Pine Grove, CA Map & Demographics
Pine Grove Map
Pine Grove Overview
$35,486
PER CAPITA INCOME
$67,896
AVG FAMILY INCOME
$62,568
AVG HOUSEHOLD INCOME
0.2%
WAGE / INCOME GAP [ % ]
99.8¢/ $1
WAGE / INCOME GAP [ $ ]
0.37
INEQUALITY / GINI INDEX
3,386
TOTAL POPULATION
1,464
MALE POPULATION
1,922
FEMALE POPULATION
76.17
MALES / 100 FEMALES
131.28
FEMALES / 100 MALES
55.4
MEDIAN AGE
2.6
AVG FAMILY SIZE
2.2
AVG HOUSEHOLD SIZE
1,555
LABOR FORCE [ PEOPLE ]
53.2%
PERCENT IN LABOR FORCE
14.0%
UNEMPLOYMENT RATE
Pine Grove Zip Codes
Pine Grove Area Codes
Income in Pine Grove
Income Overview in Pine Grove
Per Capita Income in Pine Grove is $35,486, while median incomes of families and households are $67,896 and $62,568 respectively.
| Characteristic | Number | Measure |
| Per Capita Income | 3,386 | $35,486 |
| Median Family Income | 1,051 | $67,896 |
| Mean Family Income | 1,051 | $88,886 |
| Median Household Income | 1,540 | $62,568 |
| Mean Household Income | 1,540 | $76,484 |
| Income Deficit | 1,051 | $0 |
| Wage / Income Gap (%) | 3,386 | 0.20% |
| Wage / Income Gap ($) | 3,386 | 99.80¢ per $1 |
| Gini / Inequality Index | 3,386 | 0.37 |
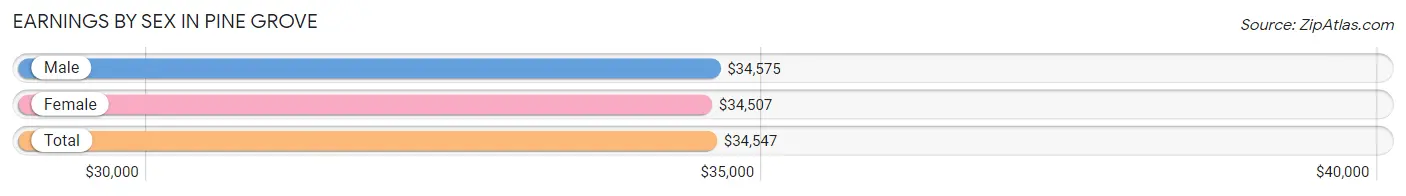
Earnings by Sex in Pine Grove
Average Earnings in Pine Grove are $34,547, $34,575 for men and $34,507 for women, a difference of 0.2%.
| Sex | Number | Average Earnings |
| Male | 763 (48.4%) | $34,575 |
| Female | 812 (51.6%) | $34,507 |
| Total | 1,575 (100.0%) | $34,547 |
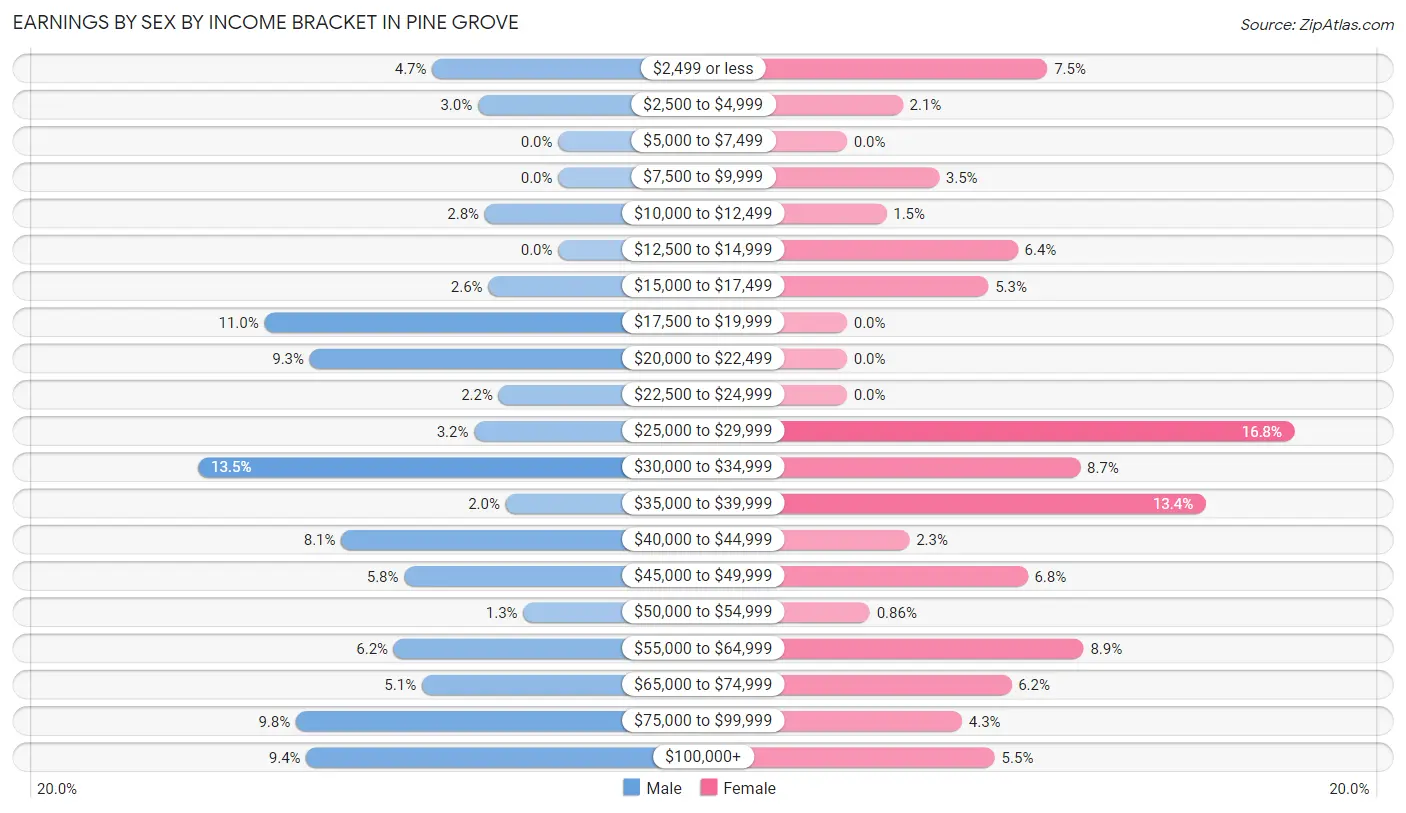
Earnings by Sex by Income Bracket in Pine Grove
The most common earnings brackets in Pine Grove are $30,000 to $34,999 for men (103 | 13.5%) and $25,000 to $29,999 for women (136 | 16.8%).
| Income | Male | Female |
| $2,499 or less | 36 (4.7%) | 61 (7.5%) |
| $2,500 to $4,999 | 23 (3.0%) | 17 (2.1%) |
| $5,000 to $7,499 | 0 (0.0%) | 0 (0.0%) |
| $7,500 to $9,999 | 0 (0.0%) | 28 (3.5%) |
| $10,000 to $12,499 | 21 (2.8%) | 12 (1.5%) |
| $12,500 to $14,999 | 0 (0.0%) | 52 (6.4%) |
| $15,000 to $17,499 | 20 (2.6%) | 43 (5.3%) |
| $17,500 to $19,999 | 84 (11.0%) | 0 (0.0%) |
| $20,000 to $22,499 | 71 (9.3%) | 0 (0.0%) |
| $22,500 to $24,999 | 17 (2.2%) | 0 (0.0%) |
| $25,000 to $29,999 | 24 (3.2%) | 136 (16.8%) |
| $30,000 to $34,999 | 103 (13.5%) | 71 (8.7%) |
| $35,000 to $39,999 | 15 (2.0%) | 109 (13.4%) |
| $40,000 to $44,999 | 62 (8.1%) | 19 (2.3%) |
| $45,000 to $49,999 | 44 (5.8%) | 55 (6.8%) |
| $50,000 to $54,999 | 10 (1.3%) | 7 (0.9%) |
| $55,000 to $64,999 | 47 (6.2%) | 72 (8.9%) |
| $65,000 to $74,999 | 39 (5.1%) | 50 (6.2%) |
| $75,000 to $99,999 | 75 (9.8%) | 35 (4.3%) |
| $100,000+ | 72 (9.4%) | 45 (5.5%) |
| Total | 763 (100.0%) | 812 (100.0%) |
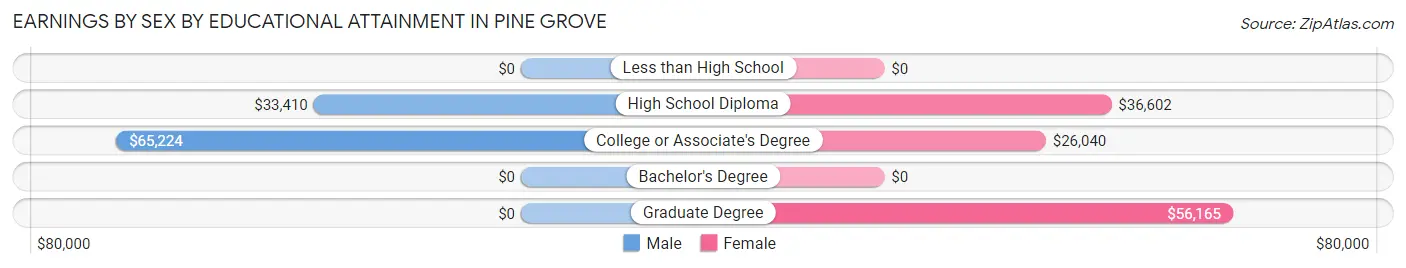
Earnings by Sex by Educational Attainment in Pine Grove
Average earnings in Pine Grove are $34,624 for men and $35,000 for women, a difference of 1.1%. Men with an educational attainment of college or associate's degree enjoy the highest average annual earnings of $65,224, while those with high school diploma education earn the least with $33,410. Women with an educational attainment of graduate degree earn the most with the average annual earnings of $56,165, while those with college or associate's degree education have the smallest earnings of $26,040.
| Educational Attainment | Male Income | Female Income |
| Less than High School | - | - |
| High School Diploma | $33,410 | $36,602 |
| College or Associate's Degree | $65,224 | $26,040 |
| Bachelor's Degree | - | - |
| Graduate Degree | - | - |
| Total | $34,624 | $35,000 |
Family Income in Pine Grove
Family Income Brackets in Pine Grove
According to the Pine Grove family income data, there are 302 families falling into the $35,000 to $49,999 income range, which is the most common income bracket and makes up 28.7% of all families.
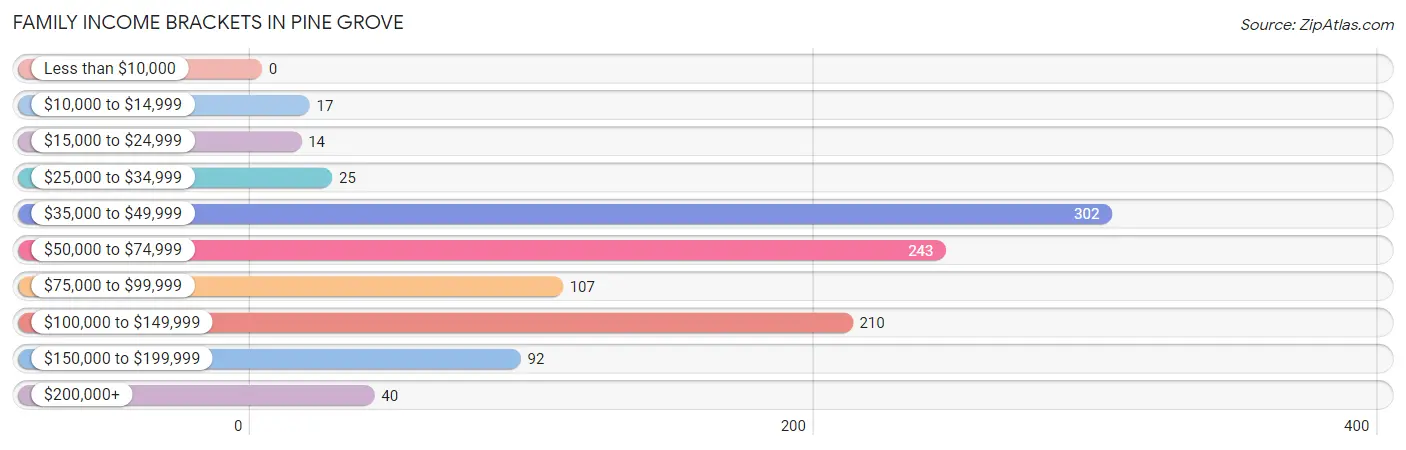
| Income Bracket | # Families | % Families |
| Less than $10,000 | 0 | 0.0% |
| $10,000 to $14,999 | 17 | 1.6% |
| $15,000 to $24,999 | 14 | 1.3% |
| $25,000 to $34,999 | 25 | 2.4% |
| $35,000 to $49,999 | 302 | 28.7% |
| $50,000 to $74,999 | 243 | 23.1% |
| $75,000 to $99,999 | 107 | 10.2% |
| $100,000 to $149,999 | 210 | 20.0% |
| $150,000 to $199,999 | 92 | 8.8% |
| $200,000+ | 40 | 3.8% |
Family Income by Famaliy Size in Pine Grove
5-person families (99 | 9.4%) account for the highest median family income in Pine Grove with $125,362 per family, while 2-person families (611 | 58.1%) have the highest median income of $32,527 per family member.
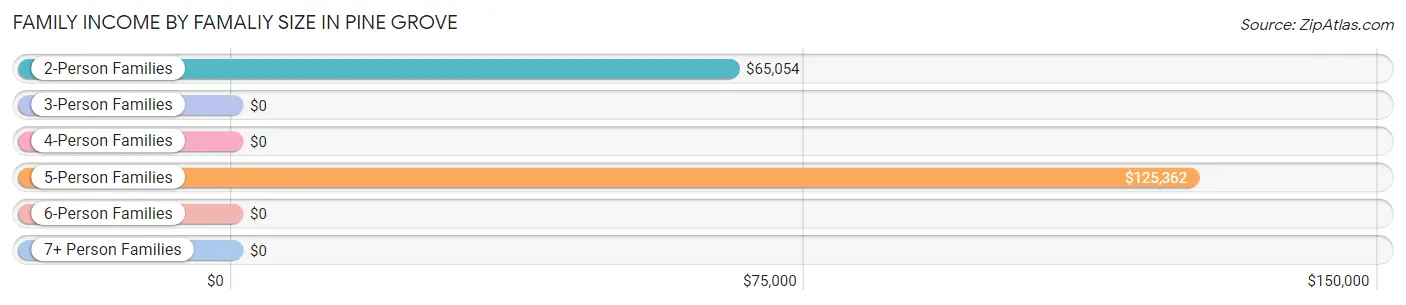
| Income Bracket | # Families | Median Income |
| 2-Person Families | 611 (58.1%) | $65,054 |
| 3-Person Families | 184 (17.5%) | $0 |
| 4-Person Families | 148 (14.1%) | $0 |
| 5-Person Families | 99 (9.4%) | $125,362 |
| 6-Person Families | 9 (0.9%) | $0 |
| 7+ Person Families | 0 (0.0%) | $0 |
| Total | 1,051 (100.0%) | $67,896 |
Family Income by Number of Earners in Pine Grove
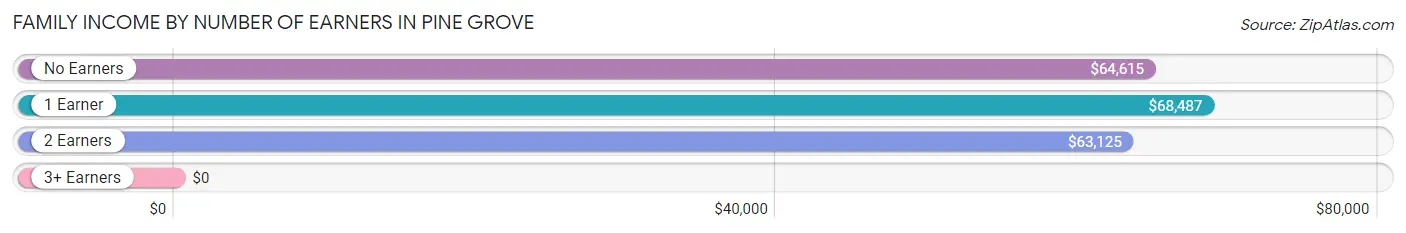
| Number of Earners | # Families | Median Income |
| No Earners | 182 (17.3%) | $64,615 |
| 1 Earner | 333 (31.7%) | $68,487 |
| 2 Earners | 492 (46.8%) | $63,125 |
| 3+ Earners | 44 (4.2%) | $0 |
| Total | 1,051 (100.0%) | $67,896 |
Household Income in Pine Grove
Household Income Brackets in Pine Grove
With 337 households falling in the category, the $35,000 to $49,999 income range is the most frequent in Pine Grove, accounting for 21.9% of all households. In contrast, only 18 households (1.2%) fall into the less than $10,000 income bracket, making it the least populous group.
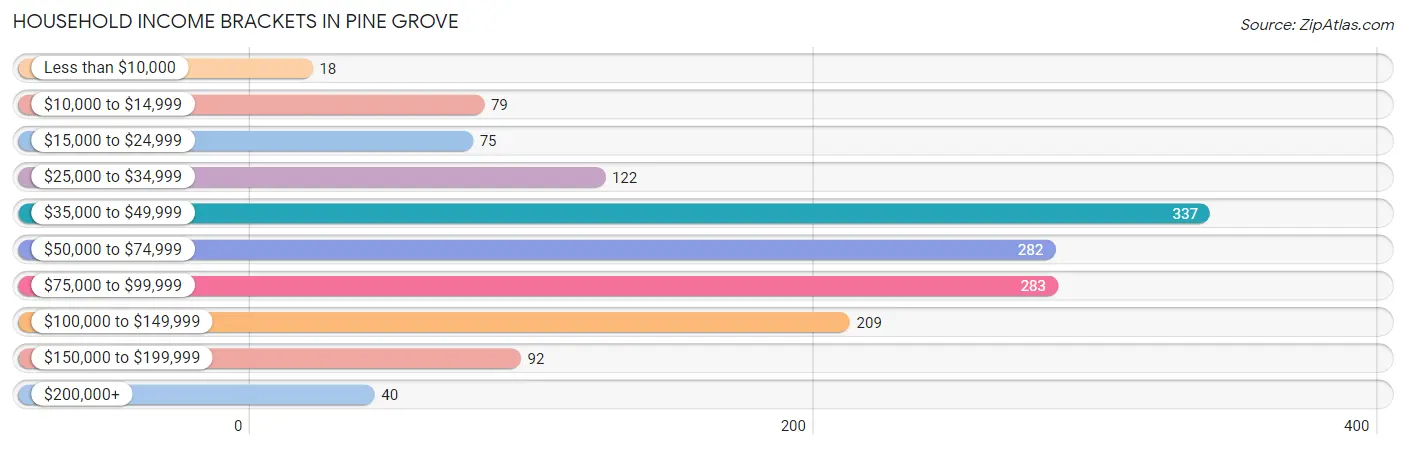
| Income Bracket | # Households | % Households |
| Less than $10,000 | 18 | 1.2% |
| $10,000 to $14,999 | 79 | 5.1% |
| $15,000 to $24,999 | 75 | 4.9% |
| $25,000 to $34,999 | 122 | 7.9% |
| $35,000 to $49,999 | 337 | 21.9% |
| $50,000 to $74,999 | 282 | 18.3% |
| $75,000 to $99,999 | 283 | 18.4% |
| $100,000 to $149,999 | 209 | 13.6% |
| $150,000 to $199,999 | 92 | 6.0% |
| $200,000+ | 40 | 2.6% |
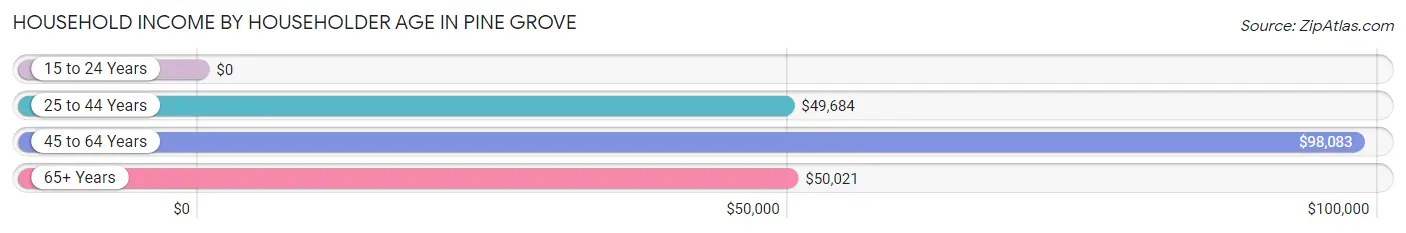
Household Income by Householder Age in Pine Grove
The median household income in Pine Grove is $62,568, with the highest median household income of $98,083 found in the 45 to 64 years age bracket for the primary householder. A total of 479 households (31.1%) fall into this category.
| Income Bracket | # Households | Median Income |
| 15 to 24 Years | 0 (0.0%) | $0 |
| 25 to 44 Years | 338 (22.0%) | $49,684 |
| 45 to 64 Years | 479 (31.1%) | $98,083 |
| 65+ Years | 723 (46.9%) | $50,021 |
| Total | 1,540 (100.0%) | $62,568 |
Poverty in Pine Grove
Income Below Poverty by Sex and Age in Pine Grove
With 4.4% poverty level for males and 5.4% for females among the residents of Pine Grove, 75 year old and over males and 45 to 54 year old females are the most vulnerable to poverty, with 17 males (17.0%) and 42 females (30.7%) in their respective age groups living below the poverty level.
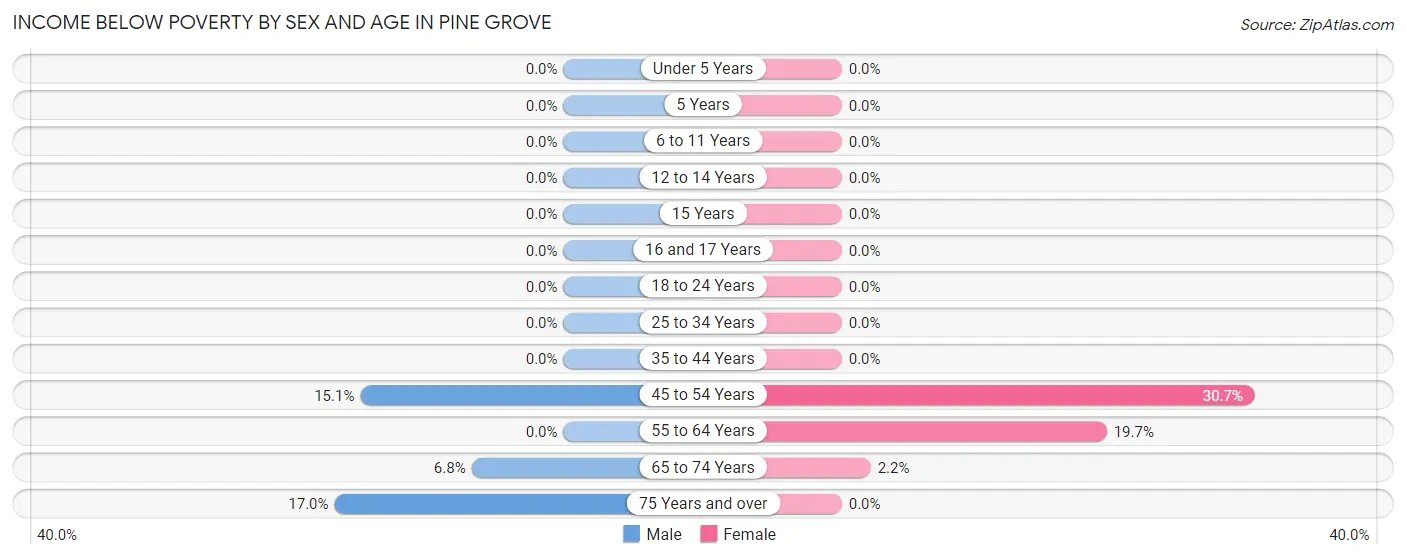
| Age Bracket | Male | Female |
| Under 5 Years | 0 (0.0%) | 0 (0.0%) |
| 5 Years | 0 (0.0%) | 0 (0.0%) |
| 6 to 11 Years | 0 (0.0%) | 0 (0.0%) |
| 12 to 14 Years | 0 (0.0%) | 0 (0.0%) |
| 15 Years | 0 (0.0%) | 0 (0.0%) |
| 16 and 17 Years | 0 (0.0%) | 0 (0.0%) |
| 18 to 24 Years | 0 (0.0%) | 0 (0.0%) |
| 25 to 34 Years | 0 (0.0%) | 0 (0.0%) |
| 35 to 44 Years | 0 (0.0%) | 0 (0.0%) |
| 45 to 54 Years | 30 (15.1%) | 42 (30.7%) |
| 55 to 64 Years | 0 (0.0%) | 48 (19.7%) |
| 65 to 74 Years | 18 (6.8%) | 14 (2.1%) |
| 75 Years and over | 17 (17.0%) | 0 (0.0%) |
| Total | 65 (4.4%) | 104 (5.4%) |
Income Above Poverty by Sex and Age in Pine Grove
According to the poverty statistics in Pine Grove, males aged under 5 years and females aged under 5 years are the age groups that are most secure financially, with 100.0% of males and 100.0% of females in these age groups living above the poverty line.
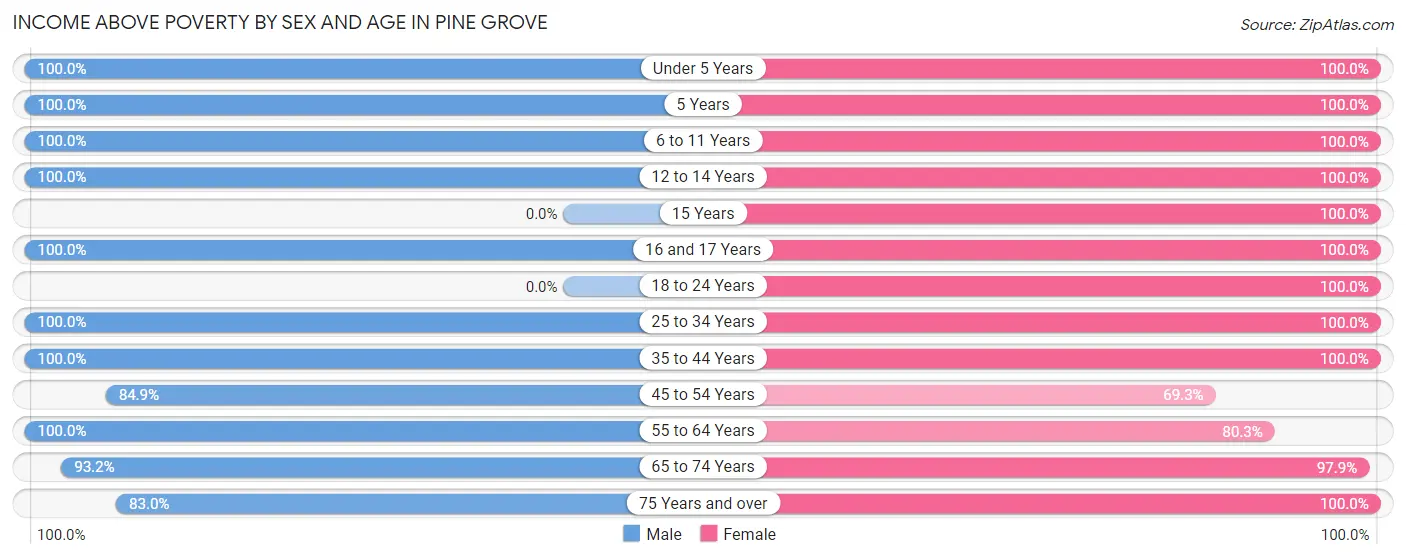
| Age Bracket | Male | Female |
| Under 5 Years | 92 (100.0%) | 110 (100.0%) |
| 5 Years | 48 (100.0%) | 45 (100.0%) |
| 6 to 11 Years | 79 (100.0%) | 53 (100.0%) |
| 12 to 14 Years | 6 (100.0%) | 21 (100.0%) |
| 15 Years | 0 (0.0%) | 10 (100.0%) |
| 16 and 17 Years | 4 (100.0%) | 28 (100.0%) |
| 18 to 24 Years | 0 (0.0%) | 13 (100.0%) |
| 25 to 34 Years | 92 (100.0%) | 348 (100.0%) |
| 35 to 44 Years | 250 (100.0%) | 111 (100.0%) |
| 45 to 54 Years | 169 (84.9%) | 95 (69.3%) |
| 55 to 64 Years | 330 (100.0%) | 196 (80.3%) |
| 65 to 74 Years | 246 (93.2%) | 638 (97.9%) |
| 75 Years and over | 83 (83.0%) | 150 (100.0%) |
| Total | 1,399 (95.6%) | 1,818 (94.6%) |
Income Below Poverty Among Married-Couple Families in Pine Grove
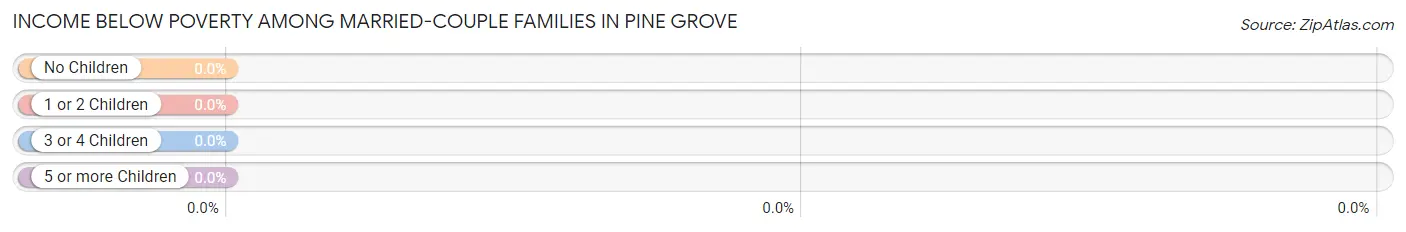
| Children | Above Poverty | Below Poverty |
| No Children | 466 (100.0%) | 0 (0.0%) |
| 1 or 2 Children | 358 (100.0%) | 0 (0.0%) |
| 3 or 4 Children | 26 (100.0%) | 0 (0.0%) |
| 5 or more Children | 0 (0.0%) | 0 (0.0%) |
| Total | 850 (100.0%) | 0 (0.0%) |
Income Below Poverty Among Single-Parent Households in Pine Grove
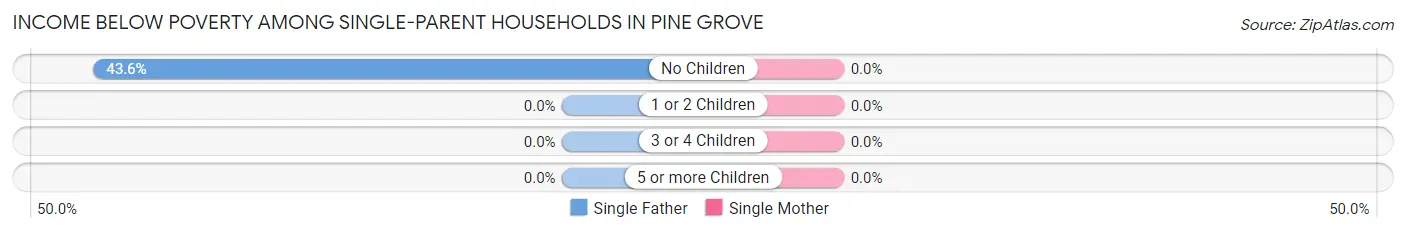
| Children | Single Father | Single Mother |
| No Children | 17 (43.6%) | 0 (0.0%) |
| 1 or 2 Children | 0 (0.0%) | 0 (0.0%) |
| 3 or 4 Children | 0 (0.0%) | 0 (0.0%) |
| 5 or more Children | 0 (0.0%) | 0 (0.0%) |
| Total | 17 (43.6%) | 0 (0.0%) |
Income Below Poverty Among Married-Couple vs Single-Parent Households in Pine Grove
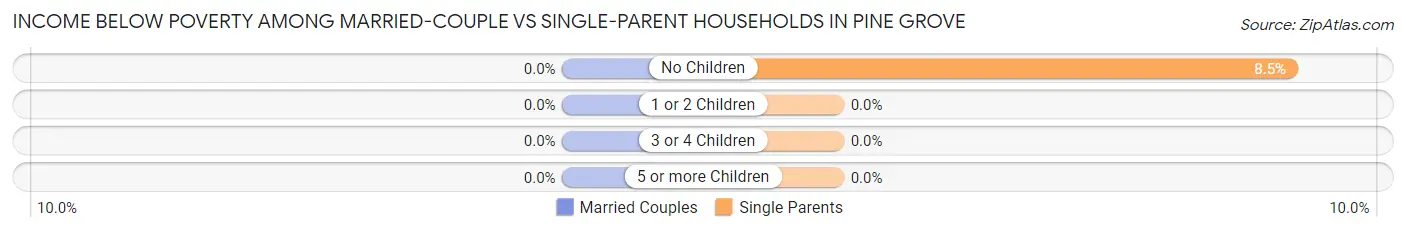
| Children | Married-Couple Families | Single-Parent Households |
| No Children | 0 (0.0%) | 17 (8.5%) |
| 1 or 2 Children | 0 (0.0%) | 0 (0.0%) |
| 3 or 4 Children | 0 (0.0%) | 0 (0.0%) |
| 5 or more Children | 0 (0.0%) | 0 (0.0%) |
| Total | 0 (0.0%) | 17 (8.5%) |
Race in Pine Grove
The most populous races in Pine Grove are White / Caucasian (2,912 | 86.0%), Hispanic or Latino (308 | 9.1%), and Two or more Races (261 | 7.7%).
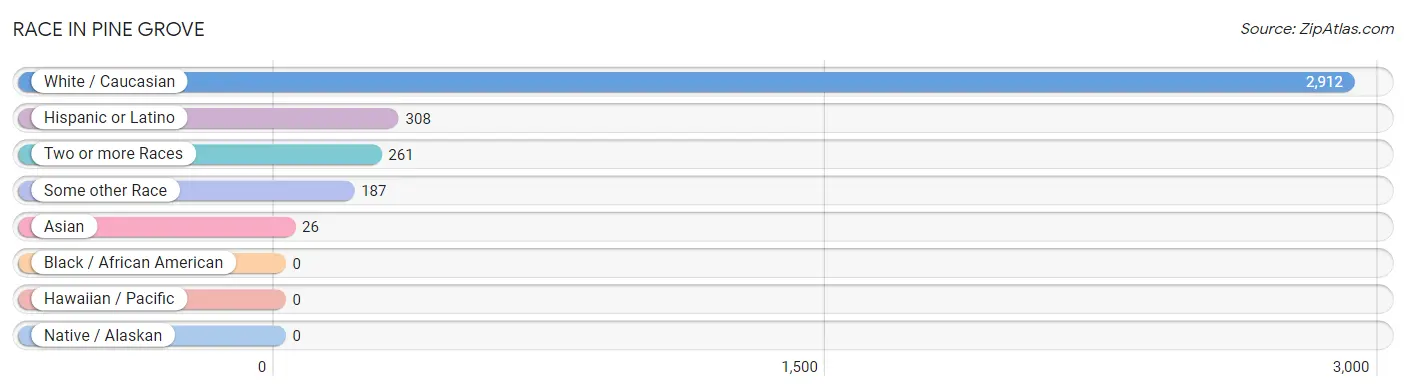
| Race | # Population | % Population |
| Asian | 26 | 0.8% |
| Black / African American | 0 | 0.0% |
| Hawaiian / Pacific | 0 | 0.0% |
| Hispanic or Latino | 308 | 9.1% |
| Native / Alaskan | 0 | 0.0% |
| White / Caucasian | 2,912 | 86.0% |
| Two or more Races | 261 | 7.7% |
| Some other Race | 187 | 5.5% |
| Total | 3,386 | 100.0% |
Ancestry in Pine Grove
The most populous ancestries reported in Pine Grove are German (649 | 19.2%), English (598 | 17.7%), Irish (501 | 14.8%), Italian (320 | 9.5%), and Mexican (298 | 8.8%), together accounting for 69.9% of all Pine Grove residents.
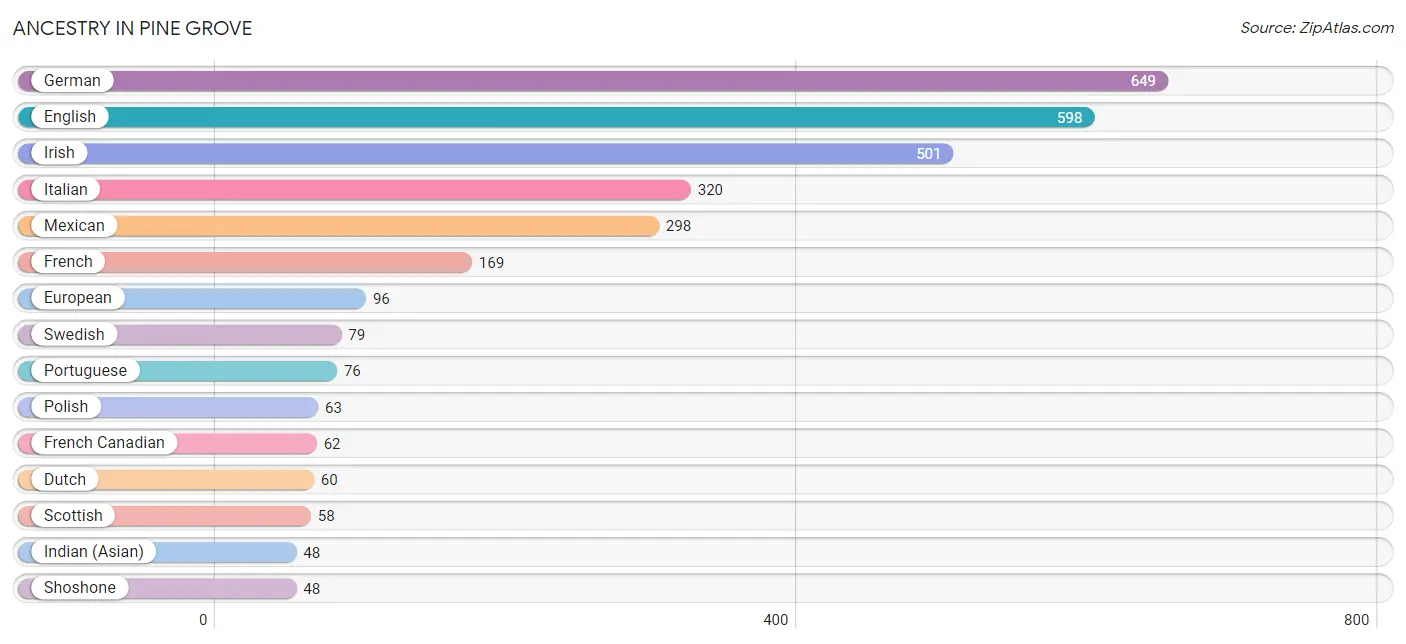
| Ancestry | # Population | % Population |
| American | 14 | 0.4% |
| Austrian | 16 | 0.5% |
| British | 15 | 0.4% |
| Burmese | 21 | 0.6% |
| Choctaw | 11 | 0.3% |
| Dutch | 60 | 1.8% |
| English | 598 | 17.7% |
| European | 96 | 2.8% |
| French | 169 | 5.0% |
| French Canadian | 62 | 1.8% |
| German | 649 | 19.2% |
| Indian (Asian) | 48 | 1.4% |
| Irish | 501 | 14.8% |
| Italian | 320 | 9.5% |
| Korean | 26 | 0.8% |
| Mexican | 298 | 8.8% |
| Native Hawaiian | 41 | 1.2% |
| Norwegian | 38 | 1.1% |
| Polish | 63 | 1.9% |
| Portuguese | 76 | 2.2% |
| Russian | 14 | 0.4% |
| Scotch-Irish | 23 | 0.7% |
| Scottish | 58 | 1.7% |
| Shoshone | 48 | 1.4% |
| Spanish | 10 | 0.3% |
| Swedish | 79 | 2.3% |
| Welsh | 12 | 0.4% | View All 27 Rows |
Immigrants in Pine Grove
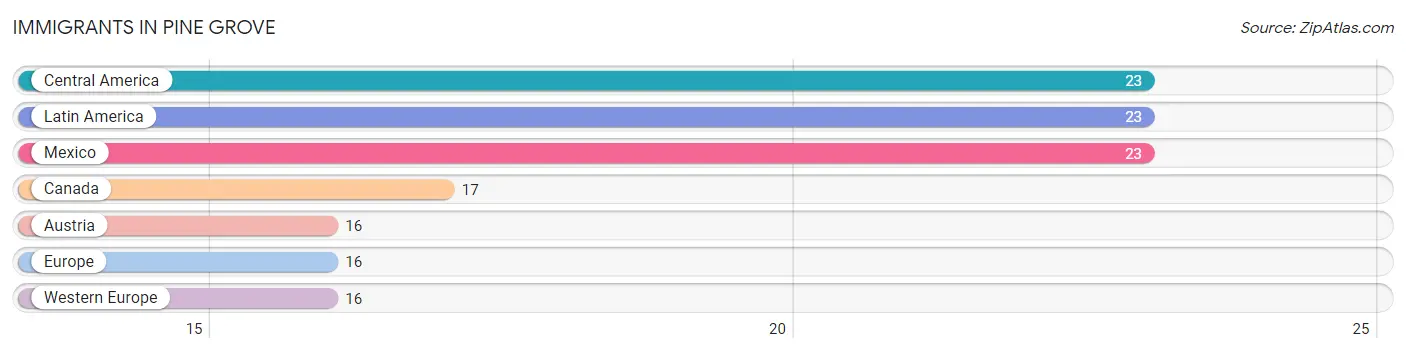
The most numerous immigrant groups reported in Pine Grove came from Central America (23 | 0.7%), Latin America (23 | 0.7%), Mexico (23 | 0.7%), Canada (17 | 0.5%), and Austria (16 | 0.5%), together accounting for 3.0% of all Pine Grove residents.
| Immigration Origin | # Population | % Population |
| Austria | 16 | 0.5% |
| Canada | 17 | 0.5% |
| Central America | 23 | 0.7% |
| Europe | 16 | 0.5% |
| Latin America | 23 | 0.7% |
| Mexico | 23 | 0.7% |
| Western Europe | 16 | 0.5% | View All 7 Rows |
Sex and Age in Pine Grove
Sex and Age in Pine Grove
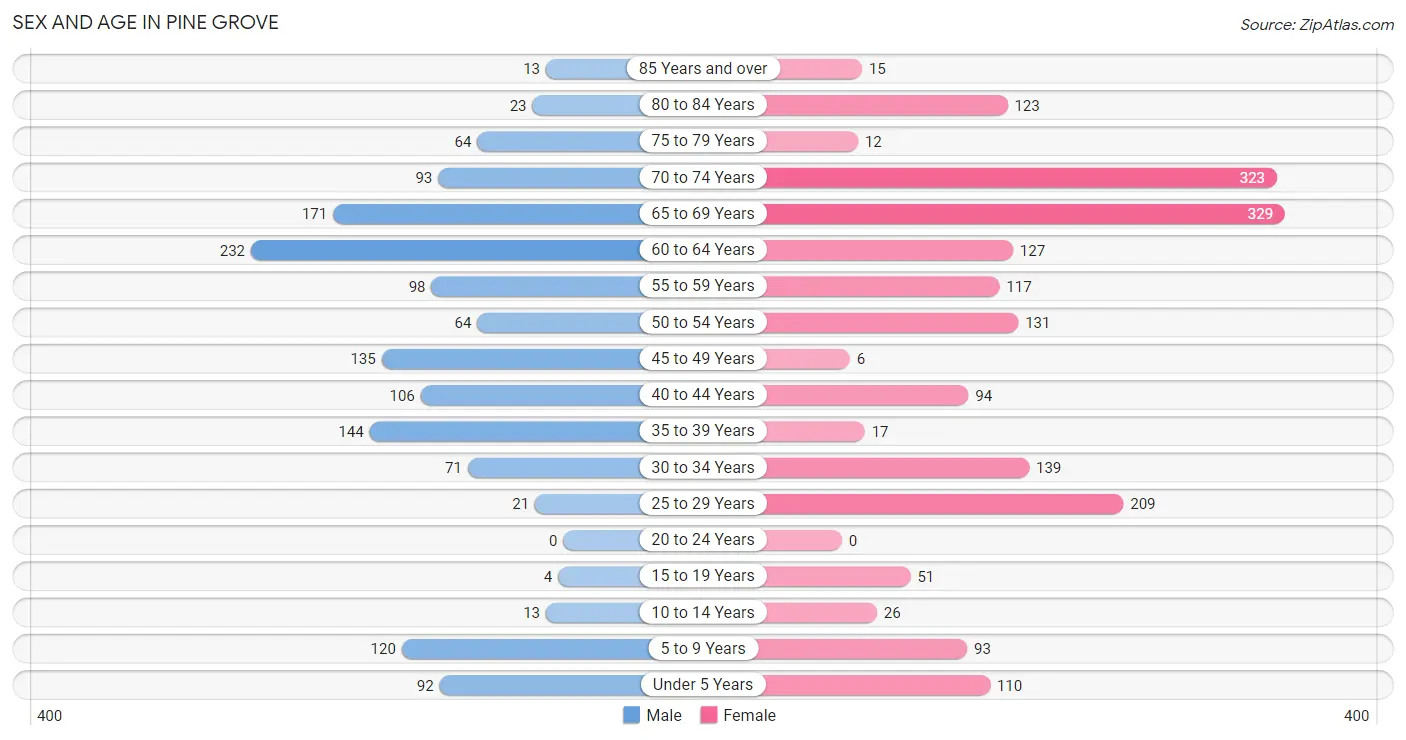
The most populous age groups in Pine Grove are 60 to 64 Years (232 | 15.9%) for men and 65 to 69 Years (329 | 17.1%) for women.
| Age Bracket | Male | Female |
| Under 5 Years | 92 (6.3%) | 110 (5.7%) |
| 5 to 9 Years | 120 (8.2%) | 93 (4.8%) |
| 10 to 14 Years | 13 (0.9%) | 26 (1.3%) |
| 15 to 19 Years | 4 (0.3%) | 51 (2.6%) |
| 20 to 24 Years | 0 (0.0%) | 0 (0.0%) |
| 25 to 29 Years | 21 (1.4%) | 209 (10.9%) |
| 30 to 34 Years | 71 (4.9%) | 139 (7.2%) |
| 35 to 39 Years | 144 (9.8%) | 17 (0.9%) |
| 40 to 44 Years | 106 (7.2%) | 94 (4.9%) |
| 45 to 49 Years | 135 (9.2%) | 6 (0.3%) |
| 50 to 54 Years | 64 (4.4%) | 131 (6.8%) |
| 55 to 59 Years | 98 (6.7%) | 117 (6.1%) |
| 60 to 64 Years | 232 (15.9%) | 127 (6.6%) |
| 65 to 69 Years | 171 (11.7%) | 329 (17.1%) |
| 70 to 74 Years | 93 (6.4%) | 323 (16.8%) |
| 75 to 79 Years | 64 (4.4%) | 12 (0.6%) |
| 80 to 84 Years | 23 (1.6%) | 123 (6.4%) |
| 85 Years and over | 13 (0.9%) | 15 (0.8%) |
| Total | 1,464 (100.0%) | 1,922 (100.0%) |
Families and Households in Pine Grove
Median Family Size in Pine Grove
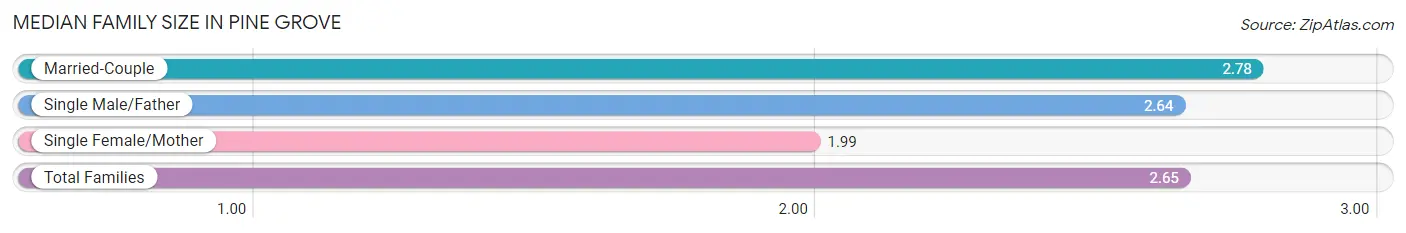
The median family size in Pine Grove is 2.65 persons per family, with married-couple families (850 | 80.9%) accounting for the largest median family size of 2.78 persons per family. On the other hand, single female/mother families (162 | 15.4%) represent the smallest median family size with 1.99 persons per family.
| Family Type | # Families | Family Size |
| Married-Couple | 850 (80.9%) | 2.78 |
| Single Male/Father | 39 (3.7%) | 2.64 |
| Single Female/Mother | 162 (15.4%) | 1.99 |
| Total Families | 1,051 (100.0%) | 2.65 |
Median Household Size in Pine Grove
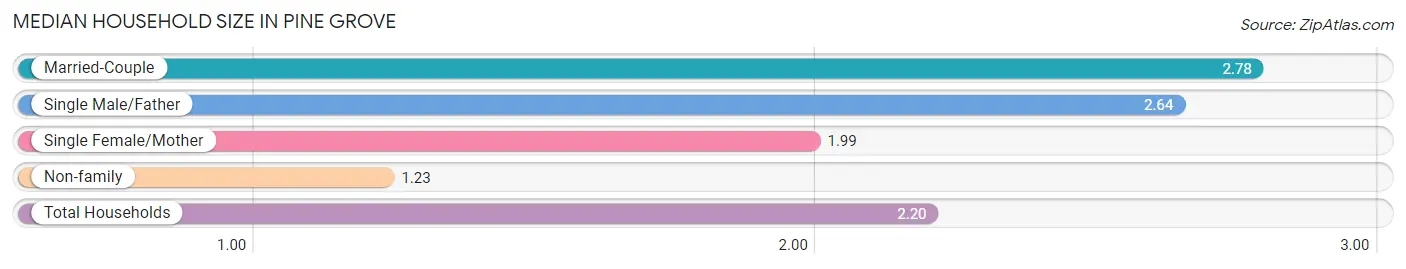
The median household size in Pine Grove is 2.20 persons per household, with married-couple households (850 | 55.2%) accounting for the largest median household size of 2.78 persons per household. non-family households (489 | 31.8%) represent the smallest median household size with 1.23 persons per household.
| Household Type | # Households | Household Size |
| Married-Couple | 850 (55.2%) | 2.78 |
| Single Male/Father | 39 (2.5%) | 2.64 |
| Single Female/Mother | 162 (10.5%) | 1.99 |
| Non-family | 489 (31.8%) | 1.23 |
| Total Households | 1,540 (100.0%) | 2.20 |
Household Size by Marriage Status in Pine Grove
Out of a total of 1,540 households in Pine Grove, 1,051 (68.2%) are family households, while 489 (31.8%) are nonfamily households. The most numerous type of family households are 2-person households, comprising 611, and the most common type of nonfamily households are 1-person households, comprising 409.
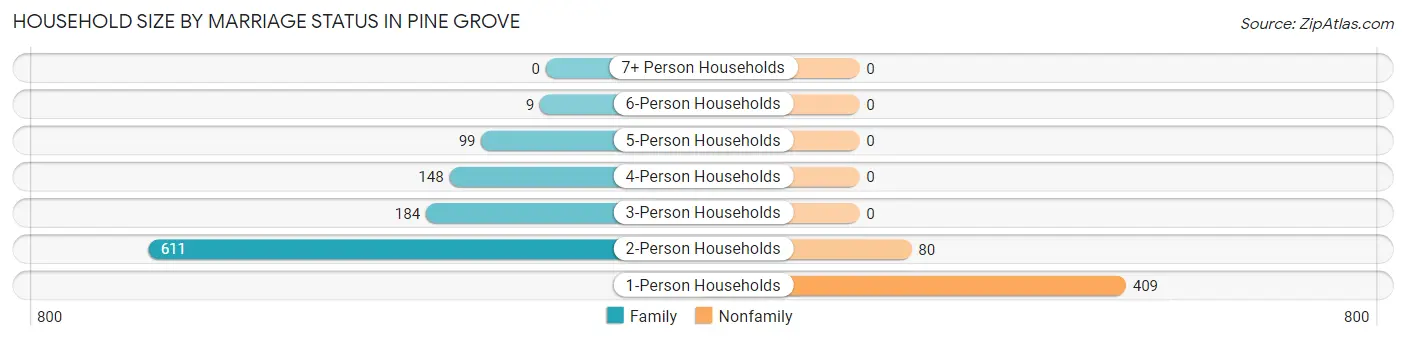
| Household Size | Family Households | Nonfamily Households |
| 1-Person Households | - | 409 (26.6%) |
| 2-Person Households | 611 (39.7%) | 80 (5.2%) |
| 3-Person Households | 184 (11.9%) | 0 (0.0%) |
| 4-Person Households | 148 (9.6%) | 0 (0.0%) |
| 5-Person Households | 99 (6.4%) | 0 (0.0%) |
| 6-Person Households | 9 (0.6%) | 0 (0.0%) |
| 7+ Person Households | 0 (0.0%) | 0 (0.0%) |
| Total | 1,051 (68.2%) | 489 (31.8%) |
Female Fertility in Pine Grove
Fertility by Age in Pine Grove
Average fertility rate in Pine Grove is 186.0 births per 1,000 women. Women in the age bracket of 20 to 34 years have the highest fertility rate with 276.0 births per 1,000 women. Women in the age bracket of 20 to 34 years acount for 100.0% of all women with births.
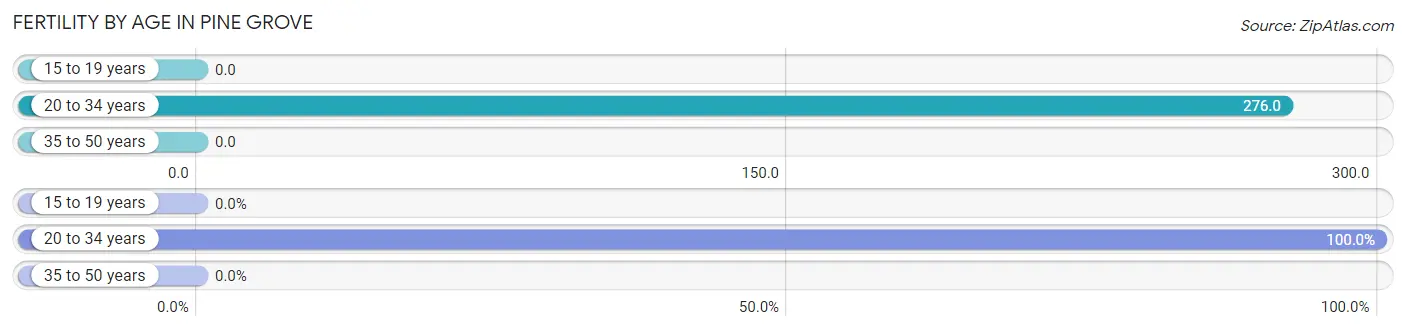
| Age Bracket | Women with Births | Births / 1,000 Women |
| 15 to 19 years | 0 (0.0%) | 0.0 |
| 20 to 34 years | 96 (100.0%) | 276.0 |
| 35 to 50 years | 0 (0.0%) | 0.0 |
| Total | 96 (100.0%) | 186.0 |
Fertility by Age by Marriage Status in Pine Grove
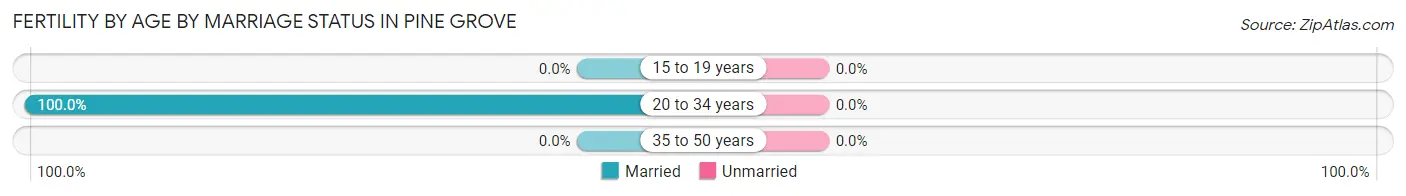
| Age Bracket | Married | Unmarried |
| 15 to 19 years | 0 (0.0%) | 0 (0.0%) |
| 20 to 34 years | 96 (100.0%) | 0 (0.0%) |
| 35 to 50 years | 0 (0.0%) | 0 (0.0%) |
| Total | 96 (100.0%) | 0 (0.0%) |
Fertility by Education in Pine Grove

| Educational Attainment | Women with Births | Births / 1,000 Women |
| Less than High School | 0 (0.0%) | 0.0 |
| High School Diploma | 17 (17.7%) | 134.0 |
| College or Associate's Degree | 79 (82.3%) | 300.0 |
| Bachelor's Degree | 0 (0.0%) | 0.0 |
| Graduate Degree | 0 (0.0%) | 0.0 |
| Total | 96 (100.0%) | 186.0 |
Fertility by Education by Marriage Status in Pine Grove
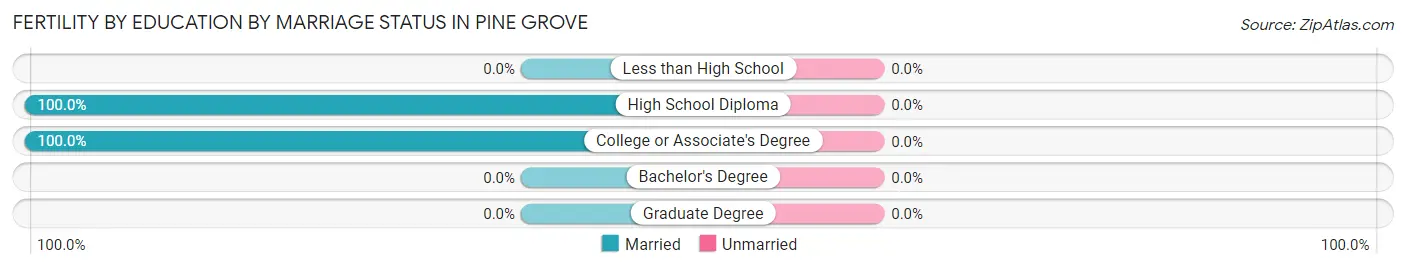
| Educational Attainment | Married | Unmarried |
| Less than High School | 0 (0.0%) | 0 (0.0%) |
| High School Diploma | 17 (100.0%) | 0 (0.0%) |
| College or Associate's Degree | 79 (100.0%) | 0 (0.0%) |
| Bachelor's Degree | 0 (0.0%) | 0 (0.0%) |
| Graduate Degree | 0 (0.0%) | 0 (0.0%) |
| Total | 96 (100.0%) | 0 (0.0%) |
Employment Characteristics in Pine Grove
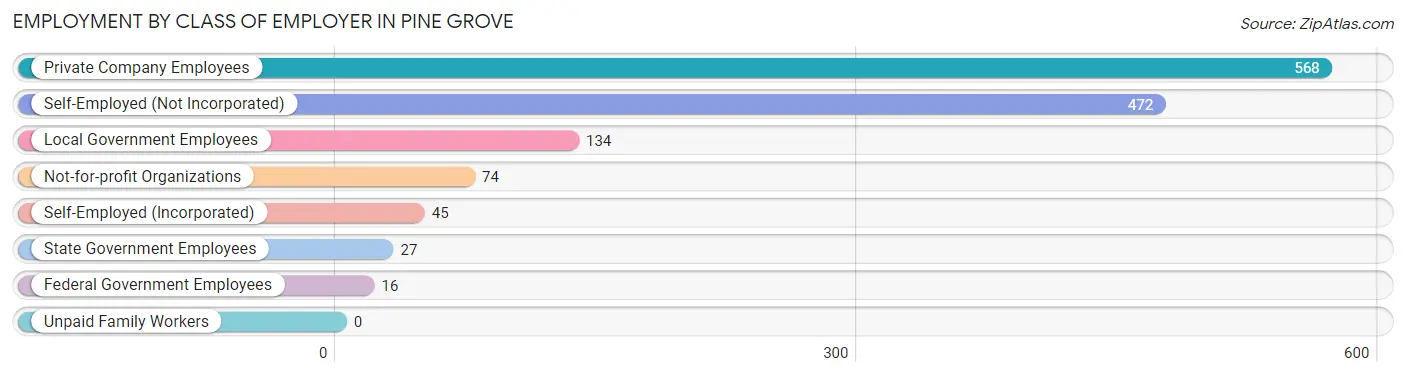
Employment by Class of Employer in Pine Grove
Among the 1,336 employed individuals in Pine Grove, private company employees (568 | 42.5%), self-employed (not incorporated) (472 | 35.3%), and local government employees (134 | 10.0%) make up the most common classes of employment.
| Employer Class | # Employees | % Employees |
| Private Company Employees | 568 | 42.5% |
| Self-Employed (Incorporated) | 45 | 3.4% |
| Self-Employed (Not Incorporated) | 472 | 35.3% |
| Not-for-profit Organizations | 74 | 5.5% |
| Local Government Employees | 134 | 10.0% |
| State Government Employees | 27 | 2.0% |
| Federal Government Employees | 16 | 1.2% |
| Unpaid Family Workers | 0 | 0.0% |
| Total | 1,336 | 100.0% |
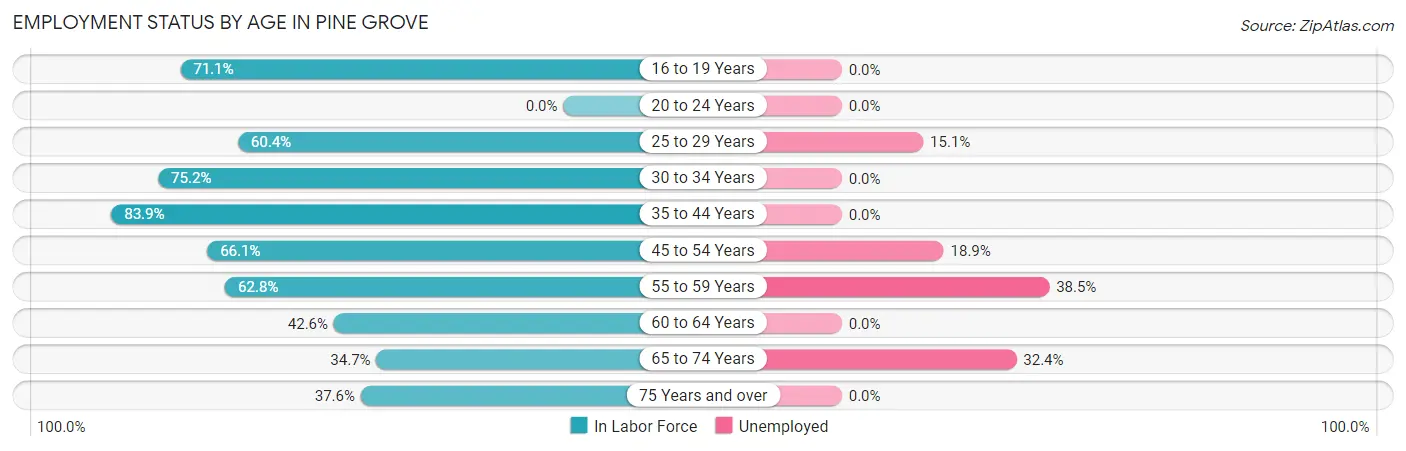
Employment Status by Age in Pine Grove
According to the labor force statistics for Pine Grove, out of the total population over 16 years of age (2,922), 53.2% or 1,555 individuals are in the labor force, with 14.0% or 218 of them unemployed. The age group with the highest labor force participation rate is 35 to 44 years, with 83.9% or 303 individuals in the labor force. Within the labor force, the 55 to 59 years age range has the highest percentage of unemployed individuals, with 38.5% or 52 of them being unemployed.
| Age Bracket | In Labor Force | Unemployed |
| 16 to 19 Years | 32 (71.1%) | 0 (0.0%) |
| 20 to 24 Years | 0 (0.0%) | 0 (0.0%) |
| 25 to 29 Years | 139 (60.4%) | 21 (15.1%) |
| 30 to 34 Years | 158 (75.2%) | 0 (0.0%) |
| 35 to 44 Years | 303 (83.9%) | 0 (0.0%) |
| 45 to 54 Years | 222 (66.1%) | 42 (18.9%) |
| 55 to 59 Years | 135 (62.8%) | 52 (38.5%) |
| 60 to 64 Years | 153 (42.6%) | 0 (0.0%) |
| 65 to 74 Years | 318 (34.7%) | 103 (32.4%) |
| 75 Years and over | 94 (37.6%) | 0 (0.0%) |
| Total | 1,555 (53.2%) | 218 (14.0%) |
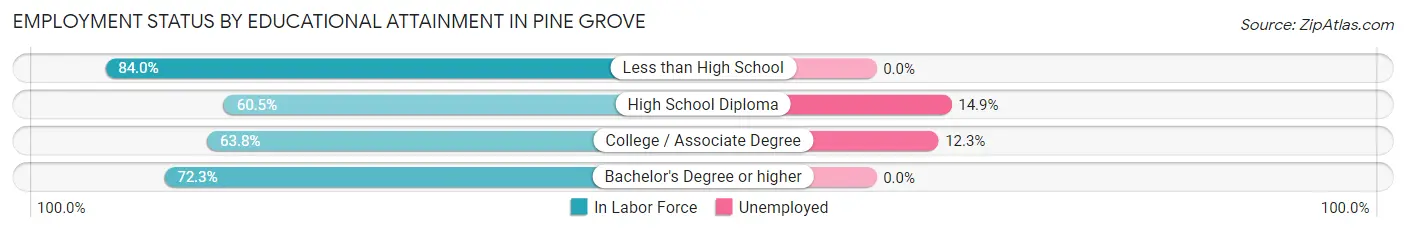
Employment Status by Educational Attainment in Pine Grove
According to labor force statistics for Pine Grove, 64.9% of individuals (1,110) out of the total population between 25 and 64 years of age (1,711) are in the labor force, with 10.4% or 115 of them being unemployed. The group with the highest labor force participation rate are those with the educational attainment of less than high school, with 84.0% or 84 individuals in the labor force. Within the labor force, individuals with high school diploma education have the highest percentage of unemployment, with 14.9% or 63 of them being unemployed.
| Educational Attainment | In Labor Force | Unemployed |
| Less than High School | 84 (84.0%) | 0 (0.0%) |
| High School Diploma | 423 (60.5%) | 104 (14.9%) |
| College / Associate Degree | 423 (63.8%) | 82 (12.3%) |
| Bachelor's Degree or higher | 180 (72.3%) | 0 (0.0%) |
| Total | 1,110 (64.9%) | 178 (10.4%) |
Employment Occupations by Sex in Pine Grove
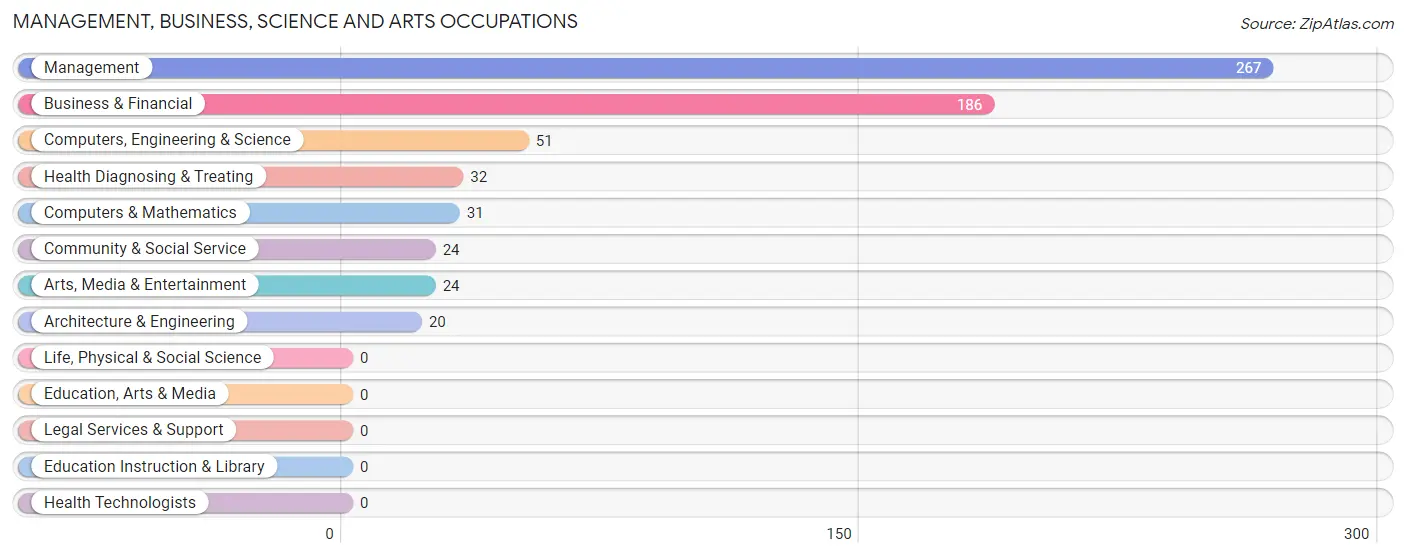
Management, Business, Science and Arts Occupations
The most common Management, Business, Science and Arts occupations in Pine Grove are Management (267 | 20.0%), Business & Financial (186 | 13.9%), Computers, Engineering & Science (51 | 3.8%), Health Diagnosing & Treating (32 | 2.4%), and Computers & Mathematics (31 | 2.3%).
Management, Business, Science and Arts Occupations by Sex
Within the Management, Business, Science and Arts occupations in Pine Grove, the most male-oriented occupations are Architecture & Engineering (100.0%), Community & Social Service (100.0%), and Arts, Media & Entertainment (100.0%), while the most female-oriented occupations are Health Diagnosing & Treating (100.0%), Business & Financial (92.5%), and Computers & Mathematics (41.9%).
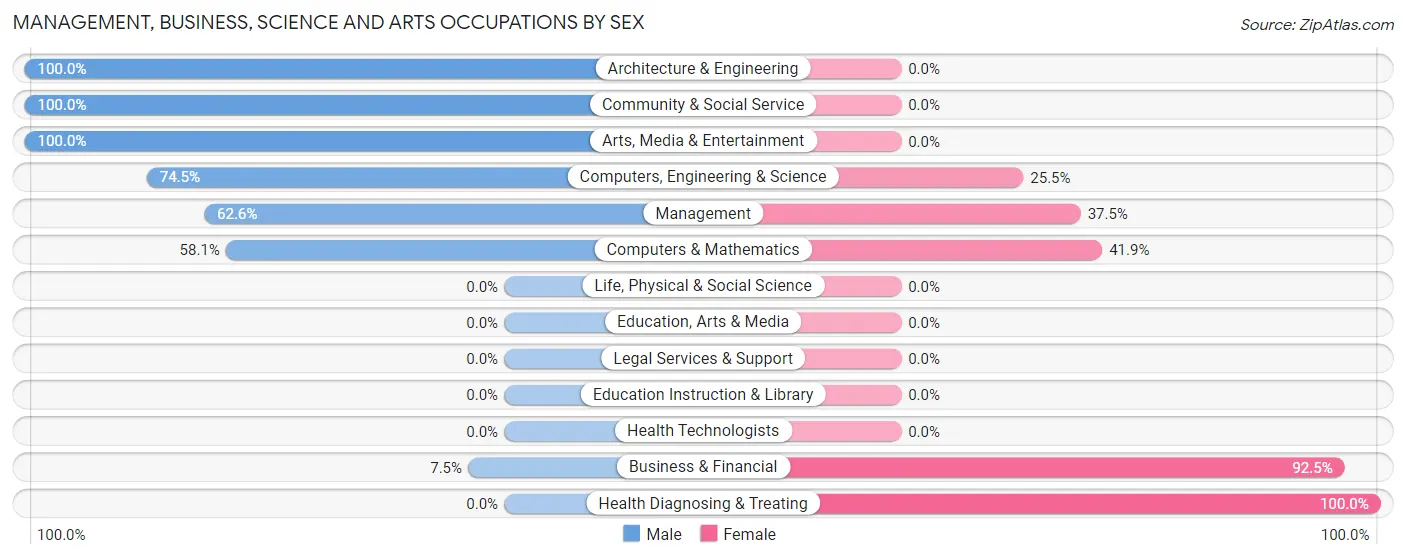
| Occupation | Male | Female |
| Management | 167 (62.5%) | 100 (37.4%) |
| Business & Financial | 14 (7.5%) | 172 (92.5%) |
| Computers, Engineering & Science | 38 (74.5%) | 13 (25.5%) |
| Computers & Mathematics | 18 (58.1%) | 13 (41.9%) |
| Architecture & Engineering | 20 (100.0%) | 0 (0.0%) |
| Life, Physical & Social Science | 0 (0.0%) | 0 (0.0%) |
| Community & Social Service | 24 (100.0%) | 0 (0.0%) |
| Education, Arts & Media | 0 (0.0%) | 0 (0.0%) |
| Legal Services & Support | 0 (0.0%) | 0 (0.0%) |
| Education Instruction & Library | 0 (0.0%) | 0 (0.0%) |
| Arts, Media & Entertainment | 24 (100.0%) | 0 (0.0%) |
| Health Diagnosing & Treating | 0 (0.0%) | 32 (100.0%) |
| Health Technologists | 0 (0.0%) | 0 (0.0%) |
| Total (Category) | 243 (43.4%) | 317 (56.6%) |
| Total (Overall) | 557 (41.7%) | 779 (58.3%) |
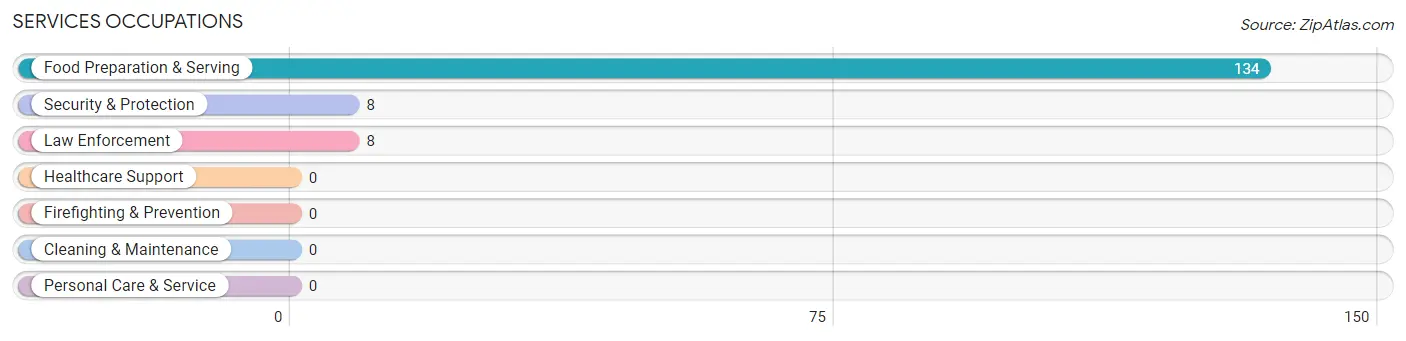
Services Occupations
The most common Services occupations in Pine Grove are Food Preparation & Serving (134 | 10.0%), Security & Protection (8 | 0.6%), and Law Enforcement (8 | 0.6%).
Services Occupations by Sex
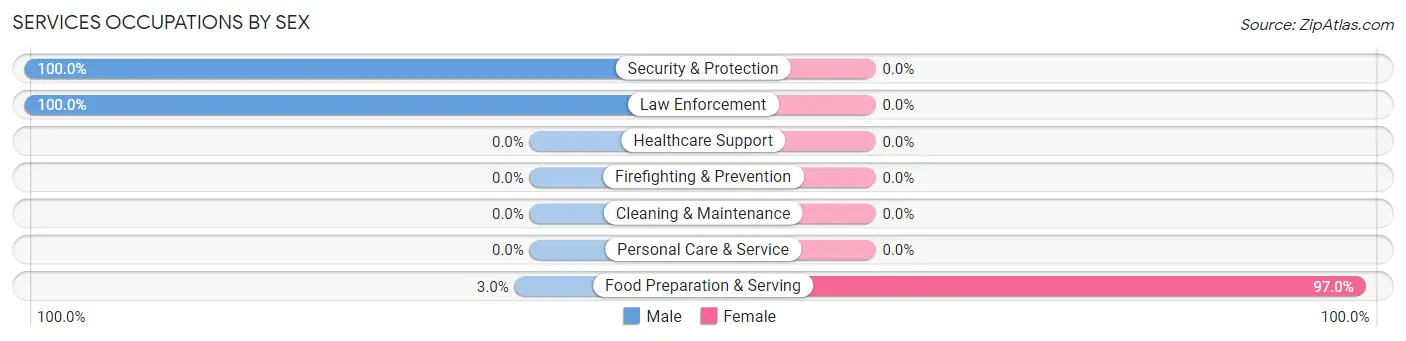
| Occupation | Male | Female |
| Healthcare Support | 0 (0.0%) | 0 (0.0%) |
| Security & Protection | 8 (100.0%) | 0 (0.0%) |
| Firefighting & Prevention | 0 (0.0%) | 0 (0.0%) |
| Law Enforcement | 8 (100.0%) | 0 (0.0%) |
| Food Preparation & Serving | 4 (3.0%) | 130 (97.0%) |
| Cleaning & Maintenance | 0 (0.0%) | 0 (0.0%) |
| Personal Care & Service | 0 (0.0%) | 0 (0.0%) |
| Total (Category) | 12 (8.5%) | 130 (91.5%) |
| Total (Overall) | 557 (41.7%) | 779 (58.3%) |
Sales and Office Occupations
The most common Sales and Office occupations in Pine Grove are Office & Administration (162 | 12.1%), and Sales & Related (44 | 3.3%).

Sales and Office Occupations by Sex

| Occupation | Male | Female |
| Sales & Related | 44 (100.0%) | 0 (0.0%) |
| Office & Administration | 15 (9.3%) | 147 (90.7%) |
| Total (Category) | 59 (28.6%) | 147 (71.4%) |
| Total (Overall) | 557 (41.7%) | 779 (58.3%) |
Natural Resources, Construction and Maintenance Occupations
The most common Natural Resources, Construction and Maintenance occupations in Pine Grove are Construction & Extraction (103 | 7.7%), Installation, Maintenance & Repair (39 | 2.9%), and Farming, Fishing & Forestry (15 | 1.1%).

Natural Resources, Construction and Maintenance Occupations by Sex
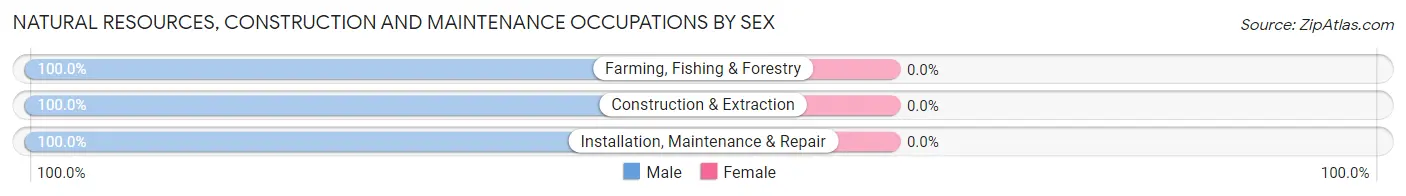
| Occupation | Male | Female |
| Farming, Fishing & Forestry | 15 (100.0%) | 0 (0.0%) |
| Construction & Extraction | 103 (100.0%) | 0 (0.0%) |
| Installation, Maintenance & Repair | 39 (100.0%) | 0 (0.0%) |
| Total (Category) | 157 (100.0%) | 0 (0.0%) |
| Total (Overall) | 557 (41.7%) | 779 (58.3%) |
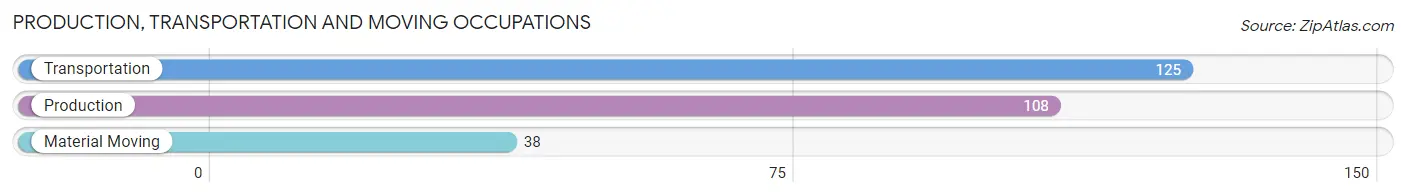
Production, Transportation and Moving Occupations
The most common Production, Transportation and Moving occupations in Pine Grove are Transportation (125 | 9.4%), Production (108 | 8.1%), and Material Moving (38 | 2.8%).
Production, Transportation and Moving Occupations by Sex

| Occupation | Male | Female |
| Production | 32 (29.6%) | 76 (70.4%) |
| Transportation | 54 (43.2%) | 71 (56.8%) |
| Material Moving | 0 (0.0%) | 38 (100.0%) |
| Total (Category) | 86 (31.7%) | 185 (68.3%) |
| Total (Overall) | 557 (41.7%) | 779 (58.3%) |
Employment Industries by Sex in Pine Grove
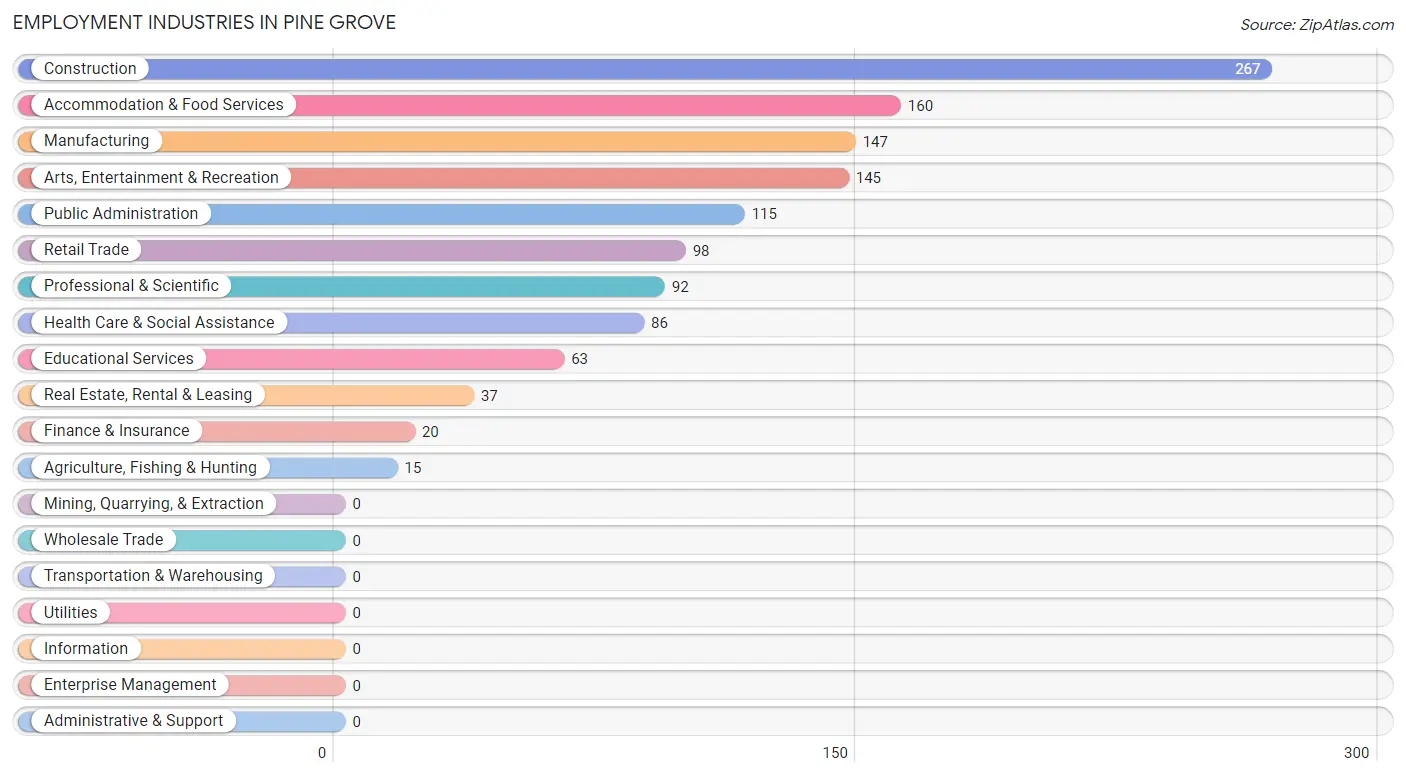
Employment Industries in Pine Grove
The major employment industries in Pine Grove include Construction (267 | 20.0%), Accommodation & Food Services (160 | 12.0%), Manufacturing (147 | 11.0%), Arts, Entertainment & Recreation (145 | 10.8%), and Public Administration (115 | 8.6%).
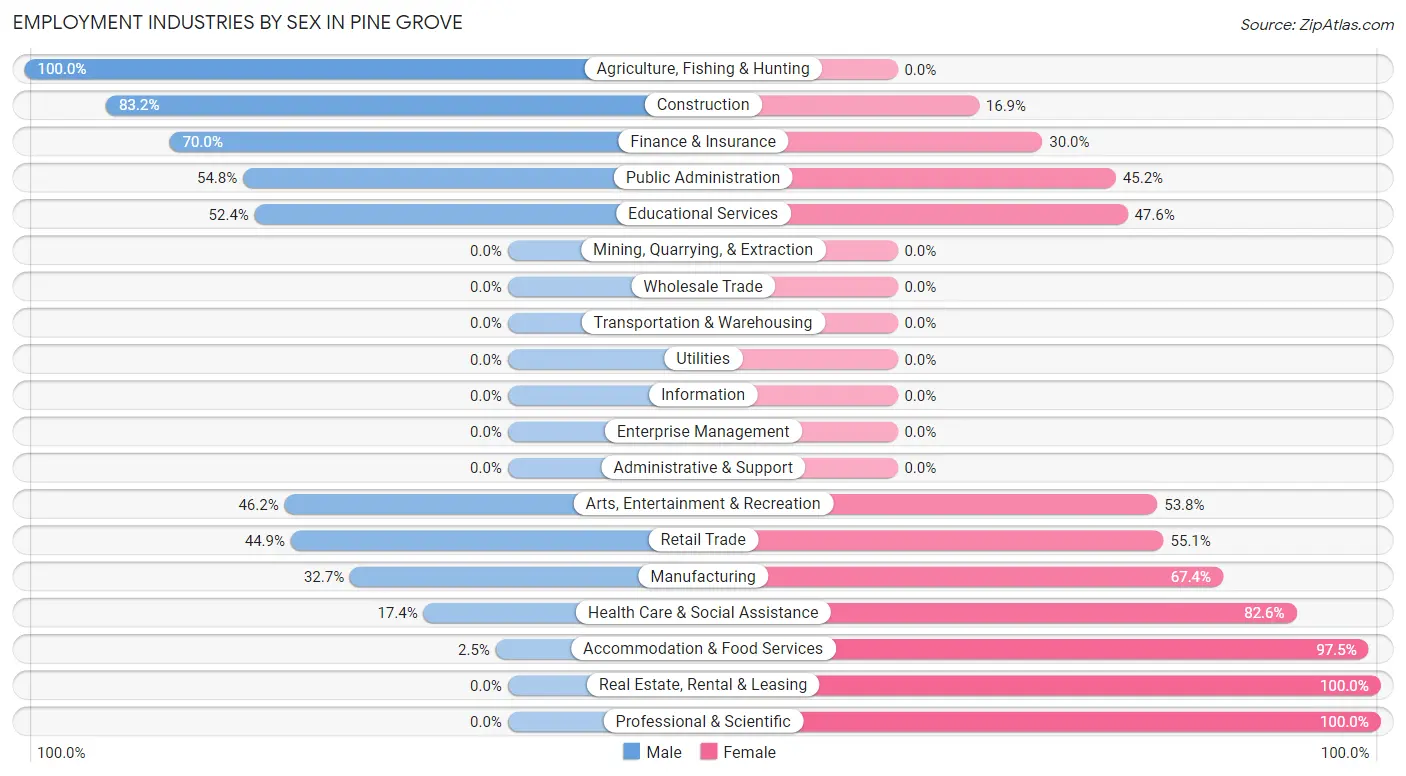
Employment Industries by Sex in Pine Grove
The Pine Grove industries that see more men than women are Agriculture, Fishing & Hunting (100.0%), Construction (83.2%), and Finance & Insurance (70.0%), whereas the industries that tend to have a higher number of women are Real Estate, Rental & Leasing (100.0%), Professional & Scientific (100.0%), and Accommodation & Food Services (97.5%).
| Industry | Male | Female |
| Agriculture, Fishing & Hunting | 15 (100.0%) | 0 (0.0%) |
| Mining, Quarrying, & Extraction | 0 (0.0%) | 0 (0.0%) |
| Construction | 222 (83.2%) | 45 (16.9%) |
| Manufacturing | 48 (32.7%) | 99 (67.3%) |
| Wholesale Trade | 0 (0.0%) | 0 (0.0%) |
| Retail Trade | 44 (44.9%) | 54 (55.1%) |
| Transportation & Warehousing | 0 (0.0%) | 0 (0.0%) |
| Utilities | 0 (0.0%) | 0 (0.0%) |
| Information | 0 (0.0%) | 0 (0.0%) |
| Finance & Insurance | 14 (70.0%) | 6 (30.0%) |
| Real Estate, Rental & Leasing | 0 (0.0%) | 37 (100.0%) |
| Professional & Scientific | 0 (0.0%) | 92 (100.0%) |
| Enterprise Management | 0 (0.0%) | 0 (0.0%) |
| Administrative & Support | 0 (0.0%) | 0 (0.0%) |
| Educational Services | 33 (52.4%) | 30 (47.6%) |
| Health Care & Social Assistance | 15 (17.4%) | 71 (82.6%) |
| Arts, Entertainment & Recreation | 67 (46.2%) | 78 (53.8%) |
| Accommodation & Food Services | 4 (2.5%) | 156 (97.5%) |
| Public Administration | 63 (54.8%) | 52 (45.2%) |
| Total | 557 (41.7%) | 779 (58.3%) |
Education in Pine Grove
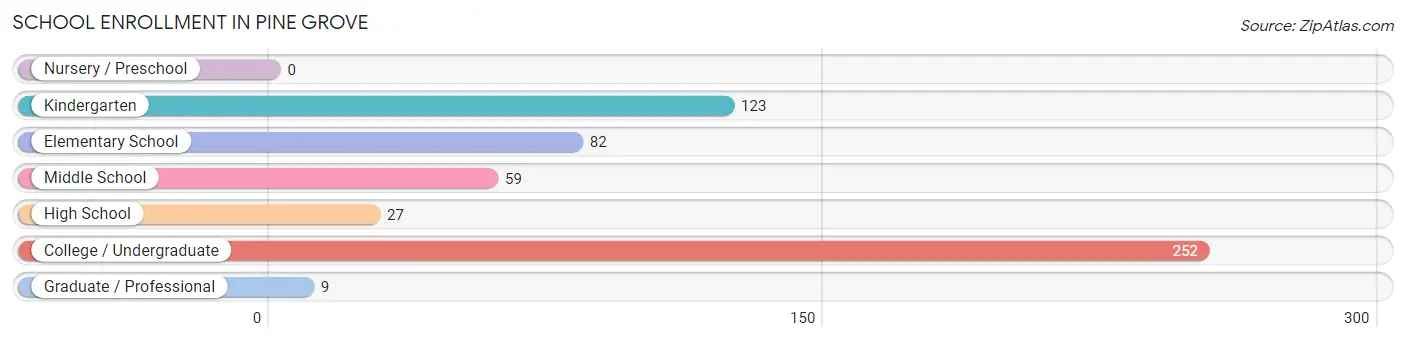
School Enrollment in Pine Grove
The most common levels of schooling among the 552 students in Pine Grove are college / undergraduate (252 | 45.7%), kindergarten (123 | 22.3%), and elementary school (82 | 14.9%).
| School Level | # Students | % Students |
| Nursery / Preschool | 0 | 0.0% |
| Kindergarten | 123 | 22.3% |
| Elementary School | 82 | 14.9% |
| Middle School | 59 | 10.7% |
| High School | 27 | 4.9% |
| College / Undergraduate | 252 | 45.7% |
| Graduate / Professional | 9 | 1.6% |
| Total | 552 | 100.0% |
School Enrollment by Age by Funding Source in Pine Grove
Out of a total of 552 students who are enrolled in schools in Pine Grove, 175 (31.7%) attend a private institution, while the remaining 377 (68.3%) are enrolled in public schools. The age group of 18 to 19 year olds has the highest likelihood of being enrolled in private schools, with 13 (100.0% in the age bracket) enrolled. Conversely, the age group of 3 to 4 year olds has the lowest likelihood of being enrolled in a private school, with 12 (100.0% in the age bracket) attending a public institution.
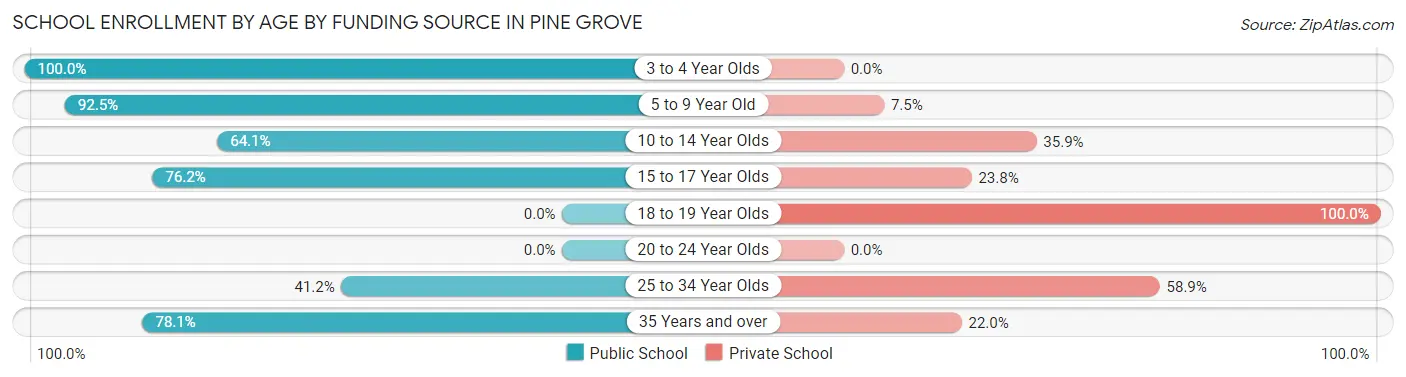
| Age Bracket | Public School | Private School |
| 3 to 4 Year Olds | 12 (100.0%) | 0 (0.0%) |
| 5 to 9 Year Old | 197 (92.5%) | 16 (7.5%) |
| 10 to 14 Year Olds | 25 (64.1%) | 14 (35.9%) |
| 15 to 17 Year Olds | 32 (76.2%) | 10 (23.8%) |
| 18 to 19 Year Olds | 0 (0.0%) | 13 (100.0%) |
| 20 to 24 Year Olds | 0 (0.0%) | 0 (0.0%) |
| 25 to 34 Year Olds | 79 (41.1%) | 113 (58.9%) |
| 35 Years and over | 32 (78.0%) | 9 (22.0%) |
| Total | 377 (68.3%) | 175 (31.7%) |
Educational Attainment by Field of Study in Pine Grove
Science & technology (137 | 26.3%), business (86 | 16.5%), social sciences (67 | 12.9%), visual & performing arts (52 | 10.0%), and education (48 | 9.2%) are the most common fields of study among 521 individuals in Pine Grove who have obtained a bachelor's degree or higher.
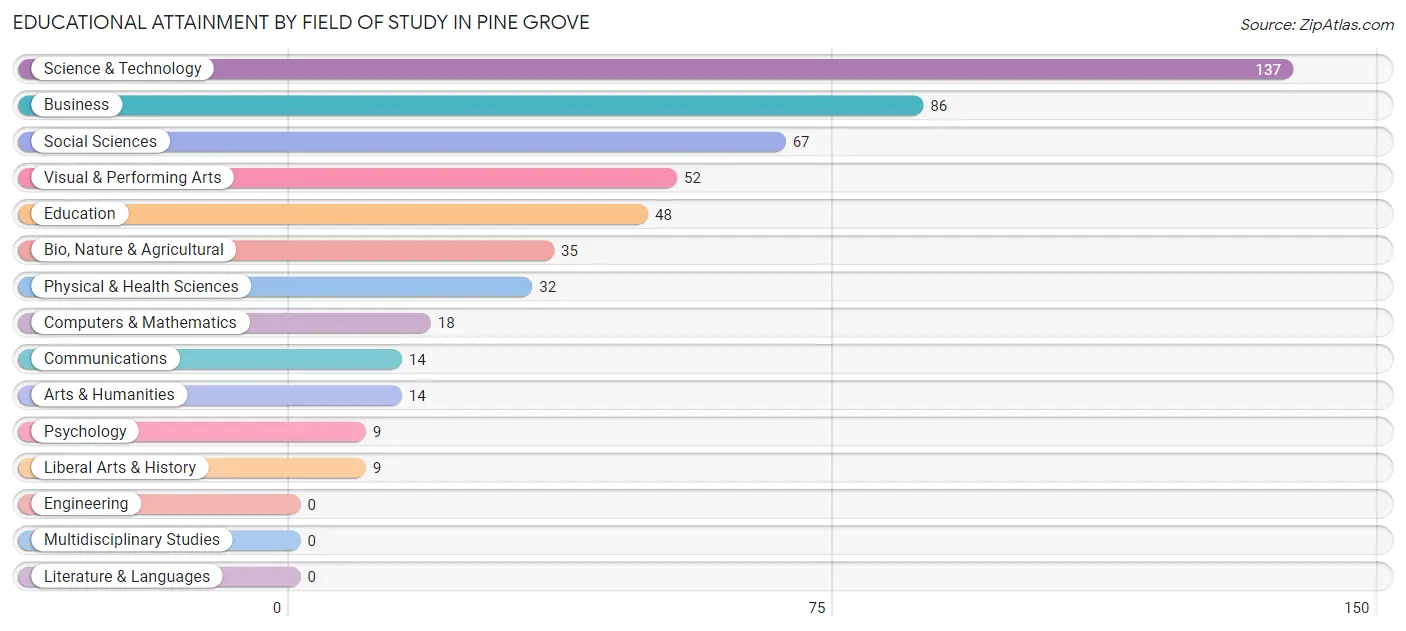
| Field of Study | # Graduates | % Graduates |
| Computers & Mathematics | 18 | 3.5% |
| Bio, Nature & Agricultural | 35 | 6.7% |
| Physical & Health Sciences | 32 | 6.1% |
| Psychology | 9 | 1.7% |
| Social Sciences | 67 | 12.9% |
| Engineering | 0 | 0.0% |
| Multidisciplinary Studies | 0 | 0.0% |
| Science & Technology | 137 | 26.3% |
| Business | 86 | 16.5% |
| Education | 48 | 9.2% |
| Literature & Languages | 0 | 0.0% |
| Liberal Arts & History | 9 | 1.7% |
| Visual & Performing Arts | 52 | 10.0% |
| Communications | 14 | 2.7% |
| Arts & Humanities | 14 | 2.7% |
| Total | 521 | 100.0% |
Transportation & Commute in Pine Grove
Vehicle Availability by Sex in Pine Grove
The most prevalent vehicle ownership categories in Pine Grove are males with 2 vehicles (260, accounting for 46.7%) and females with 2 vehicles (382, making up 33.4%).
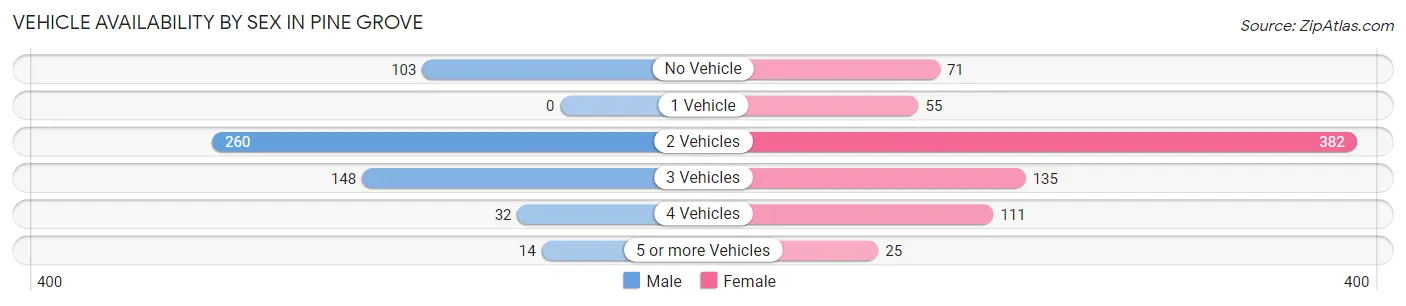
| Vehicles Available | Male | Female |
| No Vehicle | 103 (18.5%) | 71 (9.1%) |
| 1 Vehicle | 0 (0.0%) | 55 (7.1%) |
| 2 Vehicles | 260 (46.7%) | 382 (49.0%) |
| 3 Vehicles | 148 (26.6%) | 135 (17.3%) |
| 4 Vehicles | 32 (5.8%) | 111 (14.2%) |
| 5 or more Vehicles | 14 (2.5%) | 25 (3.2%) |
| Total | 557 (100.0%) | 779 (100.0%) |
Commute Time in Pine Grove
The most frequently occuring commute durations in Pine Grove are 15 to 19 minutes (393 commuters, 30.7%), 20 to 24 minutes (191 commuters, 14.9%), and 5 to 9 minutes (176 commuters, 13.8%).
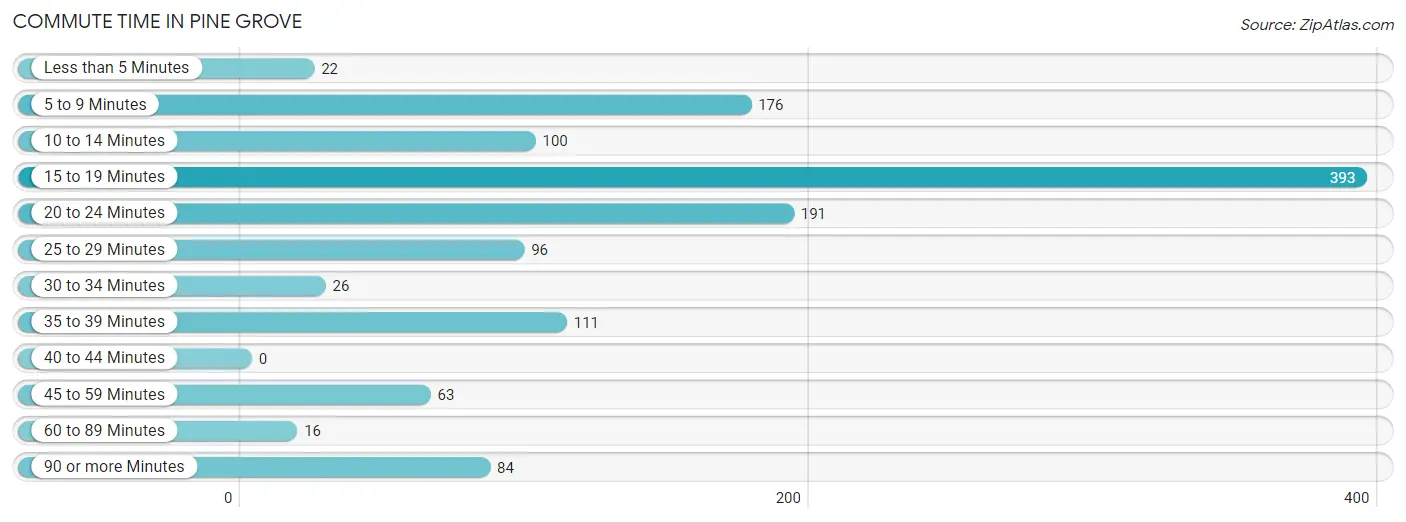
| Commute Time | # Commuters | % Commuters |
| Less than 5 Minutes | 22 | 1.7% |
| 5 to 9 Minutes | 176 | 13.8% |
| 10 to 14 Minutes | 100 | 7.8% |
| 15 to 19 Minutes | 393 | 30.7% |
| 20 to 24 Minutes | 191 | 14.9% |
| 25 to 29 Minutes | 96 | 7.5% |
| 30 to 34 Minutes | 26 | 2.0% |
| 35 to 39 Minutes | 111 | 8.7% |
| 40 to 44 Minutes | 0 | 0.0% |
| 45 to 59 Minutes | 63 | 4.9% |
| 60 to 89 Minutes | 16 | 1.3% |
| 90 or more Minutes | 84 | 6.6% |
Commute Time by Sex in Pine Grove
The most common commute times in Pine Grove are 15 to 19 minutes (176 commuters, 33.1%) for males and 15 to 19 minutes (217 commuters, 29.1%) for females.
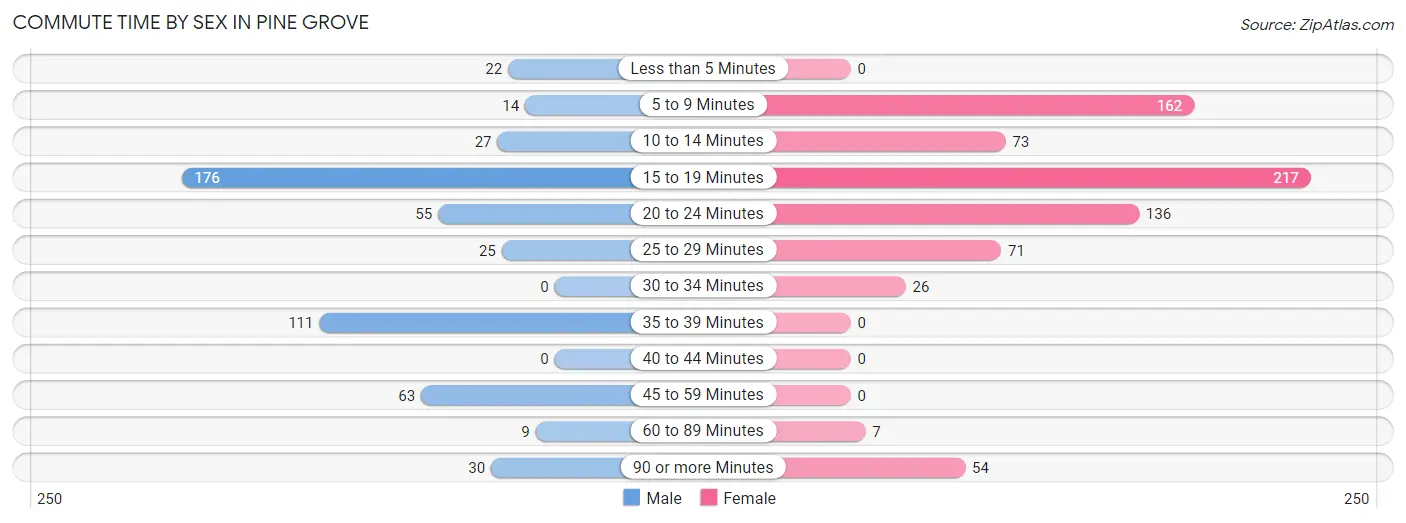
| Commute Time | Male | Female |
| Less than 5 Minutes | 22 (4.1%) | 0 (0.0%) |
| 5 to 9 Minutes | 14 (2.6%) | 162 (21.7%) |
| 10 to 14 Minutes | 27 (5.1%) | 73 (9.8%) |
| 15 to 19 Minutes | 176 (33.1%) | 217 (29.1%) |
| 20 to 24 Minutes | 55 (10.3%) | 136 (18.2%) |
| 25 to 29 Minutes | 25 (4.7%) | 71 (9.5%) |
| 30 to 34 Minutes | 0 (0.0%) | 26 (3.5%) |
| 35 to 39 Minutes | 111 (20.9%) | 0 (0.0%) |
| 40 to 44 Minutes | 0 (0.0%) | 0 (0.0%) |
| 45 to 59 Minutes | 63 (11.8%) | 0 (0.0%) |
| 60 to 89 Minutes | 9 (1.7%) | 7 (0.9%) |
| 90 or more Minutes | 30 (5.6%) | 54 (7.2%) |
Time of Departure to Work by Sex in Pine Grove
The most frequent times of departure to work in Pine Grove are 7:30 AM to 7:59 AM (175, 32.9%) for males and 7:00 AM to 7:29 AM (215, 28.8%) for females.
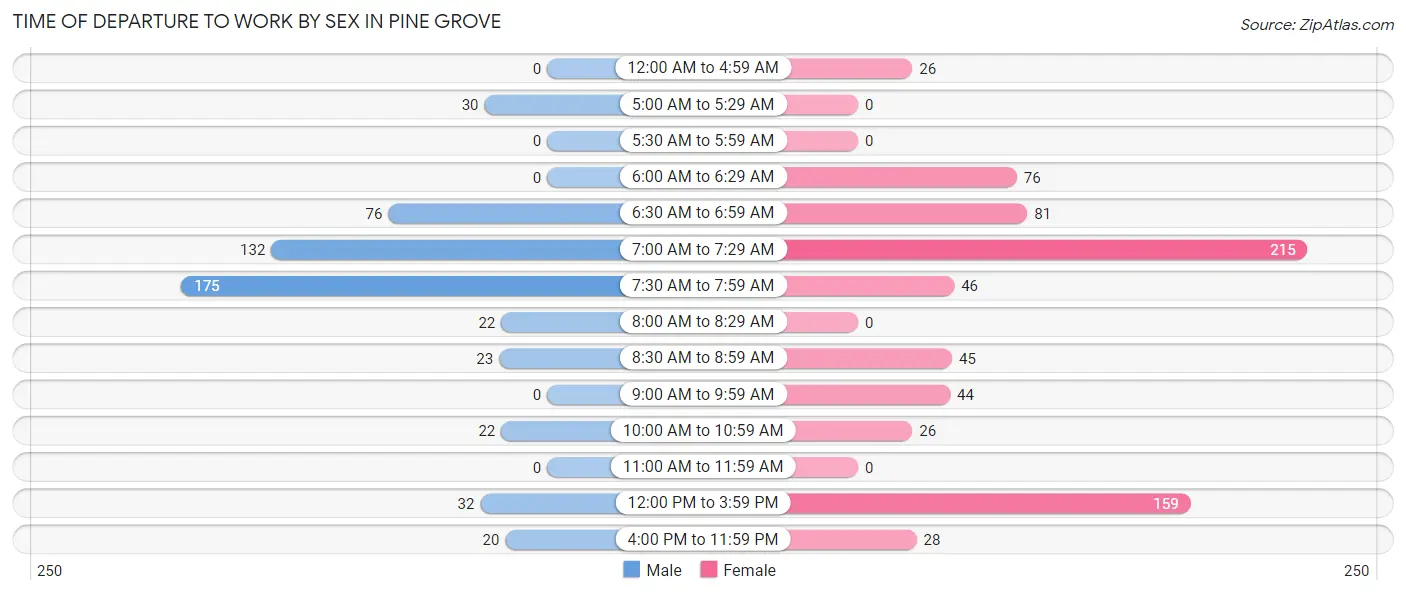
| Time of Departure | Male | Female |
| 12:00 AM to 4:59 AM | 0 (0.0%) | 26 (3.5%) |
| 5:00 AM to 5:29 AM | 30 (5.6%) | 0 (0.0%) |
| 5:30 AM to 5:59 AM | 0 (0.0%) | 0 (0.0%) |
| 6:00 AM to 6:29 AM | 0 (0.0%) | 76 (10.2%) |
| 6:30 AM to 6:59 AM | 76 (14.3%) | 81 (10.9%) |
| 7:00 AM to 7:29 AM | 132 (24.8%) | 215 (28.8%) |
| 7:30 AM to 7:59 AM | 175 (32.9%) | 46 (6.2%) |
| 8:00 AM to 8:29 AM | 22 (4.1%) | 0 (0.0%) |
| 8:30 AM to 8:59 AM | 23 (4.3%) | 45 (6.0%) |
| 9:00 AM to 9:59 AM | 0 (0.0%) | 44 (5.9%) |
| 10:00 AM to 10:59 AM | 22 (4.1%) | 26 (3.5%) |
| 11:00 AM to 11:59 AM | 0 (0.0%) | 0 (0.0%) |
| 12:00 PM to 3:59 PM | 32 (6.0%) | 159 (21.3%) |
| 4:00 PM to 11:59 PM | 20 (3.8%) | 28 (3.7%) |
| Total | 532 (100.0%) | 746 (100.0%) |
Housing Occupancy in Pine Grove
Occupancy by Ownership in Pine Grove
Of the total 1,540 dwellings in Pine Grove, owner-occupied units account for 1,209 (78.5%), while renter-occupied units make up 331 (21.5%).
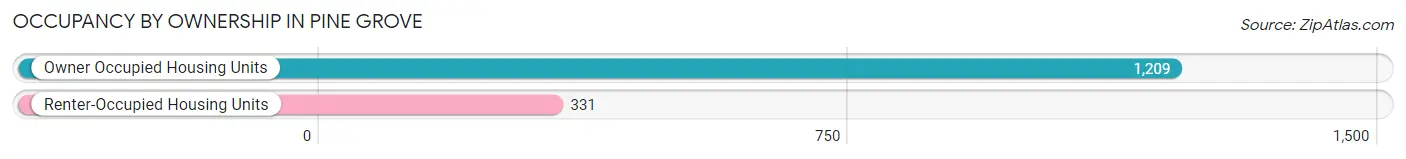
| Occupancy | # Housing Units | % Housing Units |
| Owner Occupied Housing Units | 1,209 | 78.5% |
| Renter-Occupied Housing Units | 331 | 21.5% |
| Total Occupied Housing Units | 1,540 | 100.0% |
Occupancy by Household Size in Pine Grove
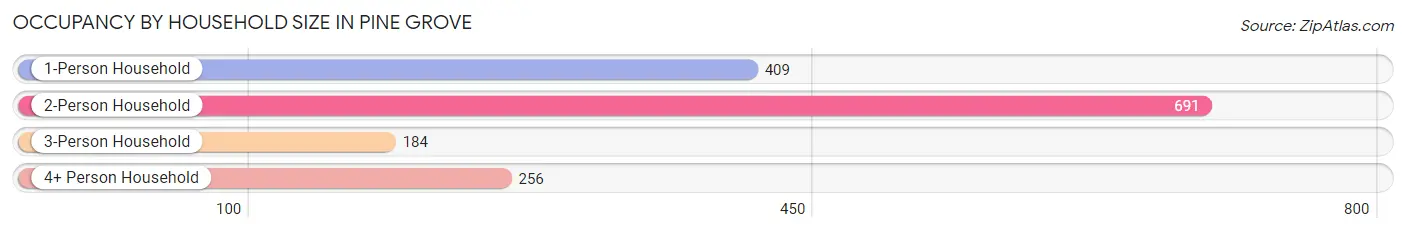
| Household Size | # Housing Units | % Housing Units |
| 1-Person Household | 409 | 26.6% |
| 2-Person Household | 691 | 44.9% |
| 3-Person Household | 184 | 11.9% |
| 4+ Person Household | 256 | 16.6% |
| Total Housing Units | 1,540 | 100.0% |
Occupancy by Ownership by Household Size in Pine Grove
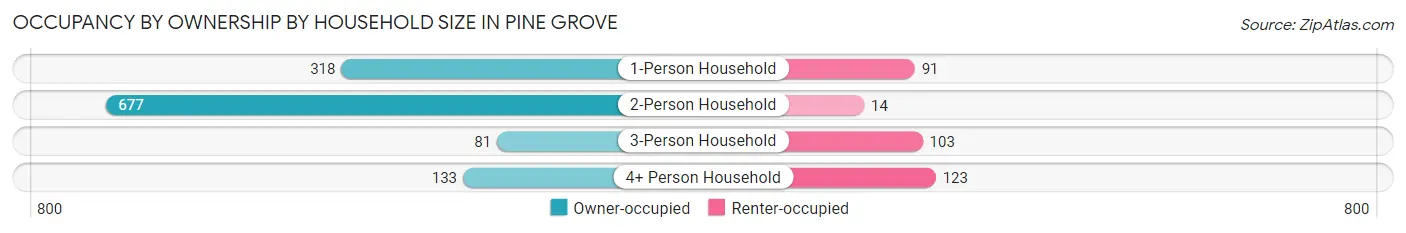
| Household Size | Owner-occupied | Renter-occupied |
| 1-Person Household | 318 (77.7%) | 91 (22.3%) |
| 2-Person Household | 677 (98.0%) | 14 (2.0%) |
| 3-Person Household | 81 (44.0%) | 103 (56.0%) |
| 4+ Person Household | 133 (51.9%) | 123 (48.0%) |
| Total Housing Units | 1,209 (78.5%) | 331 (21.5%) |
Occupancy by Educational Attainment in Pine Grove
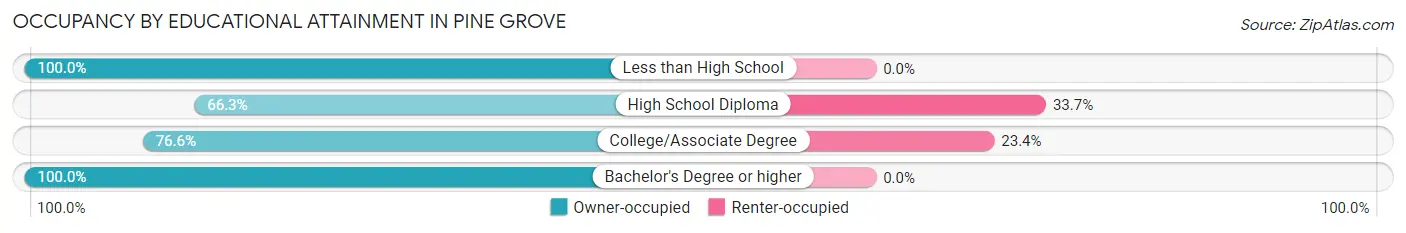
| Household Size | Owner-occupied | Renter-occupied |
| Less than High School | 20 (100.0%) | 0 (0.0%) |
| High School Diploma | 329 (66.3%) | 167 (33.7%) |
| College/Associate Degree | 536 (76.6%) | 164 (23.4%) |
| Bachelor's Degree or higher | 324 (100.0%) | 0 (0.0%) |
Occupancy by Age of Householder in Pine Grove
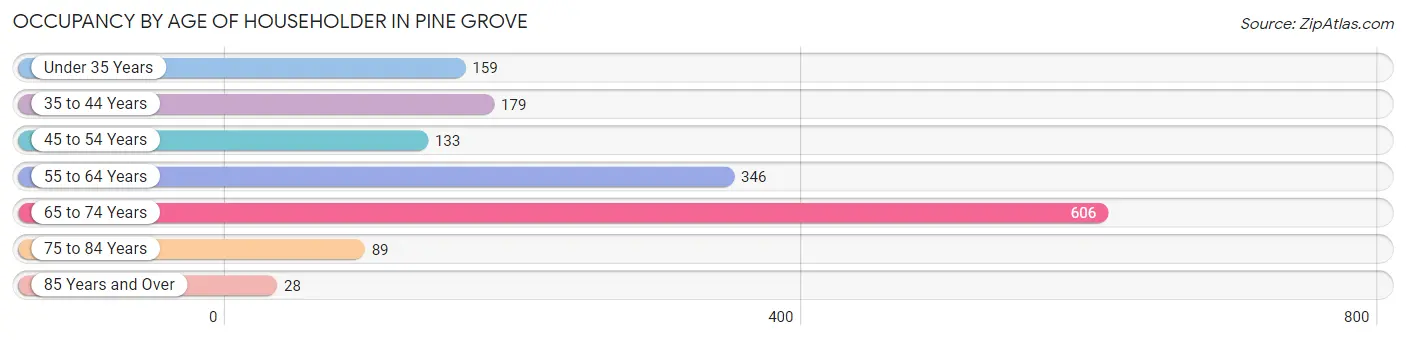
| Age Bracket | # Households | % Households |
| Under 35 Years | 159 | 10.3% |
| 35 to 44 Years | 179 | 11.6% |
| 45 to 54 Years | 133 | 8.6% |
| 55 to 64 Years | 346 | 22.5% |
| 65 to 74 Years | 606 | 39.4% |
| 75 to 84 Years | 89 | 5.8% |
| 85 Years and Over | 28 | 1.8% |
| Total | 1,540 | 100.0% |
Housing Finances in Pine Grove
Median Income by Occupancy in Pine Grove
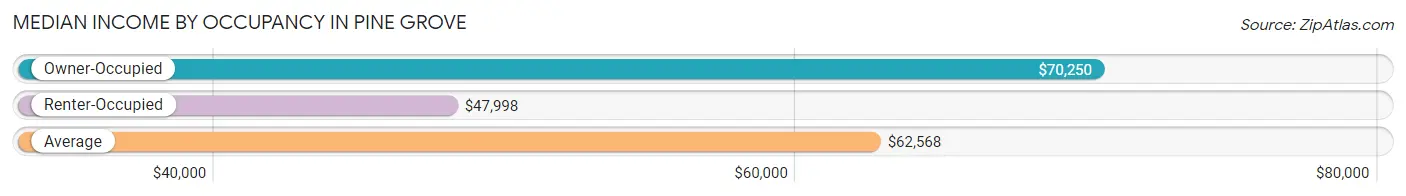
| Occupancy Type | # Households | Median Income |
| Owner-Occupied | 1,209 (78.5%) | $70,250 |
| Renter-Occupied | 331 (21.5%) | $47,998 |
| Average | 1,540 (100.0%) | $62,568 |
Occupancy by Householder Income Bracket in Pine Grove
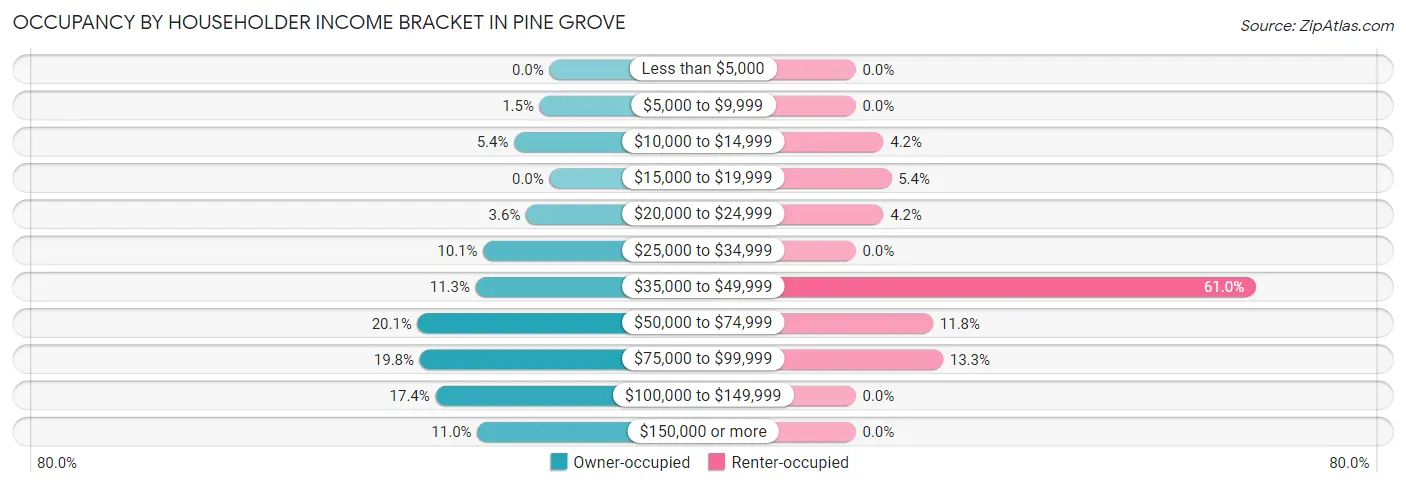
| Income Bracket | Owner-occupied | Renter-occupied |
| Less than $5,000 | 0 (0.0%) | 0 (0.0%) |
| $5,000 to $9,999 | 18 (1.5%) | 0 (0.0%) |
| $10,000 to $14,999 | 65 (5.4%) | 14 (4.2%) |
| $15,000 to $19,999 | 0 (0.0%) | 18 (5.4%) |
| $20,000 to $24,999 | 43 (3.6%) | 14 (4.2%) |
| $25,000 to $34,999 | 122 (10.1%) | 0 (0.0%) |
| $35,000 to $49,999 | 136 (11.3%) | 202 (61.0%) |
| $50,000 to $74,999 | 243 (20.1%) | 39 (11.8%) |
| $75,000 to $99,999 | 239 (19.8%) | 44 (13.3%) |
| $100,000 to $149,999 | 210 (17.4%) | 0 (0.0%) |
| $150,000 or more | 133 (11.0%) | 0 (0.0%) |
| Total | 1,209 (100.0%) | 331 (100.0%) |
Monthly Housing Cost Tiers in Pine Grove
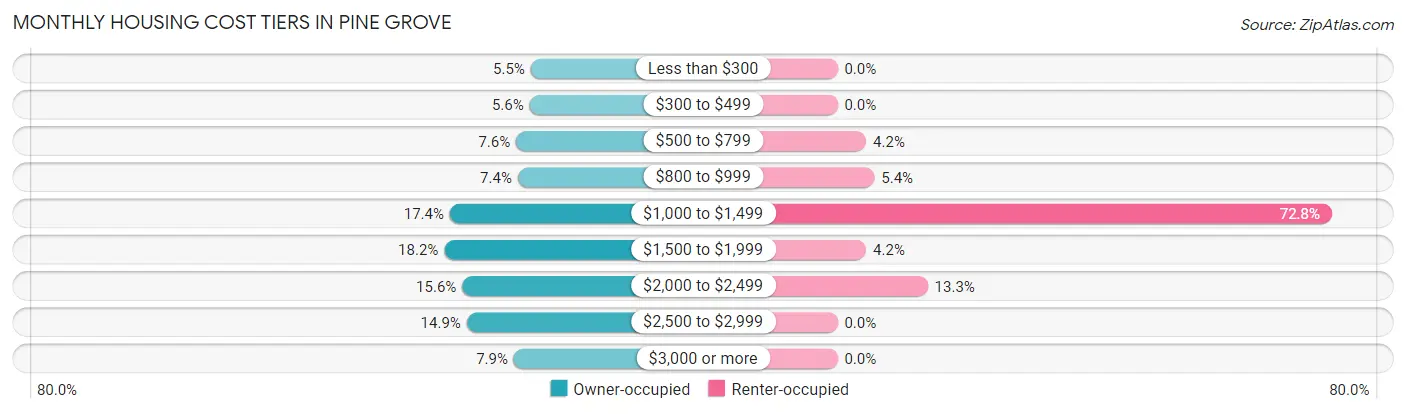
| Monthly Cost | Owner-occupied | Renter-occupied |
| Less than $300 | 66 (5.5%) | 0 (0.0%) |
| $300 to $499 | 68 (5.6%) | 0 (0.0%) |
| $500 to $799 | 92 (7.6%) | 14 (4.2%) |
| $800 to $999 | 89 (7.4%) | 18 (5.4%) |
| $1,000 to $1,499 | 210 (17.4%) | 241 (72.8%) |
| $1,500 to $1,999 | 220 (18.2%) | 14 (4.2%) |
| $2,000 to $2,499 | 188 (15.5%) | 44 (13.3%) |
| $2,500 to $2,999 | 180 (14.9%) | 0 (0.0%) |
| $3,000 or more | 96 (7.9%) | 0 (0.0%) |
| Total | 1,209 (100.0%) | 331 (100.0%) |
Physical Housing Characteristics in Pine Grove
Housing Structures in Pine Grove
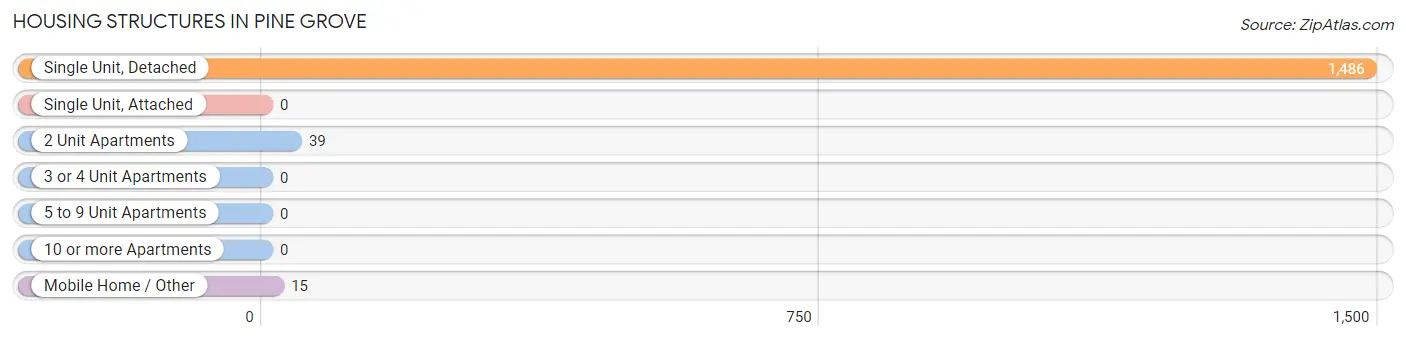
| Structure Type | # Housing Units | % Housing Units |
| Single Unit, Detached | 1,486 | 96.5% |
| Single Unit, Attached | 0 | 0.0% |
| 2 Unit Apartments | 39 | 2.5% |
| 3 or 4 Unit Apartments | 0 | 0.0% |
| 5 to 9 Unit Apartments | 0 | 0.0% |
| 10 or more Apartments | 0 | 0.0% |
| Mobile Home / Other | 15 | 1.0% |
| Total | 1,540 | 100.0% |
Housing Structures by Occupancy in Pine Grove
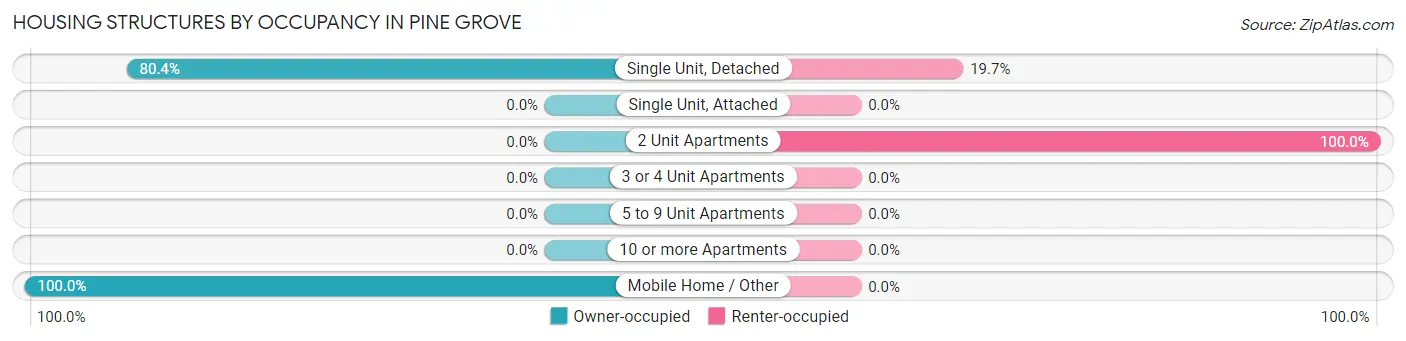
| Structure Type | Owner-occupied | Renter-occupied |
| Single Unit, Detached | 1,194 (80.3%) | 292 (19.7%) |
| Single Unit, Attached | 0 (0.0%) | 0 (0.0%) |
| 2 Unit Apartments | 0 (0.0%) | 39 (100.0%) |
| 3 or 4 Unit Apartments | 0 (0.0%) | 0 (0.0%) |
| 5 to 9 Unit Apartments | 0 (0.0%) | 0 (0.0%) |
| 10 or more Apartments | 0 (0.0%) | 0 (0.0%) |
| Mobile Home / Other | 15 (100.0%) | 0 (0.0%) |
| Total | 1,209 (78.5%) | 331 (21.5%) |
Housing Structures by Number of Rooms in Pine Grove
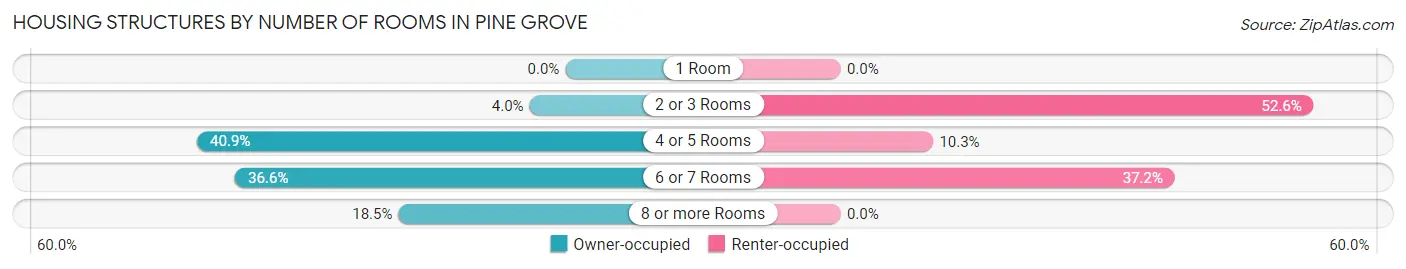
| Number of Rooms | Owner-occupied | Renter-occupied |
| 1 Room | 0 (0.0%) | 0 (0.0%) |
| 2 or 3 Rooms | 48 (4.0%) | 174 (52.6%) |
| 4 or 5 Rooms | 494 (40.9%) | 34 (10.3%) |
| 6 or 7 Rooms | 443 (36.6%) | 123 (37.2%) |
| 8 or more Rooms | 224 (18.5%) | 0 (0.0%) |
| Total | 1,209 (100.0%) | 331 (100.0%) |
Housing Structure by Heating Type in Pine Grove
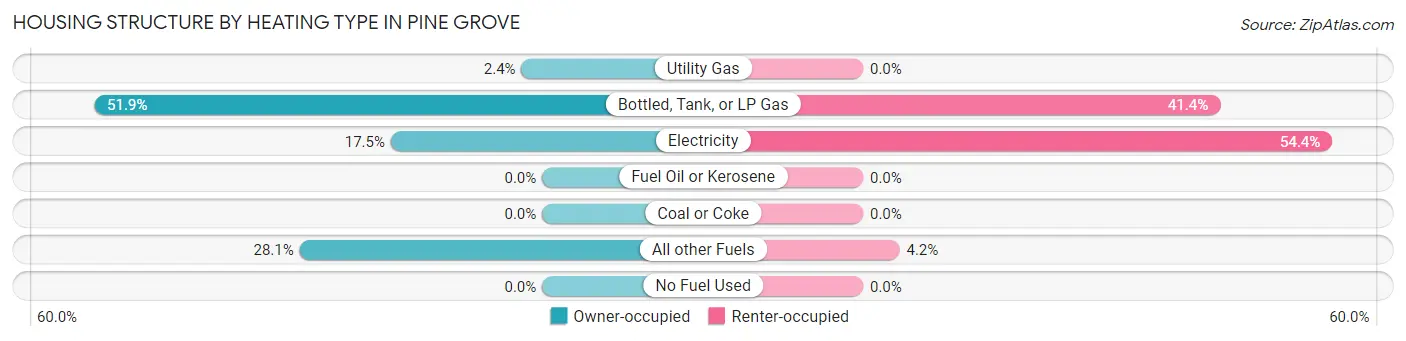
| Heating Type | Owner-occupied | Renter-occupied |
| Utility Gas | 29 (2.4%) | 0 (0.0%) |
| Bottled, Tank, or LP Gas | 628 (51.9%) | 137 (41.4%) |
| Electricity | 212 (17.5%) | 180 (54.4%) |
| Fuel Oil or Kerosene | 0 (0.0%) | 0 (0.0%) |
| Coal or Coke | 0 (0.0%) | 0 (0.0%) |
| All other Fuels | 340 (28.1%) | 14 (4.2%) |
| No Fuel Used | 0 (0.0%) | 0 (0.0%) |
| Total | 1,209 (100.0%) | 331 (100.0%) |
Household Vehicle Usage in Pine Grove
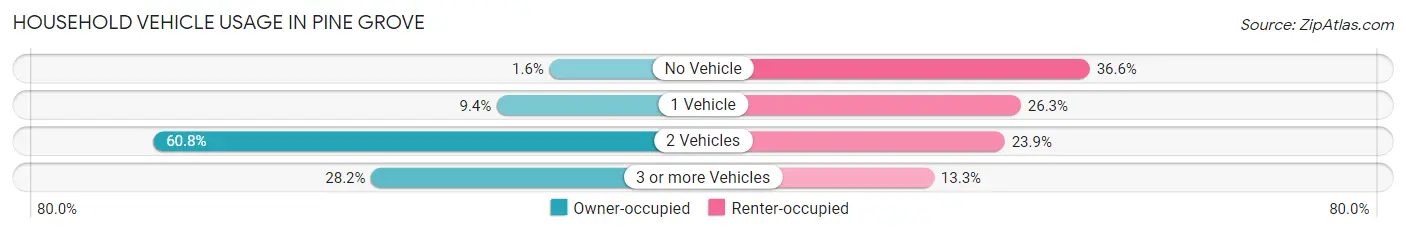
| Vehicles per Household | Owner-occupied | Renter-occupied |
| No Vehicle | 19 (1.6%) | 121 (36.6%) |
| 1 Vehicle | 114 (9.4%) | 87 (26.3%) |
| 2 Vehicles | 735 (60.8%) | 79 (23.9%) |
| 3 or more Vehicles | 341 (28.2%) | 44 (13.3%) |
| Total | 1,209 (100.0%) | 331 (100.0%) |
Real Estate & Mortgages in Pine Grove
Real Estate and Mortgage Overview in Pine Grove
| Characteristic | Without Mortgage | With Mortgage |
| Housing Units | 325 | 884 |
| Median Property Value | $411,200 | $357,100 |
| Median Household Income | $45,703 | $118 |
| Monthly Housing Costs | $694 | $96 |
| Real Estate Taxes | $3,297 | $9 |
Property Value by Mortgage Status in Pine Grove
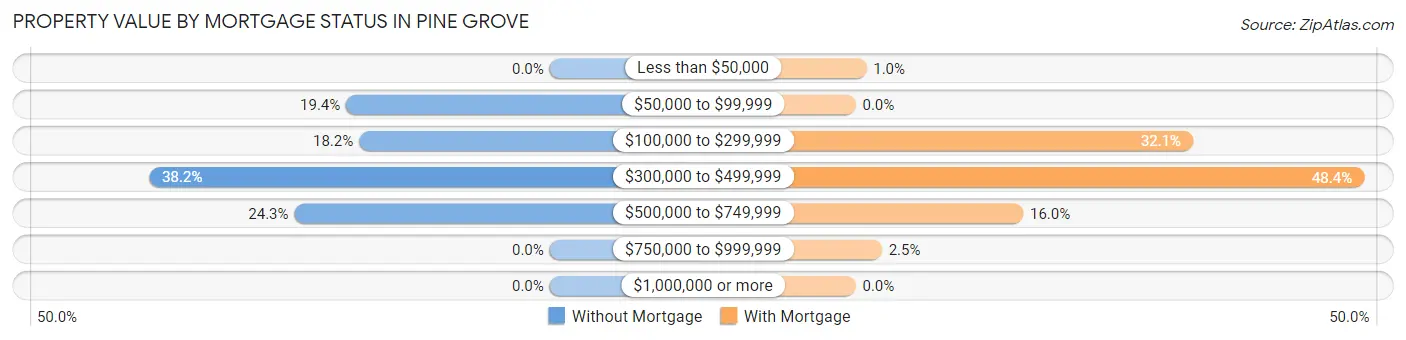
| Property Value | Without Mortgage | With Mortgage |
| Less than $50,000 | 0 (0.0%) | 9 (1.0%) |
| $50,000 to $99,999 | 63 (19.4%) | 0 (0.0%) |
| $100,000 to $299,999 | 59 (18.1%) | 284 (32.1%) |
| $300,000 to $499,999 | 124 (38.2%) | 428 (48.4%) |
| $500,000 to $749,999 | 79 (24.3%) | 141 (16.0%) |
| $750,000 to $999,999 | 0 (0.0%) | 22 (2.5%) |
| $1,000,000 or more | 0 (0.0%) | 0 (0.0%) |
| Total | 325 (100.0%) | 884 (100.0%) |
Household Income by Mortgage Status in Pine Grove
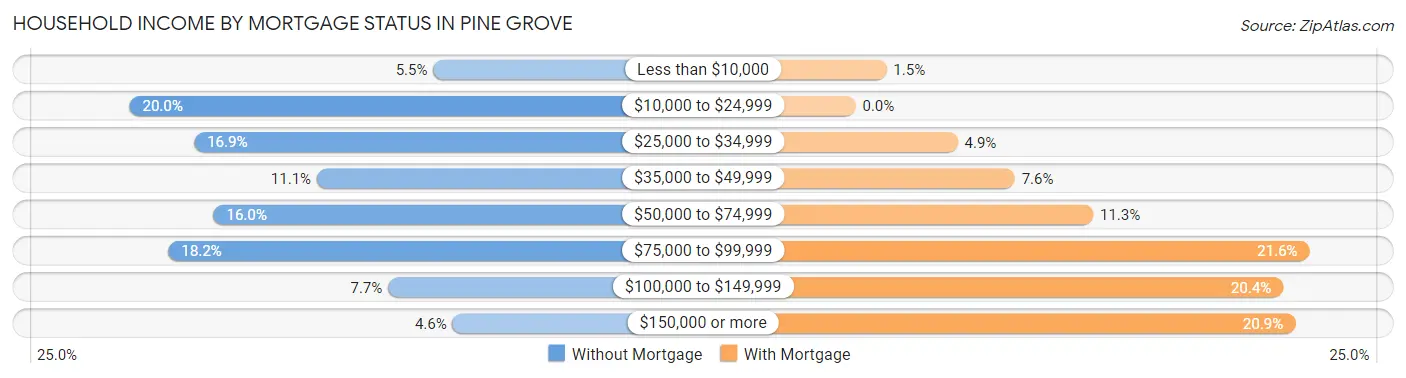
| Household Income | Without Mortgage | With Mortgage |
| Less than $10,000 | 18 (5.5%) | 13 (1.5%) |
| $10,000 to $24,999 | 65 (20.0%) | 0 (0.0%) |
| $25,000 to $34,999 | 55 (16.9%) | 43 (4.9%) |
| $35,000 to $49,999 | 36 (11.1%) | 67 (7.6%) |
| $50,000 to $74,999 | 52 (16.0%) | 100 (11.3%) |
| $75,000 to $99,999 | 59 (18.1%) | 191 (21.6%) |
| $100,000 to $149,999 | 25 (7.7%) | 180 (20.4%) |
| $150,000 or more | 15 (4.6%) | 185 (20.9%) |
| Total | 325 (100.0%) | 884 (100.0%) |
Property Value to Household Income Ratio in Pine Grove
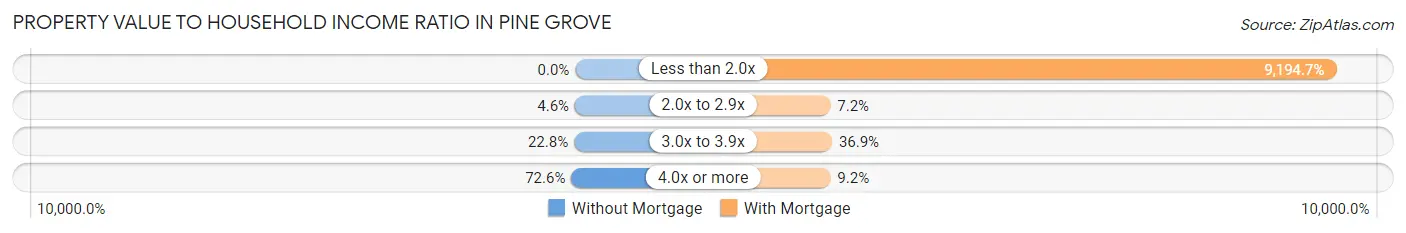
| Value-to-Income Ratio | Without Mortgage | With Mortgage |
| Less than 2.0x | 0 (0.0%) | 81,281 (9,194.7%) |
| 2.0x to 2.9x | 15 (4.6%) | 64 (7.2%) |
| 3.0x to 3.9x | 74 (22.8%) | 326 (36.9%) |
| 4.0x or more | 236 (72.6%) | 81 (9.2%) |
| Total | 325 (100.0%) | 884 (100.0%) |
Real Estate Taxes by Mortgage Status in Pine Grove
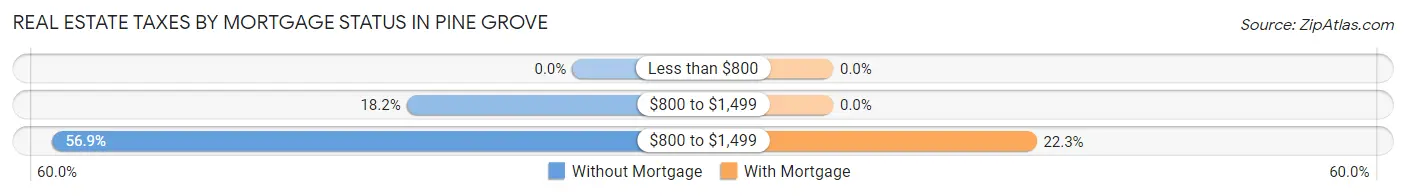
| Property Taxes | Without Mortgage | With Mortgage |
| Less than $800 | 0 (0.0%) | 0 (0.0%) |
| $800 to $1,499 | 59 (18.1%) | 0 (0.0%) |
| $800 to $1,499 | 185 (56.9%) | 197 (22.3%) |
| Total | 325 (100.0%) | 884 (100.0%) |
Health & Disability in Pine Grove
Health Insurance Coverage by Age in Pine Grove
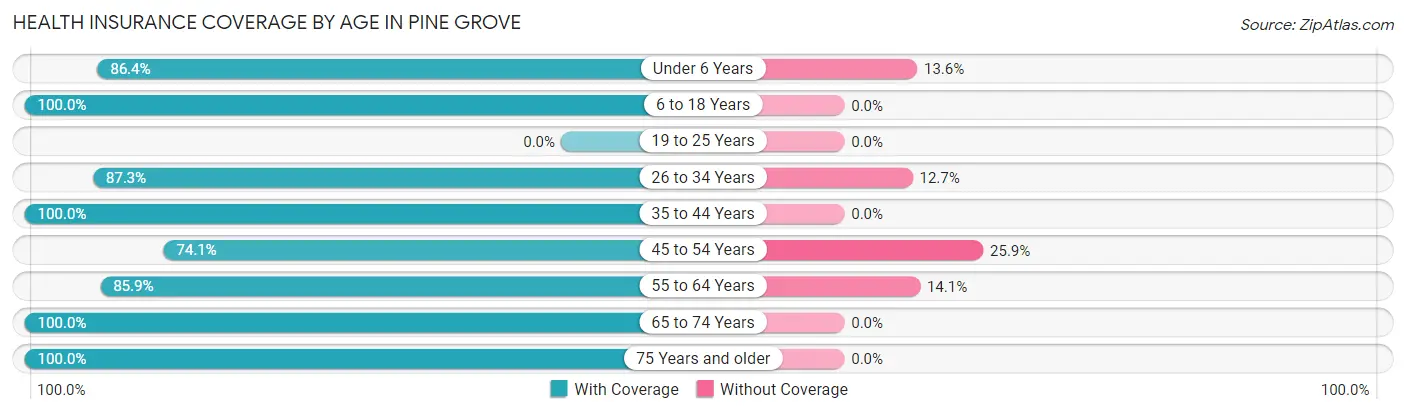
| Age Bracket | With Coverage | Without Coverage |
| Under 6 Years | 255 (86.4%) | 40 (13.6%) |
| 6 to 18 Years | 214 (100.0%) | 0 (0.0%) |
| 19 to 25 Years | 0 (0.0%) | 0 (0.0%) |
| 26 to 34 Years | 384 (87.3%) | 56 (12.7%) |
| 35 to 44 Years | 361 (100.0%) | 0 (0.0%) |
| 45 to 54 Years | 249 (74.1%) | 87 (25.9%) |
| 55 to 64 Years | 493 (85.9%) | 81 (14.1%) |
| 65 to 74 Years | 916 (100.0%) | 0 (0.0%) |
| 75 Years and older | 250 (100.0%) | 0 (0.0%) |
| Total | 3,122 (92.2%) | 264 (7.8%) |
Health Insurance Coverage by Citizenship Status in Pine Grove

| Citizenship Status | With Coverage | Without Coverage |
| Native Born | 255 (86.4%) | 40 (13.6%) |
| Foreign Born, Citizen | 214 (100.0%) | 0 (0.0%) |
| Foreign Born, not a Citizen | 0 (0.0%) | 0 (0.0%) |
Health Insurance Coverage by Household Income in Pine Grove
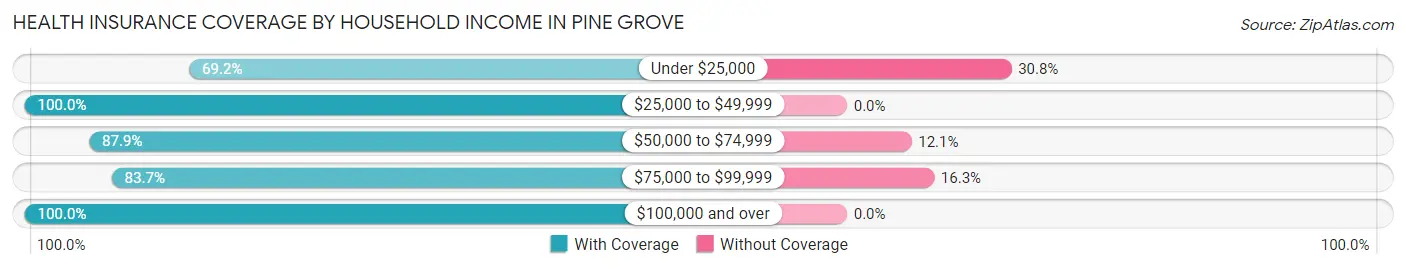
| Household Income | With Coverage | Without Coverage |
| Under $25,000 | 182 (69.2%) | 81 (30.8%) |
| $25,000 to $49,999 | 827 (100.0%) | 0 (0.0%) |
| $50,000 to $74,999 | 524 (87.9%) | 72 (12.1%) |
| $75,000 to $99,999 | 569 (83.7%) | 111 (16.3%) |
| $100,000 and over | 1,020 (100.0%) | 0 (0.0%) |
Public vs Private Health Insurance Coverage by Age in Pine Grove
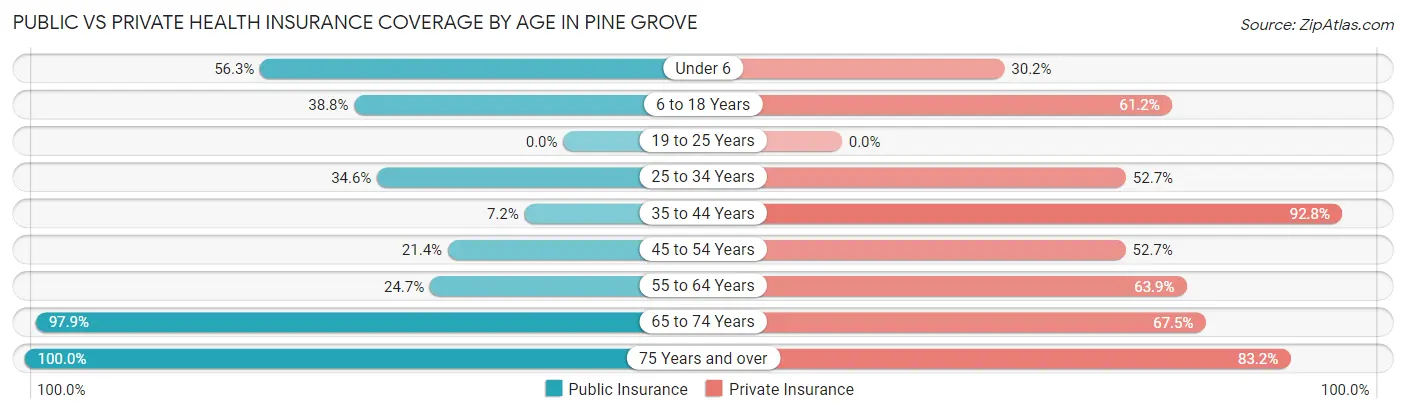
| Age Bracket | Public Insurance | Private Insurance |
| Under 6 | 166 (56.3%) | 89 (30.2%) |
| 6 to 18 Years | 83 (38.8%) | 131 (61.2%) |
| 19 to 25 Years | 0 (0.0%) | 0 (0.0%) |
| 25 to 34 Years | 152 (34.5%) | 232 (52.7%) |
| 35 to 44 Years | 26 (7.2%) | 335 (92.8%) |
| 45 to 54 Years | 72 (21.4%) | 177 (52.7%) |
| 55 to 64 Years | 142 (24.7%) | 367 (63.9%) |
| 65 to 74 Years | 897 (97.9%) | 618 (67.5%) |
| 75 Years and over | 250 (100.0%) | 208 (83.2%) |
| Total | 1,788 (52.8%) | 2,157 (63.7%) |
Disability Status by Sex by Age in Pine Grove
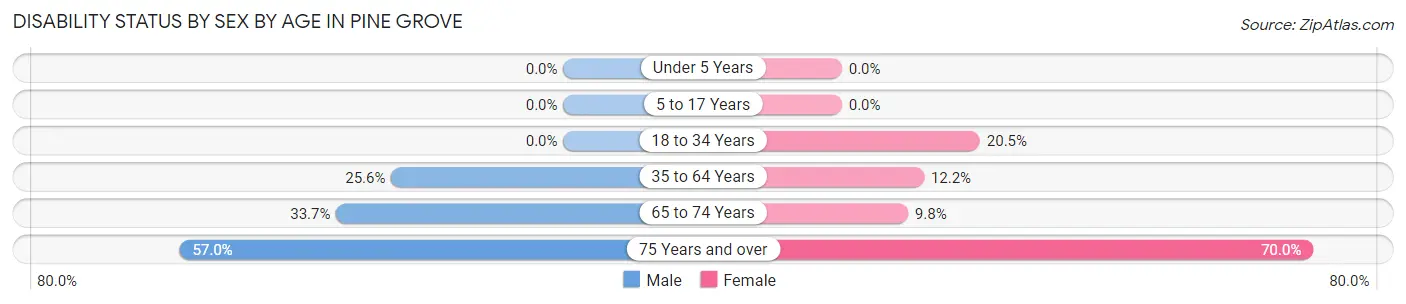
| Age Bracket | Male | Female |
| Under 5 Years | 0 (0.0%) | 0 (0.0%) |
| 5 to 17 Years | 0 (0.0%) | 0 (0.0%) |
| 18 to 34 Years | 0 (0.0%) | 74 (20.5%) |
| 35 to 64 Years | 199 (25.6%) | 60 (12.2%) |
| 65 to 74 Years | 89 (33.7%) | 64 (9.8%) |
| 75 Years and over | 57 (57.0%) | 105 (70.0%) |
Disability Class by Sex by Age in Pine Grove
Disability Class: Hearing Difficulty
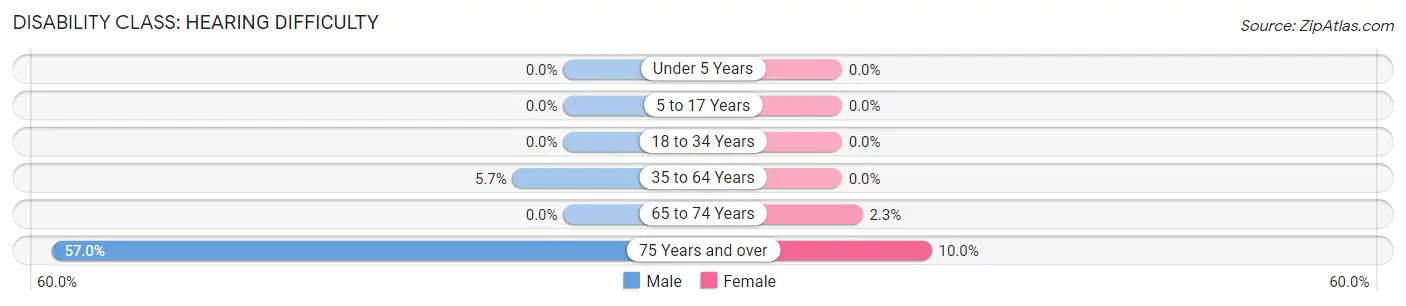
| Age Bracket | Male | Female |
| Under 5 Years | 0 (0.0%) | 0 (0.0%) |
| 5 to 17 Years | 0 (0.0%) | 0 (0.0%) |
| 18 to 34 Years | 0 (0.0%) | 0 (0.0%) |
| 35 to 64 Years | 44 (5.7%) | 0 (0.0%) |
| 65 to 74 Years | 0 (0.0%) | 15 (2.3%) |
| 75 Years and over | 57 (57.0%) | 15 (10.0%) |
Disability Class: Vision Difficulty
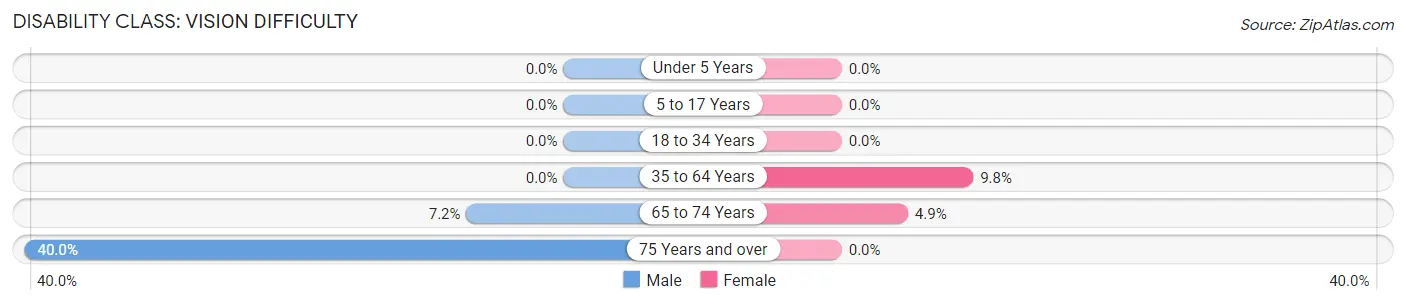
| Age Bracket | Male | Female |
| Under 5 Years | 0 (0.0%) | 0 (0.0%) |
| 5 to 17 Years | 0 (0.0%) | 0 (0.0%) |
| 18 to 34 Years | 0 (0.0%) | 0 (0.0%) |
| 35 to 64 Years | 0 (0.0%) | 48 (9.8%) |
| 65 to 74 Years | 19 (7.2%) | 32 (4.9%) |
| 75 Years and over | 40 (40.0%) | 0 (0.0%) |
Disability Class: Cognitive Difficulty
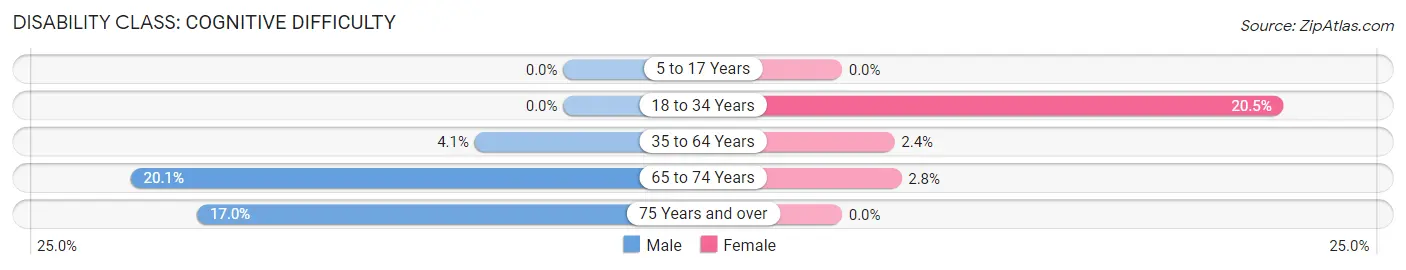
| Age Bracket | Male | Female |
| 5 to 17 Years | 0 (0.0%) | 0 (0.0%) |
| 18 to 34 Years | 0 (0.0%) | 74 (20.5%) |
| 35 to 64 Years | 32 (4.1%) | 12 (2.4%) |
| 65 to 74 Years | 53 (20.1%) | 18 (2.8%) |
| 75 Years and over | 17 (17.0%) | 0 (0.0%) |
Disability Class: Ambulatory Difficulty
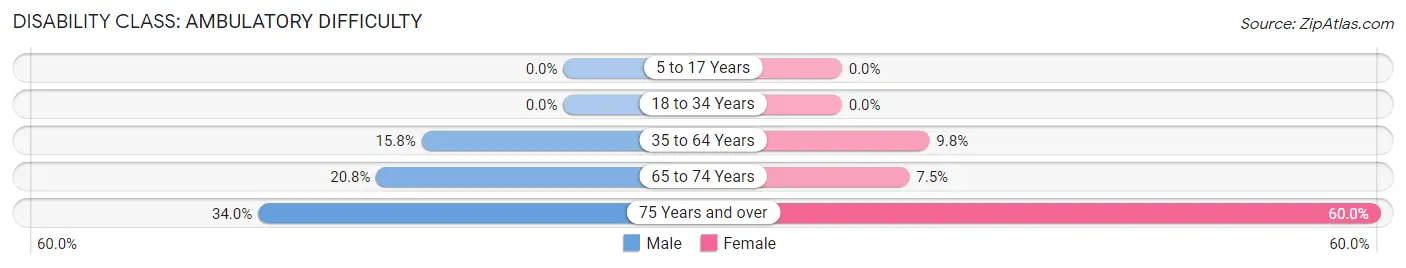
| Age Bracket | Male | Female |
| 5 to 17 Years | 0 (0.0%) | 0 (0.0%) |
| 18 to 34 Years | 0 (0.0%) | 0 (0.0%) |
| 35 to 64 Years | 123 (15.8%) | 48 (9.8%) |
| 65 to 74 Years | 55 (20.8%) | 49 (7.5%) |
| 75 Years and over | 34 (34.0%) | 90 (60.0%) |
Disability Class: Self-Care Difficulty
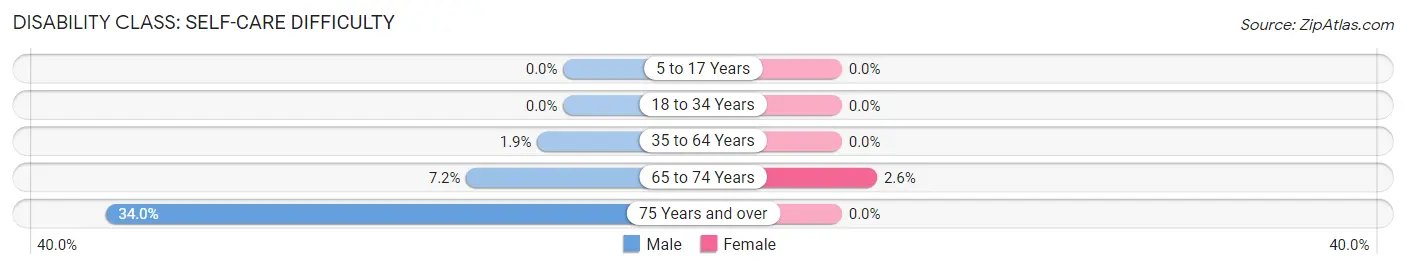
| Age Bracket | Male | Female |
| 5 to 17 Years | 0 (0.0%) | 0 (0.0%) |
| 18 to 34 Years | 0 (0.0%) | 0 (0.0%) |
| 35 to 64 Years | 15 (1.9%) | 0 (0.0%) |
| 65 to 74 Years | 19 (7.2%) | 17 (2.6%) |
| 75 Years and over | 34 (34.0%) | 0 (0.0%) |
Technology Access in Pine Grove
Computing Device Access in Pine Grove
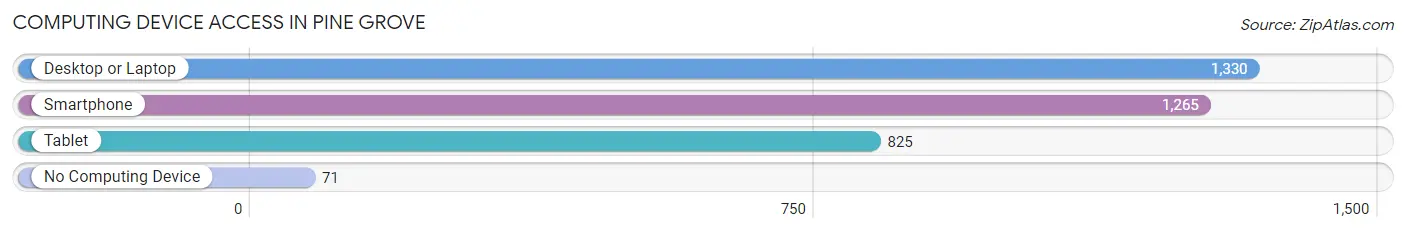
| Device Type | # Households | % Households |
| Desktop or Laptop | 1,330 | 86.4% |
| Smartphone | 1,265 | 82.1% |
| Tablet | 825 | 53.6% |
| No Computing Device | 71 | 4.6% |
| Total | 1,540 | 100.0% |
Internet Access in Pine Grove
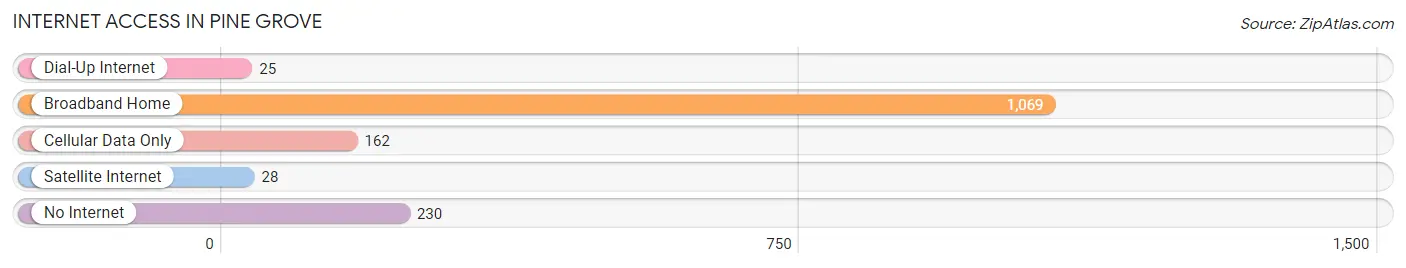
| Internet Type | # Households | % Households |
| Dial-Up Internet | 25 | 1.6% |
| Broadband Home | 1,069 | 69.4% |
| Cellular Data Only | 162 | 10.5% |
| Satellite Internet | 28 | 1.8% |
| No Internet | 230 | 14.9% |
| Total | 1,540 | 100.0% |
Pine Grove Summary
Pine Grove, California is a small unincorporated community located in Amador County, California. It is situated in the Sierra Nevada foothills, approximately 40 miles east of Sacramento and 80 miles northeast of San Francisco. The population of Pine Grove was 1,845 at the 2010 census.
History
Pine Grove was originally inhabited by the Miwok Indians, who lived in the area for thousands of years before the arrival of European settlers. The first recorded European settler in the area was John Sutter, who established a trading post in 1848. The area was later settled by miners during the California Gold Rush. The town was officially founded in 1854 and was named after the abundance of pine trees in the area.
Geography
Pine Grove is located at an elevation of 2,000 feet in the Sierra Nevada foothills. The town is situated in a valley surrounded by rolling hills and mountains. The nearest major city is Sacramento, which is located 40 miles to the west. The nearest major airport is Sacramento International Airport, which is located 45 miles to the west.
Climate
Pine Grove has a Mediterranean climate, with hot, dry summers and cool, wet winters. The average high temperature in the summer is 90°F, and the average low temperature in the winter is 33°F. The area receives an average of 20 inches of precipitation per year.
Economy
The economy of Pine Grove is largely based on agriculture and tourism. The area is known for its wineries, vineyards, and apple orchards. The town is also home to several small businesses, including restaurants, shops, and galleries.
Demographics
As of the 2010 census, the population of Pine Grove was 1,845. The racial makeup of the town was 87.3% White, 0.7% African American, 0.7% Native American, 0.7% Asian, 0.2% Pacific Islander, 8.2% from other races, and 2.2% from two or more races. The median household income was $45,000, and the median family income was $50,000. The per capita income was $20,000.
Conclusion
Pine Grove, California is a small unincorporated community located in Amador County, California. It is situated in the Sierra Nevada foothills, approximately 40 miles east of Sacramento and 80 miles northeast of San Francisco. The population of Pine Grove was 1,845 at the 2010 census. The economy of Pine Grove is largely based on agriculture and tourism, and the town is known for its wineries, vineyards, and apple orchards. The racial makeup of the town was 87.3% White, 0.7% African American, 0.7% Native American, 0.7% Asian, 0.2% Pacific Islander, 8.2% from other races, and 2.2% from two or more races. The median household income was $45,000, and the median family income was $50,000. The per capita income was $20,000.
Common Questions
What is Per Capita Income in Pine Grove?
Per Capita income in Pine Grove is $35,486.
What is the Median Family Income in Pine Grove?
Median Family Income in Pine Grove is $67,896.
What is the Median Household income in Pine Grove?
Median Household Income in Pine Grove is $62,568.
What is Income or Wage Gap in Pine Grove?
Income or Wage Gap in Pine Grove is 0.2%.
Women in Pine Grove earn 99.8 cents for every dollar earned by a man.
What is Inequality or Gini Index in Pine Grove?
Inequality or Gini Index in Pine Grove is 0.37.
What is the Total Population of Pine Grove?
Total Population of Pine Grove is 3,386.
What is the Total Male Population of Pine Grove?
Total Male Population of Pine Grove is 1,464.
What is the Total Female Population of Pine Grove?
Total Female Population of Pine Grove is 1,922.
What is the Ratio of Males per 100 Females in Pine Grove?
There are 76.17 Males per 100 Females in Pine Grove.
What is the Ratio of Females per 100 Males in Pine Grove?
There are 131.28 Females per 100 Males in Pine Grove.
What is the Median Population Age in Pine Grove?
Median Population Age in Pine Grove is 55.4 Years.
What is the Average Family Size in Pine Grove
Average Family Size in Pine Grove is 2.6 People.
What is the Average Household Size in Pine Grove
Average Household Size in Pine Grove is 2.2 People.
How Large is the Labor Force in Pine Grove?
There are 1,555 People in the Labor Forcein in Pine Grove.
What is the Percentage of People in the Labor Force in Pine Grove?
53.2% of People are in the Labor Force in Pine Grove.
What is the Unemployment Rate in Pine Grove?
Unemployment Rate in Pine Grove is 14.0%.