Parlier, CA Map & Demographics
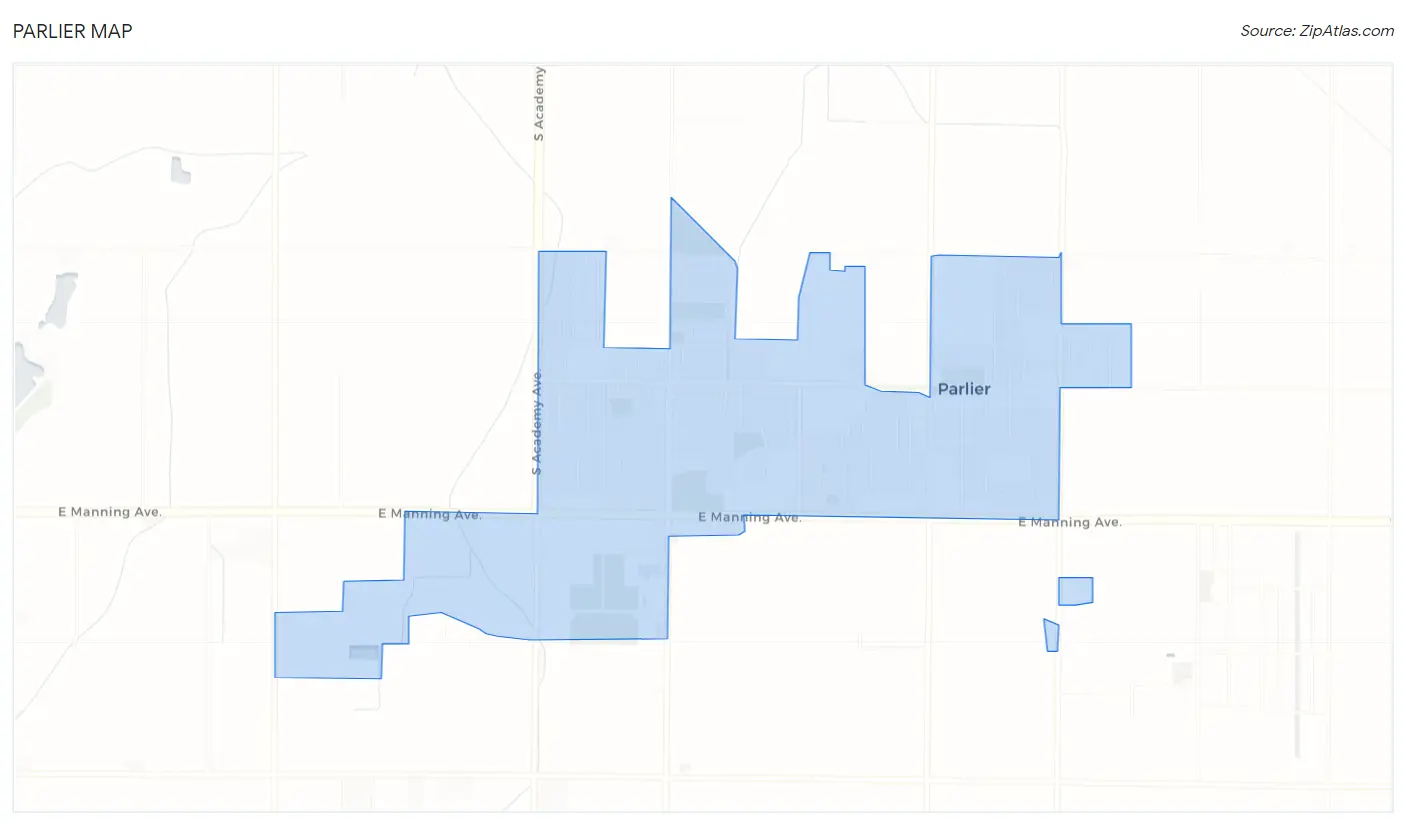
Parlier Map
Parlier Overview
$17,566
PER CAPITA INCOME
$51,592
AVG FAMILY INCOME
$50,026
AVG HOUSEHOLD INCOME
25.4%
WAGE / INCOME GAP [ % ]
74.6¢/ $1
WAGE / INCOME GAP [ $ ]
0.46
INEQUALITY / GINI INDEX
14,625
TOTAL POPULATION
7,345
MALE POPULATION
7,280
FEMALE POPULATION
100.89
MALES / 100 FEMALES
99.12
FEMALES / 100 MALES
28.2
MEDIAN AGE
4.1
AVG FAMILY SIZE
3.9
AVG HOUSEHOLD SIZE
6,836
LABOR FORCE [ PEOPLE ]
64.9%
PERCENT IN LABOR FORCE
6.9%
UNEMPLOYMENT RATE
Parlier Zip Codes
Parlier Area Codes
Income in Parlier
Income Overview in Parlier
Per Capita Income in Parlier is $17,566, while median incomes of families and households are $51,592 and $50,026 respectively.
| Characteristic | Number | Measure |
| Per Capita Income | 14,625 | $17,566 |
| Median Family Income | 3,295 | $51,592 |
| Mean Family Income | 3,295 | $62,595 |
| Median Household Income | 3,746 | $50,026 |
| Mean Household Income | 3,746 | $63,872 |
| Income Deficit | 3,295 | $0 |
| Wage / Income Gap (%) | 14,625 | 25.43% |
| Wage / Income Gap ($) | 14,625 | 74.57¢ per $1 |
| Gini / Inequality Index | 14,625 | 0.46 |
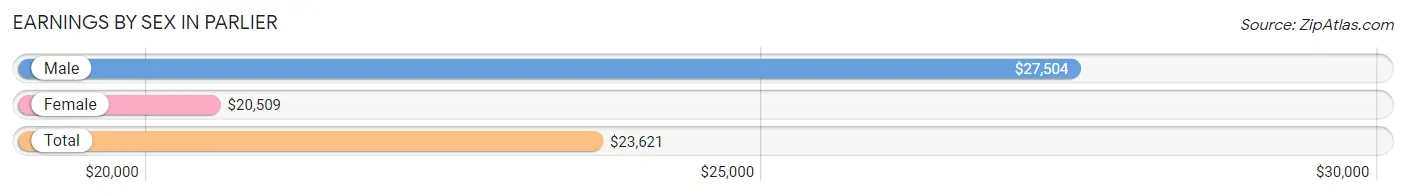
Earnings by Sex in Parlier
Average Earnings in Parlier are $23,621, $27,504 for men and $20,509 for women, a difference of 25.4%.
| Sex | Number | Average Earnings |
| Male | 3,795 (52.9%) | $27,504 |
| Female | 3,384 (47.1%) | $20,509 |
| Total | 7,179 (100.0%) | $23,621 |
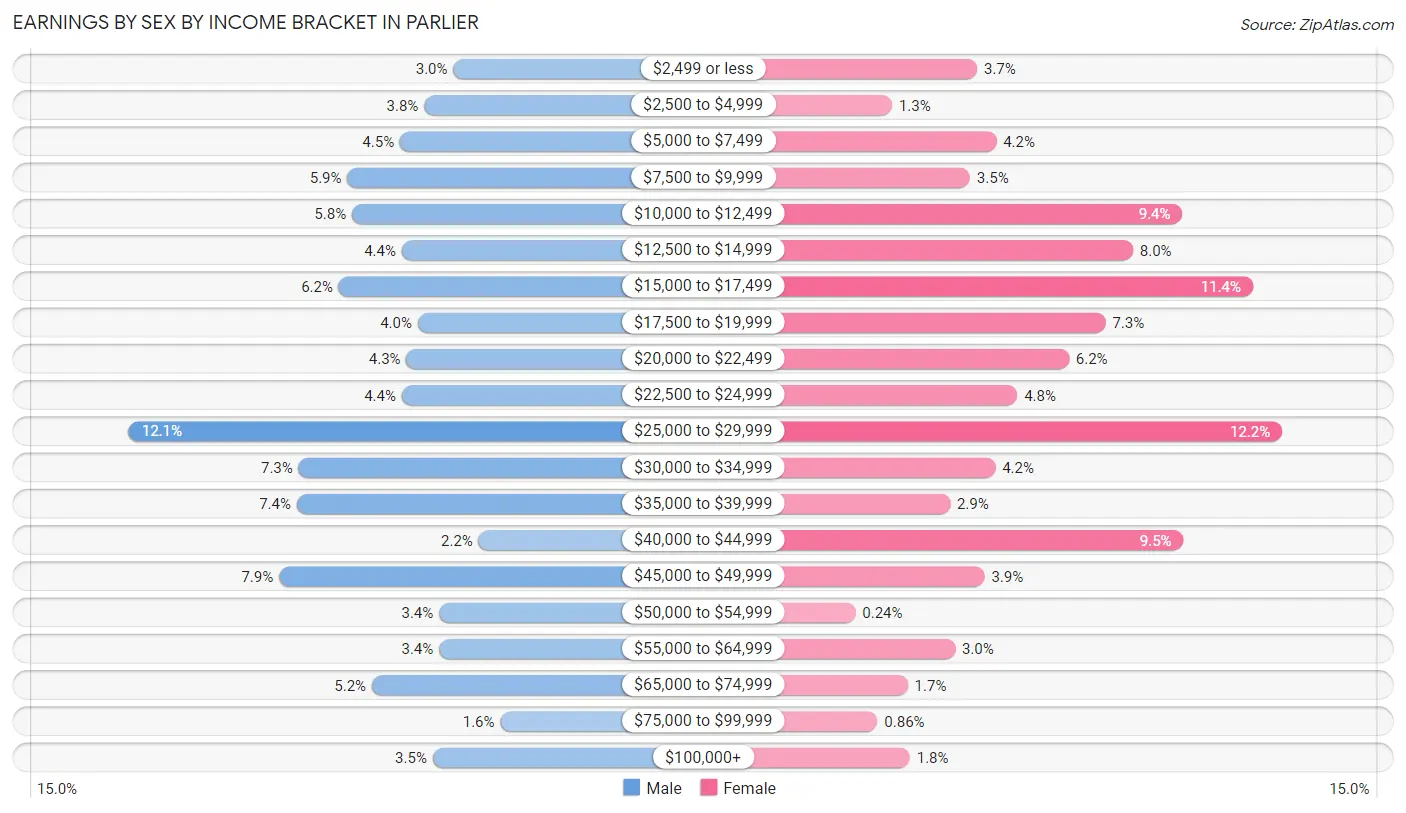
Earnings by Sex by Income Bracket in Parlier
The most common earnings brackets in Parlier are $25,000 to $29,999 for men (458 | 12.1%) and $25,000 to $29,999 for women (414 | 12.2%).
| Income | Male | Female |
| $2,499 or less | 112 (2.9%) | 124 (3.7%) |
| $2,500 to $4,999 | 143 (3.8%) | 43 (1.3%) |
| $5,000 to $7,499 | 169 (4.4%) | 142 (4.2%) |
| $7,500 to $9,999 | 225 (5.9%) | 117 (3.5%) |
| $10,000 to $12,499 | 220 (5.8%) | 319 (9.4%) |
| $12,500 to $14,999 | 167 (4.4%) | 272 (8.0%) |
| $15,000 to $17,499 | 234 (6.2%) | 386 (11.4%) |
| $17,500 to $19,999 | 150 (4.0%) | 246 (7.3%) |
| $20,000 to $22,499 | 162 (4.3%) | 211 (6.2%) |
| $22,500 to $24,999 | 167 (4.4%) | 162 (4.8%) |
| $25,000 to $29,999 | 458 (12.1%) | 414 (12.2%) |
| $30,000 to $34,999 | 277 (7.3%) | 141 (4.2%) |
| $35,000 to $39,999 | 279 (7.3%) | 98 (2.9%) |
| $40,000 to $44,999 | 85 (2.2%) | 320 (9.5%) |
| $45,000 to $49,999 | 298 (7.9%) | 131 (3.9%) |
| $50,000 to $54,999 | 127 (3.4%) | 8 (0.2%) |
| $55,000 to $64,999 | 127 (3.4%) | 103 (3.0%) |
| $65,000 to $74,999 | 199 (5.2%) | 58 (1.7%) |
| $75,000 to $99,999 | 62 (1.6%) | 29 (0.9%) |
| $100,000+ | 134 (3.5%) | 60 (1.8%) |
| Total | 3,795 (100.0%) | 3,384 (100.0%) |
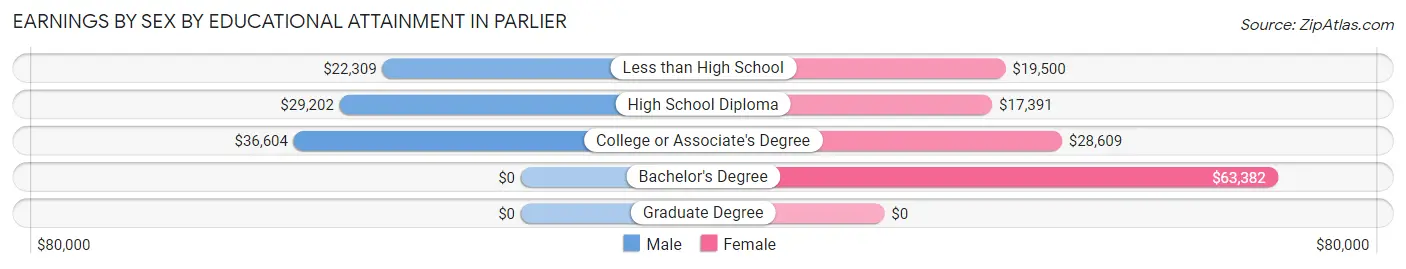
Earnings by Sex by Educational Attainment in Parlier
Average earnings in Parlier are $29,319 for men and $22,577 for women, a difference of 23.0%. Men with an educational attainment of college or associate's degree enjoy the highest average annual earnings of $36,604, while those with less than high school education earn the least with $22,309. Women with an educational attainment of bachelor's degree earn the most with the average annual earnings of $63,382, while those with high school diploma education have the smallest earnings of $17,391.
| Educational Attainment | Male Income | Female Income |
| Less than High School | $22,309 | $19,500 |
| High School Diploma | $29,202 | $17,391 |
| College or Associate's Degree | $36,604 | $28,609 |
| Bachelor's Degree | - | - |
| Graduate Degree | - | - |
| Total | $29,319 | $22,577 |
Family Income in Parlier
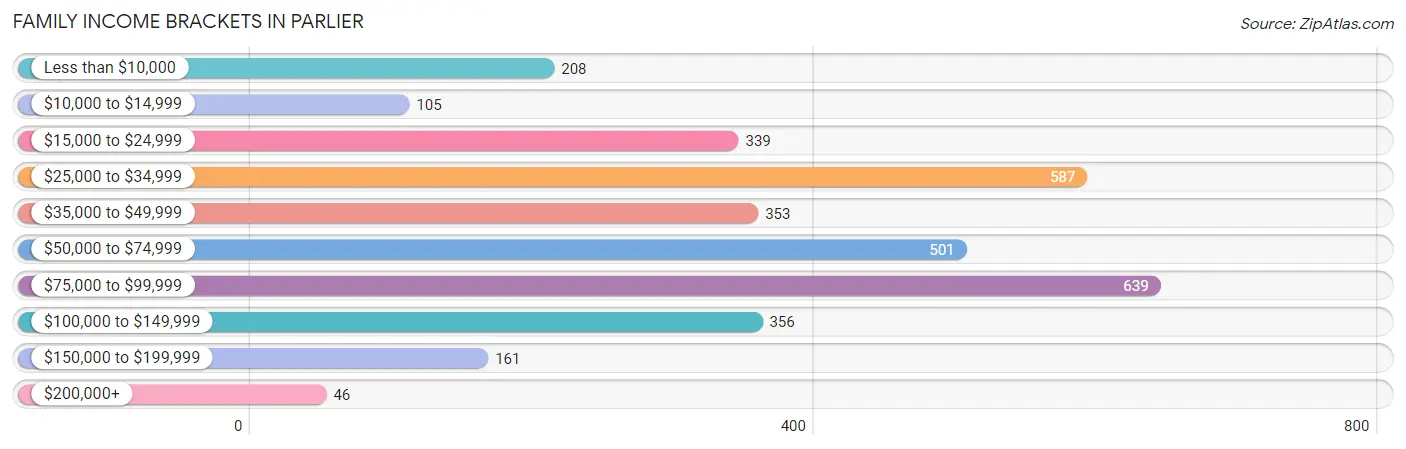
Family Income Brackets in Parlier
According to the Parlier family income data, there are 639 families falling into the $75,000 to $99,999 income range, which is the most common income bracket and makes up 19.4% of all families. Conversely, the $200,000+ income bracket is the least frequent group with only 46 families (1.4%) belonging to this category.
| Income Bracket | # Families | % Families |
| Less than $10,000 | 208 | 6.3% |
| $10,000 to $14,999 | 105 | 3.2% |
| $15,000 to $24,999 | 339 | 10.3% |
| $25,000 to $34,999 | 587 | 17.8% |
| $35,000 to $49,999 | 353 | 10.7% |
| $50,000 to $74,999 | 501 | 15.2% |
| $75,000 to $99,999 | 639 | 19.4% |
| $100,000 to $149,999 | 356 | 10.8% |
| $150,000 to $199,999 | 161 | 4.9% |
| $200,000+ | 46 | 1.4% |
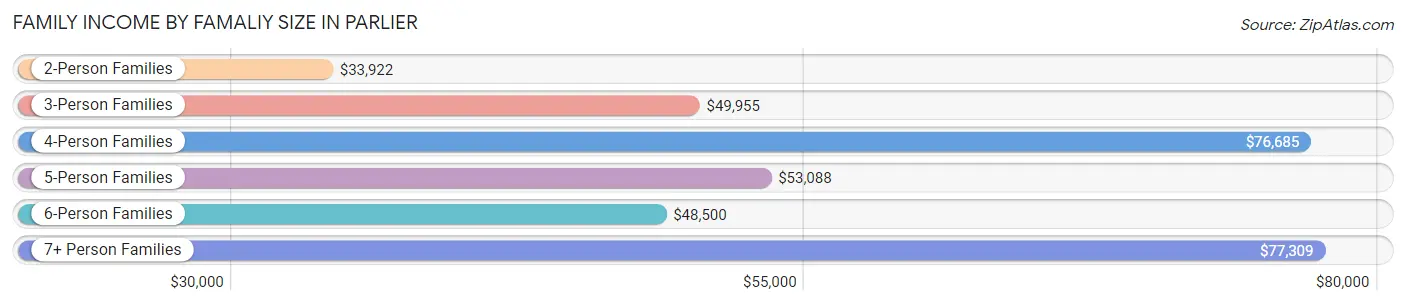
Family Income by Famaliy Size in Parlier
7+ person families (181 | 5.5%) account for the highest median family income in Parlier with $77,309 per family, while 4-person families (707 | 21.5%) have the highest median income of $19,171 per family member.
| Income Bracket | # Families | Median Income |
| 2-Person Families | 886 (26.9%) | $33,922 |
| 3-Person Families | 667 (20.2%) | $49,955 |
| 4-Person Families | 707 (21.5%) | $76,685 |
| 5-Person Families | 558 (16.9%) | $53,088 |
| 6-Person Families | 296 (9.0%) | $48,500 |
| 7+ Person Families | 181 (5.5%) | $77,309 |
| Total | 3,295 (100.0%) | $51,592 |
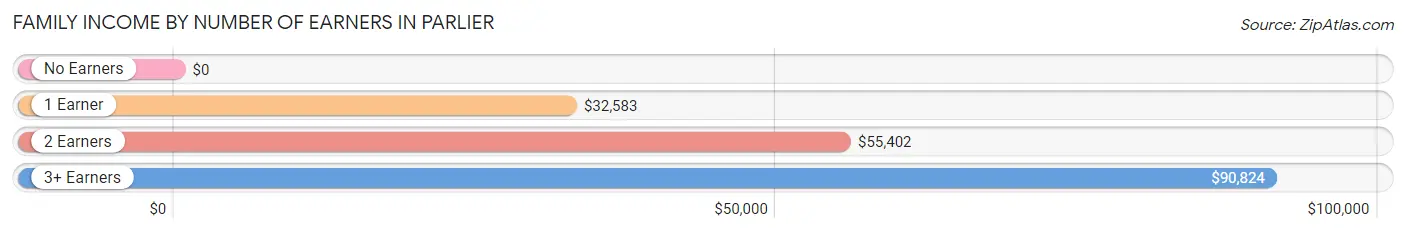
Family Income by Number of Earners in Parlier
| Number of Earners | # Families | Median Income |
| No Earners | 436 (13.2%) | $0 |
| 1 Earner | 860 (26.1%) | $32,583 |
| 2 Earners | 1,311 (39.8%) | $55,402 |
| 3+ Earners | 688 (20.9%) | $90,824 |
| Total | 3,295 (100.0%) | $51,592 |
Household Income in Parlier
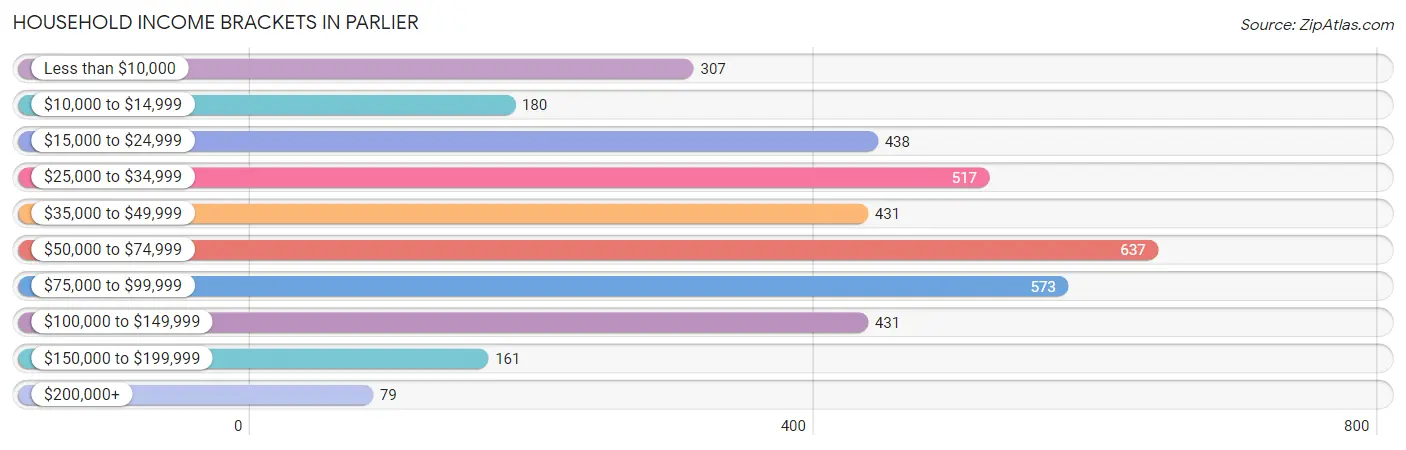
Household Income Brackets in Parlier
With 637 households falling in the category, the $50,000 to $74,999 income range is the most frequent in Parlier, accounting for 17.0% of all households. In contrast, only 79 households (2.1%) fall into the $200,000+ income bracket, making it the least populous group.
| Income Bracket | # Households | % Households |
| Less than $10,000 | 307 | 8.2% |
| $10,000 to $14,999 | 180 | 4.8% |
| $15,000 to $24,999 | 438 | 11.7% |
| $25,000 to $34,999 | 517 | 13.8% |
| $35,000 to $49,999 | 431 | 11.5% |
| $50,000 to $74,999 | 637 | 17.0% |
| $75,000 to $99,999 | 573 | 15.3% |
| $100,000 to $149,999 | 431 | 11.5% |
| $150,000 to $199,999 | 161 | 4.3% |
| $200,000+ | 79 | 2.1% |
Household Income by Householder Age in Parlier
The median household income in Parlier is $50,026, with the highest median household income of $73,265 found in the 45 to 64 years age bracket for the primary householder. A total of 1,418 households (37.9%) fall into this category. Meanwhile, the 15 to 24 years age bracket for the primary householder has the lowest median household income of $0, with 118 households (3.2%) in this group.
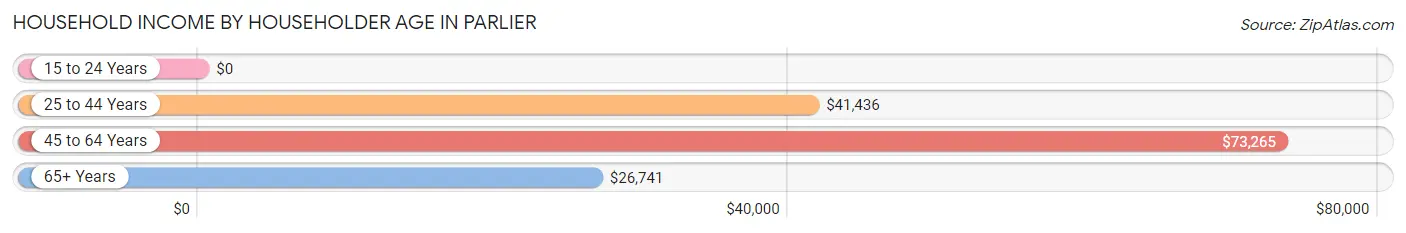
| Income Bracket | # Households | Median Income |
| 15 to 24 Years | 118 (3.2%) | $0 |
| 25 to 44 Years | 1,525 (40.7%) | $41,436 |
| 45 to 64 Years | 1,418 (37.9%) | $73,265 |
| 65+ Years | 685 (18.3%) | $26,741 |
| Total | 3,746 (100.0%) | $50,026 |
Poverty in Parlier
Income Below Poverty by Sex and Age in Parlier
With 26.6% poverty level for males and 28.2% for females among the residents of Parlier, 16 and 17 year old males and under 5 year old females are the most vulnerable to poverty, with 168 males (59.0%) and 320 females (54.1%) in their respective age groups living below the poverty level.
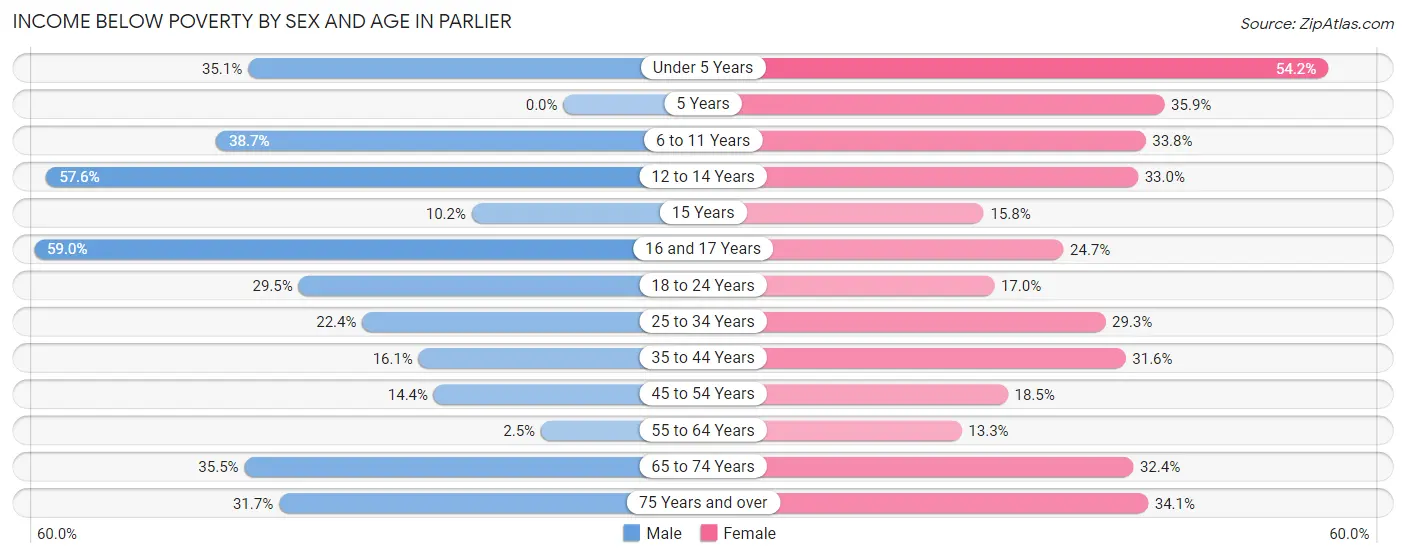
| Age Bracket | Male | Female |
| Under 5 Years | 177 (35.1%) | 320 (54.1%) |
| 5 Years | 0 (0.0%) | 14 (35.9%) |
| 6 to 11 Years | 322 (38.7%) | 266 (33.8%) |
| 12 to 14 Years | 247 (57.6%) | 147 (33.0%) |
| 15 Years | 15 (10.2%) | 33 (15.8%) |
| 16 and 17 Years | 168 (59.0%) | 88 (24.6%) |
| 18 to 24 Years | 274 (29.5%) | 141 (17.0%) |
| 25 to 34 Years | 247 (22.4%) | 368 (29.3%) |
| 35 to 44 Years | 153 (16.1%) | 295 (31.6%) |
| 45 to 54 Years | 76 (14.4%) | 120 (18.5%) |
| 55 to 64 Years | 21 (2.5%) | 89 (13.3%) |
| 65 to 74 Years | 168 (35.5%) | 72 (32.4%) |
| 75 Years and over | 76 (31.7%) | 91 (34.1%) |
| Total | 1,944 (26.6%) | 2,044 (28.2%) |
Income Above Poverty by Sex and Age in Parlier
According to the poverty statistics in Parlier, males aged 5 years and females aged 55 to 64 years are the age groups that are most secure financially, with 100.0% of males and 86.7% of females in these age groups living above the poverty line.
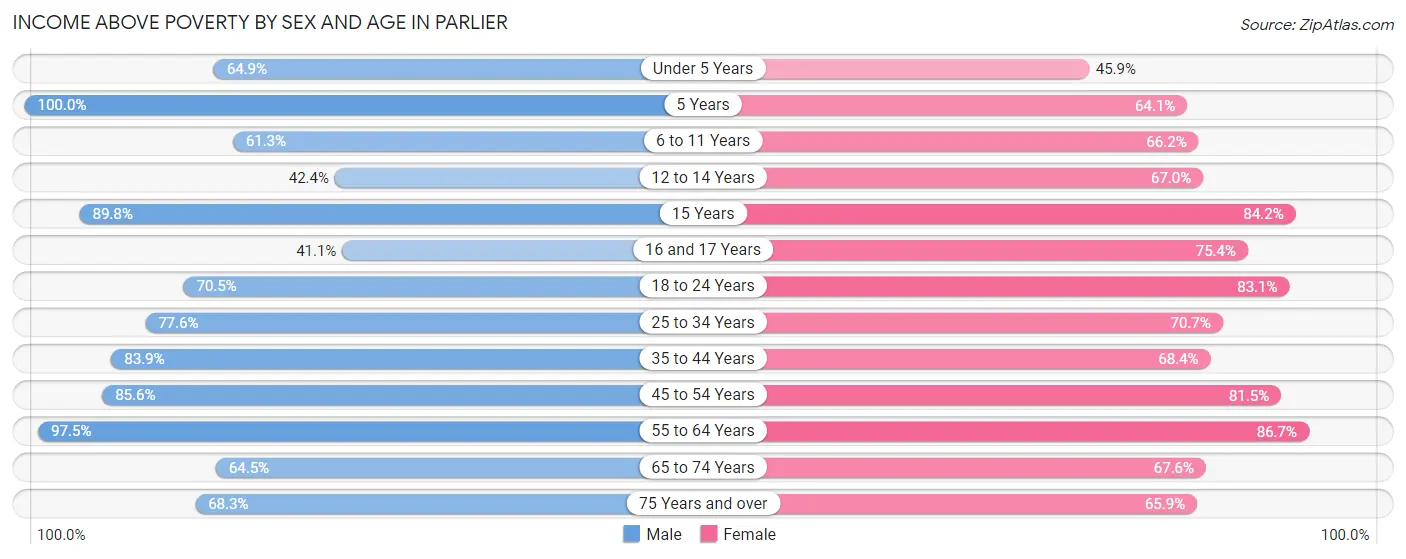
| Age Bracket | Male | Female |
| Under 5 Years | 327 (64.9%) | 271 (45.9%) |
| 5 Years | 50 (100.0%) | 25 (64.1%) |
| 6 to 11 Years | 511 (61.3%) | 521 (66.2%) |
| 12 to 14 Years | 182 (42.4%) | 299 (67.0%) |
| 15 Years | 132 (89.8%) | 176 (84.2%) |
| 16 and 17 Years | 117 (41.0%) | 269 (75.3%) |
| 18 to 24 Years | 655 (70.5%) | 691 (83.1%) |
| 25 to 34 Years | 856 (77.6%) | 887 (70.7%) |
| 35 to 44 Years | 797 (83.9%) | 639 (68.4%) |
| 45 to 54 Years | 451 (85.6%) | 530 (81.5%) |
| 55 to 64 Years | 820 (97.5%) | 579 (86.7%) |
| 65 to 74 Years | 305 (64.5%) | 150 (67.6%) |
| 75 Years and over | 164 (68.3%) | 176 (65.9%) |
| Total | 5,367 (73.4%) | 5,213 (71.8%) |
Income Below Poverty Among Married-Couple Families in Parlier
The poverty statistics for married-couple families in Parlier show that 27.4% or 489 of the total 1,783 families live below the poverty line. Families with 3 or 4 children have the highest poverty rate of 56.6%, comprising of 280 families. On the other hand, families with no children have the lowest poverty rate of 16.1%, which includes 127 families.
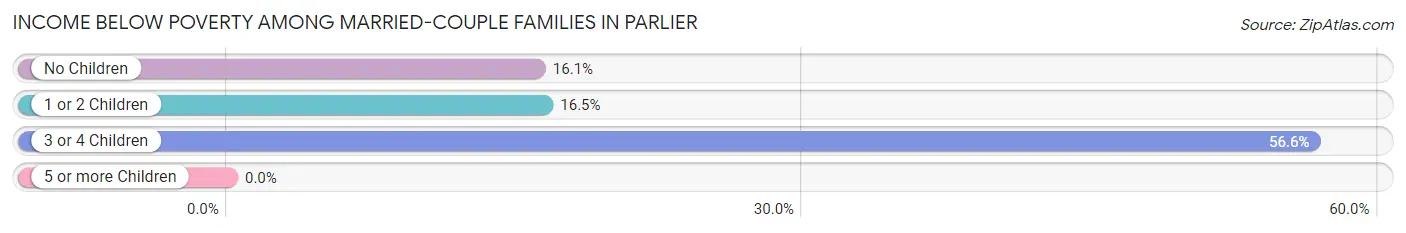
| Children | Above Poverty | Below Poverty |
| No Children | 663 (83.9%) | 127 (16.1%) |
| 1 or 2 Children | 416 (83.5%) | 82 (16.5%) |
| 3 or 4 Children | 215 (43.4%) | 280 (56.6%) |
| 5 or more Children | 0 (0.0%) | 0 (0.0%) |
| Total | 1,294 (72.6%) | 489 (27.4%) |
Income Below Poverty Among Single-Parent Households in Parlier
According to the poverty data in Parlier, 1.7% or 8 single-father households and 31.7% or 333 single-mother households are living below the poverty line. Among single-father households, those with 1 or 2 children have the highest poverty rate, with 8 households (2.9%) experiencing poverty. Likewise, among single-mother households, those with 3 or 4 children have the highest poverty rate, with 133 households (57.8%) falling below the poverty line.
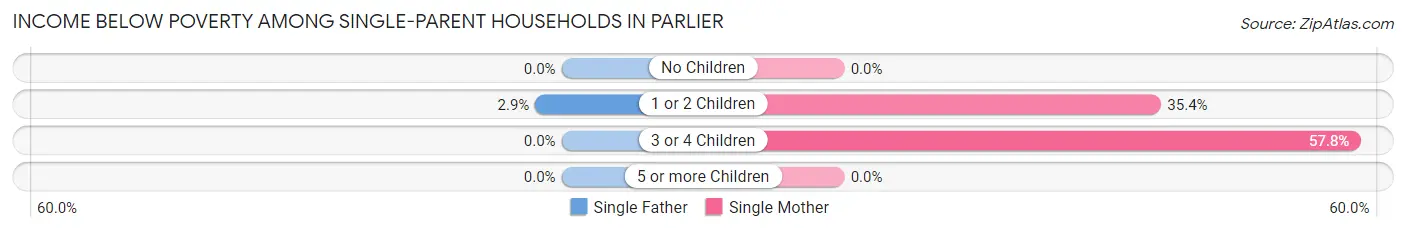
| Children | Single Father | Single Mother |
| No Children | 0 (0.0%) | 0 (0.0%) |
| 1 or 2 Children | 8 (2.9%) | 200 (35.4%) |
| 3 or 4 Children | 0 (0.0%) | 133 (57.8%) |
| 5 or more Children | 0 (0.0%) | 0 (0.0%) |
| Total | 8 (1.7%) | 333 (31.7%) |
Income Below Poverty Among Married-Couple vs Single-Parent Households in Parlier
The poverty data for Parlier shows that 489 of the married-couple family households (27.4%) and 341 of the single-parent households (22.6%) are living below the poverty level. Within the married-couple family households, those with 3 or 4 children have the highest poverty rate, with 280 households (56.6%) falling below the poverty line. Among the single-parent households, those with 3 or 4 children have the highest poverty rate, with 133 household (57.8%) living below poverty.
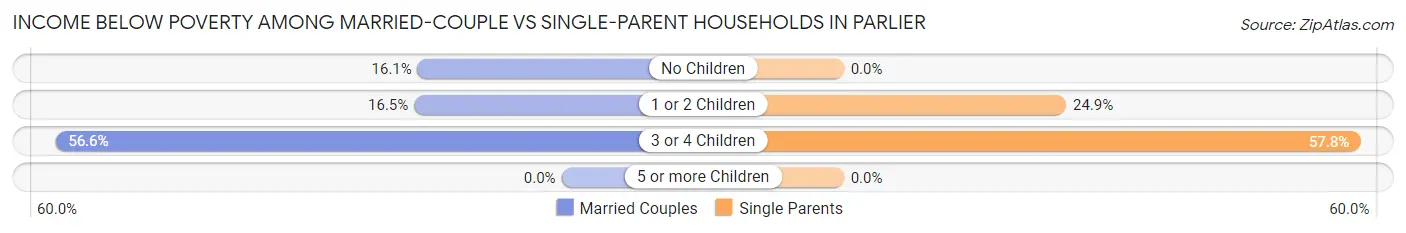
| Children | Married-Couple Families | Single-Parent Households |
| No Children | 127 (16.1%) | 0 (0.0%) |
| 1 or 2 Children | 82 (16.5%) | 208 (24.8%) |
| 3 or 4 Children | 280 (56.6%) | 133 (57.8%) |
| 5 or more Children | 0 (0.0%) | 0 (0.0%) |
| Total | 489 (27.4%) | 341 (22.6%) |
Race in Parlier
The most populous races in Parlier are Hispanic or Latino (14,100 | 96.4%), White / Caucasian (7,251 | 49.6%), and Some other Race (4,926 | 33.7%).
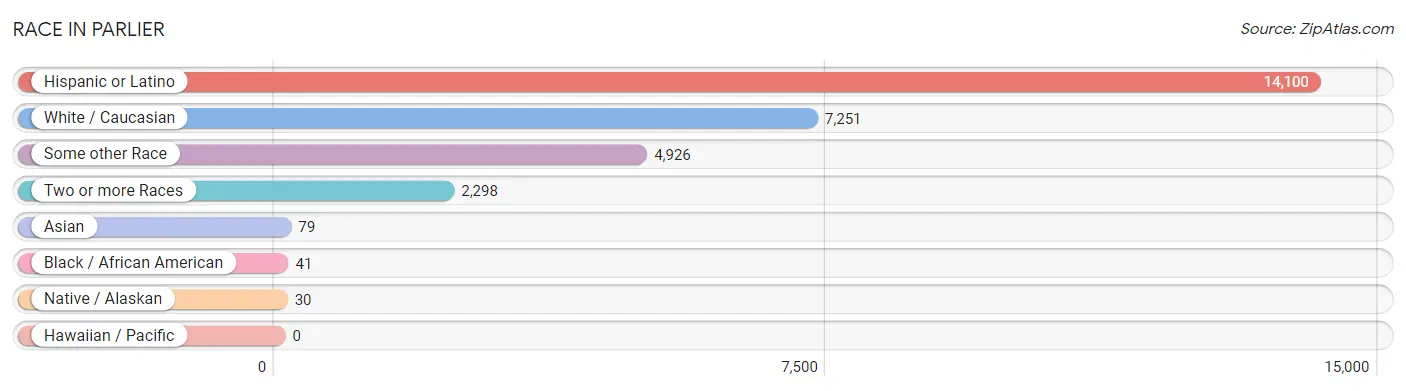
| Race | # Population | % Population |
| Asian | 79 | 0.5% |
| Black / African American | 41 | 0.3% |
| Hawaiian / Pacific | 0 | 0.0% |
| Hispanic or Latino | 14,100 | 96.4% |
| Native / Alaskan | 30 | 0.2% |
| White / Caucasian | 7,251 | 49.6% |
| Two or more Races | 2,298 | 15.7% |
| Some other Race | 4,926 | 33.7% |
| Total | 14,625 | 100.0% |
Ancestry in Parlier
The most populous ancestries reported in Parlier are Mexican (13,400 | 91.6%), Central American (239 | 1.6%), Salvadoran (239 | 1.6%), American (148 | 1.0%), and Mexican American Indian (107 | 0.7%), together accounting for 96.6% of all Parlier residents.
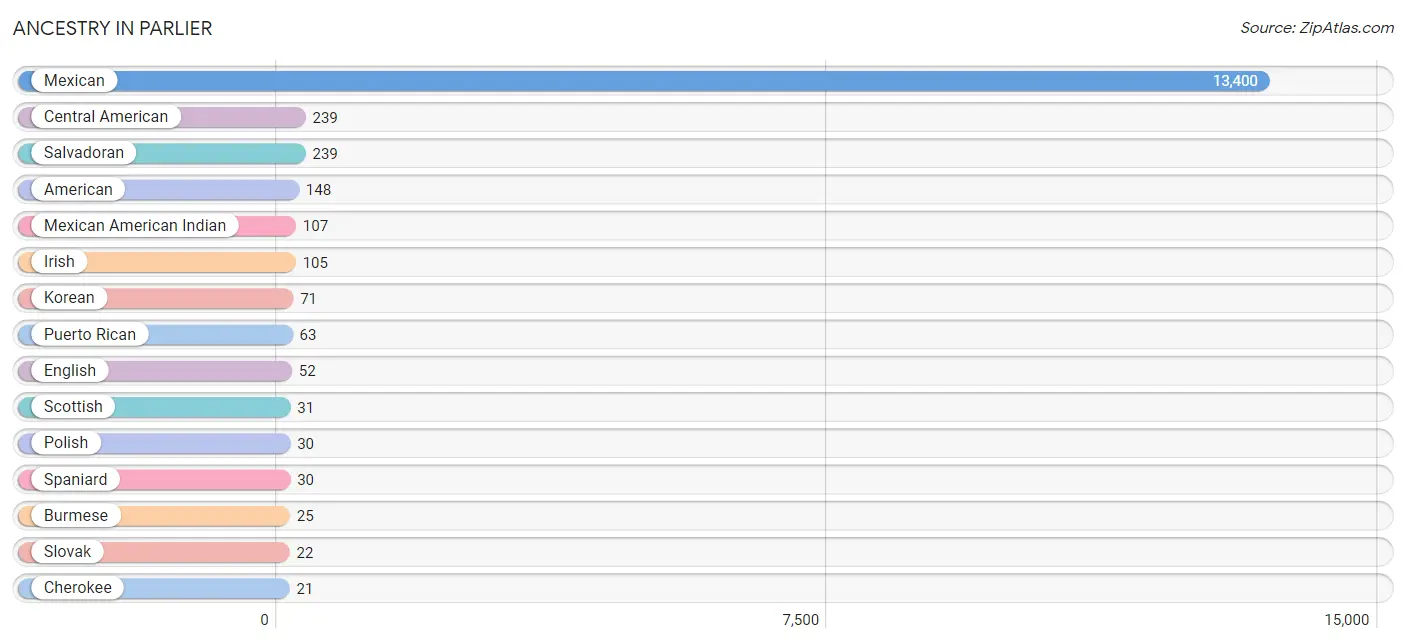
| Ancestry | # Population | % Population |
| American | 148 | 1.0% |
| Burmese | 25 | 0.2% |
| Central American | 239 | 1.6% |
| Cherokee | 21 | 0.1% |
| Colombian | 5 | 0.0% |
| English | 52 | 0.4% |
| Guamanian / Chamorro | 10 | 0.1% |
| Irish | 105 | 0.7% |
| Korean | 71 | 0.5% |
| Malaysian | 14 | 0.1% |
| Mexican | 13,400 | 91.6% |
| Mexican American Indian | 107 | 0.7% |
| Polish | 30 | 0.2% |
| Puerto Rican | 63 | 0.4% |
| Salvadoran | 239 | 1.6% |
| Scottish | 31 | 0.2% |
| Slovak | 22 | 0.2% |
| South American | 5 | 0.0% |
| Spaniard | 30 | 0.2% |
| Thai | 11 | 0.1% |
| West Indian | 9 | 0.1% | View All 21 Rows |
Immigrants in Parlier
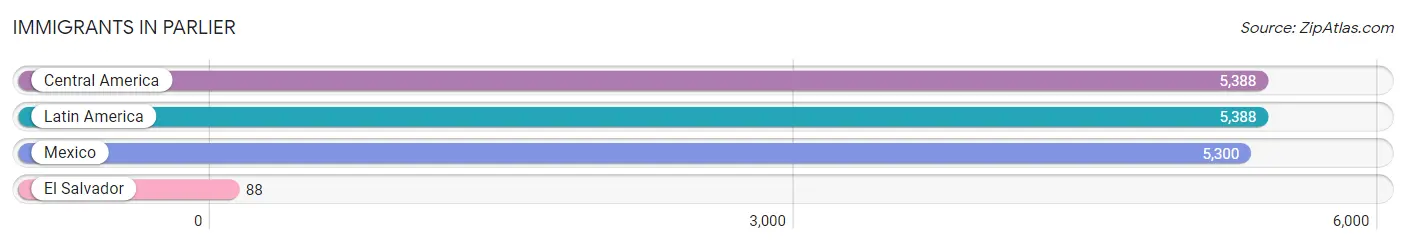
The most numerous immigrant groups reported in Parlier came from Central America (5,388 | 36.8%), Latin America (5,388 | 36.8%), Mexico (5,300 | 36.2%), and El Salvador (88 | 0.6%), together accounting for 110.5% of all Parlier residents.
| Immigration Origin | # Population | % Population |
| Central America | 5,388 | 36.8% |
| El Salvador | 88 | 0.6% |
| Latin America | 5,388 | 36.8% |
| Mexico | 5,300 | 36.2% | View All 4 Rows |
Sex and Age in Parlier
Sex and Age in Parlier
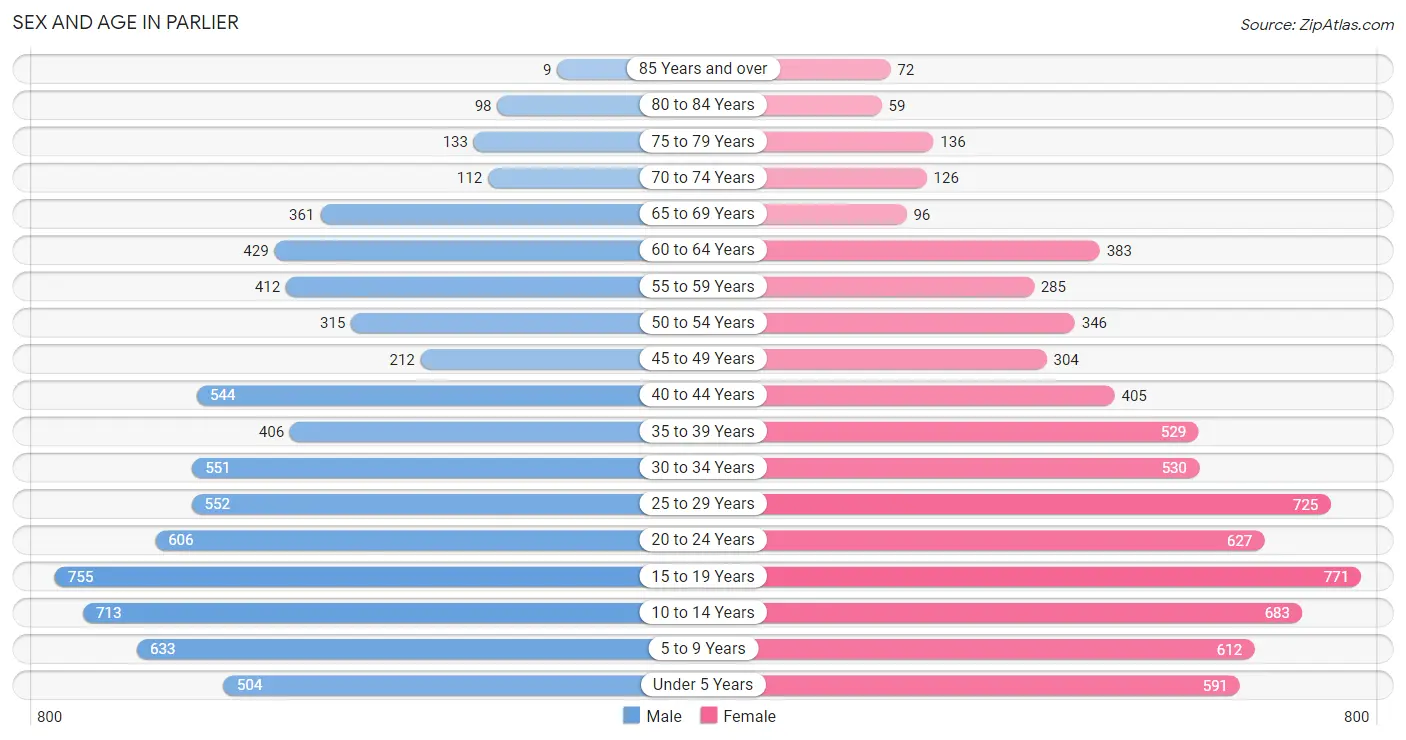
The most populous age groups in Parlier are 15 to 19 Years (755 | 10.3%) for men and 15 to 19 Years (771 | 10.6%) for women.
| Age Bracket | Male | Female |
| Under 5 Years | 504 (6.9%) | 591 (8.1%) |
| 5 to 9 Years | 633 (8.6%) | 612 (8.4%) |
| 10 to 14 Years | 713 (9.7%) | 683 (9.4%) |
| 15 to 19 Years | 755 (10.3%) | 771 (10.6%) |
| 20 to 24 Years | 606 (8.3%) | 627 (8.6%) |
| 25 to 29 Years | 552 (7.5%) | 725 (10.0%) |
| 30 to 34 Years | 551 (7.5%) | 530 (7.3%) |
| 35 to 39 Years | 406 (5.5%) | 529 (7.3%) |
| 40 to 44 Years | 544 (7.4%) | 405 (5.6%) |
| 45 to 49 Years | 212 (2.9%) | 304 (4.2%) |
| 50 to 54 Years | 315 (4.3%) | 346 (4.8%) |
| 55 to 59 Years | 412 (5.6%) | 285 (3.9%) |
| 60 to 64 Years | 429 (5.8%) | 383 (5.3%) |
| 65 to 69 Years | 361 (4.9%) | 96 (1.3%) |
| 70 to 74 Years | 112 (1.5%) | 126 (1.7%) |
| 75 to 79 Years | 133 (1.8%) | 136 (1.9%) |
| 80 to 84 Years | 98 (1.3%) | 59 (0.8%) |
| 85 Years and over | 9 (0.1%) | 72 (1.0%) |
| Total | 7,345 (100.0%) | 7,280 (100.0%) |
Families and Households in Parlier
Median Family Size in Parlier
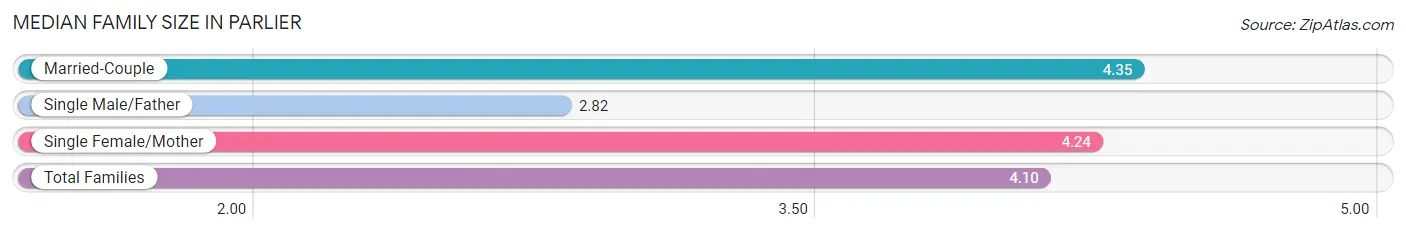
The median family size in Parlier is 4.10 persons per family, with married-couple families (1,783 | 54.1%) accounting for the largest median family size of 4.35 persons per family. On the other hand, single male/father families (461 | 14.0%) represent the smallest median family size with 2.82 persons per family.
| Family Type | # Families | Family Size |
| Married-Couple | 1,783 (54.1%) | 4.35 |
| Single Male/Father | 461 (14.0%) | 2.82 |
| Single Female/Mother | 1,051 (31.9%) | 4.24 |
| Total Families | 3,295 (100.0%) | 4.10 |
Median Household Size in Parlier
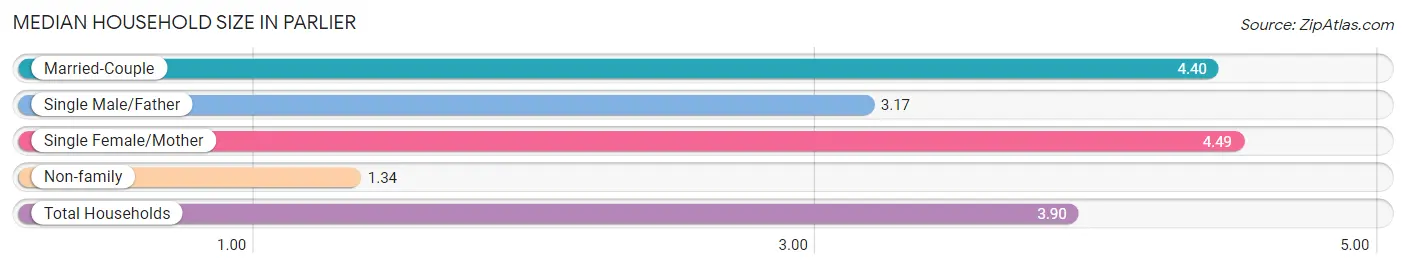
The median household size in Parlier is 3.90 persons per household, with single female/mother households (1,051 | 28.1%) accounting for the largest median household size of 4.49 persons per household. non-family households (451 | 12.0%) represent the smallest median household size with 1.34 persons per household.
| Household Type | # Households | Household Size |
| Married-Couple | 1,783 (47.6%) | 4.40 |
| Single Male/Father | 461 (12.3%) | 3.17 |
| Single Female/Mother | 1,051 (28.1%) | 4.49 |
| Non-family | 451 (12.0%) | 1.34 |
| Total Households | 3,746 (100.0%) | 3.90 |
Household Size by Marriage Status in Parlier
Out of a total of 3,746 households in Parlier, 3,295 (88.0%) are family households, while 451 (12.0%) are nonfamily households. The most numerous type of family households are 2-person households, comprising 778, and the most common type of nonfamily households are 1-person households, comprising 347.
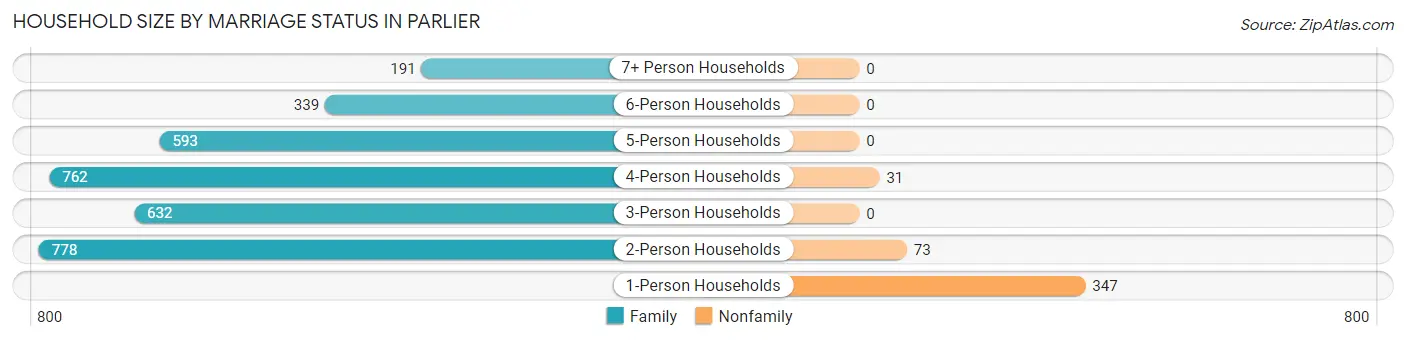
| Household Size | Family Households | Nonfamily Households |
| 1-Person Households | - | 347 (9.3%) |
| 2-Person Households | 778 (20.8%) | 73 (1.9%) |
| 3-Person Households | 632 (16.9%) | 0 (0.0%) |
| 4-Person Households | 762 (20.3%) | 31 (0.8%) |
| 5-Person Households | 593 (15.8%) | 0 (0.0%) |
| 6-Person Households | 339 (9.0%) | 0 (0.0%) |
| 7+ Person Households | 191 (5.1%) | 0 (0.0%) |
| Total | 3,295 (88.0%) | 451 (12.0%) |
Female Fertility in Parlier
Fertility by Age in Parlier
Average fertility rate in Parlier is 43.0 births per 1,000 women. Women in the age bracket of 20 to 34 years have the highest fertility rate with 66.0 births per 1,000 women. Women in the age bracket of 20 to 34 years acount for 73.4% of all women with births.
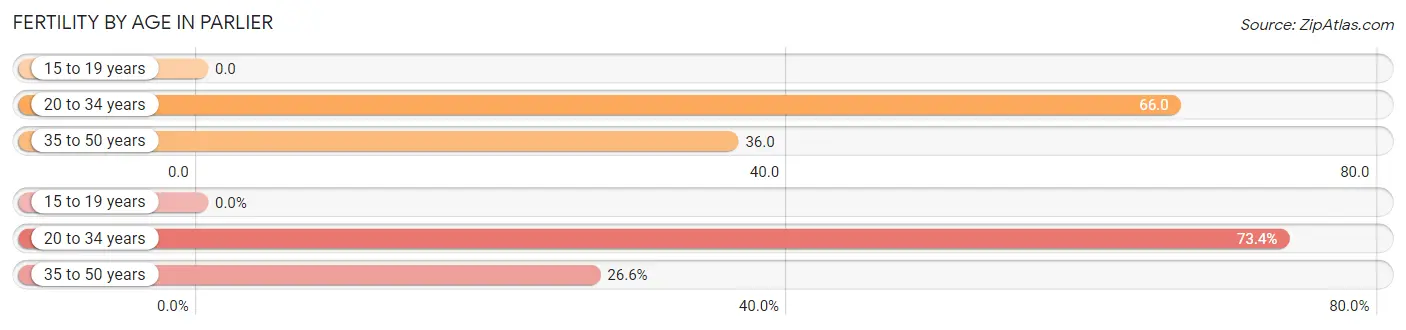
| Age Bracket | Women with Births | Births / 1,000 Women |
| 15 to 19 years | 0 (0.0%) | 0.0 |
| 20 to 34 years | 124 (73.4%) | 66.0 |
| 35 to 50 years | 45 (26.6%) | 36.0 |
| Total | 169 (100.0%) | 43.0 |
Fertility by Age by Marriage Status in Parlier
76.3% of women with births (169) in Parlier are married. The highest percentage of unmarried women with births falls into 20 to 34 years age bracket with 32.3% of them unmarried at the time of birth, while the lowest percentage of unmarried women with births belong to 35 to 50 years age bracket with 0.0% of them unmarried.
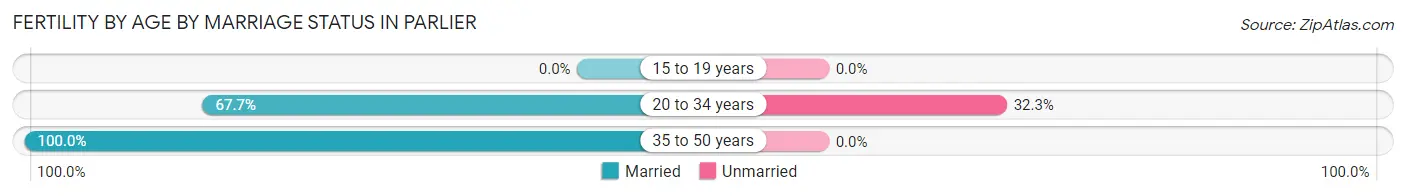
| Age Bracket | Married | Unmarried |
| 15 to 19 years | 0 (0.0%) | 0 (0.0%) |
| 20 to 34 years | 84 (67.7%) | 40 (32.3%) |
| 35 to 50 years | 45 (100.0%) | 0 (0.0%) |
| Total | 129 (76.3%) | 40 (23.7%) |
Fertility by Education in Parlier
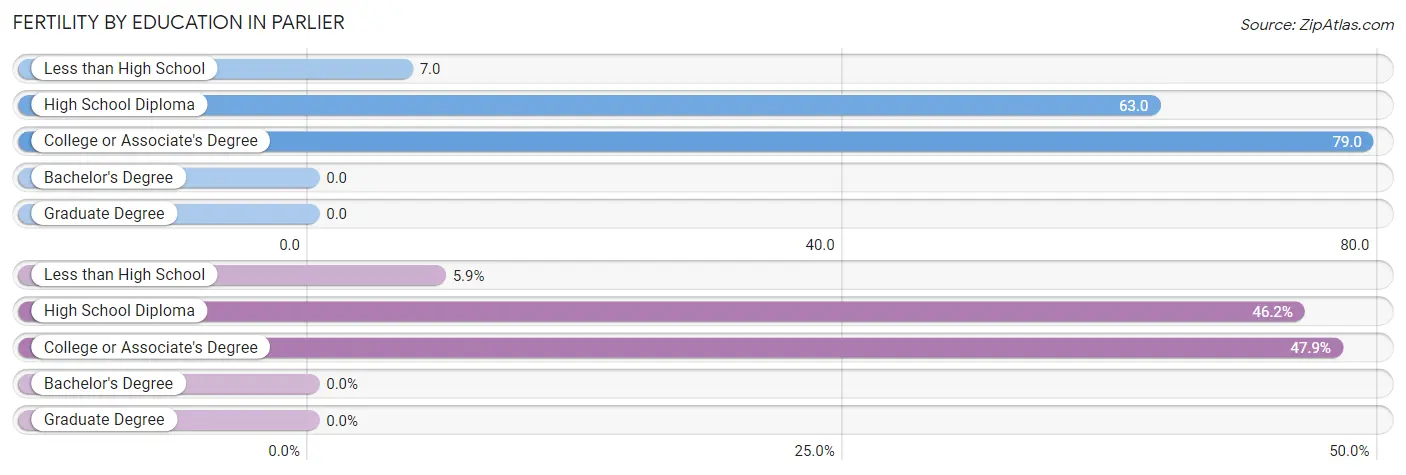
| Educational Attainment | Women with Births | Births / 1,000 Women |
| Less than High School | 10 (5.9%) | 7.0 |
| High School Diploma | 78 (46.2%) | 63.0 |
| College or Associate's Degree | 81 (47.9%) | 79.0 |
| Bachelor's Degree | 0 (0.0%) | 0.0 |
| Graduate Degree | 0 (0.0%) | 0.0 |
| Total | 169 (100.0%) | 43.0 |
Fertility by Education by Marriage Status in Parlier
23.7% of women with births in Parlier are unmarried. Women with the educational attainment of less than high school are most likely to be married with 100.0% of them married at childbirth, while women with the educational attainment of high school diploma are least likely to be married with 51.3% of them unmarried at childbirth.
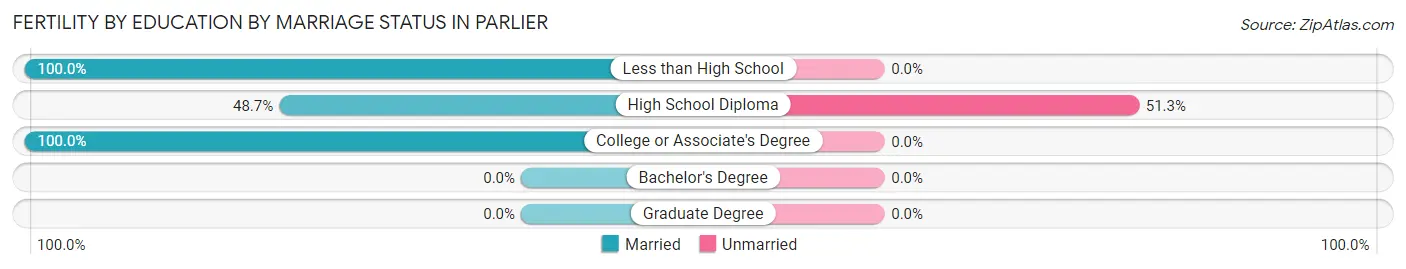
| Educational Attainment | Married | Unmarried |
| Less than High School | 10 (100.0%) | 0 (0.0%) |
| High School Diploma | 38 (48.7%) | 40 (51.3%) |
| College or Associate's Degree | 81 (100.0%) | 0 (0.0%) |
| Bachelor's Degree | 0 (0.0%) | 0 (0.0%) |
| Graduate Degree | 0 (0.0%) | 0 (0.0%) |
| Total | 129 (76.3%) | 40 (23.7%) |
Employment Characteristics in Parlier
Employment by Class of Employer in Parlier
Among the 6,182 employed individuals in Parlier, private company employees (4,978 | 80.5%), not-for-profit organizations (393 | 6.4%), and local government employees (359 | 5.8%) make up the most common classes of employment.
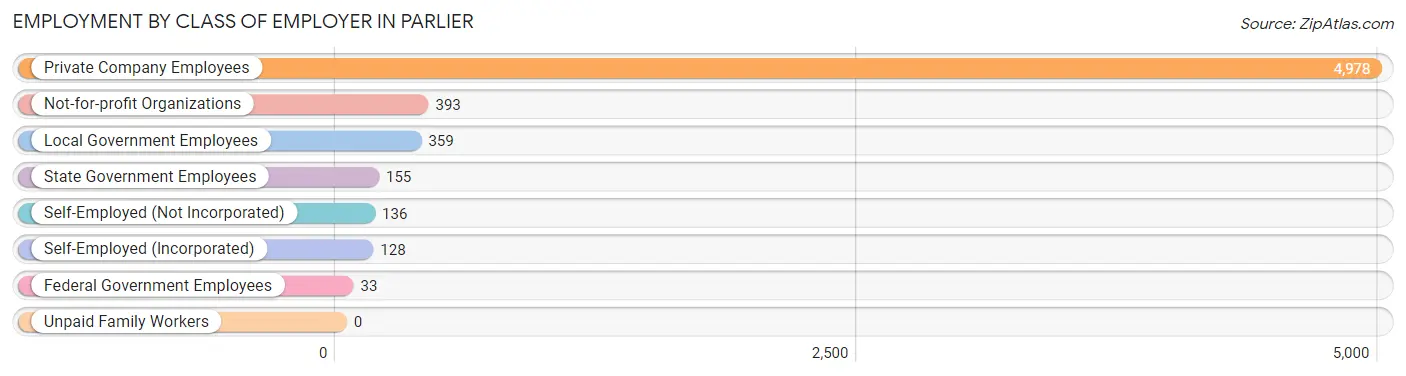
| Employer Class | # Employees | % Employees |
| Private Company Employees | 4,978 | 80.5% |
| Self-Employed (Incorporated) | 128 | 2.1% |
| Self-Employed (Not Incorporated) | 136 | 2.2% |
| Not-for-profit Organizations | 393 | 6.4% |
| Local Government Employees | 359 | 5.8% |
| State Government Employees | 155 | 2.5% |
| Federal Government Employees | 33 | 0.5% |
| Unpaid Family Workers | 0 | 0.0% |
| Total | 6,182 | 100.0% |
Employment Status by Age in Parlier
According to the labor force statistics for Parlier, out of the total population over 16 years of age (10,533), 64.9% or 6,836 individuals are in the labor force, with 6.9% or 472 of them unemployed. The age group with the highest labor force participation rate is 35 to 44 years, with 86.0% or 1,620 individuals in the labor force. Within the labor force, the 75 years and over age range has the highest percentage of unemployed individuals, with 43.2% or 19 of them being unemployed.
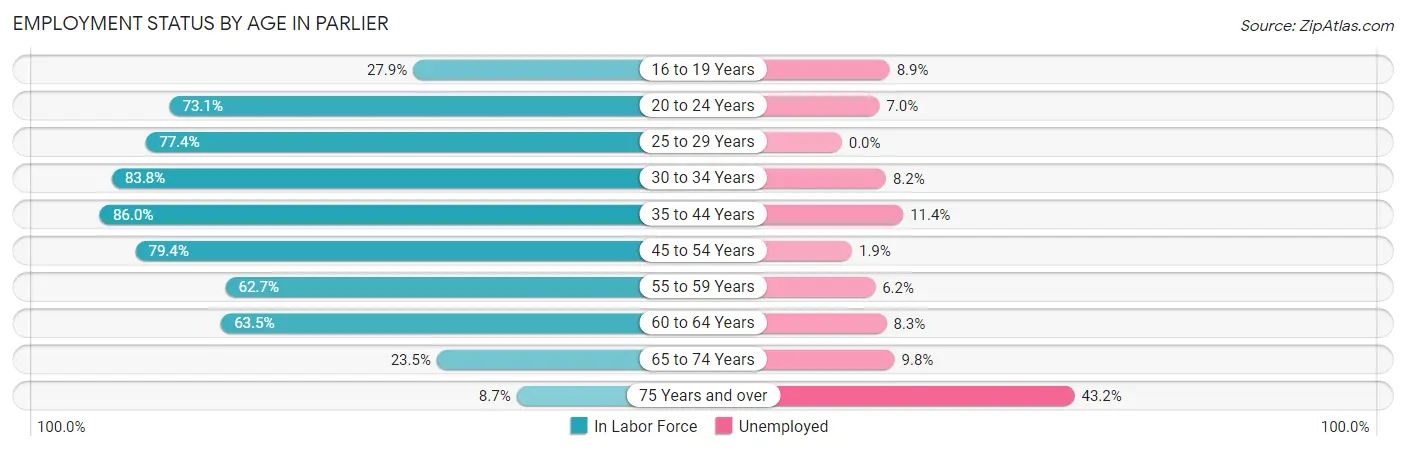
| Age Bracket | In Labor Force | Unemployed |
| 16 to 19 Years | 326 (27.9%) | 29 (8.9%) |
| 20 to 24 Years | 901 (73.1%) | 63 (7.0%) |
| 25 to 29 Years | 988 (77.4%) | 0 (0.0%) |
| 30 to 34 Years | 906 (83.8%) | 74 (8.2%) |
| 35 to 44 Years | 1,620 (86.0%) | 185 (11.4%) |
| 45 to 54 Years | 935 (79.4%) | 18 (1.9%) |
| 55 to 59 Years | 437 (62.7%) | 27 (6.2%) |
| 60 to 64 Years | 516 (63.5%) | 43 (8.3%) |
| 65 to 74 Years | 163 (23.5%) | 16 (9.8%) |
| 75 Years and over | 44 (8.7%) | 19 (43.2%) |
| Total | 6,836 (64.9%) | 472 (6.9%) |
Employment Status by Educational Attainment in Parlier
According to labor force statistics for Parlier, 78.0% of individuals (5,404) out of the total population between 25 and 64 years of age (6,928) are in the labor force, with 6.4% or 346 of them being unemployed. The group with the highest labor force participation rate are those with the educational attainment of bachelor's degree or higher, with 93.8% or 332 individuals in the labor force. Within the labor force, individuals with less than high school education have the highest percentage of unemployment, with 8.5% or 214 of them being unemployed.
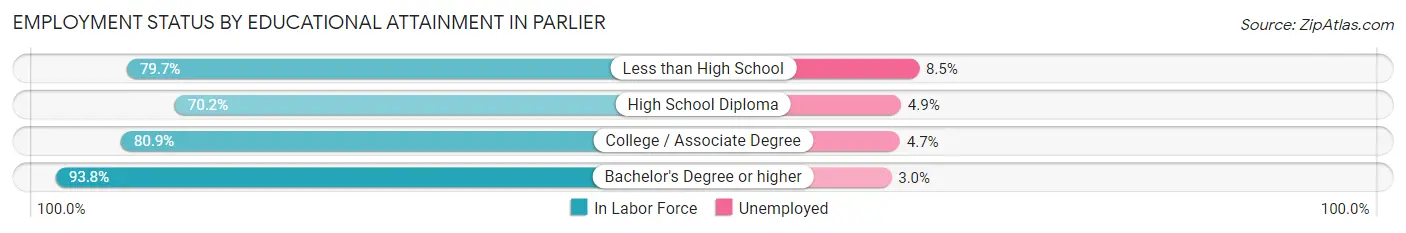
| Educational Attainment | In Labor Force | Unemployed |
| Less than High School | 2,520 (79.7%) | 269 (8.5%) |
| High School Diploma | 1,382 (70.2%) | 96 (4.9%) |
| College / Associate Degree | 1,167 (80.9%) | 68 (4.7%) |
| Bachelor's Degree or higher | 332 (93.8%) | 11 (3.0%) |
| Total | 5,404 (78.0%) | 443 (6.4%) |
Employment Occupations by Sex in Parlier
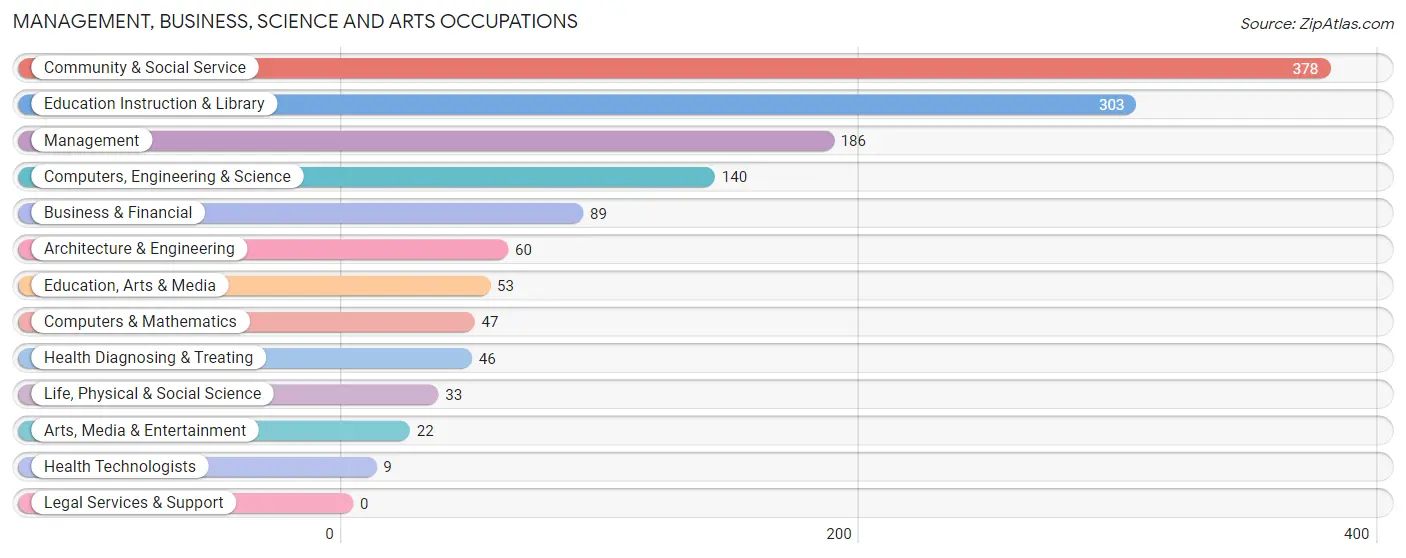
Management, Business, Science and Arts Occupations
The most common Management, Business, Science and Arts occupations in Parlier are Community & Social Service (378 | 5.9%), Education Instruction & Library (303 | 4.8%), Management (186 | 2.9%), Computers, Engineering & Science (140 | 2.2%), and Business & Financial (89 | 1.4%).
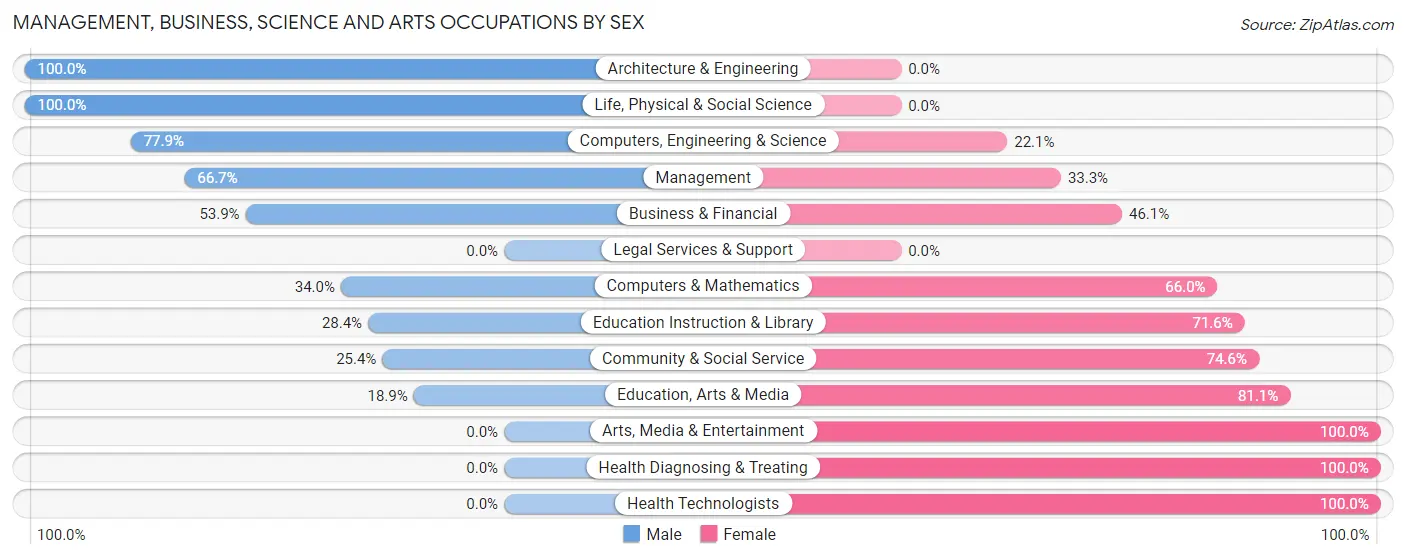
Management, Business, Science and Arts Occupations by Sex
Within the Management, Business, Science and Arts occupations in Parlier, the most male-oriented occupations are Architecture & Engineering (100.0%), Life, Physical & Social Science (100.0%), and Computers, Engineering & Science (77.9%), while the most female-oriented occupations are Arts, Media & Entertainment (100.0%), Health Diagnosing & Treating (100.0%), and Health Technologists (100.0%).
| Occupation | Male | Female |
| Management | 124 (66.7%) | 62 (33.3%) |
| Business & Financial | 48 (53.9%) | 41 (46.1%) |
| Computers, Engineering & Science | 109 (77.9%) | 31 (22.1%) |
| Computers & Mathematics | 16 (34.0%) | 31 (66.0%) |
| Architecture & Engineering | 60 (100.0%) | 0 (0.0%) |
| Life, Physical & Social Science | 33 (100.0%) | 0 (0.0%) |
| Community & Social Service | 96 (25.4%) | 282 (74.6%) |
| Education, Arts & Media | 10 (18.9%) | 43 (81.1%) |
| Legal Services & Support | 0 (0.0%) | 0 (0.0%) |
| Education Instruction & Library | 86 (28.4%) | 217 (71.6%) |
| Arts, Media & Entertainment | 0 (0.0%) | 22 (100.0%) |
| Health Diagnosing & Treating | 0 (0.0%) | 46 (100.0%) |
| Health Technologists | 0 (0.0%) | 9 (100.0%) |
| Total (Category) | 377 (44.9%) | 462 (55.1%) |
| Total (Overall) | 3,425 (53.9%) | 2,929 (46.1%) |
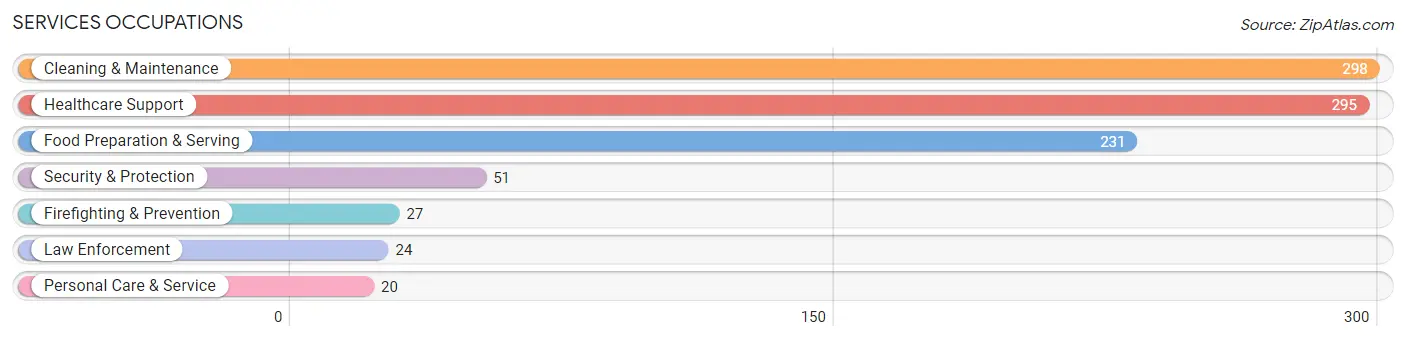
Services Occupations
The most common Services occupations in Parlier are Cleaning & Maintenance (298 | 4.7%), Healthcare Support (295 | 4.6%), Food Preparation & Serving (231 | 3.6%), Security & Protection (51 | 0.8%), and Firefighting & Prevention (27 | 0.4%).
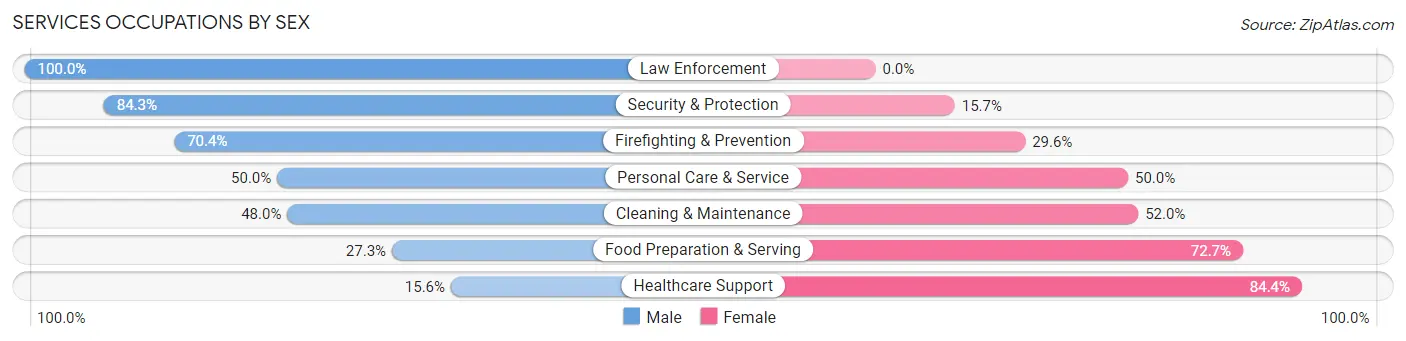
Services Occupations by Sex
Within the Services occupations in Parlier, the most male-oriented occupations are Law Enforcement (100.0%), Security & Protection (84.3%), and Firefighting & Prevention (70.4%), while the most female-oriented occupations are Healthcare Support (84.4%), Food Preparation & Serving (72.7%), and Cleaning & Maintenance (52.0%).
| Occupation | Male | Female |
| Healthcare Support | 46 (15.6%) | 249 (84.4%) |
| Security & Protection | 43 (84.3%) | 8 (15.7%) |
| Firefighting & Prevention | 19 (70.4%) | 8 (29.6%) |
| Law Enforcement | 24 (100.0%) | 0 (0.0%) |
| Food Preparation & Serving | 63 (27.3%) | 168 (72.7%) |
| Cleaning & Maintenance | 143 (48.0%) | 155 (52.0%) |
| Personal Care & Service | 10 (50.0%) | 10 (50.0%) |
| Total (Category) | 305 (34.1%) | 590 (65.9%) |
| Total (Overall) | 3,425 (53.9%) | 2,929 (46.1%) |
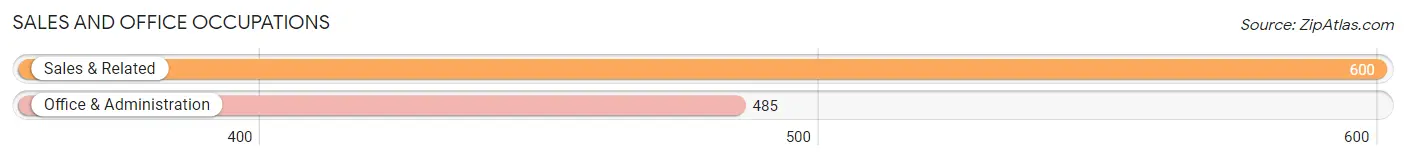
Sales and Office Occupations
The most common Sales and Office occupations in Parlier are Sales & Related (600 | 9.4%), and Office & Administration (485 | 7.6%).
Sales and Office Occupations by Sex
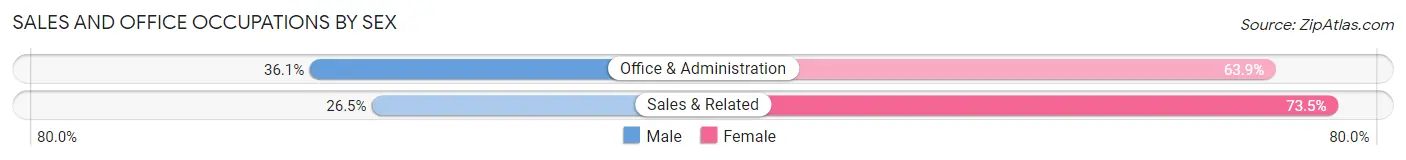
| Occupation | Male | Female |
| Sales & Related | 159 (26.5%) | 441 (73.5%) |
| Office & Administration | 175 (36.1%) | 310 (63.9%) |
| Total (Category) | 334 (30.8%) | 751 (69.2%) |
| Total (Overall) | 3,425 (53.9%) | 2,929 (46.1%) |
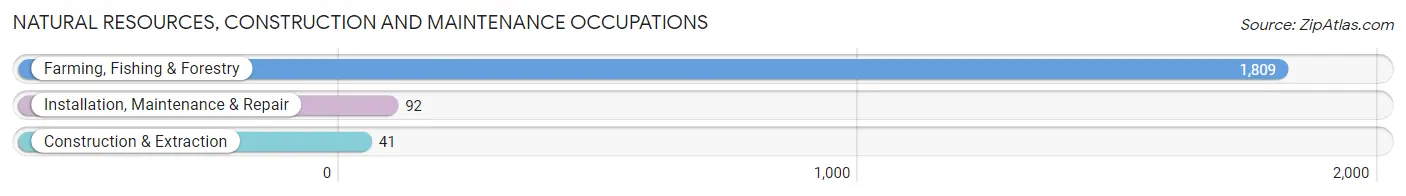
Natural Resources, Construction and Maintenance Occupations
The most common Natural Resources, Construction and Maintenance occupations in Parlier are Farming, Fishing & Forestry (1,809 | 28.5%), Installation, Maintenance & Repair (92 | 1.5%), and Construction & Extraction (41 | 0.6%).
Natural Resources, Construction and Maintenance Occupations by Sex
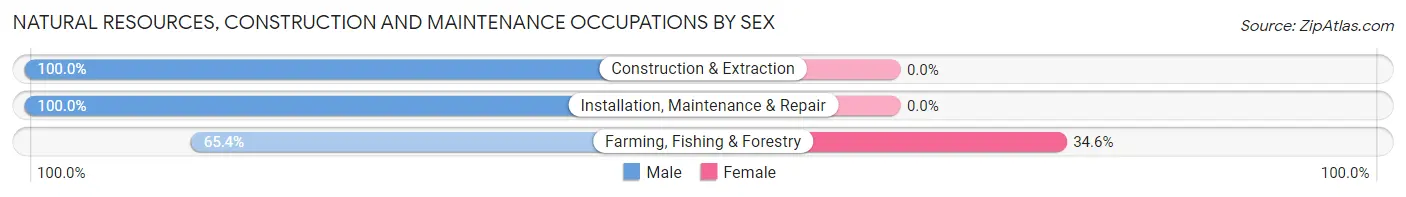
| Occupation | Male | Female |
| Farming, Fishing & Forestry | 1,183 (65.4%) | 626 (34.6%) |
| Construction & Extraction | 41 (100.0%) | 0 (0.0%) |
| Installation, Maintenance & Repair | 92 (100.0%) | 0 (0.0%) |
| Total (Category) | 1,316 (67.8%) | 626 (32.2%) |
| Total (Overall) | 3,425 (53.9%) | 2,929 (46.1%) |
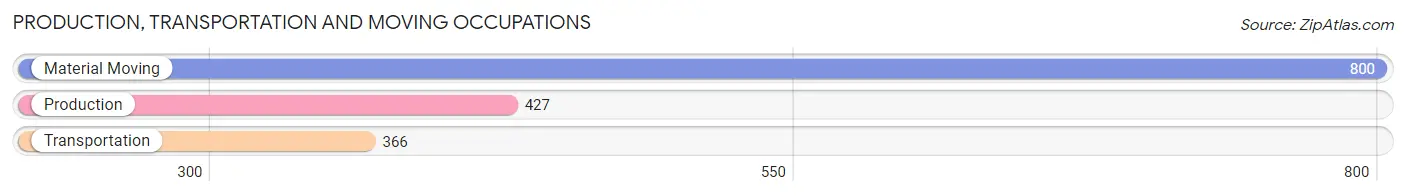
Production, Transportation and Moving Occupations
The most common Production, Transportation and Moving occupations in Parlier are Material Moving (800 | 12.6%), Production (427 | 6.7%), and Transportation (366 | 5.8%).
Production, Transportation and Moving Occupations by Sex
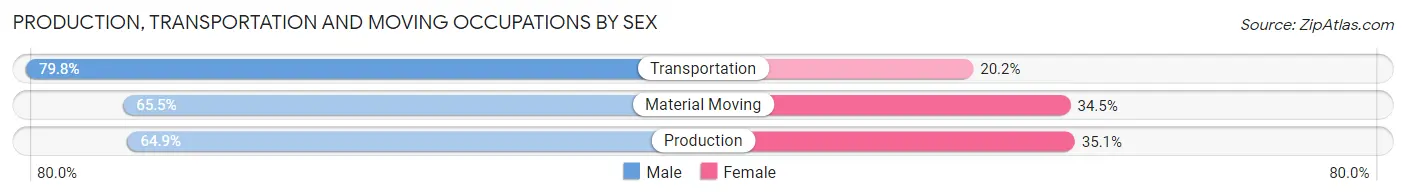
| Occupation | Male | Female |
| Production | 277 (64.9%) | 150 (35.1%) |
| Transportation | 292 (79.8%) | 74 (20.2%) |
| Material Moving | 524 (65.5%) | 276 (34.5%) |
| Total (Category) | 1,093 (68.6%) | 500 (31.4%) |
| Total (Overall) | 3,425 (53.9%) | 2,929 (46.1%) |
Employment Industries by Sex in Parlier
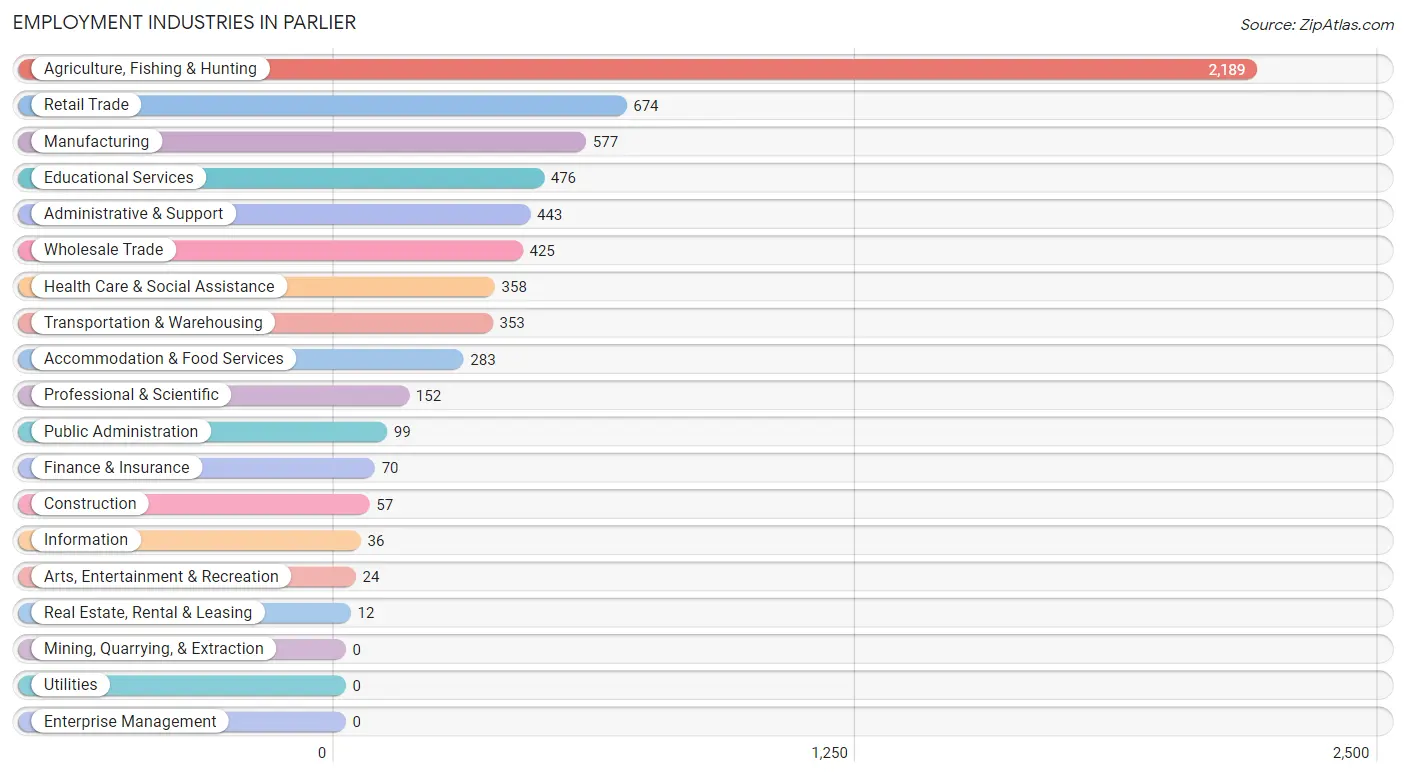
Employment Industries in Parlier
The major employment industries in Parlier include Agriculture, Fishing & Hunting (2,189 | 34.4%), Retail Trade (674 | 10.6%), Manufacturing (577 | 9.1%), Educational Services (476 | 7.5%), and Administrative & Support (443 | 7.0%).
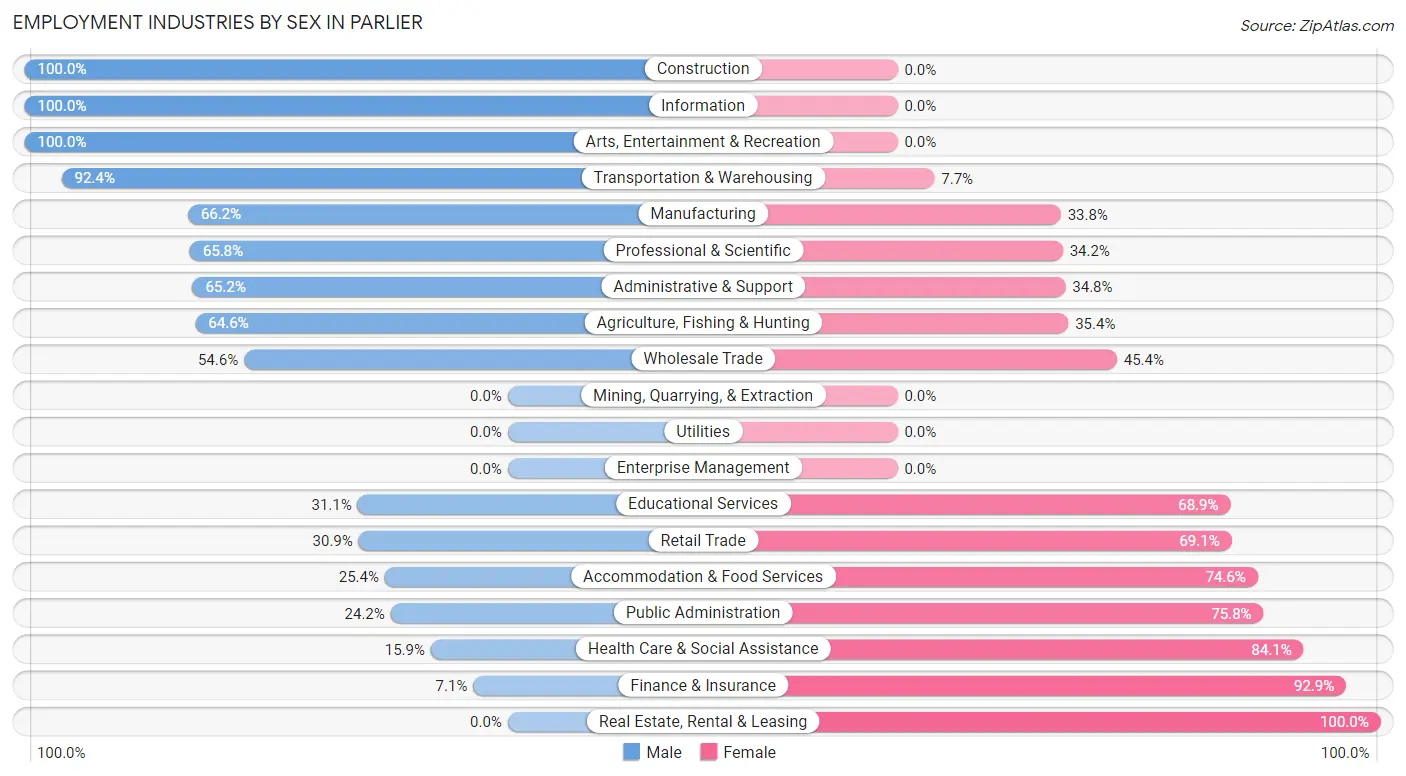
Employment Industries by Sex in Parlier
The Parlier industries that see more men than women are Construction (100.0%), Information (100.0%), and Arts, Entertainment & Recreation (100.0%), whereas the industries that tend to have a higher number of women are Real Estate, Rental & Leasing (100.0%), Finance & Insurance (92.9%), and Health Care & Social Assistance (84.1%).
| Industry | Male | Female |
| Agriculture, Fishing & Hunting | 1,415 (64.6%) | 774 (35.4%) |
| Mining, Quarrying, & Extraction | 0 (0.0%) | 0 (0.0%) |
| Construction | 57 (100.0%) | 0 (0.0%) |
| Manufacturing | 382 (66.2%) | 195 (33.8%) |
| Wholesale Trade | 232 (54.6%) | 193 (45.4%) |
| Retail Trade | 208 (30.9%) | 466 (69.1%) |
| Transportation & Warehousing | 326 (92.3%) | 27 (7.6%) |
| Utilities | 0 (0.0%) | 0 (0.0%) |
| Information | 36 (100.0%) | 0 (0.0%) |
| Finance & Insurance | 5 (7.1%) | 65 (92.9%) |
| Real Estate, Rental & Leasing | 0 (0.0%) | 12 (100.0%) |
| Professional & Scientific | 100 (65.8%) | 52 (34.2%) |
| Enterprise Management | 0 (0.0%) | 0 (0.0%) |
| Administrative & Support | 289 (65.2%) | 154 (34.8%) |
| Educational Services | 148 (31.1%) | 328 (68.9%) |
| Health Care & Social Assistance | 57 (15.9%) | 301 (84.1%) |
| Arts, Entertainment & Recreation | 24 (100.0%) | 0 (0.0%) |
| Accommodation & Food Services | 72 (25.4%) | 211 (74.6%) |
| Public Administration | 24 (24.2%) | 75 (75.8%) |
| Total | 3,425 (53.9%) | 2,929 (46.1%) |
Education in Parlier
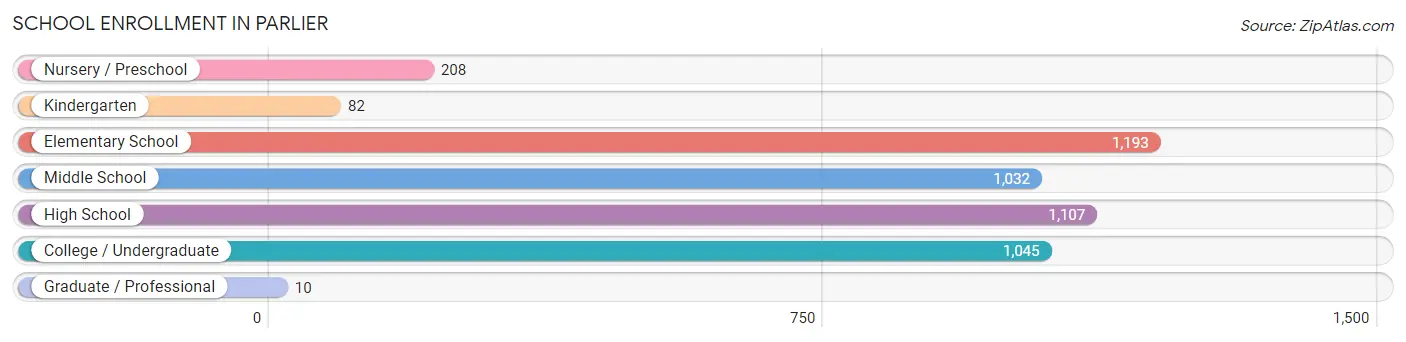
School Enrollment in Parlier
The most common levels of schooling among the 4,677 students in Parlier are elementary school (1,193 | 25.5%), high school (1,107 | 23.7%), and college / undergraduate (1,045 | 22.3%).
| School Level | # Students | % Students |
| Nursery / Preschool | 208 | 4.4% |
| Kindergarten | 82 | 1.8% |
| Elementary School | 1,193 | 25.5% |
| Middle School | 1,032 | 22.1% |
| High School | 1,107 | 23.7% |
| College / Undergraduate | 1,045 | 22.3% |
| Graduate / Professional | 10 | 0.2% |
| Total | 4,677 | 100.0% |
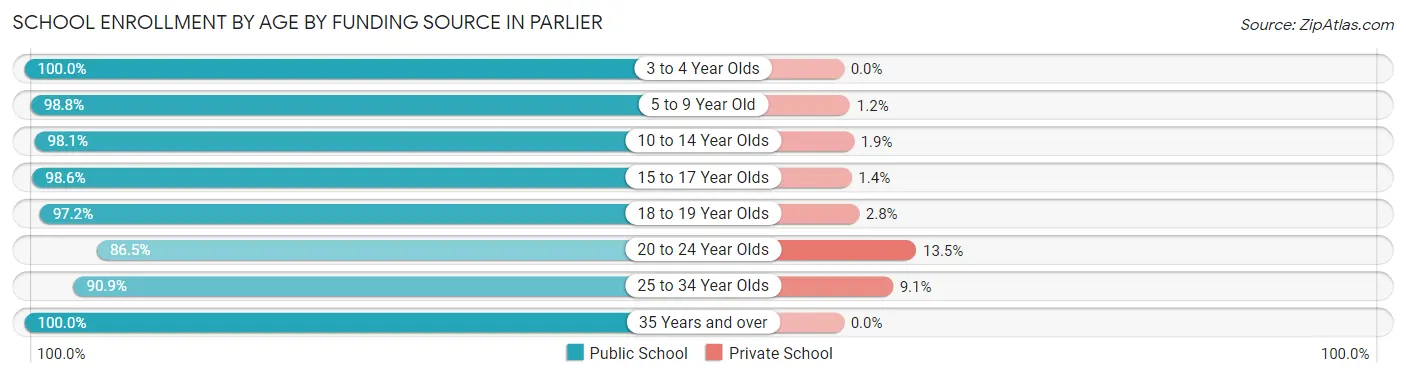
School Enrollment by Age by Funding Source in Parlier
Out of a total of 4,677 students who are enrolled in schools in Parlier, 122 (2.6%) attend a private institution, while the remaining 4,555 (97.4%) are enrolled in public schools. The age group of 20 to 24 year olds has the highest likelihood of being enrolled in private schools, with 39 (13.5% in the age bracket) enrolled. Conversely, the age group of 3 to 4 year olds has the lowest likelihood of being enrolled in a private school, with 208 (100.0% in the age bracket) attending a public institution.
| Age Bracket | Public School | Private School |
| 3 to 4 Year Olds | 208 (100.0%) | 0 (0.0%) |
| 5 to 9 Year Old | 1,106 (98.8%) | 13 (1.2%) |
| 10 to 14 Year Olds | 1,362 (98.1%) | 26 (1.9%) |
| 15 to 17 Year Olds | 960 (98.6%) | 14 (1.4%) |
| 18 to 19 Year Olds | 378 (97.2%) | 11 (2.8%) |
| 20 to 24 Year Olds | 250 (86.5%) | 39 (13.5%) |
| 25 to 34 Year Olds | 199 (90.9%) | 20 (9.1%) |
| 35 Years and over | 91 (100.0%) | 0 (0.0%) |
| Total | 4,555 (97.4%) | 122 (2.6%) |
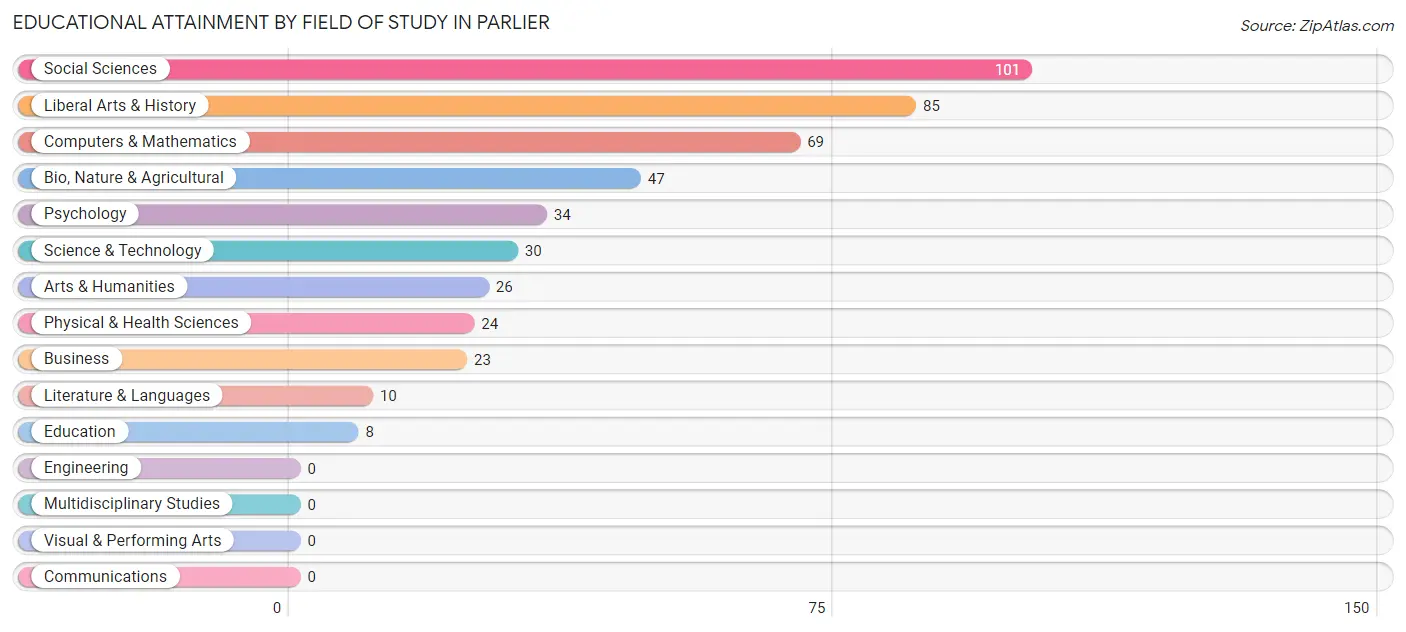
Educational Attainment by Field of Study in Parlier
Social sciences (101 | 22.1%), liberal arts & history (85 | 18.6%), computers & mathematics (69 | 15.1%), bio, nature & agricultural (47 | 10.3%), and psychology (34 | 7.4%) are the most common fields of study among 457 individuals in Parlier who have obtained a bachelor's degree or higher.
| Field of Study | # Graduates | % Graduates |
| Computers & Mathematics | 69 | 15.1% |
| Bio, Nature & Agricultural | 47 | 10.3% |
| Physical & Health Sciences | 24 | 5.2% |
| Psychology | 34 | 7.4% |
| Social Sciences | 101 | 22.1% |
| Engineering | 0 | 0.0% |
| Multidisciplinary Studies | 0 | 0.0% |
| Science & Technology | 30 | 6.6% |
| Business | 23 | 5.0% |
| Education | 8 | 1.8% |
| Literature & Languages | 10 | 2.2% |
| Liberal Arts & History | 85 | 18.6% |
| Visual & Performing Arts | 0 | 0.0% |
| Communications | 0 | 0.0% |
| Arts & Humanities | 26 | 5.7% |
| Total | 457 | 100.0% |
Transportation & Commute in Parlier
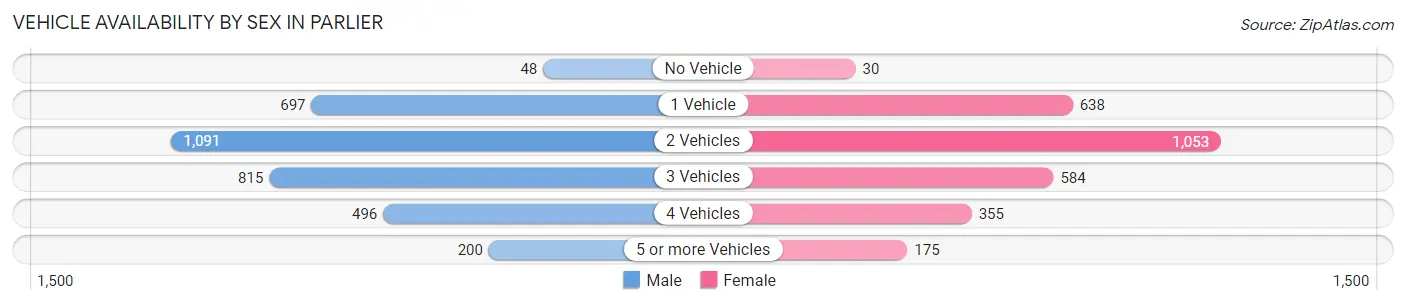
Vehicle Availability by Sex in Parlier
The most prevalent vehicle ownership categories in Parlier are males with 2 vehicles (1,091, accounting for 32.6%) and females with 2 vehicles (1,053, making up 38.5%).
| Vehicles Available | Male | Female |
| No Vehicle | 48 (1.4%) | 30 (1.1%) |
| 1 Vehicle | 697 (20.8%) | 638 (22.5%) |
| 2 Vehicles | 1,091 (32.6%) | 1,053 (37.1%) |
| 3 Vehicles | 815 (24.3%) | 584 (20.6%) |
| 4 Vehicles | 496 (14.8%) | 355 (12.5%) |
| 5 or more Vehicles | 200 (6.0%) | 175 (6.2%) |
| Total | 3,347 (100.0%) | 2,835 (100.0%) |
Commute Time in Parlier
The most frequently occuring commute durations in Parlier are 15 to 19 minutes (1,124 commuters, 18.3%), 20 to 24 minutes (1,096 commuters, 17.9%), and 10 to 14 minutes (1,094 commuters, 17.8%).
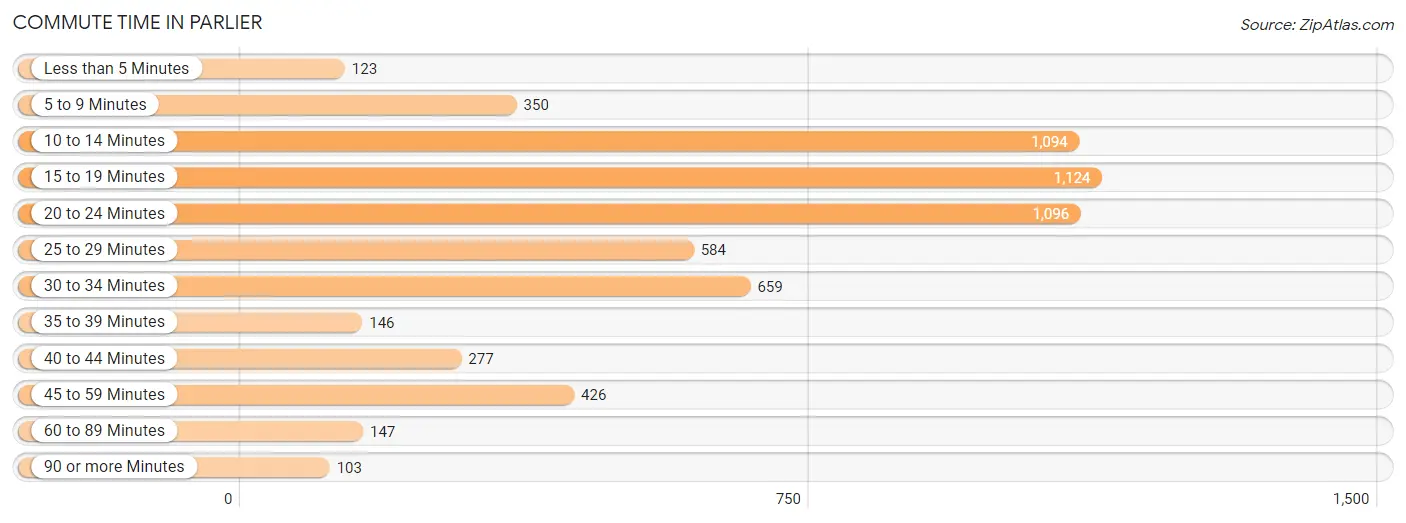
| Commute Time | # Commuters | % Commuters |
| Less than 5 Minutes | 123 | 2.0% |
| 5 to 9 Minutes | 350 | 5.7% |
| 10 to 14 Minutes | 1,094 | 17.8% |
| 15 to 19 Minutes | 1,124 | 18.3% |
| 20 to 24 Minutes | 1,096 | 17.9% |
| 25 to 29 Minutes | 584 | 9.5% |
| 30 to 34 Minutes | 659 | 10.7% |
| 35 to 39 Minutes | 146 | 2.4% |
| 40 to 44 Minutes | 277 | 4.5% |
| 45 to 59 Minutes | 426 | 7.0% |
| 60 to 89 Minutes | 147 | 2.4% |
| 90 or more Minutes | 103 | 1.7% |
Commute Time by Sex in Parlier
The most common commute times in Parlier are 10 to 14 minutes (621 commuters, 18.7%) for males and 15 to 19 minutes (667 commuters, 23.7%) for females.
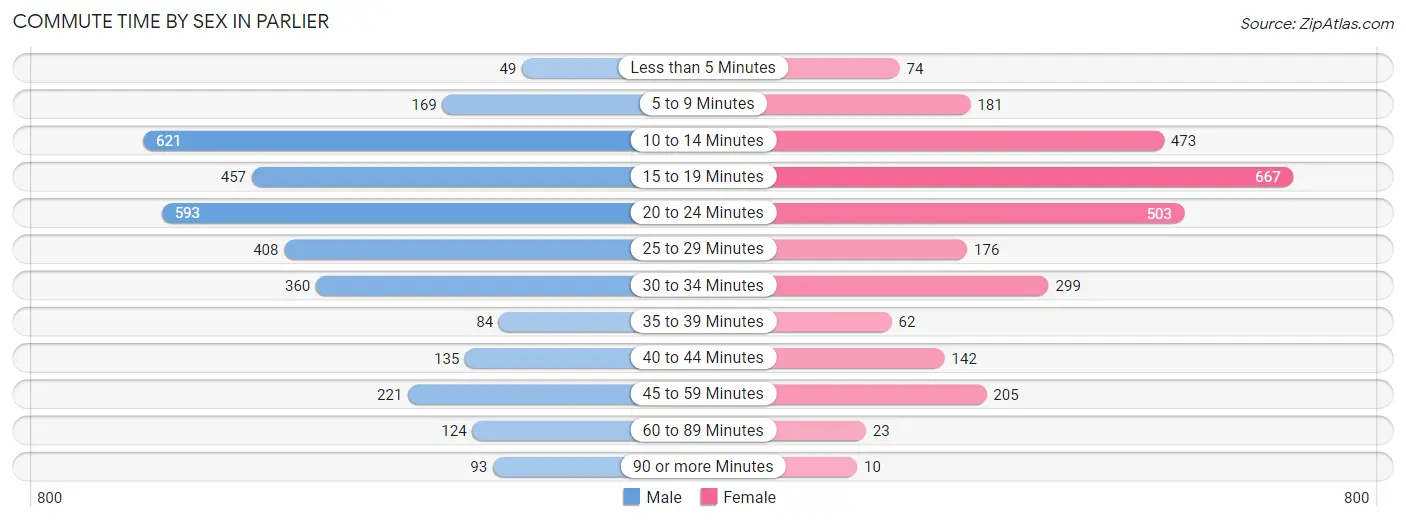
| Commute Time | Male | Female |
| Less than 5 Minutes | 49 (1.5%) | 74 (2.6%) |
| 5 to 9 Minutes | 169 (5.1%) | 181 (6.4%) |
| 10 to 14 Minutes | 621 (18.7%) | 473 (16.8%) |
| 15 to 19 Minutes | 457 (13.8%) | 667 (23.7%) |
| 20 to 24 Minutes | 593 (17.9%) | 503 (17.9%) |
| 25 to 29 Minutes | 408 (12.3%) | 176 (6.2%) |
| 30 to 34 Minutes | 360 (10.9%) | 299 (10.6%) |
| 35 to 39 Minutes | 84 (2.5%) | 62 (2.2%) |
| 40 to 44 Minutes | 135 (4.1%) | 142 (5.0%) |
| 45 to 59 Minutes | 221 (6.7%) | 205 (7.3%) |
| 60 to 89 Minutes | 124 (3.7%) | 23 (0.8%) |
| 90 or more Minutes | 93 (2.8%) | 10 (0.4%) |
Time of Departure to Work by Sex in Parlier
The most frequent times of departure to work in Parlier are 12:00 AM to 4:59 AM (547, 16.5%) for males and 7:00 AM to 7:29 AM (548, 19.5%) for females.
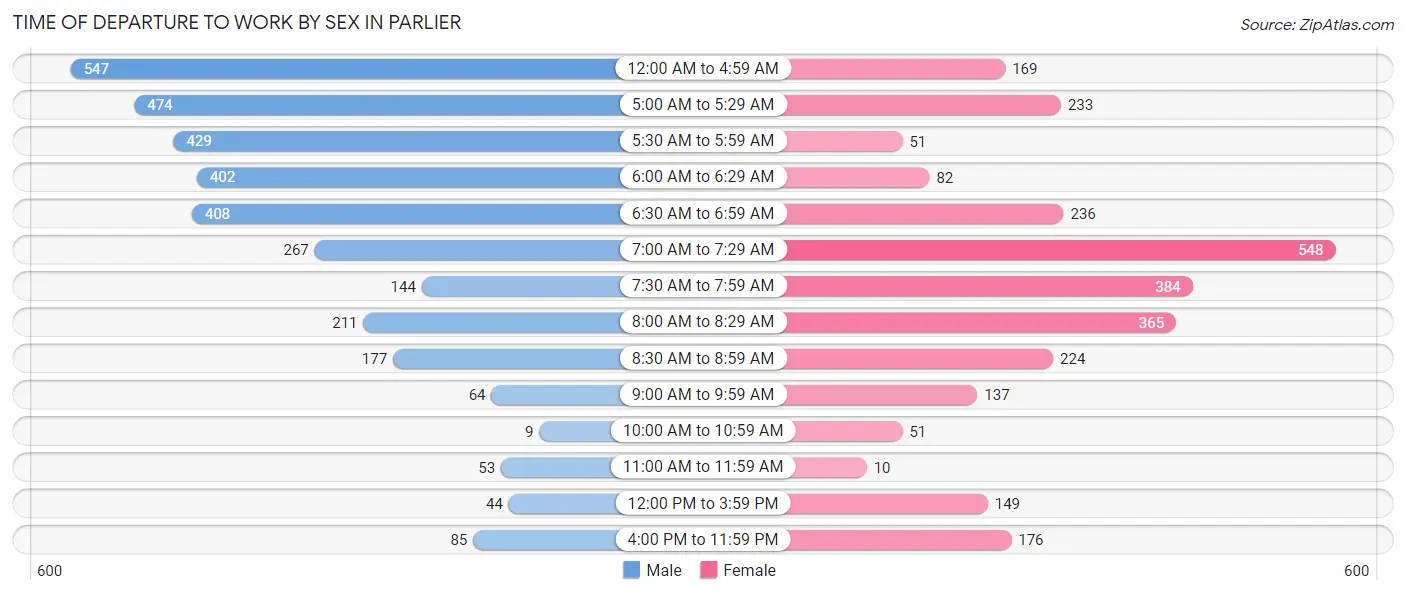
| Time of Departure | Male | Female |
| 12:00 AM to 4:59 AM | 547 (16.5%) | 169 (6.0%) |
| 5:00 AM to 5:29 AM | 474 (14.3%) | 233 (8.3%) |
| 5:30 AM to 5:59 AM | 429 (13.0%) | 51 (1.8%) |
| 6:00 AM to 6:29 AM | 402 (12.1%) | 82 (2.9%) |
| 6:30 AM to 6:59 AM | 408 (12.3%) | 236 (8.4%) |
| 7:00 AM to 7:29 AM | 267 (8.1%) | 548 (19.5%) |
| 7:30 AM to 7:59 AM | 144 (4.3%) | 384 (13.6%) |
| 8:00 AM to 8:29 AM | 211 (6.4%) | 365 (13.0%) |
| 8:30 AM to 8:59 AM | 177 (5.3%) | 224 (8.0%) |
| 9:00 AM to 9:59 AM | 64 (1.9%) | 137 (4.9%) |
| 10:00 AM to 10:59 AM | 9 (0.3%) | 51 (1.8%) |
| 11:00 AM to 11:59 AM | 53 (1.6%) | 10 (0.4%) |
| 12:00 PM to 3:59 PM | 44 (1.3%) | 149 (5.3%) |
| 4:00 PM to 11:59 PM | 85 (2.6%) | 176 (6.2%) |
| Total | 3,314 (100.0%) | 2,815 (100.0%) |
Housing Occupancy in Parlier
Occupancy by Ownership in Parlier
Of the total 3,746 dwellings in Parlier, owner-occupied units account for 1,773 (47.3%), while renter-occupied units make up 1,973 (52.7%).
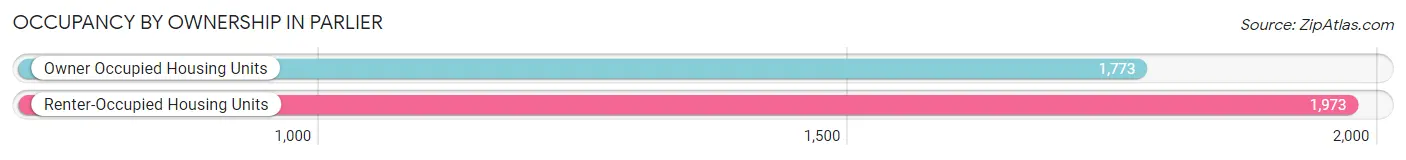
| Occupancy | # Housing Units | % Housing Units |
| Owner Occupied Housing Units | 1,773 | 47.3% |
| Renter-Occupied Housing Units | 1,973 | 52.7% |
| Total Occupied Housing Units | 3,746 | 100.0% |
Occupancy by Household Size in Parlier
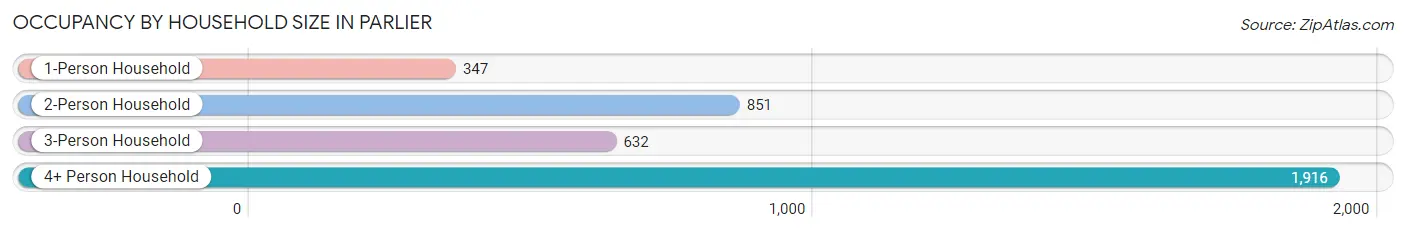
| Household Size | # Housing Units | % Housing Units |
| 1-Person Household | 347 | 9.3% |
| 2-Person Household | 851 | 22.7% |
| 3-Person Household | 632 | 16.9% |
| 4+ Person Household | 1,916 | 51.1% |
| Total Housing Units | 3,746 | 100.0% |
Occupancy by Ownership by Household Size in Parlier
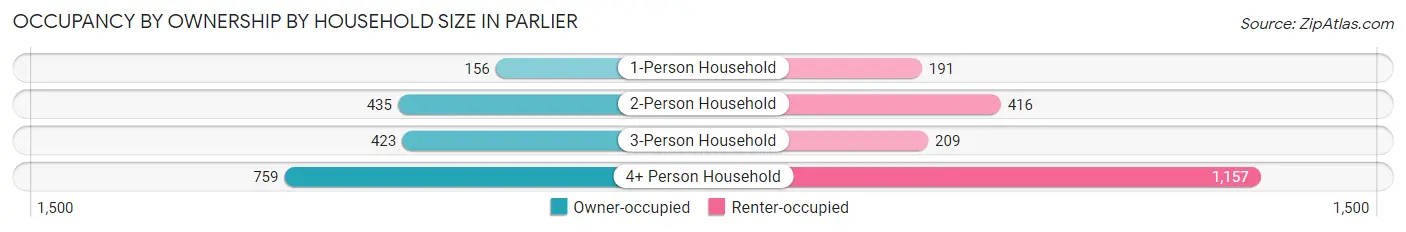
| Household Size | Owner-occupied | Renter-occupied |
| 1-Person Household | 156 (45.0%) | 191 (55.0%) |
| 2-Person Household | 435 (51.1%) | 416 (48.9%) |
| 3-Person Household | 423 (66.9%) | 209 (33.1%) |
| 4+ Person Household | 759 (39.6%) | 1,157 (60.4%) |
| Total Housing Units | 1,773 (47.3%) | 1,973 (52.7%) |
Occupancy by Educational Attainment in Parlier
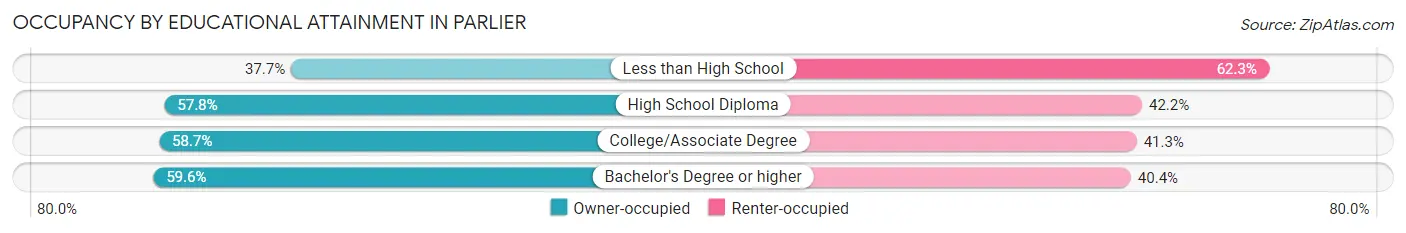
| Household Size | Owner-occupied | Renter-occupied |
| Less than High School | 753 (37.7%) | 1,242 (62.3%) |
| High School Diploma | 569 (57.8%) | 415 (42.2%) |
| College/Associate Degree | 392 (58.7%) | 276 (41.3%) |
| Bachelor's Degree or higher | 59 (59.6%) | 40 (40.4%) |
Occupancy by Age of Householder in Parlier
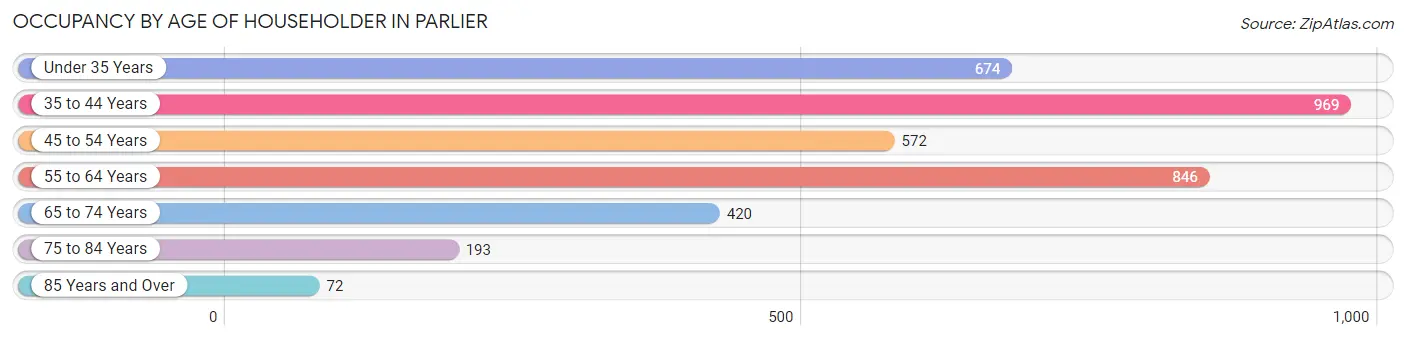
| Age Bracket | # Households | % Households |
| Under 35 Years | 674 | 18.0% |
| 35 to 44 Years | 969 | 25.9% |
| 45 to 54 Years | 572 | 15.3% |
| 55 to 64 Years | 846 | 22.6% |
| 65 to 74 Years | 420 | 11.2% |
| 75 to 84 Years | 193 | 5.1% |
| 85 Years and Over | 72 | 1.9% |
| Total | 3,746 | 100.0% |
Housing Finances in Parlier
Median Income by Occupancy in Parlier
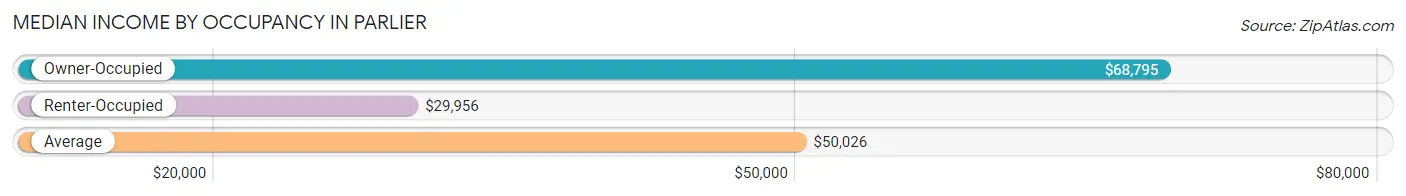
| Occupancy Type | # Households | Median Income |
| Owner-Occupied | 1,773 (47.3%) | $68,795 |
| Renter-Occupied | 1,973 (52.7%) | $29,956 |
| Average | 3,746 (100.0%) | $50,026 |
Occupancy by Householder Income Bracket in Parlier
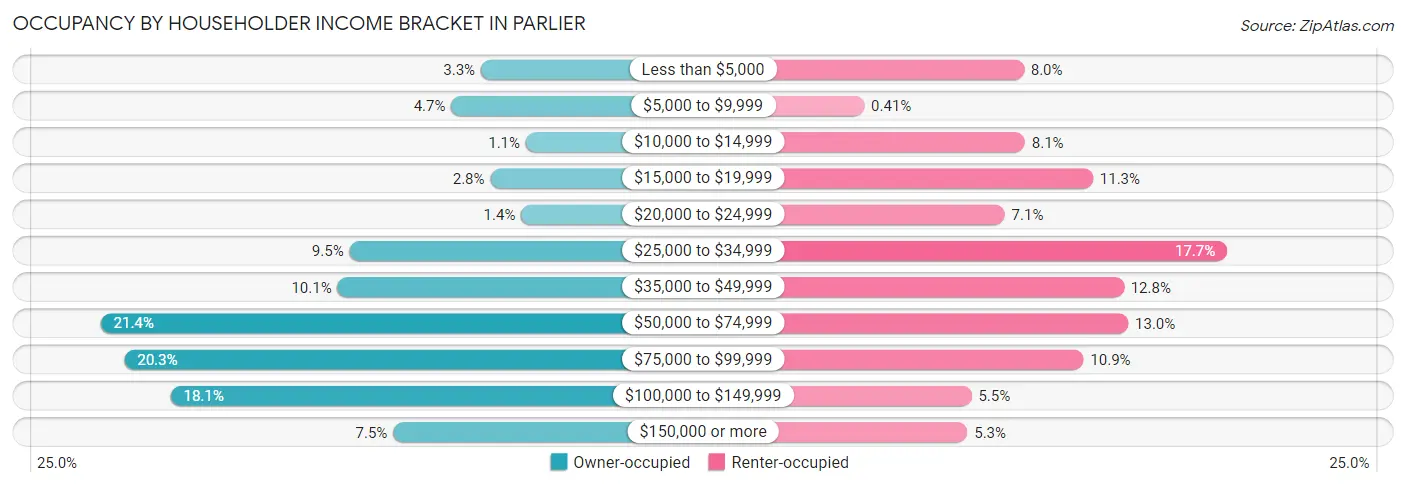
| Income Bracket | Owner-occupied | Renter-occupied |
| Less than $5,000 | 58 (3.3%) | 158 (8.0%) |
| $5,000 to $9,999 | 83 (4.7%) | 8 (0.4%) |
| $10,000 to $14,999 | 20 (1.1%) | 159 (8.1%) |
| $15,000 to $19,999 | 50 (2.8%) | 223 (11.3%) |
| $20,000 to $24,999 | 24 (1.3%) | 140 (7.1%) |
| $25,000 to $34,999 | 169 (9.5%) | 349 (17.7%) |
| $35,000 to $49,999 | 179 (10.1%) | 252 (12.8%) |
| $50,000 to $74,999 | 379 (21.4%) | 256 (13.0%) |
| $75,000 to $99,999 | 359 (20.3%) | 214 (10.8%) |
| $100,000 to $149,999 | 320 (18.0%) | 109 (5.5%) |
| $150,000 or more | 132 (7.4%) | 105 (5.3%) |
| Total | 1,773 (100.0%) | 1,973 (100.0%) |
Monthly Housing Cost Tiers in Parlier
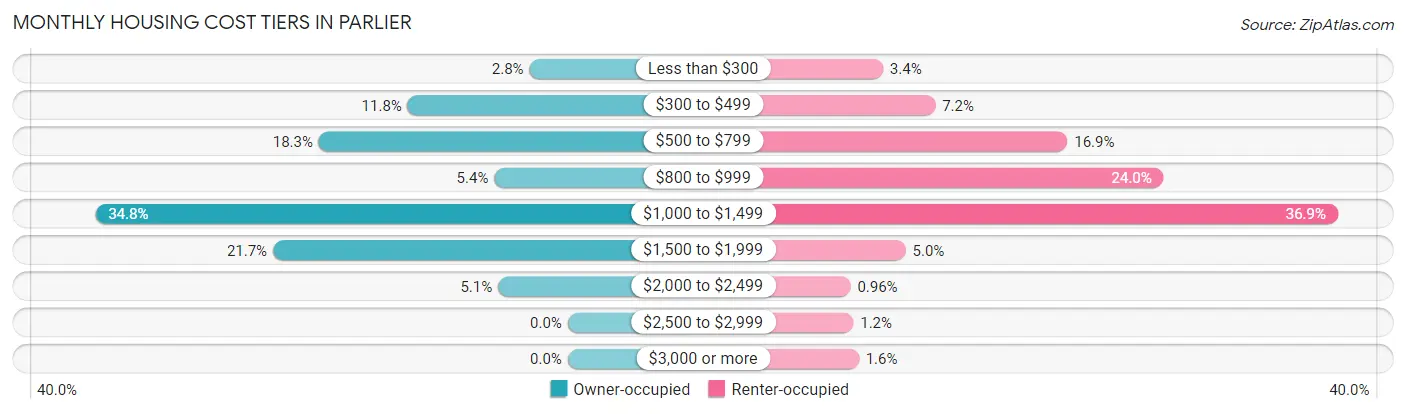
| Monthly Cost | Owner-occupied | Renter-occupied |
| Less than $300 | 50 (2.8%) | 66 (3.4%) |
| $300 to $499 | 209 (11.8%) | 142 (7.2%) |
| $500 to $799 | 325 (18.3%) | 334 (16.9%) |
| $800 to $999 | 96 (5.4%) | 474 (24.0%) |
| $1,000 to $1,499 | 617 (34.8%) | 727 (36.8%) |
| $1,500 to $1,999 | 385 (21.7%) | 99 (5.0%) |
| $2,000 to $2,499 | 91 (5.1%) | 19 (1.0%) |
| $2,500 to $2,999 | 0 (0.0%) | 23 (1.2%) |
| $3,000 or more | 0 (0.0%) | 31 (1.6%) |
| Total | 1,773 (100.0%) | 1,973 (100.0%) |
Physical Housing Characteristics in Parlier
Housing Structures in Parlier
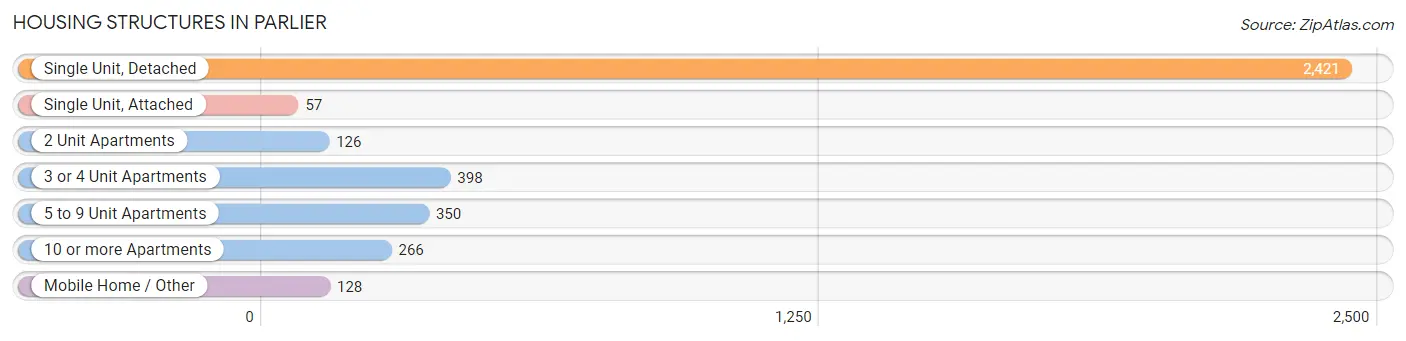
| Structure Type | # Housing Units | % Housing Units |
| Single Unit, Detached | 2,421 | 64.6% |
| Single Unit, Attached | 57 | 1.5% |
| 2 Unit Apartments | 126 | 3.4% |
| 3 or 4 Unit Apartments | 398 | 10.6% |
| 5 to 9 Unit Apartments | 350 | 9.3% |
| 10 or more Apartments | 266 | 7.1% |
| Mobile Home / Other | 128 | 3.4% |
| Total | 3,746 | 100.0% |
Housing Structures by Occupancy in Parlier
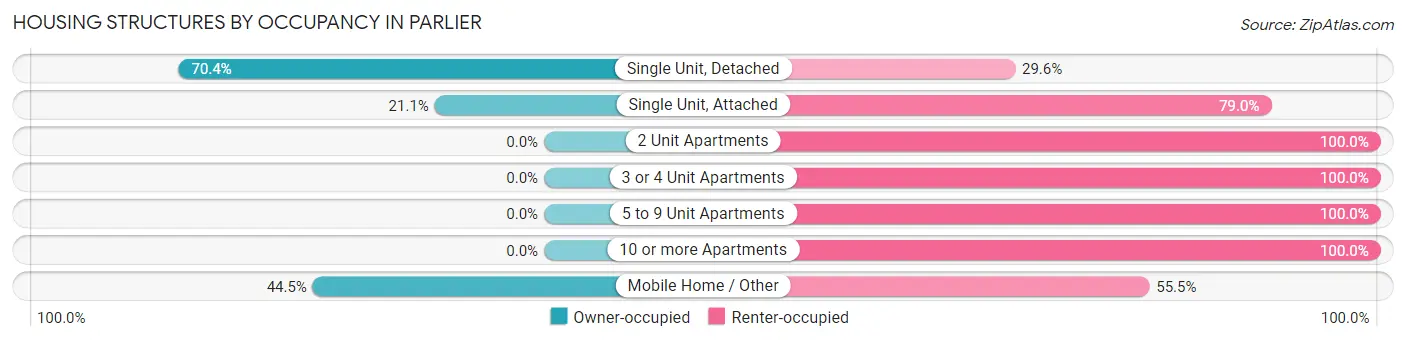
| Structure Type | Owner-occupied | Renter-occupied |
| Single Unit, Detached | 1,704 (70.4%) | 717 (29.6%) |
| Single Unit, Attached | 12 (21.0%) | 45 (78.9%) |
| 2 Unit Apartments | 0 (0.0%) | 126 (100.0%) |
| 3 or 4 Unit Apartments | 0 (0.0%) | 398 (100.0%) |
| 5 to 9 Unit Apartments | 0 (0.0%) | 350 (100.0%) |
| 10 or more Apartments | 0 (0.0%) | 266 (100.0%) |
| Mobile Home / Other | 57 (44.5%) | 71 (55.5%) |
| Total | 1,773 (47.3%) | 1,973 (52.7%) |
Housing Structures by Number of Rooms in Parlier
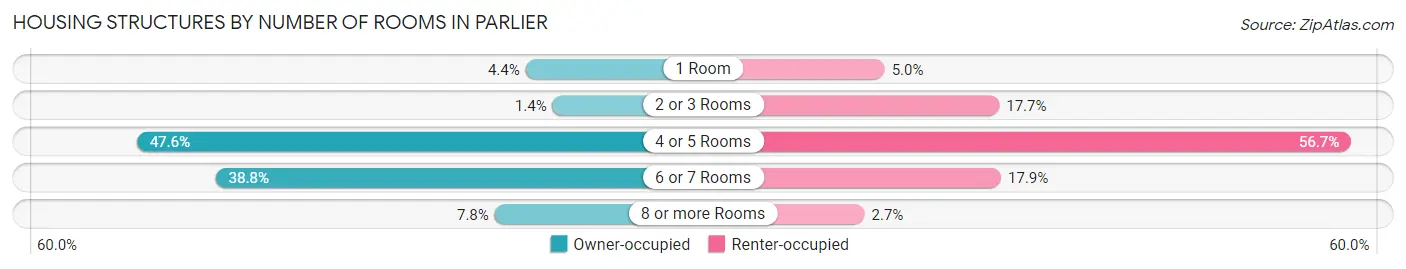
| Number of Rooms | Owner-occupied | Renter-occupied |
| 1 Room | 78 (4.4%) | 98 (5.0%) |
| 2 or 3 Rooms | 25 (1.4%) | 349 (17.7%) |
| 4 or 5 Rooms | 843 (47.5%) | 1,119 (56.7%) |
| 6 or 7 Rooms | 688 (38.8%) | 353 (17.9%) |
| 8 or more Rooms | 139 (7.8%) | 54 (2.7%) |
| Total | 1,773 (100.0%) | 1,973 (100.0%) |
Housing Structure by Heating Type in Parlier
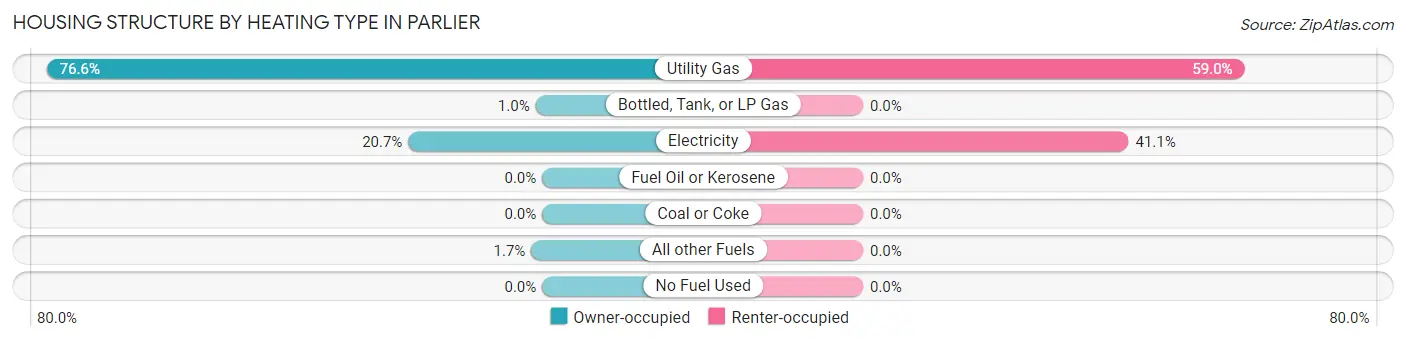
| Heating Type | Owner-occupied | Renter-occupied |
| Utility Gas | 1,358 (76.6%) | 1,163 (59.0%) |
| Bottled, Tank, or LP Gas | 18 (1.0%) | 0 (0.0%) |
| Electricity | 367 (20.7%) | 810 (41.0%) |
| Fuel Oil or Kerosene | 0 (0.0%) | 0 (0.0%) |
| Coal or Coke | 0 (0.0%) | 0 (0.0%) |
| All other Fuels | 30 (1.7%) | 0 (0.0%) |
| No Fuel Used | 0 (0.0%) | 0 (0.0%) |
| Total | 1,773 (100.0%) | 1,973 (100.0%) |
Household Vehicle Usage in Parlier
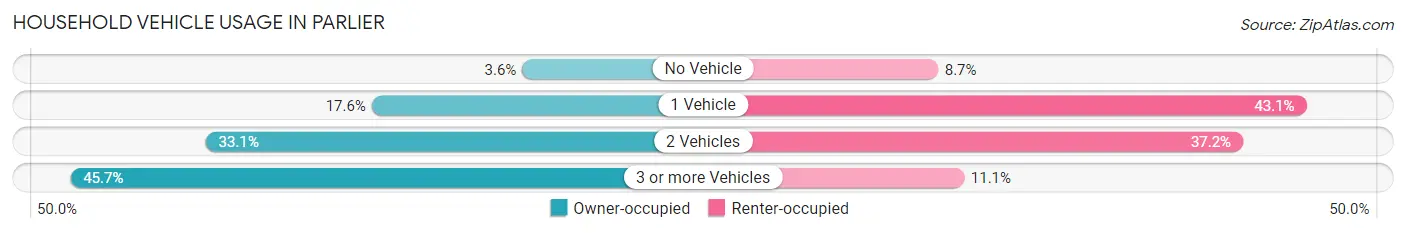
| Vehicles per Household | Owner-occupied | Renter-occupied |
| No Vehicle | 63 (3.5%) | 171 (8.7%) |
| 1 Vehicle | 312 (17.6%) | 850 (43.1%) |
| 2 Vehicles | 587 (33.1%) | 733 (37.1%) |
| 3 or more Vehicles | 811 (45.7%) | 219 (11.1%) |
| Total | 1,773 (100.0%) | 1,973 (100.0%) |
Real Estate & Mortgages in Parlier
Real Estate and Mortgage Overview in Parlier
| Characteristic | Without Mortgage | With Mortgage |
| Housing Units | 461 | 1,312 |
| Median Property Value | $207,700 | $220,000 |
| Median Household Income | $75,525 | $88 |
| Monthly Housing Costs | $466 | $0 |
| Real Estate Taxes | $1,280 | $37 |
Property Value by Mortgage Status in Parlier
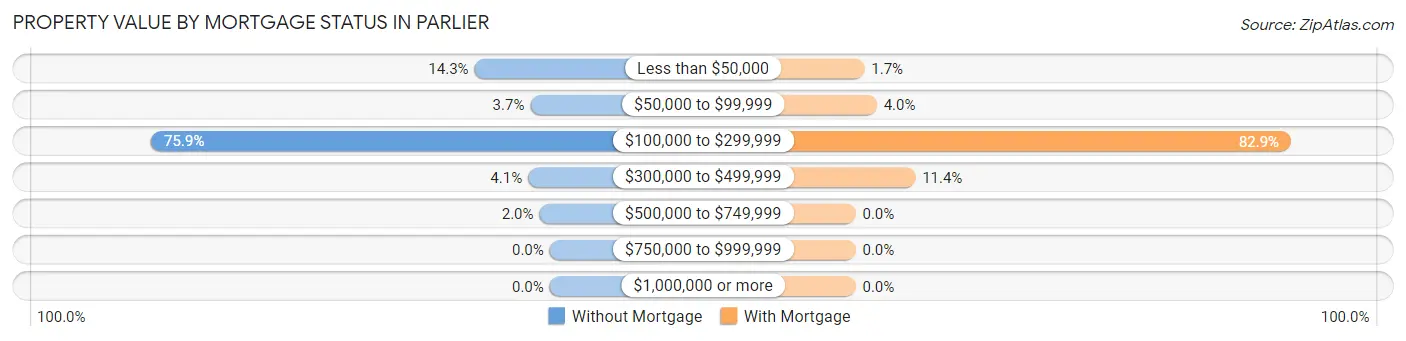
| Property Value | Without Mortgage | With Mortgage |
| Less than $50,000 | 66 (14.3%) | 22 (1.7%) |
| $50,000 to $99,999 | 17 (3.7%) | 53 (4.0%) |
| $100,000 to $299,999 | 350 (75.9%) | 1,088 (82.9%) |
| $300,000 to $499,999 | 19 (4.1%) | 149 (11.4%) |
| $500,000 to $749,999 | 9 (1.9%) | 0 (0.0%) |
| $750,000 to $999,999 | 0 (0.0%) | 0 (0.0%) |
| $1,000,000 or more | 0 (0.0%) | 0 (0.0%) |
| Total | 461 (100.0%) | 1,312 (100.0%) |
Household Income by Mortgage Status in Parlier
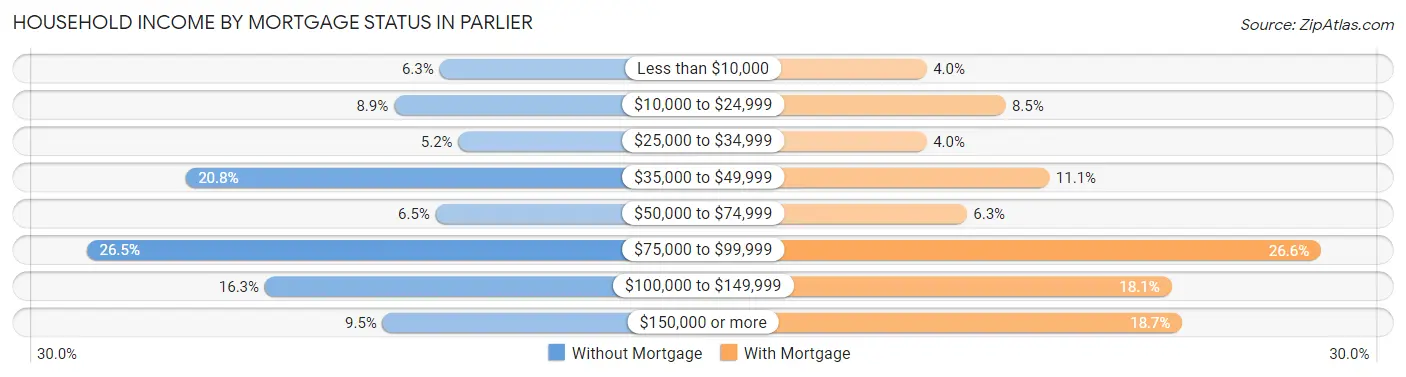
| Household Income | Without Mortgage | With Mortgage |
| Less than $10,000 | 29 (6.3%) | 53 (4.0%) |
| $10,000 to $24,999 | 41 (8.9%) | 112 (8.5%) |
| $25,000 to $34,999 | 24 (5.2%) | 53 (4.0%) |
| $35,000 to $49,999 | 96 (20.8%) | 145 (11.1%) |
| $50,000 to $74,999 | 30 (6.5%) | 83 (6.3%) |
| $75,000 to $99,999 | 122 (26.5%) | 349 (26.6%) |
| $100,000 to $149,999 | 75 (16.3%) | 237 (18.1%) |
| $150,000 or more | 44 (9.5%) | 245 (18.7%) |
| Total | 461 (100.0%) | 1,312 (100.0%) |
Property Value to Household Income Ratio in Parlier
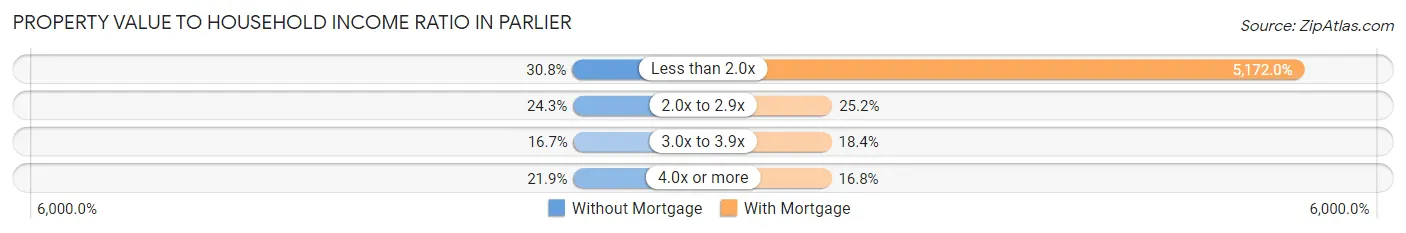
| Value-to-Income Ratio | Without Mortgage | With Mortgage |
| Less than 2.0x | 142 (30.8%) | 67,857 (5,172.0%) |
| 2.0x to 2.9x | 112 (24.3%) | 331 (25.2%) |
| 3.0x to 3.9x | 77 (16.7%) | 241 (18.4%) |
| 4.0x or more | 101 (21.9%) | 220 (16.8%) |
| Total | 461 (100.0%) | 1,312 (100.0%) |
Real Estate Taxes by Mortgage Status in Parlier
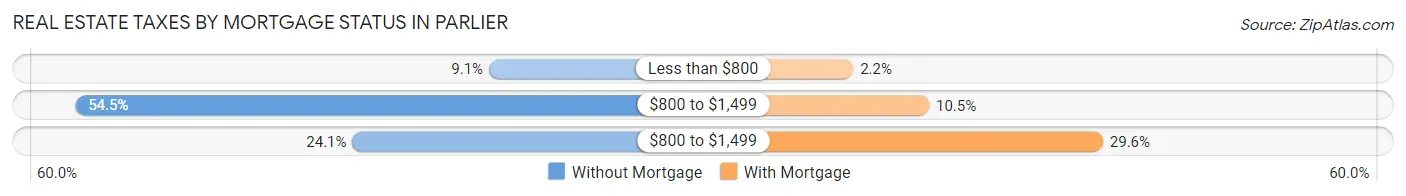
| Property Taxes | Without Mortgage | With Mortgage |
| Less than $800 | 42 (9.1%) | 29 (2.2%) |
| $800 to $1,499 | 251 (54.4%) | 138 (10.5%) |
| $800 to $1,499 | 111 (24.1%) | 388 (29.6%) |
| Total | 461 (100.0%) | 1,312 (100.0%) |
Health & Disability in Parlier
Health Insurance Coverage by Age in Parlier
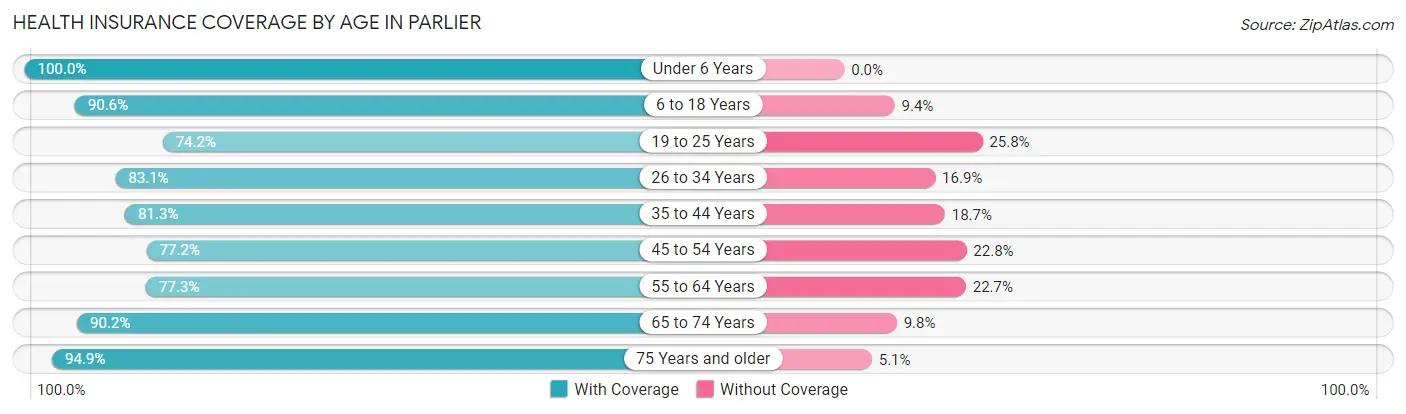
| Age Bracket | With Coverage | Without Coverage |
| Under 6 Years | 1,184 (100.0%) | 0 (0.0%) |
| 6 to 18 Years | 3,525 (90.6%) | 365 (9.4%) |
| 19 to 25 Years | 1,369 (74.2%) | 475 (25.8%) |
| 26 to 34 Years | 1,599 (83.1%) | 326 (16.9%) |
| 35 to 44 Years | 1,531 (81.3%) | 353 (18.7%) |
| 45 to 54 Years | 909 (77.2%) | 268 (22.8%) |
| 55 to 64 Years | 1,167 (77.3%) | 342 (22.7%) |
| 65 to 74 Years | 627 (90.2%) | 68 (9.8%) |
| 75 Years and older | 481 (94.9%) | 26 (5.1%) |
| Total | 12,392 (84.8%) | 2,223 (15.2%) |
Health Insurance Coverage by Citizenship Status in Parlier
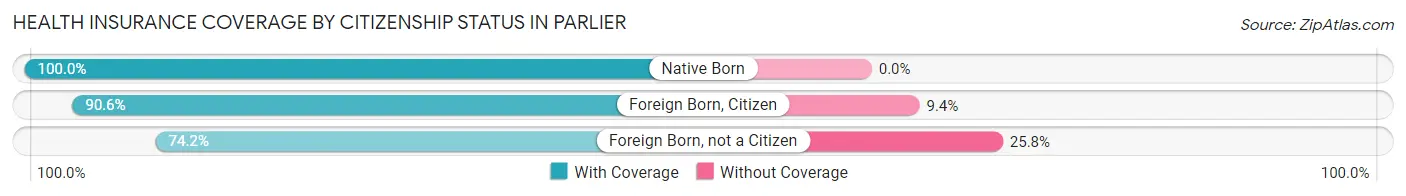
| Citizenship Status | With Coverage | Without Coverage |
| Native Born | 1,184 (100.0%) | 0 (0.0%) |
| Foreign Born, Citizen | 3,525 (90.6%) | 365 (9.4%) |
| Foreign Born, not a Citizen | 1,369 (74.2%) | 475 (25.8%) |
Health Insurance Coverage by Household Income in Parlier
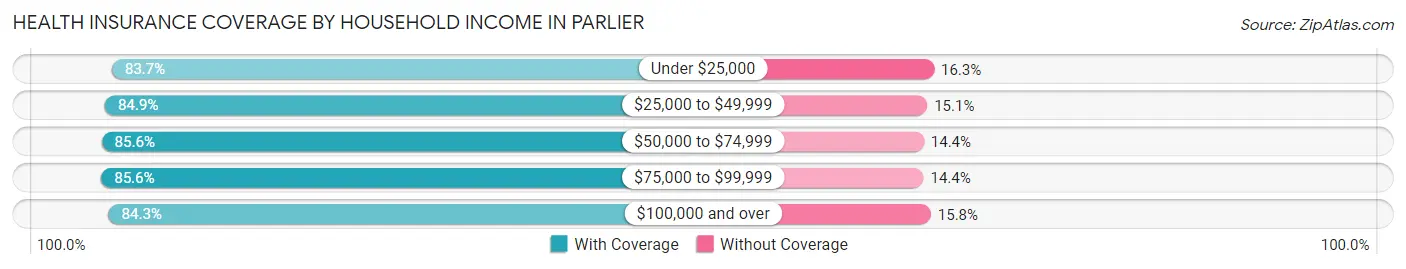
| Household Income | With Coverage | Without Coverage |
| Under $25,000 | 2,242 (83.7%) | 438 (16.3%) |
| $25,000 to $49,999 | 3,061 (84.9%) | 543 (15.1%) |
| $50,000 to $74,999 | 2,027 (85.6%) | 342 (14.4%) |
| $75,000 to $99,999 | 2,424 (85.6%) | 407 (14.4%) |
| $100,000 and over | 2,638 (84.3%) | 493 (15.8%) |
Public vs Private Health Insurance Coverage by Age in Parlier
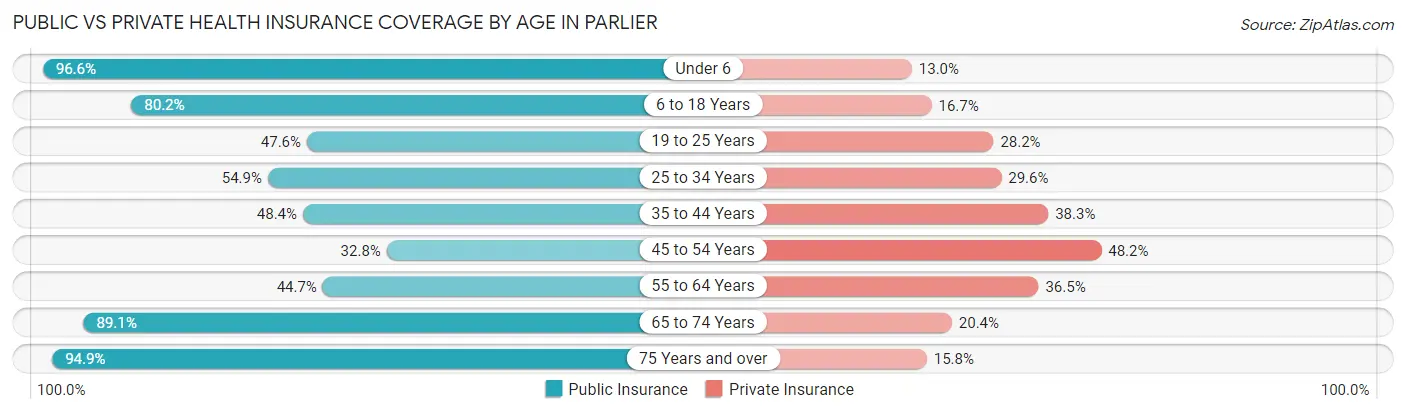
| Age Bracket | Public Insurance | Private Insurance |
| Under 6 | 1,144 (96.6%) | 154 (13.0%) |
| 6 to 18 Years | 3,119 (80.2%) | 648 (16.7%) |
| 19 to 25 Years | 878 (47.6%) | 519 (28.1%) |
| 25 to 34 Years | 1,056 (54.9%) | 570 (29.6%) |
| 35 to 44 Years | 911 (48.3%) | 722 (38.3%) |
| 45 to 54 Years | 386 (32.8%) | 567 (48.2%) |
| 55 to 64 Years | 674 (44.7%) | 551 (36.5%) |
| 65 to 74 Years | 619 (89.1%) | 142 (20.4%) |
| 75 Years and over | 481 (94.9%) | 80 (15.8%) |
| Total | 9,268 (63.4%) | 3,953 (27.1%) |
Disability Status by Sex by Age in Parlier
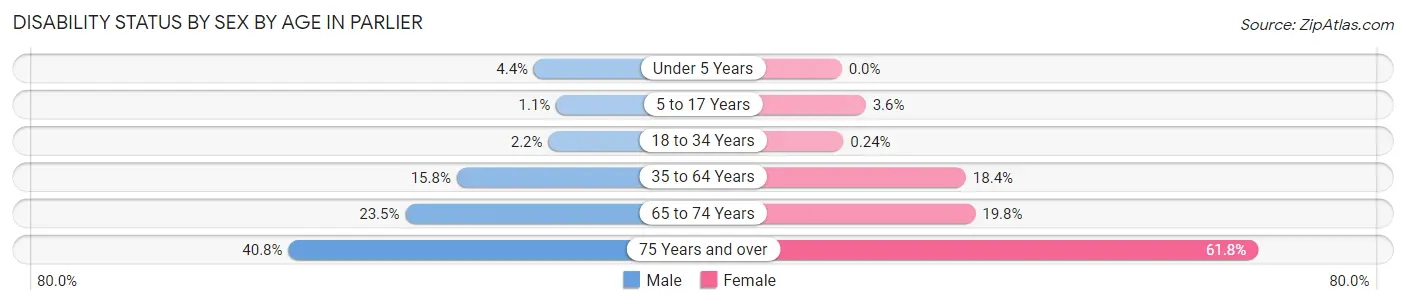
| Age Bracket | Male | Female |
| Under 5 Years | 22 (4.4%) | 0 (0.0%) |
| 5 to 17 Years | 19 (1.1%) | 66 (3.5%) |
| 18 to 34 Years | 45 (2.2%) | 5 (0.2%) |
| 35 to 64 Years | 367 (15.8%) | 415 (18.4%) |
| 65 to 74 Years | 111 (23.5%) | 44 (19.8%) |
| 75 Years and over | 98 (40.8%) | 165 (61.8%) |
Disability Class by Sex by Age in Parlier
Disability Class: Hearing Difficulty
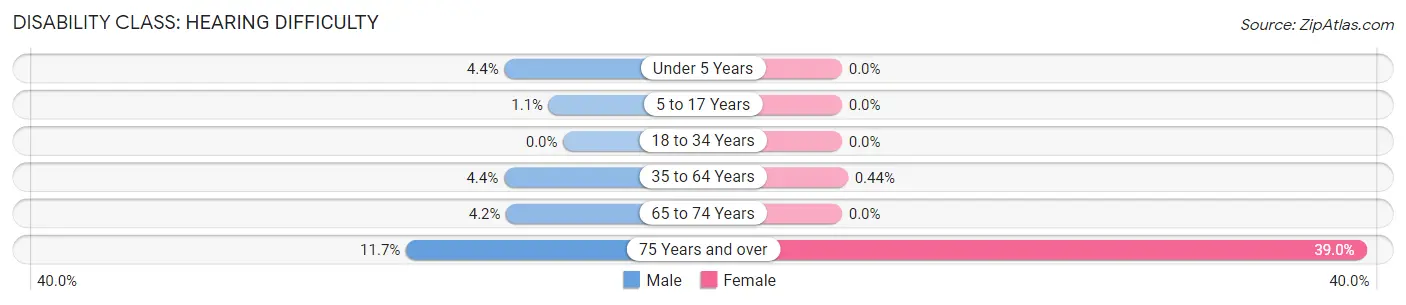
| Age Bracket | Male | Female |
| Under 5 Years | 22 (4.4%) | 0 (0.0%) |
| 5 to 17 Years | 19 (1.1%) | 0 (0.0%) |
| 18 to 34 Years | 0 (0.0%) | 0 (0.0%) |
| 35 to 64 Years | 102 (4.4%) | 10 (0.4%) |
| 65 to 74 Years | 20 (4.2%) | 0 (0.0%) |
| 75 Years and over | 28 (11.7%) | 104 (39.0%) |
Disability Class: Vision Difficulty
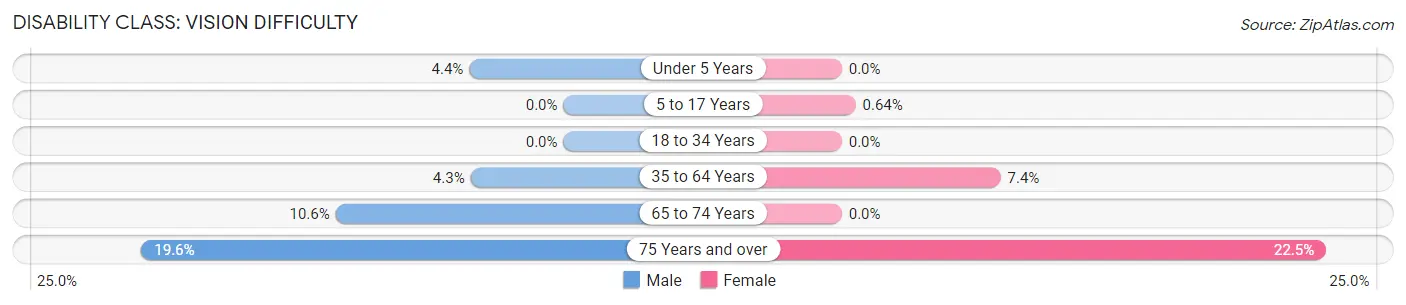
| Age Bracket | Male | Female |
| Under 5 Years | 22 (4.4%) | 0 (0.0%) |
| 5 to 17 Years | 0 (0.0%) | 12 (0.6%) |
| 18 to 34 Years | 0 (0.0%) | 0 (0.0%) |
| 35 to 64 Years | 100 (4.3%) | 166 (7.4%) |
| 65 to 74 Years | 50 (10.6%) | 0 (0.0%) |
| 75 Years and over | 47 (19.6%) | 60 (22.5%) |
Disability Class: Cognitive Difficulty
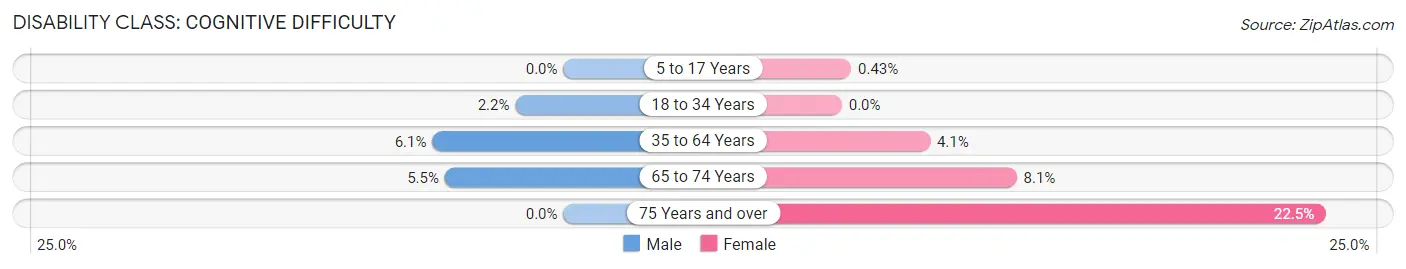
| Age Bracket | Male | Female |
| 5 to 17 Years | 0 (0.0%) | 8 (0.4%) |
| 18 to 34 Years | 45 (2.2%) | 0 (0.0%) |
| 35 to 64 Years | 141 (6.1%) | 92 (4.1%) |
| 65 to 74 Years | 26 (5.5%) | 18 (8.1%) |
| 75 Years and over | 0 (0.0%) | 60 (22.5%) |
Disability Class: Ambulatory Difficulty
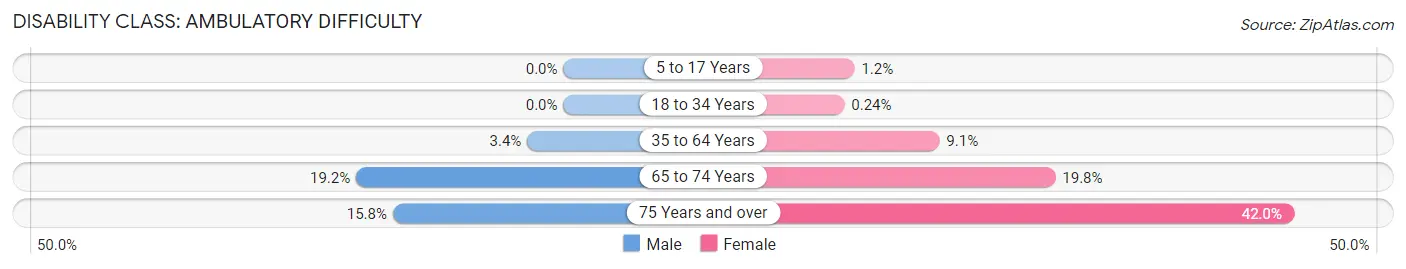
| Age Bracket | Male | Female |
| 5 to 17 Years | 0 (0.0%) | 22 (1.2%) |
| 18 to 34 Years | 0 (0.0%) | 5 (0.2%) |
| 35 to 64 Years | 78 (3.4%) | 204 (9.1%) |
| 65 to 74 Years | 91 (19.2%) | 44 (19.8%) |
| 75 Years and over | 38 (15.8%) | 112 (41.9%) |
Disability Class: Self-Care Difficulty
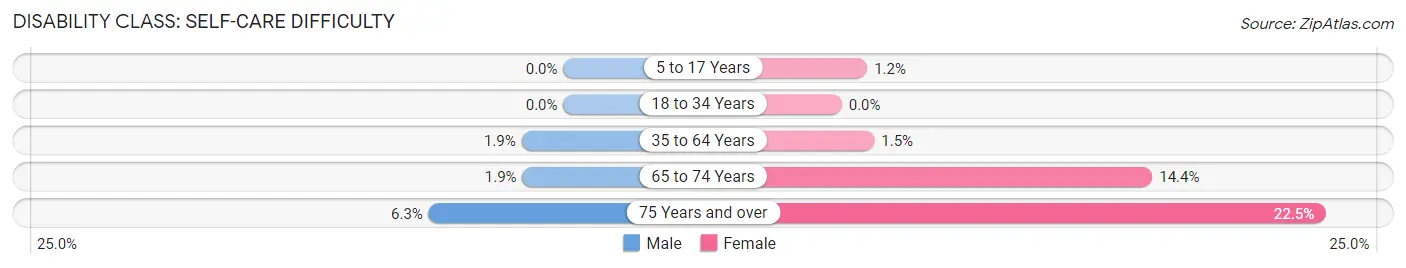
| Age Bracket | Male | Female |
| 5 to 17 Years | 0 (0.0%) | 22 (1.2%) |
| 18 to 34 Years | 0 (0.0%) | 0 (0.0%) |
| 35 to 64 Years | 45 (1.9%) | 34 (1.5%) |
| 65 to 74 Years | 9 (1.9%) | 32 (14.4%) |
| 75 Years and over | 15 (6.2%) | 60 (22.5%) |
Technology Access in Parlier
Computing Device Access in Parlier
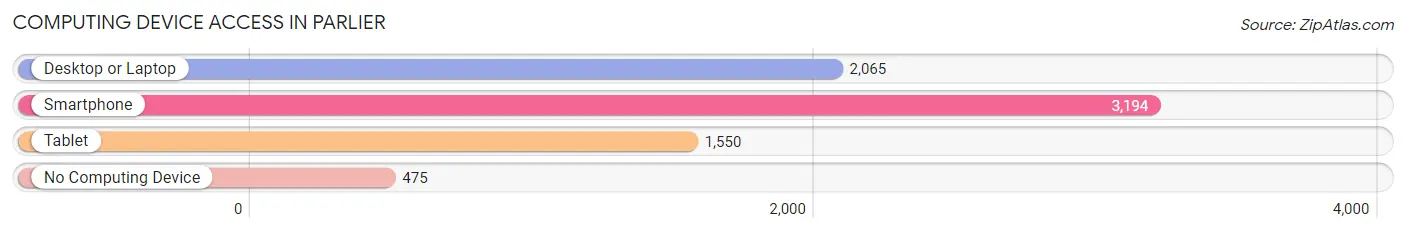
| Device Type | # Households | % Households |
| Desktop or Laptop | 2,065 | 55.1% |
| Smartphone | 3,194 | 85.3% |
| Tablet | 1,550 | 41.4% |
| No Computing Device | 475 | 12.7% |
| Total | 3,746 | 100.0% |
Internet Access in Parlier
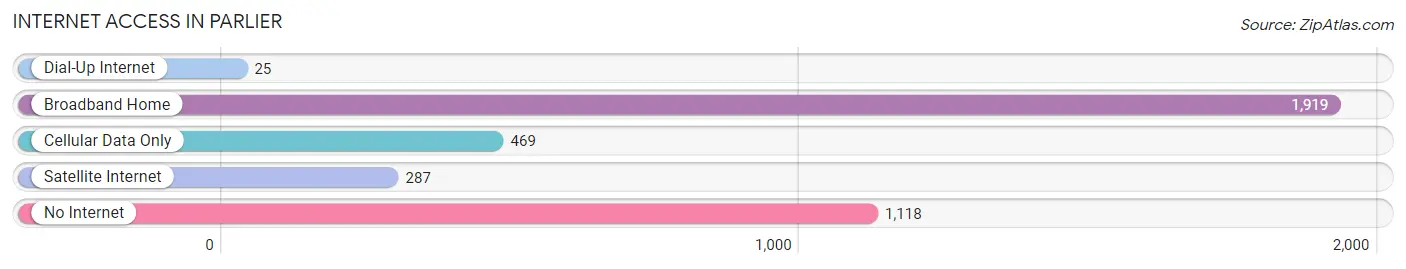
| Internet Type | # Households | % Households |
| Dial-Up Internet | 25 | 0.7% |
| Broadband Home | 1,919 | 51.2% |
| Cellular Data Only | 469 | 12.5% |
| Satellite Internet | 287 | 7.7% |
| No Internet | 1,118 | 29.8% |
| Total | 3,746 | 100.0% |
Parlier Summary
Parlier is a city located in Fresno County, California, United States. The population was 14,494 at the 2010 census, up from 11,145 at the 2000 census. It is located 8 miles (13 km) east-southeast of Fresno, at an elevation of 348 feet (106 m).
History
Parlier was founded in 1891 by a group of settlers from the Midwest. The city was named after the first postmaster, John Parlier. The city was incorporated in 1914.
Geography
Parlier is located at 36 37 17 N 119 30 17 W 36 6214 119 5047
According to the United States Census Bureau, the city has a total area of 2.2 square miles (5.7 km2), all of it land.
Economy
Parlier is a major agricultural center in the San Joaquin Valley. The city is home to a variety of agricultural businesses, including fruit and vegetable packing houses, dairies, and wineries. The city is also home to a number of manufacturing and distribution companies.
Demographics
As of the census of 2000, there were 11,145 people, 2,845 households, and 2,323 families residing in the city. The population density was 5,039.2 people per square mile (1,945.2/km2). There were 3,039 housing units at an average density of 1,372.2 per square mile (529.2/km2). The racial makeup of the city was 44.2% White, 0.7% African American, 1.2% Native American, 0.7% Asian, 0.1% Pacific Islander, 50.2% from other races, and 3.0% from two or more races. Hispanic or Latino of any race were 81.2% of the population.
There were 2,845 households, out of which 44.2% had children under the age of 18 living with them, 56.2% were married couples living together, 16.2% had a female householder with no husband present, and 20.2% were non-families. 16.2% of all households were made up of individuals, and 8.2% had someone living alone who was 65 years of age or older. The average household size was 3.90 and the average family size was 4.30.
In the city, the population was spread out, with 35.2% under the age of 18, 11.7% from 18 to 24, 28.2% from 25 to 44, 15.7% from 45 to 64, and 9.2% who were 65 years of age or older. The median age was 27 years. For every 100 females, there were 97.2 males. For every 100 females age 18 and over, there were 93.2 males.
The median income for a household in the city was $25,938, and the median income for a family was $27,917. Males had a median income of $25,938 versus $19,917 for females. The per capita income for the city was $9,845. About 24.2% of families and 28.2% of the population were below the poverty line, including 36.2% of those under age 18 and 16.2% of those age 65 or over.
Common Questions
What is Per Capita Income in Parlier?
Per Capita income in Parlier is $17,566.
What is the Median Family Income in Parlier?
Median Family Income in Parlier is $51,592.
What is the Median Household income in Parlier?
Median Household Income in Parlier is $50,026.
What is Income or Wage Gap in Parlier?
Income or Wage Gap in Parlier is 25.4%.
Women in Parlier earn 74.6 cents for every dollar earned by a man.
What is Inequality or Gini Index in Parlier?
Inequality or Gini Index in Parlier is 0.46.
What is the Total Population of Parlier?
Total Population of Parlier is 14,625.
What is the Total Male Population of Parlier?
Total Male Population of Parlier is 7,345.
What is the Total Female Population of Parlier?
Total Female Population of Parlier is 7,280.
What is the Ratio of Males per 100 Females in Parlier?
There are 100.89 Males per 100 Females in Parlier.
What is the Ratio of Females per 100 Males in Parlier?
There are 99.12 Females per 100 Males in Parlier.
What is the Median Population Age in Parlier?
Median Population Age in Parlier is 28.2 Years.
What is the Average Family Size in Parlier
Average Family Size in Parlier is 4.1 People.
What is the Average Household Size in Parlier
Average Household Size in Parlier is 3.9 People.
How Large is the Labor Force in Parlier?
There are 6,836 People in the Labor Forcein in Parlier.
What is the Percentage of People in the Labor Force in Parlier?
64.9% of People are in the Labor Force in Parlier.
What is the Unemployment Rate in Parlier?
Unemployment Rate in Parlier is 6.9%.