Palo Cedro, CA Map & Demographics
Palo Cedro Map
Palo Cedro Overview
$50,014
PER CAPITA INCOME
$135,731
AVG FAMILY INCOME
$111,771
AVG HOUSEHOLD INCOME
53.3%
WAGE / INCOME GAP [ % ]
46.7¢/ $1
WAGE / INCOME GAP [ $ ]
$14,623
FAMILY INCOME DEFICIT
0.42
INEQUALITY / GINI INDEX
3,396
TOTAL POPULATION
1,640
MALE POPULATION
1,756
FEMALE POPULATION
93.39
MALES / 100 FEMALES
107.07
FEMALES / 100 MALES
41.6
MEDIAN AGE
3.3
AVG FAMILY SIZE
2.8
AVG HOUSEHOLD SIZE
1,480
LABOR FORCE [ PEOPLE ]
58.6%
PERCENT IN LABOR FORCE
5.7%
UNEMPLOYMENT RATE
Palo Cedro Zip Codes
Palo Cedro Area Codes
Income in Palo Cedro
Income Overview in Palo Cedro
Per Capita Income in Palo Cedro is $50,014, while median incomes of families and households are $135,731 and $111,771 respectively.
| Characteristic | Number | Measure |
| Per Capita Income | 3,396 | $50,014 |
| Median Family Income | 927 | $135,731 |
| Mean Family Income | 927 | $159,342 |
| Median Household Income | 1,193 | $111,771 |
| Mean Household Income | 1,193 | $136,157 |
| Income Deficit | 927 | $14,623 |
| Wage / Income Gap (%) | 3,396 | 53.31% |
| Wage / Income Gap ($) | 3,396 | 46.69¢ per $1 |
| Gini / Inequality Index | 3,396 | 0.42 |
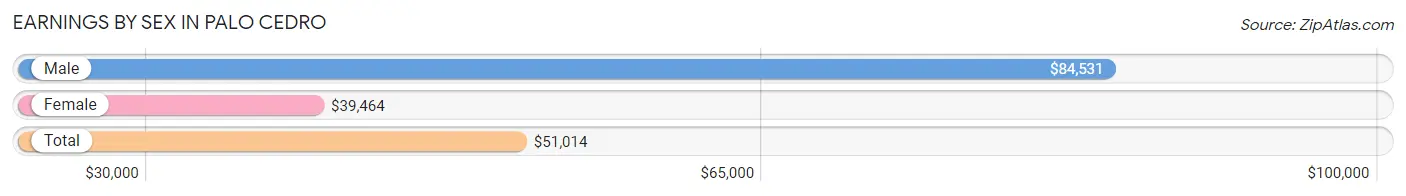
Earnings by Sex in Palo Cedro
Average Earnings in Palo Cedro are $51,014, $84,531 for men and $39,464 for women, a difference of 53.3%.
| Sex | Number | Average Earnings |
| Male | 801 (49.0%) | $84,531 |
| Female | 835 (51.0%) | $39,464 |
| Total | 1,636 (100.0%) | $51,014 |
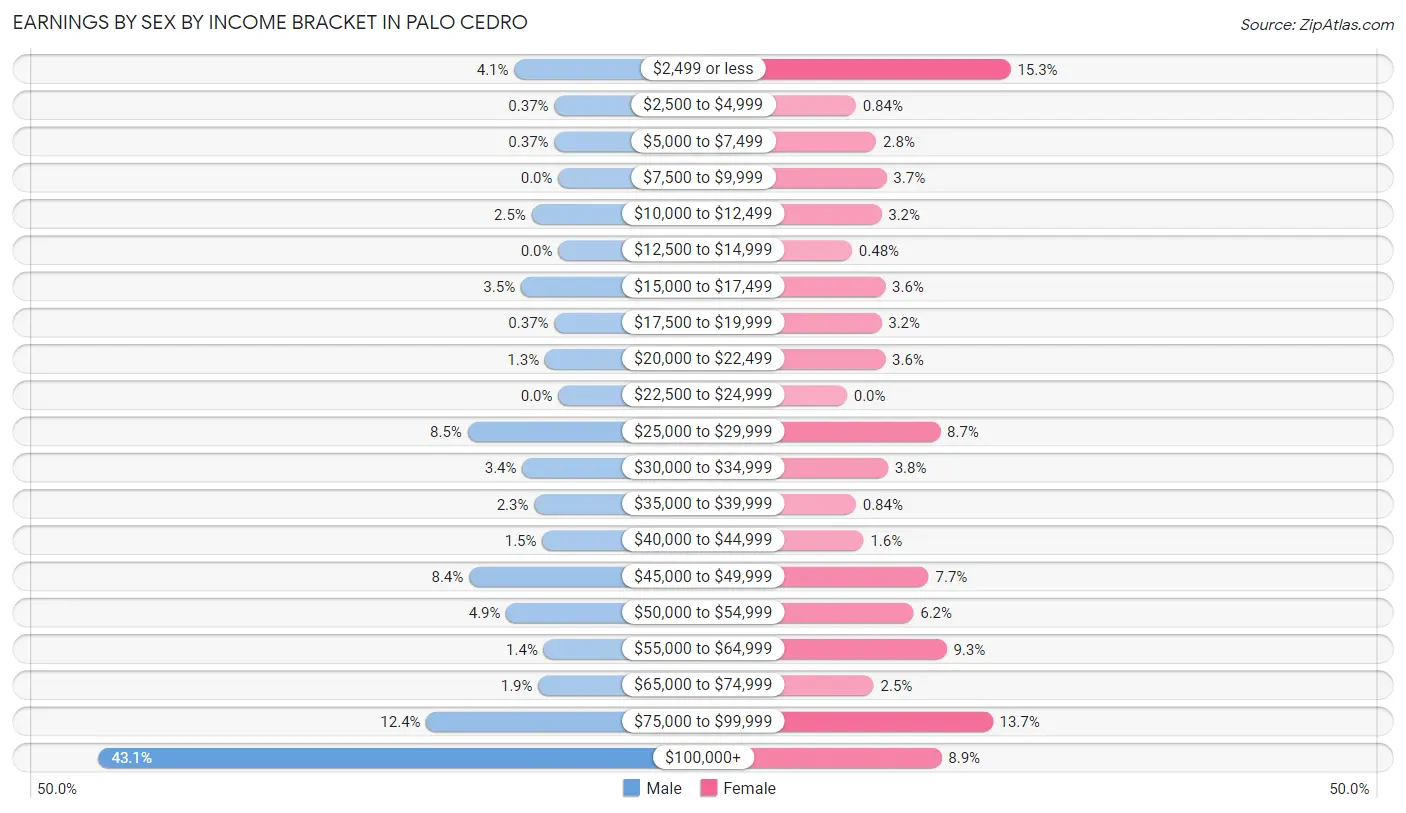
Earnings by Sex by Income Bracket in Palo Cedro
The most common earnings brackets in Palo Cedro are $100,000+ for men (345 | 43.1%) and $2,499 or less for women (128 | 15.3%).
| Income | Male | Female |
| $2,499 or less | 33 (4.1%) | 128 (15.3%) |
| $2,500 to $4,999 | 3 (0.4%) | 7 (0.8%) |
| $5,000 to $7,499 | 3 (0.4%) | 23 (2.8%) |
| $7,500 to $9,999 | 0 (0.0%) | 31 (3.7%) |
| $10,000 to $12,499 | 20 (2.5%) | 27 (3.2%) |
| $12,500 to $14,999 | 0 (0.0%) | 4 (0.5%) |
| $15,000 to $17,499 | 28 (3.5%) | 30 (3.6%) |
| $17,500 to $19,999 | 3 (0.4%) | 27 (3.2%) |
| $20,000 to $22,499 | 10 (1.3%) | 30 (3.6%) |
| $22,500 to $24,999 | 0 (0.0%) | 0 (0.0%) |
| $25,000 to $29,999 | 68 (8.5%) | 73 (8.7%) |
| $30,000 to $34,999 | 27 (3.4%) | 32 (3.8%) |
| $35,000 to $39,999 | 18 (2.2%) | 7 (0.8%) |
| $40,000 to $44,999 | 12 (1.5%) | 13 (1.6%) |
| $45,000 to $49,999 | 67 (8.4%) | 64 (7.7%) |
| $50,000 to $54,999 | 39 (4.9%) | 52 (6.2%) |
| $55,000 to $64,999 | 11 (1.4%) | 78 (9.3%) |
| $65,000 to $74,999 | 15 (1.9%) | 21 (2.5%) |
| $75,000 to $99,999 | 99 (12.4%) | 114 (13.7%) |
| $100,000+ | 345 (43.1%) | 74 (8.9%) |
| Total | 801 (100.0%) | 835 (100.0%) |
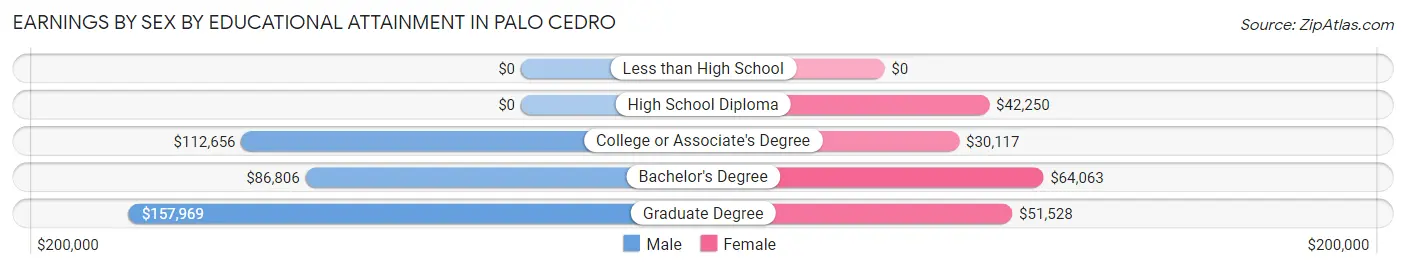
Earnings by Sex by Educational Attainment in Palo Cedro
Average earnings in Palo Cedro are $94,044 for men and $50,341 for women, a difference of 46.5%. Men with an educational attainment of graduate degree enjoy the highest average annual earnings of $157,969, while those with bachelor's degree education earn the least with $86,806. Women with an educational attainment of bachelor's degree earn the most with the average annual earnings of $64,063, while those with college or associate's degree education have the smallest earnings of $30,117.
| Educational Attainment | Male Income | Female Income |
| Less than High School | - | - |
| High School Diploma | - | - |
| College or Associate's Degree | $112,656 | $30,117 |
| Bachelor's Degree | $86,806 | $64,063 |
| Graduate Degree | $157,969 | $51,528 |
| Total | $94,044 | $50,341 |
Family Income in Palo Cedro
Family Income Brackets in Palo Cedro
According to the Palo Cedro family income data, there are 303 families falling into the $100,000 to $149,999 income range, which is the most common income bracket and makes up 32.7% of all families.
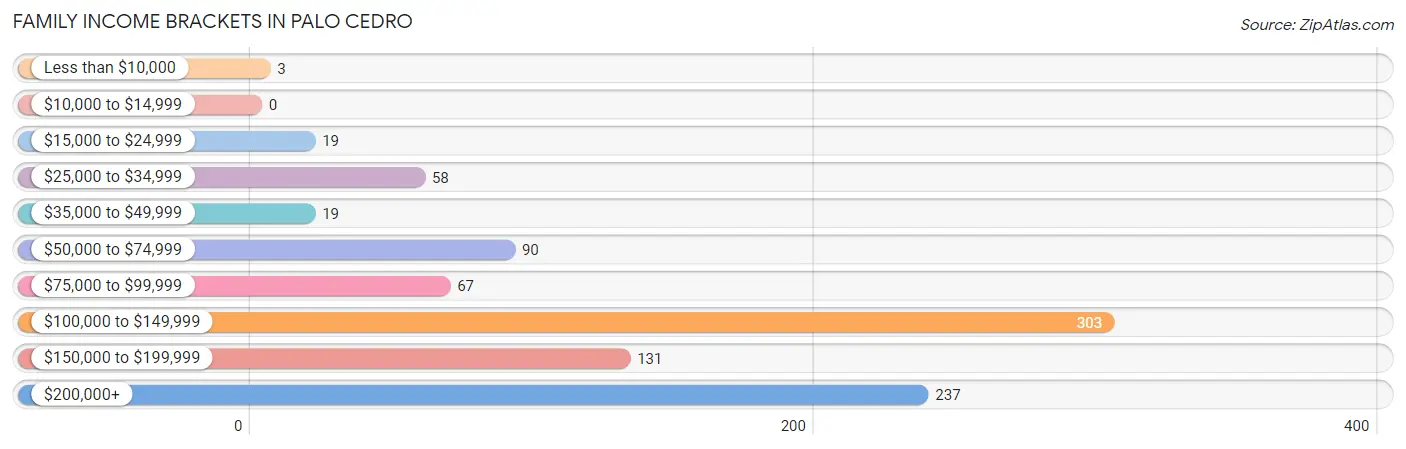
| Income Bracket | # Families | % Families |
| Less than $10,000 | 3 | 0.3% |
| $10,000 to $14,999 | 0 | 0.0% |
| $15,000 to $24,999 | 19 | 2.0% |
| $25,000 to $34,999 | 58 | 6.3% |
| $35,000 to $49,999 | 19 | 2.0% |
| $50,000 to $74,999 | 90 | 9.7% |
| $75,000 to $99,999 | 67 | 7.2% |
| $100,000 to $149,999 | 303 | 32.7% |
| $150,000 to $199,999 | 131 | 14.1% |
| $200,000+ | 237 | 25.6% |
Family Income by Famaliy Size in Palo Cedro
6-person families (48 | 5.2%) account for the highest median family income in Palo Cedro with $233,621 per family, while 2-person families (390 | 42.1%) have the highest median income of $51,719 per family member.
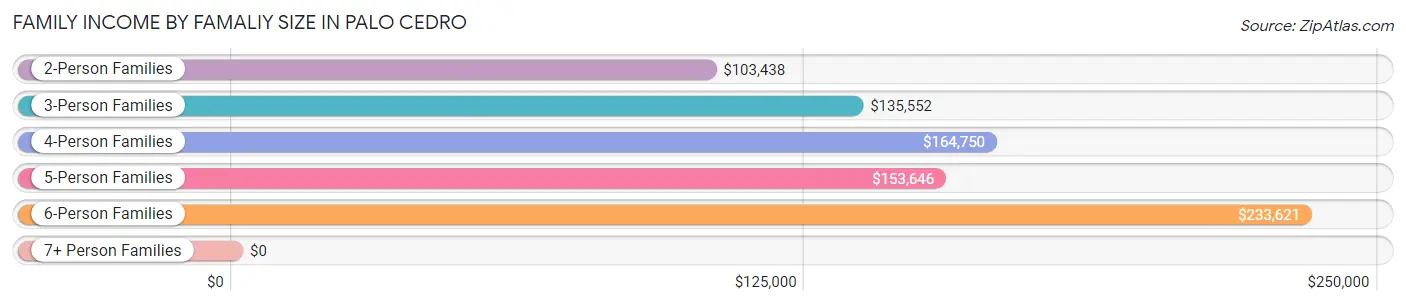
| Income Bracket | # Families | Median Income |
| 2-Person Families | 390 (42.1%) | $103,438 |
| 3-Person Families | 281 (30.3%) | $135,552 |
| 4-Person Families | 129 (13.9%) | $164,750 |
| 5-Person Families | 62 (6.7%) | $153,646 |
| 6-Person Families | 48 (5.2%) | $233,621 |
| 7+ Person Families | 17 (1.8%) | $0 |
| Total | 927 (100.0%) | $135,731 |
Family Income by Number of Earners in Palo Cedro
The median family income in Palo Cedro is $135,731, with families comprising 3+ earners (162) having the highest median family income of $216,250, while families with no earners (123) have the lowest median family income of $65,417, accounting for 17.5% and 13.3% of families, respectively.
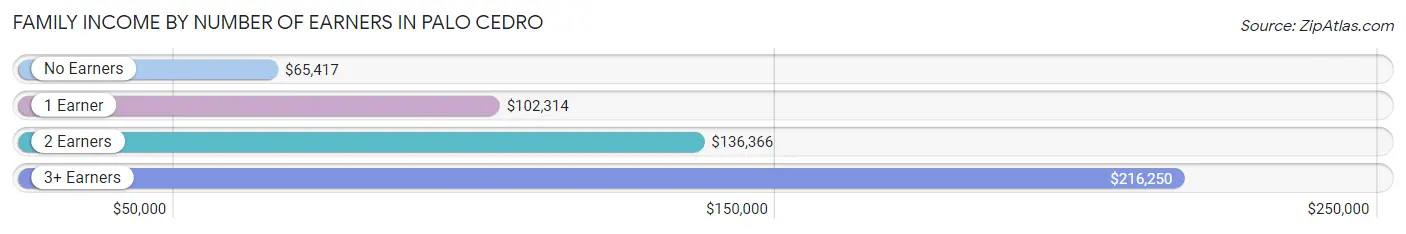
| Number of Earners | # Families | Median Income |
| No Earners | 123 (13.3%) | $65,417 |
| 1 Earner | 321 (34.6%) | $102,314 |
| 2 Earners | 321 (34.6%) | $136,366 |
| 3+ Earners | 162 (17.5%) | $216,250 |
| Total | 927 (100.0%) | $135,731 |
Household Income in Palo Cedro
Household Income Brackets in Palo Cedro
With 315 households falling in the category, the $100,000 to $149,999 income range is the most frequent in Palo Cedro, accounting for 26.4% of all households. In contrast, only 8 households (0.7%) fall into the $10,000 to $14,999 income bracket, making it the least populous group.
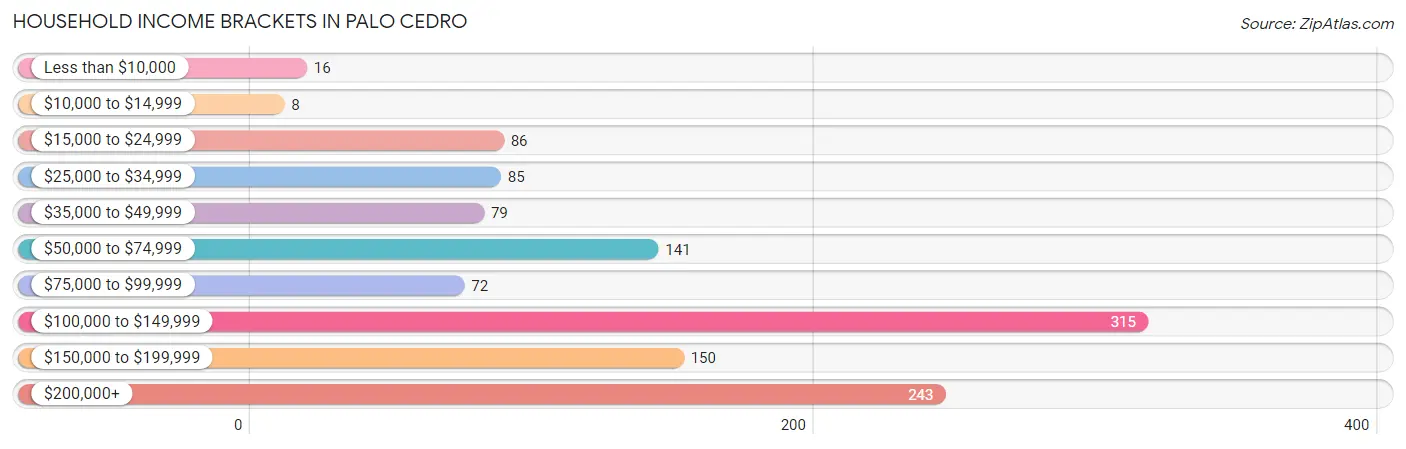
| Income Bracket | # Households | % Households |
| Less than $10,000 | 16 | 1.3% |
| $10,000 to $14,999 | 8 | 0.7% |
| $15,000 to $24,999 | 86 | 7.2% |
| $25,000 to $34,999 | 85 | 7.1% |
| $35,000 to $49,999 | 79 | 6.6% |
| $50,000 to $74,999 | 141 | 11.8% |
| $75,000 to $99,999 | 72 | 6.0% |
| $100,000 to $149,999 | 315 | 26.4% |
| $150,000 to $199,999 | 150 | 12.6% |
| $200,000+ | 243 | 20.4% |
Household Income by Householder Age in Palo Cedro
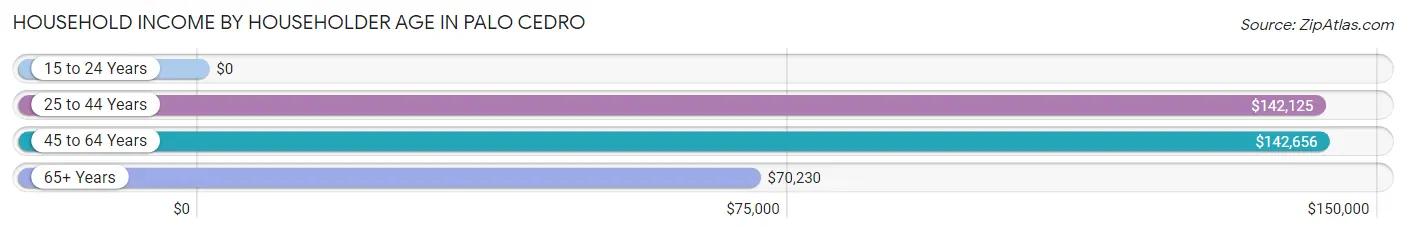
The median household income in Palo Cedro is $111,771, with the highest median household income of $142,656 found in the 45 to 64 years age bracket for the primary householder. A total of 429 households (36.0%) fall into this category. Meanwhile, the 15 to 24 years age bracket for the primary householder has the lowest median household income of $0, with 2 households (0.2%) in this group.
| Income Bracket | # Households | Median Income |
| 15 to 24 Years | 2 (0.2%) | $0 |
| 25 to 44 Years | 279 (23.4%) | $142,125 |
| 45 to 64 Years | 429 (36.0%) | $142,656 |
| 65+ Years | 483 (40.5%) | $70,230 |
| Total | 1,193 (100.0%) | $111,771 |
Poverty in Palo Cedro
Income Below Poverty by Sex and Age in Palo Cedro
With 4.2% poverty level for males and 1.7% for females among the residents of Palo Cedro, under 5 year old males and 75 year old and over females are the most vulnerable to poverty, with 12 males (16.4%) and 10 females (6.1%) in their respective age groups living below the poverty level.
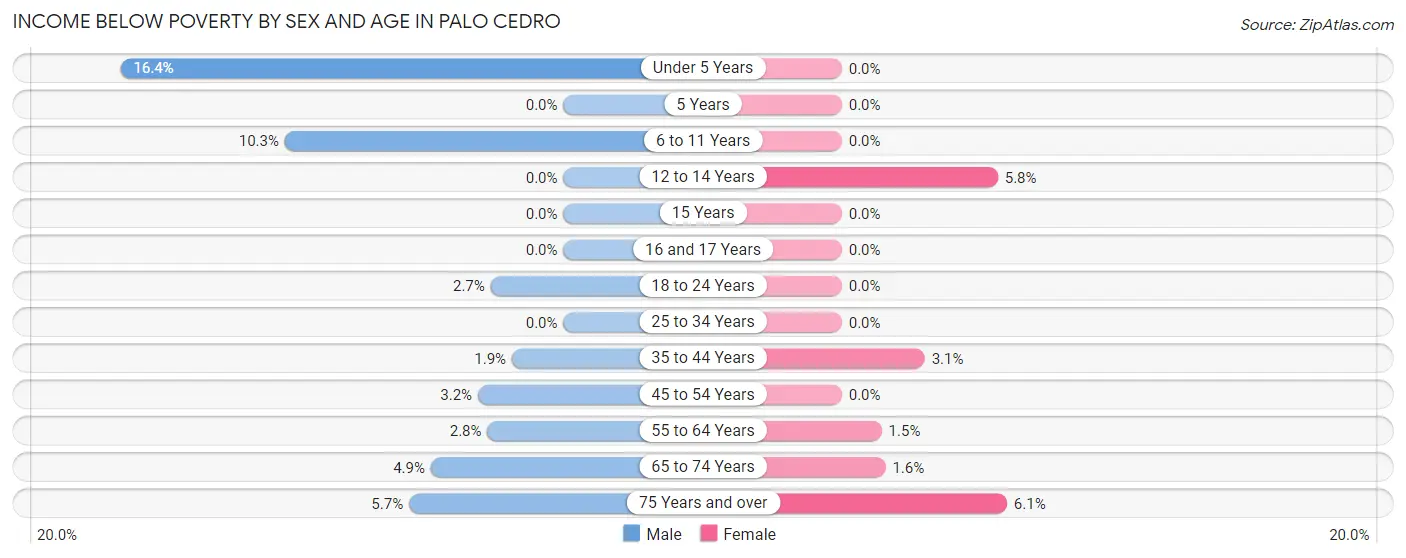
| Age Bracket | Male | Female |
| Under 5 Years | 12 (16.4%) | 0 (0.0%) |
| 5 Years | 0 (0.0%) | 0 (0.0%) |
| 6 to 11 Years | 18 (10.3%) | 0 (0.0%) |
| 12 to 14 Years | 0 (0.0%) | 7 (5.8%) |
| 15 Years | 0 (0.0%) | 0 (0.0%) |
| 16 and 17 Years | 0 (0.0%) | 0 (0.0%) |
| 18 to 24 Years | 2 (2.7%) | 0 (0.0%) |
| 25 to 34 Years | 0 (0.0%) | 0 (0.0%) |
| 35 to 44 Years | 3 (1.9%) | 6 (3.1%) |
| 45 to 54 Years | 6 (3.2%) | 0 (0.0%) |
| 55 to 64 Years | 7 (2.8%) | 3 (1.5%) |
| 65 to 74 Years | 9 (4.9%) | 3 (1.6%) |
| 75 Years and over | 11 (5.7%) | 10 (6.1%) |
| Total | 68 (4.2%) | 29 (1.7%) |
Income Above Poverty by Sex and Age in Palo Cedro
According to the poverty statistics in Palo Cedro, males aged 5 years and females aged under 5 years are the age groups that are most secure financially, with 100.0% of males and 100.0% of females in these age groups living above the poverty line.
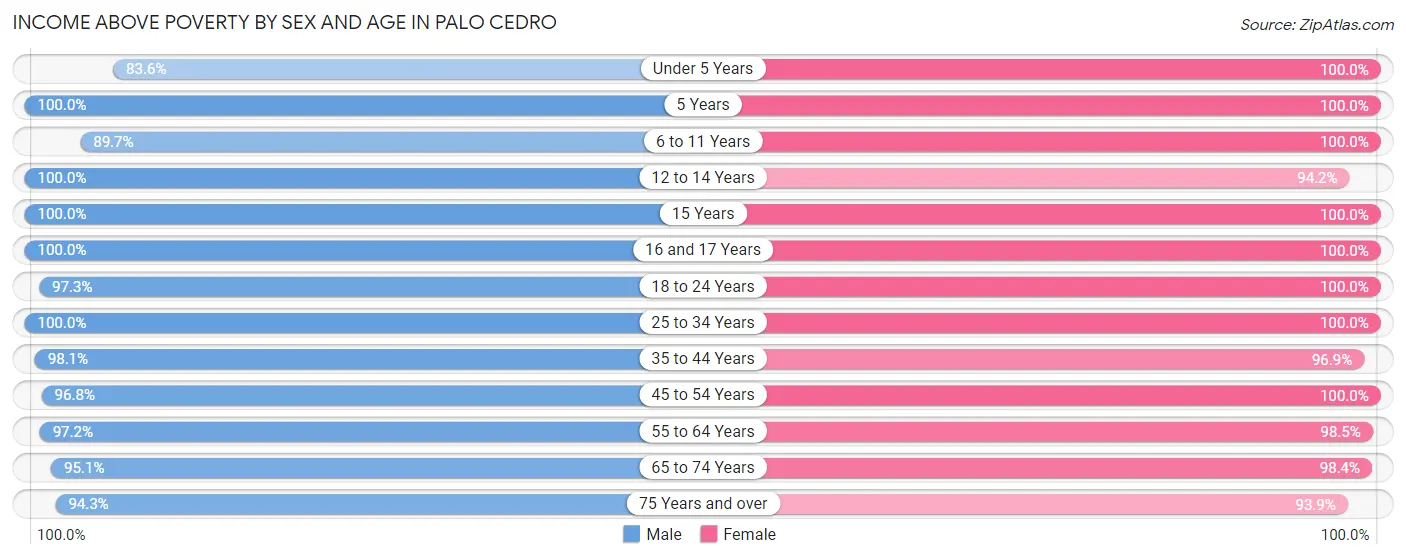
| Age Bracket | Male | Female |
| Under 5 Years | 61 (83.6%) | 215 (100.0%) |
| 5 Years | 51 (100.0%) | 5 (100.0%) |
| 6 to 11 Years | 156 (89.7%) | 60 (100.0%) |
| 12 to 14 Years | 106 (100.0%) | 114 (94.2%) |
| 15 Years | 54 (100.0%) | 8 (100.0%) |
| 16 and 17 Years | 47 (100.0%) | 130 (100.0%) |
| 18 to 24 Years | 72 (97.3%) | 63 (100.0%) |
| 25 to 34 Years | 86 (100.0%) | 169 (100.0%) |
| 35 to 44 Years | 154 (98.1%) | 189 (96.9%) |
| 45 to 54 Years | 183 (96.8%) | 239 (100.0%) |
| 55 to 64 Years | 241 (97.2%) | 200 (98.5%) |
| 65 to 74 Years | 174 (95.1%) | 182 (98.4%) |
| 75 Years and over | 181 (94.3%) | 153 (93.9%) |
| Total | 1,566 (95.8%) | 1,727 (98.4%) |
Income Below Poverty Among Married-Couple Families in Palo Cedro
The poverty statistics for married-couple families in Palo Cedro show that 1.6% or 13 of the total 817 families live below the poverty line. Families with 5 or more children have the highest poverty rate of 100.0%, comprising of 6 families. On the other hand, families with 1 or 2 children have the lowest poverty rate of 0.0%, which includes 0 families.
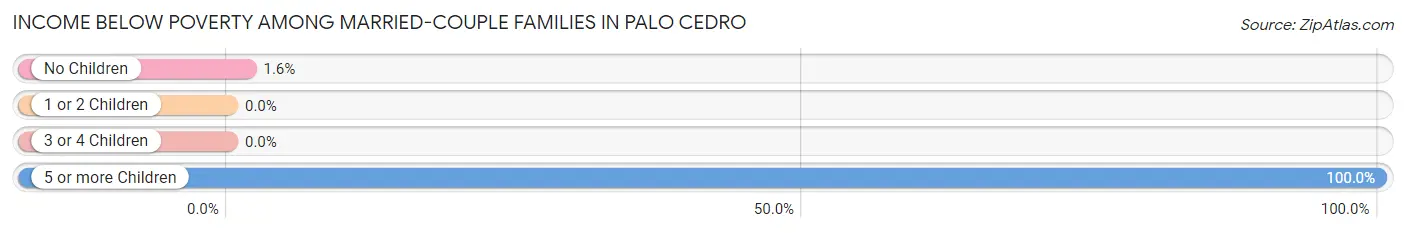
| Children | Above Poverty | Below Poverty |
| No Children | 427 (98.4%) | 7 (1.6%) |
| 1 or 2 Children | 283 (100.0%) | 0 (0.0%) |
| 3 or 4 Children | 94 (100.0%) | 0 (0.0%) |
| 5 or more Children | 0 (0.0%) | 6 (100.0%) |
| Total | 804 (98.4%) | 13 (1.6%) |
Income Below Poverty Among Single-Parent Households in Palo Cedro
| Children | Single Father | Single Mother |
| No Children | 0 (0.0%) | 0 (0.0%) |
| 1 or 2 Children | 0 (0.0%) | 0 (0.0%) |
| 3 or 4 Children | 0 (0.0%) | 0 (0.0%) |
| 5 or more Children | 0 (0.0%) | 0 (0.0%) |
| Total | 0 (0.0%) | 0 (0.0%) |
Income Below Poverty Among Married-Couple vs Single-Parent Households in Palo Cedro
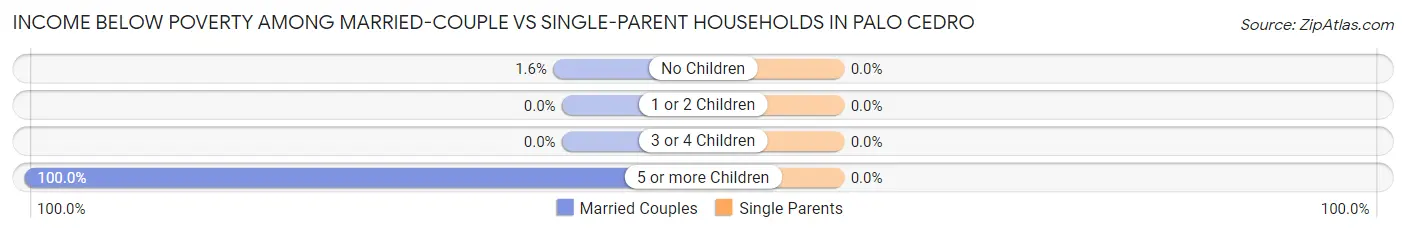
| Children | Married-Couple Families | Single-Parent Households |
| No Children | 7 (1.6%) | 0 (0.0%) |
| 1 or 2 Children | 0 (0.0%) | 0 (0.0%) |
| 3 or 4 Children | 0 (0.0%) | 0 (0.0%) |
| 5 or more Children | 6 (100.0%) | 0 (0.0%) |
| Total | 13 (1.6%) | 0 (0.0%) |
Race in Palo Cedro
The most populous races in Palo Cedro are White / Caucasian (3,034 | 89.3%), Two or more Races (292 | 8.6%), and Hispanic or Latino (89 | 2.6%).
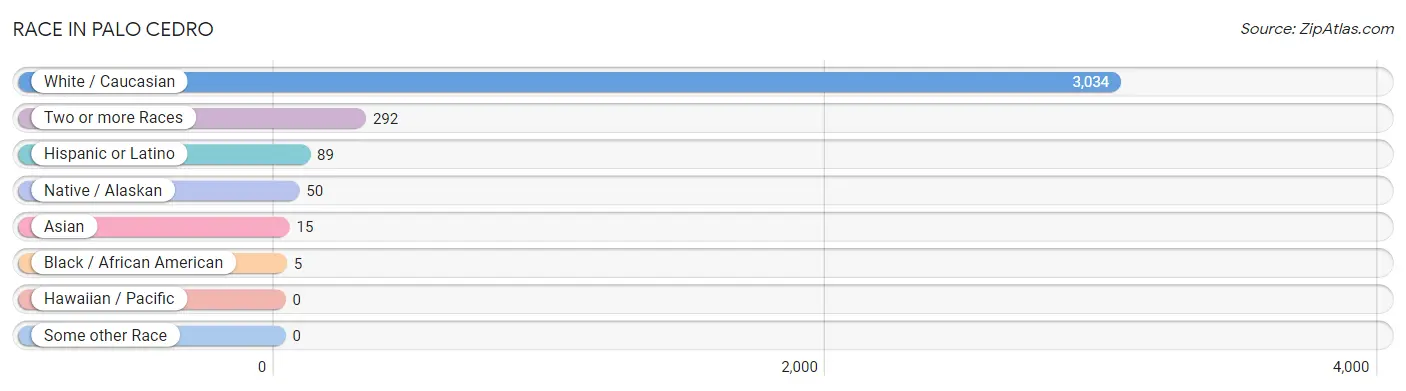
| Race | # Population | % Population |
| Asian | 15 | 0.4% |
| Black / African American | 5 | 0.2% |
| Hawaiian / Pacific | 0 | 0.0% |
| Hispanic or Latino | 89 | 2.6% |
| Native / Alaskan | 50 | 1.5% |
| White / Caucasian | 3,034 | 89.3% |
| Two or more Races | 292 | 8.6% |
| Some other Race | 0 | 0.0% |
| Total | 3,396 | 100.0% |
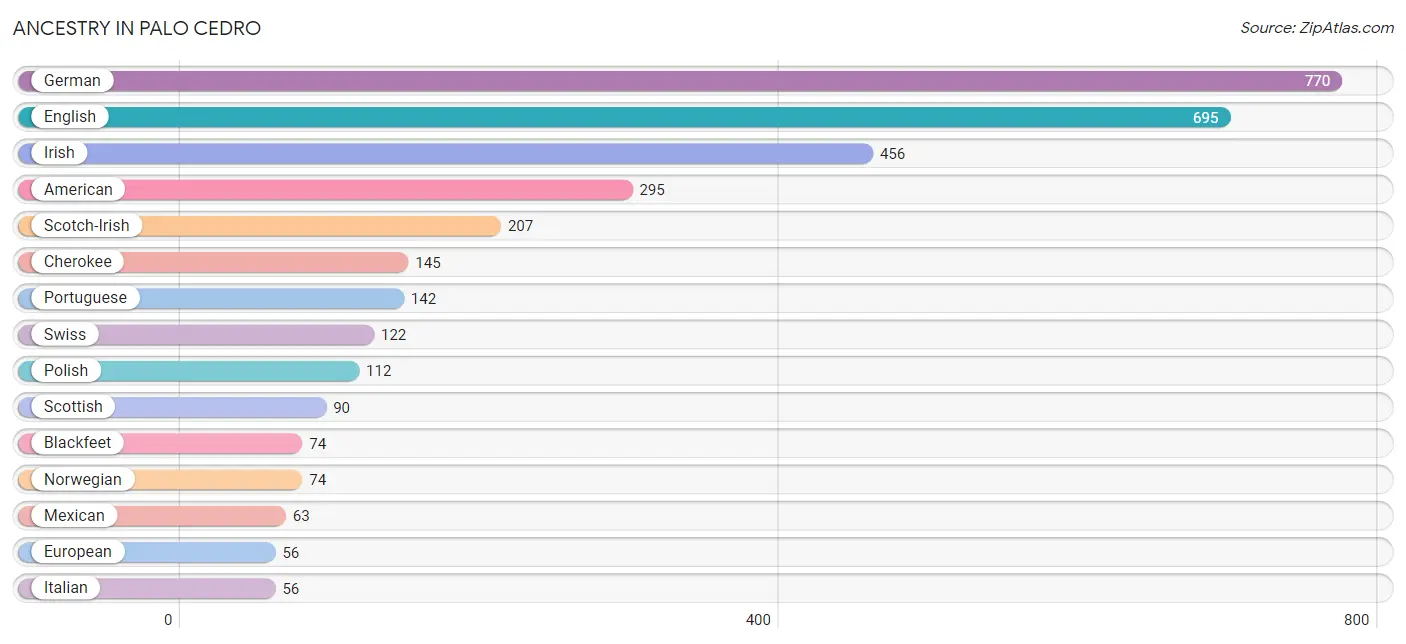
Ancestry in Palo Cedro
The most populous ancestries reported in Palo Cedro are German (770 | 22.7%), English (695 | 20.5%), Irish (456 | 13.4%), American (295 | 8.7%), and Scotch-Irish (207 | 6.1%), together accounting for 71.4% of all Palo Cedro residents.
| Ancestry | # Population | % Population |
| African | 4 | 0.1% |
| American | 295 | 8.7% |
| Austrian | 34 | 1.0% |
| Bhutanese | 28 | 0.8% |
| Blackfeet | 74 | 2.2% |
| British | 7 | 0.2% |
| Bulgarian | 17 | 0.5% |
| Canadian | 8 | 0.2% |
| Central American | 3 | 0.1% |
| Cherokee | 145 | 4.3% |
| Choctaw | 32 | 0.9% |
| Colville | 4 | 0.1% |
| Czech | 13 | 0.4% |
| Czechoslovakian | 28 | 0.8% |
| Danish | 37 | 1.1% |
| English | 695 | 20.5% |
| European | 56 | 1.7% |
| Filipino | 12 | 0.4% |
| Finnish | 9 | 0.3% |
| French | 33 | 1.0% |
| French Canadian | 6 | 0.2% |
| German | 770 | 22.7% |
| Greek | 35 | 1.0% |
| Hungarian | 3 | 0.1% |
| Indian (Asian) | 31 | 0.9% |
| Iranian | 43 | 1.3% |
| Irish | 456 | 13.4% |
| Italian | 56 | 1.7% |
| Maltese | 8 | 0.2% |
| Mexican | 63 | 1.9% |
| Norwegian | 74 | 2.2% |
| Pennsylvania German | 20 | 0.6% |
| Peruvian | 5 | 0.2% |
| Polish | 112 | 3.3% |
| Portuguese | 142 | 4.2% |
| Puerto Rican | 6 | 0.2% |
| Salvadoran | 3 | 0.1% |
| Scandinavian | 3 | 0.1% |
| Scotch-Irish | 207 | 6.1% |
| Scottish | 90 | 2.6% |
| Serbian | 8 | 0.2% |
| Slavic | 4 | 0.1% |
| South American | 5 | 0.2% |
| Spaniard | 10 | 0.3% |
| Spanish | 2 | 0.1% |
| Subsaharan African | 4 | 0.1% |
| Swedish | 42 | 1.2% |
| Swiss | 122 | 3.6% |
| Ukrainian | 3 | 0.1% |
| Welsh | 17 | 0.5% | View All 50 Rows |
Immigrants in Palo Cedro
The most numerous immigrant groups reported in Palo Cedro came from Asia (15 | 0.4%), China (15 | 0.4%), Eastern Asia (15 | 0.4%), Taiwan (12 | 0.4%), and Europe (8 | 0.2%), together accounting for 1.9% of all Palo Cedro residents.
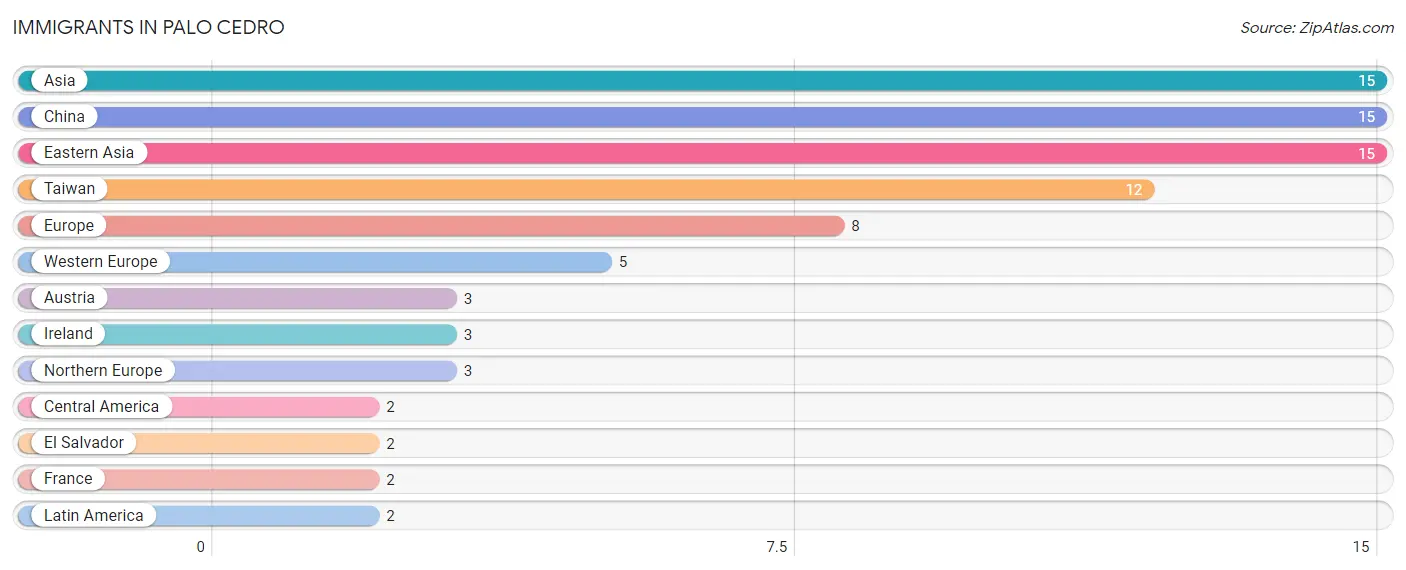
| Immigration Origin | # Population | % Population |
| Asia | 15 | 0.4% |
| Austria | 3 | 0.1% |
| Central America | 2 | 0.1% |
| China | 15 | 0.4% |
| Eastern Asia | 15 | 0.4% |
| El Salvador | 2 | 0.1% |
| Europe | 8 | 0.2% |
| France | 2 | 0.1% |
| Ireland | 3 | 0.1% |
| Latin America | 2 | 0.1% |
| Northern Europe | 3 | 0.1% |
| Taiwan | 12 | 0.4% |
| Western Europe | 5 | 0.2% | View All 13 Rows |
Sex and Age in Palo Cedro
Sex and Age in Palo Cedro
The most populous age groups in Palo Cedro are 45 to 49 Years (179 | 10.9%) for men and Under 5 Years (215 | 12.2%) for women.
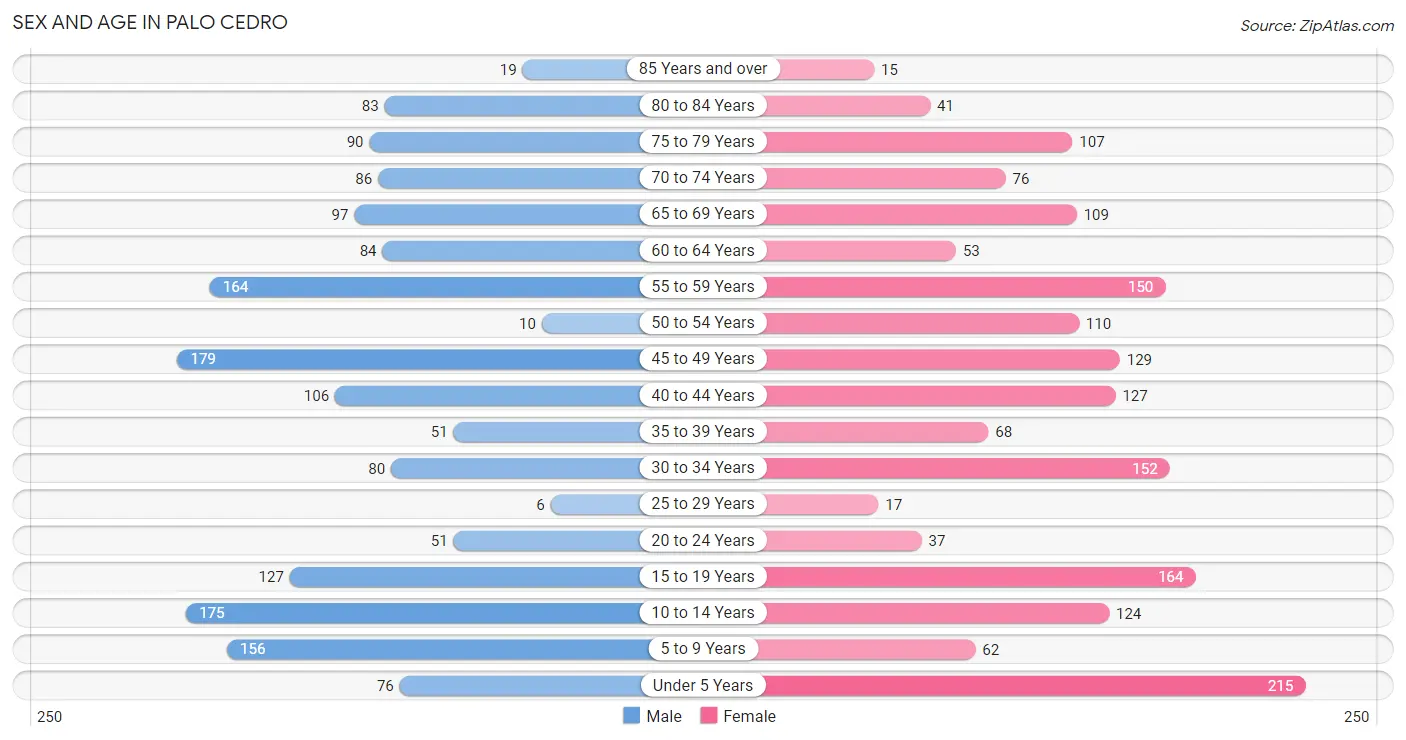
| Age Bracket | Male | Female |
| Under 5 Years | 76 (4.6%) | 215 (12.2%) |
| 5 to 9 Years | 156 (9.5%) | 62 (3.5%) |
| 10 to 14 Years | 175 (10.7%) | 124 (7.1%) |
| 15 to 19 Years | 127 (7.7%) | 164 (9.3%) |
| 20 to 24 Years | 51 (3.1%) | 37 (2.1%) |
| 25 to 29 Years | 6 (0.4%) | 17 (1.0%) |
| 30 to 34 Years | 80 (4.9%) | 152 (8.7%) |
| 35 to 39 Years | 51 (3.1%) | 68 (3.9%) |
| 40 to 44 Years | 106 (6.5%) | 127 (7.2%) |
| 45 to 49 Years | 179 (10.9%) | 129 (7.3%) |
| 50 to 54 Years | 10 (0.6%) | 110 (6.3%) |
| 55 to 59 Years | 164 (10.0%) | 150 (8.5%) |
| 60 to 64 Years | 84 (5.1%) | 53 (3.0%) |
| 65 to 69 Years | 97 (5.9%) | 109 (6.2%) |
| 70 to 74 Years | 86 (5.2%) | 76 (4.3%) |
| 75 to 79 Years | 90 (5.5%) | 107 (6.1%) |
| 80 to 84 Years | 83 (5.1%) | 41 (2.3%) |
| 85 Years and over | 19 (1.2%) | 15 (0.9%) |
| Total | 1,640 (100.0%) | 1,756 (100.0%) |
Families and Households in Palo Cedro
Median Family Size in Palo Cedro
The median family size in Palo Cedro is 3.32 persons per family, with single male/father families (29 | 3.1%) accounting for the largest median family size of 5.41 persons per family. On the other hand, single female/mother families (81 | 8.7%) represent the smallest median family size with 2.27 persons per family.
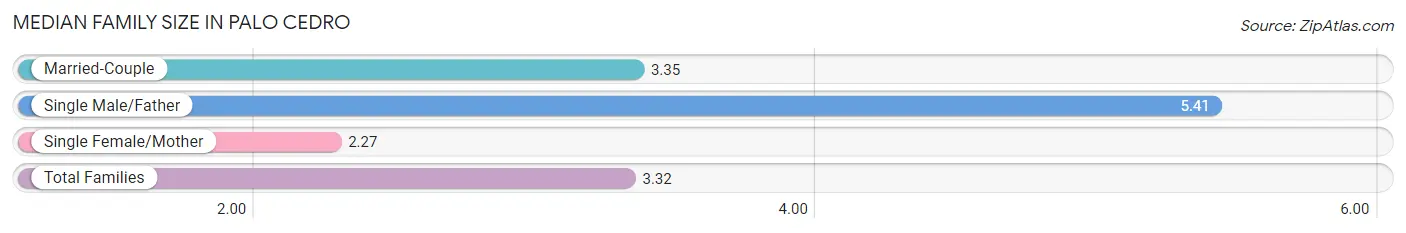
| Family Type | # Families | Family Size |
| Married-Couple | 817 (88.1%) | 3.35 |
| Single Male/Father | 29 (3.1%) | 5.41 |
| Single Female/Mother | 81 (8.7%) | 2.27 |
| Total Families | 927 (100.0%) | 3.32 |
Median Household Size in Palo Cedro
The median household size in Palo Cedro is 2.84 persons per household, with single male/father households (29 | 2.4%) accounting for the largest median household size of 5.41 persons per household. non-family households (266 | 22.3%) represent the smallest median household size with 1.14 persons per household.
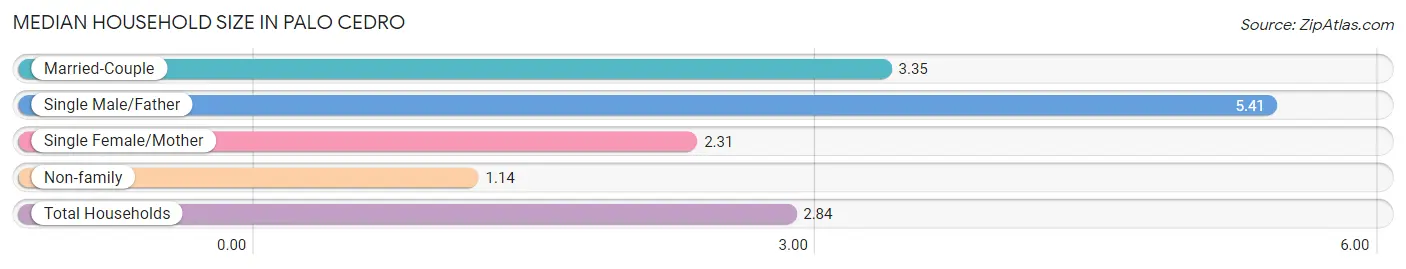
| Household Type | # Households | Household Size |
| Married-Couple | 817 (68.5%) | 3.35 |
| Single Male/Father | 29 (2.4%) | 5.41 |
| Single Female/Mother | 81 (6.8%) | 2.31 |
| Non-family | 266 (22.3%) | 1.14 |
| Total Households | 1,193 (100.0%) | 2.84 |
Household Size by Marriage Status in Palo Cedro
Out of a total of 1,193 households in Palo Cedro, 927 (77.7%) are family households, while 266 (22.3%) are nonfamily households. The most numerous type of family households are 2-person households, comprising 390, and the most common type of nonfamily households are 1-person households, comprising 246.
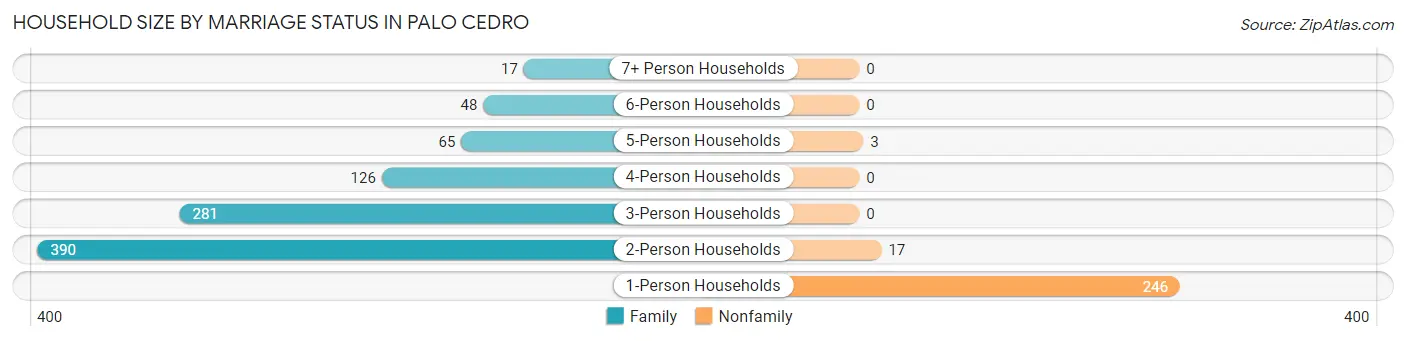
| Household Size | Family Households | Nonfamily Households |
| 1-Person Households | - | 246 (20.6%) |
| 2-Person Households | 390 (32.7%) | 17 (1.4%) |
| 3-Person Households | 281 (23.5%) | 0 (0.0%) |
| 4-Person Households | 126 (10.6%) | 0 (0.0%) |
| 5-Person Households | 65 (5.4%) | 3 (0.3%) |
| 6-Person Households | 48 (4.0%) | 0 (0.0%) |
| 7+ Person Households | 17 (1.4%) | 0 (0.0%) |
| Total | 927 (77.7%) | 266 (22.3%) |
Female Fertility in Palo Cedro
Fertility by Age in Palo Cedro
Average fertility rate in Palo Cedro is 121.0 births per 1,000 women. Women in the age bracket of 20 to 34 years have the highest fertility rate with 413.0 births per 1,000 women. Women in the age bracket of 20 to 34 years acount for 97.7% of all women with births.
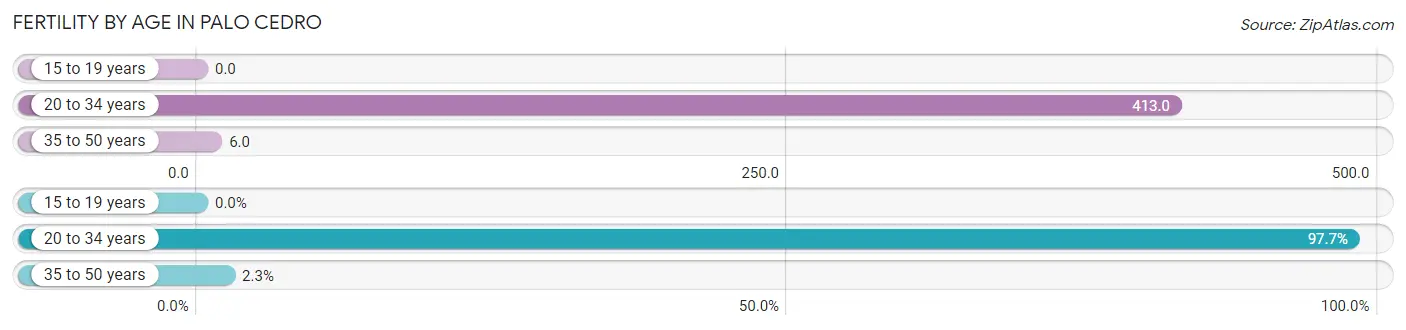
| Age Bracket | Women with Births | Births / 1,000 Women |
| 15 to 19 years | 0 (0.0%) | 0.0 |
| 20 to 34 years | 85 (97.7%) | 413.0 |
| 35 to 50 years | 2 (2.3%) | 6.0 |
| Total | 87 (100.0%) | 121.0 |
Fertility by Age by Marriage Status in Palo Cedro
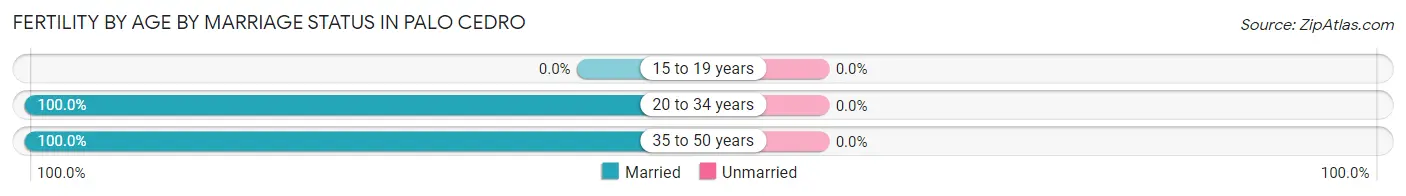
| Age Bracket | Married | Unmarried |
| 15 to 19 years | 0 (0.0%) | 0 (0.0%) |
| 20 to 34 years | 85 (100.0%) | 0 (0.0%) |
| 35 to 50 years | 2 (100.0%) | 0 (0.0%) |
| Total | 87 (100.0%) | 0 (0.0%) |
Fertility by Education in Palo Cedro
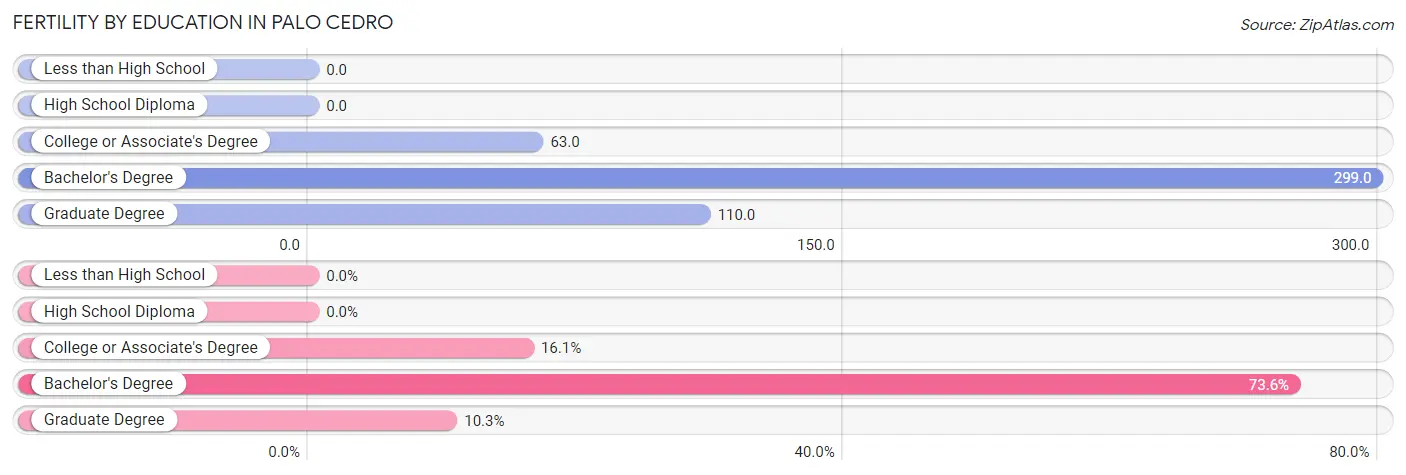
| Educational Attainment | Women with Births | Births / 1,000 Women |
| Less than High School | 0 (0.0%) | 0.0 |
| High School Diploma | 0 (0.0%) | 0.0 |
| College or Associate's Degree | 14 (16.1%) | 63.0 |
| Bachelor's Degree | 64 (73.6%) | 299.0 |
| Graduate Degree | 9 (10.3%) | 110.0 |
| Total | 87 (100.0%) | 121.0 |
Fertility by Education by Marriage Status in Palo Cedro
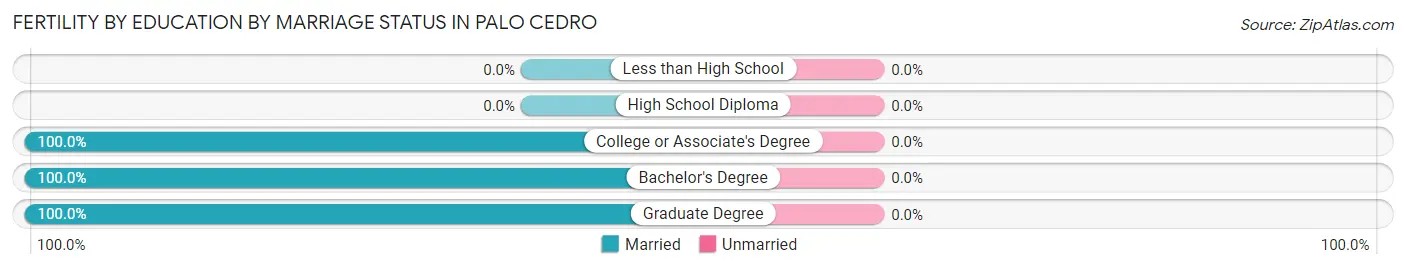
| Educational Attainment | Married | Unmarried |
| Less than High School | 0 (0.0%) | 0 (0.0%) |
| High School Diploma | 0 (0.0%) | 0 (0.0%) |
| College or Associate's Degree | 14 (100.0%) | 0 (0.0%) |
| Bachelor's Degree | 64 (100.0%) | 0 (0.0%) |
| Graduate Degree | 9 (100.0%) | 0 (0.0%) |
| Total | 87 (100.0%) | 0 (0.0%) |
Employment Characteristics in Palo Cedro
Employment by Class of Employer in Palo Cedro
Among the 1,274 employed individuals in Palo Cedro, private company employees (662 | 52.0%), self-employed (not incorporated) (164 | 12.9%), and local government employees (121 | 9.5%) make up the most common classes of employment.
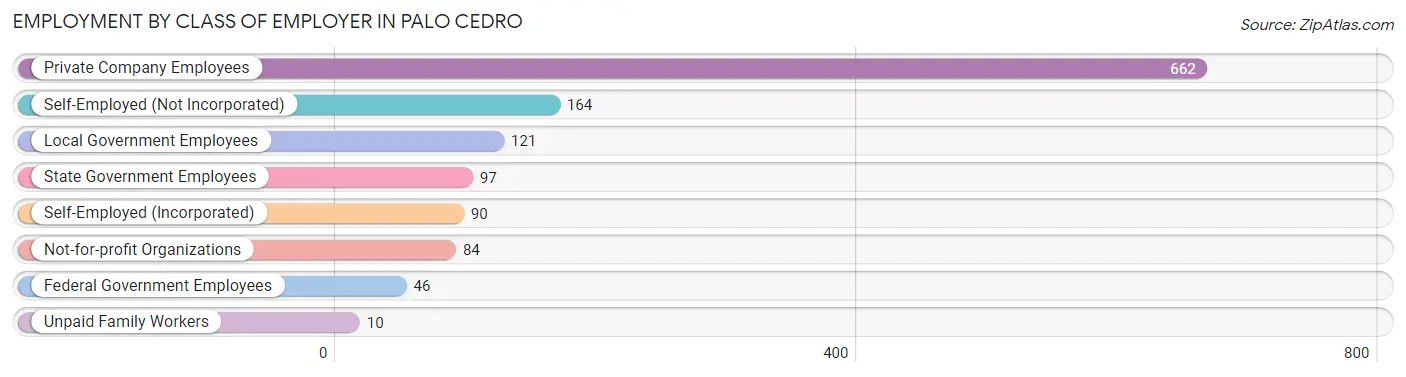
| Employer Class | # Employees | % Employees |
| Private Company Employees | 662 | 52.0% |
| Self-Employed (Incorporated) | 90 | 7.1% |
| Self-Employed (Not Incorporated) | 164 | 12.9% |
| Not-for-profit Organizations | 84 | 6.6% |
| Local Government Employees | 121 | 9.5% |
| State Government Employees | 97 | 7.6% |
| Federal Government Employees | 46 | 3.6% |
| Unpaid Family Workers | 10 | 0.8% |
| Total | 1,274 | 100.0% |
Employment Status by Age in Palo Cedro
According to the labor force statistics for Palo Cedro, out of the total population over 16 years of age (2,525), 58.6% or 1,480 individuals are in the labor force, with 5.7% or 84 of them unemployed. The age group with the highest labor force participation rate is 20 to 24 years, with 100.0% or 88 individuals in the labor force. Within the labor force, the 20 to 24 years age range has the highest percentage of unemployed individuals, with 30.7% or 27 of them being unemployed.
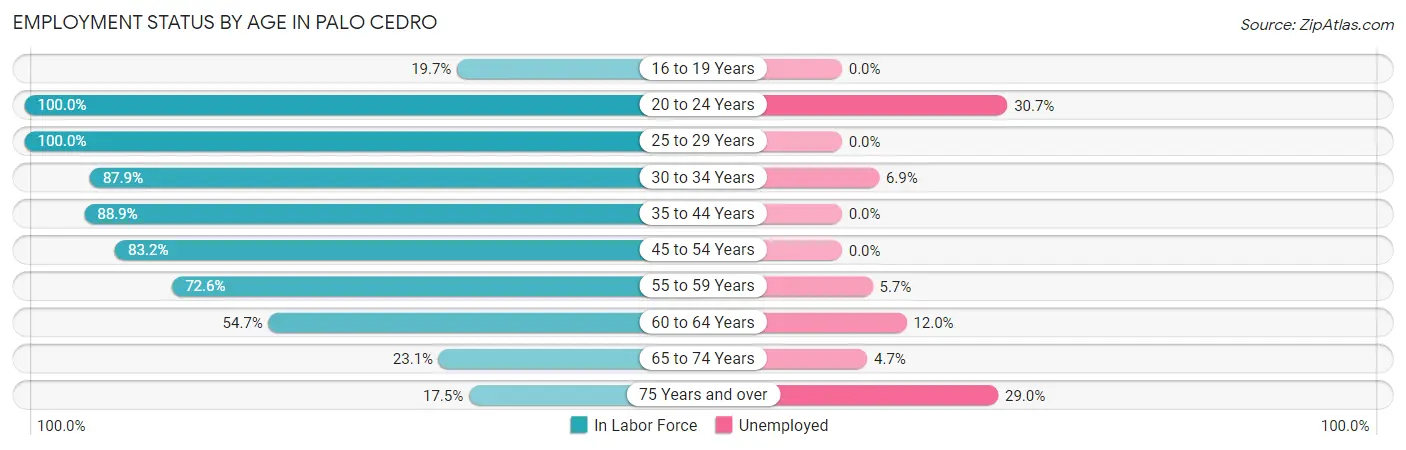
| Age Bracket | In Labor Force | Unemployed |
| 16 to 19 Years | 45 (19.7%) | 0 (0.0%) |
| 20 to 24 Years | 88 (100.0%) | 27 (30.7%) |
| 25 to 29 Years | 23 (100.0%) | 0 (0.0%) |
| 30 to 34 Years | 204 (87.9%) | 14 (6.9%) |
| 35 to 44 Years | 313 (88.9%) | 0 (0.0%) |
| 45 to 54 Years | 356 (83.2%) | 0 (0.0%) |
| 55 to 59 Years | 228 (72.6%) | 13 (5.7%) |
| 60 to 64 Years | 75 (54.7%) | 9 (12.0%) |
| 65 to 74 Years | 85 (23.1%) | 4 (4.7%) |
| 75 Years and over | 62 (17.5%) | 18 (29.0%) |
| Total | 1,480 (58.6%) | 84 (5.7%) |
Employment Status by Educational Attainment in Palo Cedro
According to labor force statistics for Palo Cedro, 80.7% of individuals (1,199) out of the total population between 25 and 64 years of age (1,486) are in the labor force, with 3.0% or 36 of them being unemployed. The group with the highest labor force participation rate are those with the educational attainment of college / associate degree, with 87.0% or 510 individuals in the labor force. Within the labor force, individuals with bachelor's degree or higher education have the highest percentage of unemployment, with 4.3% or 22 of them being unemployed.
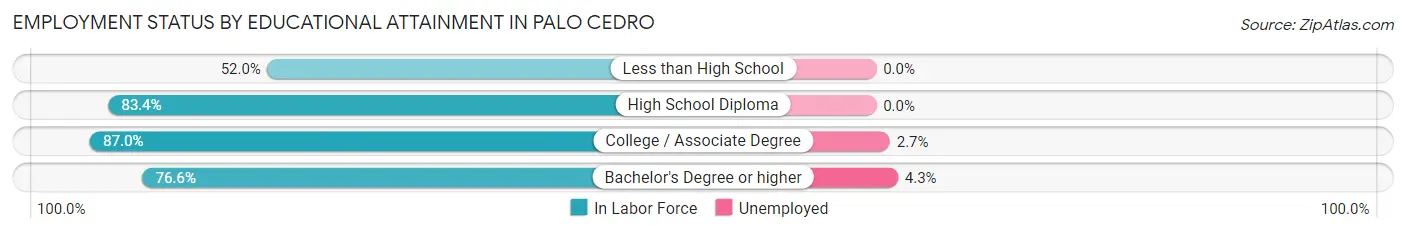
| Educational Attainment | In Labor Force | Unemployed |
| Less than High School | 26 (52.0%) | 0 (0.0%) |
| High School Diploma | 146 (83.4%) | 0 (0.0%) |
| College / Associate Degree | 510 (87.0%) | 16 (2.7%) |
| Bachelor's Degree or higher | 517 (76.6%) | 29 (4.3%) |
| Total | 1,199 (80.7%) | 45 (3.0%) |
Employment Occupations by Sex in Palo Cedro
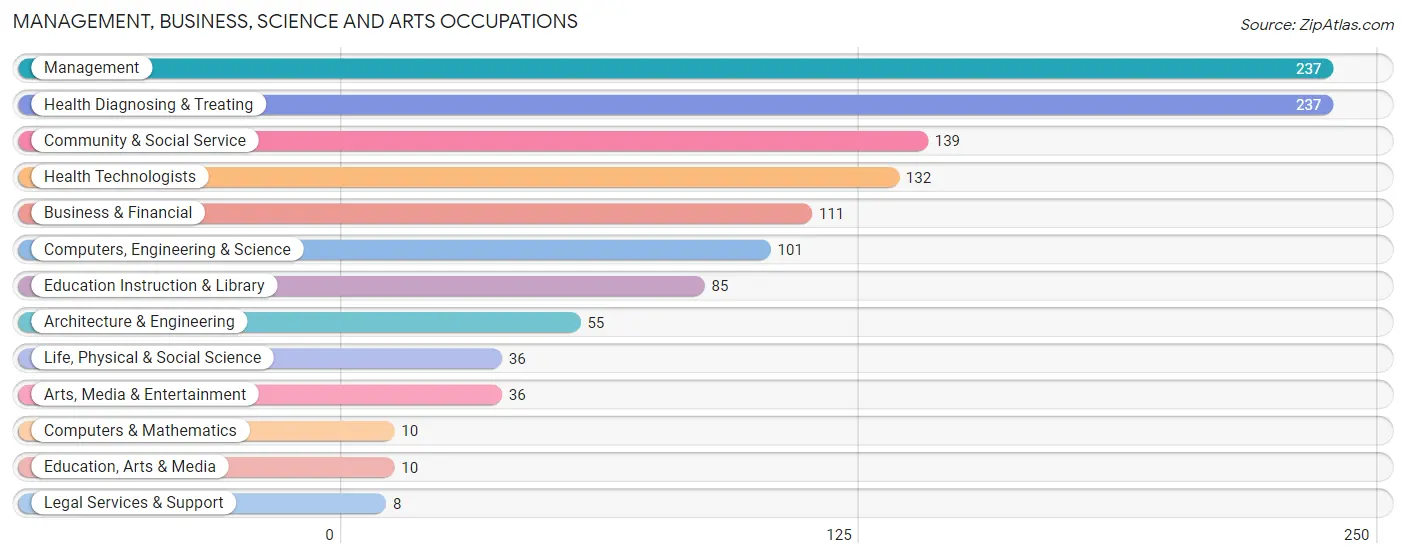
Management, Business, Science and Arts Occupations
The most common Management, Business, Science and Arts occupations in Palo Cedro are Management (237 | 17.0%), Health Diagnosing & Treating (237 | 17.0%), Community & Social Service (139 | 10.0%), Health Technologists (132 | 9.5%), and Business & Financial (111 | 8.0%).
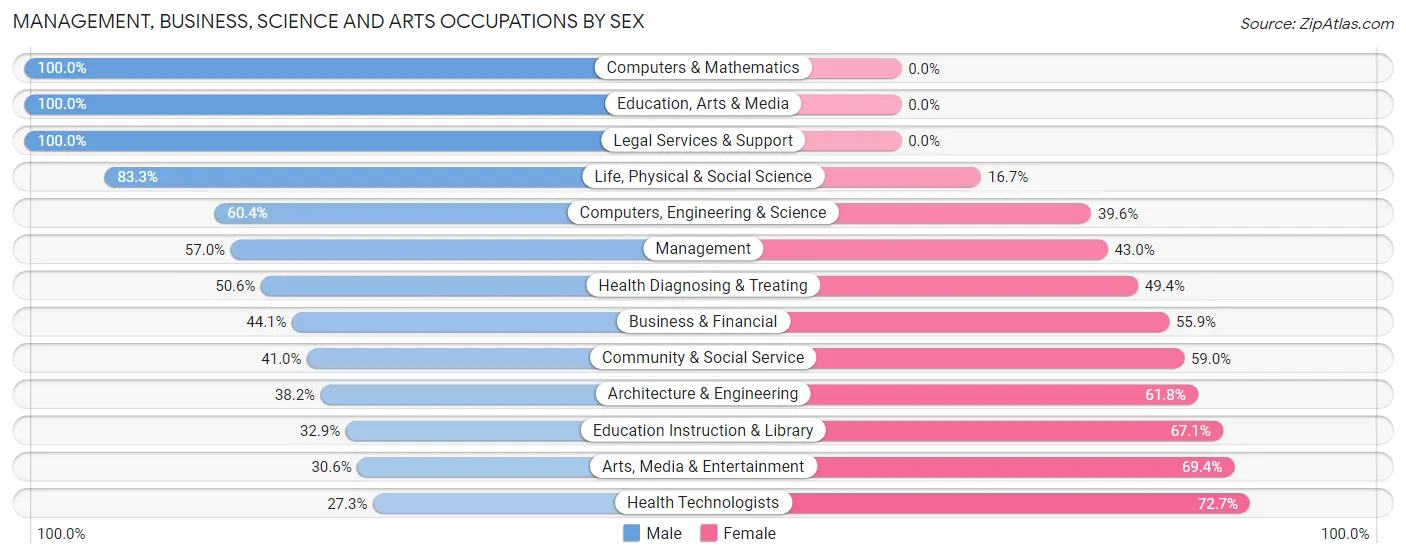
Management, Business, Science and Arts Occupations by Sex
Within the Management, Business, Science and Arts occupations in Palo Cedro, the most male-oriented occupations are Computers & Mathematics (100.0%), Education, Arts & Media (100.0%), and Legal Services & Support (100.0%), while the most female-oriented occupations are Health Technologists (72.7%), Arts, Media & Entertainment (69.4%), and Education Instruction & Library (67.1%).
| Occupation | Male | Female |
| Management | 135 (57.0%) | 102 (43.0%) |
| Business & Financial | 49 (44.1%) | 62 (55.9%) |
| Computers, Engineering & Science | 61 (60.4%) | 40 (39.6%) |
| Computers & Mathematics | 10 (100.0%) | 0 (0.0%) |
| Architecture & Engineering | 21 (38.2%) | 34 (61.8%) |
| Life, Physical & Social Science | 30 (83.3%) | 6 (16.7%) |
| Community & Social Service | 57 (41.0%) | 82 (59.0%) |
| Education, Arts & Media | 10 (100.0%) | 0 (0.0%) |
| Legal Services & Support | 8 (100.0%) | 0 (0.0%) |
| Education Instruction & Library | 28 (32.9%) | 57 (67.1%) |
| Arts, Media & Entertainment | 11 (30.6%) | 25 (69.4%) |
| Health Diagnosing & Treating | 120 (50.6%) | 117 (49.4%) |
| Health Technologists | 36 (27.3%) | 96 (72.7%) |
| Total (Category) | 422 (51.1%) | 403 (48.8%) |
| Total (Overall) | 700 (50.2%) | 694 (49.8%) |
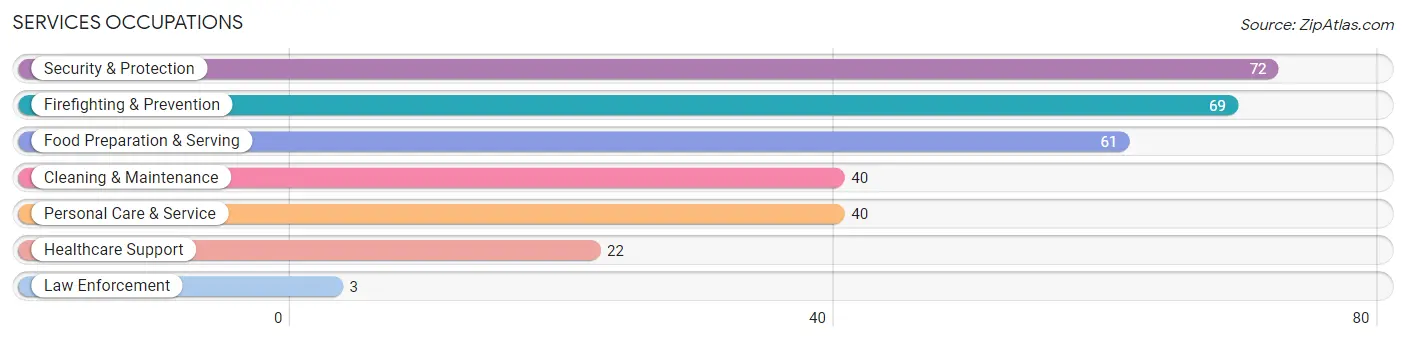
Services Occupations
The most common Services occupations in Palo Cedro are Security & Protection (72 | 5.2%), Firefighting & Prevention (69 | 5.0%), Food Preparation & Serving (61 | 4.4%), Cleaning & Maintenance (40 | 2.9%), and Personal Care & Service (40 | 2.9%).
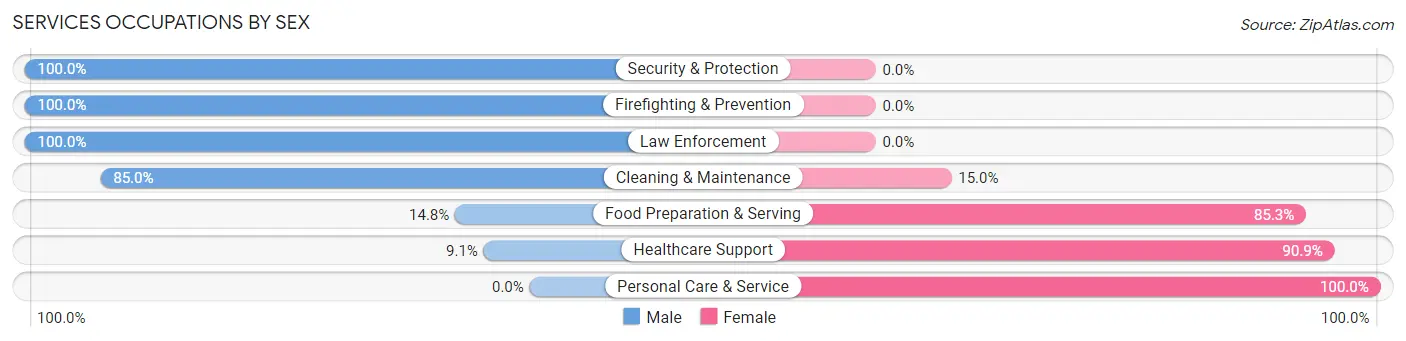
Services Occupations by Sex
Within the Services occupations in Palo Cedro, the most male-oriented occupations are Security & Protection (100.0%), Firefighting & Prevention (100.0%), and Law Enforcement (100.0%), while the most female-oriented occupations are Personal Care & Service (100.0%), Healthcare Support (90.9%), and Food Preparation & Serving (85.3%).
| Occupation | Male | Female |
| Healthcare Support | 2 (9.1%) | 20 (90.9%) |
| Security & Protection | 72 (100.0%) | 0 (0.0%) |
| Firefighting & Prevention | 69 (100.0%) | 0 (0.0%) |
| Law Enforcement | 3 (100.0%) | 0 (0.0%) |
| Food Preparation & Serving | 9 (14.7%) | 52 (85.3%) |
| Cleaning & Maintenance | 34 (85.0%) | 6 (15.0%) |
| Personal Care & Service | 0 (0.0%) | 40 (100.0%) |
| Total (Category) | 117 (49.8%) | 118 (50.2%) |
| Total (Overall) | 700 (50.2%) | 694 (49.8%) |
Sales and Office Occupations
The most common Sales and Office occupations in Palo Cedro are Office & Administration (127 | 9.1%), and Sales & Related (81 | 5.8%).

Sales and Office Occupations by Sex

| Occupation | Male | Female |
| Sales & Related | 28 (34.6%) | 53 (65.4%) |
| Office & Administration | 24 (18.9%) | 103 (81.1%) |
| Total (Category) | 52 (25.0%) | 156 (75.0%) |
| Total (Overall) | 700 (50.2%) | 694 (49.8%) |
Natural Resources, Construction and Maintenance Occupations
The most common Natural Resources, Construction and Maintenance occupations in Palo Cedro are Construction & Extraction (39 | 2.8%), Farming, Fishing & Forestry (4 | 0.3%), and Installation, Maintenance & Repair (3 | 0.2%).
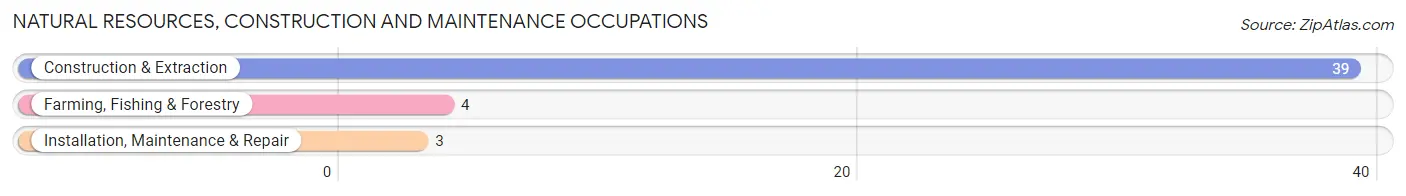
Natural Resources, Construction and Maintenance Occupations by Sex

| Occupation | Male | Female |
| Farming, Fishing & Forestry | 4 (100.0%) | 0 (0.0%) |
| Construction & Extraction | 39 (100.0%) | 0 (0.0%) |
| Installation, Maintenance & Repair | 3 (100.0%) | 0 (0.0%) |
| Total (Category) | 46 (100.0%) | 0 (0.0%) |
| Total (Overall) | 700 (50.2%) | 694 (49.8%) |
Production, Transportation and Moving Occupations
The most common Production, Transportation and Moving occupations in Palo Cedro are Transportation (42 | 3.0%), Material Moving (23 | 1.7%), and Production (15 | 1.1%).
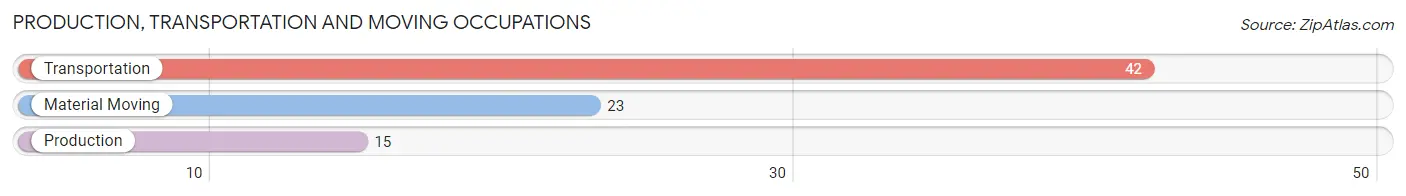
Production, Transportation and Moving Occupations by Sex
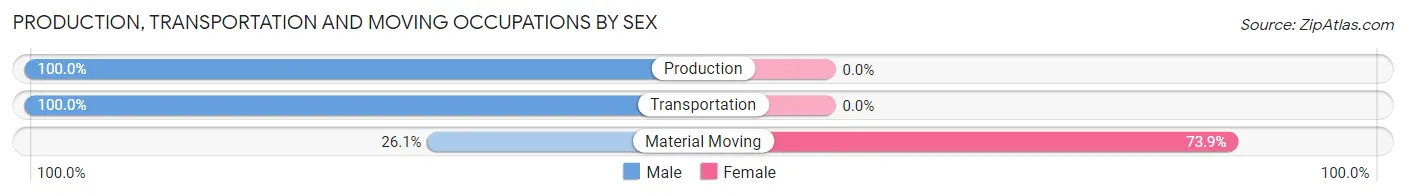
| Occupation | Male | Female |
| Production | 15 (100.0%) | 0 (0.0%) |
| Transportation | 42 (100.0%) | 0 (0.0%) |
| Material Moving | 6 (26.1%) | 17 (73.9%) |
| Total (Category) | 63 (78.7%) | 17 (21.2%) |
| Total (Overall) | 700 (50.2%) | 694 (49.8%) |
Employment Industries by Sex in Palo Cedro
Employment Industries in Palo Cedro
The major employment industries in Palo Cedro include Health Care & Social Assistance (278 | 19.9%), Public Administration (179 | 12.8%), Retail Trade (140 | 10.0%), Educational Services (137 | 9.8%), and Professional & Scientific (113 | 8.1%).
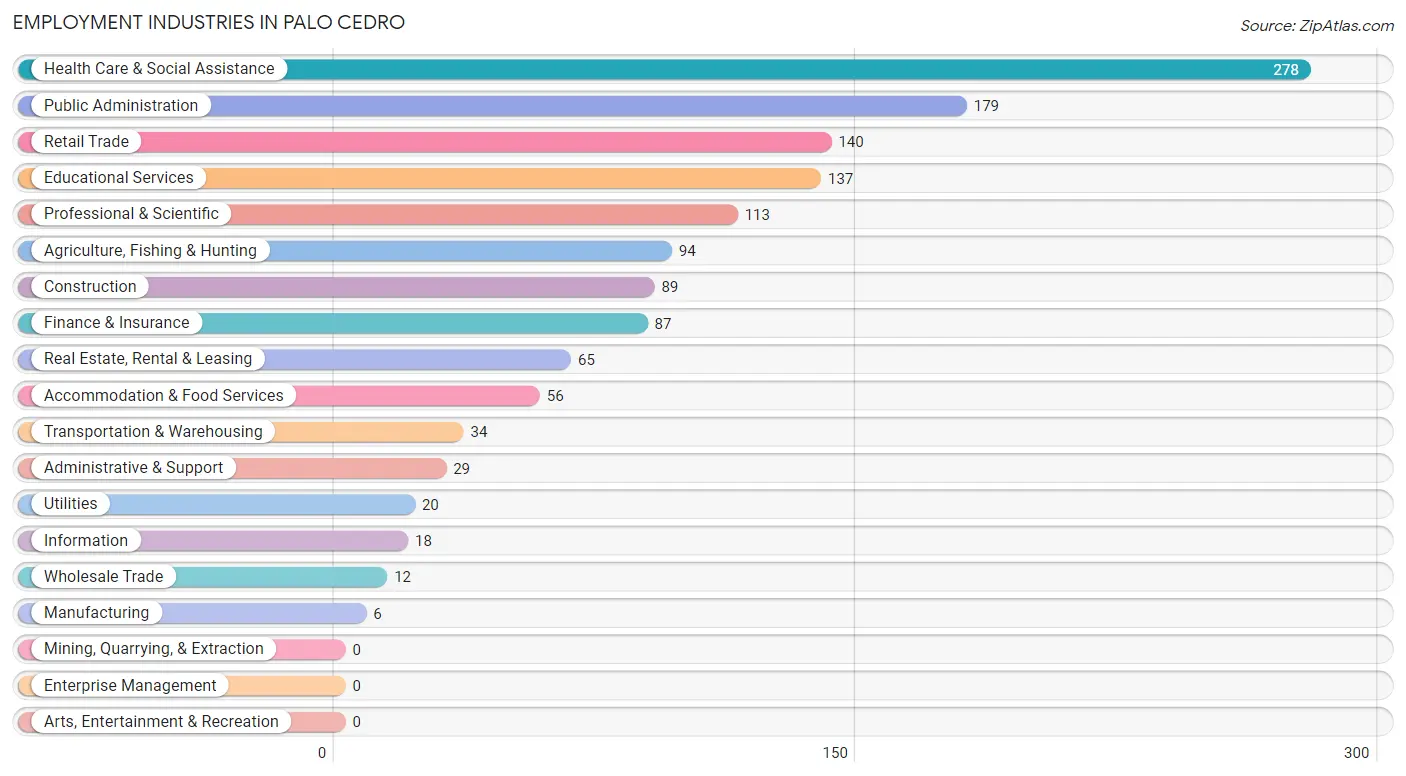
Employment Industries by Sex in Palo Cedro
The Palo Cedro industries that see more men than women are Utilities (100.0%), Construction (96.6%), and Administrative & Support (89.7%), whereas the industries that tend to have a higher number of women are Manufacturing (100.0%), Wholesale Trade (100.0%), and Accommodation & Food Services (91.1%).
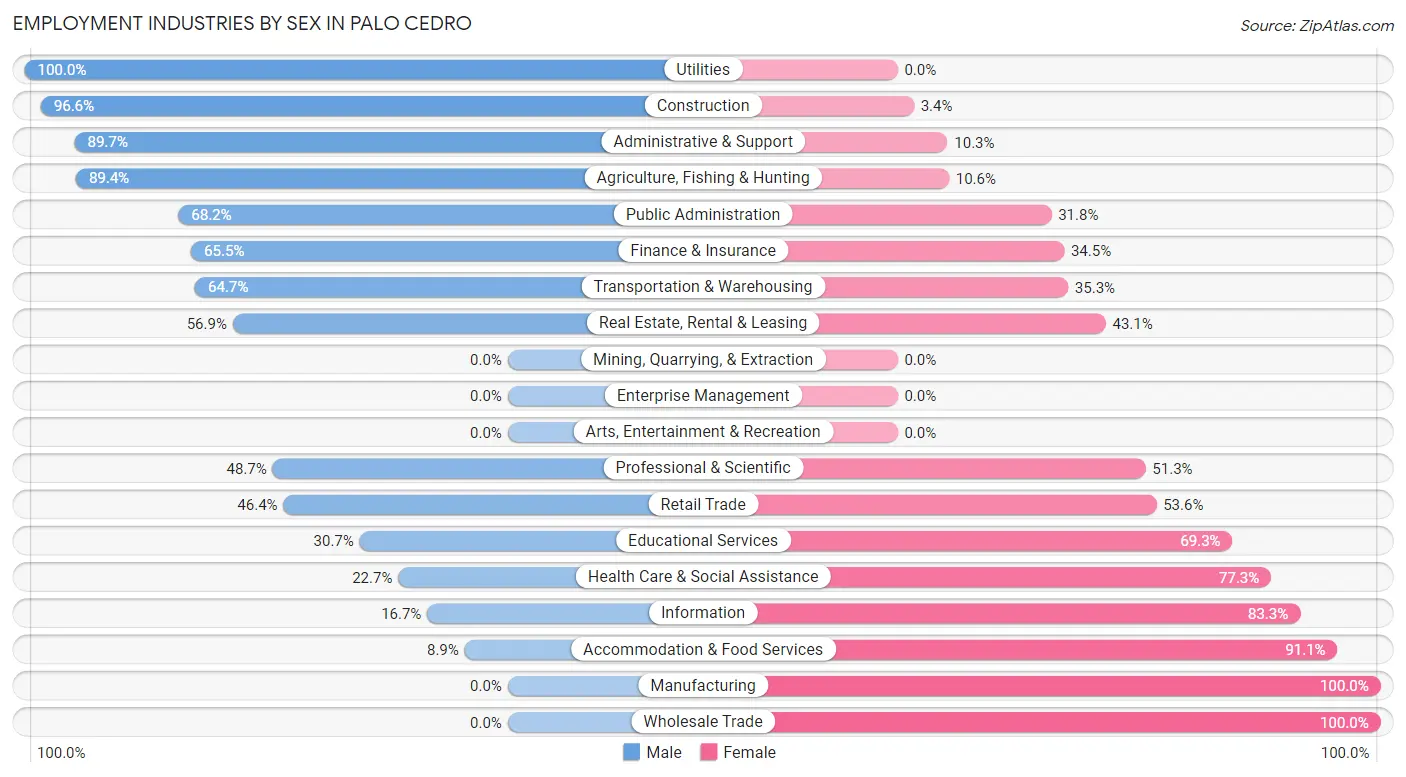
| Industry | Male | Female |
| Agriculture, Fishing & Hunting | 84 (89.4%) | 10 (10.6%) |
| Mining, Quarrying, & Extraction | 0 (0.0%) | 0 (0.0%) |
| Construction | 86 (96.6%) | 3 (3.4%) |
| Manufacturing | 0 (0.0%) | 6 (100.0%) |
| Wholesale Trade | 0 (0.0%) | 12 (100.0%) |
| Retail Trade | 65 (46.4%) | 75 (53.6%) |
| Transportation & Warehousing | 22 (64.7%) | 12 (35.3%) |
| Utilities | 20 (100.0%) | 0 (0.0%) |
| Information | 3 (16.7%) | 15 (83.3%) |
| Finance & Insurance | 57 (65.5%) | 30 (34.5%) |
| Real Estate, Rental & Leasing | 37 (56.9%) | 28 (43.1%) |
| Professional & Scientific | 55 (48.7%) | 58 (51.3%) |
| Enterprise Management | 0 (0.0%) | 0 (0.0%) |
| Administrative & Support | 26 (89.7%) | 3 (10.3%) |
| Educational Services | 42 (30.7%) | 95 (69.3%) |
| Health Care & Social Assistance | 63 (22.7%) | 215 (77.3%) |
| Arts, Entertainment & Recreation | 0 (0.0%) | 0 (0.0%) |
| Accommodation & Food Services | 5 (8.9%) | 51 (91.1%) |
| Public Administration | 122 (68.2%) | 57 (31.8%) |
| Total | 700 (50.2%) | 694 (49.8%) |
Education in Palo Cedro
School Enrollment in Palo Cedro
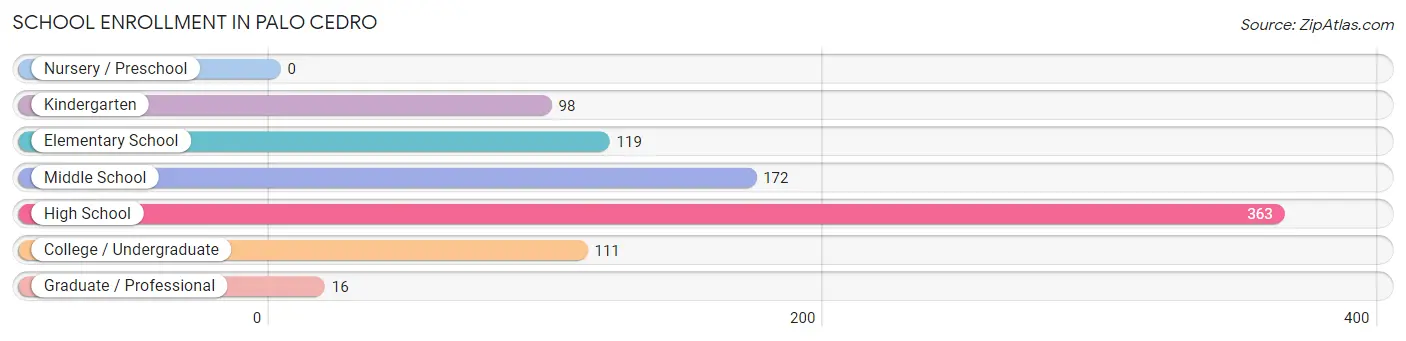
The most common levels of schooling among the 879 students in Palo Cedro are high school (363 | 41.3%), middle school (172 | 19.6%), and elementary school (119 | 13.5%).
| School Level | # Students | % Students |
| Nursery / Preschool | 0 | 0.0% |
| Kindergarten | 98 | 11.2% |
| Elementary School | 119 | 13.5% |
| Middle School | 172 | 19.6% |
| High School | 363 | 41.3% |
| College / Undergraduate | 111 | 12.6% |
| Graduate / Professional | 16 | 1.8% |
| Total | 879 | 100.0% |
School Enrollment by Age by Funding Source in Palo Cedro
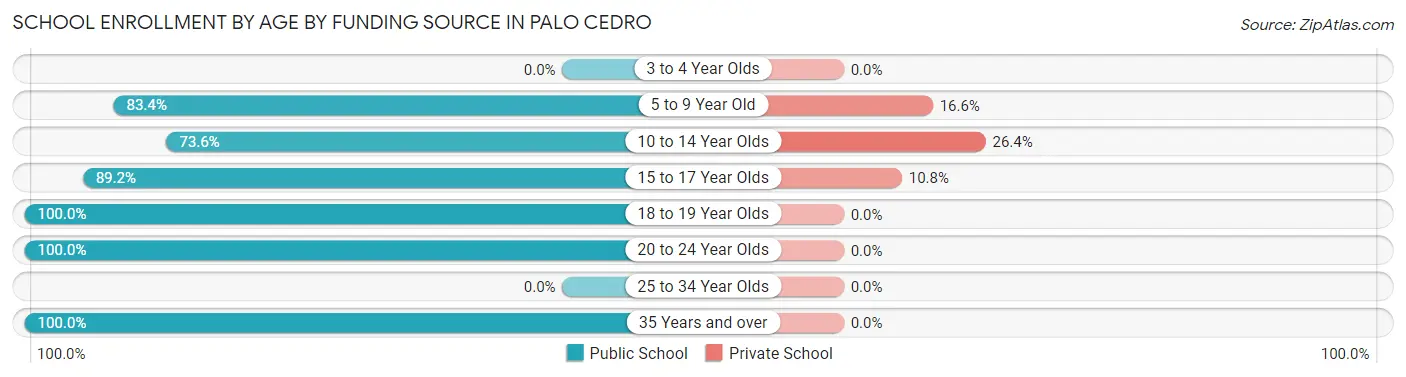
Out of a total of 879 students who are enrolled in schools in Palo Cedro, 138 (15.7%) attend a private institution, while the remaining 741 (84.3%) are enrolled in public schools. The age group of 10 to 14 year olds has the highest likelihood of being enrolled in private schools, with 79 (26.4% in the age bracket) enrolled. Conversely, the age group of 18 to 19 year olds has the lowest likelihood of being enrolled in a private school, with 19 (100.0% in the age bracket) attending a public institution.
| Age Bracket | Public School | Private School |
| 3 to 4 Year Olds | 0 (0.0%) | 0 (0.0%) |
| 5 to 9 Year Old | 166 (83.4%) | 33 (16.6%) |
| 10 to 14 Year Olds | 220 (73.6%) | 79 (26.4%) |
| 15 to 17 Year Olds | 214 (89.2%) | 26 (10.8%) |
| 18 to 19 Year Olds | 19 (100.0%) | 0 (0.0%) |
| 20 to 24 Year Olds | 41 (100.0%) | 0 (0.0%) |
| 25 to 34 Year Olds | 0 (0.0%) | 0 (0.0%) |
| 35 Years and over | 81 (100.0%) | 0 (0.0%) |
| Total | 741 (84.3%) | 138 (15.7%) |
Educational Attainment by Field of Study in Palo Cedro
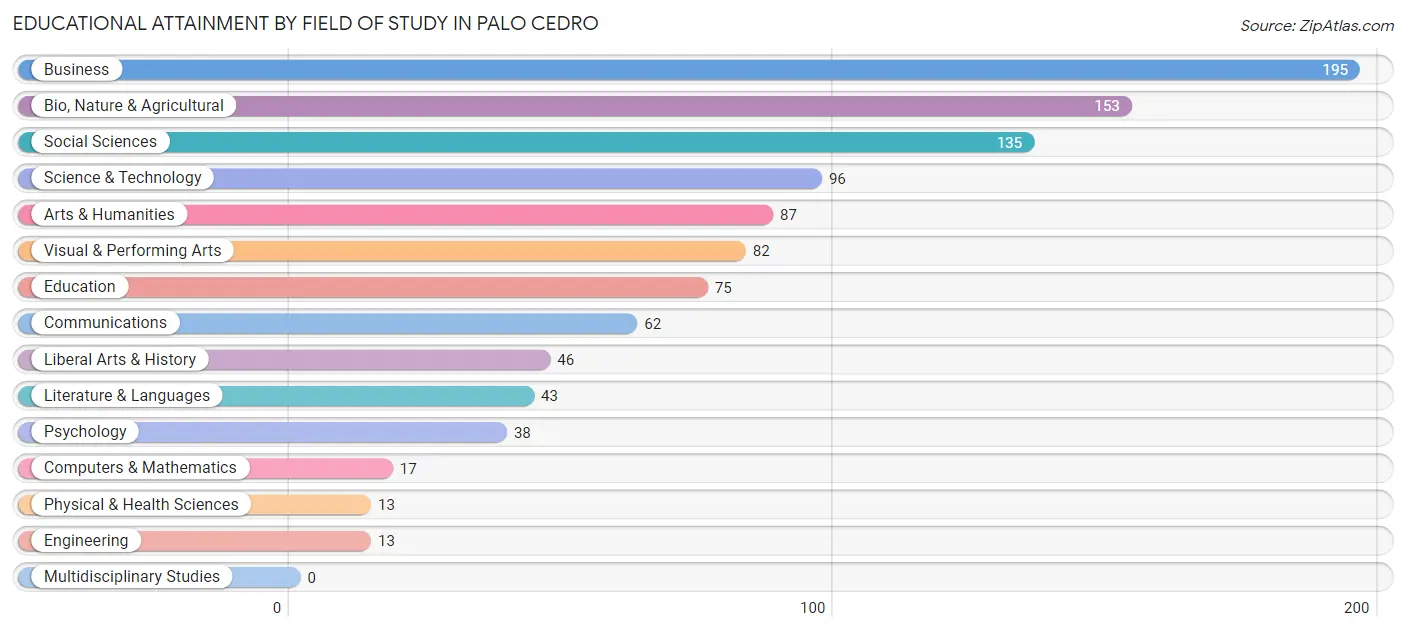
Business (195 | 18.5%), bio, nature & agricultural (153 | 14.5%), social sciences (135 | 12.8%), science & technology (96 | 9.1%), and arts & humanities (87 | 8.3%) are the most common fields of study among 1,055 individuals in Palo Cedro who have obtained a bachelor's degree or higher.
| Field of Study | # Graduates | % Graduates |
| Computers & Mathematics | 17 | 1.6% |
| Bio, Nature & Agricultural | 153 | 14.5% |
| Physical & Health Sciences | 13 | 1.2% |
| Psychology | 38 | 3.6% |
| Social Sciences | 135 | 12.8% |
| Engineering | 13 | 1.2% |
| Multidisciplinary Studies | 0 | 0.0% |
| Science & Technology | 96 | 9.1% |
| Business | 195 | 18.5% |
| Education | 75 | 7.1% |
| Literature & Languages | 43 | 4.1% |
| Liberal Arts & History | 46 | 4.4% |
| Visual & Performing Arts | 82 | 7.8% |
| Communications | 62 | 5.9% |
| Arts & Humanities | 87 | 8.3% |
| Total | 1,055 | 100.0% |
Transportation & Commute in Palo Cedro
Vehicle Availability by Sex in Palo Cedro
The most prevalent vehicle ownership categories in Palo Cedro are males with 3 vehicles (267, accounting for 41.1%) and females with 3 vehicles (240, making up 43.0%).
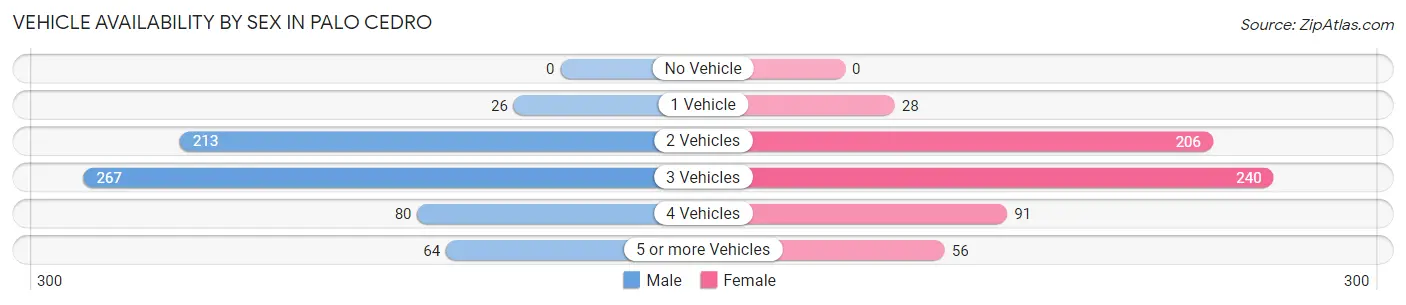
| Vehicles Available | Male | Female |
| No Vehicle | 0 (0.0%) | 0 (0.0%) |
| 1 Vehicle | 26 (4.0%) | 28 (4.5%) |
| 2 Vehicles | 213 (32.8%) | 206 (33.2%) |
| 3 Vehicles | 267 (41.1%) | 240 (38.7%) |
| 4 Vehicles | 80 (12.3%) | 91 (14.6%) |
| 5 or more Vehicles | 64 (9.9%) | 56 (9.0%) |
| Total | 650 (100.0%) | 621 (100.0%) |
Commute Time in Palo Cedro
The most frequently occuring commute durations in Palo Cedro are 20 to 24 minutes (286 commuters, 26.4%), 10 to 14 minutes (233 commuters, 21.5%), and 15 to 19 minutes (146 commuters, 13.5%).
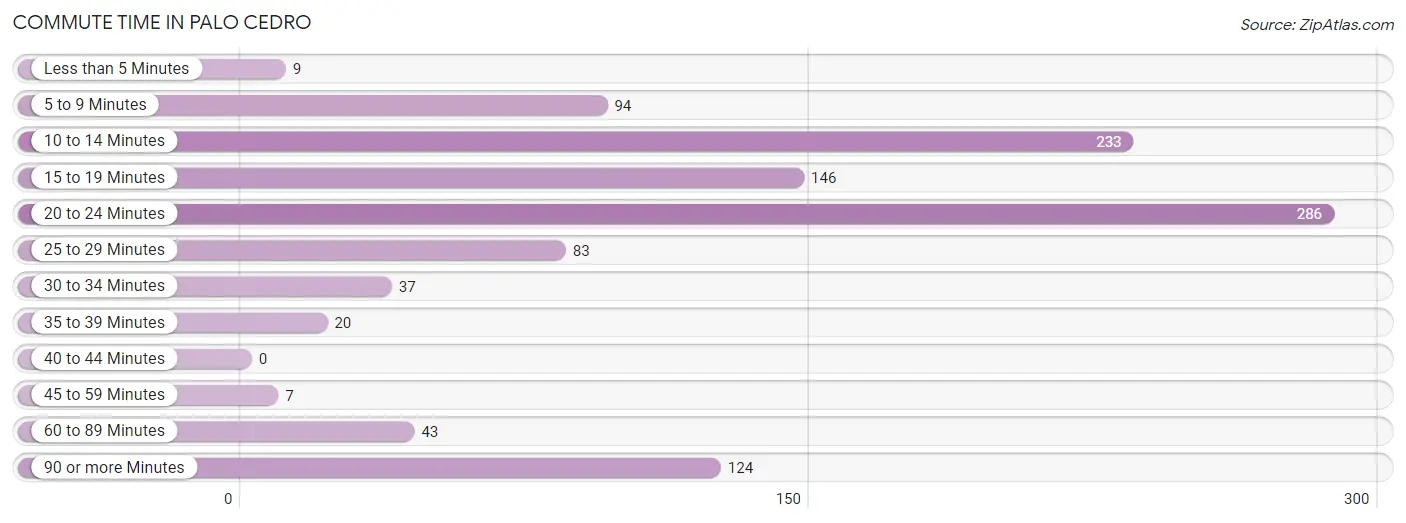
| Commute Time | # Commuters | % Commuters |
| Less than 5 Minutes | 9 | 0.8% |
| 5 to 9 Minutes | 94 | 8.7% |
| 10 to 14 Minutes | 233 | 21.5% |
| 15 to 19 Minutes | 146 | 13.5% |
| 20 to 24 Minutes | 286 | 26.4% |
| 25 to 29 Minutes | 83 | 7.7% |
| 30 to 34 Minutes | 37 | 3.4% |
| 35 to 39 Minutes | 20 | 1.8% |
| 40 to 44 Minutes | 0 | 0.0% |
| 45 to 59 Minutes | 7 | 0.6% |
| 60 to 89 Minutes | 43 | 4.0% |
| 90 or more Minutes | 124 | 11.5% |
Commute Time by Sex in Palo Cedro
The most common commute times in Palo Cedro are 10 to 14 minutes (160 commuters, 26.2%) for males and 20 to 24 minutes (146 commuters, 30.9%) for females.
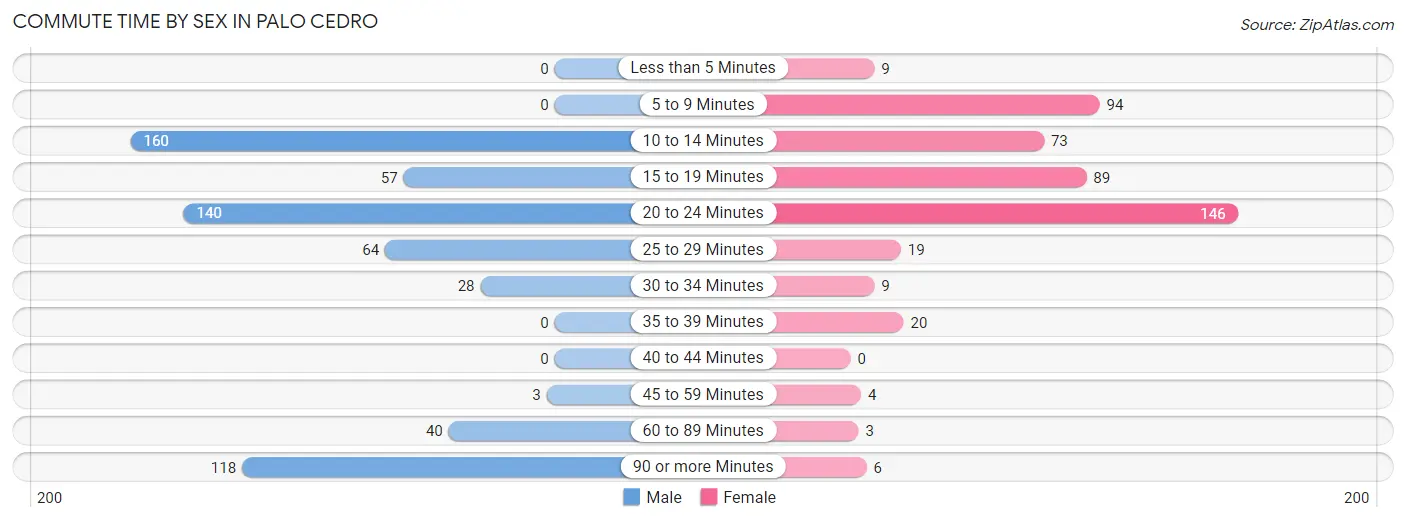
| Commute Time | Male | Female |
| Less than 5 Minutes | 0 (0.0%) | 9 (1.9%) |
| 5 to 9 Minutes | 0 (0.0%) | 94 (19.9%) |
| 10 to 14 Minutes | 160 (26.2%) | 73 (15.5%) |
| 15 to 19 Minutes | 57 (9.3%) | 89 (18.9%) |
| 20 to 24 Minutes | 140 (23.0%) | 146 (30.9%) |
| 25 to 29 Minutes | 64 (10.5%) | 19 (4.0%) |
| 30 to 34 Minutes | 28 (4.6%) | 9 (1.9%) |
| 35 to 39 Minutes | 0 (0.0%) | 20 (4.2%) |
| 40 to 44 Minutes | 0 (0.0%) | 0 (0.0%) |
| 45 to 59 Minutes | 3 (0.5%) | 4 (0.9%) |
| 60 to 89 Minutes | 40 (6.6%) | 3 (0.6%) |
| 90 or more Minutes | 118 (19.3%) | 6 (1.3%) |
Time of Departure to Work by Sex in Palo Cedro
The most frequent times of departure to work in Palo Cedro are 7:30 AM to 7:59 AM (98, 16.1%) for males and 7:30 AM to 7:59 AM (145, 30.7%) for females.
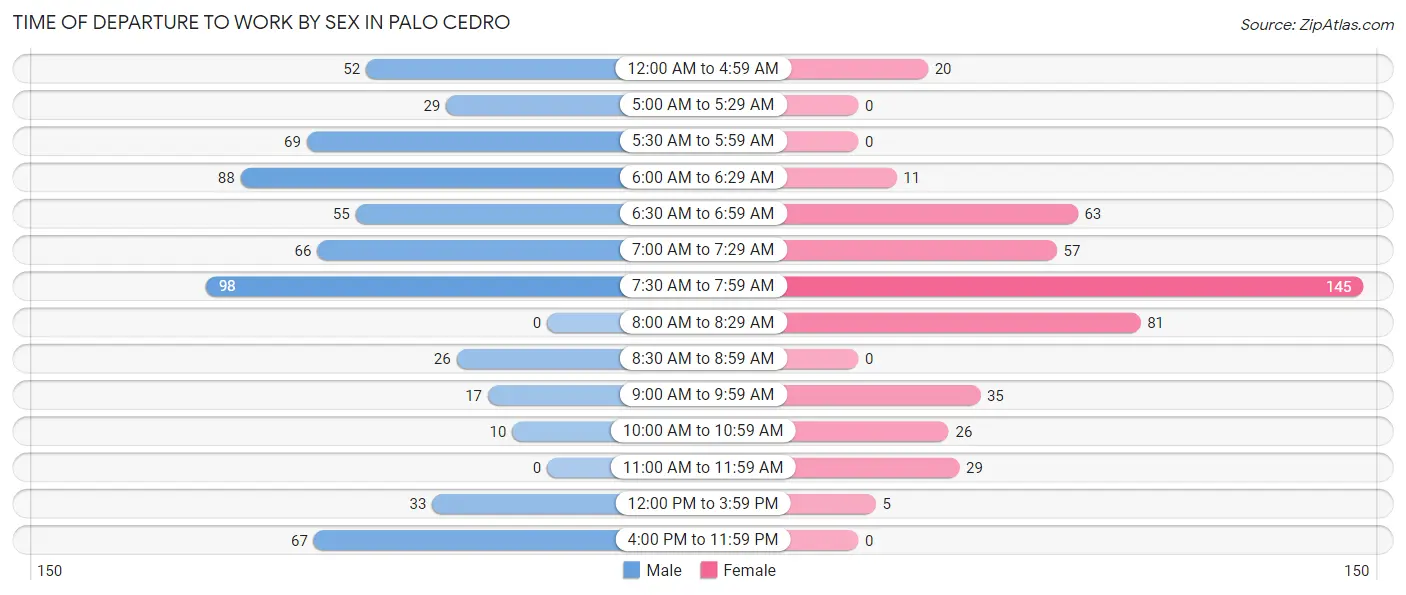
| Time of Departure | Male | Female |
| 12:00 AM to 4:59 AM | 52 (8.5%) | 20 (4.2%) |
| 5:00 AM to 5:29 AM | 29 (4.8%) | 0 (0.0%) |
| 5:30 AM to 5:59 AM | 69 (11.3%) | 0 (0.0%) |
| 6:00 AM to 6:29 AM | 88 (14.4%) | 11 (2.3%) |
| 6:30 AM to 6:59 AM | 55 (9.0%) | 63 (13.4%) |
| 7:00 AM to 7:29 AM | 66 (10.8%) | 57 (12.1%) |
| 7:30 AM to 7:59 AM | 98 (16.1%) | 145 (30.7%) |
| 8:00 AM to 8:29 AM | 0 (0.0%) | 81 (17.2%) |
| 8:30 AM to 8:59 AM | 26 (4.3%) | 0 (0.0%) |
| 9:00 AM to 9:59 AM | 17 (2.8%) | 35 (7.4%) |
| 10:00 AM to 10:59 AM | 10 (1.6%) | 26 (5.5%) |
| 11:00 AM to 11:59 AM | 0 (0.0%) | 29 (6.1%) |
| 12:00 PM to 3:59 PM | 33 (5.4%) | 5 (1.1%) |
| 4:00 PM to 11:59 PM | 67 (11.0%) | 0 (0.0%) |
| Total | 610 (100.0%) | 472 (100.0%) |
Housing Occupancy in Palo Cedro
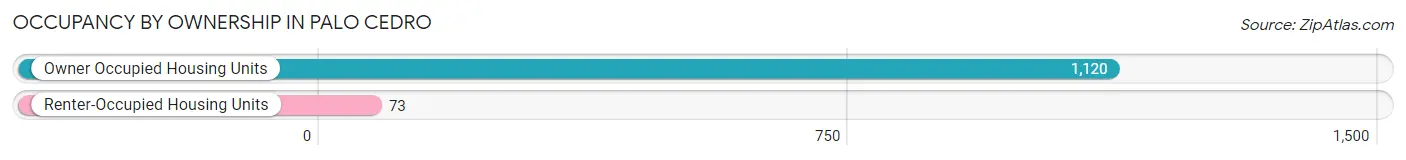
Occupancy by Ownership in Palo Cedro
Of the total 1,193 dwellings in Palo Cedro, owner-occupied units account for 1,120 (93.9%), while renter-occupied units make up 73 (6.1%).
| Occupancy | # Housing Units | % Housing Units |
| Owner Occupied Housing Units | 1,120 | 93.9% |
| Renter-Occupied Housing Units | 73 | 6.1% |
| Total Occupied Housing Units | 1,193 | 100.0% |
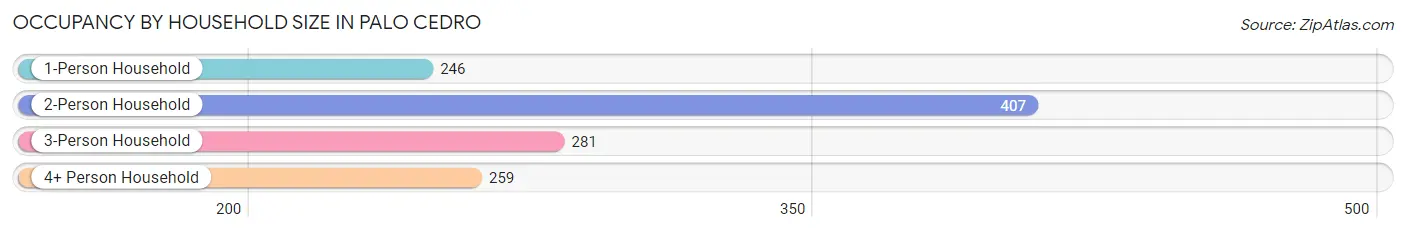
Occupancy by Household Size in Palo Cedro
| Household Size | # Housing Units | % Housing Units |
| 1-Person Household | 246 | 20.6% |
| 2-Person Household | 407 | 34.1% |
| 3-Person Household | 281 | 23.5% |
| 4+ Person Household | 259 | 21.7% |
| Total Housing Units | 1,193 | 100.0% |
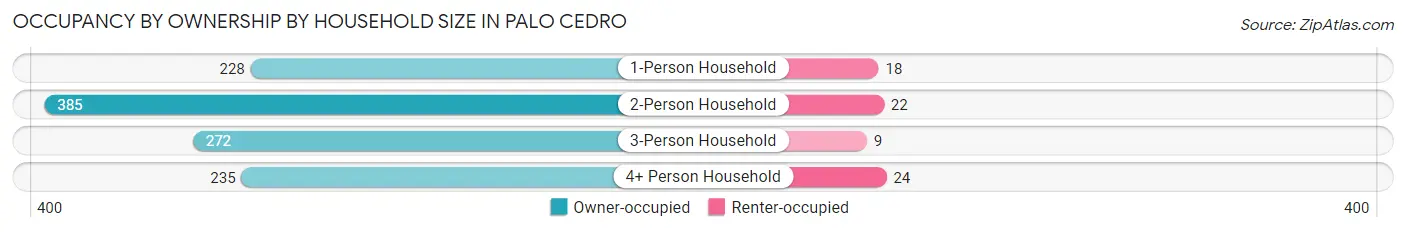
Occupancy by Ownership by Household Size in Palo Cedro
| Household Size | Owner-occupied | Renter-occupied |
| 1-Person Household | 228 (92.7%) | 18 (7.3%) |
| 2-Person Household | 385 (94.6%) | 22 (5.4%) |
| 3-Person Household | 272 (96.8%) | 9 (3.2%) |
| 4+ Person Household | 235 (90.7%) | 24 (9.3%) |
| Total Housing Units | 1,120 (93.9%) | 73 (6.1%) |
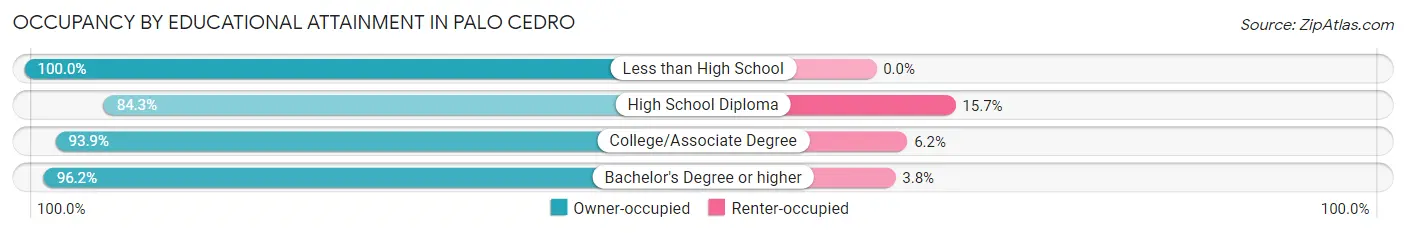
Occupancy by Educational Attainment in Palo Cedro
| Household Size | Owner-occupied | Renter-occupied |
| Less than High School | 34 (100.0%) | 0 (0.0%) |
| High School Diploma | 118 (84.3%) | 22 (15.7%) |
| College/Associate Degree | 488 (93.9%) | 32 (6.1%) |
| Bachelor's Degree or higher | 480 (96.2%) | 19 (3.8%) |
Occupancy by Age of Householder in Palo Cedro
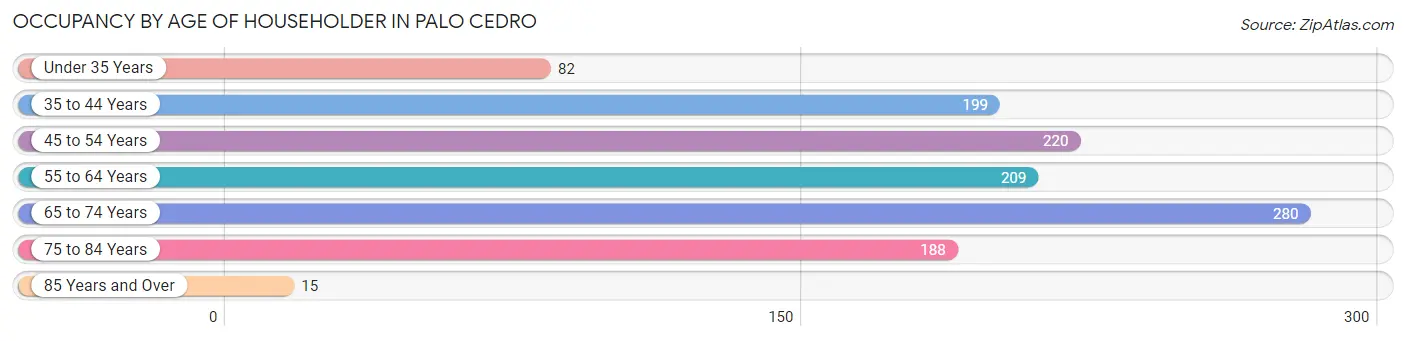
| Age Bracket | # Households | % Households |
| Under 35 Years | 82 | 6.9% |
| 35 to 44 Years | 199 | 16.7% |
| 45 to 54 Years | 220 | 18.4% |
| 55 to 64 Years | 209 | 17.5% |
| 65 to 74 Years | 280 | 23.5% |
| 75 to 84 Years | 188 | 15.8% |
| 85 Years and Over | 15 | 1.3% |
| Total | 1,193 | 100.0% |
Housing Finances in Palo Cedro
Median Income by Occupancy in Palo Cedro
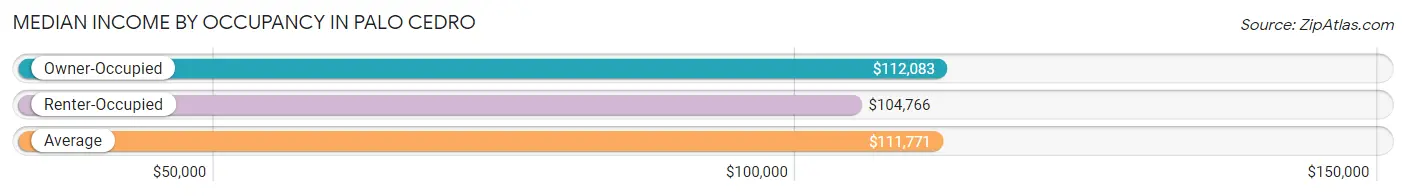
| Occupancy Type | # Households | Median Income |
| Owner-Occupied | 1,120 (93.9%) | $112,083 |
| Renter-Occupied | 73 (6.1%) | $104,766 |
| Average | 1,193 (100.0%) | $111,771 |
Occupancy by Householder Income Bracket in Palo Cedro
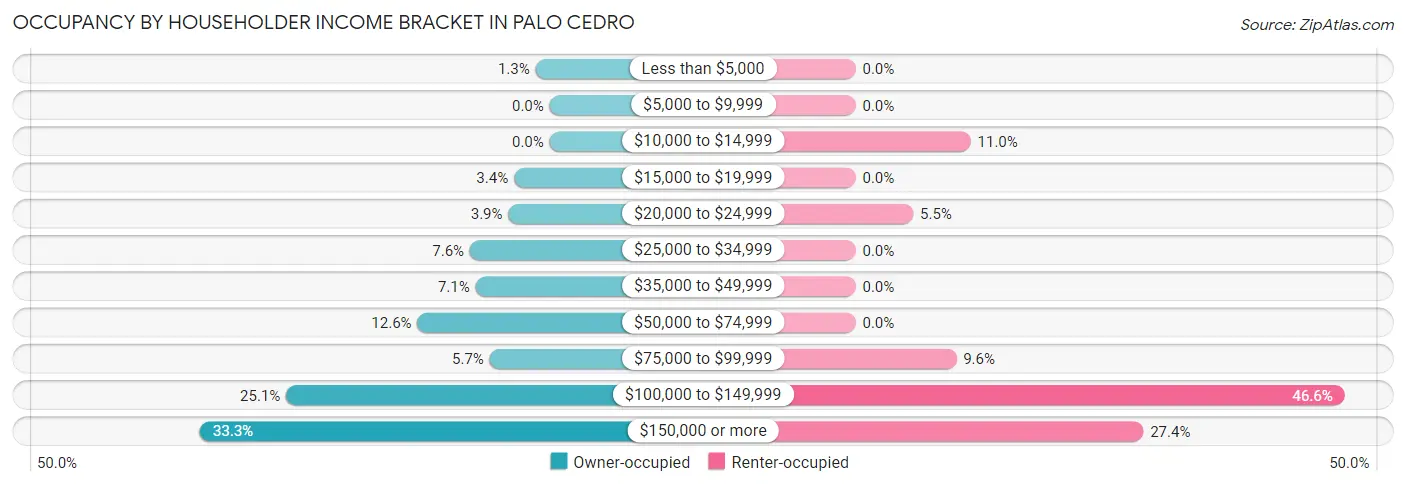
| Income Bracket | Owner-occupied | Renter-occupied |
| Less than $5,000 | 15 (1.3%) | 0 (0.0%) |
| $5,000 to $9,999 | 0 (0.0%) | 0 (0.0%) |
| $10,000 to $14,999 | 0 (0.0%) | 8 (11.0%) |
| $15,000 to $19,999 | 38 (3.4%) | 0 (0.0%) |
| $20,000 to $24,999 | 44 (3.9%) | 4 (5.5%) |
| $25,000 to $34,999 | 85 (7.6%) | 0 (0.0%) |
| $35,000 to $49,999 | 79 (7.0%) | 0 (0.0%) |
| $50,000 to $74,999 | 141 (12.6%) | 0 (0.0%) |
| $75,000 to $99,999 | 64 (5.7%) | 7 (9.6%) |
| $100,000 to $149,999 | 281 (25.1%) | 34 (46.6%) |
| $150,000 or more | 373 (33.3%) | 20 (27.4%) |
| Total | 1,120 (100.0%) | 73 (100.0%) |
Monthly Housing Cost Tiers in Palo Cedro
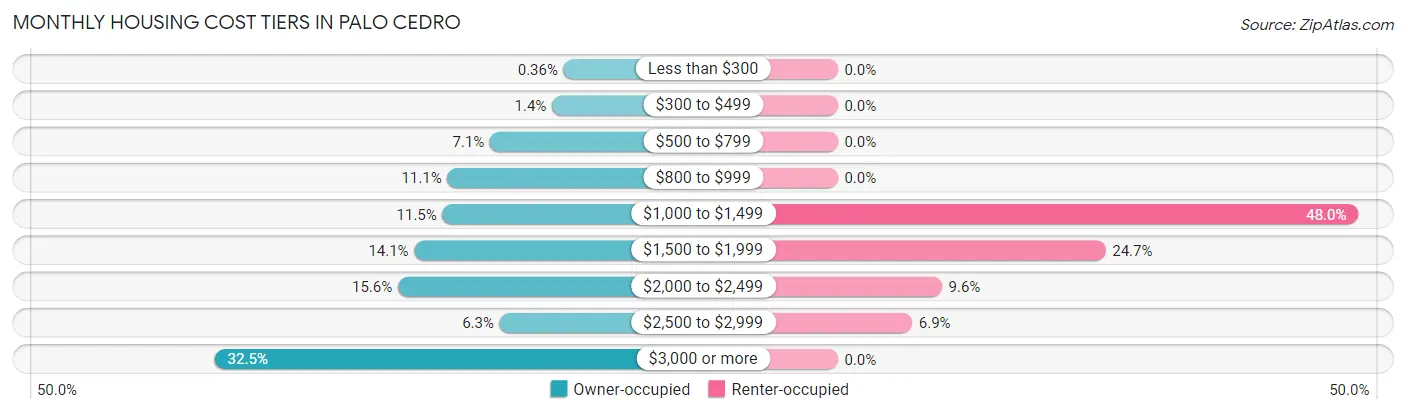
| Monthly Cost | Owner-occupied | Renter-occupied |
| Less than $300 | 4 (0.4%) | 0 (0.0%) |
| $300 to $499 | 16 (1.4%) | 0 (0.0%) |
| $500 to $799 | 80 (7.1%) | 0 (0.0%) |
| $800 to $999 | 124 (11.1%) | 0 (0.0%) |
| $1,000 to $1,499 | 129 (11.5%) | 35 (47.9%) |
| $1,500 to $1,999 | 158 (14.1%) | 18 (24.7%) |
| $2,000 to $2,499 | 175 (15.6%) | 7 (9.6%) |
| $2,500 to $2,999 | 70 (6.2%) | 5 (6.9%) |
| $3,000 or more | 364 (32.5%) | 0 (0.0%) |
| Total | 1,120 (100.0%) | 73 (100.0%) |
Physical Housing Characteristics in Palo Cedro
Housing Structures in Palo Cedro
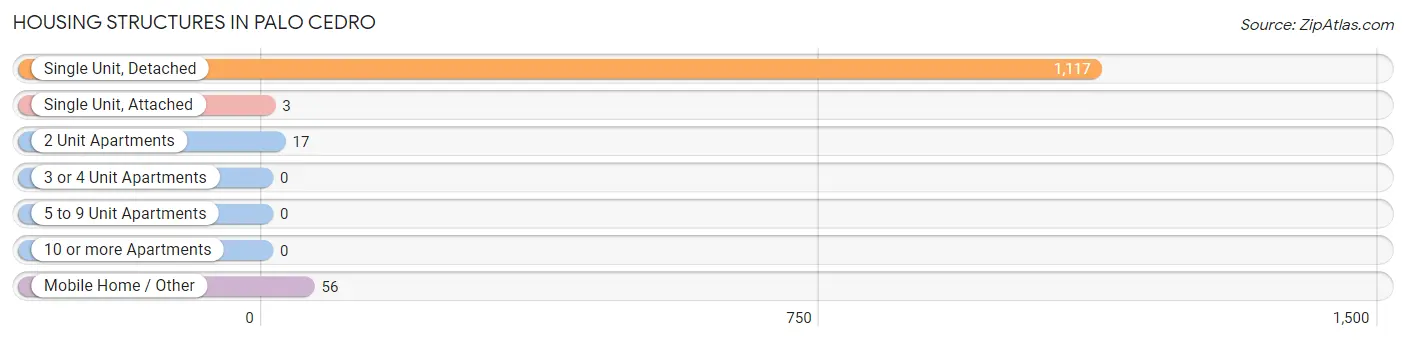
| Structure Type | # Housing Units | % Housing Units |
| Single Unit, Detached | 1,117 | 93.6% |
| Single Unit, Attached | 3 | 0.3% |
| 2 Unit Apartments | 17 | 1.4% |
| 3 or 4 Unit Apartments | 0 | 0.0% |
| 5 to 9 Unit Apartments | 0 | 0.0% |
| 10 or more Apartments | 0 | 0.0% |
| Mobile Home / Other | 56 | 4.7% |
| Total | 1,193 | 100.0% |
Housing Structures by Occupancy in Palo Cedro
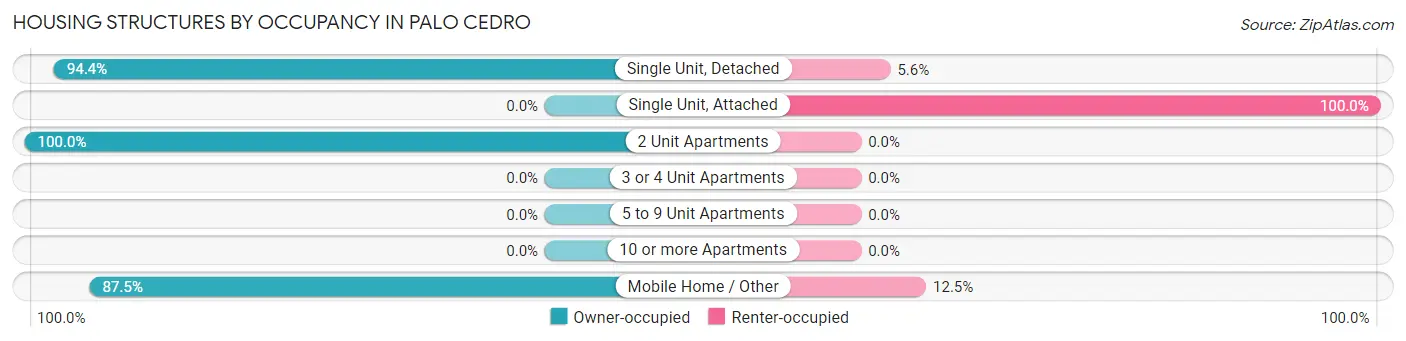
| Structure Type | Owner-occupied | Renter-occupied |
| Single Unit, Detached | 1,054 (94.4%) | 63 (5.6%) |
| Single Unit, Attached | 0 (0.0%) | 3 (100.0%) |
| 2 Unit Apartments | 17 (100.0%) | 0 (0.0%) |
| 3 or 4 Unit Apartments | 0 (0.0%) | 0 (0.0%) |
| 5 to 9 Unit Apartments | 0 (0.0%) | 0 (0.0%) |
| 10 or more Apartments | 0 (0.0%) | 0 (0.0%) |
| Mobile Home / Other | 49 (87.5%) | 7 (12.5%) |
| Total | 1,120 (93.9%) | 73 (6.1%) |
Housing Structures by Number of Rooms in Palo Cedro
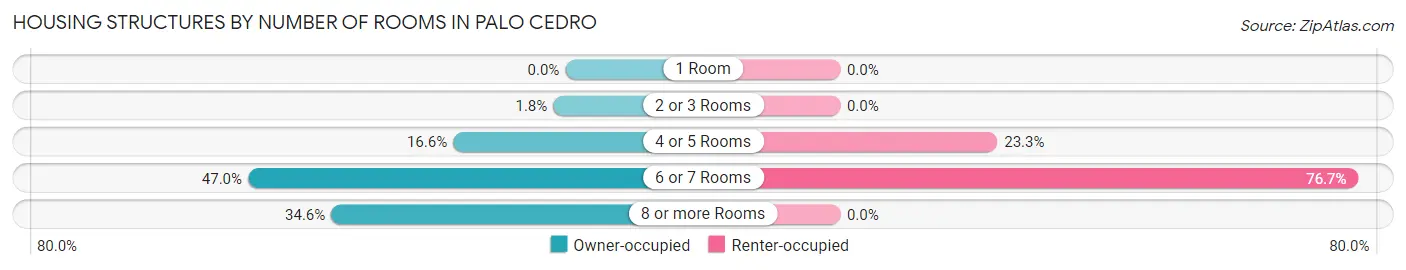
| Number of Rooms | Owner-occupied | Renter-occupied |
| 1 Room | 0 (0.0%) | 0 (0.0%) |
| 2 or 3 Rooms | 20 (1.8%) | 0 (0.0%) |
| 4 or 5 Rooms | 186 (16.6%) | 17 (23.3%) |
| 6 or 7 Rooms | 526 (47.0%) | 56 (76.7%) |
| 8 or more Rooms | 388 (34.6%) | 0 (0.0%) |
| Total | 1,120 (100.0%) | 73 (100.0%) |
Housing Structure by Heating Type in Palo Cedro
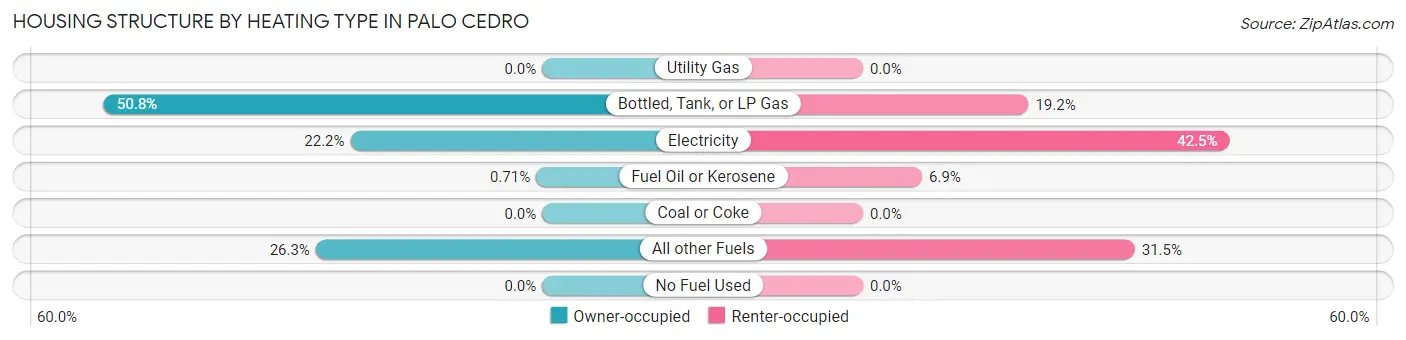
| Heating Type | Owner-occupied | Renter-occupied |
| Utility Gas | 0 (0.0%) | 0 (0.0%) |
| Bottled, Tank, or LP Gas | 569 (50.8%) | 14 (19.2%) |
| Electricity | 249 (22.2%) | 31 (42.5%) |
| Fuel Oil or Kerosene | 8 (0.7%) | 5 (6.9%) |
| Coal or Coke | 0 (0.0%) | 0 (0.0%) |
| All other Fuels | 294 (26.3%) | 23 (31.5%) |
| No Fuel Used | 0 (0.0%) | 0 (0.0%) |
| Total | 1,120 (100.0%) | 73 (100.0%) |
Household Vehicle Usage in Palo Cedro
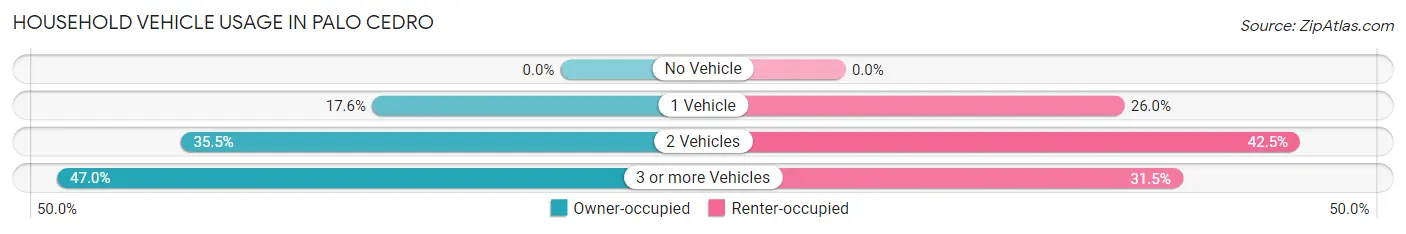
| Vehicles per Household | Owner-occupied | Renter-occupied |
| No Vehicle | 0 (0.0%) | 0 (0.0%) |
| 1 Vehicle | 197 (17.6%) | 19 (26.0%) |
| 2 Vehicles | 397 (35.4%) | 31 (42.5%) |
| 3 or more Vehicles | 526 (47.0%) | 23 (31.5%) |
| Total | 1,120 (100.0%) | 73 (100.0%) |
Real Estate & Mortgages in Palo Cedro
Real Estate and Mortgage Overview in Palo Cedro
| Characteristic | Without Mortgage | With Mortgage |
| Housing Units | 269 | 851 |
| Median Property Value | $521,300 | $522,000 |
| Median Household Income | $42,375 | $347 |
| Monthly Housing Costs | $903 | $364 |
| Real Estate Taxes | $3,402 | $49 |
Property Value by Mortgage Status in Palo Cedro
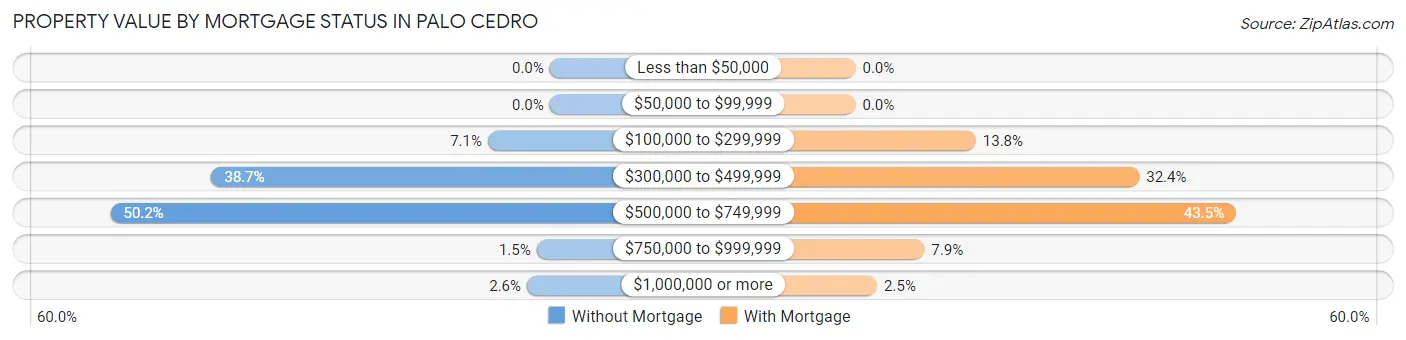
| Property Value | Without Mortgage | With Mortgage |
| Less than $50,000 | 0 (0.0%) | 0 (0.0%) |
| $50,000 to $99,999 | 0 (0.0%) | 0 (0.0%) |
| $100,000 to $299,999 | 19 (7.1%) | 117 (13.8%) |
| $300,000 to $499,999 | 104 (38.7%) | 276 (32.4%) |
| $500,000 to $749,999 | 135 (50.2%) | 370 (43.5%) |
| $750,000 to $999,999 | 4 (1.5%) | 67 (7.9%) |
| $1,000,000 or more | 7 (2.6%) | 21 (2.5%) |
| Total | 269 (100.0%) | 851 (100.0%) |
Household Income by Mortgage Status in Palo Cedro
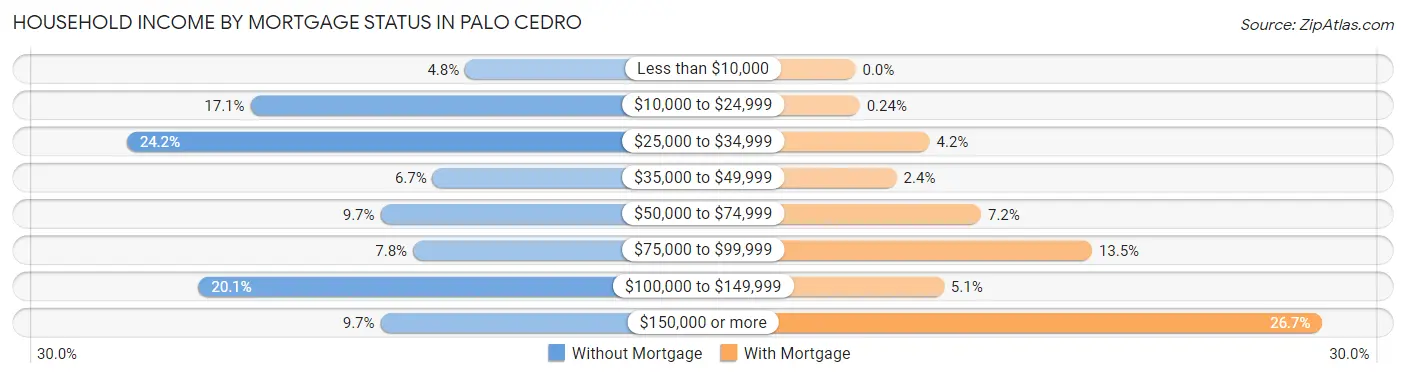
| Household Income | Without Mortgage | With Mortgage |
| Less than $10,000 | 13 (4.8%) | 0 (0.0%) |
| $10,000 to $24,999 | 46 (17.1%) | 2 (0.2%) |
| $25,000 to $34,999 | 65 (24.2%) | 36 (4.2%) |
| $35,000 to $49,999 | 18 (6.7%) | 20 (2.4%) |
| $50,000 to $74,999 | 26 (9.7%) | 61 (7.2%) |
| $75,000 to $99,999 | 21 (7.8%) | 115 (13.5%) |
| $100,000 to $149,999 | 54 (20.1%) | 43 (5.1%) |
| $150,000 or more | 26 (9.7%) | 227 (26.7%) |
| Total | 269 (100.0%) | 851 (100.0%) |
Property Value to Household Income Ratio in Palo Cedro
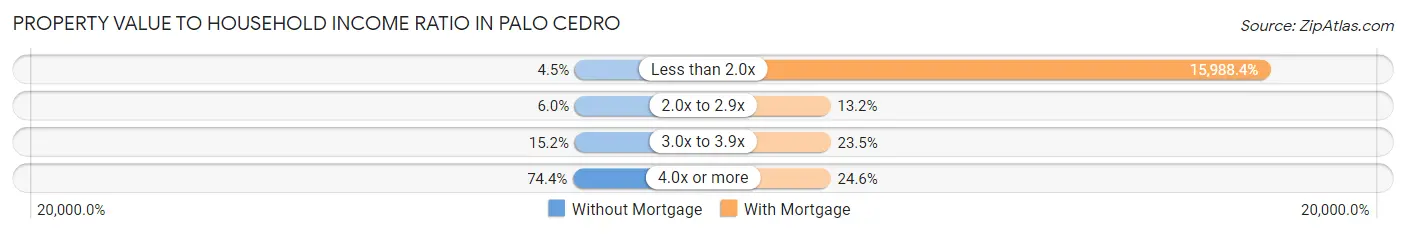
| Value-to-Income Ratio | Without Mortgage | With Mortgage |
| Less than 2.0x | 12 (4.5%) | 136,061 (15,988.4%) |
| 2.0x to 2.9x | 16 (5.9%) | 112 (13.2%) |
| 3.0x to 3.9x | 41 (15.2%) | 200 (23.5%) |
| 4.0x or more | 200 (74.4%) | 209 (24.6%) |
| Total | 269 (100.0%) | 851 (100.0%) |
Real Estate Taxes by Mortgage Status in Palo Cedro

| Property Taxes | Without Mortgage | With Mortgage |
| Less than $800 | 0 (0.0%) | 0 (0.0%) |
| $800 to $1,499 | 35 (13.0%) | 0 (0.0%) |
| $800 to $1,499 | 234 (87.0%) | 21 (2.5%) |
| Total | 269 (100.0%) | 851 (100.0%) |
Health & Disability in Palo Cedro
Health Insurance Coverage by Age in Palo Cedro
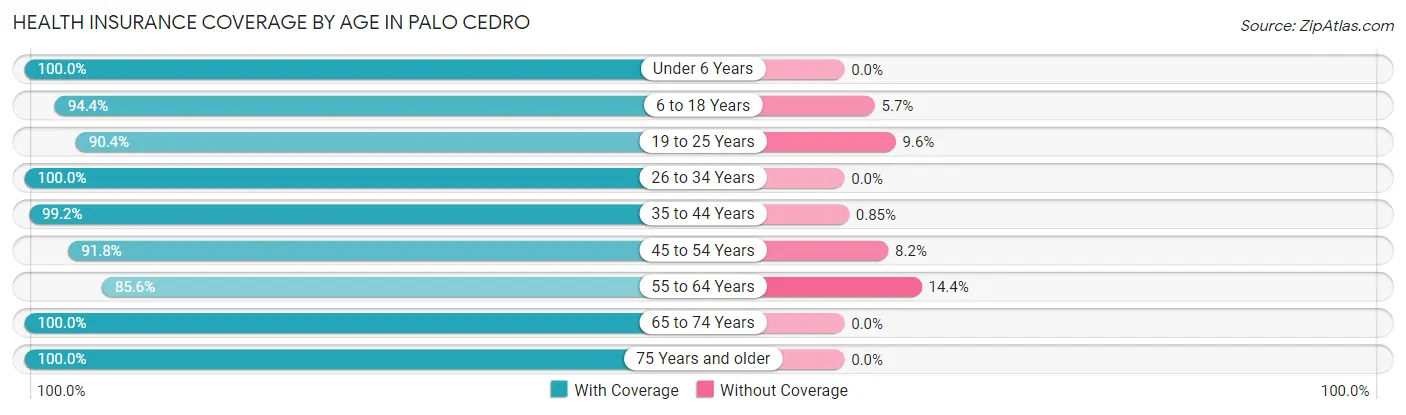
| Age Bracket | With Coverage | Without Coverage |
| Under 6 Years | 347 (100.0%) | 0 (0.0%) |
| 6 to 18 Years | 701 (94.4%) | 42 (5.7%) |
| 19 to 25 Years | 85 (90.4%) | 9 (9.6%) |
| 26 to 34 Years | 255 (100.0%) | 0 (0.0%) |
| 35 to 44 Years | 349 (99.2%) | 3 (0.9%) |
| 45 to 54 Years | 393 (91.8%) | 35 (8.2%) |
| 55 to 64 Years | 386 (85.6%) | 65 (14.4%) |
| 65 to 74 Years | 368 (100.0%) | 0 (0.0%) |
| 75 Years and older | 355 (100.0%) | 0 (0.0%) |
| Total | 3,239 (95.5%) | 154 (4.5%) |
Health Insurance Coverage by Citizenship Status in Palo Cedro
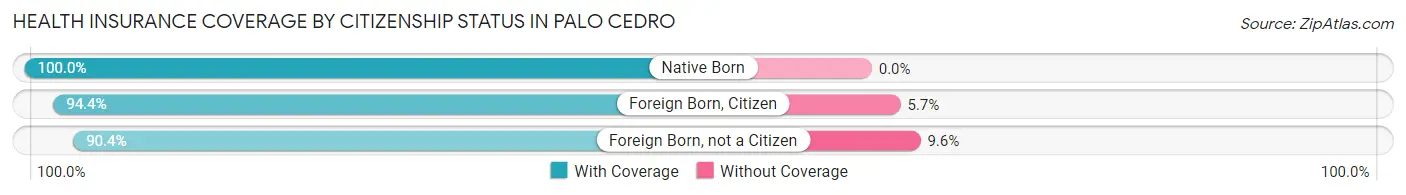
| Citizenship Status | With Coverage | Without Coverage |
| Native Born | 347 (100.0%) | 0 (0.0%) |
| Foreign Born, Citizen | 701 (94.4%) | 42 (5.7%) |
| Foreign Born, not a Citizen | 85 (90.4%) | 9 (9.6%) |
Health Insurance Coverage by Household Income in Palo Cedro
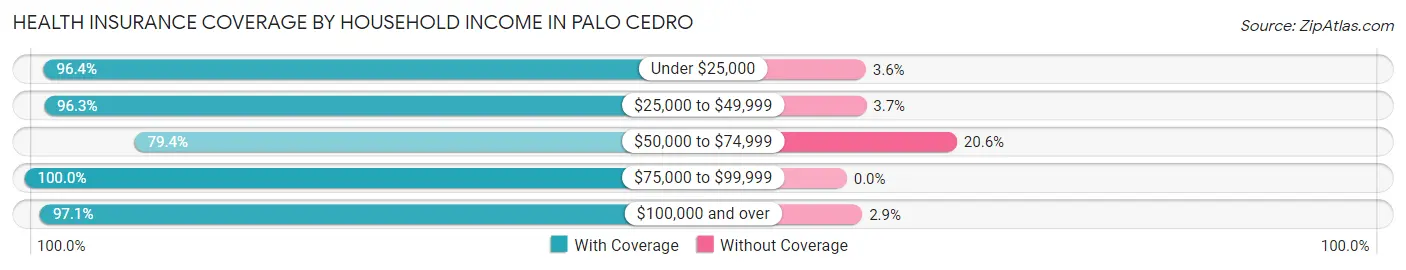
| Household Income | With Coverage | Without Coverage |
| Under $25,000 | 162 (96.4%) | 6 (3.6%) |
| $25,000 to $49,999 | 237 (96.3%) | 9 (3.7%) |
| $50,000 to $74,999 | 250 (79.4%) | 65 (20.6%) |
| $75,000 to $99,999 | 202 (100.0%) | 0 (0.0%) |
| $100,000 and over | 2,385 (97.1%) | 71 (2.9%) |
Public vs Private Health Insurance Coverage by Age in Palo Cedro
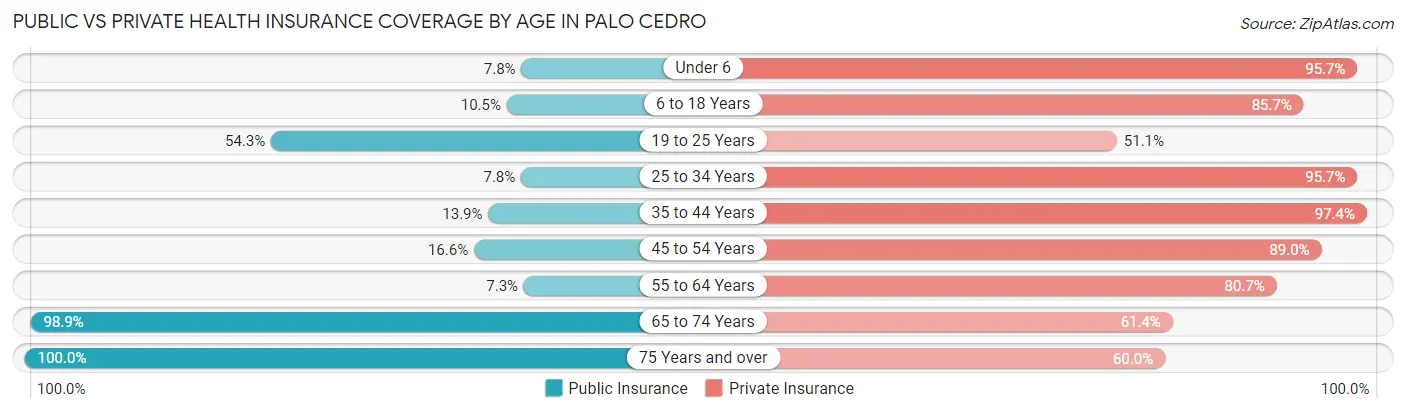
| Age Bracket | Public Insurance | Private Insurance |
| Under 6 | 27 (7.8%) | 332 (95.7%) |
| 6 to 18 Years | 78 (10.5%) | 637 (85.7%) |
| 19 to 25 Years | 51 (54.3%) | 48 (51.1%) |
| 25 to 34 Years | 20 (7.8%) | 244 (95.7%) |
| 35 to 44 Years | 49 (13.9%) | 343 (97.4%) |
| 45 to 54 Years | 71 (16.6%) | 381 (89.0%) |
| 55 to 64 Years | 33 (7.3%) | 364 (80.7%) |
| 65 to 74 Years | 364 (98.9%) | 226 (61.4%) |
| 75 Years and over | 355 (100.0%) | 213 (60.0%) |
| Total | 1,048 (30.9%) | 2,788 (82.2%) |
Disability Status by Sex by Age in Palo Cedro
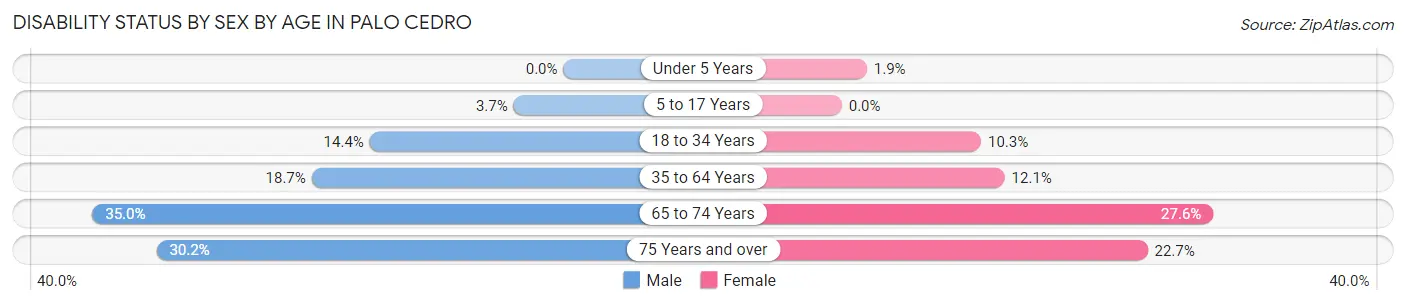
| Age Bracket | Male | Female |
| Under 5 Years | 0 (0.0%) | 4 (1.9%) |
| 5 to 17 Years | 16 (3.7%) | 0 (0.0%) |
| 18 to 34 Years | 23 (14.4%) | 24 (10.3%) |
| 35 to 64 Years | 111 (18.7%) | 77 (12.1%) |
| 65 to 74 Years | 64 (35.0%) | 51 (27.6%) |
| 75 Years and over | 58 (30.2%) | 37 (22.7%) |
Disability Class by Sex by Age in Palo Cedro
Disability Class: Hearing Difficulty
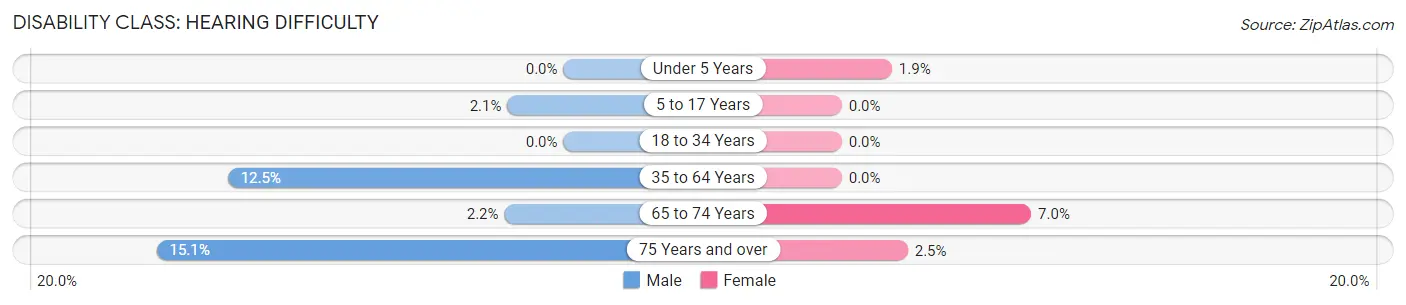
| Age Bracket | Male | Female |
| Under 5 Years | 0 (0.0%) | 4 (1.9%) |
| 5 to 17 Years | 9 (2.1%) | 0 (0.0%) |
| 18 to 34 Years | 0 (0.0%) | 0 (0.0%) |
| 35 to 64 Years | 74 (12.5%) | 0 (0.0%) |
| 65 to 74 Years | 4 (2.2%) | 13 (7.0%) |
| 75 Years and over | 29 (15.1%) | 4 (2.5%) |
Disability Class: Vision Difficulty
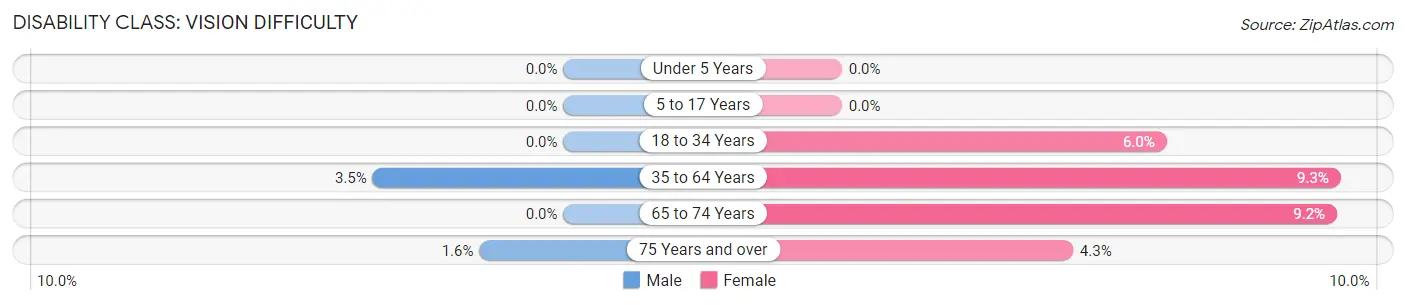
| Age Bracket | Male | Female |
| Under 5 Years | 0 (0.0%) | 0 (0.0%) |
| 5 to 17 Years | 0 (0.0%) | 0 (0.0%) |
| 18 to 34 Years | 0 (0.0%) | 14 (6.0%) |
| 35 to 64 Years | 21 (3.5%) | 59 (9.3%) |
| 65 to 74 Years | 0 (0.0%) | 17 (9.2%) |
| 75 Years and over | 3 (1.6%) | 7 (4.3%) |
Disability Class: Cognitive Difficulty
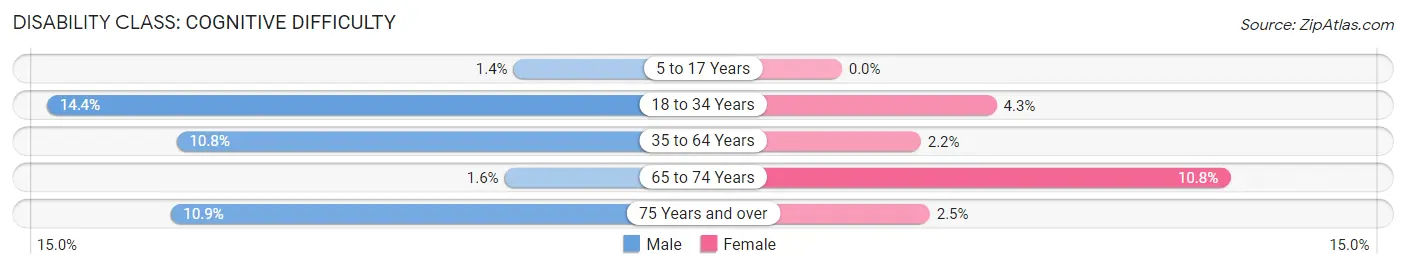
| Age Bracket | Male | Female |
| 5 to 17 Years | 6 (1.4%) | 0 (0.0%) |
| 18 to 34 Years | 23 (14.4%) | 10 (4.3%) |
| 35 to 64 Years | 64 (10.8%) | 14 (2.2%) |
| 65 to 74 Years | 3 (1.6%) | 20 (10.8%) |
| 75 Years and over | 21 (10.9%) | 4 (2.5%) |
Disability Class: Ambulatory Difficulty
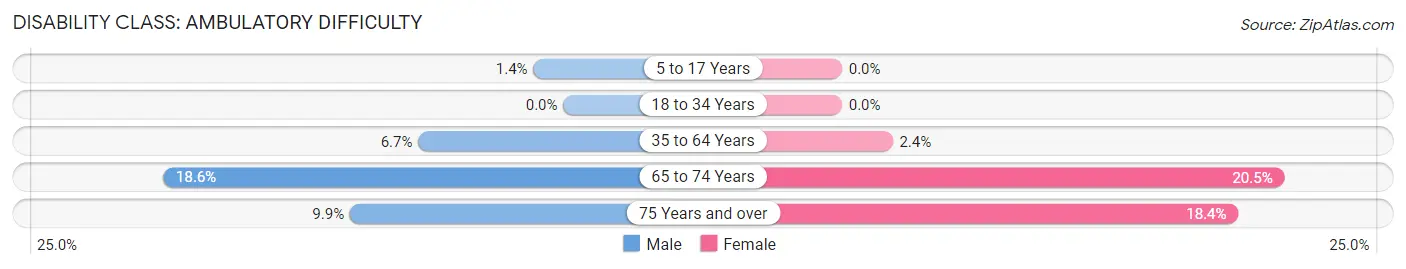
| Age Bracket | Male | Female |
| 5 to 17 Years | 6 (1.4%) | 0 (0.0%) |
| 18 to 34 Years | 0 (0.0%) | 0 (0.0%) |
| 35 to 64 Years | 40 (6.7%) | 15 (2.4%) |
| 65 to 74 Years | 34 (18.6%) | 38 (20.5%) |
| 75 Years and over | 19 (9.9%) | 30 (18.4%) |
Disability Class: Self-Care Difficulty
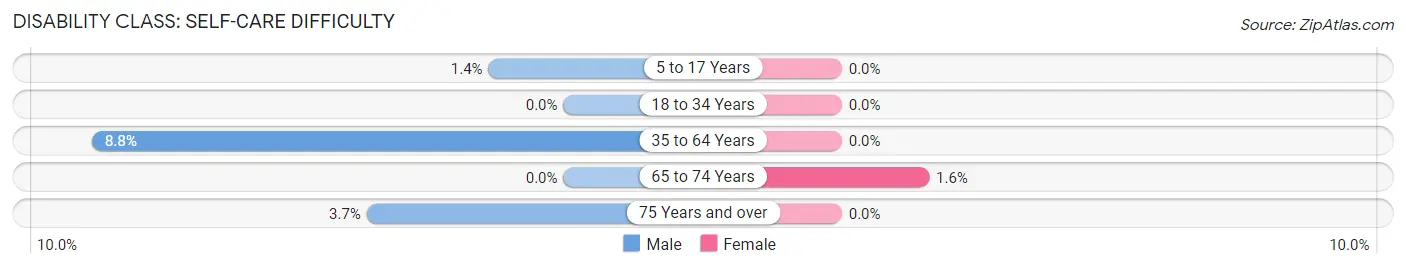
| Age Bracket | Male | Female |
| 5 to 17 Years | 6 (1.4%) | 0 (0.0%) |
| 18 to 34 Years | 0 (0.0%) | 0 (0.0%) |
| 35 to 64 Years | 52 (8.7%) | 0 (0.0%) |
| 65 to 74 Years | 0 (0.0%) | 3 (1.6%) |
| 75 Years and over | 7 (3.6%) | 0 (0.0%) |
Technology Access in Palo Cedro
Computing Device Access in Palo Cedro
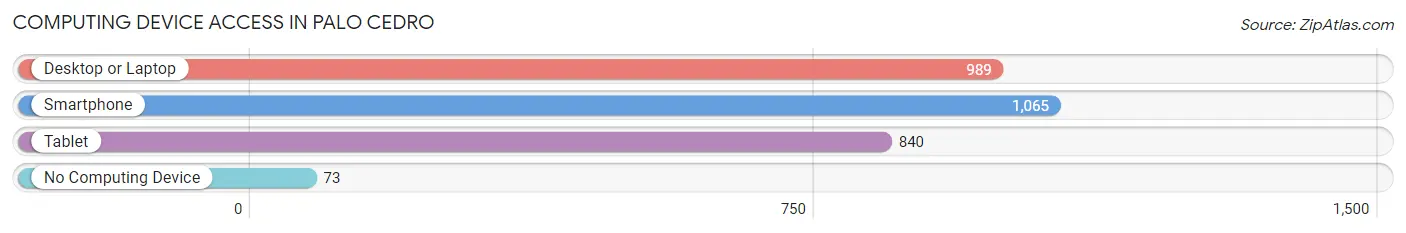
| Device Type | # Households | % Households |
| Desktop or Laptop | 989 | 82.9% |
| Smartphone | 1,065 | 89.3% |
| Tablet | 840 | 70.4% |
| No Computing Device | 73 | 6.1% |
| Total | 1,193 | 100.0% |
Internet Access in Palo Cedro
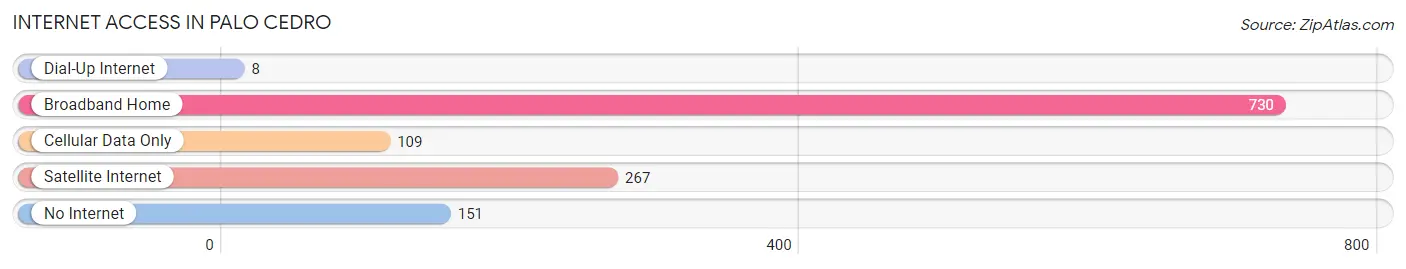
| Internet Type | # Households | % Households |
| Dial-Up Internet | 8 | 0.7% |
| Broadband Home | 730 | 61.2% |
| Cellular Data Only | 109 | 9.1% |
| Satellite Internet | 267 | 22.4% |
| No Internet | 151 | 12.7% |
| Total | 1,193 | 100.0% |
Palo Cedro Summary
Palo Cedro is an unincorporated community located in Shasta County, California. It is situated in the foothills of the Cascade Range, approximately 10 miles east of Redding. The population was 2,269 at the 2010 census.
History
Palo Cedro was originally inhabited by the Wintu Native American tribe. The first non-native settlers arrived in the area in the 1850s. The town was founded in 1872 by a group of settlers from the Midwest. The town was named after the Spanish phrase for “cedar tree”, which was abundant in the area.
In the late 19th century, the town was a major stop on the stagecoach route between Redding and Chico. The town was also home to a number of businesses, including a hotel, a general store, a blacksmith shop, and a saloon.
Geography
Palo Cedro is located at 40°33'25"N 122°17'45"W (40.556944, -122.295833). It is situated in the foothills of the Cascade Range, approximately 10 miles east of Redding. The town is located at an elevation of 1,845 feet (562 m).
The town is located in the Sacramento Valley, which is part of the Central Valley of California. The Sacramento River is located approximately 10 miles to the west of Palo Cedro.
Economy
The economy of Palo Cedro is largely based on agriculture. The town is home to a number of farms, which produce a variety of crops, including almonds, walnuts, and hay. The town is also home to a number of businesses, including a grocery store, a hardware store, and a gas station.
Demographics
As of the 2010 census, there were 2,269 people, 845 households, and 645 families residing in the town. The population density was 545.3 people per square mile (210.9/km2). There were 890 housing units at an average density of 214.3 per square mile (82.7/km2). The racial makeup of the town was 91.2% White, 0.3% African American, 1.2% Native American, 0.7% Asian, 0.1% Pacific Islander, 4.2% from other races, and 2.3% from two or more races. Hispanic or Latino of any race were 8.7% of the population.
There were 845 households, out of which 33.2% had children under the age of 18 living with them, 58.2% were married couples living together, 10.2% had a female householder with no husband present, and 26.2% were non-families. 21.2% of all households were made up of individuals, and 8.2% had someone living alone who was 65 years of age or older. The average household size was 2.68 and the average family size was 3.11.
In the town, the population was spread out, with 26.2% under the age of 18, 7.2% from 18 to 24, 25.2% from 25 to 44, 28.2% from 45 to 64, and 13.2% who were 65 years of age or older. The median age was 39 years. For every 100 females, there were 97.2 males. For every 100 females age 18 and over, there were 94.2 males.
The median income for a household in the town was $45,000, and the median income for a family was $50,000. Males had a median income of $41,000 versus $27,000 for females. The per capita income for the town was $20,000. About 8.2% of families and 10.2% of the population were below the poverty line, including 14.2% of those under age 18 and 4.2% of those age 65 or over.
Common Questions
What is Per Capita Income in Palo Cedro?
Per Capita income in Palo Cedro is $50,014.
What is the Median Family Income in Palo Cedro?
Median Family Income in Palo Cedro is $135,731.
What is the Median Household income in Palo Cedro?
Median Household Income in Palo Cedro is $111,771.
What is Income or Wage Gap in Palo Cedro?
Income or Wage Gap in Palo Cedro is 53.3%.
Women in Palo Cedro earn 46.7 cents for every dollar earned by a man.
What is Family Income Deficit in Palo Cedro?
Family Income Deficit in Palo Cedro is $14,623.
Families that are below poverty line in Palo Cedro earn $14,623 less on average than the poverty threshold level.
What is Inequality or Gini Index in Palo Cedro?
Inequality or Gini Index in Palo Cedro is 0.42.
What is the Total Population of Palo Cedro?
Total Population of Palo Cedro is 3,396.
What is the Total Male Population of Palo Cedro?
Total Male Population of Palo Cedro is 1,640.
What is the Total Female Population of Palo Cedro?
Total Female Population of Palo Cedro is 1,756.
What is the Ratio of Males per 100 Females in Palo Cedro?
There are 93.39 Males per 100 Females in Palo Cedro.
What is the Ratio of Females per 100 Males in Palo Cedro?
There are 107.07 Females per 100 Males in Palo Cedro.
What is the Median Population Age in Palo Cedro?
Median Population Age in Palo Cedro is 41.6 Years.
What is the Average Family Size in Palo Cedro
Average Family Size in Palo Cedro is 3.3 People.
What is the Average Household Size in Palo Cedro
Average Household Size in Palo Cedro is 2.8 People.
How Large is the Labor Force in Palo Cedro?
There are 1,480 People in the Labor Forcein in Palo Cedro.
What is the Percentage of People in the Labor Force in Palo Cedro?
58.6% of People are in the Labor Force in Palo Cedro.
What is the Unemployment Rate in Palo Cedro?
Unemployment Rate in Palo Cedro is 5.7%.