Zip Codes with the Highest Percentage of Population Employed in Arts, Entertainment & Recreation in Oroville, CA
RELATED REPORTS & OPTIONS
Arts, Entertainment & Recreation
Oroville
Compare Zip Codes
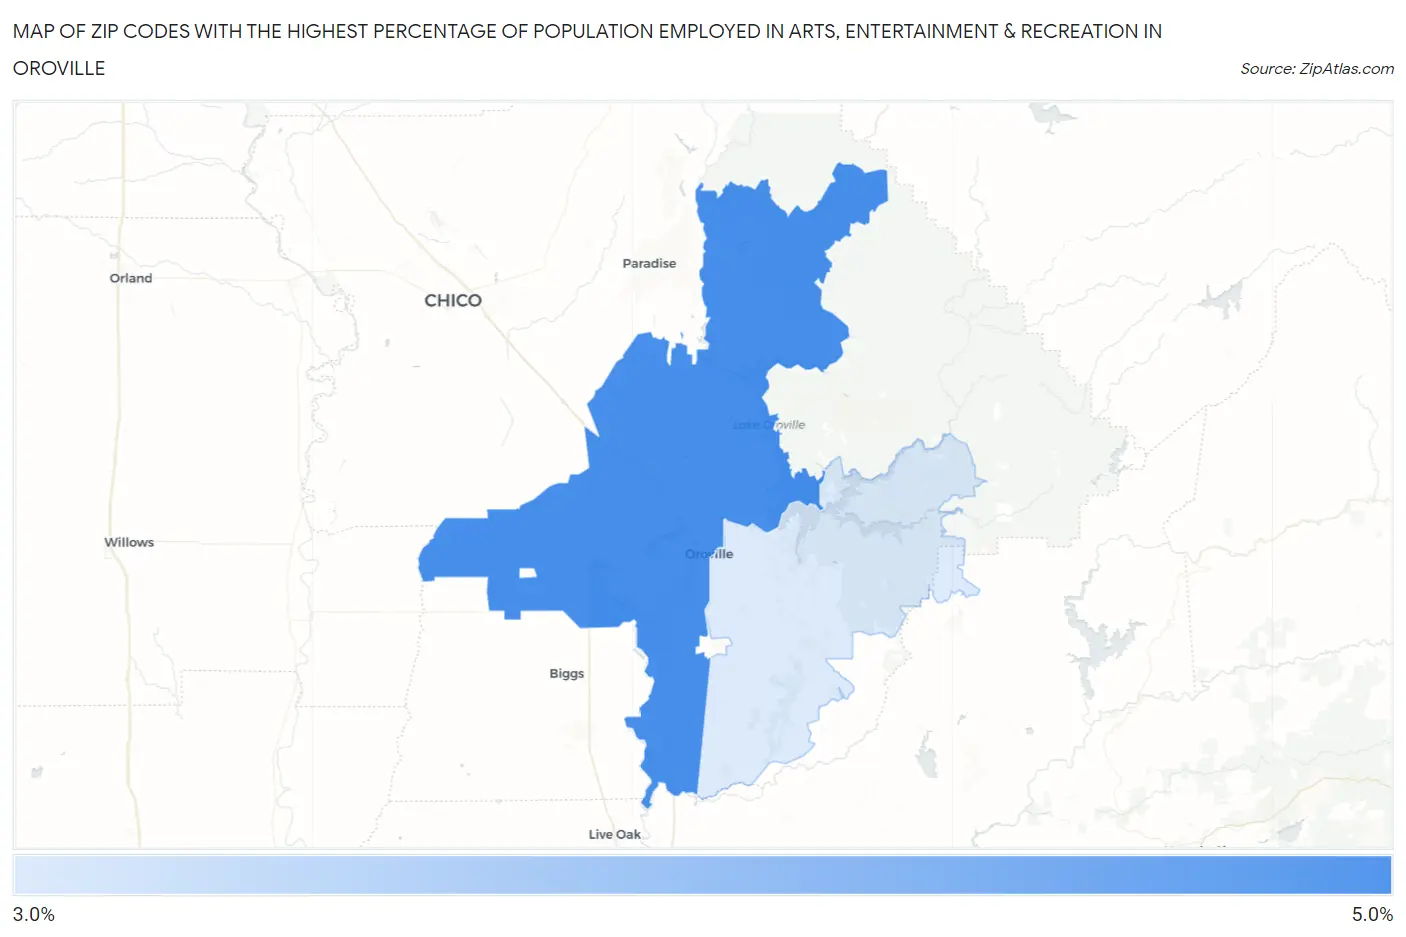
Map of Zip Codes with the Highest Percentage of Population Employed in Arts, Entertainment & Recreation in Oroville
0.0%
5.0%
Zip Codes with the Highest Percentage of Population Employed in Arts, Entertainment & Recreation in Oroville, CA
| Zip Code | % Employed | vs State | vs National | |
| 1. | 95965 | 4.7% | 2.6%(+2.13)#248 | 2.1%(+2.60)#2,543 |
| 2. | 95966 | 3.8% | 2.6%(+1.24)#360 | 2.1%(+1.71)#3,638 |
1
Common Questions
What are the Top Zip Codes with the Highest Percentage of Population Employed in Arts, Entertainment & Recreation in Oroville, CA?
Top Zip Codes with the Highest Percentage of Population Employed in Arts, Entertainment & Recreation in Oroville, CA are:
What zip code has the Highest Percentage of Population Employed in Arts, Entertainment & Recreation in Oroville, CA?
95965 has the Highest Percentage of Population Employed in Arts, Entertainment & Recreation in Oroville, CA with 4.7%.
What is the Percentage of Population Employed in Arts, Entertainment & Recreation in Oroville, CA?
Percentage of Population Employed in Arts, Entertainment & Recreation in Oroville is 3.4%.
What is the Percentage of Population Employed in Arts, Entertainment & Recreation in California?
Percentage of Population Employed in Arts, Entertainment & Recreation in California is 2.6%.
What is the Percentage of Population Employed in Arts, Entertainment & Recreation in the United States?
Percentage of Population Employed in Arts, Entertainment & Recreation in the United States is 2.1%.