Zip Codes with the Highest Percentage of Population Employed in Mining, Quarrying, & Extraction in Ontario, CA
RELATED REPORTS & OPTIONS
Mining, Quarrying, & Extraction
Ontario
Compare Zip Codes
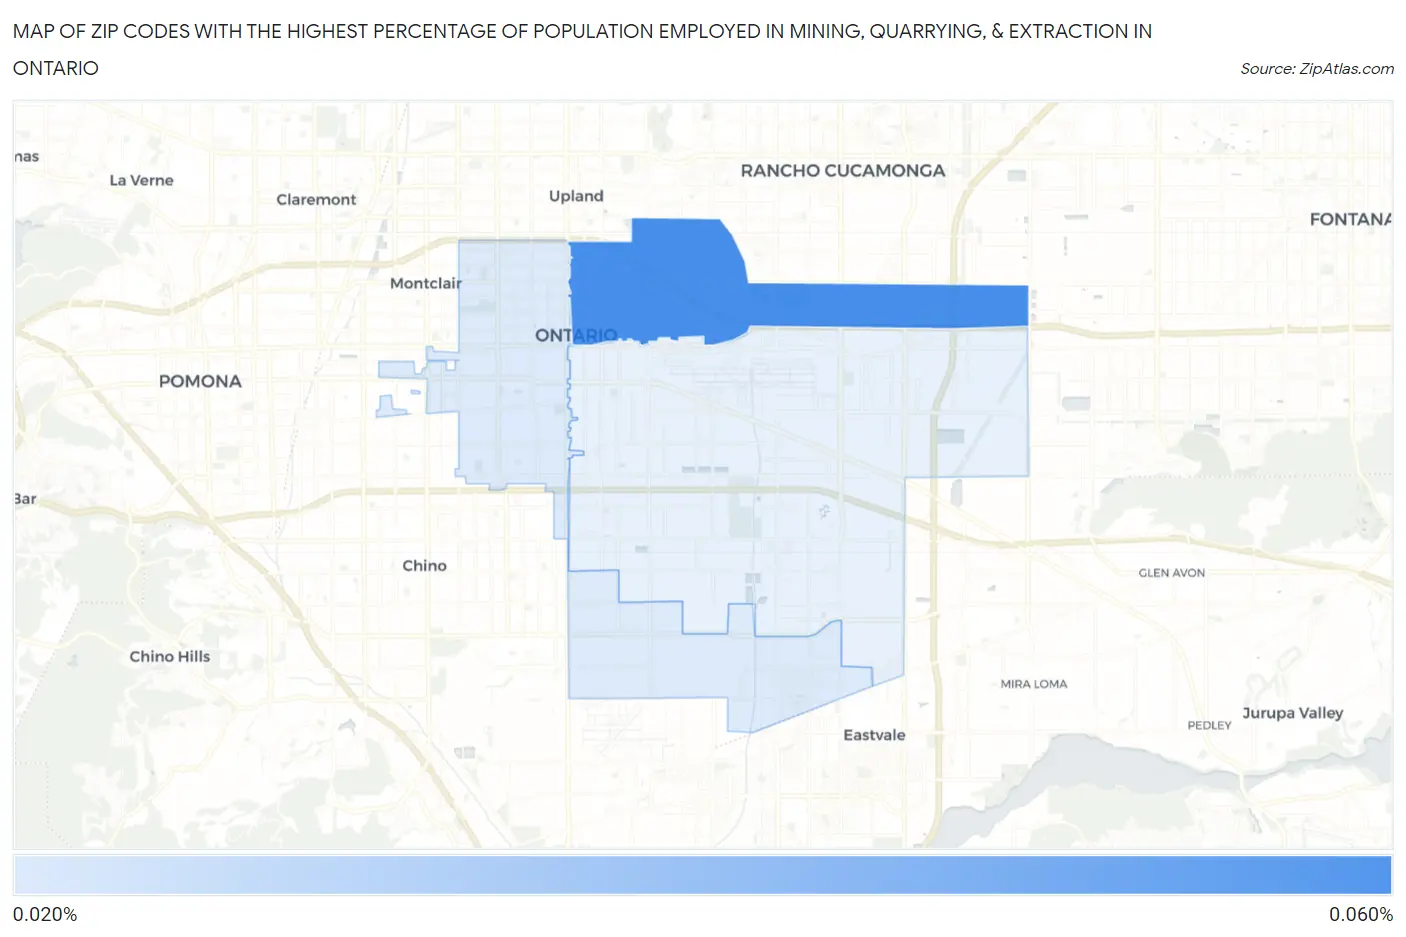
Map of Zip Codes with the Highest Percentage of Population Employed in Mining, Quarrying, & Extraction in Ontario
0.030%
0.059%
Zip Codes with the Highest Percentage of Population Employed in Mining, Quarrying, & Extraction in Ontario, CA
| Zip Code | % Employed | vs State | vs National | |
| 1. | 91764 | 0.059% | 0.12%(-0.064)#413 | 0.44%(-0.381)#11,524 |
| 2. | 91762 | 0.030% | 0.12%(-0.093)#487 | 0.44%(-0.410)#11,973 |
1
Common Questions
What are the Top Zip Codes with the Highest Percentage of Population Employed in Mining, Quarrying, & Extraction in Ontario, CA?
Top Zip Codes with the Highest Percentage of Population Employed in Mining, Quarrying, & Extraction in Ontario, CA are:
What zip code has the Highest Percentage of Population Employed in Mining, Quarrying, & Extraction in Ontario, CA?
91764 has the Highest Percentage of Population Employed in Mining, Quarrying, & Extraction in Ontario, CA with 0.059%.
What is the Percentage of Population Employed in Mining, Quarrying, & Extraction in Ontario, CA?
Percentage of Population Employed in Mining, Quarrying, & Extraction in Ontario is 0.029%.
What is the Percentage of Population Employed in Mining, Quarrying, & Extraction in California?
Percentage of Population Employed in Mining, Quarrying, & Extraction in California is 0.12%.
What is the Percentage of Population Employed in Mining, Quarrying, & Extraction in the United States?
Percentage of Population Employed in Mining, Quarrying, & Extraction in the United States is 0.44%.