Olivehurst, CA Map & Demographics
Olivehurst Map
Olivehurst Overview
$28,711
PER CAPITA INCOME
$82,747
AVG FAMILY INCOME
$69,595
AVG HOUSEHOLD INCOME
35.2%
WAGE / INCOME GAP [ % ]
64.8¢/ $1
WAGE / INCOME GAP [ $ ]
0.44
INEQUALITY / GINI INDEX
17,416
TOTAL POPULATION
8,692
MALE POPULATION
8,724
FEMALE POPULATION
99.63
MALES / 100 FEMALES
100.37
FEMALES / 100 MALES
32.7
MEDIAN AGE
3.8
AVG FAMILY SIZE
3.3
AVG HOUSEHOLD SIZE
8,395
LABOR FORCE [ PEOPLE ]
63.7%
PERCENT IN LABOR FORCE
7.3%
UNEMPLOYMENT RATE
Olivehurst Zip Codes
Olivehurst Area Codes
Income in Olivehurst
Income Overview in Olivehurst
Per Capita Income in Olivehurst is $28,711, while median incomes of families and households are $82,747 and $69,595 respectively.
| Characteristic | Number | Measure |
| Per Capita Income | 17,416 | $28,711 |
| Median Family Income | 3,802 | $82,747 |
| Mean Family Income | 3,802 | $95,932 |
| Median Household Income | 5,264 | $69,595 |
| Mean Household Income | 5,264 | $87,412 |
| Income Deficit | 3,802 | $0 |
| Wage / Income Gap (%) | 17,416 | 35.19% |
| Wage / Income Gap ($) | 17,416 | 64.81¢ per $1 |
| Gini / Inequality Index | 17,416 | 0.44 |
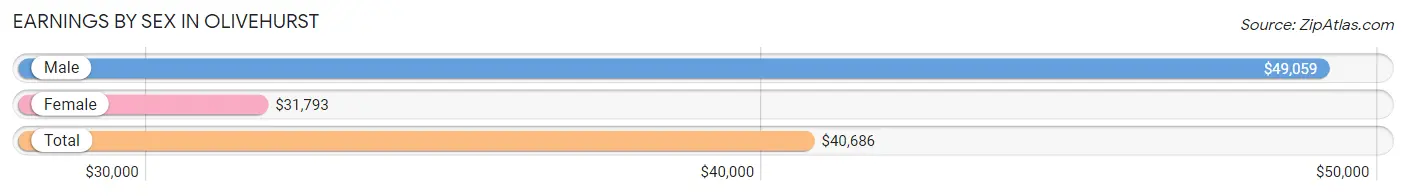
Earnings by Sex in Olivehurst
Average Earnings in Olivehurst are $40,686, $49,059 for men and $31,793 for women, a difference of 35.2%.
| Sex | Number | Average Earnings |
| Male | 4,456 (53.0%) | $49,059 |
| Female | 3,953 (47.0%) | $31,793 |
| Total | 8,409 (100.0%) | $40,686 |
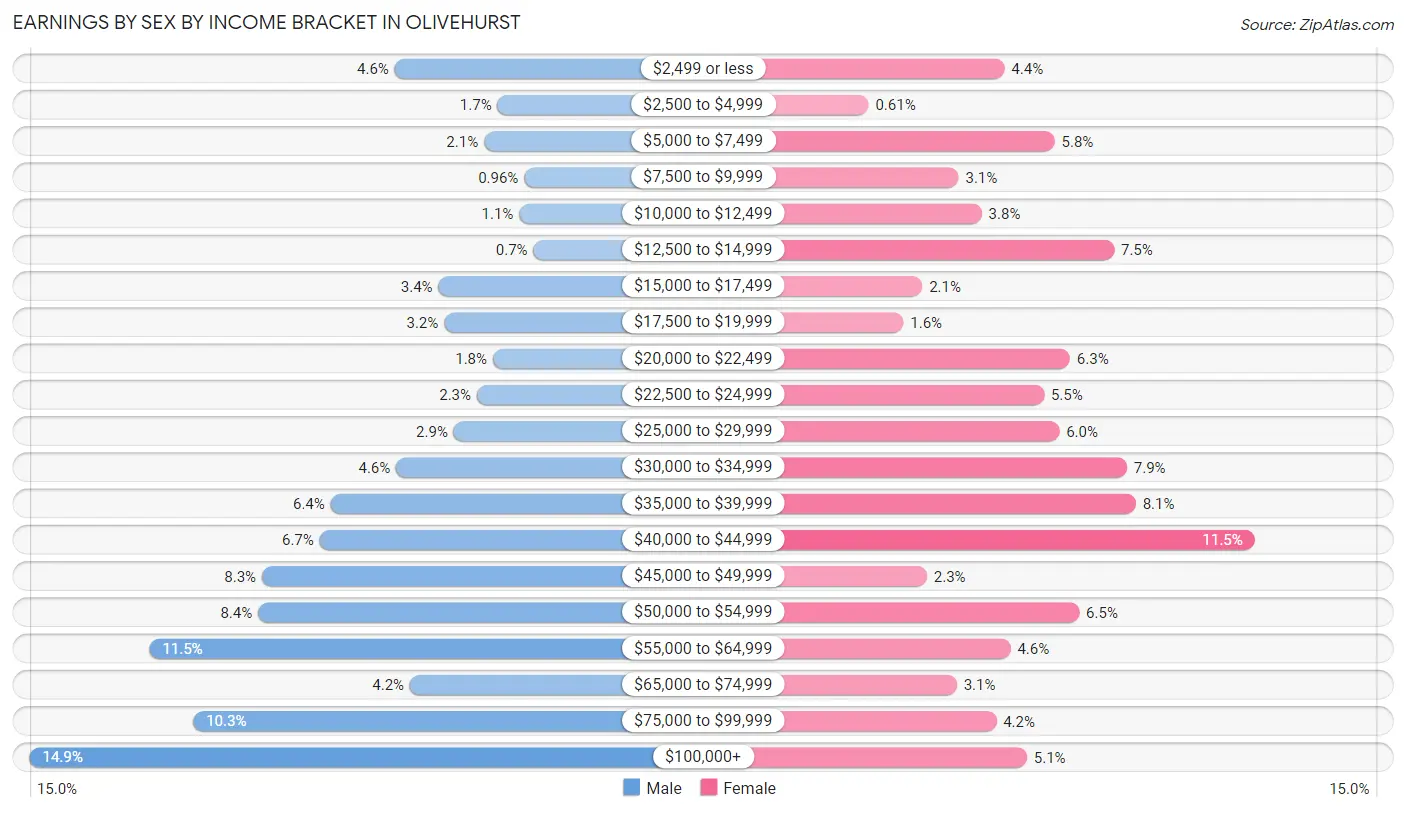
Earnings by Sex by Income Bracket in Olivehurst
The most common earnings brackets in Olivehurst are $100,000+ for men (662 | 14.9%) and $40,000 to $44,999 for women (453 | 11.5%).
| Income | Male | Female |
| $2,499 or less | 205 (4.6%) | 175 (4.4%) |
| $2,500 to $4,999 | 76 (1.7%) | 24 (0.6%) |
| $5,000 to $7,499 | 93 (2.1%) | 231 (5.8%) |
| $7,500 to $9,999 | 43 (1.0%) | 124 (3.1%) |
| $10,000 to $12,499 | 49 (1.1%) | 150 (3.8%) |
| $12,500 to $14,999 | 31 (0.7%) | 297 (7.5%) |
| $15,000 to $17,499 | 150 (3.4%) | 84 (2.1%) |
| $17,500 to $19,999 | 143 (3.2%) | 63 (1.6%) |
| $20,000 to $22,499 | 82 (1.8%) | 248 (6.3%) |
| $22,500 to $24,999 | 102 (2.3%) | 219 (5.5%) |
| $25,000 to $29,999 | 131 (2.9%) | 236 (6.0%) |
| $30,000 to $34,999 | 203 (4.6%) | 311 (7.9%) |
| $35,000 to $39,999 | 285 (6.4%) | 321 (8.1%) |
| $40,000 to $44,999 | 299 (6.7%) | 453 (11.5%) |
| $45,000 to $49,999 | 371 (8.3%) | 89 (2.2%) |
| $50,000 to $54,999 | 376 (8.4%) | 258 (6.5%) |
| $55,000 to $64,999 | 512 (11.5%) | 182 (4.6%) |
| $65,000 to $74,999 | 186 (4.2%) | 122 (3.1%) |
| $75,000 to $99,999 | 457 (10.3%) | 166 (4.2%) |
| $100,000+ | 662 (14.9%) | 200 (5.1%) |
| Total | 4,456 (100.0%) | 3,953 (100.0%) |
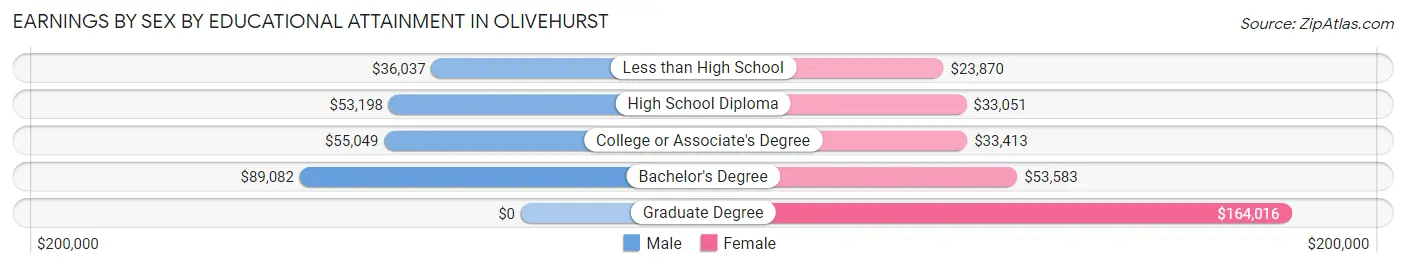
Earnings by Sex by Educational Attainment in Olivehurst
Average earnings in Olivehurst are $53,433 for men and $36,212 for women, a difference of 32.2%. Men with an educational attainment of bachelor's degree enjoy the highest average annual earnings of $89,082, while those with less than high school education earn the least with $36,037. Women with an educational attainment of graduate degree earn the most with the average annual earnings of $164,016, while those with less than high school education have the smallest earnings of $23,870.
| Educational Attainment | Male Income | Female Income |
| Less than High School | $36,037 | $23,870 |
| High School Diploma | $53,198 | $33,051 |
| College or Associate's Degree | $55,049 | $33,413 |
| Bachelor's Degree | $89,082 | $53,583 |
| Graduate Degree | - | - |
| Total | $53,433 | $36,212 |
Family Income in Olivehurst
Family Income Brackets in Olivehurst
According to the Olivehurst family income data, there are 935 families falling into the $75,000 to $99,999 income range, which is the most common income bracket and makes up 24.6% of all families. Conversely, the $15,000 to $24,999 income bracket is the least frequent group with only 99 families (2.6%) belonging to this category.
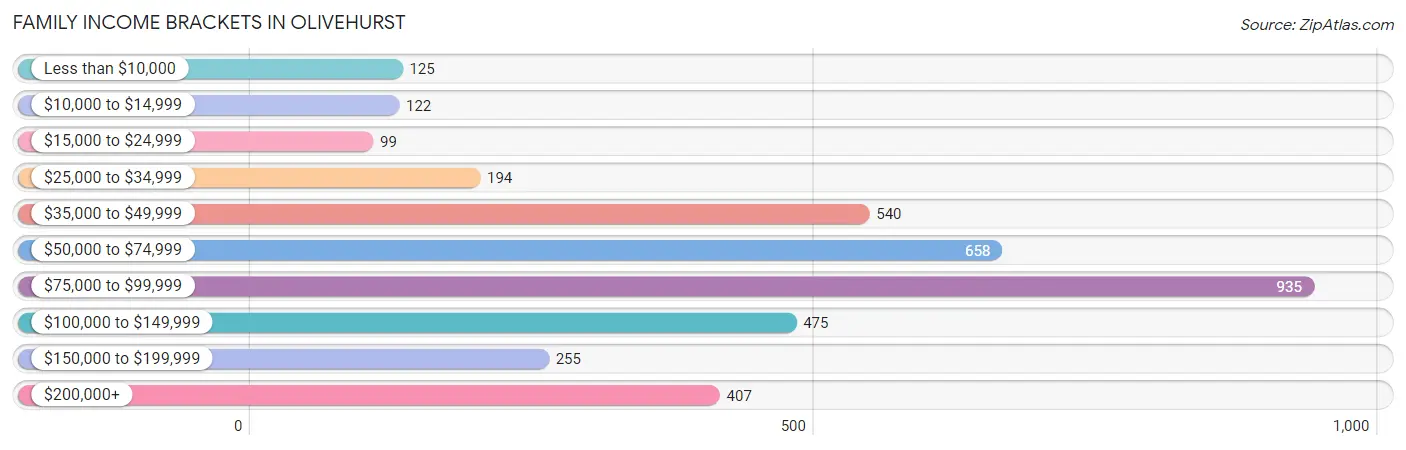
| Income Bracket | # Families | % Families |
| Less than $10,000 | 125 | 3.3% |
| $10,000 to $14,999 | 122 | 3.2% |
| $15,000 to $24,999 | 99 | 2.6% |
| $25,000 to $34,999 | 194 | 5.1% |
| $35,000 to $49,999 | 540 | 14.2% |
| $50,000 to $74,999 | 658 | 17.3% |
| $75,000 to $99,999 | 935 | 24.6% |
| $100,000 to $149,999 | 475 | 12.5% |
| $150,000 to $199,999 | 255 | 6.7% |
| $200,000+ | 407 | 10.7% |
Family Income by Famaliy Size in Olivehurst
6-person families (234 | 6.1%) account for the highest median family income in Olivehurst with $97,696 per family, while 3-person families (1,031 | 27.1%) have the highest median income of $28,098 per family member.
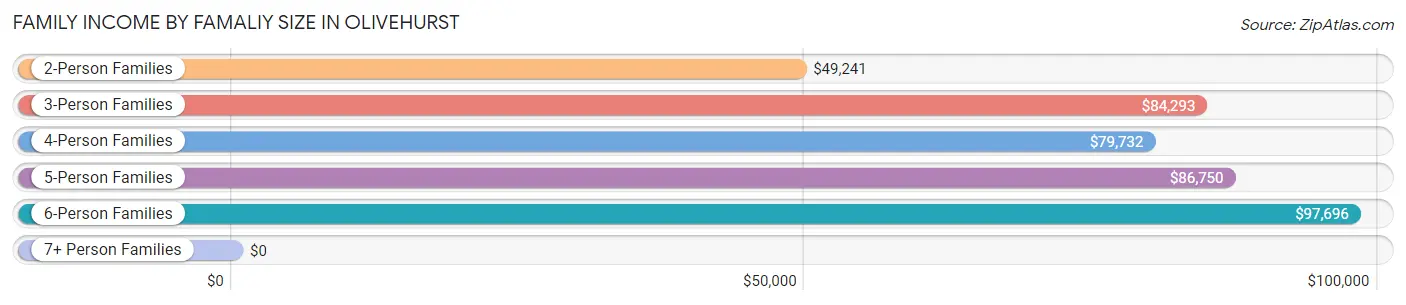
| Income Bracket | # Families | Median Income |
| 2-Person Families | 883 (23.2%) | $49,241 |
| 3-Person Families | 1,031 (27.1%) | $84,293 |
| 4-Person Families | 1,067 (28.1%) | $79,732 |
| 5-Person Families | 400 (10.5%) | $86,750 |
| 6-Person Families | 234 (6.1%) | $97,696 |
| 7+ Person Families | 187 (4.9%) | $0 |
| Total | 3,802 (100.0%) | $82,747 |
Family Income by Number of Earners in Olivehurst
The median family income in Olivehurst is $82,747, with families comprising 3+ earners (412) having the highest median family income of $187,121, while families with no earners (421) have the lowest median family income of $34,122, accounting for 10.8% and 11.1% of families, respectively.
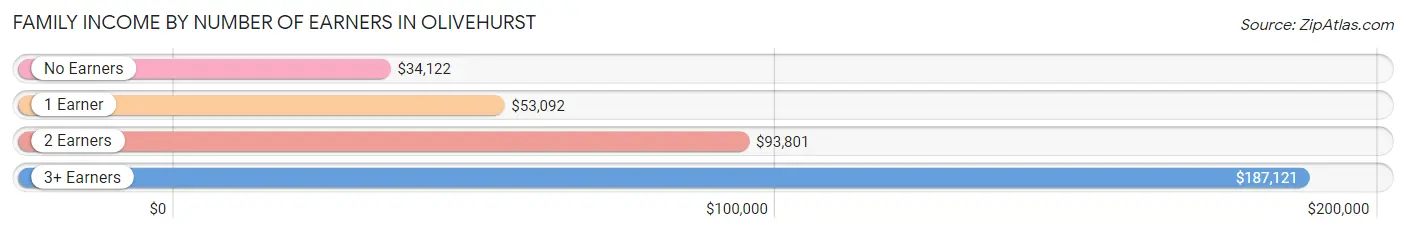
| Number of Earners | # Families | Median Income |
| No Earners | 421 (11.1%) | $34,122 |
| 1 Earner | 1,261 (33.2%) | $53,092 |
| 2 Earners | 1,708 (44.9%) | $93,801 |
| 3+ Earners | 412 (10.8%) | $187,121 |
| Total | 3,802 (100.0%) | $82,747 |
Household Income in Olivehurst
Household Income Brackets in Olivehurst
With 1,016 households falling in the category, the $75,000 to $99,999 income range is the most frequent in Olivehurst, accounting for 19.3% of all households. In contrast, only 211 households (4.0%) fall into the $25,000 to $34,999 income bracket, making it the least populous group.
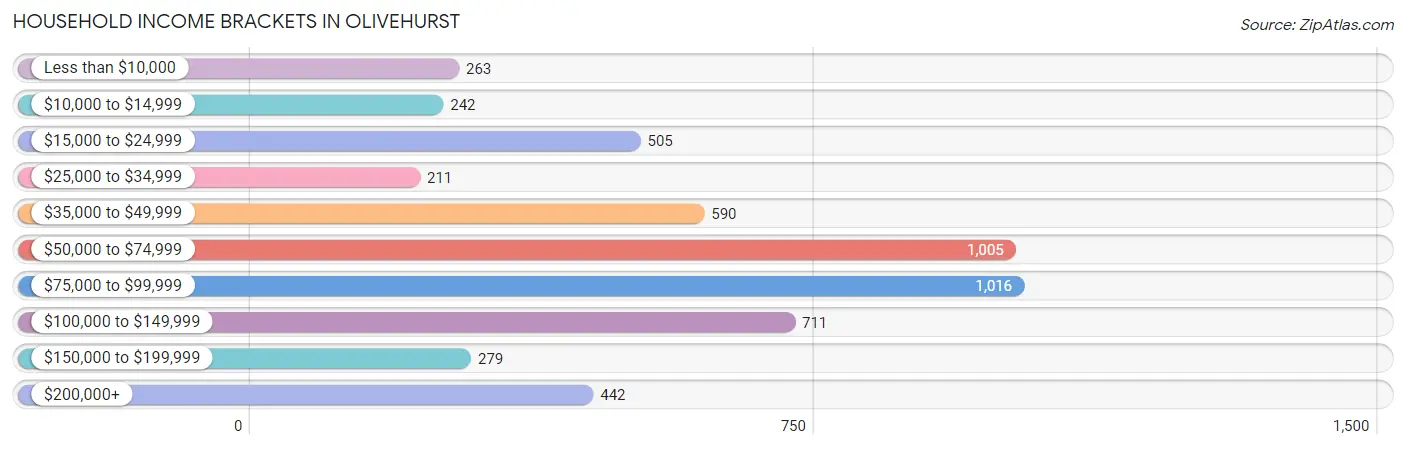
| Income Bracket | # Households | % Households |
| Less than $10,000 | 263 | 5.0% |
| $10,000 to $14,999 | 242 | 4.6% |
| $15,000 to $24,999 | 505 | 9.6% |
| $25,000 to $34,999 | 211 | 4.0% |
| $35,000 to $49,999 | 590 | 11.2% |
| $50,000 to $74,999 | 1,005 | 19.1% |
| $75,000 to $99,999 | 1,016 | 19.3% |
| $100,000 to $149,999 | 711 | 13.5% |
| $150,000 to $199,999 | 279 | 5.3% |
| $200,000+ | 442 | 8.4% |
Household Income by Householder Age in Olivehurst
The median household income in Olivehurst is $69,595, with the highest median household income of $85,564 found in the 45 to 64 years age bracket for the primary householder. A total of 1,607 households (30.5%) fall into this category. Meanwhile, the 65+ years age bracket for the primary householder has the lowest median household income of $30,741, with 1,244 households (23.6%) in this group.
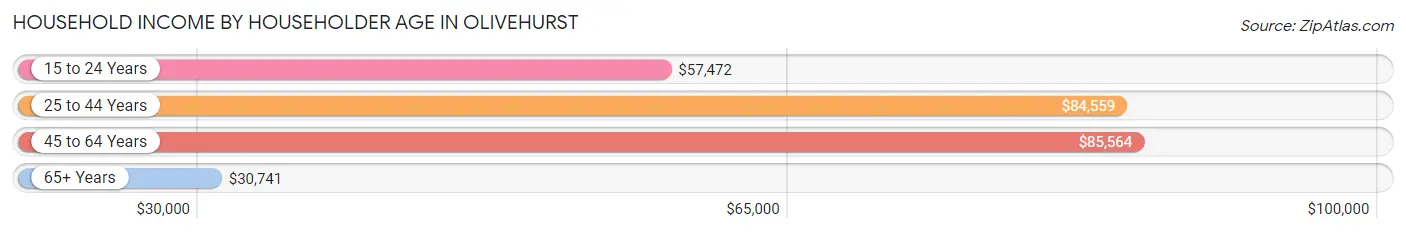
| Income Bracket | # Households | Median Income |
| 15 to 24 Years | 249 (4.7%) | $57,472 |
| 25 to 44 Years | 2,164 (41.1%) | $84,559 |
| 45 to 64 Years | 1,607 (30.5%) | $85,564 |
| 65+ Years | 1,244 (23.6%) | $30,741 |
| Total | 5,264 (100.0%) | $69,595 |
Poverty in Olivehurst
Income Below Poverty by Sex and Age in Olivehurst
With 9.3% poverty level for males and 13.0% for females among the residents of Olivehurst, 15 year old males and 65 to 74 year old females are the most vulnerable to poverty, with 54 males (39.4%) and 186 females (26.4%) in their respective age groups living below the poverty level.
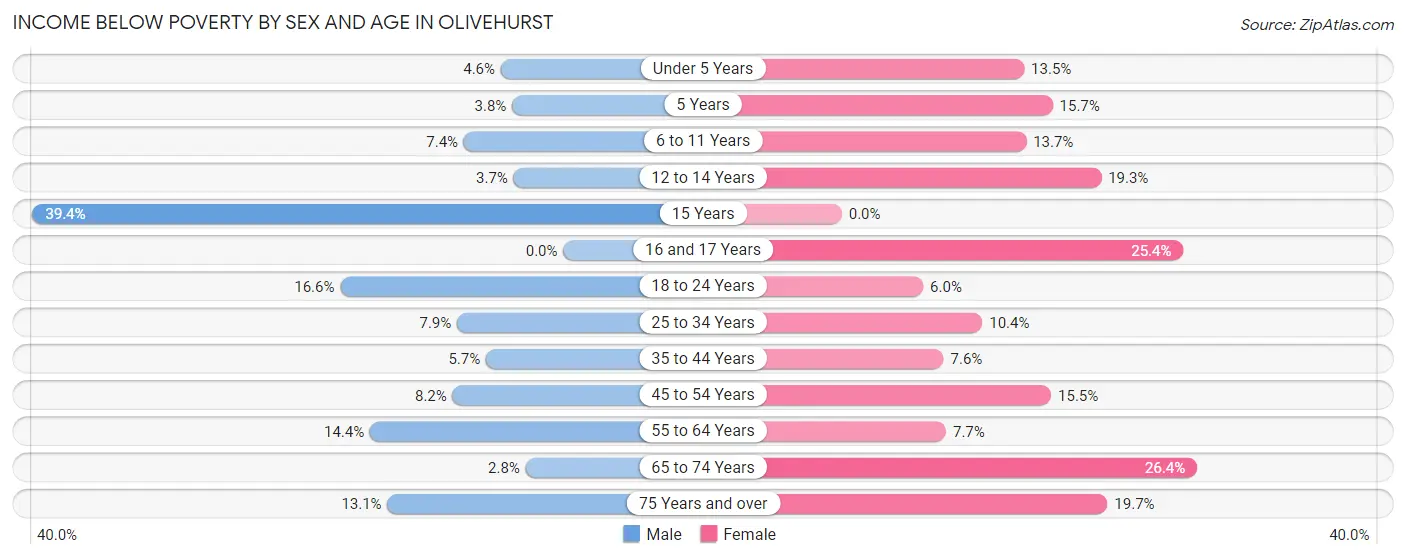
| Age Bracket | Male | Female |
| Under 5 Years | 28 (4.6%) | 67 (13.5%) |
| 5 Years | 3 (3.8%) | 36 (15.7%) |
| 6 to 11 Years | 69 (7.4%) | 105 (13.7%) |
| 12 to 14 Years | 10 (3.7%) | 88 (19.3%) |
| 15 Years | 54 (39.4%) | 0 (0.0%) |
| 16 and 17 Years | 0 (0.0%) | 72 (25.4%) |
| 18 to 24 Years | 188 (16.6%) | 53 (6.0%) |
| 25 to 34 Years | 106 (7.9%) | 165 (10.4%) |
| 35 to 44 Years | 77 (5.7%) | 72 (7.6%) |
| 45 to 54 Years | 69 (8.2%) | 131 (15.5%) |
| 55 to 64 Years | 134 (14.3%) | 74 (7.7%) |
| 65 to 74 Years | 14 (2.8%) | 186 (26.4%) |
| 75 Years and over | 44 (13.1%) | 85 (19.7%) |
| Total | 796 (9.3%) | 1,134 (13.0%) |
Income Above Poverty by Sex and Age in Olivehurst
According to the poverty statistics in Olivehurst, males aged 16 and 17 years and females aged 15 years are the age groups that are most secure financially, with 100.0% of males and 100.0% of females in these age groups living above the poverty line.
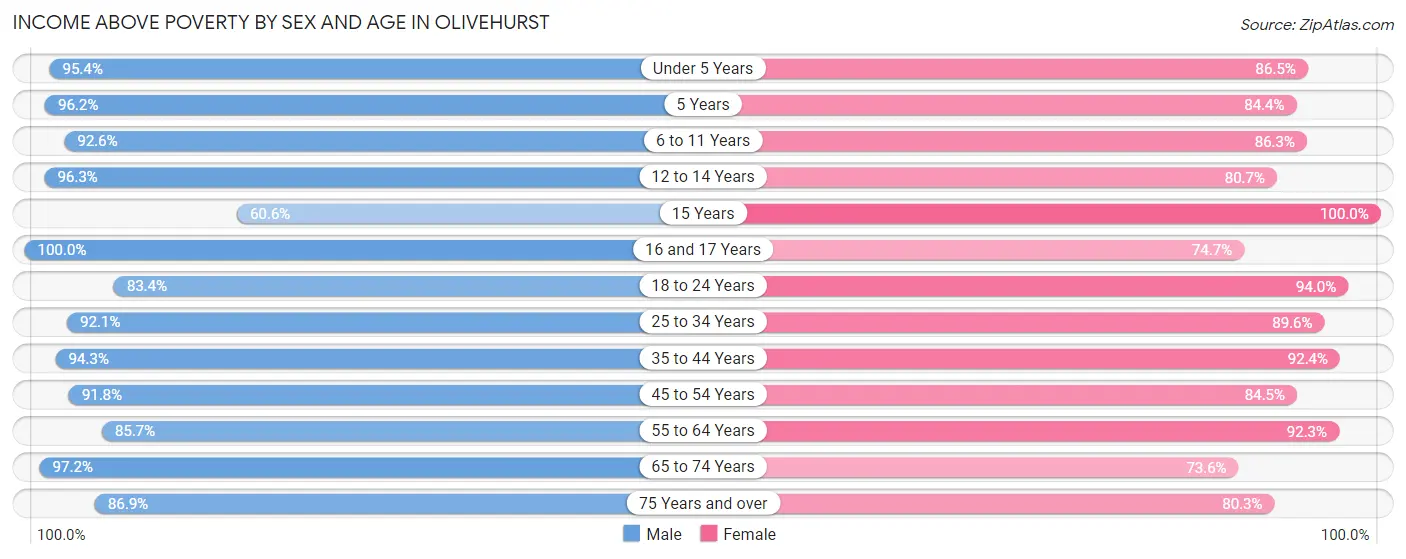
| Age Bracket | Male | Female |
| Under 5 Years | 575 (95.4%) | 428 (86.5%) |
| 5 Years | 76 (96.2%) | 194 (84.4%) |
| 6 to 11 Years | 866 (92.6%) | 662 (86.3%) |
| 12 to 14 Years | 261 (96.3%) | 369 (80.7%) |
| 15 Years | 83 (60.6%) | 144 (100.0%) |
| 16 and 17 Years | 118 (100.0%) | 212 (74.7%) |
| 18 to 24 Years | 947 (83.4%) | 825 (94.0%) |
| 25 to 34 Years | 1,237 (92.1%) | 1,417 (89.6%) |
| 35 to 44 Years | 1,265 (94.3%) | 880 (92.4%) |
| 45 to 54 Years | 770 (91.8%) | 712 (84.5%) |
| 55 to 64 Years | 800 (85.7%) | 882 (92.3%) |
| 65 to 74 Years | 486 (97.2%) | 519 (73.6%) |
| 75 Years and over | 293 (86.9%) | 346 (80.3%) |
| Total | 7,777 (90.7%) | 7,590 (87.0%) |
Income Below Poverty Among Married-Couple Families in Olivehurst
The poverty statistics for married-couple families in Olivehurst show that 3.6% or 97 of the total 2,698 families live below the poverty line. Families with no children have the highest poverty rate of 4.5%, comprising of 44 families. On the other hand, families with 3 or 4 children have the lowest poverty rate of 0.0%, which includes 0 families.
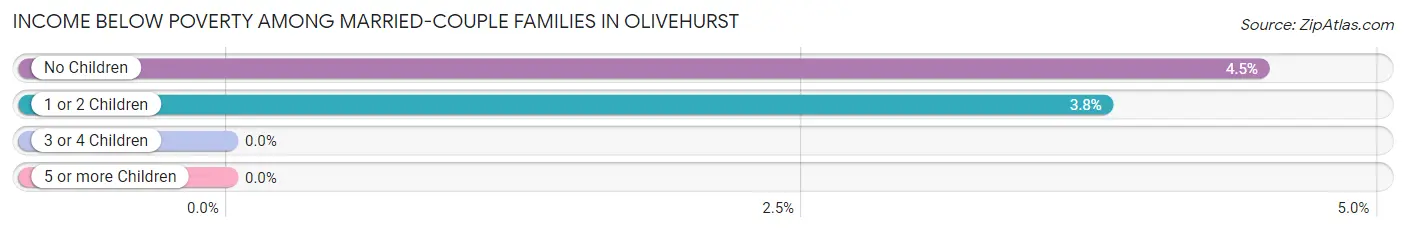
| Children | Above Poverty | Below Poverty |
| No Children | 935 (95.5%) | 44 (4.5%) |
| 1 or 2 Children | 1,339 (96.2%) | 53 (3.8%) |
| 3 or 4 Children | 253 (100.0%) | 0 (0.0%) |
| 5 or more Children | 74 (100.0%) | 0 (0.0%) |
| Total | 2,601 (96.4%) | 97 (3.6%) |
Income Below Poverty Among Single-Parent Households in Olivehurst
According to the poverty data in Olivehurst, 8.3% or 41 single-father households and 28.7% or 174 single-mother households are living below the poverty line. Among single-father households, those with 1 or 2 children have the highest poverty rate, with 41 households (12.7%) experiencing poverty. Likewise, among single-mother households, those with 3 or 4 children have the highest poverty rate, with 38 households (38.4%) falling below the poverty line.
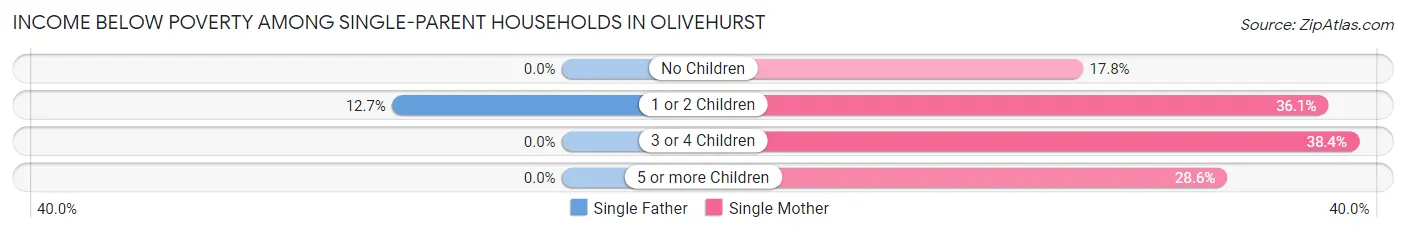
| Children | Single Father | Single Mother |
| No Children | 0 (0.0%) | 45 (17.8%) |
| 1 or 2 Children | 41 (12.7%) | 87 (36.1%) |
| 3 or 4 Children | 0 (0.0%) | 38 (38.4%) |
| 5 or more Children | 0 (0.0%) | 4 (28.6%) |
| Total | 41 (8.3%) | 174 (28.7%) |
Income Below Poverty Among Married-Couple vs Single-Parent Households in Olivehurst
The poverty data for Olivehurst shows that 97 of the married-couple family households (3.6%) and 215 of the single-parent households (19.5%) are living below the poverty level. Within the married-couple family households, those with no children have the highest poverty rate, with 44 households (4.5%) falling below the poverty line. Among the single-parent households, those with 5 or more children have the highest poverty rate, with 4 household (28.6%) living below poverty.
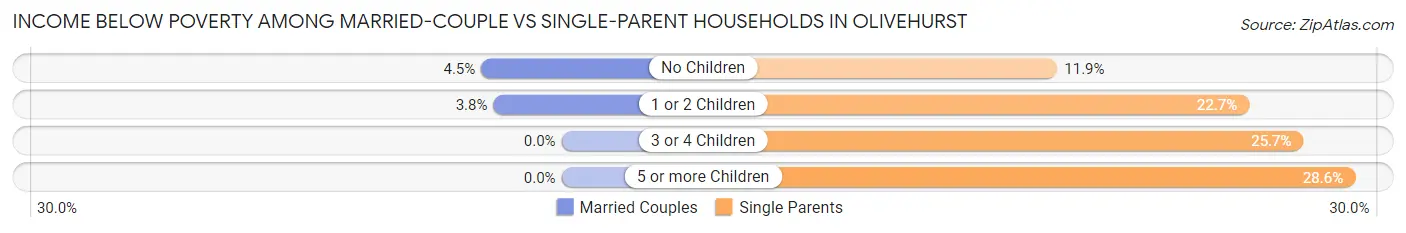
| Children | Married-Couple Families | Single-Parent Households |
| No Children | 44 (4.5%) | 45 (11.9%) |
| 1 or 2 Children | 53 (3.8%) | 128 (22.7%) |
| 3 or 4 Children | 0 (0.0%) | 38 (25.7%) |
| 5 or more Children | 0 (0.0%) | 4 (28.6%) |
| Total | 97 (3.6%) | 215 (19.5%) |
Race in Olivehurst
The most populous races in Olivehurst are White / Caucasian (10,541 | 60.5%), Hispanic or Latino (6,979 | 40.1%), and Two or more Races (2,408 | 13.8%).
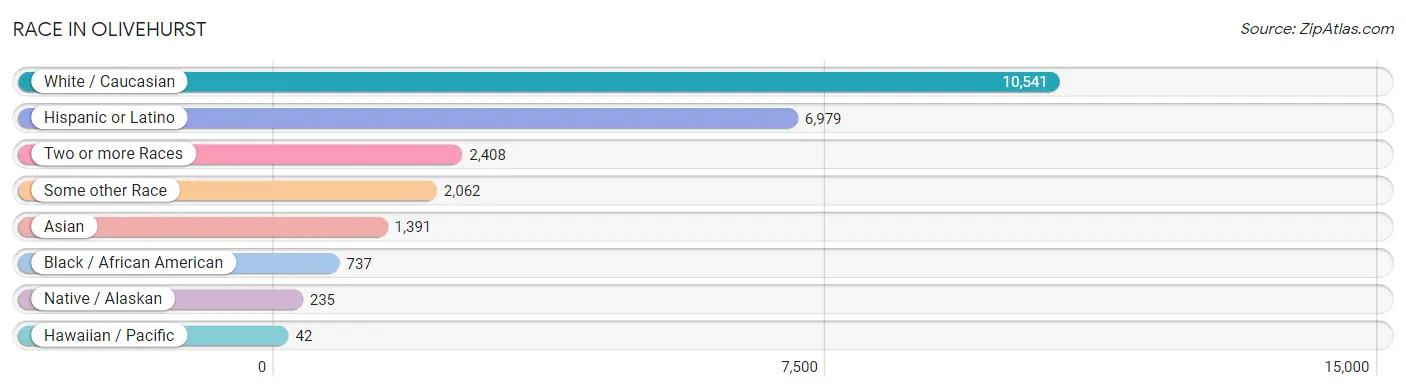
| Race | # Population | % Population |
| Asian | 1,391 | 8.0% |
| Black / African American | 737 | 4.2% |
| Hawaiian / Pacific | 42 | 0.2% |
| Hispanic or Latino | 6,979 | 40.1% |
| Native / Alaskan | 235 | 1.3% |
| White / Caucasian | 10,541 | 60.5% |
| Two or more Races | 2,408 | 13.8% |
| Some other Race | 2,062 | 11.8% |
| Total | 17,416 | 100.0% |
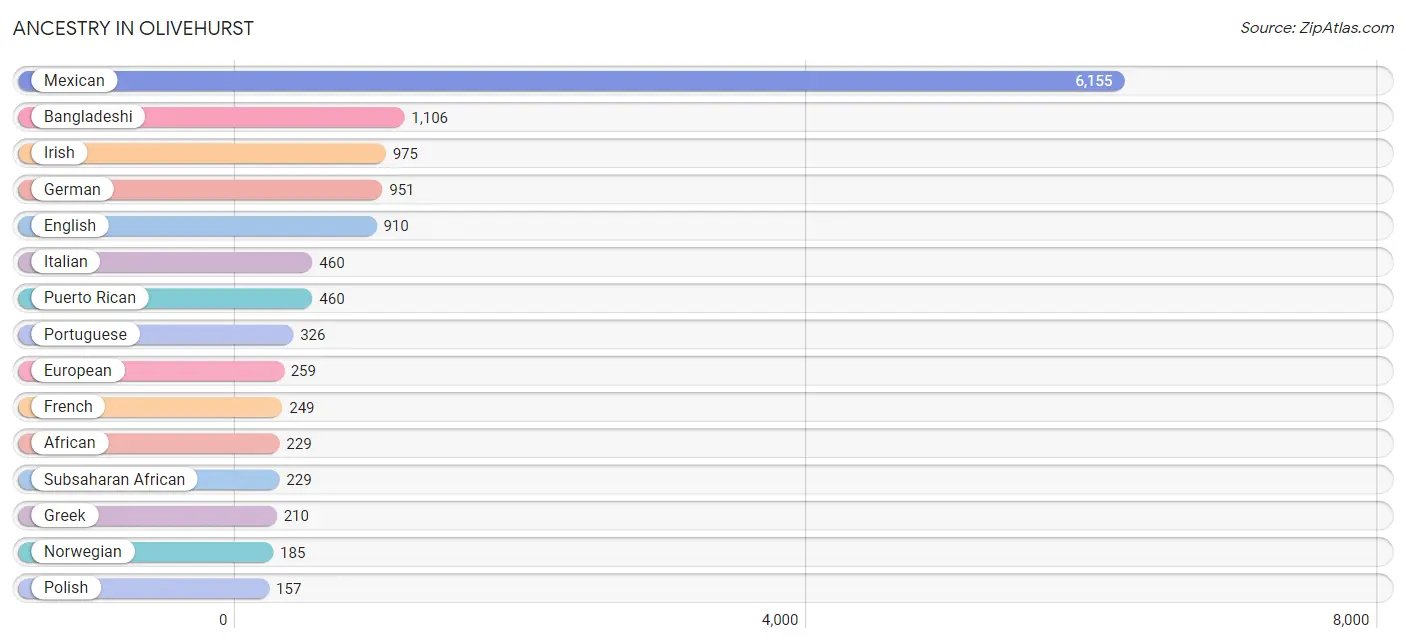
Ancestry in Olivehurst
The most populous ancestries reported in Olivehurst are Mexican (6,155 | 35.3%), Bangladeshi (1,106 | 6.4%), Irish (975 | 5.6%), German (951 | 5.5%), and English (910 | 5.2%), together accounting for 58.0% of all Olivehurst residents.
| Ancestry | # Population | % Population |
| African | 229 | 1.3% |
| American | 144 | 0.8% |
| Apache | 22 | 0.1% |
| Bangladeshi | 1,106 | 6.4% |
| Belgian | 13 | 0.1% |
| Bhutanese | 38 | 0.2% |
| Burmese | 12 | 0.1% |
| Central American | 113 | 0.6% |
| Cherokee | 144 | 0.8% |
| Chippewa | 45 | 0.3% |
| Choctaw | 29 | 0.2% |
| Colombian | 15 | 0.1% |
| Comanche | 7 | 0.0% |
| Creek | 13 | 0.1% |
| Cuban | 38 | 0.2% |
| Dutch | 48 | 0.3% |
| Dutch West Indian | 27 | 0.2% |
| Eastern European | 28 | 0.2% |
| English | 910 | 5.2% |
| European | 259 | 1.5% |
| French | 249 | 1.4% |
| French Canadian | 20 | 0.1% |
| German | 951 | 5.5% |
| Greek | 210 | 1.2% |
| Guamanian / Chamorro | 116 | 0.7% |
| Indian (Asian) | 138 | 0.8% |
| Irish | 975 | 5.6% |
| Italian | 460 | 2.6% |
| Japanese | 13 | 0.1% |
| Korean | 87 | 0.5% |
| Malaysian | 47 | 0.3% |
| Mexican | 6,155 | 35.3% |
| Mexican American Indian | 83 | 0.5% |
| Nicaraguan | 88 | 0.5% |
| Northern European | 61 | 0.4% |
| Norwegian | 185 | 1.1% |
| Polish | 157 | 0.9% |
| Portuguese | 326 | 1.9% |
| Puerto Rican | 460 | 2.6% |
| Russian | 62 | 0.4% |
| Salvadoran | 25 | 0.1% |
| Scotch-Irish | 48 | 0.3% |
| Scottish | 55 | 0.3% |
| Sioux | 15 | 0.1% |
| Slovak | 11 | 0.1% |
| South American | 15 | 0.1% |
| Spaniard | 52 | 0.3% |
| Spanish | 28 | 0.2% |
| Sri Lankan | 11 | 0.1% |
| Subsaharan African | 229 | 1.3% |
| Swedish | 20 | 0.1% |
| Swiss | 25 | 0.1% |
| Thai | 44 | 0.3% |
| Welsh | 118 | 0.7% |
| Yaqui | 22 | 0.1% | View All 55 Rows |
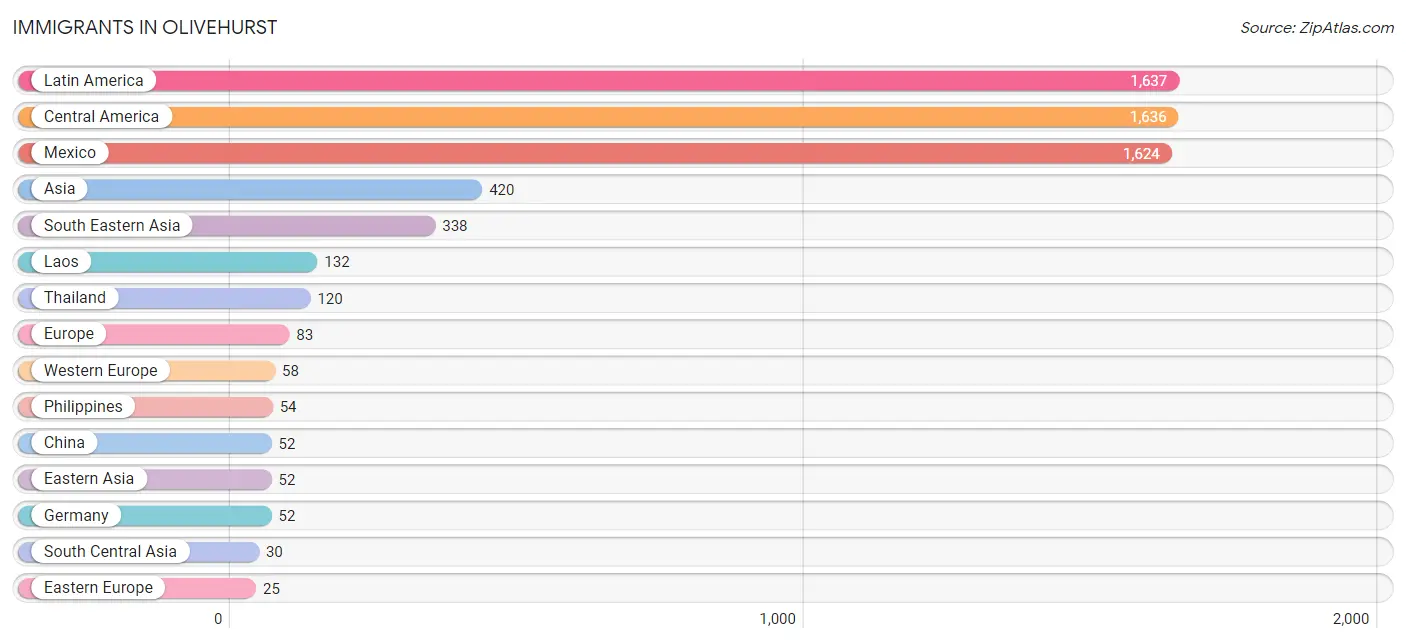
Immigrants in Olivehurst
The most numerous immigrant groups reported in Olivehurst came from Latin America (1,637 | 9.4%), Central America (1,636 | 9.4%), Mexico (1,624 | 9.3%), Asia (420 | 2.4%), and South Eastern Asia (338 | 1.9%), together accounting for 32.5% of all Olivehurst residents.
| Immigration Origin | # Population | % Population |
| Asia | 420 | 2.4% |
| Cambodia | 17 | 0.1% |
| Canada | 24 | 0.1% |
| Caribbean | 1 | 0.0% |
| Central America | 1,636 | 9.4% |
| China | 52 | 0.3% |
| Cuba | 1 | 0.0% |
| Eastern Asia | 52 | 0.3% |
| Eastern Europe | 25 | 0.1% |
| Europe | 83 | 0.5% |
| France | 6 | 0.0% |
| Germany | 52 | 0.3% |
| Laos | 132 | 0.8% |
| Latin America | 1,637 | 9.4% |
| Mexico | 1,624 | 9.3% |
| Nicaragua | 12 | 0.1% |
| Pakistan | 14 | 0.1% |
| Philippines | 54 | 0.3% |
| Russia | 25 | 0.1% |
| South Central Asia | 30 | 0.2% |
| South Eastern Asia | 338 | 1.9% |
| Thailand | 120 | 0.7% |
| Uzbekistan | 16 | 0.1% |
| Vietnam | 15 | 0.1% |
| Western Europe | 58 | 0.3% | View All 25 Rows |
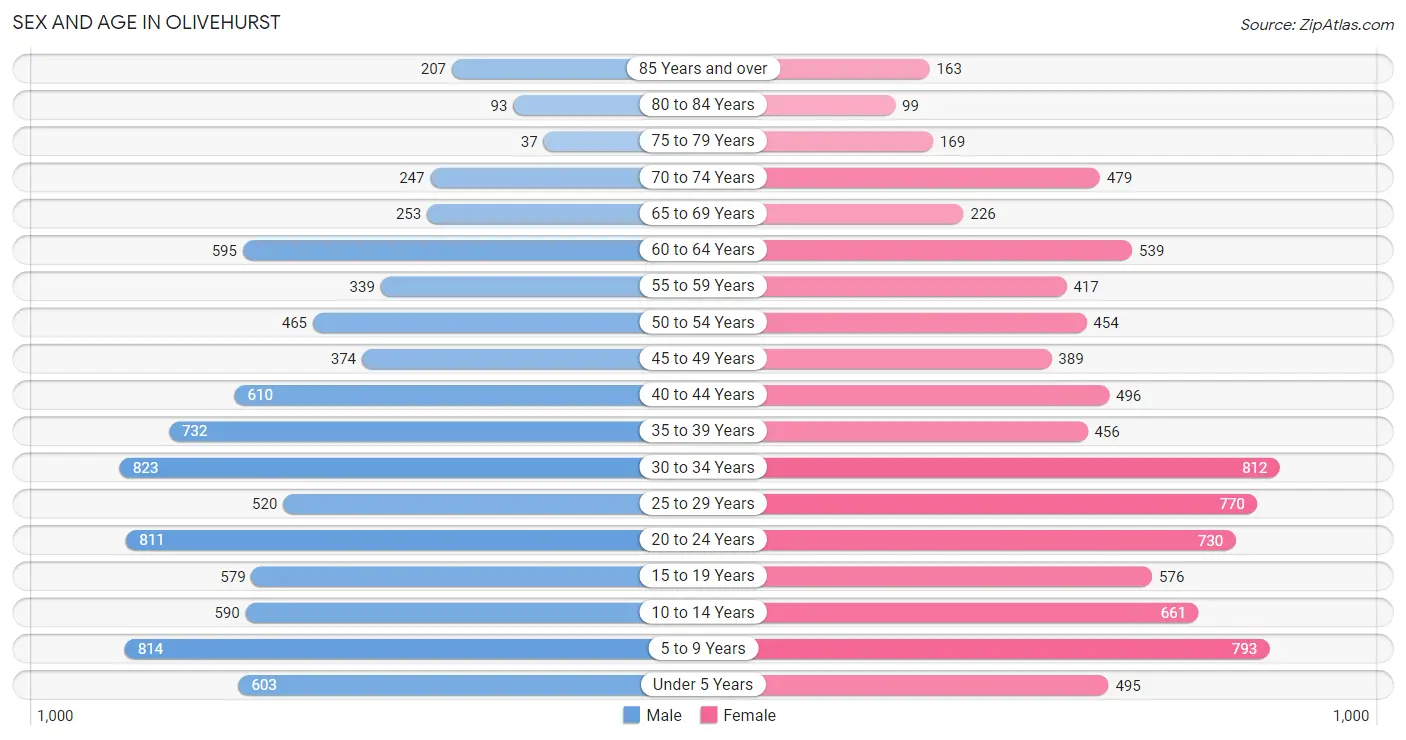
Sex and Age in Olivehurst
Sex and Age in Olivehurst
The most populous age groups in Olivehurst are 30 to 34 Years (823 | 9.5%) for men and 30 to 34 Years (812 | 9.3%) for women.
| Age Bracket | Male | Female |
| Under 5 Years | 603 (6.9%) | 495 (5.7%) |
| 5 to 9 Years | 814 (9.4%) | 793 (9.1%) |
| 10 to 14 Years | 590 (6.8%) | 661 (7.6%) |
| 15 to 19 Years | 579 (6.7%) | 576 (6.6%) |
| 20 to 24 Years | 811 (9.3%) | 730 (8.4%) |
| 25 to 29 Years | 520 (6.0%) | 770 (8.8%) |
| 30 to 34 Years | 823 (9.5%) | 812 (9.3%) |
| 35 to 39 Years | 732 (8.4%) | 456 (5.2%) |
| 40 to 44 Years | 610 (7.0%) | 496 (5.7%) |
| 45 to 49 Years | 374 (4.3%) | 389 (4.5%) |
| 50 to 54 Years | 465 (5.3%) | 454 (5.2%) |
| 55 to 59 Years | 339 (3.9%) | 417 (4.8%) |
| 60 to 64 Years | 595 (6.9%) | 539 (6.2%) |
| 65 to 69 Years | 253 (2.9%) | 226 (2.6%) |
| 70 to 74 Years | 247 (2.8%) | 479 (5.5%) |
| 75 to 79 Years | 37 (0.4%) | 169 (1.9%) |
| 80 to 84 Years | 93 (1.1%) | 99 (1.1%) |
| 85 Years and over | 207 (2.4%) | 163 (1.9%) |
| Total | 8,692 (100.0%) | 8,724 (100.0%) |
Families and Households in Olivehurst
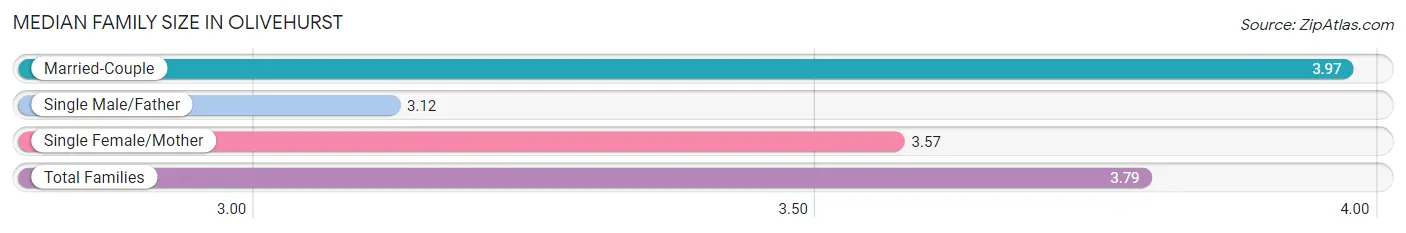
Median Family Size in Olivehurst
The median family size in Olivehurst is 3.79 persons per family, with married-couple families (2,698 | 71.0%) accounting for the largest median family size of 3.97 persons per family. On the other hand, single male/father families (497 | 13.1%) represent the smallest median family size with 3.12 persons per family.
| Family Type | # Families | Family Size |
| Married-Couple | 2,698 (71.0%) | 3.97 |
| Single Male/Father | 497 (13.1%) | 3.12 |
| Single Female/Mother | 607 (16.0%) | 3.57 |
| Total Families | 3,802 (100.0%) | 3.79 |
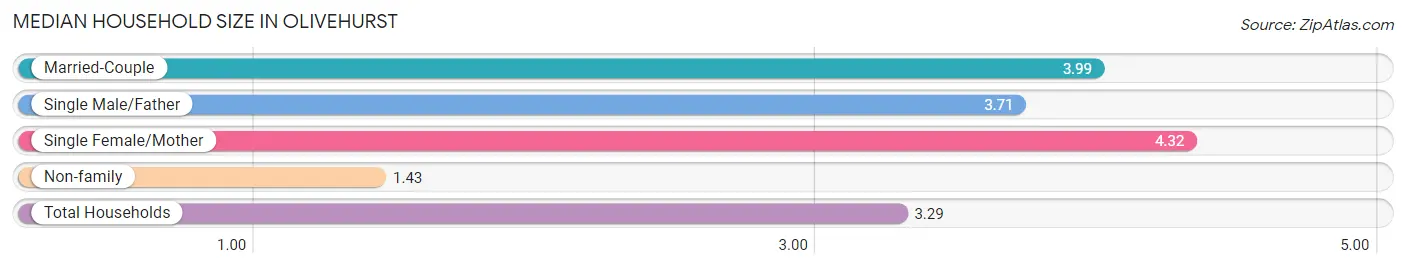
Median Household Size in Olivehurst
The median household size in Olivehurst is 3.29 persons per household, with single female/mother households (607 | 11.5%) accounting for the largest median household size of 4.32 persons per household. non-family households (1,462 | 27.8%) represent the smallest median household size with 1.43 persons per household.
| Household Type | # Households | Household Size |
| Married-Couple | 2,698 (51.2%) | 3.99 |
| Single Male/Father | 497 (9.4%) | 3.71 |
| Single Female/Mother | 607 (11.5%) | 4.32 |
| Non-family | 1,462 (27.8%) | 1.43 |
| Total Households | 5,264 (100.0%) | 3.29 |
Household Size by Marriage Status in Olivehurst
Out of a total of 5,264 households in Olivehurst, 3,802 (72.2%) are family households, while 1,462 (27.8%) are nonfamily households. The most numerous type of family households are 4-person households, comprising 1,049, and the most common type of nonfamily households are 1-person households, comprising 1,077.
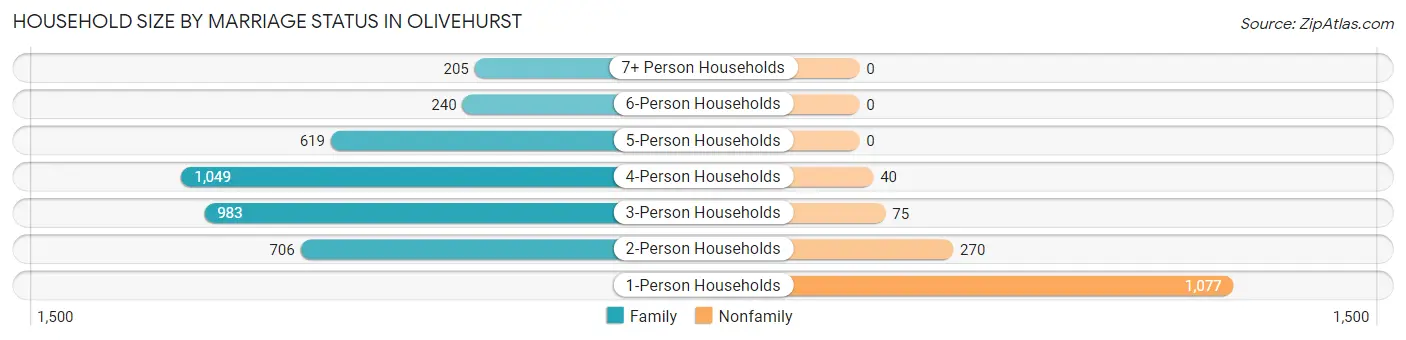
| Household Size | Family Households | Nonfamily Households |
| 1-Person Households | - | 1,077 (20.5%) |
| 2-Person Households | 706 (13.4%) | 270 (5.1%) |
| 3-Person Households | 983 (18.7%) | 75 (1.4%) |
| 4-Person Households | 1,049 (19.9%) | 40 (0.8%) |
| 5-Person Households | 619 (11.8%) | 0 (0.0%) |
| 6-Person Households | 240 (4.6%) | 0 (0.0%) |
| 7+ Person Households | 205 (3.9%) | 0 (0.0%) |
| Total | 3,802 (72.2%) | 1,462 (27.8%) |
Female Fertility in Olivehurst
Fertility by Age in Olivehurst
Average fertility rate in Olivehurst is 96.0 births per 1,000 women. Women in the age bracket of 20 to 34 years have the highest fertility rate with 167.0 births per 1,000 women. Women in the age bracket of 20 to 34 years acount for 94.6% of all women with births.
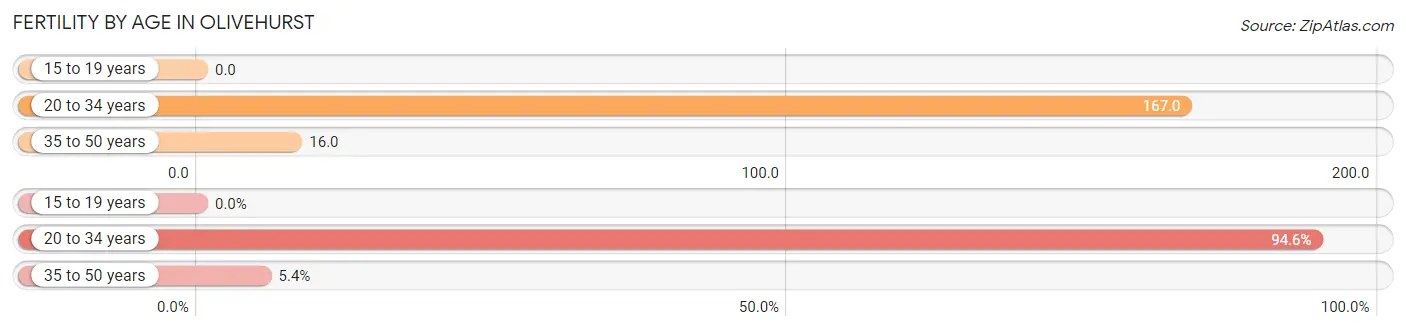
| Age Bracket | Women with Births | Births / 1,000 Women |
| 15 to 19 years | 0 (0.0%) | 0.0 |
| 20 to 34 years | 386 (94.6%) | 167.0 |
| 35 to 50 years | 22 (5.4%) | 16.0 |
| Total | 408 (100.0%) | 96.0 |
Fertility by Age by Marriage Status in Olivehurst
51.2% of women with births (408) in Olivehurst are married. The highest percentage of unmarried women with births falls into 20 to 34 years age bracket with 49.0% of them unmarried at the time of birth, while the lowest percentage of unmarried women with births belong to 35 to 50 years age bracket with 45.5% of them unmarried.
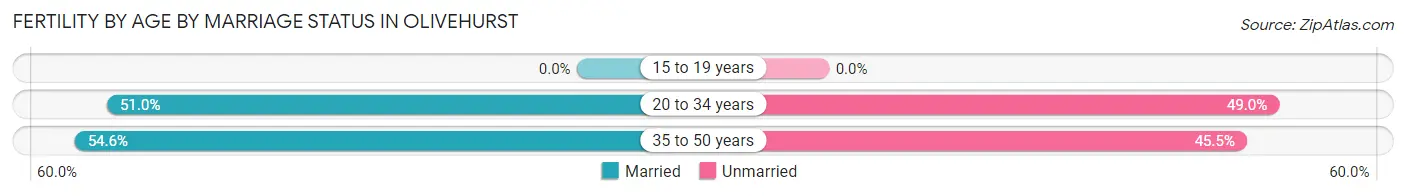
| Age Bracket | Married | Unmarried |
| 15 to 19 years | 0 (0.0%) | 0 (0.0%) |
| 20 to 34 years | 197 (51.0%) | 189 (49.0%) |
| 35 to 50 years | 12 (54.5%) | 10 (45.5%) |
| Total | 209 (51.2%) | 199 (48.8%) |
Fertility by Education in Olivehurst
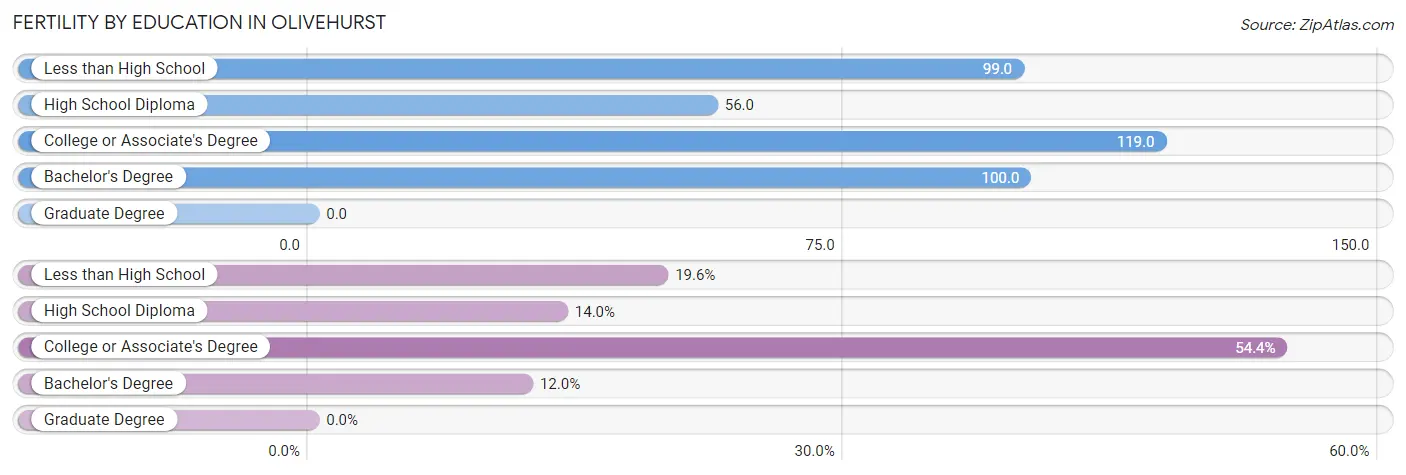
| Educational Attainment | Women with Births | Births / 1,000 Women |
| Less than High School | 80 (19.6%) | 99.0 |
| High School Diploma | 57 (14.0%) | 56.0 |
| College or Associate's Degree | 222 (54.4%) | 119.0 |
| Bachelor's Degree | 49 (12.0%) | 100.0 |
| Graduate Degree | 0 (0.0%) | 0.0 |
| Total | 408 (100.0%) | 96.0 |
Fertility by Education by Marriage Status in Olivehurst
48.8% of women with births in Olivehurst are unmarried. Women with the educational attainment of less than high school are most likely to be married with 100.0% of them married at childbirth, while women with the educational attainment of bachelor's degree are least likely to be married with 100.0% of them unmarried at childbirth.
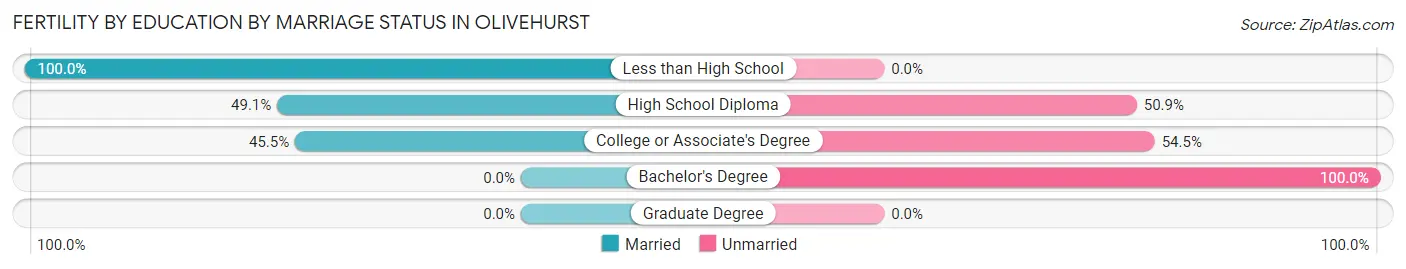
| Educational Attainment | Married | Unmarried |
| Less than High School | 80 (100.0%) | 0 (0.0%) |
| High School Diploma | 28 (49.1%) | 29 (50.9%) |
| College or Associate's Degree | 101 (45.5%) | 121 (54.5%) |
| Bachelor's Degree | 0 (0.0%) | 49 (100.0%) |
| Graduate Degree | 0 (0.0%) | 0 (0.0%) |
| Total | 209 (51.2%) | 199 (48.8%) |
Employment Characteristics in Olivehurst
Employment by Class of Employer in Olivehurst
Among the 7,660 employed individuals in Olivehurst, private company employees (4,624 | 60.4%), not-for-profit organizations (696 | 9.1%), and federal government employees (632 | 8.3%) make up the most common classes of employment.
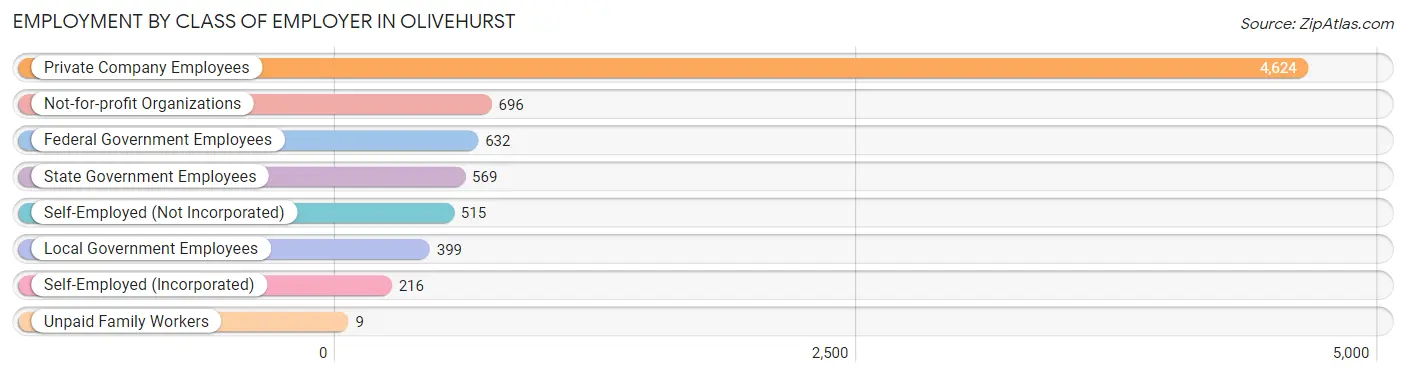
| Employer Class | # Employees | % Employees |
| Private Company Employees | 4,624 | 60.4% |
| Self-Employed (Incorporated) | 216 | 2.8% |
| Self-Employed (Not Incorporated) | 515 | 6.7% |
| Not-for-profit Organizations | 696 | 9.1% |
| Local Government Employees | 399 | 5.2% |
| State Government Employees | 569 | 7.4% |
| Federal Government Employees | 632 | 8.3% |
| Unpaid Family Workers | 9 | 0.1% |
| Total | 7,660 | 100.0% |
Employment Status by Age in Olivehurst
According to the labor force statistics for Olivehurst, out of the total population over 16 years of age (13,179), 63.7% or 8,395 individuals are in the labor force, with 7.3% or 613 of them unemployed. The age group with the highest labor force participation rate is 35 to 44 years, with 86.5% or 1,984 individuals in the labor force. Within the labor force, the 16 to 19 years age range has the highest percentage of unemployed individuals, with 41.5% or 114 of them being unemployed.
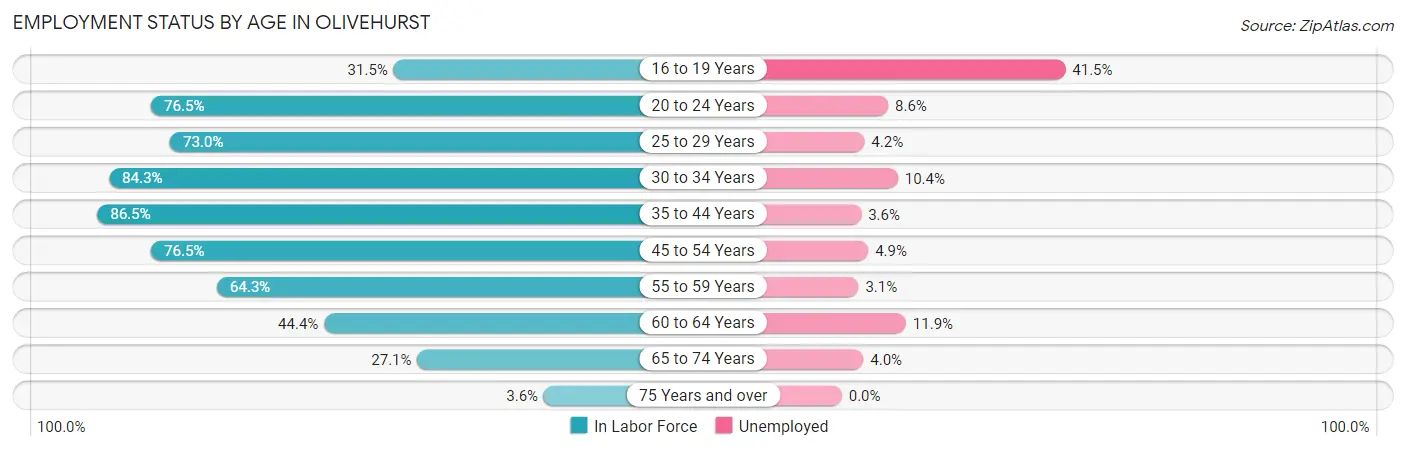
| Age Bracket | In Labor Force | Unemployed |
| 16 to 19 Years | 275 (31.5%) | 114 (41.5%) |
| 20 to 24 Years | 1,179 (76.5%) | 101 (8.6%) |
| 25 to 29 Years | 942 (73.0%) | 40 (4.2%) |
| 30 to 34 Years | 1,378 (84.3%) | 143 (10.4%) |
| 35 to 44 Years | 1,984 (86.5%) | 71 (3.6%) |
| 45 to 54 Years | 1,287 (76.5%) | 63 (4.9%) |
| 55 to 59 Years | 486 (64.3%) | 15 (3.1%) |
| 60 to 64 Years | 503 (44.4%) | 60 (11.9%) |
| 65 to 74 Years | 327 (27.1%) | 13 (4.0%) |
| 75 Years and over | 28 (3.6%) | 0 (0.0%) |
| Total | 8,395 (63.7%) | 613 (7.3%) |
Employment Status by Educational Attainment in Olivehurst
According to labor force statistics for Olivehurst, 74.9% of individuals (6,584) out of the total population between 25 and 64 years of age (8,791) are in the labor force, with 5.9% or 388 of them being unemployed. The group with the highest labor force participation rate are those with the educational attainment of bachelor's degree or higher, with 94.5% or 1,309 individuals in the labor force. Within the labor force, individuals with college / associate degree education have the highest percentage of unemployment, with 10.6% or 290 of them being unemployed.
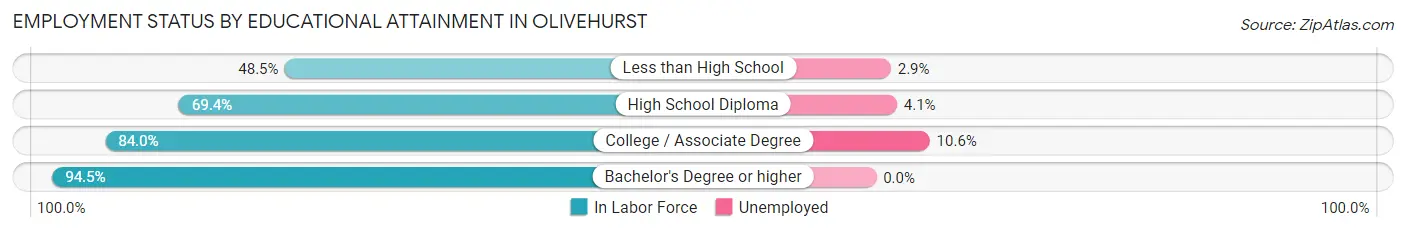
| Educational Attainment | In Labor Force | Unemployed |
| Less than High School | 790 (48.5%) | 47 (2.9%) |
| High School Diploma | 1,752 (69.4%) | 103 (4.1%) |
| College / Associate Degree | 2,733 (84.0%) | 345 (10.6%) |
| Bachelor's Degree or higher | 1,309 (94.5%) | 0 (0.0%) |
| Total | 6,584 (74.9%) | 519 (5.9%) |
Employment Occupations by Sex in Olivehurst
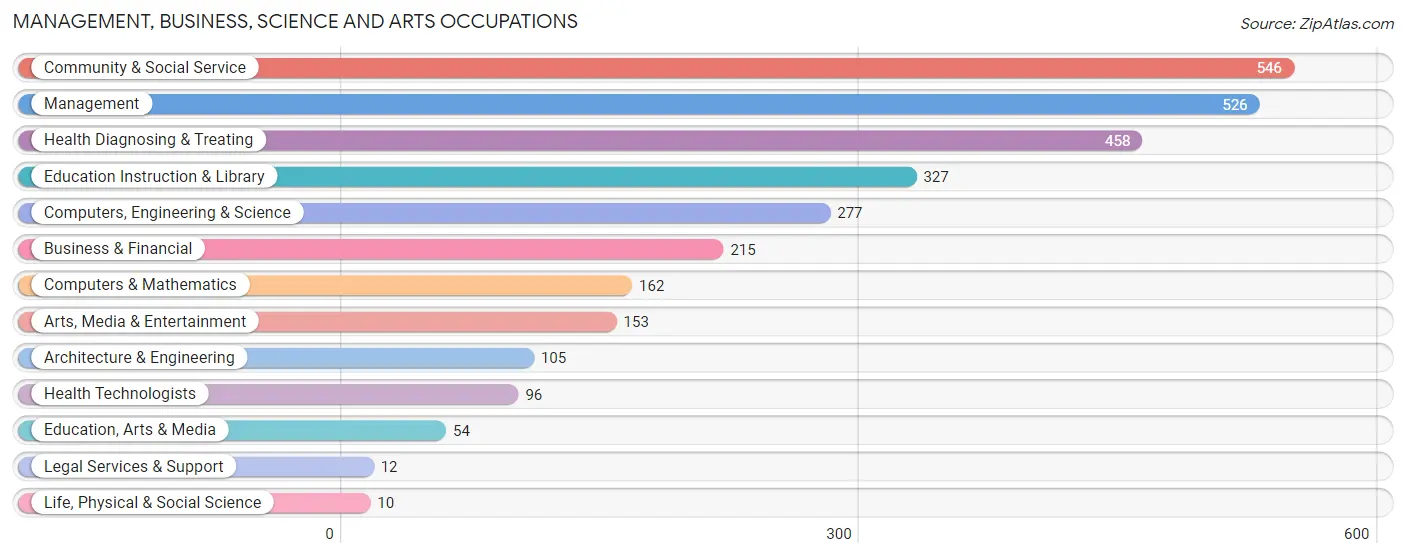
Management, Business, Science and Arts Occupations
The most common Management, Business, Science and Arts occupations in Olivehurst are Community & Social Service (546 | 7.4%), Management (526 | 7.1%), Health Diagnosing & Treating (458 | 6.2%), Education Instruction & Library (327 | 4.4%), and Computers, Engineering & Science (277 | 3.7%).
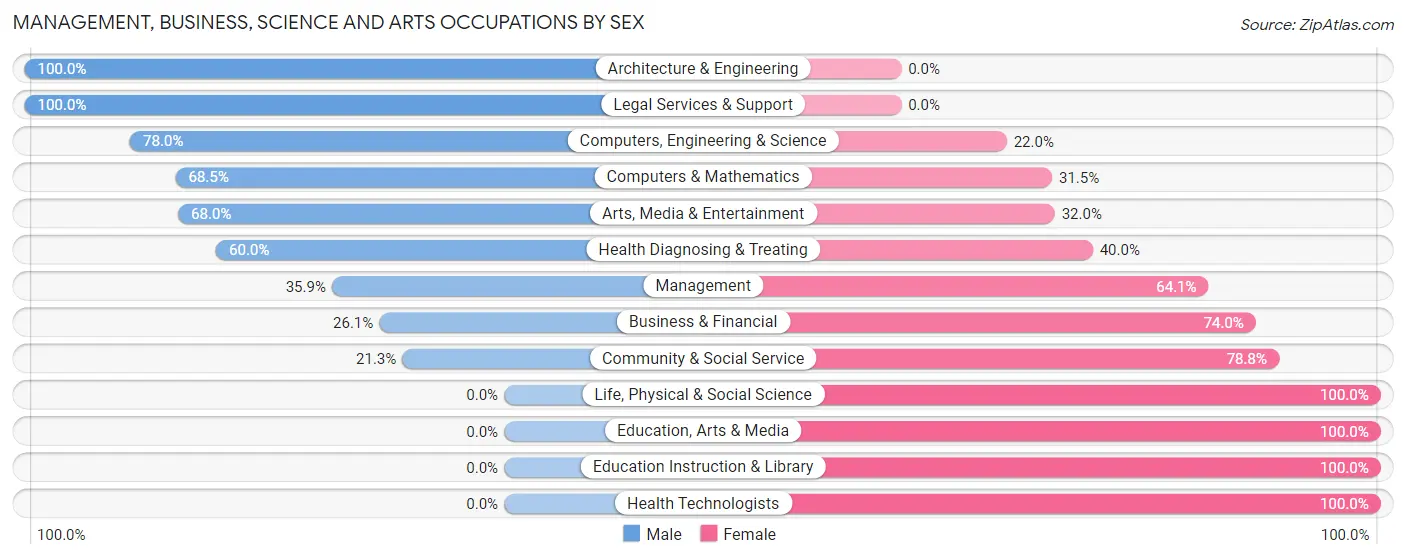
Management, Business, Science and Arts Occupations by Sex
Within the Management, Business, Science and Arts occupations in Olivehurst, the most male-oriented occupations are Architecture & Engineering (100.0%), Legal Services & Support (100.0%), and Computers, Engineering & Science (78.0%), while the most female-oriented occupations are Life, Physical & Social Science (100.0%), Education, Arts & Media (100.0%), and Education Instruction & Library (100.0%).
| Occupation | Male | Female |
| Management | 189 (35.9%) | 337 (64.1%) |
| Business & Financial | 56 (26.1%) | 159 (74.0%) |
| Computers, Engineering & Science | 216 (78.0%) | 61 (22.0%) |
| Computers & Mathematics | 111 (68.5%) | 51 (31.5%) |
| Architecture & Engineering | 105 (100.0%) | 0 (0.0%) |
| Life, Physical & Social Science | 0 (0.0%) | 10 (100.0%) |
| Community & Social Service | 116 (21.2%) | 430 (78.7%) |
| Education, Arts & Media | 0 (0.0%) | 54 (100.0%) |
| Legal Services & Support | 12 (100.0%) | 0 (0.0%) |
| Education Instruction & Library | 0 (0.0%) | 327 (100.0%) |
| Arts, Media & Entertainment | 104 (68.0%) | 49 (32.0%) |
| Health Diagnosing & Treating | 275 (60.0%) | 183 (40.0%) |
| Health Technologists | 0 (0.0%) | 96 (100.0%) |
| Total (Category) | 852 (42.1%) | 1,170 (57.9%) |
| Total (Overall) | 3,754 (50.7%) | 3,643 (49.2%) |
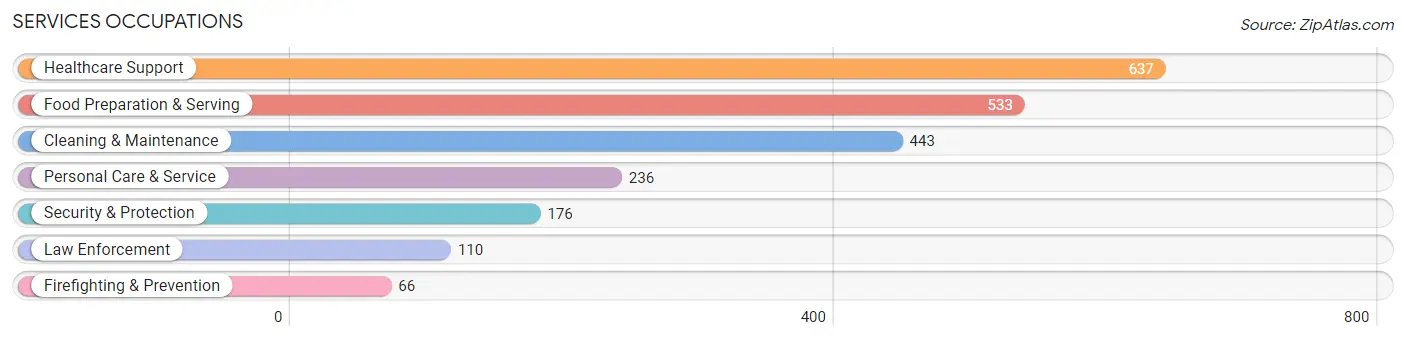
Services Occupations
The most common Services occupations in Olivehurst are Healthcare Support (637 | 8.6%), Food Preparation & Serving (533 | 7.2%), Cleaning & Maintenance (443 | 6.0%), Personal Care & Service (236 | 3.2%), and Security & Protection (176 | 2.4%).
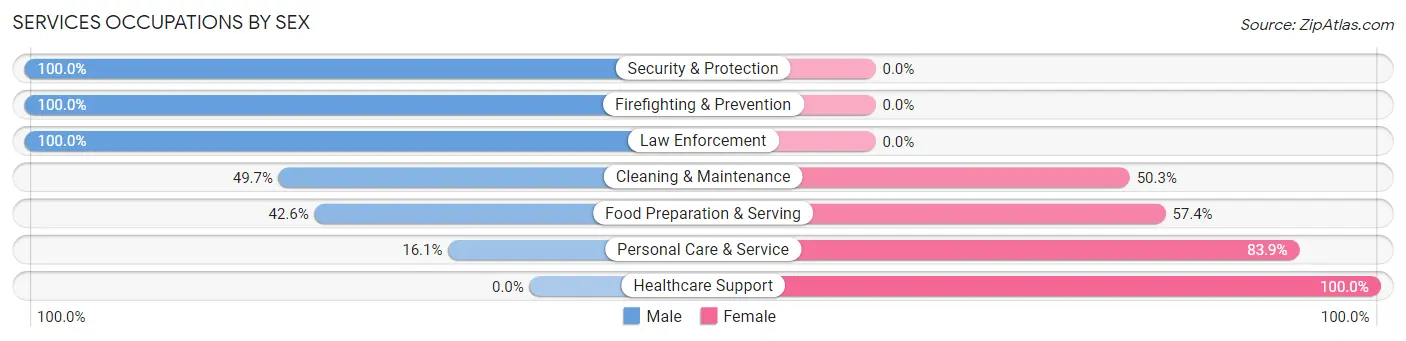
Services Occupations by Sex
Within the Services occupations in Olivehurst, the most male-oriented occupations are Security & Protection (100.0%), Firefighting & Prevention (100.0%), and Law Enforcement (100.0%), while the most female-oriented occupations are Healthcare Support (100.0%), Personal Care & Service (83.9%), and Food Preparation & Serving (57.4%).
| Occupation | Male | Female |
| Healthcare Support | 0 (0.0%) | 637 (100.0%) |
| Security & Protection | 176 (100.0%) | 0 (0.0%) |
| Firefighting & Prevention | 66 (100.0%) | 0 (0.0%) |
| Law Enforcement | 110 (100.0%) | 0 (0.0%) |
| Food Preparation & Serving | 227 (42.6%) | 306 (57.4%) |
| Cleaning & Maintenance | 220 (49.7%) | 223 (50.3%) |
| Personal Care & Service | 38 (16.1%) | 198 (83.9%) |
| Total (Category) | 661 (32.6%) | 1,364 (67.4%) |
| Total (Overall) | 3,754 (50.7%) | 3,643 (49.2%) |
Sales and Office Occupations
The most common Sales and Office occupations in Olivehurst are Office & Administration (728 | 9.8%), and Sales & Related (624 | 8.4%).
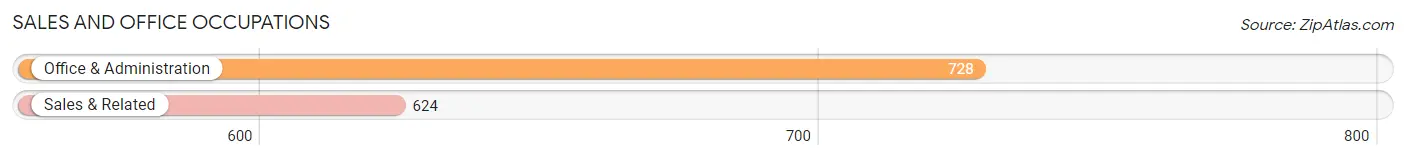
Sales and Office Occupations by Sex
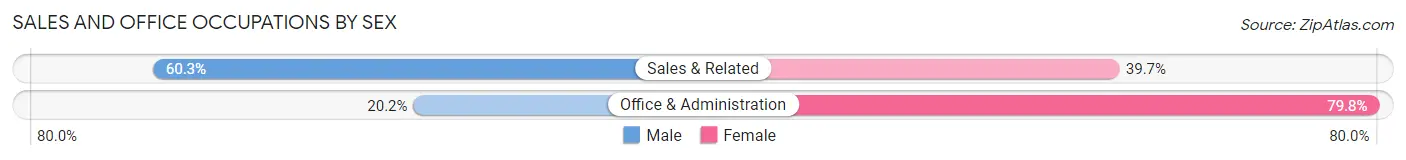
| Occupation | Male | Female |
| Sales & Related | 376 (60.3%) | 248 (39.7%) |
| Office & Administration | 147 (20.2%) | 581 (79.8%) |
| Total (Category) | 523 (38.7%) | 829 (61.3%) |
| Total (Overall) | 3,754 (50.7%) | 3,643 (49.2%) |
Natural Resources, Construction and Maintenance Occupations
The most common Natural Resources, Construction and Maintenance occupations in Olivehurst are Construction & Extraction (366 | 5.0%), Installation, Maintenance & Repair (345 | 4.7%), and Farming, Fishing & Forestry (215 | 2.9%).
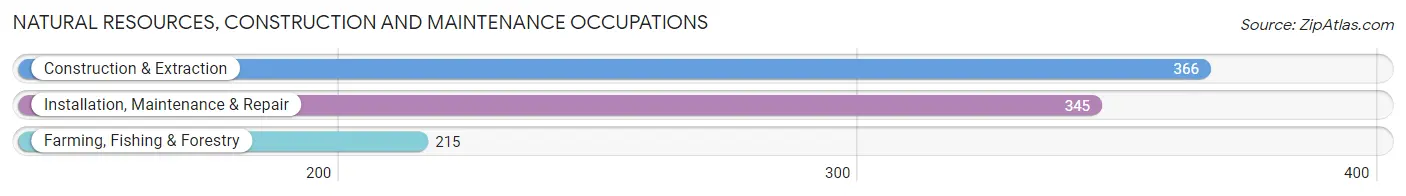
Natural Resources, Construction and Maintenance Occupations by Sex
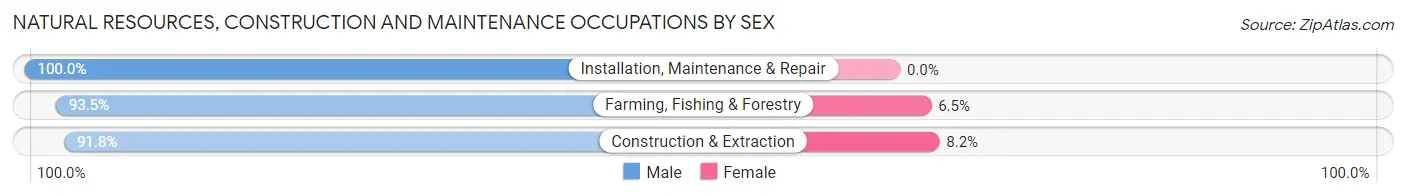
| Occupation | Male | Female |
| Farming, Fishing & Forestry | 201 (93.5%) | 14 (6.5%) |
| Construction & Extraction | 336 (91.8%) | 30 (8.2%) |
| Installation, Maintenance & Repair | 345 (100.0%) | 0 (0.0%) |
| Total (Category) | 882 (95.3%) | 44 (4.8%) |
| Total (Overall) | 3,754 (50.7%) | 3,643 (49.2%) |
Production, Transportation and Moving Occupations
The most common Production, Transportation and Moving occupations in Olivehurst are Production (469 | 6.3%), Transportation (320 | 4.3%), and Material Moving (283 | 3.8%).
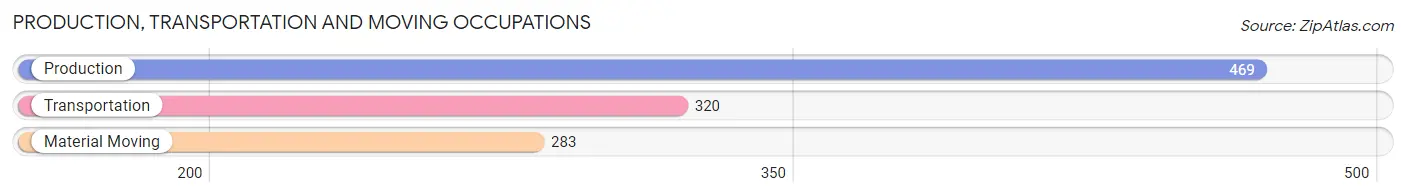
Production, Transportation and Moving Occupations by Sex
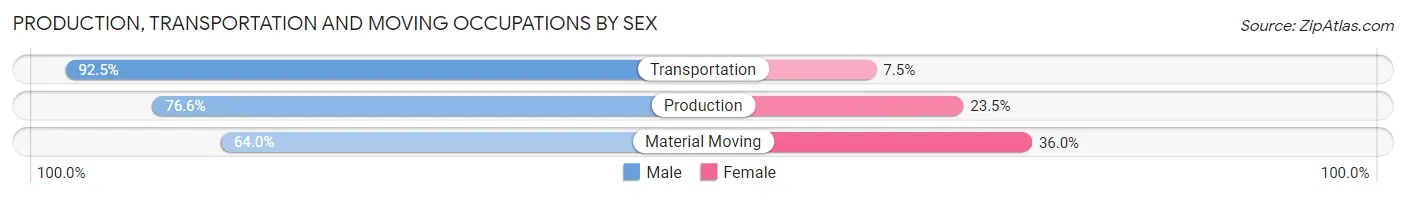
| Occupation | Male | Female |
| Production | 359 (76.5%) | 110 (23.4%) |
| Transportation | 296 (92.5%) | 24 (7.5%) |
| Material Moving | 181 (64.0%) | 102 (36.0%) |
| Total (Category) | 836 (78.0%) | 236 (22.0%) |
| Total (Overall) | 3,754 (50.7%) | 3,643 (49.2%) |
Employment Industries by Sex in Olivehurst
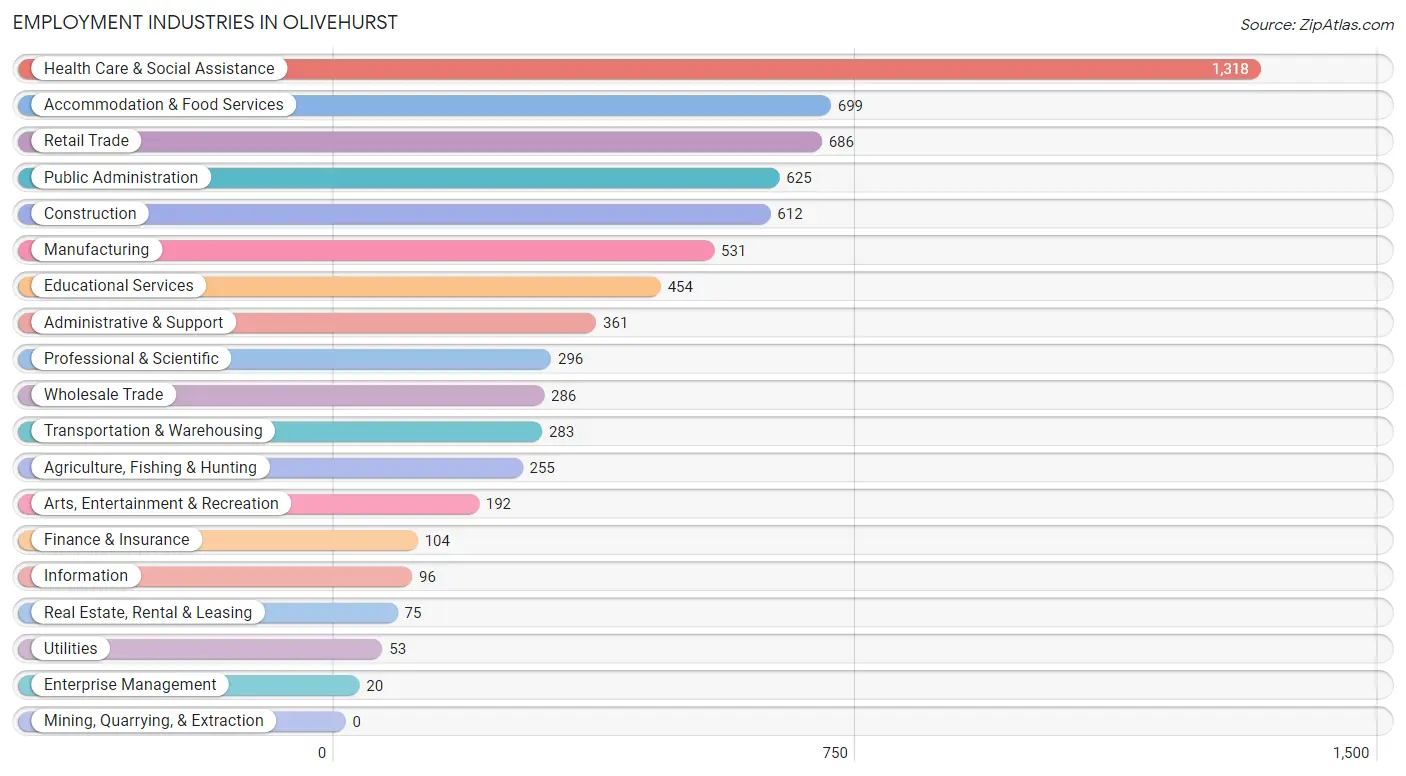
Employment Industries in Olivehurst
The major employment industries in Olivehurst include Health Care & Social Assistance (1,318 | 17.8%), Accommodation & Food Services (699 | 9.5%), Retail Trade (686 | 9.3%), Public Administration (625 | 8.5%), and Construction (612 | 8.3%).
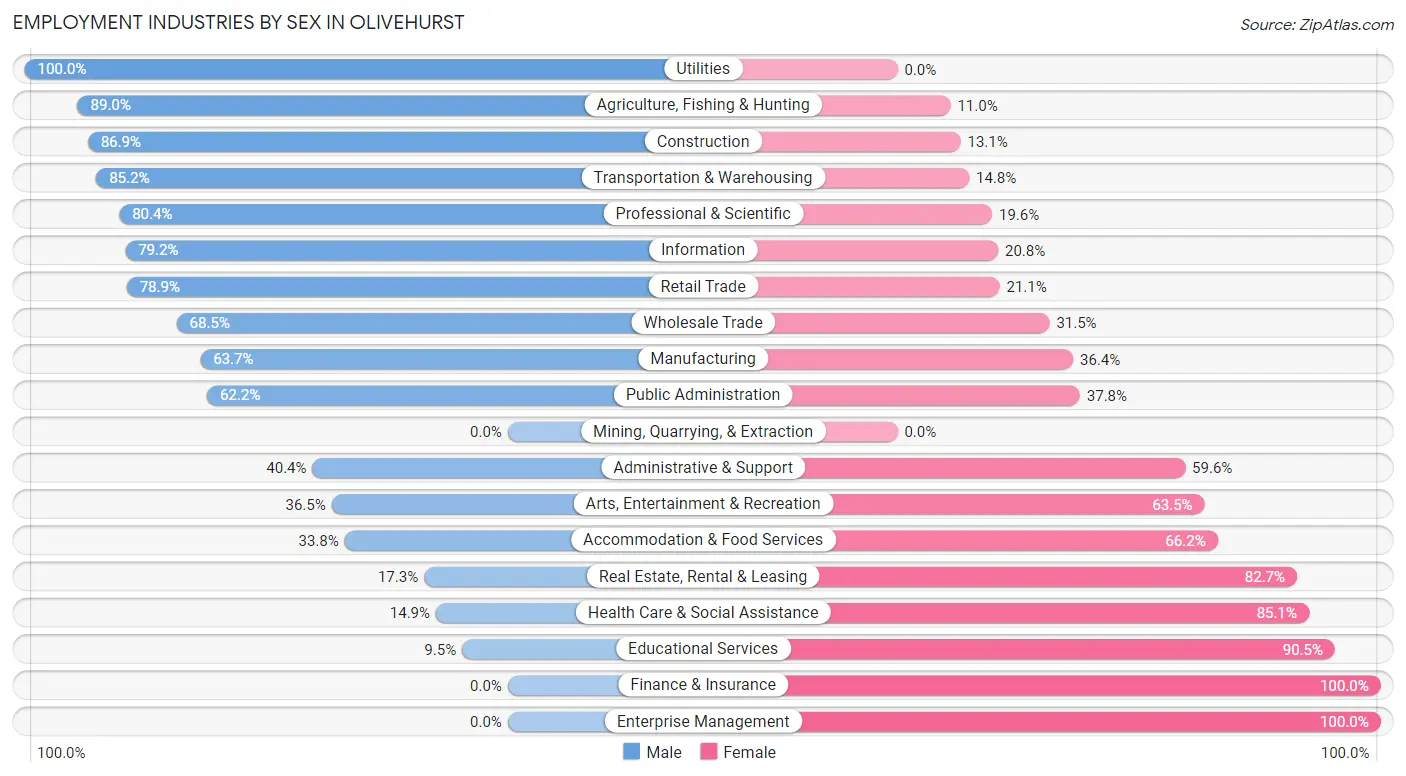
Employment Industries by Sex in Olivehurst
The Olivehurst industries that see more men than women are Utilities (100.0%), Agriculture, Fishing & Hunting (89.0%), and Construction (86.9%), whereas the industries that tend to have a higher number of women are Finance & Insurance (100.0%), Enterprise Management (100.0%), and Educational Services (90.5%).
| Industry | Male | Female |
| Agriculture, Fishing & Hunting | 227 (89.0%) | 28 (11.0%) |
| Mining, Quarrying, & Extraction | 0 (0.0%) | 0 (0.0%) |
| Construction | 532 (86.9%) | 80 (13.1%) |
| Manufacturing | 338 (63.6%) | 193 (36.3%) |
| Wholesale Trade | 196 (68.5%) | 90 (31.5%) |
| Retail Trade | 541 (78.9%) | 145 (21.1%) |
| Transportation & Warehousing | 241 (85.2%) | 42 (14.8%) |
| Utilities | 53 (100.0%) | 0 (0.0%) |
| Information | 76 (79.2%) | 20 (20.8%) |
| Finance & Insurance | 0 (0.0%) | 104 (100.0%) |
| Real Estate, Rental & Leasing | 13 (17.3%) | 62 (82.7%) |
| Professional & Scientific | 238 (80.4%) | 58 (19.6%) |
| Enterprise Management | 0 (0.0%) | 20 (100.0%) |
| Administrative & Support | 146 (40.4%) | 215 (59.6%) |
| Educational Services | 43 (9.5%) | 411 (90.5%) |
| Health Care & Social Assistance | 196 (14.9%) | 1,122 (85.1%) |
| Arts, Entertainment & Recreation | 70 (36.5%) | 122 (63.5%) |
| Accommodation & Food Services | 236 (33.8%) | 463 (66.2%) |
| Public Administration | 389 (62.2%) | 236 (37.8%) |
| Total | 3,754 (50.7%) | 3,643 (49.2%) |
Education in Olivehurst
School Enrollment in Olivehurst
The most common levels of schooling among the 4,763 students in Olivehurst are college / undergraduate (1,148 | 24.1%), middle school (1,083 | 22.7%), and elementary school (946 | 19.9%).
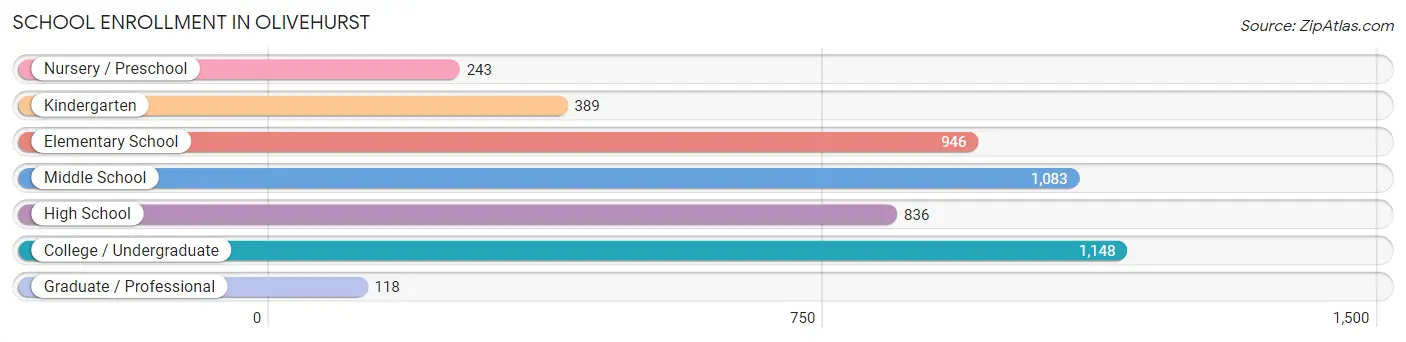
| School Level | # Students | % Students |
| Nursery / Preschool | 243 | 5.1% |
| Kindergarten | 389 | 8.2% |
| Elementary School | 946 | 19.9% |
| Middle School | 1,083 | 22.7% |
| High School | 836 | 17.5% |
| College / Undergraduate | 1,148 | 24.1% |
| Graduate / Professional | 118 | 2.5% |
| Total | 4,763 | 100.0% |
School Enrollment by Age by Funding Source in Olivehurst
Out of a total of 4,763 students who are enrolled in schools in Olivehurst, 319 (6.7%) attend a private institution, while the remaining 4,444 (93.3%) are enrolled in public schools. The age group of 35 years and over has the highest likelihood of being enrolled in private schools, with 28 (26.9% in the age bracket) enrolled. Conversely, the age group of 5 to 9 year old has the lowest likelihood of being enrolled in a private school, with 1,354 (100.0% in the age bracket) attending a public institution.
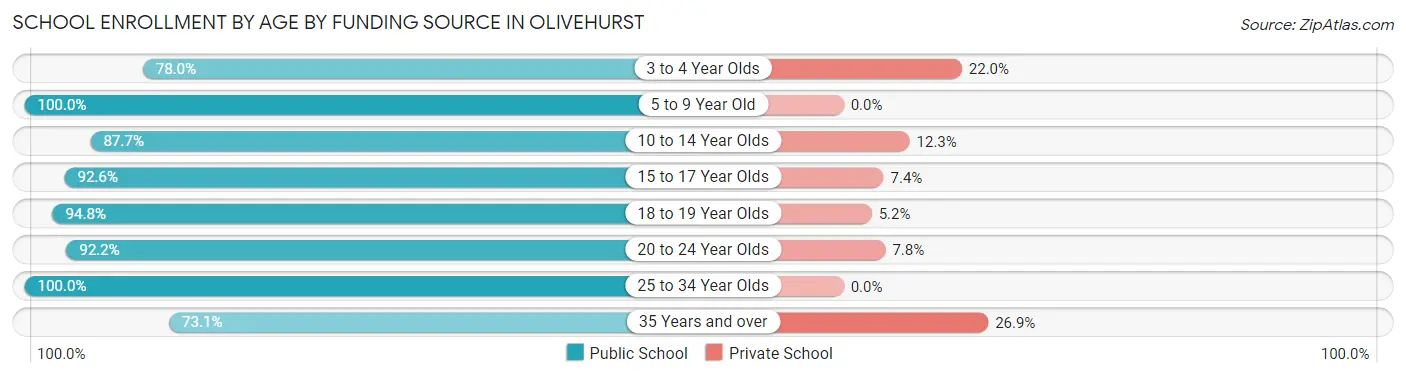
| Age Bracket | Public School | Private School |
| 3 to 4 Year Olds | 131 (78.0%) | 37 (22.0%) |
| 5 to 9 Year Old | 1,354 (100.0%) | 0 (0.0%) |
| 10 to 14 Year Olds | 1,014 (87.7%) | 142 (12.3%) |
| 15 to 17 Year Olds | 597 (92.6%) | 48 (7.4%) |
| 18 to 19 Year Olds | 344 (94.8%) | 19 (5.2%) |
| 20 to 24 Year Olds | 545 (92.2%) | 46 (7.8%) |
| 25 to 34 Year Olds | 382 (100.0%) | 0 (0.0%) |
| 35 Years and over | 76 (73.1%) | 28 (26.9%) |
| Total | 4,444 (93.3%) | 319 (6.7%) |
Educational Attainment by Field of Study in Olivehurst
Business (359 | 24.1%), arts & humanities (264 | 17.7%), engineering (157 | 10.6%), literature & languages (132 | 8.9%), and communications (120 | 8.1%) are the most common fields of study among 1,487 individuals in Olivehurst who have obtained a bachelor's degree or higher.
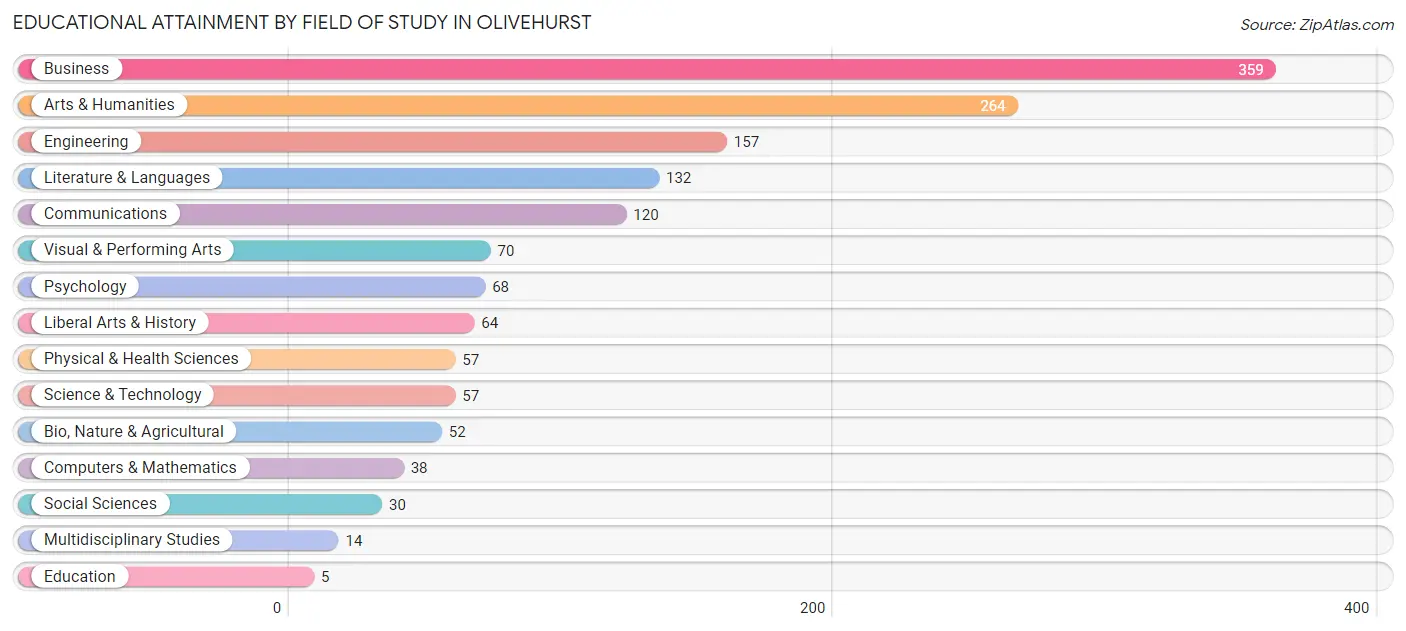
| Field of Study | # Graduates | % Graduates |
| Computers & Mathematics | 38 | 2.6% |
| Bio, Nature & Agricultural | 52 | 3.5% |
| Physical & Health Sciences | 57 | 3.8% |
| Psychology | 68 | 4.6% |
| Social Sciences | 30 | 2.0% |
| Engineering | 157 | 10.6% |
| Multidisciplinary Studies | 14 | 0.9% |
| Science & Technology | 57 | 3.8% |
| Business | 359 | 24.1% |
| Education | 5 | 0.3% |
| Literature & Languages | 132 | 8.9% |
| Liberal Arts & History | 64 | 4.3% |
| Visual & Performing Arts | 70 | 4.7% |
| Communications | 120 | 8.1% |
| Arts & Humanities | 264 | 17.7% |
| Total | 1,487 | 100.0% |
Transportation & Commute in Olivehurst
Vehicle Availability by Sex in Olivehurst
The most prevalent vehicle ownership categories in Olivehurst are males with 2 vehicles (1,418, accounting for 34.4%) and females with 2 vehicles (1,015, making up 40.3%).
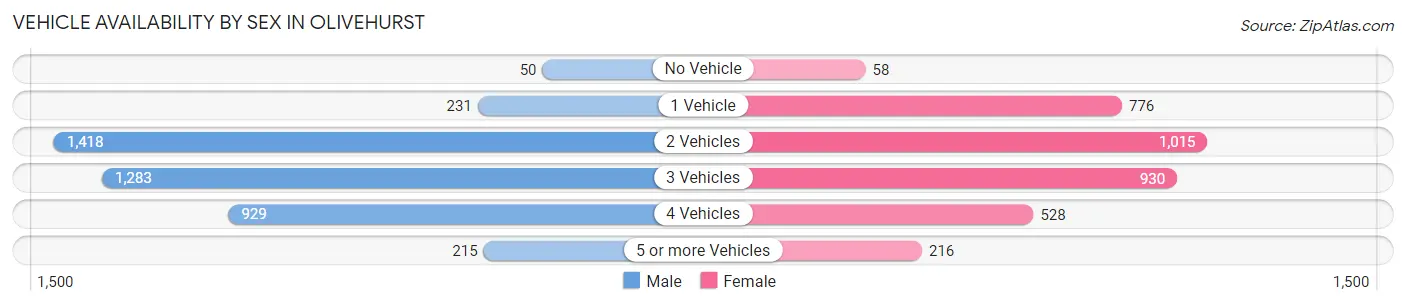
| Vehicles Available | Male | Female |
| No Vehicle | 50 (1.2%) | 58 (1.7%) |
| 1 Vehicle | 231 (5.6%) | 776 (22.0%) |
| 2 Vehicles | 1,418 (34.4%) | 1,015 (28.8%) |
| 3 Vehicles | 1,283 (31.1%) | 930 (26.4%) |
| 4 Vehicles | 929 (22.5%) | 528 (15.0%) |
| 5 or more Vehicles | 215 (5.2%) | 216 (6.1%) |
| Total | 4,126 (100.0%) | 3,523 (100.0%) |
Commute Time in Olivehurst
The most frequently occuring commute durations in Olivehurst are 45 to 59 minutes (1,109 commuters, 15.5%), 30 to 34 minutes (1,083 commuters, 15.1%), and 15 to 19 minutes (837 commuters, 11.7%).
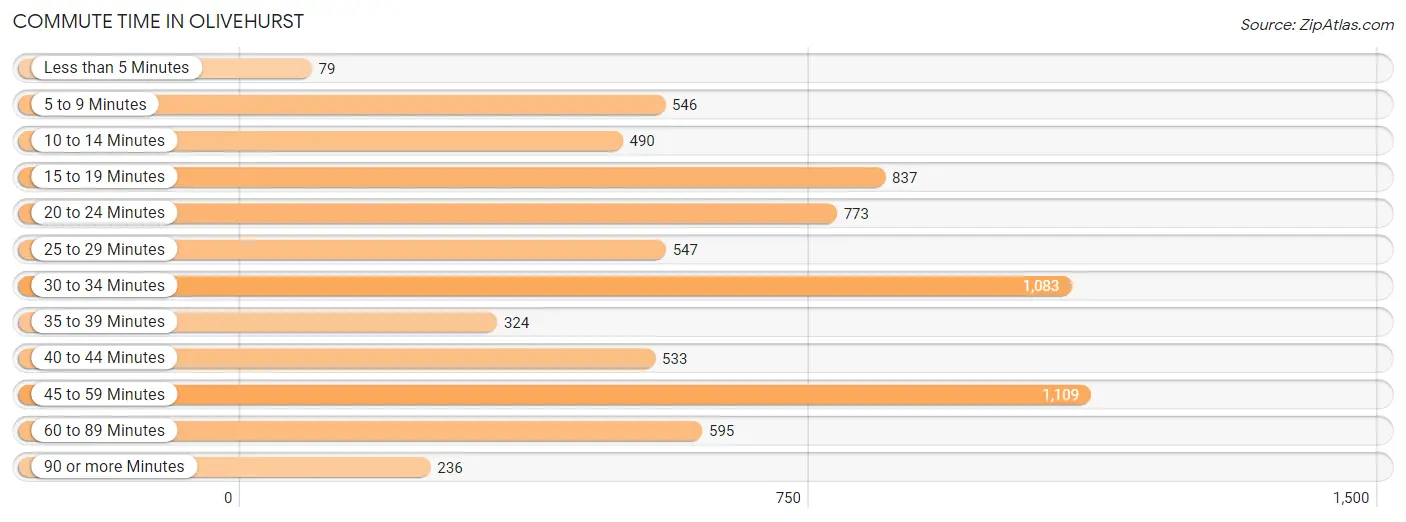
| Commute Time | # Commuters | % Commuters |
| Less than 5 Minutes | 79 | 1.1% |
| 5 to 9 Minutes | 546 | 7.6% |
| 10 to 14 Minutes | 490 | 6.9% |
| 15 to 19 Minutes | 837 | 11.7% |
| 20 to 24 Minutes | 773 | 10.8% |
| 25 to 29 Minutes | 547 | 7.6% |
| 30 to 34 Minutes | 1,083 | 15.1% |
| 35 to 39 Minutes | 324 | 4.5% |
| 40 to 44 Minutes | 533 | 7.4% |
| 45 to 59 Minutes | 1,109 | 15.5% |
| 60 to 89 Minutes | 595 | 8.3% |
| 90 or more Minutes | 236 | 3.3% |
Commute Time by Sex in Olivehurst
The most common commute times in Olivehurst are 30 to 34 minutes (639 commuters, 16.3%) for males and 15 to 19 minutes (559 commuters, 17.2%) for females.
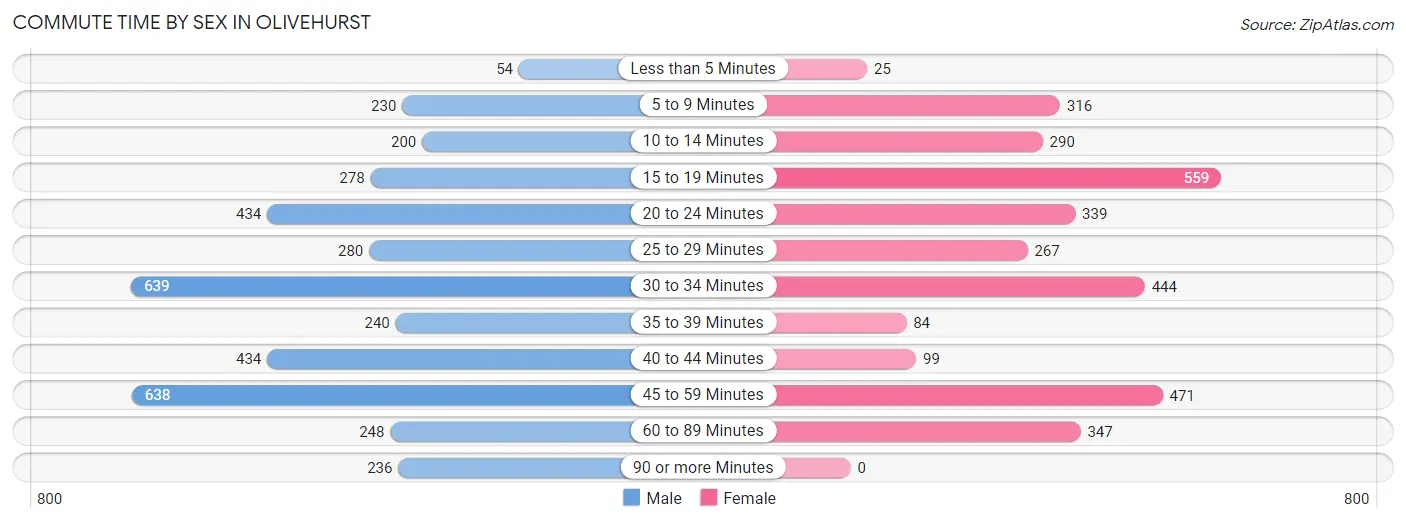
| Commute Time | Male | Female |
| Less than 5 Minutes | 54 (1.4%) | 25 (0.8%) |
| 5 to 9 Minutes | 230 (5.9%) | 316 (9.8%) |
| 10 to 14 Minutes | 200 (5.1%) | 290 (8.9%) |
| 15 to 19 Minutes | 278 (7.1%) | 559 (17.2%) |
| 20 to 24 Minutes | 434 (11.1%) | 339 (10.5%) |
| 25 to 29 Minutes | 280 (7.2%) | 267 (8.2%) |
| 30 to 34 Minutes | 639 (16.3%) | 444 (13.7%) |
| 35 to 39 Minutes | 240 (6.1%) | 84 (2.6%) |
| 40 to 44 Minutes | 434 (11.1%) | 99 (3.0%) |
| 45 to 59 Minutes | 638 (16.3%) | 471 (14.5%) |
| 60 to 89 Minutes | 248 (6.3%) | 347 (10.7%) |
| 90 or more Minutes | 236 (6.0%) | 0 (0.0%) |
Time of Departure to Work by Sex in Olivehurst
The most frequent times of departure to work in Olivehurst are 6:00 AM to 6:29 AM (627, 16.0%) for males and 6:30 AM to 6:59 AM (485, 15.0%) for females.
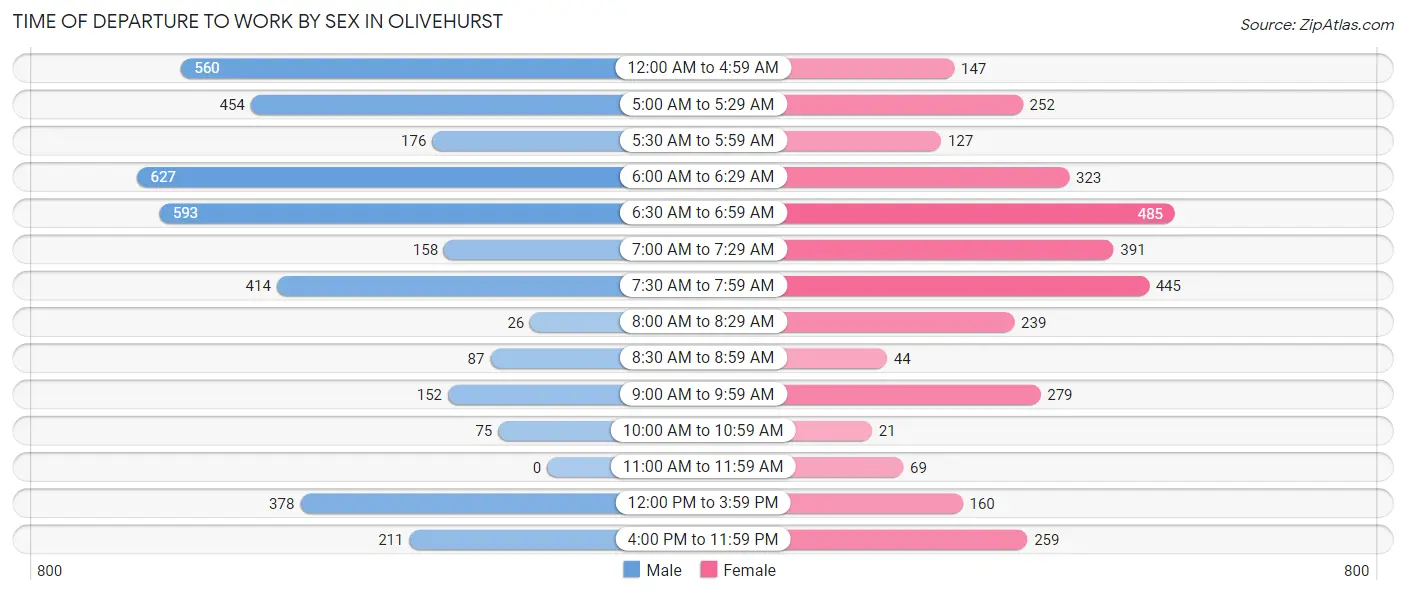
| Time of Departure | Male | Female |
| 12:00 AM to 4:59 AM | 560 (14.3%) | 147 (4.5%) |
| 5:00 AM to 5:29 AM | 454 (11.6%) | 252 (7.8%) |
| 5:30 AM to 5:59 AM | 176 (4.5%) | 127 (3.9%) |
| 6:00 AM to 6:29 AM | 627 (16.0%) | 323 (10.0%) |
| 6:30 AM to 6:59 AM | 593 (15.2%) | 485 (15.0%) |
| 7:00 AM to 7:29 AM | 158 (4.0%) | 391 (12.1%) |
| 7:30 AM to 7:59 AM | 414 (10.6%) | 445 (13.7%) |
| 8:00 AM to 8:29 AM | 26 (0.7%) | 239 (7.4%) |
| 8:30 AM to 8:59 AM | 87 (2.2%) | 44 (1.4%) |
| 9:00 AM to 9:59 AM | 152 (3.9%) | 279 (8.6%) |
| 10:00 AM to 10:59 AM | 75 (1.9%) | 21 (0.6%) |
| 11:00 AM to 11:59 AM | 0 (0.0%) | 69 (2.1%) |
| 12:00 PM to 3:59 PM | 378 (9.7%) | 160 (4.9%) |
| 4:00 PM to 11:59 PM | 211 (5.4%) | 259 (8.0%) |
| Total | 3,911 (100.0%) | 3,241 (100.0%) |
Housing Occupancy in Olivehurst
Occupancy by Ownership in Olivehurst
Of the total 5,264 dwellings in Olivehurst, owner-occupied units account for 3,532 (67.1%), while renter-occupied units make up 1,732 (32.9%).
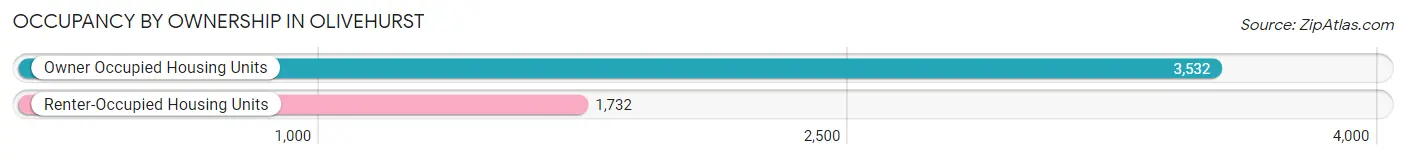
| Occupancy | # Housing Units | % Housing Units |
| Owner Occupied Housing Units | 3,532 | 67.1% |
| Renter-Occupied Housing Units | 1,732 | 32.9% |
| Total Occupied Housing Units | 5,264 | 100.0% |
Occupancy by Household Size in Olivehurst
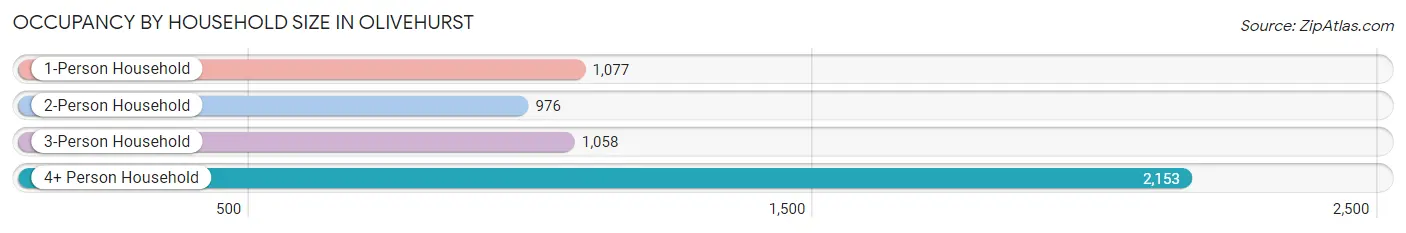
| Household Size | # Housing Units | % Housing Units |
| 1-Person Household | 1,077 | 20.5% |
| 2-Person Household | 976 | 18.5% |
| 3-Person Household | 1,058 | 20.1% |
| 4+ Person Household | 2,153 | 40.9% |
| Total Housing Units | 5,264 | 100.0% |
Occupancy by Ownership by Household Size in Olivehurst
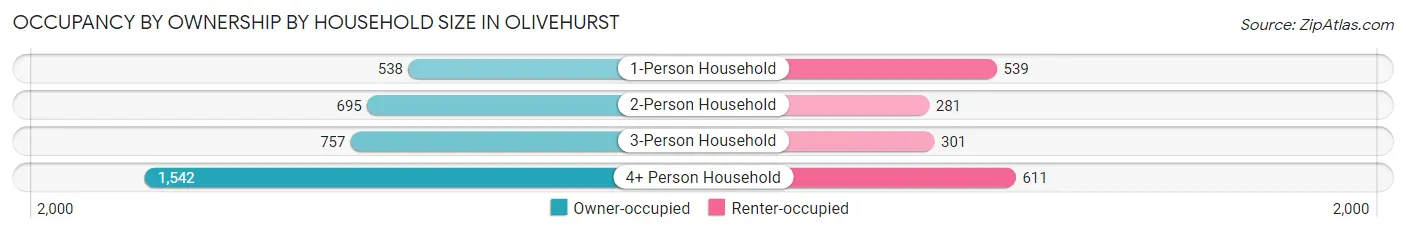
| Household Size | Owner-occupied | Renter-occupied |
| 1-Person Household | 538 (49.9%) | 539 (50.0%) |
| 2-Person Household | 695 (71.2%) | 281 (28.8%) |
| 3-Person Household | 757 (71.6%) | 301 (28.4%) |
| 4+ Person Household | 1,542 (71.6%) | 611 (28.4%) |
| Total Housing Units | 3,532 (67.1%) | 1,732 (32.9%) |
Occupancy by Educational Attainment in Olivehurst
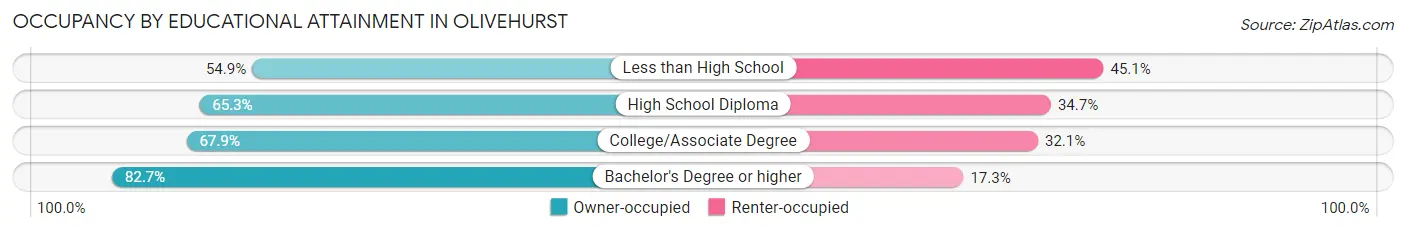
| Household Size | Owner-occupied | Renter-occupied |
| Less than High School | 491 (54.9%) | 403 (45.1%) |
| High School Diploma | 758 (65.3%) | 402 (34.7%) |
| College/Associate Degree | 1,705 (67.9%) | 806 (32.1%) |
| Bachelor's Degree or higher | 578 (82.7%) | 121 (17.3%) |
Occupancy by Age of Householder in Olivehurst
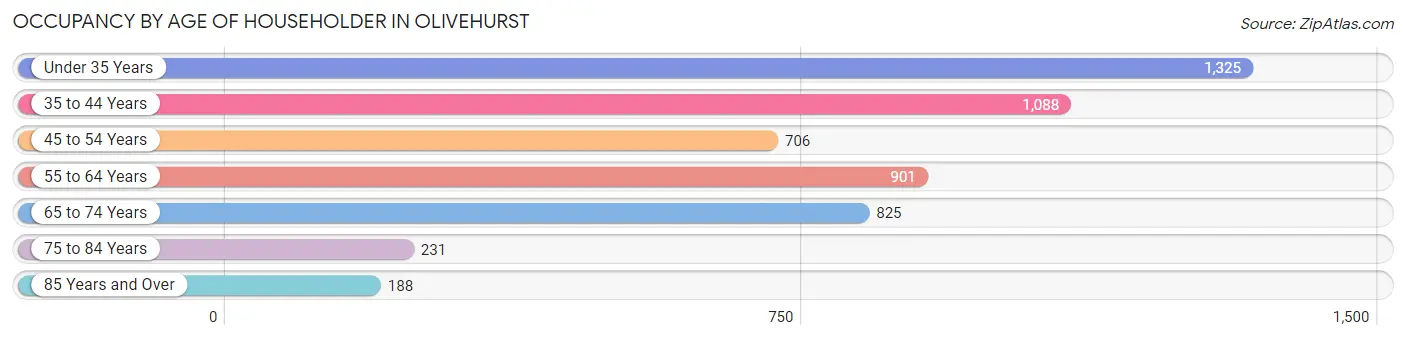
| Age Bracket | # Households | % Households |
| Under 35 Years | 1,325 | 25.2% |
| 35 to 44 Years | 1,088 | 20.7% |
| 45 to 54 Years | 706 | 13.4% |
| 55 to 64 Years | 901 | 17.1% |
| 65 to 74 Years | 825 | 15.7% |
| 75 to 84 Years | 231 | 4.4% |
| 85 Years and Over | 188 | 3.6% |
| Total | 5,264 | 100.0% |
Housing Finances in Olivehurst
Median Income by Occupancy in Olivehurst
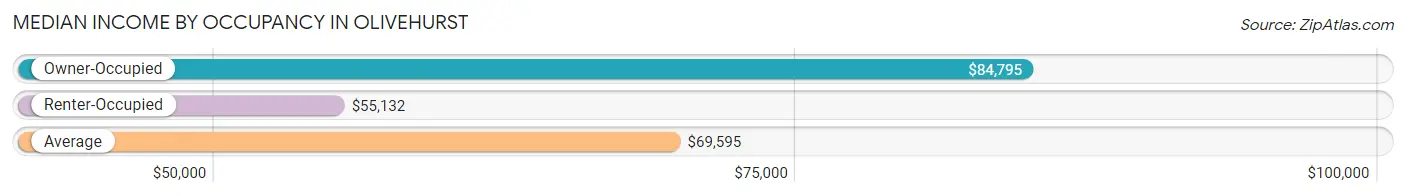
| Occupancy Type | # Households | Median Income |
| Owner-Occupied | 3,532 (67.1%) | $84,795 |
| Renter-Occupied | 1,732 (32.9%) | $55,132 |
| Average | 5,264 (100.0%) | $69,595 |
Occupancy by Householder Income Bracket in Olivehurst
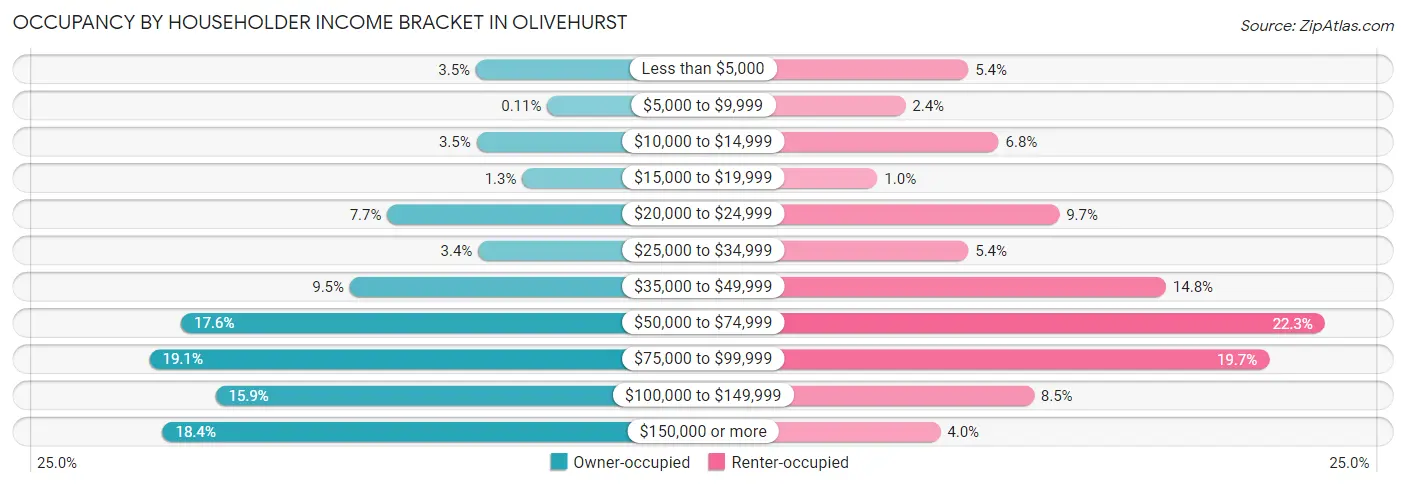
| Income Bracket | Owner-occupied | Renter-occupied |
| Less than $5,000 | 124 (3.5%) | 93 (5.4%) |
| $5,000 to $9,999 | 4 (0.1%) | 41 (2.4%) |
| $10,000 to $14,999 | 123 (3.5%) | 118 (6.8%) |
| $15,000 to $19,999 | 46 (1.3%) | 18 (1.0%) |
| $20,000 to $24,999 | 273 (7.7%) | 168 (9.7%) |
| $25,000 to $34,999 | 120 (3.4%) | 93 (5.4%) |
| $35,000 to $49,999 | 336 (9.5%) | 256 (14.8%) |
| $50,000 to $74,999 | 620 (17.5%) | 387 (22.3%) |
| $75,000 to $99,999 | 673 (19.1%) | 341 (19.7%) |
| $100,000 to $149,999 | 562 (15.9%) | 147 (8.5%) |
| $150,000 or more | 651 (18.4%) | 70 (4.0%) |
| Total | 3,532 (100.0%) | 1,732 (100.0%) |
Monthly Housing Cost Tiers in Olivehurst
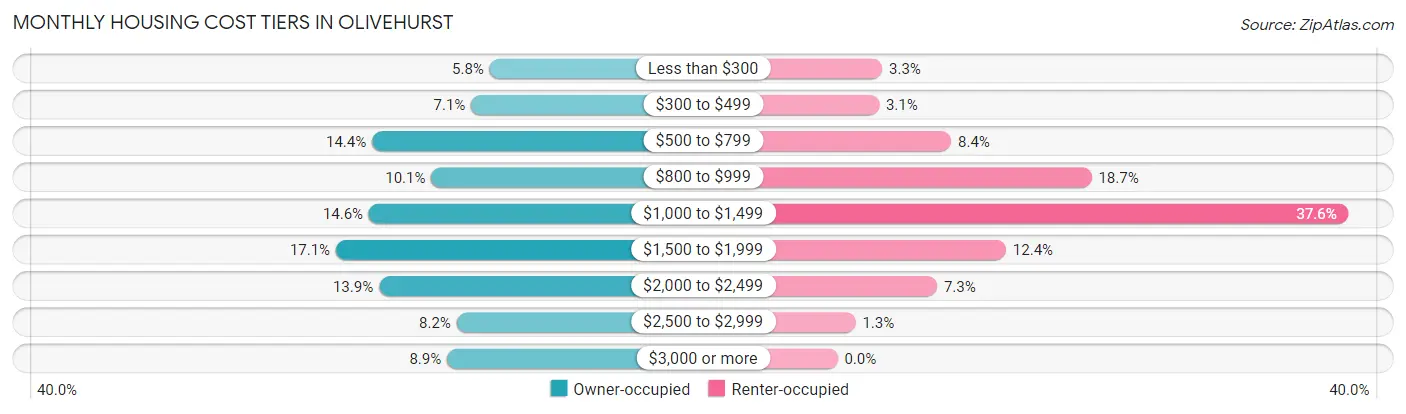
| Monthly Cost | Owner-occupied | Renter-occupied |
| Less than $300 | 203 (5.8%) | 57 (3.3%) |
| $300 to $499 | 251 (7.1%) | 53 (3.1%) |
| $500 to $799 | 509 (14.4%) | 145 (8.4%) |
| $800 to $999 | 355 (10.1%) | 324 (18.7%) |
| $1,000 to $1,499 | 517 (14.6%) | 652 (37.6%) |
| $1,500 to $1,999 | 603 (17.1%) | 215 (12.4%) |
| $2,000 to $2,499 | 491 (13.9%) | 127 (7.3%) |
| $2,500 to $2,999 | 289 (8.2%) | 23 (1.3%) |
| $3,000 or more | 314 (8.9%) | 0 (0.0%) |
| Total | 3,532 (100.0%) | 1,732 (100.0%) |
Physical Housing Characteristics in Olivehurst
Housing Structures in Olivehurst
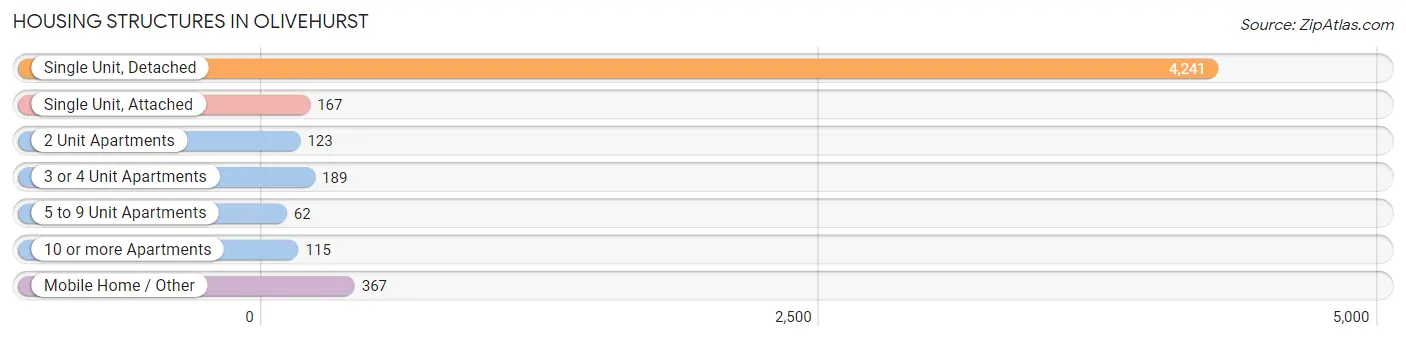
| Structure Type | # Housing Units | % Housing Units |
| Single Unit, Detached | 4,241 | 80.6% |
| Single Unit, Attached | 167 | 3.2% |
| 2 Unit Apartments | 123 | 2.3% |
| 3 or 4 Unit Apartments | 189 | 3.6% |
| 5 to 9 Unit Apartments | 62 | 1.2% |
| 10 or more Apartments | 115 | 2.2% |
| Mobile Home / Other | 367 | 7.0% |
| Total | 5,264 | 100.0% |
Housing Structures by Occupancy in Olivehurst
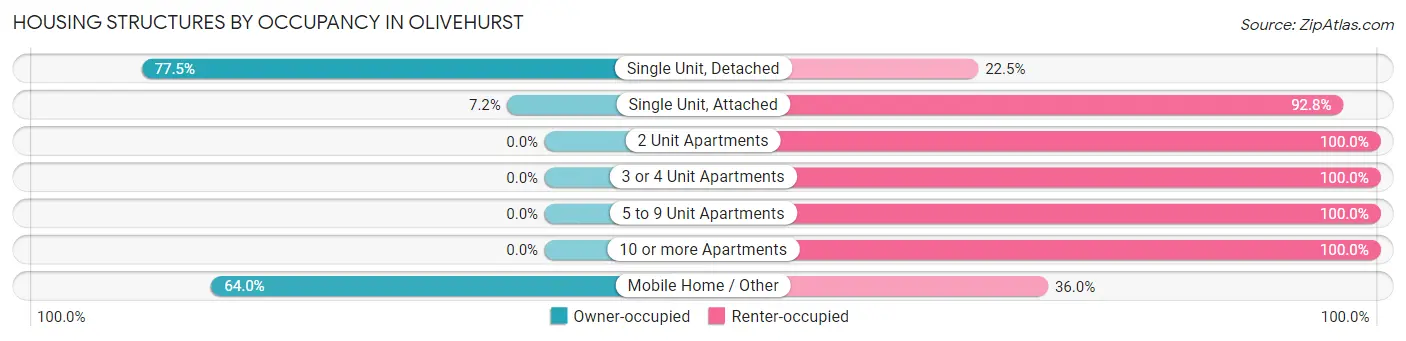
| Structure Type | Owner-occupied | Renter-occupied |
| Single Unit, Detached | 3,285 (77.5%) | 956 (22.5%) |
| Single Unit, Attached | 12 (7.2%) | 155 (92.8%) |
| 2 Unit Apartments | 0 (0.0%) | 123 (100.0%) |
| 3 or 4 Unit Apartments | 0 (0.0%) | 189 (100.0%) |
| 5 to 9 Unit Apartments | 0 (0.0%) | 62 (100.0%) |
| 10 or more Apartments | 0 (0.0%) | 115 (100.0%) |
| Mobile Home / Other | 235 (64.0%) | 132 (36.0%) |
| Total | 3,532 (67.1%) | 1,732 (32.9%) |
Housing Structures by Number of Rooms in Olivehurst
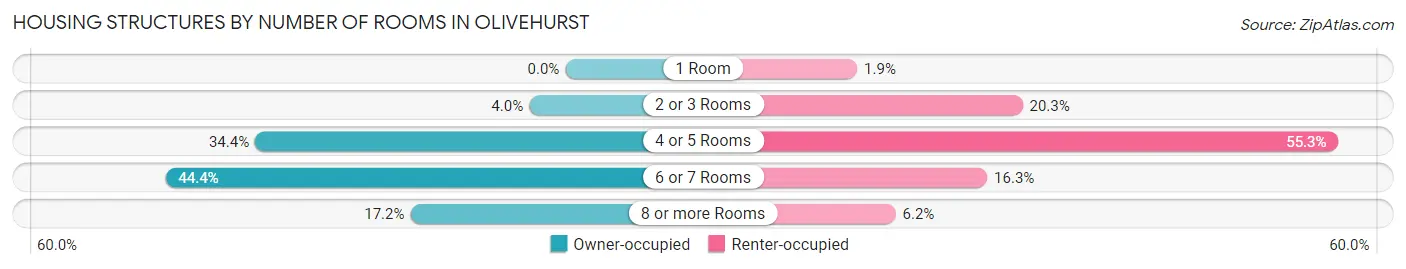
| Number of Rooms | Owner-occupied | Renter-occupied |
| 1 Room | 0 (0.0%) | 33 (1.9%) |
| 2 or 3 Rooms | 142 (4.0%) | 351 (20.3%) |
| 4 or 5 Rooms | 1,216 (34.4%) | 958 (55.3%) |
| 6 or 7 Rooms | 1,567 (44.4%) | 283 (16.3%) |
| 8 or more Rooms | 607 (17.2%) | 107 (6.2%) |
| Total | 3,532 (100.0%) | 1,732 (100.0%) |
Housing Structure by Heating Type in Olivehurst
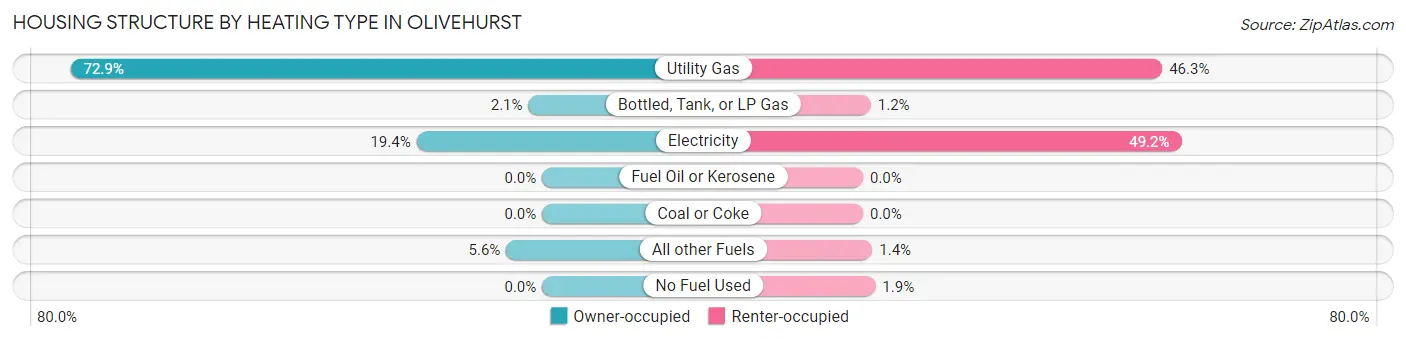
| Heating Type | Owner-occupied | Renter-occupied |
| Utility Gas | 2,575 (72.9%) | 801 (46.3%) |
| Bottled, Tank, or LP Gas | 75 (2.1%) | 21 (1.2%) |
| Electricity | 686 (19.4%) | 852 (49.2%) |
| Fuel Oil or Kerosene | 0 (0.0%) | 0 (0.0%) |
| Coal or Coke | 0 (0.0%) | 0 (0.0%) |
| All other Fuels | 196 (5.6%) | 25 (1.4%) |
| No Fuel Used | 0 (0.0%) | 33 (1.9%) |
| Total | 3,532 (100.0%) | 1,732 (100.0%) |
Household Vehicle Usage in Olivehurst
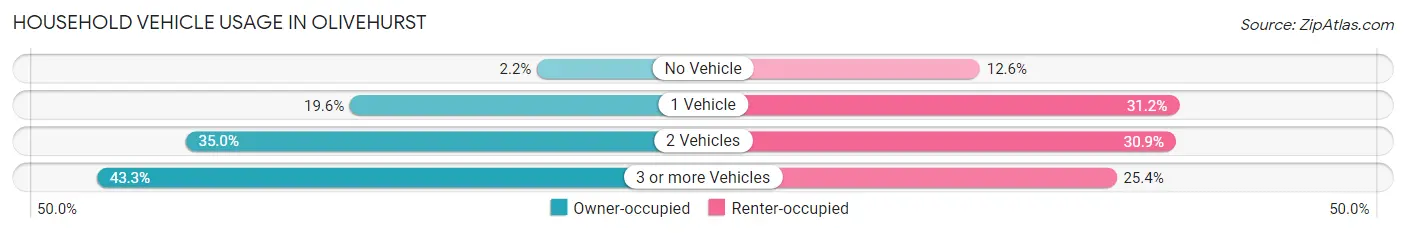
| Vehicles per Household | Owner-occupied | Renter-occupied |
| No Vehicle | 76 (2.1%) | 218 (12.6%) |
| 1 Vehicle | 693 (19.6%) | 540 (31.2%) |
| 2 Vehicles | 1,235 (35.0%) | 535 (30.9%) |
| 3 or more Vehicles | 1,528 (43.3%) | 439 (25.4%) |
| Total | 3,532 (100.0%) | 1,732 (100.0%) |
Real Estate & Mortgages in Olivehurst
Real Estate and Mortgage Overview in Olivehurst
| Characteristic | Without Mortgage | With Mortgage |
| Housing Units | 1,040 | 2,492 |
| Median Property Value | $210,700 | $341,700 |
| Median Household Income | $52,969 | $538 |
| Monthly Housing Costs | $553 | $314 |
| Real Estate Taxes | $1,554 | $65 |
Property Value by Mortgage Status in Olivehurst
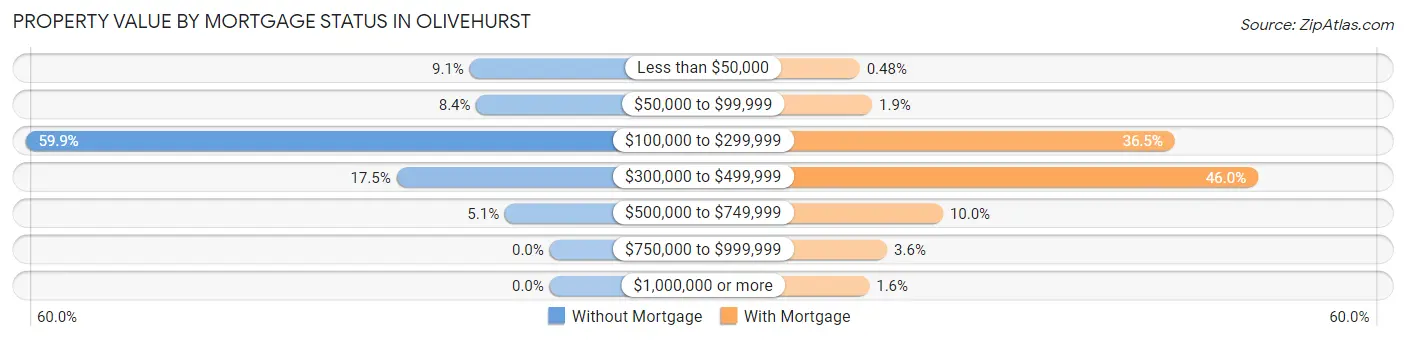
| Property Value | Without Mortgage | With Mortgage |
| Less than $50,000 | 95 (9.1%) | 12 (0.5%) |
| $50,000 to $99,999 | 87 (8.4%) | 47 (1.9%) |
| $100,000 to $299,999 | 623 (59.9%) | 909 (36.5%) |
| $300,000 to $499,999 | 182 (17.5%) | 1,146 (46.0%) |
| $500,000 to $749,999 | 53 (5.1%) | 249 (10.0%) |
| $750,000 to $999,999 | 0 (0.0%) | 90 (3.6%) |
| $1,000,000 or more | 0 (0.0%) | 39 (1.6%) |
| Total | 1,040 (100.0%) | 2,492 (100.0%) |
Household Income by Mortgage Status in Olivehurst
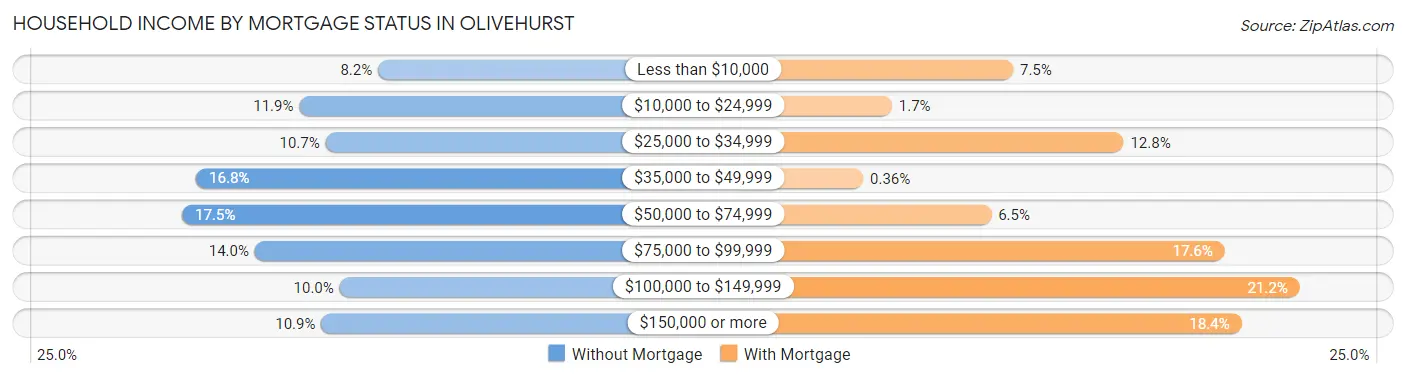
| Household Income | Without Mortgage | With Mortgage |
| Less than $10,000 | 85 (8.2%) | 187 (7.5%) |
| $10,000 to $24,999 | 124 (11.9%) | 43 (1.7%) |
| $25,000 to $34,999 | 111 (10.7%) | 318 (12.8%) |
| $35,000 to $49,999 | 175 (16.8%) | 9 (0.4%) |
| $50,000 to $74,999 | 182 (17.5%) | 161 (6.5%) |
| $75,000 to $99,999 | 146 (14.0%) | 438 (17.6%) |
| $100,000 to $149,999 | 104 (10.0%) | 527 (21.1%) |
| $150,000 or more | 113 (10.9%) | 458 (18.4%) |
| Total | 1,040 (100.0%) | 2,492 (100.0%) |
Property Value to Household Income Ratio in Olivehurst
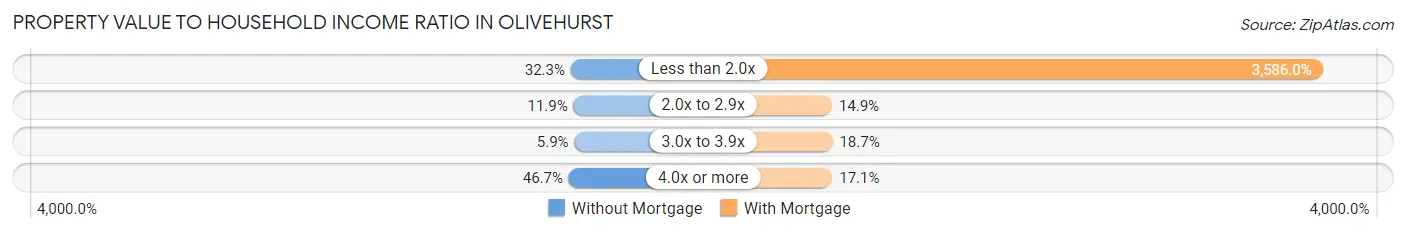
| Value-to-Income Ratio | Without Mortgage | With Mortgage |
| Less than 2.0x | 336 (32.3%) | 89,363 (3,586.0%) |
| 2.0x to 2.9x | 124 (11.9%) | 370 (14.8%) |
| 3.0x to 3.9x | 61 (5.9%) | 466 (18.7%) |
| 4.0x or more | 486 (46.7%) | 425 (17.1%) |
| Total | 1,040 (100.0%) | 2,492 (100.0%) |
Real Estate Taxes by Mortgage Status in Olivehurst
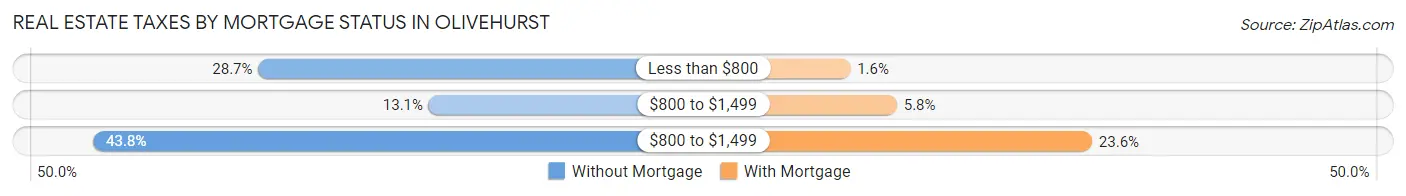
| Property Taxes | Without Mortgage | With Mortgage |
| Less than $800 | 298 (28.6%) | 39 (1.6%) |
| $800 to $1,499 | 136 (13.1%) | 145 (5.8%) |
| $800 to $1,499 | 455 (43.8%) | 589 (23.6%) |
| Total | 1,040 (100.0%) | 2,492 (100.0%) |
Health & Disability in Olivehurst
Health Insurance Coverage by Age in Olivehurst
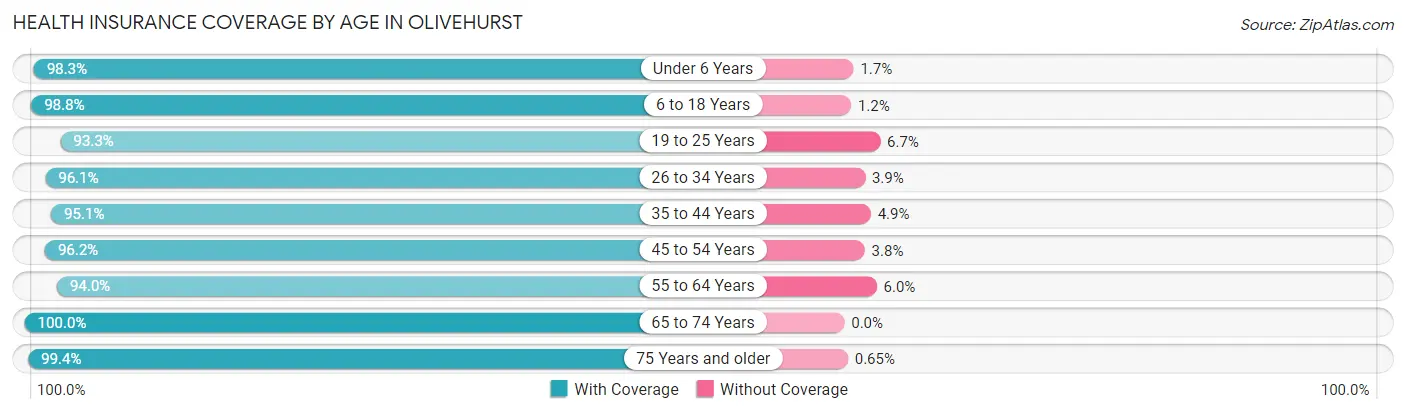
| Age Bracket | With Coverage | Without Coverage |
| Under 6 Years | 1,383 (98.3%) | 24 (1.7%) |
| 6 to 18 Years | 3,494 (98.8%) | 44 (1.2%) |
| 19 to 25 Years | 1,454 (93.3%) | 104 (6.7%) |
| 26 to 34 Years | 2,568 (96.1%) | 103 (3.9%) |
| 35 to 44 Years | 2,177 (95.1%) | 113 (4.9%) |
| 45 to 54 Years | 1,618 (96.2%) | 64 (3.8%) |
| 55 to 64 Years | 1,776 (94.0%) | 114 (6.0%) |
| 65 to 74 Years | 1,205 (100.0%) | 0 (0.0%) |
| 75 Years and older | 763 (99.4%) | 5 (0.6%) |
| Total | 16,438 (96.6%) | 571 (3.4%) |
Health Insurance Coverage by Citizenship Status in Olivehurst
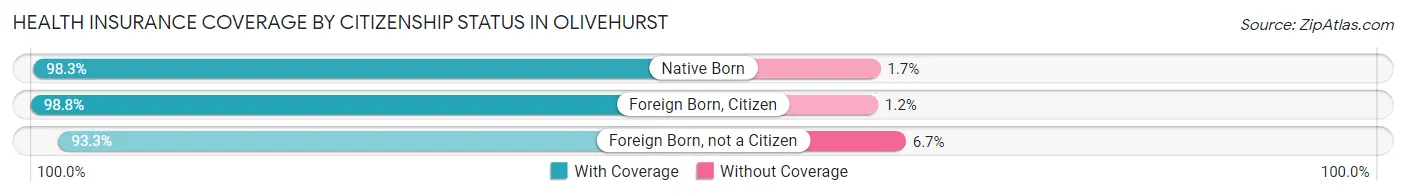
| Citizenship Status | With Coverage | Without Coverage |
| Native Born | 1,383 (98.3%) | 24 (1.7%) |
| Foreign Born, Citizen | 3,494 (98.8%) | 44 (1.2%) |
| Foreign Born, not a Citizen | 1,454 (93.3%) | 104 (6.7%) |
Health Insurance Coverage by Household Income in Olivehurst
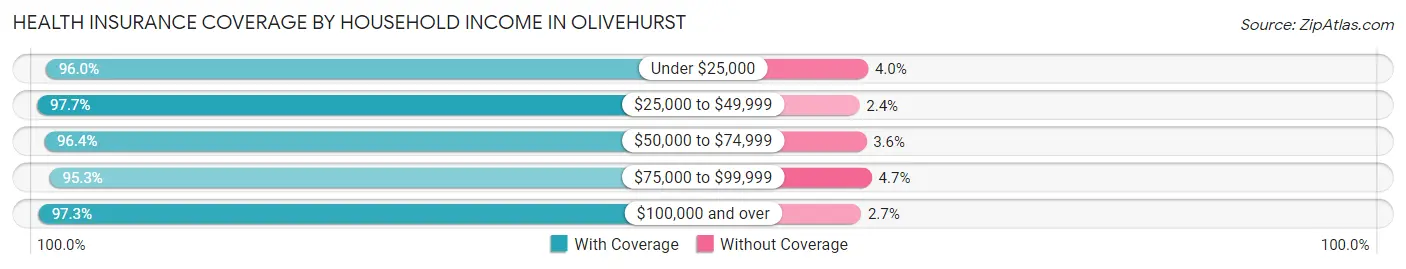
| Household Income | With Coverage | Without Coverage |
| Under $25,000 | 1,571 (96.0%) | 65 (4.0%) |
| $25,000 to $49,999 | 2,454 (97.7%) | 59 (2.4%) |
| $50,000 to $74,999 | 2,995 (96.4%) | 113 (3.6%) |
| $75,000 to $99,999 | 3,440 (95.3%) | 168 (4.7%) |
| $100,000 and over | 5,894 (97.3%) | 161 (2.7%) |
Public vs Private Health Insurance Coverage by Age in Olivehurst
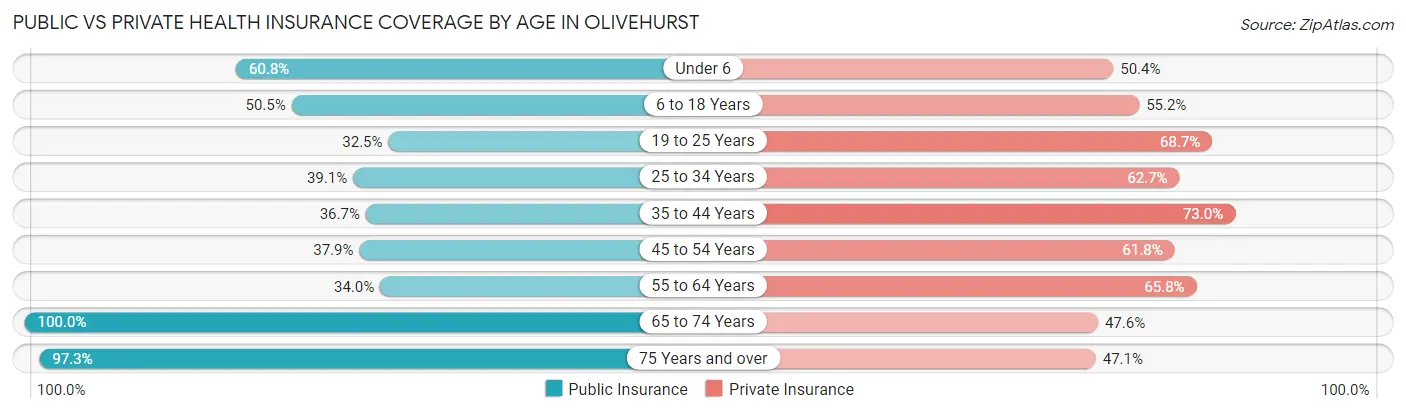
| Age Bracket | Public Insurance | Private Insurance |
| Under 6 | 855 (60.8%) | 709 (50.4%) |
| 6 to 18 Years | 1,785 (50.4%) | 1,953 (55.2%) |
| 19 to 25 Years | 506 (32.5%) | 1,071 (68.7%) |
| 25 to 34 Years | 1,043 (39.1%) | 1,674 (62.7%) |
| 35 to 44 Years | 840 (36.7%) | 1,671 (73.0%) |
| 45 to 54 Years | 637 (37.9%) | 1,039 (61.8%) |
| 55 to 64 Years | 643 (34.0%) | 1,244 (65.8%) |
| 65 to 74 Years | 1,205 (100.0%) | 573 (47.5%) |
| 75 Years and over | 747 (97.3%) | 362 (47.1%) |
| Total | 8,261 (48.6%) | 10,296 (60.5%) |
Disability Status by Sex by Age in Olivehurst
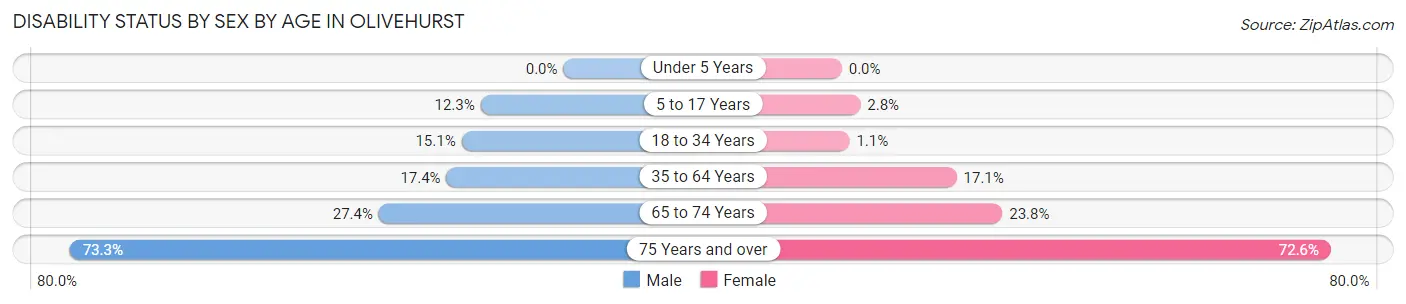
| Age Bracket | Male | Female |
| Under 5 Years | 0 (0.0%) | 0 (0.0%) |
| 5 to 17 Years | 204 (12.3%) | 52 (2.8%) |
| 18 to 34 Years | 314 (15.1%) | 28 (1.1%) |
| 35 to 64 Years | 540 (17.4%) | 469 (17.1%) |
| 65 to 74 Years | 137 (27.4%) | 168 (23.8%) |
| 75 Years and over | 247 (73.3%) | 313 (72.6%) |
Disability Class by Sex by Age in Olivehurst
Disability Class: Hearing Difficulty
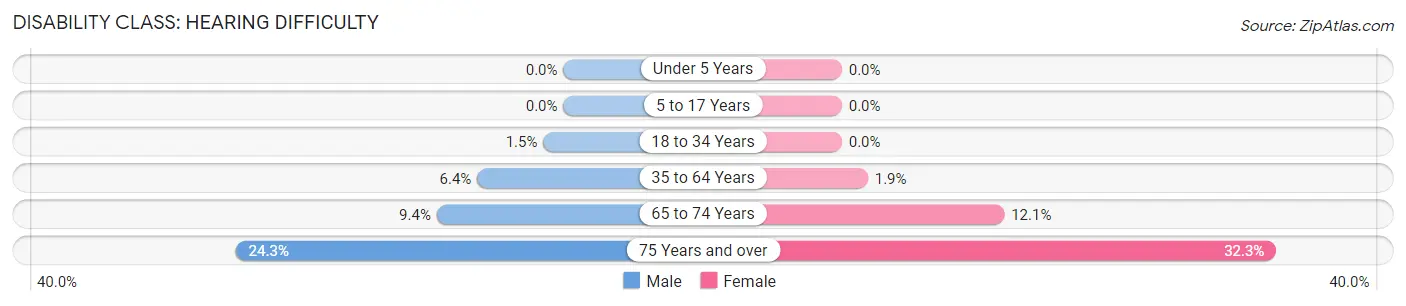
| Age Bracket | Male | Female |
| Under 5 Years | 0 (0.0%) | 0 (0.0%) |
| 5 to 17 Years | 0 (0.0%) | 0 (0.0%) |
| 18 to 34 Years | 31 (1.5%) | 0 (0.0%) |
| 35 to 64 Years | 199 (6.4%) | 53 (1.9%) |
| 65 to 74 Years | 47 (9.4%) | 85 (12.1%) |
| 75 Years and over | 82 (24.3%) | 139 (32.3%) |
Disability Class: Vision Difficulty
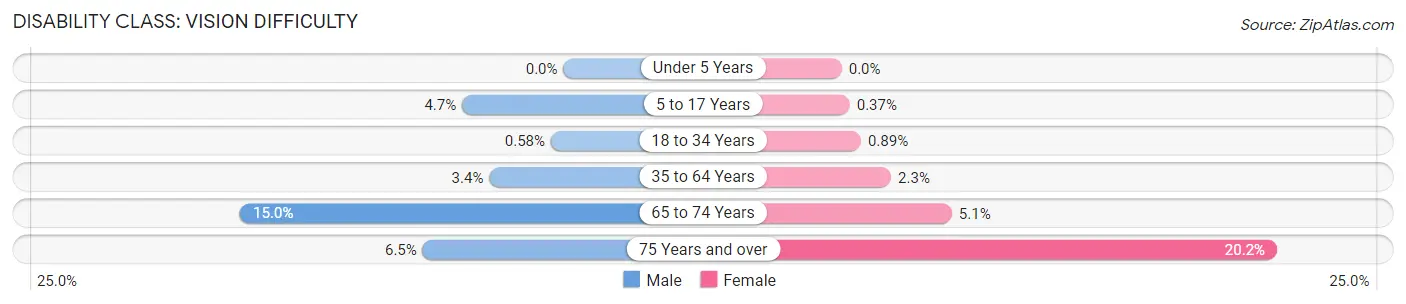
| Age Bracket | Male | Female |
| Under 5 Years | 0 (0.0%) | 0 (0.0%) |
| 5 to 17 Years | 78 (4.7%) | 7 (0.4%) |
| 18 to 34 Years | 12 (0.6%) | 22 (0.9%) |
| 35 to 64 Years | 107 (3.4%) | 63 (2.3%) |
| 65 to 74 Years | 75 (15.0%) | 36 (5.1%) |
| 75 Years and over | 22 (6.5%) | 87 (20.2%) |
Disability Class: Cognitive Difficulty
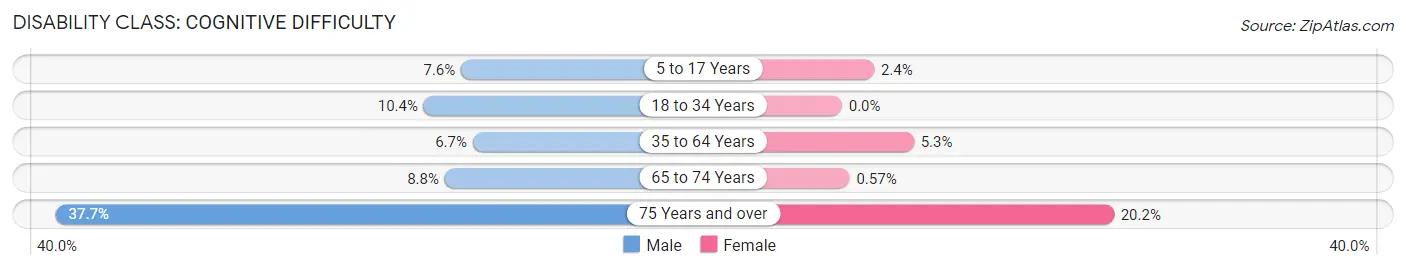
| Age Bracket | Male | Female |
| 5 to 17 Years | 126 (7.6%) | 45 (2.4%) |
| 18 to 34 Years | 215 (10.4%) | 0 (0.0%) |
| 35 to 64 Years | 209 (6.7%) | 147 (5.3%) |
| 65 to 74 Years | 44 (8.8%) | 4 (0.6%) |
| 75 Years and over | 127 (37.7%) | 87 (20.2%) |
Disability Class: Ambulatory Difficulty
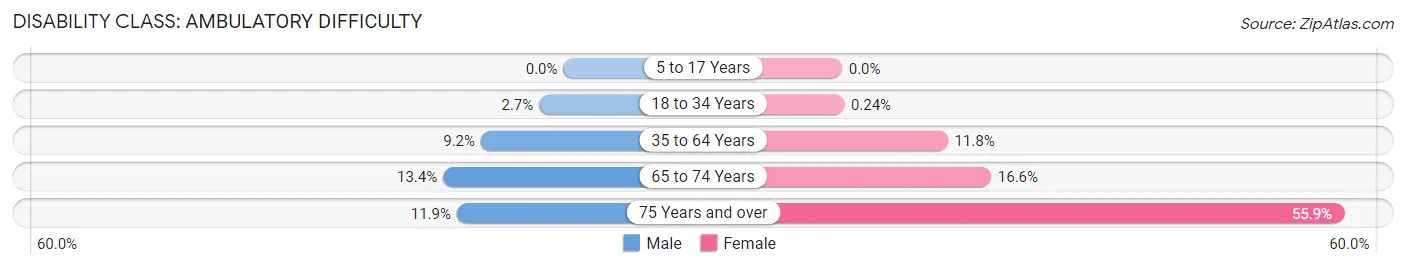
| Age Bracket | Male | Female |
| 5 to 17 Years | 0 (0.0%) | 0 (0.0%) |
| 18 to 34 Years | 56 (2.7%) | 6 (0.2%) |
| 35 to 64 Years | 286 (9.2%) | 324 (11.8%) |
| 65 to 74 Years | 67 (13.4%) | 117 (16.6%) |
| 75 Years and over | 40 (11.9%) | 241 (55.9%) |
Disability Class: Self-Care Difficulty
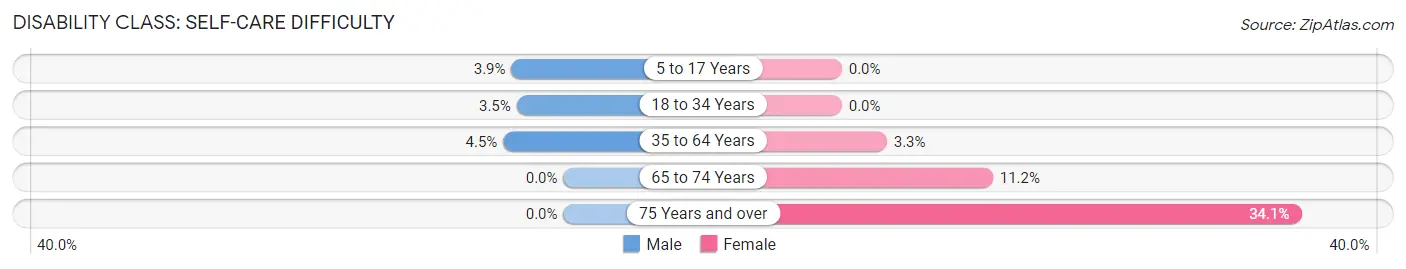
| Age Bracket | Male | Female |
| 5 to 17 Years | 64 (3.9%) | 0 (0.0%) |
| 18 to 34 Years | 72 (3.5%) | 0 (0.0%) |
| 35 to 64 Years | 139 (4.5%) | 92 (3.3%) |
| 65 to 74 Years | 0 (0.0%) | 79 (11.2%) |
| 75 Years and over | 0 (0.0%) | 147 (34.1%) |
Technology Access in Olivehurst
Computing Device Access in Olivehurst
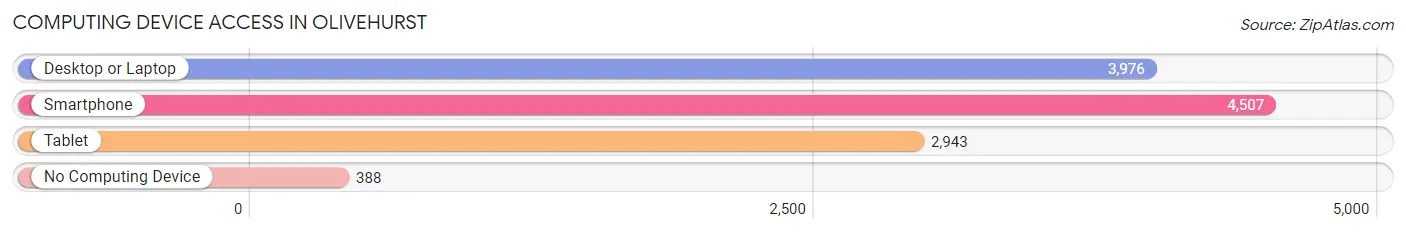
| Device Type | # Households | % Households |
| Desktop or Laptop | 3,976 | 75.5% |
| Smartphone | 4,507 | 85.6% |
| Tablet | 2,943 | 55.9% |
| No Computing Device | 388 | 7.4% |
| Total | 5,264 | 100.0% |
Internet Access in Olivehurst
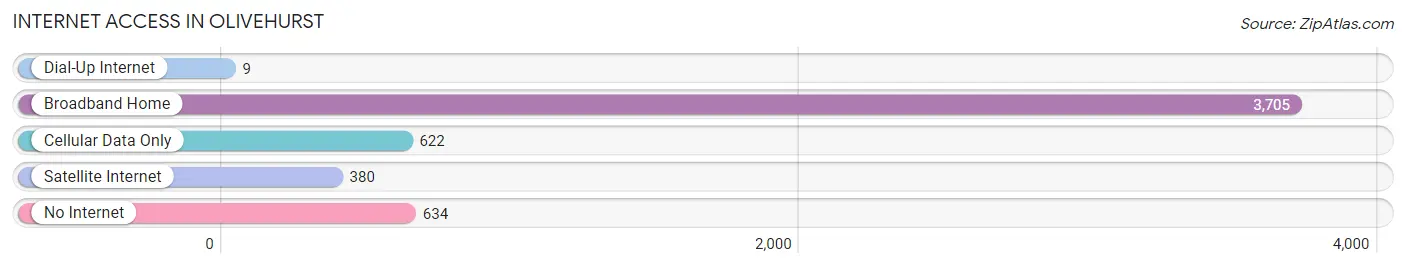
| Internet Type | # Households | % Households |
| Dial-Up Internet | 9 | 0.2% |
| Broadband Home | 3,705 | 70.4% |
| Cellular Data Only | 622 | 11.8% |
| Satellite Internet | 380 | 7.2% |
| No Internet | 634 | 12.0% |
| Total | 5,264 | 100.0% |
Olivehurst Summary
Olivehurst is a census-designated place located in Yuba County, California. It is situated in the northern part of the state, about 40 miles north of Sacramento. The population of Olivehurst was 11,061 at the 2010 census.
History
Olivehurst was founded in 1912 by the Olivehurst Land and Water Company. The company was formed by a group of investors from San Francisco who purchased the land from the Southern Pacific Railroad. The town was named after the olive trees that were planted in the area. The first post office was established in 1913.
In the early years, Olivehurst was a farming community, with the main crops being olives, walnuts, and prunes. The town also had a cannery, a creamery, and a packing house.
In the 1950s, Olivehurst began to experience rapid growth due to the influx of people from the Bay Area. The population increased from 1,000 in 1950 to over 10,000 by the year 2000.
Geography
Olivehurst is located at 39°7′17″N 121°35′17″W (39.1214, -121.5879). It is situated in the northern part of the state, about 40 miles north of Sacramento. The town is located in the Sierra Nevada foothills, and is surrounded by rolling hills and oak trees.
The climate in Olivehurst is mild, with hot summers and cool winters. The average high temperature in July is 92°F (33°C), and the average low temperature in January is 39°F (4°C).
Economy
Olivehurst’s economy is largely based on agriculture. The main crops are olives, walnuts, and prunes. The town also has a number of small businesses, including restaurants, retail stores, and auto repair shops.
The town is also home to a number of manufacturing companies, including a furniture factory, a plastics factory, and a metal fabrication plant.
Demographics
As of the 2010 census, the population of Olivehurst was 11,061. The racial makeup of the town was 68.3% White, 5.2% African American, 0.7% Native American, 1.3% Asian, 0.2% Pacific Islander, 19.2% from other races, and 4.3% from two or more races. Hispanic or Latino of any race were 33.2% of the population.
The median household income in Olivehurst was $41,945, and the median family income was $48,945. The per capita income was $17,945. About 17.2% of the population was below the poverty line.
Common Questions
What is Per Capita Income in Olivehurst?
Per Capita income in Olivehurst is $28,711.
What is the Median Family Income in Olivehurst?
Median Family Income in Olivehurst is $82,747.
What is the Median Household income in Olivehurst?
Median Household Income in Olivehurst is $69,595.
What is Income or Wage Gap in Olivehurst?
Income or Wage Gap in Olivehurst is 35.2%.
Women in Olivehurst earn 64.8 cents for every dollar earned by a man.
What is Inequality or Gini Index in Olivehurst?
Inequality or Gini Index in Olivehurst is 0.44.
What is the Total Population of Olivehurst?
Total Population of Olivehurst is 17,416.
What is the Total Male Population of Olivehurst?
Total Male Population of Olivehurst is 8,692.
What is the Total Female Population of Olivehurst?
Total Female Population of Olivehurst is 8,724.
What is the Ratio of Males per 100 Females in Olivehurst?
There are 99.63 Males per 100 Females in Olivehurst.
What is the Ratio of Females per 100 Males in Olivehurst?
There are 100.37 Females per 100 Males in Olivehurst.
What is the Median Population Age in Olivehurst?
Median Population Age in Olivehurst is 32.7 Years.
What is the Average Family Size in Olivehurst
Average Family Size in Olivehurst is 3.8 People.
What is the Average Household Size in Olivehurst
Average Household Size in Olivehurst is 3.3 People.
How Large is the Labor Force in Olivehurst?
There are 8,395 People in the Labor Forcein in Olivehurst.
What is the Percentage of People in the Labor Force in Olivehurst?
63.7% of People are in the Labor Force in Olivehurst.
What is the Unemployment Rate in Olivehurst?
Unemployment Rate in Olivehurst is 7.3%.