Oakley, CA Map & Demographics
Oakley Map
Oakley Overview
$41,163
PER CAPITA INCOME
$128,810
AVG FAMILY INCOME
$120,915
AVG HOUSEHOLD INCOME
43.5%
WAGE / INCOME GAP [ % ]
56.5¢/ $1
WAGE / INCOME GAP [ $ ]
$9,725
FAMILY INCOME DEFICIT
0.36
INEQUALITY / GINI INDEX
43,525
TOTAL POPULATION
21,990
MALE POPULATION
21,535
FEMALE POPULATION
102.11
MALES / 100 FEMALES
97.93
FEMALES / 100 MALES
35.8
MEDIAN AGE
3.6
AVG FAMILY SIZE
3.3
AVG HOUSEHOLD SIZE
22,910
LABOR FORCE [ PEOPLE ]
68.2%
PERCENT IN LABOR FORCE
5.9%
UNEMPLOYMENT RATE
Oakley Zip Codes
Oakley Area Codes
Income in Oakley
Income Overview in Oakley
Per Capita Income in Oakley is $41,163, while median incomes of families and households are $128,810 and $120,915 respectively.
| Characteristic | Number | Measure |
| Per Capita Income | 43,525 | $41,163 |
| Median Family Income | 10,713 | $128,810 |
| Mean Family Income | 10,713 | $140,488 |
| Median Household Income | 13,036 | $120,915 |
| Mean Household Income | 13,036 | $133,777 |
| Income Deficit | 10,713 | $9,725 |
| Wage / Income Gap (%) | 43,525 | 43.51% |
| Wage / Income Gap ($) | 43,525 | 56.49¢ per $1 |
| Gini / Inequality Index | 43,525 | 0.36 |
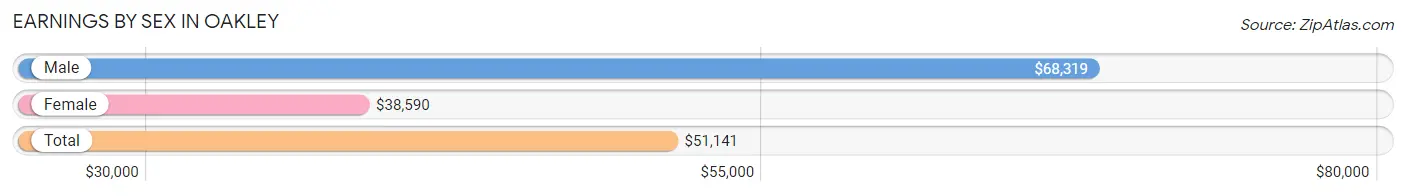
Earnings by Sex in Oakley
Average Earnings in Oakley are $51,141, $68,319 for men and $38,590 for women, a difference of 43.5%.
| Sex | Number | Average Earnings |
| Male | 12,488 (52.2%) | $68,319 |
| Female | 11,434 (47.8%) | $38,590 |
| Total | 23,922 (100.0%) | $51,141 |
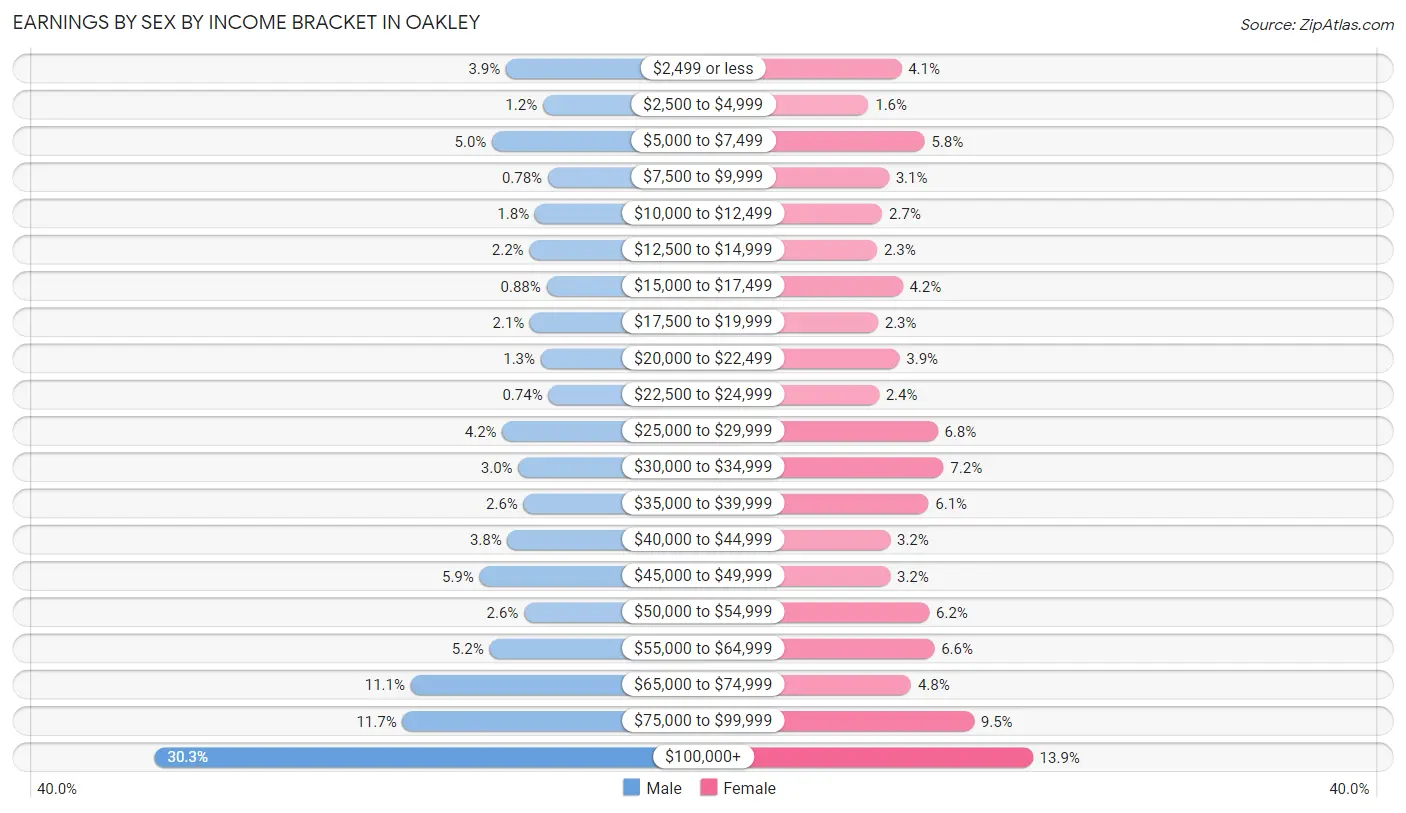
Earnings by Sex by Income Bracket in Oakley
The most common earnings brackets in Oakley are $100,000+ for men (3,779 | 30.3%) and $100,000+ for women (1,593 | 13.9%).
| Income | Male | Female |
| $2,499 or less | 490 (3.9%) | 467 (4.1%) |
| $2,500 to $4,999 | 143 (1.1%) | 184 (1.6%) |
| $5,000 to $7,499 | 620 (5.0%) | 666 (5.8%) |
| $7,500 to $9,999 | 97 (0.8%) | 359 (3.1%) |
| $10,000 to $12,499 | 219 (1.8%) | 303 (2.6%) |
| $12,500 to $14,999 | 271 (2.2%) | 258 (2.3%) |
| $15,000 to $17,499 | 110 (0.9%) | 477 (4.2%) |
| $17,500 to $19,999 | 263 (2.1%) | 265 (2.3%) |
| $20,000 to $22,499 | 163 (1.3%) | 451 (3.9%) |
| $22,500 to $24,999 | 93 (0.7%) | 273 (2.4%) |
| $25,000 to $29,999 | 523 (4.2%) | 778 (6.8%) |
| $30,000 to $34,999 | 374 (3.0%) | 828 (7.2%) |
| $35,000 to $39,999 | 325 (2.6%) | 699 (6.1%) |
| $40,000 to $44,999 | 476 (3.8%) | 370 (3.2%) |
| $45,000 to $49,999 | 737 (5.9%) | 370 (3.2%) |
| $50,000 to $54,999 | 320 (2.6%) | 705 (6.2%) |
| $55,000 to $64,999 | 645 (5.2%) | 749 (6.6%) |
| $65,000 to $74,999 | 1,381 (11.1%) | 550 (4.8%) |
| $75,000 to $99,999 | 1,459 (11.7%) | 1,089 (9.5%) |
| $100,000+ | 3,779 (30.3%) | 1,593 (13.9%) |
| Total | 12,488 (100.0%) | 11,434 (100.0%) |
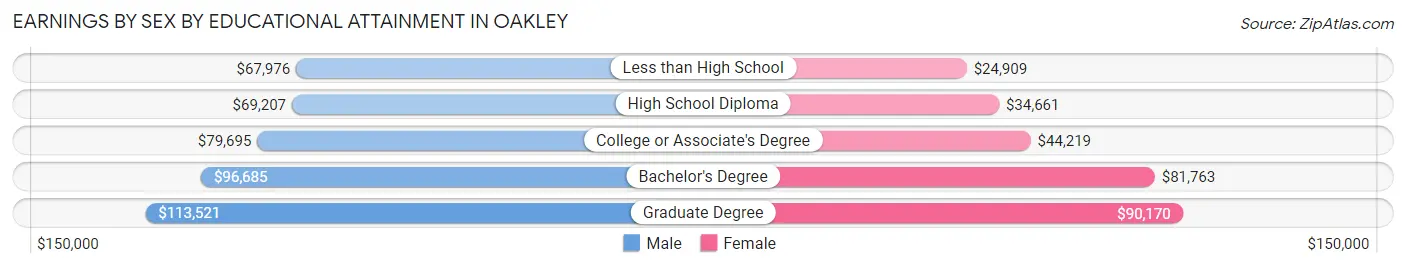
Earnings by Sex by Educational Attainment in Oakley
Average earnings in Oakley are $72,454 for men and $48,620 for women, a difference of 32.9%. Men with an educational attainment of graduate degree enjoy the highest average annual earnings of $113,521, while those with less than high school education earn the least with $67,976. Women with an educational attainment of graduate degree earn the most with the average annual earnings of $90,170, while those with less than high school education have the smallest earnings of $24,909.
| Educational Attainment | Male Income | Female Income |
| Less than High School | $67,976 | $24,909 |
| High School Diploma | $69,207 | $34,661 |
| College or Associate's Degree | $79,695 | $44,219 |
| Bachelor's Degree | $96,685 | $81,763 |
| Graduate Degree | $113,521 | $90,170 |
| Total | $72,454 | $48,620 |
Family Income in Oakley
Family Income Brackets in Oakley
According to the Oakley family income data, there are 2,593 families falling into the $100,000 to $149,999 income range, which is the most common income bracket and makes up 24.2% of all families. Conversely, the $10,000 to $14,999 income bracket is the least frequent group with only 43 families (0.4%) belonging to this category.
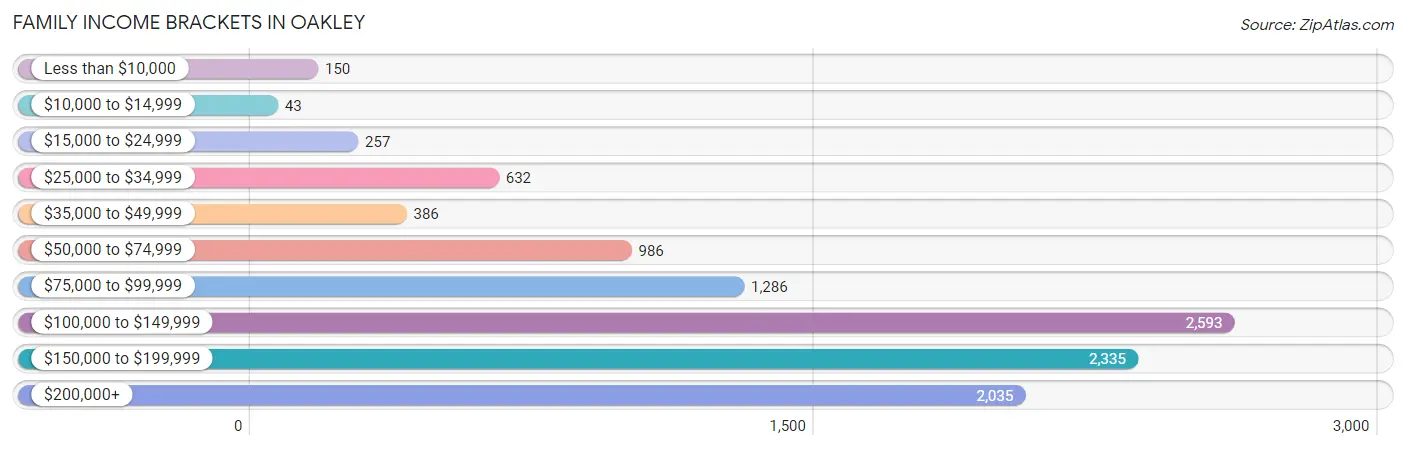
| Income Bracket | # Families | % Families |
| Less than $10,000 | 150 | 1.4% |
| $10,000 to $14,999 | 43 | 0.4% |
| $15,000 to $24,999 | 257 | 2.4% |
| $25,000 to $34,999 | 632 | 5.9% |
| $35,000 to $49,999 | 386 | 3.6% |
| $50,000 to $74,999 | 986 | 9.2% |
| $75,000 to $99,999 | 1,286 | 12.0% |
| $100,000 to $149,999 | 2,593 | 24.2% |
| $150,000 to $199,999 | 2,335 | 21.8% |
| $200,000+ | 2,035 | 19.0% |
Family Income by Famaliy Size in Oakley
7+ person families (378 | 3.5%) account for the highest median family income in Oakley with $184,712 per family, while 2-person families (2,905 | 27.1%) have the highest median income of $53,756 per family member.
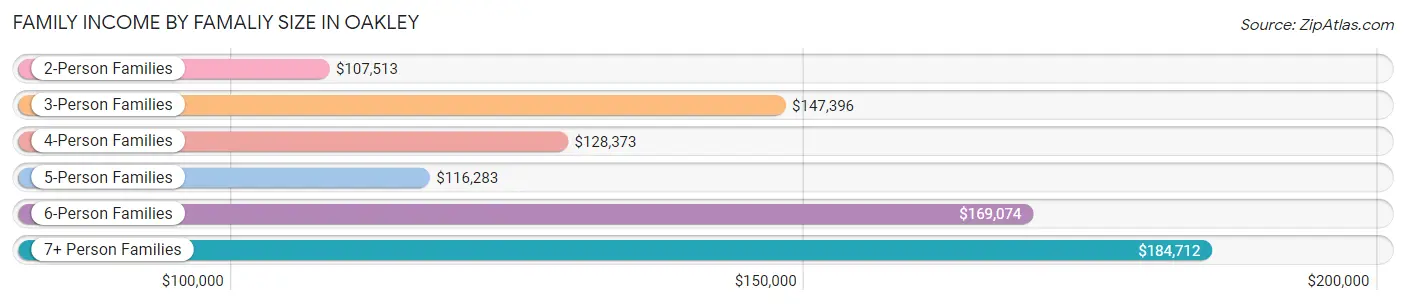
| Income Bracket | # Families | Median Income |
| 2-Person Families | 2,905 (27.1%) | $107,513 |
| 3-Person Families | 2,518 (23.5%) | $147,396 |
| 4-Person Families | 2,888 (27.0%) | $128,373 |
| 5-Person Families | 1,253 (11.7%) | $116,283 |
| 6-Person Families | 771 (7.2%) | $169,074 |
| 7+ Person Families | 378 (3.5%) | $184,712 |
| Total | 10,713 (100.0%) | $128,810 |
Family Income by Number of Earners in Oakley
The median family income in Oakley is $128,810, with families comprising 3+ earners (2,526) having the highest median family income of $172,308, while families with no earners (686) have the lowest median family income of $73,938, accounting for 23.6% and 6.4% of families, respectively.
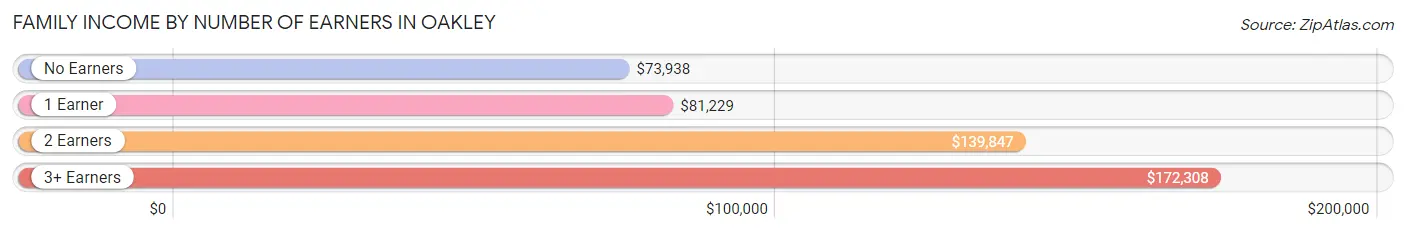
| Number of Earners | # Families | Median Income |
| No Earners | 686 (6.4%) | $73,938 |
| 1 Earner | 3,091 (28.8%) | $81,229 |
| 2 Earners | 4,410 (41.2%) | $139,847 |
| 3+ Earners | 2,526 (23.6%) | $172,308 |
| Total | 10,713 (100.0%) | $128,810 |
Household Income in Oakley
Household Income Brackets in Oakley
With 3,389 households falling in the category, the $100,000 to $149,999 income range is the most frequent in Oakley, accounting for 26.0% of all households. In contrast, only 209 households (1.6%) fall into the $10,000 to $14,999 income bracket, making it the least populous group.
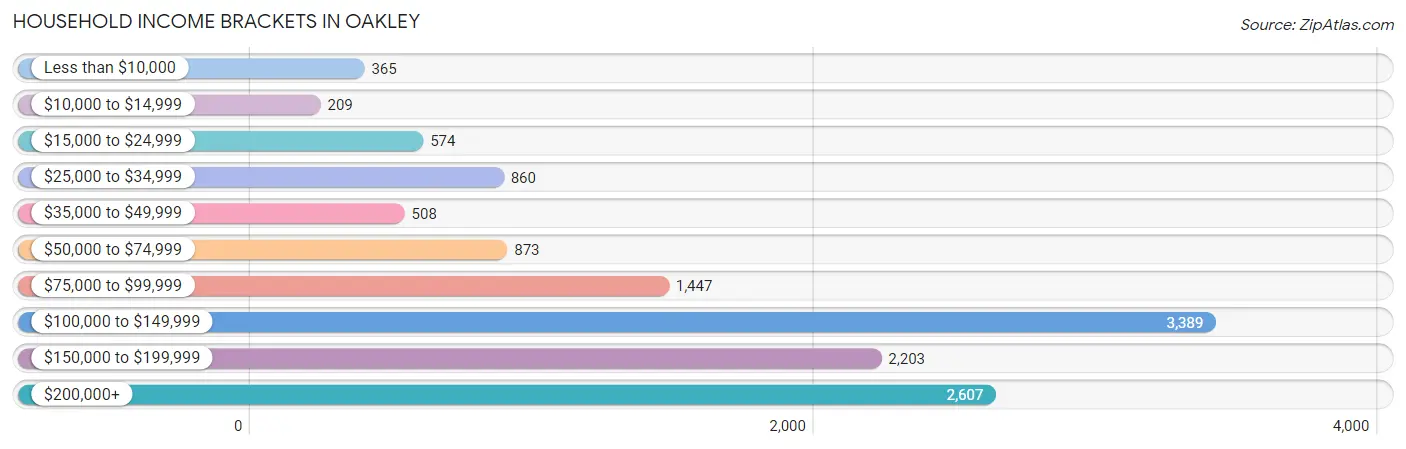
| Income Bracket | # Households | % Households |
| Less than $10,000 | 365 | 2.8% |
| $10,000 to $14,999 | 209 | 1.6% |
| $15,000 to $24,999 | 574 | 4.4% |
| $25,000 to $34,999 | 860 | 6.6% |
| $35,000 to $49,999 | 508 | 3.9% |
| $50,000 to $74,999 | 873 | 6.7% |
| $75,000 to $99,999 | 1,447 | 11.1% |
| $100,000 to $149,999 | 3,389 | 26.0% |
| $150,000 to $199,999 | 2,203 | 16.9% |
| $200,000+ | 2,607 | 20.0% |
Household Income by Householder Age in Oakley
The median household income in Oakley is $120,915, with the highest median household income of $142,388 found in the 45 to 64 years age bracket for the primary householder. A total of 5,564 households (42.7%) fall into this category. Meanwhile, the 15 to 24 years age bracket for the primary householder has the lowest median household income of $0, with 85 households (0.6%) in this group.
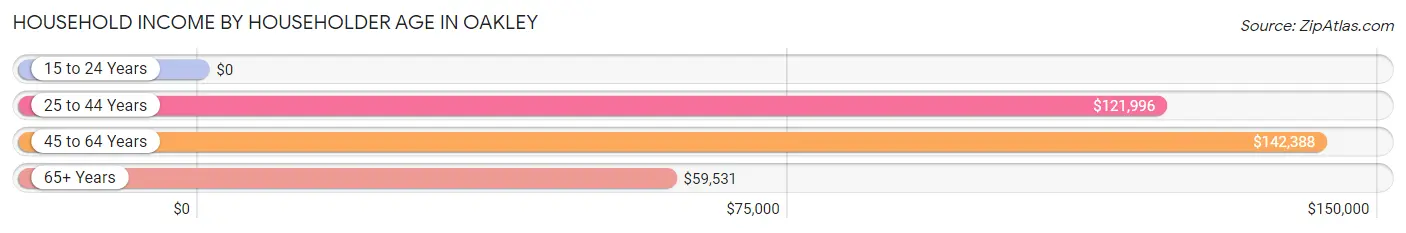
| Income Bracket | # Households | Median Income |
| 15 to 24 Years | 85 (0.6%) | $0 |
| 25 to 44 Years | 4,991 (38.3%) | $121,996 |
| 45 to 64 Years | 5,564 (42.7%) | $142,388 |
| 65+ Years | 2,396 (18.4%) | $59,531 |
| Total | 13,036 (100.0%) | $120,915 |
Poverty in Oakley
Income Below Poverty by Sex and Age in Oakley
With 7.9% poverty level for males and 6.1% for females among the residents of Oakley, 5 year old males and 75 year old and over females are the most vulnerable to poverty, with 110 males (33.3%) and 217 females (27.9%) in their respective age groups living below the poverty level.
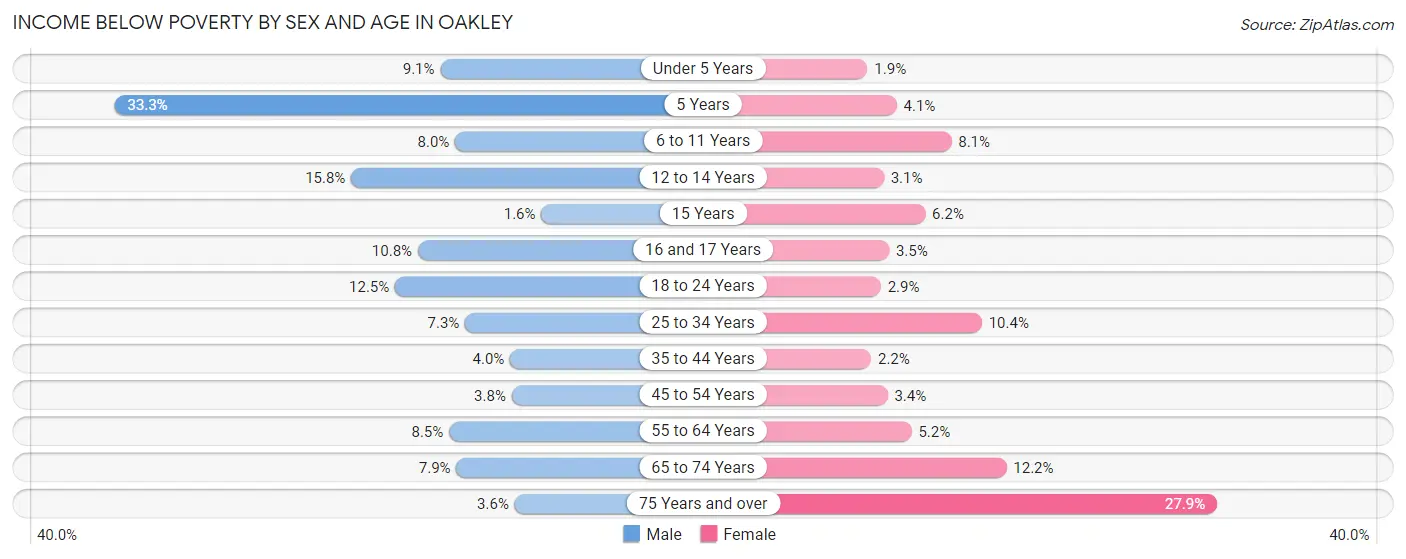
| Age Bracket | Male | Female |
| Under 5 Years | 144 (9.1%) | 33 (1.9%) |
| 5 Years | 110 (33.3%) | 9 (4.1%) |
| 6 to 11 Years | 174 (8.0%) | 109 (8.1%) |
| 12 to 14 Years | 140 (15.8%) | 38 (3.1%) |
| 15 Years | 3 (1.6%) | 14 (6.2%) |
| 16 and 17 Years | 73 (10.8%) | 16 (3.5%) |
| 18 to 24 Years | 240 (12.5%) | 66 (2.9%) |
| 25 to 34 Years | 217 (7.3%) | 305 (10.4%) |
| 35 to 44 Years | 134 (4.0%) | 67 (2.2%) |
| 45 to 54 Years | 102 (3.8%) | 95 (3.4%) |
| 55 to 64 Years | 260 (8.5%) | 150 (5.2%) |
| 65 to 74 Years | 129 (7.9%) | 187 (12.2%) |
| 75 Years and over | 17 (3.6%) | 217 (27.9%) |
| Total | 1,743 (7.9%) | 1,306 (6.1%) |
Income Above Poverty by Sex and Age in Oakley
According to the poverty statistics in Oakley, males aged 15 years and females aged under 5 years are the age groups that are most secure financially, with 98.4% of males and 98.1% of females in these age groups living above the poverty line.
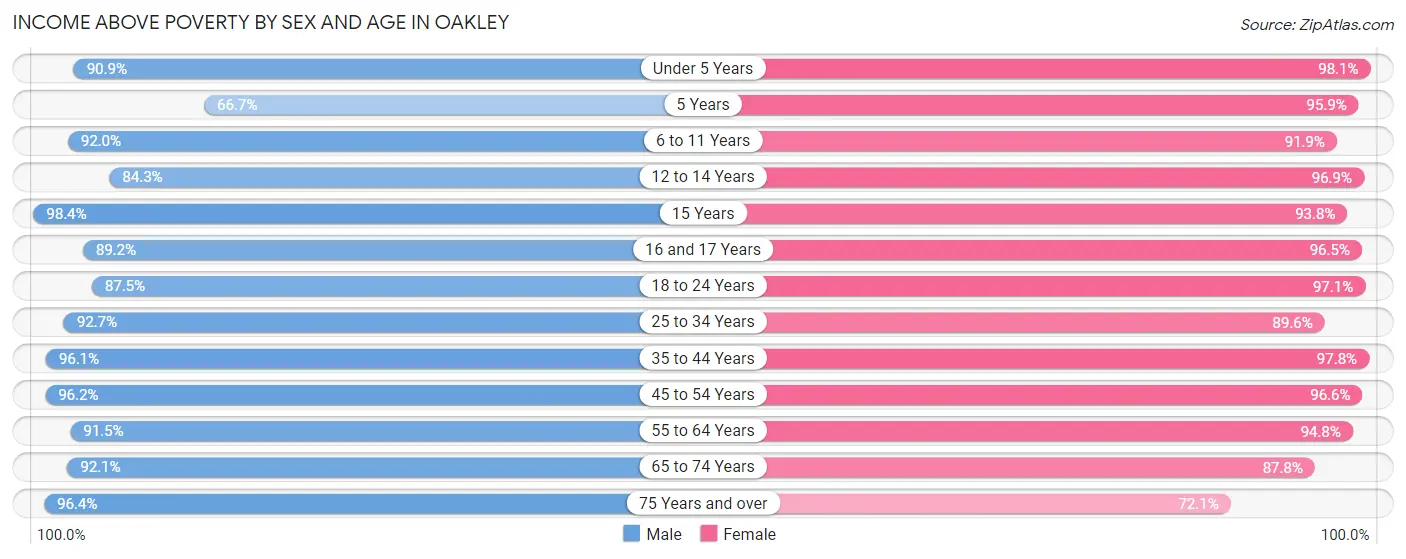
| Age Bracket | Male | Female |
| Under 5 Years | 1,434 (90.9%) | 1,708 (98.1%) |
| 5 Years | 220 (66.7%) | 212 (95.9%) |
| 6 to 11 Years | 1,993 (92.0%) | 1,232 (91.9%) |
| 12 to 14 Years | 749 (84.3%) | 1,183 (96.9%) |
| 15 Years | 181 (98.4%) | 212 (93.8%) |
| 16 and 17 Years | 603 (89.2%) | 441 (96.5%) |
| 18 to 24 Years | 1,682 (87.5%) | 2,218 (97.1%) |
| 25 to 34 Years | 2,759 (92.7%) | 2,630 (89.6%) |
| 35 to 44 Years | 3,256 (96.1%) | 3,019 (97.8%) |
| 45 to 54 Years | 2,564 (96.2%) | 2,707 (96.6%) |
| 55 to 64 Years | 2,807 (91.5%) | 2,752 (94.8%) |
| 65 to 74 Years | 1,496 (92.1%) | 1,343 (87.8%) |
| 75 Years and over | 454 (96.4%) | 562 (72.1%) |
| Total | 20,198 (92.1%) | 20,219 (93.9%) |
Income Below Poverty Among Married-Couple Families in Oakley
The poverty statistics for married-couple families in Oakley show that 2.1% or 184 of the total 8,569 families live below the poverty line. Families with 3 or 4 children have the highest poverty rate of 9.4%, comprising of 87 families. On the other hand, families with 5 or more children have the lowest poverty rate of 0.0%, which includes 0 families.
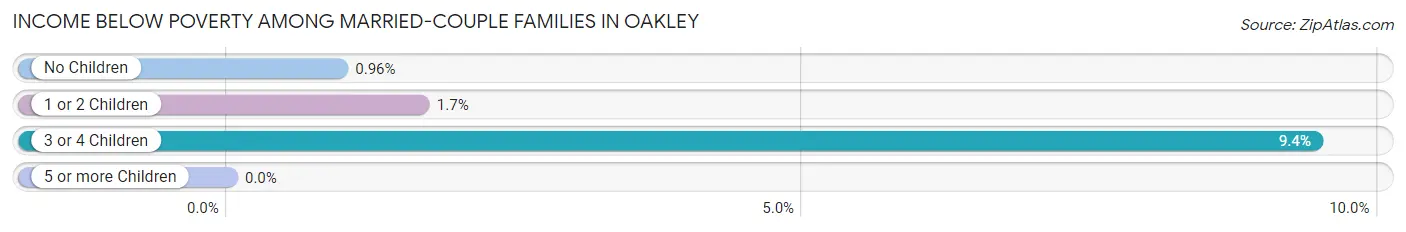
| Children | Above Poverty | Below Poverty |
| No Children | 4,147 (99.0%) | 40 (1.0%) |
| 1 or 2 Children | 3,350 (98.3%) | 57 (1.7%) |
| 3 or 4 Children | 835 (90.6%) | 87 (9.4%) |
| 5 or more Children | 53 (100.0%) | 0 (0.0%) |
| Total | 8,385 (97.9%) | 184 (2.1%) |
Income Below Poverty Among Single-Parent Households in Oakley
According to the poverty data in Oakley, 7.3% or 46 single-father households and 23.5% or 356 single-mother households are living below the poverty line. Among single-father households, those with no children have the highest poverty rate, with 36 households (14.3%) experiencing poverty. Likewise, among single-mother households, those with no children have the highest poverty rate, with 191 households (35.2%) falling below the poverty line.
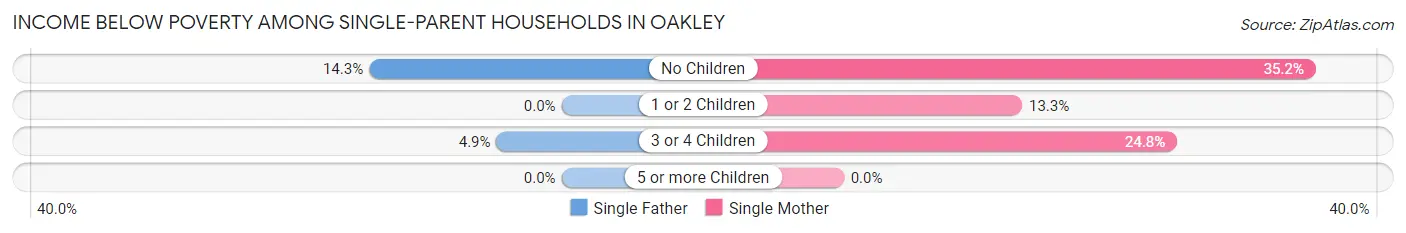
| Children | Single Father | Single Mother |
| No Children | 36 (14.3%) | 191 (35.2%) |
| 1 or 2 Children | 0 (0.0%) | 88 (13.3%) |
| 3 or 4 Children | 10 (4.9%) | 77 (24.8%) |
| 5 or more Children | 0 (0.0%) | 0 (0.0%) |
| Total | 46 (7.3%) | 356 (23.5%) |
Income Below Poverty Among Married-Couple vs Single-Parent Households in Oakley
The poverty data for Oakley shows that 184 of the married-couple family households (2.1%) and 402 of the single-parent households (18.8%) are living below the poverty level. Within the married-couple family households, those with 3 or 4 children have the highest poverty rate, with 87 households (9.4%) falling below the poverty line. Among the single-parent households, those with no children have the highest poverty rate, with 227 household (28.6%) living below poverty.
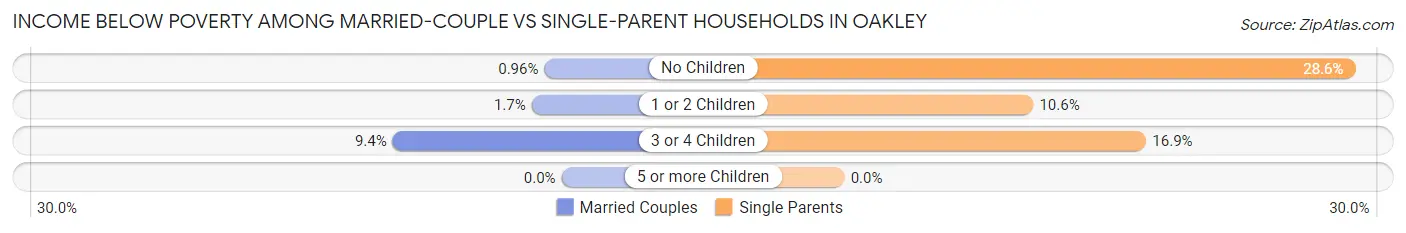
| Children | Married-Couple Families | Single-Parent Households |
| No Children | 40 (1.0%) | 227 (28.6%) |
| 1 or 2 Children | 57 (1.7%) | 88 (10.5%) |
| 3 or 4 Children | 87 (9.4%) | 87 (16.9%) |
| 5 or more Children | 0 (0.0%) | 0 (0.0%) |
| Total | 184 (2.1%) | 402 (18.8%) |
Race in Oakley
The most populous races in Oakley are White / Caucasian (23,492 | 54.0%), Hispanic or Latino (13,958 | 32.1%), and Two or more Races (6,106 | 14.0%).
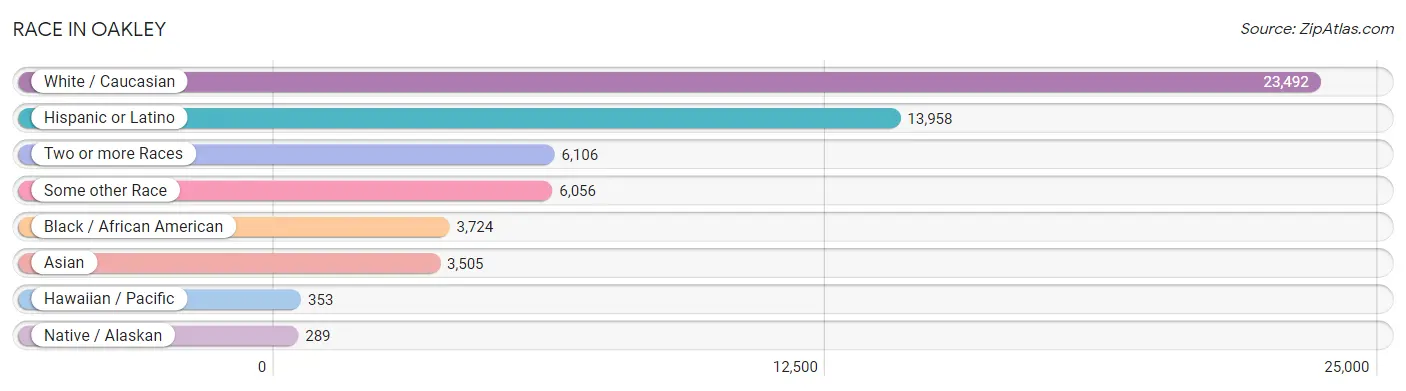
| Race | # Population | % Population |
| Asian | 3,505 | 8.1% |
| Black / African American | 3,724 | 8.6% |
| Hawaiian / Pacific | 353 | 0.8% |
| Hispanic or Latino | 13,958 | 32.1% |
| Native / Alaskan | 289 | 0.7% |
| White / Caucasian | 23,492 | 54.0% |
| Two or more Races | 6,106 | 14.0% |
| Some other Race | 6,056 | 13.9% |
| Total | 43,525 | 100.0% |
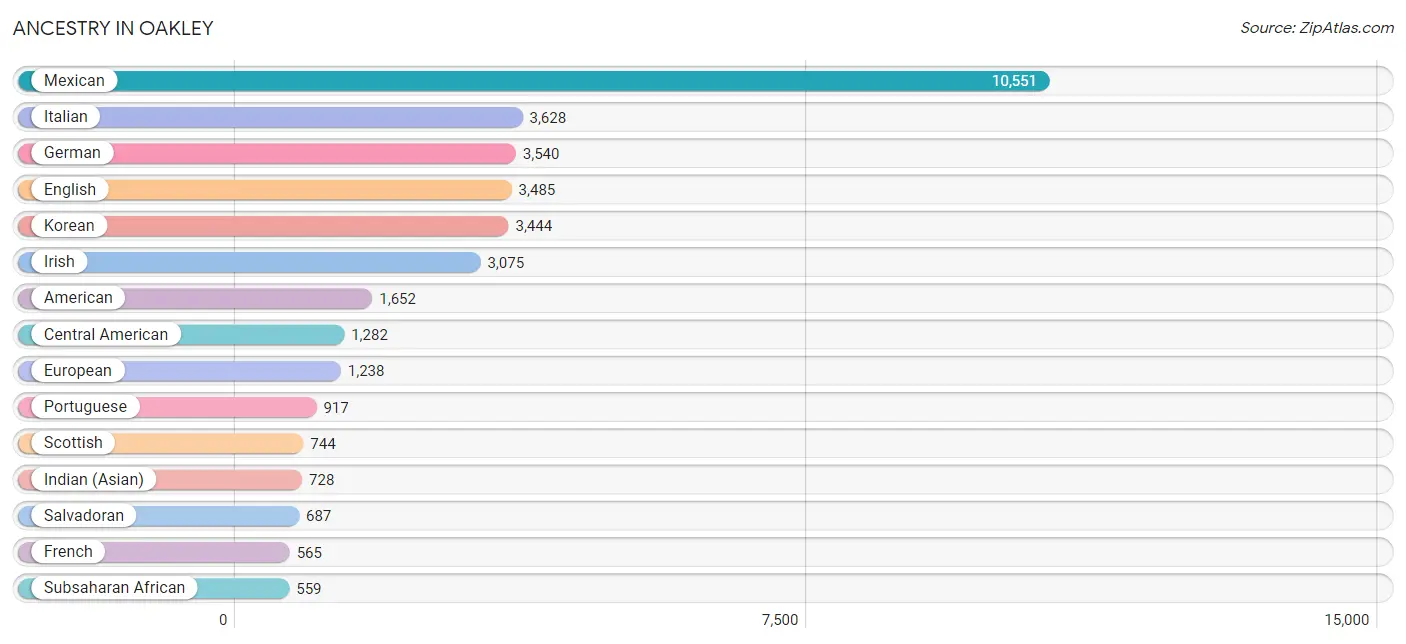
Ancestry in Oakley
The most populous ancestries reported in Oakley are Mexican (10,551 | 24.2%), Italian (3,628 | 8.3%), German (3,540 | 8.1%), English (3,485 | 8.0%), and Korean (3,444 | 7.9%), together accounting for 56.6% of all Oakley residents.
| Ancestry | # Population | % Population |
| Afghan | 23 | 0.1% |
| American | 1,652 | 3.8% |
| Apache | 15 | 0.0% |
| Arab | 245 | 0.6% |
| Argentinean | 88 | 0.2% |
| Austrian | 34 | 0.1% |
| Bangladeshi | 57 | 0.1% |
| Basque | 17 | 0.0% |
| Belgian | 33 | 0.1% |
| Bhutanese | 358 | 0.8% |
| Blackfeet | 289 | 0.7% |
| Bolivian | 29 | 0.1% |
| Brazilian | 26 | 0.1% |
| British | 133 | 0.3% |
| Burmese | 38 | 0.1% |
| Cajun | 18 | 0.0% |
| Canadian | 69 | 0.2% |
| Carpatho Rusyn | 34 | 0.1% |
| Central American | 1,282 | 2.9% |
| Cherokee | 261 | 0.6% |
| Chilean | 40 | 0.1% |
| Choctaw | 32 | 0.1% |
| Costa Rican | 189 | 0.4% |
| Creek | 35 | 0.1% |
| Cuban | 48 | 0.1% |
| Czechoslovakian | 15 | 0.0% |
| Danish | 88 | 0.2% |
| Dutch | 350 | 0.8% |
| Eastern European | 429 | 1.0% |
| Egyptian | 95 | 0.2% |
| English | 3,485 | 8.0% |
| European | 1,238 | 2.8% |
| Finnish | 61 | 0.1% |
| French | 565 | 1.3% |
| French Canadian | 221 | 0.5% |
| German | 3,540 | 8.1% |
| Greek | 87 | 0.2% |
| Guamanian / Chamorro | 164 | 0.4% |
| Guatemalan | 71 | 0.2% |
| Honduran | 1 | 0.0% |
| Hungarian | 61 | 0.1% |
| Indian (Asian) | 728 | 1.7% |
| Iranian | 221 | 0.5% |
| Irish | 3,075 | 7.1% |
| Italian | 3,628 | 8.3% |
| Jamaican | 39 | 0.1% |
| Kenyan | 8 | 0.0% |
| Korean | 3,444 | 7.9% |
| Laotian | 9 | 0.0% |
| Lebanese | 87 | 0.2% |
| Malaysian | 36 | 0.1% |
| Mexican | 10,551 | 24.2% |
| Mexican American Indian | 103 | 0.2% |
| Native Hawaiian | 151 | 0.4% |
| Navajo | 8 | 0.0% |
| Nicaraguan | 239 | 0.5% |
| Nigerian | 521 | 1.2% |
| Northern European | 59 | 0.1% |
| Norwegian | 308 | 0.7% |
| Ottawa | 3 | 0.0% |
| Peruvian | 172 | 0.4% |
| Polish | 307 | 0.7% |
| Portuguese | 917 | 2.1% |
| Pueblo | 9 | 0.0% |
| Puerto Rican | 490 | 1.1% |
| Romanian | 14 | 0.0% |
| Russian | 83 | 0.2% |
| Salvadoran | 687 | 1.6% |
| Samoan | 230 | 0.5% |
| Scandinavian | 254 | 0.6% |
| Scotch-Irish | 237 | 0.5% |
| Scottish | 744 | 1.7% |
| Seminole | 39 | 0.1% |
| Slavic | 15 | 0.0% |
| South African | 30 | 0.1% |
| South American | 329 | 0.8% |
| Spaniard | 136 | 0.3% |
| Spanish | 526 | 1.2% |
| Spanish American Indian | 15 | 0.0% |
| Sri Lankan | 461 | 1.1% |
| Subsaharan African | 559 | 1.3% |
| Swedish | 164 | 0.4% |
| Swiss | 34 | 0.1% |
| Thai | 204 | 0.5% |
| Tohono O'Odham | 52 | 0.1% |
| Turkish | 30 | 0.1% |
| Ukrainian | 62 | 0.1% |
| Welsh | 438 | 1.0% |
| Yaqui | 20 | 0.1% |
| Yugoslavian | 178 | 0.4% | View All 90 Rows |
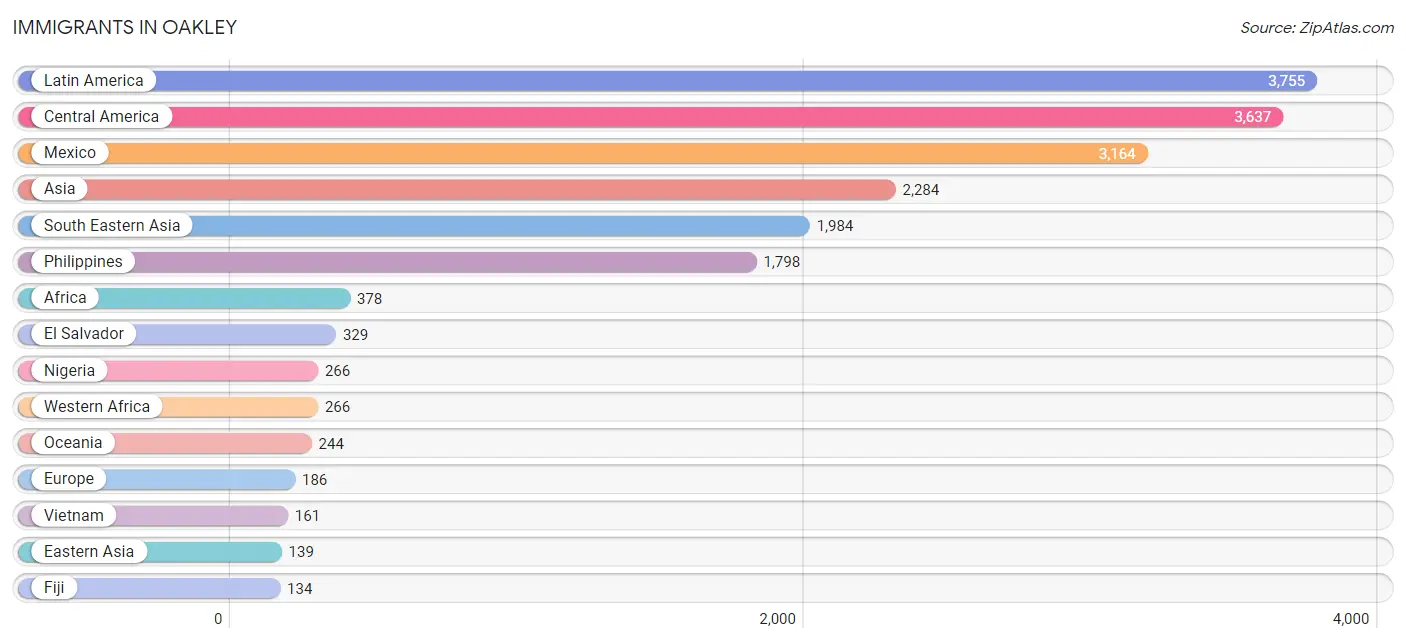
Immigrants in Oakley
The most numerous immigrant groups reported in Oakley came from Latin America (3,755 | 8.6%), Central America (3,637 | 8.4%), Mexico (3,164 | 7.3%), Asia (2,284 | 5.2%), and South Eastern Asia (1,984 | 4.6%), together accounting for 34.1% of all Oakley residents.
| Immigration Origin | # Population | % Population |
| Afghanistan | 23 | 0.1% |
| Africa | 378 | 0.9% |
| Asia | 2,284 | 5.2% |
| Australia | 23 | 0.1% |
| Belarus | 17 | 0.0% |
| Brazil | 62 | 0.1% |
| Canada | 118 | 0.3% |
| Caribbean | 39 | 0.1% |
| Central America | 3,637 | 8.4% |
| China | 106 | 0.2% |
| Costa Rica | 38 | 0.1% |
| Cuba | 12 | 0.0% |
| Eastern Africa | 8 | 0.0% |
| Eastern Asia | 139 | 0.3% |
| Eastern Europe | 39 | 0.1% |
| Egypt | 55 | 0.1% |
| El Salvador | 329 | 0.8% |
| England | 67 | 0.2% |
| Europe | 186 | 0.4% |
| Fiji | 134 | 0.3% |
| Germany | 10 | 0.0% |
| Guatemala | 31 | 0.1% |
| Honduras | 1 | 0.0% |
| Hong Kong | 30 | 0.1% |
| India | 73 | 0.2% |
| Indonesia | 1 | 0.0% |
| Iran | 17 | 0.0% |
| Italy | 19 | 0.0% |
| Jamaica | 27 | 0.1% |
| Japan | 6 | 0.0% |
| Kenya | 8 | 0.0% |
| Korea | 27 | 0.1% |
| Kuwait | 27 | 0.1% |
| Laos | 11 | 0.0% |
| Latin America | 3,755 | 8.6% |
| Mexico | 3,164 | 7.3% |
| Micronesia | 31 | 0.1% |
| Middle Africa | 18 | 0.0% |
| Nicaragua | 74 | 0.2% |
| Nigeria | 266 | 0.6% |
| Northern Africa | 68 | 0.2% |
| Northern Europe | 67 | 0.2% |
| Oceania | 244 | 0.6% |
| Peru | 17 | 0.0% |
| Philippines | 1,798 | 4.1% |
| Portugal | 51 | 0.1% |
| South Africa | 18 | 0.0% |
| South America | 79 | 0.2% |
| South Central Asia | 113 | 0.3% |
| South Eastern Asia | 1,984 | 4.6% |
| Southern Europe | 70 | 0.2% |
| Taiwan | 21 | 0.1% |
| Thailand | 13 | 0.0% |
| Ukraine | 22 | 0.1% |
| Vietnam | 161 | 0.4% |
| Western Africa | 266 | 0.6% |
| Western Asia | 48 | 0.1% |
| Western Europe | 10 | 0.0% |
| Yemen | 21 | 0.1% | View All 59 Rows |
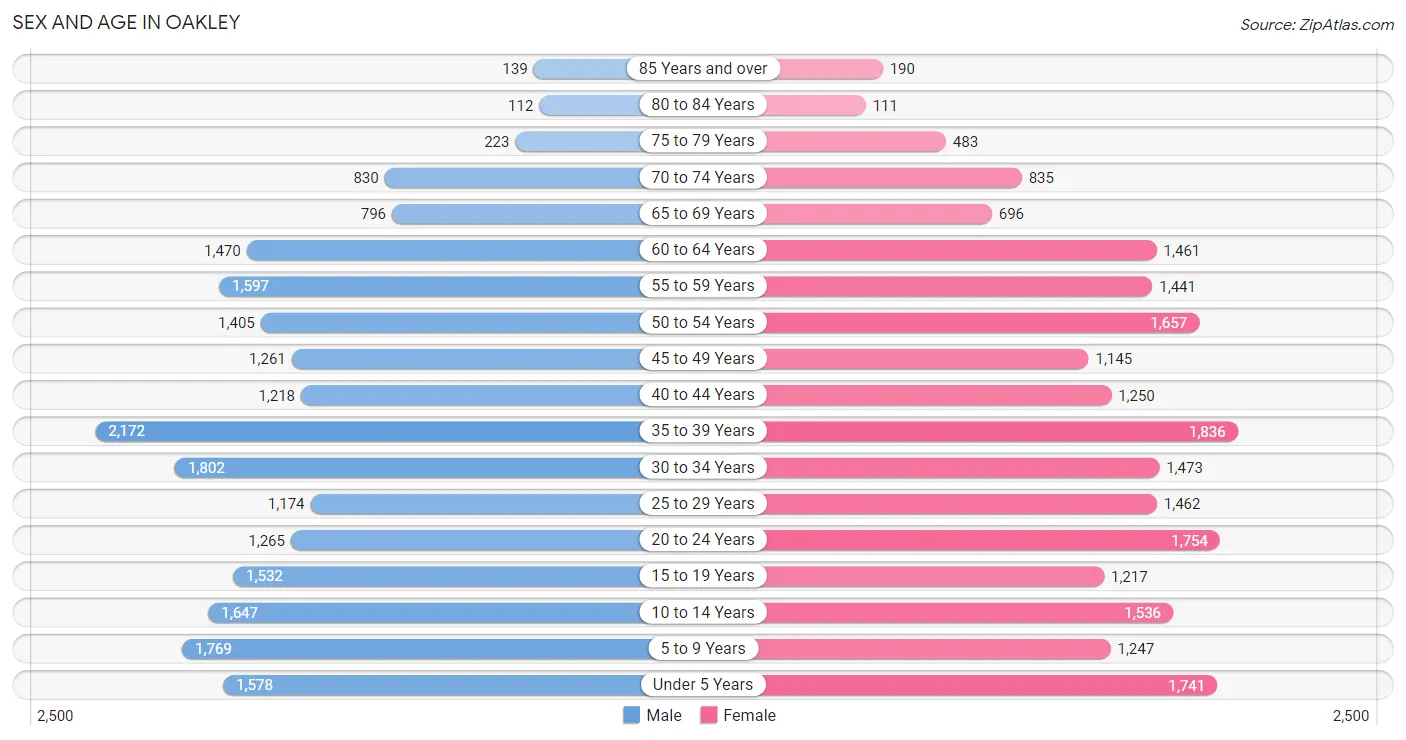
Sex and Age in Oakley
Sex and Age in Oakley
The most populous age groups in Oakley are 35 to 39 Years (2,172 | 9.9%) for men and 35 to 39 Years (1,836 | 8.5%) for women.
| Age Bracket | Male | Female |
| Under 5 Years | 1,578 (7.2%) | 1,741 (8.1%) |
| 5 to 9 Years | 1,769 (8.0%) | 1,247 (5.8%) |
| 10 to 14 Years | 1,647 (7.5%) | 1,536 (7.1%) |
| 15 to 19 Years | 1,532 (7.0%) | 1,217 (5.7%) |
| 20 to 24 Years | 1,265 (5.8%) | 1,754 (8.1%) |
| 25 to 29 Years | 1,174 (5.3%) | 1,462 (6.8%) |
| 30 to 34 Years | 1,802 (8.2%) | 1,473 (6.8%) |
| 35 to 39 Years | 2,172 (9.9%) | 1,836 (8.5%) |
| 40 to 44 Years | 1,218 (5.5%) | 1,250 (5.8%) |
| 45 to 49 Years | 1,261 (5.7%) | 1,145 (5.3%) |
| 50 to 54 Years | 1,405 (6.4%) | 1,657 (7.7%) |
| 55 to 59 Years | 1,597 (7.3%) | 1,441 (6.7%) |
| 60 to 64 Years | 1,470 (6.7%) | 1,461 (6.8%) |
| 65 to 69 Years | 796 (3.6%) | 696 (3.2%) |
| 70 to 74 Years | 830 (3.8%) | 835 (3.9%) |
| 75 to 79 Years | 223 (1.0%) | 483 (2.2%) |
| 80 to 84 Years | 112 (0.5%) | 111 (0.5%) |
| 85 Years and over | 139 (0.6%) | 190 (0.9%) |
| Total | 21,990 (100.0%) | 21,535 (100.0%) |
Families and Households in Oakley
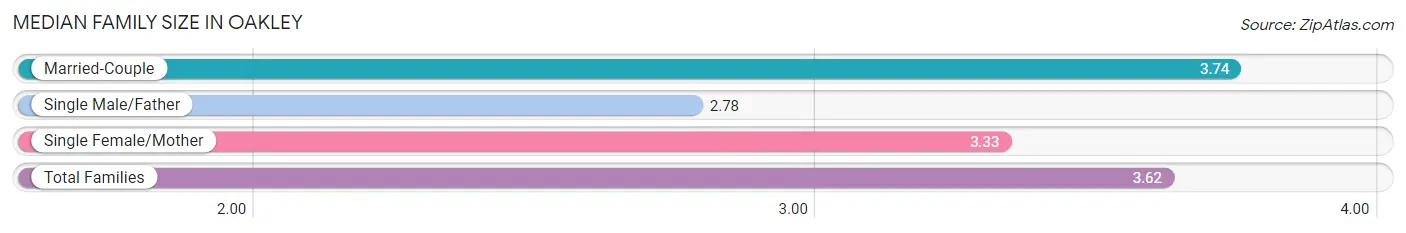
Median Family Size in Oakley
The median family size in Oakley is 3.62 persons per family, with married-couple families (8,569 | 80.0%) accounting for the largest median family size of 3.74 persons per family. On the other hand, single male/father families (629 | 5.9%) represent the smallest median family size with 2.78 persons per family.
| Family Type | # Families | Family Size |
| Married-Couple | 8,569 (80.0%) | 3.74 |
| Single Male/Father | 629 (5.9%) | 2.78 |
| Single Female/Mother | 1,515 (14.1%) | 3.33 |
| Total Families | 10,713 (100.0%) | 3.62 |
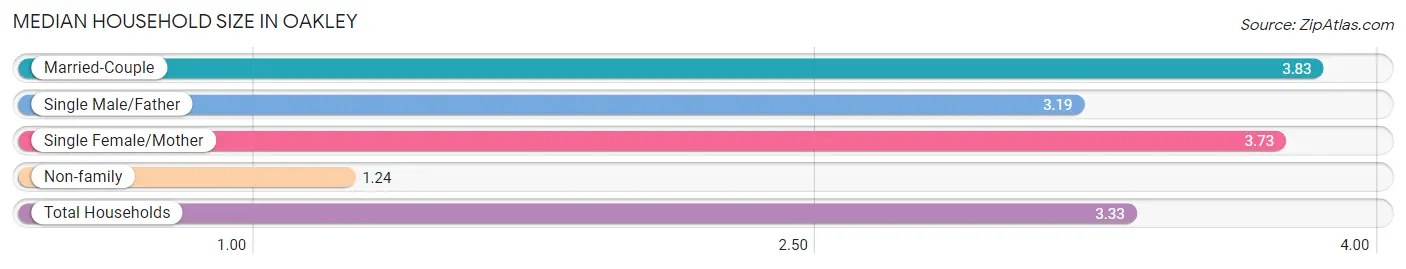
Median Household Size in Oakley
The median household size in Oakley is 3.33 persons per household, with married-couple households (8,569 | 65.7%) accounting for the largest median household size of 3.83 persons per household. non-family households (2,323 | 17.8%) represent the smallest median household size with 1.24 persons per household.
| Household Type | # Households | Household Size |
| Married-Couple | 8,569 (65.7%) | 3.83 |
| Single Male/Father | 629 (4.8%) | 3.19 |
| Single Female/Mother | 1,515 (11.6%) | 3.73 |
| Non-family | 2,323 (17.8%) | 1.24 |
| Total Households | 13,036 (100.0%) | 3.33 |
Household Size by Marriage Status in Oakley
Out of a total of 13,036 households in Oakley, 10,713 (82.2%) are family households, while 2,323 (17.8%) are nonfamily households. The most numerous type of family households are 4-person households, comprising 2,845, and the most common type of nonfamily households are 1-person households, comprising 1,937.
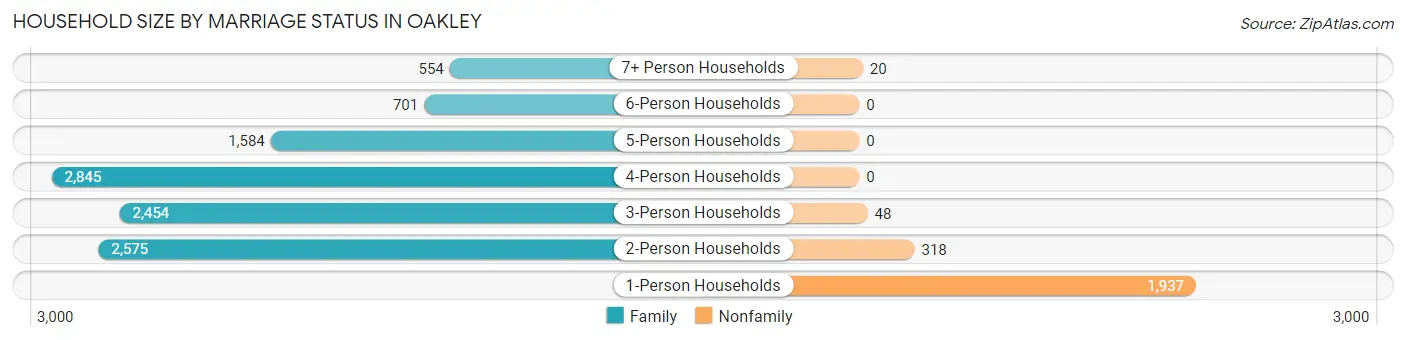
| Household Size | Family Households | Nonfamily Households |
| 1-Person Households | - | 1,937 (14.9%) |
| 2-Person Households | 2,575 (19.8%) | 318 (2.4%) |
| 3-Person Households | 2,454 (18.8%) | 48 (0.4%) |
| 4-Person Households | 2,845 (21.8%) | 0 (0.0%) |
| 5-Person Households | 1,584 (12.1%) | 0 (0.0%) |
| 6-Person Households | 701 (5.4%) | 0 (0.0%) |
| 7+ Person Households | 554 (4.3%) | 20 (0.2%) |
| Total | 10,713 (82.2%) | 2,323 (17.8%) |
Female Fertility in Oakley
Fertility by Age in Oakley
Average fertility rate in Oakley is 73.0 births per 1,000 women. Women in the age bracket of 20 to 34 years have the highest fertility rate with 103.0 births per 1,000 women. Women in the age bracket of 20 to 34 years acount for 63.4% of all women with births.
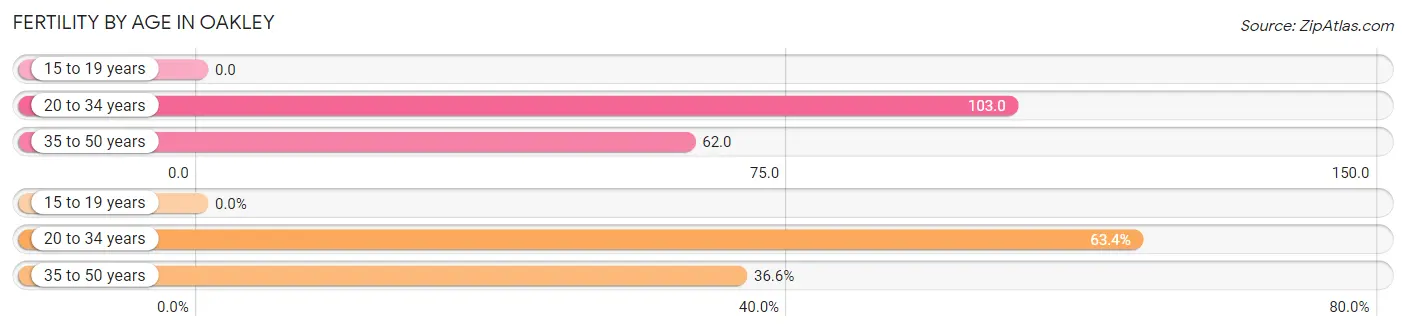
| Age Bracket | Women with Births | Births / 1,000 Women |
| 15 to 19 years | 0 (0.0%) | 0.0 |
| 20 to 34 years | 482 (63.4%) | 103.0 |
| 35 to 50 years | 278 (36.6%) | 62.0 |
| Total | 760 (100.0%) | 73.0 |
Fertility by Age by Marriage Status in Oakley
71.7% of women with births (760) in Oakley are married. The highest percentage of unmarried women with births falls into 35 to 50 years age bracket with 30.9% of them unmarried at the time of birth, while the lowest percentage of unmarried women with births belong to 20 to 34 years age bracket with 26.8% of them unmarried.
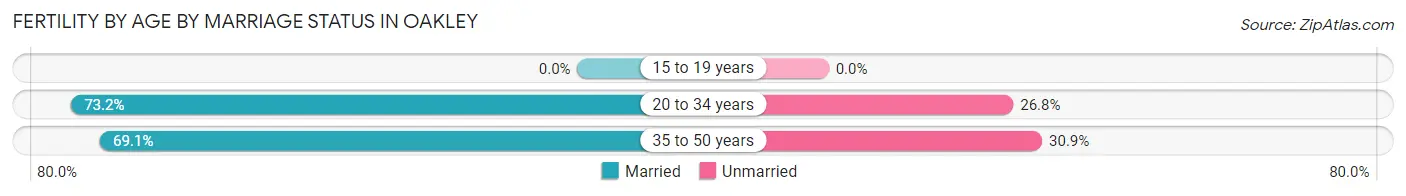
| Age Bracket | Married | Unmarried |
| 15 to 19 years | 0 (0.0%) | 0 (0.0%) |
| 20 to 34 years | 353 (73.2%) | 129 (26.8%) |
| 35 to 50 years | 192 (69.1%) | 86 (30.9%) |
| Total | 545 (71.7%) | 215 (28.3%) |
Fertility by Education in Oakley
Average fertility rate in Oakley is 73.0 births per 1,000 women. Women with the education attainment of bachelor's degree have the highest fertility rate of 118.0 births per 1,000 women, while women with the education attainment of less than high school have the lowest fertility at 41.0 births per 1,000 women. Women with the education attainment of college or associate's degree represent 38.6% of all women with births.
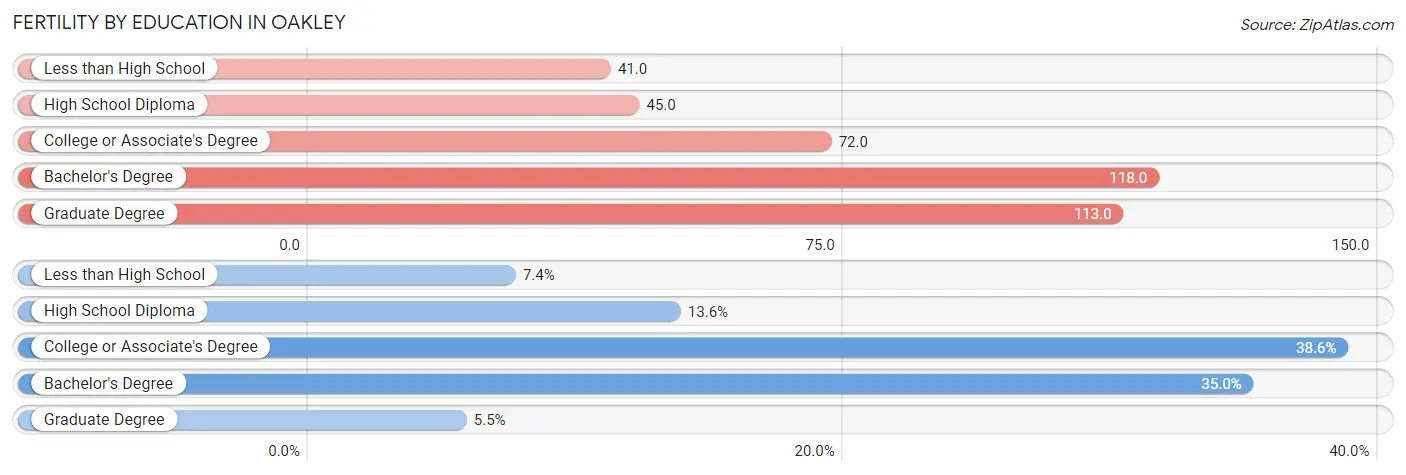
| Educational Attainment | Women with Births | Births / 1,000 Women |
| Less than High School | 56 (7.4%) | 41.0 |
| High School Diploma | 103 (13.6%) | 45.0 |
| College or Associate's Degree | 293 (38.6%) | 72.0 |
| Bachelor's Degree | 266 (35.0%) | 118.0 |
| Graduate Degree | 42 (5.5%) | 113.0 |
| Total | 760 (100.0%) | 73.0 |
Fertility by Education by Marriage Status in Oakley
28.3% of women with births in Oakley are unmarried. Women with the educational attainment of less than high school are most likely to be married with 100.0% of them married at childbirth, while women with the educational attainment of high school diploma are least likely to be married with 73.8% of them unmarried at childbirth.
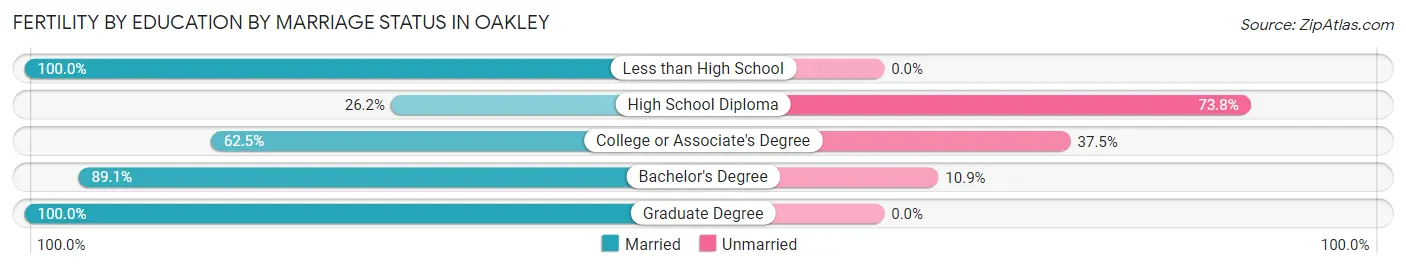
| Educational Attainment | Married | Unmarried |
| Less than High School | 56 (100.0%) | 0 (0.0%) |
| High School Diploma | 27 (26.2%) | 76 (73.8%) |
| College or Associate's Degree | 183 (62.5%) | 110 (37.5%) |
| Bachelor's Degree | 237 (89.1%) | 29 (10.9%) |
| Graduate Degree | 42 (100.0%) | 0 (0.0%) |
| Total | 545 (71.7%) | 215 (28.3%) |
Employment Characteristics in Oakley
Employment by Class of Employer in Oakley
Among the 20,832 employed individuals in Oakley, private company employees (14,288 | 68.6%), local government employees (1,914 | 9.2%), and not-for-profit organizations (1,741 | 8.4%) make up the most common classes of employment.
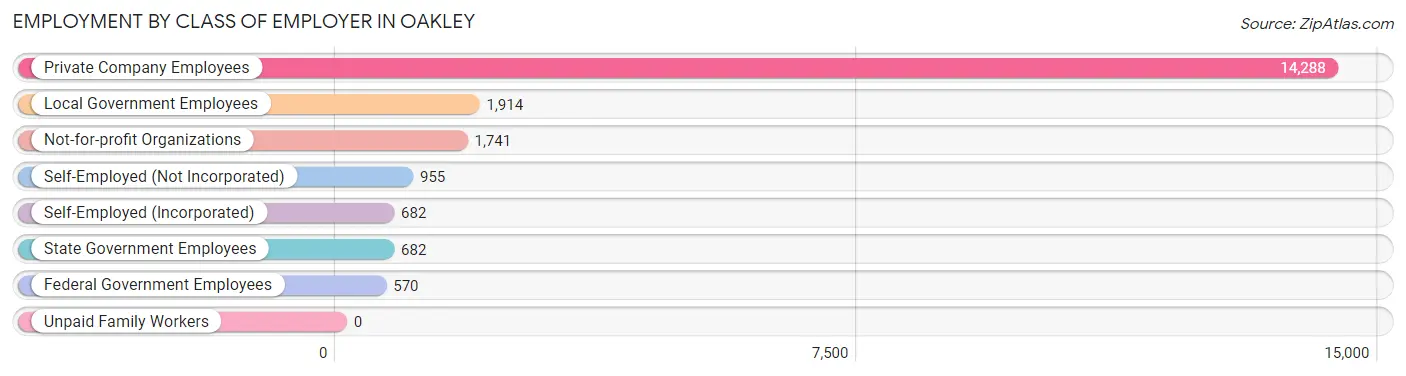
| Employer Class | # Employees | % Employees |
| Private Company Employees | 14,288 | 68.6% |
| Self-Employed (Incorporated) | 682 | 3.3% |
| Self-Employed (Not Incorporated) | 955 | 4.6% |
| Not-for-profit Organizations | 1,741 | 8.4% |
| Local Government Employees | 1,914 | 9.2% |
| State Government Employees | 682 | 3.3% |
| Federal Government Employees | 570 | 2.7% |
| Unpaid Family Workers | 0 | 0.0% |
| Total | 20,832 | 100.0% |
Employment Status by Age in Oakley
According to the labor force statistics for Oakley, out of the total population over 16 years of age (33,593), 68.2% or 22,910 individuals are in the labor force, with 5.9% or 1,352 of them unemployed. The age group with the highest labor force participation rate is 35 to 44 years, with 87.5% or 5,666 individuals in the labor force. Within the labor force, the 75 years and over age range has the highest percentage of unemployed individuals, with 78.0% or 33 of them being unemployed.
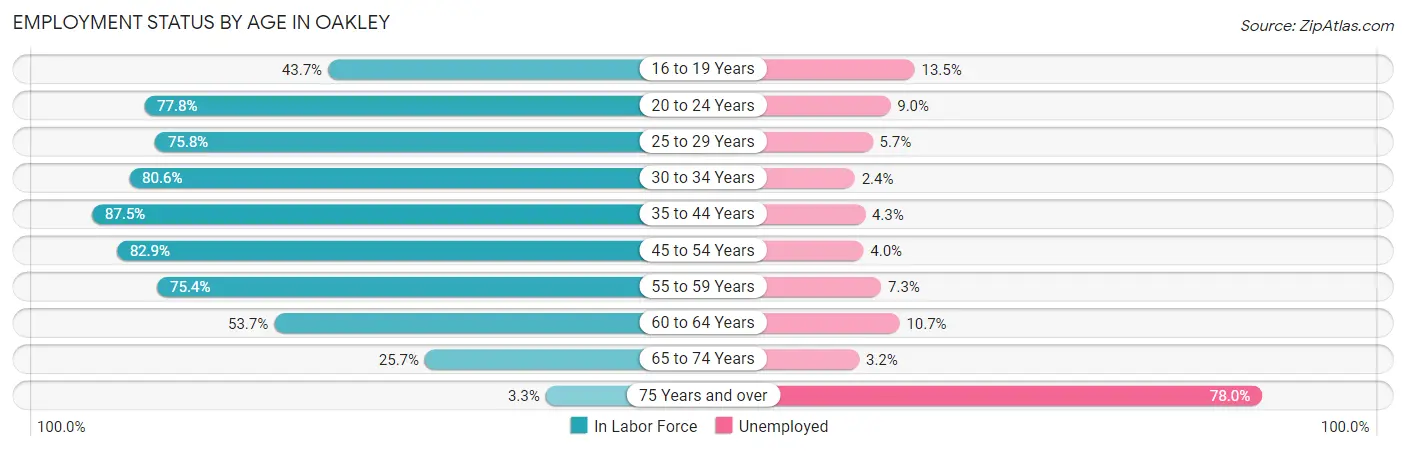
| Age Bracket | In Labor Force | Unemployed |
| 16 to 19 Years | 1,020 (43.7%) | 138 (13.5%) |
| 20 to 24 Years | 2,349 (77.8%) | 211 (9.0%) |
| 25 to 29 Years | 1,998 (75.8%) | 114 (5.7%) |
| 30 to 34 Years | 2,640 (80.6%) | 63 (2.4%) |
| 35 to 44 Years | 5,666 (87.5%) | 244 (4.3%) |
| 45 to 54 Years | 4,533 (82.9%) | 181 (4.0%) |
| 55 to 59 Years | 2,291 (75.4%) | 167 (7.3%) |
| 60 to 64 Years | 1,574 (53.7%) | 168 (10.7%) |
| 65 to 74 Years | 811 (25.7%) | 26 (3.2%) |
| 75 Years and over | 42 (3.3%) | 33 (78.0%) |
| Total | 22,910 (68.2%) | 1,352 (5.9%) |
Employment Status by Educational Attainment in Oakley
According to labor force statistics for Oakley, 78.5% of individuals (18,702) out of the total population between 25 and 64 years of age (23,824) are in the labor force, with 5.0% or 935 of them being unemployed. The group with the highest labor force participation rate are those with the educational attainment of bachelor's degree or higher, with 85.6% or 4,788 individuals in the labor force. Within the labor force, individuals with less than high school education have the highest percentage of unemployment, with 8.6% or 165 of them being unemployed.
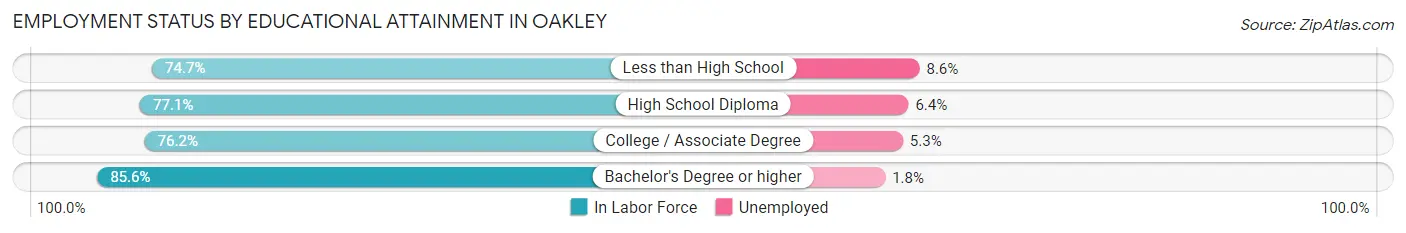
| Educational Attainment | In Labor Force | Unemployed |
| Less than High School | 1,921 (74.7%) | 221 (8.6%) |
| High School Diploma | 5,110 (77.1%) | 424 (6.4%) |
| College / Associate Degree | 6,882 (76.2%) | 479 (5.3%) |
| Bachelor's Degree or higher | 4,788 (85.6%) | 101 (1.8%) |
| Total | 18,702 (78.5%) | 1,191 (5.0%) |
Employment Occupations by Sex in Oakley
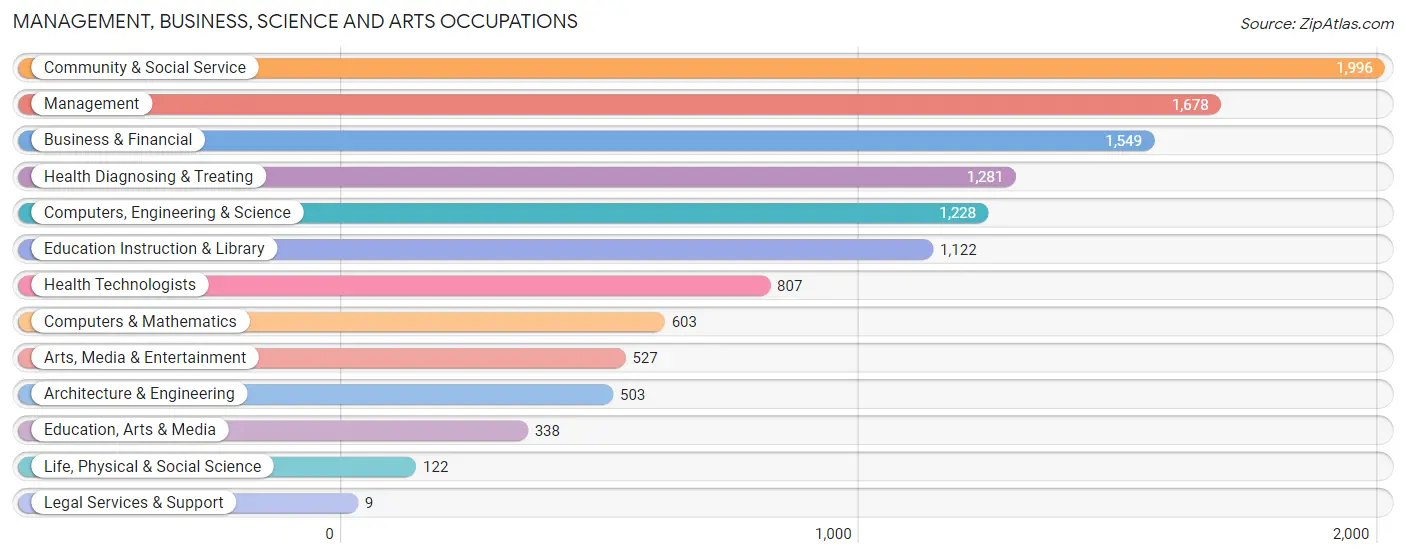
Management, Business, Science and Arts Occupations
The most common Management, Business, Science and Arts occupations in Oakley are Community & Social Service (1,996 | 9.2%), Management (1,678 | 7.8%), Business & Financial (1,549 | 7.2%), Health Diagnosing & Treating (1,281 | 5.9%), and Computers, Engineering & Science (1,228 | 5.7%).
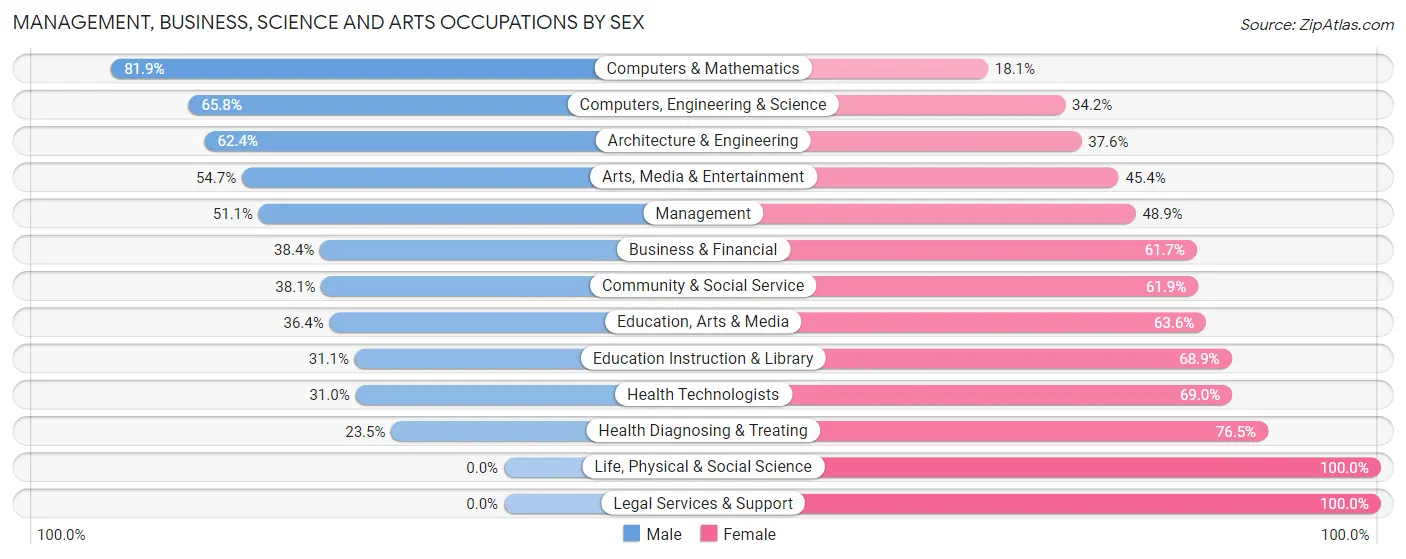
Management, Business, Science and Arts Occupations by Sex
Within the Management, Business, Science and Arts occupations in Oakley, the most male-oriented occupations are Computers & Mathematics (81.9%), Computers, Engineering & Science (65.8%), and Architecture & Engineering (62.4%), while the most female-oriented occupations are Life, Physical & Social Science (100.0%), Legal Services & Support (100.0%), and Health Diagnosing & Treating (76.5%).
| Occupation | Male | Female |
| Management | 858 (51.1%) | 820 (48.9%) |
| Business & Financial | 594 (38.4%) | 955 (61.7%) |
| Computers, Engineering & Science | 808 (65.8%) | 420 (34.2%) |
| Computers & Mathematics | 494 (81.9%) | 109 (18.1%) |
| Architecture & Engineering | 314 (62.4%) | 189 (37.6%) |
| Life, Physical & Social Science | 0 (0.0%) | 122 (100.0%) |
| Community & Social Service | 760 (38.1%) | 1,236 (61.9%) |
| Education, Arts & Media | 123 (36.4%) | 215 (63.6%) |
| Legal Services & Support | 0 (0.0%) | 9 (100.0%) |
| Education Instruction & Library | 349 (31.1%) | 773 (68.9%) |
| Arts, Media & Entertainment | 288 (54.6%) | 239 (45.4%) |
| Health Diagnosing & Treating | 301 (23.5%) | 980 (76.5%) |
| Health Technologists | 250 (31.0%) | 557 (69.0%) |
| Total (Category) | 3,321 (42.9%) | 4,411 (57.1%) |
| Total (Overall) | 11,130 (51.6%) | 10,443 (48.4%) |
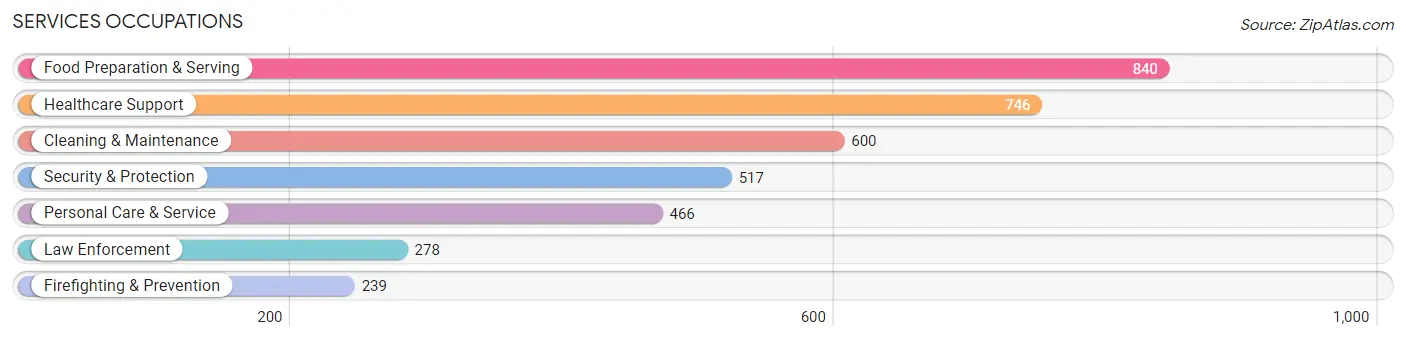
Services Occupations
The most common Services occupations in Oakley are Food Preparation & Serving (840 | 3.9%), Healthcare Support (746 | 3.5%), Cleaning & Maintenance (600 | 2.8%), Security & Protection (517 | 2.4%), and Personal Care & Service (466 | 2.2%).
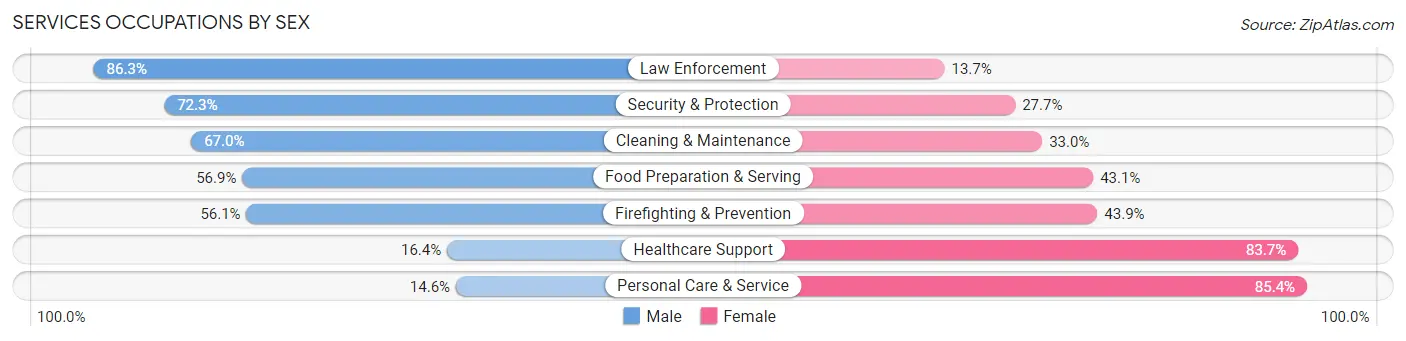
Services Occupations by Sex
Within the Services occupations in Oakley, the most male-oriented occupations are Law Enforcement (86.3%), Security & Protection (72.3%), and Cleaning & Maintenance (67.0%), while the most female-oriented occupations are Personal Care & Service (85.4%), Healthcare Support (83.7%), and Firefighting & Prevention (43.9%).
| Occupation | Male | Female |
| Healthcare Support | 122 (16.4%) | 624 (83.7%) |
| Security & Protection | 374 (72.3%) | 143 (27.7%) |
| Firefighting & Prevention | 134 (56.1%) | 105 (43.9%) |
| Law Enforcement | 240 (86.3%) | 38 (13.7%) |
| Food Preparation & Serving | 478 (56.9%) | 362 (43.1%) |
| Cleaning & Maintenance | 402 (67.0%) | 198 (33.0%) |
| Personal Care & Service | 68 (14.6%) | 398 (85.4%) |
| Total (Category) | 1,444 (45.6%) | 1,725 (54.4%) |
| Total (Overall) | 11,130 (51.6%) | 10,443 (48.4%) |
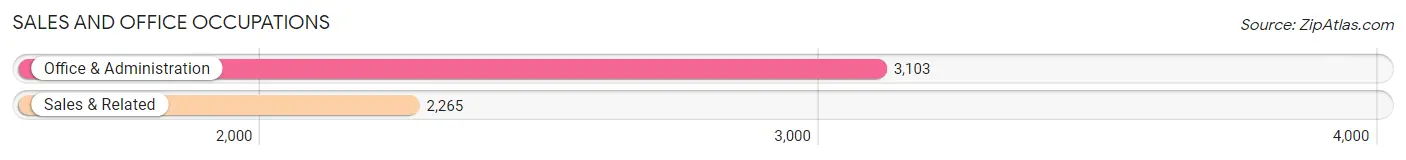
Sales and Office Occupations
The most common Sales and Office occupations in Oakley are Office & Administration (3,103 | 14.4%), and Sales & Related (2,265 | 10.5%).
Sales and Office Occupations by Sex
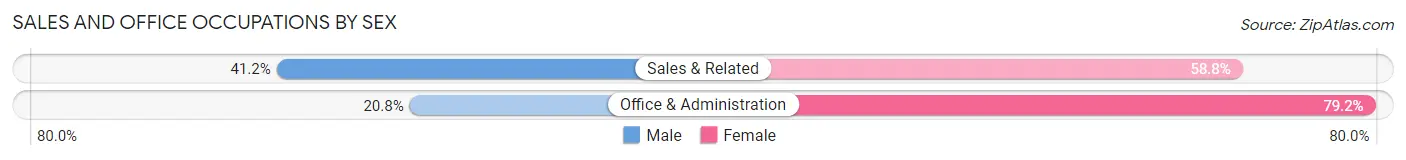
| Occupation | Male | Female |
| Sales & Related | 934 (41.2%) | 1,331 (58.8%) |
| Office & Administration | 645 (20.8%) | 2,458 (79.2%) |
| Total (Category) | 1,579 (29.4%) | 3,789 (70.6%) |
| Total (Overall) | 11,130 (51.6%) | 10,443 (48.4%) |
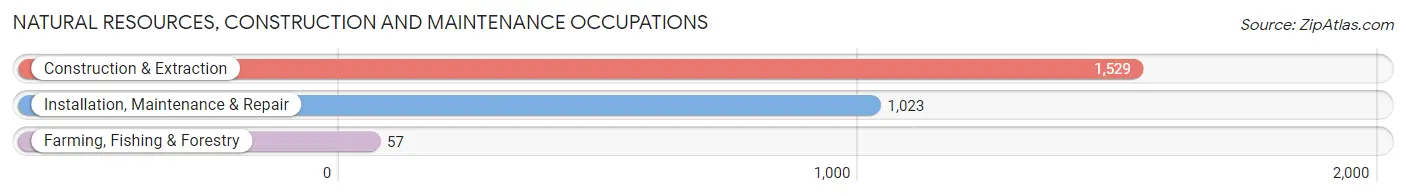
Natural Resources, Construction and Maintenance Occupations
The most common Natural Resources, Construction and Maintenance occupations in Oakley are Construction & Extraction (1,529 | 7.1%), Installation, Maintenance & Repair (1,023 | 4.7%), and Farming, Fishing & Forestry (57 | 0.3%).
Natural Resources, Construction and Maintenance Occupations by Sex
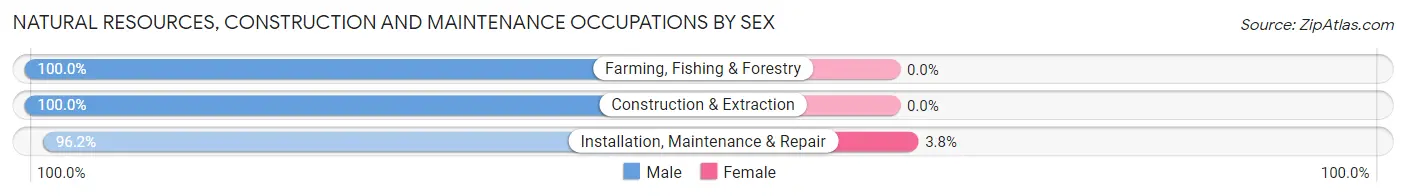
| Occupation | Male | Female |
| Farming, Fishing & Forestry | 57 (100.0%) | 0 (0.0%) |
| Construction & Extraction | 1,529 (100.0%) | 0 (0.0%) |
| Installation, Maintenance & Repair | 984 (96.2%) | 39 (3.8%) |
| Total (Category) | 2,570 (98.5%) | 39 (1.5%) |
| Total (Overall) | 11,130 (51.6%) | 10,443 (48.4%) |
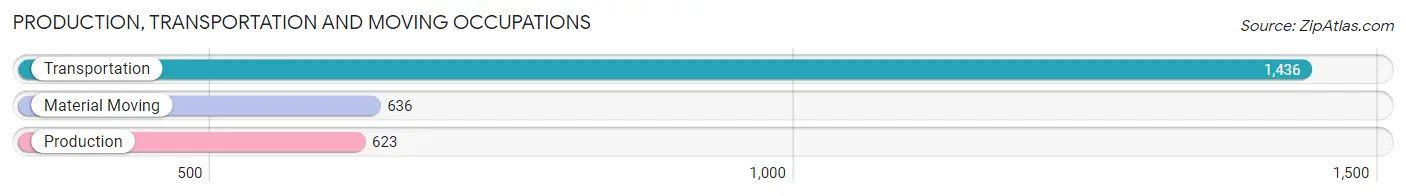
Production, Transportation and Moving Occupations
The most common Production, Transportation and Moving occupations in Oakley are Transportation (1,436 | 6.7%), Material Moving (636 | 2.9%), and Production (623 | 2.9%).
Production, Transportation and Moving Occupations by Sex
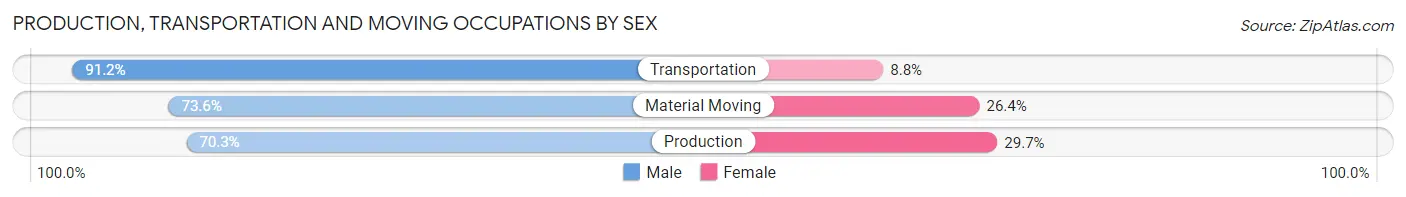
| Occupation | Male | Female |
| Production | 438 (70.3%) | 185 (29.7%) |
| Transportation | 1,310 (91.2%) | 126 (8.8%) |
| Material Moving | 468 (73.6%) | 168 (26.4%) |
| Total (Category) | 2,216 (82.2%) | 479 (17.8%) |
| Total (Overall) | 11,130 (51.6%) | 10,443 (48.4%) |
Employment Industries by Sex in Oakley
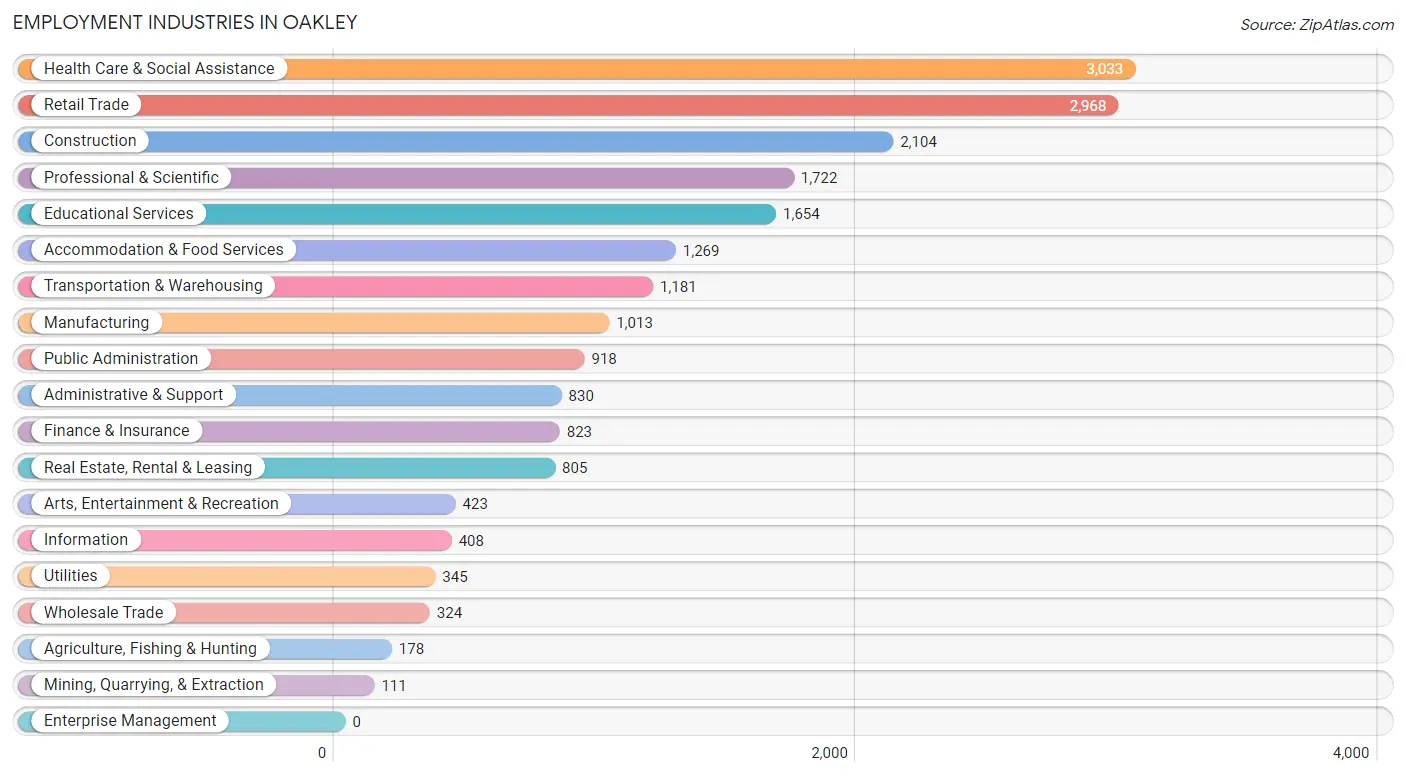
Employment Industries in Oakley
The major employment industries in Oakley include Health Care & Social Assistance (3,033 | 14.1%), Retail Trade (2,968 | 13.8%), Construction (2,104 | 9.8%), Professional & Scientific (1,722 | 8.0%), and Educational Services (1,654 | 7.7%).
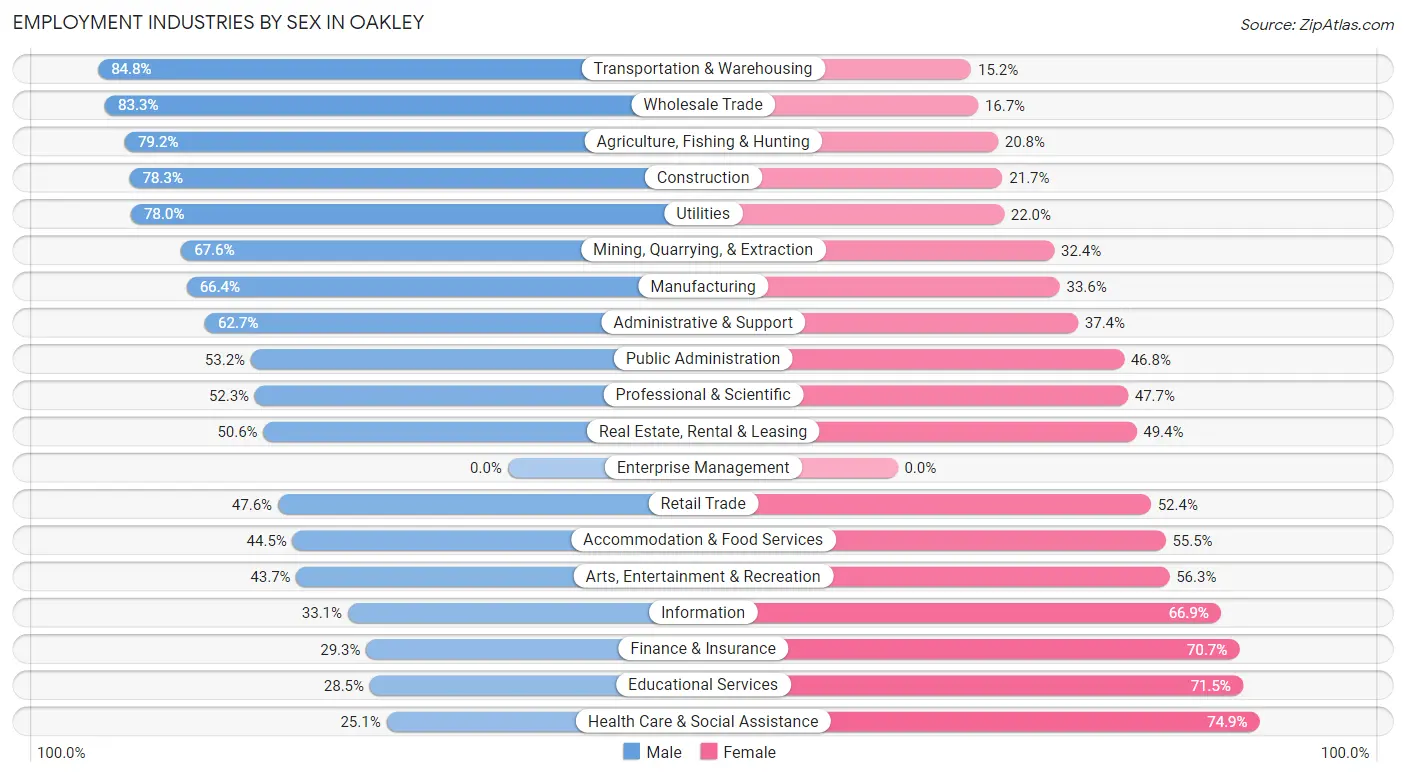
Employment Industries by Sex in Oakley
The Oakley industries that see more men than women are Transportation & Warehousing (84.8%), Wholesale Trade (83.3%), and Agriculture, Fishing & Hunting (79.2%), whereas the industries that tend to have a higher number of women are Health Care & Social Assistance (74.9%), Educational Services (71.5%), and Finance & Insurance (70.7%).
| Industry | Male | Female |
| Agriculture, Fishing & Hunting | 141 (79.2%) | 37 (20.8%) |
| Mining, Quarrying, & Extraction | 75 (67.6%) | 36 (32.4%) |
| Construction | 1,647 (78.3%) | 457 (21.7%) |
| Manufacturing | 673 (66.4%) | 340 (33.6%) |
| Wholesale Trade | 270 (83.3%) | 54 (16.7%) |
| Retail Trade | 1,412 (47.6%) | 1,556 (52.4%) |
| Transportation & Warehousing | 1,001 (84.8%) | 180 (15.2%) |
| Utilities | 269 (78.0%) | 76 (22.0%) |
| Information | 135 (33.1%) | 273 (66.9%) |
| Finance & Insurance | 241 (29.3%) | 582 (70.7%) |
| Real Estate, Rental & Leasing | 407 (50.6%) | 398 (49.4%) |
| Professional & Scientific | 901 (52.3%) | 821 (47.7%) |
| Enterprise Management | 0 (0.0%) | 0 (0.0%) |
| Administrative & Support | 520 (62.6%) | 310 (37.3%) |
| Educational Services | 472 (28.5%) | 1,182 (71.5%) |
| Health Care & Social Assistance | 761 (25.1%) | 2,272 (74.9%) |
| Arts, Entertainment & Recreation | 185 (43.7%) | 238 (56.3%) |
| Accommodation & Food Services | 565 (44.5%) | 704 (55.5%) |
| Public Administration | 488 (53.2%) | 430 (46.8%) |
| Total | 11,130 (51.6%) | 10,443 (48.4%) |
Education in Oakley
School Enrollment in Oakley
The most common levels of schooling among the 11,172 students in Oakley are college / undergraduate (2,740 | 24.5%), elementary school (2,640 | 23.6%), and middle school (2,589 | 23.2%).
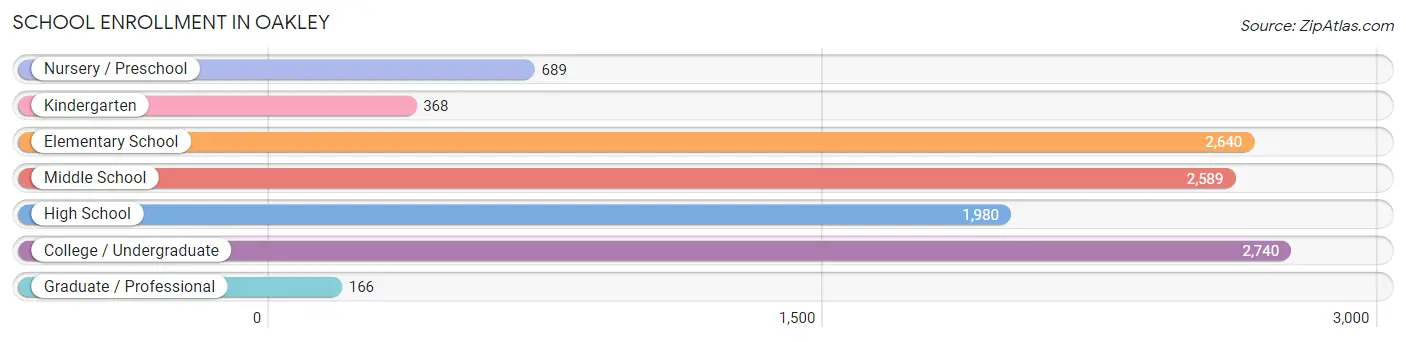
| School Level | # Students | % Students |
| Nursery / Preschool | 689 | 6.2% |
| Kindergarten | 368 | 3.3% |
| Elementary School | 2,640 | 23.6% |
| Middle School | 2,589 | 23.2% |
| High School | 1,980 | 17.7% |
| College / Undergraduate | 2,740 | 24.5% |
| Graduate / Professional | 166 | 1.5% |
| Total | 11,172 | 100.0% |
School Enrollment by Age by Funding Source in Oakley
Out of a total of 11,172 students who are enrolled in schools in Oakley, 1,140 (10.2%) attend a private institution, while the remaining 10,032 (89.8%) are enrolled in public schools. The age group of 3 to 4 year olds has the highest likelihood of being enrolled in private schools, with 251 (51.5% in the age bracket) enrolled. Conversely, the age group of 18 to 19 year olds has the lowest likelihood of being enrolled in a private school, with 527 (97.6% in the age bracket) attending a public institution.
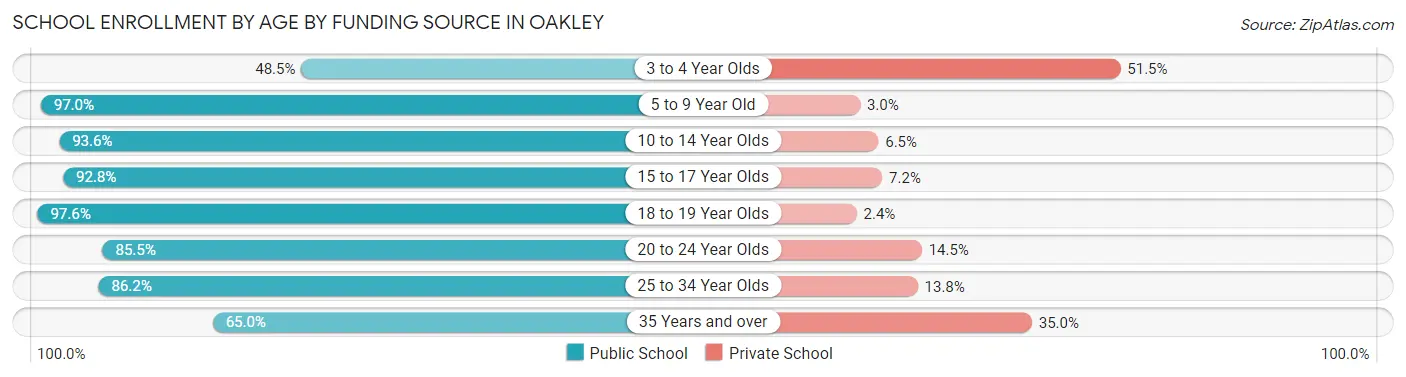
| Age Bracket | Public School | Private School |
| 3 to 4 Year Olds | 236 (48.5%) | 251 (51.5%) |
| 5 to 9 Year Old | 2,852 (97.0%) | 89 (3.0%) |
| 10 to 14 Year Olds | 2,873 (93.5%) | 198 (6.5%) |
| 15 to 17 Year Olds | 1,412 (92.8%) | 109 (7.2%) |
| 18 to 19 Year Olds | 527 (97.6%) | 13 (2.4%) |
| 20 to 24 Year Olds | 1,153 (85.5%) | 196 (14.5%) |
| 25 to 34 Year Olds | 651 (86.2%) | 104 (13.8%) |
| 35 Years and over | 330 (65.0%) | 178 (35.0%) |
| Total | 10,032 (89.8%) | 1,140 (10.2%) |
Educational Attainment by Field of Study in Oakley
Business (1,192 | 17.3%), arts & humanities (874 | 12.7%), science & technology (865 | 12.6%), bio, nature & agricultural (518 | 7.5%), and social sciences (513 | 7.4%) are the most common fields of study among 6,889 individuals in Oakley who have obtained a bachelor's degree or higher.
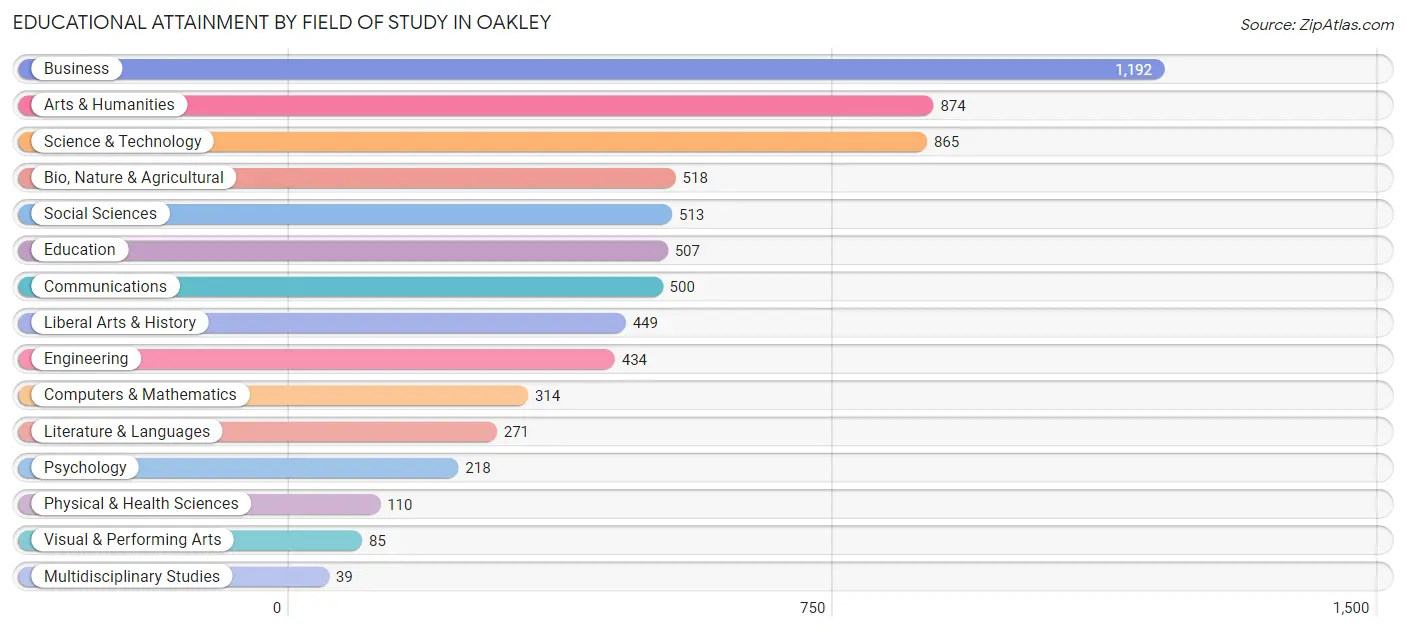
| Field of Study | # Graduates | % Graduates |
| Computers & Mathematics | 314 | 4.6% |
| Bio, Nature & Agricultural | 518 | 7.5% |
| Physical & Health Sciences | 110 | 1.6% |
| Psychology | 218 | 3.2% |
| Social Sciences | 513 | 7.4% |
| Engineering | 434 | 6.3% |
| Multidisciplinary Studies | 39 | 0.6% |
| Science & Technology | 865 | 12.6% |
| Business | 1,192 | 17.3% |
| Education | 507 | 7.4% |
| Literature & Languages | 271 | 3.9% |
| Liberal Arts & History | 449 | 6.5% |
| Visual & Performing Arts | 85 | 1.2% |
| Communications | 500 | 7.3% |
| Arts & Humanities | 874 | 12.7% |
| Total | 6,889 | 100.0% |
Transportation & Commute in Oakley
Vehicle Availability by Sex in Oakley
The most prevalent vehicle ownership categories in Oakley are males with 3 vehicles (3,895, accounting for 35.5%) and females with 3 vehicles (3,693, making up 39.6%).
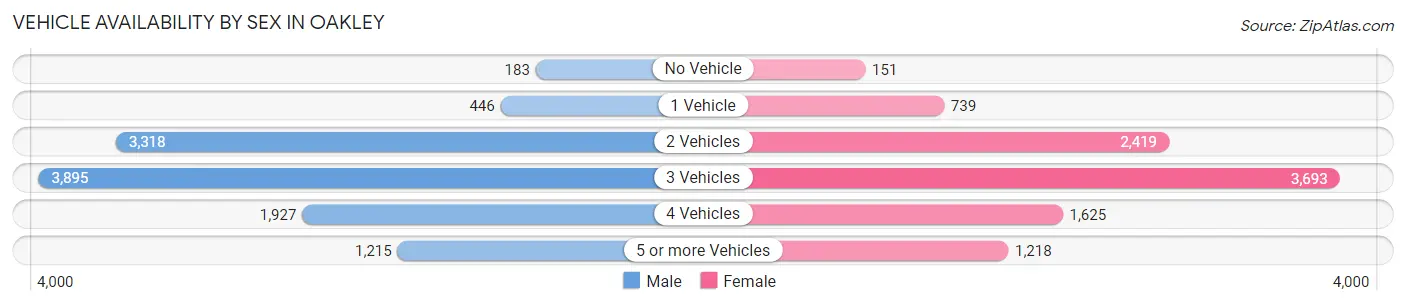
| Vehicles Available | Male | Female |
| No Vehicle | 183 (1.7%) | 151 (1.5%) |
| 1 Vehicle | 446 (4.1%) | 739 (7.5%) |
| 2 Vehicles | 3,318 (30.2%) | 2,419 (24.6%) |
| 3 Vehicles | 3,895 (35.5%) | 3,693 (37.5%) |
| 4 Vehicles | 1,927 (17.5%) | 1,625 (16.5%) |
| 5 or more Vehicles | 1,215 (11.1%) | 1,218 (12.4%) |
| Total | 10,984 (100.0%) | 9,845 (100.0%) |
Commute Time in Oakley
The most frequently occuring commute durations in Oakley are 60 to 89 minutes (3,547 commuters, 19.6%), 90 or more minutes (2,716 commuters, 15.0%), and 45 to 59 minutes (2,436 commuters, 13.5%).
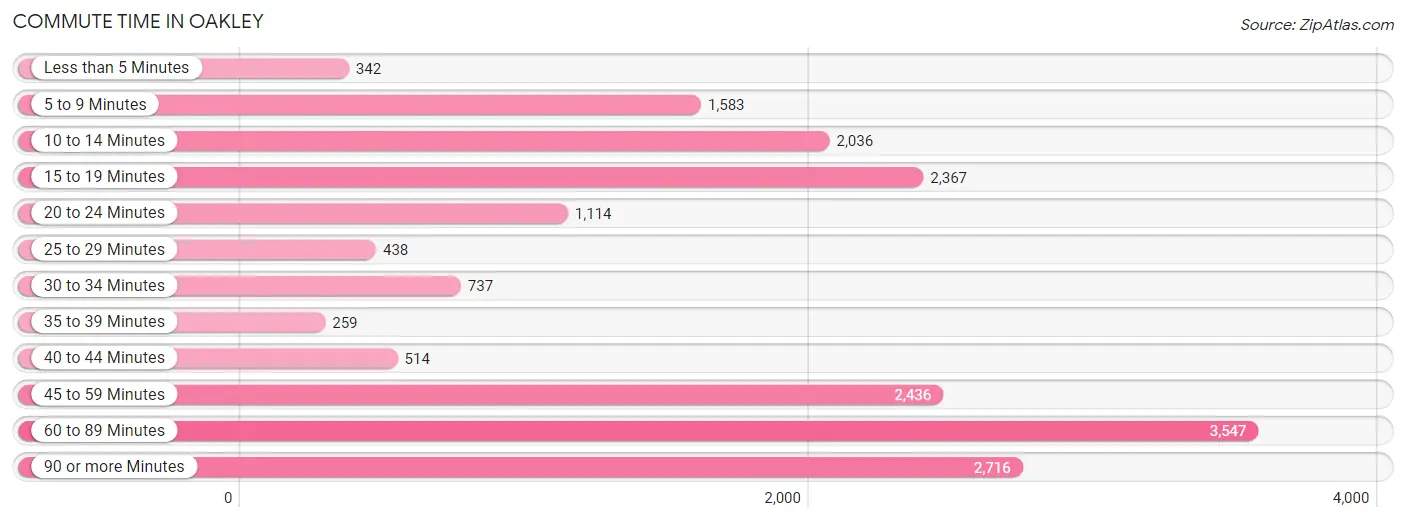
| Commute Time | # Commuters | % Commuters |
| Less than 5 Minutes | 342 | 1.9% |
| 5 to 9 Minutes | 1,583 | 8.7% |
| 10 to 14 Minutes | 2,036 | 11.3% |
| 15 to 19 Minutes | 2,367 | 13.1% |
| 20 to 24 Minutes | 1,114 | 6.2% |
| 25 to 29 Minutes | 438 | 2.4% |
| 30 to 34 Minutes | 737 | 4.1% |
| 35 to 39 Minutes | 259 | 1.4% |
| 40 to 44 Minutes | 514 | 2.8% |
| 45 to 59 Minutes | 2,436 | 13.5% |
| 60 to 89 Minutes | 3,547 | 19.6% |
| 90 or more Minutes | 2,716 | 15.0% |
Commute Time by Sex in Oakley
The most common commute times in Oakley are 60 to 89 minutes (2,395 commuters, 24.8%) for males and 15 to 19 minutes (1,313 commuters, 15.5%) for females.
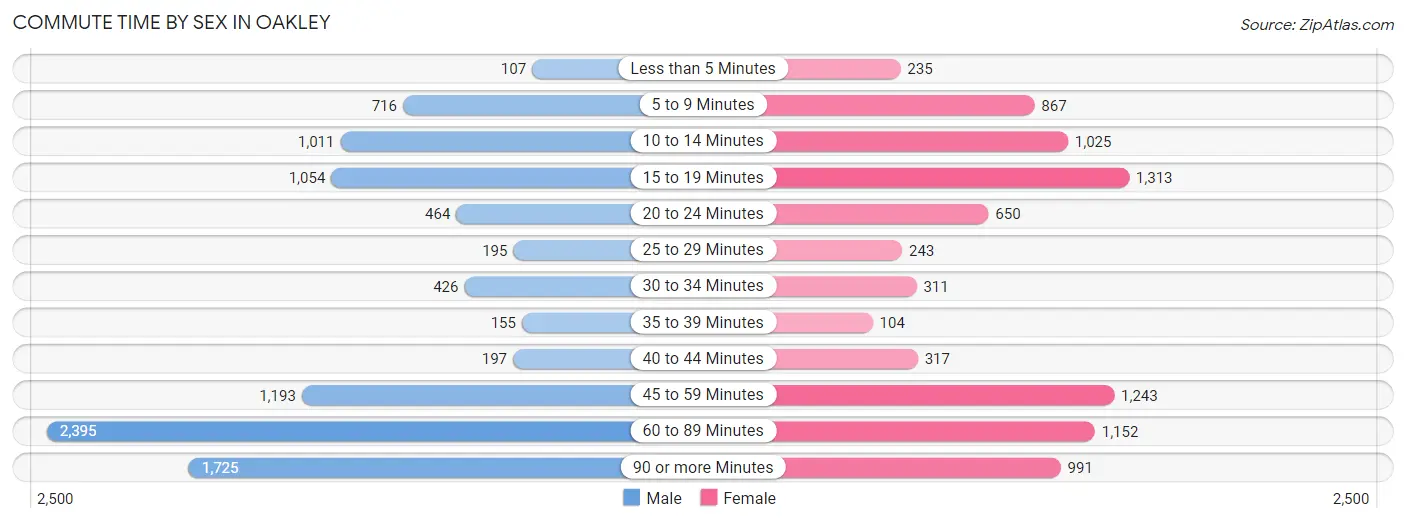
| Commute Time | Male | Female |
| Less than 5 Minutes | 107 (1.1%) | 235 (2.8%) |
| 5 to 9 Minutes | 716 (7.4%) | 867 (10.3%) |
| 10 to 14 Minutes | 1,011 (10.5%) | 1,025 (12.1%) |
| 15 to 19 Minutes | 1,054 (10.9%) | 1,313 (15.5%) |
| 20 to 24 Minutes | 464 (4.8%) | 650 (7.7%) |
| 25 to 29 Minutes | 195 (2.0%) | 243 (2.9%) |
| 30 to 34 Minutes | 426 (4.4%) | 311 (3.7%) |
| 35 to 39 Minutes | 155 (1.6%) | 104 (1.2%) |
| 40 to 44 Minutes | 197 (2.0%) | 317 (3.7%) |
| 45 to 59 Minutes | 1,193 (12.4%) | 1,243 (14.7%) |
| 60 to 89 Minutes | 2,395 (24.8%) | 1,152 (13.6%) |
| 90 or more Minutes | 1,725 (17.9%) | 991 (11.7%) |
Time of Departure to Work by Sex in Oakley
The most frequent times of departure to work in Oakley are 12:00 AM to 4:59 AM (1,839, 19.1%) for males and 7:00 AM to 7:29 AM (1,139, 13.5%) for females.
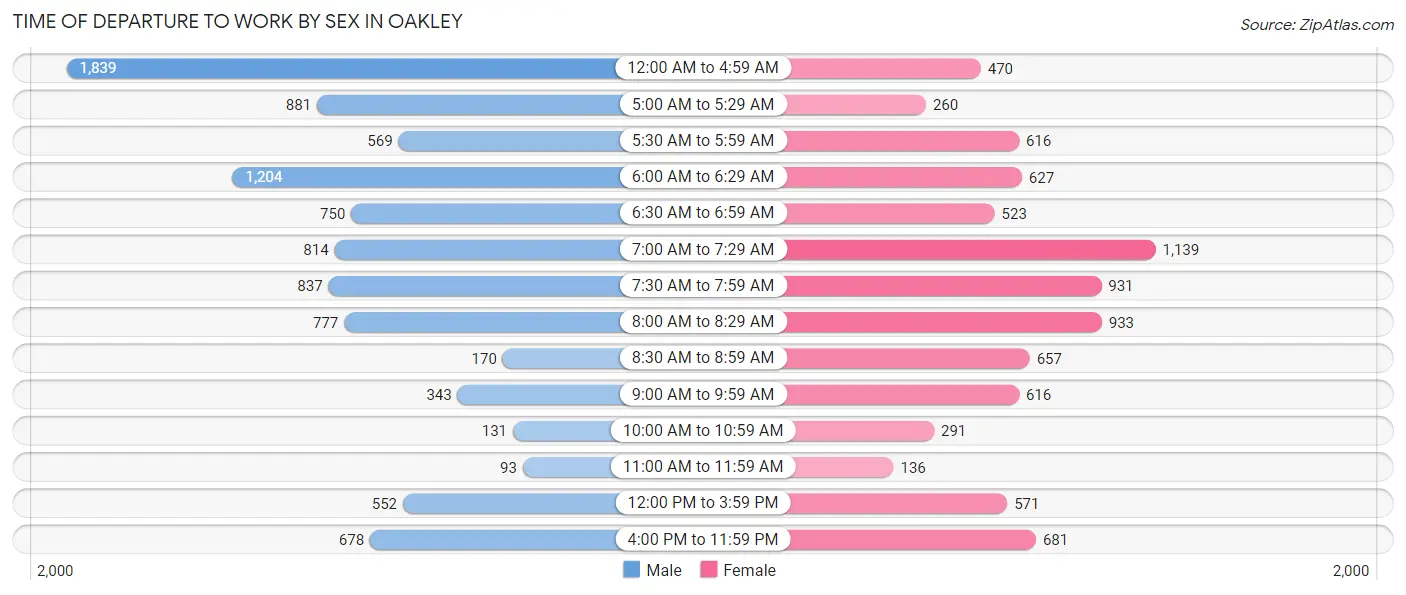
| Time of Departure | Male | Female |
| 12:00 AM to 4:59 AM | 1,839 (19.1%) | 470 (5.6%) |
| 5:00 AM to 5:29 AM | 881 (9.1%) | 260 (3.1%) |
| 5:30 AM to 5:59 AM | 569 (5.9%) | 616 (7.3%) |
| 6:00 AM to 6:29 AM | 1,204 (12.5%) | 627 (7.4%) |
| 6:30 AM to 6:59 AM | 750 (7.8%) | 523 (6.2%) |
| 7:00 AM to 7:29 AM | 814 (8.5%) | 1,139 (13.5%) |
| 7:30 AM to 7:59 AM | 837 (8.7%) | 931 (11.0%) |
| 8:00 AM to 8:29 AM | 777 (8.1%) | 933 (11.0%) |
| 8:30 AM to 8:59 AM | 170 (1.8%) | 657 (7.8%) |
| 9:00 AM to 9:59 AM | 343 (3.6%) | 616 (7.3%) |
| 10:00 AM to 10:59 AM | 131 (1.4%) | 291 (3.4%) |
| 11:00 AM to 11:59 AM | 93 (1.0%) | 136 (1.6%) |
| 12:00 PM to 3:59 PM | 552 (5.7%) | 571 (6.8%) |
| 4:00 PM to 11:59 PM | 678 (7.0%) | 681 (8.1%) |
| Total | 9,638 (100.0%) | 8,451 (100.0%) |
Housing Occupancy in Oakley
Occupancy by Ownership in Oakley
Of the total 13,036 dwellings in Oakley, owner-occupied units account for 10,150 (77.9%), while renter-occupied units make up 2,886 (22.1%).
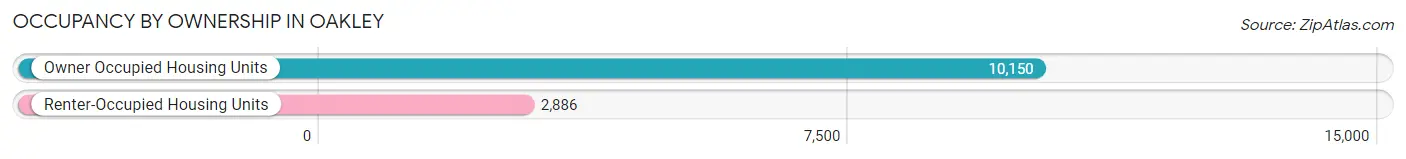
| Occupancy | # Housing Units | % Housing Units |
| Owner Occupied Housing Units | 10,150 | 77.9% |
| Renter-Occupied Housing Units | 2,886 | 22.1% |
| Total Occupied Housing Units | 13,036 | 100.0% |
Occupancy by Household Size in Oakley
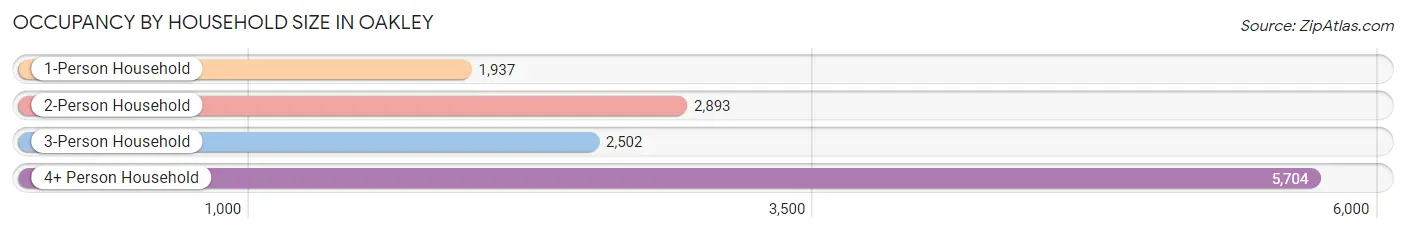
| Household Size | # Housing Units | % Housing Units |
| 1-Person Household | 1,937 | 14.9% |
| 2-Person Household | 2,893 | 22.2% |
| 3-Person Household | 2,502 | 19.2% |
| 4+ Person Household | 5,704 | 43.8% |
| Total Housing Units | 13,036 | 100.0% |
Occupancy by Ownership by Household Size in Oakley
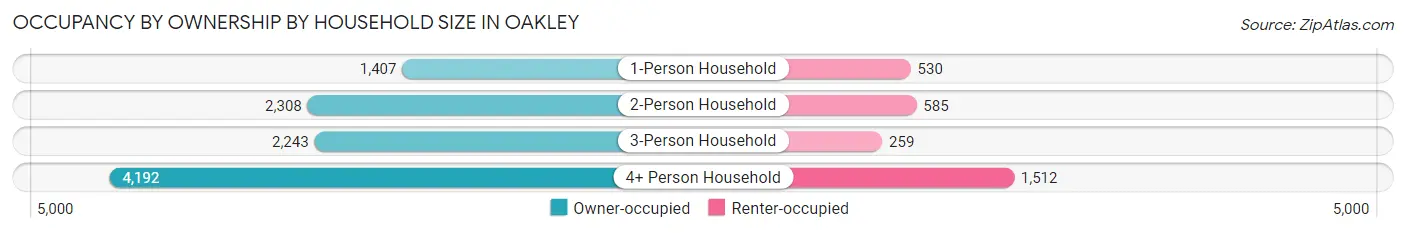
| Household Size | Owner-occupied | Renter-occupied |
| 1-Person Household | 1,407 (72.6%) | 530 (27.4%) |
| 2-Person Household | 2,308 (79.8%) | 585 (20.2%) |
| 3-Person Household | 2,243 (89.6%) | 259 (10.3%) |
| 4+ Person Household | 4,192 (73.5%) | 1,512 (26.5%) |
| Total Housing Units | 10,150 (77.9%) | 2,886 (22.1%) |
Occupancy by Educational Attainment in Oakley
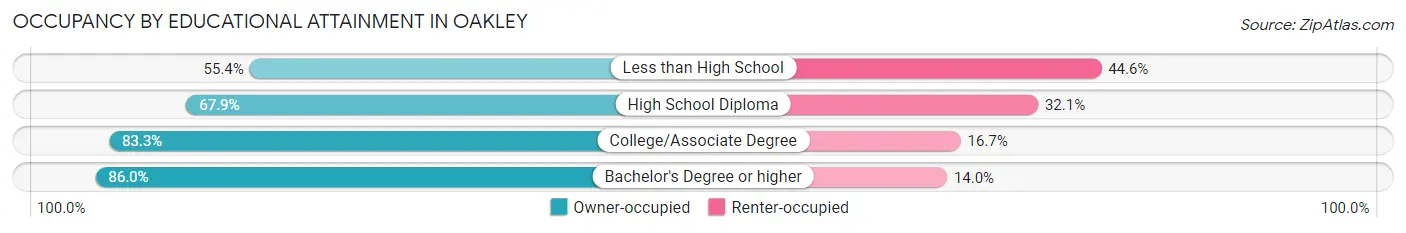
| Household Size | Owner-occupied | Renter-occupied |
| Less than High School | 555 (55.4%) | 447 (44.6%) |
| High School Diploma | 2,280 (67.9%) | 1,077 (32.1%) |
| College/Associate Degree | 4,459 (83.3%) | 896 (16.7%) |
| Bachelor's Degree or higher | 2,856 (86.0%) | 466 (14.0%) |
Occupancy by Age of Householder in Oakley
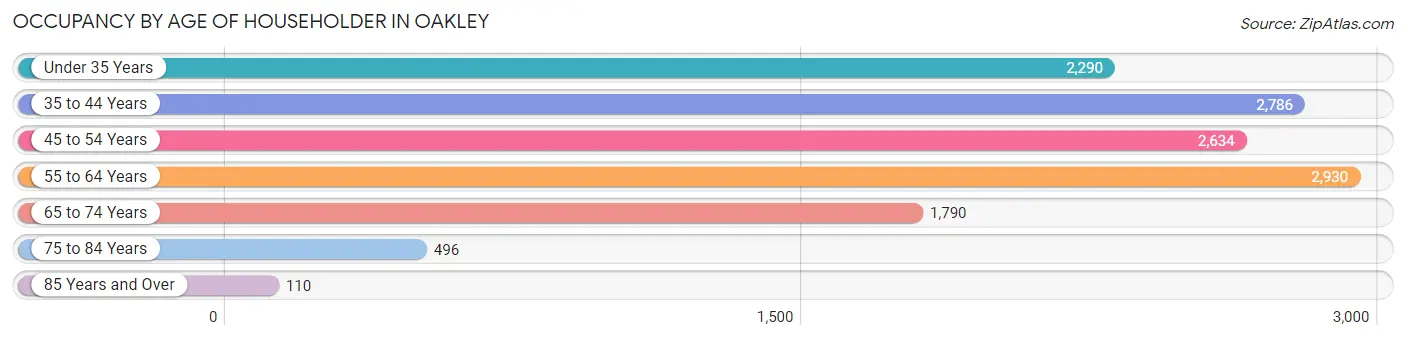
| Age Bracket | # Households | % Households |
| Under 35 Years | 2,290 | 17.6% |
| 35 to 44 Years | 2,786 | 21.4% |
| 45 to 54 Years | 2,634 | 20.2% |
| 55 to 64 Years | 2,930 | 22.5% |
| 65 to 74 Years | 1,790 | 13.7% |
| 75 to 84 Years | 496 | 3.8% |
| 85 Years and Over | 110 | 0.8% |
| Total | 13,036 | 100.0% |
Housing Finances in Oakley
Median Income by Occupancy in Oakley
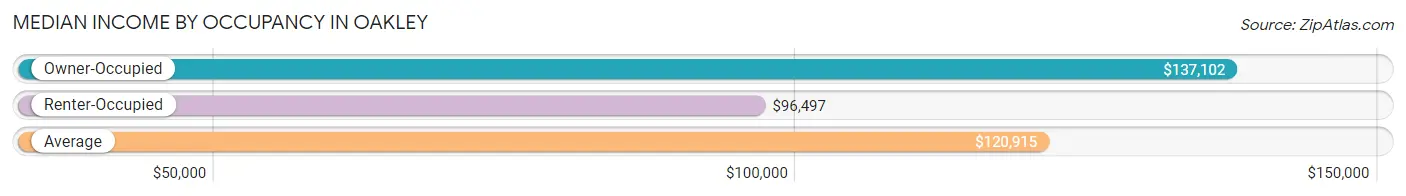
| Occupancy Type | # Households | Median Income |
| Owner-Occupied | 10,150 (77.9%) | $137,102 |
| Renter-Occupied | 2,886 (22.1%) | $96,497 |
| Average | 13,036 (100.0%) | $120,915 |
Occupancy by Householder Income Bracket in Oakley
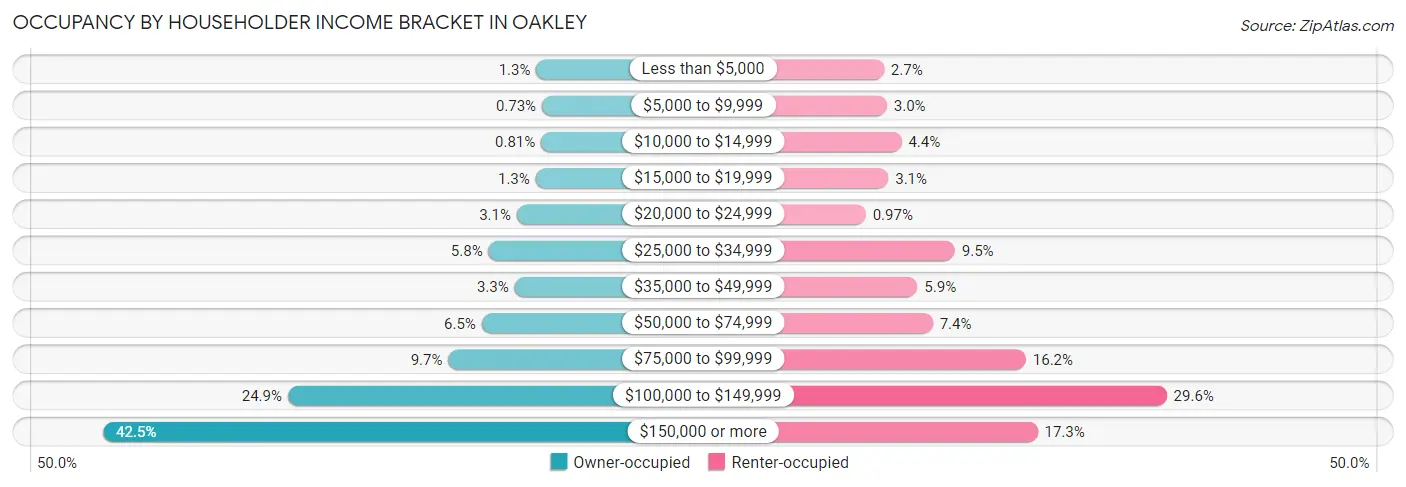
| Income Bracket | Owner-occupied | Renter-occupied |
| Less than $5,000 | 129 (1.3%) | 78 (2.7%) |
| $5,000 to $9,999 | 74 (0.7%) | 86 (3.0%) |
| $10,000 to $14,999 | 82 (0.8%) | 126 (4.4%) |
| $15,000 to $19,999 | 135 (1.3%) | 90 (3.1%) |
| $20,000 to $24,999 | 317 (3.1%) | 28 (1.0%) |
| $25,000 to $34,999 | 591 (5.8%) | 273 (9.5%) |
| $35,000 to $49,999 | 339 (3.3%) | 170 (5.9%) |
| $50,000 to $74,999 | 657 (6.5%) | 212 (7.3%) |
| $75,000 to $99,999 | 979 (9.7%) | 468 (16.2%) |
| $100,000 to $149,999 | 2,530 (24.9%) | 855 (29.6%) |
| $150,000 or more | 4,317 (42.5%) | 500 (17.3%) |
| Total | 10,150 (100.0%) | 2,886 (100.0%) |
Monthly Housing Cost Tiers in Oakley
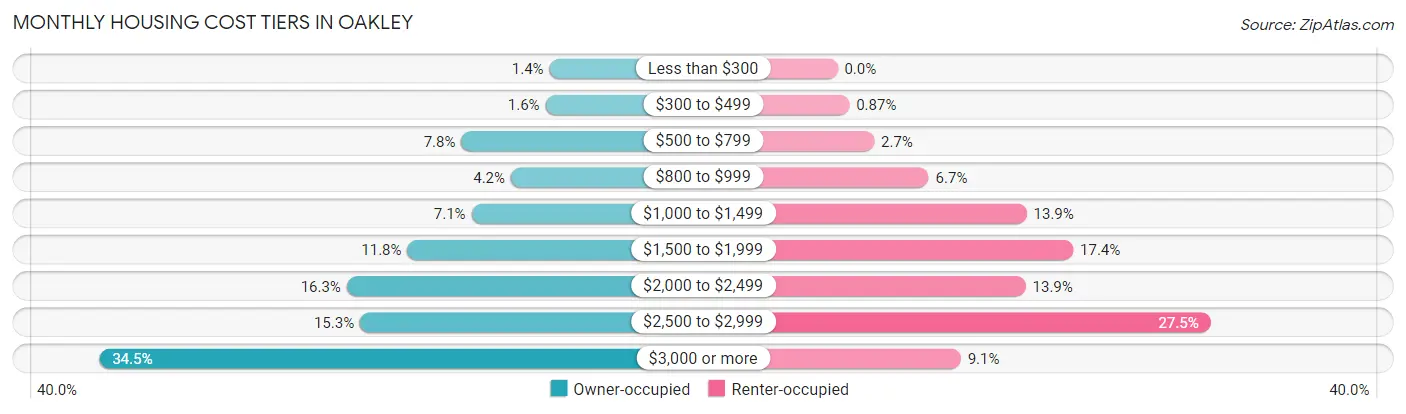
| Monthly Cost | Owner-occupied | Renter-occupied |
| Less than $300 | 137 (1.3%) | 0 (0.0%) |
| $300 to $499 | 166 (1.6%) | 25 (0.9%) |
| $500 to $799 | 796 (7.8%) | 78 (2.7%) |
| $800 to $999 | 425 (4.2%) | 194 (6.7%) |
| $1,000 to $1,499 | 720 (7.1%) | 402 (13.9%) |
| $1,500 to $1,999 | 1,199 (11.8%) | 501 (17.4%) |
| $2,000 to $2,499 | 1,652 (16.3%) | 400 (13.9%) |
| $2,500 to $2,999 | 1,553 (15.3%) | 793 (27.5%) |
| $3,000 or more | 3,502 (34.5%) | 262 (9.1%) |
| Total | 10,150 (100.0%) | 2,886 (100.0%) |
Physical Housing Characteristics in Oakley
Housing Structures in Oakley
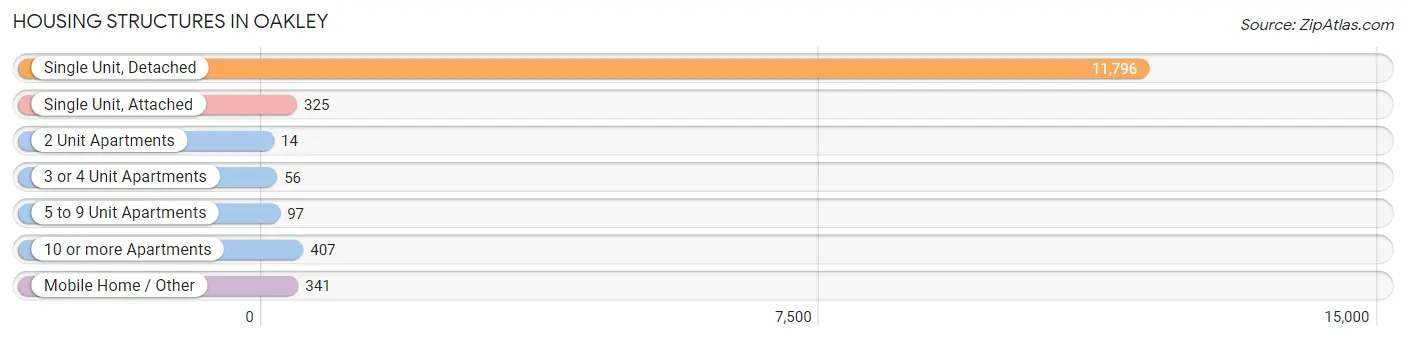
| Structure Type | # Housing Units | % Housing Units |
| Single Unit, Detached | 11,796 | 90.5% |
| Single Unit, Attached | 325 | 2.5% |
| 2 Unit Apartments | 14 | 0.1% |
| 3 or 4 Unit Apartments | 56 | 0.4% |
| 5 to 9 Unit Apartments | 97 | 0.7% |
| 10 or more Apartments | 407 | 3.1% |
| Mobile Home / Other | 341 | 2.6% |
| Total | 13,036 | 100.0% |
Housing Structures by Occupancy in Oakley
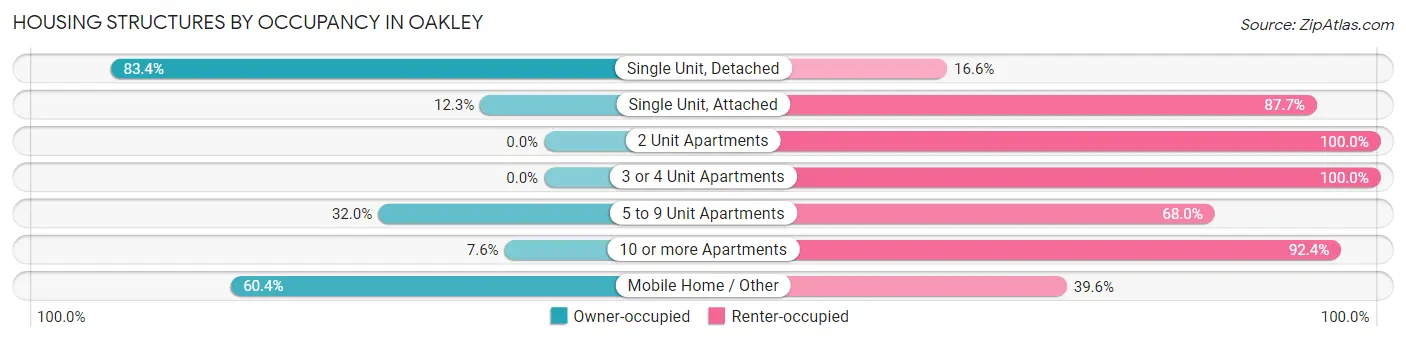
| Structure Type | Owner-occupied | Renter-occupied |
| Single Unit, Detached | 9,842 (83.4%) | 1,954 (16.6%) |
| Single Unit, Attached | 40 (12.3%) | 285 (87.7%) |
| 2 Unit Apartments | 0 (0.0%) | 14 (100.0%) |
| 3 or 4 Unit Apartments | 0 (0.0%) | 56 (100.0%) |
| 5 to 9 Unit Apartments | 31 (32.0%) | 66 (68.0%) |
| 10 or more Apartments | 31 (7.6%) | 376 (92.4%) |
| Mobile Home / Other | 206 (60.4%) | 135 (39.6%) |
| Total | 10,150 (77.9%) | 2,886 (22.1%) |
Housing Structures by Number of Rooms in Oakley
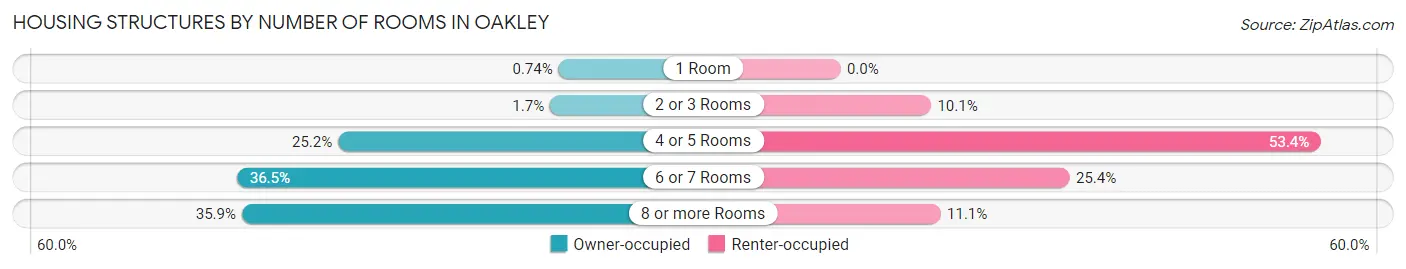
| Number of Rooms | Owner-occupied | Renter-occupied |
| 1 Room | 75 (0.7%) | 0 (0.0%) |
| 2 or 3 Rooms | 172 (1.7%) | 290 (10.1%) |
| 4 or 5 Rooms | 2,559 (25.2%) | 1,541 (53.4%) |
| 6 or 7 Rooms | 3,700 (36.4%) | 734 (25.4%) |
| 8 or more Rooms | 3,644 (35.9%) | 321 (11.1%) |
| Total | 10,150 (100.0%) | 2,886 (100.0%) |
Housing Structure by Heating Type in Oakley
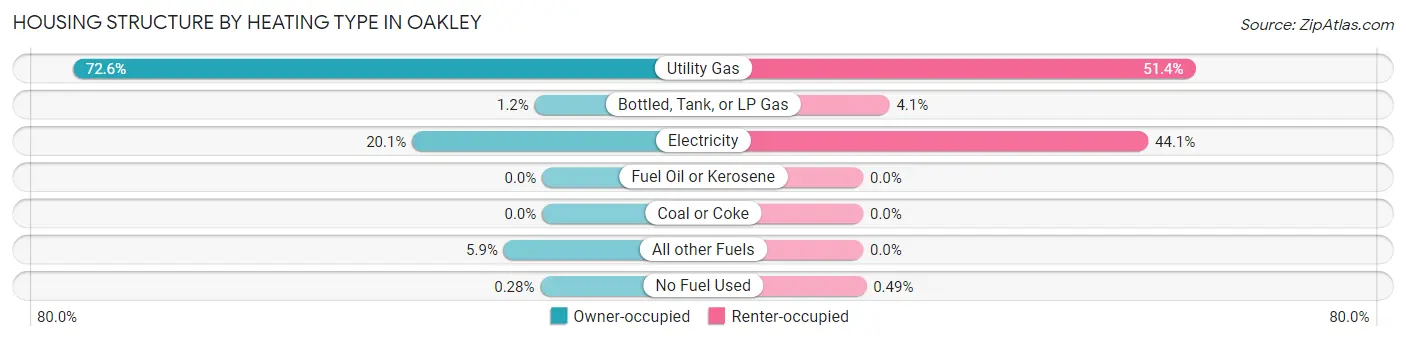
| Heating Type | Owner-occupied | Renter-occupied |
| Utility Gas | 7,364 (72.6%) | 1,482 (51.3%) |
| Bottled, Tank, or LP Gas | 118 (1.2%) | 118 (4.1%) |
| Electricity | 2,038 (20.1%) | 1,272 (44.1%) |
| Fuel Oil or Kerosene | 0 (0.0%) | 0 (0.0%) |
| Coal or Coke | 0 (0.0%) | 0 (0.0%) |
| All other Fuels | 602 (5.9%) | 0 (0.0%) |
| No Fuel Used | 28 (0.3%) | 14 (0.5%) |
| Total | 10,150 (100.0%) | 2,886 (100.0%) |
Household Vehicle Usage in Oakley
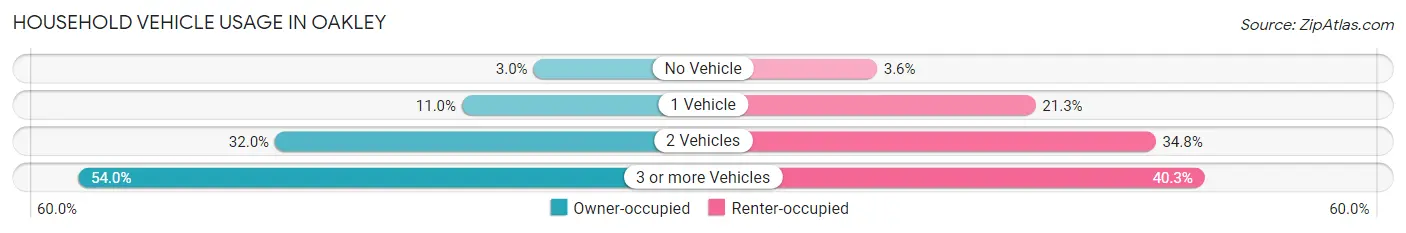
| Vehicles per Household | Owner-occupied | Renter-occupied |
| No Vehicle | 305 (3.0%) | 103 (3.6%) |
| 1 Vehicle | 1,119 (11.0%) | 616 (21.3%) |
| 2 Vehicles | 3,244 (32.0%) | 1,004 (34.8%) |
| 3 or more Vehicles | 5,482 (54.0%) | 1,163 (40.3%) |
| Total | 10,150 (100.0%) | 2,886 (100.0%) |
Real Estate & Mortgages in Oakley
Real Estate and Mortgage Overview in Oakley
| Characteristic | Without Mortgage | With Mortgage |
| Housing Units | 1,818 | 8,332 |
| Median Property Value | $562,600 | $618,700 |
| Median Household Income | $98,214 | $3,827 |
| Monthly Housing Costs | $811 | $3,483 |
| Real Estate Taxes | $5,151 | $197 |
Property Value by Mortgage Status in Oakley
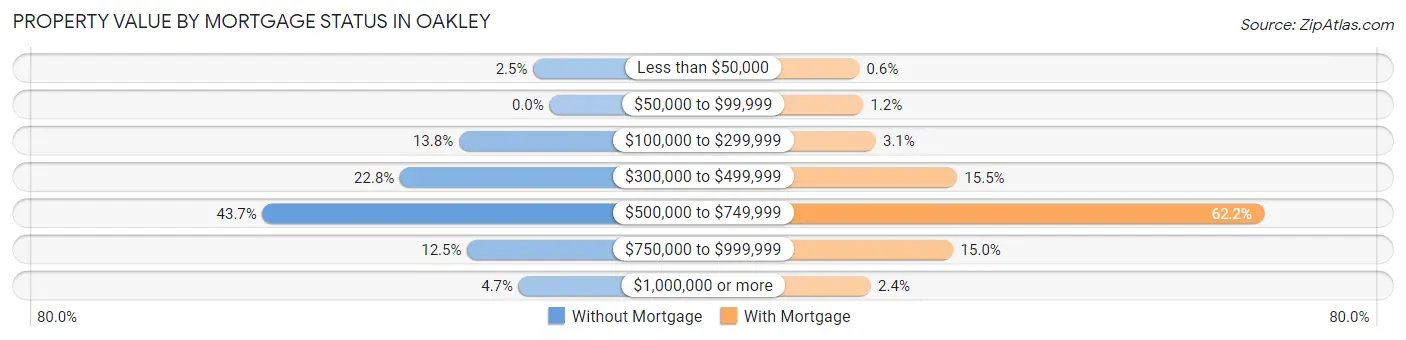
| Property Value | Without Mortgage | With Mortgage |
| Less than $50,000 | 45 (2.5%) | 50 (0.6%) |
| $50,000 to $99,999 | 0 (0.0%) | 102 (1.2%) |
| $100,000 to $299,999 | 251 (13.8%) | 260 (3.1%) |
| $300,000 to $499,999 | 414 (22.8%) | 1,293 (15.5%) |
| $500,000 to $749,999 | 795 (43.7%) | 5,183 (62.2%) |
| $750,000 to $999,999 | 228 (12.5%) | 1,246 (14.9%) |
| $1,000,000 or more | 85 (4.7%) | 198 (2.4%) |
| Total | 1,818 (100.0%) | 8,332 (100.0%) |
Household Income by Mortgage Status in Oakley
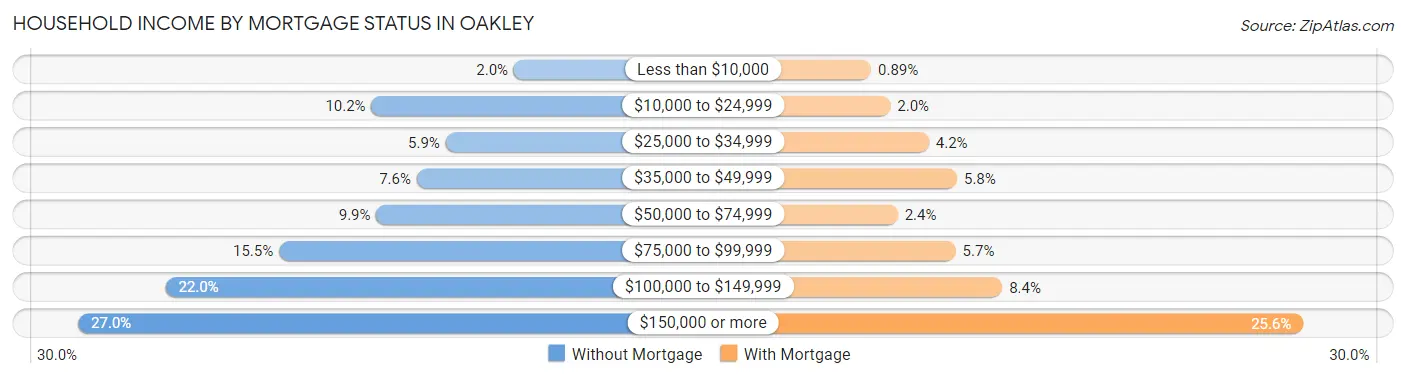
| Household Income | Without Mortgage | With Mortgage |
| Less than $10,000 | 37 (2.0%) | 74 (0.9%) |
| $10,000 to $24,999 | 185 (10.2%) | 166 (2.0%) |
| $25,000 to $34,999 | 108 (5.9%) | 349 (4.2%) |
| $35,000 to $49,999 | 138 (7.6%) | 483 (5.8%) |
| $50,000 to $74,999 | 180 (9.9%) | 201 (2.4%) |
| $75,000 to $99,999 | 281 (15.5%) | 477 (5.7%) |
| $100,000 to $149,999 | 399 (22.0%) | 698 (8.4%) |
| $150,000 or more | 490 (27.0%) | 2,131 (25.6%) |
| Total | 1,818 (100.0%) | 8,332 (100.0%) |
Property Value to Household Income Ratio in Oakley
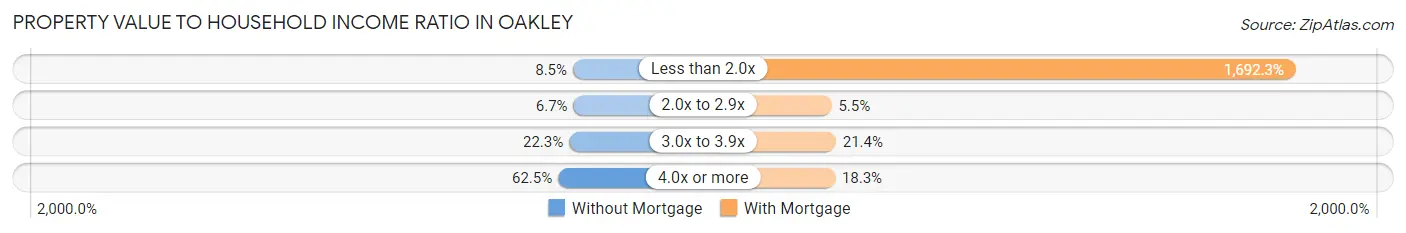
| Value-to-Income Ratio | Without Mortgage | With Mortgage |
| Less than 2.0x | 155 (8.5%) | 141,003 (1,692.3%) |
| 2.0x to 2.9x | 121 (6.7%) | 461 (5.5%) |
| 3.0x to 3.9x | 405 (22.3%) | 1,782 (21.4%) |
| 4.0x or more | 1,137 (62.5%) | 1,525 (18.3%) |
| Total | 1,818 (100.0%) | 8,332 (100.0%) |
Real Estate Taxes by Mortgage Status in Oakley
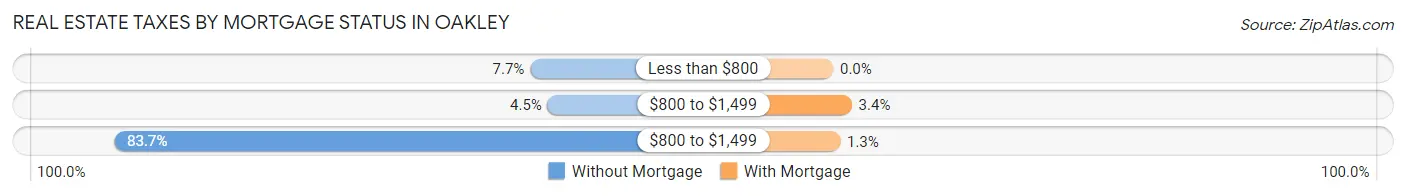
| Property Taxes | Without Mortgage | With Mortgage |
| Less than $800 | 139 (7.6%) | 0 (0.0%) |
| $800 to $1,499 | 81 (4.5%) | 283 (3.4%) |
| $800 to $1,499 | 1,521 (83.7%) | 107 (1.3%) |
| Total | 1,818 (100.0%) | 8,332 (100.0%) |
Health & Disability in Oakley
Health Insurance Coverage by Age in Oakley
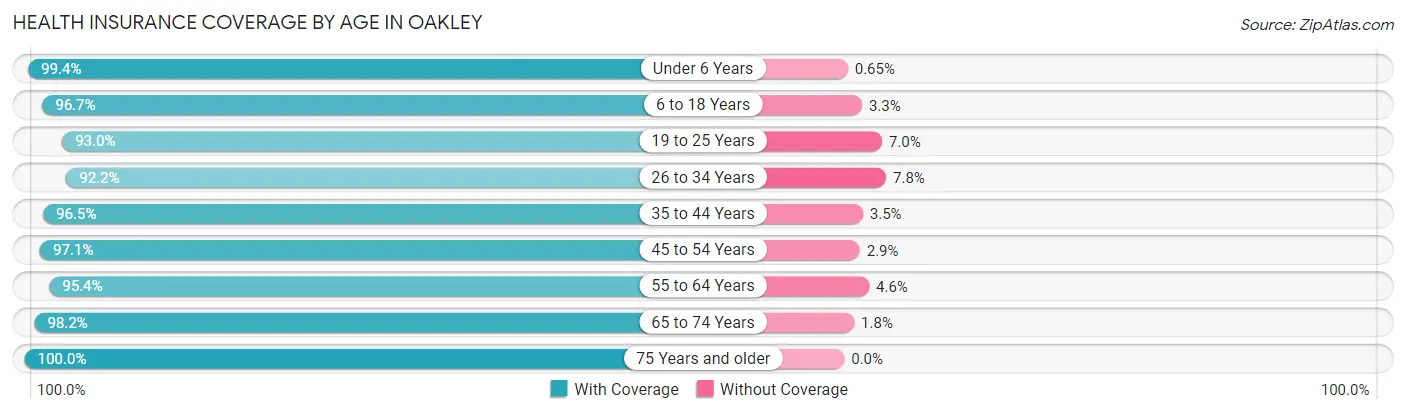
| Age Bracket | With Coverage | Without Coverage |
| Under 6 Years | 3,845 (99.4%) | 25 (0.6%) |
| 6 to 18 Years | 7,470 (96.7%) | 255 (3.3%) |
| 19 to 25 Years | 3,894 (93.0%) | 294 (7.0%) |
| 26 to 34 Years | 4,974 (92.2%) | 420 (7.8%) |
| 35 to 44 Years | 6,252 (96.5%) | 224 (3.5%) |
| 45 to 54 Years | 5,310 (97.1%) | 158 (2.9%) |
| 55 to 64 Years | 5,693 (95.4%) | 276 (4.6%) |
| 65 to 74 Years | 3,097 (98.2%) | 58 (1.8%) |
| 75 Years and older | 1,250 (100.0%) | 0 (0.0%) |
| Total | 41,785 (96.1%) | 1,710 (3.9%) |
Health Insurance Coverage by Citizenship Status in Oakley
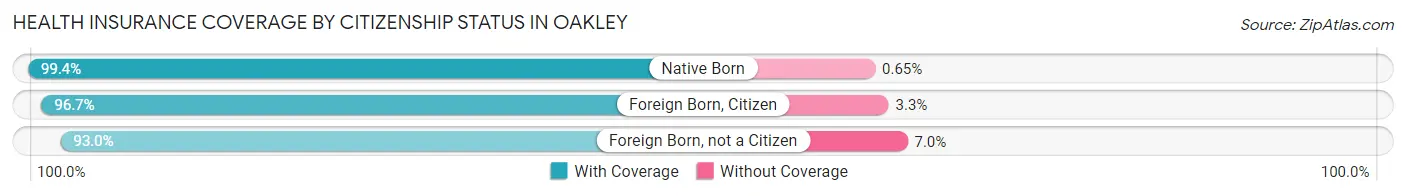
| Citizenship Status | With Coverage | Without Coverage |
| Native Born | 3,845 (99.4%) | 25 (0.6%) |
| Foreign Born, Citizen | 7,470 (96.7%) | 255 (3.3%) |
| Foreign Born, not a Citizen | 3,894 (93.0%) | 294 (7.0%) |
Health Insurance Coverage by Household Income in Oakley
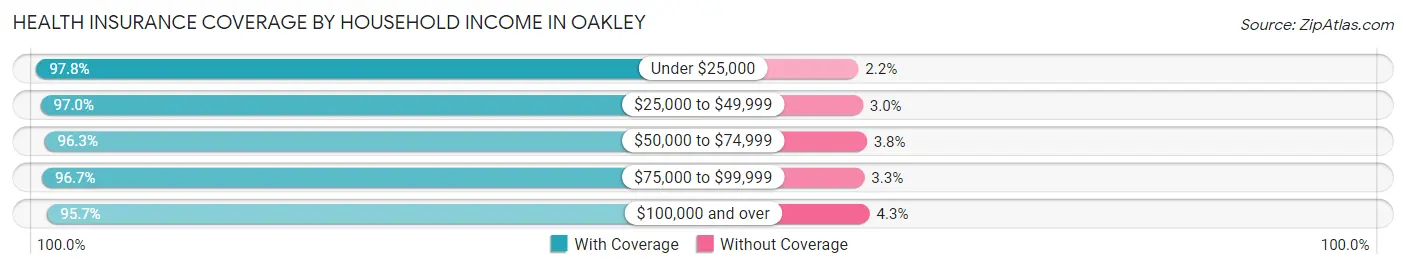
| Household Income | With Coverage | Without Coverage |
| Under $25,000 | 1,799 (97.8%) | 40 (2.2%) |
| $25,000 to $49,999 | 3,025 (97.0%) | 94 (3.0%) |
| $50,000 to $74,999 | 2,387 (96.3%) | 93 (3.7%) |
| $75,000 to $99,999 | 5,485 (96.7%) | 187 (3.3%) |
| $100,000 and over | 28,990 (95.7%) | 1,295 (4.3%) |
Public vs Private Health Insurance Coverage by Age in Oakley
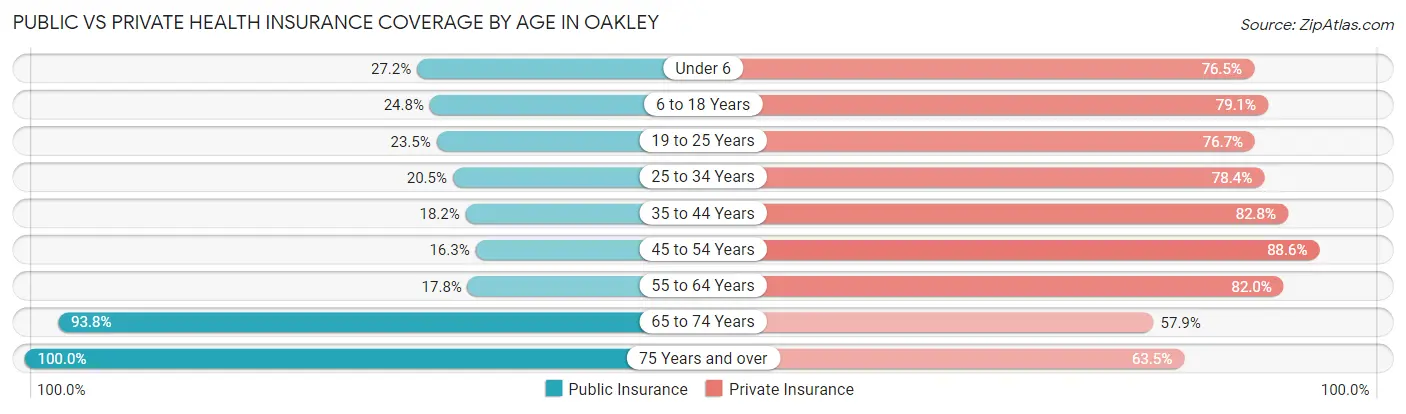
| Age Bracket | Public Insurance | Private Insurance |
| Under 6 | 1,051 (27.2%) | 2,959 (76.5%) |
| 6 to 18 Years | 1,916 (24.8%) | 6,109 (79.1%) |
| 19 to 25 Years | 986 (23.5%) | 3,211 (76.7%) |
| 25 to 34 Years | 1,107 (20.5%) | 4,227 (78.4%) |
| 35 to 44 Years | 1,176 (18.2%) | 5,361 (82.8%) |
| 45 to 54 Years | 892 (16.3%) | 4,845 (88.6%) |
| 55 to 64 Years | 1,060 (17.8%) | 4,895 (82.0%) |
| 65 to 74 Years | 2,959 (93.8%) | 1,826 (57.9%) |
| 75 Years and over | 1,250 (100.0%) | 794 (63.5%) |
| Total | 12,397 (28.5%) | 34,227 (78.7%) |
Disability Status by Sex by Age in Oakley
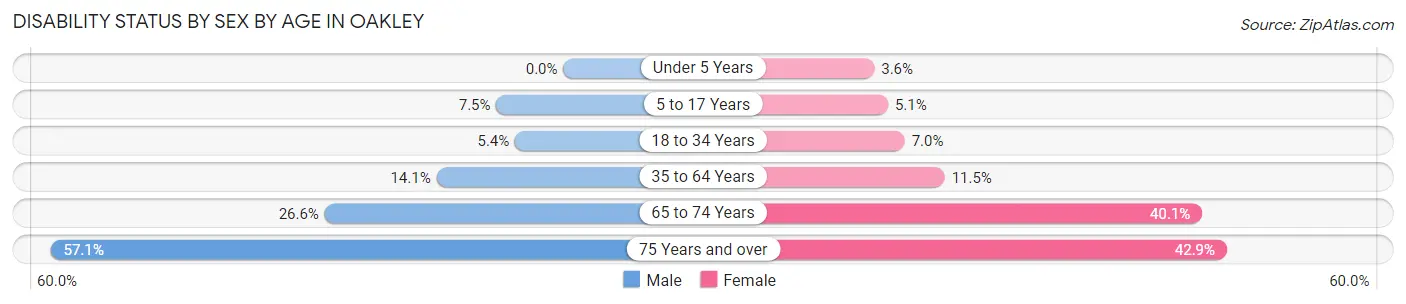
| Age Bracket | Male | Female |
| Under 5 Years | 0 (0.0%) | 63 (3.6%) |
| 5 to 17 Years | 319 (7.5%) | 178 (5.1%) |
| 18 to 34 Years | 263 (5.4%) | 366 (7.0%) |
| 35 to 64 Years | 1,289 (14.1%) | 1,007 (11.5%) |
| 65 to 74 Years | 432 (26.6%) | 614 (40.1%) |
| 75 Years and over | 269 (57.1%) | 334 (42.9%) |
Disability Class by Sex by Age in Oakley
Disability Class: Hearing Difficulty
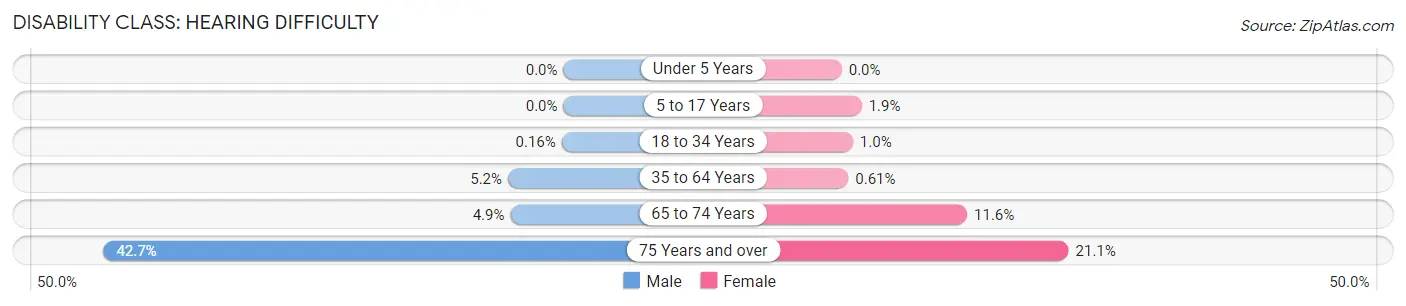
| Age Bracket | Male | Female |
| Under 5 Years | 0 (0.0%) | 0 (0.0%) |
| 5 to 17 Years | 0 (0.0%) | 64 (1.8%) |
| 18 to 34 Years | 8 (0.2%) | 54 (1.0%) |
| 35 to 64 Years | 470 (5.1%) | 54 (0.6%) |
| 65 to 74 Years | 80 (4.9%) | 178 (11.6%) |
| 75 Years and over | 201 (42.7%) | 164 (21.0%) |
Disability Class: Vision Difficulty
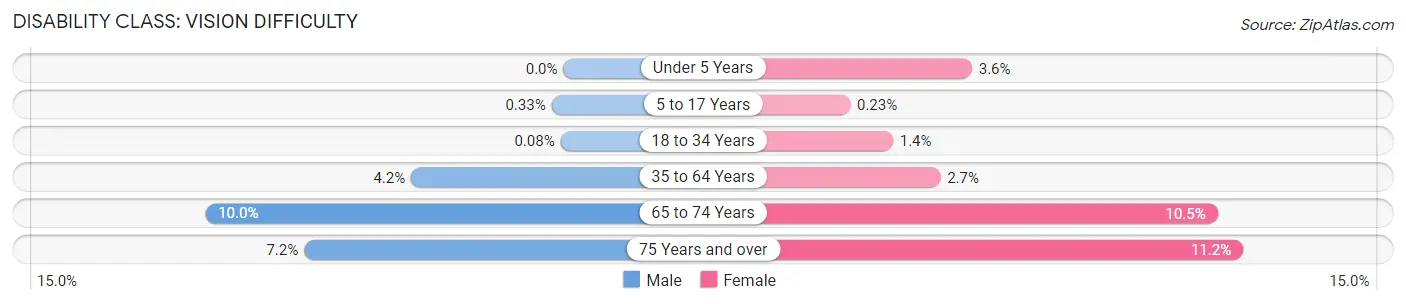
| Age Bracket | Male | Female |
| Under 5 Years | 0 (0.0%) | 63 (3.6%) |
| 5 to 17 Years | 14 (0.3%) | 8 (0.2%) |
| 18 to 34 Years | 4 (0.1%) | 74 (1.4%) |
| 35 to 64 Years | 387 (4.2%) | 241 (2.7%) |
| 65 to 74 Years | 162 (10.0%) | 160 (10.5%) |
| 75 Years and over | 34 (7.2%) | 87 (11.2%) |
Disability Class: Cognitive Difficulty
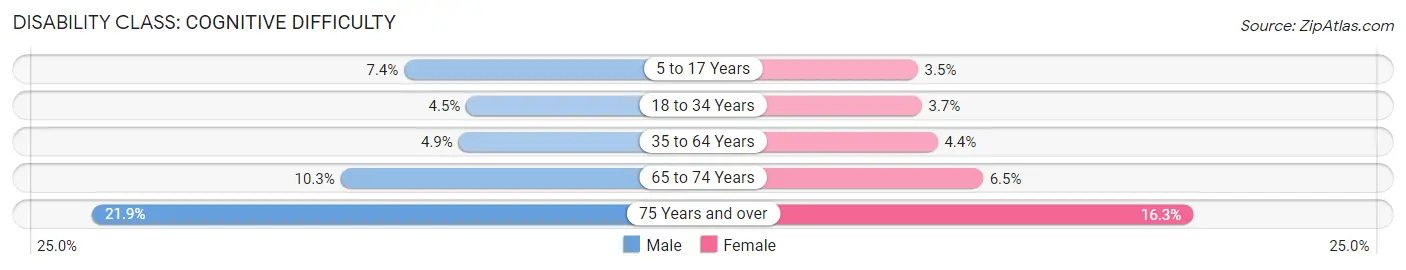
| Age Bracket | Male | Female |
| 5 to 17 Years | 316 (7.4%) | 122 (3.5%) |
| 18 to 34 Years | 221 (4.5%) | 193 (3.7%) |
| 35 to 64 Years | 443 (4.9%) | 390 (4.4%) |
| 65 to 74 Years | 168 (10.3%) | 100 (6.5%) |
| 75 Years and over | 103 (21.9%) | 127 (16.3%) |
Disability Class: Ambulatory Difficulty
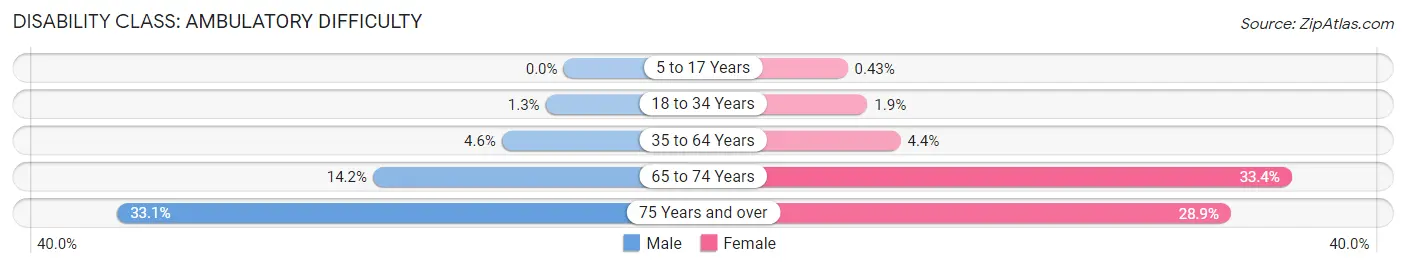
| Age Bracket | Male | Female |
| 5 to 17 Years | 0 (0.0%) | 15 (0.4%) |
| 18 to 34 Years | 65 (1.3%) | 99 (1.9%) |
| 35 to 64 Years | 418 (4.6%) | 383 (4.4%) |
| 65 to 74 Years | 230 (14.1%) | 511 (33.4%) |
| 75 Years and over | 156 (33.1%) | 225 (28.9%) |
Disability Class: Self-Care Difficulty
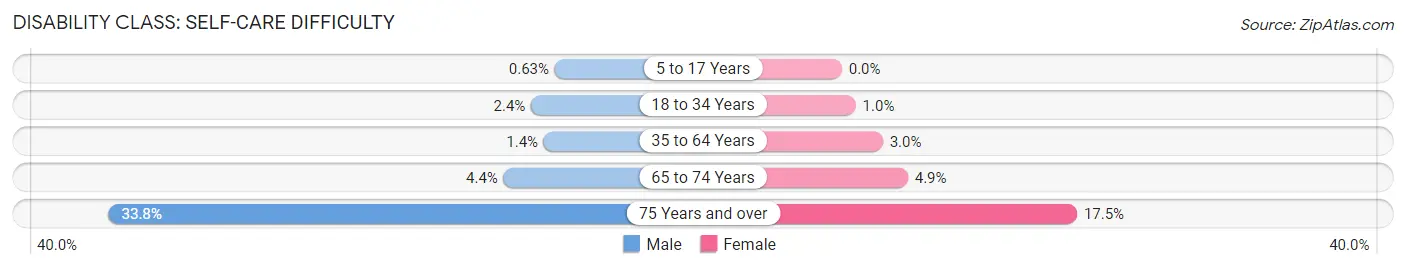
| Age Bracket | Male | Female |
| 5 to 17 Years | 27 (0.6%) | 0 (0.0%) |
| 18 to 34 Years | 117 (2.4%) | 54 (1.0%) |
| 35 to 64 Years | 131 (1.4%) | 267 (3.0%) |
| 65 to 74 Years | 72 (4.4%) | 75 (4.9%) |
| 75 Years and over | 159 (33.8%) | 136 (17.5%) |
Technology Access in Oakley
Computing Device Access in Oakley
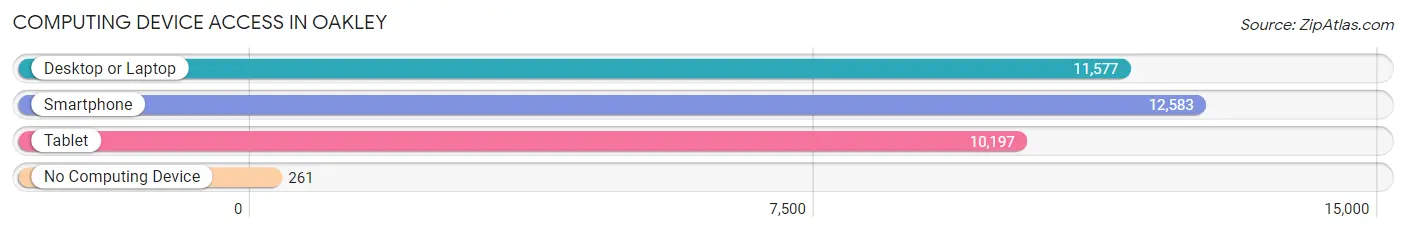
| Device Type | # Households | % Households |
| Desktop or Laptop | 11,577 | 88.8% |
| Smartphone | 12,583 | 96.5% |
| Tablet | 10,197 | 78.2% |
| No Computing Device | 261 | 2.0% |
| Total | 13,036 | 100.0% |
Internet Access in Oakley
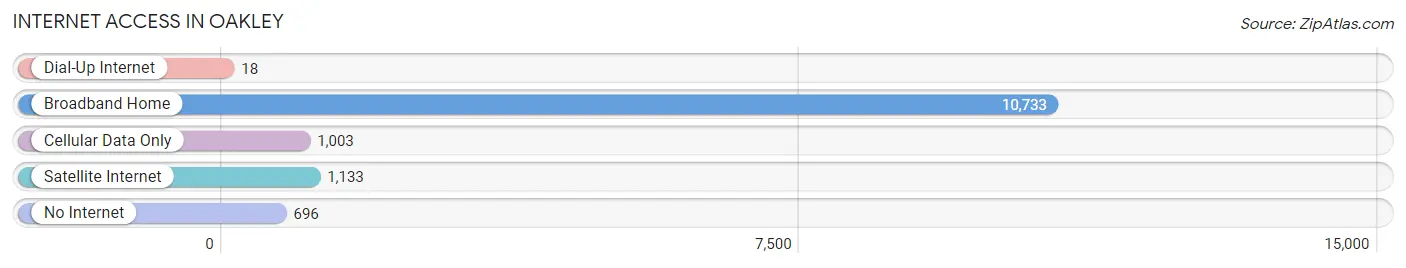
| Internet Type | # Households | % Households |
| Dial-Up Internet | 18 | 0.1% |
| Broadband Home | 10,733 | 82.3% |
| Cellular Data Only | 1,003 | 7.7% |
| Satellite Internet | 1,133 | 8.7% |
| No Internet | 696 | 5.3% |
| Total | 13,036 | 100.0% |
Oakley Summary
Oakley, California is a small city located in Contra Costa County, in the San Francisco Bay Area. It is situated on the eastern edge of the San Joaquin Valley, and is bordered by the cities of Brentwood, Antioch, and Pittsburg. The city has a population of around 35,000 people, and is known for its rural atmosphere and small-town charm.
History
Oakley was founded in 1876 by William Mendenhall, a rancher from Missouri. He purchased a large tract of land in the area and began to develop it for agricultural purposes. The town was originally called “Mendenhall’s Landing”, but was later renamed Oakley after the many oak trees that grew in the area.
In the early 1900s, Oakley began to grow as a farming community. The town was home to many small farms, and the local economy was largely based on agriculture. The town also had a few small businesses, such as a general store and a blacksmith shop.
In the 1950s, Oakley began to experience a population boom as people moved to the area from other parts of California. This growth was largely due to the development of the nearby cities of Brentwood and Antioch. The population of Oakley continued to grow throughout the 1960s and 1970s, and the city was officially incorporated in 1999.
Geography
Oakley is located in the San Joaquin Valley, on the eastern edge of Contra Costa County. The city is situated on the banks of the San Joaquin River, and is bordered by the cities of Brentwood, Antioch, and Pittsburg. The city covers an area of 8.3 square miles, and has a population density of 4,092 people per square mile.
The city is located in a semi-arid climate zone, and experiences hot, dry summers and mild, wet winters. The average annual temperature is around 65 degrees Fahrenheit, and the average annual precipitation is around 18 inches.
Economy
Oakley’s economy is largely based on agriculture and manufacturing. The city is home to several large farms, and the local economy is supported by the production of fruits, vegetables, and nuts. The city is also home to several manufacturing companies, including a large food processing plant and a plastics factory.
The city is also home to several retail stores, restaurants, and other businesses. The city’s largest employer is the Oakley Unified School District, which employs over 1,000 people.
Demographics
As of the 2010 census, Oakley had a population of 35,432 people. The racial makeup of the city was 68.3% White, 11.2% African American, 0.7% Native American, 8.2% Asian, 0.2% Pacific Islander, and 11.4% from other races. Hispanic or Latino of any race were 24.3% of the population.
The median household income in Oakley was $71,837, and the median family income was $80,837. The per capita income was $27,837. About 11.2% of families and 14.2% of the population were below the poverty line, including 19.2% of those under age 18 and 8.2% of those age 65 or over.
Oakley is a small city with a rural atmosphere and a strong sense of community. The city is home to many small businesses, farms, and manufacturing companies, and is a great place to live for those looking for a quiet, peaceful lifestyle.
Common Questions
What is Per Capita Income in Oakley?
Per Capita income in Oakley is $41,163.
What is the Median Family Income in Oakley?
Median Family Income in Oakley is $128,810.
What is the Median Household income in Oakley?
Median Household Income in Oakley is $120,915.
What is Income or Wage Gap in Oakley?
Income or Wage Gap in Oakley is 43.5%.
Women in Oakley earn 56.5 cents for every dollar earned by a man.
What is Family Income Deficit in Oakley?
Family Income Deficit in Oakley is $9,725.
Families that are below poverty line in Oakley earn $9,725 less on average than the poverty threshold level.
What is Inequality or Gini Index in Oakley?
Inequality or Gini Index in Oakley is 0.36.
What is the Total Population of Oakley?
Total Population of Oakley is 43,525.
What is the Total Male Population of Oakley?
Total Male Population of Oakley is 21,990.
What is the Total Female Population of Oakley?
Total Female Population of Oakley is 21,535.
What is the Ratio of Males per 100 Females in Oakley?
There are 102.11 Males per 100 Females in Oakley.
What is the Ratio of Females per 100 Males in Oakley?
There are 97.93 Females per 100 Males in Oakley.
What is the Median Population Age in Oakley?
Median Population Age in Oakley is 35.8 Years.
What is the Average Family Size in Oakley
Average Family Size in Oakley is 3.6 People.
What is the Average Household Size in Oakley
Average Household Size in Oakley is 3.3 People.
How Large is the Labor Force in Oakley?
There are 22,910 People in the Labor Forcein in Oakley.
What is the Percentage of People in the Labor Force in Oakley?
68.2% of People are in the Labor Force in Oakley.
What is the Unemployment Rate in Oakley?
Unemployment Rate in Oakley is 5.9%.