Oakhurst, CA Map & Demographics
Oakhurst Map
Oakhurst Overview
$44,763
PER CAPITA INCOME
$81,492
AVG FAMILY INCOME
$73,333
AVG HOUSEHOLD INCOME
41.2%
WAGE / INCOME GAP [ % ]
58.8¢/ $1
WAGE / INCOME GAP [ $ ]
0.50
INEQUALITY / GINI INDEX
5,003
TOTAL POPULATION
2,176
MALE POPULATION
2,827
FEMALE POPULATION
76.97
MALES / 100 FEMALES
129.92
FEMALES / 100 MALES
47.1
MEDIAN AGE
2.8
AVG FAMILY SIZE
2.3
AVG HOUSEHOLD SIZE
2,450
LABOR FORCE [ PEOPLE ]
57.9%
PERCENT IN LABOR FORCE
8.0%
UNEMPLOYMENT RATE
Oakhurst Zip Codes
Oakhurst Area Codes
Income in Oakhurst
Income Overview in Oakhurst
Per Capita Income in Oakhurst is $44,763, while median incomes of families and households are $81,492 and $73,333 respectively.
| Characteristic | Number | Measure |
| Per Capita Income | 5,003 | $44,763 |
| Median Family Income | 1,289 | $81,492 |
| Mean Family Income | 1,289 | $92,038 |
| Median Household Income | 2,180 | $73,333 |
| Mean Household Income | 2,180 | $98,319 |
| Income Deficit | 1,289 | $0 |
| Wage / Income Gap (%) | 5,003 | 41.15% |
| Wage / Income Gap ($) | 5,003 | 58.85¢ per $1 |
| Gini / Inequality Index | 5,003 | 0.50 |
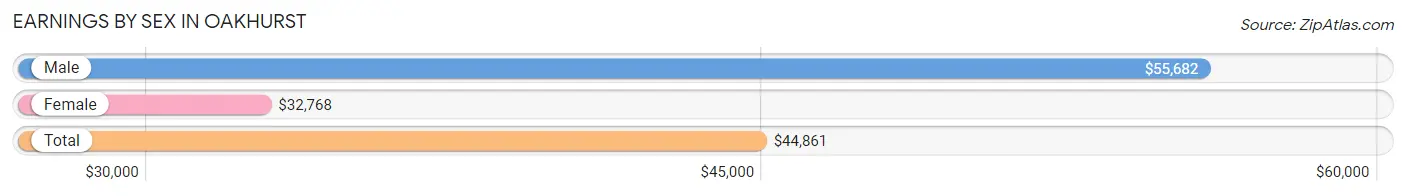
Earnings by Sex in Oakhurst
Average Earnings in Oakhurst are $44,861, $55,682 for men and $32,768 for women, a difference of 41.1%.
| Sex | Number | Average Earnings |
| Male | 1,150 (45.3%) | $55,682 |
| Female | 1,387 (54.7%) | $32,768 |
| Total | 2,537 (100.0%) | $44,861 |
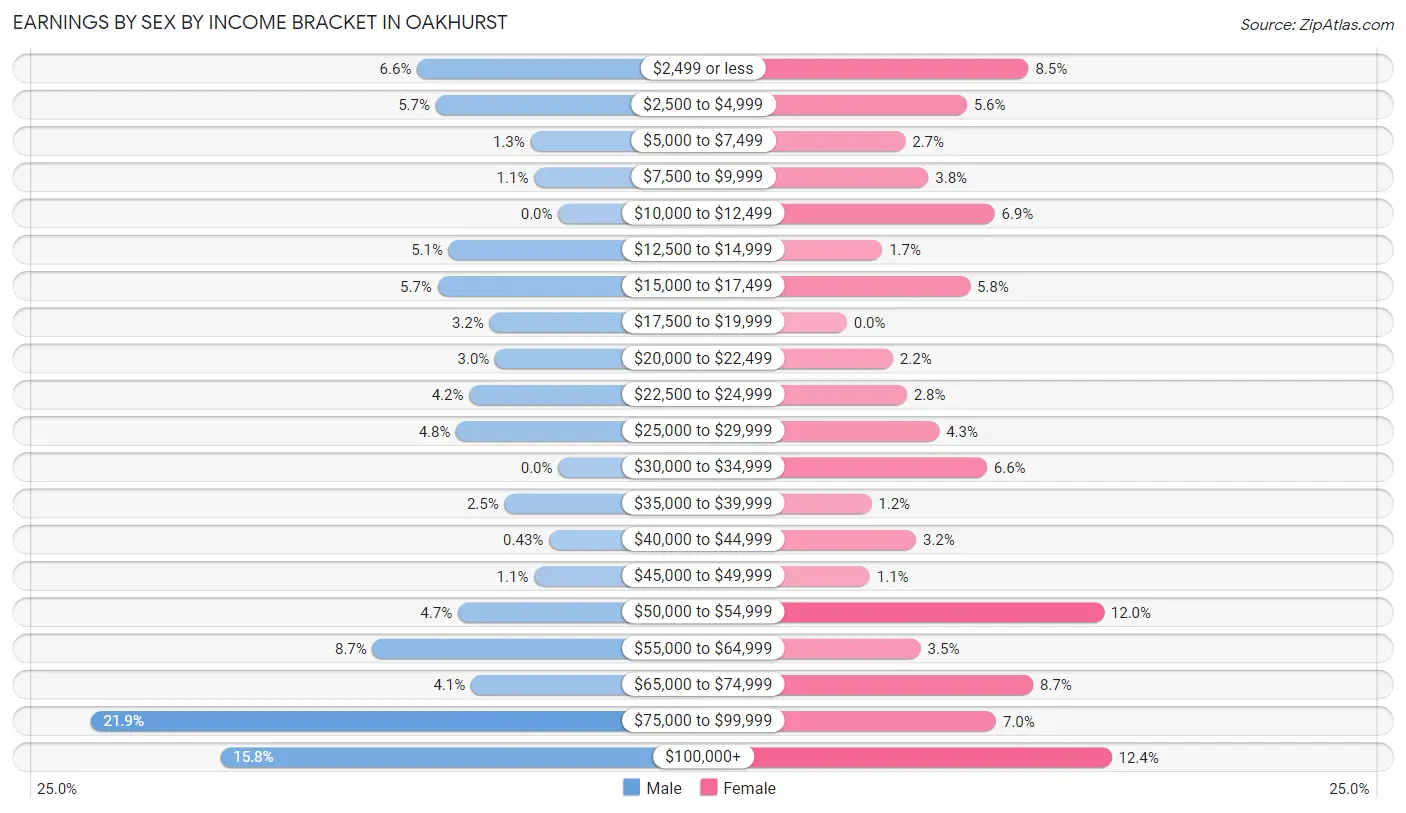
Earnings by Sex by Income Bracket in Oakhurst
The most common earnings brackets in Oakhurst are $75,000 to $99,999 for men (252 | 21.9%) and $100,000+ for women (172 | 12.4%).
| Income | Male | Female |
| $2,499 or less | 76 (6.6%) | 118 (8.5%) |
| $2,500 to $4,999 | 66 (5.7%) | 78 (5.6%) |
| $5,000 to $7,499 | 15 (1.3%) | 38 (2.7%) |
| $7,500 to $9,999 | 13 (1.1%) | 53 (3.8%) |
| $10,000 to $12,499 | 0 (0.0%) | 96 (6.9%) |
| $12,500 to $14,999 | 59 (5.1%) | 23 (1.7%) |
| $15,000 to $17,499 | 65 (5.7%) | 80 (5.8%) |
| $17,500 to $19,999 | 37 (3.2%) | 0 (0.0%) |
| $20,000 to $22,499 | 34 (3.0%) | 30 (2.2%) |
| $22,500 to $24,999 | 48 (4.2%) | 39 (2.8%) |
| $25,000 to $29,999 | 55 (4.8%) | 60 (4.3%) |
| $30,000 to $34,999 | 0 (0.0%) | 91 (6.6%) |
| $35,000 to $39,999 | 29 (2.5%) | 16 (1.1%) |
| $40,000 to $44,999 | 5 (0.4%) | 45 (3.2%) |
| $45,000 to $49,999 | 13 (1.1%) | 15 (1.1%) |
| $50,000 to $54,999 | 54 (4.7%) | 167 (12.0%) |
| $55,000 to $64,999 | 100 (8.7%) | 48 (3.5%) |
| $65,000 to $74,999 | 47 (4.1%) | 121 (8.7%) |
| $75,000 to $99,999 | 252 (21.9%) | 97 (7.0%) |
| $100,000+ | 182 (15.8%) | 172 (12.4%) |
| Total | 1,150 (100.0%) | 1,387 (100.0%) |
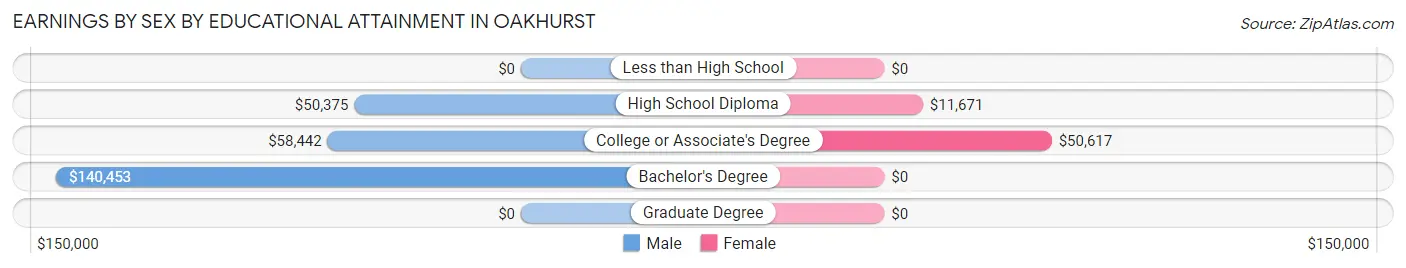
Earnings by Sex by Educational Attainment in Oakhurst
Average earnings in Oakhurst are $58,800 for men and $42,222 for women, a difference of 28.2%. Men with an educational attainment of bachelor's degree enjoy the highest average annual earnings of $140,453, while those with high school diploma education earn the least with $50,375. Women with an educational attainment of college or associate's degree earn the most with the average annual earnings of $50,617, while those with high school diploma education have the smallest earnings of $11,671.
| Educational Attainment | Male Income | Female Income |
| Less than High School | - | - |
| High School Diploma | $50,375 | $11,671 |
| College or Associate's Degree | $58,442 | $50,617 |
| Bachelor's Degree | $140,453 | $0 |
| Graduate Degree | - | - |
| Total | $58,800 | $42,222 |
Family Income in Oakhurst
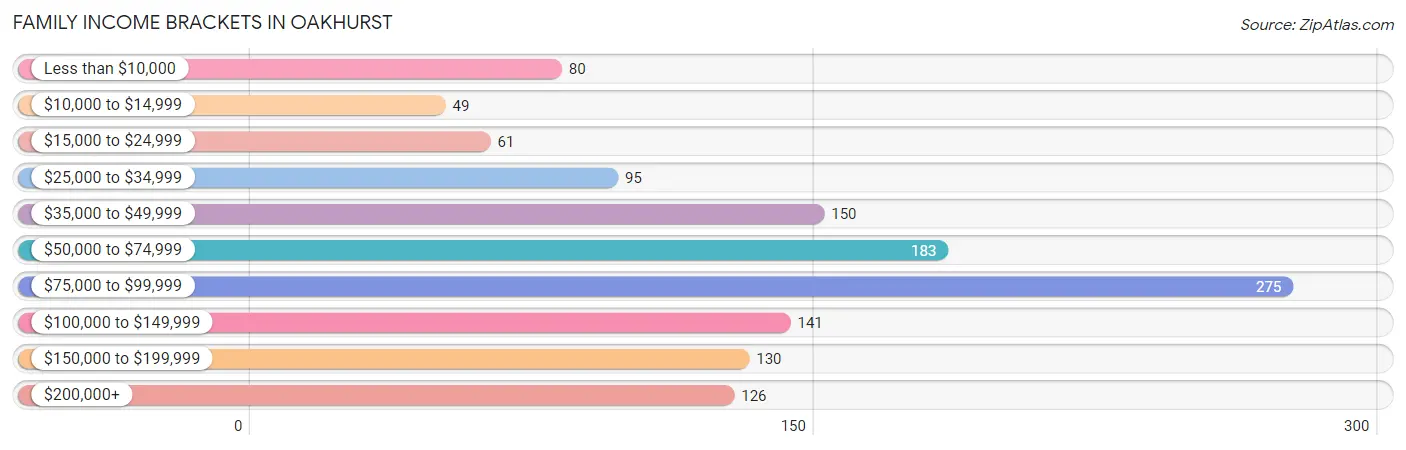
Family Income Brackets in Oakhurst
According to the Oakhurst family income data, there are 275 families falling into the $75,000 to $99,999 income range, which is the most common income bracket and makes up 21.3% of all families. Conversely, the $10,000 to $14,999 income bracket is the least frequent group with only 49 families (3.8%) belonging to this category.
| Income Bracket | # Families | % Families |
| Less than $10,000 | 80 | 6.2% |
| $10,000 to $14,999 | 49 | 3.8% |
| $15,000 to $24,999 | 61 | 4.7% |
| $25,000 to $34,999 | 95 | 7.4% |
| $35,000 to $49,999 | 150 | 11.6% |
| $50,000 to $74,999 | 183 | 14.2% |
| $75,000 to $99,999 | 275 | 21.3% |
| $100,000 to $149,999 | 141 | 10.9% |
| $150,000 to $199,999 | 130 | 10.1% |
| $200,000+ | 126 | 9.8% |
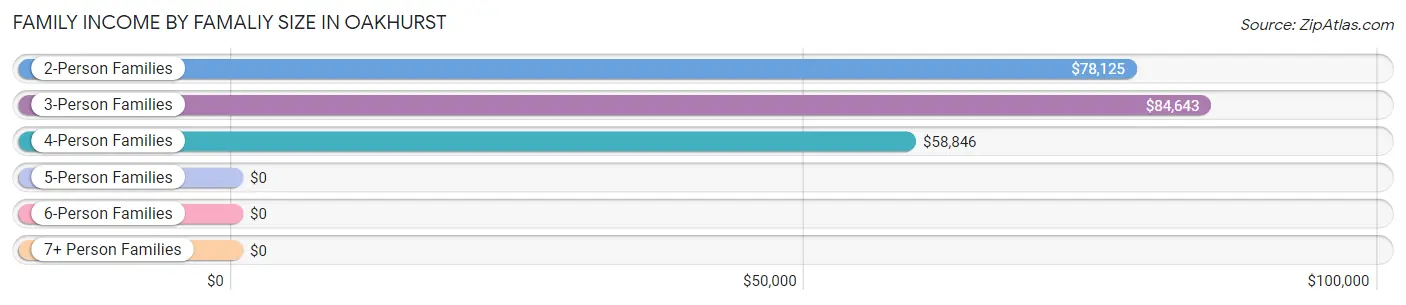
Family Income by Famaliy Size in Oakhurst
3-person families (250 | 19.4%) account for the highest median family income in Oakhurst with $84,643 per family, while 2-person families (796 | 61.8%) have the highest median income of $39,062 per family member.
| Income Bracket | # Families | Median Income |
| 2-Person Families | 796 (61.8%) | $78,125 |
| 3-Person Families | 250 (19.4%) | $84,643 |
| 4-Person Families | 160 (12.4%) | $58,846 |
| 5-Person Families | 0 (0.0%) | $0 |
| 6-Person Families | 83 (6.4%) | $0 |
| 7+ Person Families | 0 (0.0%) | $0 |
| Total | 1,289 (100.0%) | $81,492 |
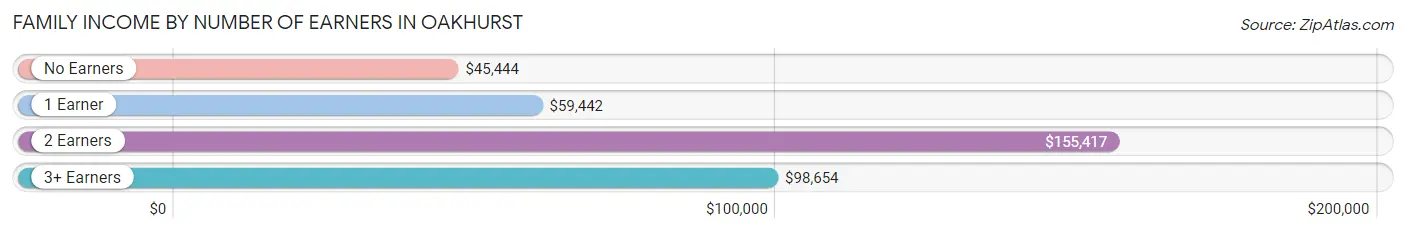
Family Income by Number of Earners in Oakhurst
The median family income in Oakhurst is $81,492, with families comprising 2 earners (378) having the highest median family income of $155,417, while families with no earners (338) have the lowest median family income of $45,444, accounting for 29.3% and 26.2% of families, respectively.
| Number of Earners | # Families | Median Income |
| No Earners | 338 (26.2%) | $45,444 |
| 1 Earner | 509 (39.5%) | $59,442 |
| 2 Earners | 378 (29.3%) | $155,417 |
| 3+ Earners | 64 (5.0%) | $98,654 |
| Total | 1,289 (100.0%) | $81,492 |
Household Income in Oakhurst
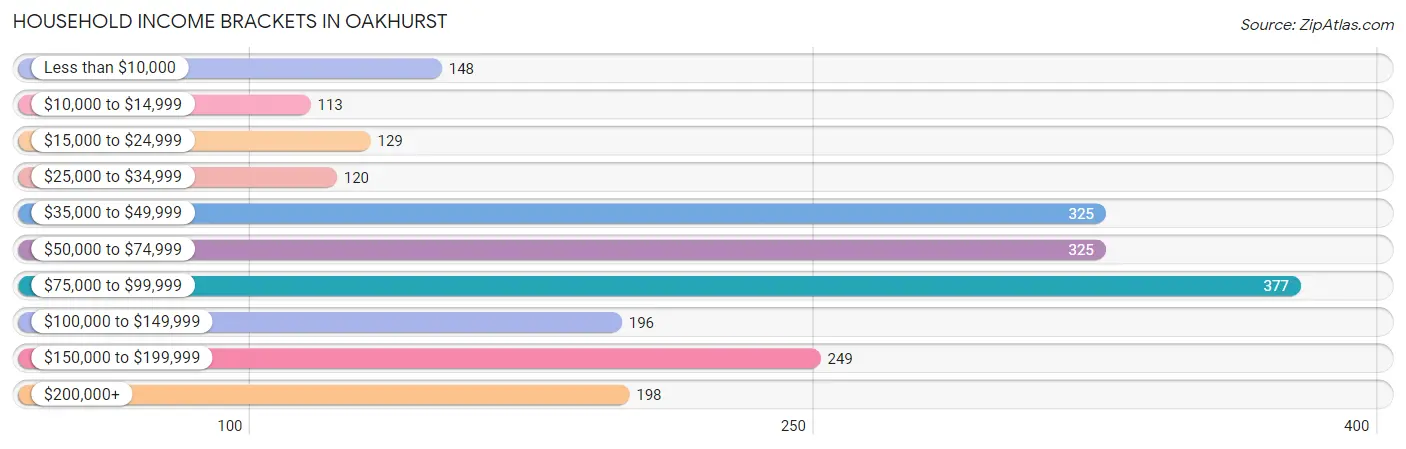
Household Income Brackets in Oakhurst
With 377 households falling in the category, the $75,000 to $99,999 income range is the most frequent in Oakhurst, accounting for 17.3% of all households. In contrast, only 113 households (5.2%) fall into the $10,000 to $14,999 income bracket, making it the least populous group.
| Income Bracket | # Households | % Households |
| Less than $10,000 | 148 | 6.8% |
| $10,000 to $14,999 | 113 | 5.2% |
| $15,000 to $24,999 | 129 | 5.9% |
| $25,000 to $34,999 | 120 | 5.5% |
| $35,000 to $49,999 | 325 | 14.9% |
| $50,000 to $74,999 | 325 | 14.9% |
| $75,000 to $99,999 | 377 | 17.3% |
| $100,000 to $149,999 | 196 | 9.0% |
| $150,000 to $199,999 | 249 | 11.4% |
| $200,000+ | 198 | 9.1% |
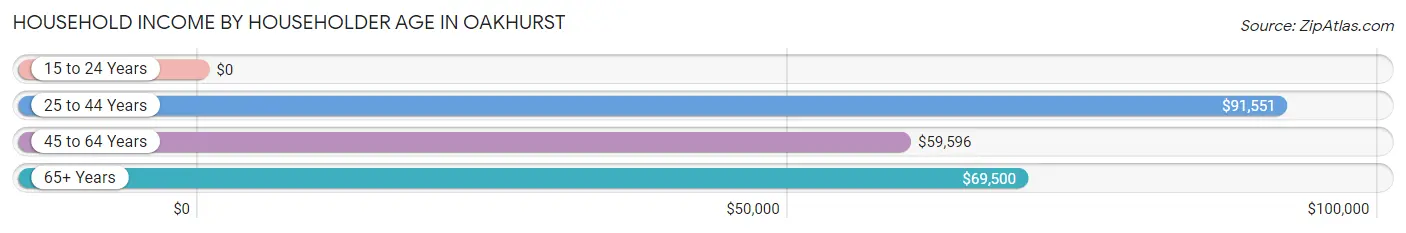
Household Income by Householder Age in Oakhurst
The median household income in Oakhurst is $73,333, with the highest median household income of $91,551 found in the 25 to 44 years age bracket for the primary householder. A total of 595 households (27.3%) fall into this category.
| Income Bracket | # Households | Median Income |
| 15 to 24 Years | 0 (0.0%) | $0 |
| 25 to 44 Years | 595 (27.3%) | $91,551 |
| 45 to 64 Years | 707 (32.4%) | $59,596 |
| 65+ Years | 878 (40.3%) | $69,500 |
| Total | 2,180 (100.0%) | $73,333 |
Poverty in Oakhurst
Income Below Poverty by Sex and Age in Oakhurst
With 13.1% poverty level for males and 18.6% for females among the residents of Oakhurst, 16 and 17 year old males and 16 and 17 year old females are the most vulnerable to poverty, with 41 males (53.9%) and 35 females (57.4%) in their respective age groups living below the poverty level.
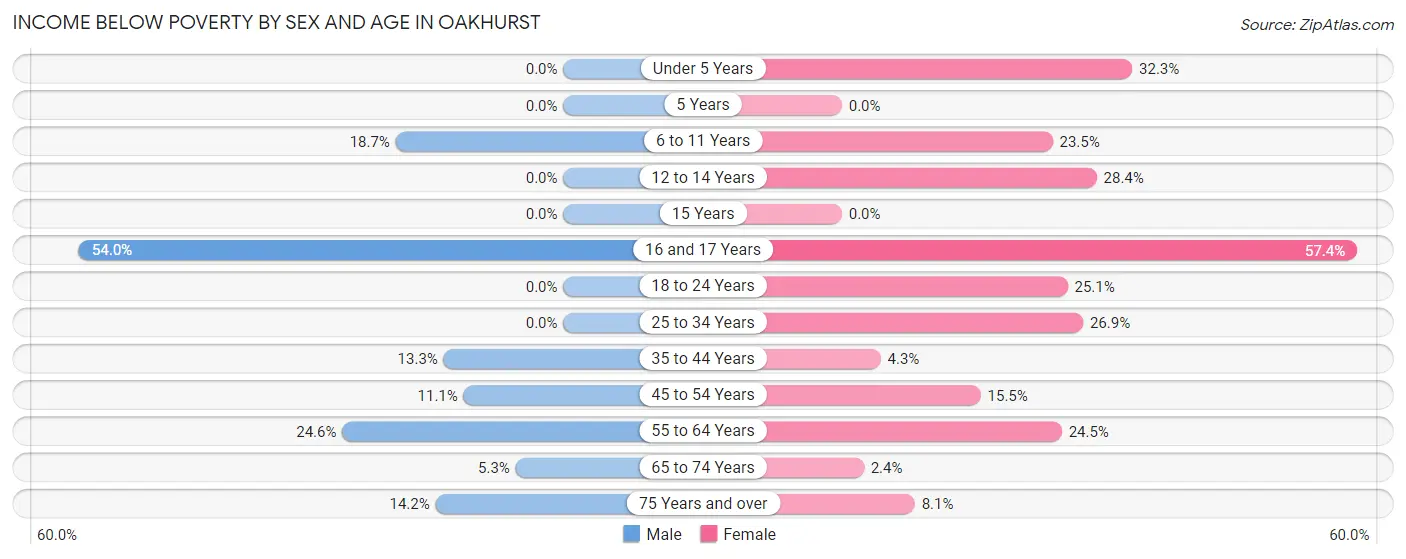
| Age Bracket | Male | Female |
| Under 5 Years | 0 (0.0%) | 43 (32.3%) |
| 5 Years | 0 (0.0%) | 0 (0.0%) |
| 6 to 11 Years | 28 (18.7%) | 50 (23.5%) |
| 12 to 14 Years | 0 (0.0%) | 42 (28.4%) |
| 15 Years | 0 (0.0%) | 0 (0.0%) |
| 16 and 17 Years | 41 (53.9%) | 35 (57.4%) |
| 18 to 24 Years | 0 (0.0%) | 46 (25.1%) |
| 25 to 34 Years | 0 (0.0%) | 94 (26.9%) |
| 35 to 44 Years | 50 (13.3%) | 13 (4.3%) |
| 45 to 54 Years | 28 (11.1%) | 47 (15.5%) |
| 55 to 64 Years | 82 (24.6%) | 120 (24.5%) |
| 65 to 74 Years | 20 (5.3%) | 7 (2.4%) |
| 75 Years and over | 37 (14.2%) | 29 (8.1%) |
| Total | 286 (13.1%) | 526 (18.6%) |
Income Above Poverty by Sex and Age in Oakhurst
According to the poverty statistics in Oakhurst, males aged under 5 years and females aged 65 to 74 years are the age groups that are most secure financially, with 100.0% of males and 97.6% of females in these age groups living above the poverty line.
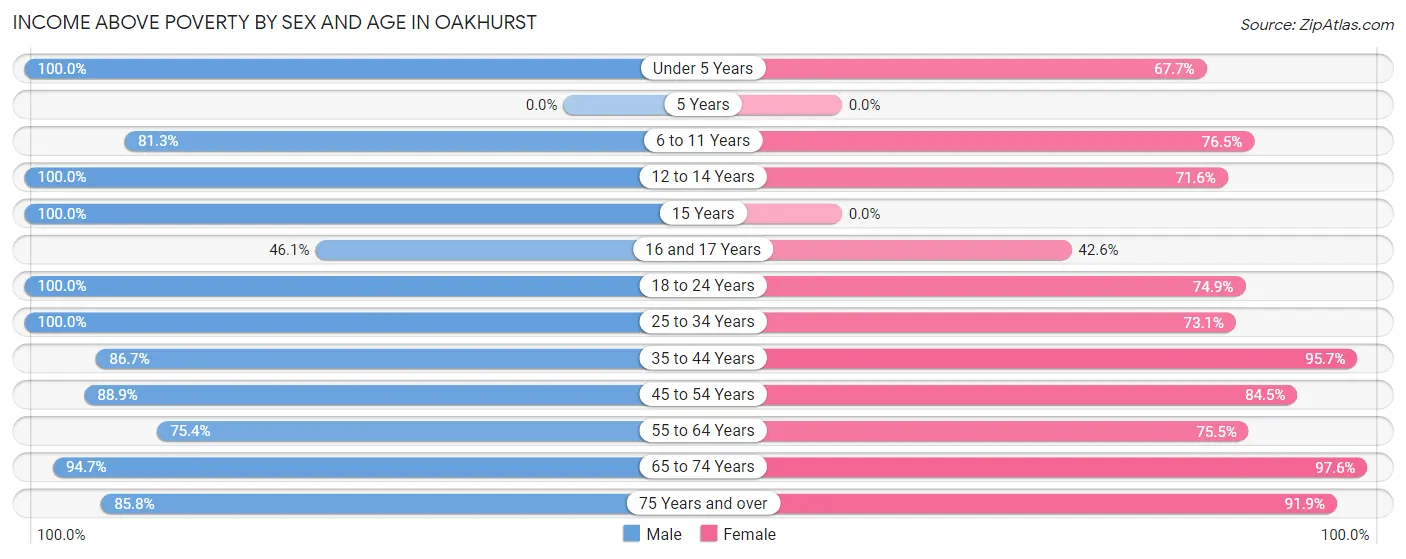
| Age Bracket | Male | Female |
| Under 5 Years | 21 (100.0%) | 90 (67.7%) |
| 5 Years | 0 (0.0%) | 0 (0.0%) |
| 6 to 11 Years | 122 (81.3%) | 163 (76.5%) |
| 12 to 14 Years | 58 (100.0%) | 106 (71.6%) |
| 15 Years | 49 (100.0%) | 0 (0.0%) |
| 16 and 17 Years | 35 (46.1%) | 26 (42.6%) |
| 18 to 24 Years | 99 (100.0%) | 137 (74.9%) |
| 25 to 34 Years | 126 (100.0%) | 256 (73.1%) |
| 35 to 44 Years | 325 (86.7%) | 288 (95.7%) |
| 45 to 54 Years | 224 (88.9%) | 257 (84.5%) |
| 55 to 64 Years | 251 (75.4%) | 370 (75.5%) |
| 65 to 74 Years | 357 (94.7%) | 280 (97.6%) |
| 75 Years and over | 223 (85.8%) | 328 (91.9%) |
| Total | 1,890 (86.9%) | 2,301 (81.4%) |
Income Below Poverty Among Married-Couple Families in Oakhurst
The poverty statistics for married-couple families in Oakhurst show that 4.0% or 30 of the total 743 families live below the poverty line. Families with 1 or 2 children have the highest poverty rate of 7.9%, comprising of 7 families. On the other hand, families with no children have the lowest poverty rate of 3.5%, which includes 23 families.
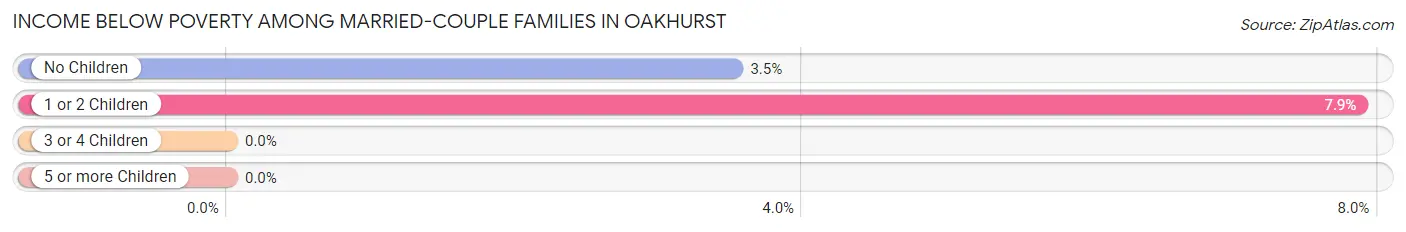
| Children | Above Poverty | Below Poverty |
| No Children | 631 (96.5%) | 23 (3.5%) |
| 1 or 2 Children | 82 (92.1%) | 7 (7.9%) |
| 3 or 4 Children | 0 (0.0%) | 0 (0.0%) |
| 5 or more Children | 0 (0.0%) | 0 (0.0%) |
| Total | 713 (96.0%) | 30 (4.0%) |
Income Below Poverty Among Single-Parent Households in Oakhurst
According to the poverty data in Oakhurst, 6.0% or 7 single-father households and 37.2% or 160 single-mother households are living below the poverty line. Among single-father households, those with no children have the highest poverty rate, with 7 households (22.6%) experiencing poverty. Likewise, among single-mother households, those with 3 or 4 children have the highest poverty rate, with 45 households (100.0%) falling below the poverty line.
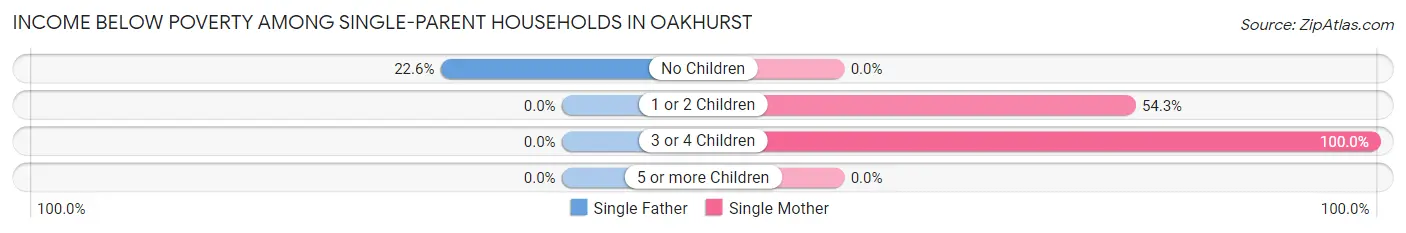
| Children | Single Father | Single Mother |
| No Children | 7 (22.6%) | 0 (0.0%) |
| 1 or 2 Children | 0 (0.0%) | 115 (54.2%) |
| 3 or 4 Children | 0 (0.0%) | 45 (100.0%) |
| 5 or more Children | 0 (0.0%) | 0 (0.0%) |
| Total | 7 (6.0%) | 160 (37.2%) |
Income Below Poverty Among Married-Couple vs Single-Parent Households in Oakhurst
The poverty data for Oakhurst shows that 30 of the married-couple family households (4.0%) and 167 of the single-parent households (30.6%) are living below the poverty level. Within the married-couple family households, those with 1 or 2 children have the highest poverty rate, with 7 households (7.9%) falling below the poverty line. Among the single-parent households, those with 3 or 4 children have the highest poverty rate, with 45 household (100.0%) living below poverty.
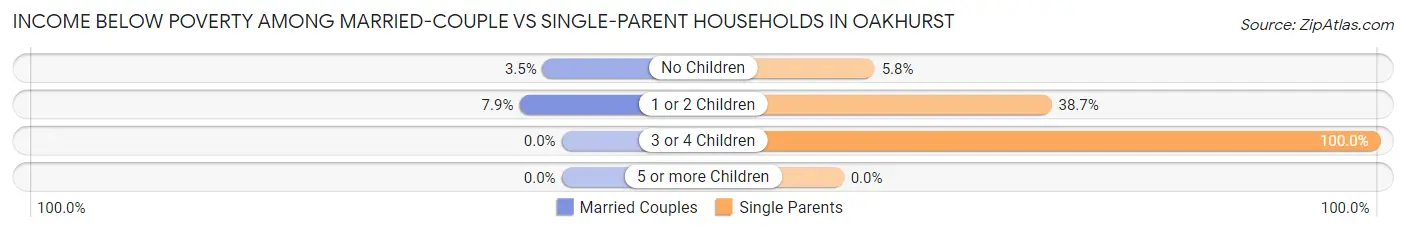
| Children | Married-Couple Families | Single-Parent Households |
| No Children | 23 (3.5%) | 7 (5.8%) |
| 1 or 2 Children | 7 (7.9%) | 115 (38.7%) |
| 3 or 4 Children | 0 (0.0%) | 45 (100.0%) |
| 5 or more Children | 0 (0.0%) | 0 (0.0%) |
| Total | 30 (4.0%) | 167 (30.6%) |
Race in Oakhurst
The most populous races in Oakhurst are White / Caucasian (4,391 | 87.8%), Hispanic or Latino (598 | 11.9%), and Two or more Races (383 | 7.7%).
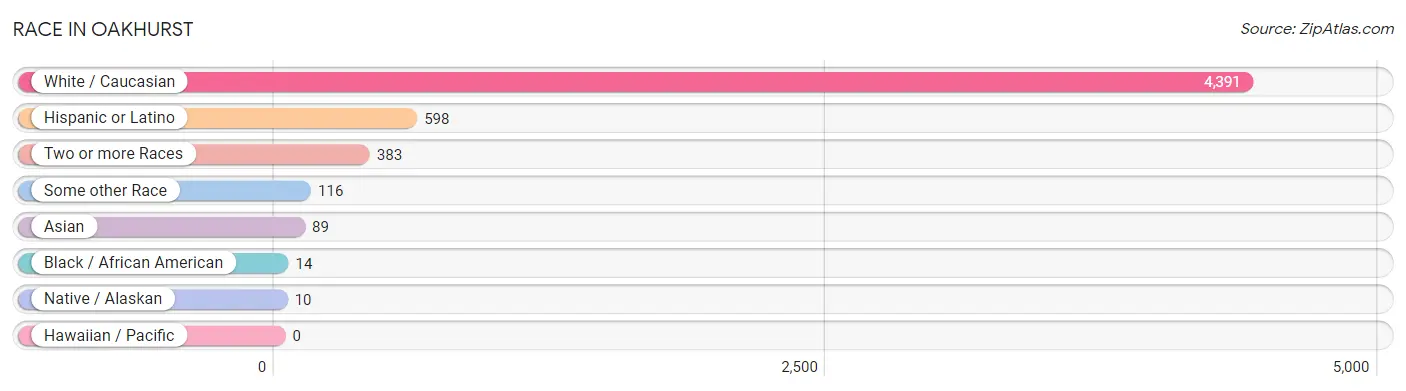
| Race | # Population | % Population |
| Asian | 89 | 1.8% |
| Black / African American | 14 | 0.3% |
| Hawaiian / Pacific | 0 | 0.0% |
| Hispanic or Latino | 598 | 11.9% |
| Native / Alaskan | 10 | 0.2% |
| White / Caucasian | 4,391 | 87.8% |
| Two or more Races | 383 | 7.7% |
| Some other Race | 116 | 2.3% |
| Total | 5,003 | 100.0% |
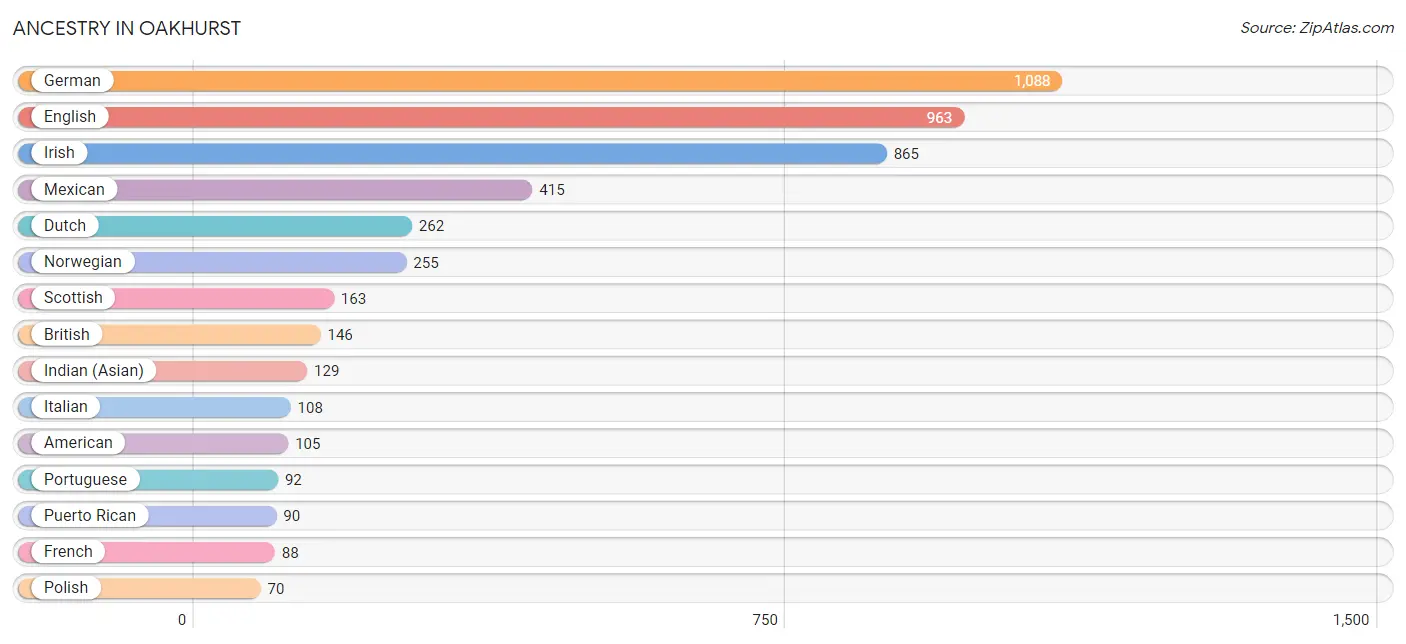
Ancestry in Oakhurst
The most populous ancestries reported in Oakhurst are German (1,088 | 21.7%), English (963 | 19.3%), Irish (865 | 17.3%), Mexican (415 | 8.3%), and Dutch (262 | 5.2%), together accounting for 71.8% of all Oakhurst residents.
| Ancestry | # Population | % Population |
| American | 105 | 2.1% |
| Arab | 28 | 0.6% |
| Austrian | 11 | 0.2% |
| Belgian | 8 | 0.2% |
| British | 146 | 2.9% |
| Central American | 37 | 0.7% |
| Czech | 9 | 0.2% |
| Czechoslovakian | 24 | 0.5% |
| Danish | 59 | 1.2% |
| Dutch | 262 | 5.2% |
| Eastern European | 38 | 0.8% |
| English | 963 | 19.3% |
| European | 50 | 1.0% |
| French | 88 | 1.8% |
| French Canadian | 11 | 0.2% |
| German | 1,088 | 21.7% |
| Greek | 58 | 1.2% |
| Honduran | 24 | 0.5% |
| Hungarian | 7 | 0.1% |
| Indian (Asian) | 129 | 2.6% |
| Iranian | 7 | 0.1% |
| Irish | 865 | 17.3% |
| Italian | 108 | 2.2% |
| Korean | 1 | 0.0% |
| Mexican | 415 | 8.3% |
| Norwegian | 255 | 5.1% |
| Polish | 70 | 1.4% |
| Portuguese | 92 | 1.8% |
| Puerto Rican | 90 | 1.8% |
| Russian | 60 | 1.2% |
| Salvadoran | 13 | 0.3% |
| Scandinavian | 12 | 0.2% |
| Scotch-Irish | 44 | 0.9% |
| Scottish | 163 | 3.3% |
| Spaniard | 56 | 1.1% |
| Sri Lankan | 8 | 0.2% |
| Swedish | 49 | 1.0% |
| Thai | 10 | 0.2% |
| Welsh | 36 | 0.7% | View All 39 Rows |
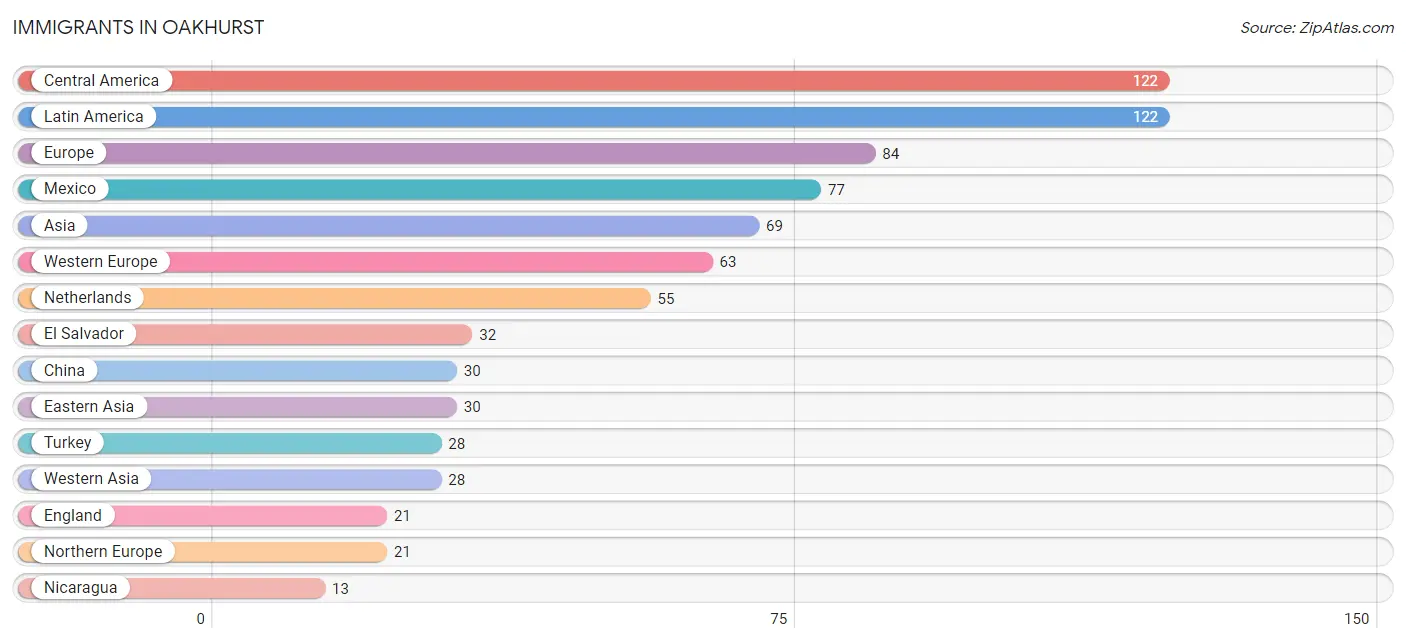
Immigrants in Oakhurst
The most numerous immigrant groups reported in Oakhurst came from Central America (122 | 2.4%), Latin America (122 | 2.4%), Europe (84 | 1.7%), Mexico (77 | 1.5%), and Asia (69 | 1.4%), together accounting for 9.5% of all Oakhurst residents.
| Immigration Origin | # Population | % Population |
| Asia | 69 | 1.4% |
| Belgium | 8 | 0.2% |
| Canada | 11 | 0.2% |
| Central America | 122 | 2.4% |
| China | 30 | 0.6% |
| Eastern Asia | 30 | 0.6% |
| El Salvador | 32 | 0.6% |
| England | 21 | 0.4% |
| Europe | 84 | 1.7% |
| India | 10 | 0.2% |
| Latin America | 122 | 2.4% |
| Mexico | 77 | 1.5% |
| Netherlands | 55 | 1.1% |
| Nicaragua | 13 | 0.3% |
| Northern Europe | 21 | 0.4% |
| Philippines | 1 | 0.0% |
| South Central Asia | 10 | 0.2% |
| South Eastern Asia | 1 | 0.0% |
| Turkey | 28 | 0.6% |
| Western Asia | 28 | 0.6% |
| Western Europe | 63 | 1.3% | View All 21 Rows |
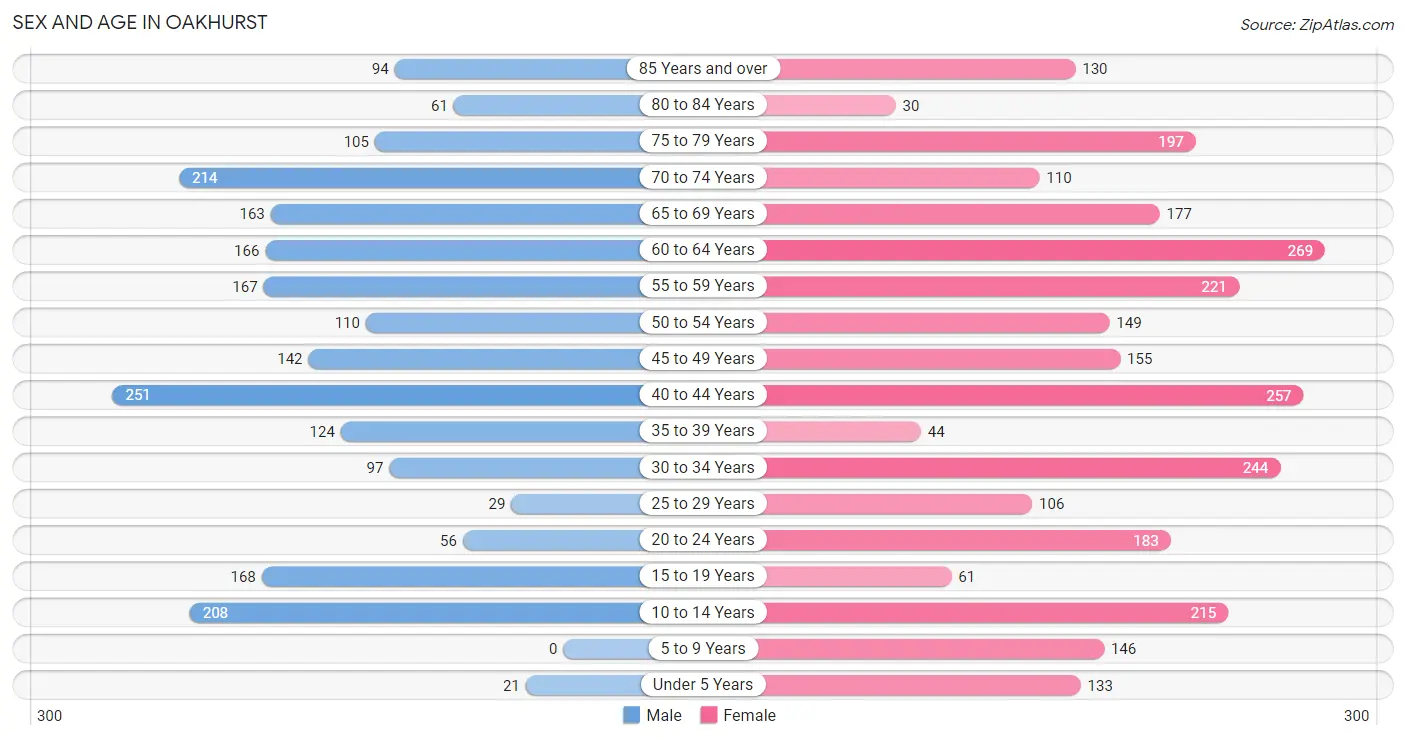
Sex and Age in Oakhurst
Sex and Age in Oakhurst
The most populous age groups in Oakhurst are 40 to 44 Years (251 | 11.5%) for men and 60 to 64 Years (269 | 9.5%) for women.
| Age Bracket | Male | Female |
| Under 5 Years | 21 (1.0%) | 133 (4.7%) |
| 5 to 9 Years | 0 (0.0%) | 146 (5.2%) |
| 10 to 14 Years | 208 (9.6%) | 215 (7.6%) |
| 15 to 19 Years | 168 (7.7%) | 61 (2.2%) |
| 20 to 24 Years | 56 (2.6%) | 183 (6.5%) |
| 25 to 29 Years | 29 (1.3%) | 106 (3.7%) |
| 30 to 34 Years | 97 (4.5%) | 244 (8.6%) |
| 35 to 39 Years | 124 (5.7%) | 44 (1.6%) |
| 40 to 44 Years | 251 (11.5%) | 257 (9.1%) |
| 45 to 49 Years | 142 (6.5%) | 155 (5.5%) |
| 50 to 54 Years | 110 (5.1%) | 149 (5.3%) |
| 55 to 59 Years | 167 (7.7%) | 221 (7.8%) |
| 60 to 64 Years | 166 (7.6%) | 269 (9.5%) |
| 65 to 69 Years | 163 (7.5%) | 177 (6.3%) |
| 70 to 74 Years | 214 (9.8%) | 110 (3.9%) |
| 75 to 79 Years | 105 (4.8%) | 197 (7.0%) |
| 80 to 84 Years | 61 (2.8%) | 30 (1.1%) |
| 85 Years and over | 94 (4.3%) | 130 (4.6%) |
| Total | 2,176 (100.0%) | 2,827 (100.0%) |
Families and Households in Oakhurst
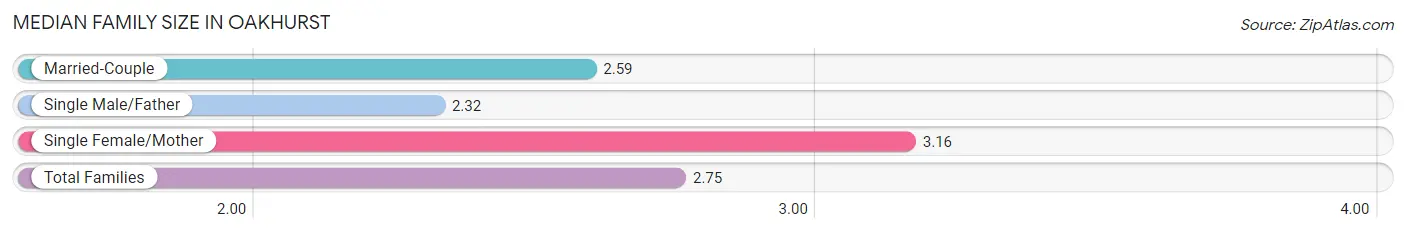
Median Family Size in Oakhurst
The median family size in Oakhurst is 2.75 persons per family, with single female/mother families (430 | 33.4%) accounting for the largest median family size of 3.16 persons per family. On the other hand, single male/father families (116 | 9.0%) represent the smallest median family size with 2.32 persons per family.
| Family Type | # Families | Family Size |
| Married-Couple | 743 (57.6%) | 2.59 |
| Single Male/Father | 116 (9.0%) | 2.32 |
| Single Female/Mother | 430 (33.4%) | 3.16 |
| Total Families | 1,289 (100.0%) | 2.75 |
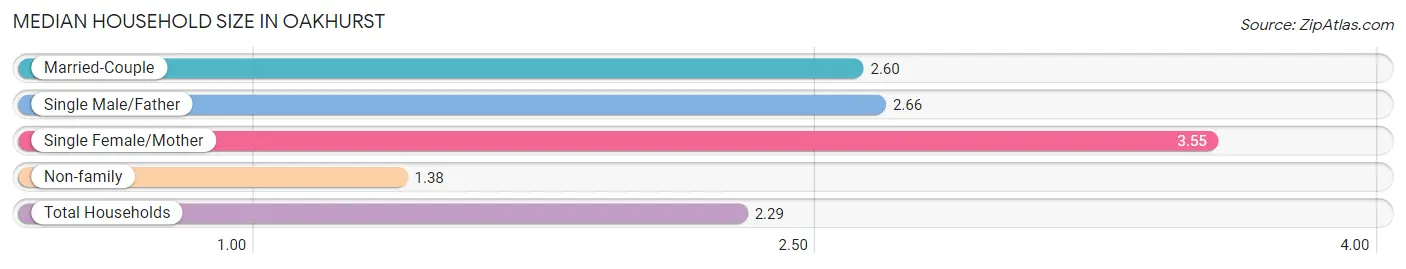
Median Household Size in Oakhurst
The median household size in Oakhurst is 2.29 persons per household, with single female/mother households (430 | 19.7%) accounting for the largest median household size of 3.55 persons per household. non-family households (891 | 40.9%) represent the smallest median household size with 1.38 persons per household.
| Household Type | # Households | Household Size |
| Married-Couple | 743 (34.1%) | 2.60 |
| Single Male/Father | 116 (5.3%) | 2.66 |
| Single Female/Mother | 430 (19.7%) | 3.55 |
| Non-family | 891 (40.9%) | 1.38 |
| Total Households | 2,180 (100.0%) | 2.29 |
Household Size by Marriage Status in Oakhurst
Out of a total of 2,180 households in Oakhurst, 1,289 (59.1%) are family households, while 891 (40.9%) are nonfamily households. The most numerous type of family households are 2-person households, comprising 729, and the most common type of nonfamily households are 1-person households, comprising 587.
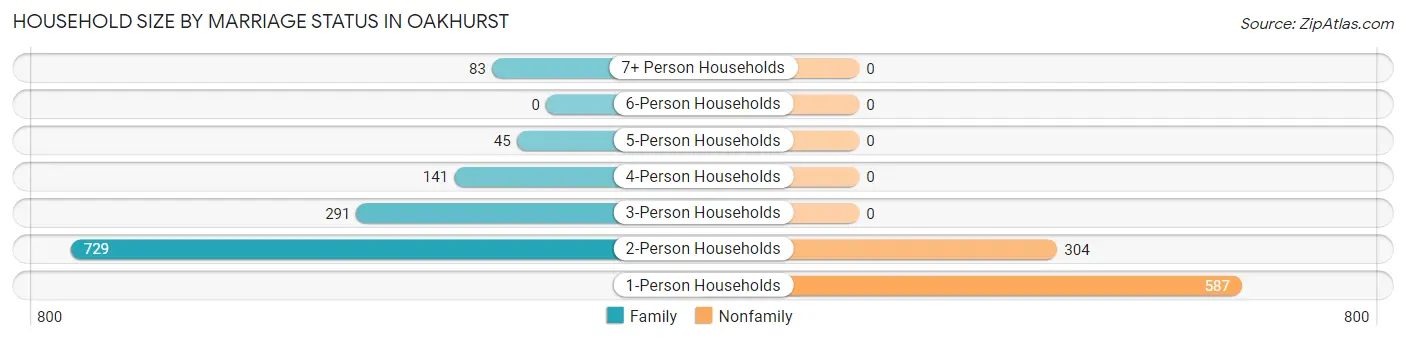
| Household Size | Family Households | Nonfamily Households |
| 1-Person Households | - | 587 (26.9%) |
| 2-Person Households | 729 (33.4%) | 304 (13.9%) |
| 3-Person Households | 291 (13.4%) | 0 (0.0%) |
| 4-Person Households | 141 (6.5%) | 0 (0.0%) |
| 5-Person Households | 45 (2.1%) | 0 (0.0%) |
| 6-Person Households | 0 (0.0%) | 0 (0.0%) |
| 7+ Person Households | 83 (3.8%) | 0 (0.0%) |
| Total | 1,289 (59.1%) | 891 (40.9%) |
Female Fertility in Oakhurst
Fertility by Age in Oakhurst
| Age Bracket | Women with Births | Births / 1,000 Women |
| 15 to 19 years | 0 (0.0%) | 0.0 |
| 20 to 34 years | 0 (0.0%) | 0.0 |
| 35 to 50 years | 0 (0.0%) | 0.0 |
| Total | 0 (0.0%) | 0.0 |
Fertility by Age by Marriage Status in Oakhurst
| Age Bracket | Married | Unmarried |
| 15 to 19 years | 0 (0.0%) | 0 (0.0%) |
| 20 to 34 years | 0 (0.0%) | 0 (0.0%) |
| 35 to 50 years | 0 (0.0%) | 0 (0.0%) |
| Total | 0 (0.0%) | 0 (0.0%) |
Fertility by Education in Oakhurst
| Educational Attainment | Women with Births | Births / 1,000 Women |
| Less than High School | 0 (0.0%) | 0.0 |
| High School Diploma | 0 (0.0%) | 0.0 |
| College or Associate's Degree | 0 (0.0%) | 0.0 |
| Bachelor's Degree | 0 (0.0%) | 0.0 |
| Graduate Degree | 0 (0.0%) | 0.0 |
| Total | 0 (0.0%) | 0.0 |
Fertility by Education by Marriage Status in Oakhurst
| Educational Attainment | Married | Unmarried |
| Less than High School | 0 (0.0%) | 0 (0.0%) |
| High School Diploma | 0 (0.0%) | 0 (0.0%) |
| College or Associate's Degree | 0 (0.0%) | 0 (0.0%) |
| Bachelor's Degree | 0 (0.0%) | 0 (0.0%) |
| Graduate Degree | 0 (0.0%) | 0 (0.0%) |
| Total | 0 (0.0%) | 0 (0.0%) |
Employment Characteristics in Oakhurst
Employment by Class of Employer in Oakhurst
Among the 2,198 employed individuals in Oakhurst, private company employees (1,296 | 59.0%), local government employees (269 | 12.2%), and not-for-profit organizations (189 | 8.6%) make up the most common classes of employment.
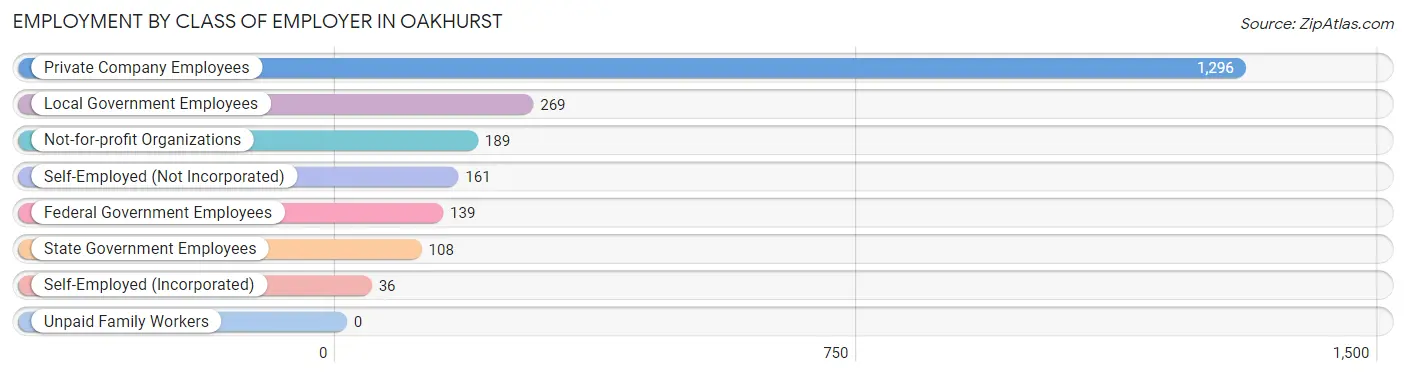
| Employer Class | # Employees | % Employees |
| Private Company Employees | 1,296 | 59.0% |
| Self-Employed (Incorporated) | 36 | 1.6% |
| Self-Employed (Not Incorporated) | 161 | 7.3% |
| Not-for-profit Organizations | 189 | 8.6% |
| Local Government Employees | 269 | 12.2% |
| State Government Employees | 108 | 4.9% |
| Federal Government Employees | 139 | 6.3% |
| Unpaid Family Workers | 0 | 0.0% |
| Total | 2,198 | 100.0% |
Employment Status by Age in Oakhurst
According to the labor force statistics for Oakhurst, out of the total population over 16 years of age (4,231), 57.9% or 2,450 individuals are in the labor force, with 8.0% or 196 of them unemployed. The age group with the highest labor force participation rate is 25 to 29 years, with 100.0% or 135 individuals in the labor force. Within the labor force, the 16 to 19 years age range has the highest percentage of unemployed individuals, with 88.9% or 24 of them being unemployed.
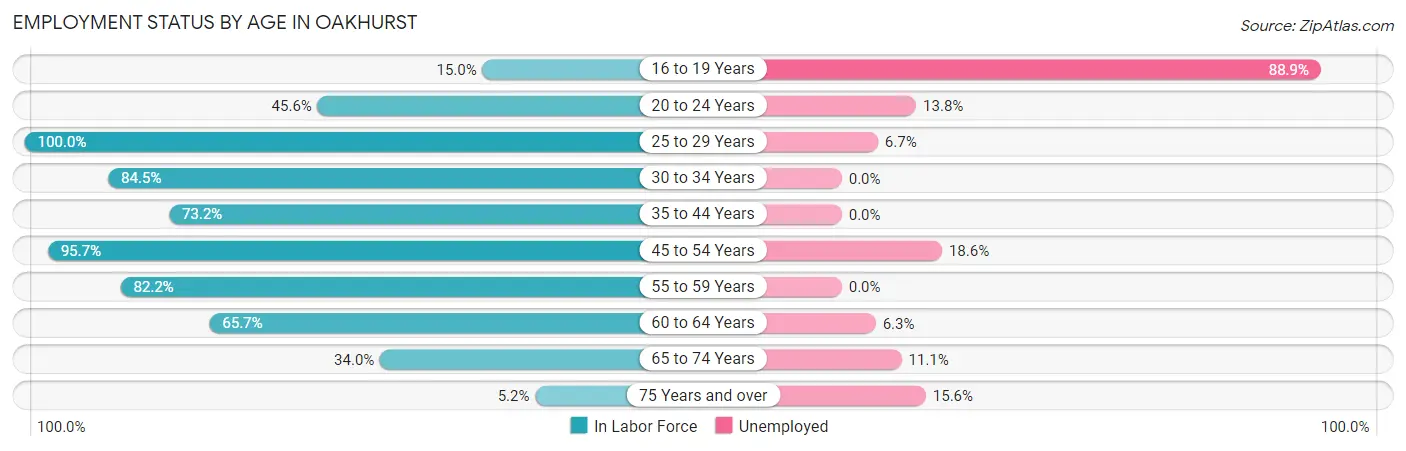
| Age Bracket | In Labor Force | Unemployed |
| 16 to 19 Years | 27 (15.0%) | 24 (88.9%) |
| 20 to 24 Years | 109 (45.6%) | 15 (13.8%) |
| 25 to 29 Years | 135 (100.0%) | 9 (6.7%) |
| 30 to 34 Years | 288 (84.5%) | 0 (0.0%) |
| 35 to 44 Years | 495 (73.2%) | 0 (0.0%) |
| 45 to 54 Years | 532 (95.7%) | 99 (18.6%) |
| 55 to 59 Years | 319 (82.2%) | 0 (0.0%) |
| 60 to 64 Years | 286 (65.7%) | 18 (6.3%) |
| 65 to 74 Years | 226 (34.0%) | 25 (11.1%) |
| 75 Years and over | 32 (5.2%) | 5 (15.6%) |
| Total | 2,450 (57.9%) | 196 (8.0%) |
Employment Status by Educational Attainment in Oakhurst
According to labor force statistics for Oakhurst, 81.2% of individuals (2,055) out of the total population between 25 and 64 years of age (2,531) are in the labor force, with 6.1% or 125 of them being unemployed. The group with the highest labor force participation rate are those with the educational attainment of bachelor's degree or higher, with 90.1% or 611 individuals in the labor force. Within the labor force, individuals with high school diploma education have the highest percentage of unemployment, with 19.0% or 61 of them being unemployed.
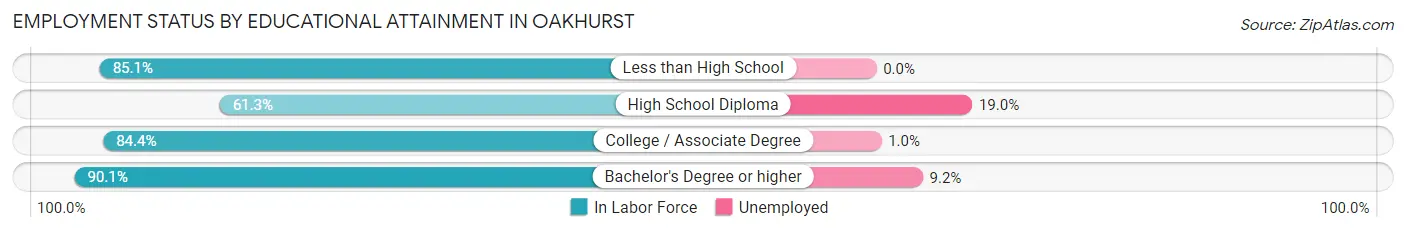
| Educational Attainment | In Labor Force | Unemployed |
| Less than High School | 212 (85.1%) | 0 (0.0%) |
| High School Diploma | 321 (61.3%) | 100 (19.0%) |
| College / Associate Degree | 912 (84.4%) | 11 (1.0%) |
| Bachelor's Degree or higher | 611 (90.1%) | 62 (9.2%) |
| Total | 2,055 (81.2%) | 154 (6.1%) |
Employment Occupations by Sex in Oakhurst
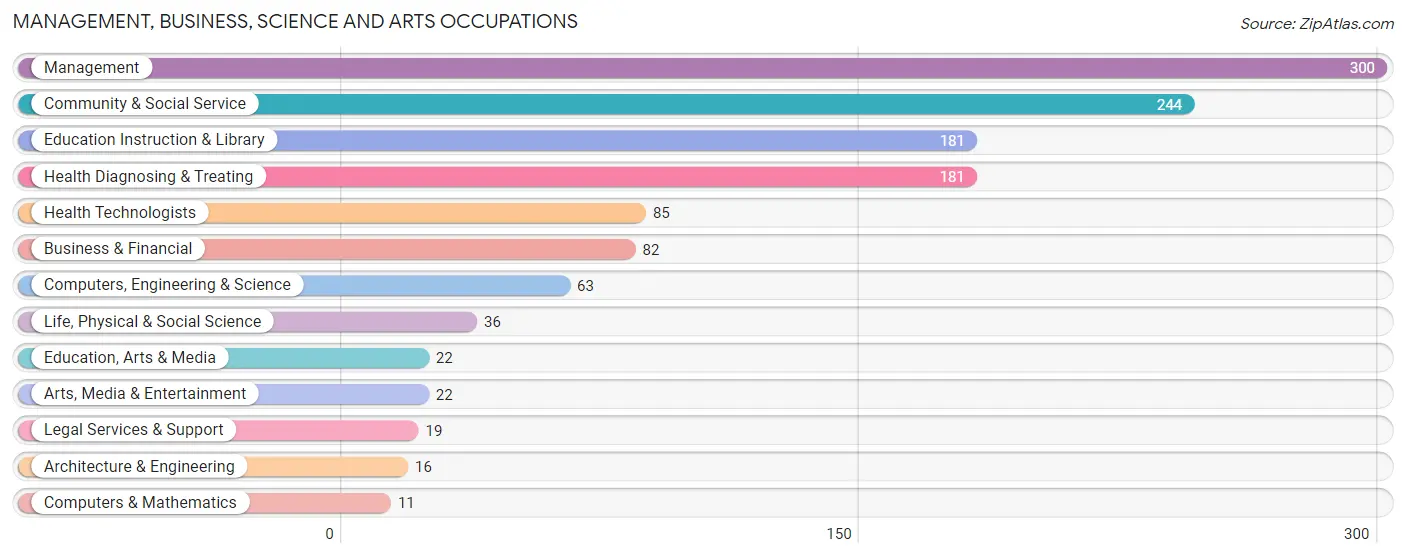
Management, Business, Science and Arts Occupations
The most common Management, Business, Science and Arts occupations in Oakhurst are Management (300 | 13.3%), Community & Social Service (244 | 10.8%), Education Instruction & Library (181 | 8.0%), Health Diagnosing & Treating (181 | 8.0%), and Health Technologists (85 | 3.8%).
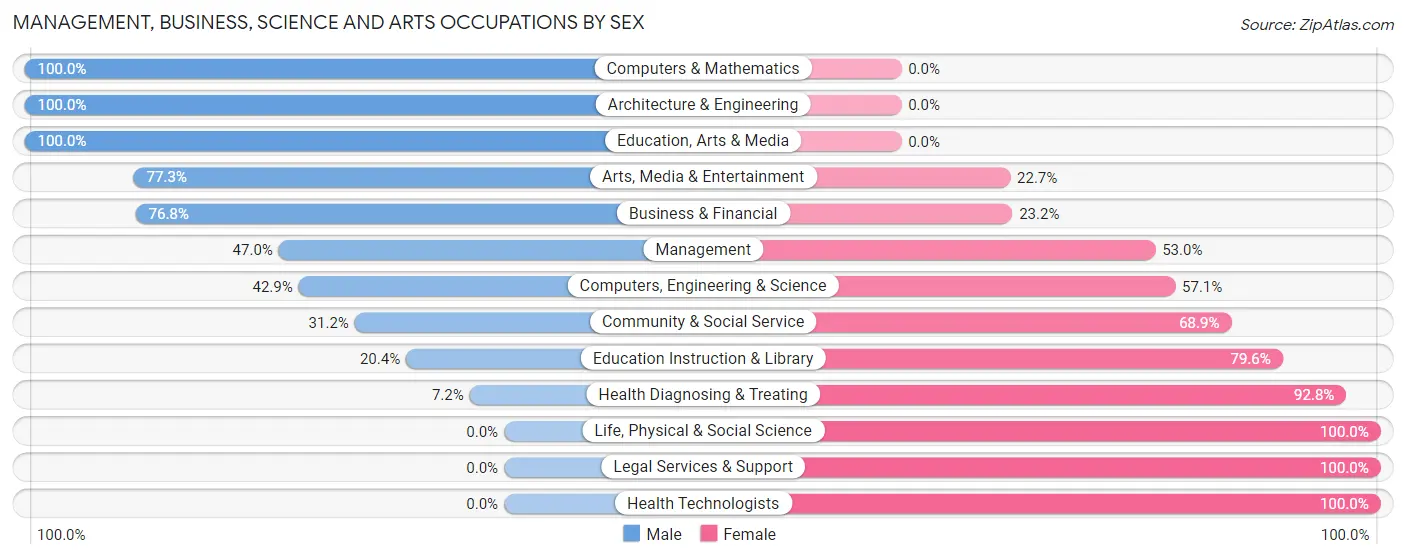
Management, Business, Science and Arts Occupations by Sex
Within the Management, Business, Science and Arts occupations in Oakhurst, the most male-oriented occupations are Computers & Mathematics (100.0%), Architecture & Engineering (100.0%), and Education, Arts & Media (100.0%), while the most female-oriented occupations are Life, Physical & Social Science (100.0%), Legal Services & Support (100.0%), and Health Technologists (100.0%).
| Occupation | Male | Female |
| Management | 141 (47.0%) | 159 (53.0%) |
| Business & Financial | 63 (76.8%) | 19 (23.2%) |
| Computers, Engineering & Science | 27 (42.9%) | 36 (57.1%) |
| Computers & Mathematics | 11 (100.0%) | 0 (0.0%) |
| Architecture & Engineering | 16 (100.0%) | 0 (0.0%) |
| Life, Physical & Social Science | 0 (0.0%) | 36 (100.0%) |
| Community & Social Service | 76 (31.1%) | 168 (68.9%) |
| Education, Arts & Media | 22 (100.0%) | 0 (0.0%) |
| Legal Services & Support | 0 (0.0%) | 19 (100.0%) |
| Education Instruction & Library | 37 (20.4%) | 144 (79.6%) |
| Arts, Media & Entertainment | 17 (77.3%) | 5 (22.7%) |
| Health Diagnosing & Treating | 13 (7.2%) | 168 (92.8%) |
| Health Technologists | 0 (0.0%) | 85 (100.0%) |
| Total (Category) | 320 (36.8%) | 550 (63.2%) |
| Total (Overall) | 1,037 (46.0%) | 1,217 (54.0%) |
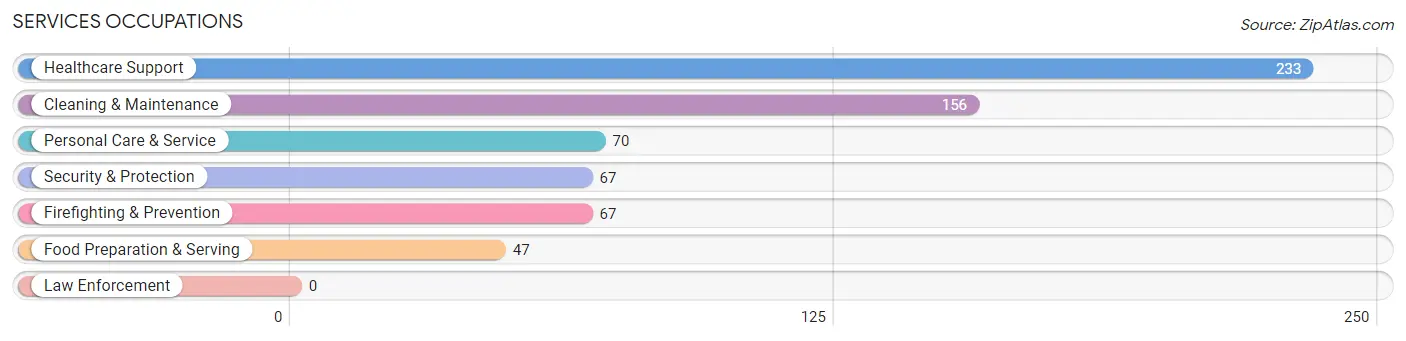
Services Occupations
The most common Services occupations in Oakhurst are Healthcare Support (233 | 10.3%), Cleaning & Maintenance (156 | 6.9%), Personal Care & Service (70 | 3.1%), Security & Protection (67 | 3.0%), and Firefighting & Prevention (67 | 3.0%).
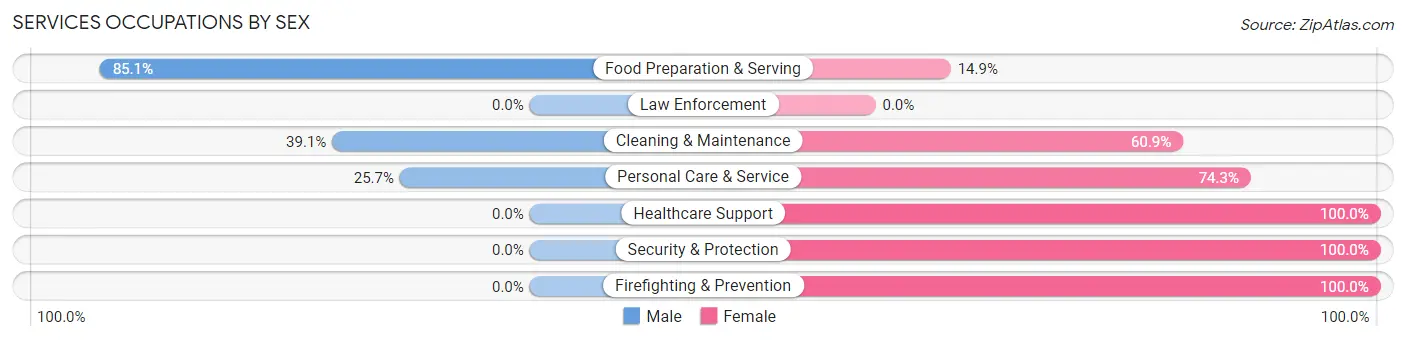
Services Occupations by Sex
Within the Services occupations in Oakhurst, the most male-oriented occupations are Food Preparation & Serving (85.1%), Cleaning & Maintenance (39.1%), and Personal Care & Service (25.7%), while the most female-oriented occupations are Healthcare Support (100.0%), Security & Protection (100.0%), and Firefighting & Prevention (100.0%).
| Occupation | Male | Female |
| Healthcare Support | 0 (0.0%) | 233 (100.0%) |
| Security & Protection | 0 (0.0%) | 67 (100.0%) |
| Firefighting & Prevention | 0 (0.0%) | 67 (100.0%) |
| Law Enforcement | 0 (0.0%) | 0 (0.0%) |
| Food Preparation & Serving | 40 (85.1%) | 7 (14.9%) |
| Cleaning & Maintenance | 61 (39.1%) | 95 (60.9%) |
| Personal Care & Service | 18 (25.7%) | 52 (74.3%) |
| Total (Category) | 119 (20.8%) | 454 (79.2%) |
| Total (Overall) | 1,037 (46.0%) | 1,217 (54.0%) |
Sales and Office Occupations
The most common Sales and Office occupations in Oakhurst are Office & Administration (187 | 8.3%), and Sales & Related (110 | 4.9%).
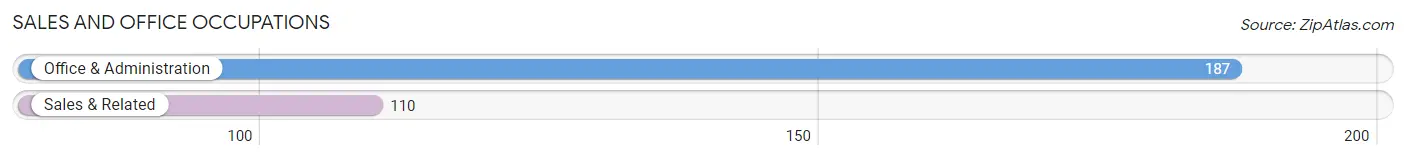
Sales and Office Occupations by Sex
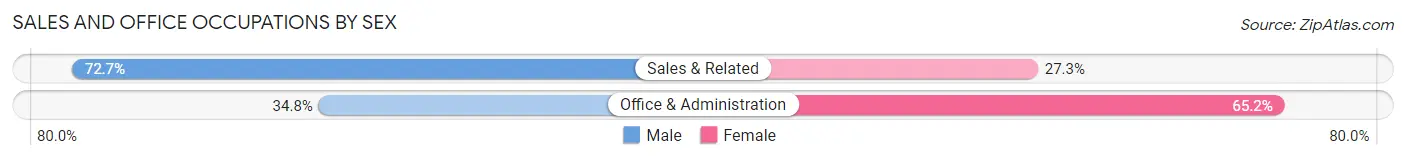
| Occupation | Male | Female |
| Sales & Related | 80 (72.7%) | 30 (27.3%) |
| Office & Administration | 65 (34.8%) | 122 (65.2%) |
| Total (Category) | 145 (48.8%) | 152 (51.2%) |
| Total (Overall) | 1,037 (46.0%) | 1,217 (54.0%) |
Natural Resources, Construction and Maintenance Occupations
The most common Natural Resources, Construction and Maintenance occupations in Oakhurst are Construction & Extraction (239 | 10.6%), and Installation, Maintenance & Repair (47 | 2.1%).
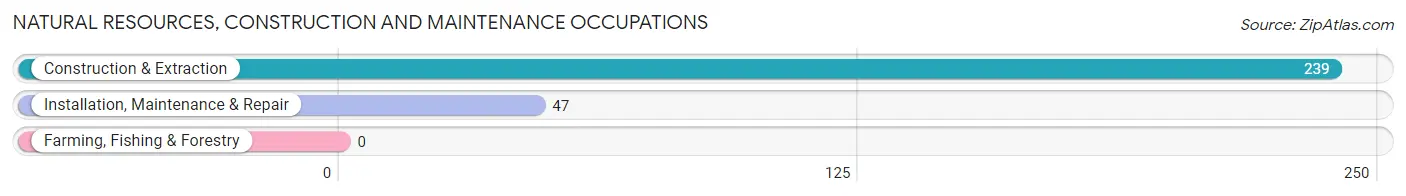
Natural Resources, Construction and Maintenance Occupations by Sex
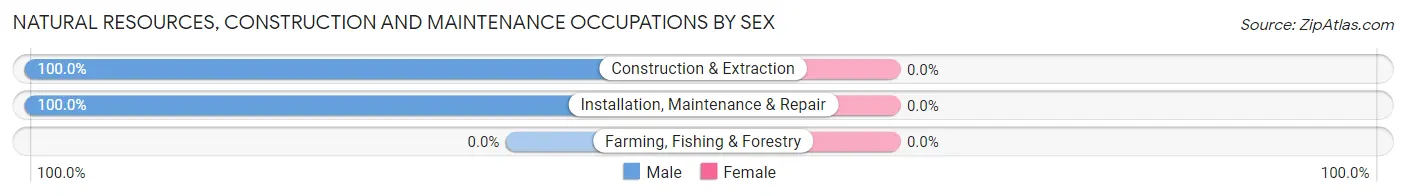
| Occupation | Male | Female |
| Farming, Fishing & Forestry | 0 (0.0%) | 0 (0.0%) |
| Construction & Extraction | 239 (100.0%) | 0 (0.0%) |
| Installation, Maintenance & Repair | 47 (100.0%) | 0 (0.0%) |
| Total (Category) | 286 (100.0%) | 0 (0.0%) |
| Total (Overall) | 1,037 (46.0%) | 1,217 (54.0%) |
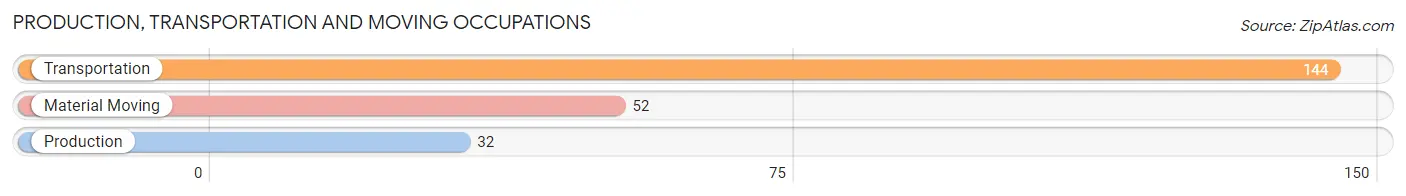
Production, Transportation and Moving Occupations
The most common Production, Transportation and Moving occupations in Oakhurst are Transportation (144 | 6.4%), Material Moving (52 | 2.3%), and Production (32 | 1.4%).
Production, Transportation and Moving Occupations by Sex
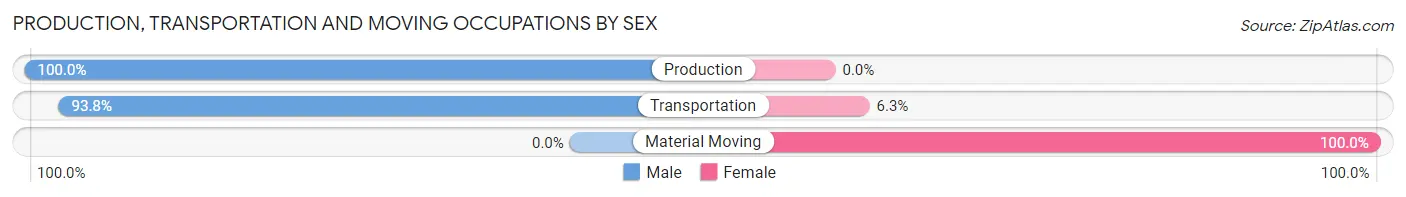
| Occupation | Male | Female |
| Production | 32 (100.0%) | 0 (0.0%) |
| Transportation | 135 (93.8%) | 9 (6.2%) |
| Material Moving | 0 (0.0%) | 52 (100.0%) |
| Total (Category) | 167 (73.3%) | 61 (26.8%) |
| Total (Overall) | 1,037 (46.0%) | 1,217 (54.0%) |
Employment Industries by Sex in Oakhurst
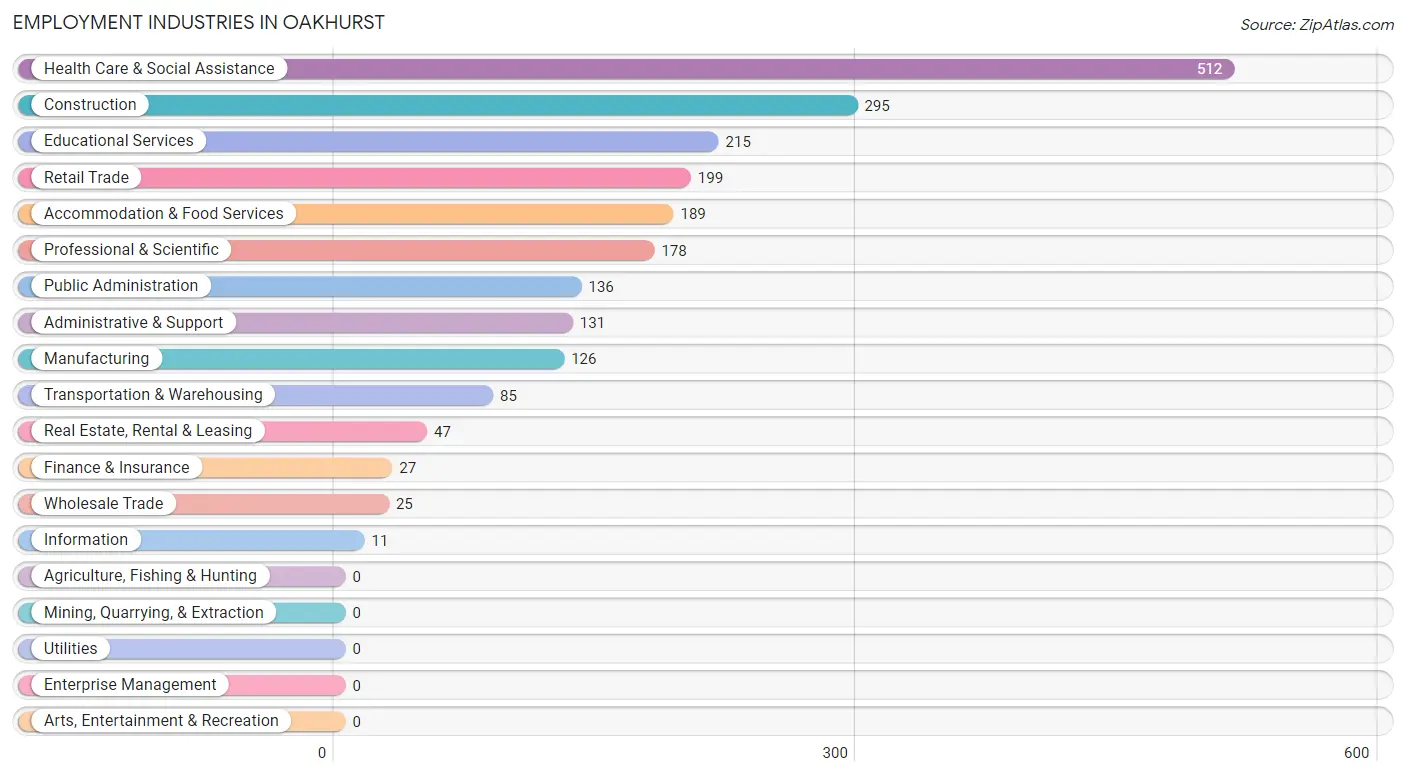
Employment Industries in Oakhurst
The major employment industries in Oakhurst include Health Care & Social Assistance (512 | 22.7%), Construction (295 | 13.1%), Educational Services (215 | 9.5%), Retail Trade (199 | 8.8%), and Accommodation & Food Services (189 | 8.4%).
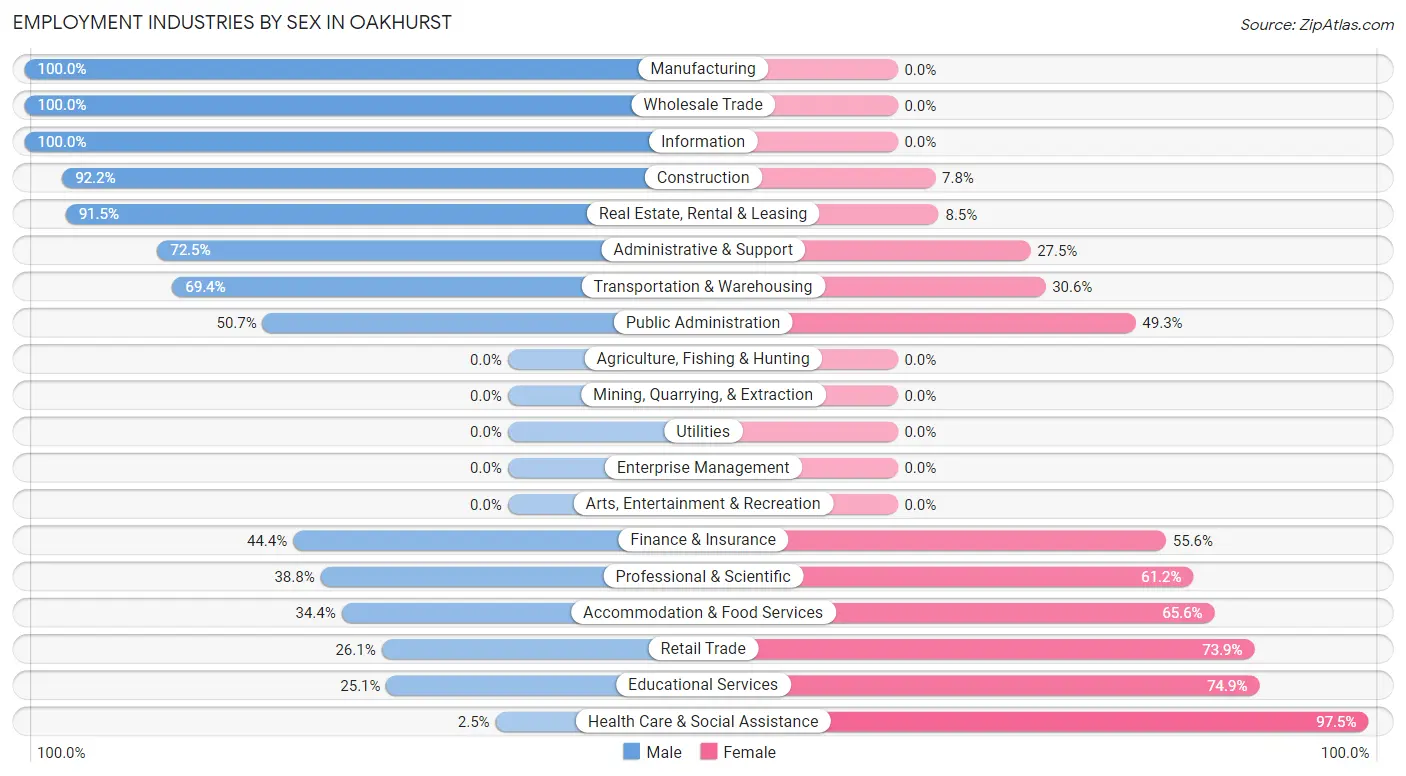
Employment Industries by Sex in Oakhurst
The Oakhurst industries that see more men than women are Manufacturing (100.0%), Wholesale Trade (100.0%), and Information (100.0%), whereas the industries that tend to have a higher number of women are Health Care & Social Assistance (97.5%), Educational Services (74.9%), and Retail Trade (73.9%).
| Industry | Male | Female |
| Agriculture, Fishing & Hunting | 0 (0.0%) | 0 (0.0%) |
| Mining, Quarrying, & Extraction | 0 (0.0%) | 0 (0.0%) |
| Construction | 272 (92.2%) | 23 (7.8%) |
| Manufacturing | 126 (100.0%) | 0 (0.0%) |
| Wholesale Trade | 25 (100.0%) | 0 (0.0%) |
| Retail Trade | 52 (26.1%) | 147 (73.9%) |
| Transportation & Warehousing | 59 (69.4%) | 26 (30.6%) |
| Utilities | 0 (0.0%) | 0 (0.0%) |
| Information | 11 (100.0%) | 0 (0.0%) |
| Finance & Insurance | 12 (44.4%) | 15 (55.6%) |
| Real Estate, Rental & Leasing | 43 (91.5%) | 4 (8.5%) |
| Professional & Scientific | 69 (38.8%) | 109 (61.2%) |
| Enterprise Management | 0 (0.0%) | 0 (0.0%) |
| Administrative & Support | 95 (72.5%) | 36 (27.5%) |
| Educational Services | 54 (25.1%) | 161 (74.9%) |
| Health Care & Social Assistance | 13 (2.5%) | 499 (97.5%) |
| Arts, Entertainment & Recreation | 0 (0.0%) | 0 (0.0%) |
| Accommodation & Food Services | 65 (34.4%) | 124 (65.6%) |
| Public Administration | 69 (50.7%) | 67 (49.3%) |
| Total | 1,037 (46.0%) | 1,217 (54.0%) |
Education in Oakhurst
School Enrollment in Oakhurst
The most common levels of schooling among the 1,178 students in Oakhurst are middle school (307 | 26.1%), college / undergraduate (261 | 22.2%), and high school (244 | 20.7%).
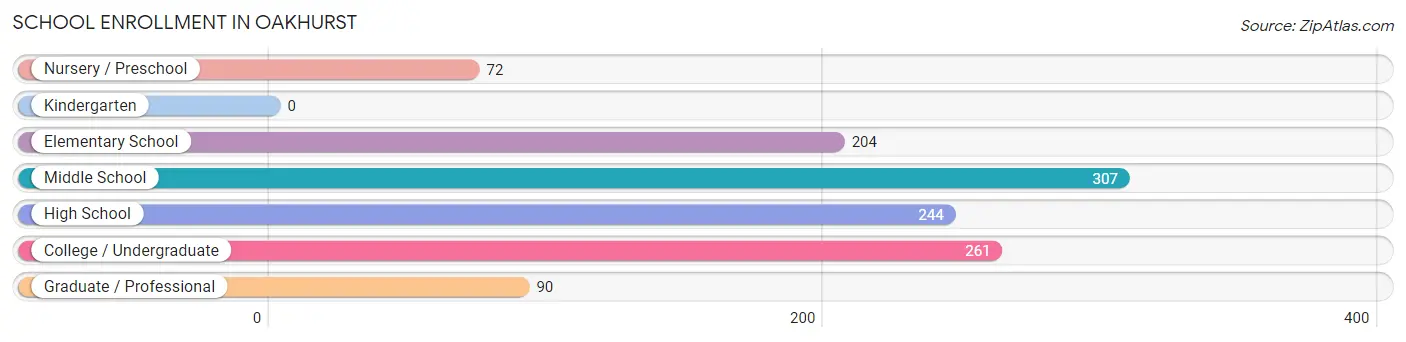
| School Level | # Students | % Students |
| Nursery / Preschool | 72 | 6.1% |
| Kindergarten | 0 | 0.0% |
| Elementary School | 204 | 17.3% |
| Middle School | 307 | 26.1% |
| High School | 244 | 20.7% |
| College / Undergraduate | 261 | 22.2% |
| Graduate / Professional | 90 | 7.6% |
| Total | 1,178 | 100.0% |
School Enrollment by Age by Funding Source in Oakhurst
Out of a total of 1,178 students who are enrolled in schools in Oakhurst, 355 (30.1%) attend a private institution, while the remaining 823 (69.9%) are enrolled in public schools. The age group of 5 to 9 year old has the highest likelihood of being enrolled in private schools, with 134 (91.8% in the age bracket) enrolled. Conversely, the age group of 3 to 4 year olds has the lowest likelihood of being enrolled in a private school, with 72 (100.0% in the age bracket) attending a public institution.
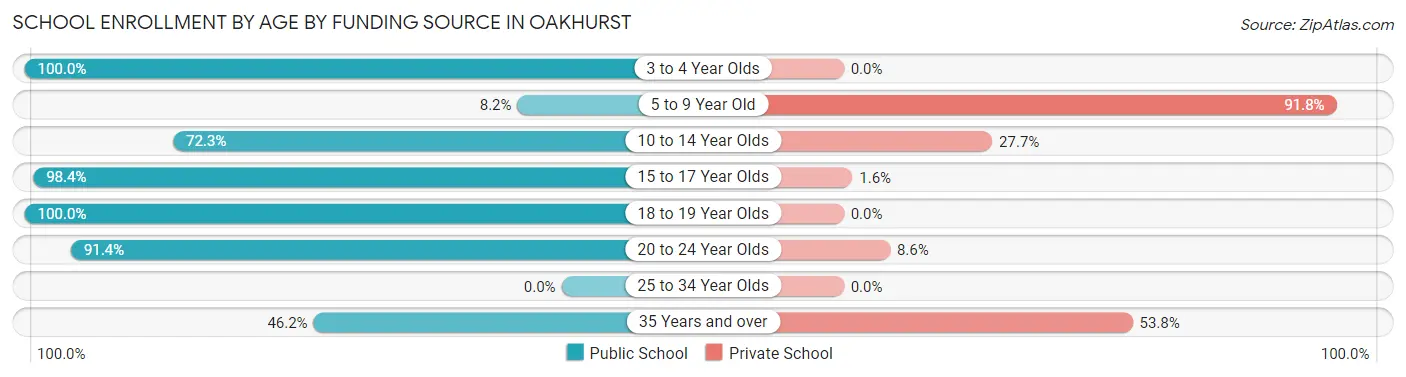
| Age Bracket | Public School | Private School |
| 3 to 4 Year Olds | 72 (100.0%) | 0 (0.0%) |
| 5 to 9 Year Old | 12 (8.2%) | 134 (91.8%) |
| 10 to 14 Year Olds | 306 (72.3%) | 117 (27.7%) |
| 15 to 17 Year Olds | 183 (98.4%) | 3 (1.6%) |
| 18 to 19 Year Olds | 19 (100.0%) | 0 (0.0%) |
| 20 to 24 Year Olds | 159 (91.4%) | 15 (8.6%) |
| 25 to 34 Year Olds | 0 (0.0%) | 0 (0.0%) |
| 35 Years and over | 73 (46.2%) | 85 (53.8%) |
| Total | 823 (69.9%) | 355 (30.1%) |
Educational Attainment by Field of Study in Oakhurst
Business (223 | 17.8%), bio, nature & agricultural (172 | 13.8%), liberal arts & history (158 | 12.7%), education (126 | 10.1%), and communications (112 | 9.0%) are the most common fields of study among 1,249 individuals in Oakhurst who have obtained a bachelor's degree or higher.
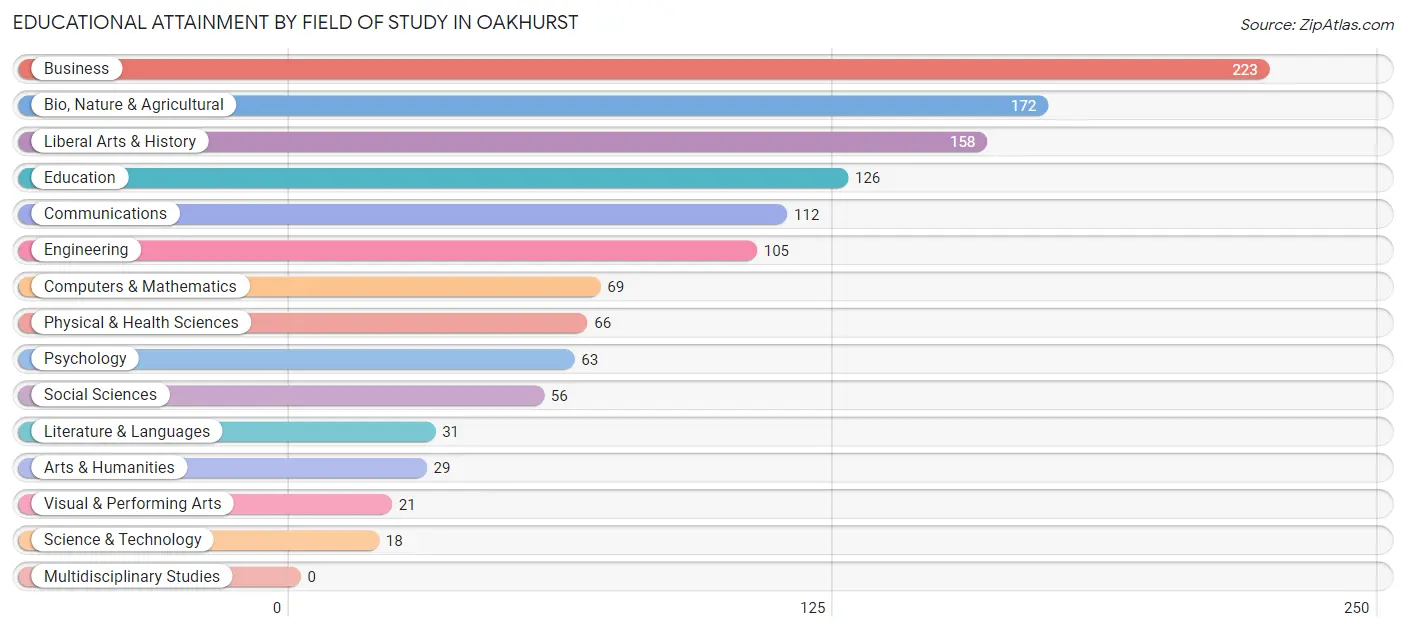
| Field of Study | # Graduates | % Graduates |
| Computers & Mathematics | 69 | 5.5% |
| Bio, Nature & Agricultural | 172 | 13.8% |
| Physical & Health Sciences | 66 | 5.3% |
| Psychology | 63 | 5.0% |
| Social Sciences | 56 | 4.5% |
| Engineering | 105 | 8.4% |
| Multidisciplinary Studies | 0 | 0.0% |
| Science & Technology | 18 | 1.4% |
| Business | 223 | 17.8% |
| Education | 126 | 10.1% |
| Literature & Languages | 31 | 2.5% |
| Liberal Arts & History | 158 | 12.7% |
| Visual & Performing Arts | 21 | 1.7% |
| Communications | 112 | 9.0% |
| Arts & Humanities | 29 | 2.3% |
| Total | 1,249 | 100.0% |
Transportation & Commute in Oakhurst
Vehicle Availability by Sex in Oakhurst
The most prevalent vehicle ownership categories in Oakhurst are males with 2 vehicles (369, accounting for 35.6%) and females with 2 vehicles (458, making up 31.8%).
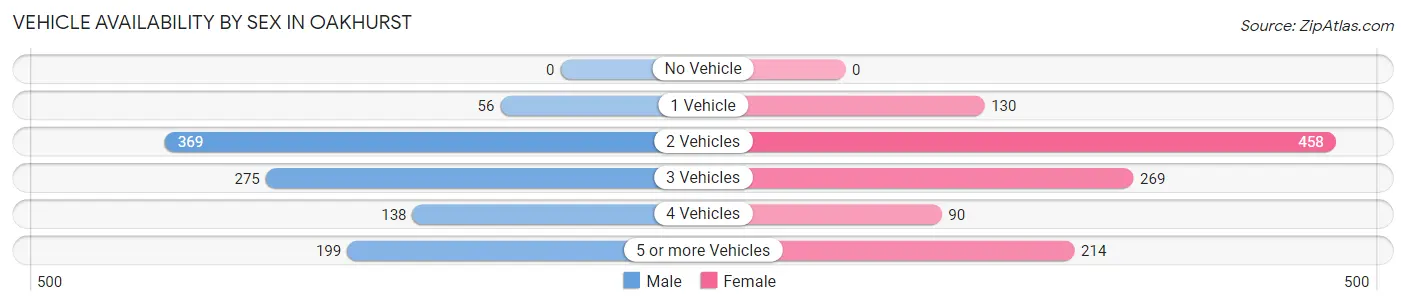
| Vehicles Available | Male | Female |
| No Vehicle | 0 (0.0%) | 0 (0.0%) |
| 1 Vehicle | 56 (5.4%) | 130 (11.2%) |
| 2 Vehicles | 369 (35.6%) | 458 (39.5%) |
| 3 Vehicles | 275 (26.5%) | 269 (23.2%) |
| 4 Vehicles | 138 (13.3%) | 90 (7.7%) |
| 5 or more Vehicles | 199 (19.2%) | 214 (18.4%) |
| Total | 1,037 (100.0%) | 1,161 (100.0%) |
Commute Time in Oakhurst
The most frequently occuring commute durations in Oakhurst are 10 to 14 minutes (422 commuters, 23.7%), 45 to 59 minutes (390 commuters, 21.9%), and 5 to 9 minutes (283 commuters, 15.9%).
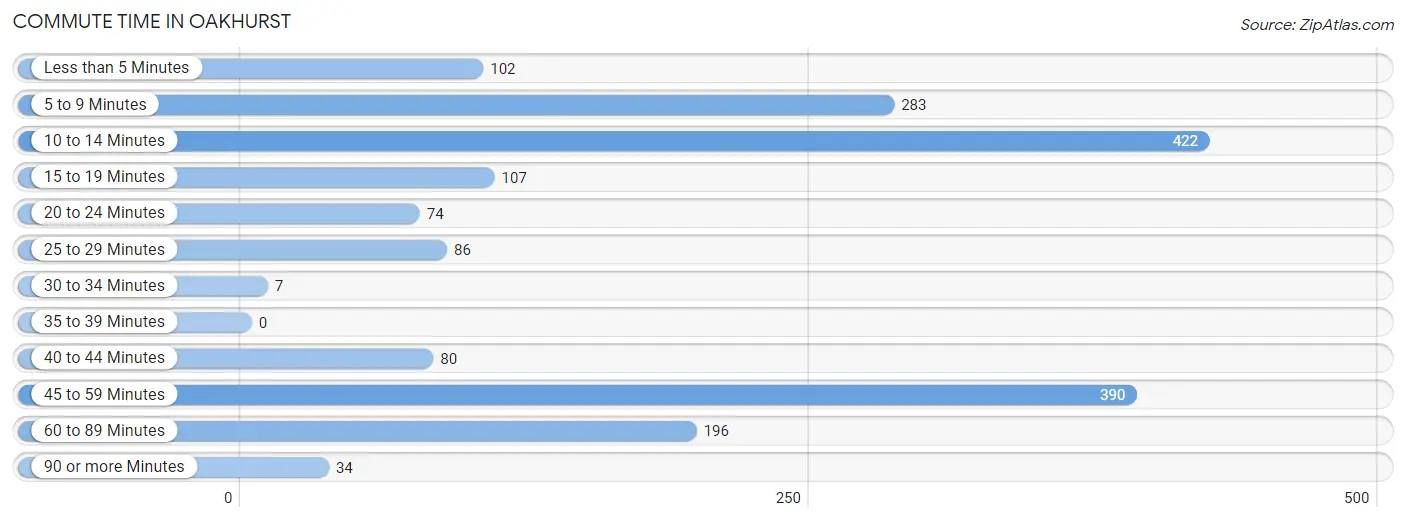
| Commute Time | # Commuters | % Commuters |
| Less than 5 Minutes | 102 | 5.7% |
| 5 to 9 Minutes | 283 | 15.9% |
| 10 to 14 Minutes | 422 | 23.7% |
| 15 to 19 Minutes | 107 | 6.0% |
| 20 to 24 Minutes | 74 | 4.2% |
| 25 to 29 Minutes | 86 | 4.8% |
| 30 to 34 Minutes | 7 | 0.4% |
| 35 to 39 Minutes | 0 | 0.0% |
| 40 to 44 Minutes | 80 | 4.5% |
| 45 to 59 Minutes | 390 | 21.9% |
| 60 to 89 Minutes | 196 | 11.0% |
| 90 or more Minutes | 34 | 1.9% |
Commute Time by Sex in Oakhurst
The most common commute times in Oakhurst are 45 to 59 minutes (199 commuters, 24.7%) for males and 10 to 14 minutes (267 commuters, 27.4%) for females.
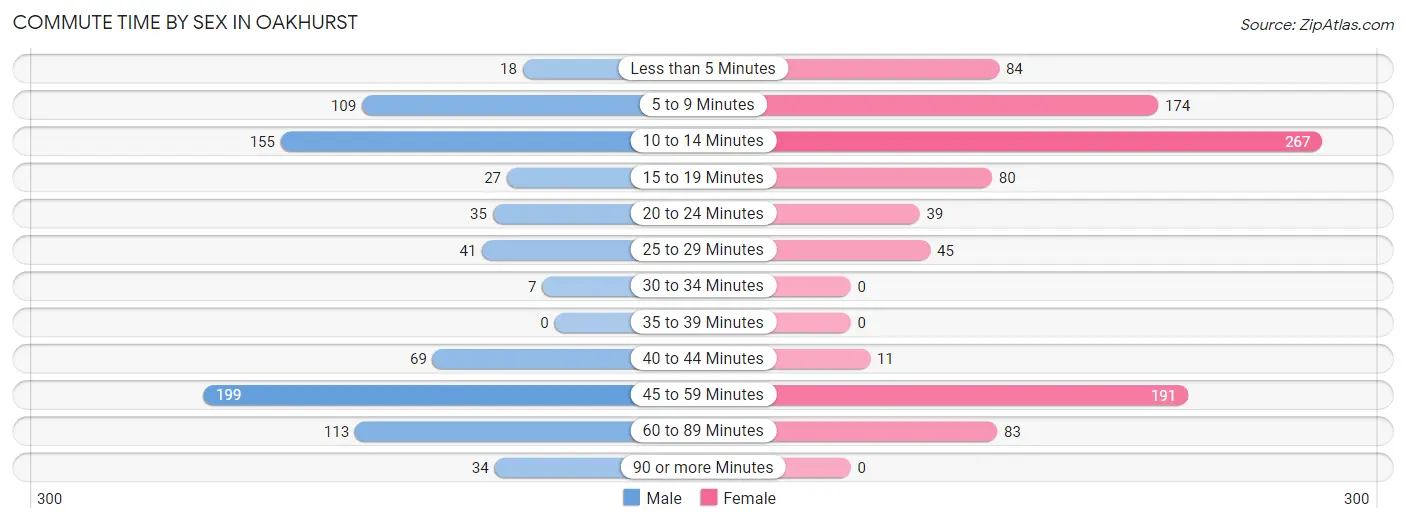
| Commute Time | Male | Female |
| Less than 5 Minutes | 18 (2.2%) | 84 (8.6%) |
| 5 to 9 Minutes | 109 (13.5%) | 174 (17.9%) |
| 10 to 14 Minutes | 155 (19.2%) | 267 (27.4%) |
| 15 to 19 Minutes | 27 (3.4%) | 80 (8.2%) |
| 20 to 24 Minutes | 35 (4.3%) | 39 (4.0%) |
| 25 to 29 Minutes | 41 (5.1%) | 45 (4.6%) |
| 30 to 34 Minutes | 7 (0.9%) | 0 (0.0%) |
| 35 to 39 Minutes | 0 (0.0%) | 0 (0.0%) |
| 40 to 44 Minutes | 69 (8.6%) | 11 (1.1%) |
| 45 to 59 Minutes | 199 (24.7%) | 191 (19.6%) |
| 60 to 89 Minutes | 113 (14.0%) | 83 (8.5%) |
| 90 or more Minutes | 34 (4.2%) | 0 (0.0%) |
Time of Departure to Work by Sex in Oakhurst
The most frequent times of departure to work in Oakhurst are 5:00 AM to 5:29 AM (187, 23.2%) for males and 6:00 AM to 6:29 AM (182, 18.7%) for females.
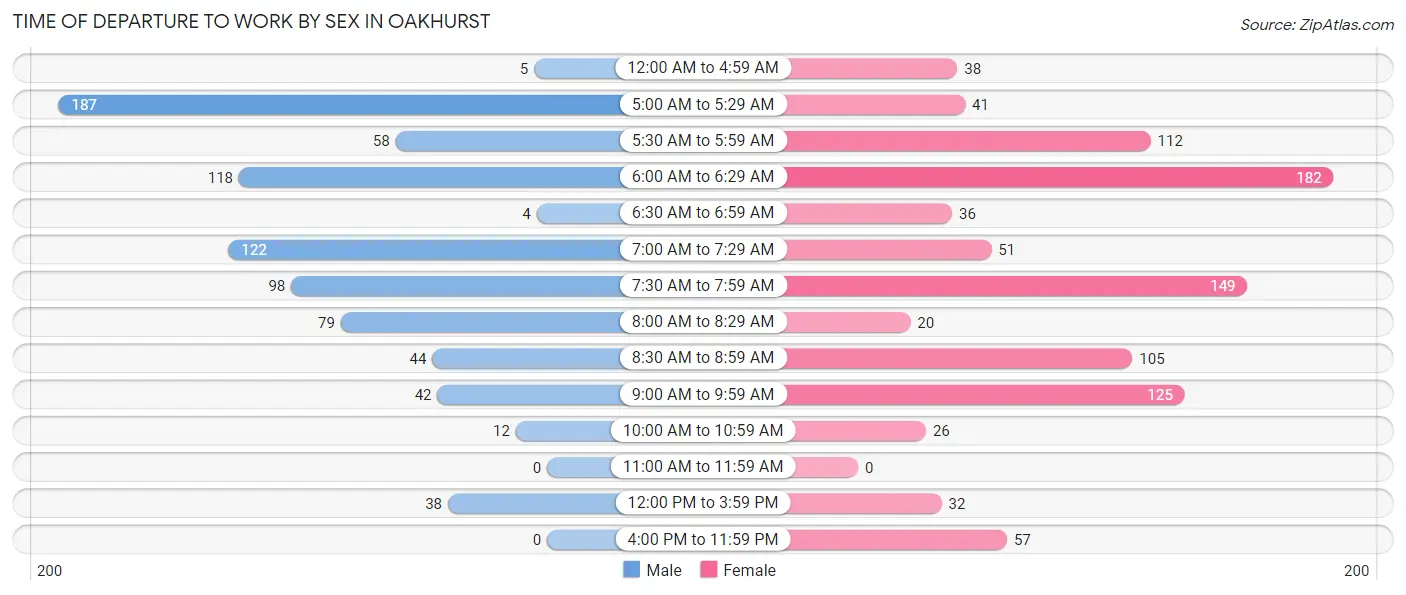
| Time of Departure | Male | Female |
| 12:00 AM to 4:59 AM | 5 (0.6%) | 38 (3.9%) |
| 5:00 AM to 5:29 AM | 187 (23.2%) | 41 (4.2%) |
| 5:30 AM to 5:59 AM | 58 (7.2%) | 112 (11.5%) |
| 6:00 AM to 6:29 AM | 118 (14.6%) | 182 (18.7%) |
| 6:30 AM to 6:59 AM | 4 (0.5%) | 36 (3.7%) |
| 7:00 AM to 7:29 AM | 122 (15.1%) | 51 (5.2%) |
| 7:30 AM to 7:59 AM | 98 (12.1%) | 149 (15.3%) |
| 8:00 AM to 8:29 AM | 79 (9.8%) | 20 (2.1%) |
| 8:30 AM to 8:59 AM | 44 (5.4%) | 105 (10.8%) |
| 9:00 AM to 9:59 AM | 42 (5.2%) | 125 (12.8%) |
| 10:00 AM to 10:59 AM | 12 (1.5%) | 26 (2.7%) |
| 11:00 AM to 11:59 AM | 0 (0.0%) | 0 (0.0%) |
| 12:00 PM to 3:59 PM | 38 (4.7%) | 32 (3.3%) |
| 4:00 PM to 11:59 PM | 0 (0.0%) | 57 (5.9%) |
| Total | 807 (100.0%) | 974 (100.0%) |
Housing Occupancy in Oakhurst
Occupancy by Ownership in Oakhurst
Of the total 2,180 dwellings in Oakhurst, owner-occupied units account for 1,742 (79.9%), while renter-occupied units make up 438 (20.1%).
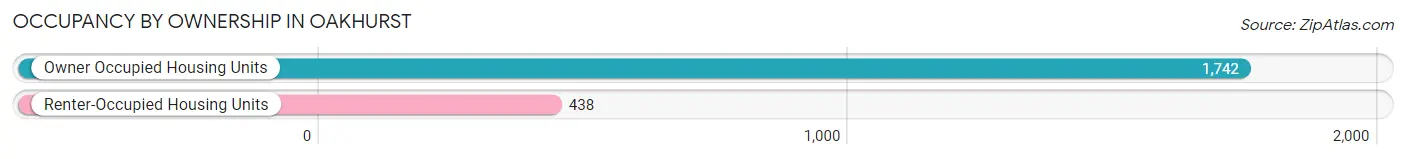
| Occupancy | # Housing Units | % Housing Units |
| Owner Occupied Housing Units | 1,742 | 79.9% |
| Renter-Occupied Housing Units | 438 | 20.1% |
| Total Occupied Housing Units | 2,180 | 100.0% |
Occupancy by Household Size in Oakhurst
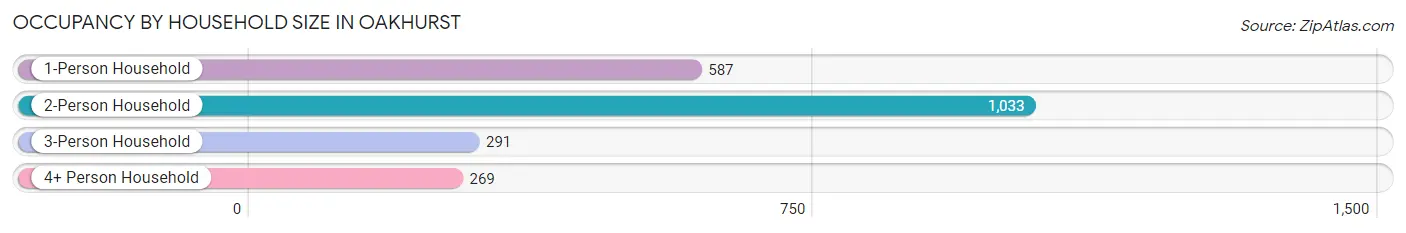
| Household Size | # Housing Units | % Housing Units |
| 1-Person Household | 587 | 26.9% |
| 2-Person Household | 1,033 | 47.4% |
| 3-Person Household | 291 | 13.4% |
| 4+ Person Household | 269 | 12.3% |
| Total Housing Units | 2,180 | 100.0% |
Occupancy by Ownership by Household Size in Oakhurst
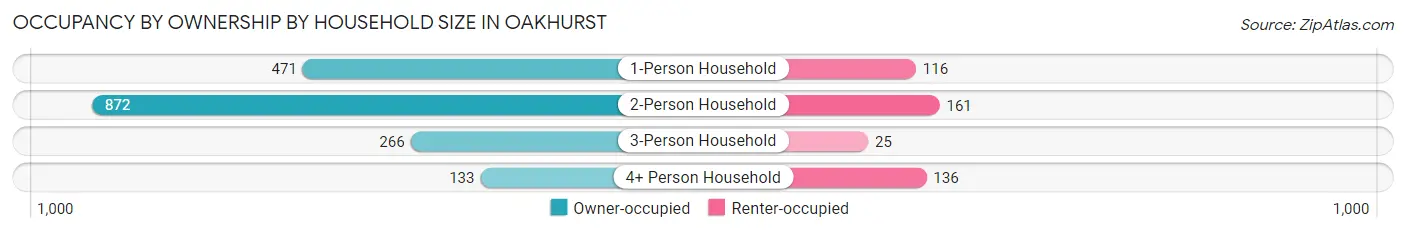
| Household Size | Owner-occupied | Renter-occupied |
| 1-Person Household | 471 (80.2%) | 116 (19.8%) |
| 2-Person Household | 872 (84.4%) | 161 (15.6%) |
| 3-Person Household | 266 (91.4%) | 25 (8.6%) |
| 4+ Person Household | 133 (49.4%) | 136 (50.6%) |
| Total Housing Units | 1,742 (79.9%) | 438 (20.1%) |
Occupancy by Educational Attainment in Oakhurst
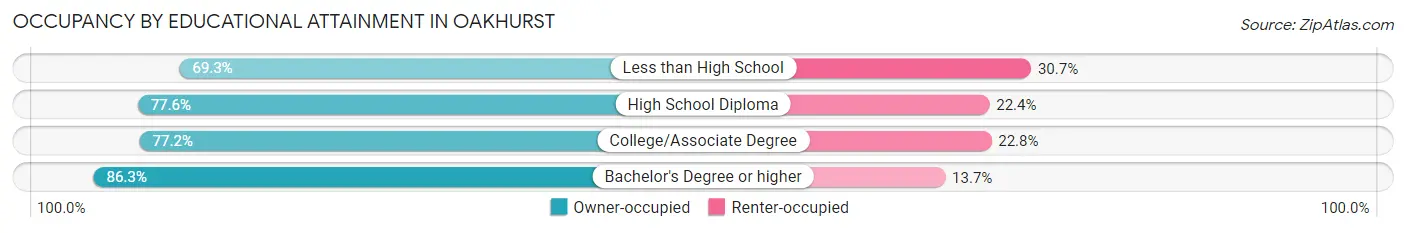
| Household Size | Owner-occupied | Renter-occupied |
| Less than High School | 79 (69.3%) | 35 (30.7%) |
| High School Diploma | 332 (77.6%) | 96 (22.4%) |
| College/Associate Degree | 700 (77.2%) | 207 (22.8%) |
| Bachelor's Degree or higher | 631 (86.3%) | 100 (13.7%) |
Occupancy by Age of Householder in Oakhurst
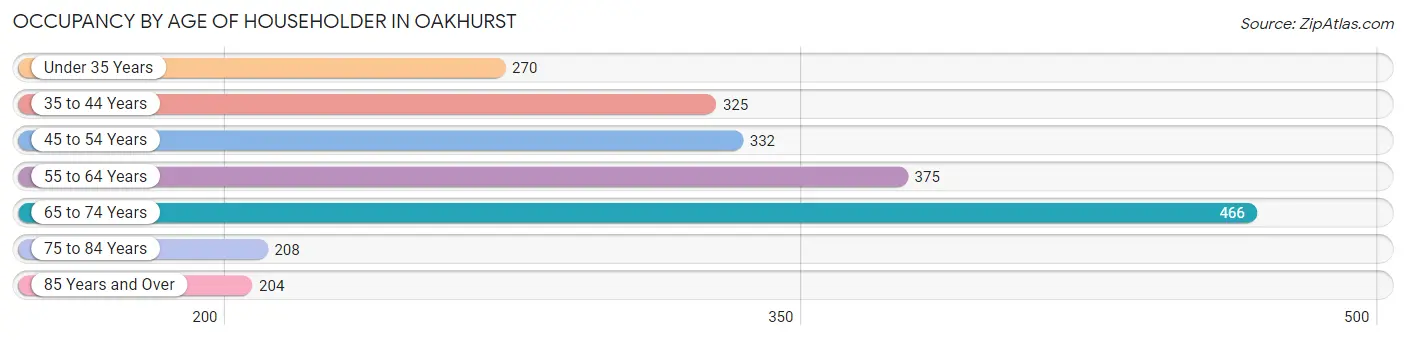
| Age Bracket | # Households | % Households |
| Under 35 Years | 270 | 12.4% |
| 35 to 44 Years | 325 | 14.9% |
| 45 to 54 Years | 332 | 15.2% |
| 55 to 64 Years | 375 | 17.2% |
| 65 to 74 Years | 466 | 21.4% |
| 75 to 84 Years | 208 | 9.5% |
| 85 Years and Over | 204 | 9.4% |
| Total | 2,180 | 100.0% |
Housing Finances in Oakhurst
Median Income by Occupancy in Oakhurst
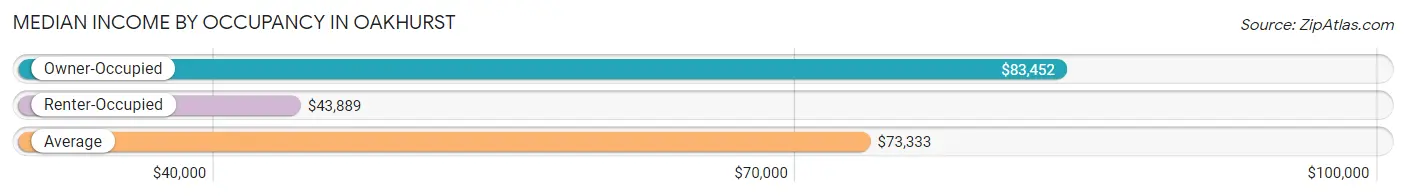
| Occupancy Type | # Households | Median Income |
| Owner-Occupied | 1,742 (79.9%) | $83,452 |
| Renter-Occupied | 438 (20.1%) | $43,889 |
| Average | 2,180 (100.0%) | $73,333 |
Occupancy by Householder Income Bracket in Oakhurst
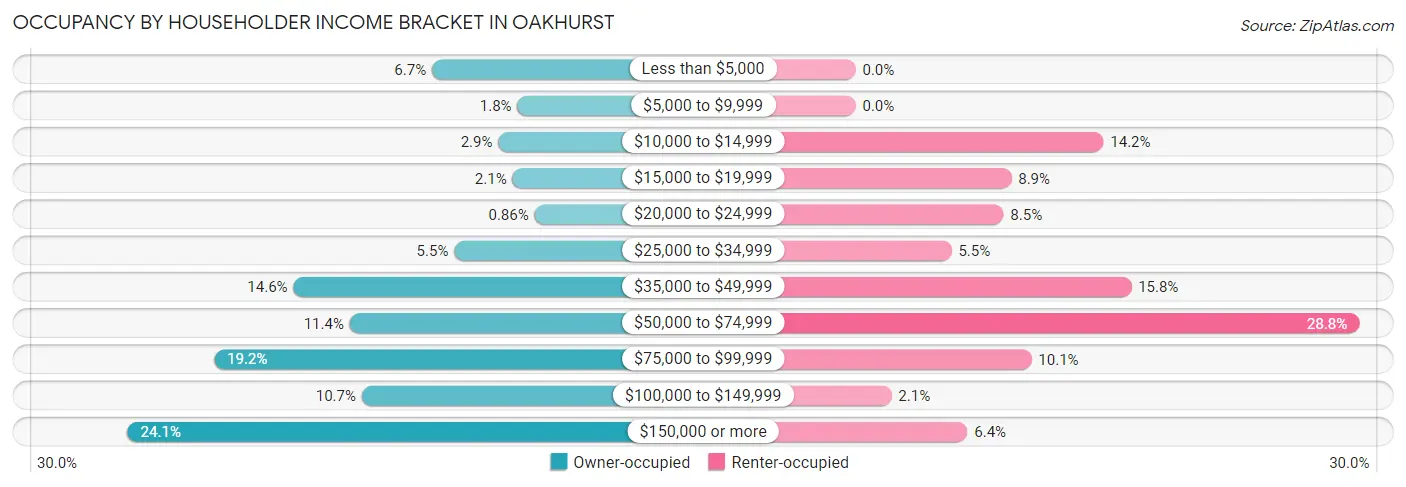
| Income Bracket | Owner-occupied | Renter-occupied |
| Less than $5,000 | 117 (6.7%) | 0 (0.0%) |
| $5,000 to $9,999 | 32 (1.8%) | 0 (0.0%) |
| $10,000 to $14,999 | 51 (2.9%) | 62 (14.2%) |
| $15,000 to $19,999 | 37 (2.1%) | 39 (8.9%) |
| $20,000 to $24,999 | 15 (0.9%) | 37 (8.5%) |
| $25,000 to $34,999 | 95 (5.4%) | 24 (5.5%) |
| $35,000 to $49,999 | 255 (14.6%) | 69 (15.8%) |
| $50,000 to $74,999 | 199 (11.4%) | 126 (28.8%) |
| $75,000 to $99,999 | 334 (19.2%) | 44 (10.1%) |
| $100,000 to $149,999 | 187 (10.7%) | 9 (2.1%) |
| $150,000 or more | 420 (24.1%) | 28 (6.4%) |
| Total | 1,742 (100.0%) | 438 (100.0%) |
Monthly Housing Cost Tiers in Oakhurst
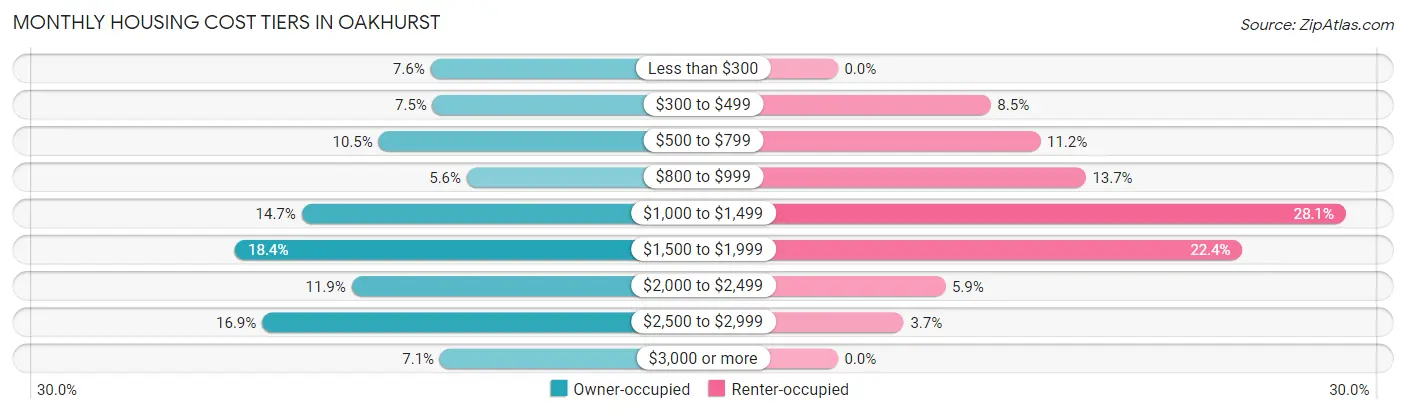
| Monthly Cost | Owner-occupied | Renter-occupied |
| Less than $300 | 132 (7.6%) | 0 (0.0%) |
| $300 to $499 | 130 (7.5%) | 37 (8.5%) |
| $500 to $799 | 182 (10.4%) | 49 (11.2%) |
| $800 to $999 | 97 (5.6%) | 60 (13.7%) |
| $1,000 to $1,499 | 256 (14.7%) | 123 (28.1%) |
| $1,500 to $1,999 | 320 (18.4%) | 98 (22.4%) |
| $2,000 to $2,499 | 208 (11.9%) | 26 (5.9%) |
| $2,500 to $2,999 | 294 (16.9%) | 16 (3.6%) |
| $3,000 or more | 123 (7.1%) | 0 (0.0%) |
| Total | 1,742 (100.0%) | 438 (100.0%) |
Physical Housing Characteristics in Oakhurst
Housing Structures in Oakhurst
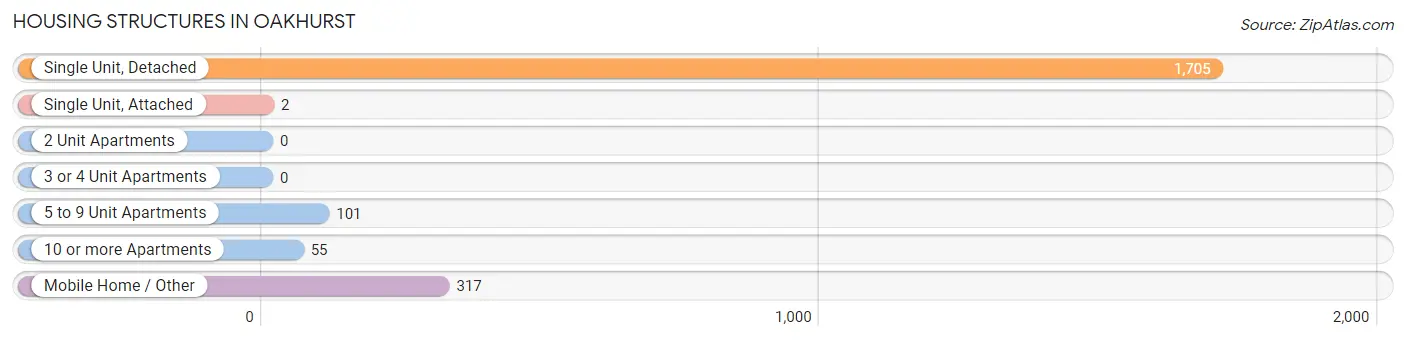
| Structure Type | # Housing Units | % Housing Units |
| Single Unit, Detached | 1,705 | 78.2% |
| Single Unit, Attached | 2 | 0.1% |
| 2 Unit Apartments | 0 | 0.0% |
| 3 or 4 Unit Apartments | 0 | 0.0% |
| 5 to 9 Unit Apartments | 101 | 4.6% |
| 10 or more Apartments | 55 | 2.5% |
| Mobile Home / Other | 317 | 14.5% |
| Total | 2,180 | 100.0% |
Housing Structures by Occupancy in Oakhurst
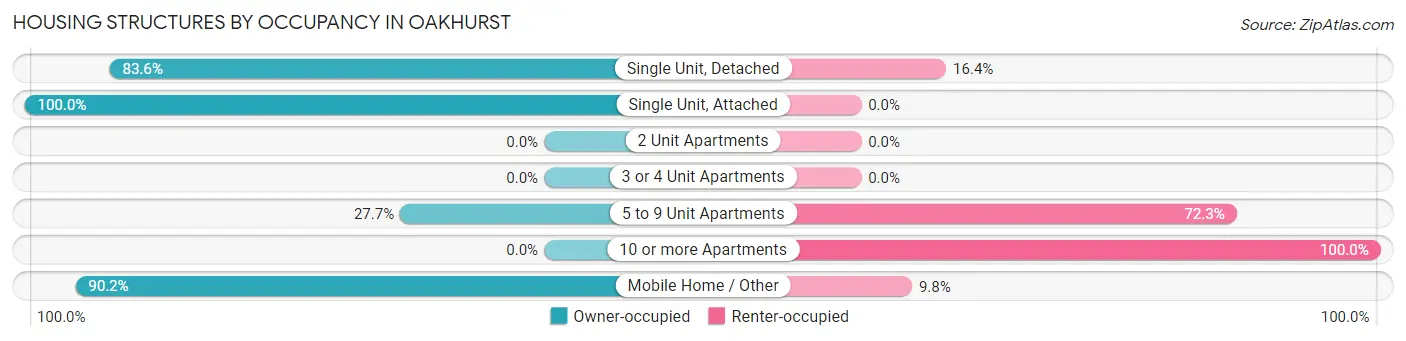
| Structure Type | Owner-occupied | Renter-occupied |
| Single Unit, Detached | 1,426 (83.6%) | 279 (16.4%) |
| Single Unit, Attached | 2 (100.0%) | 0 (0.0%) |
| 2 Unit Apartments | 0 (0.0%) | 0 (0.0%) |
| 3 or 4 Unit Apartments | 0 (0.0%) | 0 (0.0%) |
| 5 to 9 Unit Apartments | 28 (27.7%) | 73 (72.3%) |
| 10 or more Apartments | 0 (0.0%) | 55 (100.0%) |
| Mobile Home / Other | 286 (90.2%) | 31 (9.8%) |
| Total | 1,742 (79.9%) | 438 (20.1%) |
Housing Structures by Number of Rooms in Oakhurst
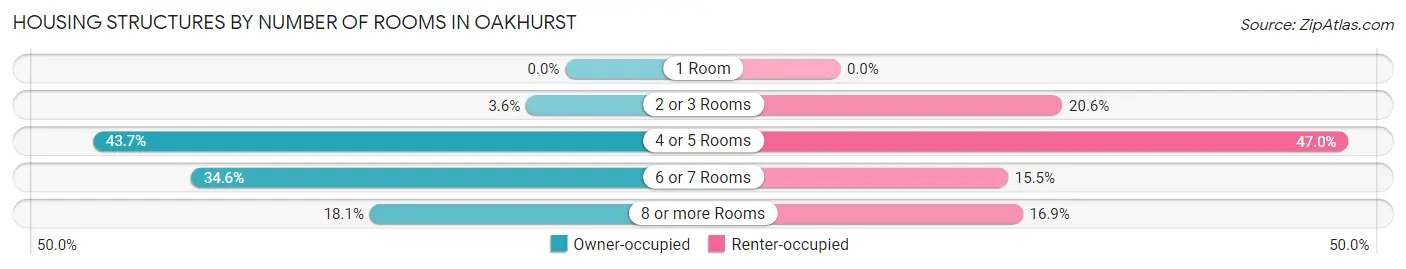
| Number of Rooms | Owner-occupied | Renter-occupied |
| 1 Room | 0 (0.0%) | 0 (0.0%) |
| 2 or 3 Rooms | 63 (3.6%) | 90 (20.5%) |
| 4 or 5 Rooms | 761 (43.7%) | 206 (47.0%) |
| 6 or 7 Rooms | 603 (34.6%) | 68 (15.5%) |
| 8 or more Rooms | 315 (18.1%) | 74 (16.9%) |
| Total | 1,742 (100.0%) | 438 (100.0%) |
Housing Structure by Heating Type in Oakhurst
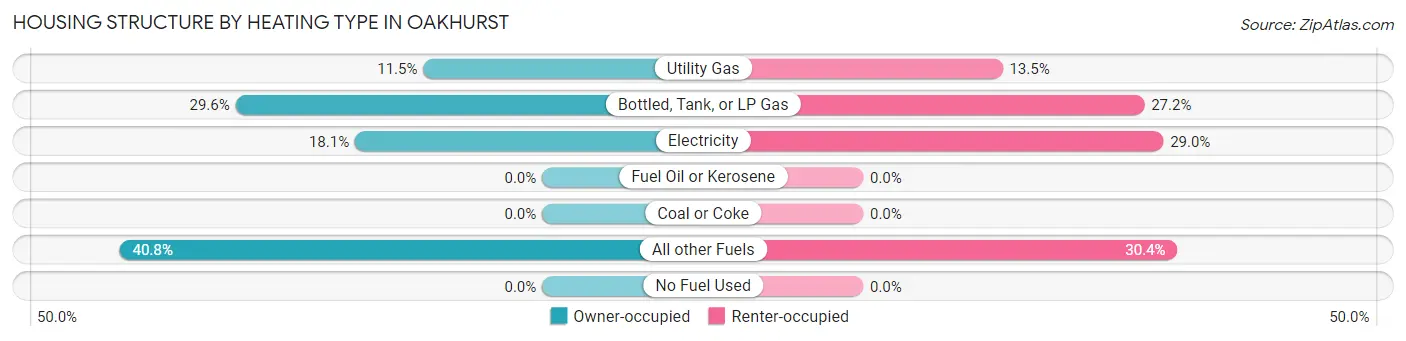
| Heating Type | Owner-occupied | Renter-occupied |
| Utility Gas | 200 (11.5%) | 59 (13.5%) |
| Bottled, Tank, or LP Gas | 516 (29.6%) | 119 (27.2%) |
| Electricity | 315 (18.1%) | 127 (29.0%) |
| Fuel Oil or Kerosene | 0 (0.0%) | 0 (0.0%) |
| Coal or Coke | 0 (0.0%) | 0 (0.0%) |
| All other Fuels | 711 (40.8%) | 133 (30.4%) |
| No Fuel Used | 0 (0.0%) | 0 (0.0%) |
| Total | 1,742 (100.0%) | 438 (100.0%) |
Household Vehicle Usage in Oakhurst
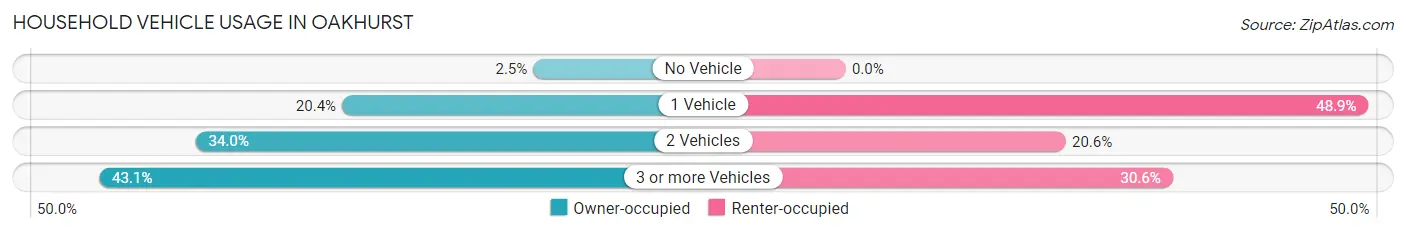
| Vehicles per Household | Owner-occupied | Renter-occupied |
| No Vehicle | 44 (2.5%) | 0 (0.0%) |
| 1 Vehicle | 355 (20.4%) | 214 (48.9%) |
| 2 Vehicles | 593 (34.0%) | 90 (20.5%) |
| 3 or more Vehicles | 750 (43.0%) | 134 (30.6%) |
| Total | 1,742 (100.0%) | 438 (100.0%) |
Real Estate & Mortgages in Oakhurst
Real Estate and Mortgage Overview in Oakhurst
| Characteristic | Without Mortgage | With Mortgage |
| Housing Units | 664 | 1,078 |
| Median Property Value | $347,200 | $379,300 |
| Median Household Income | $73,582 | $325 |
| Monthly Housing Costs | $637 | $123 |
| Real Estate Taxes | $2,611 | $40 |
Property Value by Mortgage Status in Oakhurst
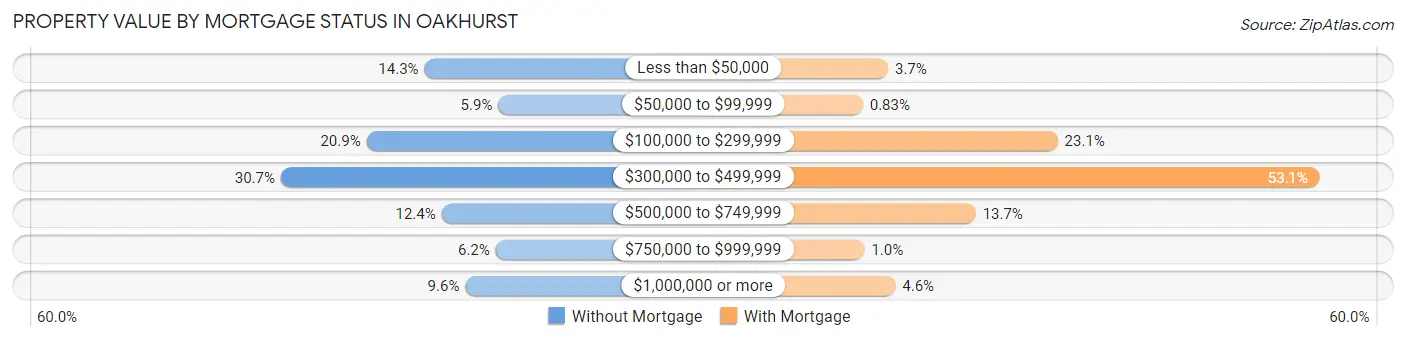
| Property Value | Without Mortgage | With Mortgage |
| Less than $50,000 | 95 (14.3%) | 40 (3.7%) |
| $50,000 to $99,999 | 39 (5.9%) | 9 (0.8%) |
| $100,000 to $299,999 | 139 (20.9%) | 249 (23.1%) |
| $300,000 to $499,999 | 204 (30.7%) | 572 (53.1%) |
| $500,000 to $749,999 | 82 (12.3%) | 148 (13.7%) |
| $750,000 to $999,999 | 41 (6.2%) | 11 (1.0%) |
| $1,000,000 or more | 64 (9.6%) | 49 (4.5%) |
| Total | 664 (100.0%) | 1,078 (100.0%) |
Household Income by Mortgage Status in Oakhurst
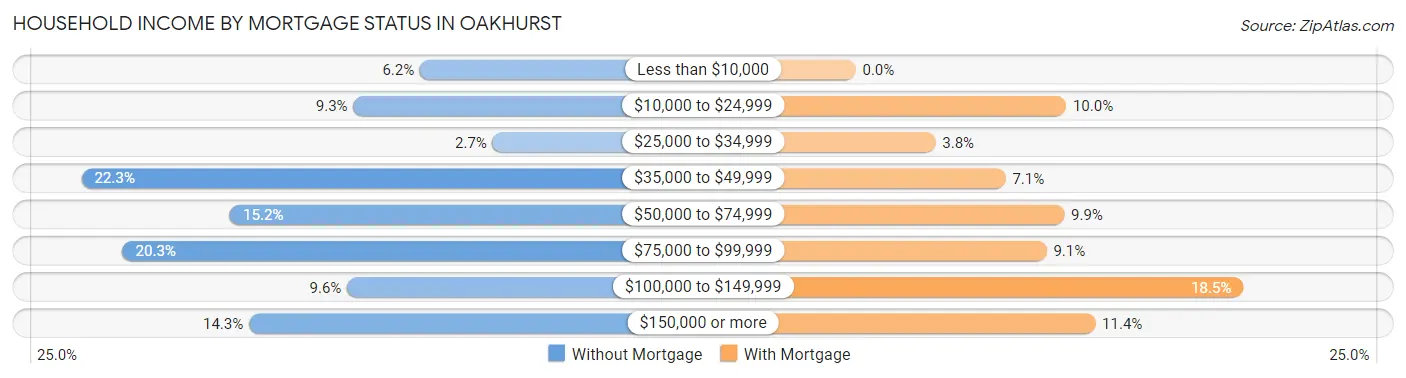
| Household Income | Without Mortgage | With Mortgage |
| Less than $10,000 | 41 (6.2%) | 0 (0.0%) |
| $10,000 to $24,999 | 62 (9.3%) | 108 (10.0%) |
| $25,000 to $34,999 | 18 (2.7%) | 41 (3.8%) |
| $35,000 to $49,999 | 148 (22.3%) | 77 (7.1%) |
| $50,000 to $74,999 | 101 (15.2%) | 107 (9.9%) |
| $75,000 to $99,999 | 135 (20.3%) | 98 (9.1%) |
| $100,000 to $149,999 | 64 (9.6%) | 199 (18.5%) |
| $150,000 or more | 95 (14.3%) | 123 (11.4%) |
| Total | 664 (100.0%) | 1,078 (100.0%) |
Property Value to Household Income Ratio in Oakhurst
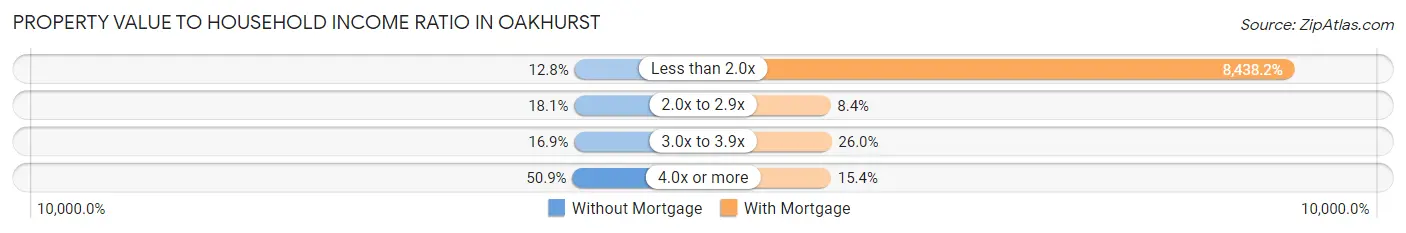
| Value-to-Income Ratio | Without Mortgage | With Mortgage |
| Less than 2.0x | 85 (12.8%) | 90,964 (8,438.2%) |
| 2.0x to 2.9x | 120 (18.1%) | 90 (8.4%) |
| 3.0x to 3.9x | 112 (16.9%) | 280 (26.0%) |
| 4.0x or more | 338 (50.9%) | 166 (15.4%) |
| Total | 664 (100.0%) | 1,078 (100.0%) |
Real Estate Taxes by Mortgage Status in Oakhurst
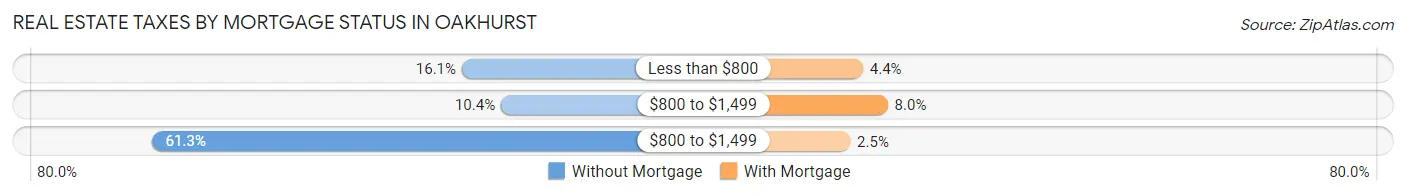
| Property Taxes | Without Mortgage | With Mortgage |
| Less than $800 | 107 (16.1%) | 47 (4.4%) |
| $800 to $1,499 | 69 (10.4%) | 86 (8.0%) |
| $800 to $1,499 | 407 (61.3%) | 27 (2.5%) |
| Total | 664 (100.0%) | 1,078 (100.0%) |
Health & Disability in Oakhurst
Health Insurance Coverage by Age in Oakhurst
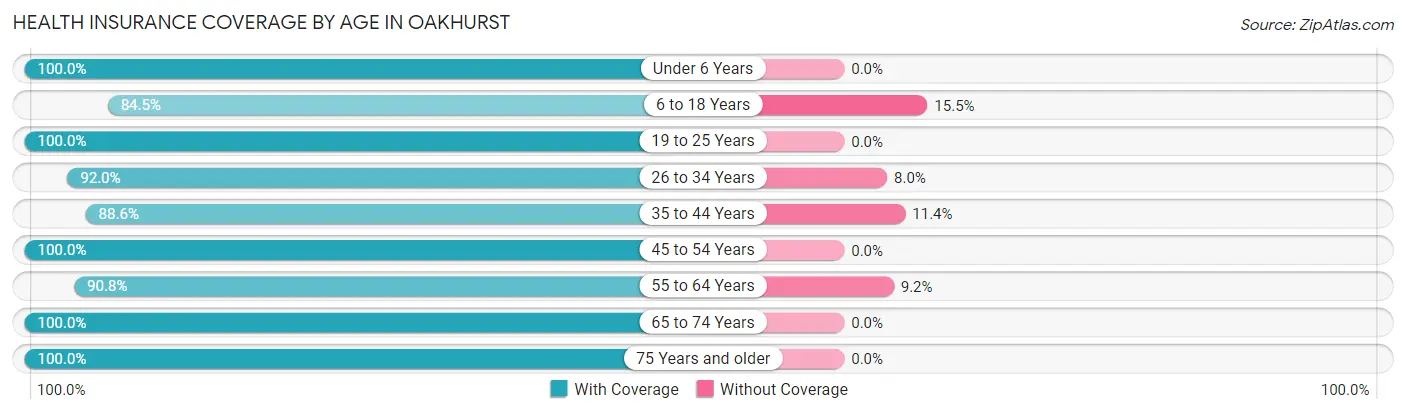
| Age Bracket | With Coverage | Without Coverage |
| Under 6 Years | 154 (100.0%) | 0 (0.0%) |
| 6 to 18 Years | 638 (84.5%) | 117 (15.5%) |
| 19 to 25 Years | 282 (100.0%) | 0 (0.0%) |
| 26 to 34 Years | 438 (92.0%) | 38 (8.0%) |
| 35 to 44 Years | 599 (88.6%) | 77 (11.4%) |
| 45 to 54 Years | 556 (100.0%) | 0 (0.0%) |
| 55 to 64 Years | 747 (90.8%) | 76 (9.2%) |
| 65 to 74 Years | 664 (100.0%) | 0 (0.0%) |
| 75 Years and older | 617 (100.0%) | 0 (0.0%) |
| Total | 4,695 (93.8%) | 308 (6.2%) |
Health Insurance Coverage by Citizenship Status in Oakhurst
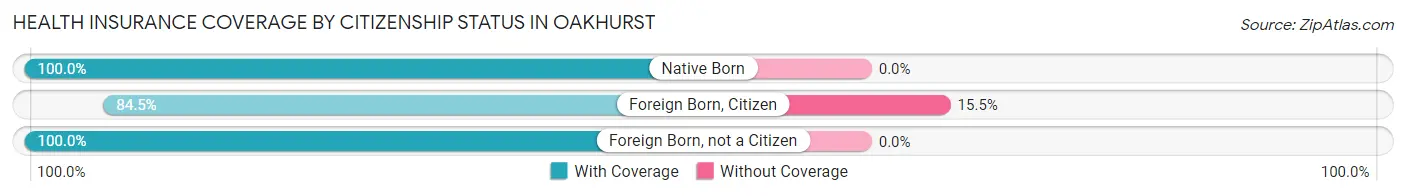
| Citizenship Status | With Coverage | Without Coverage |
| Native Born | 154 (100.0%) | 0 (0.0%) |
| Foreign Born, Citizen | 638 (84.5%) | 117 (15.5%) |
| Foreign Born, not a Citizen | 282 (100.0%) | 0 (0.0%) |
Health Insurance Coverage by Household Income in Oakhurst
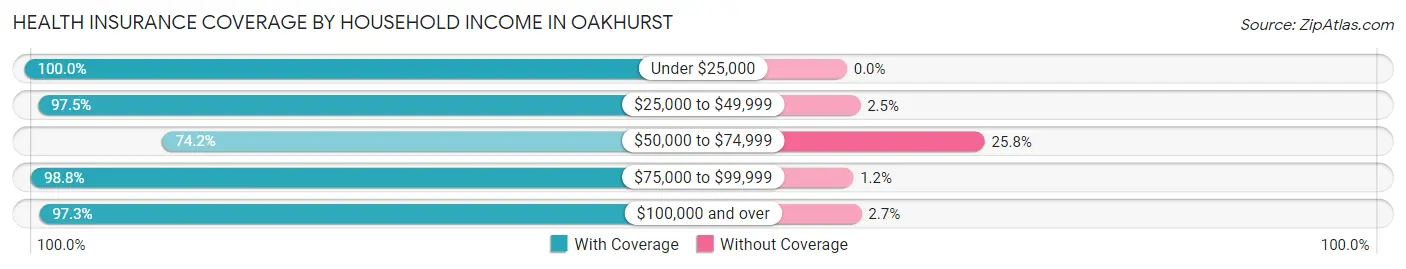
| Household Income | With Coverage | Without Coverage |
| Under $25,000 | 557 (100.0%) | 0 (0.0%) |
| $25,000 to $49,999 | 776 (97.5%) | 20 (2.5%) |
| $50,000 to $74,999 | 669 (74.2%) | 233 (25.8%) |
| $75,000 to $99,999 | 1,310 (98.8%) | 16 (1.2%) |
| $100,000 and over | 1,382 (97.3%) | 39 (2.7%) |
Public vs Private Health Insurance Coverage by Age in Oakhurst
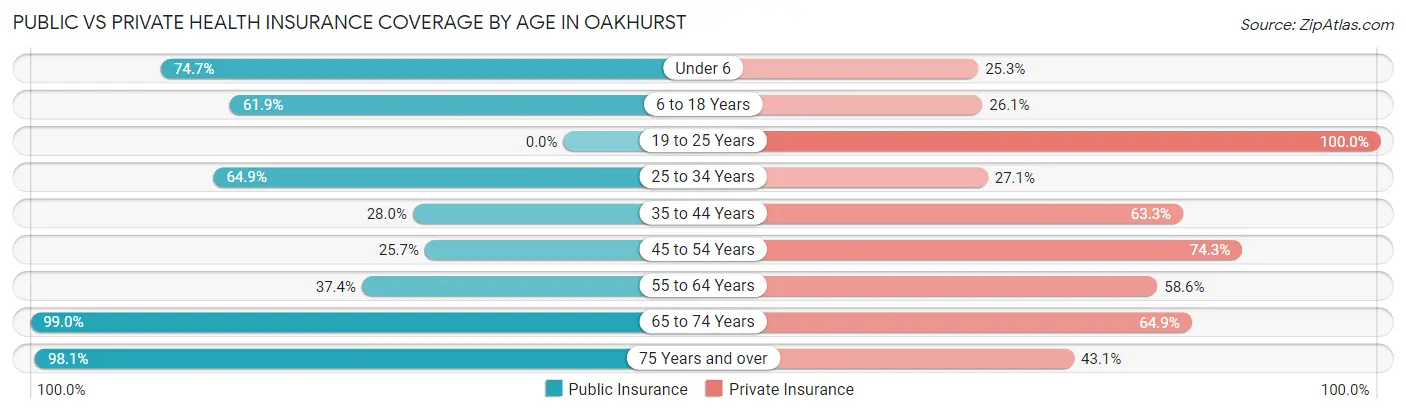
| Age Bracket | Public Insurance | Private Insurance |
| Under 6 | 115 (74.7%) | 39 (25.3%) |
| 6 to 18 Years | 467 (61.9%) | 197 (26.1%) |
| 19 to 25 Years | 0 (0.0%) | 282 (100.0%) |
| 25 to 34 Years | 309 (64.9%) | 129 (27.1%) |
| 35 to 44 Years | 189 (28.0%) | 428 (63.3%) |
| 45 to 54 Years | 143 (25.7%) | 413 (74.3%) |
| 55 to 64 Years | 308 (37.4%) | 482 (58.6%) |
| 65 to 74 Years | 657 (99.0%) | 431 (64.9%) |
| 75 Years and over | 605 (98.1%) | 266 (43.1%) |
| Total | 2,793 (55.8%) | 2,667 (53.3%) |
Disability Status by Sex by Age in Oakhurst
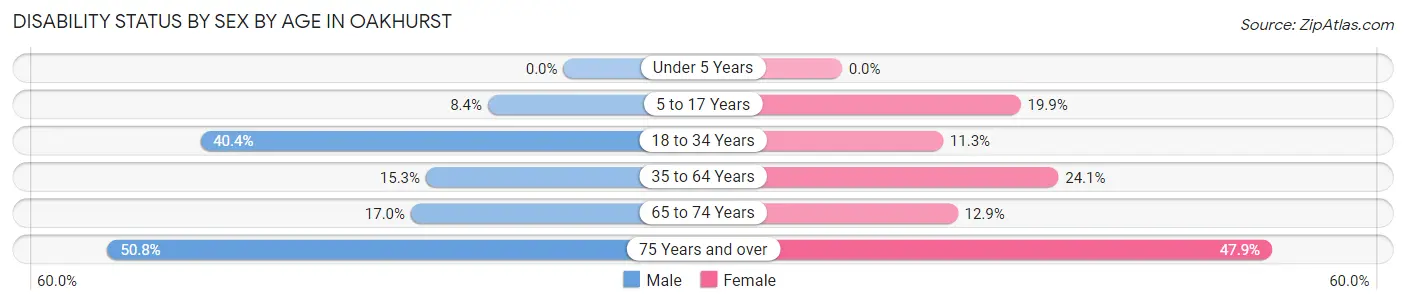
| Age Bracket | Male | Female |
| Under 5 Years | 0 (0.0%) | 0 (0.0%) |
| 5 to 17 Years | 28 (8.4%) | 84 (19.9%) |
| 18 to 34 Years | 91 (40.4%) | 60 (11.3%) |
| 35 to 64 Years | 147 (15.3%) | 264 (24.1%) |
| 65 to 74 Years | 64 (17.0%) | 37 (12.9%) |
| 75 Years and over | 132 (50.8%) | 171 (47.9%) |
Disability Class by Sex by Age in Oakhurst
Disability Class: Hearing Difficulty
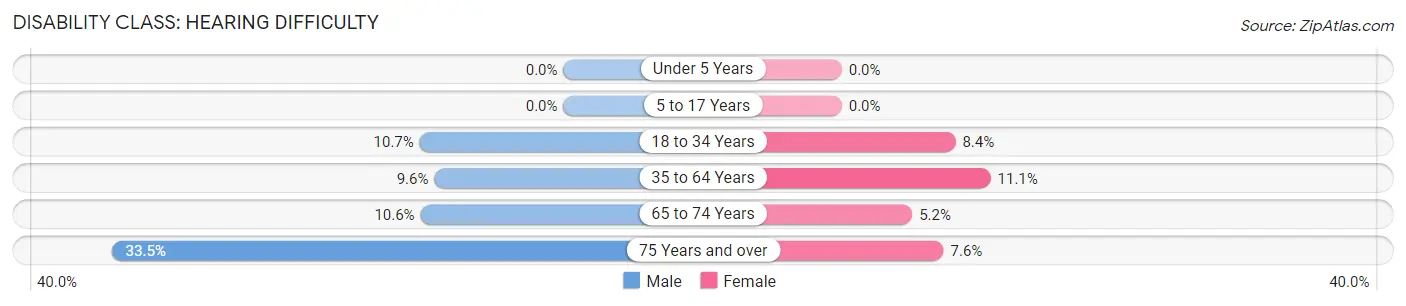
| Age Bracket | Male | Female |
| Under 5 Years | 0 (0.0%) | 0 (0.0%) |
| 5 to 17 Years | 0 (0.0%) | 0 (0.0%) |
| 18 to 34 Years | 24 (10.7%) | 45 (8.4%) |
| 35 to 64 Years | 92 (9.6%) | 121 (11.1%) |
| 65 to 74 Years | 40 (10.6%) | 15 (5.2%) |
| 75 Years and over | 87 (33.5%) | 27 (7.6%) |
Disability Class: Vision Difficulty
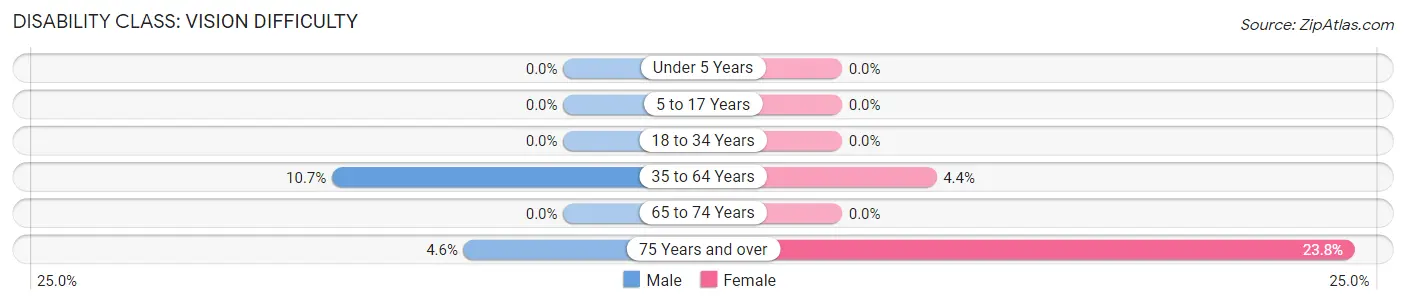
| Age Bracket | Male | Female |
| Under 5 Years | 0 (0.0%) | 0 (0.0%) |
| 5 to 17 Years | 0 (0.0%) | 0 (0.0%) |
| 18 to 34 Years | 0 (0.0%) | 0 (0.0%) |
| 35 to 64 Years | 103 (10.7%) | 48 (4.4%) |
| 65 to 74 Years | 0 (0.0%) | 0 (0.0%) |
| 75 Years and over | 12 (4.6%) | 85 (23.8%) |
Disability Class: Cognitive Difficulty
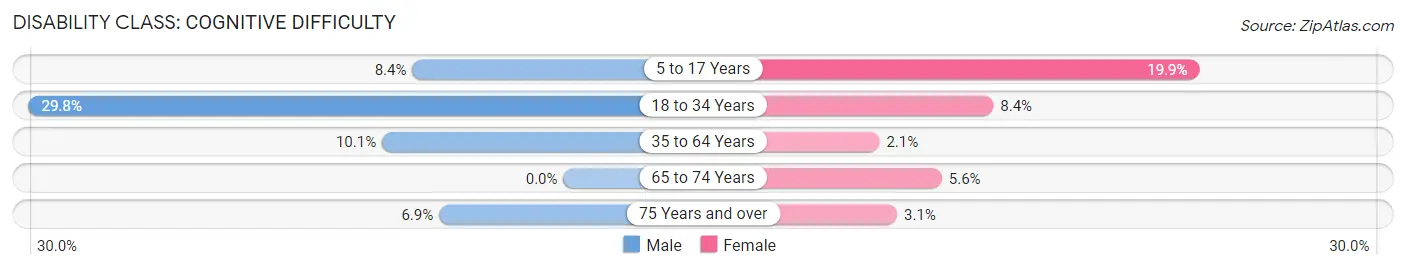
| Age Bracket | Male | Female |
| 5 to 17 Years | 28 (8.4%) | 84 (19.9%) |
| 18 to 34 Years | 67 (29.8%) | 45 (8.4%) |
| 35 to 64 Years | 97 (10.1%) | 23 (2.1%) |
| 65 to 74 Years | 0 (0.0%) | 16 (5.6%) |
| 75 Years and over | 18 (6.9%) | 11 (3.1%) |
Disability Class: Ambulatory Difficulty
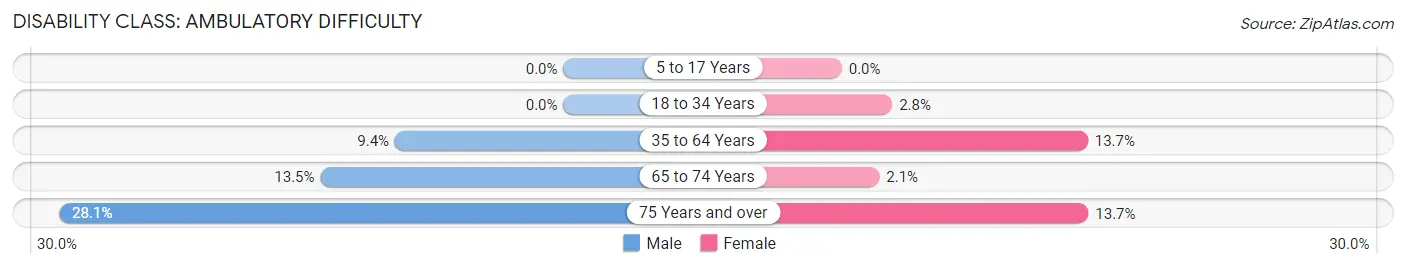
| Age Bracket | Male | Female |
| 5 to 17 Years | 0 (0.0%) | 0 (0.0%) |
| 18 to 34 Years | 0 (0.0%) | 15 (2.8%) |
| 35 to 64 Years | 90 (9.4%) | 150 (13.7%) |
| 65 to 74 Years | 51 (13.5%) | 6 (2.1%) |
| 75 Years and over | 73 (28.1%) | 49 (13.7%) |
Disability Class: Self-Care Difficulty
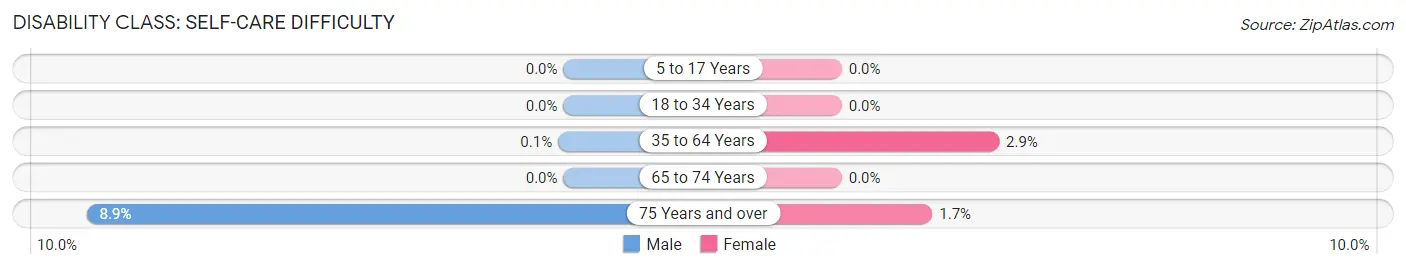
| Age Bracket | Male | Female |
| 5 to 17 Years | 0 (0.0%) | 0 (0.0%) |
| 18 to 34 Years | 0 (0.0%) | 0 (0.0%) |
| 35 to 64 Years | 1 (0.1%) | 32 (2.9%) |
| 65 to 74 Years | 0 (0.0%) | 0 (0.0%) |
| 75 Years and over | 23 (8.8%) | 6 (1.7%) |
Technology Access in Oakhurst
Computing Device Access in Oakhurst
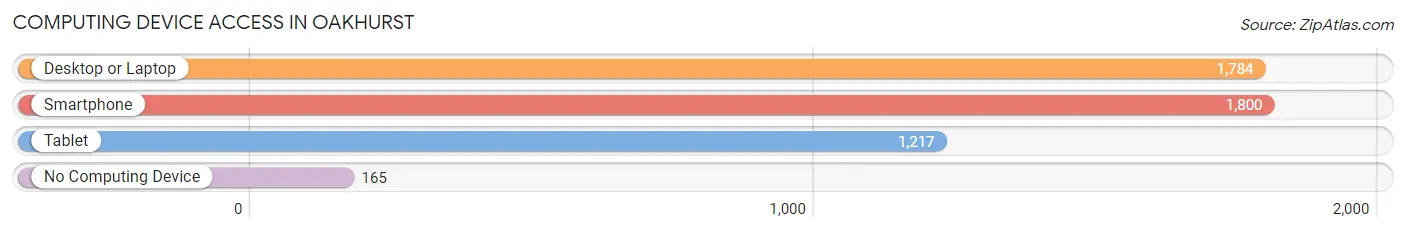
| Device Type | # Households | % Households |
| Desktop or Laptop | 1,784 | 81.8% |
| Smartphone | 1,800 | 82.6% |
| Tablet | 1,217 | 55.8% |
| No Computing Device | 165 | 7.6% |
| Total | 2,180 | 100.0% |
Internet Access in Oakhurst
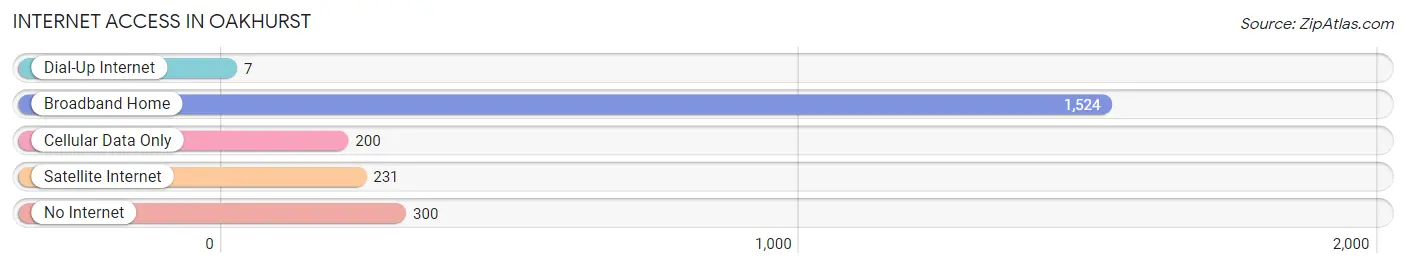
| Internet Type | # Households | % Households |
| Dial-Up Internet | 7 | 0.3% |
| Broadband Home | 1,524 | 69.9% |
| Cellular Data Only | 200 | 9.2% |
| Satellite Internet | 231 | 10.6% |
| No Internet | 300 | 13.8% |
| Total | 2,180 | 100.0% |
Oakhurst Summary
Oakhurst is a small town located in the Sierra Nevada foothills of Madera County, California. It is situated at an elevation of 2,200 feet (670 m) and is located about 25 miles (40 km) northeast of Fresno. The population of Oakhurst was 2,829 at the 2000 census.
History
Oakhurst was founded in 1868 by a group of settlers from the Midwest. The town was originally called Fresno Flats, but was later renamed Oakhurst in 1874. The name was chosen to reflect the abundance of oak trees in the area.
The town was a popular stop for travelers on the stagecoach route between Fresno and Yosemite National Park. In the early 1900s, Oakhurst became a popular destination for tourists and vacationers. The town was also home to a number of logging and lumber operations.
Geography
Oakhurst is located at 37°20'25" North, 119°37'17" West (37.340278, -119.621389). According to the United States Census Bureau, the town has a total area of 1.7 square miles (4.4 km2), all of it land.
Economy
Oakhurst’s economy is largely based on tourism and agriculture. The town is home to a number of wineries, restaurants, and other tourist attractions. The town is also home to a number of agricultural operations, including cattle ranches, dairies, and fruit orchards.
Demographics
As of the census of 2000, there were 2,829 people, 1,093 households, and 745 families residing in the town. The population density was 1,664.2 people per square mile (642.2/km2). There were 1,179 housing units at an average density of 690.2 per square mile (266.3/km2). The racial makeup of the town was 81.2% White, 0.7% African American, 1.3% Native American, 0.7% Asian, 0.1% Pacific Islander, 13.2% from other races, and 3.0% from two or more races. Hispanic or Latino of any race were 22.2% of the population.
There were 1,093 households, out of which 33.2% had children under the age of 18 living with them, 53.2% were married couples living together, 10.7% had a female householder with no husband present, and 30.7% were non-families. 24.7% of all households were made up of individuals, and 9.2% had someone living alone who was 65 years of age or older. The average household size was 2.60 and the average family size was 3.12.
In the town, the population was spread out, with 27.2% under the age of 18, 8.2% from 18 to 24, 27.2% from 25 to 44, 24.2% from 45 to 64, and 13.2% who were 65 years of age or older. The median age was 37 years. For every 100 females, there were 97.2 males. For every 100 females age 18 and over, there were 94.2 males.
The median income for a household in the town was $35,938, and the median income for a family was $41,250. Males had a median income of $30,938 versus $22,500 for females. The per capita income for the town was $17,845. About 10.2% of families and 13.2% of the population were below the poverty line, including 17.2% of those under age 18 and 8.2% of those age 65 or over.
Common Questions
What is Per Capita Income in Oakhurst?
Per Capita income in Oakhurst is $44,763.
What is the Median Family Income in Oakhurst?
Median Family Income in Oakhurst is $81,492.
What is the Median Household income in Oakhurst?
Median Household Income in Oakhurst is $73,333.
What is Income or Wage Gap in Oakhurst?
Income or Wage Gap in Oakhurst is 41.2%.
Women in Oakhurst earn 58.8 cents for every dollar earned by a man.
What is Inequality or Gini Index in Oakhurst?
Inequality or Gini Index in Oakhurst is 0.50.
What is the Total Population of Oakhurst?
Total Population of Oakhurst is 5,003.
What is the Total Male Population of Oakhurst?
Total Male Population of Oakhurst is 2,176.
What is the Total Female Population of Oakhurst?
Total Female Population of Oakhurst is 2,827.
What is the Ratio of Males per 100 Females in Oakhurst?
There are 76.97 Males per 100 Females in Oakhurst.
What is the Ratio of Females per 100 Males in Oakhurst?
There are 129.92 Females per 100 Males in Oakhurst.
What is the Median Population Age in Oakhurst?
Median Population Age in Oakhurst is 47.1 Years.
What is the Average Family Size in Oakhurst
Average Family Size in Oakhurst is 2.8 People.
What is the Average Household Size in Oakhurst
Average Household Size in Oakhurst is 2.3 People.
How Large is the Labor Force in Oakhurst?
There are 2,450 People in the Labor Forcein in Oakhurst.
What is the Percentage of People in the Labor Force in Oakhurst?
57.9% of People are in the Labor Force in Oakhurst.
What is the Unemployment Rate in Oakhurst?
Unemployment Rate in Oakhurst is 8.0%.