Oakdale, CA Map & Demographics
Oakdale Map
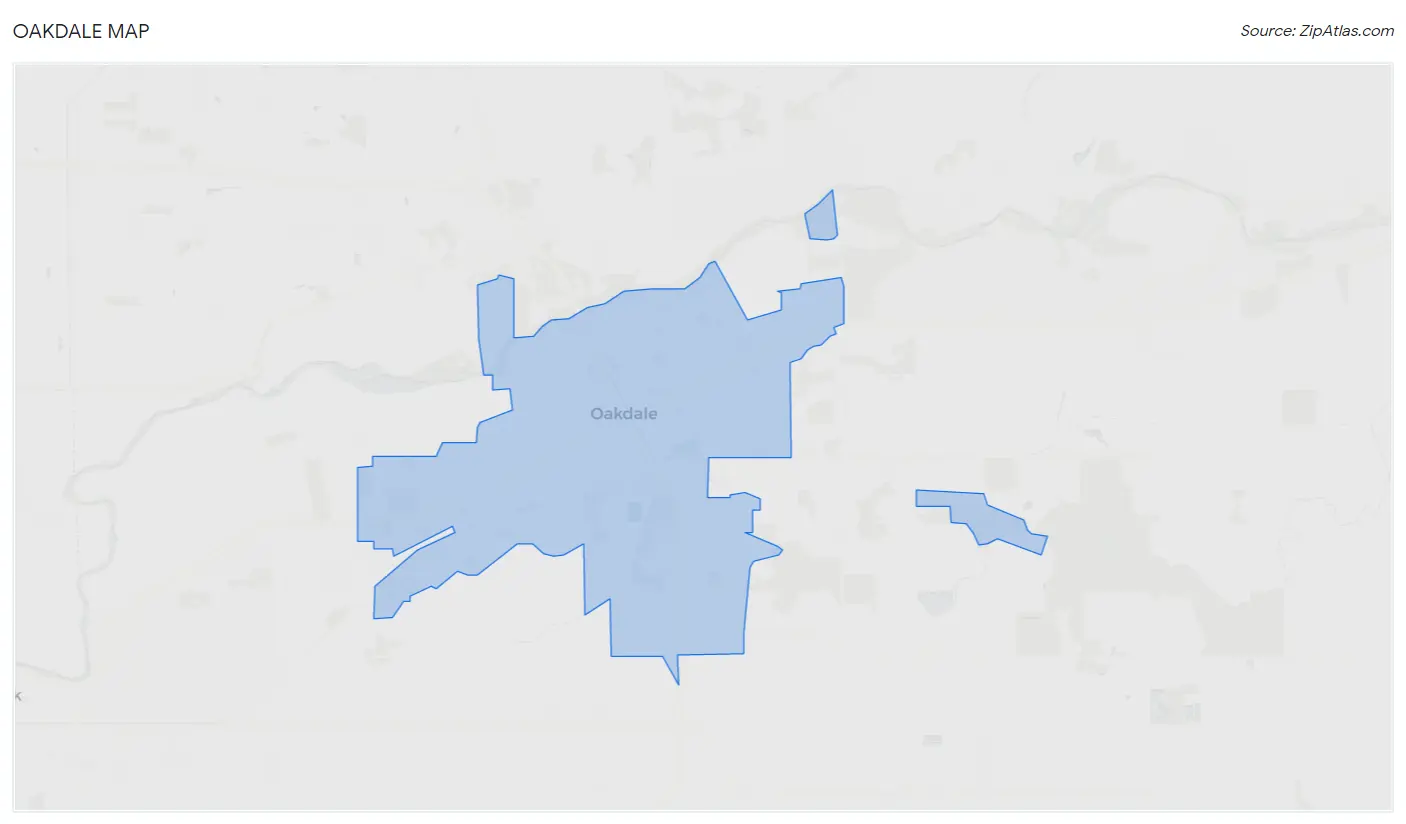
Oakdale Overview
$36,622
PER CAPITA INCOME
$97,492
AVG FAMILY INCOME
$83,110
AVG HOUSEHOLD INCOME
41.9%
WAGE / INCOME GAP [ % ]
58.1¢/ $1
WAGE / INCOME GAP [ $ ]
$10,509
FAMILY INCOME DEFICIT
0.45
INEQUALITY / GINI INDEX
23,120
TOTAL POPULATION
11,514
MALE POPULATION
11,606
FEMALE POPULATION
99.21
MALES / 100 FEMALES
100.80
FEMALES / 100 MALES
35.8
MEDIAN AGE
3.3
AVG FAMILY SIZE
2.8
AVG HOUSEHOLD SIZE
11,252
LABOR FORCE [ PEOPLE ]
63.5%
PERCENT IN LABOR FORCE
8.6%
UNEMPLOYMENT RATE
Oakdale Zip Codes
Oakdale Area Codes
Income in Oakdale
Income Overview in Oakdale
Per Capita Income in Oakdale is $36,622, while median incomes of families and households are $97,492 and $83,110 respectively.
| Characteristic | Number | Measure |
| Per Capita Income | 23,120 | $36,622 |
| Median Family Income | 6,011 | $97,492 |
| Mean Family Income | 6,011 | $115,714 |
| Median Household Income | 8,293 | $83,110 |
| Mean Household Income | 8,293 | $101,545 |
| Income Deficit | 6,011 | $10,509 |
| Wage / Income Gap (%) | 23,120 | 41.91% |
| Wage / Income Gap ($) | 23,120 | 58.09¢ per $1 |
| Gini / Inequality Index | 23,120 | 0.45 |
Earnings by Sex in Oakdale
Average Earnings in Oakdale are $46,424, $59,427 for men and $34,523 for women, a difference of 41.9%.
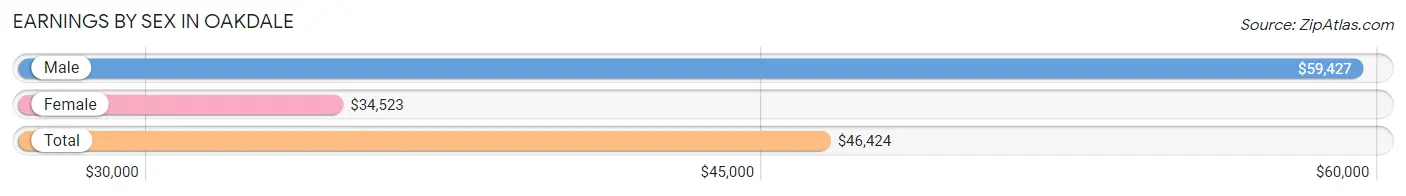
| Sex | Number | Average Earnings |
| Male | 6,134 (54.6%) | $59,427 |
| Female | 5,092 (45.4%) | $34,523 |
| Total | 11,226 (100.0%) | $46,424 |
Earnings by Sex by Income Bracket in Oakdale
The most common earnings brackets in Oakdale are $100,000+ for men (1,486 | 24.2%) and $100,000+ for women (619 | 12.2%).
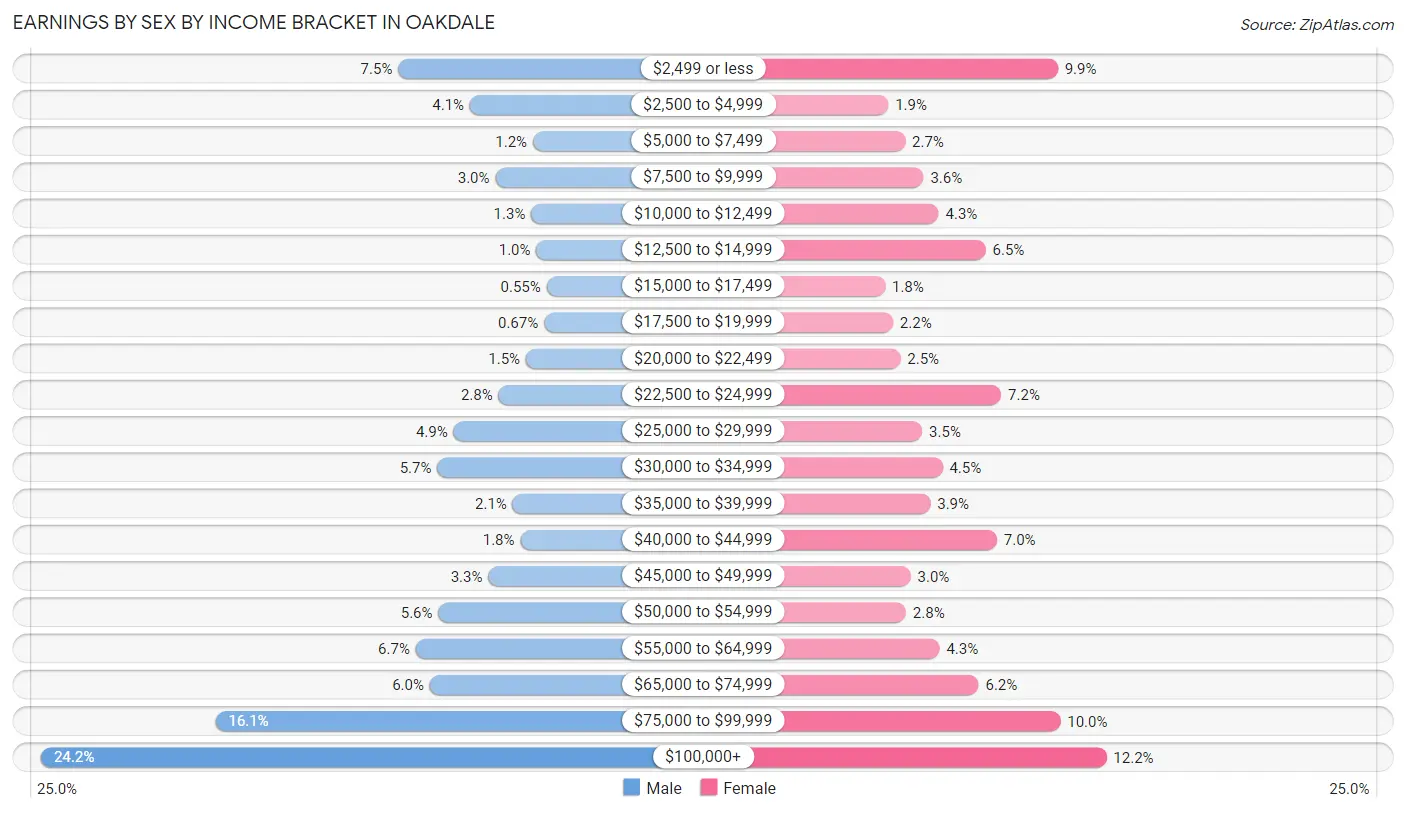
| Income | Male | Female |
| $2,499 or less | 460 (7.5%) | 503 (9.9%) |
| $2,500 to $4,999 | 254 (4.1%) | 99 (1.9%) |
| $5,000 to $7,499 | 73 (1.2%) | 139 (2.7%) |
| $7,500 to $9,999 | 181 (2.9%) | 183 (3.6%) |
| $10,000 to $12,499 | 78 (1.3%) | 219 (4.3%) |
| $12,500 to $14,999 | 63 (1.0%) | 331 (6.5%) |
| $15,000 to $17,499 | 34 (0.5%) | 91 (1.8%) |
| $17,500 to $19,999 | 41 (0.7%) | 110 (2.2%) |
| $20,000 to $22,499 | 93 (1.5%) | 128 (2.5%) |
| $22,500 to $24,999 | 172 (2.8%) | 368 (7.2%) |
| $25,000 to $29,999 | 301 (4.9%) | 180 (3.5%) |
| $30,000 to $34,999 | 348 (5.7%) | 228 (4.5%) |
| $35,000 to $39,999 | 131 (2.1%) | 199 (3.9%) |
| $40,000 to $44,999 | 109 (1.8%) | 358 (7.0%) |
| $45,000 to $49,999 | 201 (3.3%) | 152 (3.0%) |
| $50,000 to $54,999 | 345 (5.6%) | 141 (2.8%) |
| $55,000 to $64,999 | 410 (6.7%) | 221 (4.3%) |
| $65,000 to $74,999 | 369 (6.0%) | 314 (6.2%) |
| $75,000 to $99,999 | 985 (16.1%) | 509 (10.0%) |
| $100,000+ | 1,486 (24.2%) | 619 (12.2%) |
| Total | 6,134 (100.0%) | 5,092 (100.0%) |
Earnings by Sex by Educational Attainment in Oakdale
Average earnings in Oakdale are $72,191 for men and $41,520 for women, a difference of 42.5%. Men with an educational attainment of graduate degree enjoy the highest average annual earnings of $155,078, while those with less than high school education earn the least with $43,750. Women with an educational attainment of graduate degree earn the most with the average annual earnings of $97,618, while those with less than high school education have the smallest earnings of $14,418.
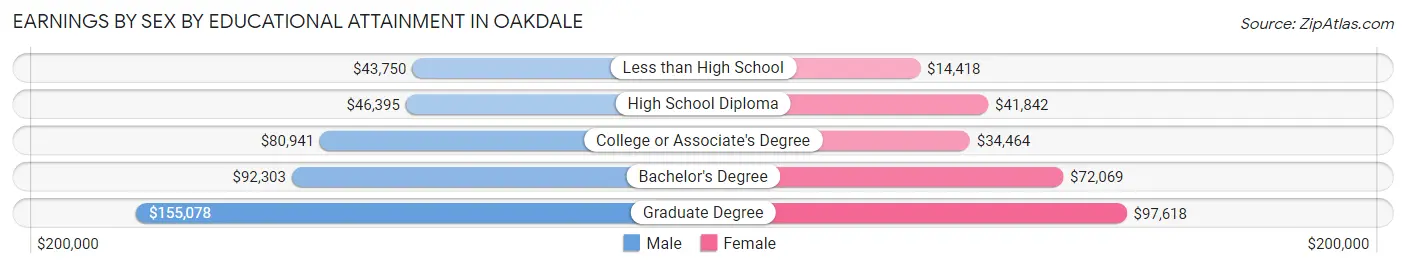
| Educational Attainment | Male Income | Female Income |
| Less than High School | $43,750 | $14,418 |
| High School Diploma | $46,395 | $41,842 |
| College or Associate's Degree | $80,941 | $34,464 |
| Bachelor's Degree | $92,303 | $72,069 |
| Graduate Degree | $155,078 | $97,618 |
| Total | $72,191 | $41,520 |
Family Income in Oakdale
Family Income Brackets in Oakdale
According to the Oakdale family income data, there are 1,479 families falling into the $100,000 to $149,999 income range, which is the most common income bracket and makes up 24.6% of all families. Conversely, the $10,000 to $14,999 income bracket is the least frequent group with only 24 families (0.4%) belonging to this category.
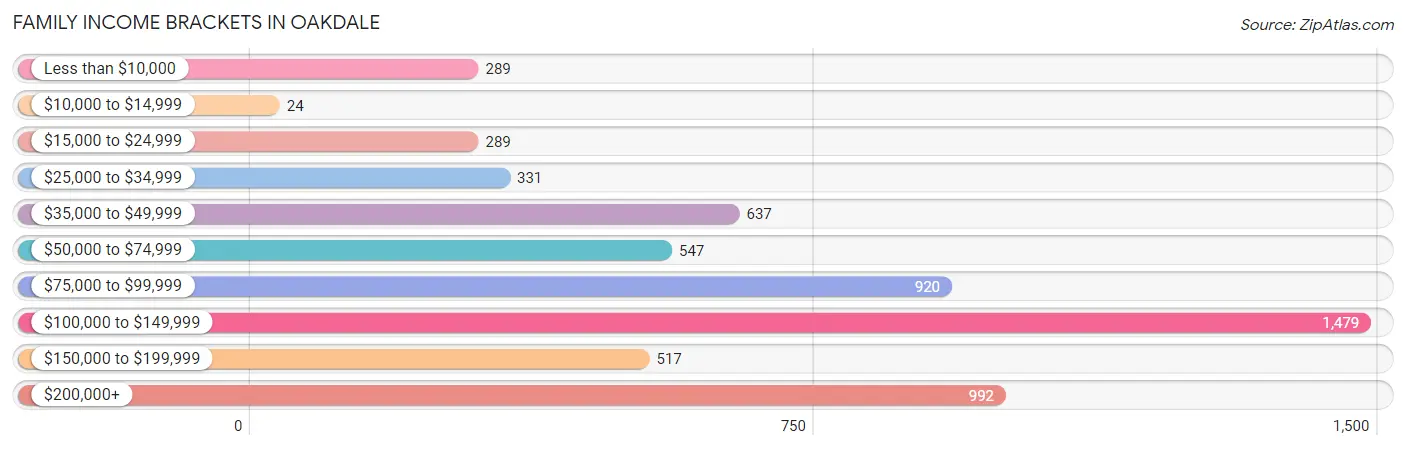
| Income Bracket | # Families | % Families |
| Less than $10,000 | 289 | 4.8% |
| $10,000 to $14,999 | 24 | 0.4% |
| $15,000 to $24,999 | 289 | 4.8% |
| $25,000 to $34,999 | 331 | 5.5% |
| $35,000 to $49,999 | 637 | 10.6% |
| $50,000 to $74,999 | 547 | 9.1% |
| $75,000 to $99,999 | 920 | 15.3% |
| $100,000 to $149,999 | 1,479 | 24.6% |
| $150,000 to $199,999 | 517 | 8.6% |
| $200,000+ | 992 | 16.5% |
Family Income by Famaliy Size in Oakdale
7+ person families (59 | 1.0%) account for the highest median family income in Oakdale with $205,664 per family, while 3-person families (1,346 | 22.4%) have the highest median income of $39,101 per family member.
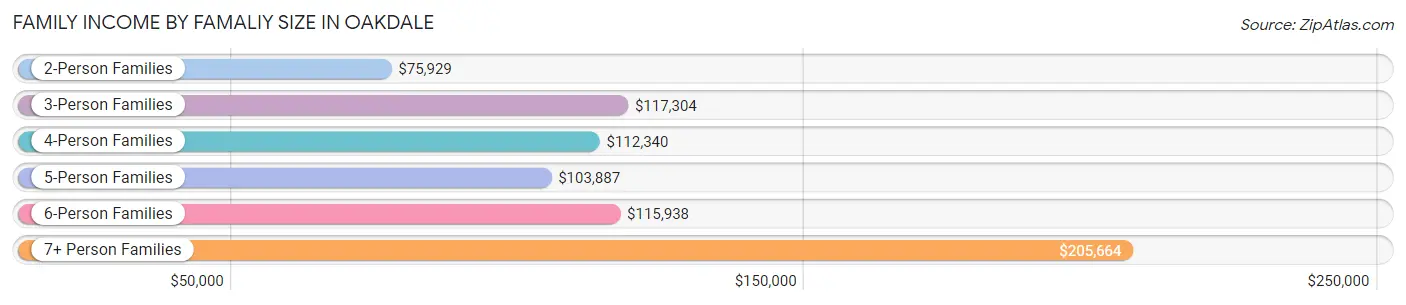
| Income Bracket | # Families | Median Income |
| 2-Person Families | 2,598 (43.2%) | $75,929 |
| 3-Person Families | 1,346 (22.4%) | $117,304 |
| 4-Person Families | 956 (15.9%) | $112,340 |
| 5-Person Families | 769 (12.8%) | $103,887 |
| 6-Person Families | 283 (4.7%) | $115,938 |
| 7+ Person Families | 59 (1.0%) | $205,664 |
| Total | 6,011 (100.0%) | $97,492 |
Family Income by Number of Earners in Oakdale
The median family income in Oakdale is $97,492, with families comprising 3+ earners (840) having the highest median family income of $206,165, while families with no earners (814) have the lowest median family income of $51,900, accounting for 14.0% and 13.5% of families, respectively.
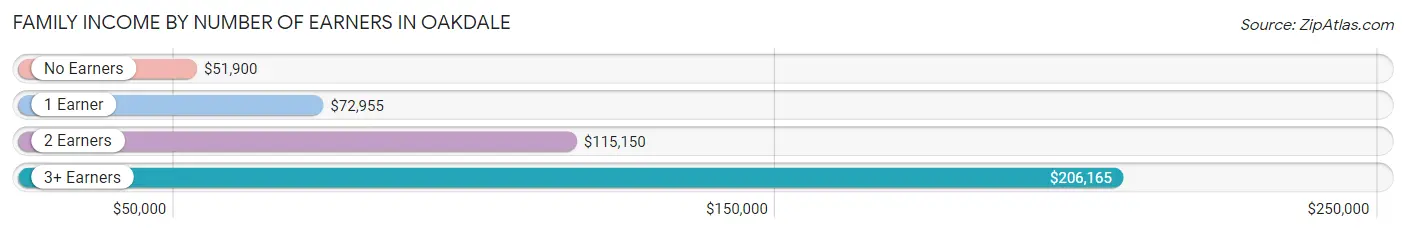
| Number of Earners | # Families | Median Income |
| No Earners | 814 (13.5%) | $51,900 |
| 1 Earner | 1,954 (32.5%) | $72,955 |
| 2 Earners | 2,403 (40.0%) | $115,150 |
| 3+ Earners | 840 (14.0%) | $206,165 |
| Total | 6,011 (100.0%) | $97,492 |
Household Income in Oakdale
Household Income Brackets in Oakdale
With 1,642 households falling in the category, the $100,000 to $149,999 income range is the most frequent in Oakdale, accounting for 19.8% of all households. In contrast, only 348 households (4.2%) fall into the $15,000 to $24,999 income bracket, making it the least populous group.
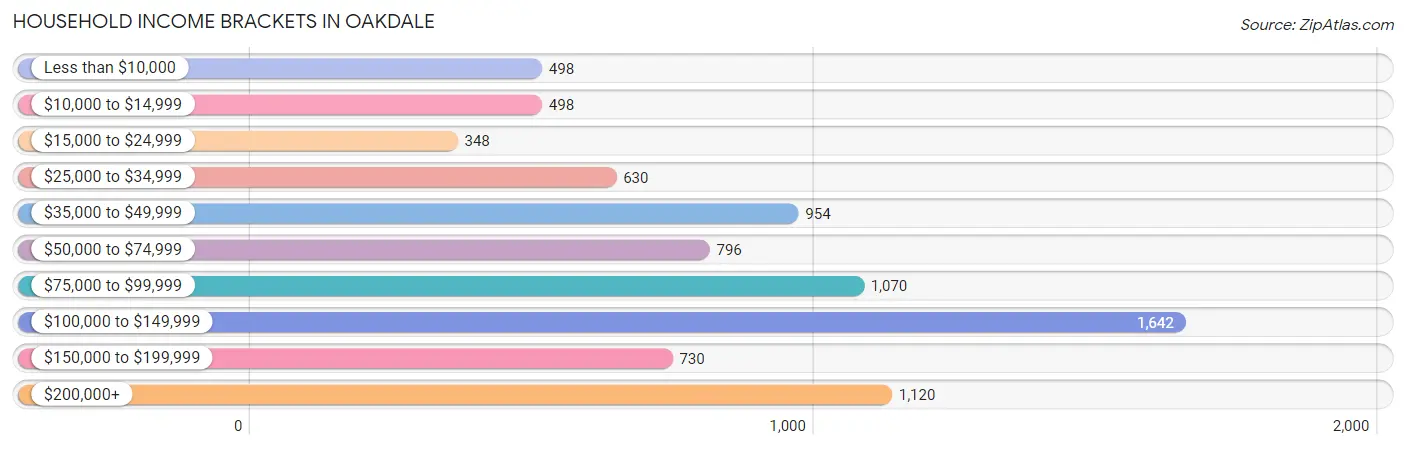
| Income Bracket | # Households | % Households |
| Less than $10,000 | 498 | 6.0% |
| $10,000 to $14,999 | 498 | 6.0% |
| $15,000 to $24,999 | 348 | 4.2% |
| $25,000 to $34,999 | 630 | 7.6% |
| $35,000 to $49,999 | 954 | 11.5% |
| $50,000 to $74,999 | 796 | 9.6% |
| $75,000 to $99,999 | 1,070 | 12.9% |
| $100,000 to $149,999 | 1,642 | 19.8% |
| $150,000 to $199,999 | 730 | 8.8% |
| $200,000+ | 1,120 | 13.5% |
Household Income by Householder Age in Oakdale
The median household income in Oakdale is $83,110, with the highest median household income of $102,472 found in the 45 to 64 years age bracket for the primary householder. A total of 3,207 households (38.7%) fall into this category. Meanwhile, the 15 to 24 years age bracket for the primary householder has the lowest median household income of $0, with 218 households (2.6%) in this group.
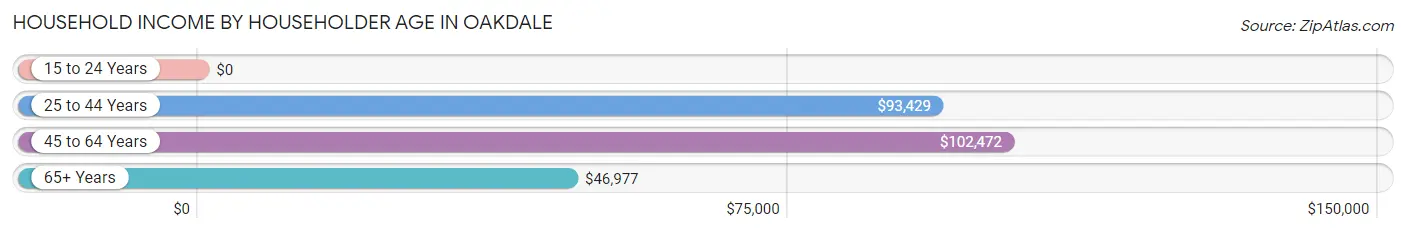
| Income Bracket | # Households | Median Income |
| 15 to 24 Years | 218 (2.6%) | $0 |
| 25 to 44 Years | 2,967 (35.8%) | $93,429 |
| 45 to 64 Years | 3,207 (38.7%) | $102,472 |
| 65+ Years | 1,901 (22.9%) | $46,977 |
| Total | 8,293 (100.0%) | $83,110 |
Poverty in Oakdale
Income Below Poverty by Sex and Age in Oakdale
With 13.4% poverty level for males and 12.6% for females among the residents of Oakdale, 6 to 11 year old males and under 5 year old females are the most vulnerable to poverty, with 336 males (35.3%) and 268 females (31.8%) in their respective age groups living below the poverty level.
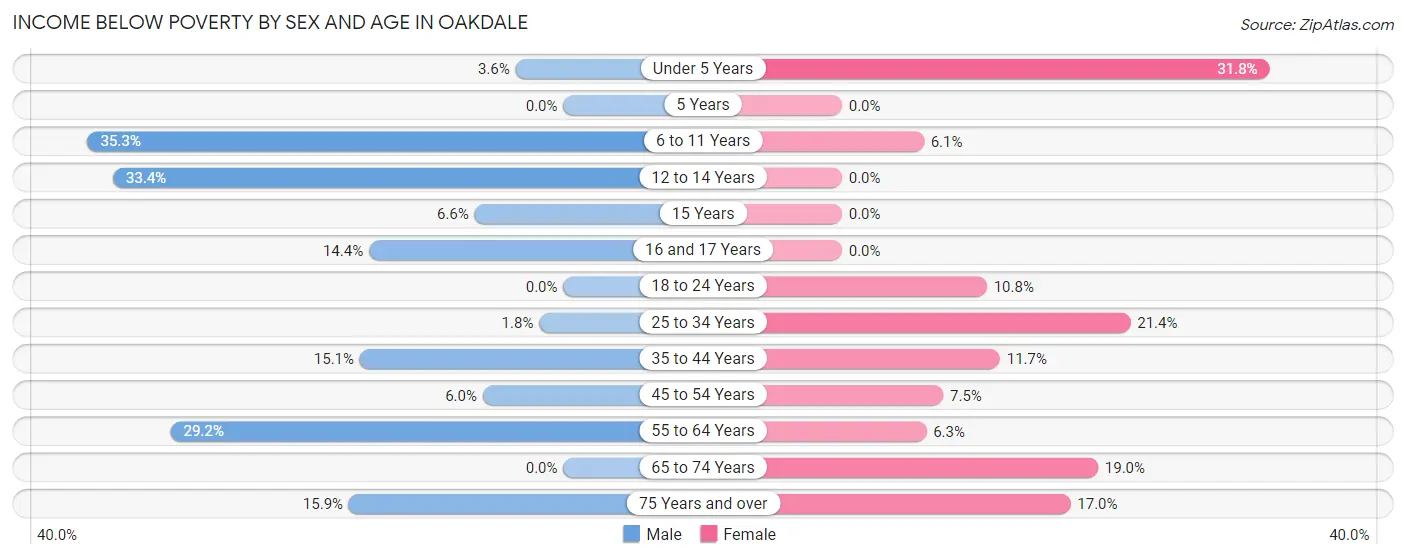
| Age Bracket | Male | Female |
| Under 5 Years | 27 (3.5%) | 268 (31.8%) |
| 5 Years | 0 (0.0%) | 0 (0.0%) |
| 6 to 11 Years | 336 (35.3%) | 53 (6.1%) |
| 12 to 14 Years | 205 (33.4%) | 0 (0.0%) |
| 15 Years | 12 (6.6%) | 0 (0.0%) |
| 16 and 17 Years | 73 (14.4%) | 0 (0.0%) |
| 18 to 24 Years | 0 (0.0%) | 110 (10.8%) |
| 25 to 34 Years | 25 (1.8%) | 322 (21.4%) |
| 35 to 44 Years | 188 (15.1%) | 214 (11.7%) |
| 45 to 54 Years | 91 (6.0%) | 93 (7.5%) |
| 55 to 64 Years | 484 (29.2%) | 75 (6.3%) |
| 65 to 74 Years | 0 (0.0%) | 161 (19.0%) |
| 75 Years and over | 78 (15.9%) | 157 (17.0%) |
| Total | 1,519 (13.4%) | 1,453 (12.6%) |
Income Above Poverty by Sex and Age in Oakdale
According to the poverty statistics in Oakdale, males aged 5 years and females aged 5 years are the age groups that are most secure financially, with 100.0% of males and 100.0% of females in these age groups living above the poverty line.
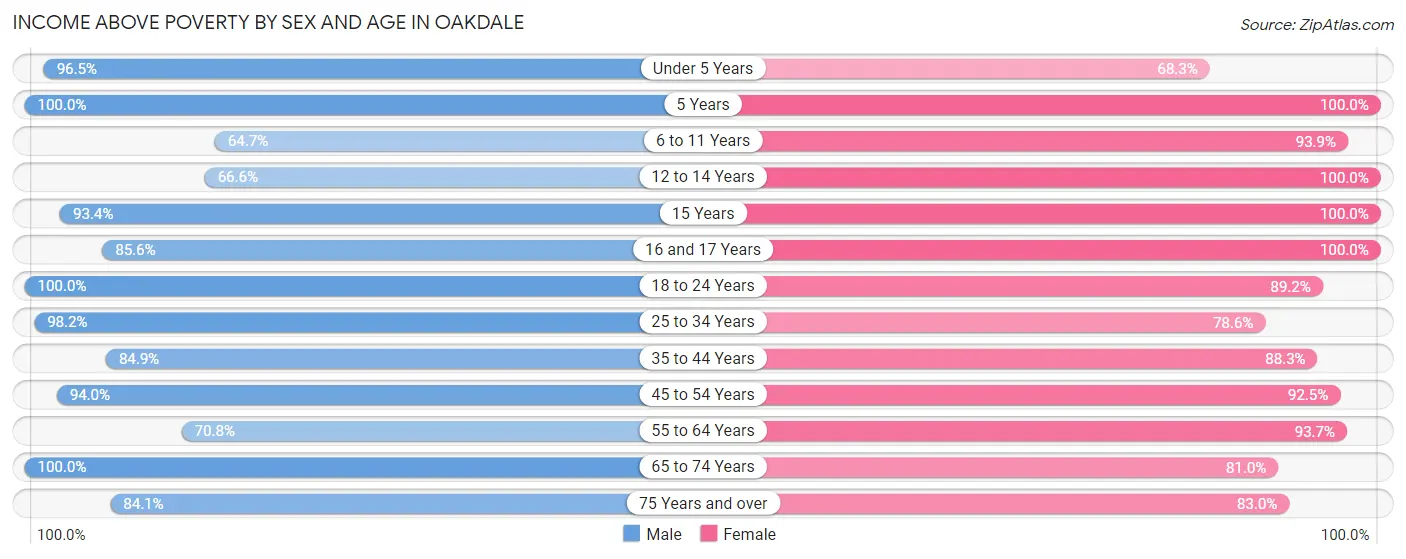
| Age Bracket | Male | Female |
| Under 5 Years | 734 (96.5%) | 576 (68.2%) |
| 5 Years | 183 (100.0%) | 257 (100.0%) |
| 6 to 11 Years | 615 (64.7%) | 819 (93.9%) |
| 12 to 14 Years | 408 (66.6%) | 526 (100.0%) |
| 15 Years | 170 (93.4%) | 103 (100.0%) |
| 16 and 17 Years | 433 (85.6%) | 364 (100.0%) |
| 18 to 24 Years | 1,145 (100.0%) | 912 (89.2%) |
| 25 to 34 Years | 1,370 (98.2%) | 1,181 (78.6%) |
| 35 to 44 Years | 1,056 (84.9%) | 1,610 (88.3%) |
| 45 to 54 Years | 1,431 (94.0%) | 1,144 (92.5%) |
| 55 to 64 Years | 1,176 (70.8%) | 1,121 (93.7%) |
| 65 to 74 Years | 695 (100.0%) | 686 (81.0%) |
| 75 Years and over | 412 (84.1%) | 768 (83.0%) |
| Total | 9,828 (86.6%) | 10,067 (87.4%) |
Income Below Poverty Among Married-Couple Families in Oakdale
The poverty statistics for married-couple families in Oakdale show that 5.4% or 244 of the total 4,486 families live below the poverty line. Families with 3 or 4 children have the highest poverty rate of 17.2%, comprising of 92 families. On the other hand, families with 5 or more children have the lowest poverty rate of 0.0%, which includes 0 families.
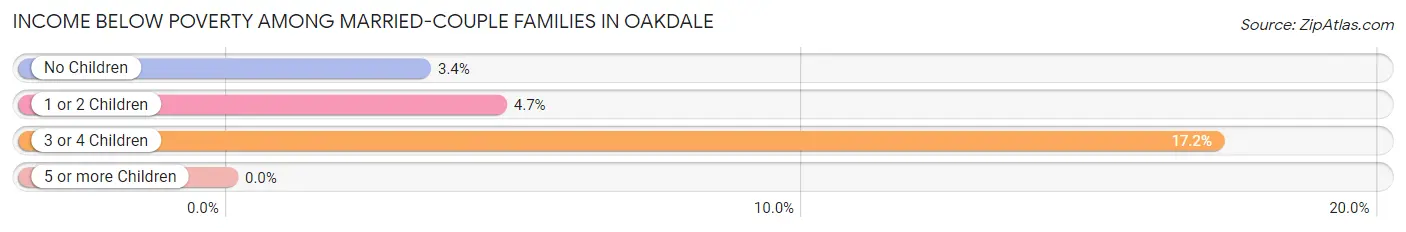
| Children | Above Poverty | Below Poverty |
| No Children | 2,330 (96.6%) | 81 (3.4%) |
| 1 or 2 Children | 1,447 (95.3%) | 71 (4.7%) |
| 3 or 4 Children | 444 (82.8%) | 92 (17.2%) |
| 5 or more Children | 21 (100.0%) | 0 (0.0%) |
| Total | 4,242 (94.6%) | 244 (5.4%) |
Income Below Poverty Among Single-Parent Households in Oakdale
According to the poverty data in Oakdale, 28.1% or 160 single-father households and 18.1% or 173 single-mother households are living below the poverty line. Among single-father households, those with 1 or 2 children have the highest poverty rate, with 154 households (40.6%) experiencing poverty. Likewise, among single-mother households, those with 3 or 4 children have the highest poverty rate, with 25 households (39.7%) falling below the poverty line.
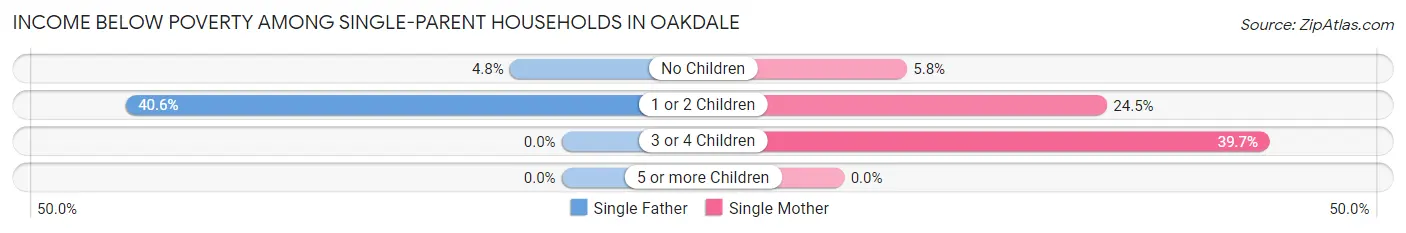
| Children | Single Father | Single Mother |
| No Children | 6 (4.8%) | 22 (5.8%) |
| 1 or 2 Children | 154 (40.6%) | 126 (24.5%) |
| 3 or 4 Children | 0 (0.0%) | 25 (39.7%) |
| 5 or more Children | 0 (0.0%) | 0 (0.0%) |
| Total | 160 (28.1%) | 173 (18.1%) |
Income Below Poverty Among Married-Couple vs Single-Parent Households in Oakdale
The poverty data for Oakdale shows that 244 of the married-couple family households (5.4%) and 333 of the single-parent households (21.8%) are living below the poverty level. Within the married-couple family households, those with 3 or 4 children have the highest poverty rate, with 92 households (17.2%) falling below the poverty line. Among the single-parent households, those with 1 or 2 children have the highest poverty rate, with 280 household (31.3%) living below poverty.
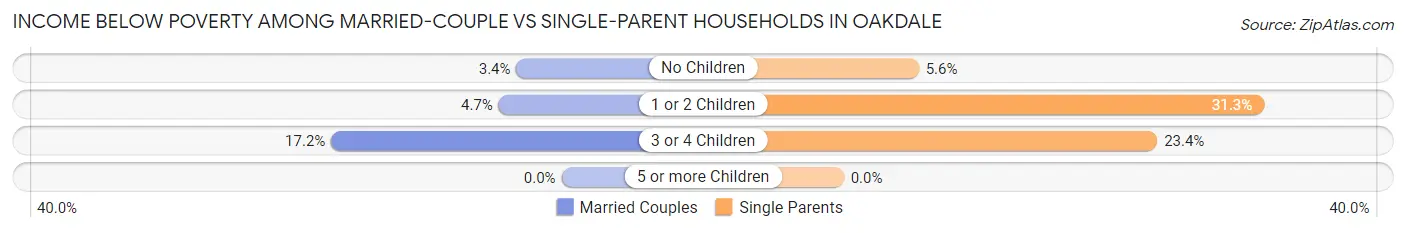
| Children | Married-Couple Families | Single-Parent Households |
| No Children | 81 (3.4%) | 28 (5.6%) |
| 1 or 2 Children | 71 (4.7%) | 280 (31.3%) |
| 3 or 4 Children | 92 (17.2%) | 25 (23.4%) |
| 5 or more Children | 0 (0.0%) | 0 (0.0%) |
| Total | 244 (5.4%) | 333 (21.8%) |
Race in Oakdale
The most populous races in Oakdale are White / Caucasian (16,143 | 69.8%), Hispanic or Latino (7,473 | 32.3%), and Two or more Races (3,558 | 15.4%).
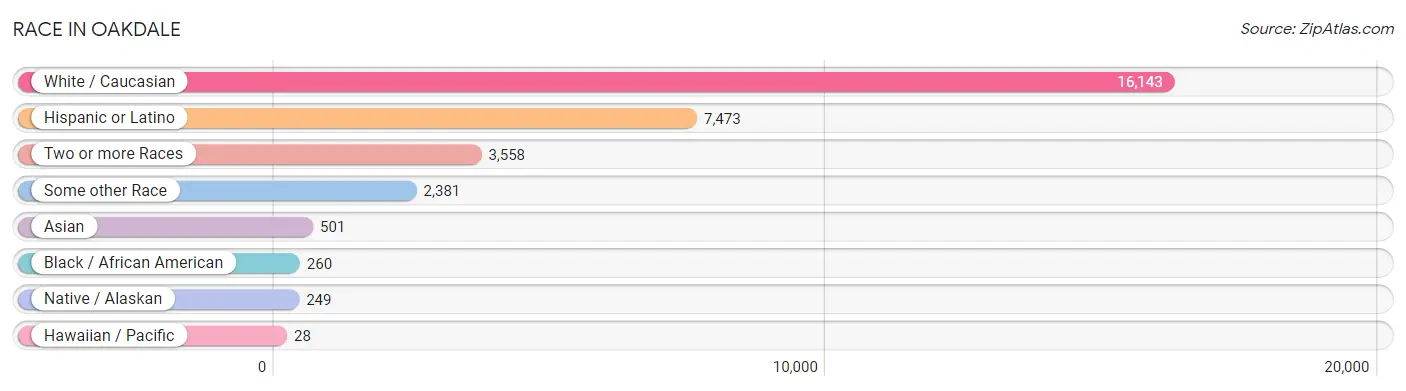
| Race | # Population | % Population |
| Asian | 501 | 2.2% |
| Black / African American | 260 | 1.1% |
| Hawaiian / Pacific | 28 | 0.1% |
| Hispanic or Latino | 7,473 | 32.3% |
| Native / Alaskan | 249 | 1.1% |
| White / Caucasian | 16,143 | 69.8% |
| Two or more Races | 3,558 | 15.4% |
| Some other Race | 2,381 | 10.3% |
| Total | 23,120 | 100.0% |
Ancestry in Oakdale
The most populous ancestries reported in Oakdale are Mexican (6,324 | 27.4%), German (2,224 | 9.6%), Irish (2,167 | 9.4%), English (2,097 | 9.1%), and Italian (1,872 | 8.1%), together accounting for 63.5% of all Oakdale residents.
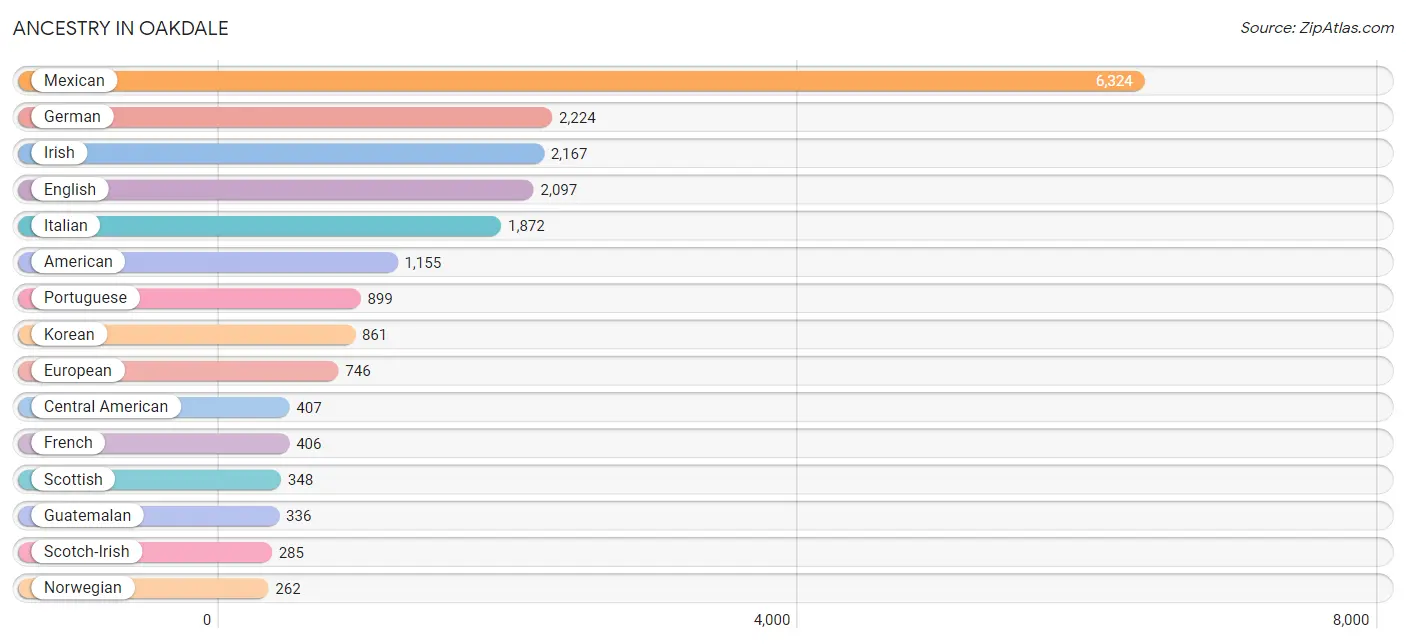
| Ancestry | # Population | % Population |
| American | 1,155 | 5.0% |
| Apache | 43 | 0.2% |
| Arab | 47 | 0.2% |
| Argentinean | 38 | 0.2% |
| Austrian | 13 | 0.1% |
| Basque | 16 | 0.1% |
| Bhutanese | 47 | 0.2% |
| Blackfeet | 66 | 0.3% |
| British | 113 | 0.5% |
| Canadian | 18 | 0.1% |
| Central American | 407 | 1.8% |
| Cherokee | 136 | 0.6% |
| Chickasaw | 13 | 0.1% |
| Chilean | 40 | 0.2% |
| Choctaw | 23 | 0.1% |
| Cree | 24 | 0.1% |
| Cuban | 111 | 0.5% |
| Czech | 66 | 0.3% |
| Czechoslovakian | 39 | 0.2% |
| Danish | 58 | 0.3% |
| Delaware | 12 | 0.1% |
| Dutch | 233 | 1.0% |
| Egyptian | 11 | 0.1% |
| English | 2,097 | 9.1% |
| Ethiopian | 22 | 0.1% |
| European | 746 | 3.2% |
| Finnish | 67 | 0.3% |
| French | 406 | 1.8% |
| French Canadian | 53 | 0.2% |
| German | 2,224 | 9.6% |
| Greek | 200 | 0.9% |
| Guatemalan | 336 | 1.5% |
| Hungarian | 31 | 0.1% |
| Indian (Asian) | 187 | 0.8% |
| Iranian | 161 | 0.7% |
| Irish | 2,167 | 9.4% |
| Italian | 1,872 | 8.1% |
| Japanese | 1 | 0.0% |
| Korean | 861 | 3.7% |
| Lebanese | 36 | 0.2% |
| Mexican | 6,324 | 27.4% |
| Mexican American Indian | 108 | 0.5% |
| Native Hawaiian | 125 | 0.5% |
| Navajo | 61 | 0.3% |
| Nigerian | 67 | 0.3% |
| Norwegian | 262 | 1.1% |
| Panamanian | 39 | 0.2% |
| Peruvian | 55 | 0.2% |
| Polish | 237 | 1.0% |
| Portuguese | 899 | 3.9% |
| Pueblo | 18 | 0.1% |
| Puerto Rican | 113 | 0.5% |
| Russian | 172 | 0.7% |
| Salvadoran | 32 | 0.1% |
| Scandinavian | 228 | 1.0% |
| Scotch-Irish | 285 | 1.2% |
| Scottish | 348 | 1.5% |
| Slavic | 30 | 0.1% |
| South American | 144 | 0.6% |
| Spaniard | 204 | 0.9% |
| Spanish | 50 | 0.2% |
| Sri Lankan | 98 | 0.4% |
| Subsaharan African | 89 | 0.4% |
| Swedish | 223 | 1.0% |
| Swiss | 162 | 0.7% |
| Thai | 95 | 0.4% |
| Ukrainian | 12 | 0.1% |
| Venezuelan | 11 | 0.1% |
| Welsh | 151 | 0.6% |
| Yaqui | 134 | 0.6% | View All 70 Rows |
Immigrants in Oakdale
The most numerous immigrant groups reported in Oakdale came from Latin America (1,930 | 8.4%), Central America (1,858 | 8.0%), Mexico (1,706 | 7.4%), Europe (222 | 1.0%), and Asia (171 | 0.7%), together accounting for 25.5% of all Oakdale residents.
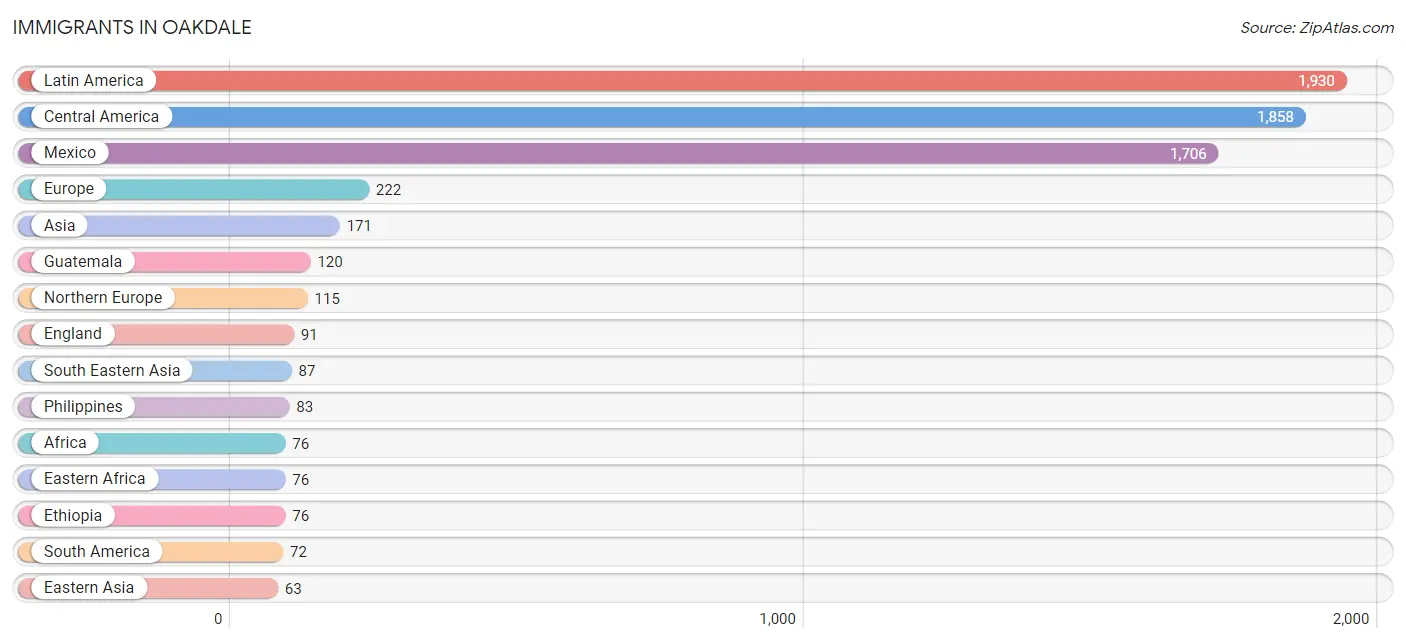
| Immigration Origin | # Population | % Population |
| Africa | 76 | 0.3% |
| Argentina | 38 | 0.2% |
| Asia | 171 | 0.7% |
| Azores | 16 | 0.1% |
| Canada | 18 | 0.1% |
| Central America | 1,858 | 8.0% |
| Chile | 11 | 0.1% |
| China | 46 | 0.2% |
| Eastern Africa | 76 | 0.3% |
| Eastern Asia | 63 | 0.3% |
| Eastern Europe | 25 | 0.1% |
| El Salvador | 32 | 0.1% |
| England | 91 | 0.4% |
| Ethiopia | 76 | 0.3% |
| Europe | 222 | 1.0% |
| Germany | 28 | 0.1% |
| Guatemala | 120 | 0.5% |
| India | 20 | 0.1% |
| Israel | 1 | 0.0% |
| Italy | 24 | 0.1% |
| Japan | 17 | 0.1% |
| Latin America | 1,930 | 8.4% |
| Mexico | 1,706 | 7.4% |
| Northern Europe | 115 | 0.5% |
| Peru | 12 | 0.1% |
| Philippines | 83 | 0.4% |
| Portugal | 26 | 0.1% |
| Russia | 13 | 0.1% |
| Scotland | 19 | 0.1% |
| South America | 72 | 0.3% |
| South Central Asia | 20 | 0.1% |
| South Eastern Asia | 87 | 0.4% |
| Southern Europe | 54 | 0.2% |
| Spain | 4 | 0.0% |
| Ukraine | 12 | 0.1% |
| Venezuela | 11 | 0.1% |
| Vietnam | 4 | 0.0% |
| Western Asia | 1 | 0.0% |
| Western Europe | 28 | 0.1% | View All 39 Rows |
Sex and Age in Oakdale
Sex and Age in Oakdale
The most populous age groups in Oakdale are 15 to 19 Years (1,087 | 9.4%) for men and 40 to 44 Years (992 | 8.6%) for women.
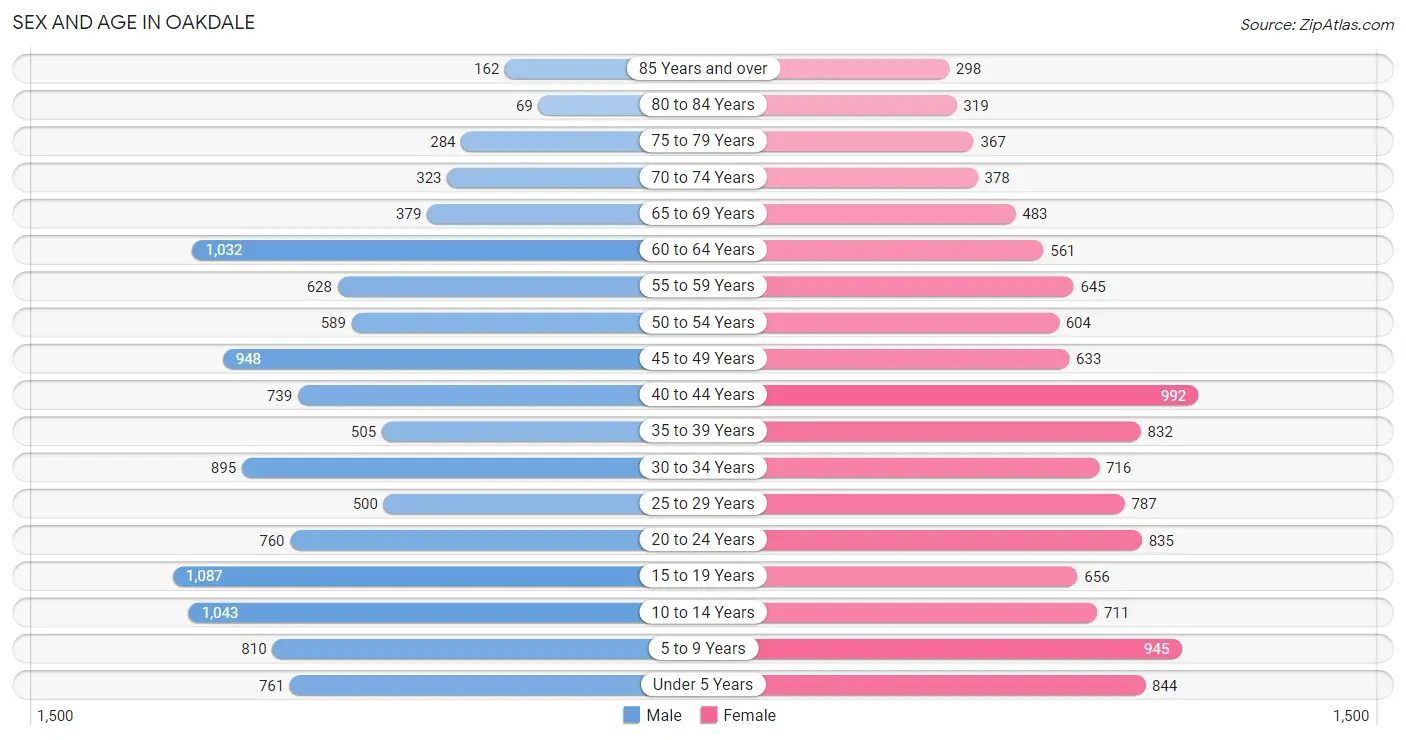
| Age Bracket | Male | Female |
| Under 5 Years | 761 (6.6%) | 844 (7.3%) |
| 5 to 9 Years | 810 (7.0%) | 945 (8.1%) |
| 10 to 14 Years | 1,043 (9.1%) | 711 (6.1%) |
| 15 to 19 Years | 1,087 (9.4%) | 656 (5.7%) |
| 20 to 24 Years | 760 (6.6%) | 835 (7.2%) |
| 25 to 29 Years | 500 (4.3%) | 787 (6.8%) |
| 30 to 34 Years | 895 (7.8%) | 716 (6.2%) |
| 35 to 39 Years | 505 (4.4%) | 832 (7.2%) |
| 40 to 44 Years | 739 (6.4%) | 992 (8.6%) |
| 45 to 49 Years | 948 (8.2%) | 633 (5.4%) |
| 50 to 54 Years | 589 (5.1%) | 604 (5.2%) |
| 55 to 59 Years | 628 (5.4%) | 645 (5.6%) |
| 60 to 64 Years | 1,032 (9.0%) | 561 (4.8%) |
| 65 to 69 Years | 379 (3.3%) | 483 (4.2%) |
| 70 to 74 Years | 323 (2.8%) | 378 (3.3%) |
| 75 to 79 Years | 284 (2.5%) | 367 (3.2%) |
| 80 to 84 Years | 69 (0.6%) | 319 (2.8%) |
| 85 Years and over | 162 (1.4%) | 298 (2.6%) |
| Total | 11,514 (100.0%) | 11,606 (100.0%) |
Families and Households in Oakdale
Median Family Size in Oakdale
The median family size in Oakdale is 3.26 persons per family, with married-couple families (4,486 | 74.6%) accounting for the largest median family size of 3.45 persons per family. On the other hand, single female/mother families (955 | 15.9%) represent the smallest median family size with 2.66 persons per family.
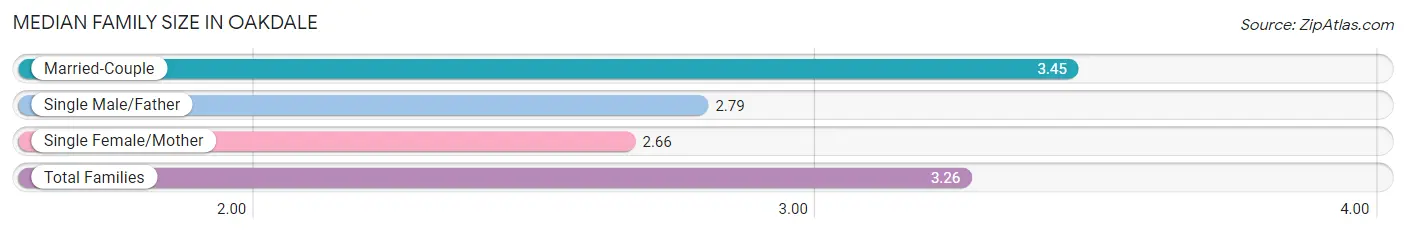
| Family Type | # Families | Family Size |
| Married-Couple | 4,486 (74.6%) | 3.45 |
| Single Male/Father | 570 (9.5%) | 2.79 |
| Single Female/Mother | 955 (15.9%) | 2.66 |
| Total Families | 6,011 (100.0%) | 3.26 |
Median Household Size in Oakdale
The median household size in Oakdale is 2.76 persons per household, with married-couple households (4,486 | 54.1%) accounting for the largest median household size of 3.47 persons per household. non-family households (2,282 | 27.5%) represent the smallest median household size with 1.13 persons per household.
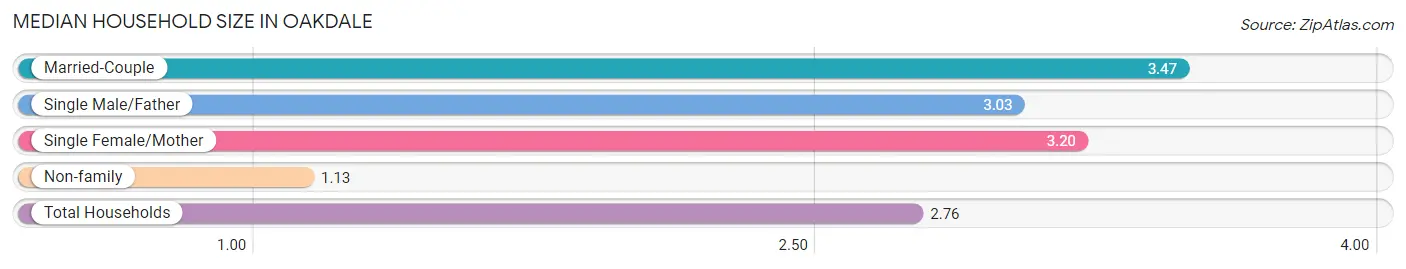
| Household Type | # Households | Household Size |
| Married-Couple | 4,486 (54.1%) | 3.47 |
| Single Male/Father | 570 (6.9%) | 3.03 |
| Single Female/Mother | 955 (11.5%) | 3.20 |
| Non-family | 2,282 (27.5%) | 1.13 |
| Total Households | 8,293 (100.0%) | 2.76 |
Household Size by Marriage Status in Oakdale
Out of a total of 8,293 households in Oakdale, 6,011 (72.5%) are family households, while 2,282 (27.5%) are nonfamily households. The most numerous type of family households are 2-person households, comprising 2,325, and the most common type of nonfamily households are 1-person households, comprising 2,046.
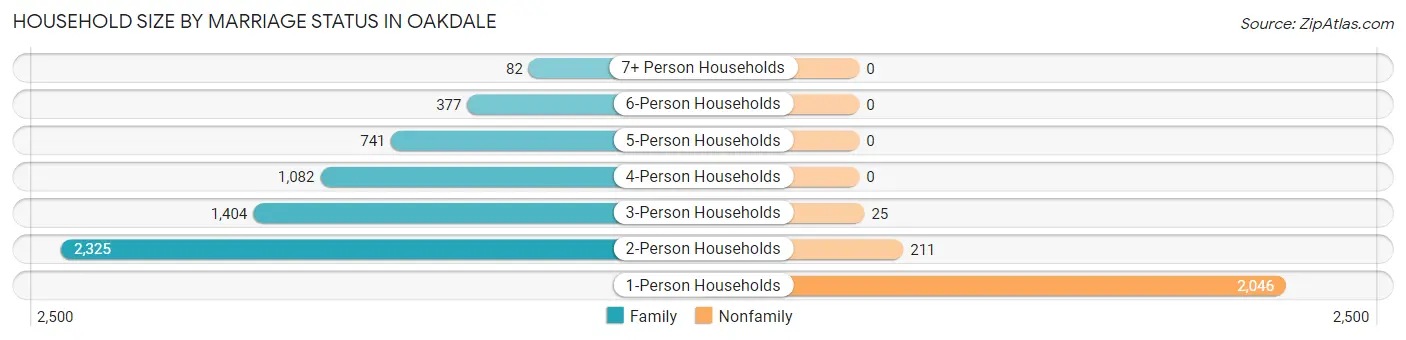
| Household Size | Family Households | Nonfamily Households |
| 1-Person Households | - | 2,046 (24.7%) |
| 2-Person Households | 2,325 (28.0%) | 211 (2.5%) |
| 3-Person Households | 1,404 (16.9%) | 25 (0.3%) |
| 4-Person Households | 1,082 (13.1%) | 0 (0.0%) |
| 5-Person Households | 741 (8.9%) | 0 (0.0%) |
| 6-Person Households | 377 (4.5%) | 0 (0.0%) |
| 7+ Person Households | 82 (1.0%) | 0 (0.0%) |
| Total | 6,011 (72.5%) | 2,282 (27.5%) |
Female Fertility in Oakdale
Fertility by Age in Oakdale
Average fertility rate in Oakdale is 28.0 births per 1,000 women. Women in the age bracket of 20 to 34 years have the highest fertility rate with 67.0 births per 1,000 women. Women in the age bracket of 20 to 34 years acount for 100.0% of all women with births.
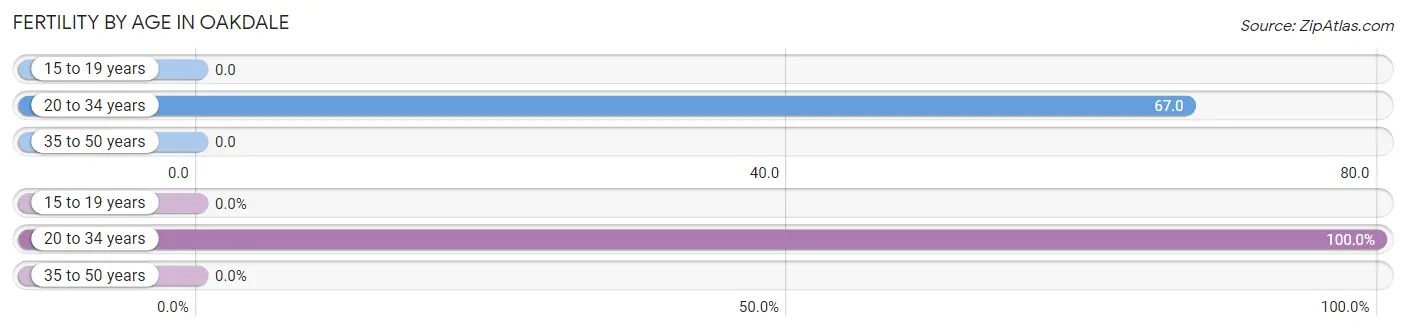
| Age Bracket | Women with Births | Births / 1,000 Women |
| 15 to 19 years | 0 (0.0%) | 0.0 |
| 20 to 34 years | 157 (100.0%) | 67.0 |
| 35 to 50 years | 0 (0.0%) | 0.0 |
| Total | 157 (100.0%) | 28.0 |
Fertility by Age by Marriage Status in Oakdale
43.9% of women with births (157) in Oakdale are married. The highest percentage of unmarried women with births falls into 20 to 34 years age bracket with 56.0% of them unmarried at the time of birth, while the lowest percentage of unmarried women with births belong to 20 to 34 years age bracket with 56.0% of them unmarried.
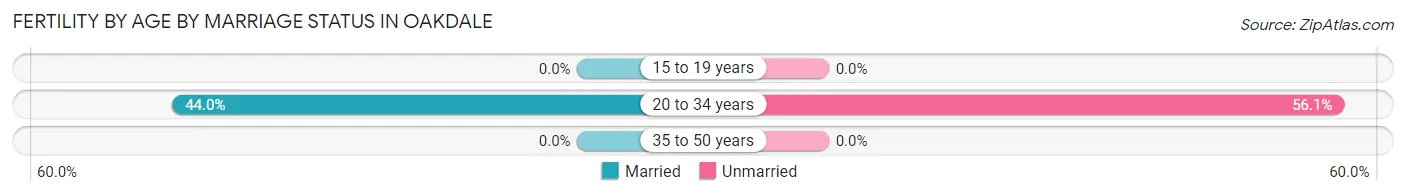
| Age Bracket | Married | Unmarried |
| 15 to 19 years | 0 (0.0%) | 0 (0.0%) |
| 20 to 34 years | 69 (44.0%) | 88 (56.0%) |
| 35 to 50 years | 0 (0.0%) | 0 (0.0%) |
| Total | 69 (44.0%) | 88 (56.0%) |
Fertility by Education in Oakdale
Average fertility rate in Oakdale is 28.0 births per 1,000 women. Women with the education attainment of high school diploma have the highest fertility rate of 36.0 births per 1,000 women, while women with the education attainment of less than high school have the lowest fertility at 8.0 births per 1,000 women. Women with the education attainment of college or associate's degree represent 47.8% of all women with births.
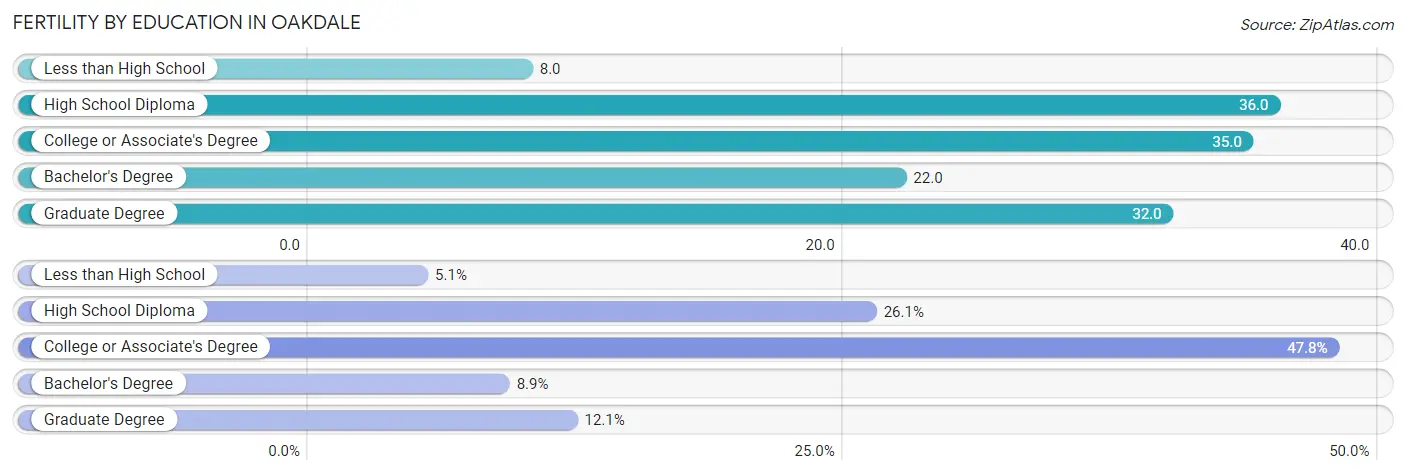
| Educational Attainment | Women with Births | Births / 1,000 Women |
| Less than High School | 8 (5.1%) | 8.0 |
| High School Diploma | 41 (26.1%) | 36.0 |
| College or Associate's Degree | 75 (47.8%) | 35.0 |
| Bachelor's Degree | 14 (8.9%) | 22.0 |
| Graduate Degree | 19 (12.1%) | 32.0 |
| Total | 157 (100.0%) | 28.0 |
Fertility by Education by Marriage Status in Oakdale
56.0% of women with births in Oakdale are unmarried. Women with the educational attainment of less than high school are most likely to be married with 100.0% of them married at childbirth, while women with the educational attainment of bachelor's degree are least likely to be married with 100.0% of them unmarried at childbirth.
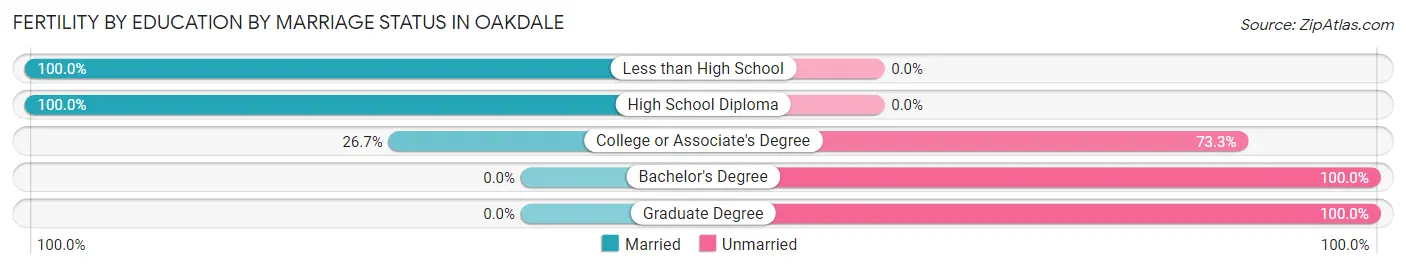
| Educational Attainment | Married | Unmarried |
| Less than High School | 8 (100.0%) | 0 (0.0%) |
| High School Diploma | 41 (100.0%) | 0 (0.0%) |
| College or Associate's Degree | 20 (26.7%) | 55 (73.3%) |
| Bachelor's Degree | 0 (0.0%) | 14 (100.0%) |
| Graduate Degree | 0 (0.0%) | 19 (100.0%) |
| Total | 69 (44.0%) | 88 (56.0%) |
Employment Characteristics in Oakdale
Employment by Class of Employer in Oakdale
Among the 9,976 employed individuals in Oakdale, private company employees (6,146 | 61.6%), local government employees (1,522 | 15.3%), and self-employed (not incorporated) (850 | 8.5%) make up the most common classes of employment.
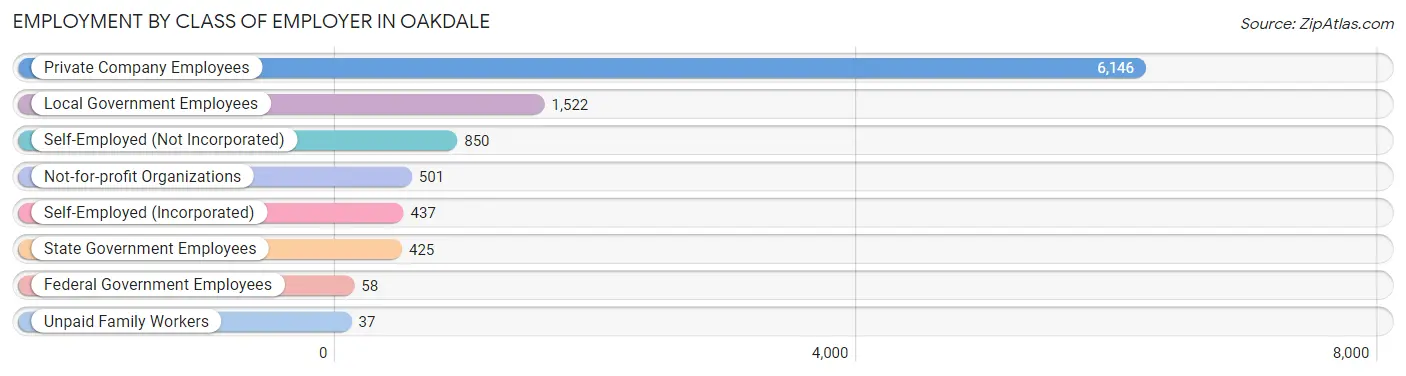
| Employer Class | # Employees | % Employees |
| Private Company Employees | 6,146 | 61.6% |
| Self-Employed (Incorporated) | 437 | 4.4% |
| Self-Employed (Not Incorporated) | 850 | 8.5% |
| Not-for-profit Organizations | 501 | 5.0% |
| Local Government Employees | 1,522 | 15.3% |
| State Government Employees | 425 | 4.3% |
| Federal Government Employees | 58 | 0.6% |
| Unpaid Family Workers | 37 | 0.4% |
| Total | 9,976 | 100.0% |
Employment Status by Age in Oakdale
According to the labor force statistics for Oakdale, out of the total population over 16 years of age (17,720), 63.5% or 11,252 individuals are in the labor force, with 8.6% or 968 of them unemployed. The age group with the highest labor force participation rate is 30 to 34 years, with 90.5% or 1,458 individuals in the labor force. Within the labor force, the 60 to 64 years age range has the highest percentage of unemployed individuals, with 29.5% or 331 of them being unemployed.
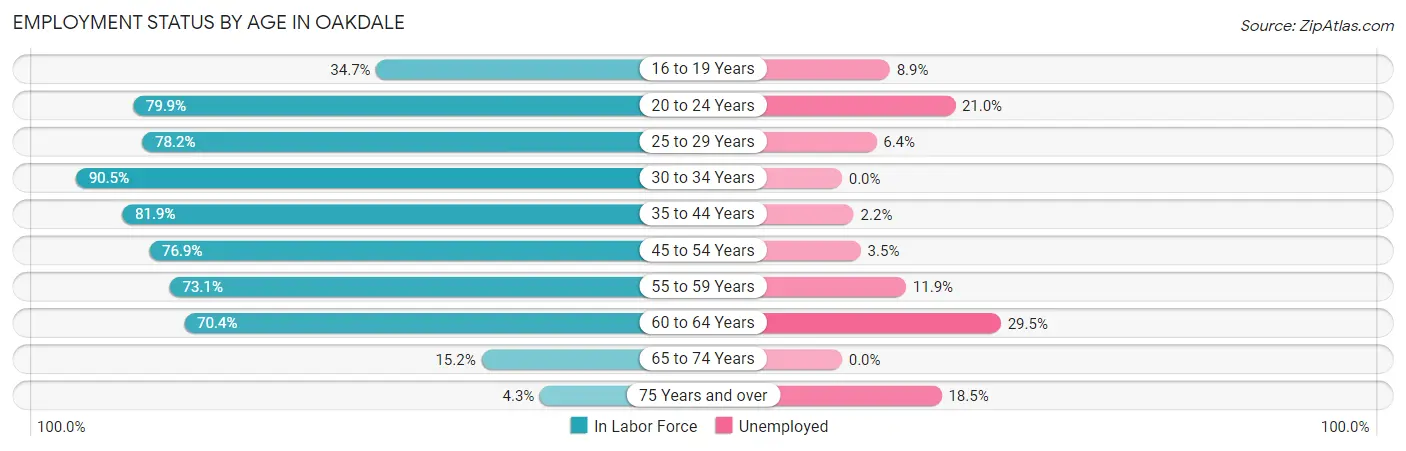
| Age Bracket | In Labor Force | Unemployed |
| 16 to 19 Years | 506 (34.7%) | 45 (8.9%) |
| 20 to 24 Years | 1,274 (79.9%) | 268 (21.0%) |
| 25 to 29 Years | 1,006 (78.2%) | 64 (6.4%) |
| 30 to 34 Years | 1,458 (90.5%) | 0 (0.0%) |
| 35 to 44 Years | 2,513 (81.9%) | 55 (2.2%) |
| 45 to 54 Years | 2,133 (76.9%) | 75 (3.5%) |
| 55 to 59 Years | 931 (73.1%) | 111 (11.9%) |
| 60 to 64 Years | 1,121 (70.4%) | 331 (29.5%) |
| 65 to 74 Years | 238 (15.2%) | 0 (0.0%) |
| 75 Years and over | 64 (4.3%) | 12 (18.5%) |
| Total | 11,252 (63.5%) | 968 (8.6%) |
Employment Status by Educational Attainment in Oakdale
According to labor force statistics for Oakdale, 78.9% of individuals (9,157) out of the total population between 25 and 64 years of age (11,606) are in the labor force, with 7.0% or 641 of them being unemployed. The group with the highest labor force participation rate are those with the educational attainment of bachelor's degree or higher, with 93.1% or 2,391 individuals in the labor force. Within the labor force, individuals with high school diploma education have the highest percentage of unemployment, with 24.5% or 528 of them being unemployed.
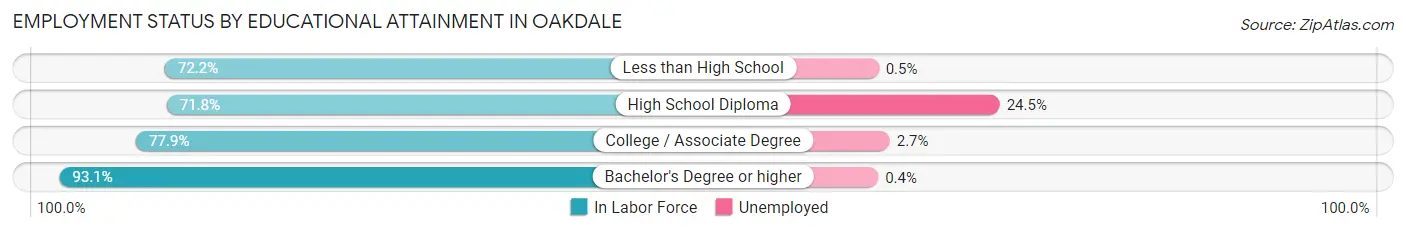
| Educational Attainment | In Labor Force | Unemployed |
| Less than High School | 1,084 (72.2%) | 8 (0.5%) |
| High School Diploma | 2,154 (71.8%) | 735 (24.5%) |
| College / Associate Degree | 3,534 (77.9%) | 122 (2.7%) |
| Bachelor's Degree or higher | 2,391 (93.1%) | 10 (0.4%) |
| Total | 9,157 (78.9%) | 812 (7.0%) |
Employment Occupations by Sex in Oakdale
Management, Business, Science and Arts Occupations
The most common Management, Business, Science and Arts occupations in Oakdale are Management (1,267 | 12.3%), Community & Social Service (922 | 9.0%), Education Instruction & Library (568 | 5.5%), Health Diagnosing & Treating (566 | 5.5%), and Computers, Engineering & Science (529 | 5.1%).
Management, Business, Science and Arts Occupations by Sex
Within the Management, Business, Science and Arts occupations in Oakdale, the most male-oriented occupations are Life, Physical & Social Science (100.0%), Computers, Engineering & Science (76.7%), and Architecture & Engineering (74.2%), while the most female-oriented occupations are Education, Arts & Media (100.0%), Legal Services & Support (100.0%), and Health Technologists (88.5%).
| Occupation | Male | Female |
| Management | 702 (55.4%) | 565 (44.6%) |
| Business & Financial | 136 (33.7%) | 268 (66.3%) |
| Computers, Engineering & Science | 406 (76.7%) | 123 (23.3%) |
| Computers & Mathematics | 77 (71.3%) | 31 (28.7%) |
| Architecture & Engineering | 265 (74.2%) | 92 (25.8%) |
| Life, Physical & Social Science | 64 (100.0%) | 0 (0.0%) |
| Community & Social Service | 164 (17.8%) | 758 (82.2%) |
| Education, Arts & Media | 0 (0.0%) | 139 (100.0%) |
| Legal Services & Support | 0 (0.0%) | 114 (100.0%) |
| Education Instruction & Library | 141 (24.8%) | 427 (75.2%) |
| Arts, Media & Entertainment | 23 (22.8%) | 78 (77.2%) |
| Health Diagnosing & Treating | 113 (20.0%) | 453 (80.0%) |
| Health Technologists | 47 (11.5%) | 361 (88.5%) |
| Total (Category) | 1,521 (41.2%) | 2,167 (58.8%) |
| Total (Overall) | 5,467 (53.2%) | 4,816 (46.8%) |
Services Occupations
The most common Services occupations in Oakdale are Food Preparation & Serving (714 | 6.9%), Cleaning & Maintenance (456 | 4.4%), Personal Care & Service (400 | 3.9%), Security & Protection (287 | 2.8%), and Law Enforcement (263 | 2.6%).
Services Occupations by Sex
Within the Services occupations in Oakdale, the most male-oriented occupations are Firefighting & Prevention (100.0%), Security & Protection (85.4%), and Law Enforcement (84.0%), while the most female-oriented occupations are Healthcare Support (89.8%), Personal Care & Service (81.8%), and Food Preparation & Serving (50.7%).
| Occupation | Male | Female |
| Healthcare Support | 18 (10.2%) | 159 (89.8%) |
| Security & Protection | 245 (85.4%) | 42 (14.6%) |
| Firefighting & Prevention | 24 (100.0%) | 0 (0.0%) |
| Law Enforcement | 221 (84.0%) | 42 (16.0%) |
| Food Preparation & Serving | 352 (49.3%) | 362 (50.7%) |
| Cleaning & Maintenance | 295 (64.7%) | 161 (35.3%) |
| Personal Care & Service | 73 (18.2%) | 327 (81.8%) |
| Total (Category) | 983 (48.3%) | 1,051 (51.7%) |
| Total (Overall) | 5,467 (53.2%) | 4,816 (46.8%) |
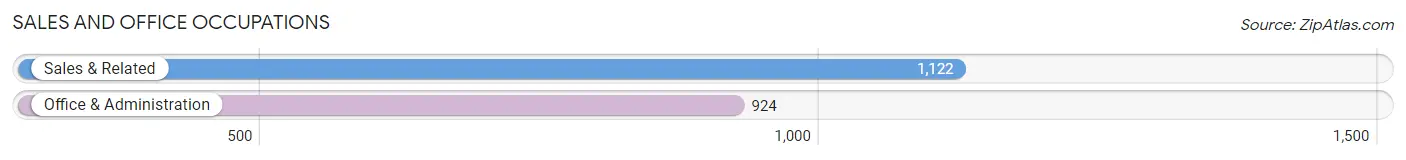
Sales and Office Occupations
The most common Sales and Office occupations in Oakdale are Sales & Related (1,122 | 10.9%), and Office & Administration (924 | 9.0%).
Sales and Office Occupations by Sex
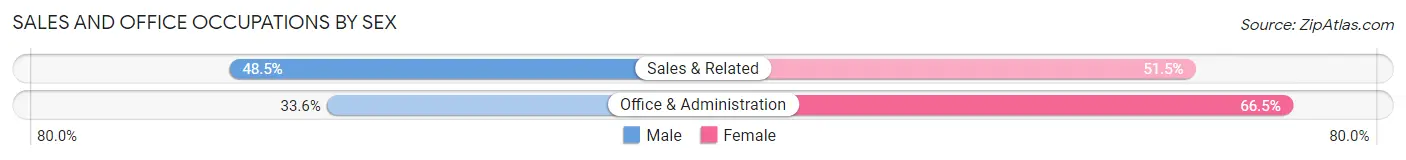
| Occupation | Male | Female |
| Sales & Related | 544 (48.5%) | 578 (51.5%) |
| Office & Administration | 310 (33.6%) | 614 (66.4%) |
| Total (Category) | 854 (41.7%) | 1,192 (58.3%) |
| Total (Overall) | 5,467 (53.2%) | 4,816 (46.8%) |
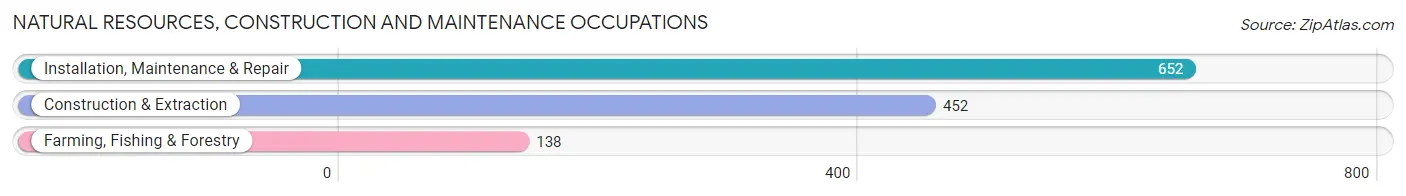
Natural Resources, Construction and Maintenance Occupations
The most common Natural Resources, Construction and Maintenance occupations in Oakdale are Installation, Maintenance & Repair (652 | 6.3%), Construction & Extraction (452 | 4.4%), and Farming, Fishing & Forestry (138 | 1.3%).
Natural Resources, Construction and Maintenance Occupations by Sex
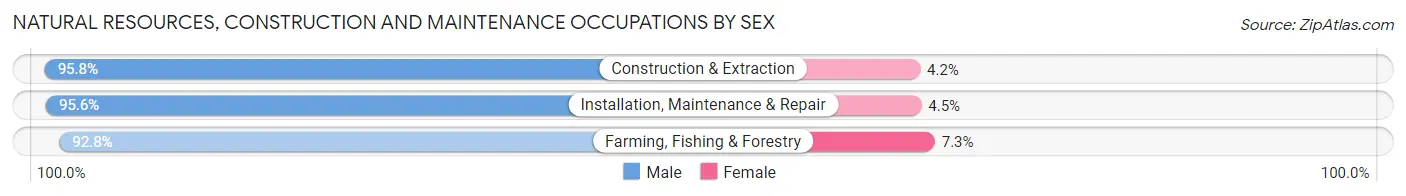
| Occupation | Male | Female |
| Farming, Fishing & Forestry | 128 (92.7%) | 10 (7.2%) |
| Construction & Extraction | 433 (95.8%) | 19 (4.2%) |
| Installation, Maintenance & Repair | 623 (95.6%) | 29 (4.4%) |
| Total (Category) | 1,184 (95.3%) | 58 (4.7%) |
| Total (Overall) | 5,467 (53.2%) | 4,816 (46.8%) |
Production, Transportation and Moving Occupations
The most common Production, Transportation and Moving occupations in Oakdale are Production (619 | 6.0%), Material Moving (351 | 3.4%), and Transportation (303 | 2.9%).
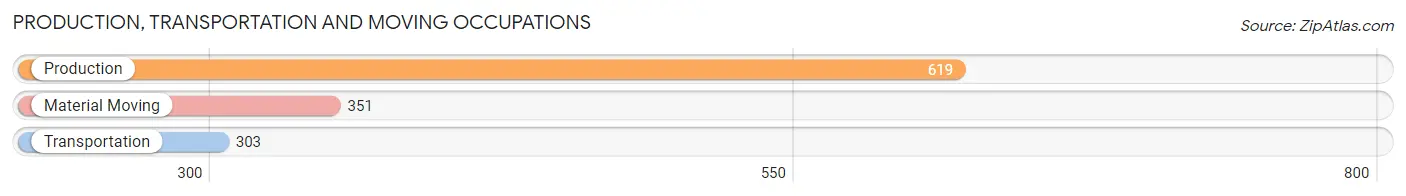
Production, Transportation and Moving Occupations by Sex
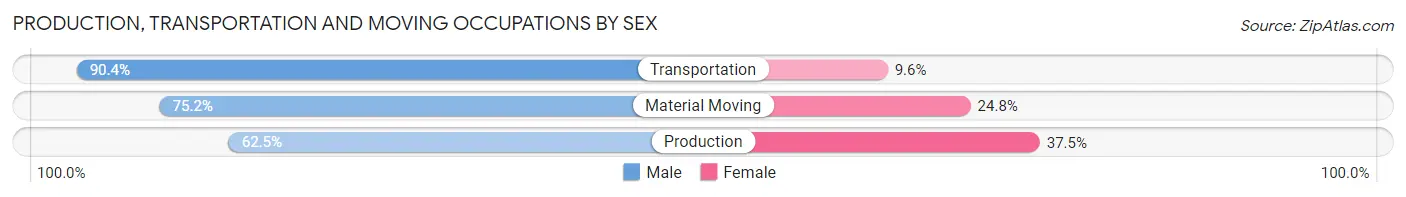
| Occupation | Male | Female |
| Production | 387 (62.5%) | 232 (37.5%) |
| Transportation | 274 (90.4%) | 29 (9.6%) |
| Material Moving | 264 (75.2%) | 87 (24.8%) |
| Total (Category) | 925 (72.7%) | 348 (27.3%) |
| Total (Overall) | 5,467 (53.2%) | 4,816 (46.8%) |
Employment Industries by Sex in Oakdale
Employment Industries in Oakdale
The major employment industries in Oakdale include Manufacturing (1,376 | 13.4%), Health Care & Social Assistance (1,215 | 11.8%), Educational Services (1,066 | 10.4%), Retail Trade (895 | 8.7%), and Accommodation & Food Services (799 | 7.8%).
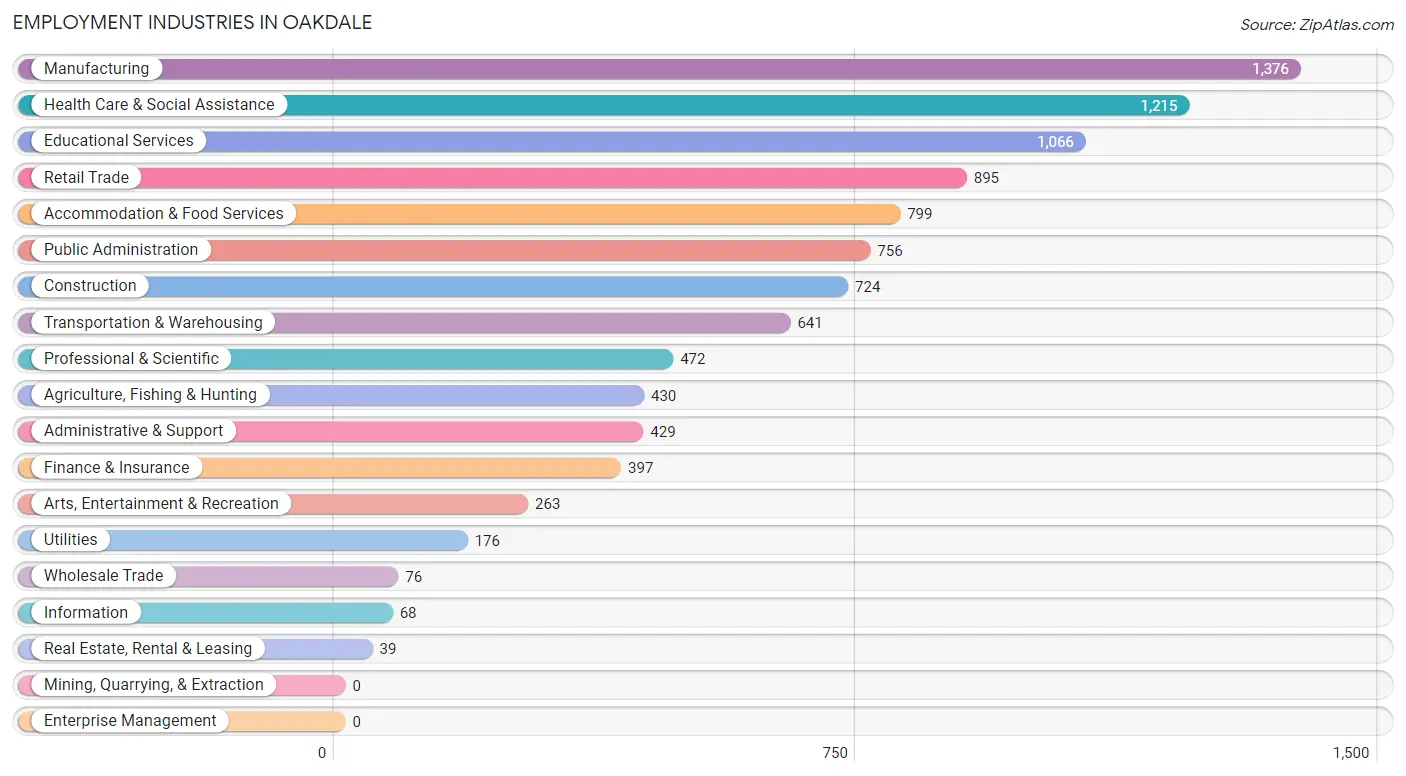
Employment Industries by Sex in Oakdale
The Oakdale industries that see more men than women are Agriculture, Fishing & Hunting (100.0%), Utilities (100.0%), and Information (100.0%), whereas the industries that tend to have a higher number of women are Educational Services (77.6%), Health Care & Social Assistance (72.3%), and Retail Trade (64.0%).
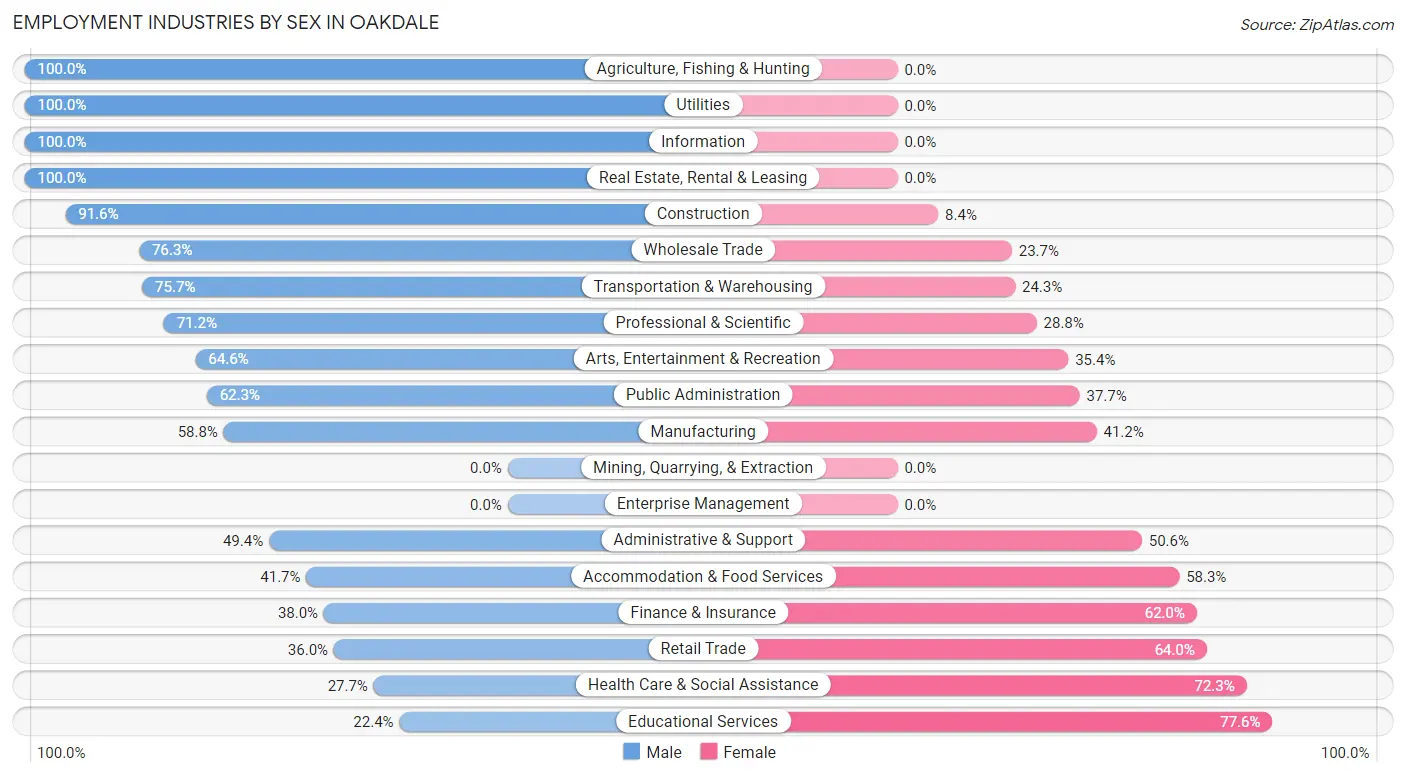
| Industry | Male | Female |
| Agriculture, Fishing & Hunting | 430 (100.0%) | 0 (0.0%) |
| Mining, Quarrying, & Extraction | 0 (0.0%) | 0 (0.0%) |
| Construction | 663 (91.6%) | 61 (8.4%) |
| Manufacturing | 809 (58.8%) | 567 (41.2%) |
| Wholesale Trade | 58 (76.3%) | 18 (23.7%) |
| Retail Trade | 322 (36.0%) | 573 (64.0%) |
| Transportation & Warehousing | 485 (75.7%) | 156 (24.3%) |
| Utilities | 176 (100.0%) | 0 (0.0%) |
| Information | 68 (100.0%) | 0 (0.0%) |
| Finance & Insurance | 151 (38.0%) | 246 (62.0%) |
| Real Estate, Rental & Leasing | 39 (100.0%) | 0 (0.0%) |
| Professional & Scientific | 336 (71.2%) | 136 (28.8%) |
| Enterprise Management | 0 (0.0%) | 0 (0.0%) |
| Administrative & Support | 212 (49.4%) | 217 (50.6%) |
| Educational Services | 239 (22.4%) | 827 (77.6%) |
| Health Care & Social Assistance | 337 (27.7%) | 878 (72.3%) |
| Arts, Entertainment & Recreation | 170 (64.6%) | 93 (35.4%) |
| Accommodation & Food Services | 333 (41.7%) | 466 (58.3%) |
| Public Administration | 471 (62.3%) | 285 (37.7%) |
| Total | 5,467 (53.2%) | 4,816 (46.8%) |
Education in Oakdale
School Enrollment in Oakdale
The most common levels of schooling among the 6,813 students in Oakdale are high school (1,665 | 24.4%), college / undergraduate (1,551 | 22.8%), and elementary school (1,419 | 20.8%).
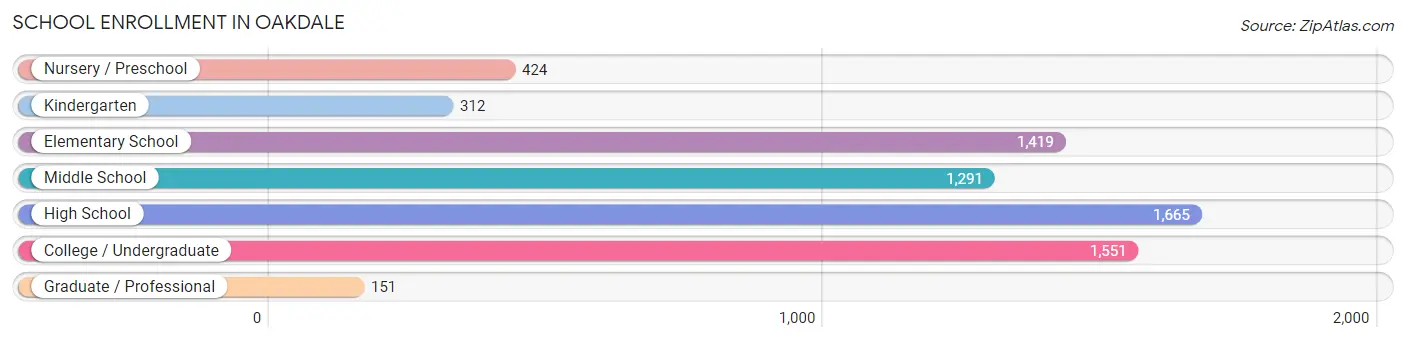
| School Level | # Students | % Students |
| Nursery / Preschool | 424 | 6.2% |
| Kindergarten | 312 | 4.6% |
| Elementary School | 1,419 | 20.8% |
| Middle School | 1,291 | 19.0% |
| High School | 1,665 | 24.4% |
| College / Undergraduate | 1,551 | 22.8% |
| Graduate / Professional | 151 | 2.2% |
| Total | 6,813 | 100.0% |
School Enrollment by Age by Funding Source in Oakdale
Out of a total of 6,813 students who are enrolled in schools in Oakdale, 906 (13.3%) attend a private institution, while the remaining 5,907 (86.7%) are enrolled in public schools. The age group of 3 to 4 year olds has the highest likelihood of being enrolled in private schools, with 260 (80.2% in the age bracket) enrolled. Conversely, the age group of 18 to 19 year olds has the lowest likelihood of being enrolled in a private school, with 489 (98.8% in the age bracket) attending a public institution.
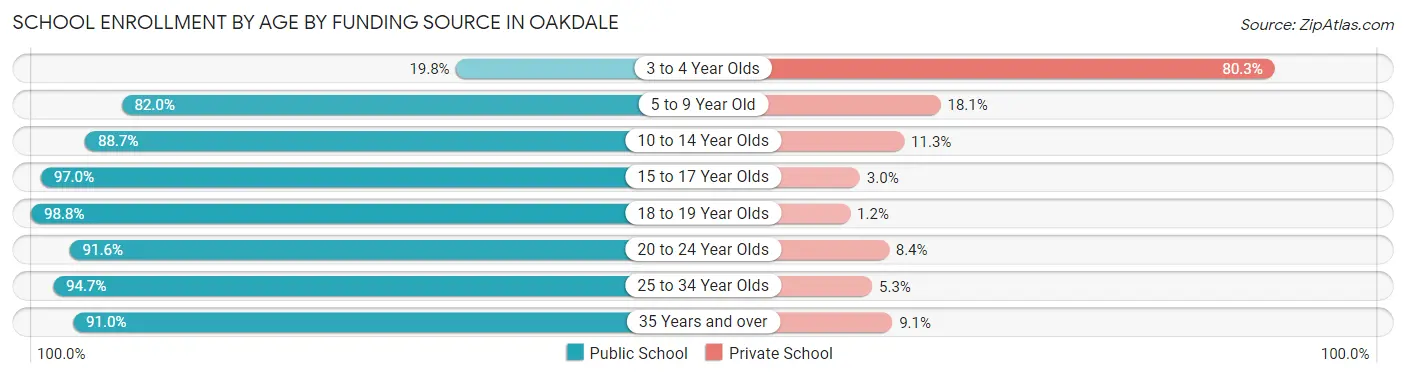
| Age Bracket | Public School | Private School |
| 3 to 4 Year Olds | 64 (19.8%) | 260 (80.2%) |
| 5 to 9 Year Old | 1,371 (82.0%) | 302 (18.0%) |
| 10 to 14 Year Olds | 1,511 (88.7%) | 192 (11.3%) |
| 15 to 17 Year Olds | 1,123 (97.0%) | 35 (3.0%) |
| 18 to 19 Year Olds | 489 (98.8%) | 6 (1.2%) |
| 20 to 24 Year Olds | 600 (91.6%) | 55 (8.4%) |
| 25 to 34 Year Olds | 375 (94.7%) | 21 (5.3%) |
| 35 Years and over | 372 (90.9%) | 37 (9.0%) |
| Total | 5,907 (86.7%) | 906 (13.3%) |
Educational Attainment by Field of Study in Oakdale
Business (500 | 15.1%), education (361 | 10.9%), science & technology (329 | 9.9%), liberal arts & history (328 | 9.9%), and engineering (303 | 9.1%) are the most common fields of study among 3,311 individuals in Oakdale who have obtained a bachelor's degree or higher.
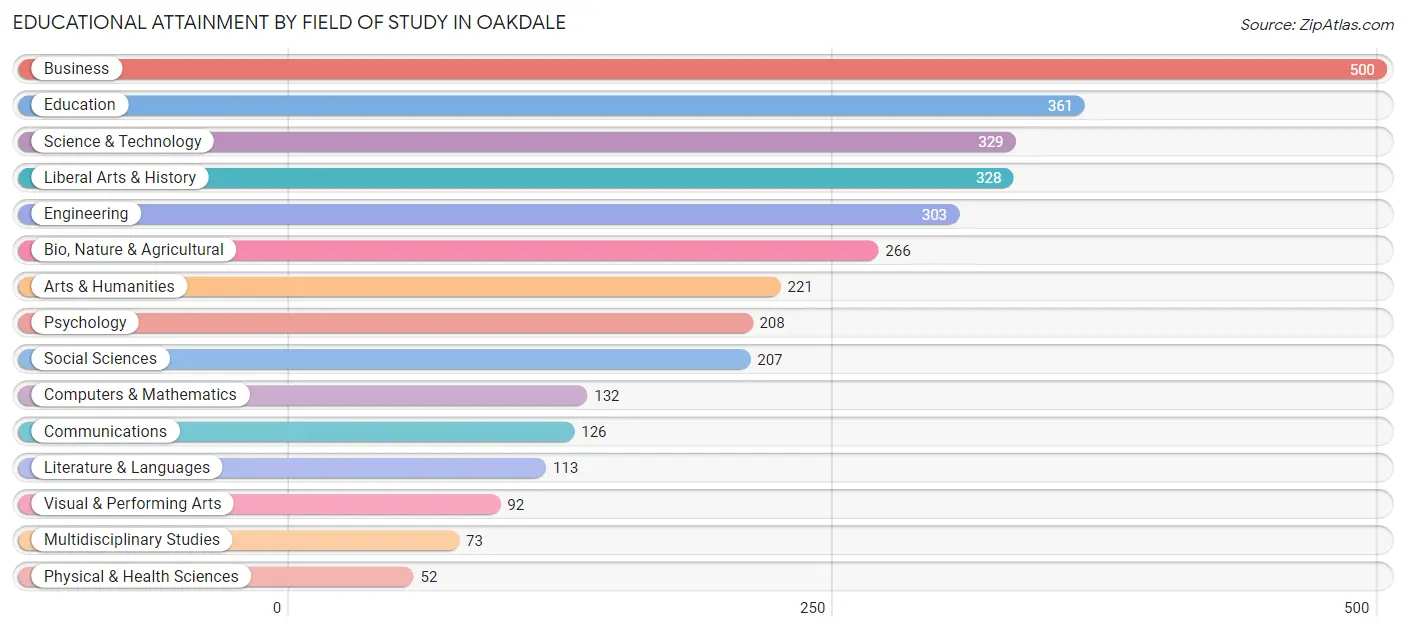
| Field of Study | # Graduates | % Graduates |
| Computers & Mathematics | 132 | 4.0% |
| Bio, Nature & Agricultural | 266 | 8.0% |
| Physical & Health Sciences | 52 | 1.6% |
| Psychology | 208 | 6.3% |
| Social Sciences | 207 | 6.2% |
| Engineering | 303 | 9.1% |
| Multidisciplinary Studies | 73 | 2.2% |
| Science & Technology | 329 | 9.9% |
| Business | 500 | 15.1% |
| Education | 361 | 10.9% |
| Literature & Languages | 113 | 3.4% |
| Liberal Arts & History | 328 | 9.9% |
| Visual & Performing Arts | 92 | 2.8% |
| Communications | 126 | 3.8% |
| Arts & Humanities | 221 | 6.7% |
| Total | 3,311 | 100.0% |
Transportation & Commute in Oakdale
Vehicle Availability by Sex in Oakdale
The most prevalent vehicle ownership categories in Oakdale are males with 2 vehicles (1,987, accounting for 37.1%) and females with 2 vehicles (1,558, making up 43.1%).
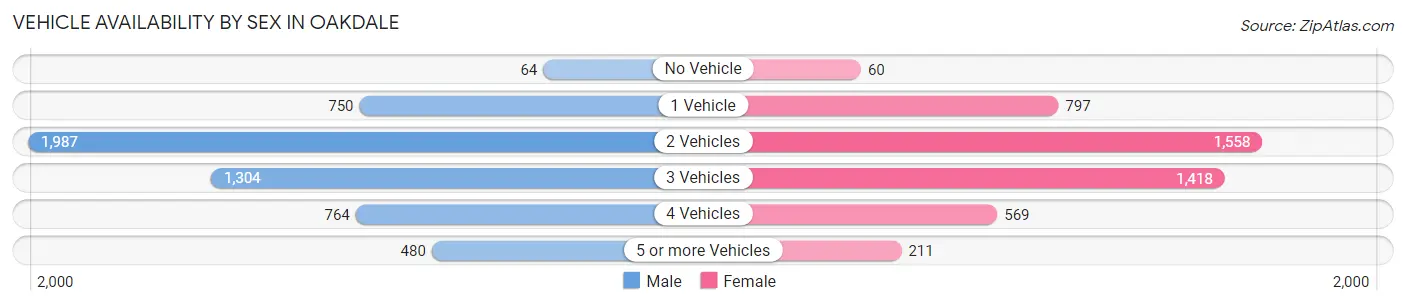
| Vehicles Available | Male | Female |
| No Vehicle | 64 (1.2%) | 60 (1.3%) |
| 1 Vehicle | 750 (14.0%) | 797 (17.3%) |
| 2 Vehicles | 1,987 (37.1%) | 1,558 (33.8%) |
| 3 Vehicles | 1,304 (24.4%) | 1,418 (30.7%) |
| 4 Vehicles | 764 (14.3%) | 569 (12.3%) |
| 5 or more Vehicles | 480 (9.0%) | 211 (4.6%) |
| Total | 5,349 (100.0%) | 4,613 (100.0%) |
Commute Time in Oakdale
The most frequently occuring commute durations in Oakdale are 45 to 59 minutes (1,475 commuters, 15.4%), 5 to 9 minutes (1,434 commuters, 14.9%), and 30 to 34 minutes (1,095 commuters, 11.4%).
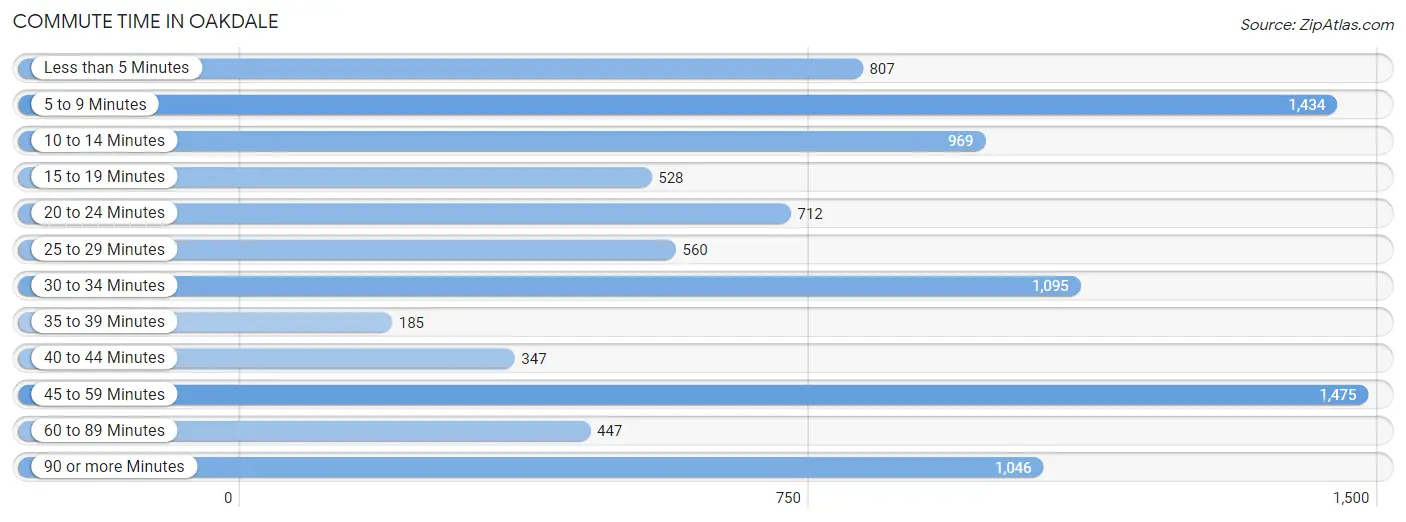
| Commute Time | # Commuters | % Commuters |
| Less than 5 Minutes | 807 | 8.4% |
| 5 to 9 Minutes | 1,434 | 14.9% |
| 10 to 14 Minutes | 969 | 10.1% |
| 15 to 19 Minutes | 528 | 5.5% |
| 20 to 24 Minutes | 712 | 7.4% |
| 25 to 29 Minutes | 560 | 5.8% |
| 30 to 34 Minutes | 1,095 | 11.4% |
| 35 to 39 Minutes | 185 | 1.9% |
| 40 to 44 Minutes | 347 | 3.6% |
| 45 to 59 Minutes | 1,475 | 15.4% |
| 60 to 89 Minutes | 447 | 4.6% |
| 90 or more Minutes | 1,046 | 10.9% |
Commute Time by Sex in Oakdale
The most common commute times in Oakdale are 90 or more minutes (758 commuters, 14.5%) for males and 45 to 59 minutes (789 commuters, 18.0%) for females.
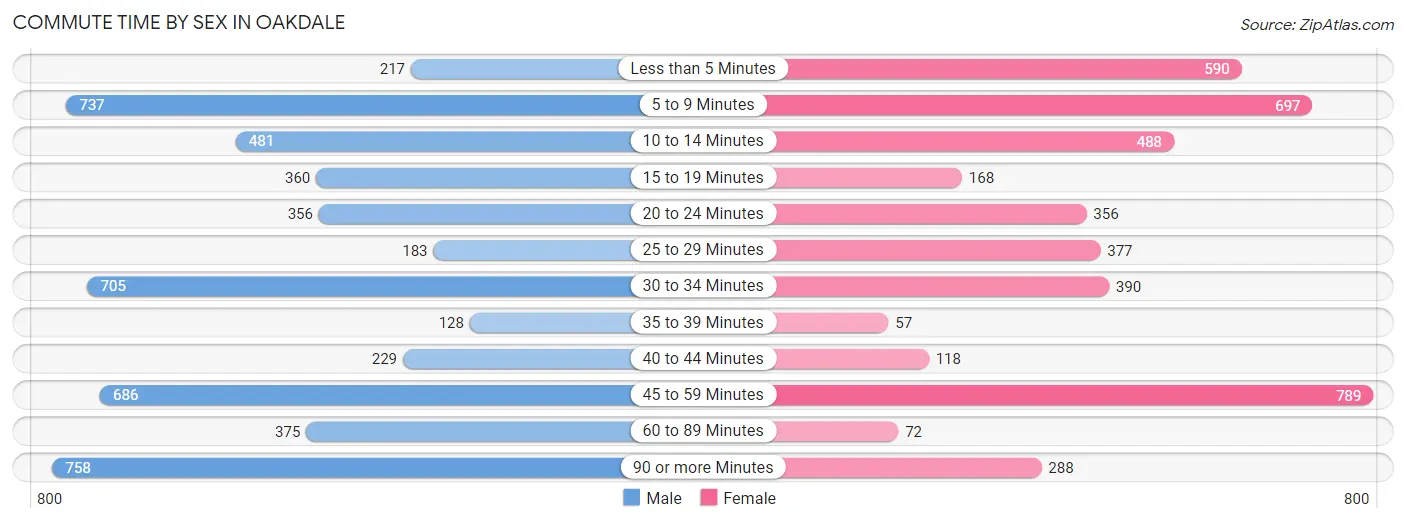
| Commute Time | Male | Female |
| Less than 5 Minutes | 217 (4.2%) | 590 (13.4%) |
| 5 to 9 Minutes | 737 (14.1%) | 697 (15.9%) |
| 10 to 14 Minutes | 481 (9.2%) | 488 (11.1%) |
| 15 to 19 Minutes | 360 (6.9%) | 168 (3.8%) |
| 20 to 24 Minutes | 356 (6.8%) | 356 (8.1%) |
| 25 to 29 Minutes | 183 (3.5%) | 377 (8.6%) |
| 30 to 34 Minutes | 705 (13.5%) | 390 (8.9%) |
| 35 to 39 Minutes | 128 (2.5%) | 57 (1.3%) |
| 40 to 44 Minutes | 229 (4.4%) | 118 (2.7%) |
| 45 to 59 Minutes | 686 (13.2%) | 789 (18.0%) |
| 60 to 89 Minutes | 375 (7.2%) | 72 (1.6%) |
| 90 or more Minutes | 758 (14.5%) | 288 (6.6%) |
Time of Departure to Work by Sex in Oakdale
The most frequent times of departure to work in Oakdale are 12:00 AM to 4:59 AM (1,066, 20.4%) for males and 7:00 AM to 7:29 AM (816, 18.6%) for females.
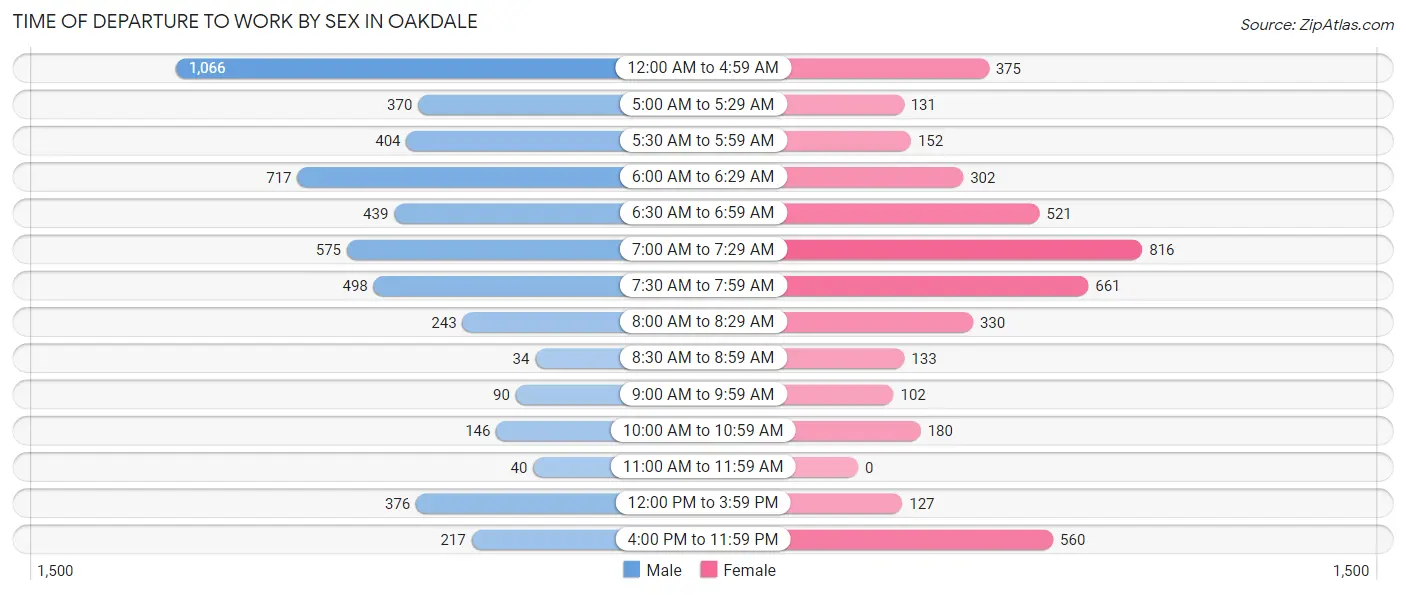
| Time of Departure | Male | Female |
| 12:00 AM to 4:59 AM | 1,066 (20.4%) | 375 (8.5%) |
| 5:00 AM to 5:29 AM | 370 (7.1%) | 131 (3.0%) |
| 5:30 AM to 5:59 AM | 404 (7.7%) | 152 (3.5%) |
| 6:00 AM to 6:29 AM | 717 (13.8%) | 302 (6.9%) |
| 6:30 AM to 6:59 AM | 439 (8.4%) | 521 (11.9%) |
| 7:00 AM to 7:29 AM | 575 (11.0%) | 816 (18.6%) |
| 7:30 AM to 7:59 AM | 498 (9.6%) | 661 (15.1%) |
| 8:00 AM to 8:29 AM | 243 (4.7%) | 330 (7.5%) |
| 8:30 AM to 8:59 AM | 34 (0.6%) | 133 (3.0%) |
| 9:00 AM to 9:59 AM | 90 (1.7%) | 102 (2.3%) |
| 10:00 AM to 10:59 AM | 146 (2.8%) | 180 (4.1%) |
| 11:00 AM to 11:59 AM | 40 (0.8%) | 0 (0.0%) |
| 12:00 PM to 3:59 PM | 376 (7.2%) | 127 (2.9%) |
| 4:00 PM to 11:59 PM | 217 (4.2%) | 560 (12.8%) |
| Total | 5,215 (100.0%) | 4,390 (100.0%) |
Housing Occupancy in Oakdale
Occupancy by Ownership in Oakdale
Of the total 8,293 dwellings in Oakdale, owner-occupied units account for 5,267 (63.5%), while renter-occupied units make up 3,026 (36.5%).
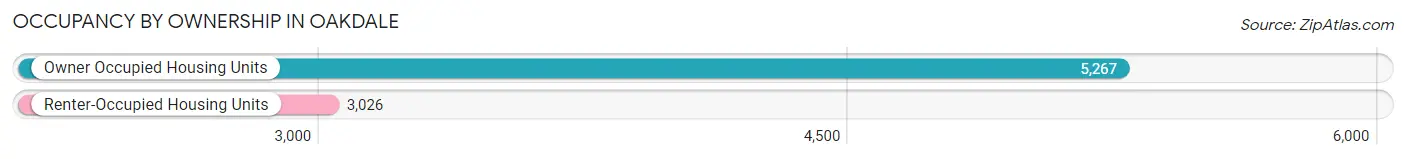
| Occupancy | # Housing Units | % Housing Units |
| Owner Occupied Housing Units | 5,267 | 63.5% |
| Renter-Occupied Housing Units | 3,026 | 36.5% |
| Total Occupied Housing Units | 8,293 | 100.0% |
Occupancy by Household Size in Oakdale
| Household Size | # Housing Units | % Housing Units |
| 1-Person Household | 2,046 | 24.7% |
| 2-Person Household | 2,536 | 30.6% |
| 3-Person Household | 1,429 | 17.2% |
| 4+ Person Household | 2,282 | 27.5% |
| Total Housing Units | 8,293 | 100.0% |
Occupancy by Ownership by Household Size in Oakdale
| Household Size | Owner-occupied | Renter-occupied |
| 1-Person Household | 880 (43.0%) | 1,166 (57.0%) |
| 2-Person Household | 1,739 (68.6%) | 797 (31.4%) |
| 3-Person Household | 866 (60.6%) | 563 (39.4%) |
| 4+ Person Household | 1,782 (78.1%) | 500 (21.9%) |
| Total Housing Units | 5,267 (63.5%) | 3,026 (36.5%) |
Occupancy by Educational Attainment in Oakdale
| Household Size | Owner-occupied | Renter-occupied |
| Less than High School | 782 (62.9%) | 461 (37.1%) |
| High School Diploma | 1,137 (57.3%) | 849 (42.7%) |
| College/Associate Degree | 2,007 (66.2%) | 1,024 (33.8%) |
| Bachelor's Degree or higher | 1,341 (66.0%) | 692 (34.0%) |
Occupancy by Age of Householder in Oakdale
| Age Bracket | # Households | % Households |
| Under 35 Years | 1,621 | 19.6% |
| 35 to 44 Years | 1,564 | 18.9% |
| 45 to 54 Years | 1,252 | 15.1% |
| 55 to 64 Years | 1,955 | 23.6% |
| 65 to 74 Years | 915 | 11.0% |
| 75 to 84 Years | 694 | 8.4% |
| 85 Years and Over | 292 | 3.5% |
| Total | 8,293 | 100.0% |
Housing Finances in Oakdale
Median Income by Occupancy in Oakdale
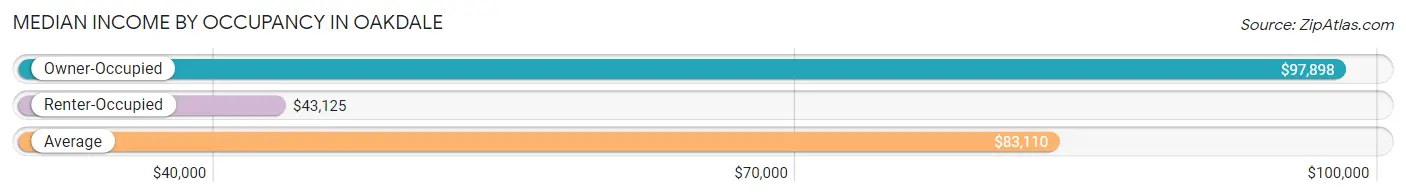
| Occupancy Type | # Households | Median Income |
| Owner-Occupied | 5,267 (63.5%) | $97,898 |
| Renter-Occupied | 3,026 (36.5%) | $43,125 |
| Average | 8,293 (100.0%) | $83,110 |
Occupancy by Householder Income Bracket in Oakdale
| Income Bracket | Owner-occupied | Renter-occupied |
| Less than $5,000 | 39 (0.7%) | 327 (10.8%) |
| $5,000 to $9,999 | 21 (0.4%) | 109 (3.6%) |
| $10,000 to $14,999 | 38 (0.7%) | 459 (15.2%) |
| $15,000 to $19,999 | 54 (1.0%) | 136 (4.5%) |
| $20,000 to $24,999 | 88 (1.7%) | 74 (2.5%) |
| $25,000 to $34,999 | 375 (7.1%) | 255 (8.4%) |
| $35,000 to $49,999 | 582 (11.1%) | 372 (12.3%) |
| $50,000 to $74,999 | 563 (10.7%) | 234 (7.7%) |
| $75,000 to $99,999 | 892 (16.9%) | 179 (5.9%) |
| $100,000 to $149,999 | 1,080 (20.5%) | 564 (18.6%) |
| $150,000 or more | 1,535 (29.1%) | 317 (10.5%) |
| Total | 5,267 (100.0%) | 3,026 (100.0%) |
Monthly Housing Cost Tiers in Oakdale
| Monthly Cost | Owner-occupied | Renter-occupied |
| Less than $300 | 103 (2.0%) | 90 (3.0%) |
| $300 to $499 | 425 (8.1%) | 120 (4.0%) |
| $500 to $799 | 876 (16.6%) | 200 (6.6%) |
| $800 to $999 | 298 (5.7%) | 221 (7.3%) |
| $1,000 to $1,499 | 666 (12.6%) | 1,111 (36.7%) |
| $1,500 to $1,999 | 807 (15.3%) | 630 (20.8%) |
| $2,000 to $2,499 | 878 (16.7%) | 337 (11.1%) |
| $2,500 to $2,999 | 566 (10.7%) | 169 (5.6%) |
| $3,000 or more | 648 (12.3%) | 8 (0.3%) |
| Total | 5,267 (100.0%) | 3,026 (100.0%) |
Physical Housing Characteristics in Oakdale
Housing Structures in Oakdale
| Structure Type | # Housing Units | % Housing Units |
| Single Unit, Detached | 6,267 | 75.6% |
| Single Unit, Attached | 222 | 2.7% |
| 2 Unit Apartments | 142 | 1.7% |
| 3 or 4 Unit Apartments | 144 | 1.7% |
| 5 to 9 Unit Apartments | 106 | 1.3% |
| 10 or more Apartments | 978 | 11.8% |
| Mobile Home / Other | 434 | 5.2% |
| Total | 8,293 | 100.0% |
Housing Structures by Occupancy in Oakdale
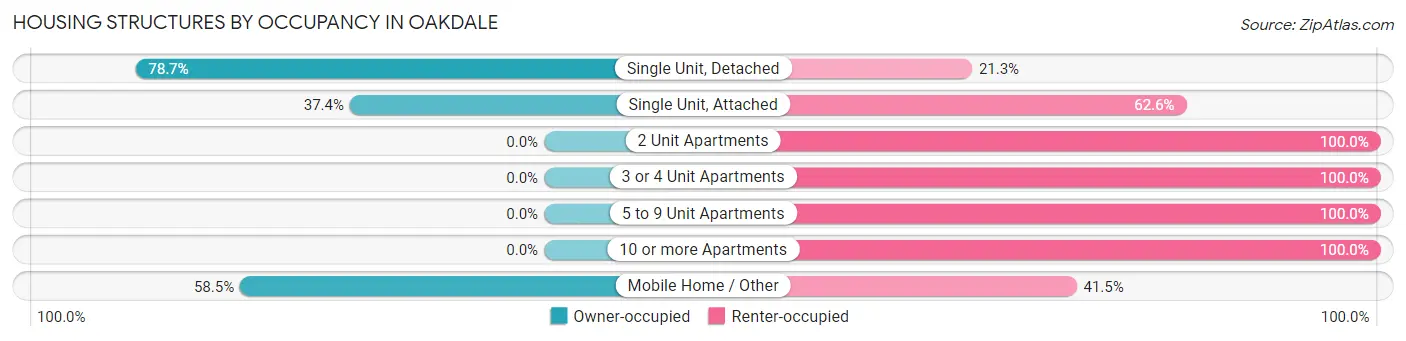
| Structure Type | Owner-occupied | Renter-occupied |
| Single Unit, Detached | 4,930 (78.7%) | 1,337 (21.3%) |
| Single Unit, Attached | 83 (37.4%) | 139 (62.6%) |
| 2 Unit Apartments | 0 (0.0%) | 142 (100.0%) |
| 3 or 4 Unit Apartments | 0 (0.0%) | 144 (100.0%) |
| 5 to 9 Unit Apartments | 0 (0.0%) | 106 (100.0%) |
| 10 or more Apartments | 0 (0.0%) | 978 (100.0%) |
| Mobile Home / Other | 254 (58.5%) | 180 (41.5%) |
| Total | 5,267 (63.5%) | 3,026 (36.5%) |
Housing Structures by Number of Rooms in Oakdale
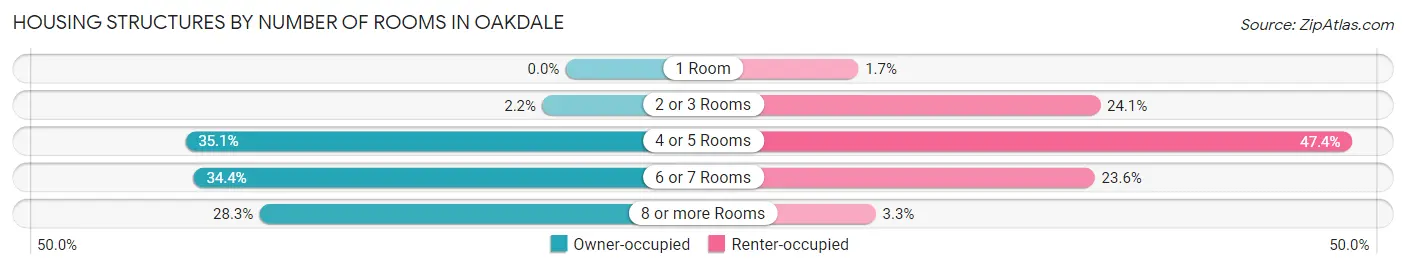
| Number of Rooms | Owner-occupied | Renter-occupied |
| 1 Room | 0 (0.0%) | 51 (1.7%) |
| 2 or 3 Rooms | 114 (2.2%) | 728 (24.1%) |
| 4 or 5 Rooms | 1,851 (35.1%) | 1,434 (47.4%) |
| 6 or 7 Rooms | 1,811 (34.4%) | 713 (23.6%) |
| 8 or more Rooms | 1,491 (28.3%) | 100 (3.3%) |
| Total | 5,267 (100.0%) | 3,026 (100.0%) |
Housing Structure by Heating Type in Oakdale
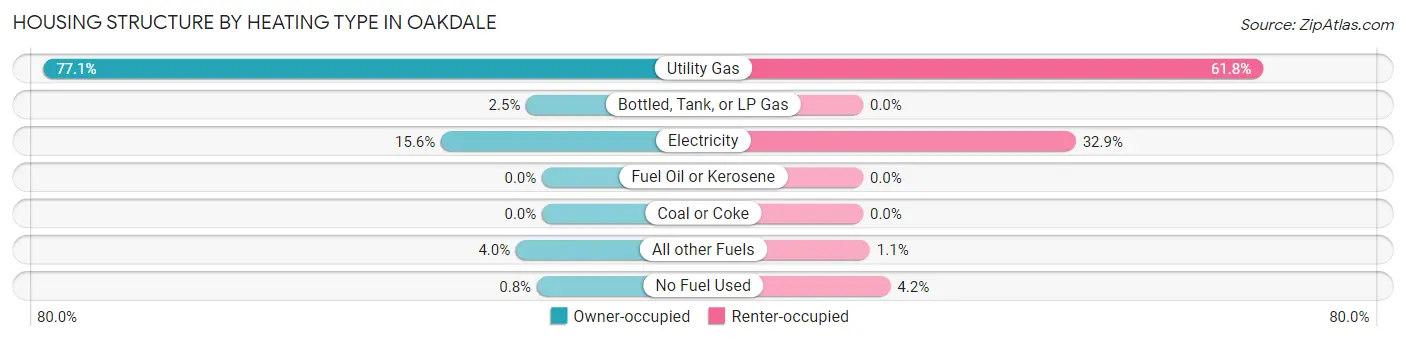
| Heating Type | Owner-occupied | Renter-occupied |
| Utility Gas | 4,062 (77.1%) | 1,871 (61.8%) |
| Bottled, Tank, or LP Gas | 129 (2.5%) | 0 (0.0%) |
| Electricity | 822 (15.6%) | 995 (32.9%) |
| Fuel Oil or Kerosene | 0 (0.0%) | 0 (0.0%) |
| Coal or Coke | 0 (0.0%) | 0 (0.0%) |
| All other Fuels | 212 (4.0%) | 32 (1.1%) |
| No Fuel Used | 42 (0.8%) | 128 (4.2%) |
| Total | 5,267 (100.0%) | 3,026 (100.0%) |
Household Vehicle Usage in Oakdale
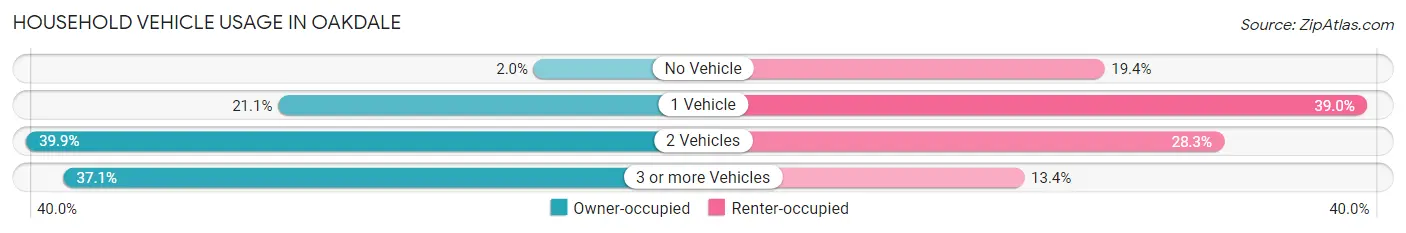
| Vehicles per Household | Owner-occupied | Renter-occupied |
| No Vehicle | 104 (2.0%) | 586 (19.4%) |
| 1 Vehicle | 1,109 (21.1%) | 1,179 (39.0%) |
| 2 Vehicles | 2,101 (39.9%) | 856 (28.3%) |
| 3 or more Vehicles | 1,953 (37.1%) | 405 (13.4%) |
| Total | 5,267 (100.0%) | 3,026 (100.0%) |
Real Estate & Mortgages in Oakdale
Real Estate and Mortgage Overview in Oakdale
| Characteristic | Without Mortgage | With Mortgage |
| Housing Units | 1,829 | 3,438 |
| Median Property Value | $386,800 | $416,300 |
| Median Household Income | $80,825 | $1,130 |
| Monthly Housing Costs | $594 | $635 |
| Real Estate Taxes | $2,502 | $78 |
Property Value by Mortgage Status in Oakdale

| Property Value | Without Mortgage | With Mortgage |
| Less than $50,000 | 147 (8.0%) | 66 (1.9%) |
| $50,000 to $99,999 | 56 (3.1%) | 0 (0.0%) |
| $100,000 to $299,999 | 439 (24.0%) | 523 (15.2%) |
| $300,000 to $499,999 | 696 (38.1%) | 1,971 (57.3%) |
| $500,000 to $749,999 | 476 (26.0%) | 835 (24.3%) |
| $750,000 to $999,999 | 0 (0.0%) | 4 (0.1%) |
| $1,000,000 or more | 15 (0.8%) | 39 (1.1%) |
| Total | 1,829 (100.0%) | 3,438 (100.0%) |
Household Income by Mortgage Status in Oakdale
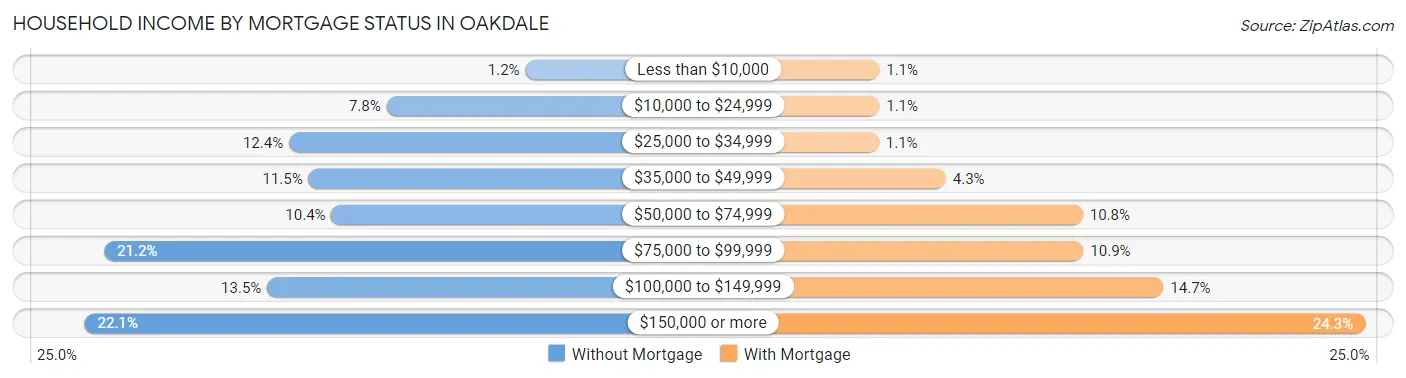
| Household Income | Without Mortgage | With Mortgage |
| Less than $10,000 | 21 (1.1%) | 39 (1.1%) |
| $10,000 to $24,999 | 142 (7.8%) | 39 (1.1%) |
| $25,000 to $34,999 | 227 (12.4%) | 38 (1.1%) |
| $35,000 to $49,999 | 210 (11.5%) | 148 (4.3%) |
| $50,000 to $74,999 | 190 (10.4%) | 372 (10.8%) |
| $75,000 to $99,999 | 388 (21.2%) | 373 (10.8%) |
| $100,000 to $149,999 | 246 (13.5%) | 504 (14.7%) |
| $150,000 or more | 405 (22.1%) | 834 (24.3%) |
| Total | 1,829 (100.0%) | 3,438 (100.0%) |
Property Value to Household Income Ratio in Oakdale
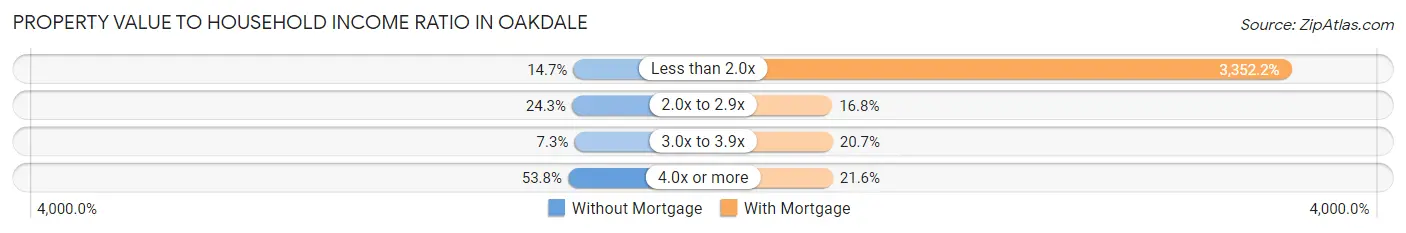
| Value-to-Income Ratio | Without Mortgage | With Mortgage |
| Less than 2.0x | 268 (14.6%) | 115,250 (3,352.2%) |
| 2.0x to 2.9x | 444 (24.3%) | 579 (16.8%) |
| 3.0x to 3.9x | 133 (7.3%) | 710 (20.6%) |
| 4.0x or more | 984 (53.8%) | 741 (21.5%) |
| Total | 1,829 (100.0%) | 3,438 (100.0%) |
Real Estate Taxes by Mortgage Status in Oakdale
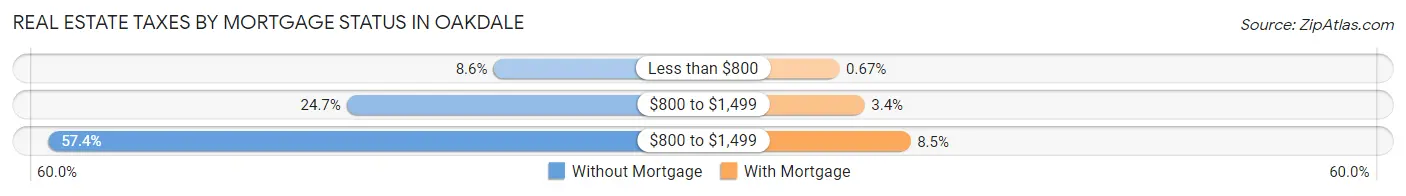
| Property Taxes | Without Mortgage | With Mortgage |
| Less than $800 | 158 (8.6%) | 23 (0.7%) |
| $800 to $1,499 | 452 (24.7%) | 118 (3.4%) |
| $800 to $1,499 | 1,050 (57.4%) | 291 (8.5%) |
| Total | 1,829 (100.0%) | 3,438 (100.0%) |
Health & Disability in Oakdale
Health Insurance Coverage by Age in Oakdale
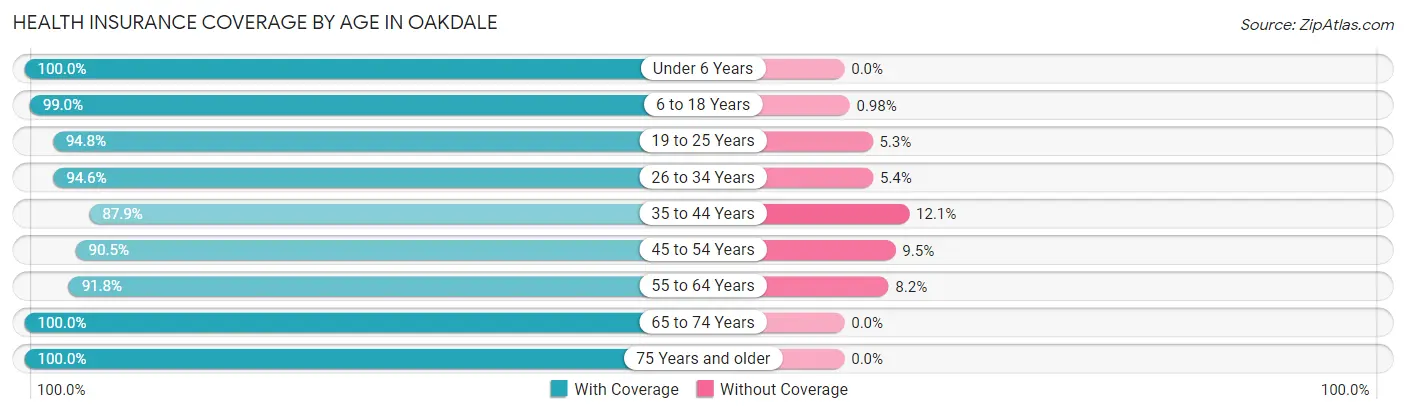
| Age Bracket | With Coverage | Without Coverage |
| Under 6 Years | 2,055 (100.0%) | 0 (0.0%) |
| 6 to 18 Years | 4,630 (99.0%) | 46 (1.0%) |
| 19 to 25 Years | 1,949 (94.8%) | 108 (5.2%) |
| 26 to 34 Years | 2,421 (94.6%) | 137 (5.4%) |
| 35 to 44 Years | 2,697 (87.9%) | 371 (12.1%) |
| 45 to 54 Years | 2,496 (90.5%) | 263 (9.5%) |
| 55 to 64 Years | 2,621 (91.8%) | 235 (8.2%) |
| 65 to 74 Years | 1,542 (100.0%) | 0 (0.0%) |
| 75 Years and older | 1,415 (100.0%) | 0 (0.0%) |
| Total | 21,826 (95.0%) | 1,160 (5.1%) |
Health Insurance Coverage by Citizenship Status in Oakdale
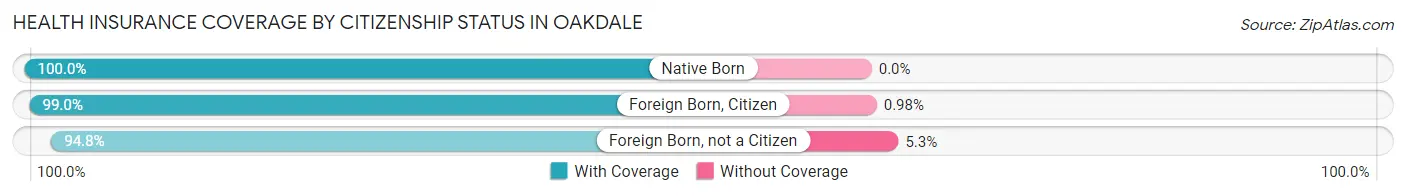
| Citizenship Status | With Coverage | Without Coverage |
| Native Born | 2,055 (100.0%) | 0 (0.0%) |
| Foreign Born, Citizen | 4,630 (99.0%) | 46 (1.0%) |
| Foreign Born, not a Citizen | 1,949 (94.8%) | 108 (5.2%) |
Health Insurance Coverage by Household Income in Oakdale
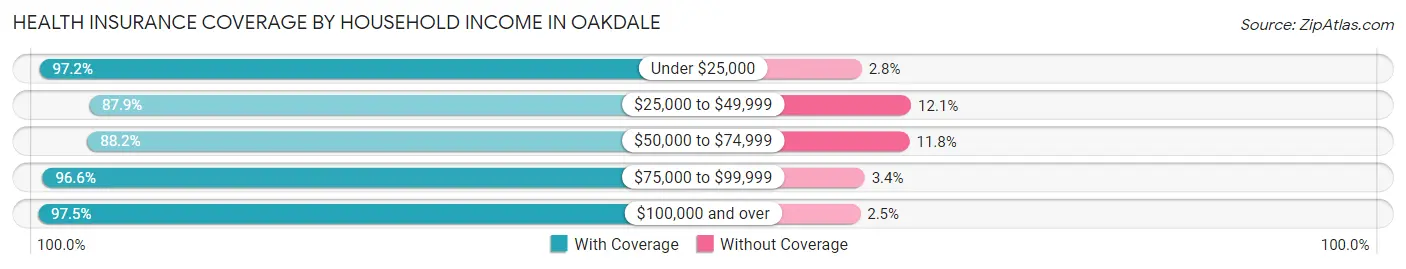
| Household Income | With Coverage | Without Coverage |
| Under $25,000 | 1,842 (97.2%) | 53 (2.8%) |
| $25,000 to $49,999 | 3,412 (87.9%) | 468 (12.1%) |
| $50,000 to $74,999 | 1,681 (88.2%) | 224 (11.8%) |
| $75,000 to $99,999 | 3,456 (96.6%) | 120 (3.4%) |
| $100,000 and over | 11,353 (97.5%) | 295 (2.5%) |
Public vs Private Health Insurance Coverage by Age in Oakdale
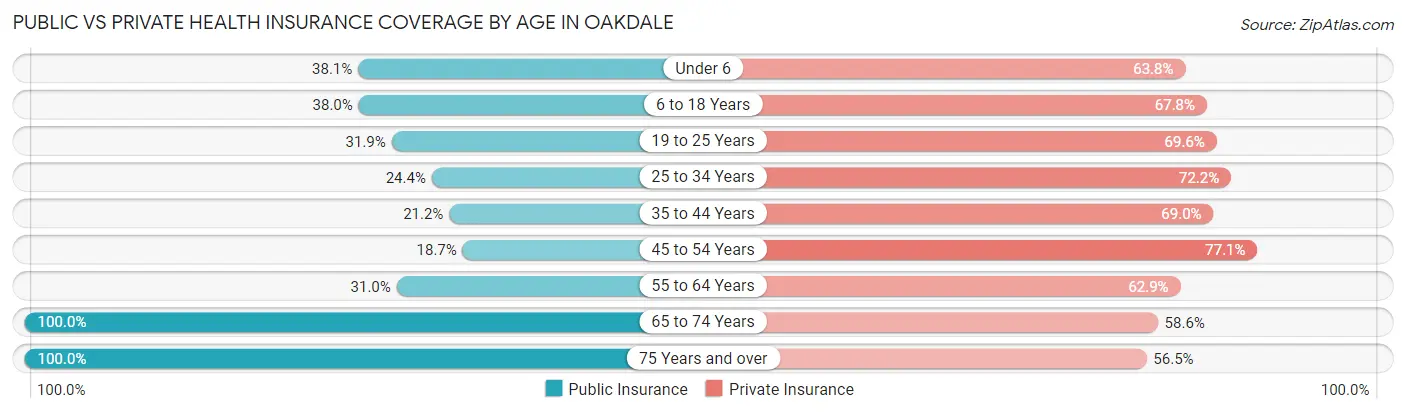
| Age Bracket | Public Insurance | Private Insurance |
| Under 6 | 783 (38.1%) | 1,310 (63.7%) |
| 6 to 18 Years | 1,777 (38.0%) | 3,168 (67.7%) |
| 19 to 25 Years | 656 (31.9%) | 1,431 (69.6%) |
| 25 to 34 Years | 625 (24.4%) | 1,848 (72.2%) |
| 35 to 44 Years | 650 (21.2%) | 2,116 (69.0%) |
| 45 to 54 Years | 516 (18.7%) | 2,128 (77.1%) |
| 55 to 64 Years | 884 (30.9%) | 1,795 (62.8%) |
| 65 to 74 Years | 1,542 (100.0%) | 904 (58.6%) |
| 75 Years and over | 1,415 (100.0%) | 800 (56.5%) |
| Total | 8,848 (38.5%) | 15,500 (67.4%) |
Disability Status by Sex by Age in Oakdale
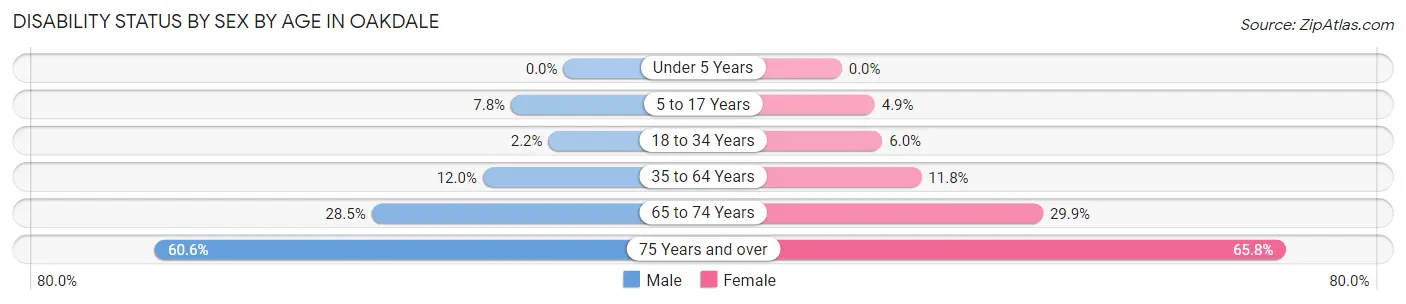
| Age Bracket | Male | Female |
| Under 5 Years | 0 (0.0%) | 0 (0.0%) |
| 5 to 17 Years | 198 (7.8%) | 104 (4.9%) |
| 18 to 34 Years | 57 (2.2%) | 152 (6.0%) |
| 35 to 64 Years | 530 (12.0%) | 503 (11.8%) |
| 65 to 74 Years | 198 (28.5%) | 253 (29.9%) |
| 75 Years and over | 297 (60.6%) | 609 (65.8%) |
Disability Class by Sex by Age in Oakdale
Disability Class: Hearing Difficulty
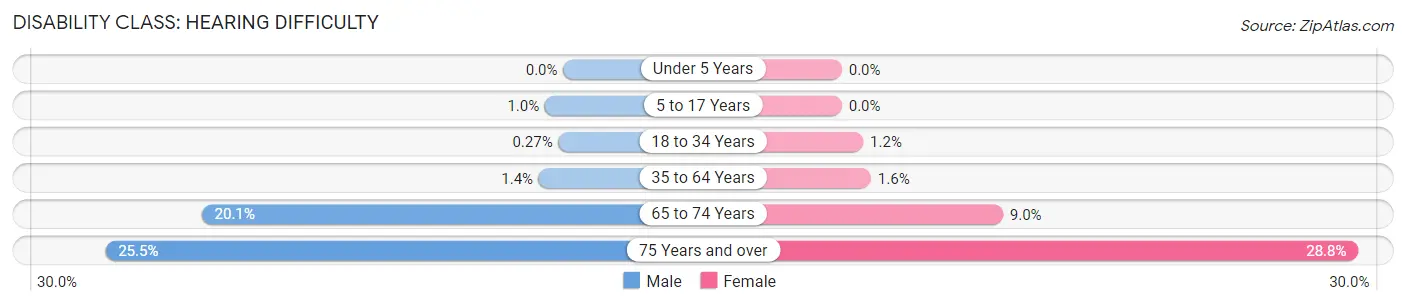
| Age Bracket | Male | Female |
| Under 5 Years | 0 (0.0%) | 0 (0.0%) |
| 5 to 17 Years | 26 (1.0%) | 0 (0.0%) |
| 18 to 34 Years | 7 (0.3%) | 30 (1.2%) |
| 35 to 64 Years | 60 (1.4%) | 69 (1.6%) |
| 65 to 74 Years | 140 (20.1%) | 76 (9.0%) |
| 75 Years and over | 125 (25.5%) | 266 (28.8%) |
Disability Class: Vision Difficulty
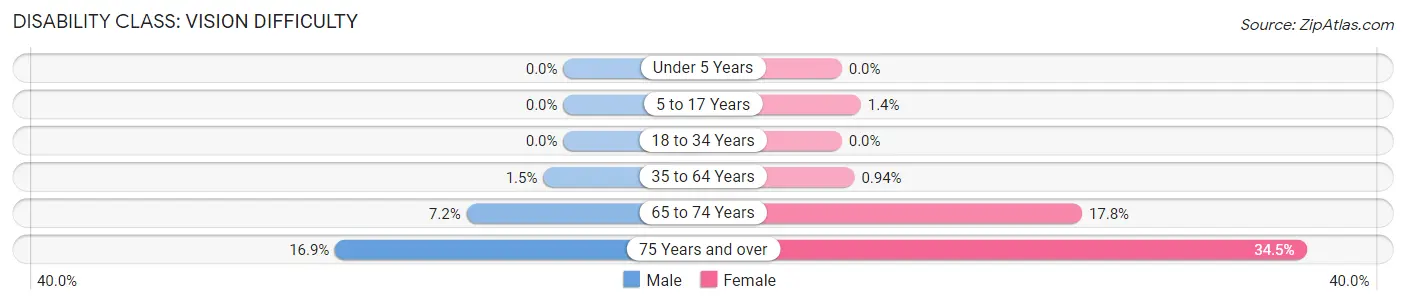
| Age Bracket | Male | Female |
| Under 5 Years | 0 (0.0%) | 0 (0.0%) |
| 5 to 17 Years | 0 (0.0%) | 30 (1.4%) |
| 18 to 34 Years | 0 (0.0%) | 0 (0.0%) |
| 35 to 64 Years | 66 (1.5%) | 40 (0.9%) |
| 65 to 74 Years | 50 (7.2%) | 151 (17.8%) |
| 75 Years and over | 83 (16.9%) | 319 (34.5%) |
Disability Class: Cognitive Difficulty
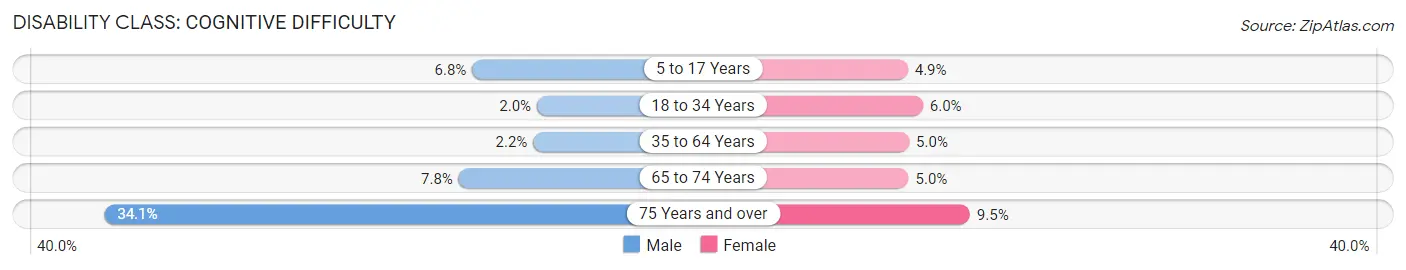
| Age Bracket | Male | Female |
| 5 to 17 Years | 172 (6.8%) | 104 (4.9%) |
| 18 to 34 Years | 50 (2.0%) | 152 (6.0%) |
| 35 to 64 Years | 99 (2.2%) | 213 (5.0%) |
| 65 to 74 Years | 54 (7.8%) | 42 (5.0%) |
| 75 Years and over | 167 (34.1%) | 88 (9.5%) |
Disability Class: Ambulatory Difficulty
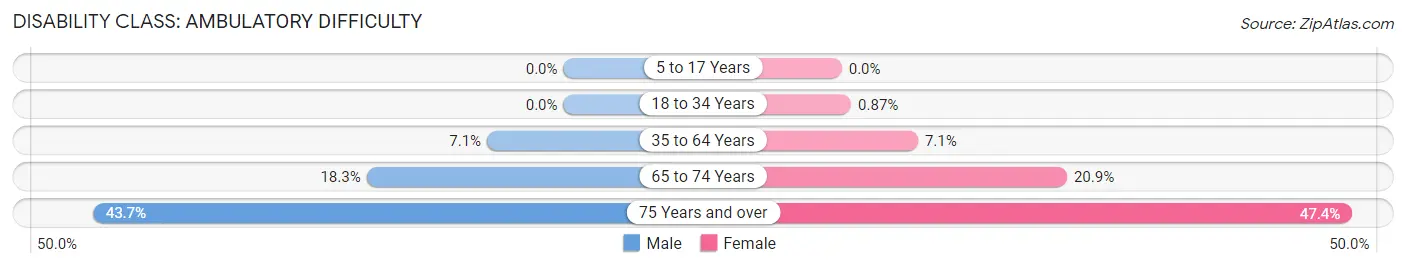
| Age Bracket | Male | Female |
| 5 to 17 Years | 0 (0.0%) | 0 (0.0%) |
| 18 to 34 Years | 0 (0.0%) | 22 (0.9%) |
| 35 to 64 Years | 314 (7.1%) | 301 (7.1%) |
| 65 to 74 Years | 127 (18.3%) | 177 (20.9%) |
| 75 Years and over | 214 (43.7%) | 438 (47.3%) |
Disability Class: Self-Care Difficulty
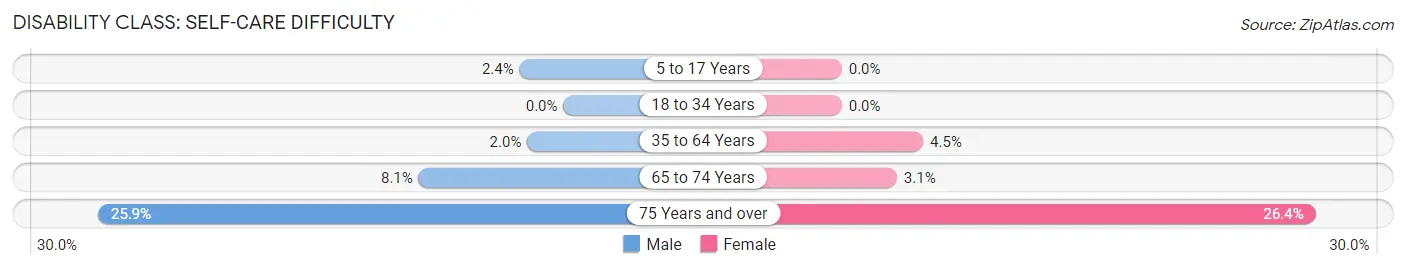
| Age Bracket | Male | Female |
| 5 to 17 Years | 62 (2.4%) | 0 (0.0%) |
| 18 to 34 Years | 0 (0.0%) | 0 (0.0%) |
| 35 to 64 Years | 89 (2.0%) | 193 (4.5%) |
| 65 to 74 Years | 56 (8.1%) | 26 (3.1%) |
| 75 Years and over | 127 (25.9%) | 244 (26.4%) |
Technology Access in Oakdale
Computing Device Access in Oakdale
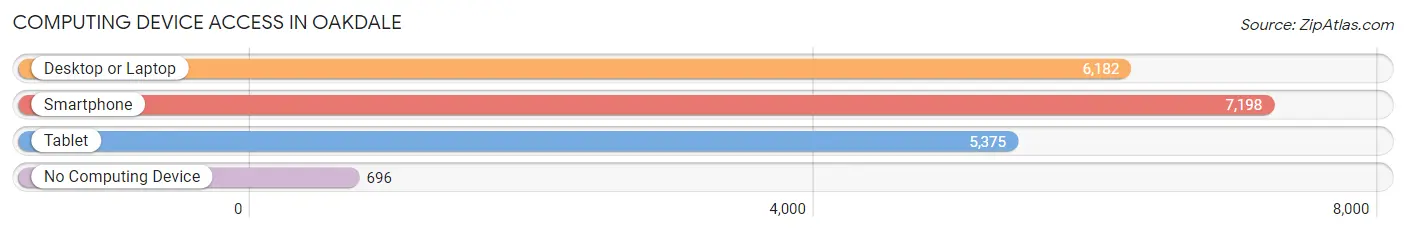
| Device Type | # Households | % Households |
| Desktop or Laptop | 6,182 | 74.5% |
| Smartphone | 7,198 | 86.8% |
| Tablet | 5,375 | 64.8% |
| No Computing Device | 696 | 8.4% |
| Total | 8,293 | 100.0% |
Internet Access in Oakdale
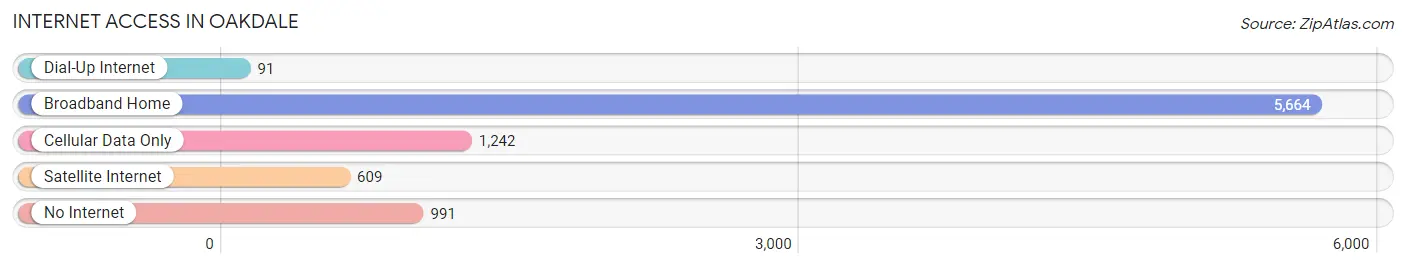
| Internet Type | # Households | % Households |
| Dial-Up Internet | 91 | 1.1% |
| Broadband Home | 5,664 | 68.3% |
| Cellular Data Only | 1,242 | 15.0% |
| Satellite Internet | 609 | 7.3% |
| No Internet | 991 | 11.9% |
| Total | 8,293 | 100.0% |
Oakdale Summary
Oakdale, California is a small city located in Stanislaus County, California. It is situated in the San Joaquin Valley, approximately 40 miles east of Modesto and 70 miles south of Sacramento. The city is known for its agricultural production, particularly its walnut and almond crops. As of the 2010 census, the population of Oakdale was 20,675.
History
Oakdale was founded in 1871 by a group of settlers from the East Coast. The city was originally known as “Tulare Station”, named after the nearby Tulare Lake. The name was changed to Oakdale in 1874, after the abundance of oak trees in the area.
The city was incorporated in 1888 and quickly became a hub for the surrounding agricultural industry. The city was home to several large farms, including the Oakdale Dairy, which was established in 1891. The dairy was one of the largest in the state and was known for its high-quality milk and butter.
In the early 1900s, the city began to expand and develop. The first bank was established in 1906, and the first school was built in 1908. The city also had a thriving business district, with several stores, restaurants, and hotels.
Geography
Oakdale is located in the San Joaquin Valley, approximately 40 miles east of Modesto and 70 miles south of Sacramento. The city is situated at an elevation of about 200 feet above sea level. The city is surrounded by rolling hills and is located near the Stanislaus River.
The climate in Oakdale is generally mild, with hot summers and cool winters. The average high temperature in July is 95 degrees Fahrenheit, and the average low temperature in January is 40 degrees Fahrenheit.
Economy
Oakdale’s economy is largely based on agriculture. The city is home to several large farms, including the Oakdale Dairy, which produces high-quality milk and butter. The city is also home to several wineries, which produce a variety of wines.
The city is also home to several manufacturing companies, including a furniture factory and a plastics factory. The city also has a thriving retail sector, with several stores, restaurants, and hotels.
Demographics
As of the 2010 census, the population of Oakdale was 20,675. The racial makeup of the city was 75.3% White, 1.3% African American, 0.7% Native American, 0.7% Asian, 0.2% Pacific Islander, 19.2% from other races, and 3.0% from two or more races. Hispanic or Latino of any race were 33.2% of the population.
The median income for a household in the city was $41,945, and the median income for a family was $48,945. The per capita income for the city was $19,945. About 16.2% of families and 19.7% of the population were below the poverty line, including 25.3% of those under age 18 and 8.2% of those age 65 or over.
Common Questions
What is Per Capita Income in Oakdale?
Per Capita income in Oakdale is $36,622.
What is the Median Family Income in Oakdale?
Median Family Income in Oakdale is $97,492.
What is the Median Household income in Oakdale?
Median Household Income in Oakdale is $83,110.
What is Income or Wage Gap in Oakdale?
Income or Wage Gap in Oakdale is 41.9%.
Women in Oakdale earn 58.1 cents for every dollar earned by a man.
What is Family Income Deficit in Oakdale?
Family Income Deficit in Oakdale is $10,509.
Families that are below poverty line in Oakdale earn $10,509 less on average than the poverty threshold level.
What is Inequality or Gini Index in Oakdale?
Inequality or Gini Index in Oakdale is 0.45.
What is the Total Population of Oakdale?
Total Population of Oakdale is 23,120.
What is the Total Male Population of Oakdale?
Total Male Population of Oakdale is 11,514.
What is the Total Female Population of Oakdale?
Total Female Population of Oakdale is 11,606.
What is the Ratio of Males per 100 Females in Oakdale?
There are 99.21 Males per 100 Females in Oakdale.
What is the Ratio of Females per 100 Males in Oakdale?
There are 100.80 Females per 100 Males in Oakdale.
What is the Median Population Age in Oakdale?
Median Population Age in Oakdale is 35.8 Years.
What is the Average Family Size in Oakdale
Average Family Size in Oakdale is 3.3 People.
What is the Average Household Size in Oakdale
Average Household Size in Oakdale is 2.8 People.
How Large is the Labor Force in Oakdale?
There are 11,252 People in the Labor Forcein in Oakdale.
What is the Percentage of People in the Labor Force in Oakdale?
63.5% of People are in the Labor Force in Oakdale.
What is the Unemployment Rate in Oakdale?
Unemployment Rate in Oakdale is 8.6%.