North Lakeport, CA Map & Demographics
North Lakeport Map
North Lakeport Overview
$36,209
PER CAPITA INCOME
$87,825
AVG FAMILY INCOME
$59,239
AVG HOUSEHOLD INCOME
35.0%
WAGE / INCOME GAP [ % ]
65.0¢/ $1
WAGE / INCOME GAP [ $ ]
0.47
INEQUALITY / GINI INDEX
2,666
TOTAL POPULATION
1,297
MALE POPULATION
1,369
FEMALE POPULATION
94.74
MALES / 100 FEMALES
105.55
FEMALES / 100 MALES
53.5
MEDIAN AGE
3.1
AVG FAMILY SIZE
2.5
AVG HOUSEHOLD SIZE
1,071
LABOR FORCE [ PEOPLE ]
46.8%
PERCENT IN LABOR FORCE
4.4%
UNEMPLOYMENT RATE
Income in North Lakeport
Income Overview in North Lakeport
Per Capita Income in North Lakeport is $36,209, while median incomes of families and households are $87,825 and $59,239 respectively.
| Characteristic | Number | Measure |
| Per Capita Income | 2,666 | $36,209 |
| Median Family Income | 675 | $87,825 |
| Mean Family Income | 675 | $110,553 |
| Median Household Income | 1,064 | $59,239 |
| Mean Household Income | 1,064 | $85,286 |
| Income Deficit | 675 | $0 |
| Wage / Income Gap (%) | 2,666 | 35.04% |
| Wage / Income Gap ($) | 2,666 | 64.96¢ per $1 |
| Gini / Inequality Index | 2,666 | 0.47 |
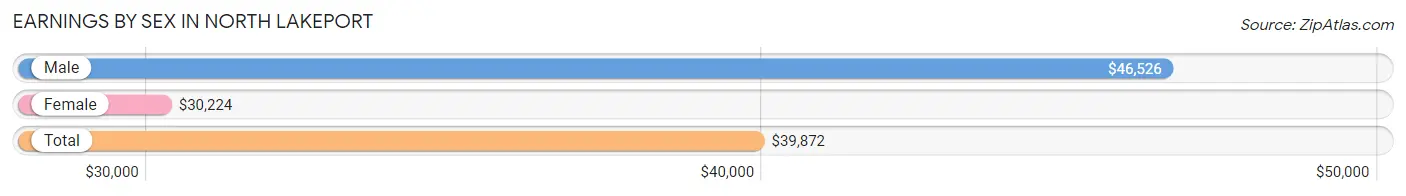
Earnings by Sex in North Lakeport
Average Earnings in North Lakeport are $39,872, $46,526 for men and $30,224 for women, a difference of 35.0%.
| Sex | Number | Average Earnings |
| Male | 474 (44.7%) | $46,526 |
| Female | 587 (55.3%) | $30,224 |
| Total | 1,061 (100.0%) | $39,872 |
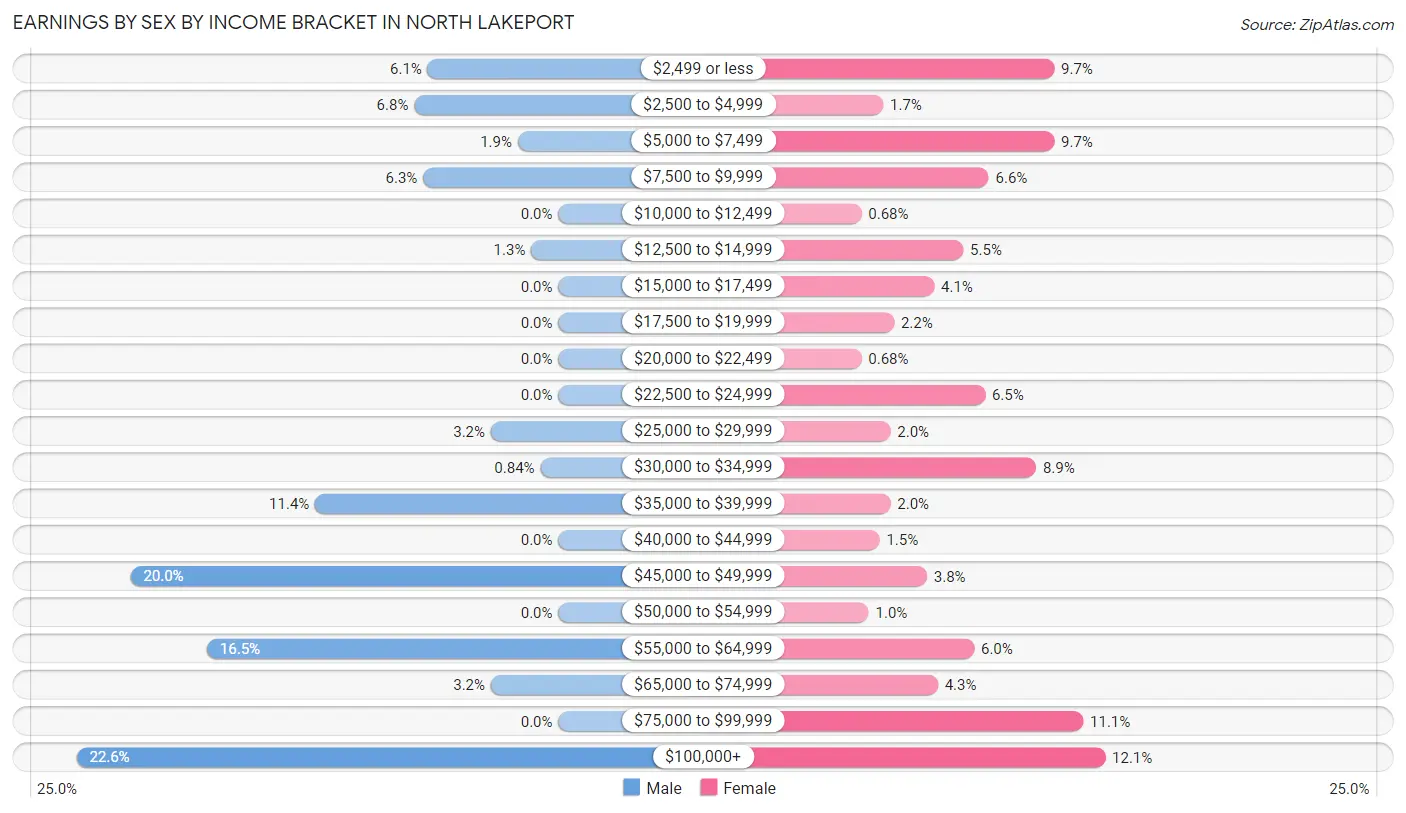
Earnings by Sex by Income Bracket in North Lakeport
The most common earnings brackets in North Lakeport are $100,000+ for men (107 | 22.6%) and $100,000+ for women (71 | 12.1%).
| Income | Male | Female |
| $2,499 or less | 29 (6.1%) | 57 (9.7%) |
| $2,500 to $4,999 | 32 (6.8%) | 10 (1.7%) |
| $5,000 to $7,499 | 9 (1.9%) | 57 (9.7%) |
| $7,500 to $9,999 | 30 (6.3%) | 39 (6.6%) |
| $10,000 to $12,499 | 0 (0.0%) | 4 (0.7%) |
| $12,500 to $14,999 | 6 (1.3%) | 32 (5.4%) |
| $15,000 to $17,499 | 0 (0.0%) | 24 (4.1%) |
| $17,500 to $19,999 | 0 (0.0%) | 13 (2.2%) |
| $20,000 to $22,499 | 0 (0.0%) | 4 (0.7%) |
| $22,500 to $24,999 | 0 (0.0%) | 38 (6.5%) |
| $25,000 to $29,999 | 15 (3.2%) | 12 (2.0%) |
| $30,000 to $34,999 | 4 (0.8%) | 52 (8.9%) |
| $35,000 to $39,999 | 54 (11.4%) | 12 (2.0%) |
| $40,000 to $44,999 | 0 (0.0%) | 9 (1.5%) |
| $45,000 to $49,999 | 95 (20.0%) | 22 (3.7%) |
| $50,000 to $54,999 | 0 (0.0%) | 6 (1.0%) |
| $55,000 to $64,999 | 78 (16.5%) | 35 (6.0%) |
| $65,000 to $74,999 | 15 (3.2%) | 25 (4.3%) |
| $75,000 to $99,999 | 0 (0.0%) | 65 (11.1%) |
| $100,000+ | 107 (22.6%) | 71 (12.1%) |
| Total | 474 (100.0%) | 587 (100.0%) |
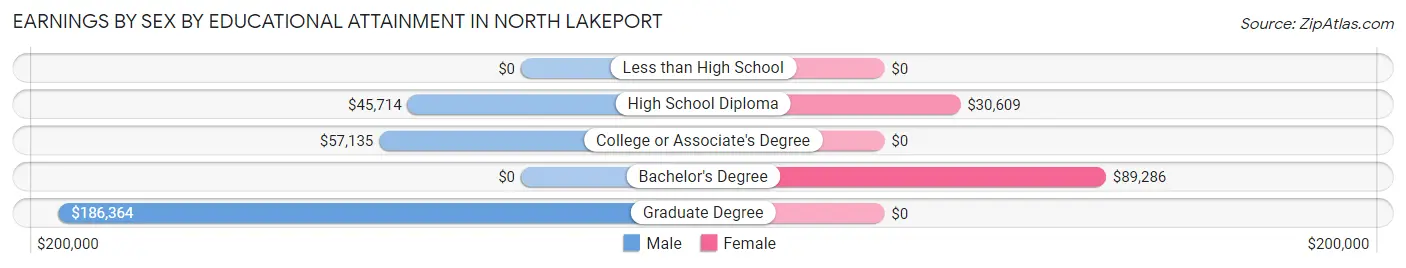
Earnings by Sex by Educational Attainment in North Lakeport
Average earnings in North Lakeport are $46,474 for men and $31,090 for women, a difference of 33.1%. Men with an educational attainment of graduate degree enjoy the highest average annual earnings of $186,364, while those with high school diploma education earn the least with $45,714. Women with an educational attainment of bachelor's degree earn the most with the average annual earnings of $89,286, while those with high school diploma education have the smallest earnings of $30,609.
| Educational Attainment | Male Income | Female Income |
| Less than High School | - | - |
| High School Diploma | $45,714 | $30,609 |
| College or Associate's Degree | $57,135 | $0 |
| Bachelor's Degree | - | - |
| Graduate Degree | $186,364 | $0 |
| Total | $46,474 | $31,090 |
Family Income in North Lakeport
Family Income Brackets in North Lakeport
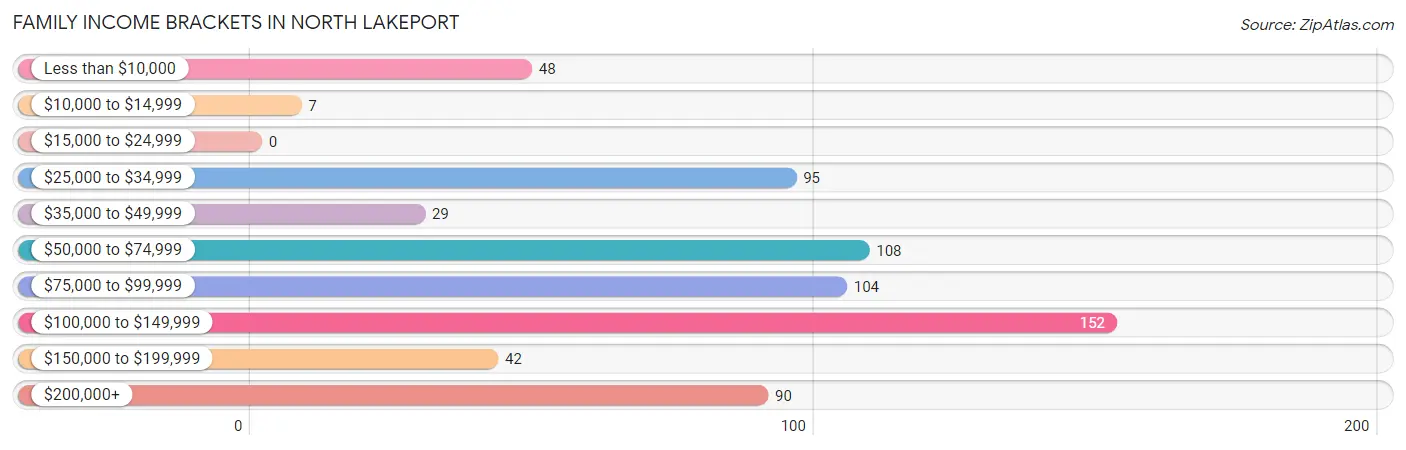
According to the North Lakeport family income data, there are 152 families falling into the $100,000 to $149,999 income range, which is the most common income bracket and makes up 22.5% of all families.
| Income Bracket | # Families | % Families |
| Less than $10,000 | 48 | 7.1% |
| $10,000 to $14,999 | 7 | 1.0% |
| $15,000 to $24,999 | 0 | 0.0% |
| $25,000 to $34,999 | 95 | 14.1% |
| $35,000 to $49,999 | 29 | 4.3% |
| $50,000 to $74,999 | 108 | 16.0% |
| $75,000 to $99,999 | 104 | 15.4% |
| $100,000 to $149,999 | 152 | 22.5% |
| $150,000 to $199,999 | 42 | 6.2% |
| $200,000+ | 90 | 13.3% |
Family Income by Famaliy Size in North Lakeport
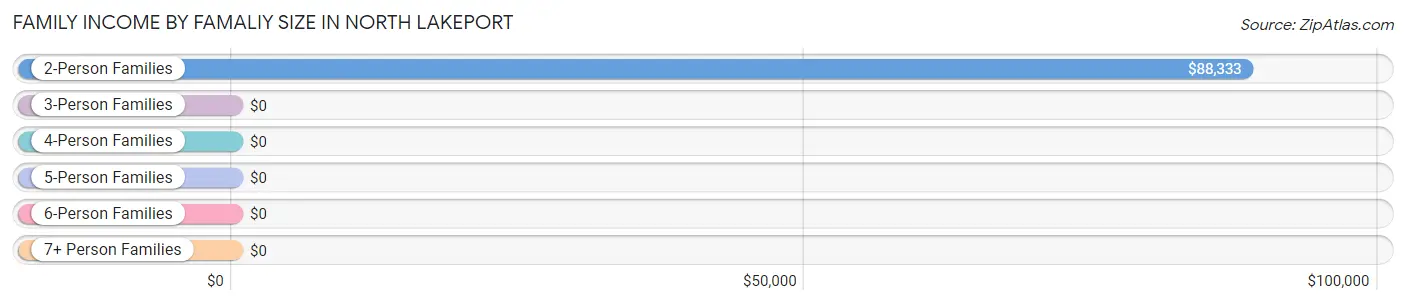
2-person families (388 | 57.5%) account for the highest median family income in North Lakeport with $88,333 per family, while 2-person families (388 | 57.5%) have the highest median income of $44,166 per family member.
| Income Bracket | # Families | Median Income |
| 2-Person Families | 388 (57.5%) | $88,333 |
| 3-Person Families | 158 (23.4%) | $0 |
| 4-Person Families | 113 (16.7%) | $0 |
| 5-Person Families | 13 (1.9%) | $0 |
| 6-Person Families | 3 (0.4%) | $0 |
| 7+ Person Families | 0 (0.0%) | $0 |
| Total | 675 (100.0%) | $87,825 |
Family Income by Number of Earners in North Lakeport
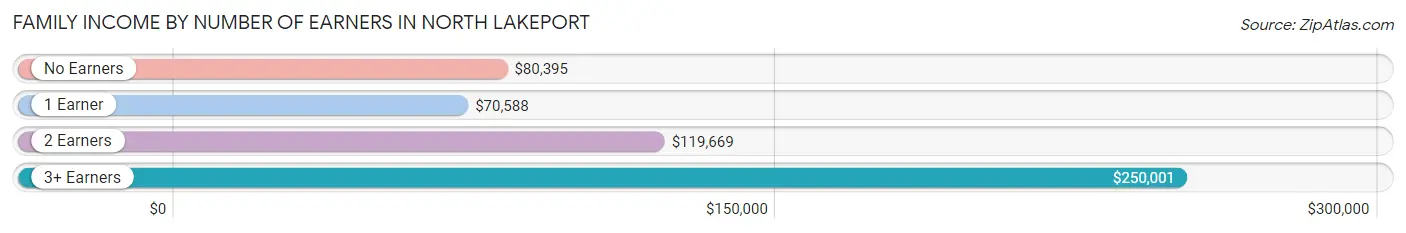
The median family income in North Lakeport is $87,825, with families comprising 3+ earners (62) having the highest median family income of $250,001, while families with 1 earner (280) have the lowest median family income of $70,588, accounting for 9.2% and 41.5% of families, respectively.
| Number of Earners | # Families | Median Income |
| No Earners | 166 (24.6%) | $80,395 |
| 1 Earner | 280 (41.5%) | $70,588 |
| 2 Earners | 167 (24.7%) | $119,669 |
| 3+ Earners | 62 (9.2%) | $250,001 |
| Total | 675 (100.0%) | $87,825 |
Household Income in North Lakeport
Household Income Brackets in North Lakeport
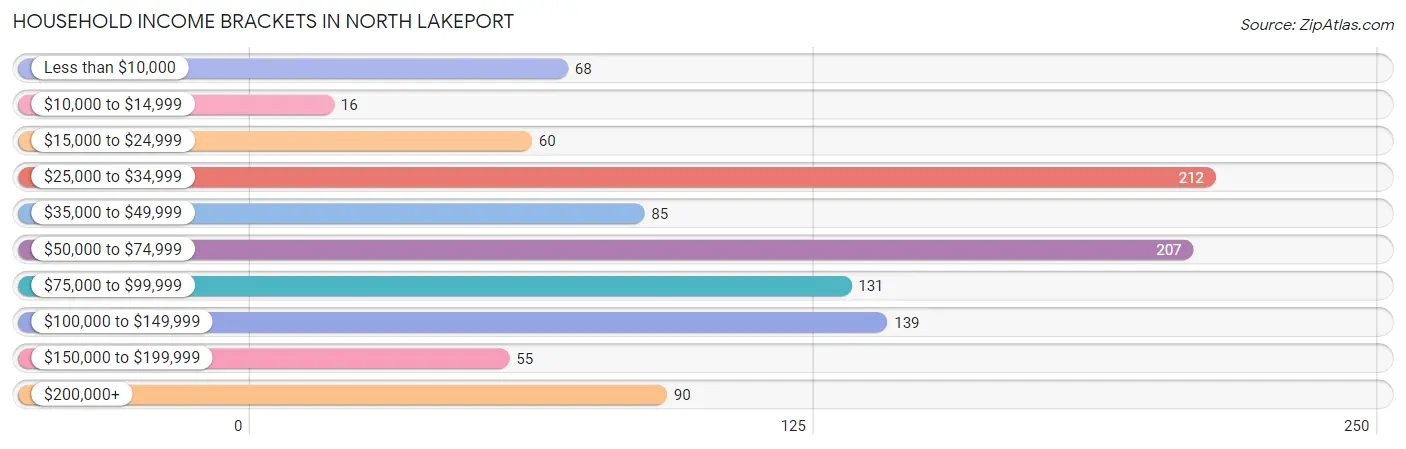
With 212 households falling in the category, the $25,000 to $34,999 income range is the most frequent in North Lakeport, accounting for 19.9% of all households. In contrast, only 16 households (1.5%) fall into the $10,000 to $14,999 income bracket, making it the least populous group.
| Income Bracket | # Households | % Households |
| Less than $10,000 | 68 | 6.4% |
| $10,000 to $14,999 | 16 | 1.5% |
| $15,000 to $24,999 | 60 | 5.6% |
| $25,000 to $34,999 | 212 | 19.9% |
| $35,000 to $49,999 | 85 | 8.0% |
| $50,000 to $74,999 | 207 | 19.5% |
| $75,000 to $99,999 | 131 | 12.3% |
| $100,000 to $149,999 | 139 | 13.1% |
| $150,000 to $199,999 | 55 | 5.2% |
| $200,000+ | 90 | 8.5% |
Household Income by Householder Age in North Lakeport
The median household income in North Lakeport is $59,239, with the highest median household income of $117,610 found in the 45 to 64 years age bracket for the primary householder. A total of 257 households (24.1%) fall into this category. Meanwhile, the 15 to 24 years age bracket for the primary householder has the lowest median household income of $0, with 4 households (0.4%) in this group.
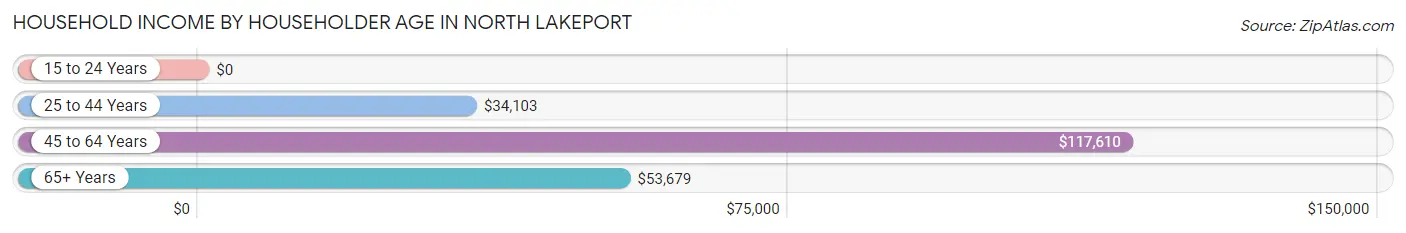
| Income Bracket | # Households | Median Income |
| 15 to 24 Years | 4 (0.4%) | $0 |
| 25 to 44 Years | 174 (16.4%) | $34,103 |
| 45 to 64 Years | 257 (24.1%) | $117,610 |
| 65+ Years | 629 (59.1%) | $53,679 |
| Total | 1,064 (100.0%) | $59,239 |
Poverty in North Lakeport
Income Below Poverty by Sex and Age in North Lakeport
With 15.7% poverty level for males and 20.6% for females among the residents of North Lakeport, 25 to 34 year old males and 5 year old females are the most vulnerable to poverty, with 71 males (49.6%) and 17 females (100.0%) in their respective age groups living below the poverty level.
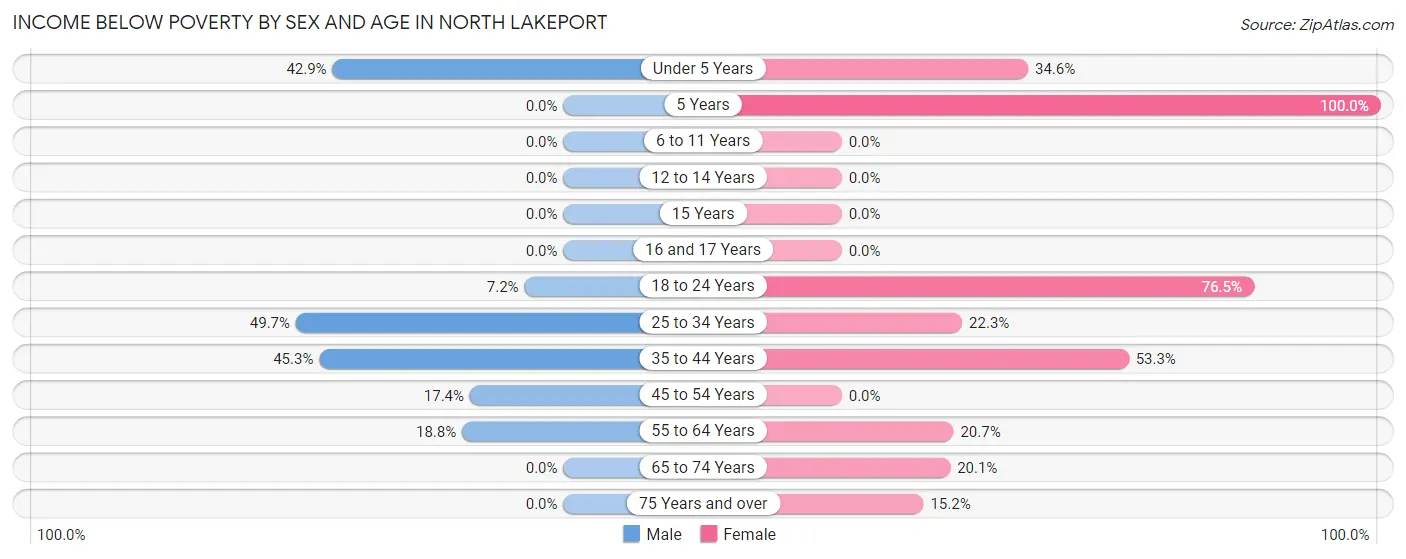
| Age Bracket | Male | Female |
| Under 5 Years | 24 (42.9%) | 28 (34.6%) |
| 5 Years | 0 (0.0%) | 17 (100.0%) |
| 6 to 11 Years | 0 (0.0%) | 0 (0.0%) |
| 12 to 14 Years | 0 (0.0%) | 0 (0.0%) |
| 15 Years | 0 (0.0%) | 0 (0.0%) |
| 16 and 17 Years | 0 (0.0%) | 0 (0.0%) |
| 18 to 24 Years | 6 (7.2%) | 39 (76.5%) |
| 25 to 34 Years | 71 (49.6%) | 21 (22.3%) |
| 35 to 44 Years | 29 (45.3%) | 41 (53.2%) |
| 45 to 54 Years | 34 (17.3%) | 0 (0.0%) |
| 55 to 64 Years | 38 (18.8%) | 34 (20.7%) |
| 65 to 74 Years | 0 (0.0%) | 65 (20.1%) |
| 75 Years and over | 0 (0.0%) | 37 (15.2%) |
| Total | 202 (15.7%) | 282 (20.6%) |
Income Above Poverty by Sex and Age in North Lakeport
According to the poverty statistics in North Lakeport, males aged 5 years and females aged 6 to 11 years are the age groups that are most secure financially, with 100.0% of males and 100.0% of females in these age groups living above the poverty line.
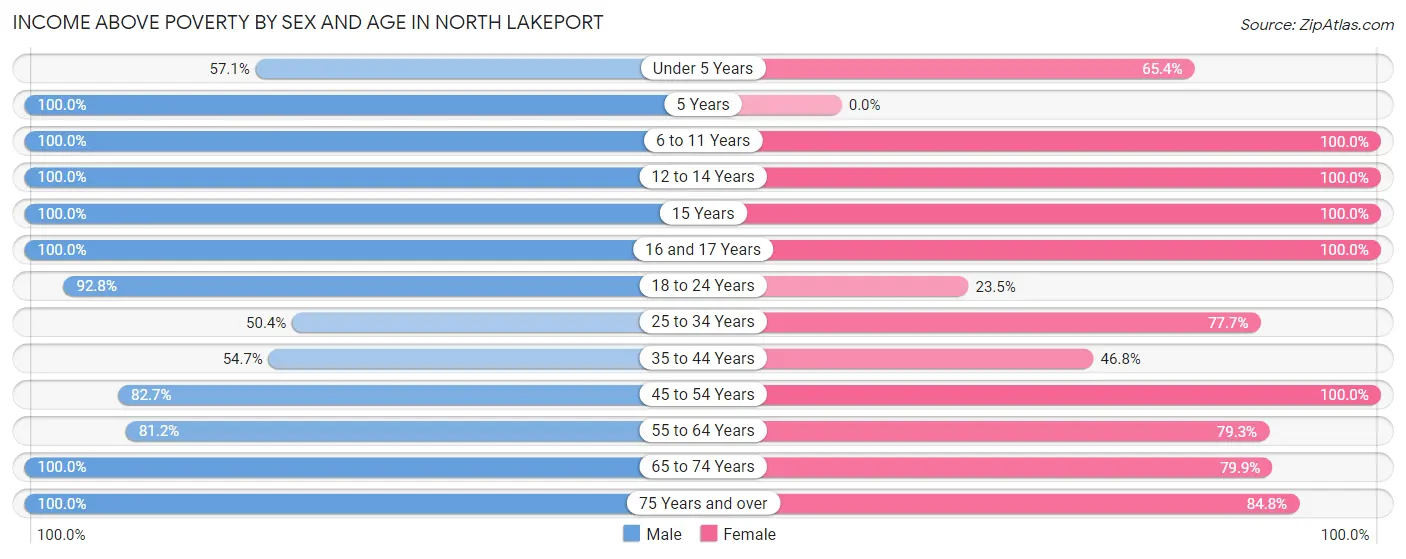
| Age Bracket | Male | Female |
| Under 5 Years | 32 (57.1%) | 53 (65.4%) |
| 5 Years | 48 (100.0%) | 0 (0.0%) |
| 6 to 11 Years | 51 (100.0%) | 49 (100.0%) |
| 12 to 14 Years | 9 (100.0%) | 19 (100.0%) |
| 15 Years | 28 (100.0%) | 5 (100.0%) |
| 16 and 17 Years | 64 (100.0%) | 52 (100.0%) |
| 18 to 24 Years | 77 (92.8%) | 12 (23.5%) |
| 25 to 34 Years | 72 (50.3%) | 73 (77.7%) |
| 35 to 44 Years | 35 (54.7%) | 36 (46.8%) |
| 45 to 54 Years | 162 (82.7%) | 193 (100.0%) |
| 55 to 64 Years | 164 (81.2%) | 130 (79.3%) |
| 65 to 74 Years | 186 (100.0%) | 258 (79.9%) |
| 75 Years and over | 153 (100.0%) | 207 (84.8%) |
| Total | 1,081 (84.3%) | 1,087 (79.4%) |
Income Below Poverty Among Married-Couple Families in North Lakeport
The poverty statistics for married-couple families in North Lakeport show that 7.1% or 36 of the total 509 families live below the poverty line. Families with no children have the highest poverty rate of 9.6%, comprising of 36 families. On the other hand, families with 1 or 2 children have the lowest poverty rate of 0.0%, which includes 0 families.
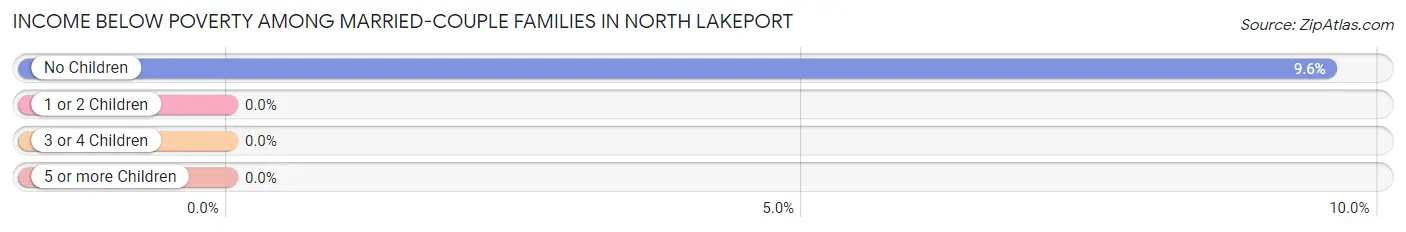
| Children | Above Poverty | Below Poverty |
| No Children | 340 (90.4%) | 36 (9.6%) |
| 1 or 2 Children | 130 (100.0%) | 0 (0.0%) |
| 3 or 4 Children | 3 (100.0%) | 0 (0.0%) |
| 5 or more Children | 0 (0.0%) | 0 (0.0%) |
| Total | 473 (92.9%) | 36 (7.1%) |
Income Below Poverty Among Single-Parent Households in North Lakeport
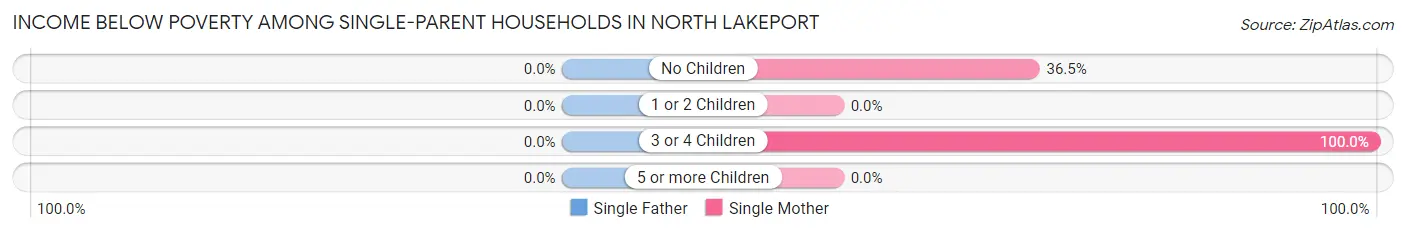
| Children | Single Father | Single Mother |
| No Children | 0 (0.0%) | 27 (36.5%) |
| 1 or 2 Children | 0 (0.0%) | 0 (0.0%) |
| 3 or 4 Children | 0 (0.0%) | 21 (100.0%) |
| 5 or more Children | 0 (0.0%) | 0 (0.0%) |
| Total | 0 (0.0%) | 48 (32.7%) |
Income Below Poverty Among Married-Couple vs Single-Parent Households in North Lakeport
The poverty data for North Lakeport shows that 36 of the married-couple family households (7.1%) and 48 of the single-parent households (28.9%) are living below the poverty level. Within the married-couple family households, those with no children have the highest poverty rate, with 36 households (9.6%) falling below the poverty line. Among the single-parent households, those with 3 or 4 children have the highest poverty rate, with 21 household (100.0%) living below poverty.
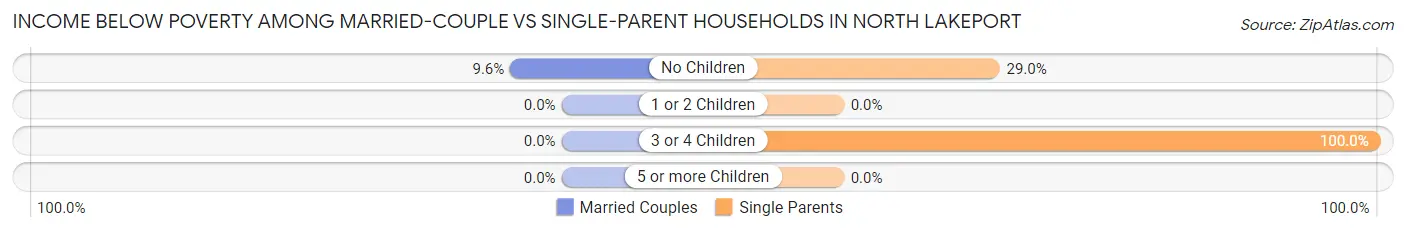
| Children | Married-Couple Families | Single-Parent Households |
| No Children | 36 (9.6%) | 27 (29.0%) |
| 1 or 2 Children | 0 (0.0%) | 0 (0.0%) |
| 3 or 4 Children | 0 (0.0%) | 21 (100.0%) |
| 5 or more Children | 0 (0.0%) | 0 (0.0%) |
| Total | 36 (7.1%) | 48 (28.9%) |
Race in North Lakeport
The most populous races in North Lakeport are White / Caucasian (2,287 | 85.8%), Hispanic or Latino (255 | 9.6%), and Two or more Races (163 | 6.1%).
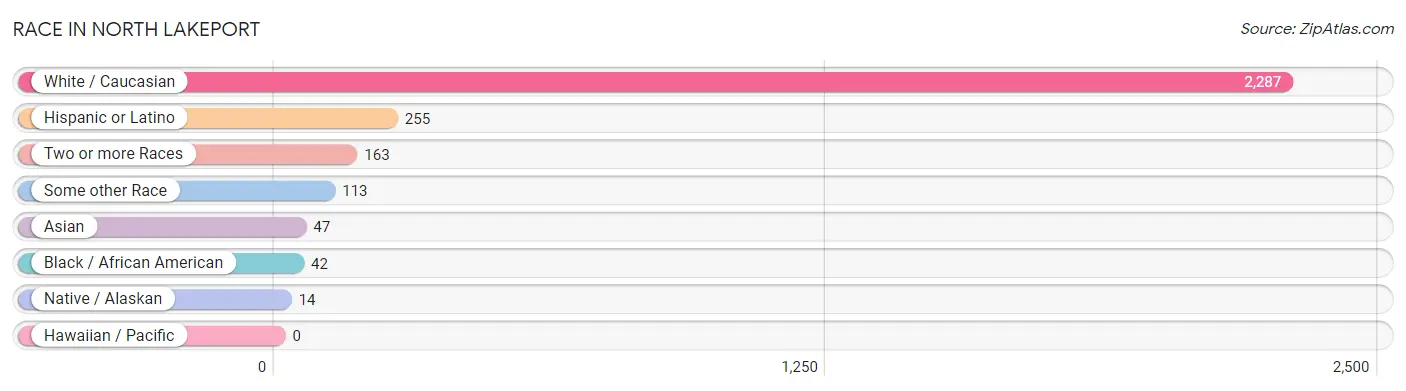
| Race | # Population | % Population |
| Asian | 47 | 1.8% |
| Black / African American | 42 | 1.6% |
| Hawaiian / Pacific | 0 | 0.0% |
| Hispanic or Latino | 255 | 9.6% |
| Native / Alaskan | 14 | 0.5% |
| White / Caucasian | 2,287 | 85.8% |
| Two or more Races | 163 | 6.1% |
| Some other Race | 113 | 4.2% |
| Total | 2,666 | 100.0% |
Ancestry in North Lakeport
The most populous ancestries reported in North Lakeport are Irish (488 | 18.3%), English (397 | 14.9%), German (379 | 14.2%), Norwegian (214 | 8.0%), and Mexican (173 | 6.5%), together accounting for 61.9% of all North Lakeport residents.
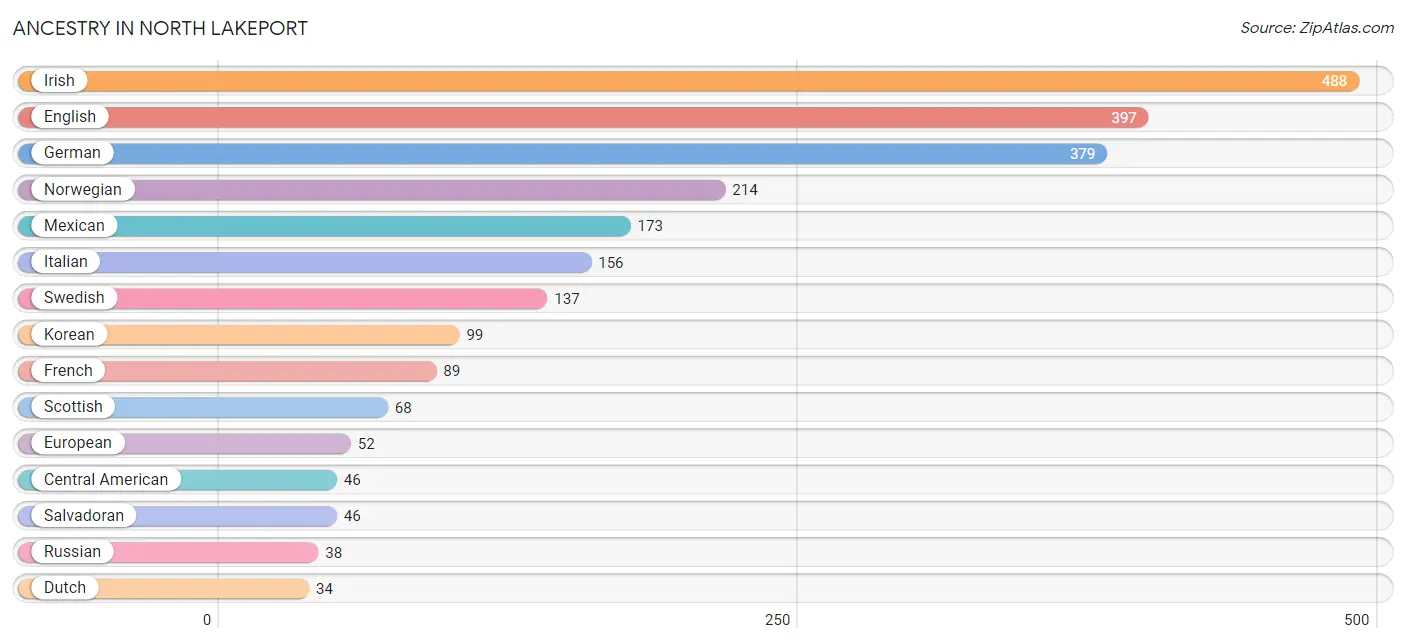
| Ancestry | # Population | % Population |
| American | 11 | 0.4% |
| British | 10 | 0.4% |
| Canadian | 10 | 0.4% |
| Central American | 46 | 1.7% |
| Cherokee | 4 | 0.2% |
| Dutch | 34 | 1.3% |
| English | 397 | 14.9% |
| European | 52 | 1.9% |
| Finnish | 13 | 0.5% |
| French | 89 | 3.3% |
| German | 379 | 14.2% |
| German Russian | 8 | 0.3% |
| Iranian | 25 | 0.9% |
| Irish | 488 | 18.3% |
| Italian | 156 | 5.9% |
| Korean | 99 | 3.7% |
| Mexican | 173 | 6.5% |
| Norwegian | 214 | 8.0% |
| Polish | 10 | 0.4% |
| Portuguese | 33 | 1.2% |
| Puerto Rican | 6 | 0.2% |
| Russian | 38 | 1.4% |
| Salvadoran | 46 | 1.7% |
| Scandinavian | 17 | 0.6% |
| Scotch-Irish | 31 | 1.2% |
| Scottish | 68 | 2.5% |
| Sioux | 6 | 0.2% |
| Swedish | 137 | 5.1% |
| Welsh | 9 | 0.3% | View All 29 Rows |
Immigrants in North Lakeport
The most numerous immigrant groups reported in North Lakeport came from Central America (113 | 4.2%), Latin America (113 | 4.2%), Mexico (113 | 4.2%), Asia (66 | 2.5%), and Europe (54 | 2.0%), together accounting for 17.2% of all North Lakeport residents.
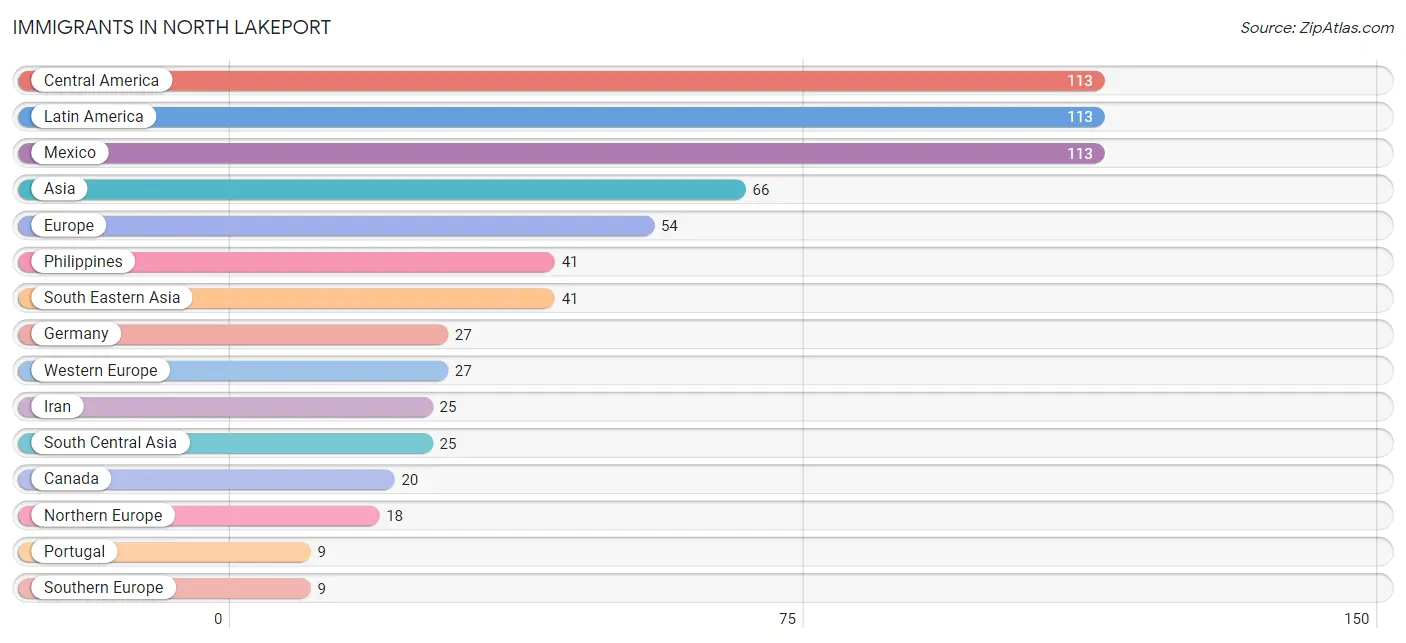
| Immigration Origin | # Population | % Population |
| Asia | 66 | 2.5% |
| Canada | 20 | 0.7% |
| Central America | 113 | 4.2% |
| Europe | 54 | 2.0% |
| Germany | 27 | 1.0% |
| Iran | 25 | 0.9% |
| Latin America | 113 | 4.2% |
| Mexico | 113 | 4.2% |
| Northern Europe | 18 | 0.7% |
| Norway | 8 | 0.3% |
| Philippines | 41 | 1.5% |
| Portugal | 9 | 0.3% |
| South Central Asia | 25 | 0.9% |
| South Eastern Asia | 41 | 1.5% |
| Southern Europe | 9 | 0.3% |
| Western Europe | 27 | 1.0% | View All 16 Rows |
Sex and Age in North Lakeport
Sex and Age in North Lakeport
The most populous age groups in North Lakeport are 15 to 19 Years (165 | 12.7%) for men and 65 to 69 Years (167 | 12.2%) for women.
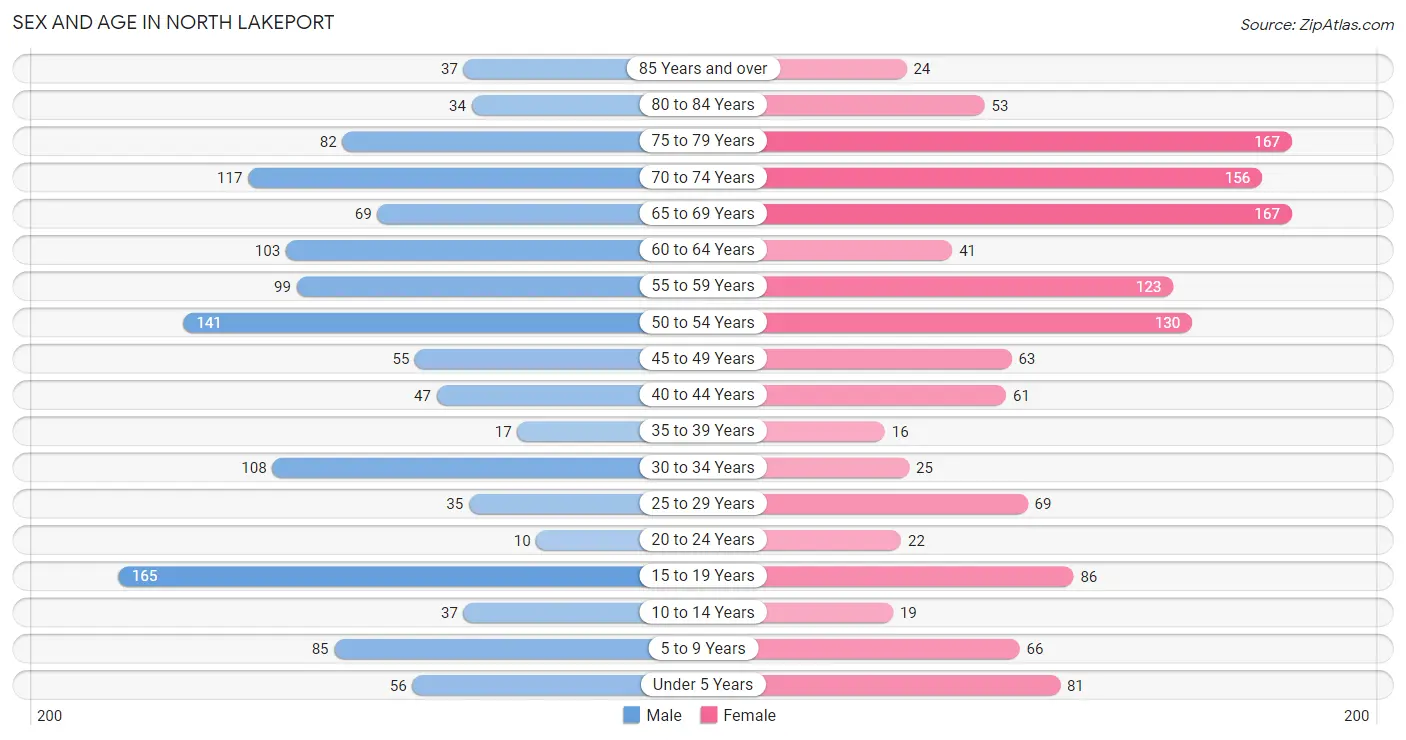
| Age Bracket | Male | Female |
| Under 5 Years | 56 (4.3%) | 81 (5.9%) |
| 5 to 9 Years | 85 (6.6%) | 66 (4.8%) |
| 10 to 14 Years | 37 (2.9%) | 19 (1.4%) |
| 15 to 19 Years | 165 (12.7%) | 86 (6.3%) |
| 20 to 24 Years | 10 (0.8%) | 22 (1.6%) |
| 25 to 29 Years | 35 (2.7%) | 69 (5.0%) |
| 30 to 34 Years | 108 (8.3%) | 25 (1.8%) |
| 35 to 39 Years | 17 (1.3%) | 16 (1.2%) |
| 40 to 44 Years | 47 (3.6%) | 61 (4.5%) |
| 45 to 49 Years | 55 (4.2%) | 63 (4.6%) |
| 50 to 54 Years | 141 (10.9%) | 130 (9.5%) |
| 55 to 59 Years | 99 (7.6%) | 123 (9.0%) |
| 60 to 64 Years | 103 (7.9%) | 41 (3.0%) |
| 65 to 69 Years | 69 (5.3%) | 167 (12.2%) |
| 70 to 74 Years | 117 (9.0%) | 156 (11.4%) |
| 75 to 79 Years | 82 (6.3%) | 167 (12.2%) |
| 80 to 84 Years | 34 (2.6%) | 53 (3.9%) |
| 85 Years and over | 37 (2.9%) | 24 (1.8%) |
| Total | 1,297 (100.0%) | 1,369 (100.0%) |
Families and Households in North Lakeport
Median Family Size in North Lakeport
The median family size in North Lakeport is 3.06 persons per family, with married-couple families (509 | 75.4%) accounting for the largest median family size of 3.11 persons per family. On the other hand, single male/father families (19 | 2.8%) represent the smallest median family size with 2.37 persons per family.
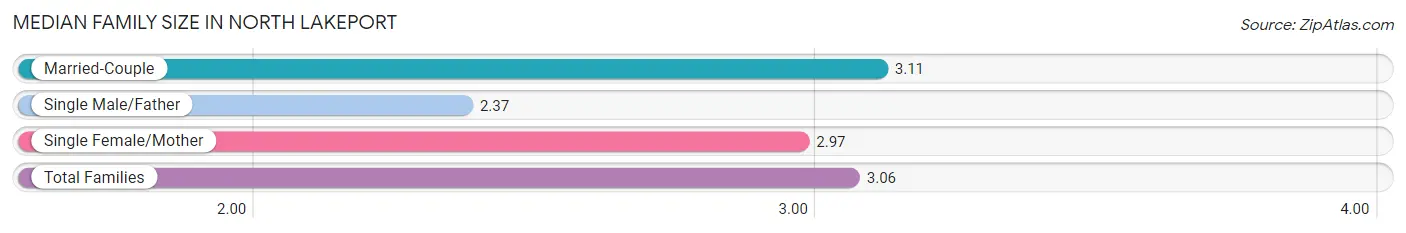
| Family Type | # Families | Family Size |
| Married-Couple | 509 (75.4%) | 3.11 |
| Single Male/Father | 19 (2.8%) | 2.37 |
| Single Female/Mother | 147 (21.8%) | 2.97 |
| Total Families | 675 (100.0%) | 3.06 |
Median Household Size in North Lakeport
The median household size in North Lakeport is 2.50 persons per household, with single female/mother households (147 | 13.8%) accounting for the largest median household size of 3.31 persons per household. non-family households (389 | 36.6%) represent the smallest median household size with 1.21 persons per household.
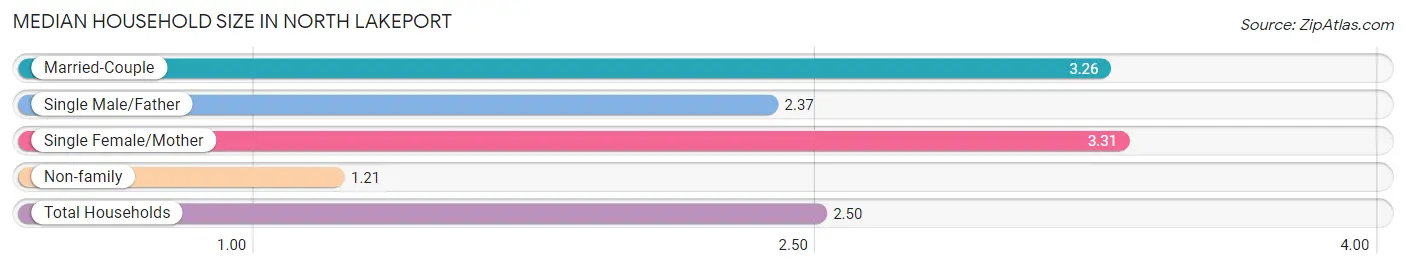
| Household Type | # Households | Household Size |
| Married-Couple | 509 (47.8%) | 3.26 |
| Single Male/Father | 19 (1.8%) | 2.37 |
| Single Female/Mother | 147 (13.8%) | 3.31 |
| Non-family | 389 (36.6%) | 1.21 |
| Total Households | 1,064 (100.0%) | 2.50 |
Household Size by Marriage Status in North Lakeport
Out of a total of 1,064 households in North Lakeport, 675 (63.4%) are family households, while 389 (36.6%) are nonfamily households. The most numerous type of family households are 2-person households, comprising 363, and the most common type of nonfamily households are 1-person households, comprising 326.
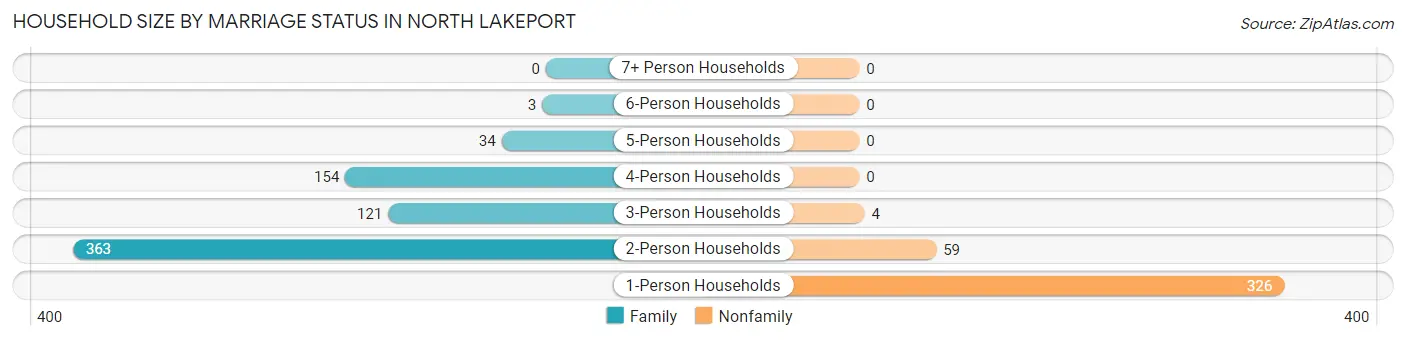
| Household Size | Family Households | Nonfamily Households |
| 1-Person Households | - | 326 (30.6%) |
| 2-Person Households | 363 (34.1%) | 59 (5.6%) |
| 3-Person Households | 121 (11.4%) | 4 (0.4%) |
| 4-Person Households | 154 (14.5%) | 0 (0.0%) |
| 5-Person Households | 34 (3.2%) | 0 (0.0%) |
| 6-Person Households | 3 (0.3%) | 0 (0.0%) |
| 7+ Person Households | 0 (0.0%) | 0 (0.0%) |
| Total | 675 (63.4%) | 389 (36.6%) |
Female Fertility in North Lakeport
Fertility by Age in North Lakeport
Average fertility rate in North Lakeport is 155.0 births per 1,000 women. Women in the age bracket of 20 to 34 years have the highest fertility rate with 517.0 births per 1,000 women. Women in the age bracket of 20 to 34 years acount for 100.0% of all women with births.
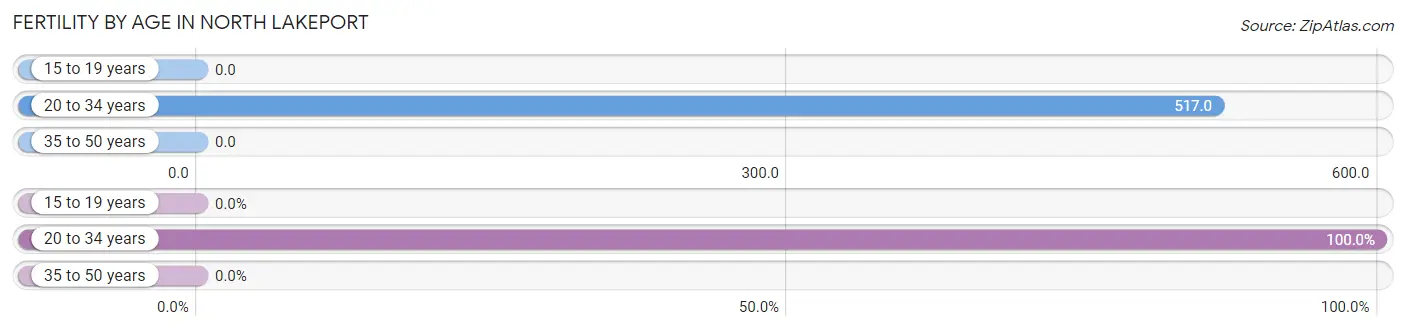
| Age Bracket | Women with Births | Births / 1,000 Women |
| 15 to 19 years | 0 (0.0%) | 0.0 |
| 20 to 34 years | 60 (100.0%) | 517.0 |
| 35 to 50 years | 0 (0.0%) | 0.0 |
| Total | 60 (100.0%) | 155.0 |
Fertility by Age by Marriage Status in North Lakeport
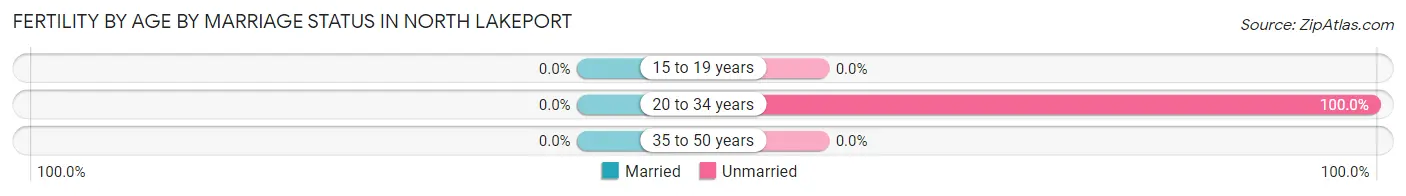
| Age Bracket | Married | Unmarried |
| 15 to 19 years | 0 (0.0%) | 0 (0.0%) |
| 20 to 34 years | 0 (0.0%) | 60 (100.0%) |
| 35 to 50 years | 0 (0.0%) | 0 (0.0%) |
| Total | 0 (0.0%) | 60 (100.0%) |
Fertility by Education in North Lakeport
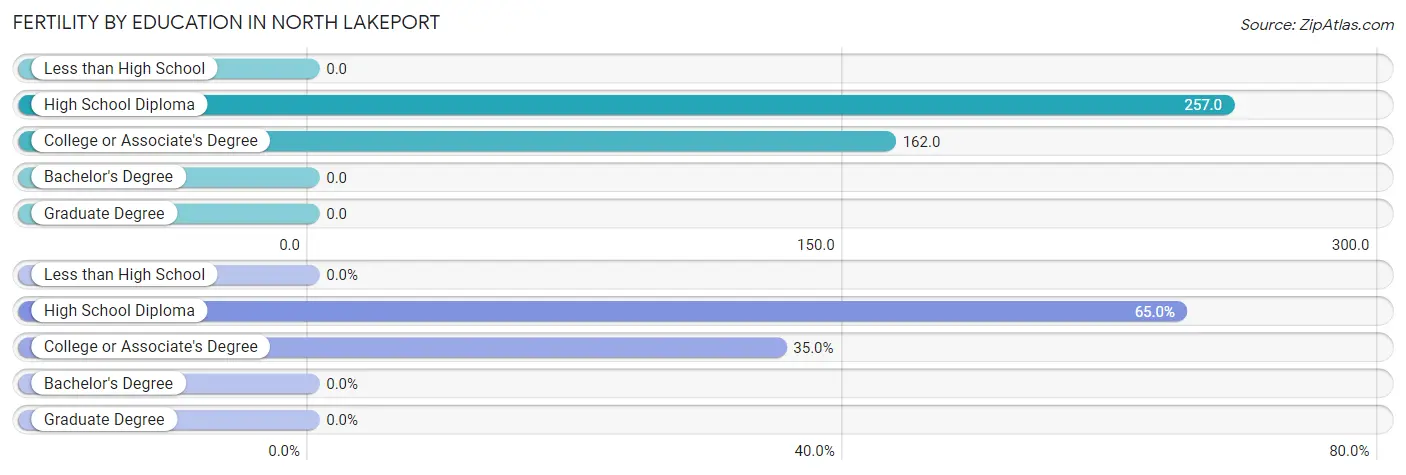
| Educational Attainment | Women with Births | Births / 1,000 Women |
| Less than High School | 0 (0.0%) | 0.0 |
| High School Diploma | 39 (65.0%) | 257.0 |
| College or Associate's Degree | 21 (35.0%) | 162.0 |
| Bachelor's Degree | 0 (0.0%) | 0.0 |
| Graduate Degree | 0 (0.0%) | 0.0 |
| Total | 60 (100.0%) | 155.0 |
Fertility by Education by Marriage Status in North Lakeport
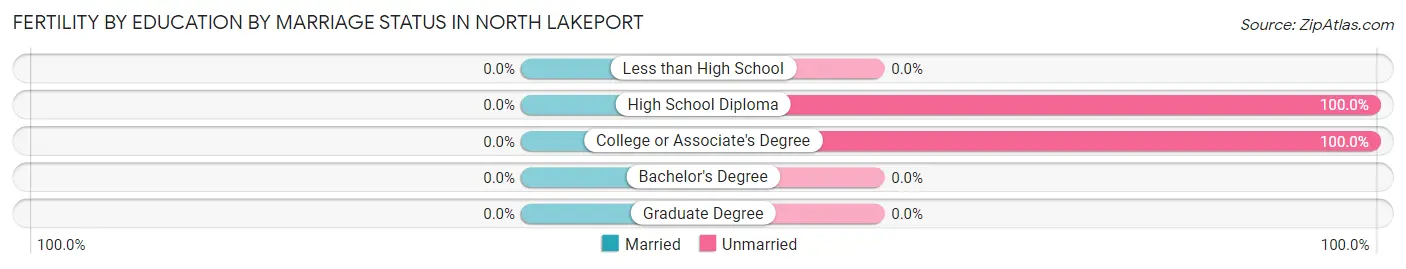
| Educational Attainment | Married | Unmarried |
| Less than High School | 0 (0.0%) | 0 (0.0%) |
| High School Diploma | 0 (0.0%) | 39 (100.0%) |
| College or Associate's Degree | 0 (0.0%) | 21 (100.0%) |
| Bachelor's Degree | 0 (0.0%) | 0 (0.0%) |
| Graduate Degree | 0 (0.0%) | 0 (0.0%) |
| Total | 0 (0.0%) | 60 (100.0%) |
Employment Characteristics in North Lakeport
Employment by Class of Employer in North Lakeport
Among the 964 employed individuals in North Lakeport, private company employees (499 | 51.8%), local government employees (175 | 18.1%), and self-employed (not incorporated) (112 | 11.6%) make up the most common classes of employment.
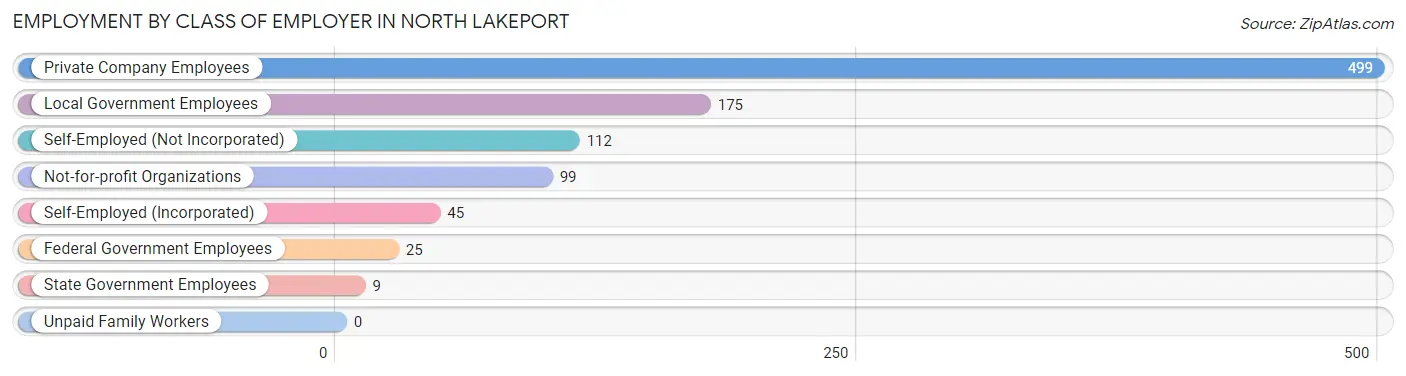
| Employer Class | # Employees | % Employees |
| Private Company Employees | 499 | 51.8% |
| Self-Employed (Incorporated) | 45 | 4.7% |
| Self-Employed (Not Incorporated) | 112 | 11.6% |
| Not-for-profit Organizations | 99 | 10.3% |
| Local Government Employees | 175 | 18.1% |
| State Government Employees | 9 | 0.9% |
| Federal Government Employees | 25 | 2.6% |
| Unpaid Family Workers | 0 | 0.0% |
| Total | 964 | 100.0% |
Employment Status by Age in North Lakeport
According to the labor force statistics for North Lakeport, out of the total population over 16 years of age (2,289), 46.8% or 1,071 individuals are in the labor force, with 4.4% or 47 of them unemployed. The age group with the highest labor force participation rate is 20 to 24 years, with 100.0% or 32 individuals in the labor force. Within the labor force, the 20 to 24 years age range has the highest percentage of unemployed individuals, with 18.8% or 6 of them being unemployed.
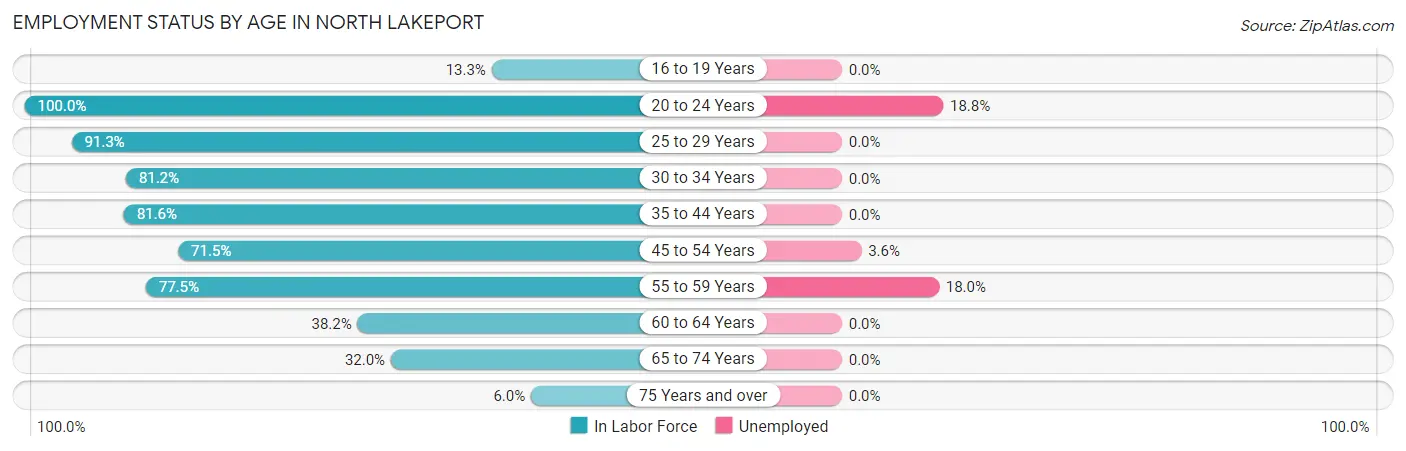
| Age Bracket | In Labor Force | Unemployed |
| 16 to 19 Years | 29 (13.3%) | 0 (0.0%) |
| 20 to 24 Years | 32 (100.0%) | 6 (18.8%) |
| 25 to 29 Years | 95 (91.3%) | 0 (0.0%) |
| 30 to 34 Years | 108 (81.2%) | 0 (0.0%) |
| 35 to 44 Years | 115 (81.6%) | 0 (0.0%) |
| 45 to 54 Years | 278 (71.5%) | 10 (3.6%) |
| 55 to 59 Years | 172 (77.5%) | 31 (18.0%) |
| 60 to 64 Years | 55 (38.2%) | 0 (0.0%) |
| 65 to 74 Years | 163 (32.0%) | 0 (0.0%) |
| 75 Years and over | 24 (6.0%) | 0 (0.0%) |
| Total | 1,071 (46.8%) | 47 (4.4%) |
Employment Status by Educational Attainment in North Lakeport
According to labor force statistics for North Lakeport, 72.6% of individuals (823) out of the total population between 25 and 64 years of age (1,133) are in the labor force, with 5.1% or 42 of them being unemployed. The group with the highest labor force participation rate are those with the educational attainment of less than high school, with 87.9% or 58 individuals in the labor force. Within the labor force, individuals with less than high school education have the highest percentage of unemployment, with 31.0% or 18 of them being unemployed.
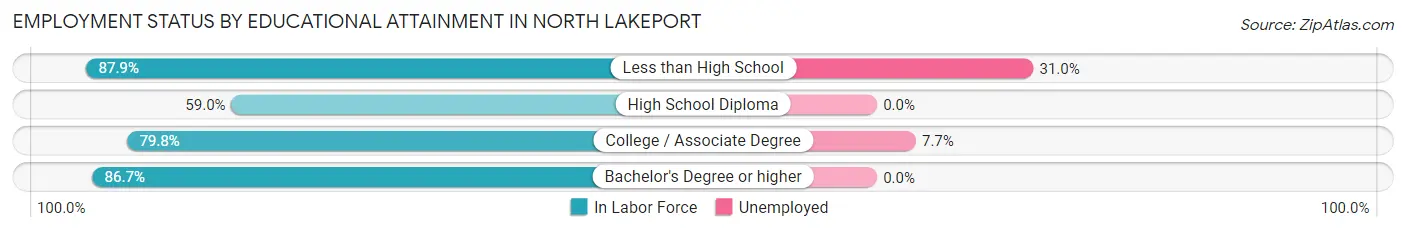
| Educational Attainment | In Labor Force | Unemployed |
| Less than High School | 58 (87.9%) | 20 (31.0%) |
| High School Diploma | 283 (59.0%) | 0 (0.0%) |
| College / Associate Degree | 313 (79.8%) | 30 (7.7%) |
| Bachelor's Degree or higher | 169 (86.7%) | 0 (0.0%) |
| Total | 823 (72.6%) | 58 (5.1%) |
Employment Occupations by Sex in North Lakeport
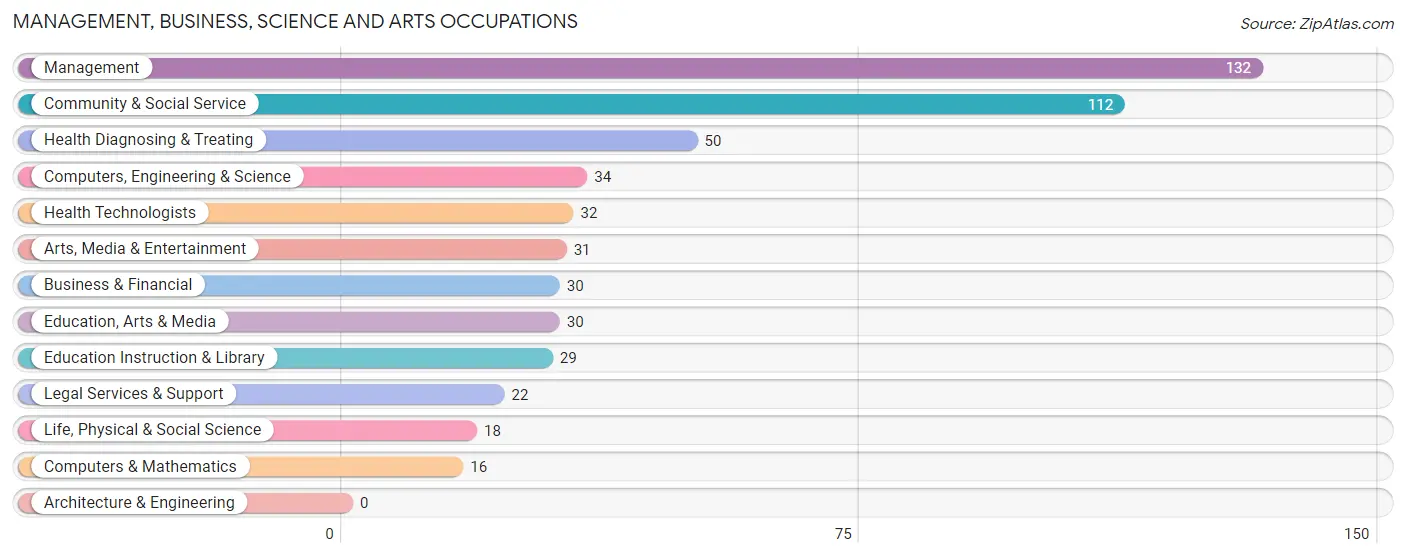
Management, Business, Science and Arts Occupations
The most common Management, Business, Science and Arts occupations in North Lakeport are Management (132 | 13.1%), Community & Social Service (112 | 11.1%), Health Diagnosing & Treating (50 | 5.0%), Computers, Engineering & Science (34 | 3.4%), and Health Technologists (32 | 3.2%).
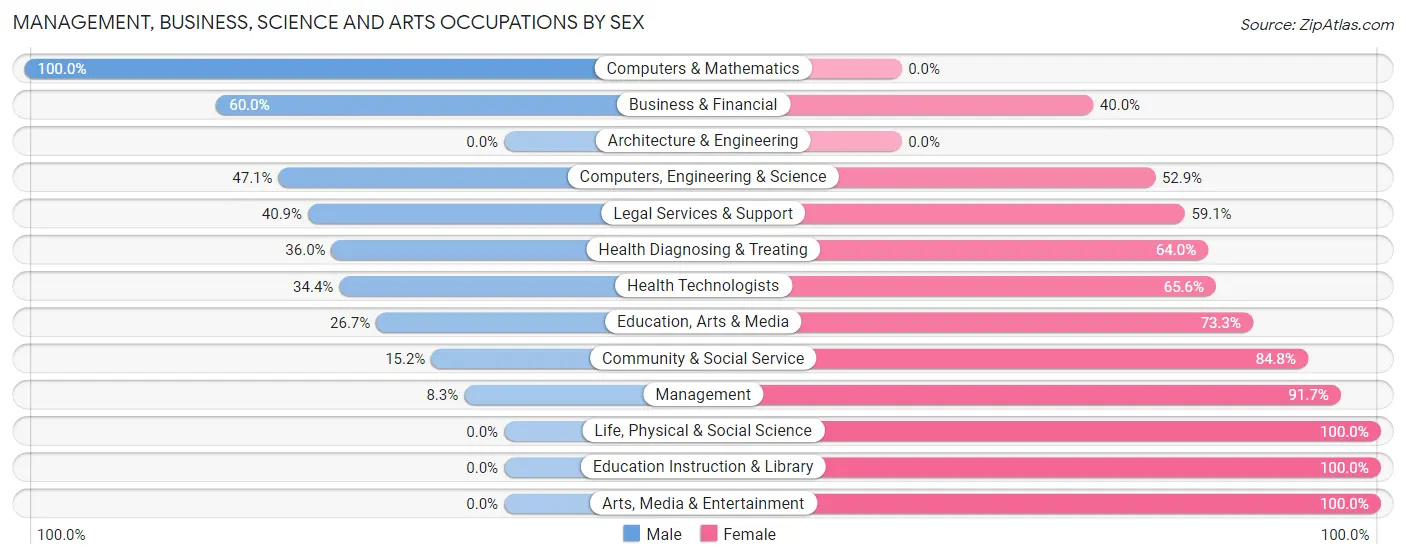
Management, Business, Science and Arts Occupations by Sex
Within the Management, Business, Science and Arts occupations in North Lakeport, the most male-oriented occupations are Computers & Mathematics (100.0%), Business & Financial (60.0%), and Computers, Engineering & Science (47.1%), while the most female-oriented occupations are Life, Physical & Social Science (100.0%), Education Instruction & Library (100.0%), and Arts, Media & Entertainment (100.0%).
| Occupation | Male | Female |
| Management | 11 (8.3%) | 121 (91.7%) |
| Business & Financial | 18 (60.0%) | 12 (40.0%) |
| Computers, Engineering & Science | 16 (47.1%) | 18 (52.9%) |
| Computers & Mathematics | 16 (100.0%) | 0 (0.0%) |
| Architecture & Engineering | 0 (0.0%) | 0 (0.0%) |
| Life, Physical & Social Science | 0 (0.0%) | 18 (100.0%) |
| Community & Social Service | 17 (15.2%) | 95 (84.8%) |
| Education, Arts & Media | 8 (26.7%) | 22 (73.3%) |
| Legal Services & Support | 9 (40.9%) | 13 (59.1%) |
| Education Instruction & Library | 0 (0.0%) | 29 (100.0%) |
| Arts, Media & Entertainment | 0 (0.0%) | 31 (100.0%) |
| Health Diagnosing & Treating | 18 (36.0%) | 32 (64.0%) |
| Health Technologists | 11 (34.4%) | 21 (65.6%) |
| Total (Category) | 80 (22.4%) | 278 (77.6%) |
| Total (Overall) | 440 (43.5%) | 571 (56.5%) |
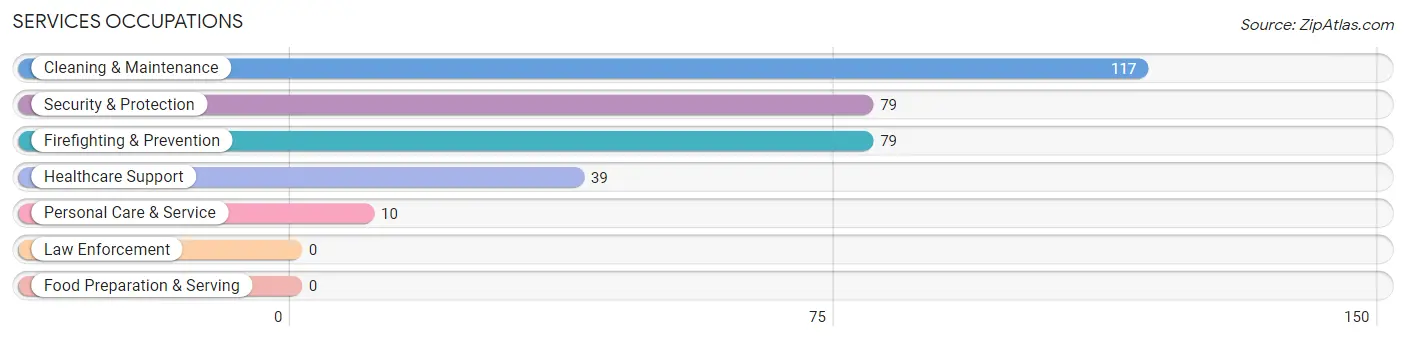
Services Occupations
The most common Services occupations in North Lakeport are Cleaning & Maintenance (117 | 11.6%), Security & Protection (79 | 7.8%), Firefighting & Prevention (79 | 7.8%), Healthcare Support (39 | 3.9%), and Personal Care & Service (10 | 1.0%).
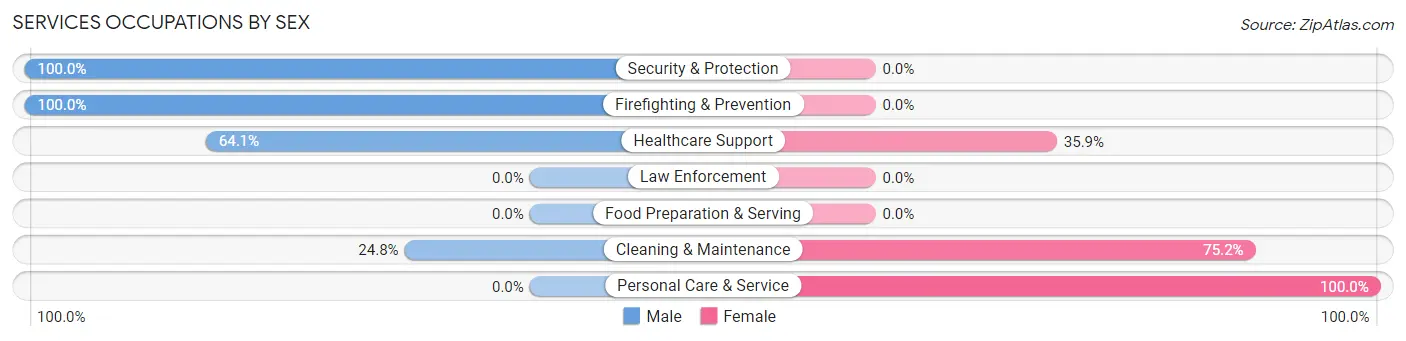
Services Occupations by Sex
Within the Services occupations in North Lakeport, the most male-oriented occupations are Security & Protection (100.0%), Firefighting & Prevention (100.0%), and Healthcare Support (64.1%), while the most female-oriented occupations are Personal Care & Service (100.0%), Cleaning & Maintenance (75.2%), and Healthcare Support (35.9%).
| Occupation | Male | Female |
| Healthcare Support | 25 (64.1%) | 14 (35.9%) |
| Security & Protection | 79 (100.0%) | 0 (0.0%) |
| Firefighting & Prevention | 79 (100.0%) | 0 (0.0%) |
| Law Enforcement | 0 (0.0%) | 0 (0.0%) |
| Food Preparation & Serving | 0 (0.0%) | 0 (0.0%) |
| Cleaning & Maintenance | 29 (24.8%) | 88 (75.2%) |
| Personal Care & Service | 0 (0.0%) | 10 (100.0%) |
| Total (Category) | 133 (54.3%) | 112 (45.7%) |
| Total (Overall) | 440 (43.5%) | 571 (56.5%) |
Sales and Office Occupations
The most common Sales and Office occupations in North Lakeport are Sales & Related (126 | 12.5%), and Office & Administration (83 | 8.2%).
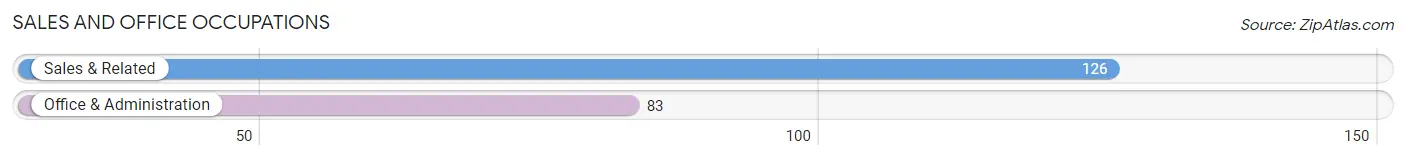
Sales and Office Occupations by Sex

| Occupation | Male | Female |
| Sales & Related | 23 (18.2%) | 103 (81.8%) |
| Office & Administration | 30 (36.1%) | 53 (63.9%) |
| Total (Category) | 53 (25.4%) | 156 (74.6%) |
| Total (Overall) | 440 (43.5%) | 571 (56.5%) |
Natural Resources, Construction and Maintenance Occupations
The most common Natural Resources, Construction and Maintenance occupations in North Lakeport are Construction & Extraction (58 | 5.7%), Installation, Maintenance & Repair (53 | 5.2%), and Farming, Fishing & Forestry (17 | 1.7%).
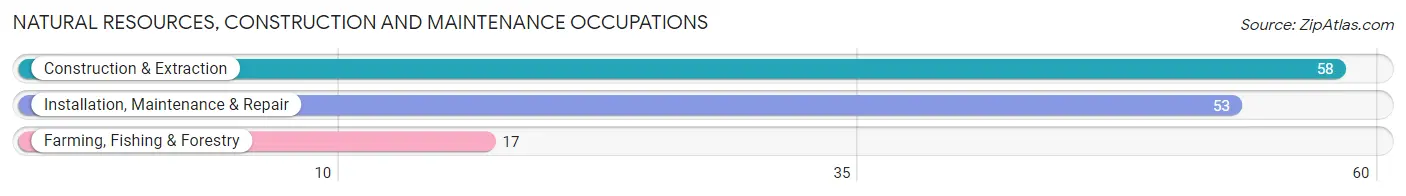
Natural Resources, Construction and Maintenance Occupations by Sex
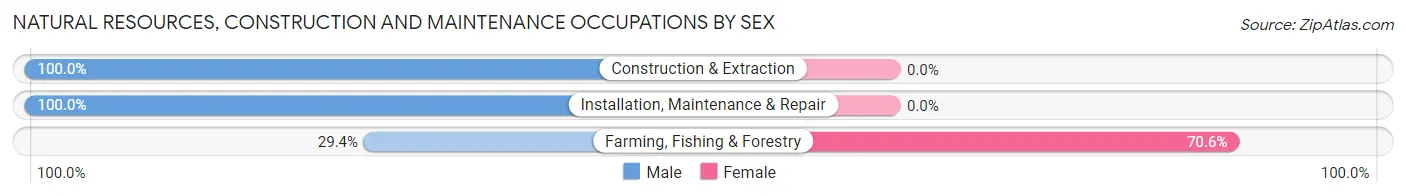
| Occupation | Male | Female |
| Farming, Fishing & Forestry | 5 (29.4%) | 12 (70.6%) |
| Construction & Extraction | 58 (100.0%) | 0 (0.0%) |
| Installation, Maintenance & Repair | 53 (100.0%) | 0 (0.0%) |
| Total (Category) | 116 (90.6%) | 12 (9.4%) |
| Total (Overall) | 440 (43.5%) | 571 (56.5%) |
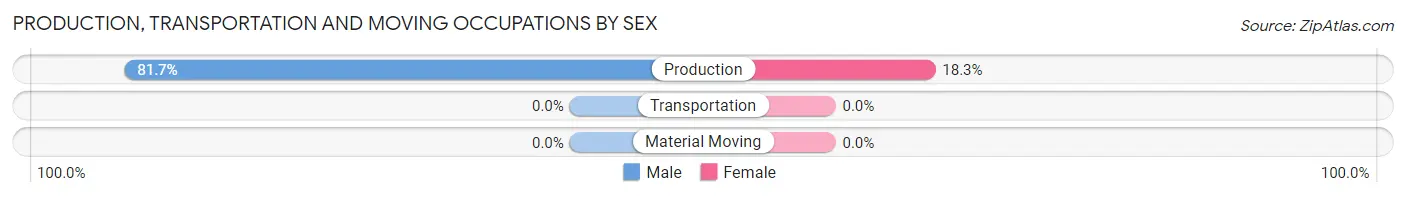
Production, Transportation and Moving Occupations
The most common Production, Transportation and Moving occupations in North Lakeport are , and Production (71 | 7.0%).
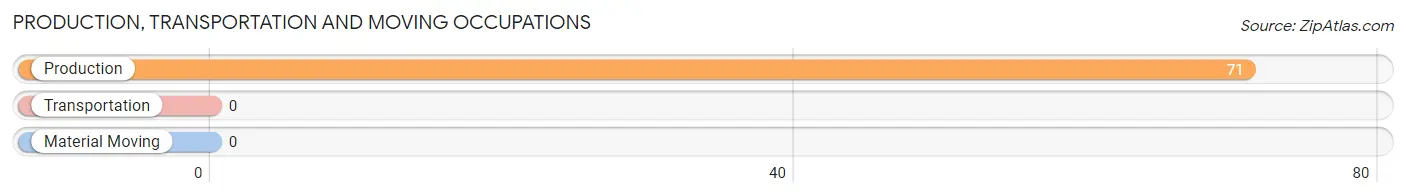
Production, Transportation and Moving Occupations by Sex
| Occupation | Male | Female |
| Production | 58 (81.7%) | 13 (18.3%) |
| Transportation | 0 (0.0%) | 0 (0.0%) |
| Material Moving | 0 (0.0%) | 0 (0.0%) |
| Total (Category) | 58 (81.7%) | 13 (18.3%) |
| Total (Overall) | 440 (43.5%) | 571 (56.5%) |
Employment Industries by Sex in North Lakeport
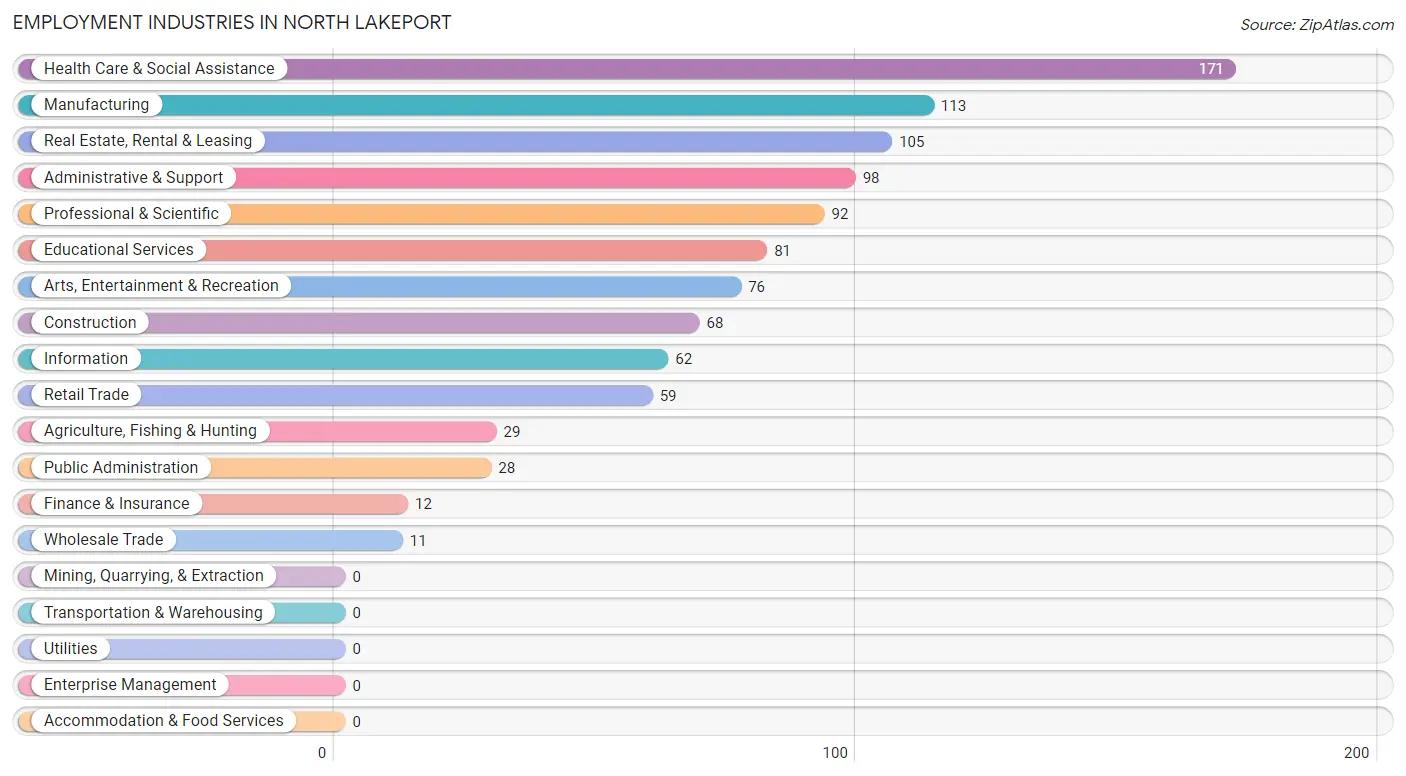
Employment Industries in North Lakeport
The major employment industries in North Lakeport include Health Care & Social Assistance (171 | 16.9%), Manufacturing (113 | 11.2%), Real Estate, Rental & Leasing (105 | 10.4%), Administrative & Support (98 | 9.7%), and Professional & Scientific (92 | 9.1%).
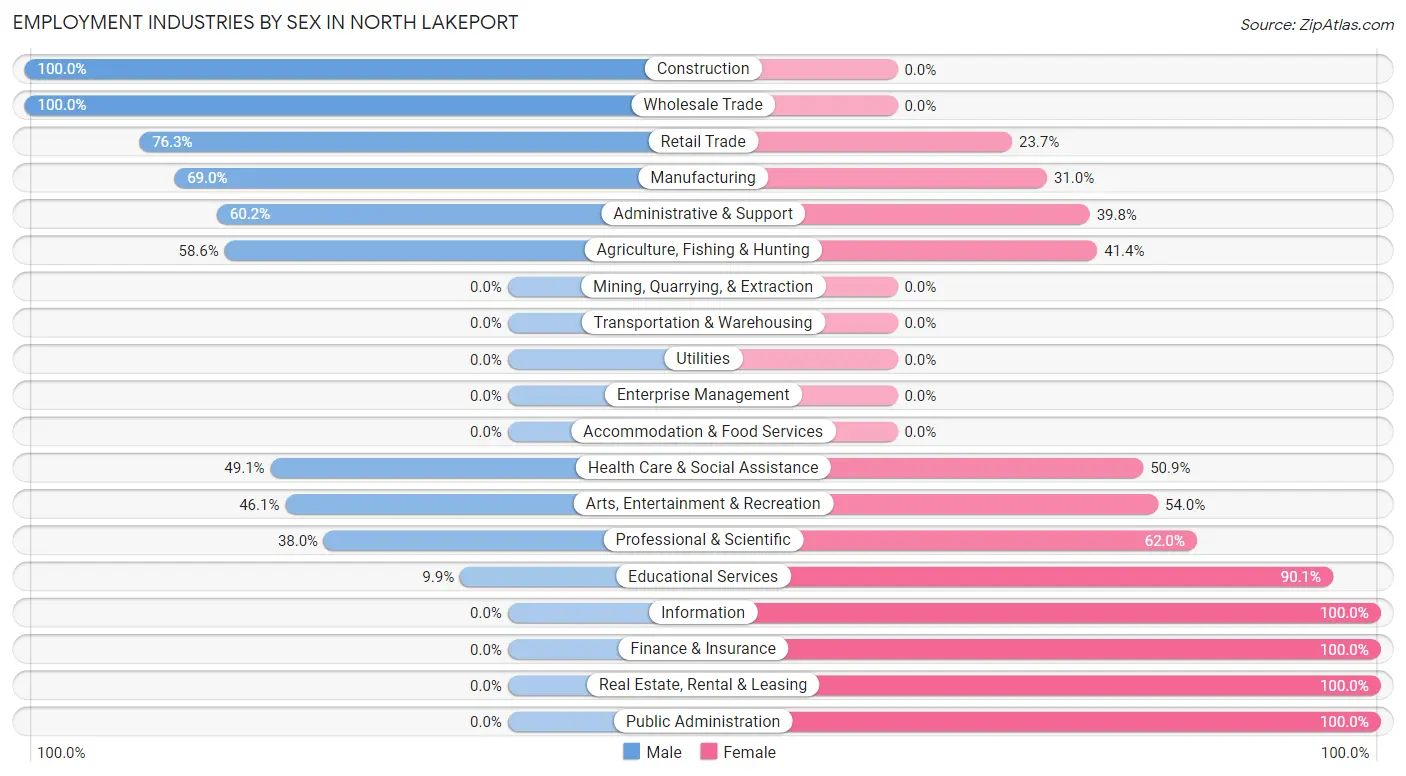
Employment Industries by Sex in North Lakeport
The North Lakeport industries that see more men than women are Construction (100.0%), Wholesale Trade (100.0%), and Retail Trade (76.3%), whereas the industries that tend to have a higher number of women are Information (100.0%), Finance & Insurance (100.0%), and Real Estate, Rental & Leasing (100.0%).
| Industry | Male | Female |
| Agriculture, Fishing & Hunting | 17 (58.6%) | 12 (41.4%) |
| Mining, Quarrying, & Extraction | 0 (0.0%) | 0 (0.0%) |
| Construction | 68 (100.0%) | 0 (0.0%) |
| Manufacturing | 78 (69.0%) | 35 (31.0%) |
| Wholesale Trade | 11 (100.0%) | 0 (0.0%) |
| Retail Trade | 45 (76.3%) | 14 (23.7%) |
| Transportation & Warehousing | 0 (0.0%) | 0 (0.0%) |
| Utilities | 0 (0.0%) | 0 (0.0%) |
| Information | 0 (0.0%) | 62 (100.0%) |
| Finance & Insurance | 0 (0.0%) | 12 (100.0%) |
| Real Estate, Rental & Leasing | 0 (0.0%) | 105 (100.0%) |
| Professional & Scientific | 35 (38.0%) | 57 (62.0%) |
| Enterprise Management | 0 (0.0%) | 0 (0.0%) |
| Administrative & Support | 59 (60.2%) | 39 (39.8%) |
| Educational Services | 8 (9.9%) | 73 (90.1%) |
| Health Care & Social Assistance | 84 (49.1%) | 87 (50.9%) |
| Arts, Entertainment & Recreation | 35 (46.1%) | 41 (53.9%) |
| Accommodation & Food Services | 0 (0.0%) | 0 (0.0%) |
| Public Administration | 0 (0.0%) | 28 (100.0%) |
| Total | 440 (43.5%) | 571 (56.5%) |
Education in North Lakeport
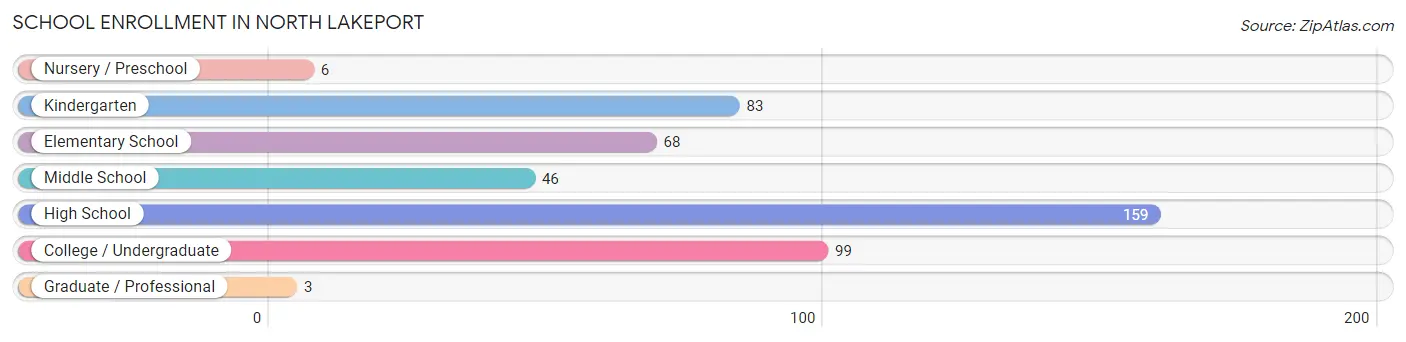
School Enrollment in North Lakeport
The most common levels of schooling among the 464 students in North Lakeport are high school (159 | 34.3%), college / undergraduate (99 | 21.3%), and kindergarten (83 | 17.9%).
| School Level | # Students | % Students |
| Nursery / Preschool | 6 | 1.3% |
| Kindergarten | 83 | 17.9% |
| Elementary School | 68 | 14.7% |
| Middle School | 46 | 9.9% |
| High School | 159 | 34.3% |
| College / Undergraduate | 99 | 21.3% |
| Graduate / Professional | 3 | 0.6% |
| Total | 464 | 100.0% |
School Enrollment by Age by Funding Source in North Lakeport
Out of a total of 464 students who are enrolled in schools in North Lakeport, 51 (11.0%) attend a private institution, while the remaining 413 (89.0%) are enrolled in public schools. The age group of 3 to 4 year olds has the highest likelihood of being enrolled in private schools, with 6 (100.0% in the age bracket) enrolled. Conversely, the age group of 10 to 14 year olds has the lowest likelihood of being enrolled in a private school, with 56 (100.0% in the age bracket) attending a public institution.
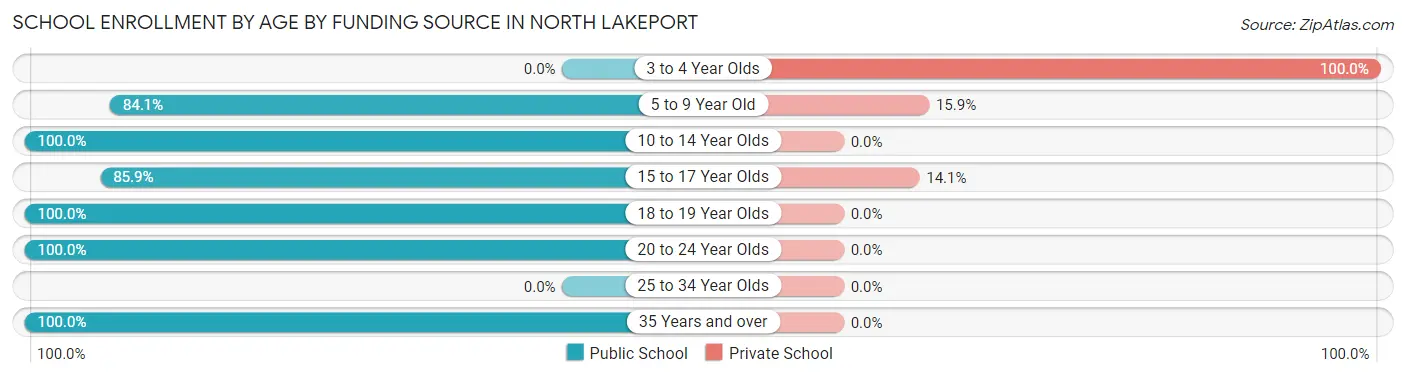
| Age Bracket | Public School | Private School |
| 3 to 4 Year Olds | 0 (0.0%) | 6 (100.0%) |
| 5 to 9 Year Old | 127 (84.1%) | 24 (15.9%) |
| 10 to 14 Year Olds | 56 (100.0%) | 0 (0.0%) |
| 15 to 17 Year Olds | 128 (85.9%) | 21 (14.1%) |
| 18 to 19 Year Olds | 73 (100.0%) | 0 (0.0%) |
| 20 to 24 Year Olds | 16 (100.0%) | 0 (0.0%) |
| 25 to 34 Year Olds | 0 (0.0%) | 0 (0.0%) |
| 35 Years and over | 13 (100.0%) | 0 (0.0%) |
| Total | 413 (89.0%) | 51 (11.0%) |
Educational Attainment by Field of Study in North Lakeport
Social sciences (99 | 19.5%), business (64 | 12.6%), psychology (56 | 11.0%), liberal arts & history (53 | 10.4%), and literature & languages (52 | 10.2%) are the most common fields of study among 509 individuals in North Lakeport who have obtained a bachelor's degree or higher.
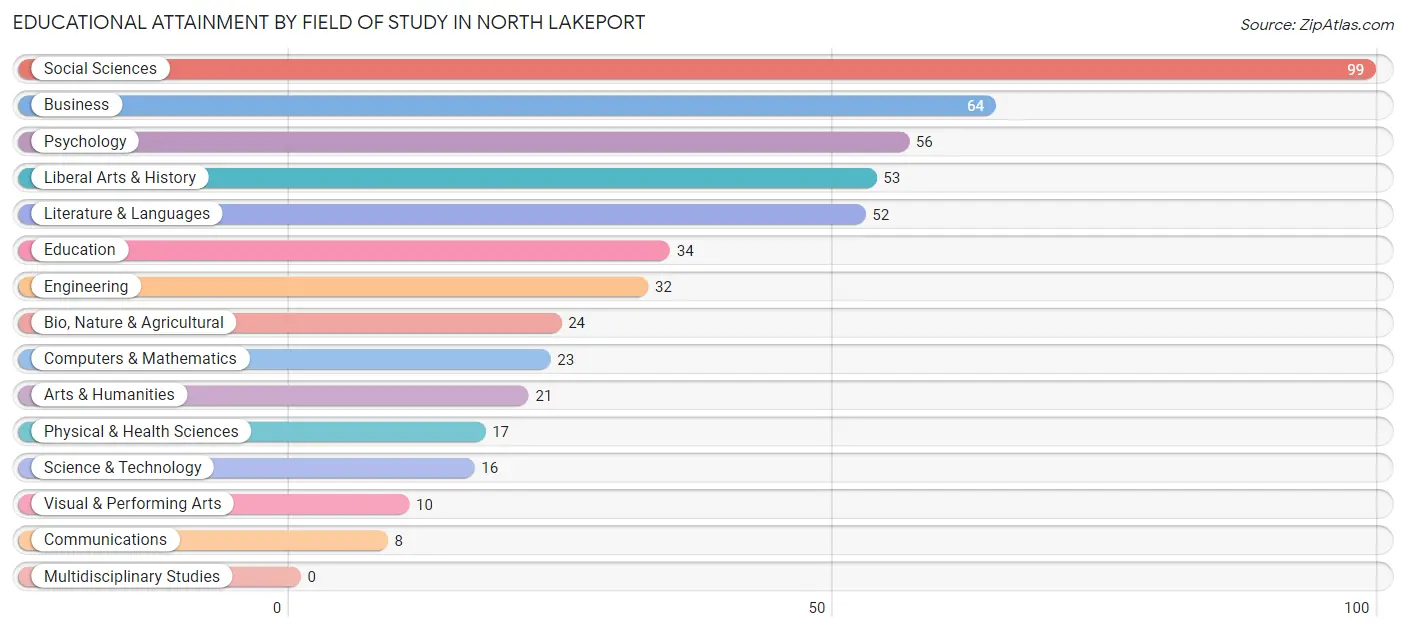
| Field of Study | # Graduates | % Graduates |
| Computers & Mathematics | 23 | 4.5% |
| Bio, Nature & Agricultural | 24 | 4.7% |
| Physical & Health Sciences | 17 | 3.3% |
| Psychology | 56 | 11.0% |
| Social Sciences | 99 | 19.5% |
| Engineering | 32 | 6.3% |
| Multidisciplinary Studies | 0 | 0.0% |
| Science & Technology | 16 | 3.1% |
| Business | 64 | 12.6% |
| Education | 34 | 6.7% |
| Literature & Languages | 52 | 10.2% |
| Liberal Arts & History | 53 | 10.4% |
| Visual & Performing Arts | 10 | 2.0% |
| Communications | 8 | 1.6% |
| Arts & Humanities | 21 | 4.1% |
| Total | 509 | 100.0% |
Transportation & Commute in North Lakeport
Vehicle Availability by Sex in North Lakeport
The most prevalent vehicle ownership categories in North Lakeport are males with 3 vehicles (142, accounting for 31.4%) and females with 3 vehicles (170, making up 27.8%).
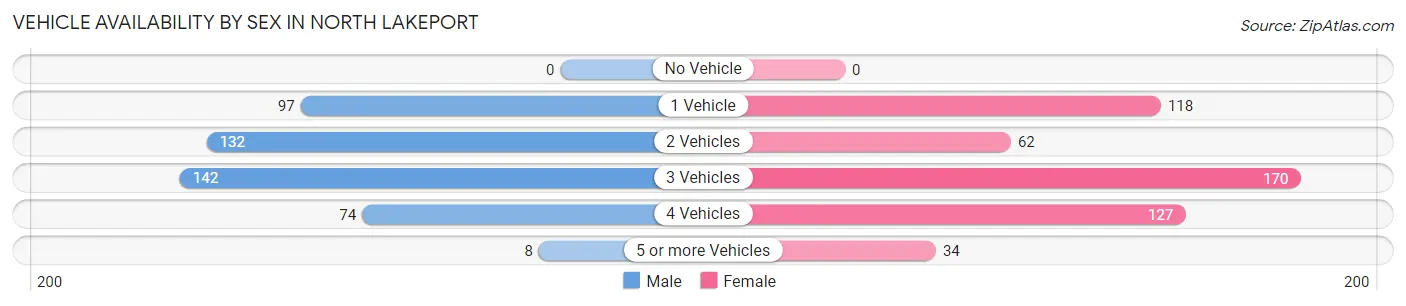
| Vehicles Available | Male | Female |
| No Vehicle | 0 (0.0%) | 0 (0.0%) |
| 1 Vehicle | 97 (21.4%) | 118 (23.1%) |
| 2 Vehicles | 132 (29.1%) | 62 (12.1%) |
| 3 Vehicles | 142 (31.4%) | 170 (33.3%) |
| 4 Vehicles | 74 (16.3%) | 127 (24.8%) |
| 5 or more Vehicles | 8 (1.8%) | 34 (6.7%) |
| Total | 453 (100.0%) | 511 (100.0%) |
Commute Time in North Lakeport
The most frequently occuring commute durations in North Lakeport are 10 to 14 minutes (327 commuters, 40.1%), 20 to 24 minutes (120 commuters, 14.7%), and 5 to 9 minutes (116 commuters, 14.2%).
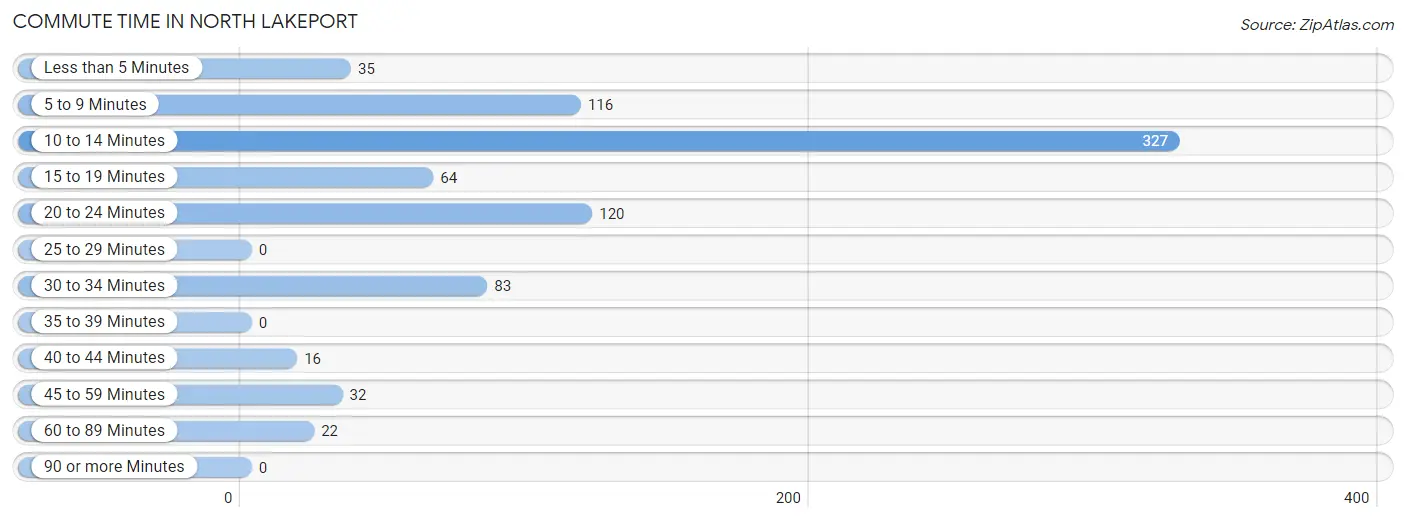
| Commute Time | # Commuters | % Commuters |
| Less than 5 Minutes | 35 | 4.3% |
| 5 to 9 Minutes | 116 | 14.2% |
| 10 to 14 Minutes | 327 | 40.1% |
| 15 to 19 Minutes | 64 | 7.9% |
| 20 to 24 Minutes | 120 | 14.7% |
| 25 to 29 Minutes | 0 | 0.0% |
| 30 to 34 Minutes | 83 | 10.2% |
| 35 to 39 Minutes | 0 | 0.0% |
| 40 to 44 Minutes | 16 | 2.0% |
| 45 to 59 Minutes | 32 | 3.9% |
| 60 to 89 Minutes | 22 | 2.7% |
| 90 or more Minutes | 0 | 0.0% |
Commute Time by Sex in North Lakeport
The most common commute times in North Lakeport are 10 to 14 minutes (114 commuters, 27.2%) for males and 10 to 14 minutes (213 commuters, 53.8%) for females.
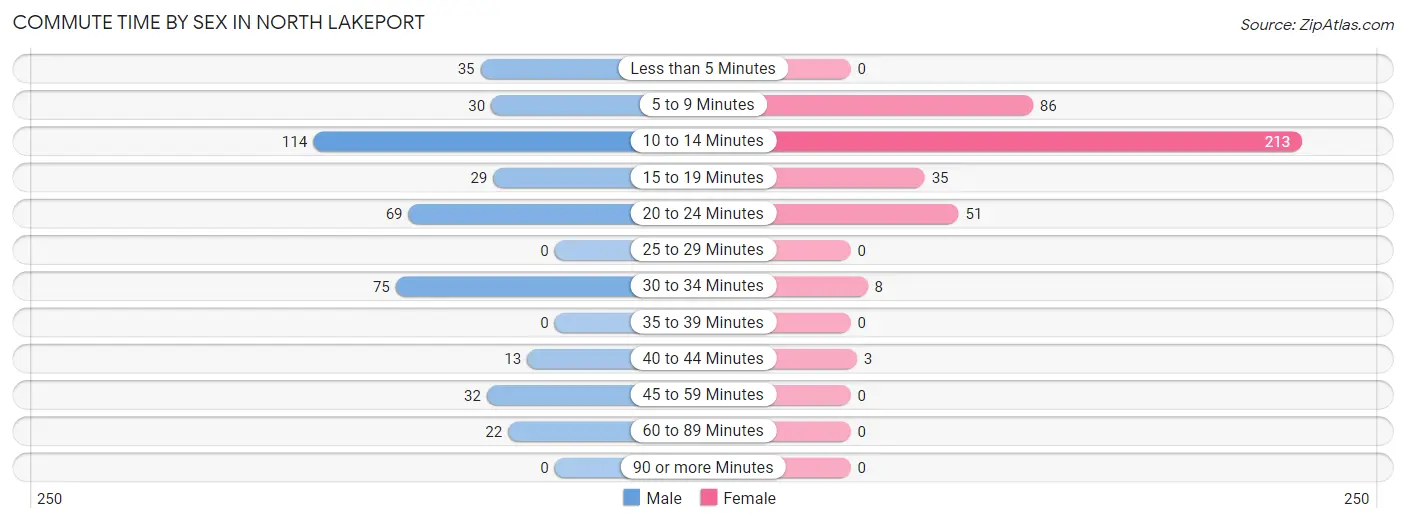
| Commute Time | Male | Female |
| Less than 5 Minutes | 35 (8.4%) | 0 (0.0%) |
| 5 to 9 Minutes | 30 (7.2%) | 86 (21.7%) |
| 10 to 14 Minutes | 114 (27.2%) | 213 (53.8%) |
| 15 to 19 Minutes | 29 (6.9%) | 35 (8.8%) |
| 20 to 24 Minutes | 69 (16.5%) | 51 (12.9%) |
| 25 to 29 Minutes | 0 (0.0%) | 0 (0.0%) |
| 30 to 34 Minutes | 75 (17.9%) | 8 (2.0%) |
| 35 to 39 Minutes | 0 (0.0%) | 0 (0.0%) |
| 40 to 44 Minutes | 13 (3.1%) | 3 (0.8%) |
| 45 to 59 Minutes | 32 (7.6%) | 0 (0.0%) |
| 60 to 89 Minutes | 22 (5.2%) | 0 (0.0%) |
| 90 or more Minutes | 0 (0.0%) | 0 (0.0%) |
Time of Departure to Work by Sex in North Lakeport
The most frequent times of departure to work in North Lakeport are 6:30 AM to 6:59 AM (75, 17.9%) for males and 10:00 AM to 10:59 AM (102, 25.8%) for females.
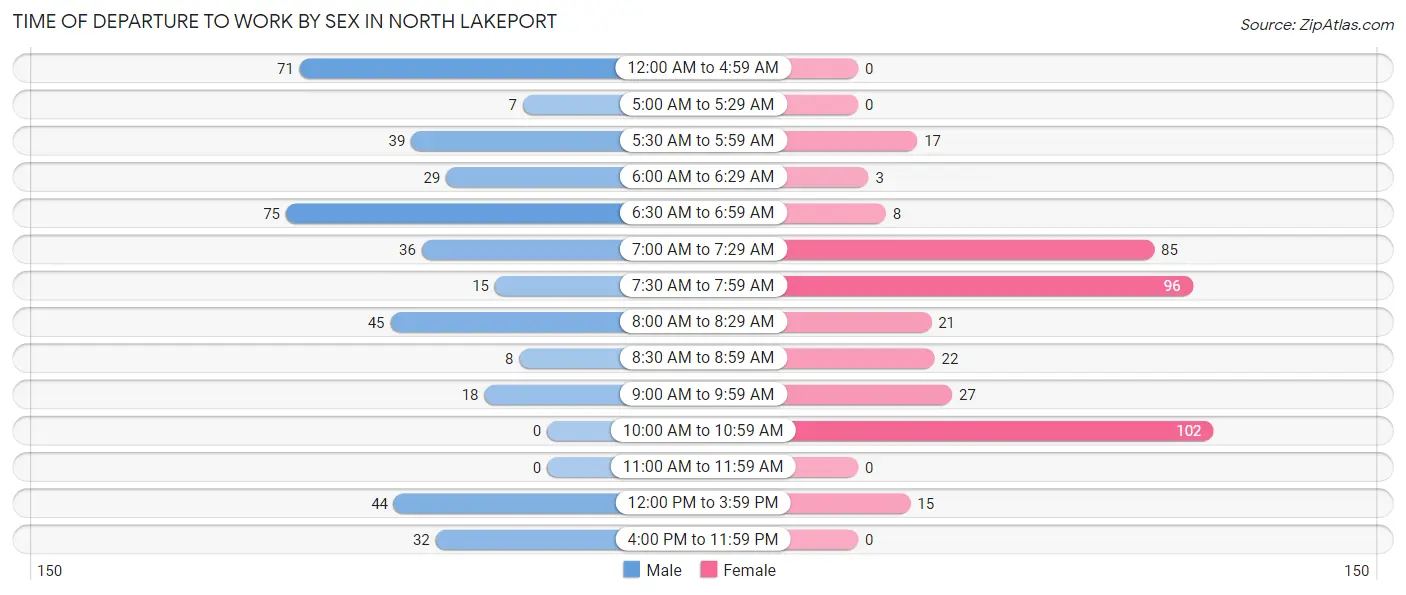
| Time of Departure | Male | Female |
| 12:00 AM to 4:59 AM | 71 (17.0%) | 0 (0.0%) |
| 5:00 AM to 5:29 AM | 7 (1.7%) | 0 (0.0%) |
| 5:30 AM to 5:59 AM | 39 (9.3%) | 17 (4.3%) |
| 6:00 AM to 6:29 AM | 29 (6.9%) | 3 (0.8%) |
| 6:30 AM to 6:59 AM | 75 (17.9%) | 8 (2.0%) |
| 7:00 AM to 7:29 AM | 36 (8.6%) | 85 (21.5%) |
| 7:30 AM to 7:59 AM | 15 (3.6%) | 96 (24.2%) |
| 8:00 AM to 8:29 AM | 45 (10.7%) | 21 (5.3%) |
| 8:30 AM to 8:59 AM | 8 (1.9%) | 22 (5.6%) |
| 9:00 AM to 9:59 AM | 18 (4.3%) | 27 (6.8%) |
| 10:00 AM to 10:59 AM | 0 (0.0%) | 102 (25.8%) |
| 11:00 AM to 11:59 AM | 0 (0.0%) | 0 (0.0%) |
| 12:00 PM to 3:59 PM | 44 (10.5%) | 15 (3.8%) |
| 4:00 PM to 11:59 PM | 32 (7.6%) | 0 (0.0%) |
| Total | 419 (100.0%) | 396 (100.0%) |
Housing Occupancy in North Lakeport
Occupancy by Ownership in North Lakeport
Of the total 1,064 dwellings in North Lakeport, owner-occupied units account for 763 (71.7%), while renter-occupied units make up 301 (28.3%).
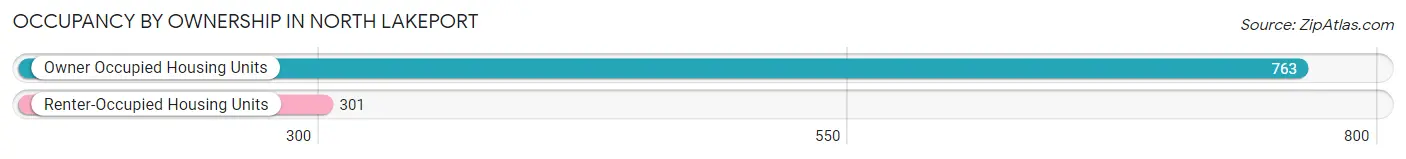
| Occupancy | # Housing Units | % Housing Units |
| Owner Occupied Housing Units | 763 | 71.7% |
| Renter-Occupied Housing Units | 301 | 28.3% |
| Total Occupied Housing Units | 1,064 | 100.0% |
Occupancy by Household Size in North Lakeport
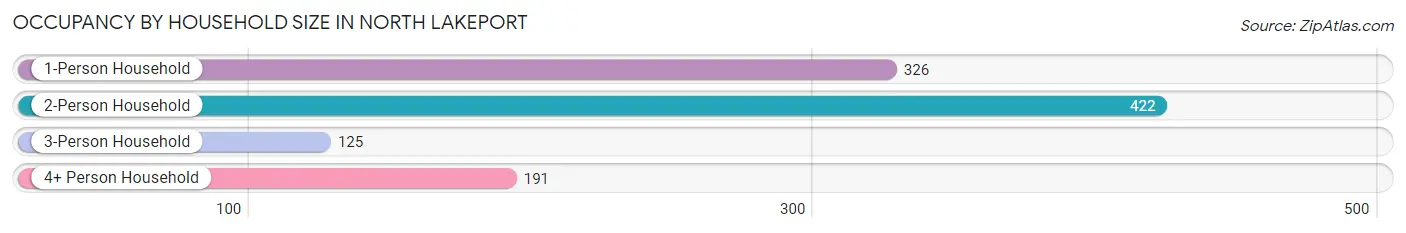
| Household Size | # Housing Units | % Housing Units |
| 1-Person Household | 326 | 30.6% |
| 2-Person Household | 422 | 39.7% |
| 3-Person Household | 125 | 11.7% |
| 4+ Person Household | 191 | 17.9% |
| Total Housing Units | 1,064 | 100.0% |
Occupancy by Ownership by Household Size in North Lakeport
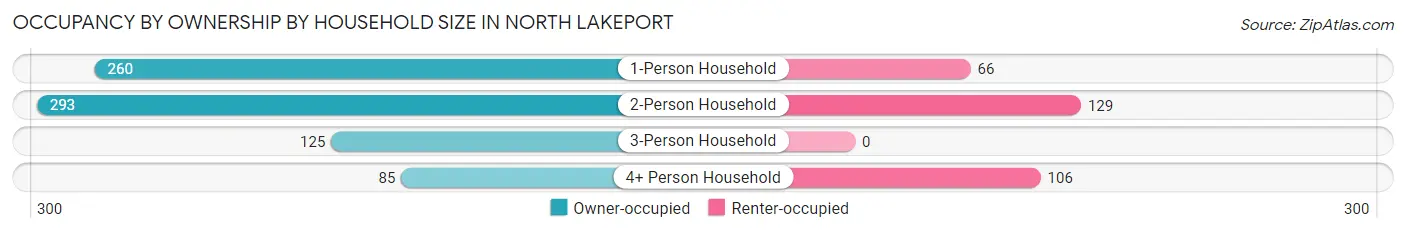
| Household Size | Owner-occupied | Renter-occupied |
| 1-Person Household | 260 (79.7%) | 66 (20.3%) |
| 2-Person Household | 293 (69.4%) | 129 (30.6%) |
| 3-Person Household | 125 (100.0%) | 0 (0.0%) |
| 4+ Person Household | 85 (44.5%) | 106 (55.5%) |
| Total Housing Units | 763 (71.7%) | 301 (28.3%) |
Occupancy by Educational Attainment in North Lakeport
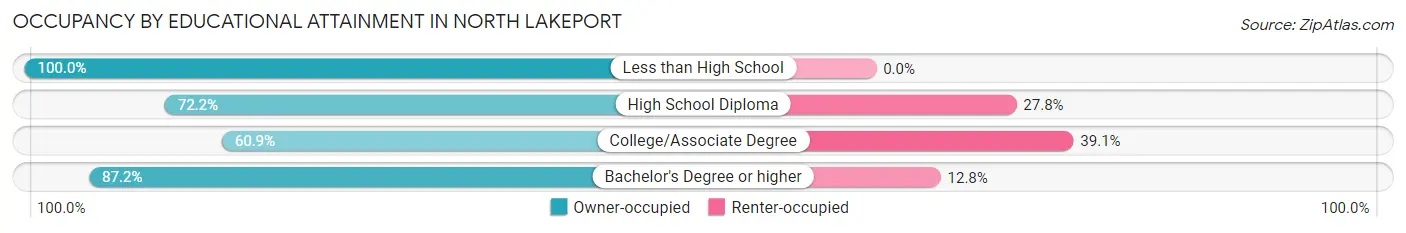
| Household Size | Owner-occupied | Renter-occupied |
| Less than High School | 30 (100.0%) | 0 (0.0%) |
| High School Diploma | 213 (72.2%) | 82 (27.8%) |
| College/Associate Degree | 288 (60.9%) | 185 (39.1%) |
| Bachelor's Degree or higher | 232 (87.2%) | 34 (12.8%) |
Occupancy by Age of Householder in North Lakeport
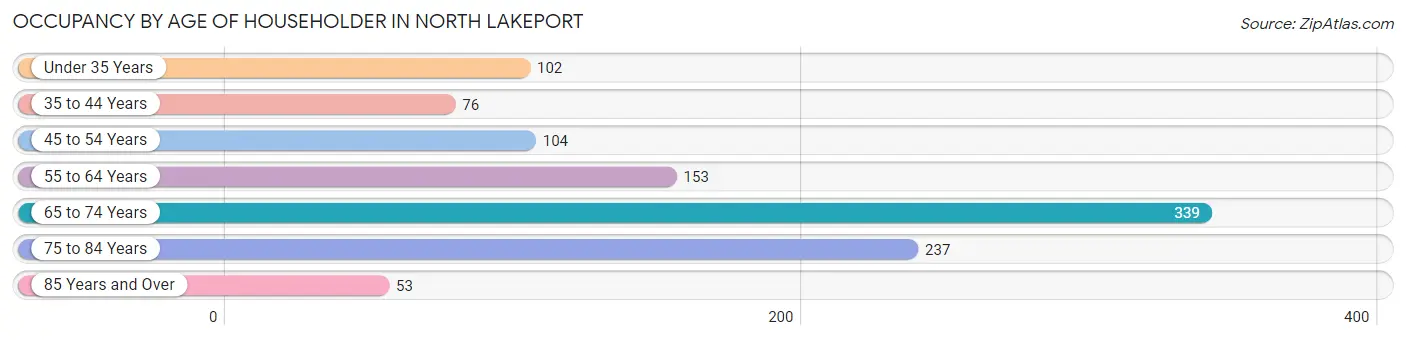
| Age Bracket | # Households | % Households |
| Under 35 Years | 102 | 9.6% |
| 35 to 44 Years | 76 | 7.1% |
| 45 to 54 Years | 104 | 9.8% |
| 55 to 64 Years | 153 | 14.4% |
| 65 to 74 Years | 339 | 31.9% |
| 75 to 84 Years | 237 | 22.3% |
| 85 Years and Over | 53 | 5.0% |
| Total | 1,064 | 100.0% |
Housing Finances in North Lakeport
Median Income by Occupancy in North Lakeport
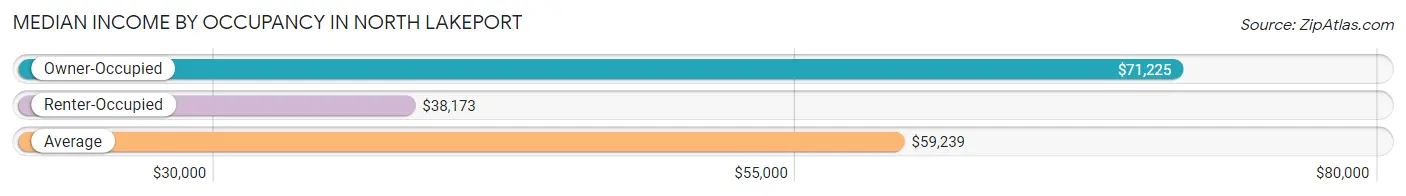
| Occupancy Type | # Households | Median Income |
| Owner-Occupied | 763 (71.7%) | $71,225 |
| Renter-Occupied | 301 (28.3%) | $38,173 |
| Average | 1,064 (100.0%) | $59,239 |
Occupancy by Householder Income Bracket in North Lakeport
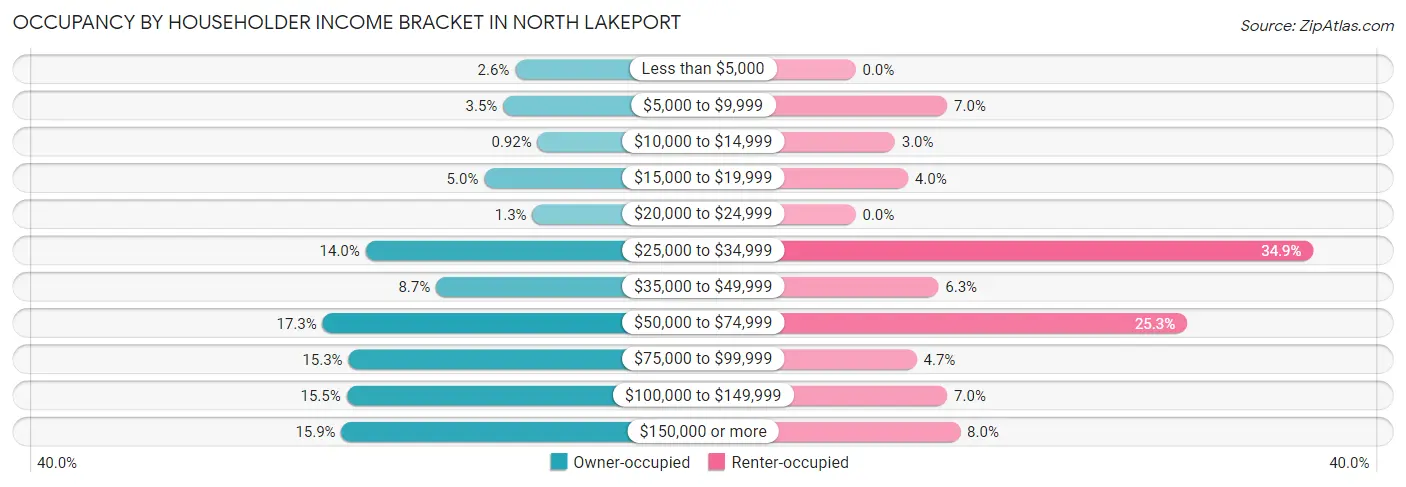
| Income Bracket | Owner-occupied | Renter-occupied |
| Less than $5,000 | 20 (2.6%) | 0 (0.0%) |
| $5,000 to $9,999 | 27 (3.5%) | 21 (7.0%) |
| $10,000 to $14,999 | 7 (0.9%) | 9 (3.0%) |
| $15,000 to $19,999 | 38 (5.0%) | 12 (4.0%) |
| $20,000 to $24,999 | 10 (1.3%) | 0 (0.0%) |
| $25,000 to $34,999 | 107 (14.0%) | 105 (34.9%) |
| $35,000 to $49,999 | 66 (8.6%) | 19 (6.3%) |
| $50,000 to $74,999 | 132 (17.3%) | 76 (25.3%) |
| $75,000 to $99,999 | 117 (15.3%) | 14 (4.6%) |
| $100,000 to $149,999 | 118 (15.5%) | 21 (7.0%) |
| $150,000 or more | 121 (15.9%) | 24 (8.0%) |
| Total | 763 (100.0%) | 301 (100.0%) |
Monthly Housing Cost Tiers in North Lakeport
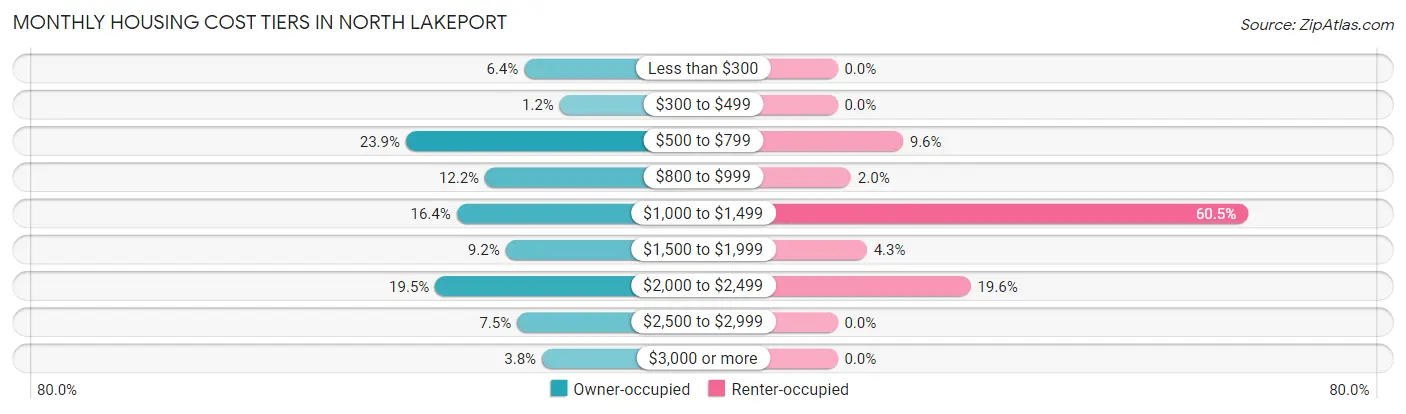
| Monthly Cost | Owner-occupied | Renter-occupied |
| Less than $300 | 49 (6.4%) | 0 (0.0%) |
| $300 to $499 | 9 (1.2%) | 0 (0.0%) |
| $500 to $799 | 182 (23.8%) | 29 (9.6%) |
| $800 to $999 | 93 (12.2%) | 6 (2.0%) |
| $1,000 to $1,499 | 125 (16.4%) | 182 (60.5%) |
| $1,500 to $1,999 | 70 (9.2%) | 13 (4.3%) |
| $2,000 to $2,499 | 149 (19.5%) | 59 (19.6%) |
| $2,500 to $2,999 | 57 (7.5%) | 0 (0.0%) |
| $3,000 or more | 29 (3.8%) | 0 (0.0%) |
| Total | 763 (100.0%) | 301 (100.0%) |
Physical Housing Characteristics in North Lakeport
Housing Structures in North Lakeport
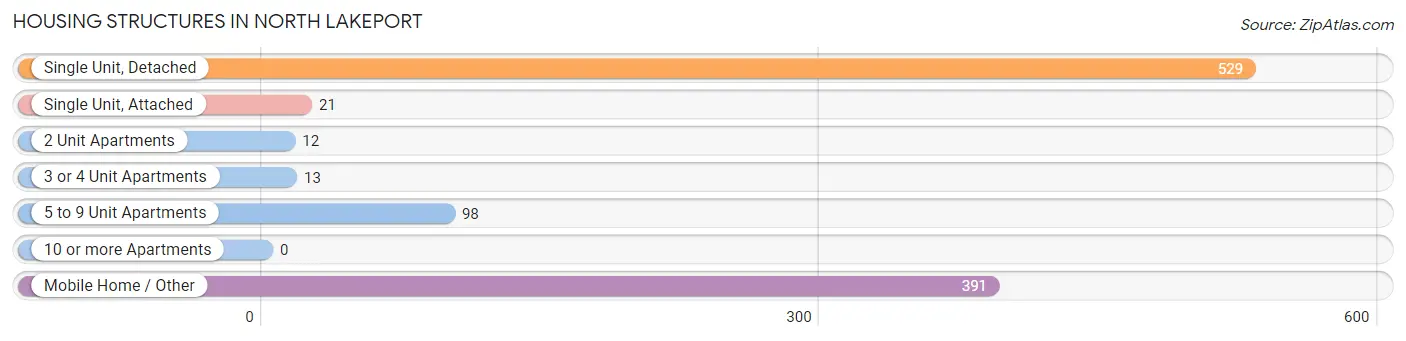
| Structure Type | # Housing Units | % Housing Units |
| Single Unit, Detached | 529 | 49.7% |
| Single Unit, Attached | 21 | 2.0% |
| 2 Unit Apartments | 12 | 1.1% |
| 3 or 4 Unit Apartments | 13 | 1.2% |
| 5 to 9 Unit Apartments | 98 | 9.2% |
| 10 or more Apartments | 0 | 0.0% |
| Mobile Home / Other | 391 | 36.7% |
| Total | 1,064 | 100.0% |
Housing Structures by Occupancy in North Lakeport
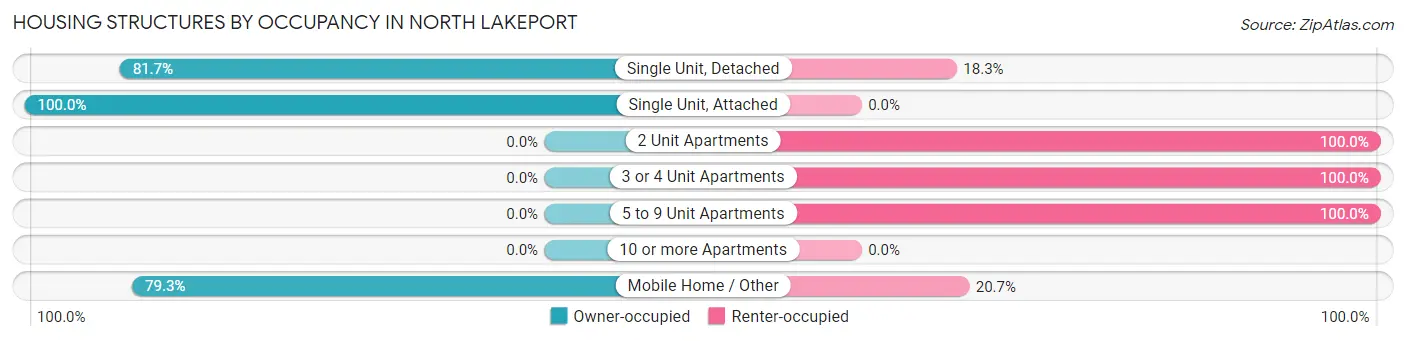
| Structure Type | Owner-occupied | Renter-occupied |
| Single Unit, Detached | 432 (81.7%) | 97 (18.3%) |
| Single Unit, Attached | 21 (100.0%) | 0 (0.0%) |
| 2 Unit Apartments | 0 (0.0%) | 12 (100.0%) |
| 3 or 4 Unit Apartments | 0 (0.0%) | 13 (100.0%) |
| 5 to 9 Unit Apartments | 0 (0.0%) | 98 (100.0%) |
| 10 or more Apartments | 0 (0.0%) | 0 (0.0%) |
| Mobile Home / Other | 310 (79.3%) | 81 (20.7%) |
| Total | 763 (71.7%) | 301 (28.3%) |
Housing Structures by Number of Rooms in North Lakeport
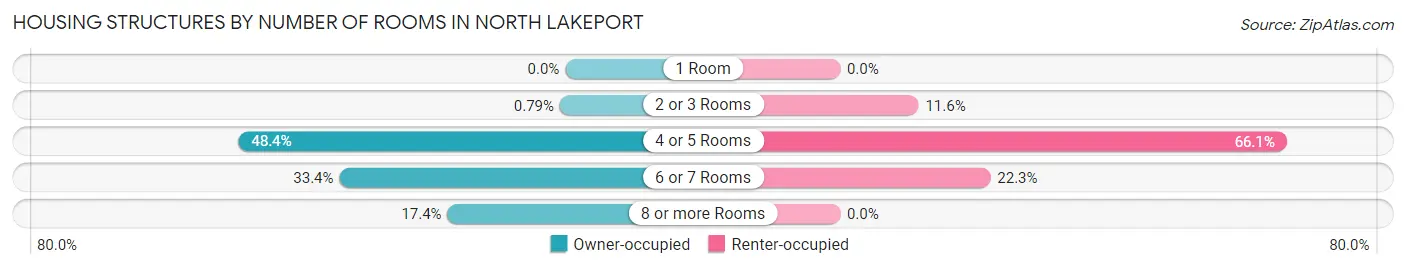
| Number of Rooms | Owner-occupied | Renter-occupied |
| 1 Room | 0 (0.0%) | 0 (0.0%) |
| 2 or 3 Rooms | 6 (0.8%) | 35 (11.6%) |
| 4 or 5 Rooms | 369 (48.4%) | 199 (66.1%) |
| 6 or 7 Rooms | 255 (33.4%) | 67 (22.3%) |
| 8 or more Rooms | 133 (17.4%) | 0 (0.0%) |
| Total | 763 (100.0%) | 301 (100.0%) |
Housing Structure by Heating Type in North Lakeport
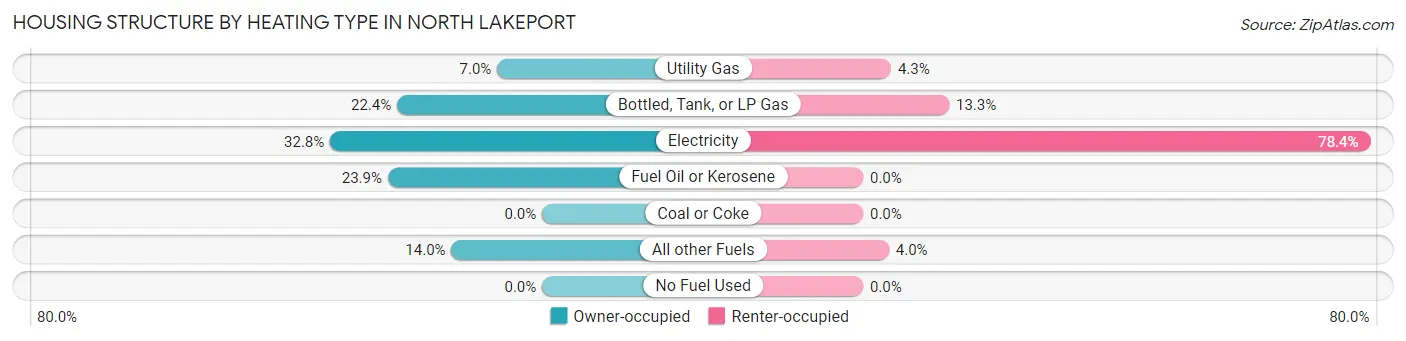
| Heating Type | Owner-occupied | Renter-occupied |
| Utility Gas | 53 (7.0%) | 13 (4.3%) |
| Bottled, Tank, or LP Gas | 171 (22.4%) | 40 (13.3%) |
| Electricity | 250 (32.8%) | 236 (78.4%) |
| Fuel Oil or Kerosene | 182 (23.8%) | 0 (0.0%) |
| Coal or Coke | 0 (0.0%) | 0 (0.0%) |
| All other Fuels | 107 (14.0%) | 12 (4.0%) |
| No Fuel Used | 0 (0.0%) | 0 (0.0%) |
| Total | 763 (100.0%) | 301 (100.0%) |
Household Vehicle Usage in North Lakeport
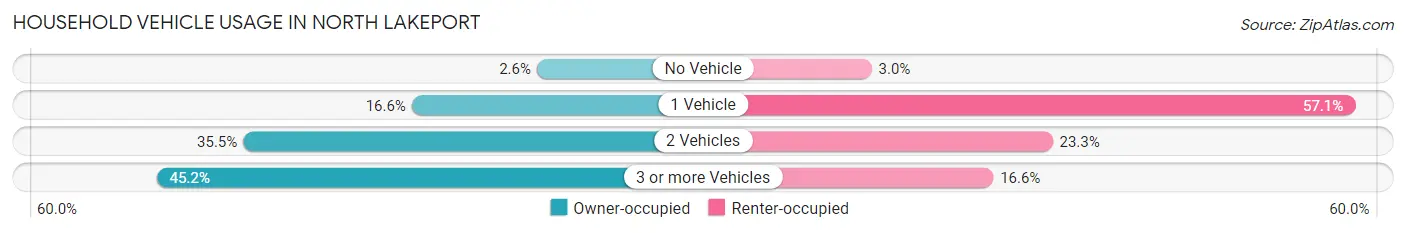
| Vehicles per Household | Owner-occupied | Renter-occupied |
| No Vehicle | 20 (2.6%) | 9 (3.0%) |
| 1 Vehicle | 127 (16.6%) | 172 (57.1%) |
| 2 Vehicles | 271 (35.5%) | 70 (23.3%) |
| 3 or more Vehicles | 345 (45.2%) | 50 (16.6%) |
| Total | 763 (100.0%) | 301 (100.0%) |
Real Estate & Mortgages in North Lakeport
Real Estate and Mortgage Overview in North Lakeport
| Characteristic | Without Mortgage | With Mortgage |
| Housing Units | 391 | 372 |
| Median Property Value | - | - |
| Median Household Income | $57,083 | $65 |
| Monthly Housing Costs | $690 | $29 |
| Real Estate Taxes | $930 | $25 |
Property Value by Mortgage Status in North Lakeport
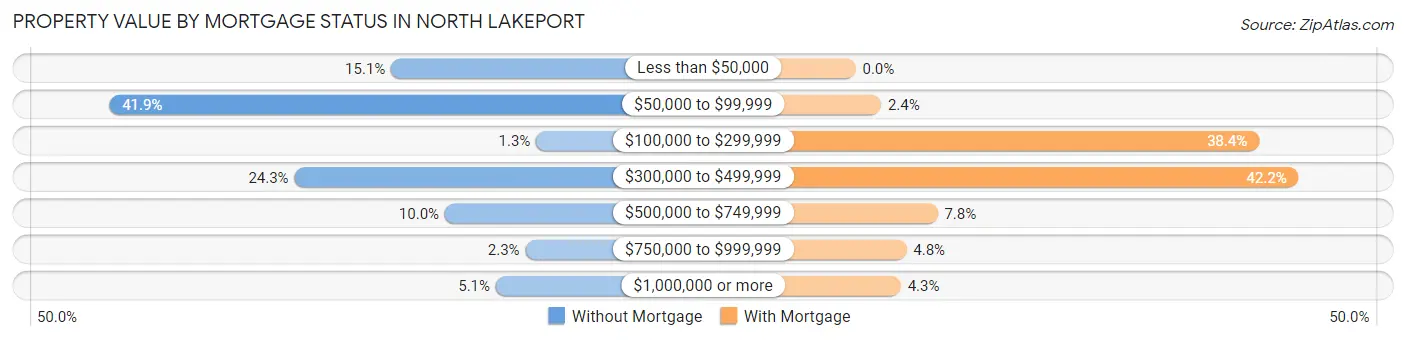
| Property Value | Without Mortgage | With Mortgage |
| Less than $50,000 | 59 (15.1%) | 0 (0.0%) |
| $50,000 to $99,999 | 164 (41.9%) | 9 (2.4%) |
| $100,000 to $299,999 | 5 (1.3%) | 143 (38.4%) |
| $300,000 to $499,999 | 95 (24.3%) | 157 (42.2%) |
| $500,000 to $749,999 | 39 (10.0%) | 29 (7.8%) |
| $750,000 to $999,999 | 9 (2.3%) | 18 (4.8%) |
| $1,000,000 or more | 20 (5.1%) | 16 (4.3%) |
| Total | 391 (100.0%) | 372 (100.0%) |
Household Income by Mortgage Status in North Lakeport
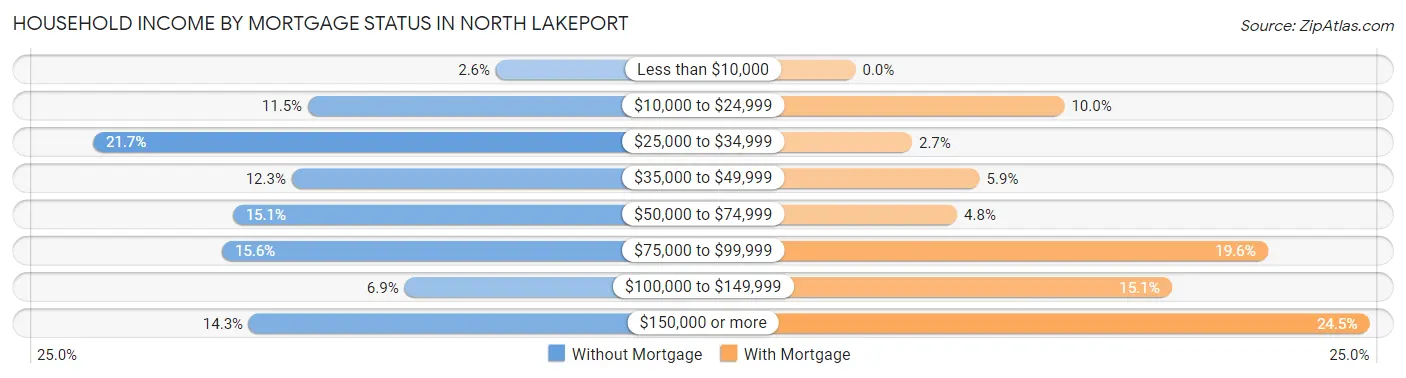
| Household Income | Without Mortgage | With Mortgage |
| Less than $10,000 | 10 (2.6%) | 0 (0.0%) |
| $10,000 to $24,999 | 45 (11.5%) | 37 (10.0%) |
| $25,000 to $34,999 | 85 (21.7%) | 10 (2.7%) |
| $35,000 to $49,999 | 48 (12.3%) | 22 (5.9%) |
| $50,000 to $74,999 | 59 (15.1%) | 18 (4.8%) |
| $75,000 to $99,999 | 61 (15.6%) | 73 (19.6%) |
| $100,000 to $149,999 | 27 (6.9%) | 56 (15.0%) |
| $150,000 or more | 56 (14.3%) | 91 (24.5%) |
| Total | 391 (100.0%) | 372 (100.0%) |
Property Value to Household Income Ratio in North Lakeport
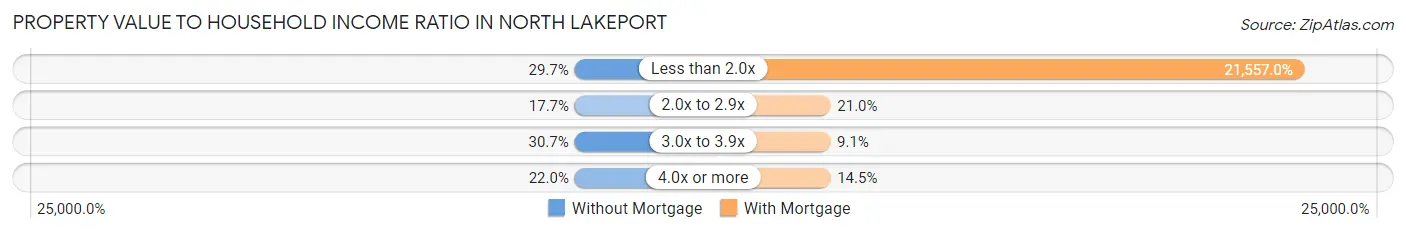
| Value-to-Income Ratio | Without Mortgage | With Mortgage |
| Less than 2.0x | 116 (29.7%) | 80,192 (21,557.0%) |
| 2.0x to 2.9x | 69 (17.6%) | 78 (21.0%) |
| 3.0x to 3.9x | 120 (30.7%) | 34 (9.1%) |
| 4.0x or more | 86 (22.0%) | 54 (14.5%) |
| Total | 391 (100.0%) | 372 (100.0%) |
Real Estate Taxes by Mortgage Status in North Lakeport
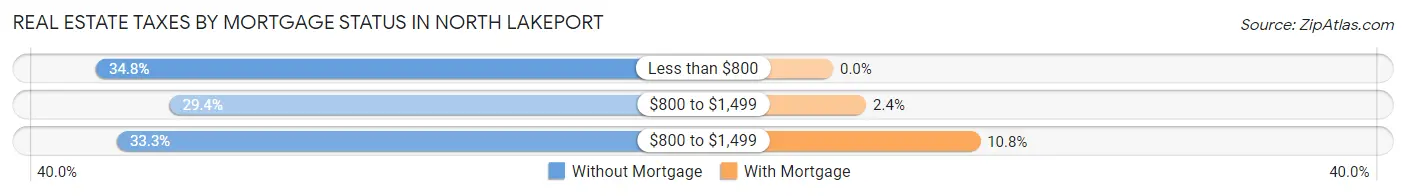
| Property Taxes | Without Mortgage | With Mortgage |
| Less than $800 | 136 (34.8%) | 0 (0.0%) |
| $800 to $1,499 | 115 (29.4%) | 9 (2.4%) |
| $800 to $1,499 | 130 (33.3%) | 40 (10.7%) |
| Total | 391 (100.0%) | 372 (100.0%) |
Health & Disability in North Lakeport
Health Insurance Coverage by Age in North Lakeport
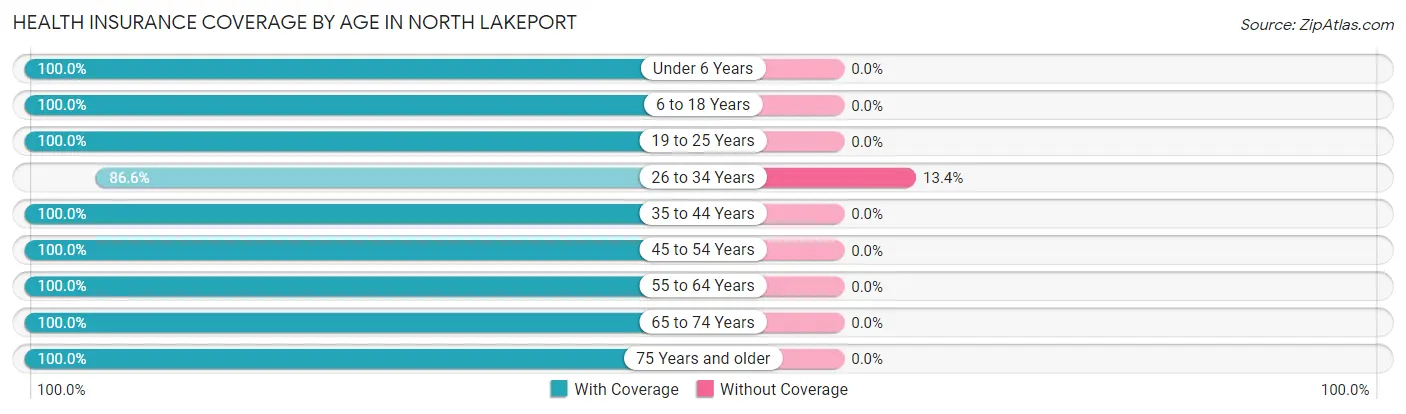
| Age Bracket | With Coverage | Without Coverage |
| Under 6 Years | 202 (100.0%) | 0 (0.0%) |
| 6 to 18 Years | 291 (100.0%) | 0 (0.0%) |
| 19 to 25 Years | 134 (100.0%) | 0 (0.0%) |
| 26 to 34 Years | 194 (86.6%) | 30 (13.4%) |
| 35 to 44 Years | 141 (100.0%) | 0 (0.0%) |
| 45 to 54 Years | 389 (100.0%) | 0 (0.0%) |
| 55 to 64 Years | 366 (100.0%) | 0 (0.0%) |
| 65 to 74 Years | 509 (100.0%) | 0 (0.0%) |
| 75 Years and older | 397 (100.0%) | 0 (0.0%) |
| Total | 2,623 (98.9%) | 30 (1.1%) |
Health Insurance Coverage by Citizenship Status in North Lakeport
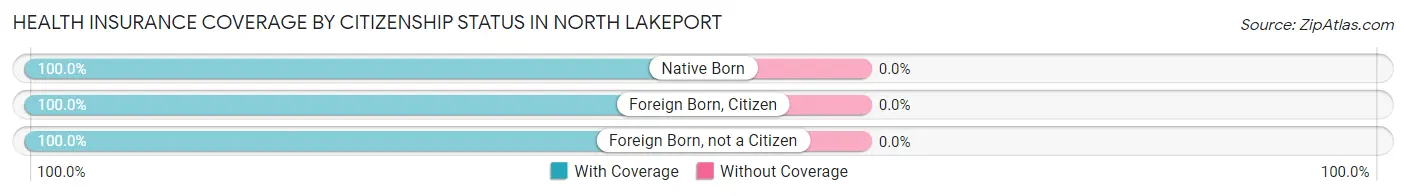
| Citizenship Status | With Coverage | Without Coverage |
| Native Born | 202 (100.0%) | 0 (0.0%) |
| Foreign Born, Citizen | 291 (100.0%) | 0 (0.0%) |
| Foreign Born, not a Citizen | 134 (100.0%) | 0 (0.0%) |
Health Insurance Coverage by Household Income in North Lakeport
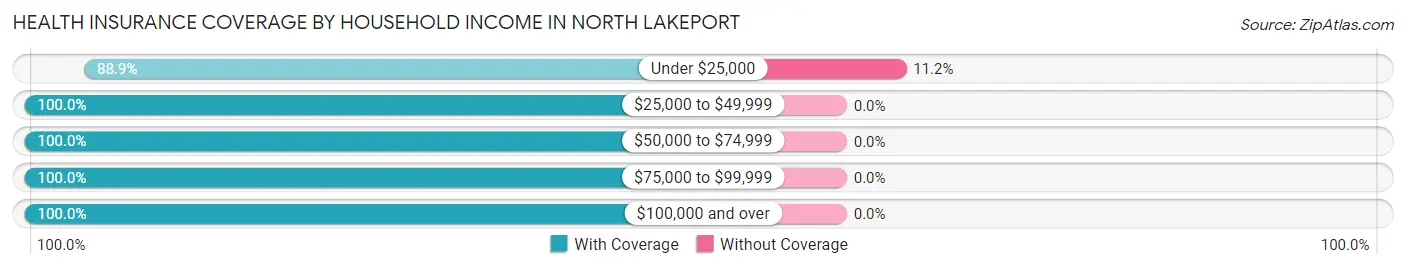
| Household Income | With Coverage | Without Coverage |
| Under $25,000 | 239 (88.8%) | 30 (11.2%) |
| $25,000 to $49,999 | 627 (100.0%) | 0 (0.0%) |
| $50,000 to $74,999 | 406 (100.0%) | 0 (0.0%) |
| $75,000 to $99,999 | 436 (100.0%) | 0 (0.0%) |
| $100,000 and over | 912 (100.0%) | 0 (0.0%) |
Public vs Private Health Insurance Coverage by Age in North Lakeport
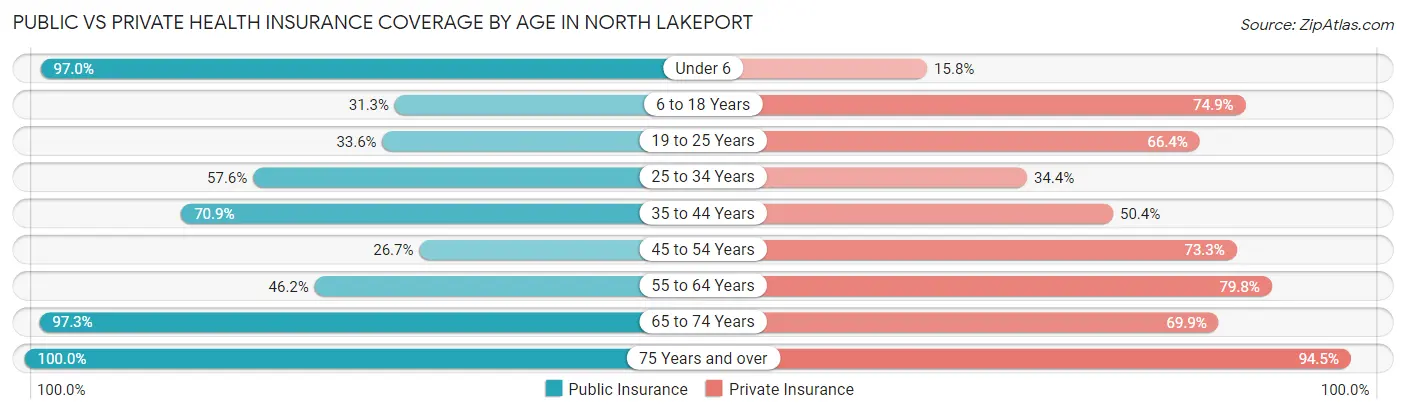
| Age Bracket | Public Insurance | Private Insurance |
| Under 6 | 196 (97.0%) | 32 (15.8%) |
| 6 to 18 Years | 91 (31.3%) | 218 (74.9%) |
| 19 to 25 Years | 45 (33.6%) | 89 (66.4%) |
| 25 to 34 Years | 129 (57.6%) | 77 (34.4%) |
| 35 to 44 Years | 100 (70.9%) | 71 (50.3%) |
| 45 to 54 Years | 104 (26.7%) | 285 (73.3%) |
| 55 to 64 Years | 169 (46.2%) | 292 (79.8%) |
| 65 to 74 Years | 495 (97.3%) | 356 (69.9%) |
| 75 Years and over | 397 (100.0%) | 375 (94.5%) |
| Total | 1,726 (65.1%) | 1,795 (67.7%) |
Disability Status by Sex by Age in North Lakeport
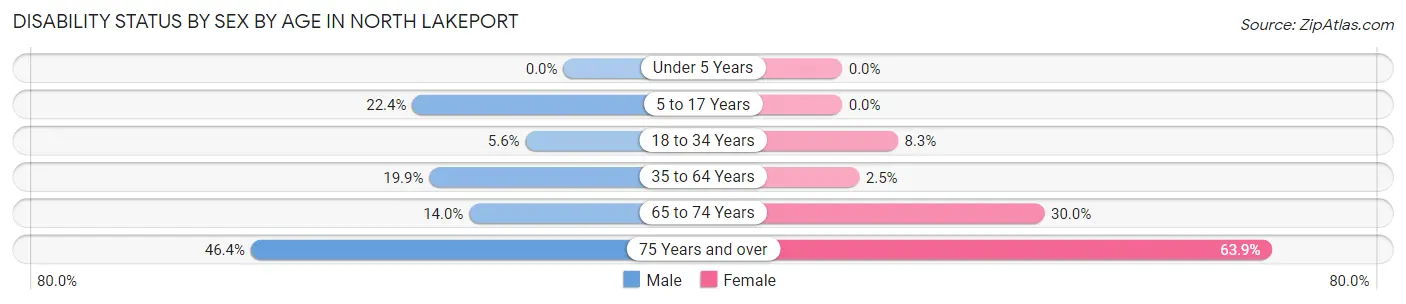
| Age Bracket | Male | Female |
| Under 5 Years | 0 (0.0%) | 0 (0.0%) |
| 5 to 17 Years | 48 (22.4%) | 0 (0.0%) |
| 18 to 34 Years | 12 (5.6%) | 12 (8.3%) |
| 35 to 64 Years | 92 (19.9%) | 11 (2.5%) |
| 65 to 74 Years | 26 (14.0%) | 97 (30.0%) |
| 75 Years and over | 71 (46.4%) | 156 (63.9%) |
Disability Class by Sex by Age in North Lakeport
Disability Class: Hearing Difficulty
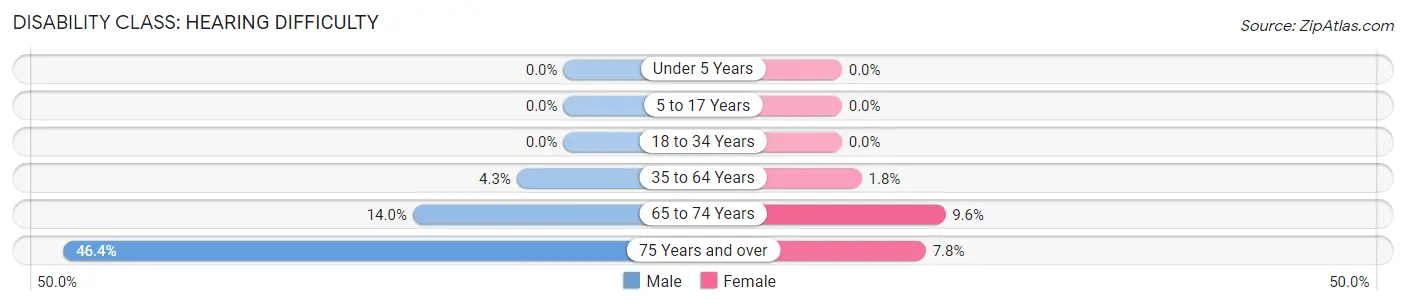
| Age Bracket | Male | Female |
| Under 5 Years | 0 (0.0%) | 0 (0.0%) |
| 5 to 17 Years | 0 (0.0%) | 0 (0.0%) |
| 18 to 34 Years | 0 (0.0%) | 0 (0.0%) |
| 35 to 64 Years | 20 (4.3%) | 8 (1.8%) |
| 65 to 74 Years | 26 (14.0%) | 31 (9.6%) |
| 75 Years and over | 71 (46.4%) | 19 (7.8%) |
Disability Class: Vision Difficulty
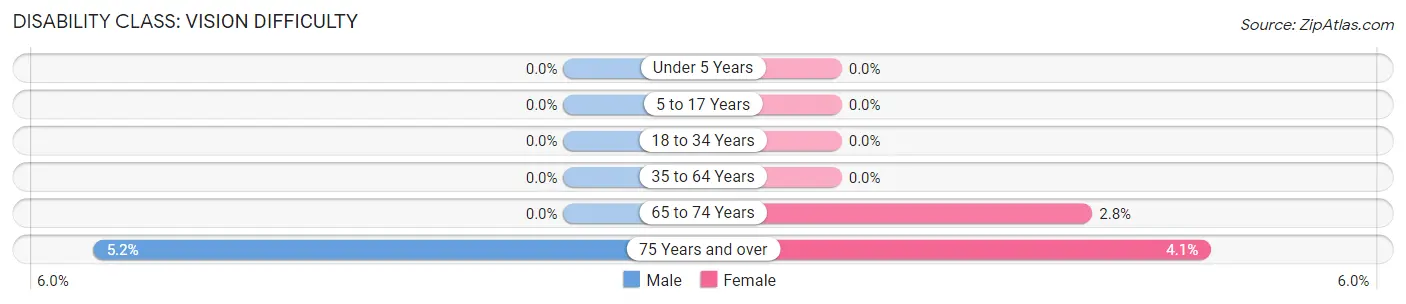
| Age Bracket | Male | Female |
| Under 5 Years | 0 (0.0%) | 0 (0.0%) |
| 5 to 17 Years | 0 (0.0%) | 0 (0.0%) |
| 18 to 34 Years | 0 (0.0%) | 0 (0.0%) |
| 35 to 64 Years | 0 (0.0%) | 0 (0.0%) |
| 65 to 74 Years | 0 (0.0%) | 9 (2.8%) |
| 75 Years and over | 8 (5.2%) | 10 (4.1%) |
Disability Class: Cognitive Difficulty
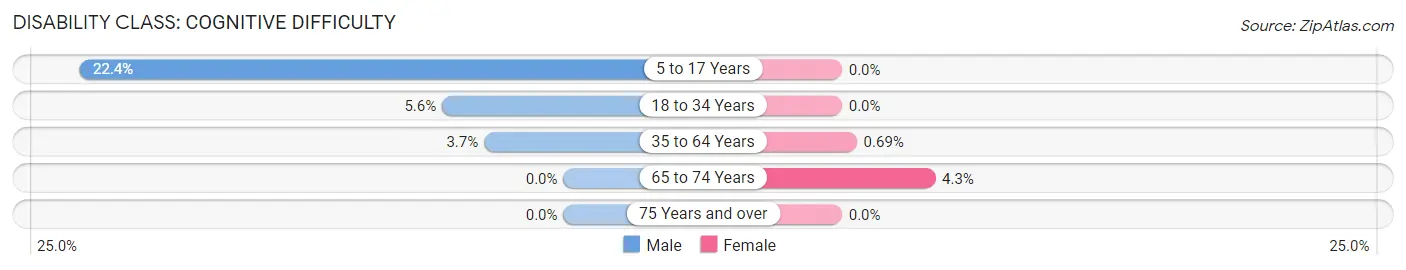
| Age Bracket | Male | Female |
| 5 to 17 Years | 48 (22.4%) | 0 (0.0%) |
| 18 to 34 Years | 12 (5.6%) | 0 (0.0%) |
| 35 to 64 Years | 17 (3.7%) | 3 (0.7%) |
| 65 to 74 Years | 0 (0.0%) | 14 (4.3%) |
| 75 Years and over | 0 (0.0%) | 0 (0.0%) |
Disability Class: Ambulatory Difficulty
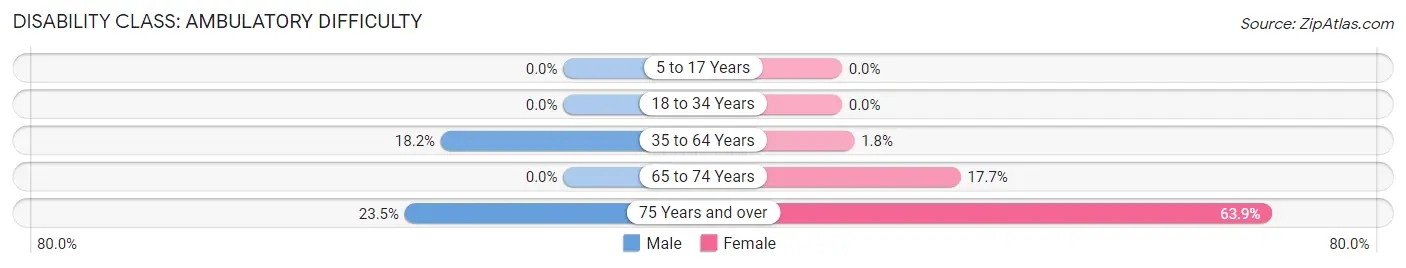
| Age Bracket | Male | Female |
| 5 to 17 Years | 0 (0.0%) | 0 (0.0%) |
| 18 to 34 Years | 0 (0.0%) | 0 (0.0%) |
| 35 to 64 Years | 84 (18.2%) | 8 (1.8%) |
| 65 to 74 Years | 0 (0.0%) | 57 (17.6%) |
| 75 Years and over | 36 (23.5%) | 156 (63.9%) |
Disability Class: Self-Care Difficulty
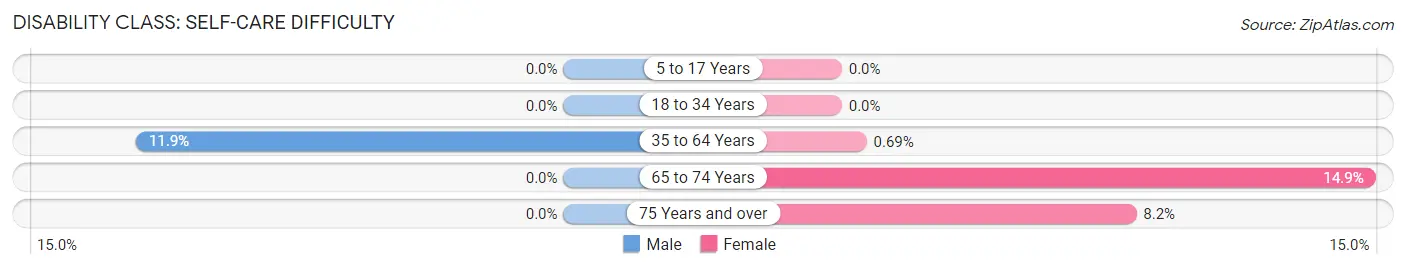
| Age Bracket | Male | Female |
| 5 to 17 Years | 0 (0.0%) | 0 (0.0%) |
| 18 to 34 Years | 0 (0.0%) | 0 (0.0%) |
| 35 to 64 Years | 55 (11.9%) | 3 (0.7%) |
| 65 to 74 Years | 0 (0.0%) | 48 (14.9%) |
| 75 Years and over | 0 (0.0%) | 20 (8.2%) |
Technology Access in North Lakeport
Computing Device Access in North Lakeport
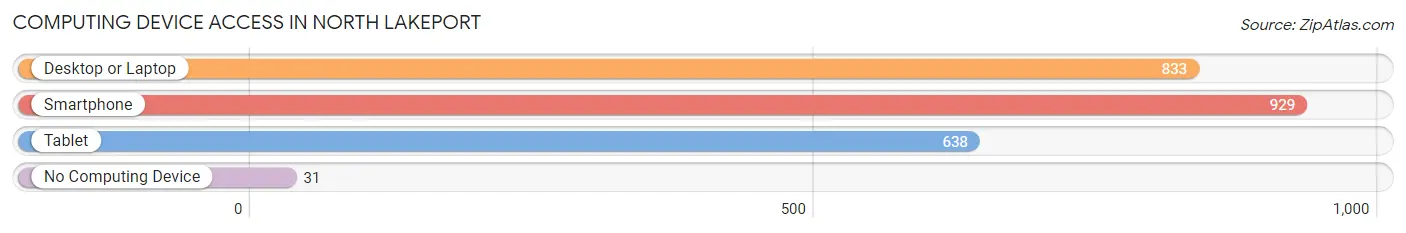
| Device Type | # Households | % Households |
| Desktop or Laptop | 833 | 78.3% |
| Smartphone | 929 | 87.3% |
| Tablet | 638 | 60.0% |
| No Computing Device | 31 | 2.9% |
| Total | 1,064 | 100.0% |
Internet Access in North Lakeport
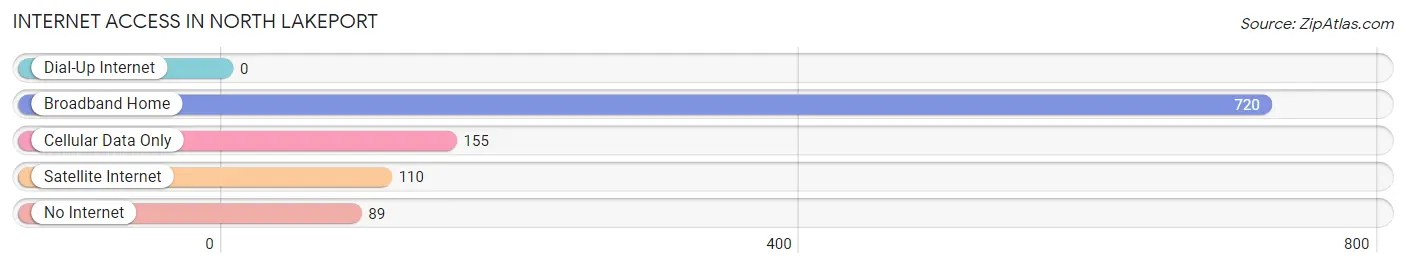
| Internet Type | # Households | % Households |
| Dial-Up Internet | 0 | 0.0% |
| Broadband Home | 720 | 67.7% |
| Cellular Data Only | 155 | 14.6% |
| Satellite Internet | 110 | 10.3% |
| No Internet | 89 | 8.4% |
| Total | 1,064 | 100.0% |
North Lakeport Summary
Lakeport is a city located in Lake County, California, United States. It is situated on the shores of Clear Lake, the largest natural lake wholly within California. The population was 4,753 at the 2010 census, up from 4,536 at the 2000 census.
History
The area around Lakeport was first settled by Native Americans several thousand years ago. At the coming of the settlers, the Kabe-napos, a branch of the Pomo people, lived here. The first white settlers arrived in the early 1850s, and by 1855, the first post office was established. The name "Lakeport" was chosen by an early settler, William Forbes, who named the town after the lake.
In 1858, the first steamboat, the "General McDowell", arrived on Clear Lake, and the town began to grow. By the late 1800s, Lakeport had become a popular resort destination, and the town was incorporated in 1888.
Geography
Lakeport is located at 39°N 122°W, at an elevation of 1355 feet (413 m). It is situated on the shores of Clear Lake, the largest natural lake wholly within California. The city is surrounded by hills and mountains, including Mount Konocti, which is the highest peak in the area.
The climate in Lakeport is generally mild, with warm summers and cool winters. The average annual temperature is around 60°F (15°C).
Economy
The economy of Lakeport is largely based on tourism and recreation. The city is a popular destination for fishing, boating, and other outdoor activities. The city is also home to several wineries, and the Clear Lake State Park.
The city is also home to several businesses, including a lumber mill, a boat manufacturing plant, and a number of retail stores.
Demographics
As of the 2010 census, the population of Lakeport was 4,753. The racial makeup of the city was 79.2% White, 0.7% African American, 2.2% Native American, 0.7% Asian, 0.1% Pacific Islander, 11.7% from other races, and 5.4% from two or more races. Hispanic or Latino of any race were 24.2% of the population.
The median income for a household in the city was $35,938, and the median income for a family was $41,938. The per capita income for the city was $17,938. About 16.2% of families and 19.2% of the population were below the poverty line, including 28.2% of those under age 18 and 8.2% of those age 65 or over.
Conclusion
Lakeport is a city located in Lake County, California, United States. It is situated on the shores of Clear Lake, the largest natural lake wholly within California. The population was 4,753 at the 2010 census, up from 4,536 at the 2000 census. The economy of Lakeport is largely based on tourism and recreation, and the city is a popular destination for fishing, boating, and other outdoor activities. The racial makeup of the city was 79.2% White, 0.7% African American, 2.2% Native American, 0.7% Asian, 0.1% Pacific Islander, 11.7% from other races, and 5.4% from two or more races. The median income for a household in the city was $35,938, and the median income for a family was $41,938.
Common Questions
What is Per Capita Income in North Lakeport?
Per Capita income in North Lakeport is $36,209.
What is the Median Family Income in North Lakeport?
Median Family Income in North Lakeport is $87,825.
What is the Median Household income in North Lakeport?
Median Household Income in North Lakeport is $59,239.
What is Income or Wage Gap in North Lakeport?
Income or Wage Gap in North Lakeport is 35.0%.
Women in North Lakeport earn 65.0 cents for every dollar earned by a man.
What is Inequality or Gini Index in North Lakeport?
Inequality or Gini Index in North Lakeport is 0.47.
What is the Total Population of North Lakeport?
Total Population of North Lakeport is 2,666.
What is the Total Male Population of North Lakeport?
Total Male Population of North Lakeport is 1,297.
What is the Total Female Population of North Lakeport?
Total Female Population of North Lakeport is 1,369.
What is the Ratio of Males per 100 Females in North Lakeport?
There are 94.74 Males per 100 Females in North Lakeport.
What is the Ratio of Females per 100 Males in North Lakeport?
There are 105.55 Females per 100 Males in North Lakeport.
What is the Median Population Age in North Lakeport?
Median Population Age in North Lakeport is 53.5 Years.
What is the Average Family Size in North Lakeport
Average Family Size in North Lakeport is 3.1 People.
What is the Average Household Size in North Lakeport
Average Household Size in North Lakeport is 2.5 People.
How Large is the Labor Force in North Lakeport?
There are 1,071 People in the Labor Forcein in North Lakeport.
What is the Percentage of People in the Labor Force in North Lakeport?
46.8% of People are in the Labor Force in North Lakeport.
What is the Unemployment Rate in North Lakeport?
Unemployment Rate in North Lakeport is 4.4%.