Nicasio, CA Map & Demographics
Nicasio Map
Nicasio Overview
$148,741
PER CAPITA INCOME
$250,001
AVG FAMILY INCOME
$210,833
AVG HOUSEHOLD INCOME
0.61
INEQUALITY / GINI INDEX
83
TOTAL POPULATION
49
MALE POPULATION
34
FEMALE POPULATION
144.12
MALES / 100 FEMALES
69.39
FEMALES / 100 MALES
56.5
MEDIAN AGE
3.0
AVG FAMILY SIZE
2.6
AVG HOUSEHOLD SIZE
54
LABOR FORCE [ PEOPLE ]
73.0%
PERCENT IN LABOR FORCE
7.4%
UNEMPLOYMENT RATE
Nicasio Zip Codes
Nicasio Area Codes
Income in Nicasio
Income Overview in Nicasio
Per Capita Income in Nicasio is $148,741, while median incomes of families and households are $250,001 and $210,833 respectively.
| Characteristic | Number | Measure |
| Per Capita Income | 83 | $148,741 |
| Median Family Income | 23 | $250,001 |
| Mean Family Income | 23 | $501,296 |
| Median Household Income | 32 | $210,833 |
| Mean Household Income | 32 | $381,341 |
| Income Deficit | 23 | $0 |
| Wage / Income Gap (%) | 83 | 0.00% |
| Wage / Income Gap ($) | 83 | 100.00¢ per $1 |
| Gini / Inequality Index | 83 | 0.61 |
Earnings by Sex in Nicasio
| Sex | Number | Average Earnings |
| Male | 39 (72.2%) | $0 |
| Female | 15 (27.8%) | $0 |
| Total | 54 (100.0%) | $0 |
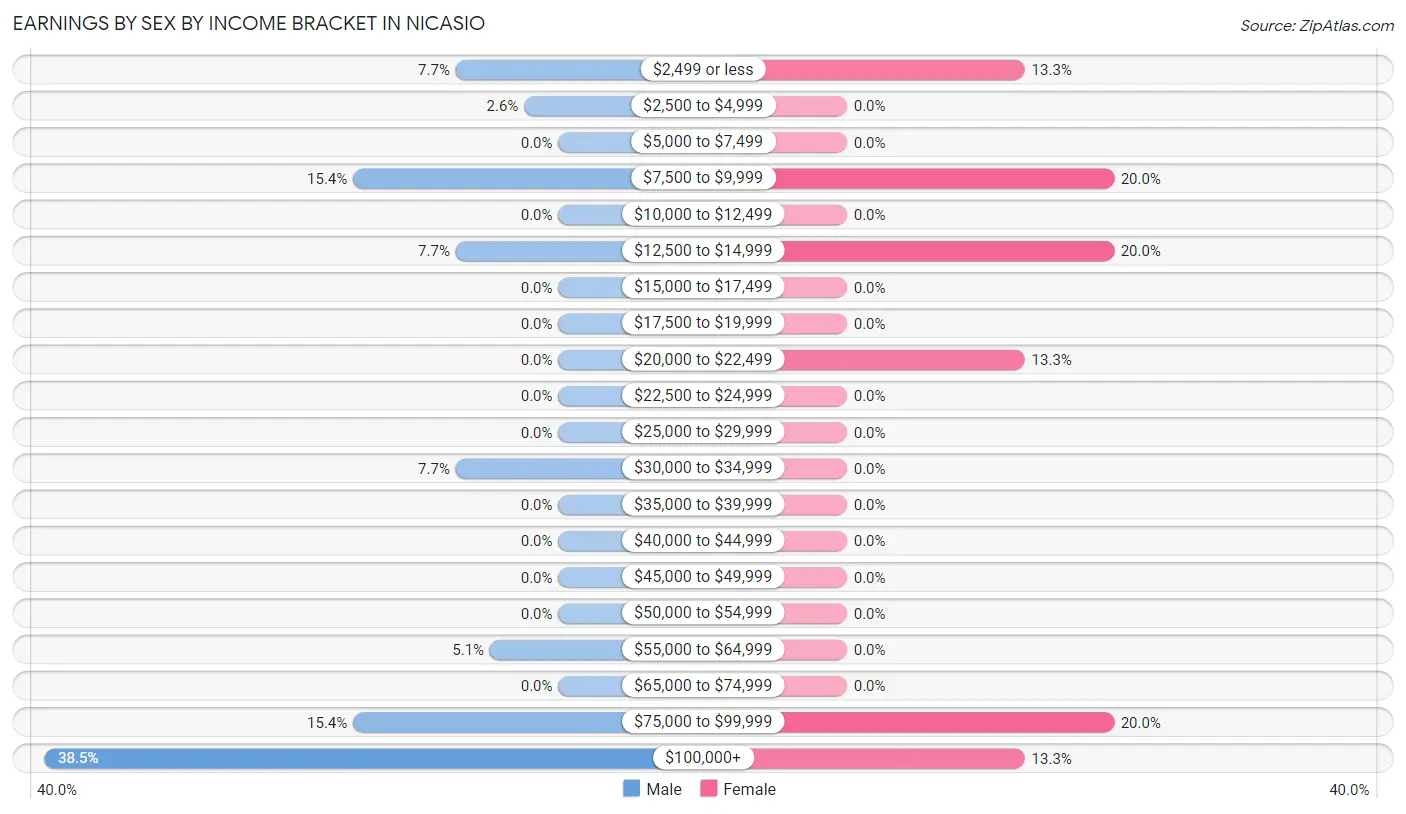
Earnings by Sex by Income Bracket in Nicasio
The most common earnings brackets in Nicasio are $100,000+ for men (15 | 38.5%) and $7,500 to $9,999 for women (3 | 20.0%).
| Income | Male | Female |
| $2,499 or less | 3 (7.7%) | 2 (13.3%) |
| $2,500 to $4,999 | 1 (2.6%) | 0 (0.0%) |
| $5,000 to $7,499 | 0 (0.0%) | 0 (0.0%) |
| $7,500 to $9,999 | 6 (15.4%) | 3 (20.0%) |
| $10,000 to $12,499 | 0 (0.0%) | 0 (0.0%) |
| $12,500 to $14,999 | 3 (7.7%) | 3 (20.0%) |
| $15,000 to $17,499 | 0 (0.0%) | 0 (0.0%) |
| $17,500 to $19,999 | 0 (0.0%) | 0 (0.0%) |
| $20,000 to $22,499 | 0 (0.0%) | 2 (13.3%) |
| $22,500 to $24,999 | 0 (0.0%) | 0 (0.0%) |
| $25,000 to $29,999 | 0 (0.0%) | 0 (0.0%) |
| $30,000 to $34,999 | 3 (7.7%) | 0 (0.0%) |
| $35,000 to $39,999 | 0 (0.0%) | 0 (0.0%) |
| $40,000 to $44,999 | 0 (0.0%) | 0 (0.0%) |
| $45,000 to $49,999 | 0 (0.0%) | 0 (0.0%) |
| $50,000 to $54,999 | 0 (0.0%) | 0 (0.0%) |
| $55,000 to $64,999 | 2 (5.1%) | 0 (0.0%) |
| $65,000 to $74,999 | 0 (0.0%) | 0 (0.0%) |
| $75,000 to $99,999 | 6 (15.4%) | 3 (20.0%) |
| $100,000+ | 15 (38.5%) | 2 (13.3%) |
| Total | 39 (100.0%) | 15 (100.0%) |
Earnings by Sex by Educational Attainment in Nicasio
| Educational Attainment | Male Income | Female Income |
| Less than High School | - | - |
| High School Diploma | - | - |
| College or Associate's Degree | - | - |
| Bachelor's Degree | - | - |
| Graduate Degree | - | - |
| Total | $113,750 | $0 |
Family Income in Nicasio
Family Income Brackets in Nicasio
According to the Nicasio family income data, there are 17 families falling into the $200,000+ income range, which is the most common income bracket and makes up 73.9% of all families.
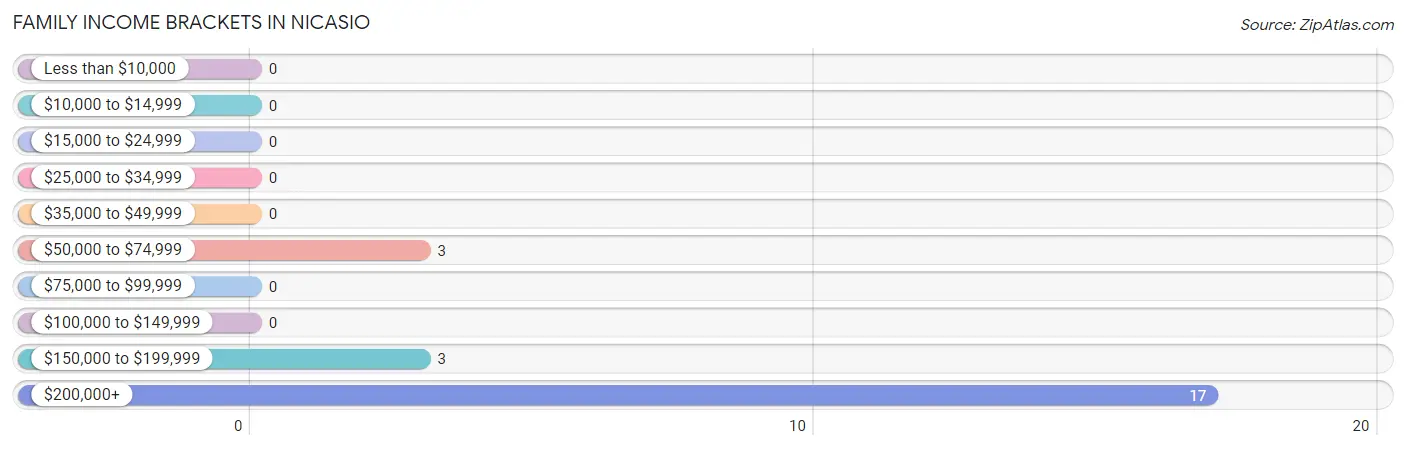
| Income Bracket | # Families | % Families |
| Less than $10,000 | 0 | 0.0% |
| $10,000 to $14,999 | 0 | 0.0% |
| $15,000 to $24,999 | 0 | 0.0% |
| $25,000 to $34,999 | 0 | 0.0% |
| $35,000 to $49,999 | 0 | 0.0% |
| $50,000 to $74,999 | 3 | 13.0% |
| $75,000 to $99,999 | 0 | 0.0% |
| $100,000 to $149,999 | 0 | 0.0% |
| $150,000 to $199,999 | 3 | 13.0% |
| $200,000+ | 17 | 73.9% |
Family Income by Famaliy Size in Nicasio
4-person families (9 | 39.1%) account for the highest median family income in Nicasio with $250,001 per family, while 2-person families (12 | 52.2%) have the highest median income of $98,125 per family member.
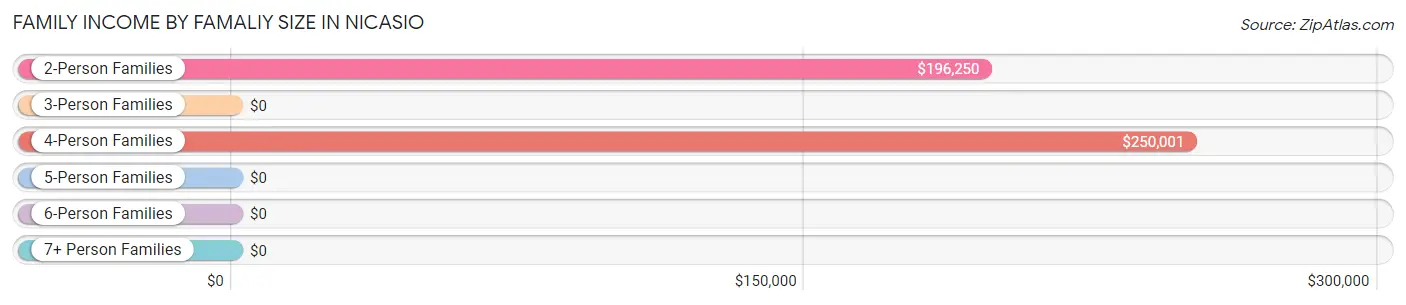
| Income Bracket | # Families | Median Income |
| 2-Person Families | 12 (52.2%) | $196,250 |
| 3-Person Families | 2 (8.7%) | $0 |
| 4-Person Families | 9 (39.1%) | $250,001 |
| 5-Person Families | 0 (0.0%) | $0 |
| 6-Person Families | 0 (0.0%) | $0 |
| 7+ Person Families | 0 (0.0%) | $0 |
| Total | 23 (100.0%) | $250,001 |
Family Income by Number of Earners in Nicasio
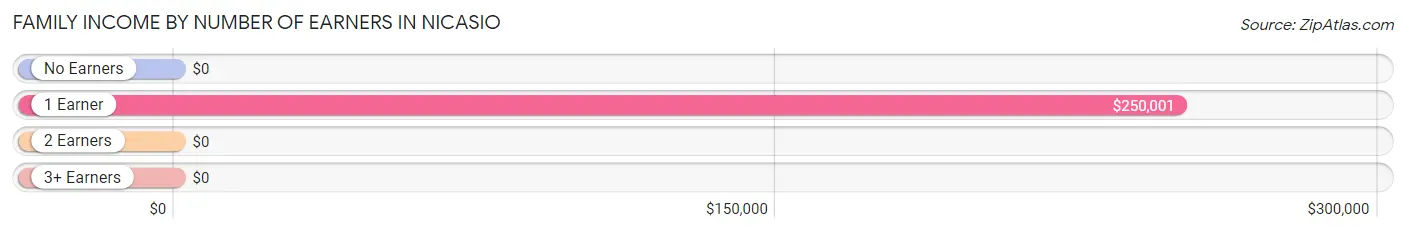
| Number of Earners | # Families | Median Income |
| No Earners | 0 (0.0%) | $0 |
| 1 Earner | 7 (30.4%) | $250,001 |
| 2 Earners | 10 (43.5%) | $0 |
| 3+ Earners | 6 (26.1%) | $0 |
| Total | 23 (100.0%) | $250,001 |
Household Income in Nicasio
Household Income Brackets in Nicasio
With 17 households falling in the category, the $200,000+ income range is the most frequent in Nicasio, accounting for 53.1% of all households.
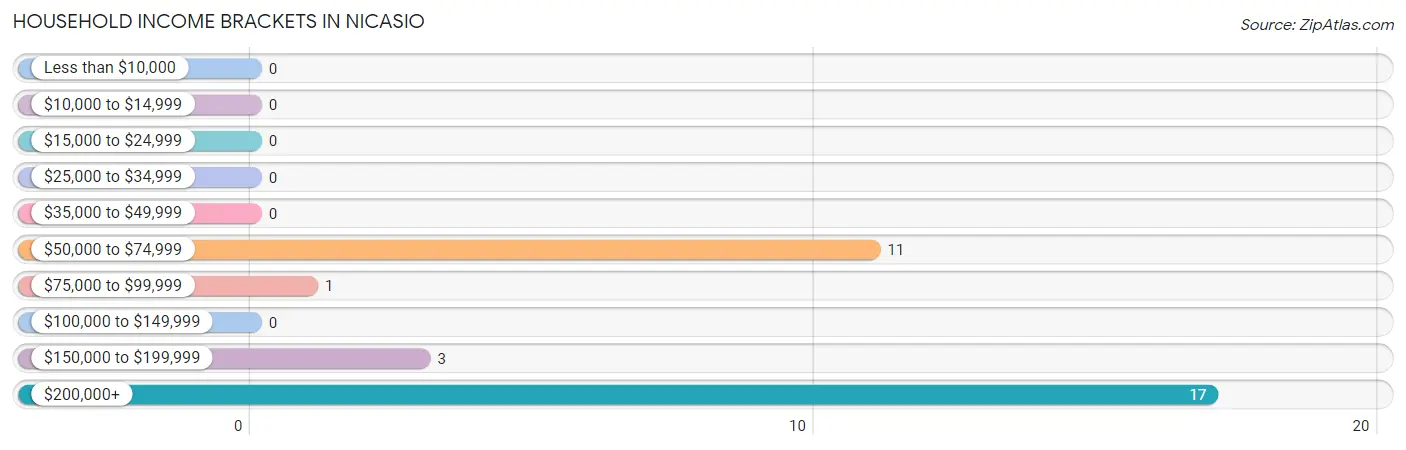
| Income Bracket | # Households | % Households |
| Less than $10,000 | 0 | 0.0% |
| $10,000 to $14,999 | 0 | 0.0% |
| $15,000 to $24,999 | 0 | 0.0% |
| $25,000 to $34,999 | 0 | 0.0% |
| $35,000 to $49,999 | 0 | 0.0% |
| $50,000 to $74,999 | 11 | 34.4% |
| $75,000 to $99,999 | 1 | 3.1% |
| $100,000 to $149,999 | 0 | 0.0% |
| $150,000 to $199,999 | 3 | 9.4% |
| $200,000+ | 17 | 53.1% |
Household Income by Householder Age in Nicasio
The median household income in Nicasio is $210,833, with the highest median household income of $250,001 found in the 45 to 64 years age bracket for the primary householder. A total of 19 households (59.4%) fall into this category.
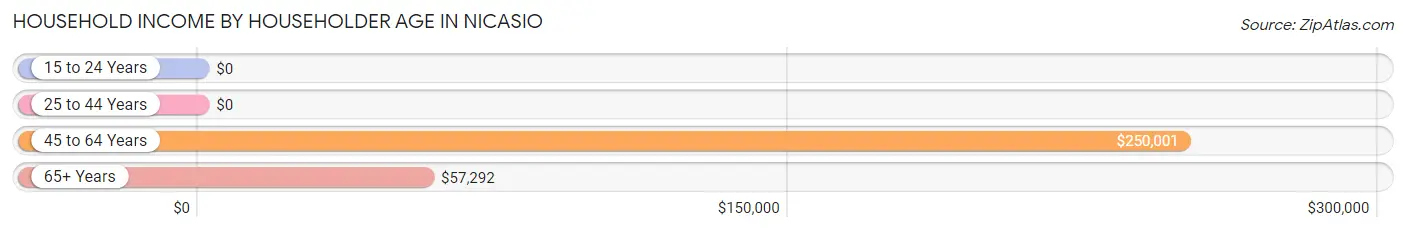
| Income Bracket | # Households | Median Income |
| 15 to 24 Years | 0 (0.0%) | $0 |
| 25 to 44 Years | 2 (6.2%) | $0 |
| 45 to 64 Years | 19 (59.4%) | $250,001 |
| 65+ Years | 11 (34.4%) | $57,292 |
| Total | 32 (100.0%) | $210,833 |
Poverty in Nicasio
Income Below Poverty by Sex and Age in Nicasio
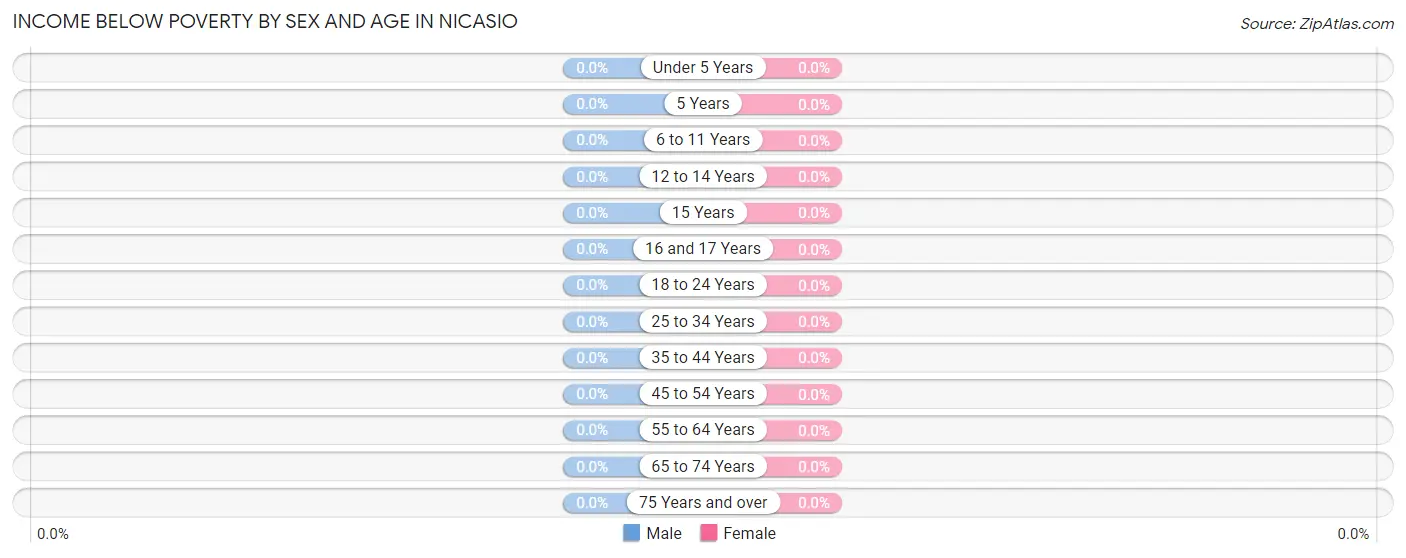
| Age Bracket | Male | Female |
| Under 5 Years | 0 (0.0%) | 0 (0.0%) |
| 5 Years | 0 (0.0%) | 0 (0.0%) |
| 6 to 11 Years | 0 (0.0%) | 0 (0.0%) |
| 12 to 14 Years | 0 (0.0%) | 0 (0.0%) |
| 15 Years | 0 (0.0%) | 0 (0.0%) |
| 16 and 17 Years | 0 (0.0%) | 0 (0.0%) |
| 18 to 24 Years | 0 (0.0%) | 0 (0.0%) |
| 25 to 34 Years | 0 (0.0%) | 0 (0.0%) |
| 35 to 44 Years | 0 (0.0%) | 0 (0.0%) |
| 45 to 54 Years | 0 (0.0%) | 0 (0.0%) |
| 55 to 64 Years | 0 (0.0%) | 0 (0.0%) |
| 65 to 74 Years | 0 (0.0%) | 0 (0.0%) |
| 75 Years and over | 0 (0.0%) | 0 (0.0%) |
| Total | 0 (0.0%) | 0 (0.0%) |
Income Above Poverty by Sex and Age in Nicasio
According to the poverty statistics in Nicasio, males aged 15 years and females aged under 5 years are the age groups that are most secure financially, with 100.0% of males and 100.0% of females in these age groups living above the poverty line.
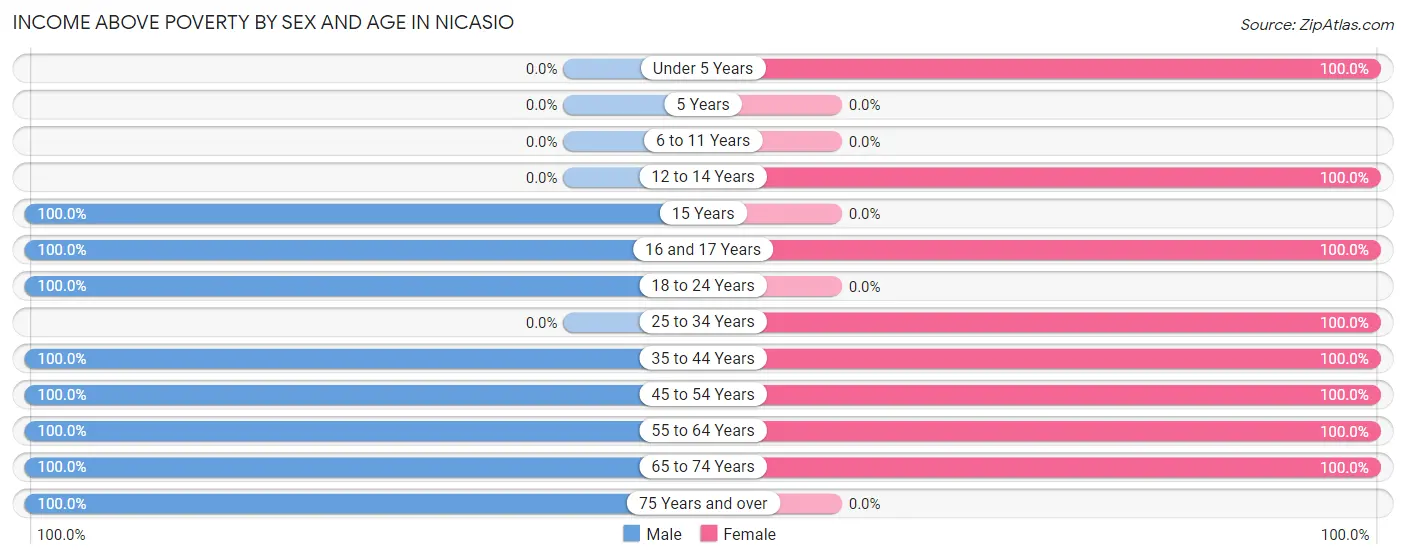
| Age Bracket | Male | Female |
| Under 5 Years | 0 (0.0%) | 2 (100.0%) |
| 5 Years | 0 (0.0%) | 0 (0.0%) |
| 6 to 11 Years | 0 (0.0%) | 0 (0.0%) |
| 12 to 14 Years | 0 (0.0%) | 4 (100.0%) |
| 15 Years | 3 (100.0%) | 0 (0.0%) |
| 16 and 17 Years | 3 (100.0%) | 3 (100.0%) |
| 18 to 24 Years | 6 (100.0%) | 0 (0.0%) |
| 25 to 34 Years | 0 (0.0%) | 2 (100.0%) |
| 35 to 44 Years | 2 (100.0%) | 2 (100.0%) |
| 45 to 54 Years | 8 (100.0%) | 3 (100.0%) |
| 55 to 64 Years | 14 (100.0%) | 13 (100.0%) |
| 65 to 74 Years | 11 (100.0%) | 5 (100.0%) |
| 75 Years and over | 2 (100.0%) | 0 (0.0%) |
| Total | 49 (100.0%) | 34 (100.0%) |
Income Below Poverty Among Married-Couple Families in Nicasio
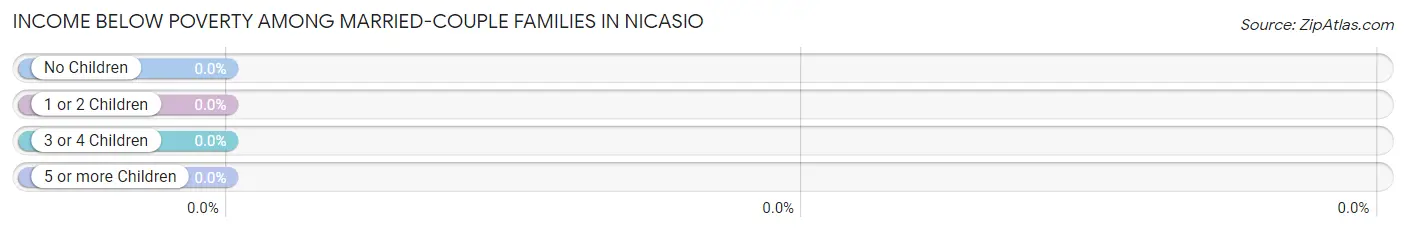
| Children | Above Poverty | Below Poverty |
| No Children | 12 (100.0%) | 0 (0.0%) |
| 1 or 2 Children | 11 (100.0%) | 0 (0.0%) |
| 3 or 4 Children | 0 (0.0%) | 0 (0.0%) |
| 5 or more Children | 0 (0.0%) | 0 (0.0%) |
| Total | 23 (100.0%) | 0 (0.0%) |
Income Below Poverty Among Single-Parent Households in Nicasio
| Children | Single Father | Single Mother |
| No Children | 0 (0.0%) | 0 (0.0%) |
| 1 or 2 Children | 0 (0.0%) | 0 (0.0%) |
| 3 or 4 Children | 0 (0.0%) | 0 (0.0%) |
| 5 or more Children | 0 (0.0%) | 0 (0.0%) |
| Total | 0 (0.0%) | 0 (0.0%) |
Income Below Poverty Among Married-Couple vs Single-Parent Households in Nicasio
| Children | Married-Couple Families | Single-Parent Households |
| No Children | 0 (0.0%) | 0 (0.0%) |
| 1 or 2 Children | 0 (0.0%) | 0 (0.0%) |
| 3 or 4 Children | 0 (0.0%) | 0 (0.0%) |
| 5 or more Children | 0 (0.0%) | 0 (0.0%) |
| Total | 0 (0.0%) | 0 (0.0%) |
Race in Nicasio
The most populous races in Nicasio are White / Caucasian (78 | 94.0%), Asian (3 | 3.6%), and Hispanic or Latino (2 | 2.4%).
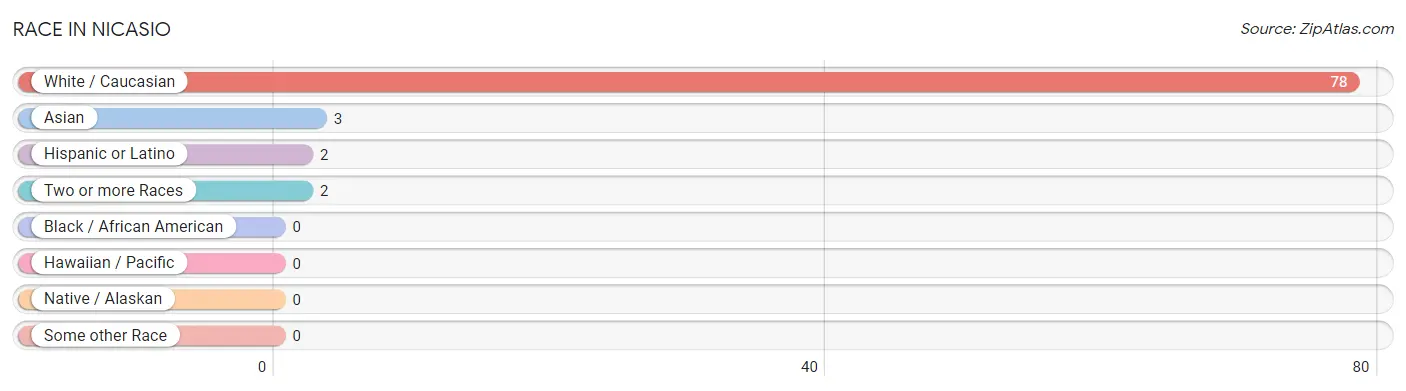
| Race | # Population | % Population |
| Asian | 3 | 3.6% |
| Black / African American | 0 | 0.0% |
| Hawaiian / Pacific | 0 | 0.0% |
| Hispanic or Latino | 2 | 2.4% |
| Native / Alaskan | 0 | 0.0% |
| White / Caucasian | 78 | 94.0% |
| Two or more Races | 2 | 2.4% |
| Some other Race | 0 | 0.0% |
| Total | 83 | 100.0% |
Ancestry in Nicasio
The most populous ancestries reported in Nicasio are Irish (17 | 20.5%), German (14 | 16.9%), English (12 | 14.5%), European (9 | 10.8%), and Italian (8 | 9.6%), together accounting for 72.3% of all Nicasio residents.
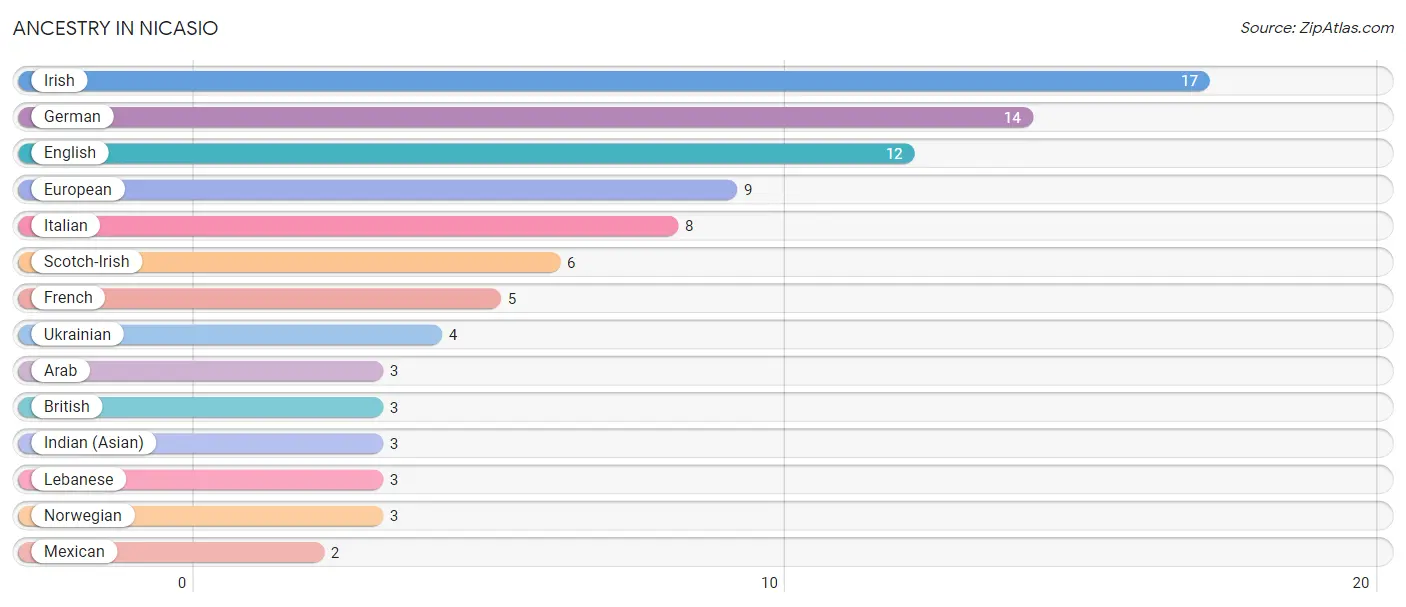
| Ancestry | # Population | % Population |
| Arab | 3 | 3.6% |
| British | 3 | 3.6% |
| English | 12 | 14.5% |
| European | 9 | 10.8% |
| French | 5 | 6.0% |
| German | 14 | 16.9% |
| Indian (Asian) | 3 | 3.6% |
| Irish | 17 | 20.5% |
| Italian | 8 | 9.6% |
| Lebanese | 3 | 3.6% |
| Mexican | 2 | 2.4% |
| Norwegian | 3 | 3.6% |
| Scotch-Irish | 6 | 7.2% |
| Ukrainian | 4 | 4.8% | View All 14 Rows |
Immigrants in Nicasio
The most numerous immigrant groups reported in Nicasio came from Asia (3 | 3.6%), China (3 | 3.6%), Eastern Asia (3 | 3.6%), and Hong Kong (3 | 3.6%), together accounting for 14.4% of all Nicasio residents.
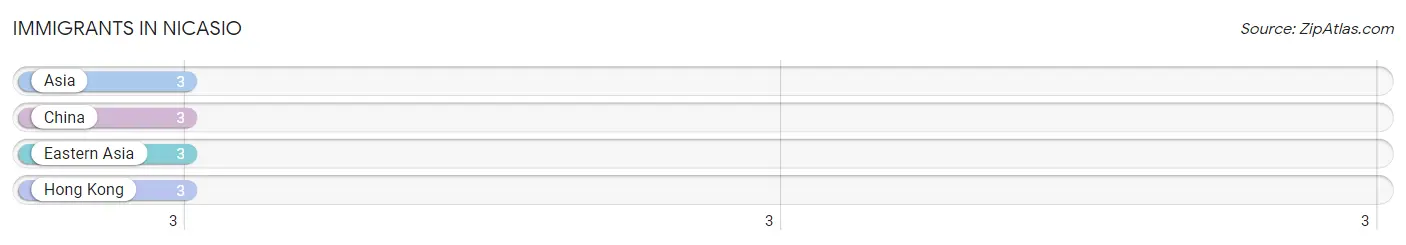
| Immigration Origin | # Population | % Population |
| Asia | 3 | 3.6% |
| China | 3 | 3.6% |
| Eastern Asia | 3 | 3.6% |
| Hong Kong | 3 | 3.6% | View All 4 Rows |
Sex and Age in Nicasio
Sex and Age in Nicasio
The most populous age groups in Nicasio are 15 to 19 Years (12 | 24.5%) for men and 55 to 59 Years (10 | 29.4%) for women.
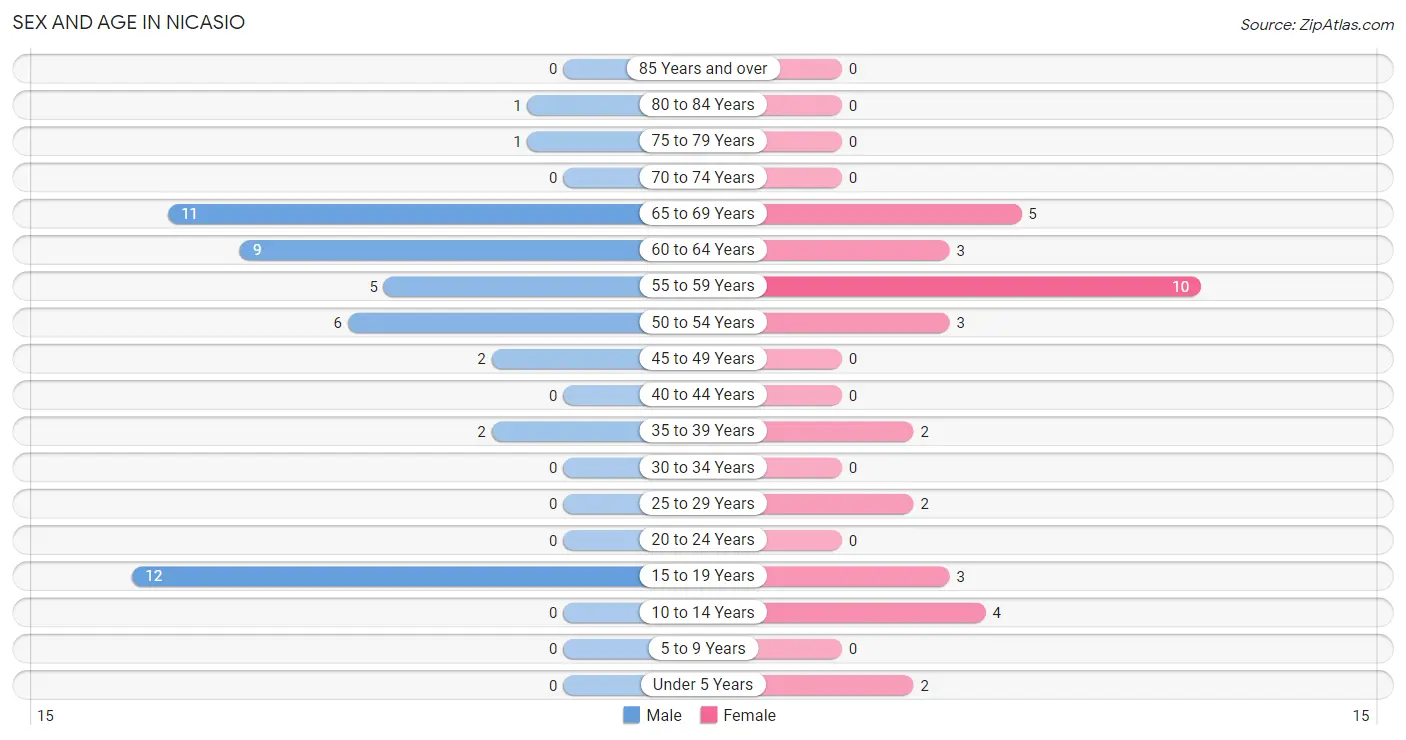
| Age Bracket | Male | Female |
| Under 5 Years | 0 (0.0%) | 2 (5.9%) |
| 5 to 9 Years | 0 (0.0%) | 0 (0.0%) |
| 10 to 14 Years | 0 (0.0%) | 4 (11.8%) |
| 15 to 19 Years | 12 (24.5%) | 3 (8.8%) |
| 20 to 24 Years | 0 (0.0%) | 0 (0.0%) |
| 25 to 29 Years | 0 (0.0%) | 2 (5.9%) |
| 30 to 34 Years | 0 (0.0%) | 0 (0.0%) |
| 35 to 39 Years | 2 (4.1%) | 2 (5.9%) |
| 40 to 44 Years | 0 (0.0%) | 0 (0.0%) |
| 45 to 49 Years | 2 (4.1%) | 0 (0.0%) |
| 50 to 54 Years | 6 (12.2%) | 3 (8.8%) |
| 55 to 59 Years | 5 (10.2%) | 10 (29.4%) |
| 60 to 64 Years | 9 (18.4%) | 3 (8.8%) |
| 65 to 69 Years | 11 (22.5%) | 5 (14.7%) |
| 70 to 74 Years | 0 (0.0%) | 0 (0.0%) |
| 75 to 79 Years | 1 (2.0%) | 0 (0.0%) |
| 80 to 84 Years | 1 (2.0%) | 0 (0.0%) |
| 85 Years and over | 0 (0.0%) | 0 (0.0%) |
| Total | 49 (100.0%) | 34 (100.0%) |
Families and Households in Nicasio
Median Family Size in Nicasio
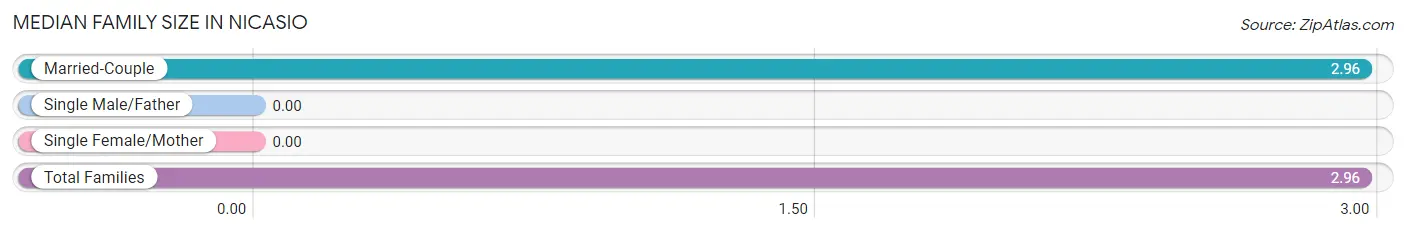
| Family Type | # Families | Family Size |
| Married-Couple | 23 (100.0%) | 2.96 |
| Single Male/Father | 0 (0.0%) | - |
| Single Female/Mother | 0 (0.0%) | - |
| Total Families | 23 (100.0%) | 2.96 |
Median Household Size in Nicasio
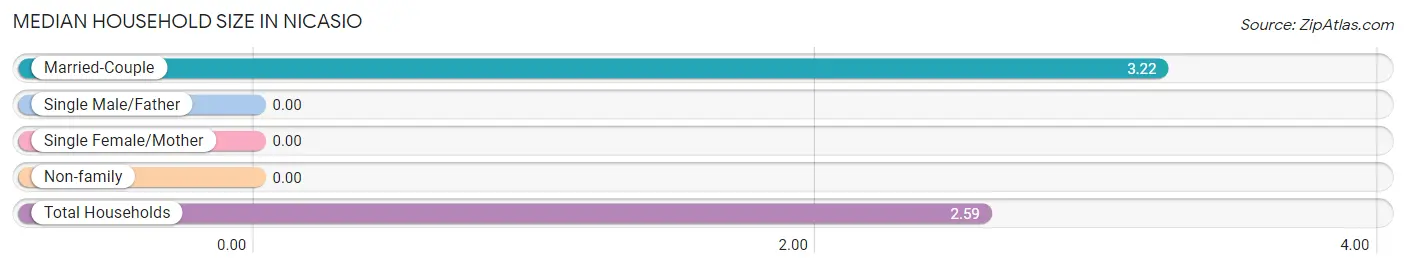
| Household Type | # Households | Household Size |
| Married-Couple | 23 (71.9%) | 3.22 |
| Single Male/Father | 0 (0.0%) | - |
| Single Female/Mother | 0 (0.0%) | - |
| Non-family | 9 (28.1%) | - |
| Total Households | 32 (100.0%) | 2.59 |
Household Size by Marriage Status in Nicasio
Out of a total of 32 households in Nicasio, 23 (71.9%) are family households, while 9 (28.1%) are nonfamily households. The most numerous type of family households are 2-person households, comprising 9, and the most common type of nonfamily households are 1-person households, comprising 9.
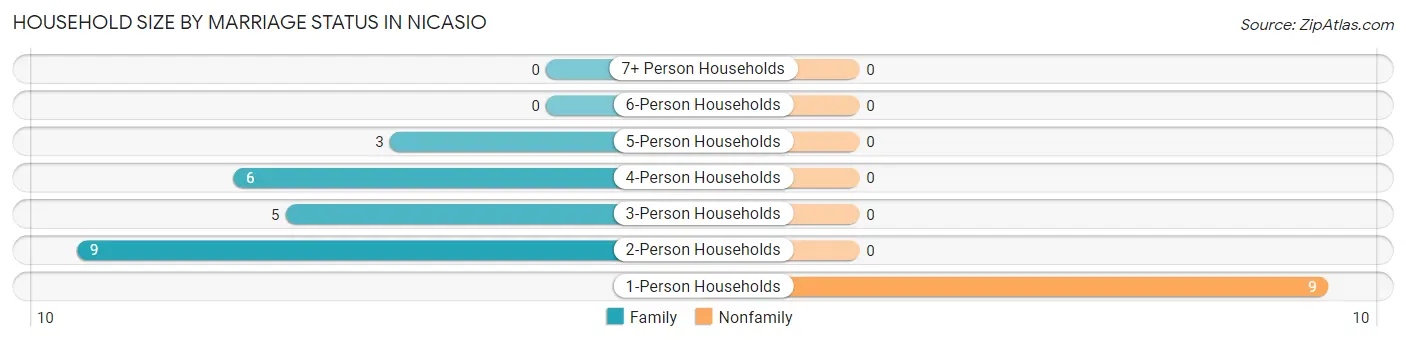
| Household Size | Family Households | Nonfamily Households |
| 1-Person Households | - | 9 (28.1%) |
| 2-Person Households | 9 (28.1%) | 0 (0.0%) |
| 3-Person Households | 5 (15.6%) | 0 (0.0%) |
| 4-Person Households | 6 (18.8%) | 0 (0.0%) |
| 5-Person Households | 3 (9.4%) | 0 (0.0%) |
| 6-Person Households | 0 (0.0%) | 0 (0.0%) |
| 7+ Person Households | 0 (0.0%) | 0 (0.0%) |
| Total | 23 (71.9%) | 9 (28.1%) |
Female Fertility in Nicasio
Fertility by Age in Nicasio
| Age Bracket | Women with Births | Births / 1,000 Women |
| 15 to 19 years | 0 (0.0%) | 0.0 |
| 20 to 34 years | 0 (0.0%) | 0.0 |
| 35 to 50 years | 0 (0.0%) | 0.0 |
| Total | 0 (0.0%) | 0.0 |
Fertility by Age by Marriage Status in Nicasio
| Age Bracket | Married | Unmarried |
| 15 to 19 years | 0 (0.0%) | 0 (0.0%) |
| 20 to 34 years | 0 (0.0%) | 0 (0.0%) |
| 35 to 50 years | 0 (0.0%) | 0 (0.0%) |
| Total | 0 (0.0%) | 0 (0.0%) |
Fertility by Education in Nicasio
| Educational Attainment | Women with Births | Births / 1,000 Women |
| Less than High School | 0 (0.0%) | 0.0 |
| High School Diploma | 0 (0.0%) | 0.0 |
| College or Associate's Degree | 0 (0.0%) | 0.0 |
| Bachelor's Degree | 0 (0.0%) | 0.0 |
| Graduate Degree | 0 (0.0%) | 0.0 |
| Total | 0 (0.0%) | 0.0 |
Fertility by Education by Marriage Status in Nicasio
| Educational Attainment | Married | Unmarried |
| Less than High School | 0 (0.0%) | 0 (0.0%) |
| High School Diploma | 0 (0.0%) | 0 (0.0%) |
| College or Associate's Degree | 0 (0.0%) | 0 (0.0%) |
| Bachelor's Degree | 0 (0.0%) | 0 (0.0%) |
| Graduate Degree | 0 (0.0%) | 0 (0.0%) |
| Total | 0 (0.0%) | 0 (0.0%) |
Employment Characteristics in Nicasio
Employment by Class of Employer in Nicasio
Among the 50 employed individuals in Nicasio, private company employees (16 | 32.0%), self-employed (incorporated) (11 | 22.0%), and self-employed (not incorporated) (11 | 22.0%) make up the most common classes of employment.
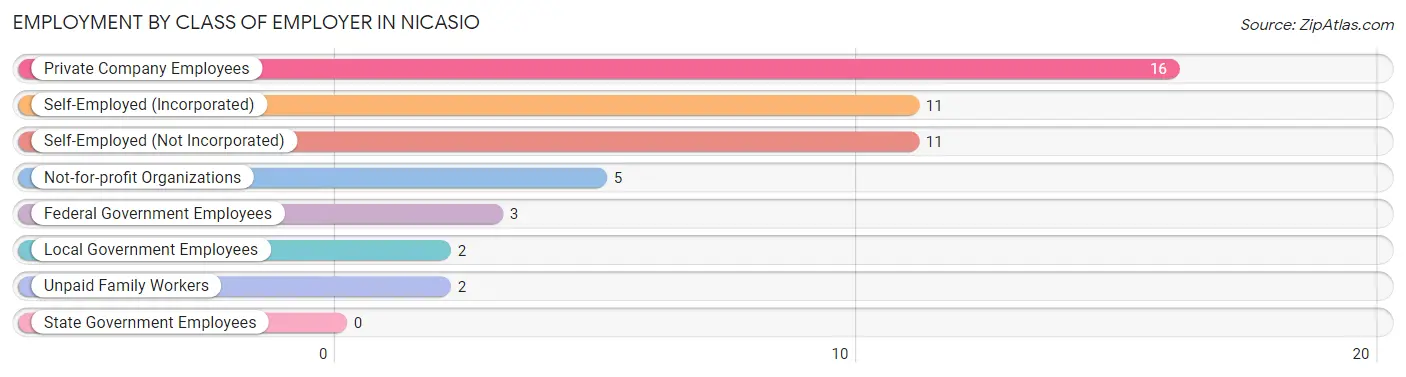
| Employer Class | # Employees | % Employees |
| Private Company Employees | 16 | 32.0% |
| Self-Employed (Incorporated) | 11 | 22.0% |
| Self-Employed (Not Incorporated) | 11 | 22.0% |
| Not-for-profit Organizations | 5 | 10.0% |
| Local Government Employees | 2 | 4.0% |
| State Government Employees | 0 | 0.0% |
| Federal Government Employees | 3 | 6.0% |
| Unpaid Family Workers | 2 | 4.0% |
| Total | 50 | 100.0% |
Employment Status by Age in Nicasio
According to the labor force statistics for Nicasio, out of the total population over 16 years of age (74), 73.0% or 54 individuals are in the labor force, with 7.4% or 4 of them unemployed. The age group with the highest labor force participation rate is 25 to 29 years, with 100.0% or 2 individuals in the labor force. Within the labor force, the 55 to 59 years age range has the highest percentage of unemployed individuals, with 44.4% or 4 of them being unemployed.
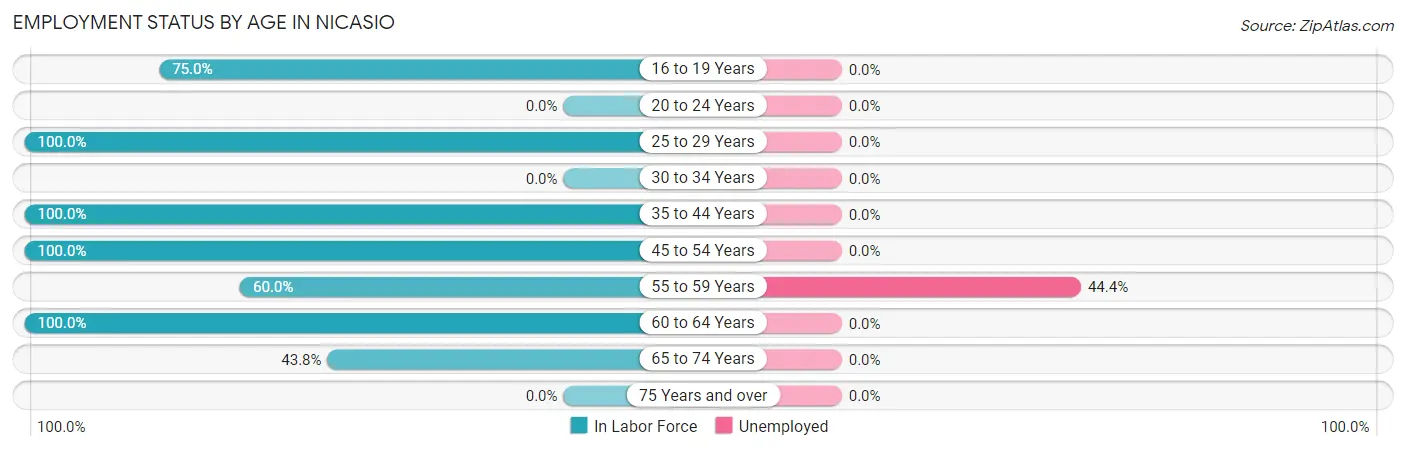
| Age Bracket | In Labor Force | Unemployed |
| 16 to 19 Years | 9 (75.0%) | 0 (0.0%) |
| 20 to 24 Years | 0 (0.0%) | 0 (0.0%) |
| 25 to 29 Years | 2 (100.0%) | 0 (0.0%) |
| 30 to 34 Years | 0 (0.0%) | 0 (0.0%) |
| 35 to 44 Years | 4 (100.0%) | 0 (0.0%) |
| 45 to 54 Years | 11 (100.0%) | 0 (0.0%) |
| 55 to 59 Years | 9 (60.0%) | 4 (44.4%) |
| 60 to 64 Years | 12 (100.0%) | 0 (0.0%) |
| 65 to 74 Years | 7 (43.8%) | 0 (0.0%) |
| 75 Years and over | 0 (0.0%) | 0 (0.0%) |
| Total | 54 (73.0%) | 4 (7.4%) |
Employment Status by Educational Attainment in Nicasio
According to labor force statistics for Nicasio, 86.4% of individuals (38) out of the total population between 25 and 64 years of age (44) are in the labor force, with 10.5% or 4 of them being unemployed. The group with the highest labor force participation rate are those with the educational attainment of high school diploma, with 100.0% or 2 individuals in the labor force. Within the labor force, individuals with bachelor's degree or higher education have the highest percentage of unemployment, with 11.1% or 4 of them being unemployed.
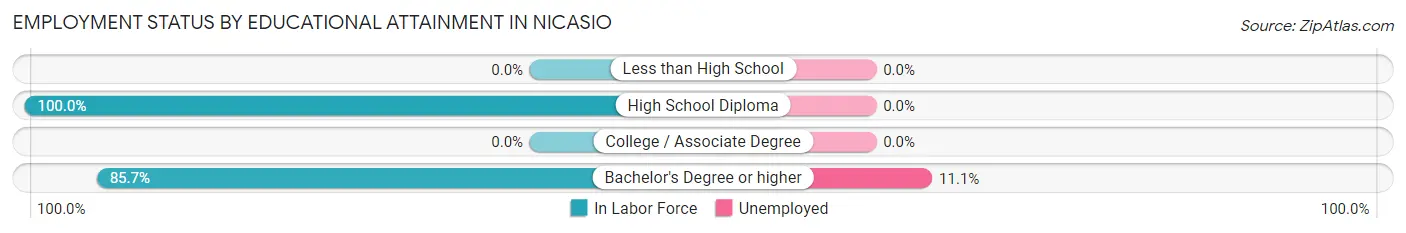
| Educational Attainment | In Labor Force | Unemployed |
| Less than High School | 0 (0.0%) | 0 (0.0%) |
| High School Diploma | 2 (100.0%) | 0 (0.0%) |
| College / Associate Degree | 0 (0.0%) | 0 (0.0%) |
| Bachelor's Degree or higher | 36 (85.7%) | 5 (11.1%) |
| Total | 38 (86.4%) | 5 (10.5%) |
Employment Occupations by Sex in Nicasio
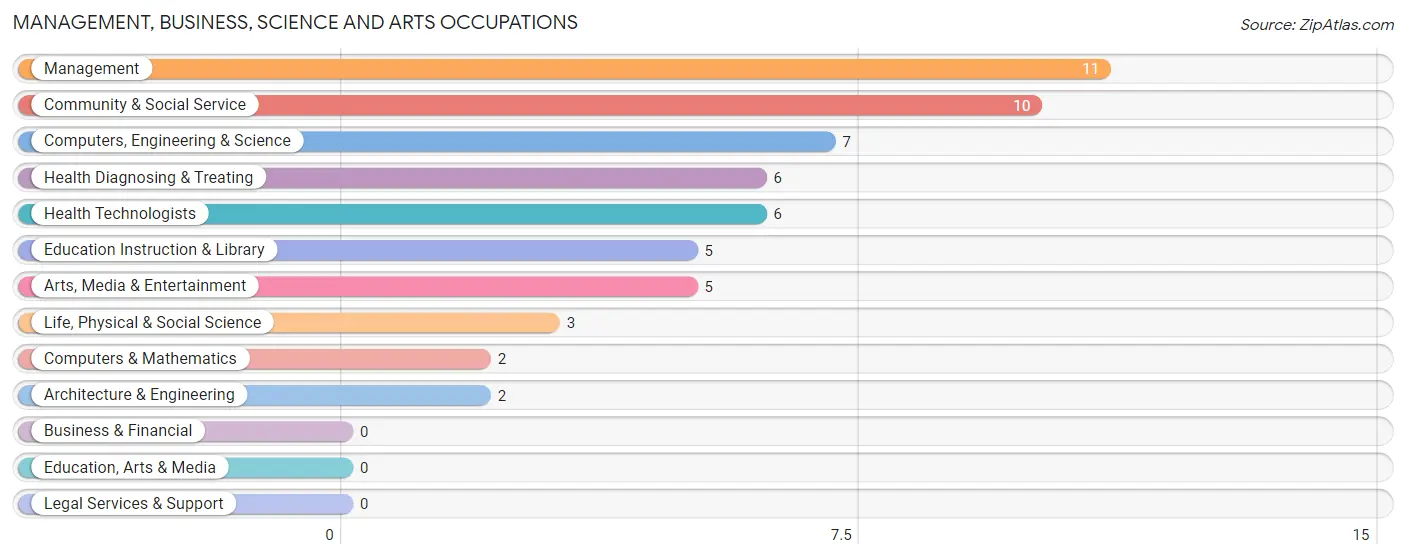
Management, Business, Science and Arts Occupations
The most common Management, Business, Science and Arts occupations in Nicasio are Management (11 | 22.0%), Community & Social Service (10 | 20.0%), Computers, Engineering & Science (7 | 14.0%), Health Diagnosing & Treating (6 | 12.0%), and Health Technologists (6 | 12.0%).
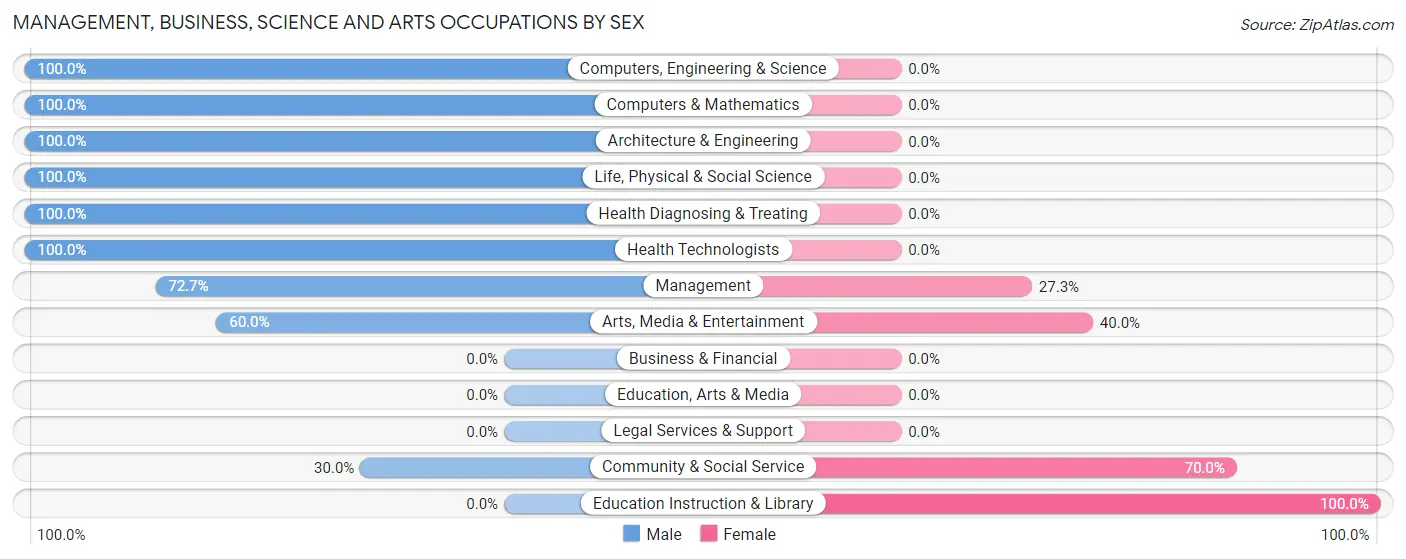
Management, Business, Science and Arts Occupations by Sex
Within the Management, Business, Science and Arts occupations in Nicasio, the most male-oriented occupations are Computers, Engineering & Science (100.0%), Computers & Mathematics (100.0%), and Architecture & Engineering (100.0%), while the most female-oriented occupations are Education Instruction & Library (100.0%), Community & Social Service (70.0%), and Arts, Media & Entertainment (40.0%).
| Occupation | Male | Female |
| Management | 8 (72.7%) | 3 (27.3%) |
| Business & Financial | 0 (0.0%) | 0 (0.0%) |
| Computers, Engineering & Science | 7 (100.0%) | 0 (0.0%) |
| Computers & Mathematics | 2 (100.0%) | 0 (0.0%) |
| Architecture & Engineering | 2 (100.0%) | 0 (0.0%) |
| Life, Physical & Social Science | 3 (100.0%) | 0 (0.0%) |
| Community & Social Service | 3 (30.0%) | 7 (70.0%) |
| Education, Arts & Media | 0 (0.0%) | 0 (0.0%) |
| Legal Services & Support | 0 (0.0%) | 0 (0.0%) |
| Education Instruction & Library | 0 (0.0%) | 5 (100.0%) |
| Arts, Media & Entertainment | 3 (60.0%) | 2 (40.0%) |
| Health Diagnosing & Treating | 6 (100.0%) | 0 (0.0%) |
| Health Technologists | 6 (100.0%) | 0 (0.0%) |
| Total (Category) | 24 (70.6%) | 10 (29.4%) |
| Total (Overall) | 35 (70.0%) | 15 (30.0%) |
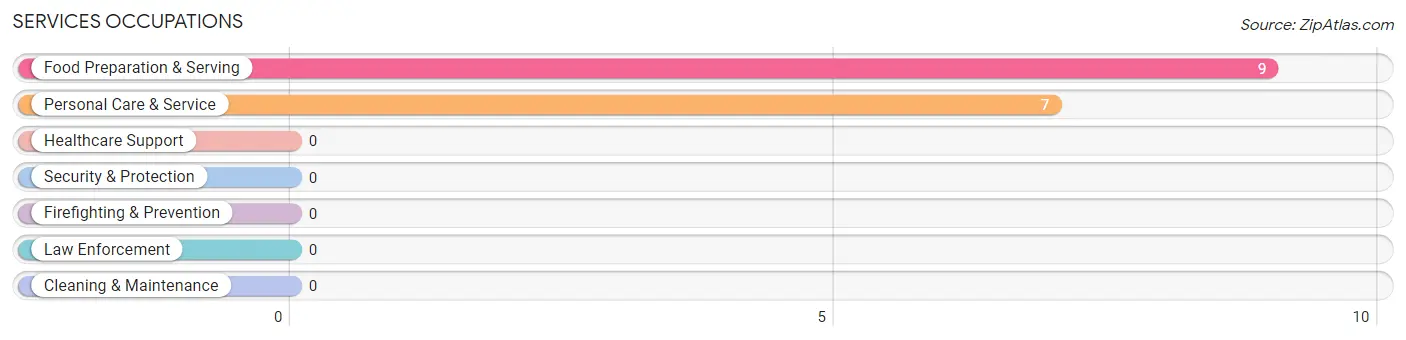
Services Occupations
The most common Services occupations in Nicasio are Food Preparation & Serving (9 | 18.0%), and Personal Care & Service (7 | 14.0%).
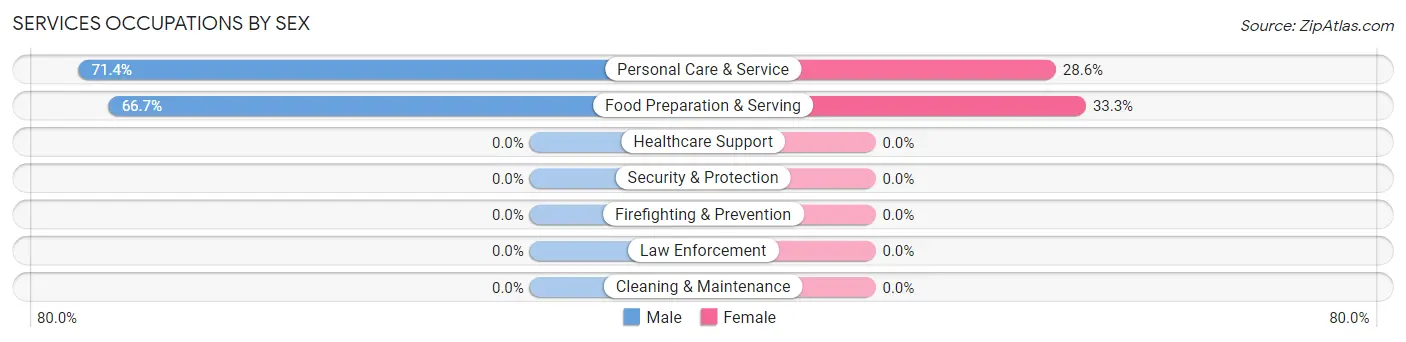
Services Occupations by Sex
Within the Services occupations in Nicasio, the most male-oriented occupations are Personal Care & Service (71.4%), and Food Preparation & Serving (66.7%), while the most female-oriented occupations are Food Preparation & Serving (33.3%), and Personal Care & Service (28.6%).
| Occupation | Male | Female |
| Healthcare Support | 0 (0.0%) | 0 (0.0%) |
| Security & Protection | 0 (0.0%) | 0 (0.0%) |
| Firefighting & Prevention | 0 (0.0%) | 0 (0.0%) |
| Law Enforcement | 0 (0.0%) | 0 (0.0%) |
| Food Preparation & Serving | 6 (66.7%) | 3 (33.3%) |
| Cleaning & Maintenance | 0 (0.0%) | 0 (0.0%) |
| Personal Care & Service | 5 (71.4%) | 2 (28.6%) |
| Total (Category) | 11 (68.8%) | 5 (31.2%) |
| Total (Overall) | 35 (70.0%) | 15 (30.0%) |
Sales and Office Occupations
Sales and Office Occupations by Sex
| Occupation | Male | Female |
| Sales & Related | 0 (0.0%) | 0 (0.0%) |
| Office & Administration | 0 (0.0%) | 0 (0.0%) |
| Total (Category) | 0 (0.0%) | 0 (0.0%) |
| Total (Overall) | 35 (70.0%) | 15 (30.0%) |
Natural Resources, Construction and Maintenance Occupations
Natural Resources, Construction and Maintenance Occupations by Sex
| Occupation | Male | Female |
| Farming, Fishing & Forestry | 0 (0.0%) | 0 (0.0%) |
| Construction & Extraction | 0 (0.0%) | 0 (0.0%) |
| Installation, Maintenance & Repair | 0 (0.0%) | 0 (0.0%) |
| Total (Category) | 0 (0.0%) | 0 (0.0%) |
| Total (Overall) | 35 (70.0%) | 15 (30.0%) |
Production, Transportation and Moving Occupations
Production, Transportation and Moving Occupations by Sex
| Occupation | Male | Female |
| Production | 0 (0.0%) | 0 (0.0%) |
| Transportation | 0 (0.0%) | 0 (0.0%) |
| Material Moving | 0 (0.0%) | 0 (0.0%) |
| Total (Category) | 0 (0.0%) | 0 (0.0%) |
| Total (Overall) | 35 (70.0%) | 15 (30.0%) |
Employment Industries by Sex in Nicasio
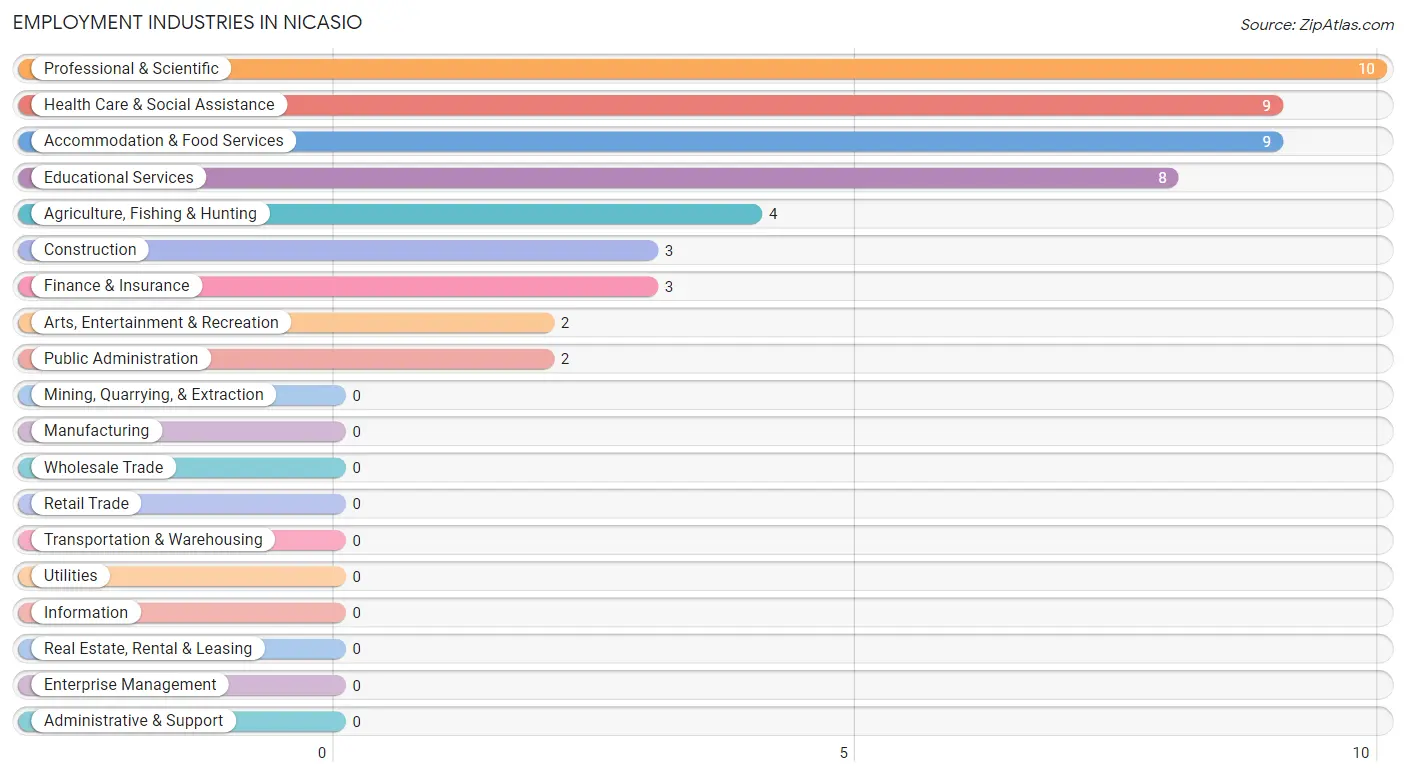
Employment Industries in Nicasio
The major employment industries in Nicasio include Professional & Scientific (10 | 20.0%), Health Care & Social Assistance (9 | 18.0%), Accommodation & Food Services (9 | 18.0%), Educational Services (8 | 16.0%), and Agriculture, Fishing & Hunting (4 | 8.0%).
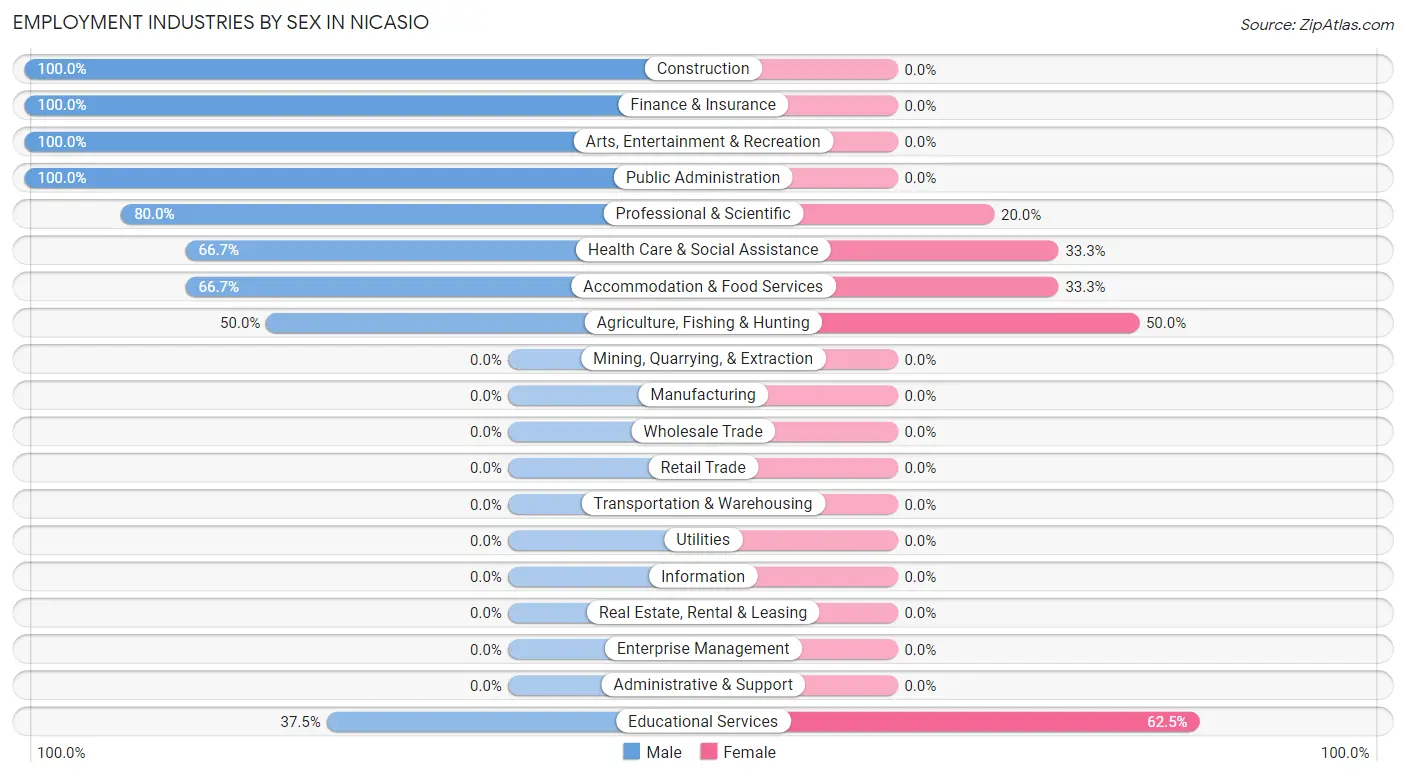
Employment Industries by Sex in Nicasio
The Nicasio industries that see more men than women are Construction (100.0%), Finance & Insurance (100.0%), and Arts, Entertainment & Recreation (100.0%), whereas the industries that tend to have a higher number of women are Educational Services (62.5%), Agriculture, Fishing & Hunting (50.0%), and Health Care & Social Assistance (33.3%).
| Industry | Male | Female |
| Agriculture, Fishing & Hunting | 2 (50.0%) | 2 (50.0%) |
| Mining, Quarrying, & Extraction | 0 (0.0%) | 0 (0.0%) |
| Construction | 3 (100.0%) | 0 (0.0%) |
| Manufacturing | 0 (0.0%) | 0 (0.0%) |
| Wholesale Trade | 0 (0.0%) | 0 (0.0%) |
| Retail Trade | 0 (0.0%) | 0 (0.0%) |
| Transportation & Warehousing | 0 (0.0%) | 0 (0.0%) |
| Utilities | 0 (0.0%) | 0 (0.0%) |
| Information | 0 (0.0%) | 0 (0.0%) |
| Finance & Insurance | 3 (100.0%) | 0 (0.0%) |
| Real Estate, Rental & Leasing | 0 (0.0%) | 0 (0.0%) |
| Professional & Scientific | 8 (80.0%) | 2 (20.0%) |
| Enterprise Management | 0 (0.0%) | 0 (0.0%) |
| Administrative & Support | 0 (0.0%) | 0 (0.0%) |
| Educational Services | 3 (37.5%) | 5 (62.5%) |
| Health Care & Social Assistance | 6 (66.7%) | 3 (33.3%) |
| Arts, Entertainment & Recreation | 2 (100.0%) | 0 (0.0%) |
| Accommodation & Food Services | 6 (66.7%) | 3 (33.3%) |
| Public Administration | 2 (100.0%) | 0 (0.0%) |
| Total | 35 (70.0%) | 15 (30.0%) |
Education in Nicasio
School Enrollment in Nicasio
The most common levels of schooling among the 19 students in Nicasio are high school (15 | 78.9%), and middle school (4 | 21.0%).
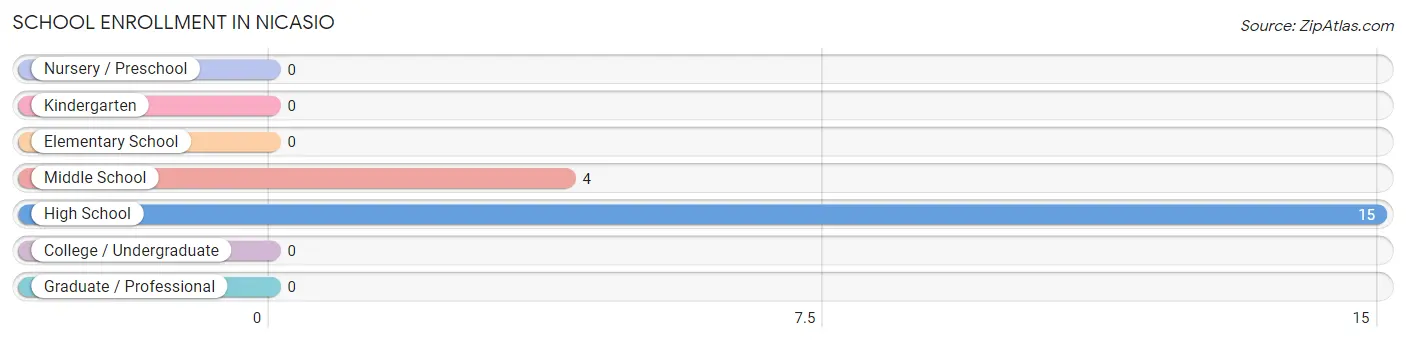
| School Level | # Students | % Students |
| Nursery / Preschool | 0 | 0.0% |
| Kindergarten | 0 | 0.0% |
| Elementary School | 0 | 0.0% |
| Middle School | 4 | 21.0% |
| High School | 15 | 78.9% |
| College / Undergraduate | 0 | 0.0% |
| Graduate / Professional | 0 | 0.0% |
| Total | 19 | 100.0% |
School Enrollment by Age by Funding Source in Nicasio
Out of a total of 19 students who are enrolled in schools in Nicasio, 10 (52.6%) attend a private institution, while the remaining 9 (47.4%) are enrolled in public schools. The age group of 10 to 14 year olds has the highest likelihood of being enrolled in private schools, with 4 (100.0% in the age bracket) enrolled. Conversely, the age group of 15 to 17 year olds has the lowest likelihood of being enrolled in a private school, with 9 (100.0% in the age bracket) attending a public institution.
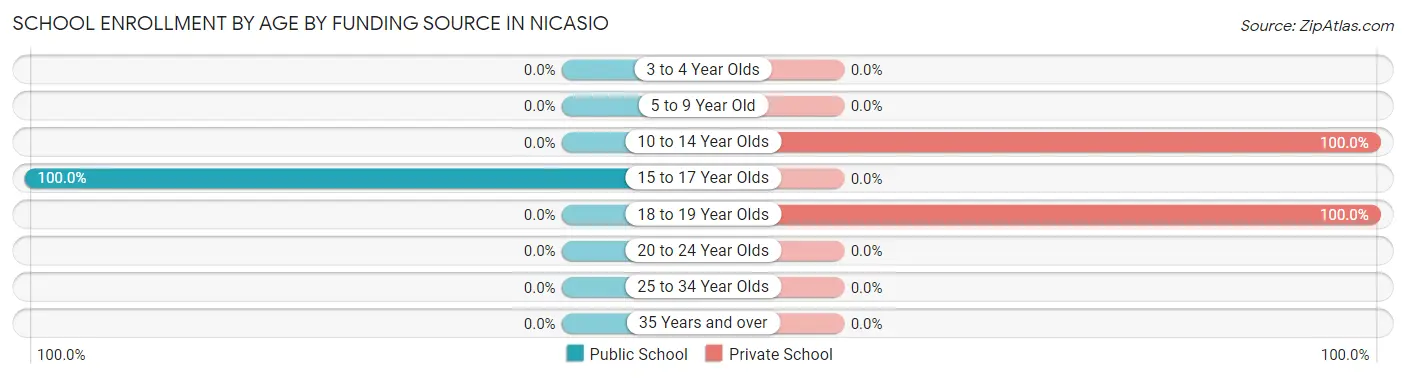
| Age Bracket | Public School | Private School |
| 3 to 4 Year Olds | 0 (0.0%) | 0 (0.0%) |
| 5 to 9 Year Old | 0 (0.0%) | 0 (0.0%) |
| 10 to 14 Year Olds | 0 (0.0%) | 4 (100.0%) |
| 15 to 17 Year Olds | 9 (100.0%) | 0 (0.0%) |
| 18 to 19 Year Olds | 0 (0.0%) | 6 (100.0%) |
| 20 to 24 Year Olds | 0 (0.0%) | 0 (0.0%) |
| 25 to 34 Year Olds | 0 (0.0%) | 0 (0.0%) |
| 35 Years and over | 0 (0.0%) | 0 (0.0%) |
| Total | 9 (47.4%) | 10 (52.6%) |
Educational Attainment by Field of Study in Nicasio
Visual & performing arts (14 | 22.2%), social sciences (10 | 15.9%), literature & languages (10 | 15.9%), science & technology (9 | 14.3%), and psychology (6 | 9.5%) are the most common fields of study among 63 individuals in Nicasio who have obtained a bachelor's degree or higher.
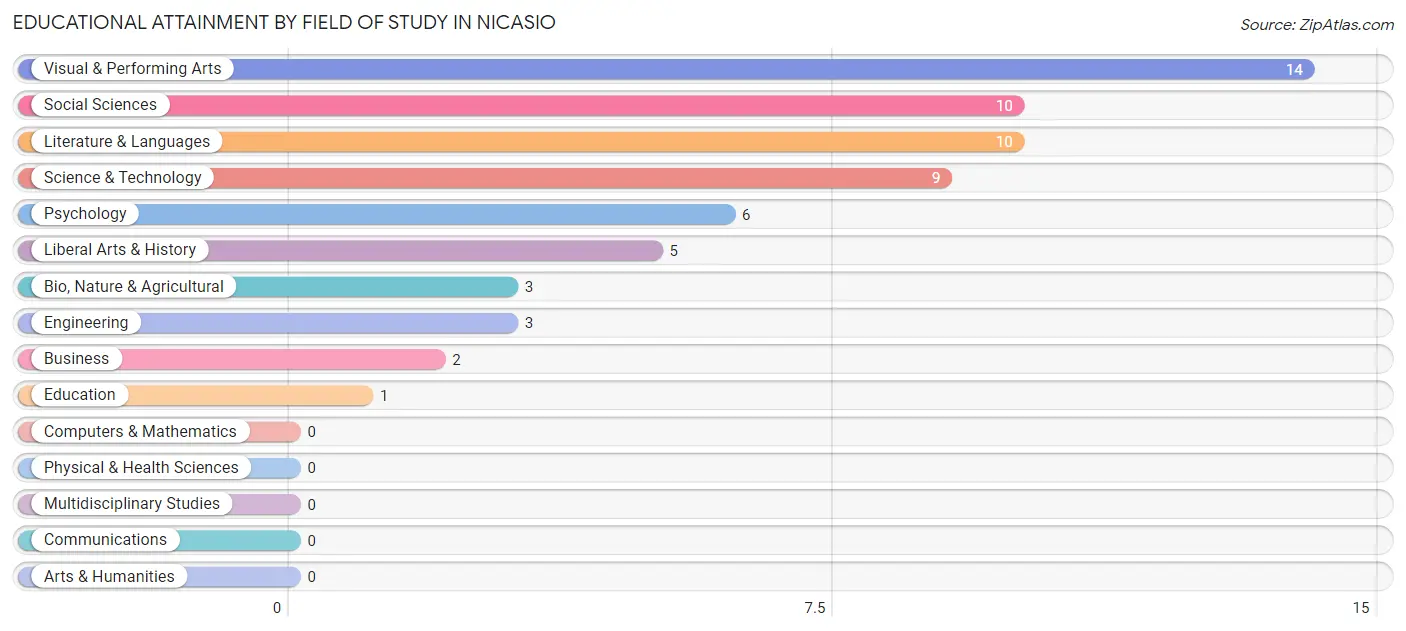
| Field of Study | # Graduates | % Graduates |
| Computers & Mathematics | 0 | 0.0% |
| Bio, Nature & Agricultural | 3 | 4.8% |
| Physical & Health Sciences | 0 | 0.0% |
| Psychology | 6 | 9.5% |
| Social Sciences | 10 | 15.9% |
| Engineering | 3 | 4.8% |
| Multidisciplinary Studies | 0 | 0.0% |
| Science & Technology | 9 | 14.3% |
| Business | 2 | 3.2% |
| Education | 1 | 1.6% |
| Literature & Languages | 10 | 15.9% |
| Liberal Arts & History | 5 | 7.9% |
| Visual & Performing Arts | 14 | 22.2% |
| Communications | 0 | 0.0% |
| Arts & Humanities | 0 | 0.0% |
| Total | 63 | 100.0% |
Transportation & Commute in Nicasio
Vehicle Availability by Sex in Nicasio
The most prevalent vehicle ownership categories in Nicasio are males with 2 vehicles (19, accounting for 54.3%) and females with 2 vehicles (2, making up 126.7%).
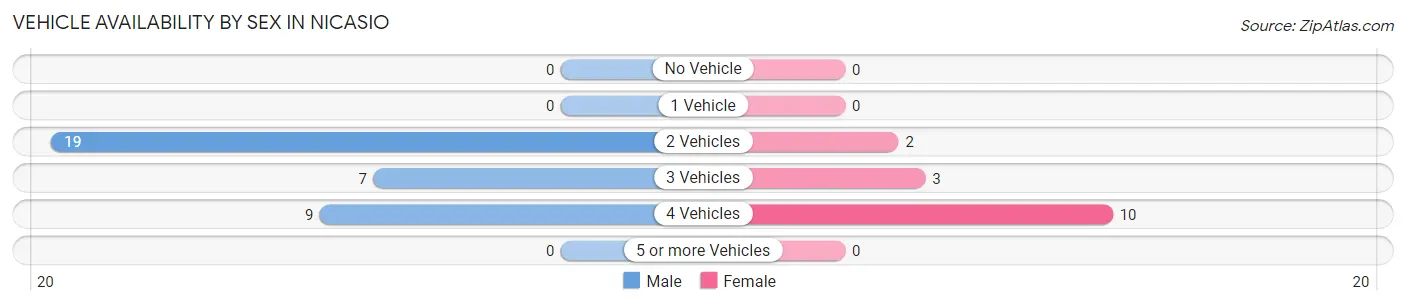
| Vehicles Available | Male | Female |
| No Vehicle | 0 (0.0%) | 0 (0.0%) |
| 1 Vehicle | 0 (0.0%) | 0 (0.0%) |
| 2 Vehicles | 19 (54.3%) | 2 (13.3%) |
| 3 Vehicles | 7 (20.0%) | 3 (20.0%) |
| 4 Vehicles | 9 (25.7%) | 10 (66.7%) |
| 5 or more Vehicles | 0 (0.0%) | 0 (0.0%) |
| Total | 35 (100.0%) | 15 (100.0%) |
Commute Time in Nicasio
The most frequently occuring commute durations in Nicasio are 90 or more minutes (12 commuters, 31.6%), 30 to 34 minutes (6 commuters, 15.8%), and 25 to 29 minutes (5 commuters, 13.2%).
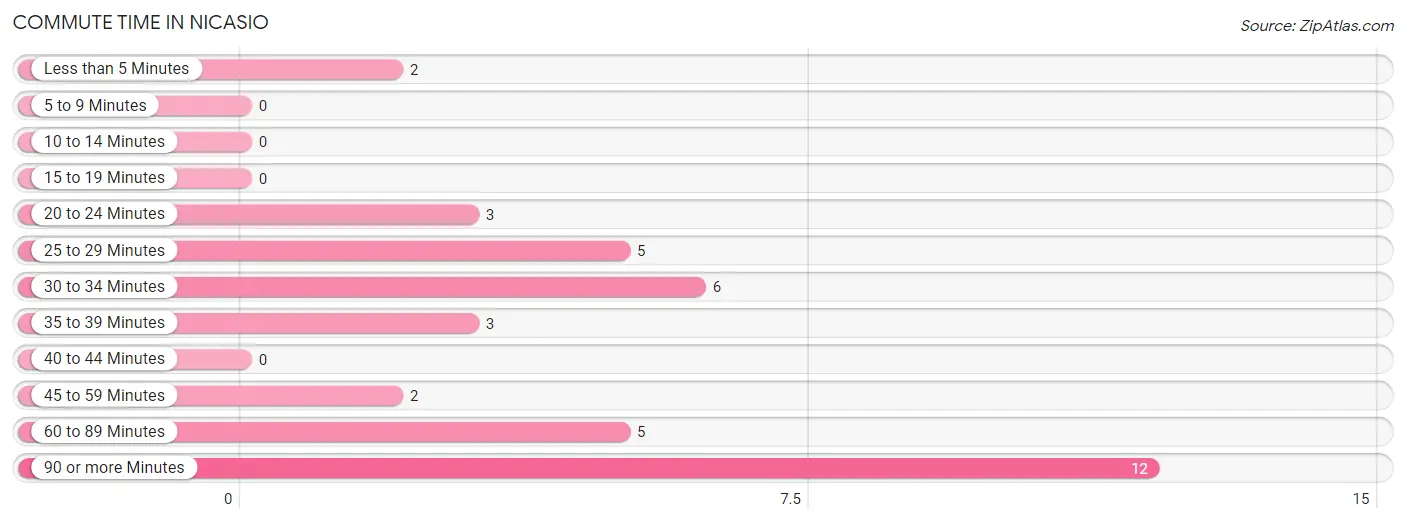
| Commute Time | # Commuters | % Commuters |
| Less than 5 Minutes | 2 | 5.3% |
| 5 to 9 Minutes | 0 | 0.0% |
| 10 to 14 Minutes | 0 | 0.0% |
| 15 to 19 Minutes | 0 | 0.0% |
| 20 to 24 Minutes | 3 | 7.9% |
| 25 to 29 Minutes | 5 | 13.2% |
| 30 to 34 Minutes | 6 | 15.8% |
| 35 to 39 Minutes | 3 | 7.9% |
| 40 to 44 Minutes | 0 | 0.0% |
| 45 to 59 Minutes | 2 | 5.3% |
| 60 to 89 Minutes | 5 | 13.2% |
| 90 or more Minutes | 12 | 31.6% |
Commute Time by Sex in Nicasio
The most common commute times in Nicasio are 90 or more minutes (12 commuters, 42.9%) for males and 30 to 34 minutes (3 commuters, 30.0%) for females.
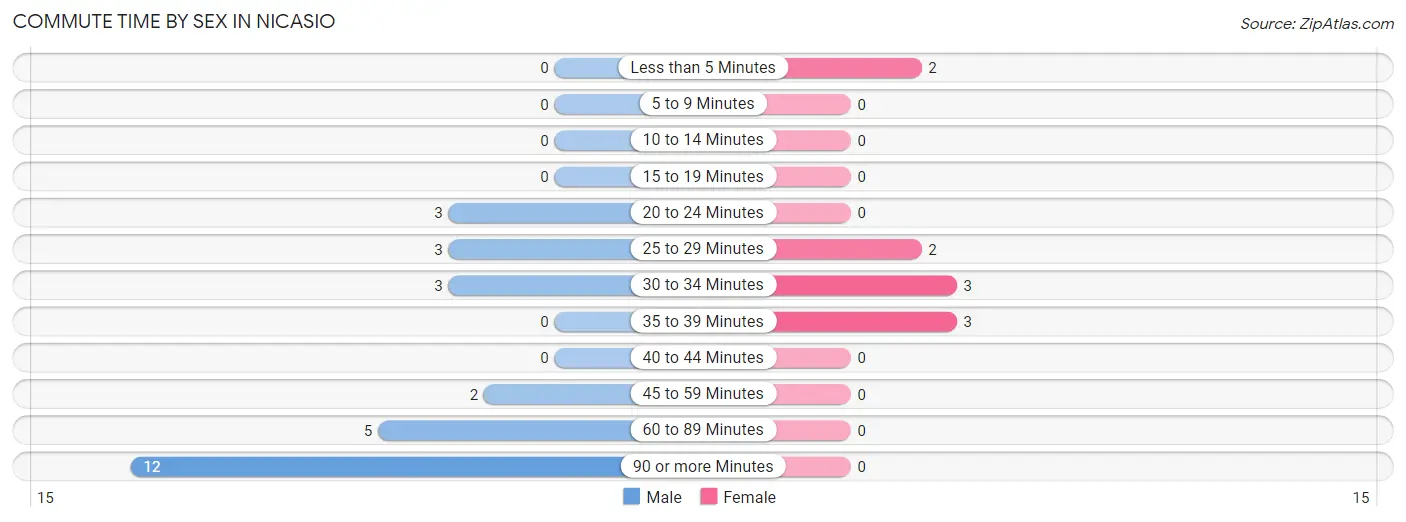
| Commute Time | Male | Female |
| Less than 5 Minutes | 0 (0.0%) | 2 (20.0%) |
| 5 to 9 Minutes | 0 (0.0%) | 0 (0.0%) |
| 10 to 14 Minutes | 0 (0.0%) | 0 (0.0%) |
| 15 to 19 Minutes | 0 (0.0%) | 0 (0.0%) |
| 20 to 24 Minutes | 3 (10.7%) | 0 (0.0%) |
| 25 to 29 Minutes | 3 (10.7%) | 2 (20.0%) |
| 30 to 34 Minutes | 3 (10.7%) | 3 (30.0%) |
| 35 to 39 Minutes | 0 (0.0%) | 3 (30.0%) |
| 40 to 44 Minutes | 0 (0.0%) | 0 (0.0%) |
| 45 to 59 Minutes | 2 (7.1%) | 0 (0.0%) |
| 60 to 89 Minutes | 5 (17.9%) | 0 (0.0%) |
| 90 or more Minutes | 12 (42.9%) | 0 (0.0%) |
Time of Departure to Work by Sex in Nicasio
The most frequent times of departure to work in Nicasio are 8:00 AM to 8:29 AM (9, 32.1%) for males and 9:00 AM to 9:59 AM (4, 40.0%) for females.
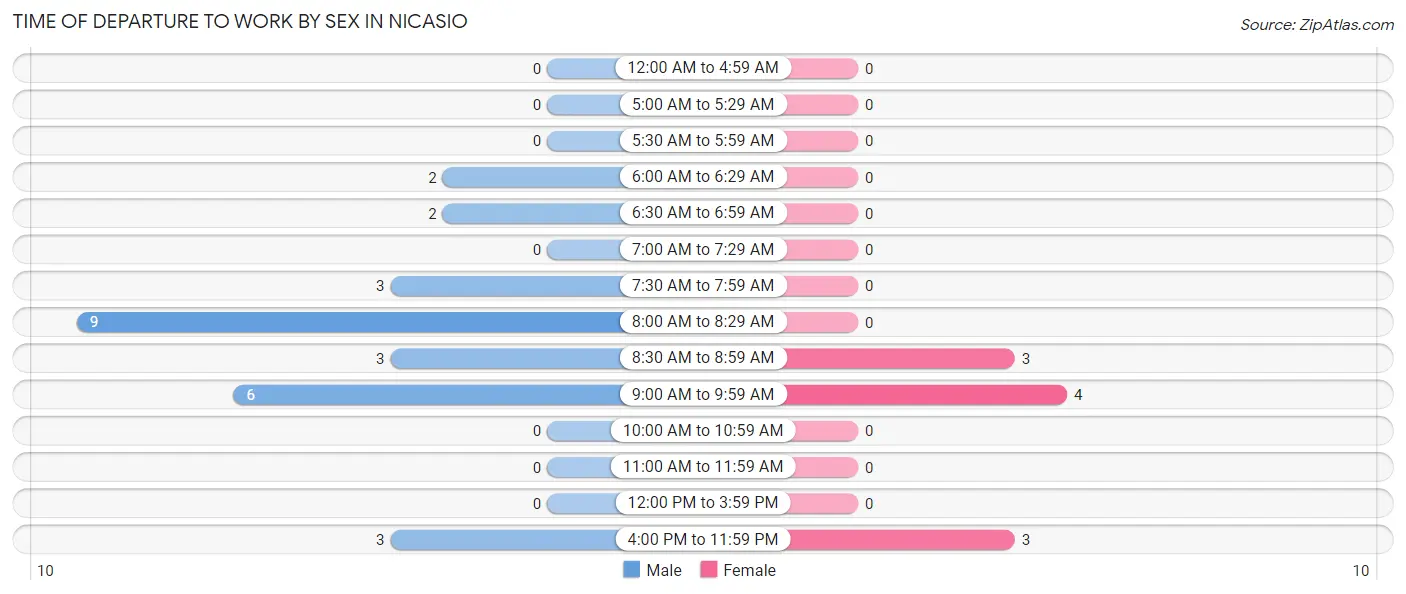
| Time of Departure | Male | Female |
| 12:00 AM to 4:59 AM | 0 (0.0%) | 0 (0.0%) |
| 5:00 AM to 5:29 AM | 0 (0.0%) | 0 (0.0%) |
| 5:30 AM to 5:59 AM | 0 (0.0%) | 0 (0.0%) |
| 6:00 AM to 6:29 AM | 2 (7.1%) | 0 (0.0%) |
| 6:30 AM to 6:59 AM | 2 (7.1%) | 0 (0.0%) |
| 7:00 AM to 7:29 AM | 0 (0.0%) | 0 (0.0%) |
| 7:30 AM to 7:59 AM | 3 (10.7%) | 0 (0.0%) |
| 8:00 AM to 8:29 AM | 9 (32.1%) | 0 (0.0%) |
| 8:30 AM to 8:59 AM | 3 (10.7%) | 3 (30.0%) |
| 9:00 AM to 9:59 AM | 6 (21.4%) | 4 (40.0%) |
| 10:00 AM to 10:59 AM | 0 (0.0%) | 0 (0.0%) |
| 11:00 AM to 11:59 AM | 0 (0.0%) | 0 (0.0%) |
| 12:00 PM to 3:59 PM | 0 (0.0%) | 0 (0.0%) |
| 4:00 PM to 11:59 PM | 3 (10.7%) | 3 (30.0%) |
| Total | 28 (100.0%) | 10 (100.0%) |
Housing Occupancy in Nicasio
Occupancy by Ownership in Nicasio
Of the total 32 dwellings in Nicasio, owner-occupied units account for 29 (90.6%), while renter-occupied units make up 3 (9.4%).
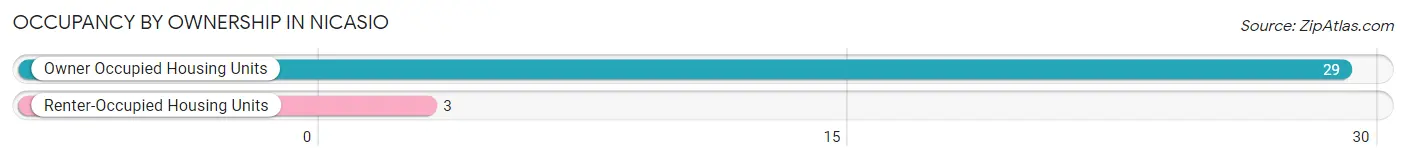
| Occupancy | # Housing Units | % Housing Units |
| Owner Occupied Housing Units | 29 | 90.6% |
| Renter-Occupied Housing Units | 3 | 9.4% |
| Total Occupied Housing Units | 32 | 100.0% |
Occupancy by Household Size in Nicasio
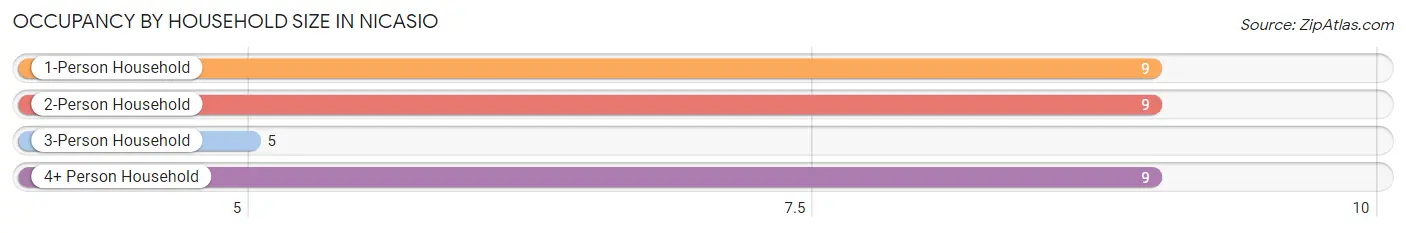
| Household Size | # Housing Units | % Housing Units |
| 1-Person Household | 9 | 28.1% |
| 2-Person Household | 9 | 28.1% |
| 3-Person Household | 5 | 15.6% |
| 4+ Person Household | 9 | 28.1% |
| Total Housing Units | 32 | 100.0% |
Occupancy by Ownership by Household Size in Nicasio
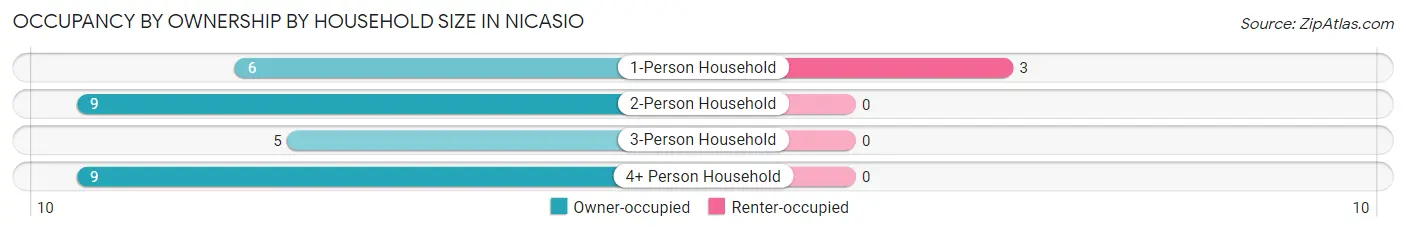
| Household Size | Owner-occupied | Renter-occupied |
| 1-Person Household | 6 (66.7%) | 3 (33.3%) |
| 2-Person Household | 9 (100.0%) | 0 (0.0%) |
| 3-Person Household | 5 (100.0%) | 0 (0.0%) |
| 4+ Person Household | 9 (100.0%) | 0 (0.0%) |
| Total Housing Units | 29 (90.6%) | 3 (9.4%) |
Occupancy by Educational Attainment in Nicasio
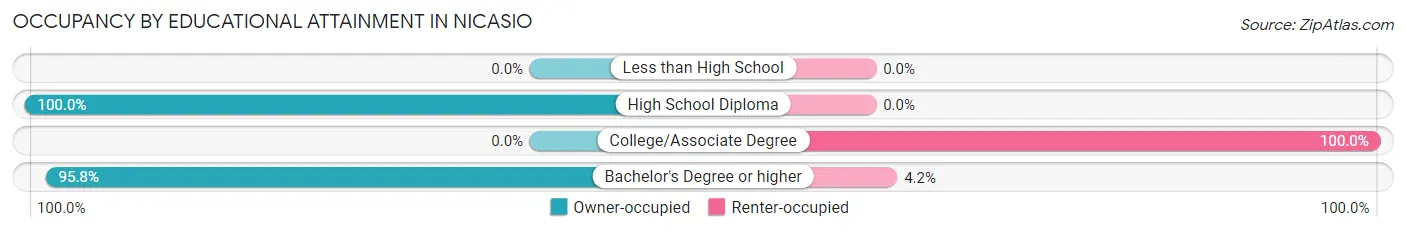
| Household Size | Owner-occupied | Renter-occupied |
| Less than High School | 0 (0.0%) | 0 (0.0%) |
| High School Diploma | 6 (100.0%) | 0 (0.0%) |
| College/Associate Degree | 0 (0.0%) | 2 (100.0%) |
| Bachelor's Degree or higher | 23 (95.8%) | 1 (4.2%) |
Occupancy by Age of Householder in Nicasio
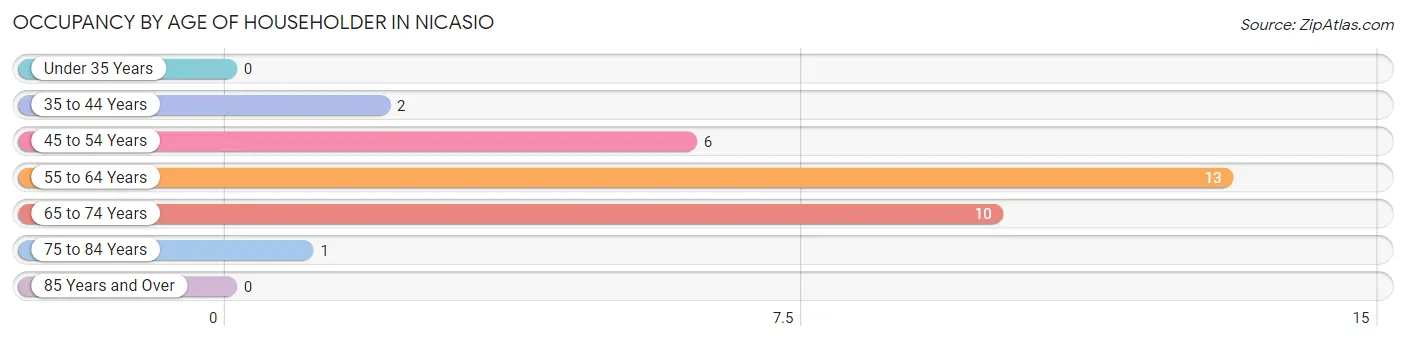
| Age Bracket | # Households | % Households |
| Under 35 Years | 0 | 0.0% |
| 35 to 44 Years | 2 | 6.2% |
| 45 to 54 Years | 6 | 18.8% |
| 55 to 64 Years | 13 | 40.6% |
| 65 to 74 Years | 10 | 31.2% |
| 75 to 84 Years | 1 | 3.1% |
| 85 Years and Over | 0 | 0.0% |
| Total | 32 | 100.0% |
Housing Finances in Nicasio
Median Income by Occupancy in Nicasio
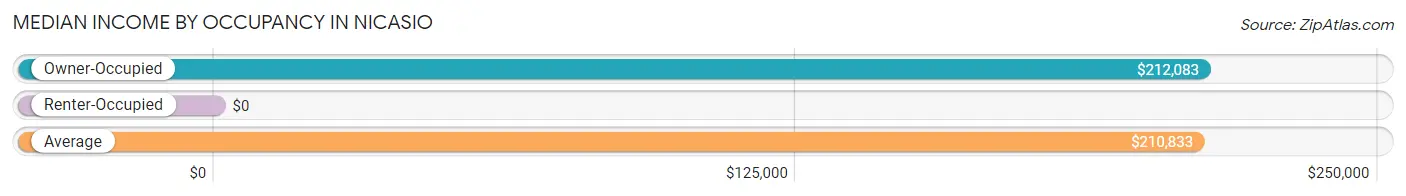
| Occupancy Type | # Households | Median Income |
| Owner-Occupied | 29 (90.6%) | $212,083 |
| Renter-Occupied | 3 (9.4%) | $0 |
| Average | 32 (100.0%) | $210,833 |
Occupancy by Householder Income Bracket in Nicasio
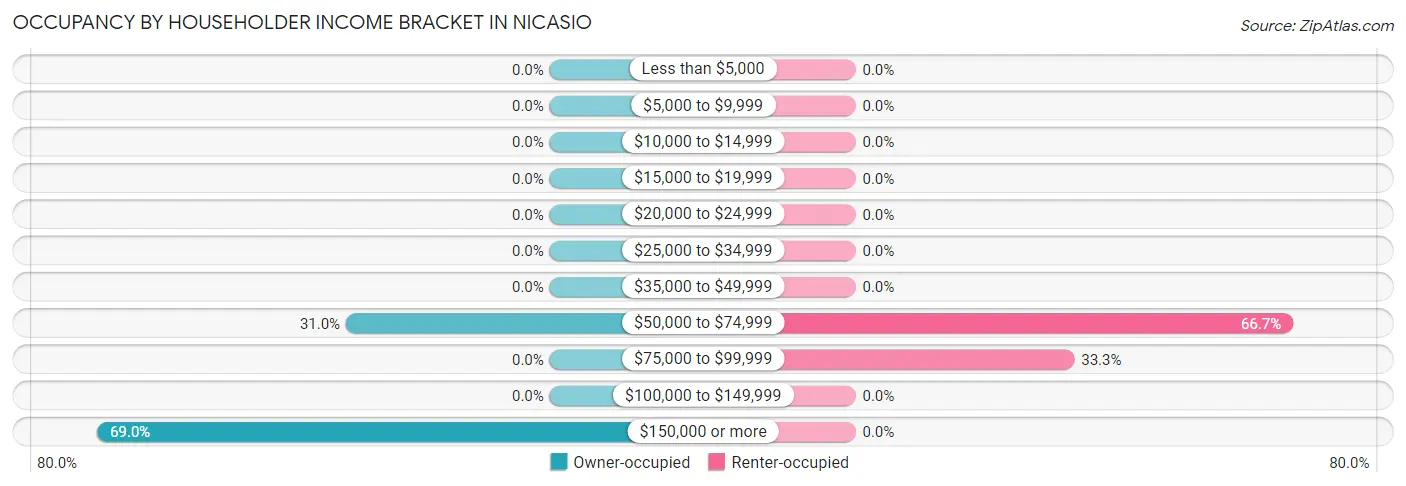
| Income Bracket | Owner-occupied | Renter-occupied |
| Less than $5,000 | 0 (0.0%) | 0 (0.0%) |
| $5,000 to $9,999 | 0 (0.0%) | 0 (0.0%) |
| $10,000 to $14,999 | 0 (0.0%) | 0 (0.0%) |
| $15,000 to $19,999 | 0 (0.0%) | 0 (0.0%) |
| $20,000 to $24,999 | 0 (0.0%) | 0 (0.0%) |
| $25,000 to $34,999 | 0 (0.0%) | 0 (0.0%) |
| $35,000 to $49,999 | 0 (0.0%) | 0 (0.0%) |
| $50,000 to $74,999 | 9 (31.0%) | 2 (66.7%) |
| $75,000 to $99,999 | 0 (0.0%) | 1 (33.3%) |
| $100,000 to $149,999 | 0 (0.0%) | 0 (0.0%) |
| $150,000 or more | 20 (69.0%) | 0 (0.0%) |
| Total | 29 (100.0%) | 3 (100.0%) |
Monthly Housing Cost Tiers in Nicasio
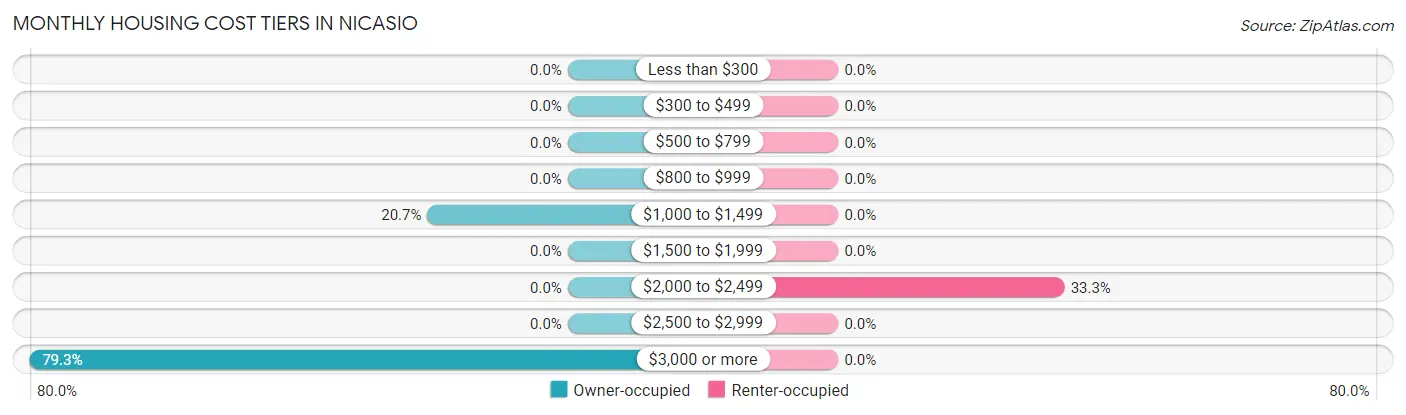
| Monthly Cost | Owner-occupied | Renter-occupied |
| Less than $300 | 0 (0.0%) | 0 (0.0%) |
| $300 to $499 | 0 (0.0%) | 0 (0.0%) |
| $500 to $799 | 0 (0.0%) | 0 (0.0%) |
| $800 to $999 | 0 (0.0%) | 0 (0.0%) |
| $1,000 to $1,499 | 6 (20.7%) | 0 (0.0%) |
| $1,500 to $1,999 | 0 (0.0%) | 0 (0.0%) |
| $2,000 to $2,499 | 0 (0.0%) | 1 (33.3%) |
| $2,500 to $2,999 | 0 (0.0%) | 0 (0.0%) |
| $3,000 or more | 23 (79.3%) | 0 (0.0%) |
| Total | 29 (100.0%) | 3 (100.0%) |
Physical Housing Characteristics in Nicasio
Housing Structures in Nicasio
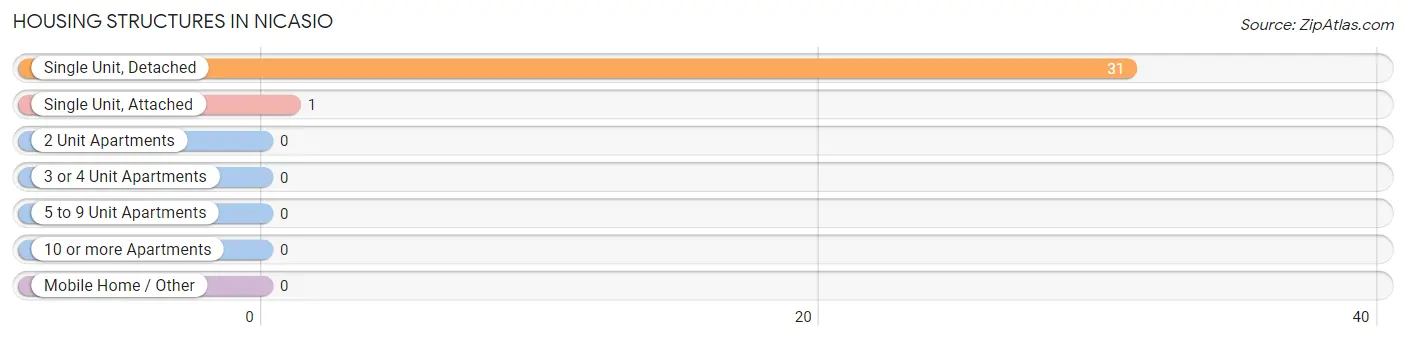
| Structure Type | # Housing Units | % Housing Units |
| Single Unit, Detached | 31 | 96.9% |
| Single Unit, Attached | 1 | 3.1% |
| 2 Unit Apartments | 0 | 0.0% |
| 3 or 4 Unit Apartments | 0 | 0.0% |
| 5 to 9 Unit Apartments | 0 | 0.0% |
| 10 or more Apartments | 0 | 0.0% |
| Mobile Home / Other | 0 | 0.0% |
| Total | 32 | 100.0% |
Housing Structures by Occupancy in Nicasio
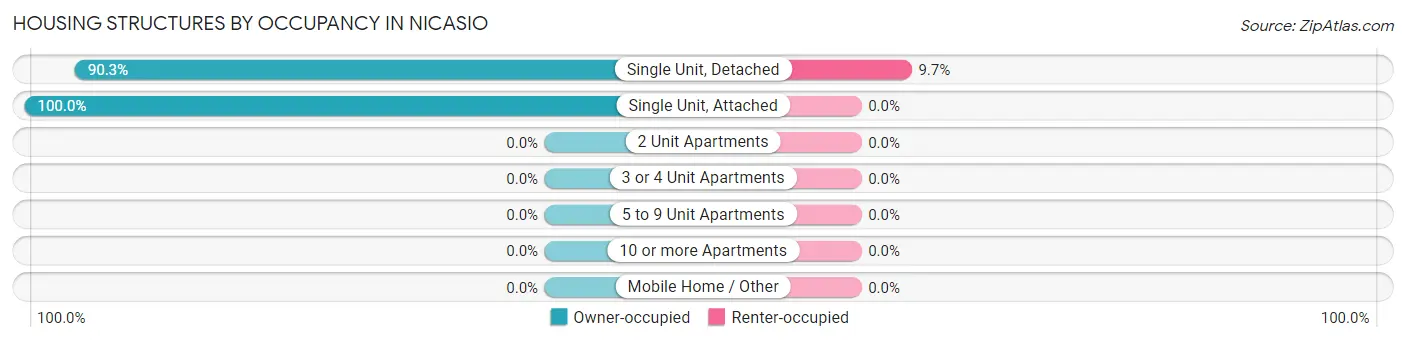
| Structure Type | Owner-occupied | Renter-occupied |
| Single Unit, Detached | 28 (90.3%) | 3 (9.7%) |
| Single Unit, Attached | 1 (100.0%) | 0 (0.0%) |
| 2 Unit Apartments | 0 (0.0%) | 0 (0.0%) |
| 3 or 4 Unit Apartments | 0 (0.0%) | 0 (0.0%) |
| 5 to 9 Unit Apartments | 0 (0.0%) | 0 (0.0%) |
| 10 or more Apartments | 0 (0.0%) | 0 (0.0%) |
| Mobile Home / Other | 0 (0.0%) | 0 (0.0%) |
| Total | 29 (90.6%) | 3 (9.4%) |
Housing Structures by Number of Rooms in Nicasio
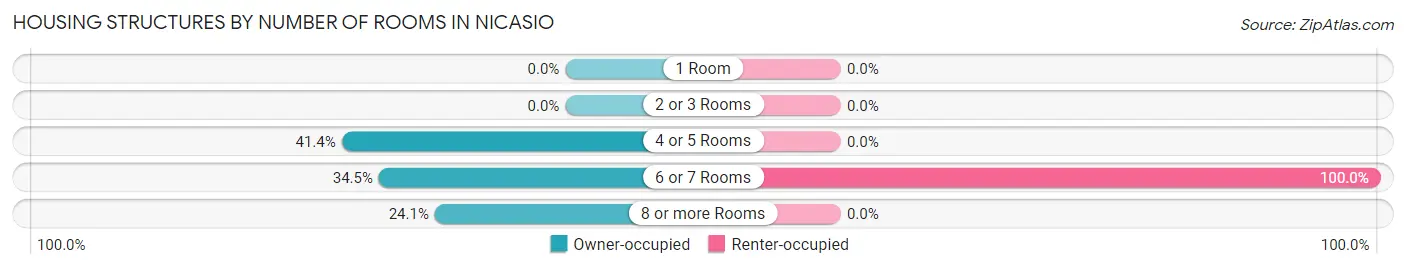
| Number of Rooms | Owner-occupied | Renter-occupied |
| 1 Room | 0 (0.0%) | 0 (0.0%) |
| 2 or 3 Rooms | 0 (0.0%) | 0 (0.0%) |
| 4 or 5 Rooms | 12 (41.4%) | 0 (0.0%) |
| 6 or 7 Rooms | 10 (34.5%) | 3 (100.0%) |
| 8 or more Rooms | 7 (24.1%) | 0 (0.0%) |
| Total | 29 (100.0%) | 3 (100.0%) |
Housing Structure by Heating Type in Nicasio
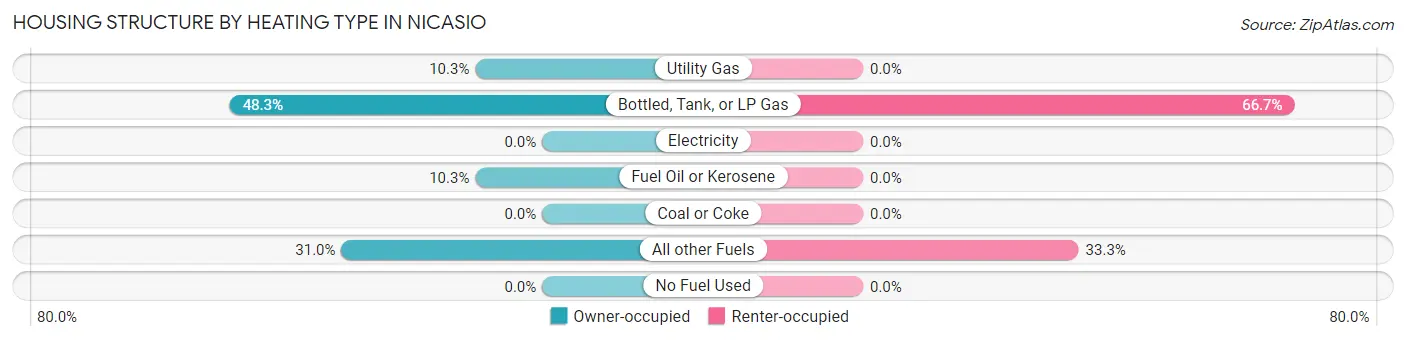
| Heating Type | Owner-occupied | Renter-occupied |
| Utility Gas | 3 (10.3%) | 0 (0.0%) |
| Bottled, Tank, or LP Gas | 14 (48.3%) | 2 (66.7%) |
| Electricity | 0 (0.0%) | 0 (0.0%) |
| Fuel Oil or Kerosene | 3 (10.3%) | 0 (0.0%) |
| Coal or Coke | 0 (0.0%) | 0 (0.0%) |
| All other Fuels | 9 (31.0%) | 1 (33.3%) |
| No Fuel Used | 0 (0.0%) | 0 (0.0%) |
| Total | 29 (100.0%) | 3 (100.0%) |
Household Vehicle Usage in Nicasio
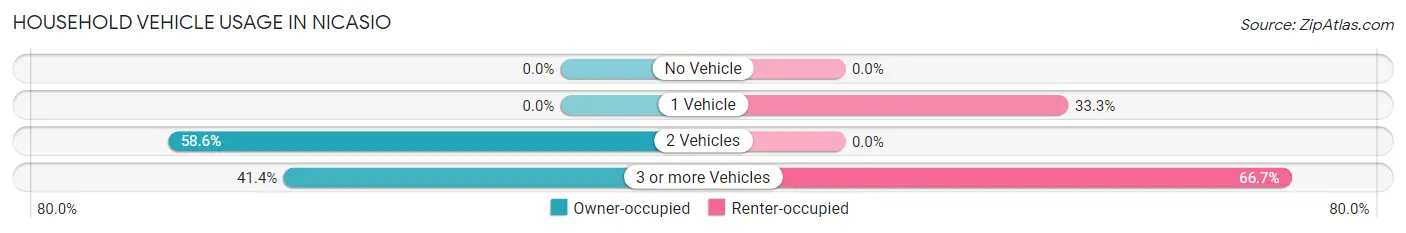
| Vehicles per Household | Owner-occupied | Renter-occupied |
| No Vehicle | 0 (0.0%) | 0 (0.0%) |
| 1 Vehicle | 0 (0.0%) | 1 (33.3%) |
| 2 Vehicles | 17 (58.6%) | 0 (0.0%) |
| 3 or more Vehicles | 12 (41.4%) | 2 (66.7%) |
| Total | 29 (100.0%) | 3 (100.0%) |
Real Estate & Mortgages in Nicasio
Real Estate and Mortgage Overview in Nicasio
| Characteristic | Without Mortgage | With Mortgage |
| Housing Units | 12 | 17 |
| Median Property Value | - | - |
| Median Household Income | - | - |
| Monthly Housing Costs | $1,500 | $17 |
| Real Estate Taxes | $10,001 | $0 |
Property Value by Mortgage Status in Nicasio
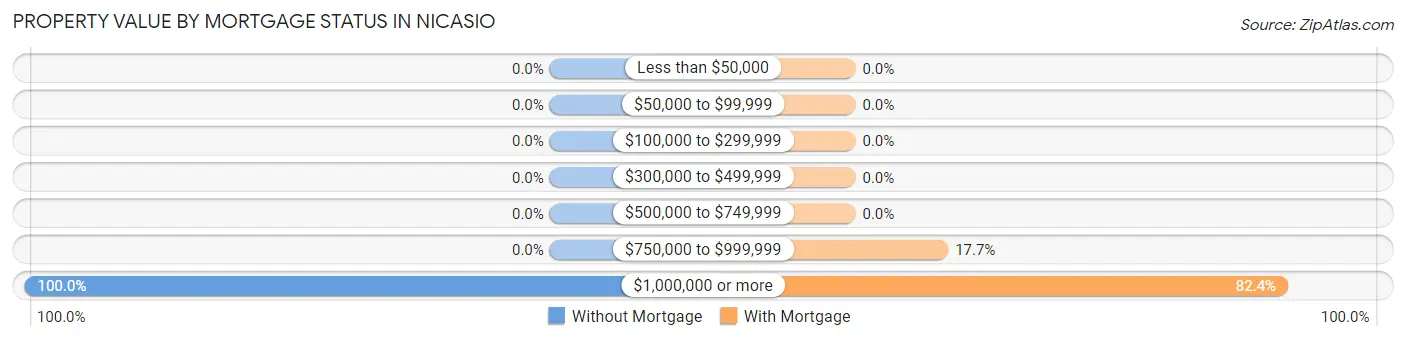
| Property Value | Without Mortgage | With Mortgage |
| Less than $50,000 | 0 (0.0%) | 0 (0.0%) |
| $50,000 to $99,999 | 0 (0.0%) | 0 (0.0%) |
| $100,000 to $299,999 | 0 (0.0%) | 0 (0.0%) |
| $300,000 to $499,999 | 0 (0.0%) | 0 (0.0%) |
| $500,000 to $749,999 | 0 (0.0%) | 0 (0.0%) |
| $750,000 to $999,999 | 0 (0.0%) | 3 (17.6%) |
| $1,000,000 or more | 12 (100.0%) | 14 (82.4%) |
| Total | 12 (100.0%) | 17 (100.0%) |
Household Income by Mortgage Status in Nicasio
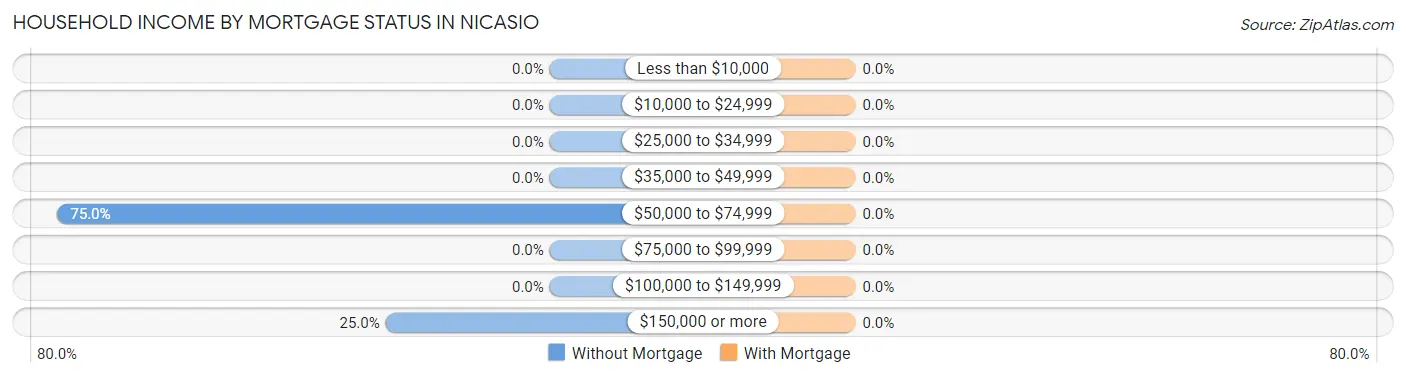
| Household Income | Without Mortgage | With Mortgage |
| Less than $10,000 | 0 (0.0%) | 0 (0.0%) |
| $10,000 to $24,999 | 0 (0.0%) | 0 (0.0%) |
| $25,000 to $34,999 | 0 (0.0%) | 0 (0.0%) |
| $35,000 to $49,999 | 0 (0.0%) | 0 (0.0%) |
| $50,000 to $74,999 | 9 (75.0%) | 0 (0.0%) |
| $75,000 to $99,999 | 0 (0.0%) | 0 (0.0%) |
| $100,000 to $149,999 | 0 (0.0%) | 0 (0.0%) |
| $150,000 or more | 3 (25.0%) | 0 (0.0%) |
| Total | 12 (100.0%) | 17 (100.0%) |
Property Value to Household Income Ratio in Nicasio
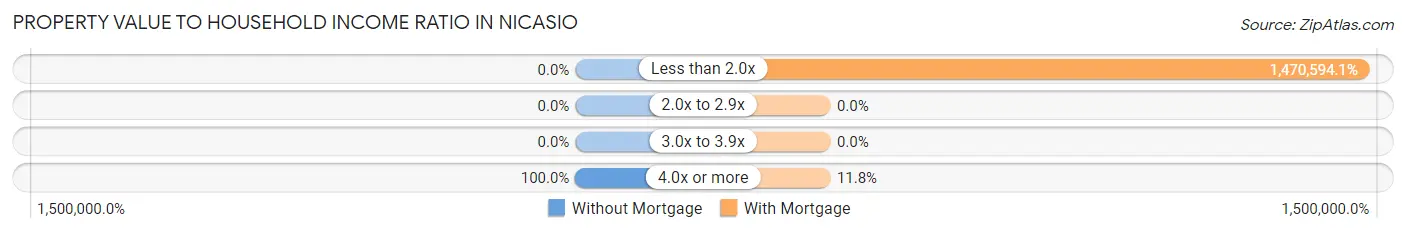
| Value-to-Income Ratio | Without Mortgage | With Mortgage |
| Less than 2.0x | 0 (0.0%) | 250,001 (1,470,594.1%) |
| 2.0x to 2.9x | 0 (0.0%) | 0 (0.0%) |
| 3.0x to 3.9x | 0 (0.0%) | 0 (0.0%) |
| 4.0x or more | 12 (100.0%) | 2 (11.8%) |
| Total | 12 (100.0%) | 17 (100.0%) |
Real Estate Taxes by Mortgage Status in Nicasio
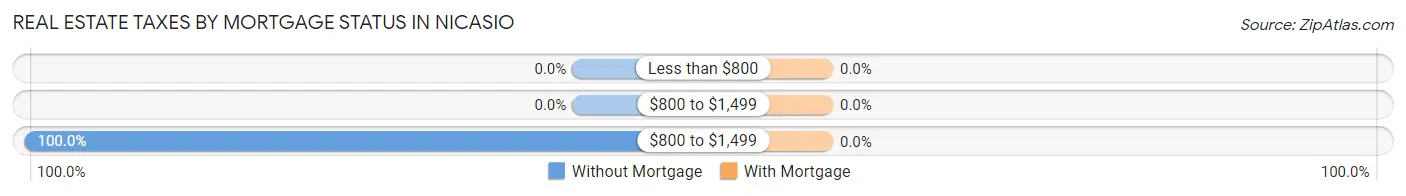
| Property Taxes | Without Mortgage | With Mortgage |
| Less than $800 | 0 (0.0%) | 0 (0.0%) |
| $800 to $1,499 | 0 (0.0%) | 0 (0.0%) |
| $800 to $1,499 | 12 (100.0%) | 0 (0.0%) |
| Total | 12 (100.0%) | 17 (100.0%) |
Health & Disability in Nicasio
Health Insurance Coverage by Age in Nicasio
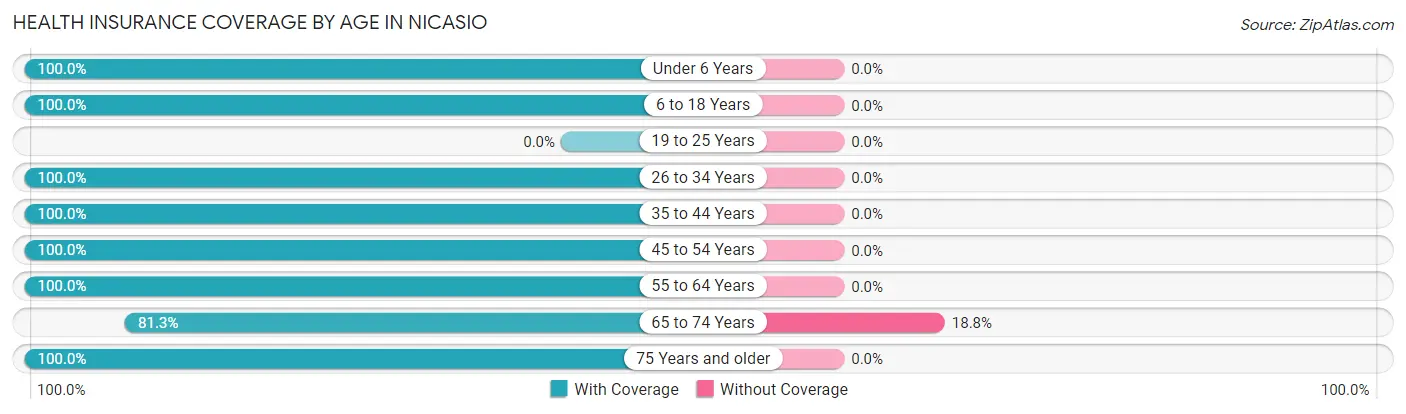
| Age Bracket | With Coverage | Without Coverage |
| Under 6 Years | 2 (100.0%) | 0 (0.0%) |
| 6 to 18 Years | 19 (100.0%) | 0 (0.0%) |
| 19 to 25 Years | 0 (0.0%) | 0 (0.0%) |
| 26 to 34 Years | 2 (100.0%) | 0 (0.0%) |
| 35 to 44 Years | 4 (100.0%) | 0 (0.0%) |
| 45 to 54 Years | 11 (100.0%) | 0 (0.0%) |
| 55 to 64 Years | 27 (100.0%) | 0 (0.0%) |
| 65 to 74 Years | 13 (81.2%) | 3 (18.8%) |
| 75 Years and older | 2 (100.0%) | 0 (0.0%) |
| Total | 80 (96.4%) | 3 (3.6%) |
Health Insurance Coverage by Citizenship Status in Nicasio
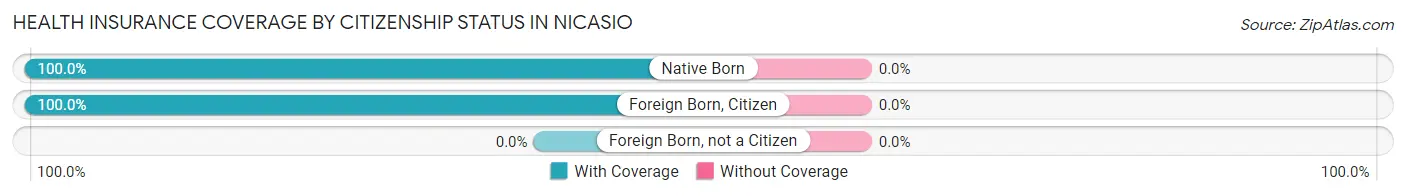
| Citizenship Status | With Coverage | Without Coverage |
| Native Born | 2 (100.0%) | 0 (0.0%) |
| Foreign Born, Citizen | 19 (100.0%) | 0 (0.0%) |
| Foreign Born, not a Citizen | 0 (0.0%) | 0 (0.0%) |
Health Insurance Coverage by Household Income in Nicasio
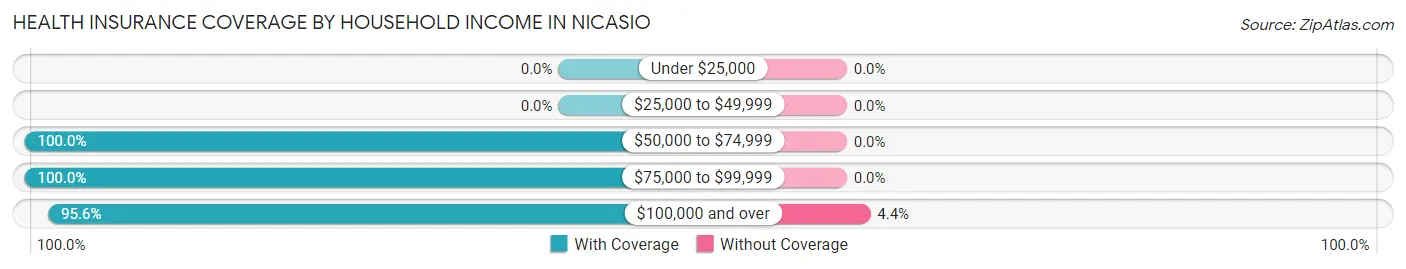
| Household Income | With Coverage | Without Coverage |
| Under $25,000 | 0 (0.0%) | 0 (0.0%) |
| $25,000 to $49,999 | 0 (0.0%) | 0 (0.0%) |
| $50,000 to $74,999 | 14 (100.0%) | 0 (0.0%) |
| $75,000 to $99,999 | 1 (100.0%) | 0 (0.0%) |
| $100,000 and over | 65 (95.6%) | 3 (4.4%) |
Public vs Private Health Insurance Coverage by Age in Nicasio
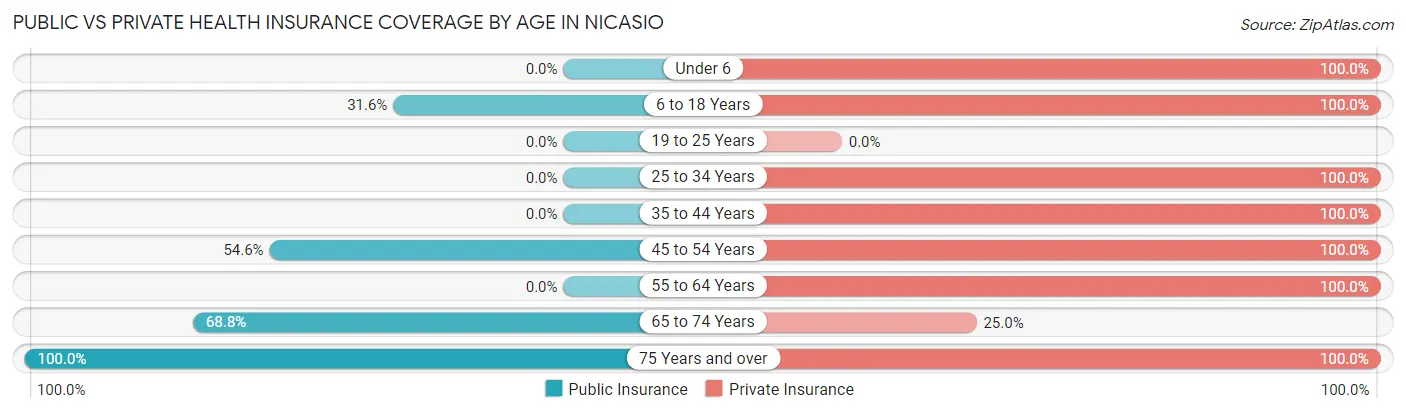
| Age Bracket | Public Insurance | Private Insurance |
| Under 6 | 0 (0.0%) | 2 (100.0%) |
| 6 to 18 Years | 6 (31.6%) | 19 (100.0%) |
| 19 to 25 Years | 0 (0.0%) | 0 (0.0%) |
| 25 to 34 Years | 0 (0.0%) | 2 (100.0%) |
| 35 to 44 Years | 0 (0.0%) | 4 (100.0%) |
| 45 to 54 Years | 6 (54.5%) | 11 (100.0%) |
| 55 to 64 Years | 0 (0.0%) | 27 (100.0%) |
| 65 to 74 Years | 11 (68.8%) | 4 (25.0%) |
| 75 Years and over | 2 (100.0%) | 2 (100.0%) |
| Total | 25 (30.1%) | 71 (85.5%) |
Disability Status by Sex by Age in Nicasio
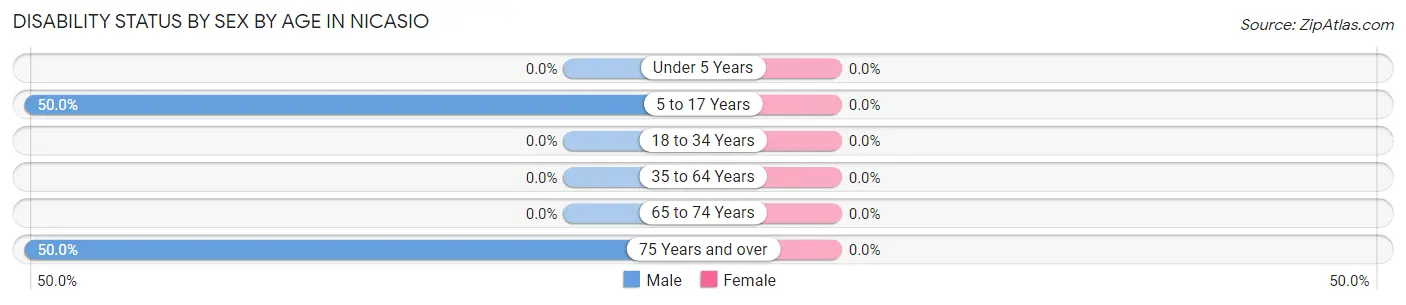
| Age Bracket | Male | Female |
| Under 5 Years | 0 (0.0%) | 0 (0.0%) |
| 5 to 17 Years | 3 (50.0%) | 0 (0.0%) |
| 18 to 34 Years | 0 (0.0%) | 0 (0.0%) |
| 35 to 64 Years | 0 (0.0%) | 0 (0.0%) |
| 65 to 74 Years | 0 (0.0%) | 0 (0.0%) |
| 75 Years and over | 1 (50.0%) | 0 (0.0%) |
Disability Class by Sex by Age in Nicasio
Disability Class: Hearing Difficulty
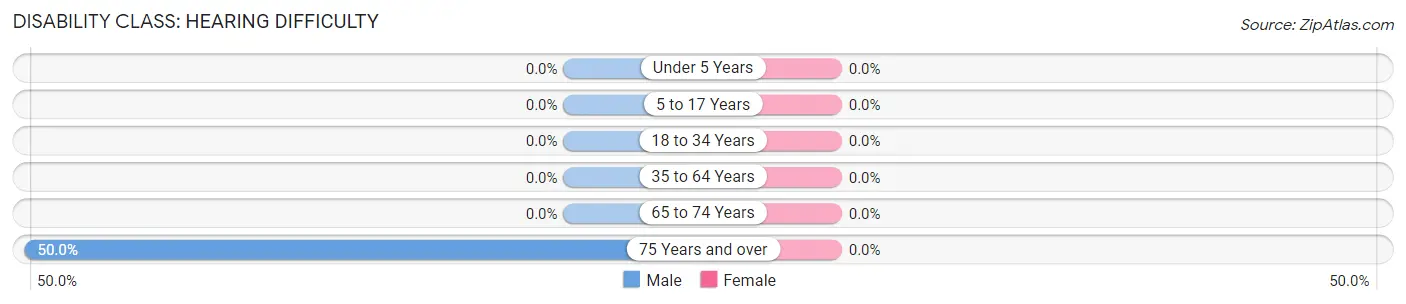
| Age Bracket | Male | Female |
| Under 5 Years | 0 (0.0%) | 0 (0.0%) |
| 5 to 17 Years | 0 (0.0%) | 0 (0.0%) |
| 18 to 34 Years | 0 (0.0%) | 0 (0.0%) |
| 35 to 64 Years | 0 (0.0%) | 0 (0.0%) |
| 65 to 74 Years | 0 (0.0%) | 0 (0.0%) |
| 75 Years and over | 1 (50.0%) | 0 (0.0%) |
Disability Class: Vision Difficulty
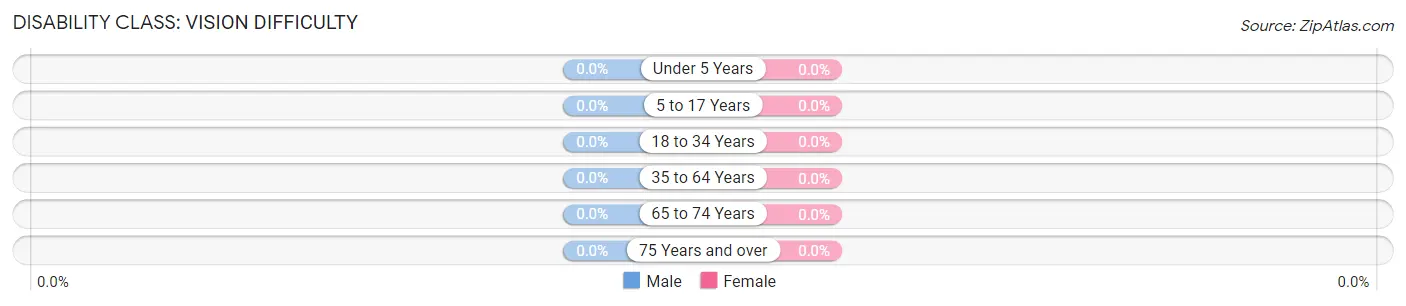
| Age Bracket | Male | Female |
| Under 5 Years | 0 (0.0%) | 0 (0.0%) |
| 5 to 17 Years | 0 (0.0%) | 0 (0.0%) |
| 18 to 34 Years | 0 (0.0%) | 0 (0.0%) |
| 35 to 64 Years | 0 (0.0%) | 0 (0.0%) |
| 65 to 74 Years | 0 (0.0%) | 0 (0.0%) |
| 75 Years and over | 0 (0.0%) | 0 (0.0%) |
Disability Class: Cognitive Difficulty
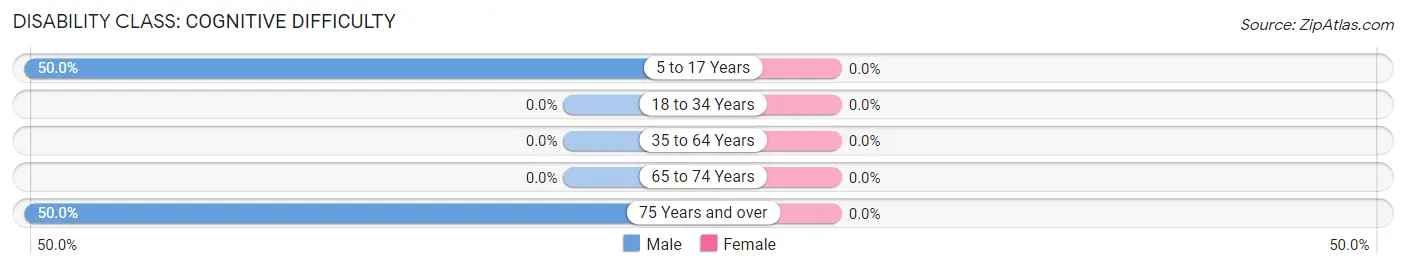
| Age Bracket | Male | Female |
| 5 to 17 Years | 3 (50.0%) | 0 (0.0%) |
| 18 to 34 Years | 0 (0.0%) | 0 (0.0%) |
| 35 to 64 Years | 0 (0.0%) | 0 (0.0%) |
| 65 to 74 Years | 0 (0.0%) | 0 (0.0%) |
| 75 Years and over | 1 (50.0%) | 0 (0.0%) |
Disability Class: Ambulatory Difficulty
| Age Bracket | Male | Female |
| 5 to 17 Years | 0 (0.0%) | 0 (0.0%) |
| 18 to 34 Years | 0 (0.0%) | 0 (0.0%) |
| 35 to 64 Years | 0 (0.0%) | 0 (0.0%) |
| 65 to 74 Years | 0 (0.0%) | 0 (0.0%) |
| 75 Years and over | 0 (0.0%) | 0 (0.0%) |
Disability Class: Self-Care Difficulty
| Age Bracket | Male | Female |
| 5 to 17 Years | 0 (0.0%) | 0 (0.0%) |
| 18 to 34 Years | 0 (0.0%) | 0 (0.0%) |
| 35 to 64 Years | 0 (0.0%) | 0 (0.0%) |
| 65 to 74 Years | 0 (0.0%) | 0 (0.0%) |
| 75 Years and over | 0 (0.0%) | 0 (0.0%) |
Technology Access in Nicasio
Computing Device Access in Nicasio
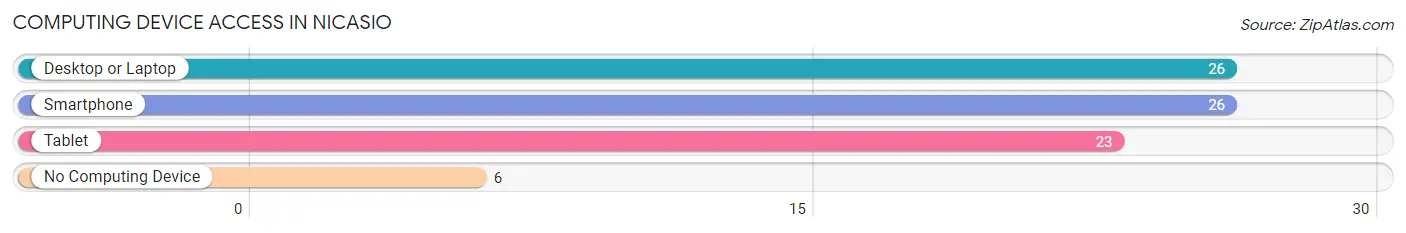
| Device Type | # Households | % Households |
| Desktop or Laptop | 26 | 81.2% |
| Smartphone | 26 | 81.2% |
| Tablet | 23 | 71.9% |
| No Computing Device | 6 | 18.8% |
| Total | 32 | 100.0% |
Internet Access in Nicasio
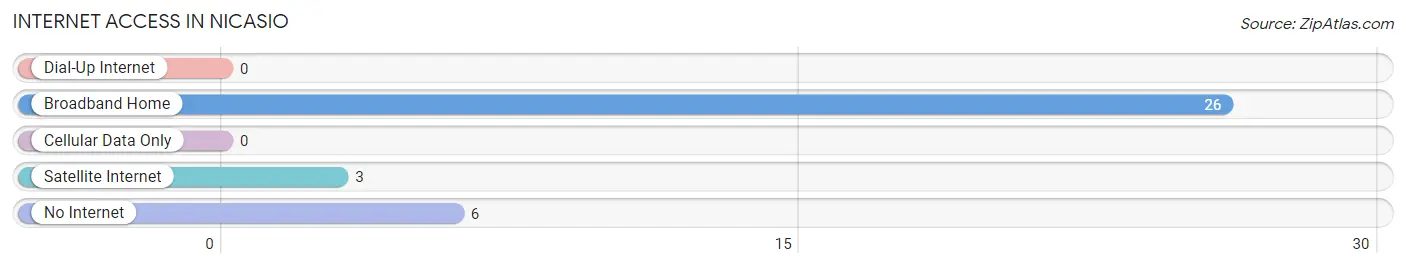
| Internet Type | # Households | % Households |
| Dial-Up Internet | 0 | 0.0% |
| Broadband Home | 26 | 81.2% |
| Cellular Data Only | 0 | 0.0% |
| Satellite Internet | 3 | 9.4% |
| No Internet | 6 | 18.8% |
| Total | 32 | 100.0% |
Nicasio Summary
Nestled in the rolling hills of Marin County, California, the small town of Nicasio is a rural community with a rich history and a unique culture. Located just 30 miles north of San Francisco, Nicasio is a picturesque town with a population of just over 1,000 people. The town is known for its rolling hills, lush green pastures, and stunning views of the Pacific Ocean.
Geography
Nicasio is located in the western part of Marin County, California, about 30 miles north of San Francisco. The town is situated in the rolling hills of the Marin Hills, which are part of the Coast Range. The town is surrounded by lush green pastures and rolling hills, with stunning views of the Pacific Ocean. The town is located at an elevation of about 500 feet, and the climate is mild and temperate.
History
Nicasio was originally inhabited by the Coast Miwok Native Americans, who lived in the area for thousands of years. The first European settlers arrived in the area in the mid-1800s, and the town was officially founded in 1867. The town was named after the Miwok chief, Nicasio, who was a leader of the local tribe.
The town was originally a small farming community, and the main crops were wheat, barley, and oats. In the early 1900s, the town began to grow and develop, and the population increased. The town was also home to a number of small businesses, including a general store, a blacksmith, and a post office.
Economy
Nicasio is a small rural community, and the economy is largely based on agriculture. The town is home to a number of small farms, which produce a variety of crops, including wheat, barley, oats, and hay. The town is also home to a number of small businesses, including a general store, a blacksmith, and a post office.
Demographics
As of the 2010 census, the population of Nicasio was 1,068. The racial makeup of the town was 94.3% White, 0.7% African American, 0.3% Native American, 0.7% Asian, 0.1% Pacific Islander, 1.2% from other races, and 2.1% from two or more races. The median household income was $90,000, and the median family income was $103,000.
Conclusion
Nicasio is a small rural town in Marin County, California, with a population of just over 1,000 people. The town is known for its rolling hills, lush green pastures, and stunning views of the Pacific Ocean. The economy is largely based on agriculture, and the town is home to a number of small businesses. The population is mostly White, with a small percentage of African American, Native American, Asian, and Pacific Islander residents.
Common Questions
What is Per Capita Income in Nicasio?
Per Capita income in Nicasio is $148,741.
What is the Median Family Income in Nicasio?
Median Family Income in Nicasio is $250,001.
What is the Median Household income in Nicasio?
Median Household Income in Nicasio is $210,833.
What is Inequality or Gini Index in Nicasio?
Inequality or Gini Index in Nicasio is 0.61.
What is the Total Population of Nicasio?
Total Population of Nicasio is 83.
What is the Total Male Population of Nicasio?
Total Male Population of Nicasio is 49.
What is the Total Female Population of Nicasio?
Total Female Population of Nicasio is 34.
What is the Ratio of Males per 100 Females in Nicasio?
There are 144.12 Males per 100 Females in Nicasio.
What is the Ratio of Females per 100 Males in Nicasio?
There are 69.39 Females per 100 Males in Nicasio.
What is the Median Population Age in Nicasio?
Median Population Age in Nicasio is 56.5 Years.
What is the Average Family Size in Nicasio
Average Family Size in Nicasio is 3.0 People.
What is the Average Household Size in Nicasio
Average Household Size in Nicasio is 2.6 People.
How Large is the Labor Force in Nicasio?
There are 54 People in the Labor Forcein in Nicasio.
What is the Percentage of People in the Labor Force in Nicasio?
73.0% of People are in the Labor Force in Nicasio.
What is the Unemployment Rate in Nicasio?
Unemployment Rate in Nicasio is 7.4%.