Nevada City, CA Map & Demographics
Nevada City Map
Nevada City Overview
$47,936
PER CAPITA INCOME
$73,750
AVG FAMILY INCOME
$65,032
AVG HOUSEHOLD INCOME
32.0%
WAGE / INCOME GAP [ % ]
68.0¢/ $1
WAGE / INCOME GAP [ $ ]
0.46
INEQUALITY / GINI INDEX
3,142
TOTAL POPULATION
1,489
MALE POPULATION
1,653
FEMALE POPULATION
90.08
MALES / 100 FEMALES
111.01
FEMALES / 100 MALES
56.5
MEDIAN AGE
3.0
AVG FAMILY SIZE
2.1
AVG HOUSEHOLD SIZE
1,441
LABOR FORCE [ PEOPLE ]
53.1%
PERCENT IN LABOR FORCE
1.8%
UNEMPLOYMENT RATE
Nevada City Zip Codes
Nevada City Area Codes
Income in Nevada City
Income Overview in Nevada City
Per Capita Income in Nevada City is $47,936, while median incomes of families and households are $73,750 and $65,032 respectively.
| Characteristic | Number | Measure |
| Per Capita Income | 3,142 | $47,936 |
| Median Family Income | 627 | $73,750 |
| Mean Family Income | 627 | $116,635 |
| Median Household Income | 1,373 | $65,032 |
| Mean Household Income | 1,373 | $97,274 |
| Income Deficit | 627 | $0 |
| Wage / Income Gap (%) | 3,142 | 31.97% |
| Wage / Income Gap ($) | 3,142 | 68.03¢ per $1 |
| Gini / Inequality Index | 3,142 | 0.46 |
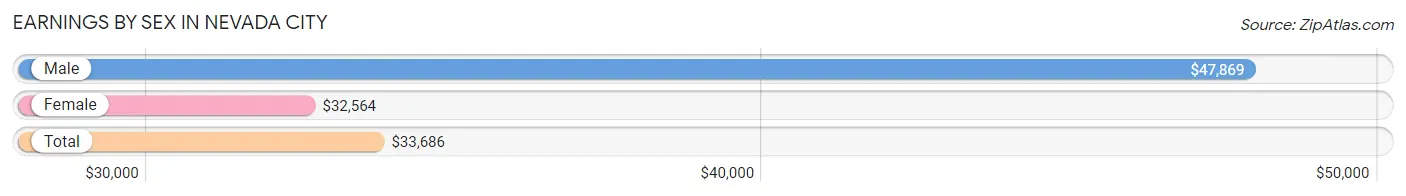
Earnings by Sex in Nevada City
Average Earnings in Nevada City are $33,686, $47,869 for men and $32,564 for women, a difference of 32.0%.
| Sex | Number | Average Earnings |
| Male | 757 (47.4%) | $47,869 |
| Female | 840 (52.6%) | $32,564 |
| Total | 1,597 (100.0%) | $33,686 |
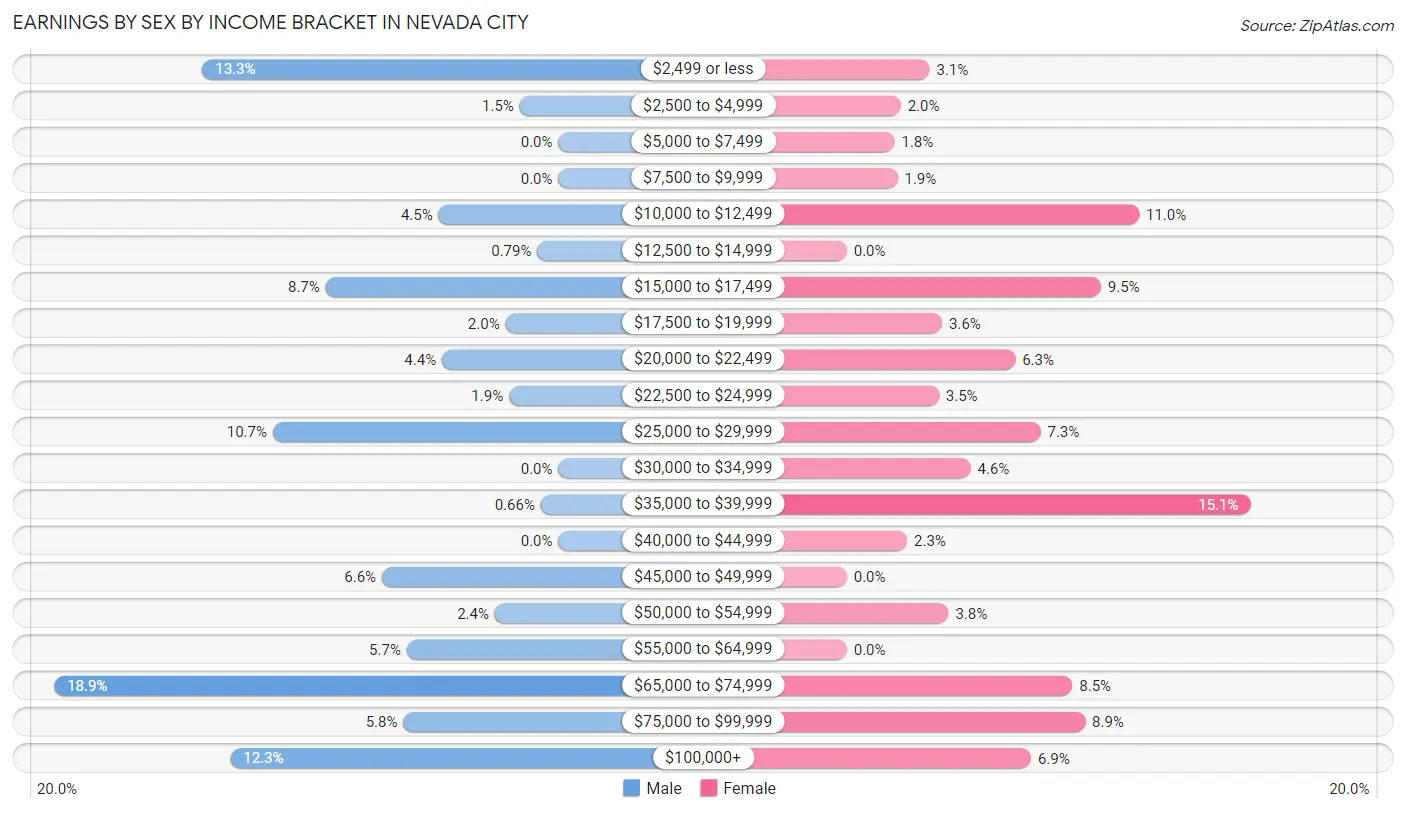
Earnings by Sex by Income Bracket in Nevada City
The most common earnings brackets in Nevada City are $65,000 to $74,999 for men (143 | 18.9%) and $35,000 to $39,999 for women (127 | 15.1%).
| Income | Male | Female |
| $2,499 or less | 101 (13.3%) | 26 (3.1%) |
| $2,500 to $4,999 | 11 (1.5%) | 17 (2.0%) |
| $5,000 to $7,499 | 0 (0.0%) | 15 (1.8%) |
| $7,500 to $9,999 | 0 (0.0%) | 16 (1.9%) |
| $10,000 to $12,499 | 34 (4.5%) | 92 (11.0%) |
| $12,500 to $14,999 | 6 (0.8%) | 0 (0.0%) |
| $15,000 to $17,499 | 66 (8.7%) | 80 (9.5%) |
| $17,500 to $19,999 | 15 (2.0%) | 30 (3.6%) |
| $20,000 to $22,499 | 33 (4.4%) | 53 (6.3%) |
| $22,500 to $24,999 | 14 (1.8%) | 29 (3.5%) |
| $25,000 to $29,999 | 81 (10.7%) | 61 (7.3%) |
| $30,000 to $34,999 | 0 (0.0%) | 39 (4.6%) |
| $35,000 to $39,999 | 5 (0.7%) | 127 (15.1%) |
| $40,000 to $44,999 | 0 (0.0%) | 19 (2.3%) |
| $45,000 to $49,999 | 50 (6.6%) | 0 (0.0%) |
| $50,000 to $54,999 | 18 (2.4%) | 32 (3.8%) |
| $55,000 to $64,999 | 43 (5.7%) | 0 (0.0%) |
| $65,000 to $74,999 | 143 (18.9%) | 71 (8.5%) |
| $75,000 to $99,999 | 44 (5.8%) | 75 (8.9%) |
| $100,000+ | 93 (12.3%) | 58 (6.9%) |
| Total | 757 (100.0%) | 840 (100.0%) |
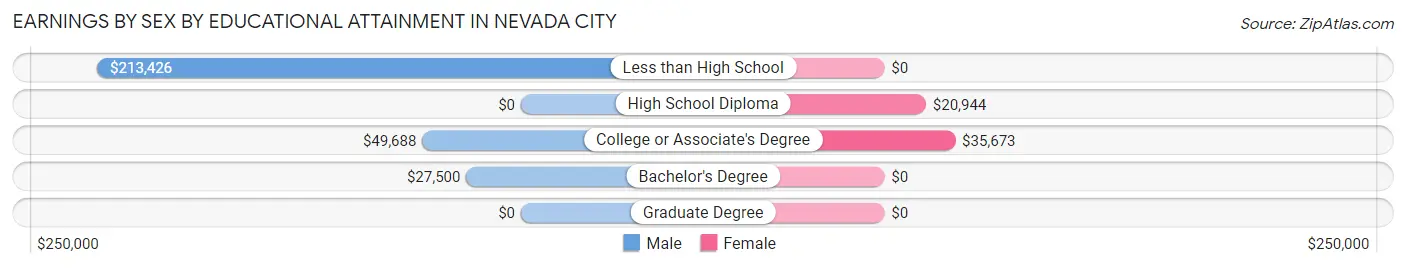
Earnings by Sex by Educational Attainment in Nevada City
Average earnings in Nevada City are $49,091 for men and $35,536 for women, a difference of 27.6%. Men with an educational attainment of less than high school enjoy the highest average annual earnings of $213,426, while those with bachelor's degree education earn the least with $27,500. Women with an educational attainment of college or associate's degree earn the most with the average annual earnings of $35,673, while those with high school diploma education have the smallest earnings of $20,944.
| Educational Attainment | Male Income | Female Income |
| Less than High School | $213,426 | $0 |
| High School Diploma | - | - |
| College or Associate's Degree | $49,688 | $35,673 |
| Bachelor's Degree | $27,500 | $0 |
| Graduate Degree | - | - |
| Total | $49,091 | $35,536 |
Family Income in Nevada City
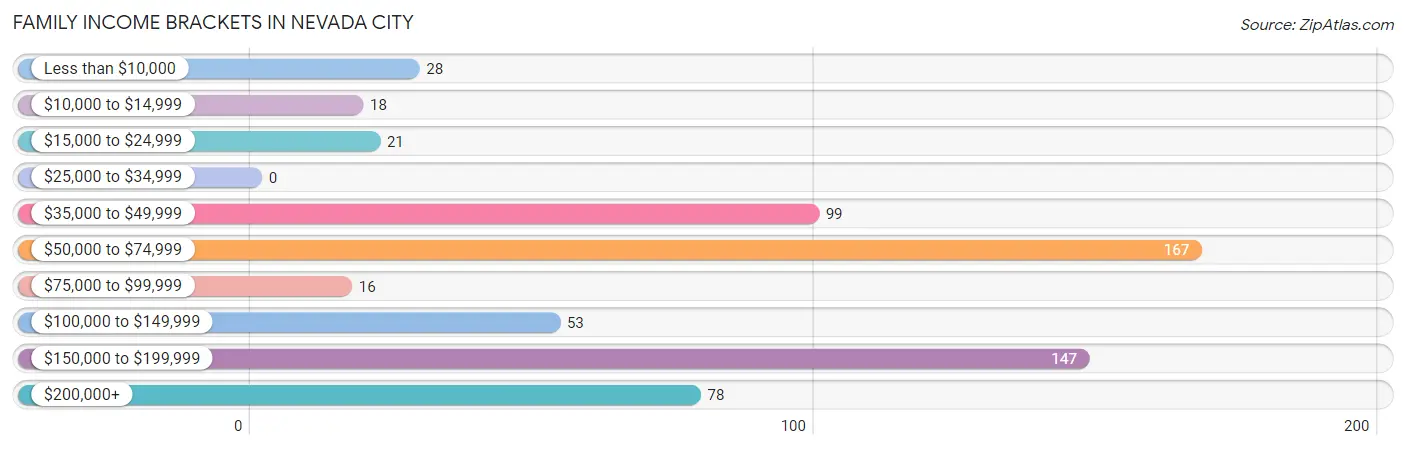
Family Income Brackets in Nevada City
According to the Nevada City family income data, there are 167 families falling into the $50,000 to $74,999 income range, which is the most common income bracket and makes up 26.6% of all families.
| Income Bracket | # Families | % Families |
| Less than $10,000 | 28 | 4.5% |
| $10,000 to $14,999 | 18 | 2.9% |
| $15,000 to $24,999 | 21 | 3.3% |
| $25,000 to $34,999 | 0 | 0.0% |
| $35,000 to $49,999 | 99 | 15.8% |
| $50,000 to $74,999 | 167 | 26.6% |
| $75,000 to $99,999 | 16 | 2.6% |
| $100,000 to $149,999 | 53 | 8.5% |
| $150,000 to $199,999 | 147 | 23.4% |
| $200,000+ | 78 | 12.4% |
Family Income by Famaliy Size in Nevada City
| Income Bracket | # Families | Median Income |
| 2-Person Families | 427 (68.1%) | $0 |
| 3-Person Families | 32 (5.1%) | $0 |
| 4-Person Families | 168 (26.8%) | $0 |
| 5-Person Families | 0 (0.0%) | $0 |
| 6-Person Families | 0 (0.0%) | $0 |
| 7+ Person Families | 0 (0.0%) | $0 |
| Total | 627 (100.0%) | $73,750 |
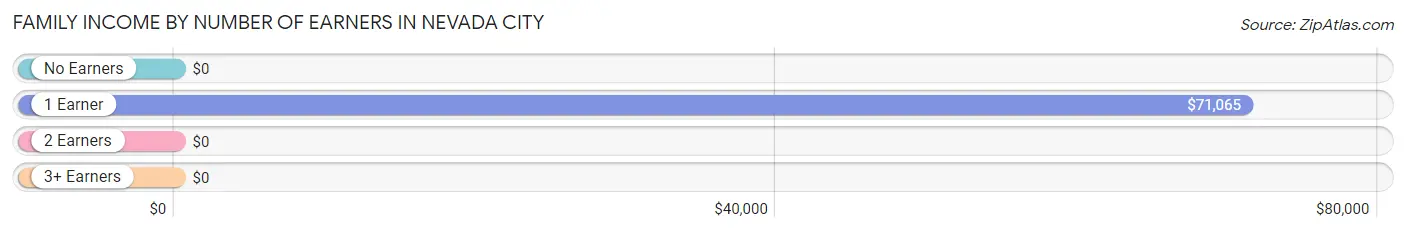
Family Income by Number of Earners in Nevada City
| Number of Earners | # Families | Median Income |
| No Earners | 261 (41.6%) | $0 |
| 1 Earner | 134 (21.4%) | $71,065 |
| 2 Earners | 200 (31.9%) | $0 |
| 3+ Earners | 32 (5.1%) | $0 |
| Total | 627 (100.0%) | $73,750 |
Household Income in Nevada City
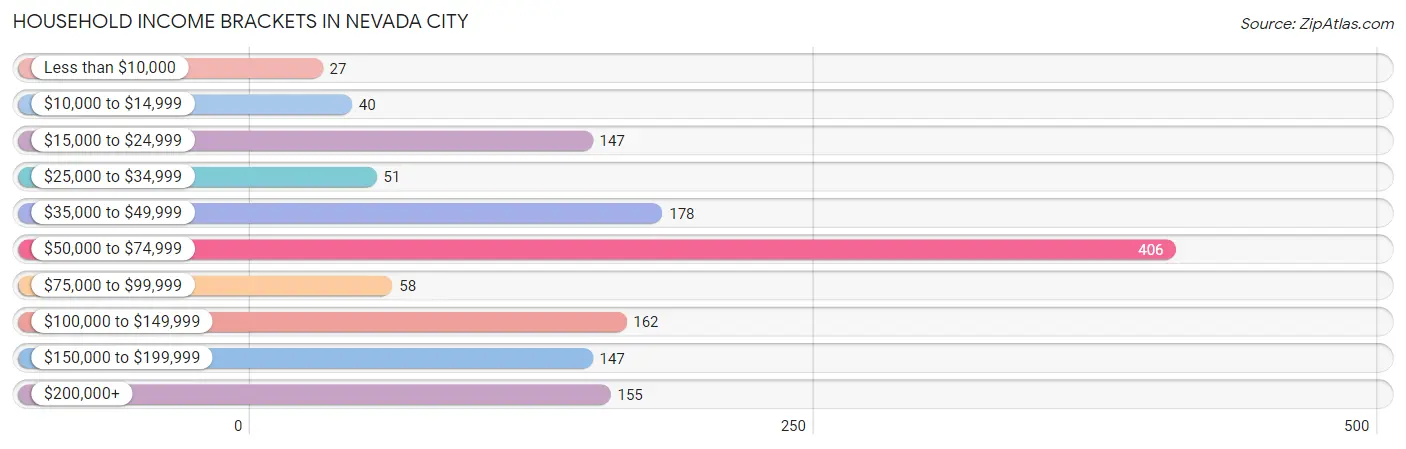
Household Income Brackets in Nevada City
With 406 households falling in the category, the $50,000 to $74,999 income range is the most frequent in Nevada City, accounting for 29.6% of all households. In contrast, only 27 households (2.0%) fall into the less than $10,000 income bracket, making it the least populous group.
| Income Bracket | # Households | % Households |
| Less than $10,000 | 27 | 2.0% |
| $10,000 to $14,999 | 40 | 2.9% |
| $15,000 to $24,999 | 147 | 10.7% |
| $25,000 to $34,999 | 51 | 3.7% |
| $35,000 to $49,999 | 178 | 13.0% |
| $50,000 to $74,999 | 406 | 29.6% |
| $75,000 to $99,999 | 58 | 4.2% |
| $100,000 to $149,999 | 162 | 11.8% |
| $150,000 to $199,999 | 147 | 10.7% |
| $200,000+ | 155 | 11.3% |
Household Income by Householder Age in Nevada City
The median household income in Nevada City is $65,032, with the highest median household income of $62,523 found in the 65+ years age bracket for the primary householder. A total of 779 households (56.7%) fall into this category. Meanwhile, the 15 to 24 years age bracket for the primary householder has the lowest median household income of $0, with 32 households (2.3%) in this group.
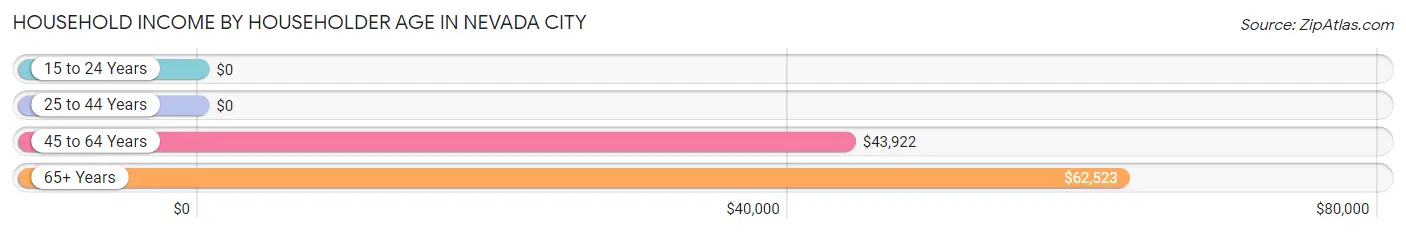
| Income Bracket | # Households | Median Income |
| 15 to 24 Years | 32 (2.3%) | $0 |
| 25 to 44 Years | 293 (21.3%) | $0 |
| 45 to 64 Years | 269 (19.6%) | $43,922 |
| 65+ Years | 779 (56.7%) | $62,523 |
| Total | 1,373 (100.0%) | $65,032 |
Poverty in Nevada City
Income Below Poverty by Sex and Age in Nevada City
With 10.5% poverty level for males and 9.5% for females among the residents of Nevada City, 65 to 74 year old males and 45 to 54 year old females are the most vulnerable to poverty, with 135 males (30.6%) and 18 females (31.6%) in their respective age groups living below the poverty level.
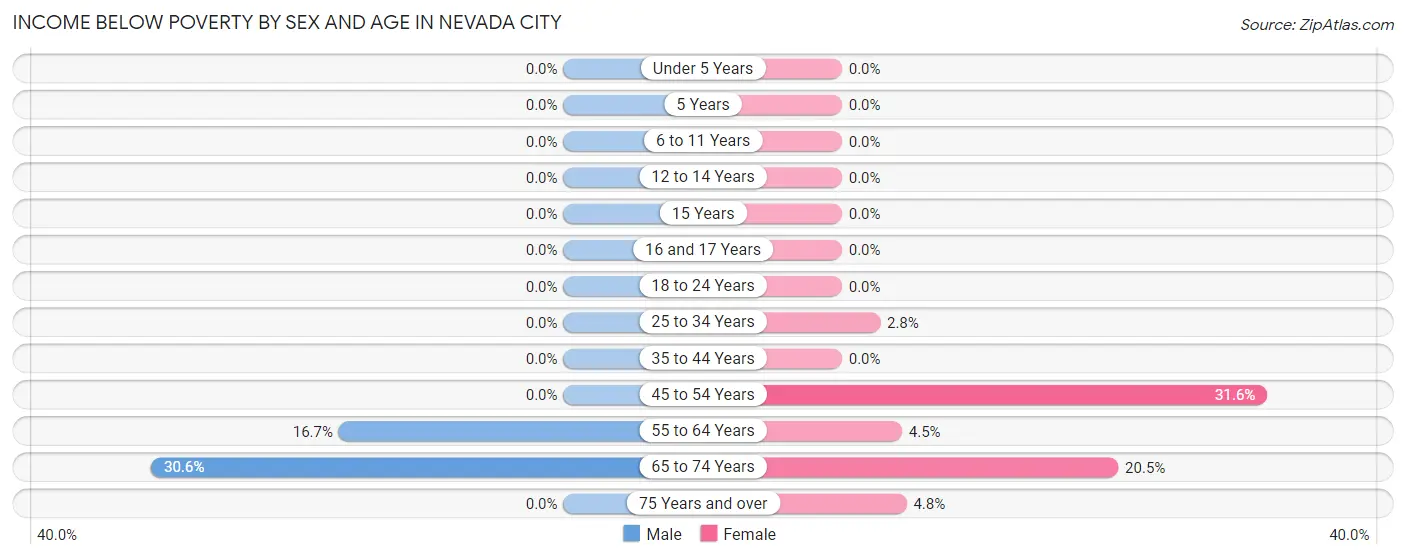
| Age Bracket | Male | Female |
| Under 5 Years | 0 (0.0%) | 0 (0.0%) |
| 5 Years | 0 (0.0%) | 0 (0.0%) |
| 6 to 11 Years | 0 (0.0%) | 0 (0.0%) |
| 12 to 14 Years | 0 (0.0%) | 0 (0.0%) |
| 15 Years | 0 (0.0%) | 0 (0.0%) |
| 16 and 17 Years | 0 (0.0%) | 0 (0.0%) |
| 18 to 24 Years | 0 (0.0%) | 0 (0.0%) |
| 25 to 34 Years | 0 (0.0%) | 4 (2.8%) |
| 35 to 44 Years | 0 (0.0%) | 0 (0.0%) |
| 45 to 54 Years | 0 (0.0%) | 18 (31.6%) |
| 55 to 64 Years | 6 (16.7%) | 10 (4.5%) |
| 65 to 74 Years | 135 (30.6%) | 118 (20.5%) |
| 75 Years and over | 0 (0.0%) | 6 (4.8%) |
| Total | 141 (10.5%) | 156 (9.5%) |
Income Above Poverty by Sex and Age in Nevada City
According to the poverty statistics in Nevada City, males aged 6 to 11 years and females aged under 5 years are the age groups that are most secure financially, with 100.0% of males and 100.0% of females in these age groups living above the poverty line.

| Age Bracket | Male | Female |
| Under 5 Years | 0 (0.0%) | 111 (100.0%) |
| 5 Years | 0 (0.0%) | 0 (0.0%) |
| 6 to 11 Years | 111 (100.0%) | 68 (100.0%) |
| 12 to 14 Years | 88 (100.0%) | 50 (100.0%) |
| 15 Years | 0 (0.0%) | 0 (0.0%) |
| 16 and 17 Years | 0 (0.0%) | 23 (100.0%) |
| 18 to 24 Years | 32 (100.0%) | 80 (100.0%) |
| 25 to 34 Years | 141 (100.0%) | 137 (97.2%) |
| 35 to 44 Years | 157 (100.0%) | 181 (100.0%) |
| 45 to 54 Years | 161 (100.0%) | 39 (68.4%) |
| 55 to 64 Years | 30 (83.3%) | 214 (95.5%) |
| 65 to 74 Years | 306 (69.4%) | 457 (79.5%) |
| 75 Years and over | 175 (100.0%) | 119 (95.2%) |
| Total | 1,201 (89.5%) | 1,479 (90.5%) |
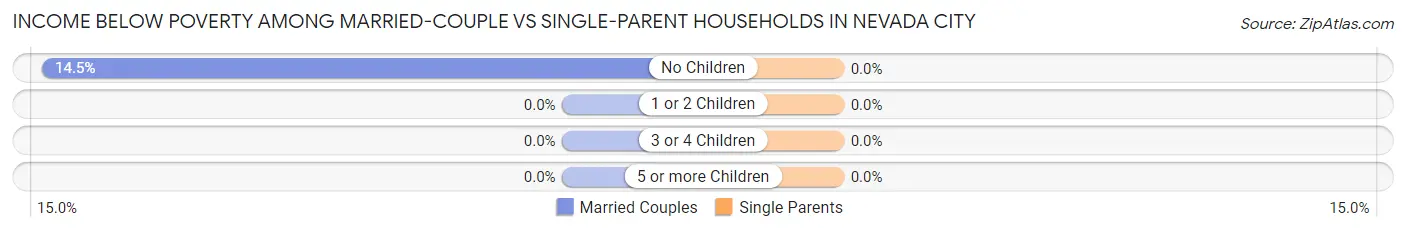
Income Below Poverty Among Married-Couple Families in Nevada City
The poverty statistics for married-couple families in Nevada City show that 11.7% or 46 of the total 392 families live below the poverty line. Families with no children have the highest poverty rate of 14.5%, comprising of 46 families. On the other hand, families with 1 or 2 children have the lowest poverty rate of 0.0%, which includes 0 families.
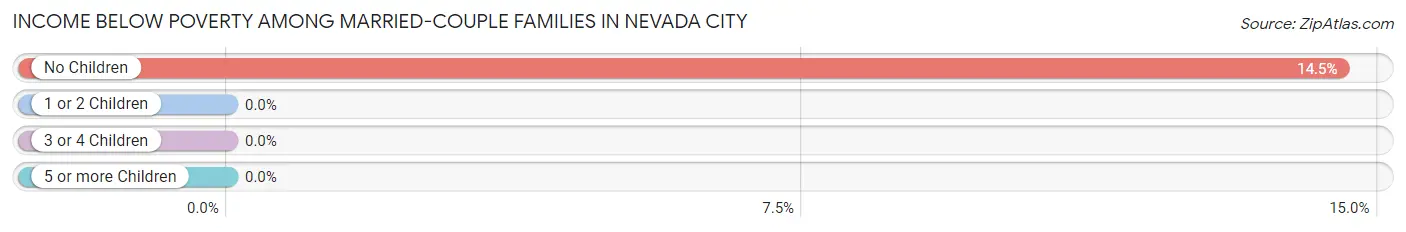
| Children | Above Poverty | Below Poverty |
| No Children | 271 (85.5%) | 46 (14.5%) |
| 1 or 2 Children | 75 (100.0%) | 0 (0.0%) |
| 3 or 4 Children | 0 (0.0%) | 0 (0.0%) |
| 5 or more Children | 0 (0.0%) | 0 (0.0%) |
| Total | 346 (88.3%) | 46 (11.7%) |
Income Below Poverty Among Single-Parent Households in Nevada City
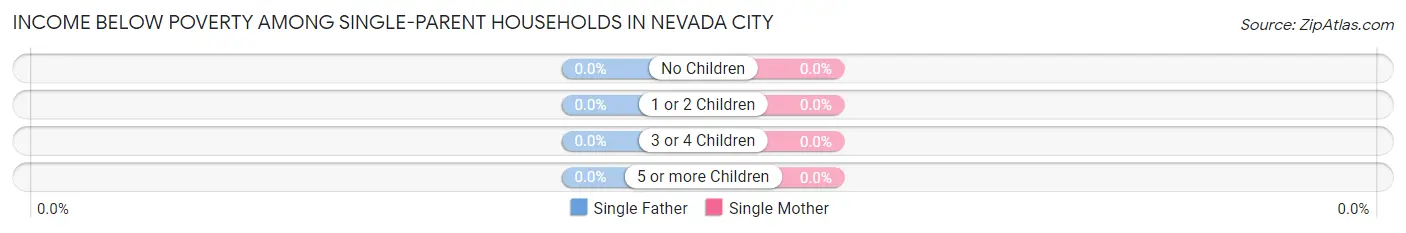
| Children | Single Father | Single Mother |
| No Children | 0 (0.0%) | 0 (0.0%) |
| 1 or 2 Children | 0 (0.0%) | 0 (0.0%) |
| 3 or 4 Children | 0 (0.0%) | 0 (0.0%) |
| 5 or more Children | 0 (0.0%) | 0 (0.0%) |
| Total | 0 (0.0%) | 0 (0.0%) |
Income Below Poverty Among Married-Couple vs Single-Parent Households in Nevada City
| Children | Married-Couple Families | Single-Parent Households |
| No Children | 46 (14.5%) | 0 (0.0%) |
| 1 or 2 Children | 0 (0.0%) | 0 (0.0%) |
| 3 or 4 Children | 0 (0.0%) | 0 (0.0%) |
| 5 or more Children | 0 (0.0%) | 0 (0.0%) |
| Total | 46 (11.7%) | 0 (0.0%) |
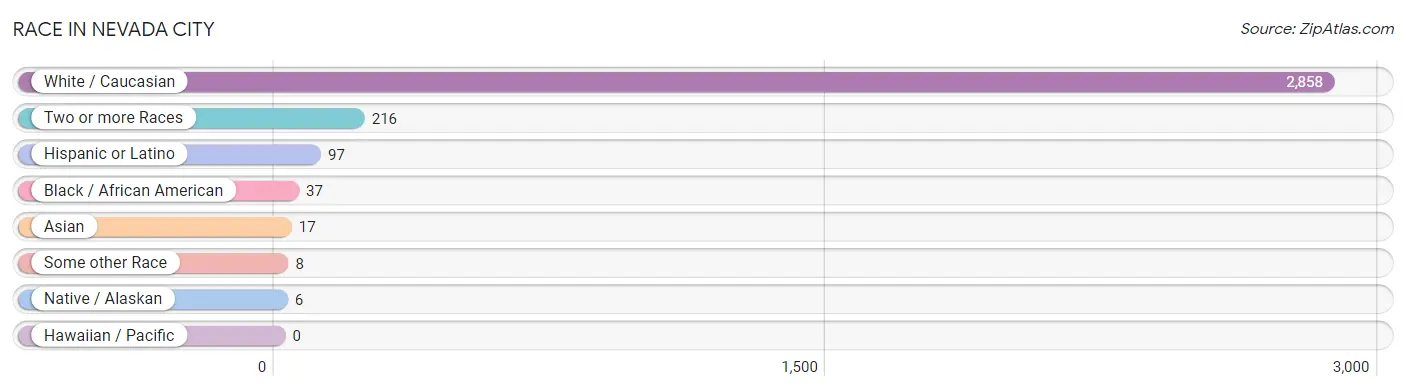
Race in Nevada City
The most populous races in Nevada City are White / Caucasian (2,858 | 91.0%), Two or more Races (216 | 6.9%), and Hispanic or Latino (97 | 3.1%).
| Race | # Population | % Population |
| Asian | 17 | 0.5% |
| Black / African American | 37 | 1.2% |
| Hawaiian / Pacific | 0 | 0.0% |
| Hispanic or Latino | 97 | 3.1% |
| Native / Alaskan | 6 | 0.2% |
| White / Caucasian | 2,858 | 91.0% |
| Two or more Races | 216 | 6.9% |
| Some other Race | 8 | 0.3% |
| Total | 3,142 | 100.0% |
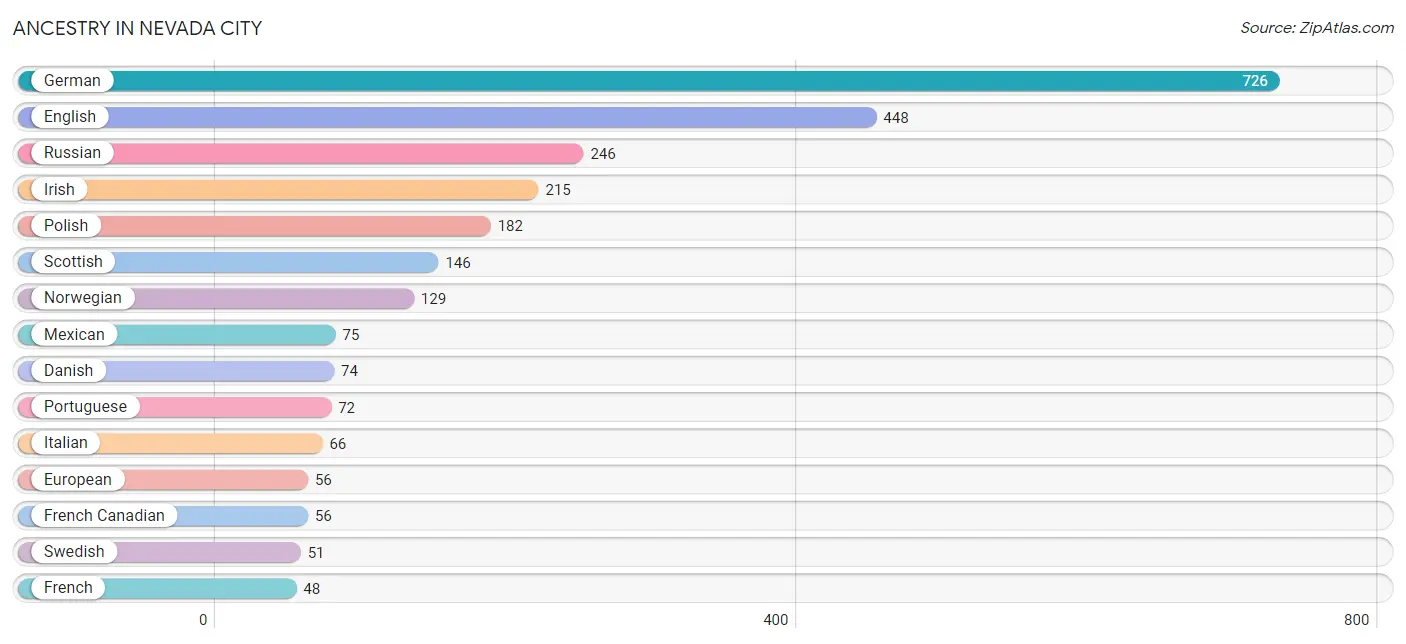
Ancestry in Nevada City
The most populous ancestries reported in Nevada City are German (726 | 23.1%), English (448 | 14.3%), Russian (246 | 7.8%), Irish (215 | 6.8%), and Polish (182 | 5.8%), together accounting for 57.8% of all Nevada City residents.
| Ancestry | # Population | % Population |
| African | 6 | 0.2% |
| American | 47 | 1.5% |
| Brazilian | 33 | 1.1% |
| British | 27 | 0.9% |
| Burmese | 3 | 0.1% |
| Cherokee | 27 | 0.9% |
| Creek | 6 | 0.2% |
| Danish | 74 | 2.4% |
| Dutch | 17 | 0.5% |
| English | 448 | 14.3% |
| European | 56 | 1.8% |
| French | 48 | 1.5% |
| French Canadian | 56 | 1.8% |
| German | 726 | 23.1% |
| Greek | 6 | 0.2% |
| Indian (Asian) | 13 | 0.4% |
| Irish | 215 | 6.8% |
| Iroquois | 16 | 0.5% |
| Italian | 66 | 2.1% |
| Latvian | 10 | 0.3% |
| Mexican | 75 | 2.4% |
| Northern European | 16 | 0.5% |
| Norwegian | 129 | 4.1% |
| Polish | 182 | 5.8% |
| Portuguese | 72 | 2.3% |
| Romanian | 23 | 0.7% |
| Russian | 246 | 7.8% |
| Scandinavian | 18 | 0.6% |
| Scotch-Irish | 45 | 1.4% |
| Scottish | 146 | 4.6% |
| Serbian | 10 | 0.3% |
| Subsaharan African | 6 | 0.2% |
| Swedish | 51 | 1.6% |
| Swiss | 33 | 1.1% |
| Welsh | 21 | 0.7% | View All 35 Rows |
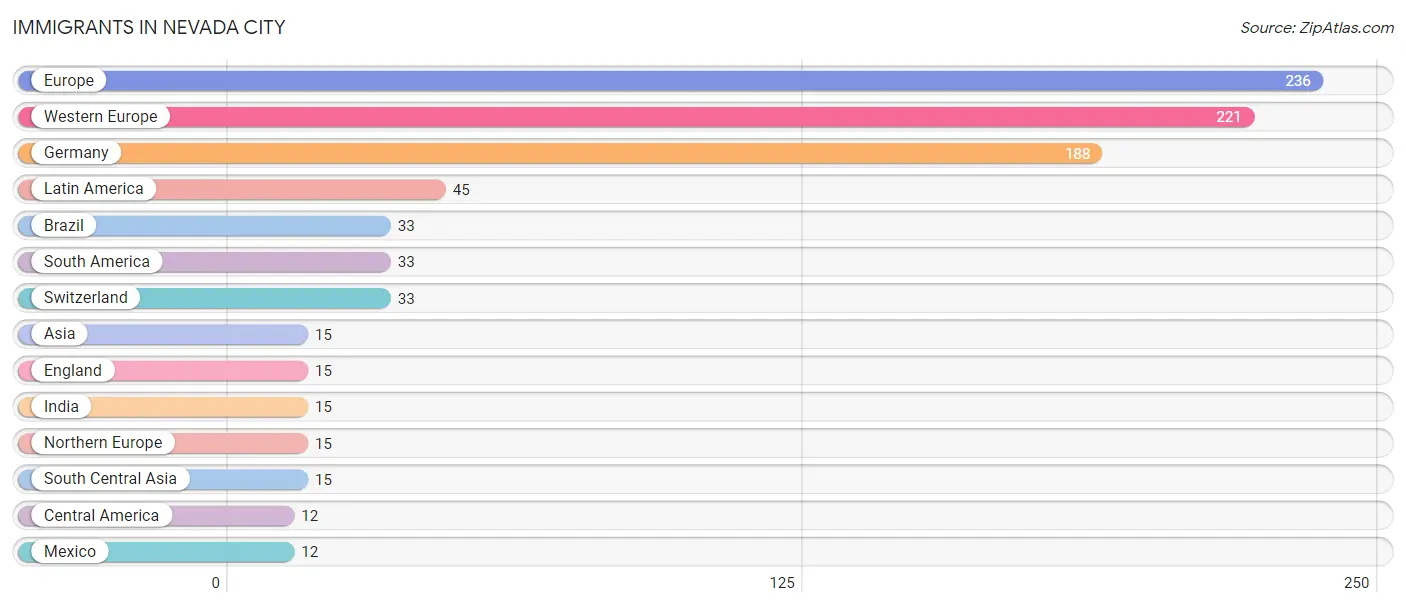
Immigrants in Nevada City
The most numerous immigrant groups reported in Nevada City came from Europe (236 | 7.5%), Western Europe (221 | 7.0%), Germany (188 | 6.0%), Latin America (45 | 1.4%), and Brazil (33 | 1.1%), together accounting for 23.0% of all Nevada City residents.
| Immigration Origin | # Population | % Population |
| Asia | 15 | 0.5% |
| Brazil | 33 | 1.1% |
| Central America | 12 | 0.4% |
| England | 15 | 0.5% |
| Europe | 236 | 7.5% |
| Germany | 188 | 6.0% |
| India | 15 | 0.5% |
| Latin America | 45 | 1.4% |
| Mexico | 12 | 0.4% |
| Northern Europe | 15 | 0.5% |
| South America | 33 | 1.1% |
| South Central Asia | 15 | 0.5% |
| Switzerland | 33 | 1.1% |
| Western Europe | 221 | 7.0% | View All 14 Rows |
Sex and Age in Nevada City
Sex and Age in Nevada City
The most populous age groups in Nevada City are 70 to 74 Years (286 | 19.2%) for men and 70 to 74 Years (295 | 17.8%) for women.
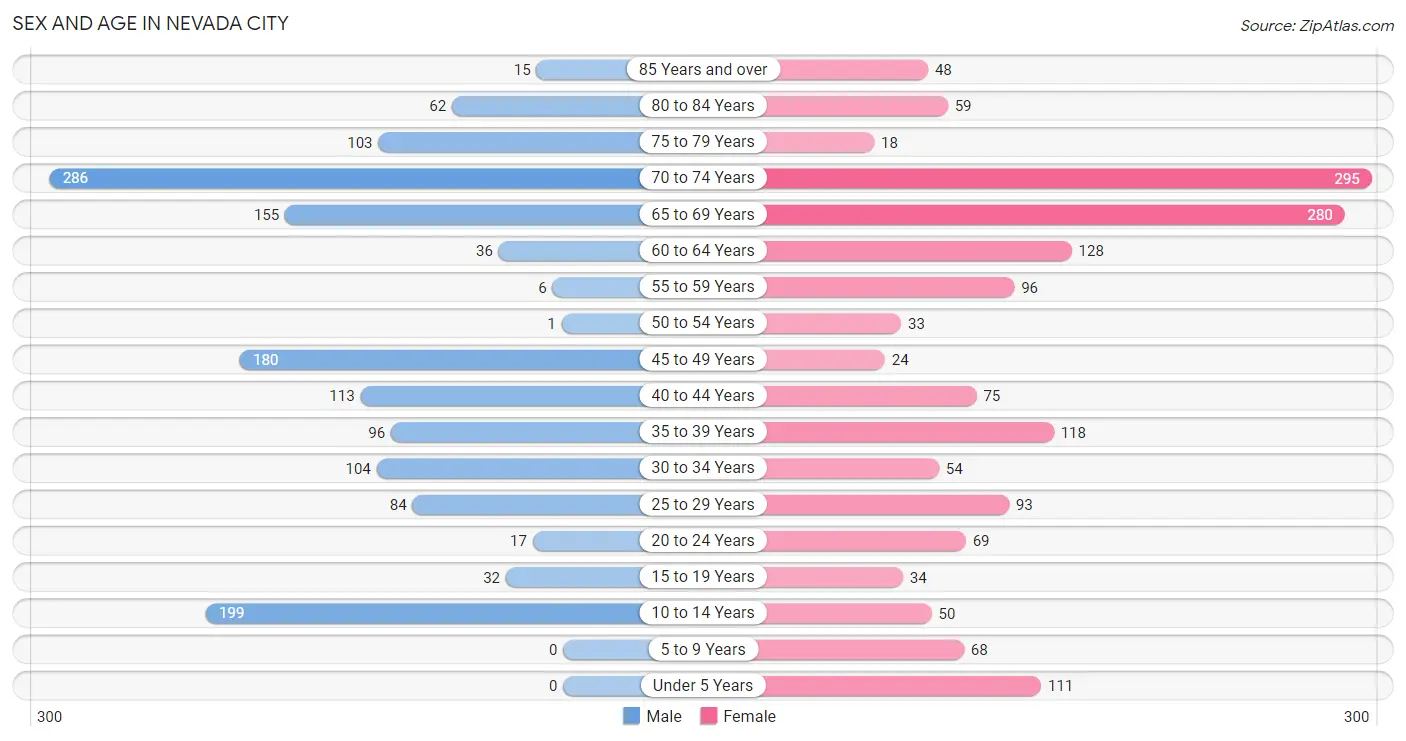
| Age Bracket | Male | Female |
| Under 5 Years | 0 (0.0%) | 111 (6.7%) |
| 5 to 9 Years | 0 (0.0%) | 68 (4.1%) |
| 10 to 14 Years | 199 (13.4%) | 50 (3.0%) |
| 15 to 19 Years | 32 (2.1%) | 34 (2.1%) |
| 20 to 24 Years | 17 (1.1%) | 69 (4.2%) |
| 25 to 29 Years | 84 (5.6%) | 93 (5.6%) |
| 30 to 34 Years | 104 (7.0%) | 54 (3.3%) |
| 35 to 39 Years | 96 (6.5%) | 118 (7.1%) |
| 40 to 44 Years | 113 (7.6%) | 75 (4.5%) |
| 45 to 49 Years | 180 (12.1%) | 24 (1.5%) |
| 50 to 54 Years | 1 (0.1%) | 33 (2.0%) |
| 55 to 59 Years | 6 (0.4%) | 96 (5.8%) |
| 60 to 64 Years | 36 (2.4%) | 128 (7.7%) |
| 65 to 69 Years | 155 (10.4%) | 280 (16.9%) |
| 70 to 74 Years | 286 (19.2%) | 295 (17.8%) |
| 75 to 79 Years | 103 (6.9%) | 18 (1.1%) |
| 80 to 84 Years | 62 (4.2%) | 59 (3.6%) |
| 85 Years and over | 15 (1.0%) | 48 (2.9%) |
| Total | 1,489 (100.0%) | 1,653 (100.0%) |
Families and Households in Nevada City
Median Family Size in Nevada City
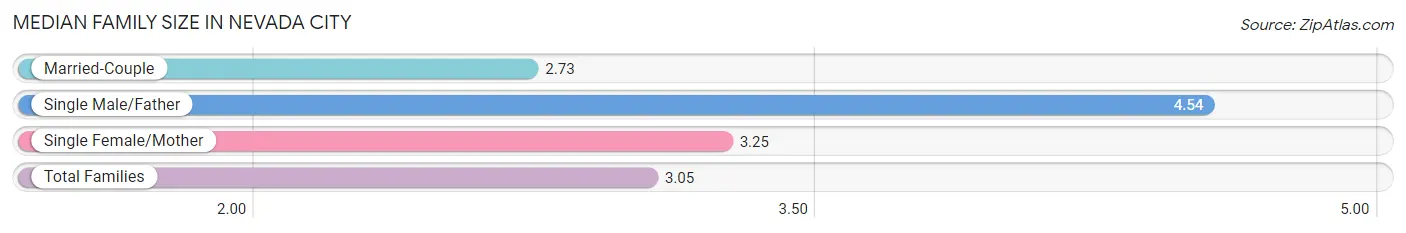
The median family size in Nevada City is 3.05 persons per family, with single male/father families (61 | 9.7%) accounting for the largest median family size of 4.54 persons per family. On the other hand, married-couple families (392 | 62.5%) represent the smallest median family size with 2.73 persons per family.
| Family Type | # Families | Family Size |
| Married-Couple | 392 (62.5%) | 2.73 |
| Single Male/Father | 61 (9.7%) | 4.54 |
| Single Female/Mother | 174 (27.8%) | 3.25 |
| Total Families | 627 (100.0%) | 3.05 |
Median Household Size in Nevada City
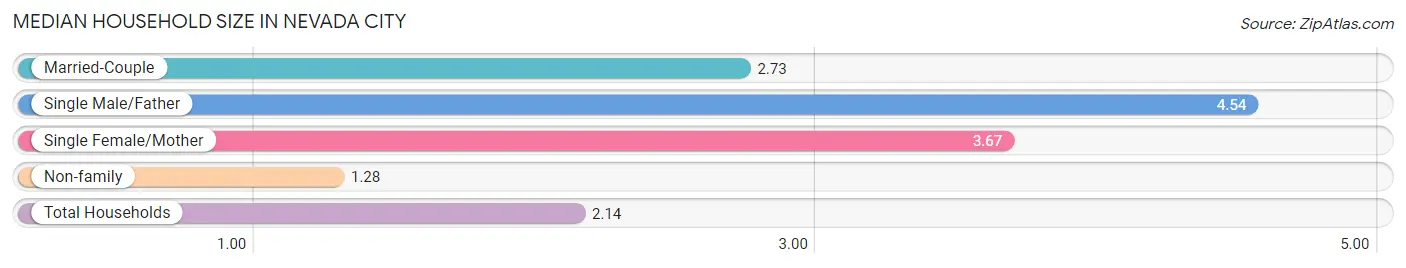
The median household size in Nevada City is 2.14 persons per household, with single male/father households (61 | 4.4%) accounting for the largest median household size of 4.54 persons per household. non-family households (746 | 54.3%) represent the smallest median household size with 1.28 persons per household.
| Household Type | # Households | Household Size |
| Married-Couple | 392 (28.5%) | 2.73 |
| Single Male/Father | 61 (4.4%) | 4.54 |
| Single Female/Mother | 174 (12.7%) | 3.67 |
| Non-family | 746 (54.3%) | 1.28 |
| Total Households | 1,373 (100.0%) | 2.14 |
Household Size by Marriage Status in Nevada City
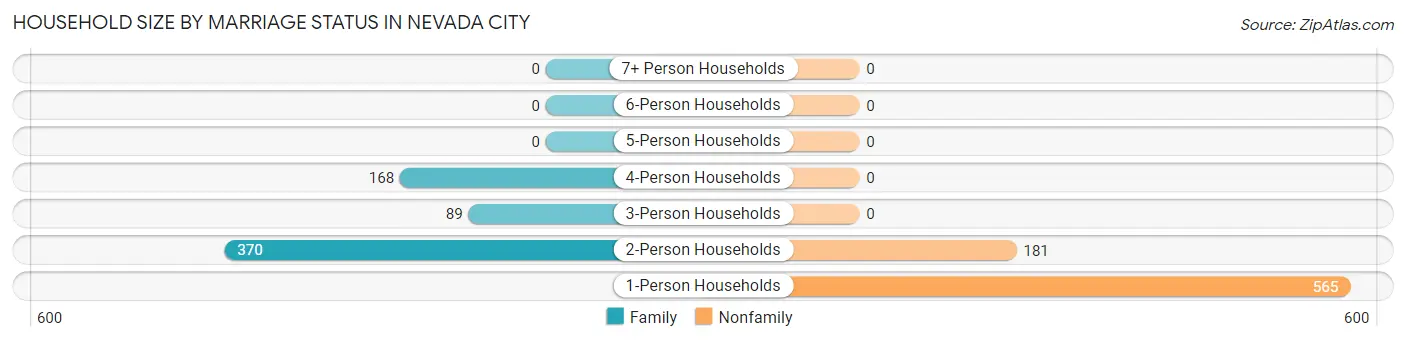
Out of a total of 1,373 households in Nevada City, 627 (45.7%) are family households, while 746 (54.3%) are nonfamily households. The most numerous type of family households are 2-person households, comprising 370, and the most common type of nonfamily households are 1-person households, comprising 565.
| Household Size | Family Households | Nonfamily Households |
| 1-Person Households | - | 565 (41.1%) |
| 2-Person Households | 370 (27.0%) | 181 (13.2%) |
| 3-Person Households | 89 (6.5%) | 0 (0.0%) |
| 4-Person Households | 168 (12.2%) | 0 (0.0%) |
| 5-Person Households | 0 (0.0%) | 0 (0.0%) |
| 6-Person Households | 0 (0.0%) | 0 (0.0%) |
| 7+ Person Households | 0 (0.0%) | 0 (0.0%) |
| Total | 627 (45.7%) | 746 (54.3%) |
Female Fertility in Nevada City
Fertility by Age in Nevada City
| Age Bracket | Women with Births | Births / 1,000 Women |
| 15 to 19 years | 0 (0.0%) | 0.0 |
| 20 to 34 years | 0 (0.0%) | 0.0 |
| 35 to 50 years | 0 (0.0%) | 0.0 |
| Total | 0 (0.0%) | 0.0 |
Fertility by Age by Marriage Status in Nevada City
| Age Bracket | Married | Unmarried |
| 15 to 19 years | 0 (0.0%) | 0 (0.0%) |
| 20 to 34 years | 0 (0.0%) | 0 (0.0%) |
| 35 to 50 years | 0 (0.0%) | 0 (0.0%) |
| Total | 0 (0.0%) | 0 (0.0%) |
Fertility by Education in Nevada City
| Educational Attainment | Women with Births | Births / 1,000 Women |
| Less than High School | 0 (0.0%) | 0.0 |
| High School Diploma | 0 (0.0%) | 0.0 |
| College or Associate's Degree | 0 (0.0%) | 0.0 |
| Bachelor's Degree | 0 (0.0%) | 0.0 |
| Graduate Degree | 0 (0.0%) | 0.0 |
| Total | 0 (0.0%) | 0.0 |
Fertility by Education by Marriage Status in Nevada City
| Educational Attainment | Married | Unmarried |
| Less than High School | 0 (0.0%) | 0 (0.0%) |
| High School Diploma | 0 (0.0%) | 0 (0.0%) |
| College or Associate's Degree | 0 (0.0%) | 0 (0.0%) |
| Bachelor's Degree | 0 (0.0%) | 0 (0.0%) |
| Graduate Degree | 0 (0.0%) | 0 (0.0%) |
| Total | 0 (0.0%) | 0 (0.0%) |
Employment Characteristics in Nevada City
Employment by Class of Employer in Nevada City
Among the 1,386 employed individuals in Nevada City, private company employees (779 | 56.2%), self-employed (not incorporated) (324 | 23.4%), and state government employees (114 | 8.2%) make up the most common classes of employment.
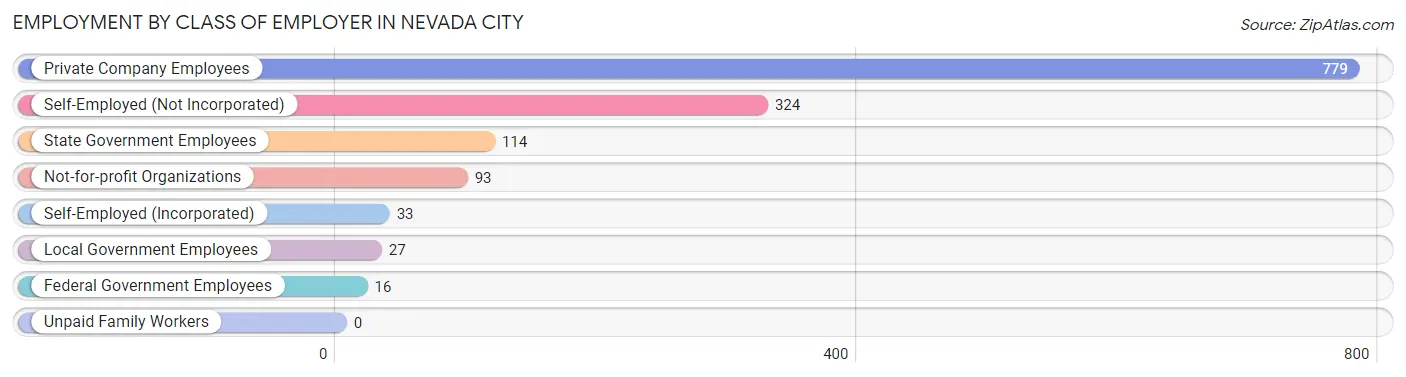
| Employer Class | # Employees | % Employees |
| Private Company Employees | 779 | 56.2% |
| Self-Employed (Incorporated) | 33 | 2.4% |
| Self-Employed (Not Incorporated) | 324 | 23.4% |
| Not-for-profit Organizations | 93 | 6.7% |
| Local Government Employees | 27 | 1.9% |
| State Government Employees | 114 | 8.2% |
| Federal Government Employees | 16 | 1.1% |
| Unpaid Family Workers | 0 | 0.0% |
| Total | 1,386 | 100.0% |
Employment Status by Age in Nevada City
According to the labor force statistics for Nevada City, out of the total population over 16 years of age (2,714), 53.1% or 1,441 individuals are in the labor force, with 1.8% or 26 of them unemployed. The age group with the highest labor force participation rate is 16 to 19 years, with 100.0% or 66 individuals in the labor force. Within the labor force, the 65 to 74 years age range has the highest percentage of unemployed individuals, with 7.9% or 26 of them being unemployed.
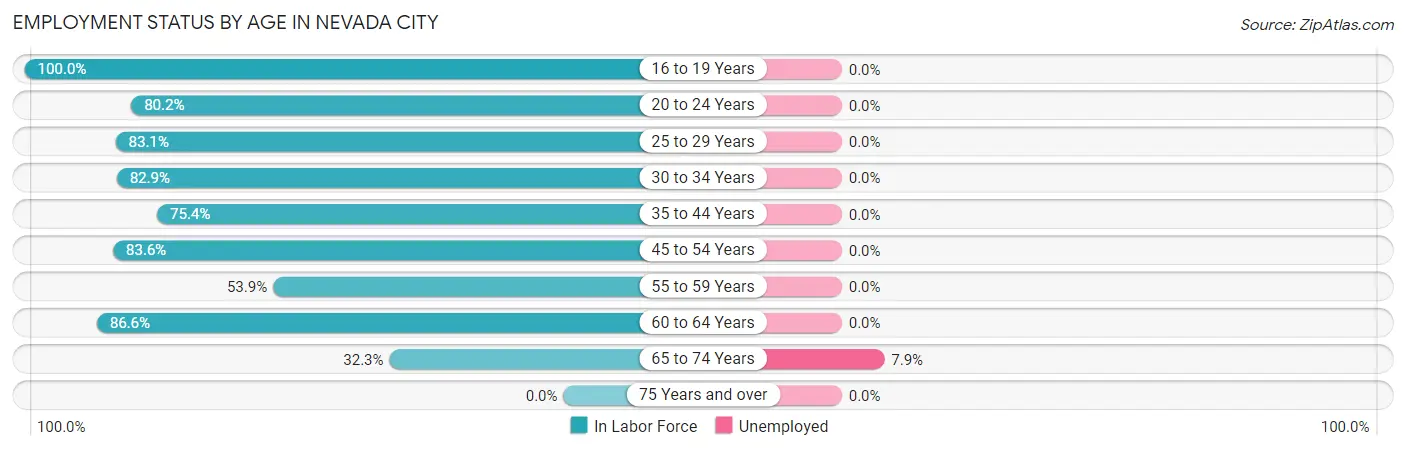
| Age Bracket | In Labor Force | Unemployed |
| 16 to 19 Years | 66 (100.0%) | 0 (0.0%) |
| 20 to 24 Years | 69 (80.2%) | 0 (0.0%) |
| 25 to 29 Years | 147 (83.1%) | 0 (0.0%) |
| 30 to 34 Years | 131 (82.9%) | 0 (0.0%) |
| 35 to 44 Years | 303 (75.4%) | 0 (0.0%) |
| 45 to 54 Years | 199 (83.6%) | 0 (0.0%) |
| 55 to 59 Years | 55 (53.9%) | 0 (0.0%) |
| 60 to 64 Years | 142 (86.6%) | 0 (0.0%) |
| 65 to 74 Years | 328 (32.3%) | 26 (7.9%) |
| 75 Years and over | 0 (0.0%) | 0 (0.0%) |
| Total | 1,441 (53.1%) | 26 (1.8%) |
Employment Status by Educational Attainment in Nevada City
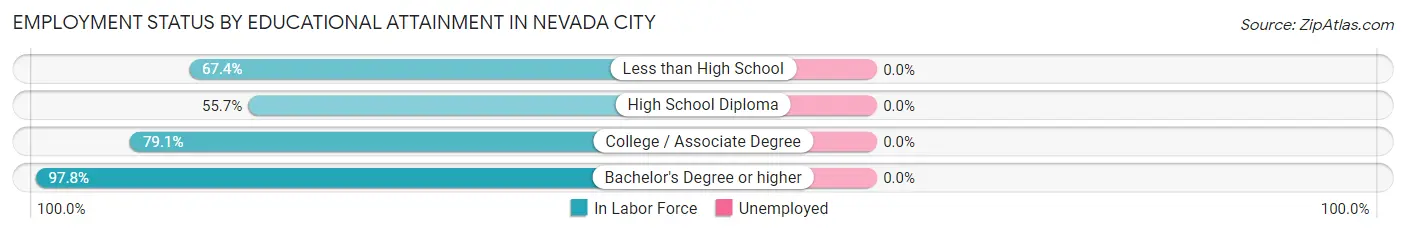
| Educational Attainment | In Labor Force | Unemployed |
| Less than High School | 62 (67.4%) | 0 (0.0%) |
| High School Diploma | 146 (55.7%) | 0 (0.0%) |
| College / Associate Degree | 416 (79.1%) | 0 (0.0%) |
| Bachelor's Degree or higher | 353 (97.8%) | 0 (0.0%) |
| Total | 977 (78.7%) | 0 (0.0%) |
Employment Occupations by Sex in Nevada City
Management, Business, Science and Arts Occupations
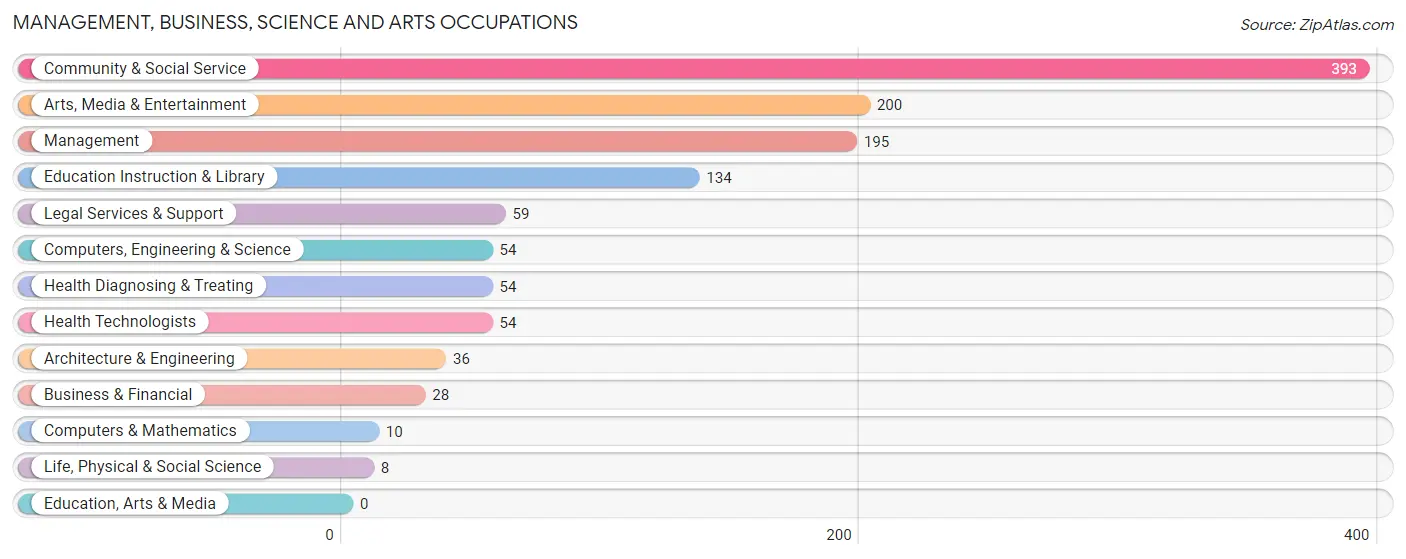
The most common Management, Business, Science and Arts occupations in Nevada City are Community & Social Service (393 | 28.1%), Arts, Media & Entertainment (200 | 14.3%), Management (195 | 14.0%), Education Instruction & Library (134 | 9.6%), and Legal Services & Support (59 | 4.2%).
Management, Business, Science and Arts Occupations by Sex
Within the Management, Business, Science and Arts occupations in Nevada City, the most male-oriented occupations are Computers & Mathematics (100.0%), Architecture & Engineering (100.0%), and Computers, Engineering & Science (85.2%), while the most female-oriented occupations are Life, Physical & Social Science (100.0%), Legal Services & Support (100.0%), and Health Diagnosing & Treating (100.0%).
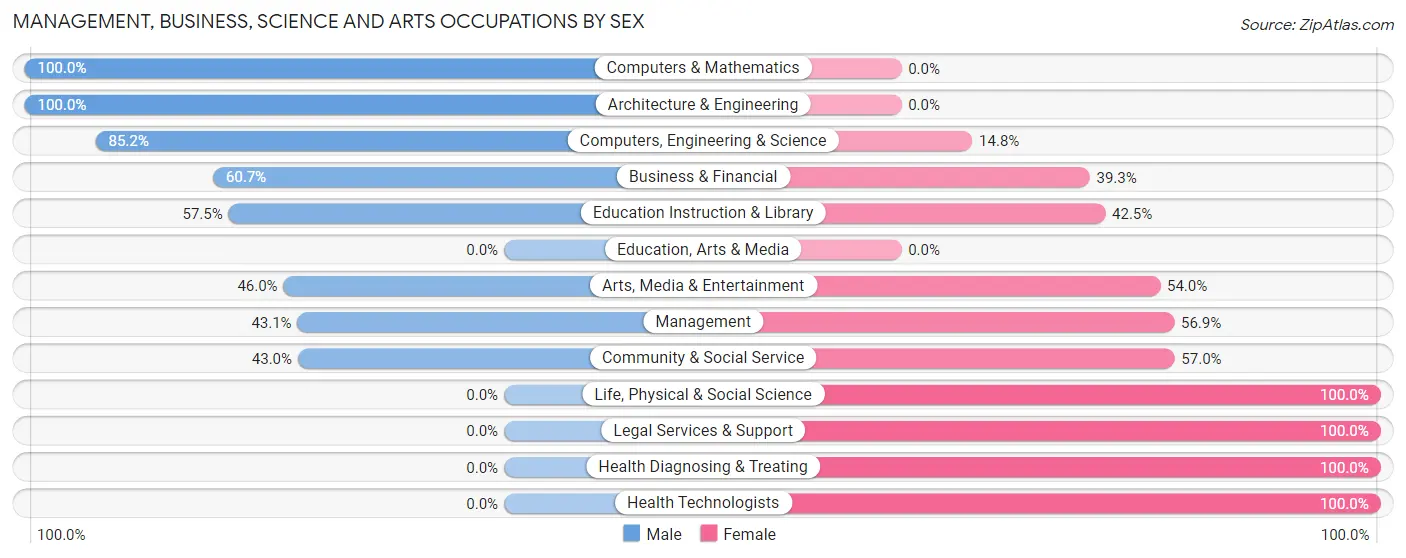
| Occupation | Male | Female |
| Management | 84 (43.1%) | 111 (56.9%) |
| Business & Financial | 17 (60.7%) | 11 (39.3%) |
| Computers, Engineering & Science | 46 (85.2%) | 8 (14.8%) |
| Computers & Mathematics | 10 (100.0%) | 0 (0.0%) |
| Architecture & Engineering | 36 (100.0%) | 0 (0.0%) |
| Life, Physical & Social Science | 0 (0.0%) | 8 (100.0%) |
| Community & Social Service | 169 (43.0%) | 224 (57.0%) |
| Education, Arts & Media | 0 (0.0%) | 0 (0.0%) |
| Legal Services & Support | 0 (0.0%) | 59 (100.0%) |
| Education Instruction & Library | 77 (57.5%) | 57 (42.5%) |
| Arts, Media & Entertainment | 92 (46.0%) | 108 (54.0%) |
| Health Diagnosing & Treating | 0 (0.0%) | 54 (100.0%) |
| Health Technologists | 0 (0.0%) | 54 (100.0%) |
| Total (Category) | 316 (43.6%) | 408 (56.4%) |
| Total (Overall) | 611 (43.7%) | 787 (56.3%) |
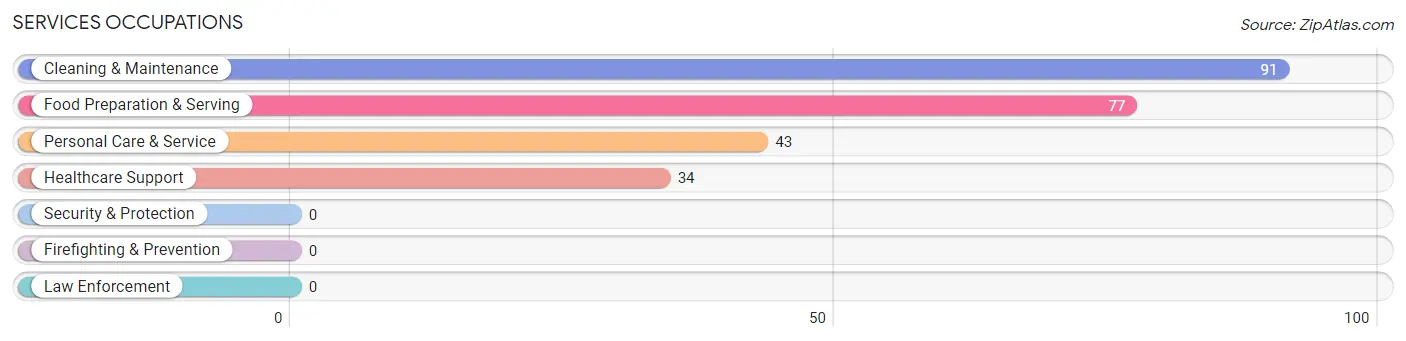
Services Occupations
The most common Services occupations in Nevada City are Cleaning & Maintenance (91 | 6.5%), Food Preparation & Serving (77 | 5.5%), Personal Care & Service (43 | 3.1%), and Healthcare Support (34 | 2.4%).
Services Occupations by Sex
Within the Services occupations in Nevada City, the most male-oriented occupations are Food Preparation & Serving (70.1%), and Cleaning & Maintenance (5.5%), while the most female-oriented occupations are Healthcare Support (100.0%), Personal Care & Service (100.0%), and Cleaning & Maintenance (94.5%).
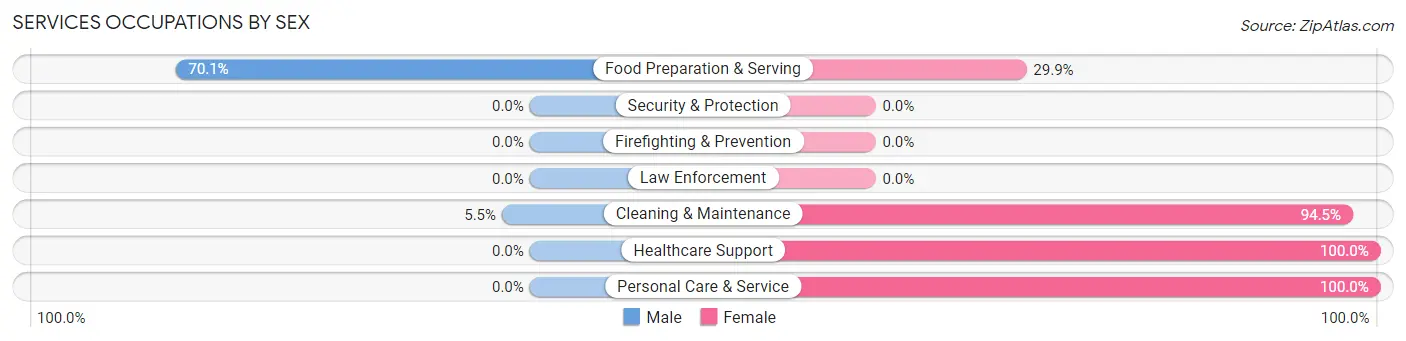
| Occupation | Male | Female |
| Healthcare Support | 0 (0.0%) | 34 (100.0%) |
| Security & Protection | 0 (0.0%) | 0 (0.0%) |
| Firefighting & Prevention | 0 (0.0%) | 0 (0.0%) |
| Law Enforcement | 0 (0.0%) | 0 (0.0%) |
| Food Preparation & Serving | 54 (70.1%) | 23 (29.9%) |
| Cleaning & Maintenance | 5 (5.5%) | 86 (94.5%) |
| Personal Care & Service | 0 (0.0%) | 43 (100.0%) |
| Total (Category) | 59 (24.1%) | 186 (75.9%) |
| Total (Overall) | 611 (43.7%) | 787 (56.3%) |
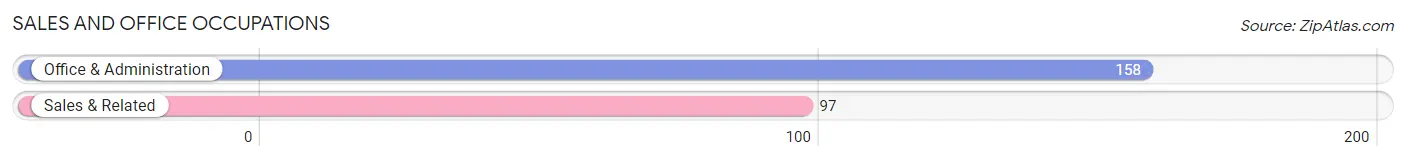
Sales and Office Occupations
The most common Sales and Office occupations in Nevada City are Office & Administration (158 | 11.3%), and Sales & Related (97 | 6.9%).
Sales and Office Occupations by Sex
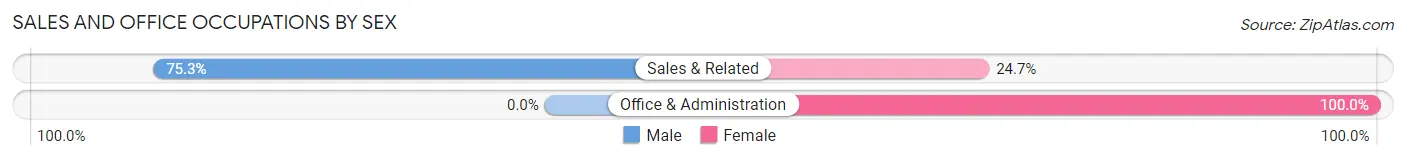
| Occupation | Male | Female |
| Sales & Related | 73 (75.3%) | 24 (24.7%) |
| Office & Administration | 0 (0.0%) | 158 (100.0%) |
| Total (Category) | 73 (28.6%) | 182 (71.4%) |
| Total (Overall) | 611 (43.7%) | 787 (56.3%) |
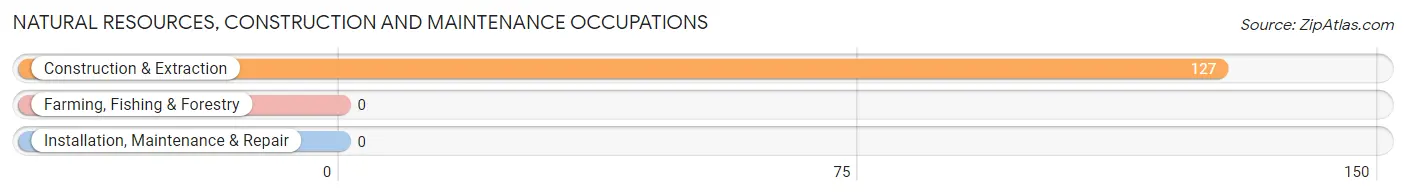
Natural Resources, Construction and Maintenance Occupations
The most common Natural Resources, Construction and Maintenance occupations in Nevada City are , and Construction & Extraction (127 | 9.1%).
Natural Resources, Construction and Maintenance Occupations by Sex
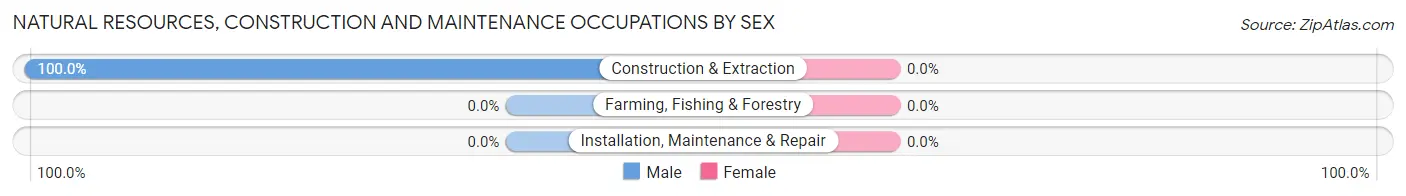
| Occupation | Male | Female |
| Farming, Fishing & Forestry | 0 (0.0%) | 0 (0.0%) |
| Construction & Extraction | 127 (100.0%) | 0 (0.0%) |
| Installation, Maintenance & Repair | 0 (0.0%) | 0 (0.0%) |
| Total (Category) | 127 (100.0%) | 0 (0.0%) |
| Total (Overall) | 611 (43.7%) | 787 (56.3%) |
Production, Transportation and Moving Occupations
The most common Production, Transportation and Moving occupations in Nevada City are Transportation (36 | 2.6%), and Production (11 | 0.8%).
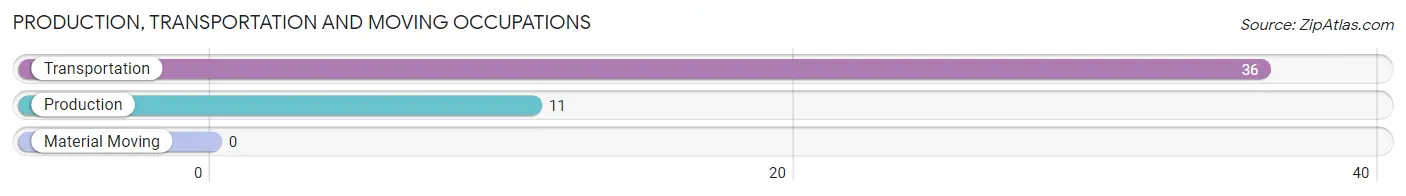
Production, Transportation and Moving Occupations by Sex
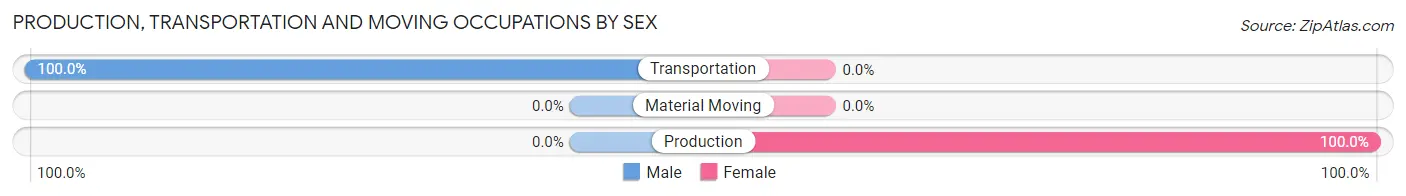
| Occupation | Male | Female |
| Production | 0 (0.0%) | 11 (100.0%) |
| Transportation | 36 (100.0%) | 0 (0.0%) |
| Material Moving | 0 (0.0%) | 0 (0.0%) |
| Total (Category) | 36 (76.6%) | 11 (23.4%) |
| Total (Overall) | 611 (43.7%) | 787 (56.3%) |
Employment Industries by Sex in Nevada City
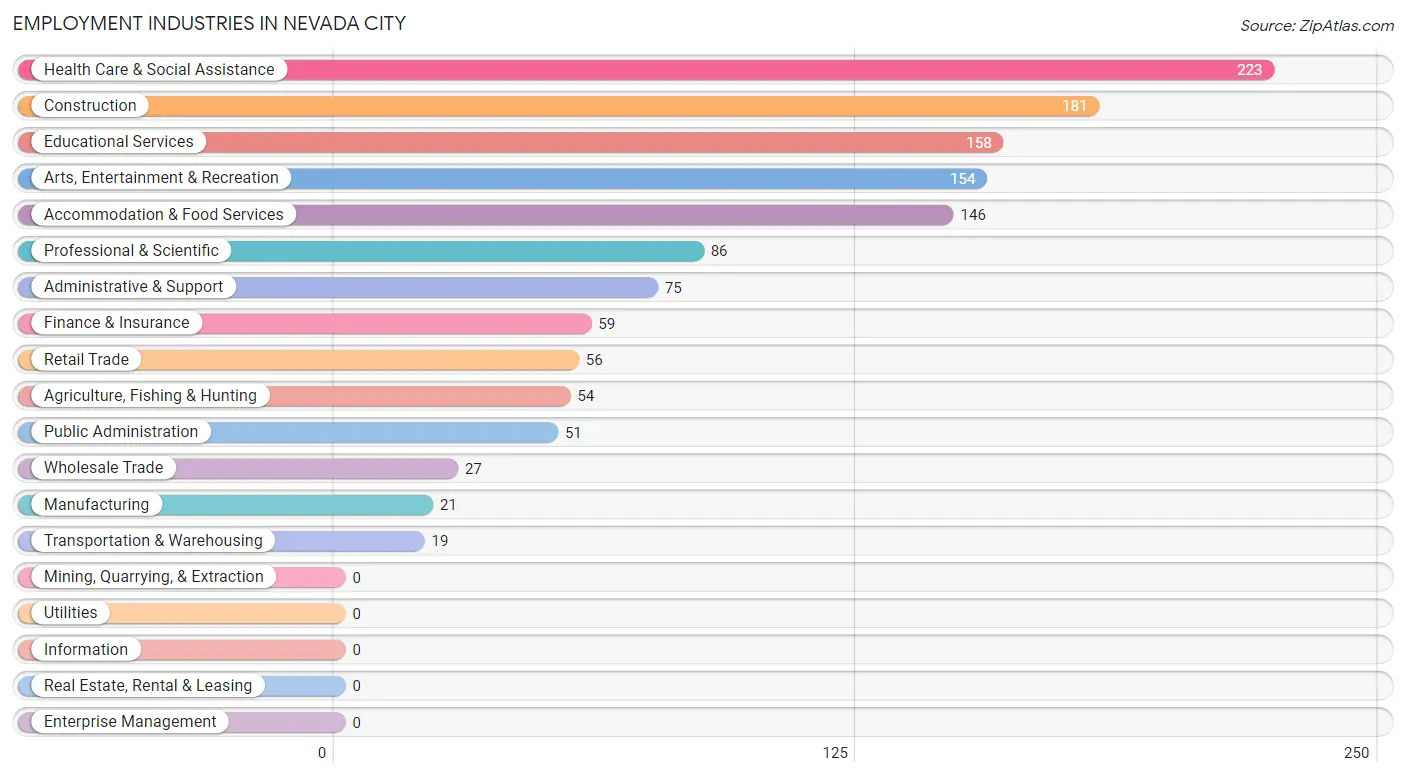
Employment Industries in Nevada City
The major employment industries in Nevada City include Health Care & Social Assistance (223 | 16.0%), Construction (181 | 13.0%), Educational Services (158 | 11.3%), Arts, Entertainment & Recreation (154 | 11.0%), and Accommodation & Food Services (146 | 10.4%).
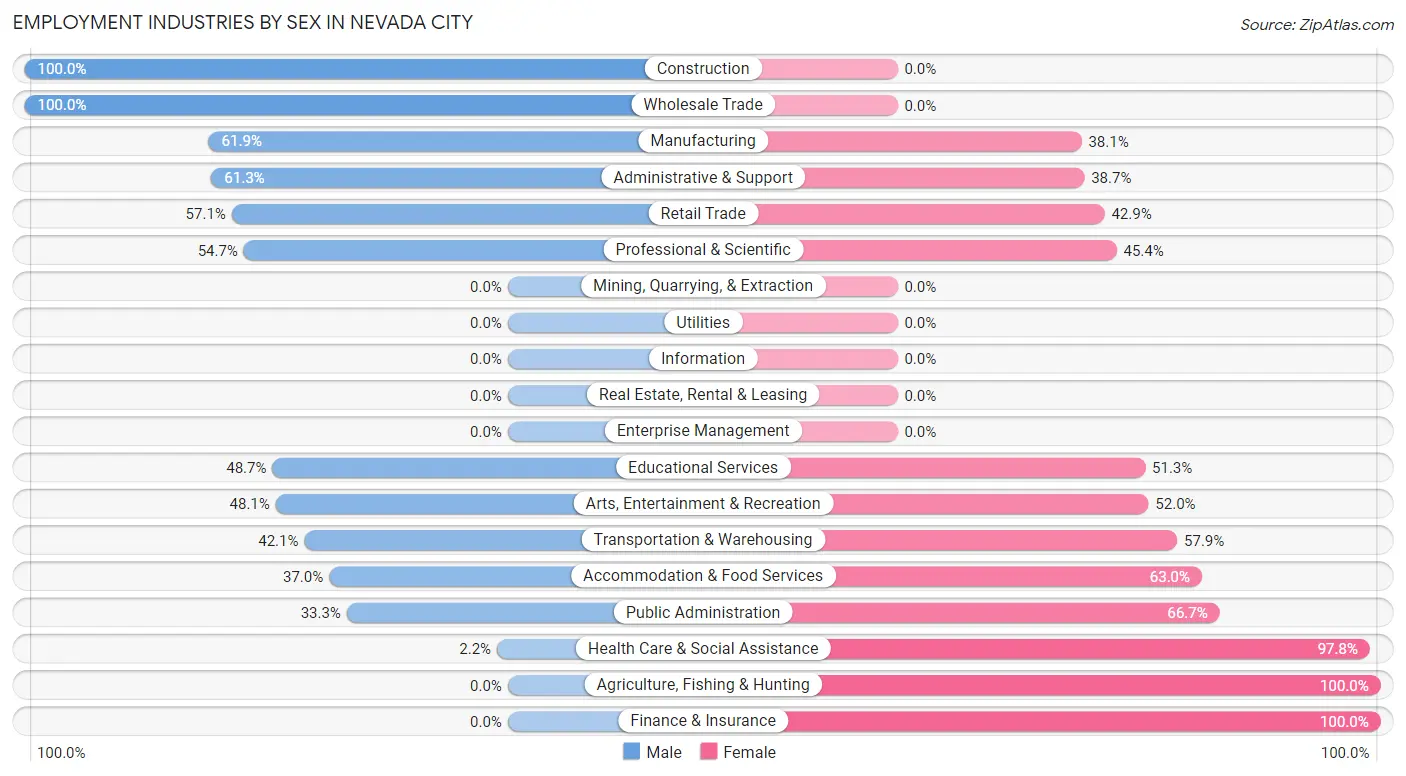
Employment Industries by Sex in Nevada City
The Nevada City industries that see more men than women are Construction (100.0%), Wholesale Trade (100.0%), and Manufacturing (61.9%), whereas the industries that tend to have a higher number of women are Agriculture, Fishing & Hunting (100.0%), Finance & Insurance (100.0%), and Health Care & Social Assistance (97.8%).
| Industry | Male | Female |
| Agriculture, Fishing & Hunting | 0 (0.0%) | 54 (100.0%) |
| Mining, Quarrying, & Extraction | 0 (0.0%) | 0 (0.0%) |
| Construction | 181 (100.0%) | 0 (0.0%) |
| Manufacturing | 13 (61.9%) | 8 (38.1%) |
| Wholesale Trade | 27 (100.0%) | 0 (0.0%) |
| Retail Trade | 32 (57.1%) | 24 (42.9%) |
| Transportation & Warehousing | 8 (42.1%) | 11 (57.9%) |
| Utilities | 0 (0.0%) | 0 (0.0%) |
| Information | 0 (0.0%) | 0 (0.0%) |
| Finance & Insurance | 0 (0.0%) | 59 (100.0%) |
| Real Estate, Rental & Leasing | 0 (0.0%) | 0 (0.0%) |
| Professional & Scientific | 47 (54.6%) | 39 (45.4%) |
| Enterprise Management | 0 (0.0%) | 0 (0.0%) |
| Administrative & Support | 46 (61.3%) | 29 (38.7%) |
| Educational Services | 77 (48.7%) | 81 (51.3%) |
| Health Care & Social Assistance | 5 (2.2%) | 218 (97.8%) |
| Arts, Entertainment & Recreation | 74 (48.0%) | 80 (51.9%) |
| Accommodation & Food Services | 54 (37.0%) | 92 (63.0%) |
| Public Administration | 17 (33.3%) | 34 (66.7%) |
| Total | 611 (43.7%) | 787 (56.3%) |
Education in Nevada City
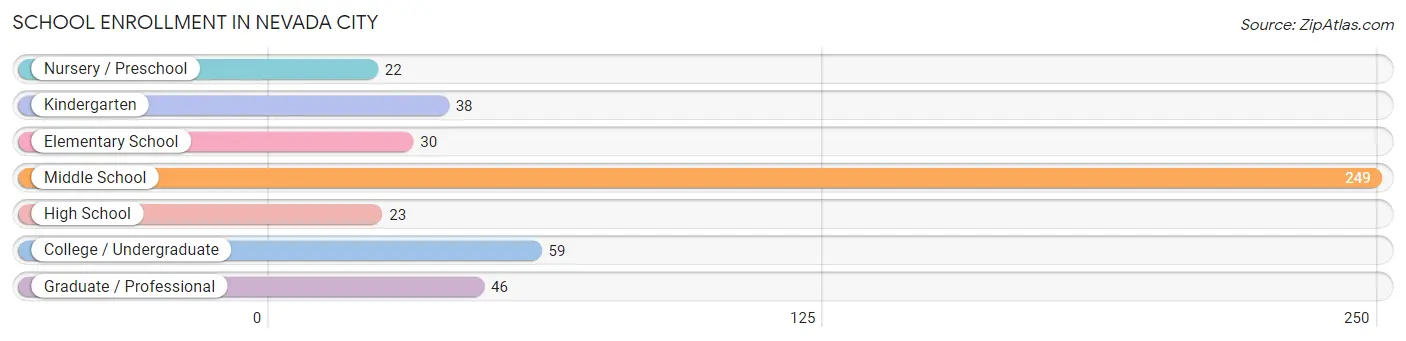
School Enrollment in Nevada City
The most common levels of schooling among the 467 students in Nevada City are middle school (249 | 53.3%), college / undergraduate (59 | 12.6%), and graduate / professional (46 | 9.9%).
| School Level | # Students | % Students |
| Nursery / Preschool | 22 | 4.7% |
| Kindergarten | 38 | 8.1% |
| Elementary School | 30 | 6.4% |
| Middle School | 249 | 53.3% |
| High School | 23 | 4.9% |
| College / Undergraduate | 59 | 12.6% |
| Graduate / Professional | 46 | 9.9% |
| Total | 467 | 100.0% |
School Enrollment by Age by Funding Source in Nevada City
Out of a total of 467 students who are enrolled in schools in Nevada City, 58 (12.4%) attend a private institution, while the remaining 409 (87.6%) are enrolled in public schools. The age group of 3 to 4 year olds has the highest likelihood of being enrolled in private schools, with 22 (100.0% in the age bracket) enrolled. Conversely, the age group of 5 to 9 year old has the lowest likelihood of being enrolled in a private school, with 68 (100.0% in the age bracket) attending a public institution.
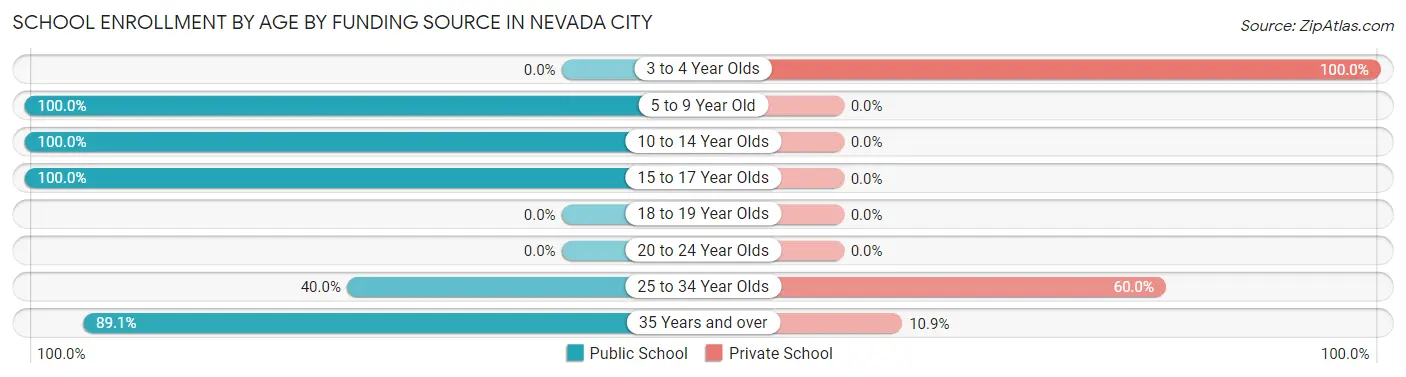
| Age Bracket | Public School | Private School |
| 3 to 4 Year Olds | 0 (0.0%) | 22 (100.0%) |
| 5 to 9 Year Old | 68 (100.0%) | 0 (0.0%) |
| 10 to 14 Year Olds | 249 (100.0%) | 0 (0.0%) |
| 15 to 17 Year Olds | 23 (100.0%) | 0 (0.0%) |
| 18 to 19 Year Olds | 0 (0.0%) | 0 (0.0%) |
| 20 to 24 Year Olds | 0 (0.0%) | 0 (0.0%) |
| 25 to 34 Year Olds | 20 (40.0%) | 30 (60.0%) |
| 35 Years and over | 49 (89.1%) | 6 (10.9%) |
| Total | 409 (87.6%) | 58 (12.4%) |
Educational Attainment by Field of Study in Nevada City
Social sciences (217 | 19.9%), business (200 | 18.3%), visual & performing arts (162 | 14.8%), psychology (77 | 7.0%), and computers & mathematics (72 | 6.6%) are the most common fields of study among 1,092 individuals in Nevada City who have obtained a bachelor's degree or higher.
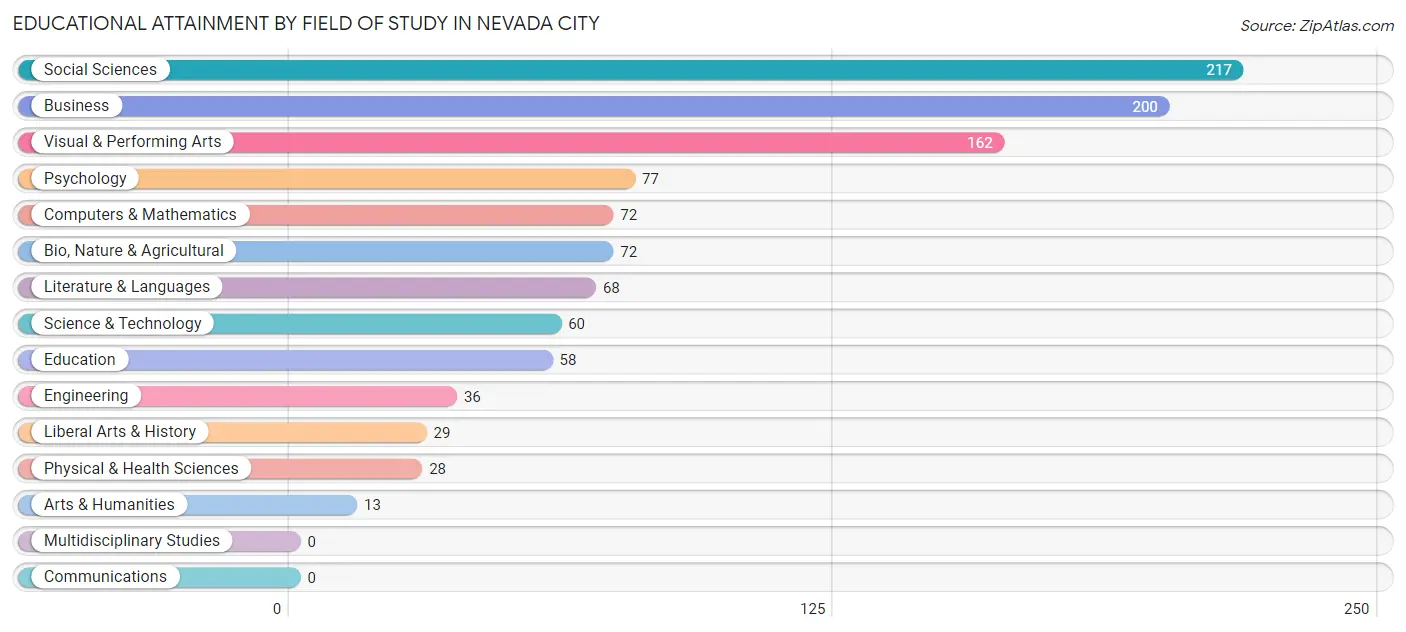
| Field of Study | # Graduates | % Graduates |
| Computers & Mathematics | 72 | 6.6% |
| Bio, Nature & Agricultural | 72 | 6.6% |
| Physical & Health Sciences | 28 | 2.6% |
| Psychology | 77 | 7.0% |
| Social Sciences | 217 | 19.9% |
| Engineering | 36 | 3.3% |
| Multidisciplinary Studies | 0 | 0.0% |
| Science & Technology | 60 | 5.5% |
| Business | 200 | 18.3% |
| Education | 58 | 5.3% |
| Literature & Languages | 68 | 6.2% |
| Liberal Arts & History | 29 | 2.7% |
| Visual & Performing Arts | 162 | 14.8% |
| Communications | 0 | 0.0% |
| Arts & Humanities | 13 | 1.2% |
| Total | 1,092 | 100.0% |
Transportation & Commute in Nevada City
Vehicle Availability by Sex in Nevada City
The most prevalent vehicle ownership categories in Nevada City are males with 3 vehicles (194, accounting for 31.2%) and females with 3 vehicles (97, making up 25.6%).
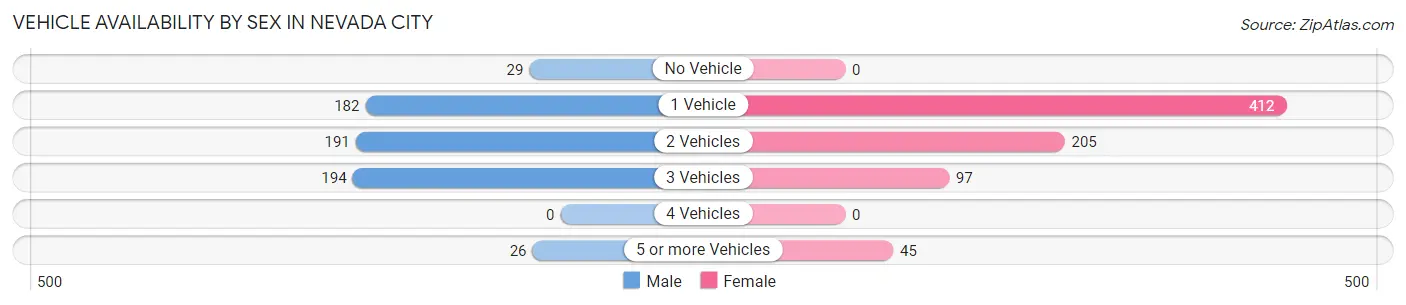
| Vehicles Available | Male | Female |
| No Vehicle | 29 (4.7%) | 0 (0.0%) |
| 1 Vehicle | 182 (29.3%) | 412 (54.3%) |
| 2 Vehicles | 191 (30.7%) | 205 (27.0%) |
| 3 Vehicles | 194 (31.2%) | 97 (12.8%) |
| 4 Vehicles | 0 (0.0%) | 0 (0.0%) |
| 5 or more Vehicles | 26 (4.2%) | 45 (5.9%) |
| Total | 622 (100.0%) | 759 (100.0%) |
Commute Time in Nevada City
The most frequently occuring commute durations in Nevada City are 10 to 14 minutes (340 commuters, 39.4%), 5 to 9 minutes (125 commuters, 14.5%), and 40 to 44 minutes (109 commuters, 12.6%).
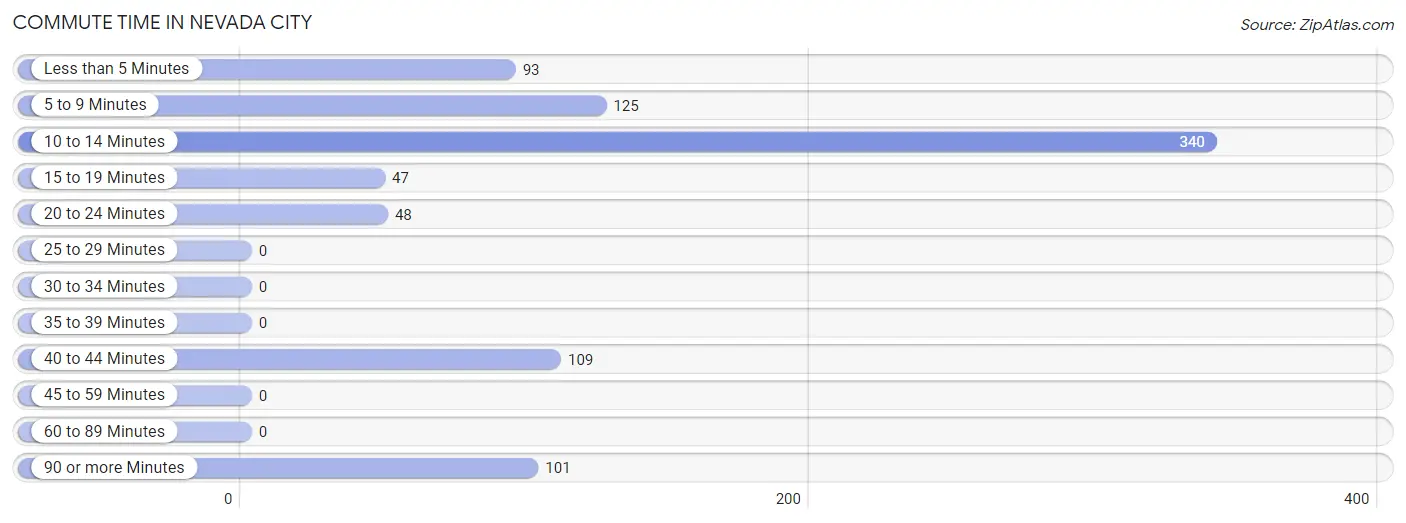
| Commute Time | # Commuters | % Commuters |
| Less than 5 Minutes | 93 | 10.8% |
| 5 to 9 Minutes | 125 | 14.5% |
| 10 to 14 Minutes | 340 | 39.4% |
| 15 to 19 Minutes | 47 | 5.4% |
| 20 to 24 Minutes | 48 | 5.6% |
| 25 to 29 Minutes | 0 | 0.0% |
| 30 to 34 Minutes | 0 | 0.0% |
| 35 to 39 Minutes | 0 | 0.0% |
| 40 to 44 Minutes | 109 | 12.6% |
| 45 to 59 Minutes | 0 | 0.0% |
| 60 to 89 Minutes | 0 | 0.0% |
| 90 or more Minutes | 101 | 11.7% |
Commute Time by Sex in Nevada City
The most common commute times in Nevada City are 5 to 9 minutes (103 commuters, 26.8%) for males and 10 to 14 minutes (258 commuters, 54.0%) for females.
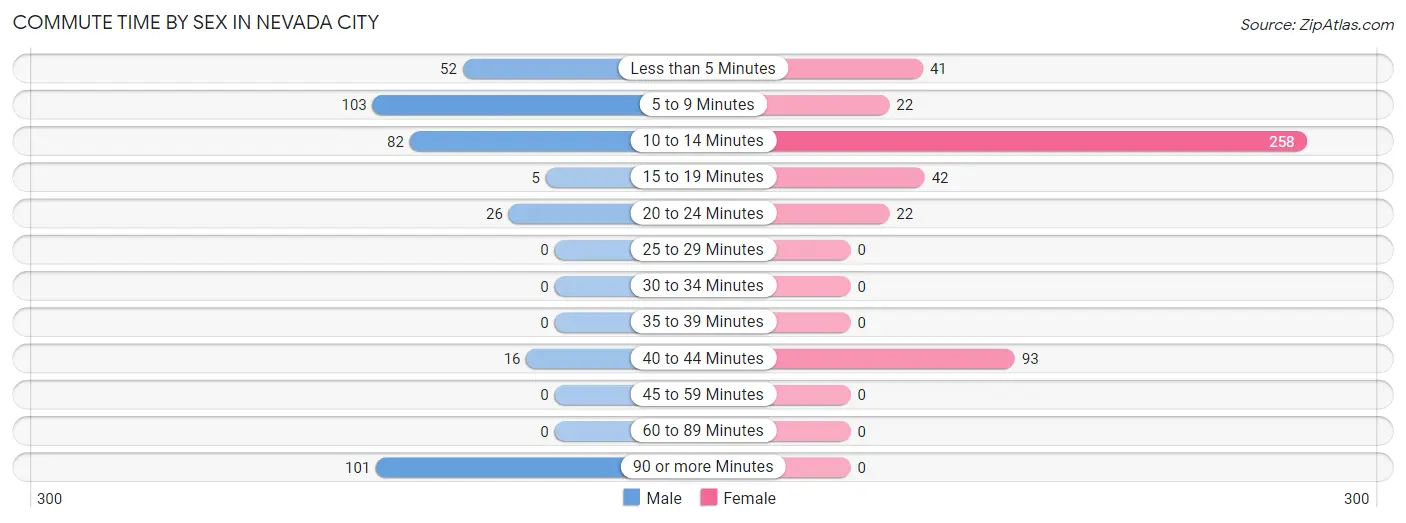
| Commute Time | Male | Female |
| Less than 5 Minutes | 52 (13.5%) | 41 (8.6%) |
| 5 to 9 Minutes | 103 (26.8%) | 22 (4.6%) |
| 10 to 14 Minutes | 82 (21.3%) | 258 (54.0%) |
| 15 to 19 Minutes | 5 (1.3%) | 42 (8.8%) |
| 20 to 24 Minutes | 26 (6.8%) | 22 (4.6%) |
| 25 to 29 Minutes | 0 (0.0%) | 0 (0.0%) |
| 30 to 34 Minutes | 0 (0.0%) | 0 (0.0%) |
| 35 to 39 Minutes | 0 (0.0%) | 0 (0.0%) |
| 40 to 44 Minutes | 16 (4.2%) | 93 (19.5%) |
| 45 to 59 Minutes | 0 (0.0%) | 0 (0.0%) |
| 60 to 89 Minutes | 0 (0.0%) | 0 (0.0%) |
| 90 or more Minutes | 101 (26.2%) | 0 (0.0%) |
Time of Departure to Work by Sex in Nevada City
The most frequent times of departure to work in Nevada City are 6:00 AM to 6:29 AM (129, 33.5%) for males and 4:00 PM to 11:59 PM (92, 19.3%) for females.
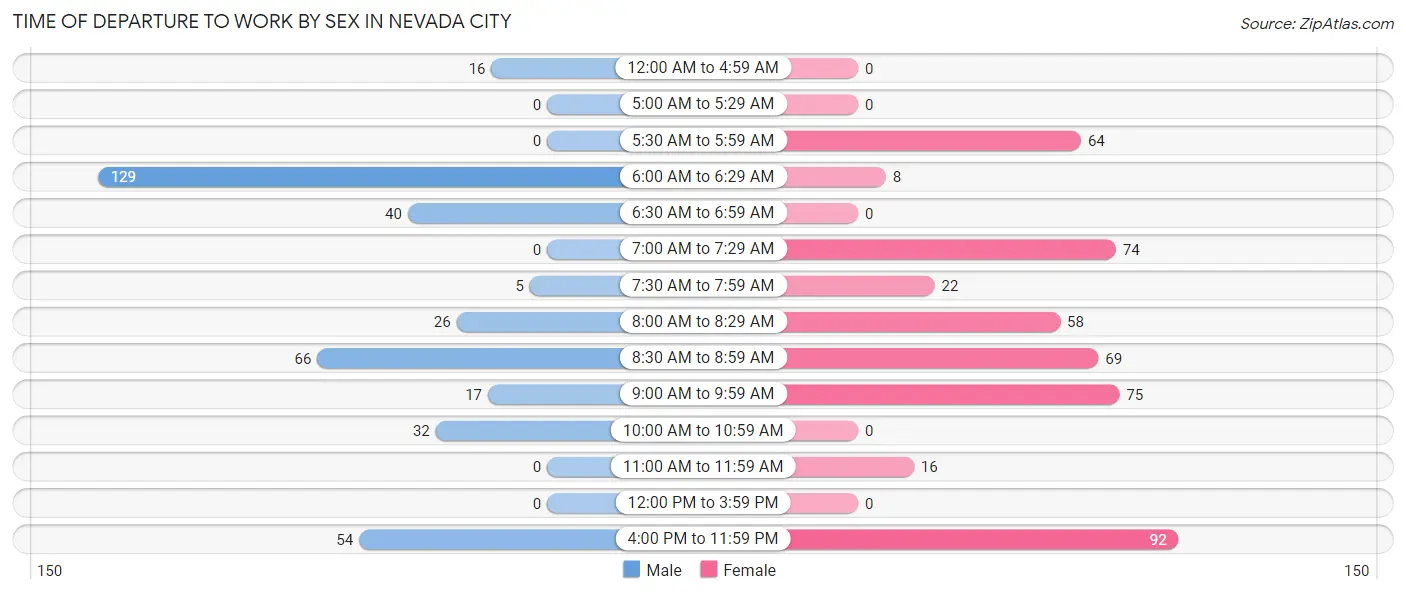
| Time of Departure | Male | Female |
| 12:00 AM to 4:59 AM | 16 (4.2%) | 0 (0.0%) |
| 5:00 AM to 5:29 AM | 0 (0.0%) | 0 (0.0%) |
| 5:30 AM to 5:59 AM | 0 (0.0%) | 64 (13.4%) |
| 6:00 AM to 6:29 AM | 129 (33.5%) | 8 (1.7%) |
| 6:30 AM to 6:59 AM | 40 (10.4%) | 0 (0.0%) |
| 7:00 AM to 7:29 AM | 0 (0.0%) | 74 (15.5%) |
| 7:30 AM to 7:59 AM | 5 (1.3%) | 22 (4.6%) |
| 8:00 AM to 8:29 AM | 26 (6.8%) | 58 (12.1%) |
| 8:30 AM to 8:59 AM | 66 (17.1%) | 69 (14.4%) |
| 9:00 AM to 9:59 AM | 17 (4.4%) | 75 (15.7%) |
| 10:00 AM to 10:59 AM | 32 (8.3%) | 0 (0.0%) |
| 11:00 AM to 11:59 AM | 0 (0.0%) | 16 (3.4%) |
| 12:00 PM to 3:59 PM | 0 (0.0%) | 0 (0.0%) |
| 4:00 PM to 11:59 PM | 54 (14.0%) | 92 (19.3%) |
| Total | 385 (100.0%) | 478 (100.0%) |
Housing Occupancy in Nevada City
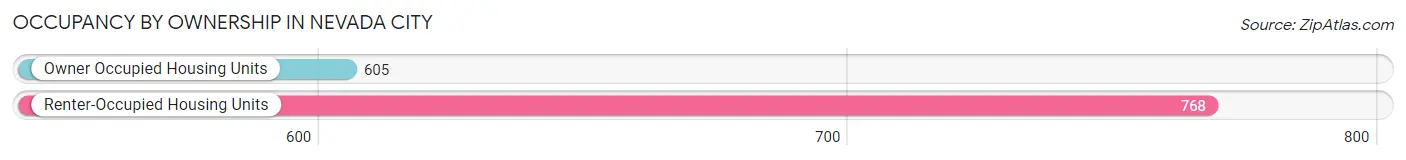
Occupancy by Ownership in Nevada City
Of the total 1,373 dwellings in Nevada City, owner-occupied units account for 605 (44.1%), while renter-occupied units make up 768 (55.9%).
| Occupancy | # Housing Units | % Housing Units |
| Owner Occupied Housing Units | 605 | 44.1% |
| Renter-Occupied Housing Units | 768 | 55.9% |
| Total Occupied Housing Units | 1,373 | 100.0% |
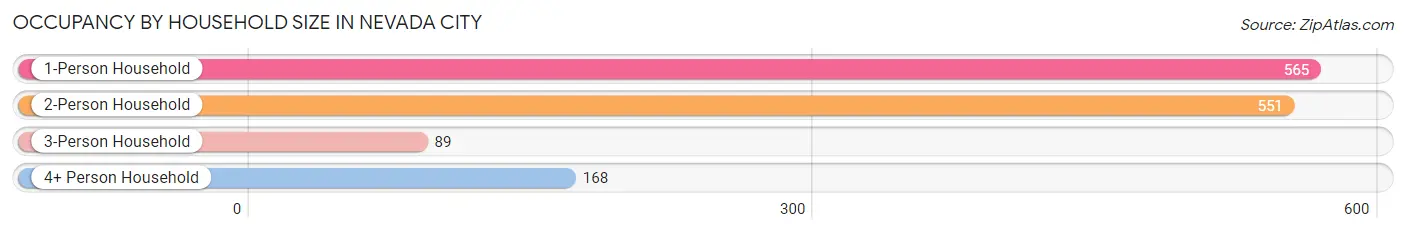
Occupancy by Household Size in Nevada City
| Household Size | # Housing Units | % Housing Units |
| 1-Person Household | 565 | 41.1% |
| 2-Person Household | 551 | 40.1% |
| 3-Person Household | 89 | 6.5% |
| 4+ Person Household | 168 | 12.2% |
| Total Housing Units | 1,373 | 100.0% |
Occupancy by Ownership by Household Size in Nevada City
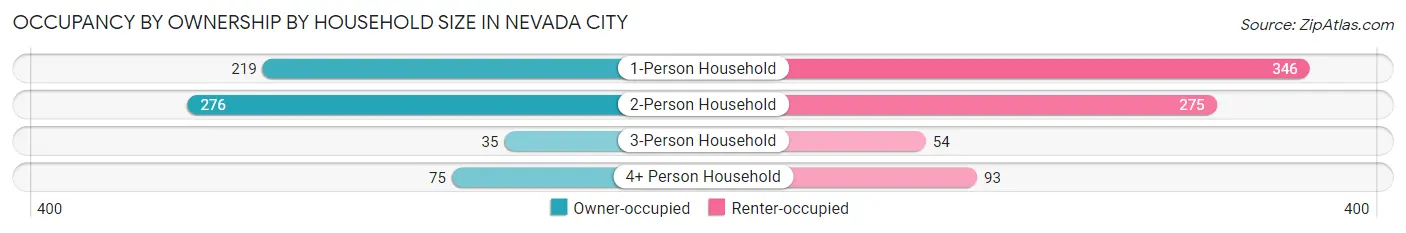
| Household Size | Owner-occupied | Renter-occupied |
| 1-Person Household | 219 (38.8%) | 346 (61.2%) |
| 2-Person Household | 276 (50.1%) | 275 (49.9%) |
| 3-Person Household | 35 (39.3%) | 54 (60.7%) |
| 4+ Person Household | 75 (44.6%) | 93 (55.4%) |
| Total Housing Units | 605 (44.1%) | 768 (55.9%) |
Occupancy by Educational Attainment in Nevada City
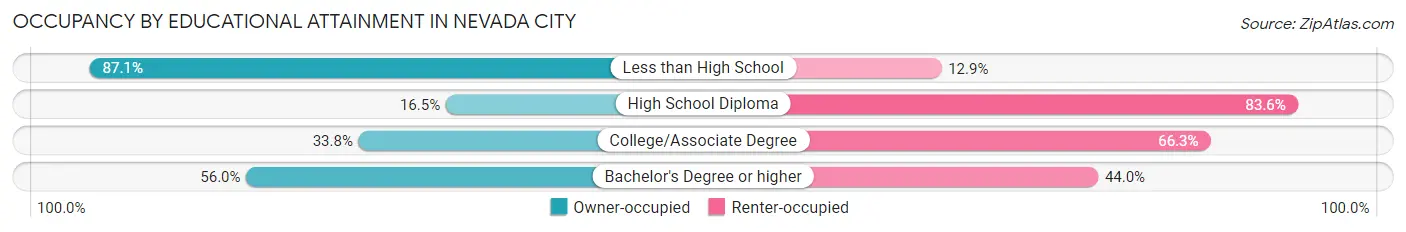
| Household Size | Owner-occupied | Renter-occupied |
| Less than High School | 54 (87.1%) | 8 (12.9%) |
| High School Diploma | 25 (16.5%) | 127 (83.6%) |
| College/Associate Degree | 187 (33.8%) | 367 (66.2%) |
| Bachelor's Degree or higher | 339 (56.0%) | 266 (44.0%) |
Occupancy by Age of Householder in Nevada City
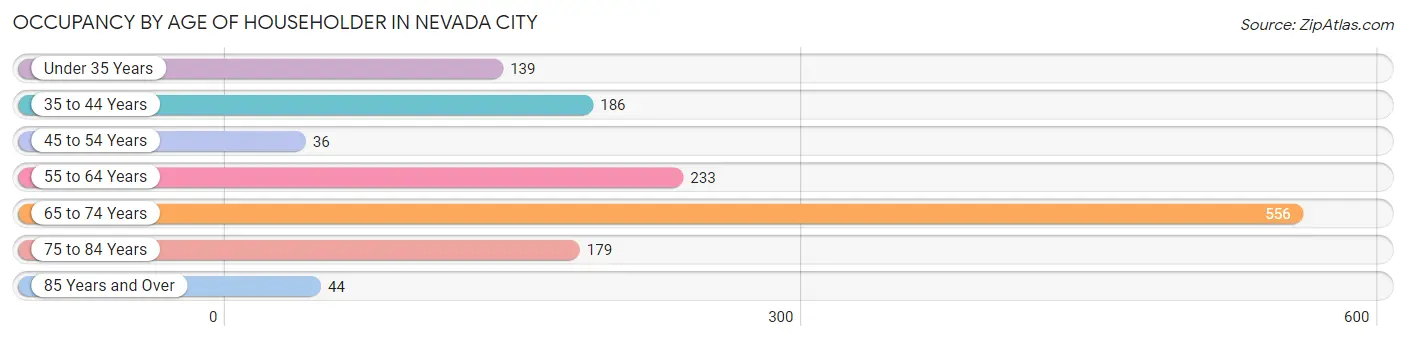
| Age Bracket | # Households | % Households |
| Under 35 Years | 139 | 10.1% |
| 35 to 44 Years | 186 | 13.6% |
| 45 to 54 Years | 36 | 2.6% |
| 55 to 64 Years | 233 | 17.0% |
| 65 to 74 Years | 556 | 40.5% |
| 75 to 84 Years | 179 | 13.0% |
| 85 Years and Over | 44 | 3.2% |
| Total | 1,373 | 100.0% |
Housing Finances in Nevada City
Median Income by Occupancy in Nevada City
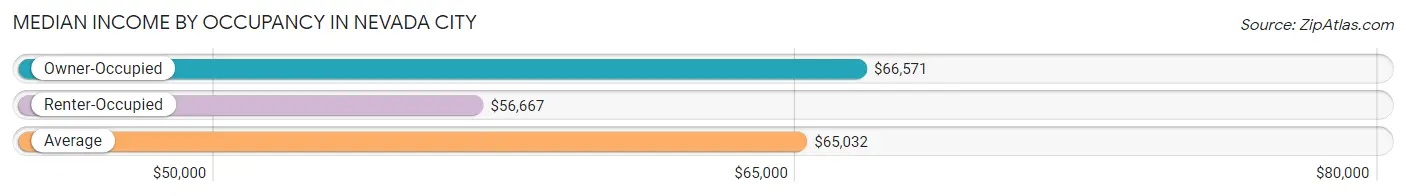
| Occupancy Type | # Households | Median Income |
| Owner-Occupied | 605 (44.1%) | $66,571 |
| Renter-Occupied | 768 (55.9%) | $56,667 |
| Average | 1,373 (100.0%) | $65,032 |
Occupancy by Householder Income Bracket in Nevada City
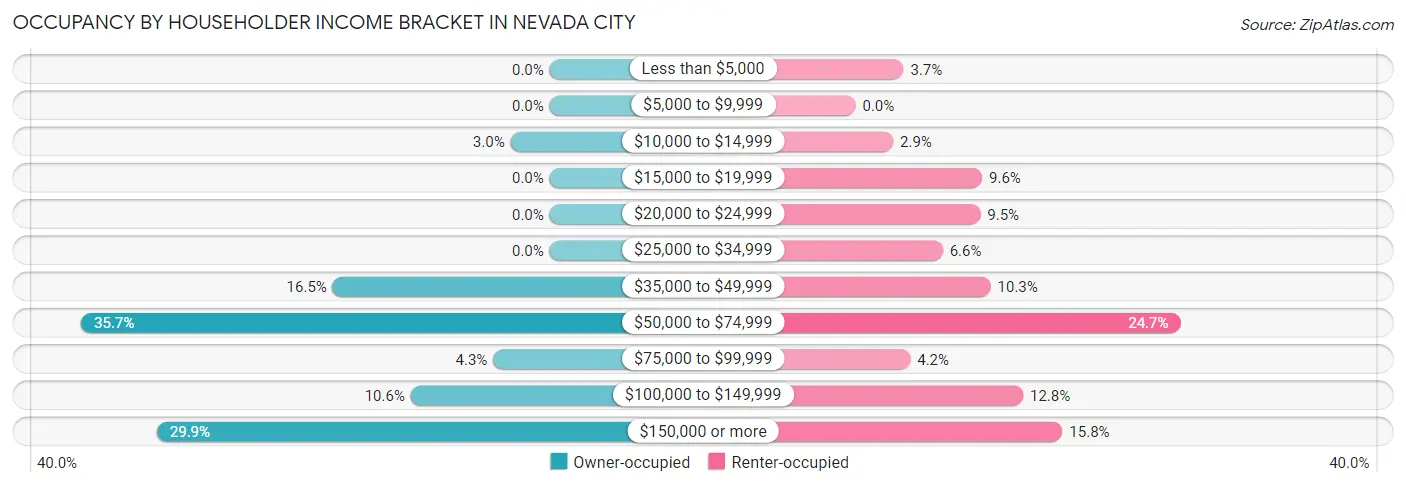
| Income Bracket | Owner-occupied | Renter-occupied |
| Less than $5,000 | 0 (0.0%) | 28 (3.6%) |
| $5,000 to $9,999 | 0 (0.0%) | 0 (0.0%) |
| $10,000 to $14,999 | 18 (3.0%) | 22 (2.9%) |
| $15,000 to $19,999 | 0 (0.0%) | 74 (9.6%) |
| $20,000 to $24,999 | 0 (0.0%) | 73 (9.5%) |
| $25,000 to $34,999 | 0 (0.0%) | 51 (6.6%) |
| $35,000 to $49,999 | 100 (16.5%) | 79 (10.3%) |
| $50,000 to $74,999 | 216 (35.7%) | 190 (24.7%) |
| $75,000 to $99,999 | 26 (4.3%) | 32 (4.2%) |
| $100,000 to $149,999 | 64 (10.6%) | 98 (12.8%) |
| $150,000 or more | 181 (29.9%) | 121 (15.8%) |
| Total | 605 (100.0%) | 768 (100.0%) |
Monthly Housing Cost Tiers in Nevada City
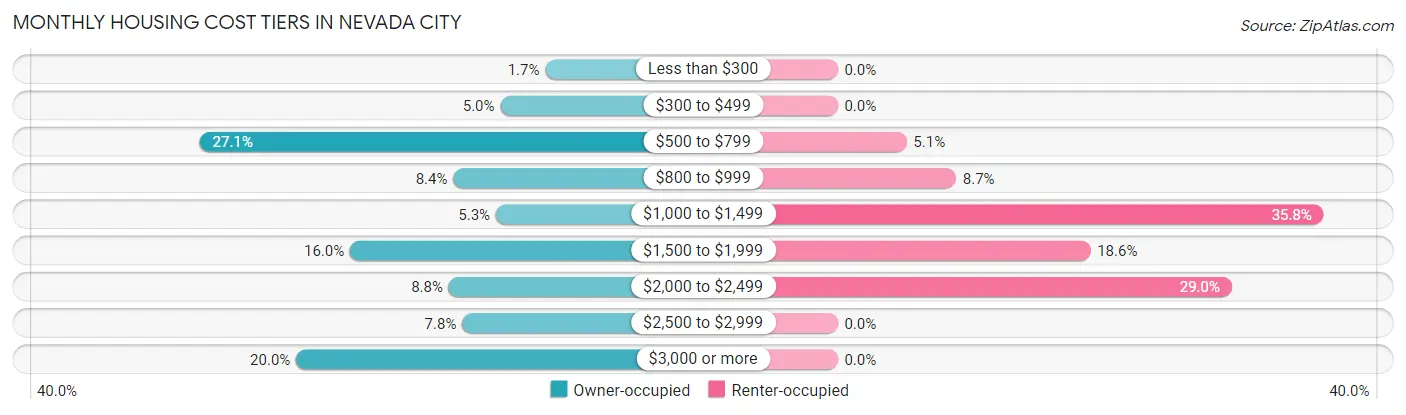
| Monthly Cost | Owner-occupied | Renter-occupied |
| Less than $300 | 10 (1.7%) | 0 (0.0%) |
| $300 to $499 | 30 (5.0%) | 0 (0.0%) |
| $500 to $799 | 164 (27.1%) | 39 (5.1%) |
| $800 to $999 | 51 (8.4%) | 67 (8.7%) |
| $1,000 to $1,499 | 32 (5.3%) | 275 (35.8%) |
| $1,500 to $1,999 | 97 (16.0%) | 143 (18.6%) |
| $2,000 to $2,499 | 53 (8.8%) | 223 (29.0%) |
| $2,500 to $2,999 | 47 (7.8%) | 0 (0.0%) |
| $3,000 or more | 121 (20.0%) | 0 (0.0%) |
| Total | 605 (100.0%) | 768 (100.0%) |
Physical Housing Characteristics in Nevada City
Housing Structures in Nevada City
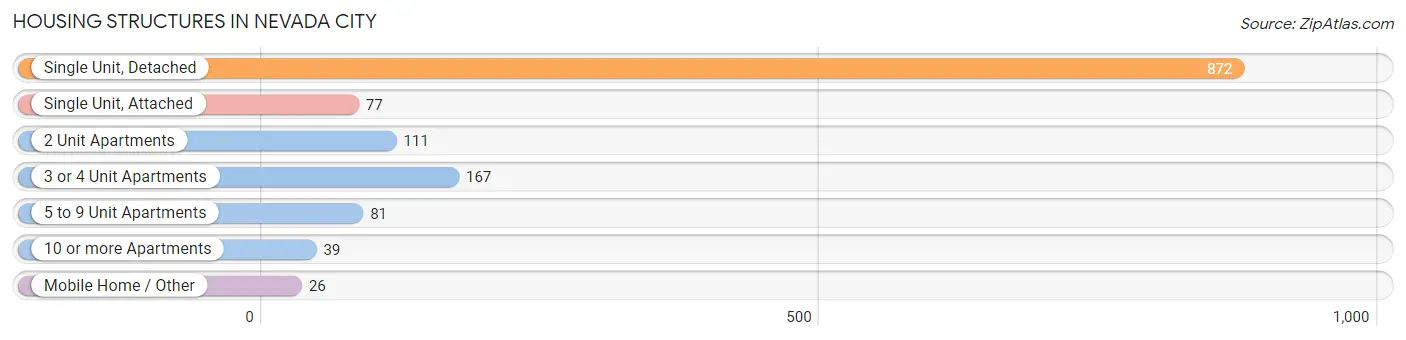
| Structure Type | # Housing Units | % Housing Units |
| Single Unit, Detached | 872 | 63.5% |
| Single Unit, Attached | 77 | 5.6% |
| 2 Unit Apartments | 111 | 8.1% |
| 3 or 4 Unit Apartments | 167 | 12.2% |
| 5 to 9 Unit Apartments | 81 | 5.9% |
| 10 or more Apartments | 39 | 2.8% |
| Mobile Home / Other | 26 | 1.9% |
| Total | 1,373 | 100.0% |
Housing Structures by Occupancy in Nevada City
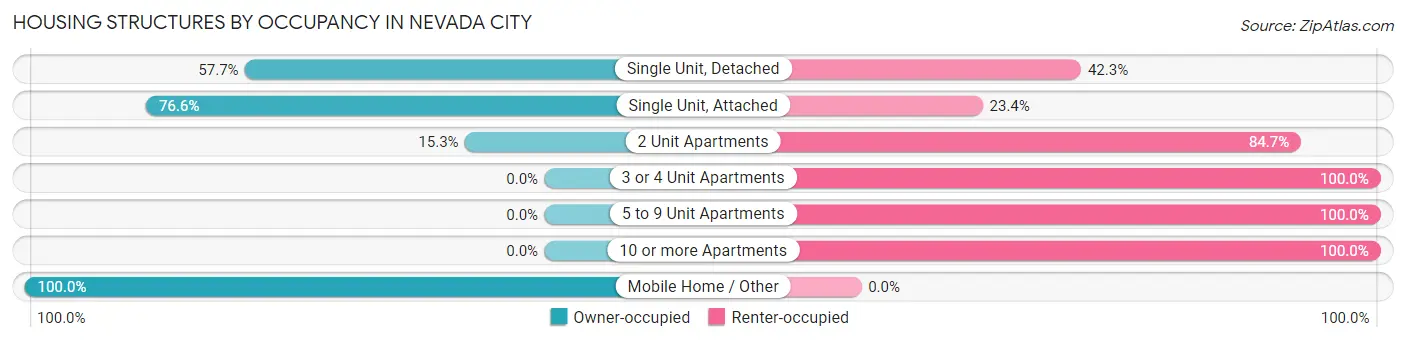
| Structure Type | Owner-occupied | Renter-occupied |
| Single Unit, Detached | 503 (57.7%) | 369 (42.3%) |
| Single Unit, Attached | 59 (76.6%) | 18 (23.4%) |
| 2 Unit Apartments | 17 (15.3%) | 94 (84.7%) |
| 3 or 4 Unit Apartments | 0 (0.0%) | 167 (100.0%) |
| 5 to 9 Unit Apartments | 0 (0.0%) | 81 (100.0%) |
| 10 or more Apartments | 0 (0.0%) | 39 (100.0%) |
| Mobile Home / Other | 26 (100.0%) | 0 (0.0%) |
| Total | 605 (44.1%) | 768 (55.9%) |
Housing Structures by Number of Rooms in Nevada City
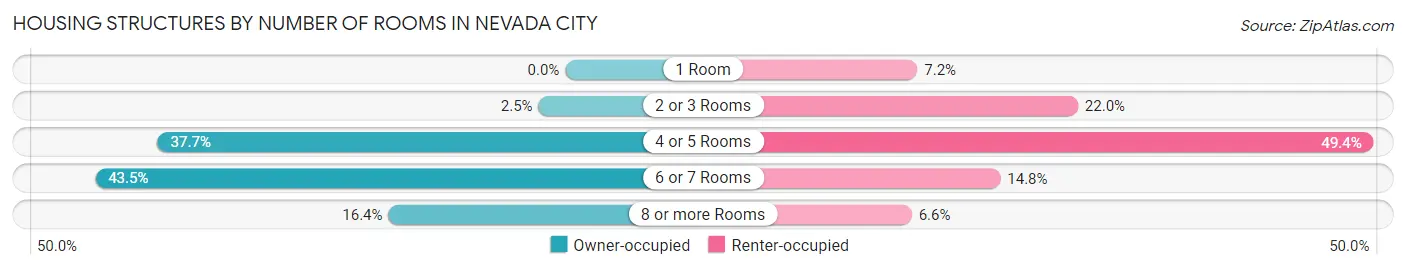
| Number of Rooms | Owner-occupied | Renter-occupied |
| 1 Room | 0 (0.0%) | 55 (7.2%) |
| 2 or 3 Rooms | 15 (2.5%) | 169 (22.0%) |
| 4 or 5 Rooms | 228 (37.7%) | 379 (49.3%) |
| 6 or 7 Rooms | 263 (43.5%) | 114 (14.8%) |
| 8 or more Rooms | 99 (16.4%) | 51 (6.6%) |
| Total | 605 (100.0%) | 768 (100.0%) |
Housing Structure by Heating Type in Nevada City
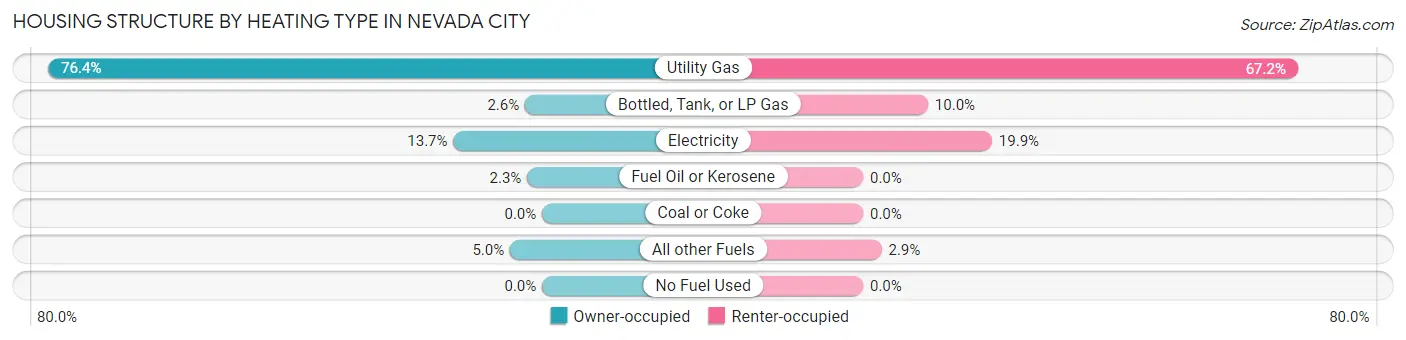
| Heating Type | Owner-occupied | Renter-occupied |
| Utility Gas | 462 (76.4%) | 516 (67.2%) |
| Bottled, Tank, or LP Gas | 16 (2.6%) | 77 (10.0%) |
| Electricity | 83 (13.7%) | 153 (19.9%) |
| Fuel Oil or Kerosene | 14 (2.3%) | 0 (0.0%) |
| Coal or Coke | 0 (0.0%) | 0 (0.0%) |
| All other Fuels | 30 (5.0%) | 22 (2.9%) |
| No Fuel Used | 0 (0.0%) | 0 (0.0%) |
| Total | 605 (100.0%) | 768 (100.0%) |
Household Vehicle Usage in Nevada City
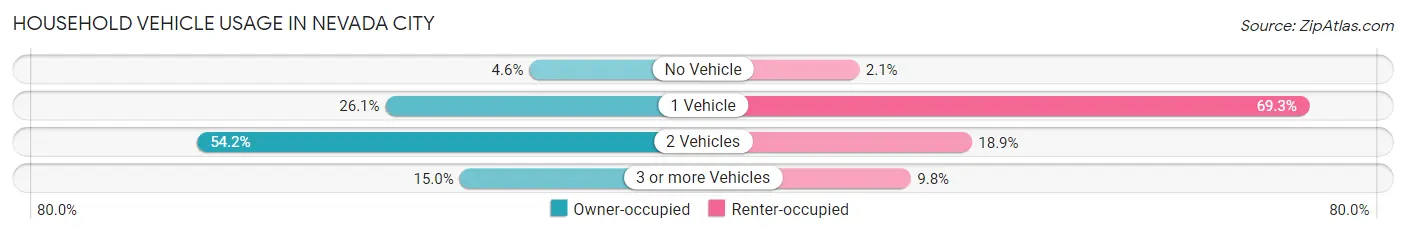
| Vehicles per Household | Owner-occupied | Renter-occupied |
| No Vehicle | 28 (4.6%) | 16 (2.1%) |
| 1 Vehicle | 158 (26.1%) | 532 (69.3%) |
| 2 Vehicles | 328 (54.2%) | 145 (18.9%) |
| 3 or more Vehicles | 91 (15.0%) | 75 (9.8%) |
| Total | 605 (100.0%) | 768 (100.0%) |
Real Estate & Mortgages in Nevada City
Real Estate and Mortgage Overview in Nevada City
| Characteristic | Without Mortgage | With Mortgage |
| Housing Units | 282 | 323 |
| Median Property Value | $606,100 | $488,300 |
| Median Household Income | $63,125 | $138 |
| Monthly Housing Costs | $680 | $121 |
| Real Estate Taxes | $2,416 | $0 |
Property Value by Mortgage Status in Nevada City
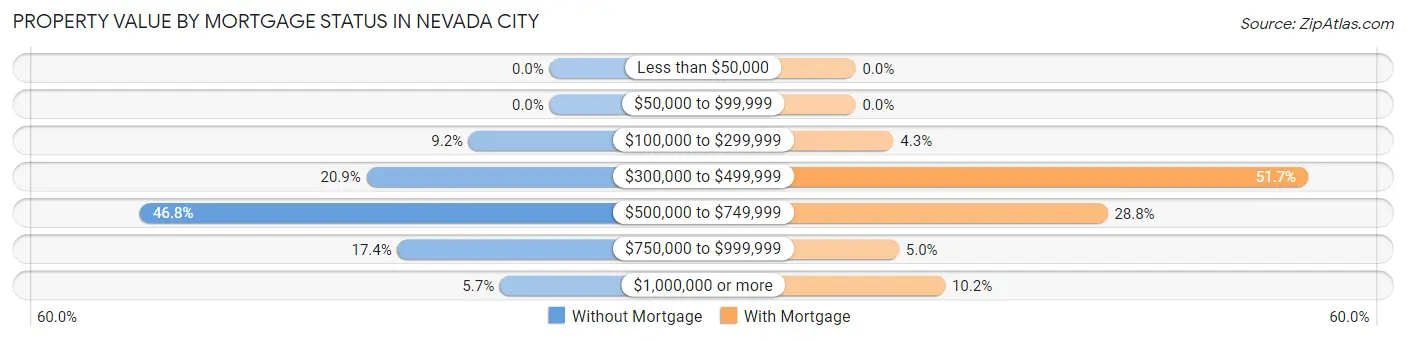
| Property Value | Without Mortgage | With Mortgage |
| Less than $50,000 | 0 (0.0%) | 0 (0.0%) |
| $50,000 to $99,999 | 0 (0.0%) | 0 (0.0%) |
| $100,000 to $299,999 | 26 (9.2%) | 14 (4.3%) |
| $300,000 to $499,999 | 59 (20.9%) | 167 (51.7%) |
| $500,000 to $749,999 | 132 (46.8%) | 93 (28.8%) |
| $750,000 to $999,999 | 49 (17.4%) | 16 (5.0%) |
| $1,000,000 or more | 16 (5.7%) | 33 (10.2%) |
| Total | 282 (100.0%) | 323 (100.0%) |
Household Income by Mortgage Status in Nevada City
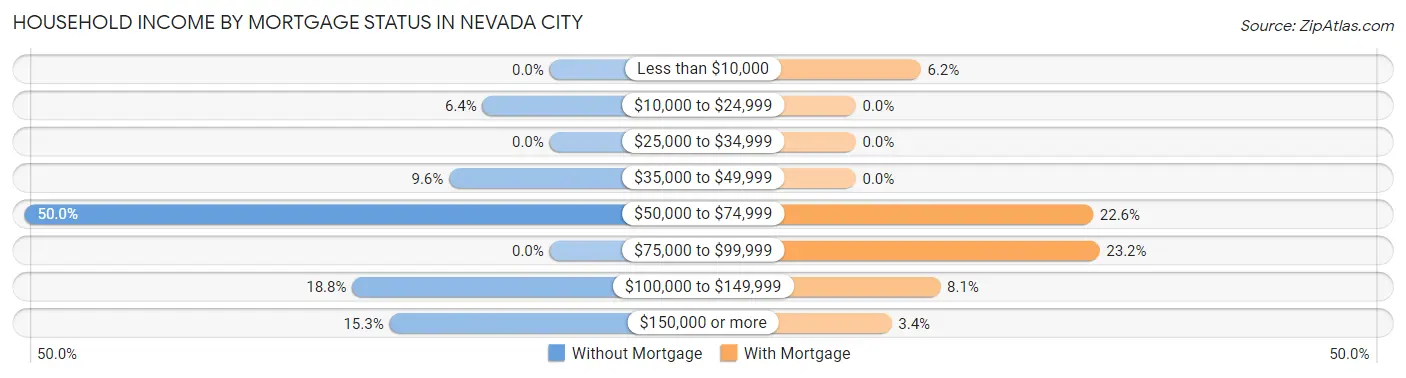
| Household Income | Without Mortgage | With Mortgage |
| Less than $10,000 | 0 (0.0%) | 20 (6.2%) |
| $10,000 to $24,999 | 18 (6.4%) | 0 (0.0%) |
| $25,000 to $34,999 | 0 (0.0%) | 0 (0.0%) |
| $35,000 to $49,999 | 27 (9.6%) | 0 (0.0%) |
| $50,000 to $74,999 | 141 (50.0%) | 73 (22.6%) |
| $75,000 to $99,999 | 0 (0.0%) | 75 (23.2%) |
| $100,000 to $149,999 | 53 (18.8%) | 26 (8.1%) |
| $150,000 or more | 43 (15.2%) | 11 (3.4%) |
| Total | 282 (100.0%) | 323 (100.0%) |
Property Value to Household Income Ratio in Nevada City
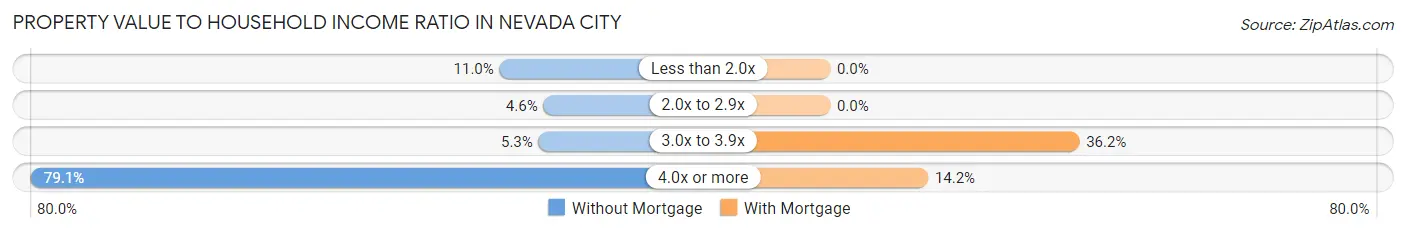
| Value-to-Income Ratio | Without Mortgage | With Mortgage |
| Less than 2.0x | 31 (11.0%) | 0 (0.0%) |
| 2.0x to 2.9x | 13 (4.6%) | 0 (0.0%) |
| 3.0x to 3.9x | 15 (5.3%) | 117 (36.2%) |
| 4.0x or more | 223 (79.1%) | 46 (14.2%) |
| Total | 282 (100.0%) | 323 (100.0%) |
Real Estate Taxes by Mortgage Status in Nevada City
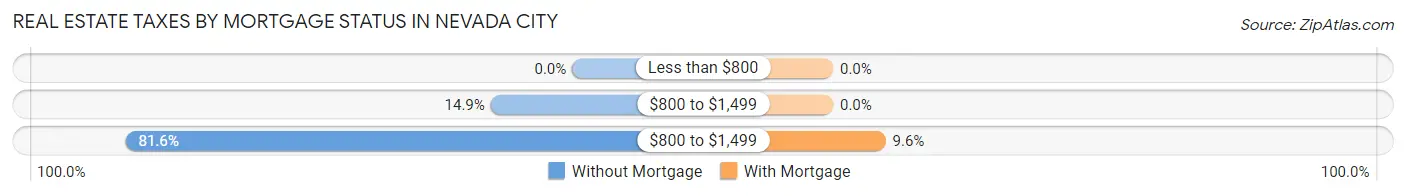
| Property Taxes | Without Mortgage | With Mortgage |
| Less than $800 | 0 (0.0%) | 0 (0.0%) |
| $800 to $1,499 | 42 (14.9%) | 0 (0.0%) |
| $800 to $1,499 | 230 (81.6%) | 31 (9.6%) |
| Total | 282 (100.0%) | 323 (100.0%) |
Health & Disability in Nevada City
Health Insurance Coverage by Age in Nevada City
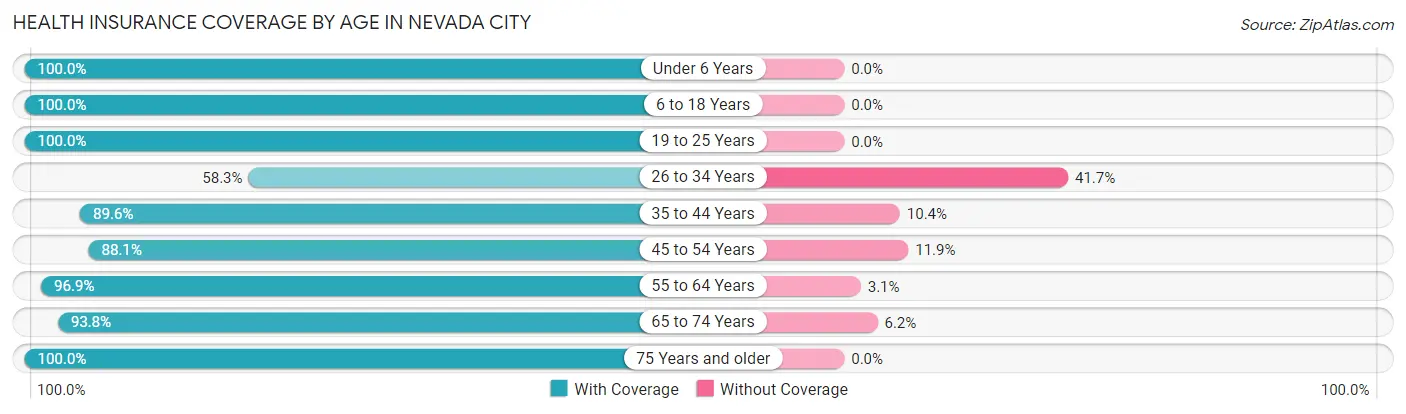
| Age Bracket | With Coverage | Without Coverage |
| Under 6 Years | 111 (100.0%) | 0 (0.0%) |
| 6 to 18 Years | 372 (100.0%) | 0 (0.0%) |
| 19 to 25 Years | 80 (100.0%) | 0 (0.0%) |
| 26 to 34 Years | 155 (58.3%) | 111 (41.7%) |
| 35 to 44 Years | 303 (89.6%) | 35 (10.4%) |
| 45 to 54 Years | 192 (88.1%) | 26 (11.9%) |
| 55 to 64 Years | 252 (96.9%) | 8 (3.1%) |
| 65 to 74 Years | 953 (93.8%) | 63 (6.2%) |
| 75 Years and older | 300 (100.0%) | 0 (0.0%) |
| Total | 2,718 (91.8%) | 243 (8.2%) |
Health Insurance Coverage by Citizenship Status in Nevada City
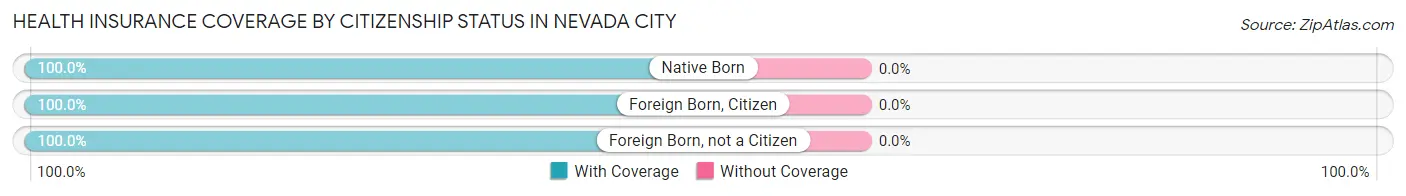
| Citizenship Status | With Coverage | Without Coverage |
| Native Born | 111 (100.0%) | 0 (0.0%) |
| Foreign Born, Citizen | 372 (100.0%) | 0 (0.0%) |
| Foreign Born, not a Citizen | 80 (100.0%) | 0 (0.0%) |
Health Insurance Coverage by Household Income in Nevada City
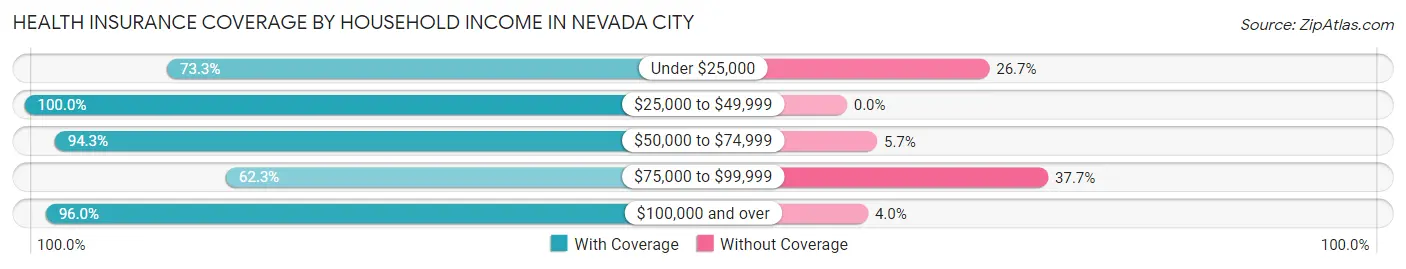
| Household Income | With Coverage | Without Coverage |
| Under $25,000 | 269 (73.3%) | 98 (26.7%) |
| $25,000 to $49,999 | 283 (100.0%) | 0 (0.0%) |
| $50,000 to $74,999 | 899 (94.3%) | 54 (5.7%) |
| $75,000 to $99,999 | 71 (62.3%) | 43 (37.7%) |
| $100,000 and over | 1,163 (96.0%) | 48 (4.0%) |
Public vs Private Health Insurance Coverage by Age in Nevada City
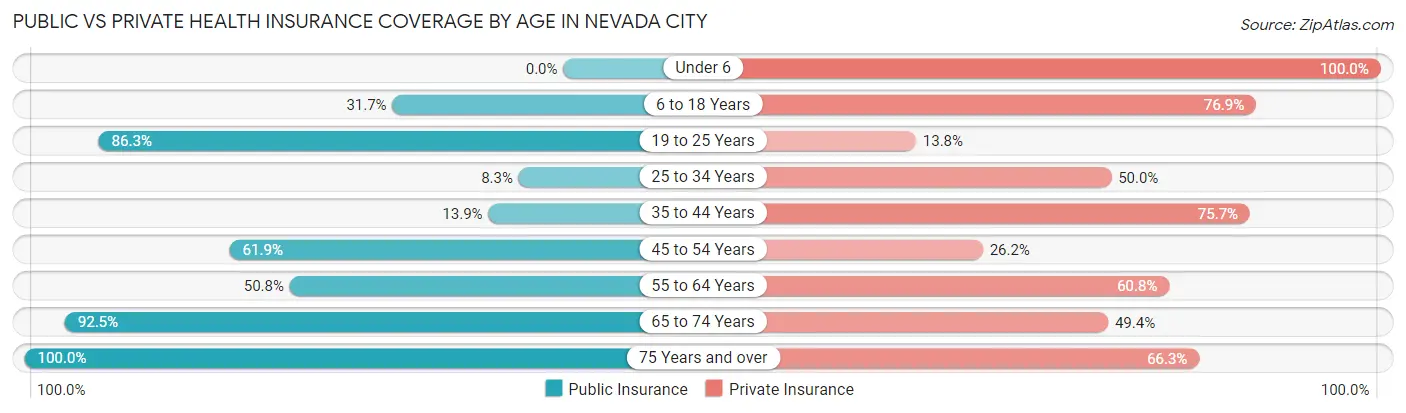
| Age Bracket | Public Insurance | Private Insurance |
| Under 6 | 0 (0.0%) | 111 (100.0%) |
| 6 to 18 Years | 118 (31.7%) | 286 (76.9%) |
| 19 to 25 Years | 69 (86.3%) | 11 (13.8%) |
| 25 to 34 Years | 22 (8.3%) | 133 (50.0%) |
| 35 to 44 Years | 47 (13.9%) | 256 (75.7%) |
| 45 to 54 Years | 135 (61.9%) | 57 (26.2%) |
| 55 to 64 Years | 132 (50.8%) | 158 (60.8%) |
| 65 to 74 Years | 940 (92.5%) | 502 (49.4%) |
| 75 Years and over | 300 (100.0%) | 199 (66.3%) |
| Total | 1,763 (59.5%) | 1,713 (57.9%) |
Disability Status by Sex by Age in Nevada City
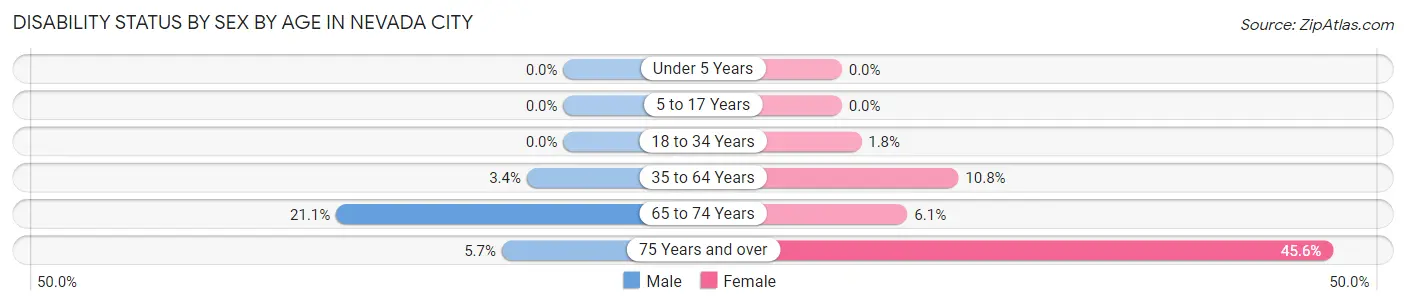
| Age Bracket | Male | Female |
| Under 5 Years | 0 (0.0%) | 0 (0.0%) |
| 5 to 17 Years | 0 (0.0%) | 0 (0.0%) |
| 18 to 34 Years | 0 (0.0%) | 4 (1.8%) |
| 35 to 64 Years | 12 (3.4%) | 50 (10.8%) |
| 65 to 74 Years | 93 (21.1%) | 35 (6.1%) |
| 75 Years and over | 10 (5.7%) | 57 (45.6%) |
Disability Class by Sex by Age in Nevada City
Disability Class: Hearing Difficulty
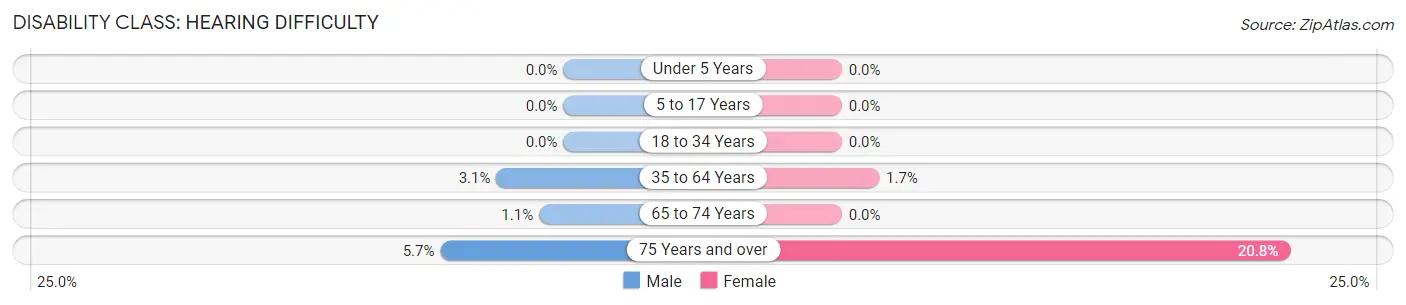
| Age Bracket | Male | Female |
| Under 5 Years | 0 (0.0%) | 0 (0.0%) |
| 5 to 17 Years | 0 (0.0%) | 0 (0.0%) |
| 18 to 34 Years | 0 (0.0%) | 0 (0.0%) |
| 35 to 64 Years | 11 (3.1%) | 8 (1.7%) |
| 65 to 74 Years | 5 (1.1%) | 0 (0.0%) |
| 75 Years and over | 10 (5.7%) | 26 (20.8%) |
Disability Class: Vision Difficulty
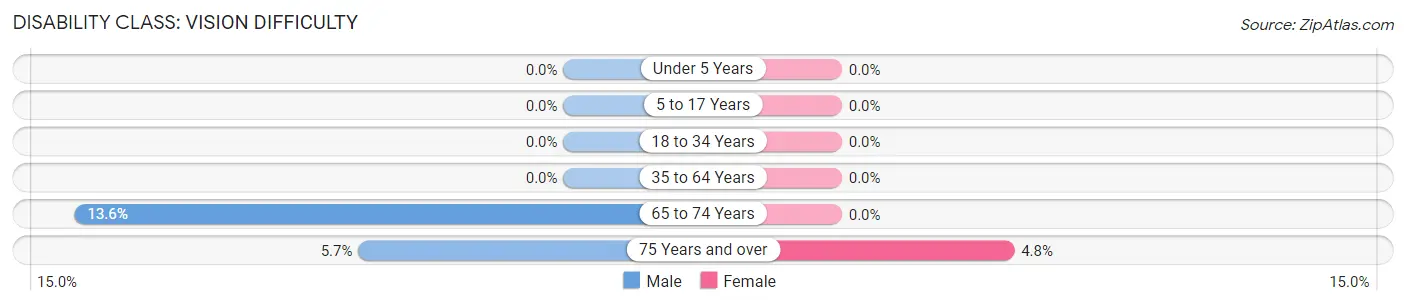
| Age Bracket | Male | Female |
| Under 5 Years | 0 (0.0%) | 0 (0.0%) |
| 5 to 17 Years | 0 (0.0%) | 0 (0.0%) |
| 18 to 34 Years | 0 (0.0%) | 0 (0.0%) |
| 35 to 64 Years | 0 (0.0%) | 0 (0.0%) |
| 65 to 74 Years | 60 (13.6%) | 0 (0.0%) |
| 75 Years and over | 10 (5.7%) | 6 (4.8%) |
Disability Class: Cognitive Difficulty
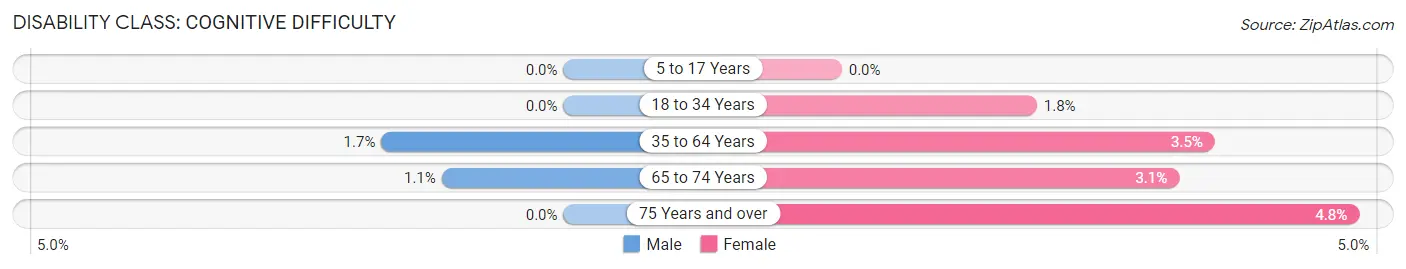
| Age Bracket | Male | Female |
| 5 to 17 Years | 0 (0.0%) | 0 (0.0%) |
| 18 to 34 Years | 0 (0.0%) | 4 (1.8%) |
| 35 to 64 Years | 6 (1.7%) | 16 (3.5%) |
| 65 to 74 Years | 5 (1.1%) | 18 (3.1%) |
| 75 Years and over | 0 (0.0%) | 6 (4.8%) |
Disability Class: Ambulatory Difficulty
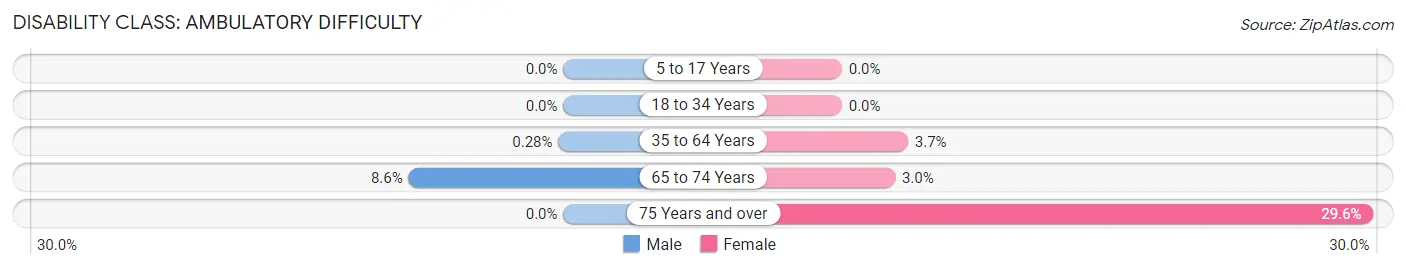
| Age Bracket | Male | Female |
| 5 to 17 Years | 0 (0.0%) | 0 (0.0%) |
| 18 to 34 Years | 0 (0.0%) | 0 (0.0%) |
| 35 to 64 Years | 1 (0.3%) | 17 (3.7%) |
| 65 to 74 Years | 38 (8.6%) | 17 (3.0%) |
| 75 Years and over | 0 (0.0%) | 37 (29.6%) |
Disability Class: Self-Care Difficulty
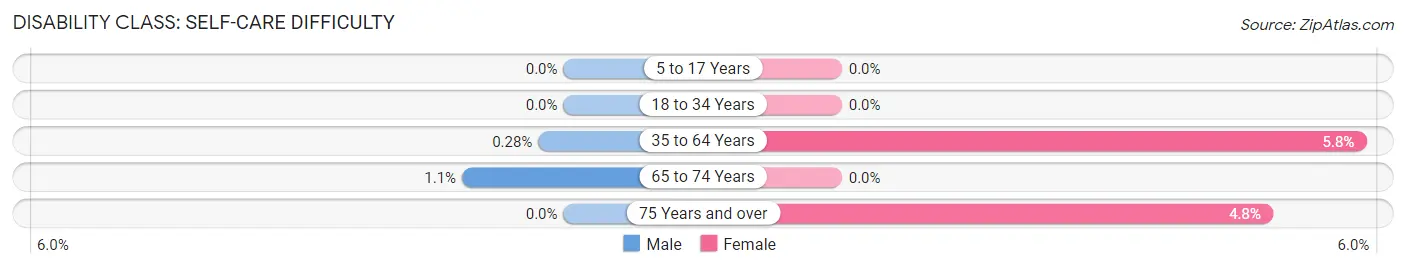
| Age Bracket | Male | Female |
| 5 to 17 Years | 0 (0.0%) | 0 (0.0%) |
| 18 to 34 Years | 0 (0.0%) | 0 (0.0%) |
| 35 to 64 Years | 1 (0.3%) | 27 (5.8%) |
| 65 to 74 Years | 5 (1.1%) | 0 (0.0%) |
| 75 Years and over | 0 (0.0%) | 6 (4.8%) |
Technology Access in Nevada City
Computing Device Access in Nevada City
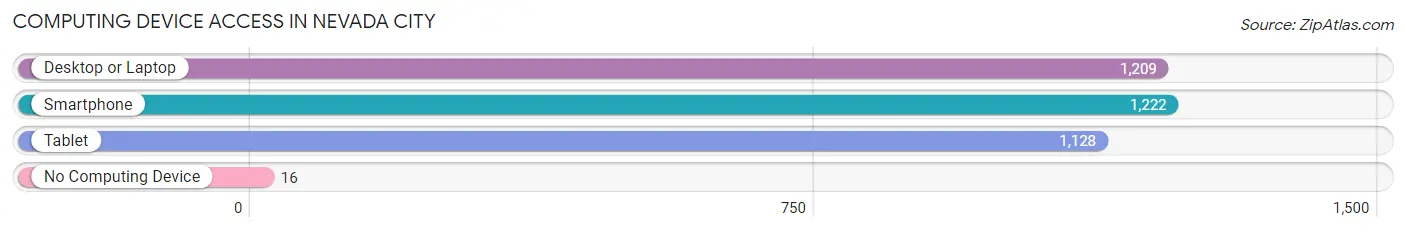
| Device Type | # Households | % Households |
| Desktop or Laptop | 1,209 | 88.1% |
| Smartphone | 1,222 | 89.0% |
| Tablet | 1,128 | 82.2% |
| No Computing Device | 16 | 1.2% |
| Total | 1,373 | 100.0% |
Internet Access in Nevada City
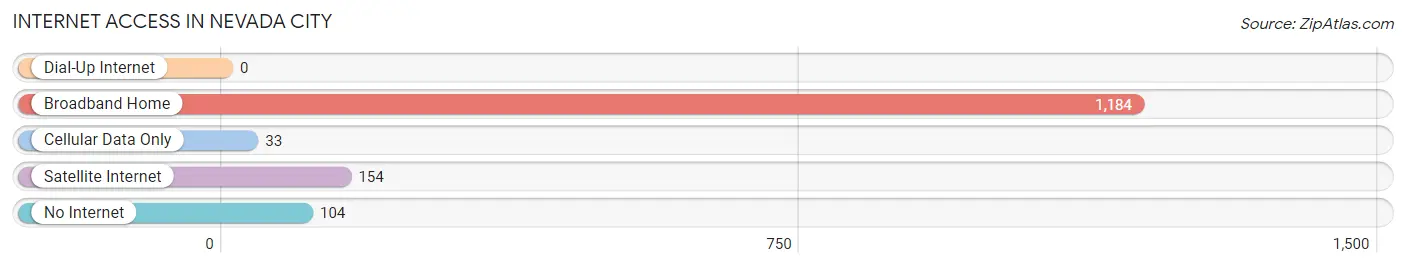
| Internet Type | # Households | % Households |
| Dial-Up Internet | 0 | 0.0% |
| Broadband Home | 1,184 | 86.2% |
| Cellular Data Only | 33 | 2.4% |
| Satellite Internet | 154 | 11.2% |
| No Internet | 104 | 7.6% |
| Total | 1,373 | 100.0% |
Nevada City Summary
Nevada City is a small city located in the Sierra Nevada foothills of California, about 40 miles northeast of Sacramento. It is the county seat of Nevada County and has a population of about 3,000 people. The city is known for its historic downtown, which is listed on the National Register of Historic Places, and its many outdoor activities, such as hiking, biking, and skiing.
Geography
Nevada City is located in the Sierra Nevada foothills of California, about 40 miles northeast of Sacramento. It is situated at an elevation of 2,500 feet and is surrounded by the Yuba River, Deer Creek, and the South Yuba River. The city is located in a valley surrounded by the Sierra Nevada Mountains to the east and the Coast Range to the west. The city is located in a temperate climate, with hot summers and cold winters.
Economy
The economy of Nevada City is largely based on tourism, with many visitors coming to the city to enjoy its outdoor activities and historic downtown. The city is also home to several small businesses, including restaurants, shops, and galleries. The city is also home to several wineries, breweries, and distilleries. Additionally, the city is home to several technology companies, such as the Nevada City Technology Center, which is a hub for tech startups.
Demographics
As of the 2010 census, the population of Nevada City was 3,068. The racial makeup of the city was 91.3% White, 0.7% African American, 0.7% Native American, 1.2% Asian, 0.2% Pacific Islander, 2.3% from other races, and 3.8% from two or more races. The median household income was $50,945, and the median family income was $60,945.
History
Nevada City was founded in 1849 during the California Gold Rush. The city was originally known as Deer Creek Dry Diggins, but was later renamed Nevada City after the Nevada Territory. The city quickly grew in population and became an important center for mining and commerce. In 1851, the city was incorporated and became the county seat of Nevada County.
In the late 19th century, Nevada City became a popular tourist destination, with many visitors coming to the city to enjoy its outdoor activities and historic downtown. The city was also home to several prominent figures, including Mark Twain, who wrote about his experiences in the city in his book Roughing It.
Today, Nevada City is still a popular tourist destination, with many visitors coming to the city to enjoy its outdoor activities and historic downtown. The city is also home to several small businesses, wineries, breweries, and distilleries, as well as several technology companies.
Common Questions
What is Per Capita Income in Nevada City?
Per Capita income in Nevada City is $47,936.
What is the Median Family Income in Nevada City?
Median Family Income in Nevada City is $73,750.
What is the Median Household income in Nevada City?
Median Household Income in Nevada City is $65,032.
What is Income or Wage Gap in Nevada City?
Income or Wage Gap in Nevada City is 32.0%.
Women in Nevada City earn 68.0 cents for every dollar earned by a man.
What is Inequality or Gini Index in Nevada City?
Inequality or Gini Index in Nevada City is 0.46.
What is the Total Population of Nevada City?
Total Population of Nevada City is 3,142.
What is the Total Male Population of Nevada City?
Total Male Population of Nevada City is 1,489.
What is the Total Female Population of Nevada City?
Total Female Population of Nevada City is 1,653.
What is the Ratio of Males per 100 Females in Nevada City?
There are 90.08 Males per 100 Females in Nevada City.
What is the Ratio of Females per 100 Males in Nevada City?
There are 111.01 Females per 100 Males in Nevada City.
What is the Median Population Age in Nevada City?
Median Population Age in Nevada City is 56.5 Years.
What is the Average Family Size in Nevada City
Average Family Size in Nevada City is 3.0 People.
What is the Average Household Size in Nevada City
Average Household Size in Nevada City is 2.1 People.
How Large is the Labor Force in Nevada City?
There are 1,441 People in the Labor Forcein in Nevada City.
What is the Percentage of People in the Labor Force in Nevada City?
53.1% of People are in the Labor Force in Nevada City.
What is the Unemployment Rate in Nevada City?
Unemployment Rate in Nevada City is 1.8%.