Murphys, CA Map & Demographics
Murphys Map
Murphys Overview
$35,815
PER CAPITA INCOME
$78,750
AVG FAMILY INCOME
$51,989
AVG HOUSEHOLD INCOME
44.7%
WAGE / INCOME GAP [ % ]
55.3¢/ $1
WAGE / INCOME GAP [ $ ]
0.43
INEQUALITY / GINI INDEX
2,022
TOTAL POPULATION
1,008
MALE POPULATION
1,014
FEMALE POPULATION
99.41
MALES / 100 FEMALES
100.60
FEMALES / 100 MALES
60.7
MEDIAN AGE
2.8
AVG FAMILY SIZE
2.2
AVG HOUSEHOLD SIZE
758
LABOR FORCE [ PEOPLE ]
40.6%
PERCENT IN LABOR FORCE
2.4%
UNEMPLOYMENT RATE
Murphys Zip Codes
Murphys Area Codes
Income in Murphys
Income Overview in Murphys
Per Capita Income in Murphys is $35,815, while median incomes of families and households are $78,750 and $51,989 respectively.
| Characteristic | Number | Measure |
| Per Capita Income | 2,022 | $35,815 |
| Median Family Income | 500 | $78,750 |
| Mean Family Income | 500 | $72,362 |
| Median Household Income | 899 | $51,989 |
| Mean Household Income | 899 | $73,541 |
| Income Deficit | 500 | $0 |
| Wage / Income Gap (%) | 2,022 | 44.73% |
| Wage / Income Gap ($) | 2,022 | 55.27¢ per $1 |
| Gini / Inequality Index | 2,022 | 0.43 |
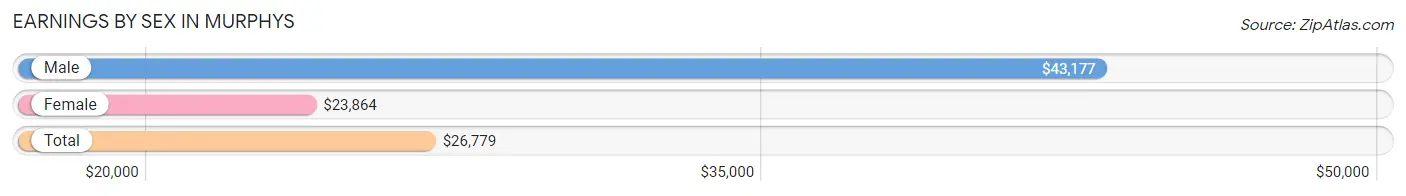
Earnings by Sex in Murphys
Average Earnings in Murphys are $26,779, $43,177 for men and $23,864 for women, a difference of 44.7%.
| Sex | Number | Average Earnings |
| Male | 472 (54.4%) | $43,177 |
| Female | 396 (45.6%) | $23,864 |
| Total | 868 (100.0%) | $26,779 |
Earnings by Sex by Income Bracket in Murphys
The most common earnings brackets in Murphys are $75,000 to $99,999 for men (55 | 11.7%) and $10,000 to $12,499 for women (102 | 25.8%).
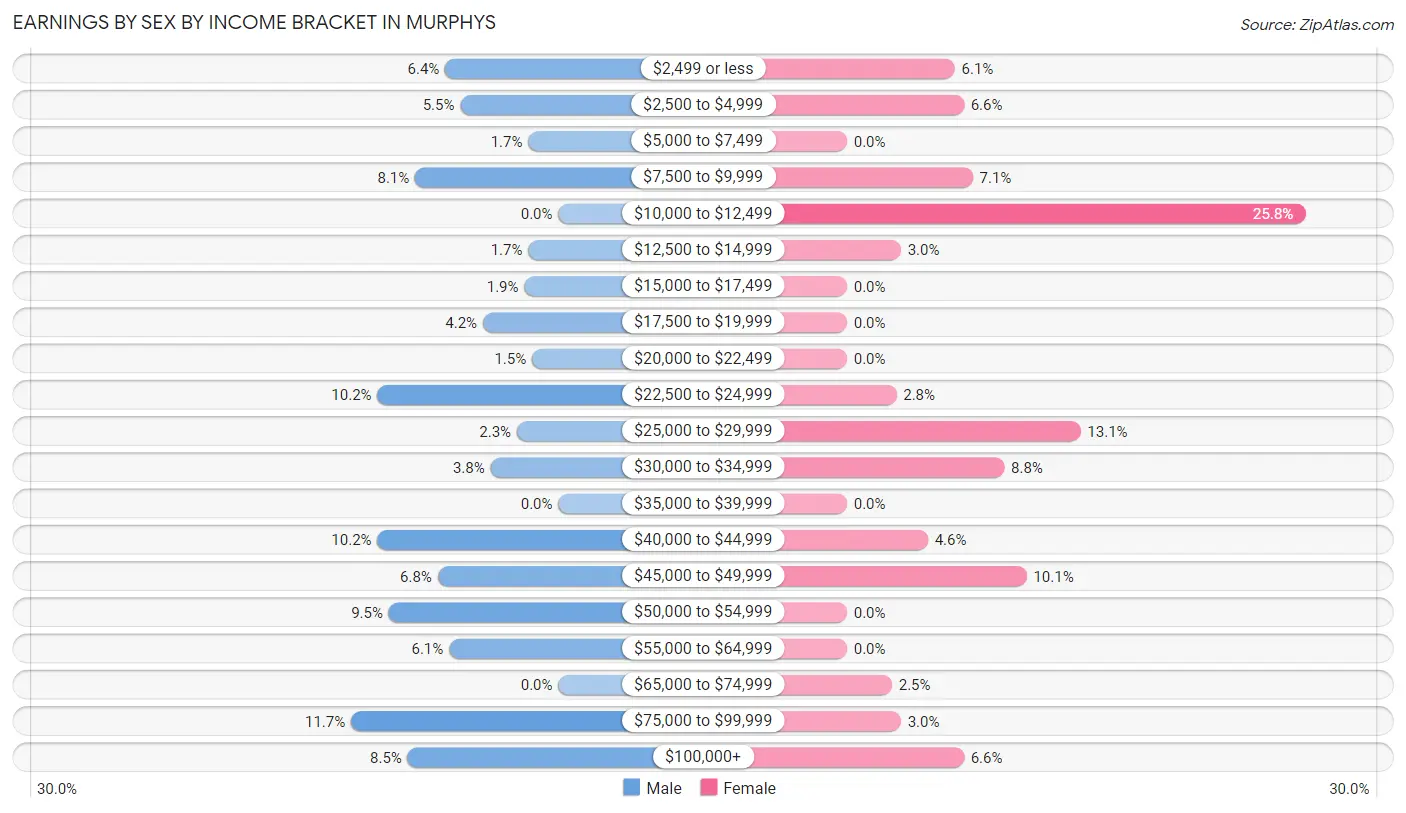
| Income | Male | Female |
| $2,499 or less | 30 (6.4%) | 24 (6.1%) |
| $2,500 to $4,999 | 26 (5.5%) | 26 (6.6%) |
| $5,000 to $7,499 | 8 (1.7%) | 0 (0.0%) |
| $7,500 to $9,999 | 38 (8.1%) | 28 (7.1%) |
| $10,000 to $12,499 | 0 (0.0%) | 102 (25.8%) |
| $12,500 to $14,999 | 8 (1.7%) | 12 (3.0%) |
| $15,000 to $17,499 | 9 (1.9%) | 0 (0.0%) |
| $17,500 to $19,999 | 20 (4.2%) | 0 (0.0%) |
| $20,000 to $22,499 | 7 (1.5%) | 0 (0.0%) |
| $22,500 to $24,999 | 48 (10.2%) | 11 (2.8%) |
| $25,000 to $29,999 | 11 (2.3%) | 52 (13.1%) |
| $30,000 to $34,999 | 18 (3.8%) | 35 (8.8%) |
| $35,000 to $39,999 | 0 (0.0%) | 0 (0.0%) |
| $40,000 to $44,999 | 48 (10.2%) | 18 (4.5%) |
| $45,000 to $49,999 | 32 (6.8%) | 40 (10.1%) |
| $50,000 to $54,999 | 45 (9.5%) | 0 (0.0%) |
| $55,000 to $64,999 | 29 (6.1%) | 0 (0.0%) |
| $65,000 to $74,999 | 0 (0.0%) | 10 (2.5%) |
| $75,000 to $99,999 | 55 (11.7%) | 12 (3.0%) |
| $100,000+ | 40 (8.5%) | 26 (6.6%) |
| Total | 472 (100.0%) | 396 (100.0%) |
Earnings by Sex by Educational Attainment in Murphys
Average earnings in Murphys are $43,359 for men and $26,154 for women, a difference of 39.7%. Men with an educational attainment of high school diploma enjoy the highest average annual earnings of $43,958, while those with high school diploma education earn the least with $43,958. Women with an educational attainment of high school diploma earn the most with the average annual earnings of $31,898, while those with bachelor's degree education have the smallest earnings of $11,000.
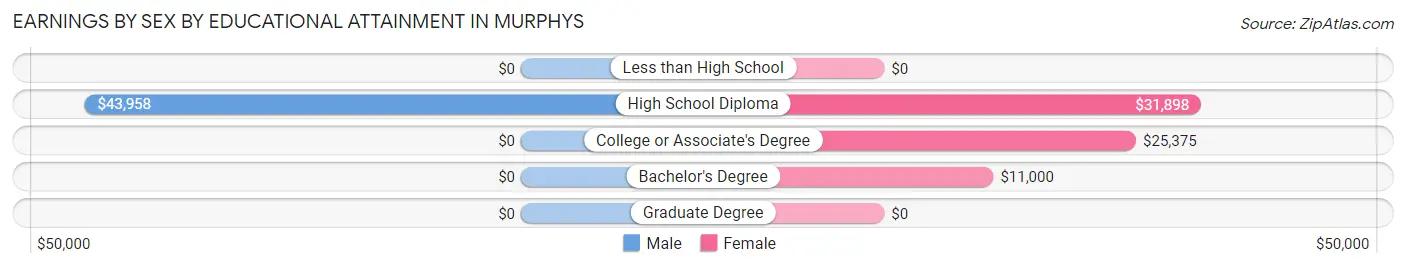
| Educational Attainment | Male Income | Female Income |
| Less than High School | - | - |
| High School Diploma | $43,958 | $31,898 |
| College or Associate's Degree | - | - |
| Bachelor's Degree | - | - |
| Graduate Degree | - | - |
| Total | $43,359 | $26,154 |
Family Income in Murphys
Family Income Brackets in Murphys
According to the Murphys family income data, there are 159 families falling into the $75,000 to $99,999 income range, which is the most common income bracket and makes up 31.8% of all families.
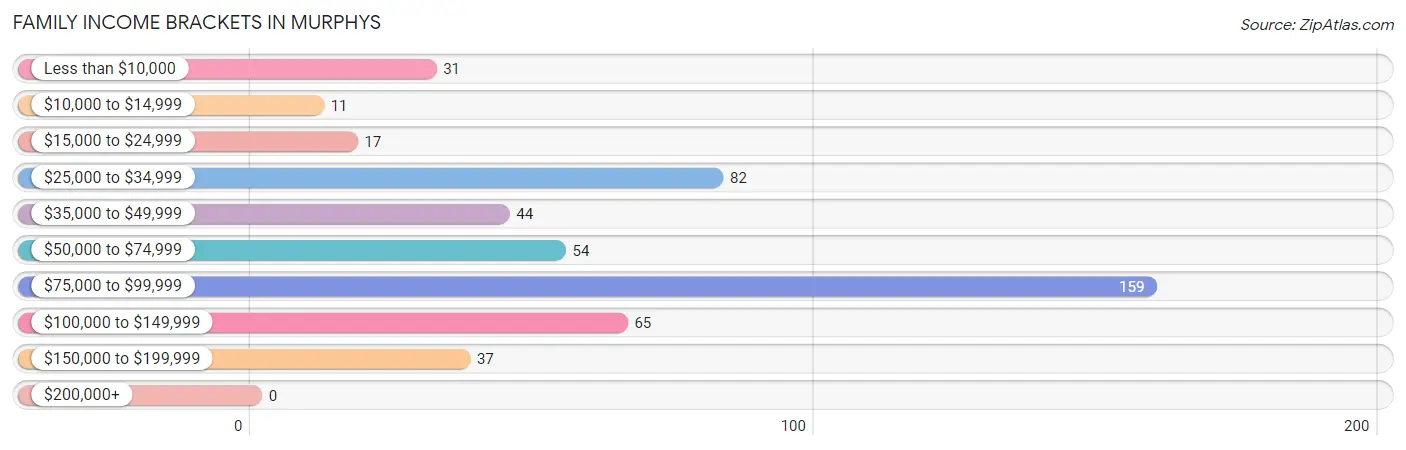
| Income Bracket | # Families | % Families |
| Less than $10,000 | 31 | 6.2% |
| $10,000 to $14,999 | 11 | 2.2% |
| $15,000 to $24,999 | 17 | 3.4% |
| $25,000 to $34,999 | 82 | 16.4% |
| $35,000 to $49,999 | 44 | 8.8% |
| $50,000 to $74,999 | 54 | 10.8% |
| $75,000 to $99,999 | 159 | 31.8% |
| $100,000 to $149,999 | 65 | 13.0% |
| $150,000 to $199,999 | 37 | 7.4% |
| $200,000+ | 0 | 0.0% |
Family Income by Famaliy Size in Murphys
3-person families (23 | 4.6%) account for the highest median family income in Murphys with $106,477 per family, while 3-person families (23 | 4.6%) have the highest median income of $35,492 per family member.
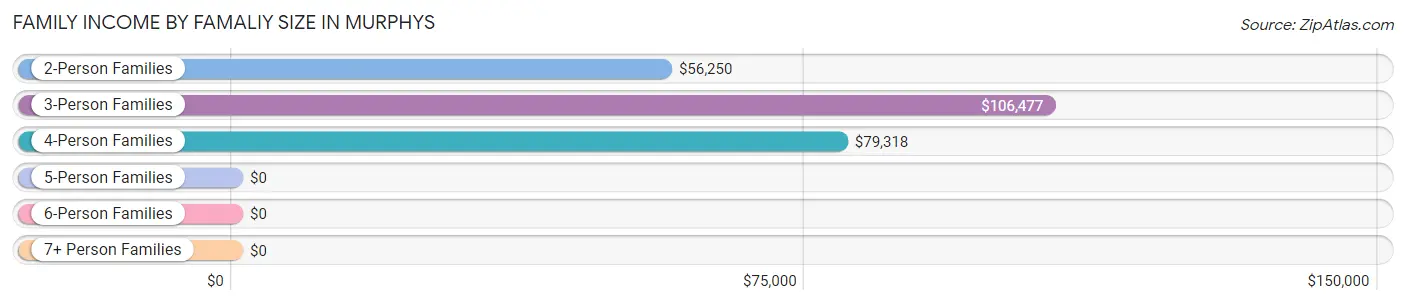
| Income Bracket | # Families | Median Income |
| 2-Person Families | 391 (78.2%) | $56,250 |
| 3-Person Families | 23 (4.6%) | $106,477 |
| 4-Person Families | 66 (13.2%) | $79,318 |
| 5-Person Families | 9 (1.8%) | $0 |
| 6-Person Families | 0 (0.0%) | $0 |
| 7+ Person Families | 11 (2.2%) | $0 |
| Total | 500 (100.0%) | $78,750 |
Family Income by Number of Earners in Murphys
The median family income in Murphys is $78,750, with families comprising 2 earners (73) having the highest median family income of $97,986, while families with no earners (184) have the lowest median family income of $47,167, accounting for 14.6% and 36.8% of families, respectively.
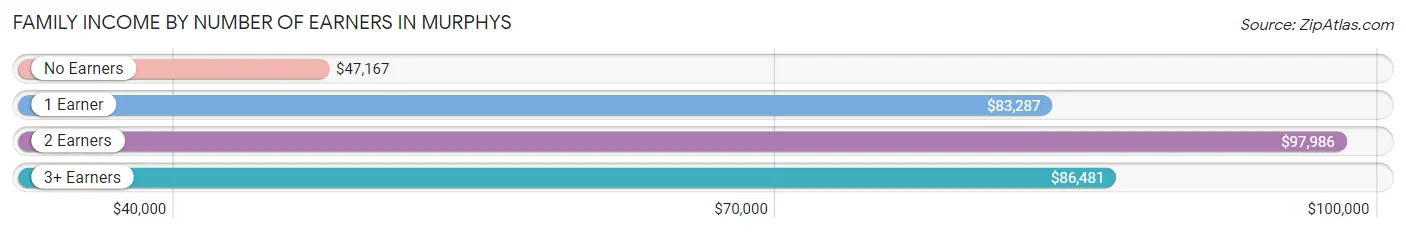
| Number of Earners | # Families | Median Income |
| No Earners | 184 (36.8%) | $47,167 |
| 1 Earner | 177 (35.4%) | $83,287 |
| 2 Earners | 73 (14.6%) | $97,986 |
| 3+ Earners | 66 (13.2%) | $86,481 |
| Total | 500 (100.0%) | $78,750 |
Household Income in Murphys
Household Income Brackets in Murphys
With 151 households falling in the category, the $75,000 to $99,999 income range is the most frequent in Murphys, accounting for 16.8% of all households. In contrast, only 29 households (3.2%) fall into the $200,000+ income bracket, making it the least populous group.
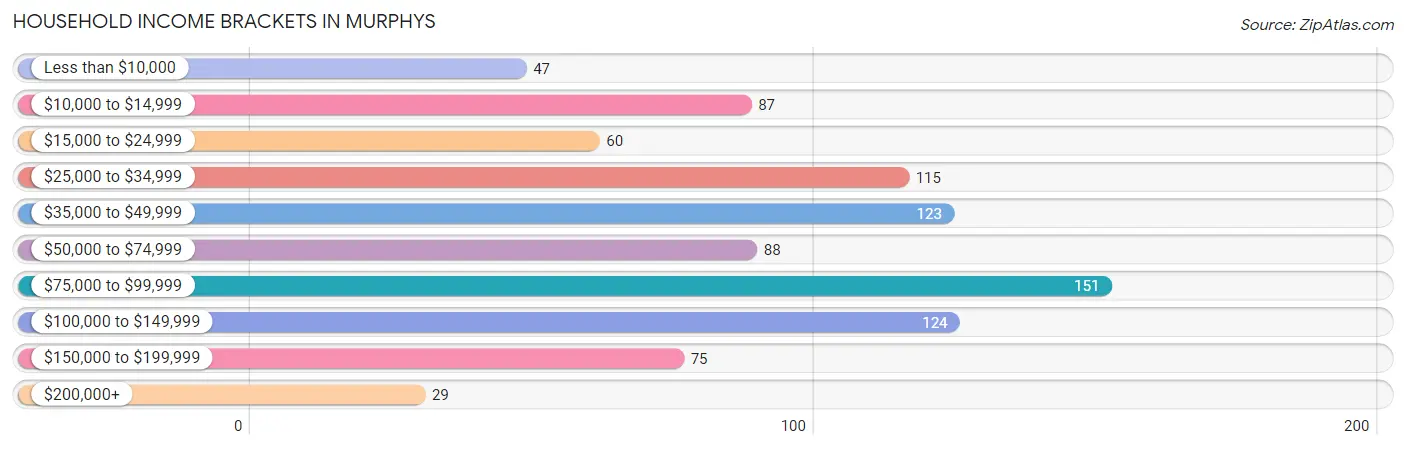
| Income Bracket | # Households | % Households |
| Less than $10,000 | 47 | 5.2% |
| $10,000 to $14,999 | 87 | 9.7% |
| $15,000 to $24,999 | 60 | 6.7% |
| $25,000 to $34,999 | 115 | 12.8% |
| $35,000 to $49,999 | 123 | 13.7% |
| $50,000 to $74,999 | 88 | 9.8% |
| $75,000 to $99,999 | 151 | 16.8% |
| $100,000 to $149,999 | 124 | 13.8% |
| $150,000 to $199,999 | 75 | 8.3% |
| $200,000+ | 29 | 3.2% |
Household Income by Householder Age in Murphys
The median household income in Murphys is $51,989, with the highest median household income of $103,750 found in the 45 to 64 years age bracket for the primary householder. A total of 264 households (29.4%) fall into this category.
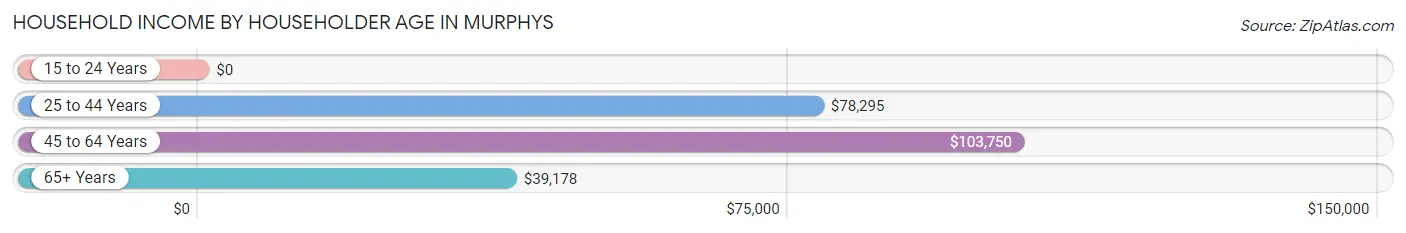
| Income Bracket | # Households | Median Income |
| 15 to 24 Years | 0 (0.0%) | $0 |
| 25 to 44 Years | 54 (6.0%) | $78,295 |
| 45 to 64 Years | 264 (29.4%) | $103,750 |
| 65+ Years | 581 (64.6%) | $39,178 |
| Total | 899 (100.0%) | $51,989 |
Poverty in Murphys
Income Below Poverty by Sex and Age in Murphys
With 13.2% poverty level for males and 11.4% for females among the residents of Murphys, 35 to 44 year old males and 12 to 14 year old females are the most vulnerable to poverty, with 48 males (48.0%) and 7 females (100.0%) in their respective age groups living below the poverty level.
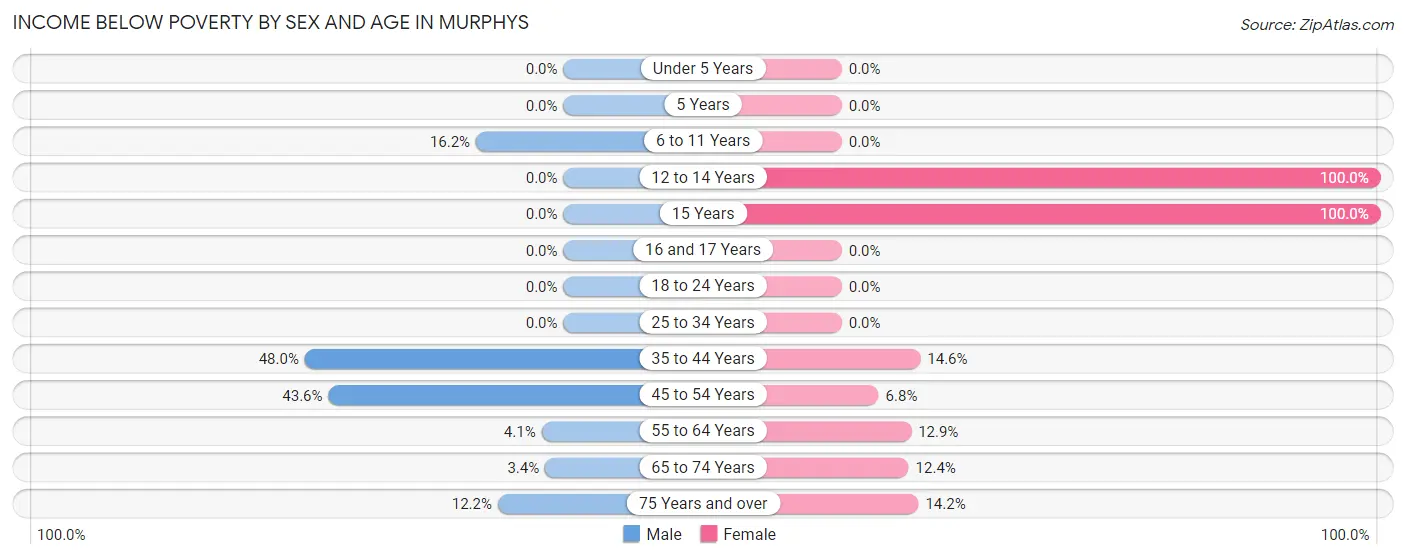
| Age Bracket | Male | Female |
| Under 5 Years | 0 (0.0%) | 0 (0.0%) |
| 5 Years | 0 (0.0%) | 0 (0.0%) |
| 6 to 11 Years | 6 (16.2%) | 0 (0.0%) |
| 12 to 14 Years | 0 (0.0%) | 7 (100.0%) |
| 15 Years | 0 (0.0%) | 10 (100.0%) |
| 16 and 17 Years | 0 (0.0%) | 0 (0.0%) |
| 18 to 24 Years | 0 (0.0%) | 0 (0.0%) |
| 25 to 34 Years | 0 (0.0%) | 0 (0.0%) |
| 35 to 44 Years | 48 (48.0%) | 7 (14.6%) |
| 45 to 54 Years | 41 (43.6%) | 8 (6.8%) |
| 55 to 64 Years | 8 (4.1%) | 17 (12.9%) |
| 65 to 74 Years | 8 (3.4%) | 33 (12.4%) |
| 75 Years and over | 18 (12.2%) | 34 (14.2%) |
| Total | 129 (13.2%) | 116 (11.4%) |
Income Above Poverty by Sex and Age in Murphys
According to the poverty statistics in Murphys, males aged 5 years and females aged under 5 years are the age groups that are most secure financially, with 100.0% of males and 100.0% of females in these age groups living above the poverty line.
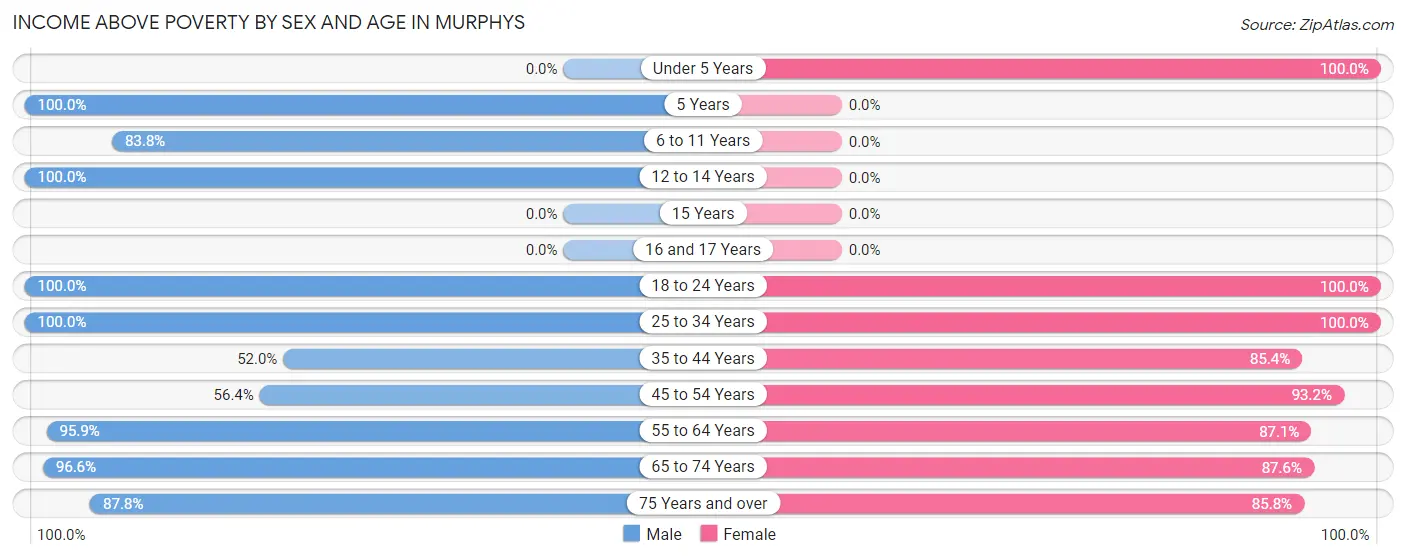
| Age Bracket | Male | Female |
| Under 5 Years | 0 (0.0%) | 20 (100.0%) |
| 5 Years | 24 (100.0%) | 0 (0.0%) |
| 6 to 11 Years | 31 (83.8%) | 0 (0.0%) |
| 12 to 14 Years | 31 (100.0%) | 0 (0.0%) |
| 15 Years | 0 (0.0%) | 0 (0.0%) |
| 16 and 17 Years | 0 (0.0%) | 0 (0.0%) |
| 18 to 24 Years | 77 (100.0%) | 112 (100.0%) |
| 25 to 34 Years | 37 (100.0%) | 63 (100.0%) |
| 35 to 44 Years | 52 (52.0%) | 41 (85.4%) |
| 45 to 54 Years | 53 (56.4%) | 109 (93.2%) |
| 55 to 64 Years | 189 (95.9%) | 115 (87.1%) |
| 65 to 74 Years | 228 (96.6%) | 233 (87.6%) |
| 75 Years and over | 130 (87.8%) | 205 (85.8%) |
| Total | 852 (86.9%) | 898 (88.6%) |
Income Below Poverty Among Married-Couple Families in Murphys
The poverty statistics for married-couple families in Murphys show that 9.6% or 40 of the total 417 families live below the poverty line. Families with 3 or 4 children have the highest poverty rate of 100.0%, comprising of 9 families. On the other hand, families with 1 or 2 children have the lowest poverty rate of 0.0%, which includes 0 families.
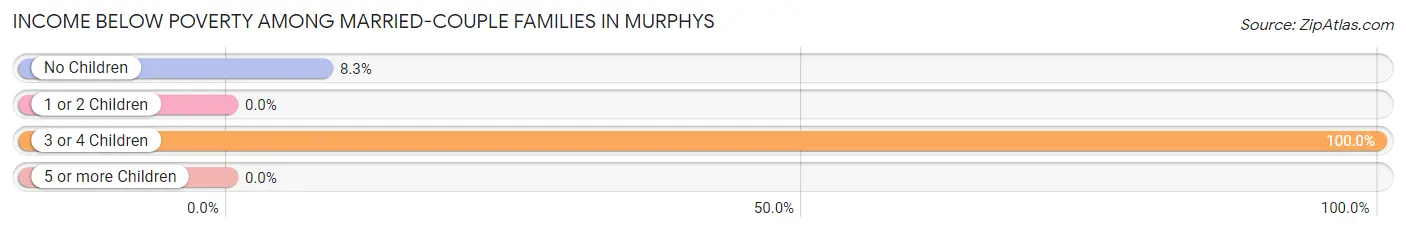
| Children | Above Poverty | Below Poverty |
| No Children | 344 (91.7%) | 31 (8.3%) |
| 1 or 2 Children | 33 (100.0%) | 0 (0.0%) |
| 3 or 4 Children | 0 (0.0%) | 9 (100.0%) |
| 5 or more Children | 0 (0.0%) | 0 (0.0%) |
| Total | 377 (90.4%) | 40 (9.6%) |
Income Below Poverty Among Single-Parent Households in Murphys
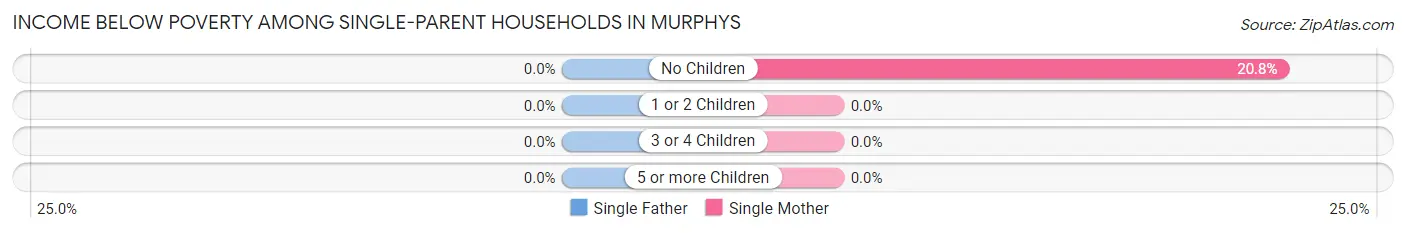
| Children | Single Father | Single Mother |
| No Children | 0 (0.0%) | 11 (20.7%) |
| 1 or 2 Children | 0 (0.0%) | 0 (0.0%) |
| 3 or 4 Children | 0 (0.0%) | 0 (0.0%) |
| 5 or more Children | 0 (0.0%) | 0 (0.0%) |
| Total | 0 (0.0%) | 11 (20.7%) |
Income Below Poverty Among Married-Couple vs Single-Parent Households in Murphys
The poverty data for Murphys shows that 40 of the married-couple family households (9.6%) and 11 of the single-parent households (13.3%) are living below the poverty level. Within the married-couple family households, those with 3 or 4 children have the highest poverty rate, with 9 households (100.0%) falling below the poverty line. Among the single-parent households, those with no children have the highest poverty rate, with 11 household (13.3%) living below poverty.
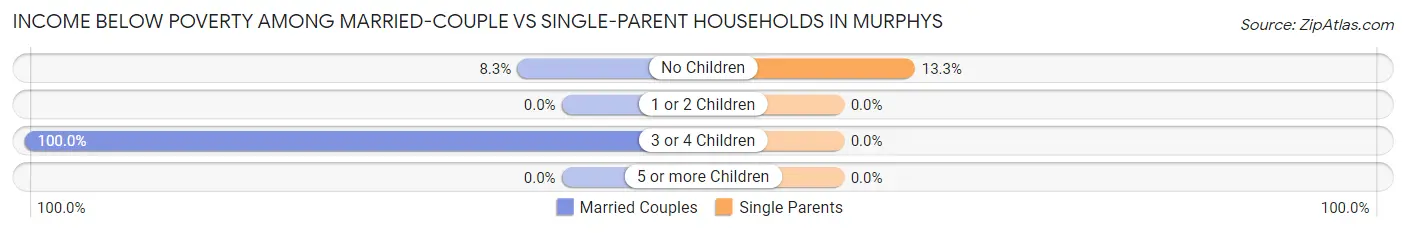
| Children | Married-Couple Families | Single-Parent Households |
| No Children | 31 (8.3%) | 11 (13.3%) |
| 1 or 2 Children | 0 (0.0%) | 0 (0.0%) |
| 3 or 4 Children | 9 (100.0%) | 0 (0.0%) |
| 5 or more Children | 0 (0.0%) | 0 (0.0%) |
| Total | 40 (9.6%) | 11 (13.3%) |
Race in Murphys
The most populous races in Murphys are White / Caucasian (1,717 | 84.9%), Two or more Races (166 | 8.2%), and Hispanic or Latino (151 | 7.5%).
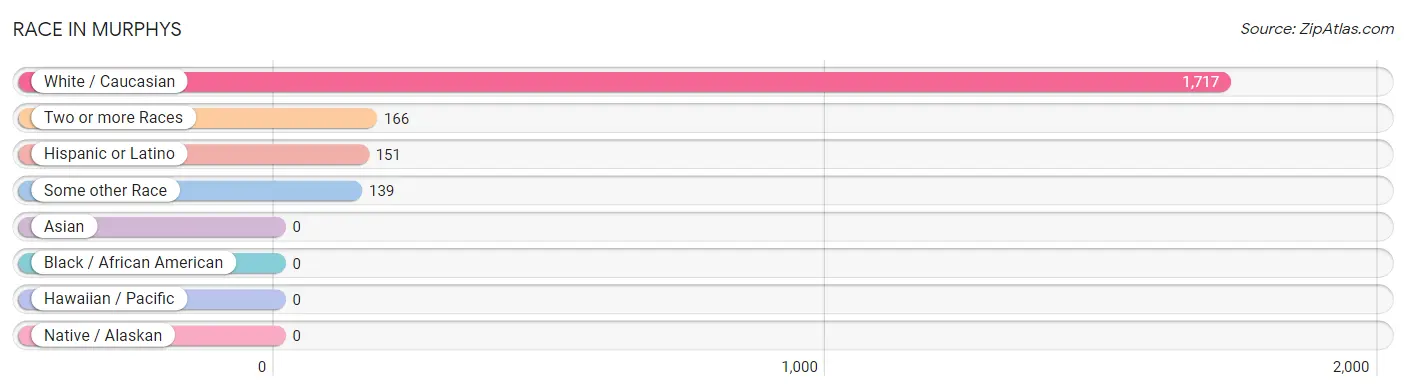
| Race | # Population | % Population |
| Asian | 0 | 0.0% |
| Black / African American | 0 | 0.0% |
| Hawaiian / Pacific | 0 | 0.0% |
| Hispanic or Latino | 151 | 7.5% |
| Native / Alaskan | 0 | 0.0% |
| White / Caucasian | 1,717 | 84.9% |
| Two or more Races | 166 | 8.2% |
| Some other Race | 139 | 6.9% |
| Total | 2,022 | 100.0% |
Ancestry in Murphys
The most populous ancestries reported in Murphys are German (347 | 17.2%), English (339 | 16.8%), Irish (318 | 15.7%), Mexican (151 | 7.5%), and Italian (103 | 5.1%), together accounting for 62.2% of all Murphys residents.
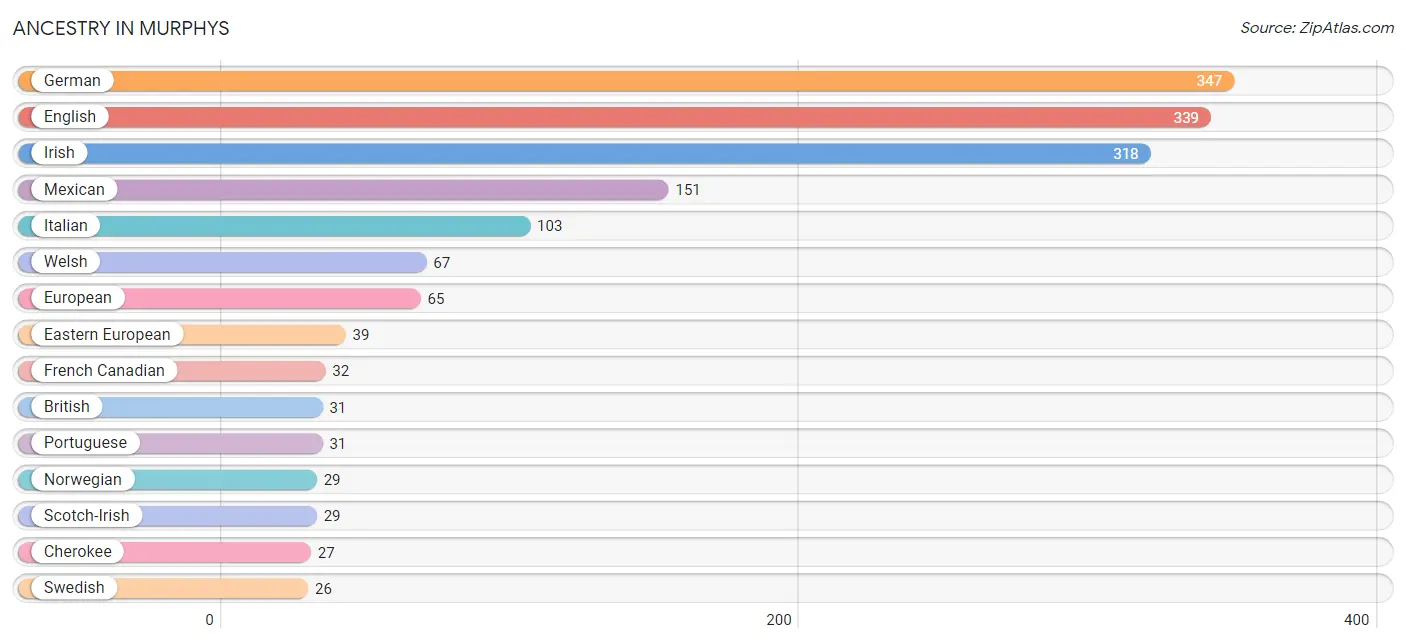
| Ancestry | # Population | % Population |
| American | 23 | 1.1% |
| Arab | 21 | 1.0% |
| Belgian | 7 | 0.4% |
| British | 31 | 1.5% |
| Canadian | 8 | 0.4% |
| Cherokee | 27 | 1.3% |
| Danish | 16 | 0.8% |
| Eastern European | 39 | 1.9% |
| English | 339 | 16.8% |
| European | 65 | 3.2% |
| French | 17 | 0.8% |
| French Canadian | 32 | 1.6% |
| German | 347 | 17.2% |
| Hungarian | 15 | 0.7% |
| Irish | 318 | 15.7% |
| Italian | 103 | 5.1% |
| Lebanese | 13 | 0.6% |
| Maltese | 8 | 0.4% |
| Mexican | 151 | 7.5% |
| Moroccan | 8 | 0.4% |
| Native Hawaiian | 19 | 0.9% |
| Norwegian | 29 | 1.4% |
| Portuguese | 31 | 1.5% |
| Scotch-Irish | 29 | 1.4% |
| Scottish | 15 | 0.7% |
| Swedish | 26 | 1.3% |
| Ukrainian | 7 | 0.4% |
| Welsh | 67 | 3.3% | View All 28 Rows |
Immigrants in Murphys
The most numerous immigrant groups reported in Murphys came from Europe (72 | 3.6%), Northern Europe (64 | 3.2%), Ireland (51 | 2.5%), Central America (35 | 1.7%), and Latin America (35 | 1.7%), together accounting for 12.7% of all Murphys residents.

| Immigration Origin | # Population | % Population |
| Africa | 8 | 0.4% |
| Asia | 7 | 0.4% |
| Canada | 19 | 0.9% |
| Central America | 35 | 1.7% |
| England | 13 | 0.6% |
| Europe | 72 | 3.6% |
| Iran | 7 | 0.4% |
| Ireland | 51 | 2.5% |
| Latin America | 35 | 1.7% |
| Mexico | 35 | 1.7% |
| Morocco | 8 | 0.4% |
| Northern Africa | 8 | 0.4% |
| Northern Europe | 64 | 3.2% |
| Oceania | 16 | 0.8% |
| South Central Asia | 7 | 0.4% |
| Southern Europe | 8 | 0.4% | View All 16 Rows |
Sex and Age in Murphys
Sex and Age in Murphys
The most populous age groups in Murphys are 55 to 59 Years (147 | 14.6%) for men and 70 to 74 Years (189 | 18.6%) for women.
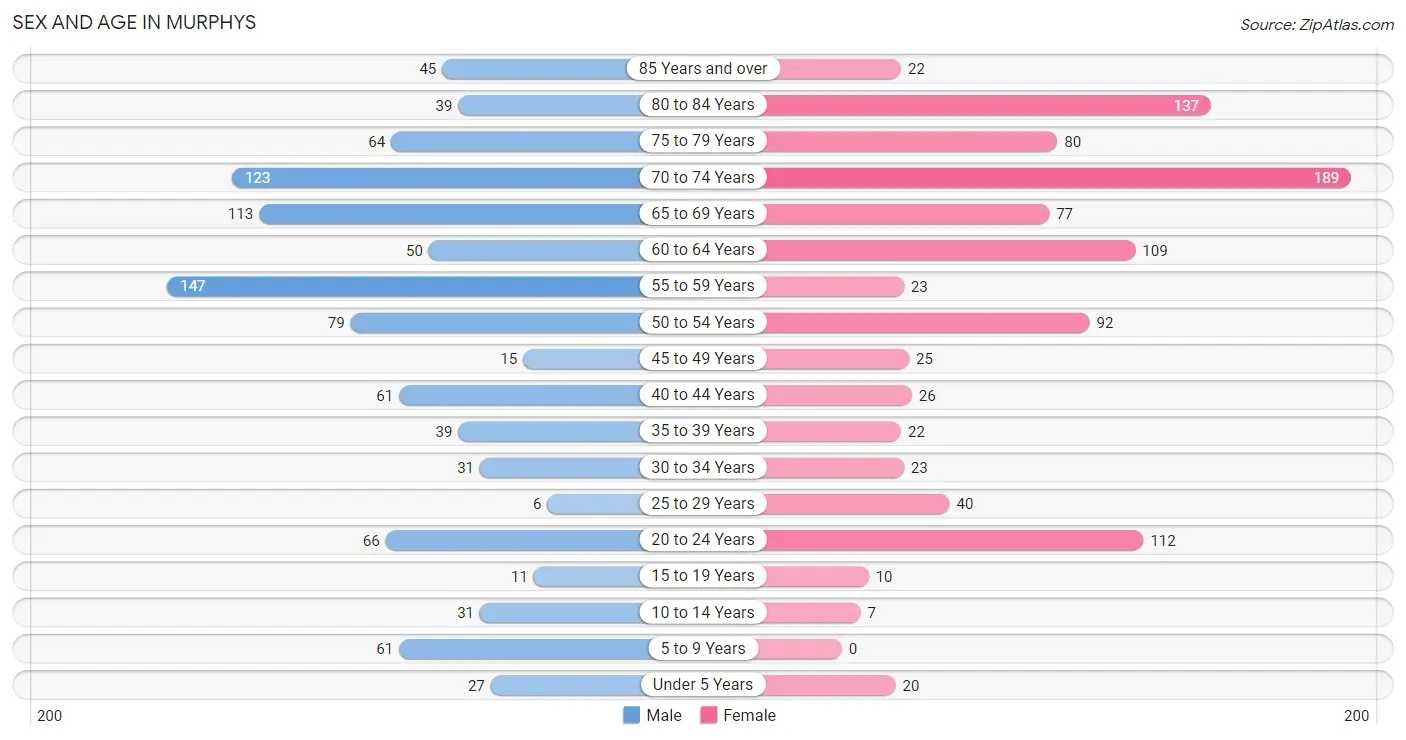
| Age Bracket | Male | Female |
| Under 5 Years | 27 (2.7%) | 20 (2.0%) |
| 5 to 9 Years | 61 (6.0%) | 0 (0.0%) |
| 10 to 14 Years | 31 (3.1%) | 7 (0.7%) |
| 15 to 19 Years | 11 (1.1%) | 10 (1.0%) |
| 20 to 24 Years | 66 (6.6%) | 112 (11.1%) |
| 25 to 29 Years | 6 (0.6%) | 40 (3.9%) |
| 30 to 34 Years | 31 (3.1%) | 23 (2.3%) |
| 35 to 39 Years | 39 (3.9%) | 22 (2.2%) |
| 40 to 44 Years | 61 (6.0%) | 26 (2.6%) |
| 45 to 49 Years | 15 (1.5%) | 25 (2.5%) |
| 50 to 54 Years | 79 (7.8%) | 92 (9.1%) |
| 55 to 59 Years | 147 (14.6%) | 23 (2.3%) |
| 60 to 64 Years | 50 (5.0%) | 109 (10.7%) |
| 65 to 69 Years | 113 (11.2%) | 77 (7.6%) |
| 70 to 74 Years | 123 (12.2%) | 189 (18.6%) |
| 75 to 79 Years | 64 (6.4%) | 80 (7.9%) |
| 80 to 84 Years | 39 (3.9%) | 137 (13.5%) |
| 85 Years and over | 45 (4.5%) | 22 (2.2%) |
| Total | 1,008 (100.0%) | 1,014 (100.0%) |
Families and Households in Murphys
Median Family Size in Murphys
The median family size in Murphys is 2.78 persons per family, with single female/mother families (53 | 10.6%) accounting for the largest median family size of 3.28 persons per family. On the other hand, single male/father families (30 | 6.0%) represent the smallest median family size with 2.43 persons per family.
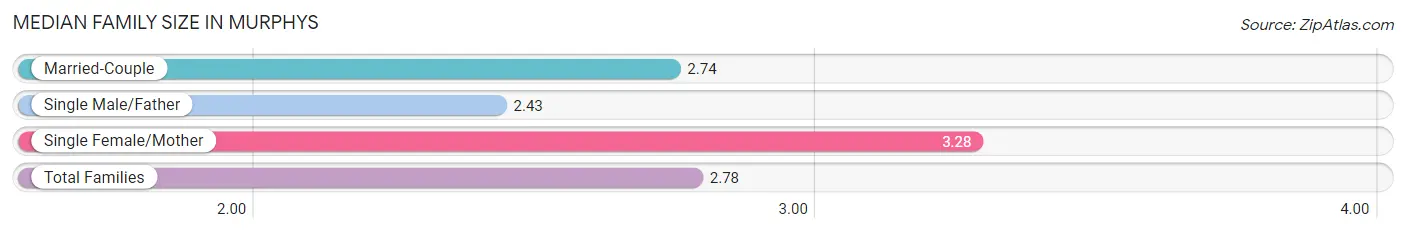
| Family Type | # Families | Family Size |
| Married-Couple | 417 (83.4%) | 2.74 |
| Single Male/Father | 30 (6.0%) | 2.43 |
| Single Female/Mother | 53 (10.6%) | 3.28 |
| Total Families | 500 (100.0%) | 2.78 |
Median Household Size in Murphys
The median household size in Murphys is 2.25 persons per household, with single female/mother households (53 | 5.9%) accounting for the largest median household size of 3.28 persons per household. non-family households (399 | 44.4%) represent the smallest median household size with 1.31 persons per household.
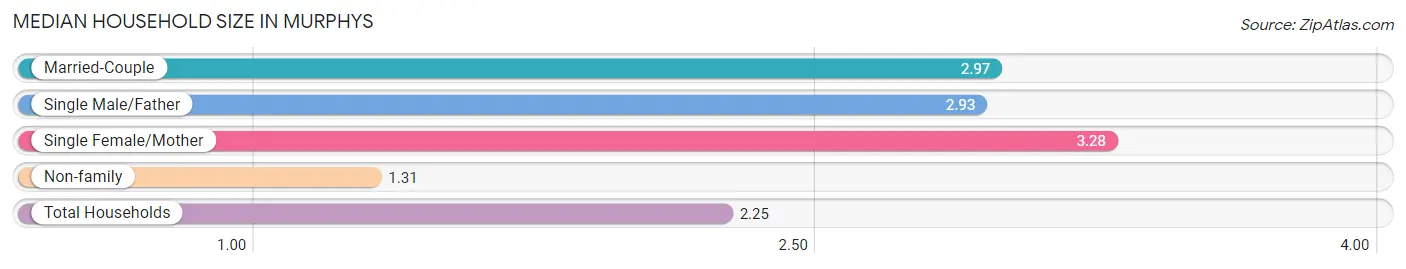
| Household Type | # Households | Household Size |
| Married-Couple | 417 (46.4%) | 2.97 |
| Single Male/Father | 30 (3.3%) | 2.93 |
| Single Female/Mother | 53 (5.9%) | 3.28 |
| Non-family | 399 (44.4%) | 1.31 |
| Total Households | 899 (100.0%) | 2.25 |
Household Size by Marriage Status in Murphys
Out of a total of 899 households in Murphys, 500 (55.6%) are family households, while 399 (44.4%) are nonfamily households. The most numerous type of family households are 2-person households, comprising 380, and the most common type of nonfamily households are 1-person households, comprising 332.
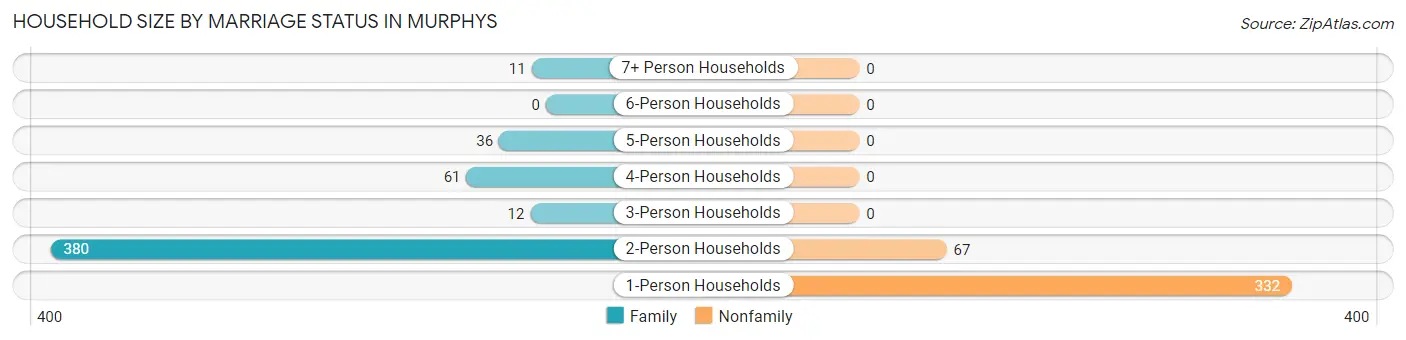
| Household Size | Family Households | Nonfamily Households |
| 1-Person Households | - | 332 (36.9%) |
| 2-Person Households | 380 (42.3%) | 67 (7.4%) |
| 3-Person Households | 12 (1.3%) | 0 (0.0%) |
| 4-Person Households | 61 (6.8%) | 0 (0.0%) |
| 5-Person Households | 36 (4.0%) | 0 (0.0%) |
| 6-Person Households | 0 (0.0%) | 0 (0.0%) |
| 7+ Person Households | 11 (1.2%) | 0 (0.0%) |
| Total | 500 (55.6%) | 399 (44.4%) |
Female Fertility in Murphys
Fertility by Age in Murphys
| Age Bracket | Women with Births | Births / 1,000 Women |
| 15 to 19 years | 0 (0.0%) | 0.0 |
| 20 to 34 years | 0 (0.0%) | 0.0 |
| 35 to 50 years | 0 (0.0%) | 0.0 |
| Total | 0 (0.0%) | 0.0 |
Fertility by Age by Marriage Status in Murphys
| Age Bracket | Married | Unmarried |
| 15 to 19 years | 0 (0.0%) | 0 (0.0%) |
| 20 to 34 years | 0 (0.0%) | 0 (0.0%) |
| 35 to 50 years | 0 (0.0%) | 0 (0.0%) |
| Total | 0 (0.0%) | 0 (0.0%) |
Fertility by Education in Murphys
| Educational Attainment | Women with Births | Births / 1,000 Women |
| Less than High School | 0 (0.0%) | 0.0 |
| High School Diploma | 0 (0.0%) | 0.0 |
| College or Associate's Degree | 0 (0.0%) | 0.0 |
| Bachelor's Degree | 0 (0.0%) | 0.0 |
| Graduate Degree | 0 (0.0%) | 0.0 |
| Total | 0 (0.0%) | 0.0 |
Fertility by Education by Marriage Status in Murphys
| Educational Attainment | Married | Unmarried |
| Less than High School | 0 (0.0%) | 0 (0.0%) |
| High School Diploma | 0 (0.0%) | 0 (0.0%) |
| College or Associate's Degree | 0 (0.0%) | 0 (0.0%) |
| Bachelor's Degree | 0 (0.0%) | 0 (0.0%) |
| Graduate Degree | 0 (0.0%) | 0 (0.0%) |
| Total | 0 (0.0%) | 0 (0.0%) |
Employment Characteristics in Murphys
Employment by Class of Employer in Murphys
Among the 739 employed individuals in Murphys, private company employees (493 | 66.7%), local government employees (96 | 13.0%), and self-employed (incorporated) (56 | 7.6%) make up the most common classes of employment.
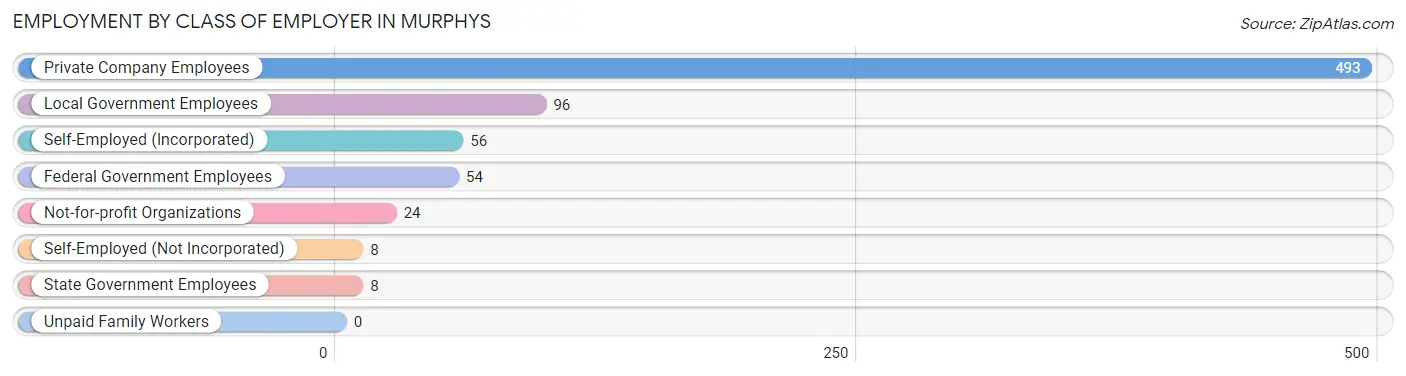
| Employer Class | # Employees | % Employees |
| Private Company Employees | 493 | 66.7% |
| Self-Employed (Incorporated) | 56 | 7.6% |
| Self-Employed (Not Incorporated) | 8 | 1.1% |
| Not-for-profit Organizations | 24 | 3.3% |
| Local Government Employees | 96 | 13.0% |
| State Government Employees | 8 | 1.1% |
| Federal Government Employees | 54 | 7.3% |
| Unpaid Family Workers | 0 | 0.0% |
| Total | 739 | 100.0% |
Employment Status by Age in Murphys
According to the labor force statistics for Murphys, out of the total population over 16 years of age (1,866), 40.6% or 758 individuals are in the labor force, with 2.4% or 18 of them unemployed. The age group with the highest labor force participation rate is 25 to 29 years, with 100.0% or 46 individuals in the labor force. Within the labor force, the 20 to 24 years age range has the highest percentage of unemployed individuals, with 12.7% or 18 of them being unemployed.
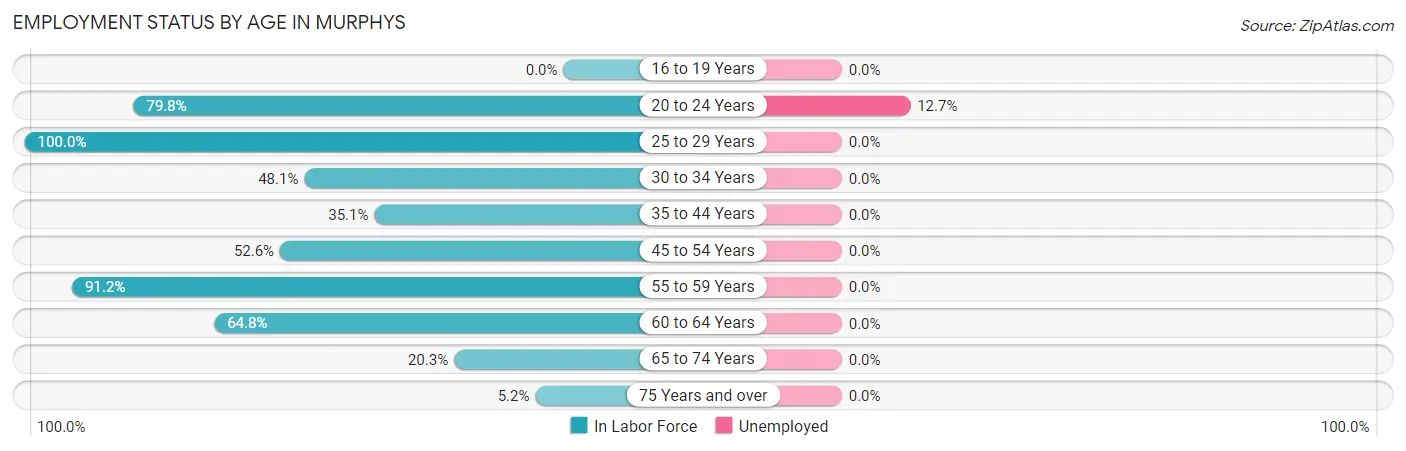
| Age Bracket | In Labor Force | Unemployed |
| 16 to 19 Years | 0 (0.0%) | 0 (0.0%) |
| 20 to 24 Years | 142 (79.8%) | 18 (12.7%) |
| 25 to 29 Years | 46 (100.0%) | 0 (0.0%) |
| 30 to 34 Years | 26 (48.1%) | 0 (0.0%) |
| 35 to 44 Years | 52 (35.1%) | 0 (0.0%) |
| 45 to 54 Years | 111 (52.6%) | 0 (0.0%) |
| 55 to 59 Years | 155 (91.2%) | 0 (0.0%) |
| 60 to 64 Years | 103 (64.8%) | 0 (0.0%) |
| 65 to 74 Years | 102 (20.3%) | 0 (0.0%) |
| 75 Years and over | 20 (5.2%) | 0 (0.0%) |
| Total | 758 (40.6%) | 18 (2.4%) |
Employment Status by Educational Attainment in Murphys
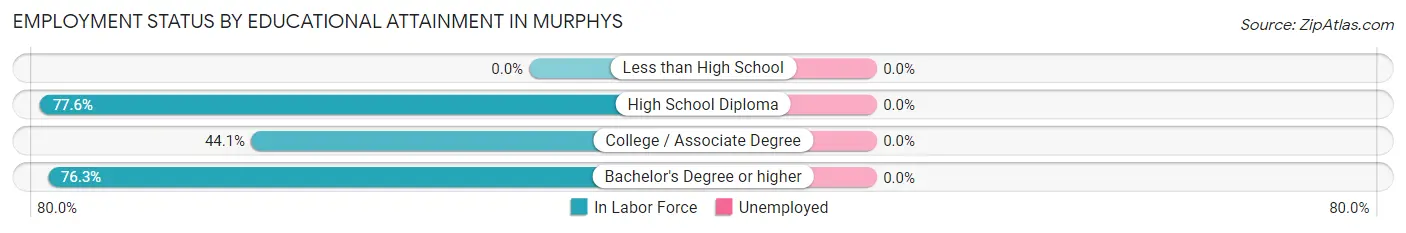
| Educational Attainment | In Labor Force | Unemployed |
| Less than High School | 0 (0.0%) | 0 (0.0%) |
| High School Diploma | 308 (77.6%) | 0 (0.0%) |
| College / Associate Degree | 98 (44.1%) | 0 (0.0%) |
| Bachelor's Degree or higher | 87 (76.3%) | 0 (0.0%) |
| Total | 493 (62.6%) | 0 (0.0%) |
Employment Occupations by Sex in Murphys
Management, Business, Science and Arts Occupations
The most common Management, Business, Science and Arts occupations in Murphys are Community & Social Service (99 | 13.4%), Management (77 | 10.4%), Legal Services & Support (35 | 4.7%), Computers, Engineering & Science (31 | 4.2%), and Arts, Media & Entertainment (28 | 3.8%).
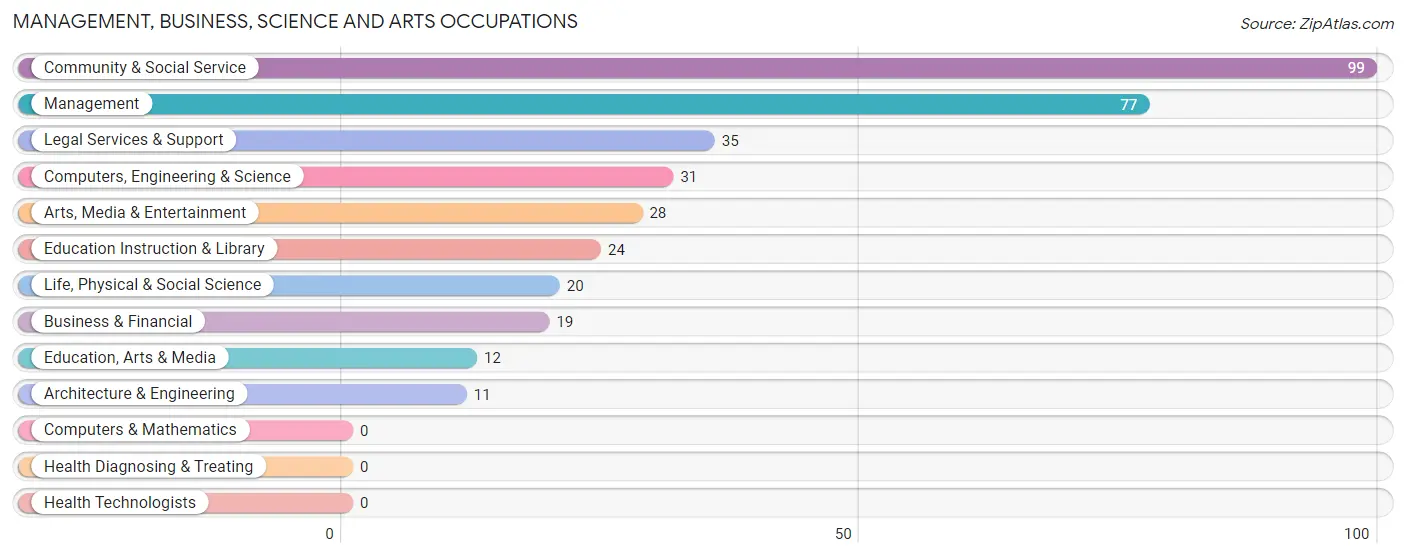
Management, Business, Science and Arts Occupations by Sex
Within the Management, Business, Science and Arts occupations in Murphys, the most male-oriented occupations are Architecture & Engineering (100.0%), Management (83.1%), and Education Instruction & Library (58.3%), while the most female-oriented occupations are Business & Financial (100.0%), Life, Physical & Social Science (100.0%), and Education, Arts & Media (100.0%).
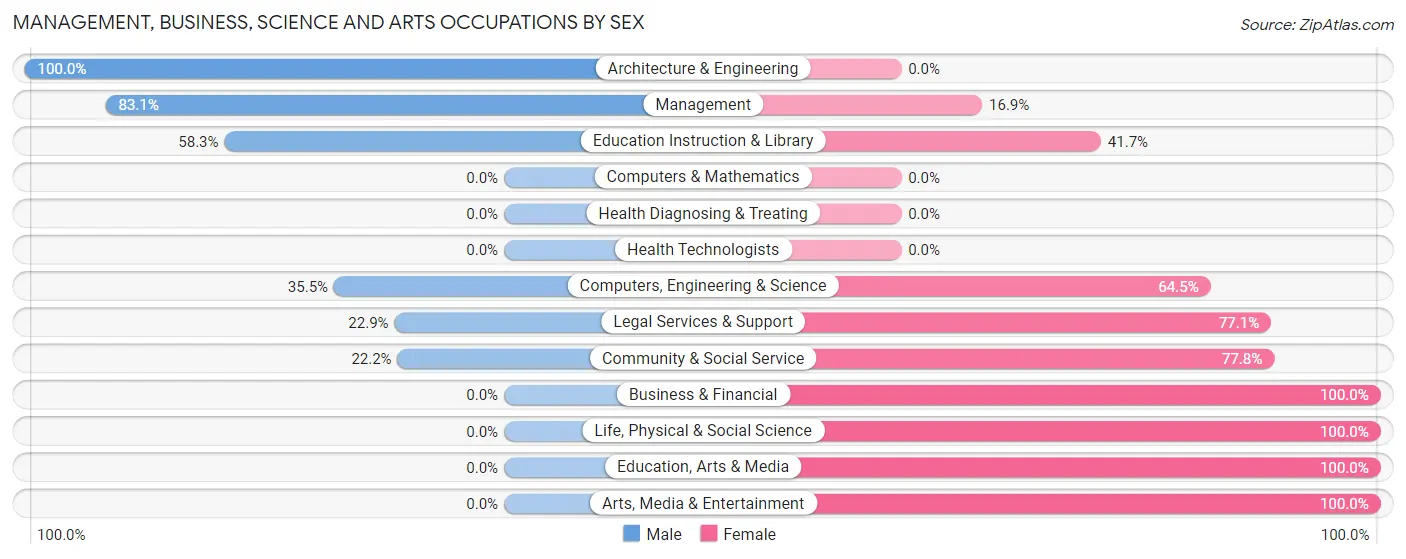
| Occupation | Male | Female |
| Management | 64 (83.1%) | 13 (16.9%) |
| Business & Financial | 0 (0.0%) | 19 (100.0%) |
| Computers, Engineering & Science | 11 (35.5%) | 20 (64.5%) |
| Computers & Mathematics | 0 (0.0%) | 0 (0.0%) |
| Architecture & Engineering | 11 (100.0%) | 0 (0.0%) |
| Life, Physical & Social Science | 0 (0.0%) | 20 (100.0%) |
| Community & Social Service | 22 (22.2%) | 77 (77.8%) |
| Education, Arts & Media | 0 (0.0%) | 12 (100.0%) |
| Legal Services & Support | 8 (22.9%) | 27 (77.1%) |
| Education Instruction & Library | 14 (58.3%) | 10 (41.7%) |
| Arts, Media & Entertainment | 0 (0.0%) | 28 (100.0%) |
| Health Diagnosing & Treating | 0 (0.0%) | 0 (0.0%) |
| Health Technologists | 0 (0.0%) | 0 (0.0%) |
| Total (Category) | 97 (42.9%) | 129 (57.1%) |
| Total (Overall) | 393 (53.2%) | 346 (46.8%) |
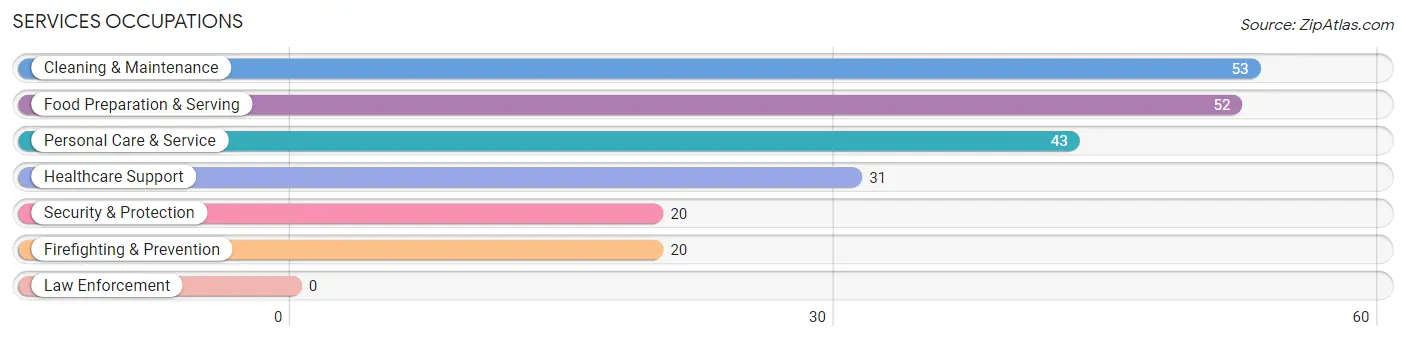
Services Occupations
The most common Services occupations in Murphys are Cleaning & Maintenance (53 | 7.2%), Food Preparation & Serving (52 | 7.0%), Personal Care & Service (43 | 5.8%), Healthcare Support (31 | 4.2%), and Security & Protection (20 | 2.7%).
Services Occupations by Sex
Within the Services occupations in Murphys, the most male-oriented occupations are Security & Protection (100.0%), Firefighting & Prevention (100.0%), and Food Preparation & Serving (100.0%), while the most female-oriented occupations are Personal Care & Service (100.0%), Healthcare Support (74.2%), and Cleaning & Maintenance (66.0%).
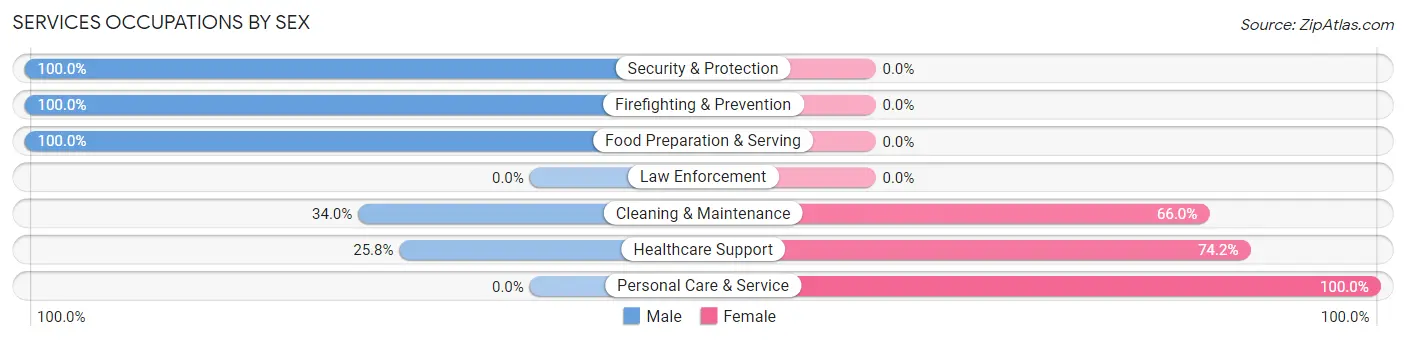
| Occupation | Male | Female |
| Healthcare Support | 8 (25.8%) | 23 (74.2%) |
| Security & Protection | 20 (100.0%) | 0 (0.0%) |
| Firefighting & Prevention | 20 (100.0%) | 0 (0.0%) |
| Law Enforcement | 0 (0.0%) | 0 (0.0%) |
| Food Preparation & Serving | 52 (100.0%) | 0 (0.0%) |
| Cleaning & Maintenance | 18 (34.0%) | 35 (66.0%) |
| Personal Care & Service | 0 (0.0%) | 43 (100.0%) |
| Total (Category) | 98 (49.2%) | 101 (50.7%) |
| Total (Overall) | 393 (53.2%) | 346 (46.8%) |
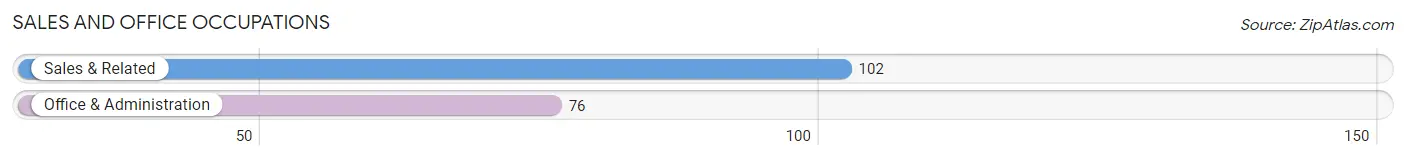
Sales and Office Occupations
The most common Sales and Office occupations in Murphys are Sales & Related (102 | 13.8%), and Office & Administration (76 | 10.3%).
Sales and Office Occupations by Sex
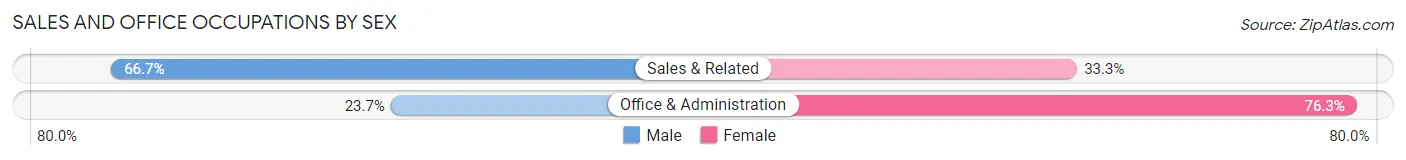
| Occupation | Male | Female |
| Sales & Related | 68 (66.7%) | 34 (33.3%) |
| Office & Administration | 18 (23.7%) | 58 (76.3%) |
| Total (Category) | 86 (48.3%) | 92 (51.7%) |
| Total (Overall) | 393 (53.2%) | 346 (46.8%) |
Natural Resources, Construction and Maintenance Occupations
The most common Natural Resources, Construction and Maintenance occupations in Murphys are Construction & Extraction (62 | 8.4%), and Installation, Maintenance & Repair (8 | 1.1%).
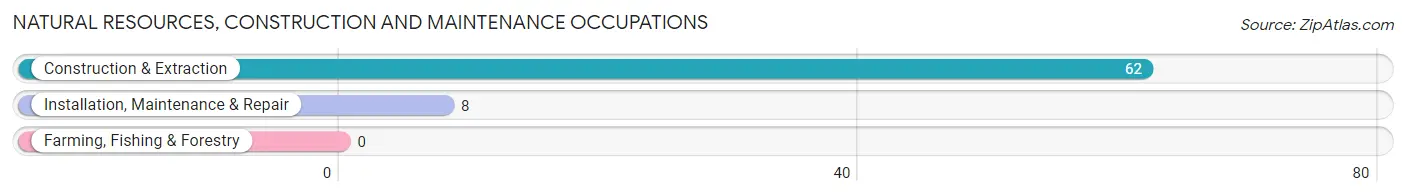
Natural Resources, Construction and Maintenance Occupations by Sex

| Occupation | Male | Female |
| Farming, Fishing & Forestry | 0 (0.0%) | 0 (0.0%) |
| Construction & Extraction | 62 (100.0%) | 0 (0.0%) |
| Installation, Maintenance & Repair | 8 (100.0%) | 0 (0.0%) |
| Total (Category) | 70 (100.0%) | 0 (0.0%) |
| Total (Overall) | 393 (53.2%) | 346 (46.8%) |
Production, Transportation and Moving Occupations
The most common Production, Transportation and Moving occupations in Murphys are Transportation (35 | 4.7%), Production (24 | 3.3%), and Material Moving (7 | 0.9%).
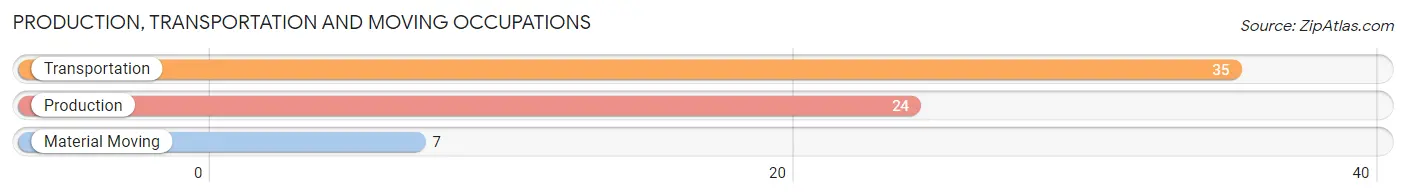
Production, Transportation and Moving Occupations by Sex
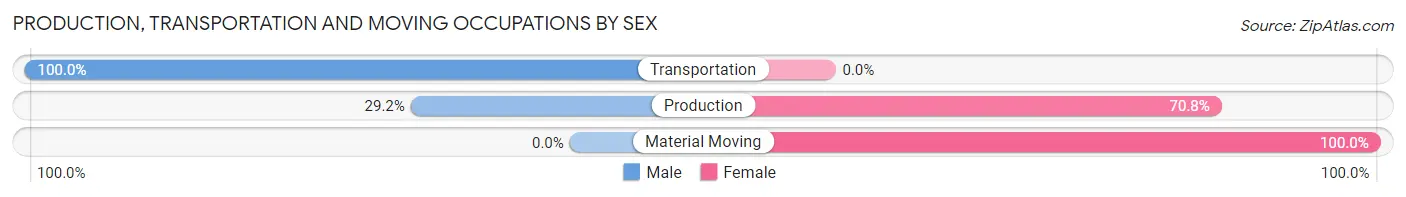
| Occupation | Male | Female |
| Production | 7 (29.2%) | 17 (70.8%) |
| Transportation | 35 (100.0%) | 0 (0.0%) |
| Material Moving | 0 (0.0%) | 7 (100.0%) |
| Total (Category) | 42 (63.6%) | 24 (36.4%) |
| Total (Overall) | 393 (53.2%) | 346 (46.8%) |
Employment Industries by Sex in Murphys
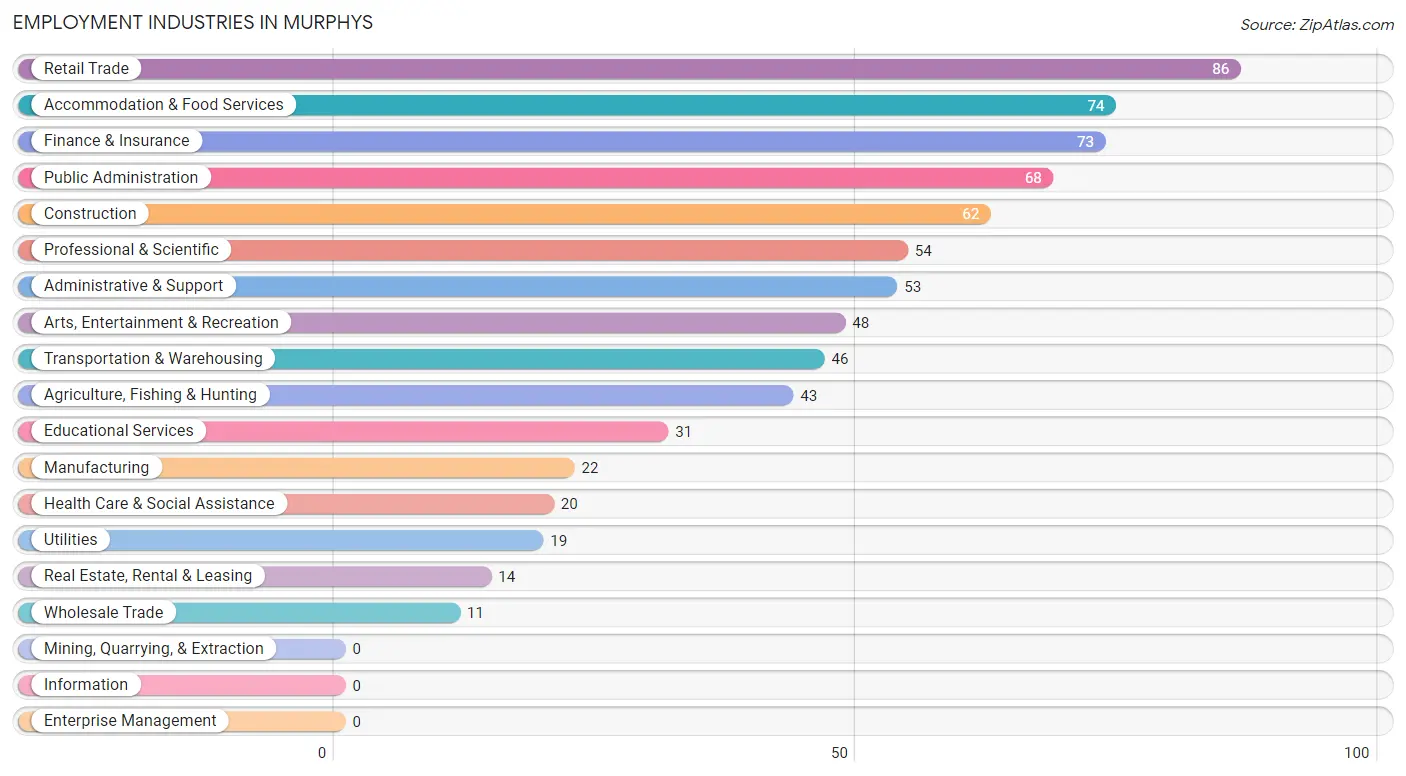
Employment Industries in Murphys
The major employment industries in Murphys include Retail Trade (86 | 11.6%), Accommodation & Food Services (74 | 10.0%), Finance & Insurance (73 | 9.9%), Public Administration (68 | 9.2%), and Construction (62 | 8.4%).
Employment Industries by Sex in Murphys
The Murphys industries that see more men than women are Construction (100.0%), Manufacturing (100.0%), and Wholesale Trade (100.0%), whereas the industries that tend to have a higher number of women are Agriculture, Fishing & Hunting (100.0%), Health Care & Social Assistance (100.0%), and Arts, Entertainment & Recreation (100.0%).
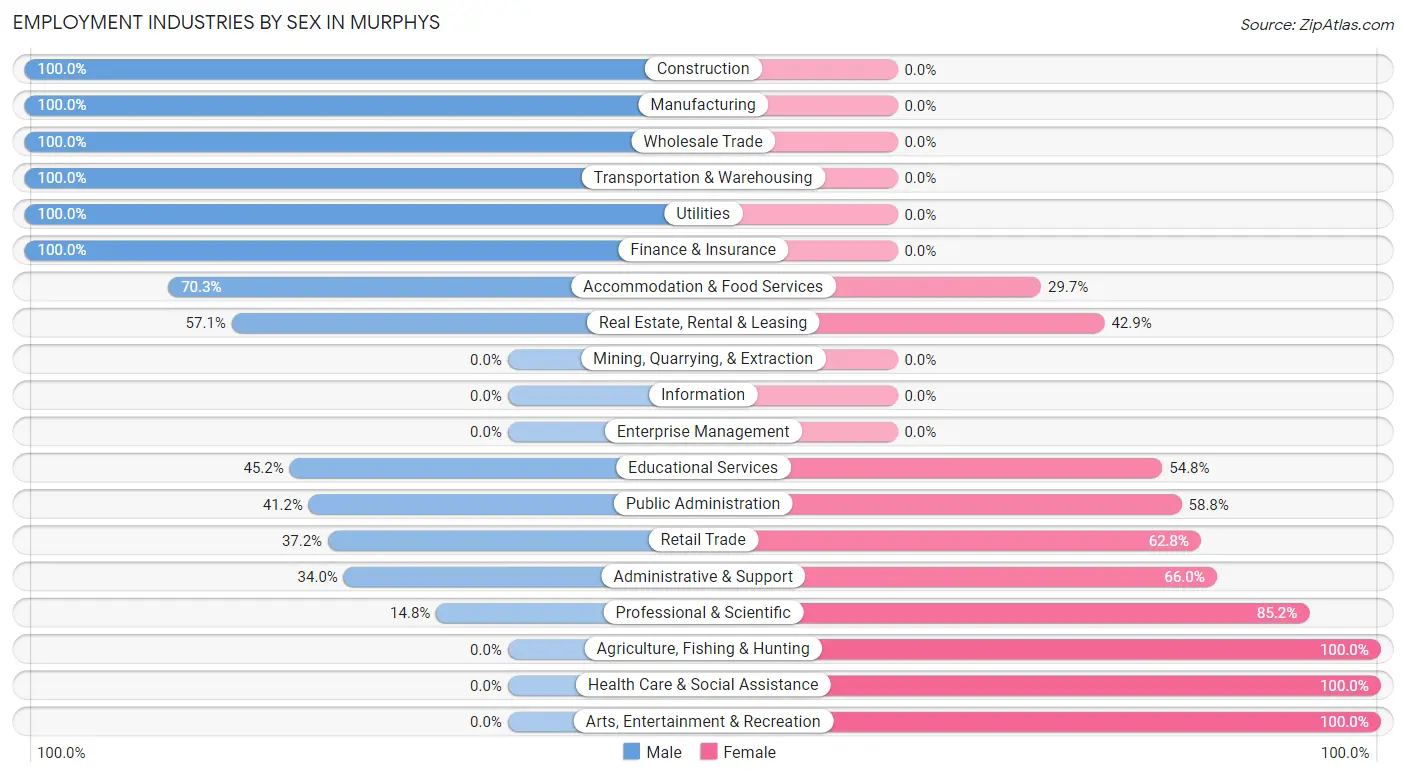
| Industry | Male | Female |
| Agriculture, Fishing & Hunting | 0 (0.0%) | 43 (100.0%) |
| Mining, Quarrying, & Extraction | 0 (0.0%) | 0 (0.0%) |
| Construction | 62 (100.0%) | 0 (0.0%) |
| Manufacturing | 22 (100.0%) | 0 (0.0%) |
| Wholesale Trade | 11 (100.0%) | 0 (0.0%) |
| Retail Trade | 32 (37.2%) | 54 (62.8%) |
| Transportation & Warehousing | 46 (100.0%) | 0 (0.0%) |
| Utilities | 19 (100.0%) | 0 (0.0%) |
| Information | 0 (0.0%) | 0 (0.0%) |
| Finance & Insurance | 73 (100.0%) | 0 (0.0%) |
| Real Estate, Rental & Leasing | 8 (57.1%) | 6 (42.9%) |
| Professional & Scientific | 8 (14.8%) | 46 (85.2%) |
| Enterprise Management | 0 (0.0%) | 0 (0.0%) |
| Administrative & Support | 18 (34.0%) | 35 (66.0%) |
| Educational Services | 14 (45.2%) | 17 (54.8%) |
| Health Care & Social Assistance | 0 (0.0%) | 20 (100.0%) |
| Arts, Entertainment & Recreation | 0 (0.0%) | 48 (100.0%) |
| Accommodation & Food Services | 52 (70.3%) | 22 (29.7%) |
| Public Administration | 28 (41.2%) | 40 (58.8%) |
| Total | 393 (53.2%) | 346 (46.8%) |
Education in Murphys
School Enrollment in Murphys
The most common levels of schooling among the 302 students in Murphys are college / undergraduate (182 | 60.3%), middle school (38 | 12.6%), and elementary school (37 | 12.2%).
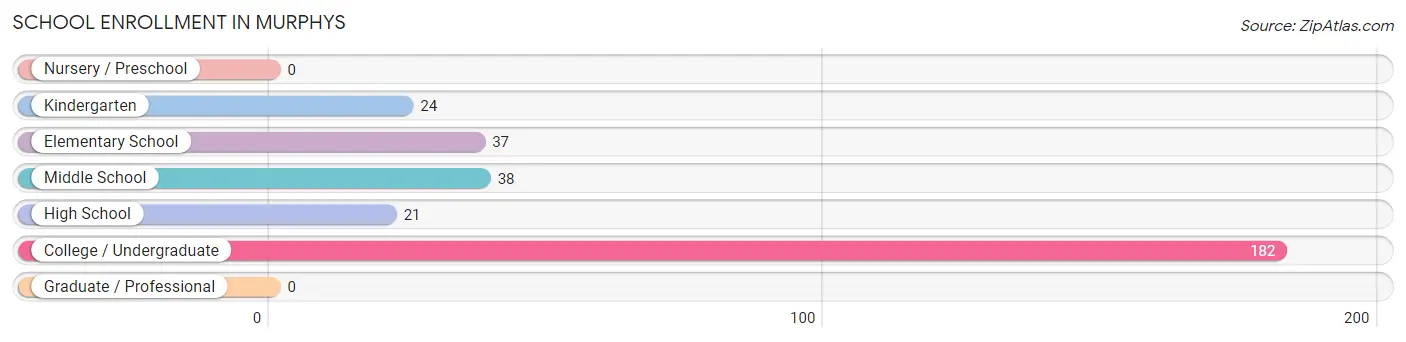
| School Level | # Students | % Students |
| Nursery / Preschool | 0 | 0.0% |
| Kindergarten | 24 | 8.0% |
| Elementary School | 37 | 12.2% |
| Middle School | 38 | 12.6% |
| High School | 21 | 7.0% |
| College / Undergraduate | 182 | 60.3% |
| Graduate / Professional | 0 | 0.0% |
| Total | 302 | 100.0% |
School Enrollment by Age by Funding Source in Murphys
Out of a total of 302 students who are enrolled in schools in Murphys, 36 (11.9%) attend a private institution, while the remaining 266 (88.1%) are enrolled in public schools. The age group of 20 to 24 year olds has the highest likelihood of being enrolled in private schools, with 28 (22.6% in the age bracket) enrolled. Conversely, the age group of 5 to 9 year old has the lowest likelihood of being enrolled in a private school, with 61 (100.0% in the age bracket) attending a public institution.
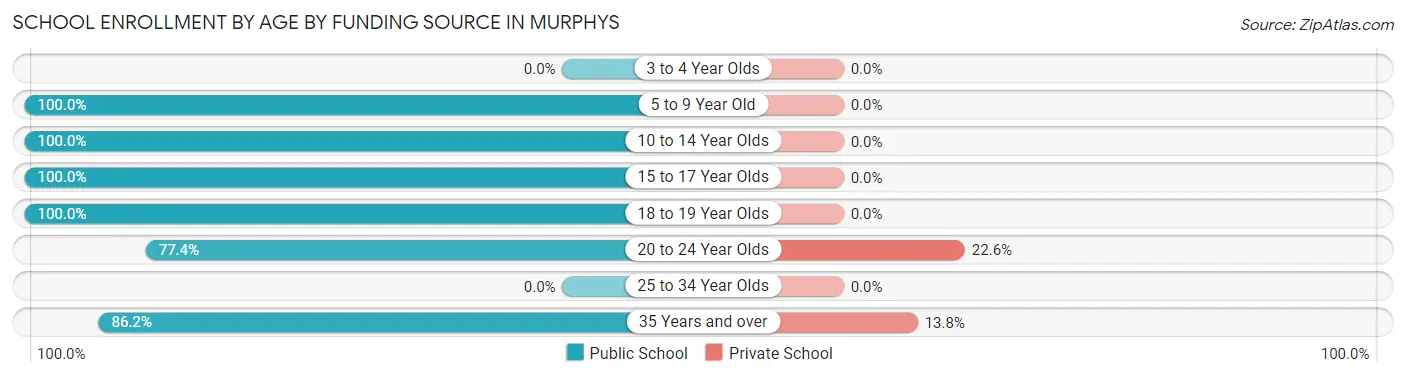
| Age Bracket | Public School | Private School |
| 3 to 4 Year Olds | 0 (0.0%) | 0 (0.0%) |
| 5 to 9 Year Old | 61 (100.0%) | 0 (0.0%) |
| 10 to 14 Year Olds | 38 (100.0%) | 0 (0.0%) |
| 15 to 17 Year Olds | 10 (100.0%) | 0 (0.0%) |
| 18 to 19 Year Olds | 11 (100.0%) | 0 (0.0%) |
| 20 to 24 Year Olds | 96 (77.4%) | 28 (22.6%) |
| 25 to 34 Year Olds | 0 (0.0%) | 0 (0.0%) |
| 35 Years and over | 50 (86.2%) | 8 (13.8%) |
| Total | 266 (88.1%) | 36 (11.9%) |
Educational Attainment by Field of Study in Murphys
Education (138 | 28.2%), business (99 | 20.3%), engineering (84 | 17.2%), bio, nature & agricultural (38 | 7.8%), and liberal arts & history (33 | 6.8%) are the most common fields of study among 489 individuals in Murphys who have obtained a bachelor's degree or higher.
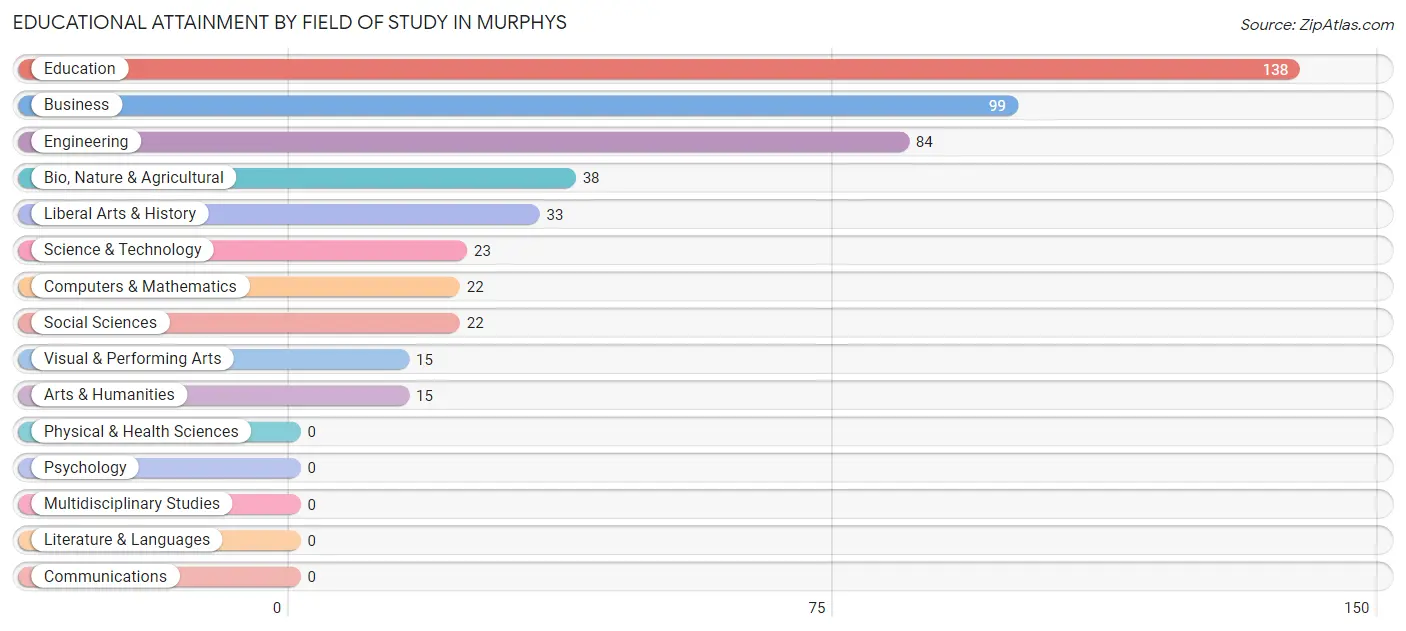
| Field of Study | # Graduates | % Graduates |
| Computers & Mathematics | 22 | 4.5% |
| Bio, Nature & Agricultural | 38 | 7.8% |
| Physical & Health Sciences | 0 | 0.0% |
| Psychology | 0 | 0.0% |
| Social Sciences | 22 | 4.5% |
| Engineering | 84 | 17.2% |
| Multidisciplinary Studies | 0 | 0.0% |
| Science & Technology | 23 | 4.7% |
| Business | 99 | 20.3% |
| Education | 138 | 28.2% |
| Literature & Languages | 0 | 0.0% |
| Liberal Arts & History | 33 | 6.8% |
| Visual & Performing Arts | 15 | 3.1% |
| Communications | 0 | 0.0% |
| Arts & Humanities | 15 | 3.1% |
| Total | 489 | 100.0% |
Transportation & Commute in Murphys
Vehicle Availability by Sex in Murphys
The most prevalent vehicle ownership categories in Murphys are males with 2 vehicles (155, accounting for 39.4%) and females with 2 vehicles (101, making up 44.8%).
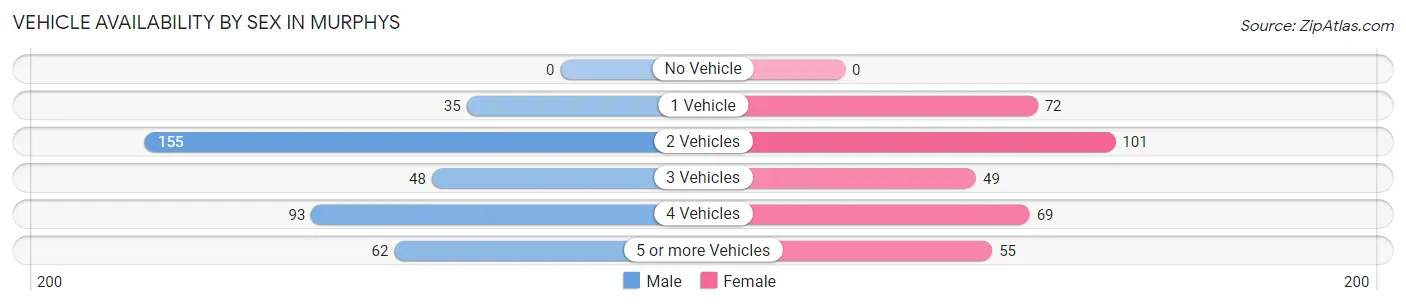
| Vehicles Available | Male | Female |
| No Vehicle | 0 (0.0%) | 0 (0.0%) |
| 1 Vehicle | 35 (8.9%) | 72 (20.8%) |
| 2 Vehicles | 155 (39.4%) | 101 (29.2%) |
| 3 Vehicles | 48 (12.2%) | 49 (14.2%) |
| 4 Vehicles | 93 (23.7%) | 69 (19.9%) |
| 5 or more Vehicles | 62 (15.8%) | 55 (15.9%) |
| Total | 393 (100.0%) | 346 (100.0%) |
Commute Time in Murphys
The most frequently occuring commute durations in Murphys are less than 5 minutes (170 commuters, 23.4%), 5 to 9 minutes (162 commuters, 22.3%), and 15 to 19 minutes (123 commuters, 16.9%).
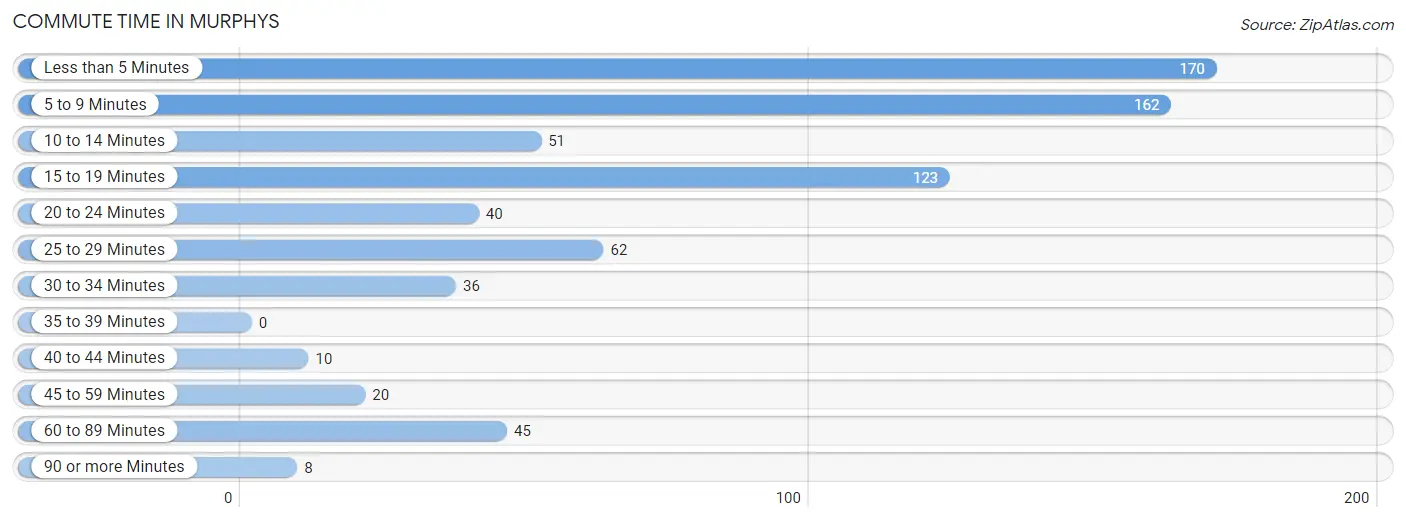
| Commute Time | # Commuters | % Commuters |
| Less than 5 Minutes | 170 | 23.4% |
| 5 to 9 Minutes | 162 | 22.3% |
| 10 to 14 Minutes | 51 | 7.0% |
| 15 to 19 Minutes | 123 | 16.9% |
| 20 to 24 Minutes | 40 | 5.5% |
| 25 to 29 Minutes | 62 | 8.5% |
| 30 to 34 Minutes | 36 | 5.0% |
| 35 to 39 Minutes | 0 | 0.0% |
| 40 to 44 Minutes | 10 | 1.4% |
| 45 to 59 Minutes | 20 | 2.8% |
| 60 to 89 Minutes | 45 | 6.2% |
| 90 or more Minutes | 8 | 1.1% |
Commute Time by Sex in Murphys
The most common commute times in Murphys are 15 to 19 minutes (90 commuters, 23.6%) for males and less than 5 minutes (120 commuters, 34.7%) for females.
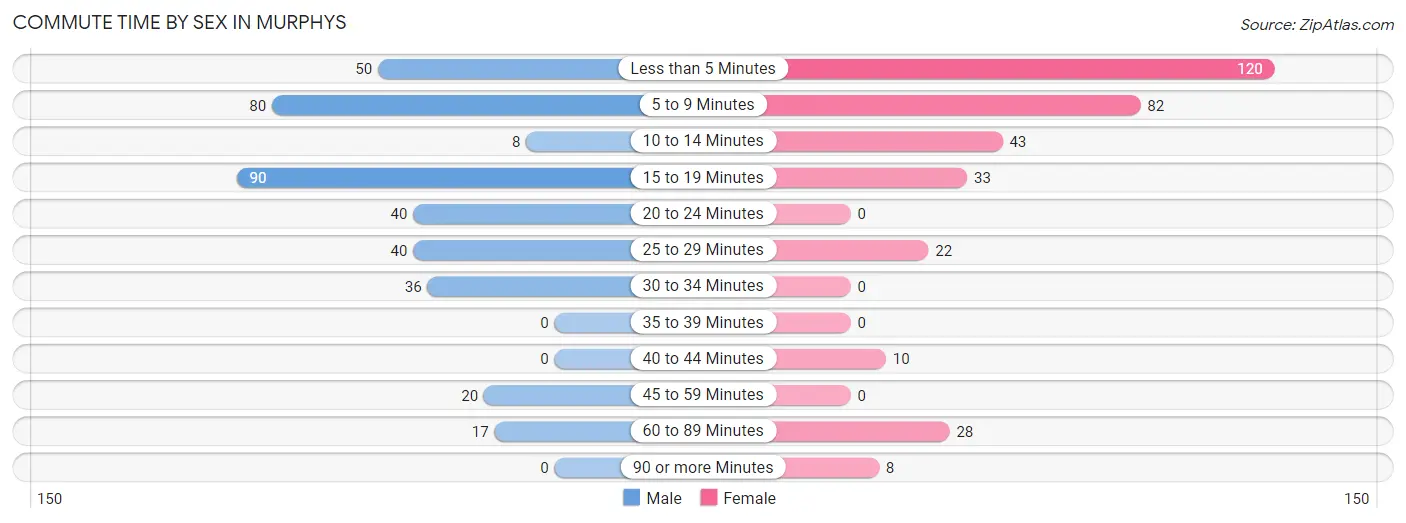
| Commute Time | Male | Female |
| Less than 5 Minutes | 50 (13.1%) | 120 (34.7%) |
| 5 to 9 Minutes | 80 (21.0%) | 82 (23.7%) |
| 10 to 14 Minutes | 8 (2.1%) | 43 (12.4%) |
| 15 to 19 Minutes | 90 (23.6%) | 33 (9.5%) |
| 20 to 24 Minutes | 40 (10.5%) | 0 (0.0%) |
| 25 to 29 Minutes | 40 (10.5%) | 22 (6.4%) |
| 30 to 34 Minutes | 36 (9.5%) | 0 (0.0%) |
| 35 to 39 Minutes | 0 (0.0%) | 0 (0.0%) |
| 40 to 44 Minutes | 0 (0.0%) | 10 (2.9%) |
| 45 to 59 Minutes | 20 (5.2%) | 0 (0.0%) |
| 60 to 89 Minutes | 17 (4.5%) | 28 (8.1%) |
| 90 or more Minutes | 0 (0.0%) | 8 (2.3%) |
Time of Departure to Work by Sex in Murphys
The most frequent times of departure to work in Murphys are 7:30 AM to 7:59 AM (118, 31.0%) for males and 9:00 AM to 9:59 AM (136, 39.3%) for females.
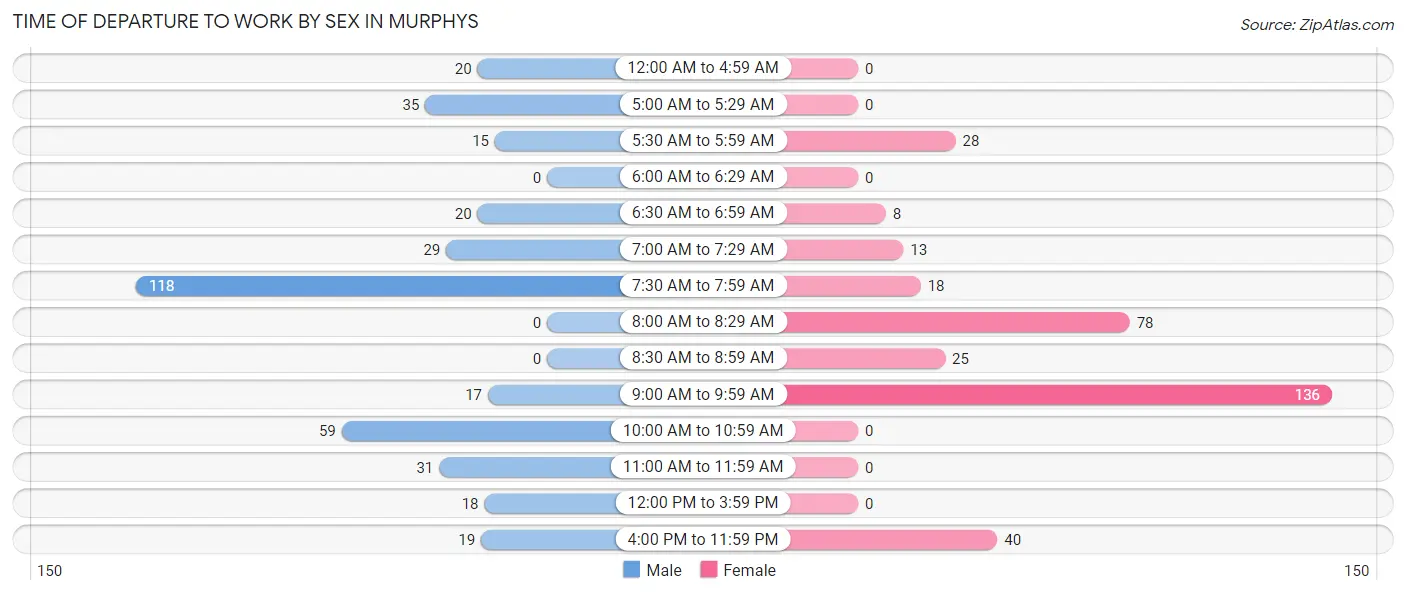
| Time of Departure | Male | Female |
| 12:00 AM to 4:59 AM | 20 (5.2%) | 0 (0.0%) |
| 5:00 AM to 5:29 AM | 35 (9.2%) | 0 (0.0%) |
| 5:30 AM to 5:59 AM | 15 (3.9%) | 28 (8.1%) |
| 6:00 AM to 6:29 AM | 0 (0.0%) | 0 (0.0%) |
| 6:30 AM to 6:59 AM | 20 (5.2%) | 8 (2.3%) |
| 7:00 AM to 7:29 AM | 29 (7.6%) | 13 (3.8%) |
| 7:30 AM to 7:59 AM | 118 (31.0%) | 18 (5.2%) |
| 8:00 AM to 8:29 AM | 0 (0.0%) | 78 (22.5%) |
| 8:30 AM to 8:59 AM | 0 (0.0%) | 25 (7.2%) |
| 9:00 AM to 9:59 AM | 17 (4.5%) | 136 (39.3%) |
| 10:00 AM to 10:59 AM | 59 (15.5%) | 0 (0.0%) |
| 11:00 AM to 11:59 AM | 31 (8.1%) | 0 (0.0%) |
| 12:00 PM to 3:59 PM | 18 (4.7%) | 0 (0.0%) |
| 4:00 PM to 11:59 PM | 19 (5.0%) | 40 (11.6%) |
| Total | 381 (100.0%) | 346 (100.0%) |
Housing Occupancy in Murphys
Occupancy by Ownership in Murphys
Of the total 899 dwellings in Murphys, owner-occupied units account for 620 (69.0%), while renter-occupied units make up 279 (31.0%).
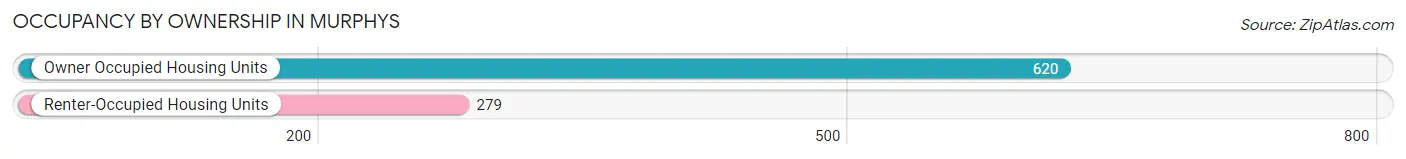
| Occupancy | # Housing Units | % Housing Units |
| Owner Occupied Housing Units | 620 | 69.0% |
| Renter-Occupied Housing Units | 279 | 31.0% |
| Total Occupied Housing Units | 899 | 100.0% |
Occupancy by Household Size in Murphys
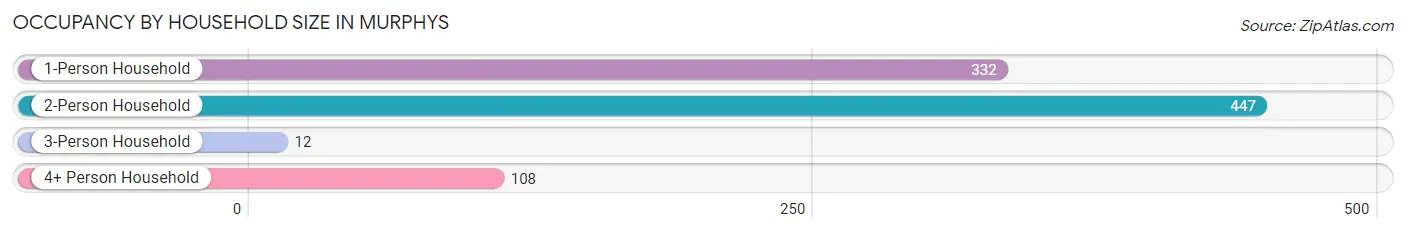
| Household Size | # Housing Units | % Housing Units |
| 1-Person Household | 332 | 36.9% |
| 2-Person Household | 447 | 49.7% |
| 3-Person Household | 12 | 1.3% |
| 4+ Person Household | 108 | 12.0% |
| Total Housing Units | 899 | 100.0% |
Occupancy by Ownership by Household Size in Murphys
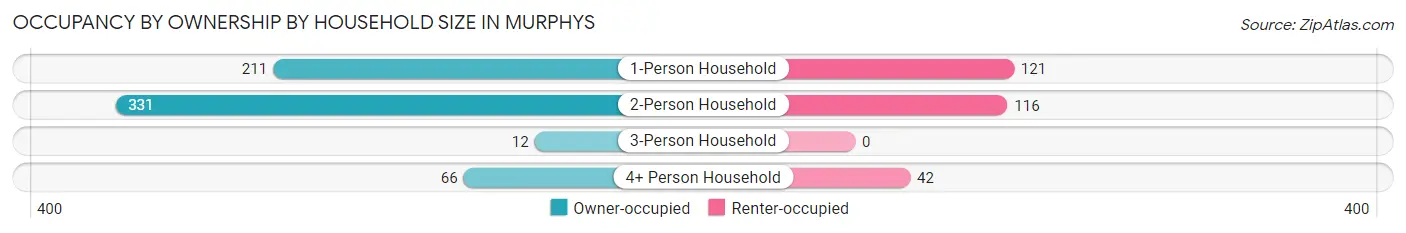
| Household Size | Owner-occupied | Renter-occupied |
| 1-Person Household | 211 (63.5%) | 121 (36.4%) |
| 2-Person Household | 331 (74.1%) | 116 (26.0%) |
| 3-Person Household | 12 (100.0%) | 0 (0.0%) |
| 4+ Person Household | 66 (61.1%) | 42 (38.9%) |
| Total Housing Units | 620 (69.0%) | 279 (31.0%) |
Occupancy by Educational Attainment in Murphys
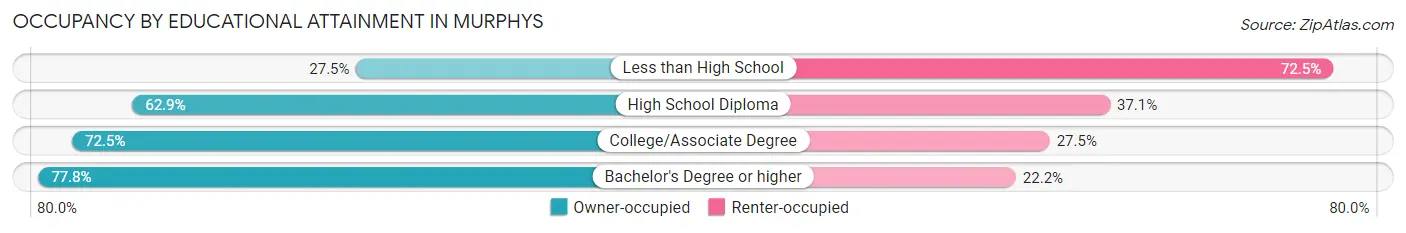
| Household Size | Owner-occupied | Renter-occupied |
| Less than High School | 19 (27.5%) | 50 (72.5%) |
| High School Diploma | 134 (62.9%) | 79 (37.1%) |
| College/Associate Degree | 179 (72.5%) | 68 (27.5%) |
| Bachelor's Degree or higher | 288 (77.8%) | 82 (22.2%) |
Occupancy by Age of Householder in Murphys
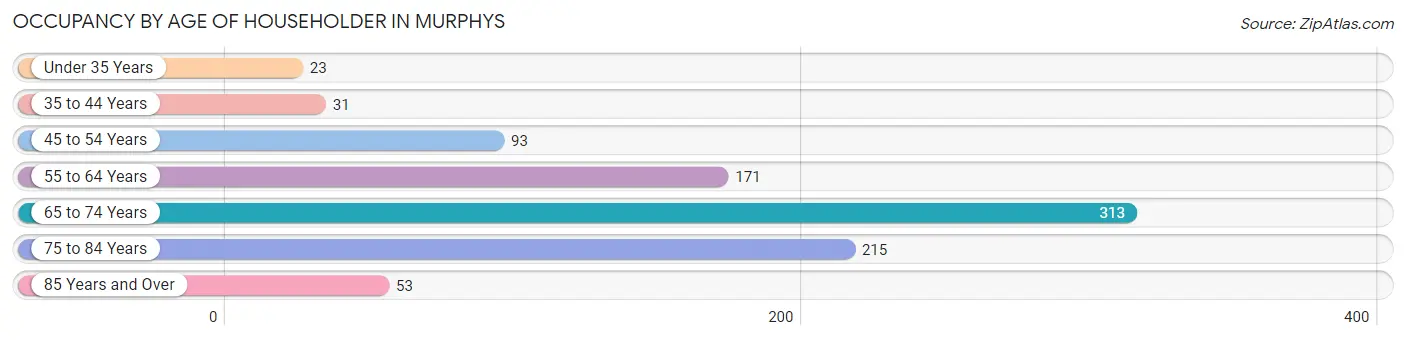
| Age Bracket | # Households | % Households |
| Under 35 Years | 23 | 2.6% |
| 35 to 44 Years | 31 | 3.5% |
| 45 to 54 Years | 93 | 10.3% |
| 55 to 64 Years | 171 | 19.0% |
| 65 to 74 Years | 313 | 34.8% |
| 75 to 84 Years | 215 | 23.9% |
| 85 Years and Over | 53 | 5.9% |
| Total | 899 | 100.0% |
Housing Finances in Murphys
Median Income by Occupancy in Murphys
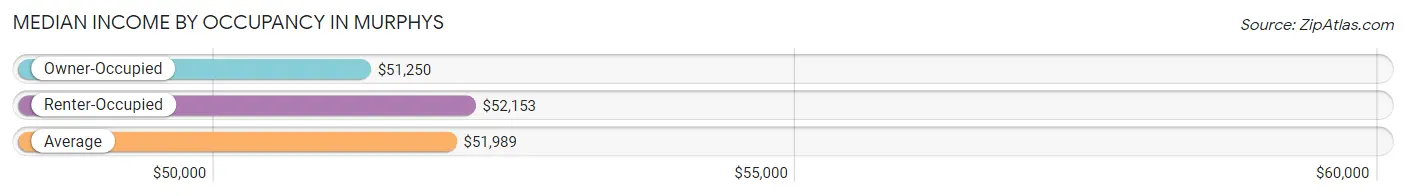
| Occupancy Type | # Households | Median Income |
| Owner-Occupied | 620 (69.0%) | $51,250 |
| Renter-Occupied | 279 (31.0%) | $52,153 |
| Average | 899 (100.0%) | $51,989 |
Occupancy by Householder Income Bracket in Murphys
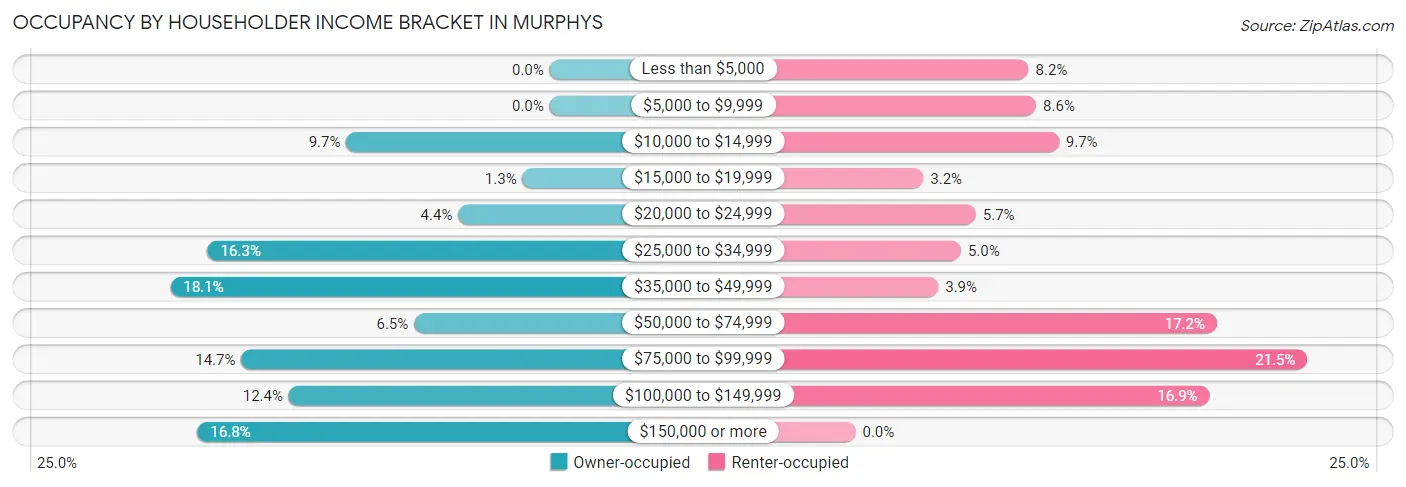
| Income Bracket | Owner-occupied | Renter-occupied |
| Less than $5,000 | 0 (0.0%) | 23 (8.2%) |
| $5,000 to $9,999 | 0 (0.0%) | 24 (8.6%) |
| $10,000 to $14,999 | 60 (9.7%) | 27 (9.7%) |
| $15,000 to $19,999 | 8 (1.3%) | 9 (3.2%) |
| $20,000 to $24,999 | 27 (4.3%) | 16 (5.7%) |
| $25,000 to $34,999 | 101 (16.3%) | 14 (5.0%) |
| $35,000 to $49,999 | 112 (18.1%) | 11 (3.9%) |
| $50,000 to $74,999 | 40 (6.5%) | 48 (17.2%) |
| $75,000 to $99,999 | 91 (14.7%) | 60 (21.5%) |
| $100,000 to $149,999 | 77 (12.4%) | 47 (16.9%) |
| $150,000 or more | 104 (16.8%) | 0 (0.0%) |
| Total | 620 (100.0%) | 279 (100.0%) |
Monthly Housing Cost Tiers in Murphys
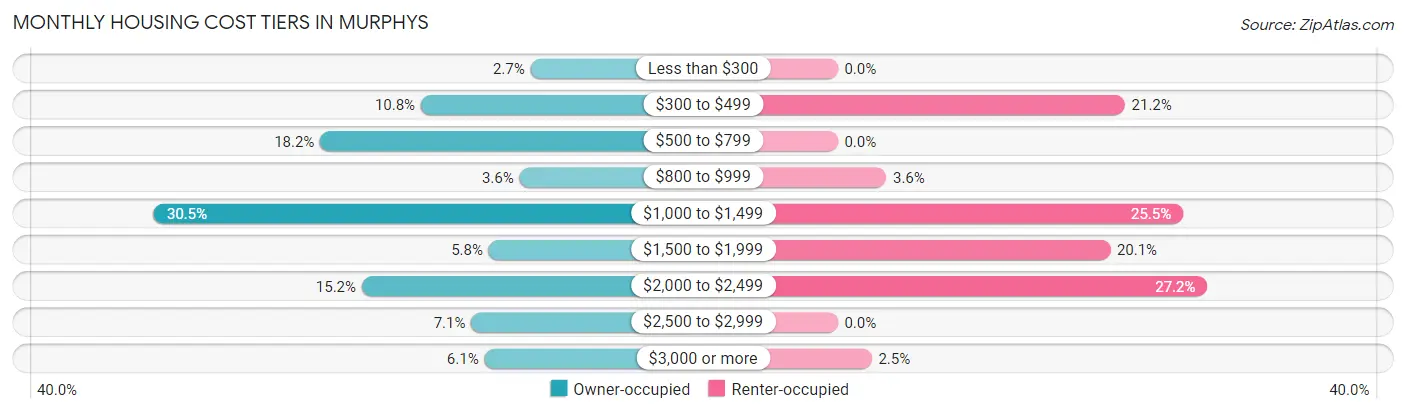
| Monthly Cost | Owner-occupied | Renter-occupied |
| Less than $300 | 17 (2.7%) | 0 (0.0%) |
| $300 to $499 | 67 (10.8%) | 59 (21.1%) |
| $500 to $799 | 113 (18.2%) | 0 (0.0%) |
| $800 to $999 | 22 (3.5%) | 10 (3.6%) |
| $1,000 to $1,499 | 189 (30.5%) | 71 (25.5%) |
| $1,500 to $1,999 | 36 (5.8%) | 56 (20.1%) |
| $2,000 to $2,499 | 94 (15.2%) | 76 (27.2%) |
| $2,500 to $2,999 | 44 (7.1%) | 0 (0.0%) |
| $3,000 or more | 38 (6.1%) | 7 (2.5%) |
| Total | 620 (100.0%) | 279 (100.0%) |
Physical Housing Characteristics in Murphys
Housing Structures in Murphys
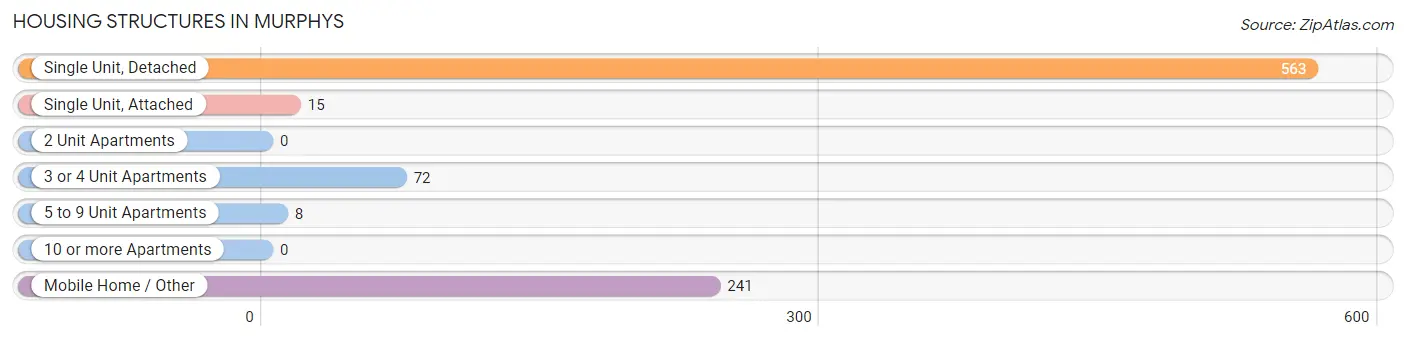
| Structure Type | # Housing Units | % Housing Units |
| Single Unit, Detached | 563 | 62.6% |
| Single Unit, Attached | 15 | 1.7% |
| 2 Unit Apartments | 0 | 0.0% |
| 3 or 4 Unit Apartments | 72 | 8.0% |
| 5 to 9 Unit Apartments | 8 | 0.9% |
| 10 or more Apartments | 0 | 0.0% |
| Mobile Home / Other | 241 | 26.8% |
| Total | 899 | 100.0% |
Housing Structures by Occupancy in Murphys
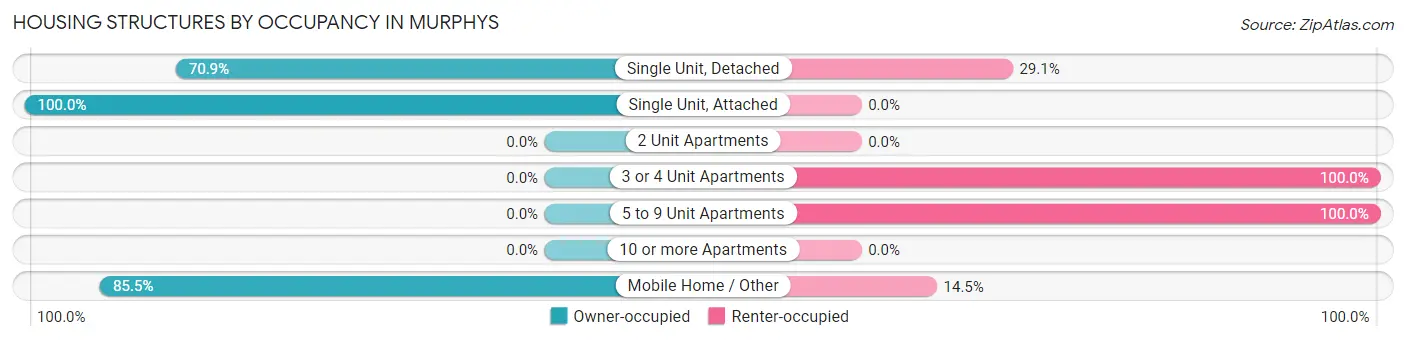
| Structure Type | Owner-occupied | Renter-occupied |
| Single Unit, Detached | 399 (70.9%) | 164 (29.1%) |
| Single Unit, Attached | 15 (100.0%) | 0 (0.0%) |
| 2 Unit Apartments | 0 (0.0%) | 0 (0.0%) |
| 3 or 4 Unit Apartments | 0 (0.0%) | 72 (100.0%) |
| 5 to 9 Unit Apartments | 0 (0.0%) | 8 (100.0%) |
| 10 or more Apartments | 0 (0.0%) | 0 (0.0%) |
| Mobile Home / Other | 206 (85.5%) | 35 (14.5%) |
| Total | 620 (69.0%) | 279 (31.0%) |
Housing Structures by Number of Rooms in Murphys
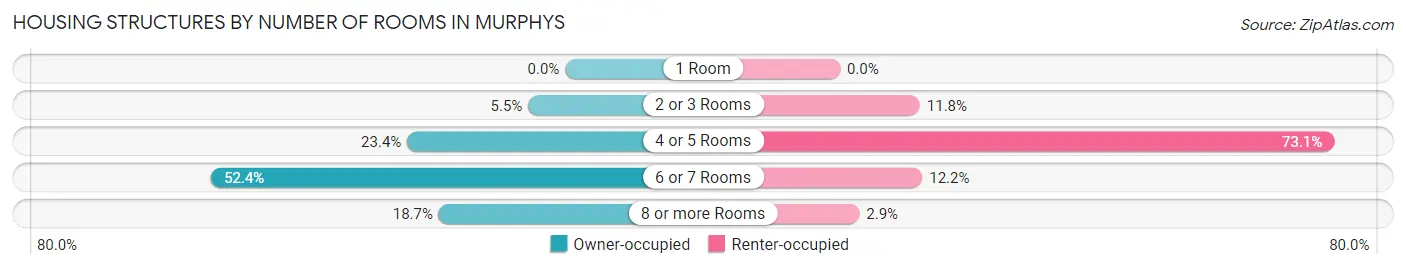
| Number of Rooms | Owner-occupied | Renter-occupied |
| 1 Room | 0 (0.0%) | 0 (0.0%) |
| 2 or 3 Rooms | 34 (5.5%) | 33 (11.8%) |
| 4 or 5 Rooms | 145 (23.4%) | 204 (73.1%) |
| 6 or 7 Rooms | 325 (52.4%) | 34 (12.2%) |
| 8 or more Rooms | 116 (18.7%) | 8 (2.9%) |
| Total | 620 (100.0%) | 279 (100.0%) |
Housing Structure by Heating Type in Murphys
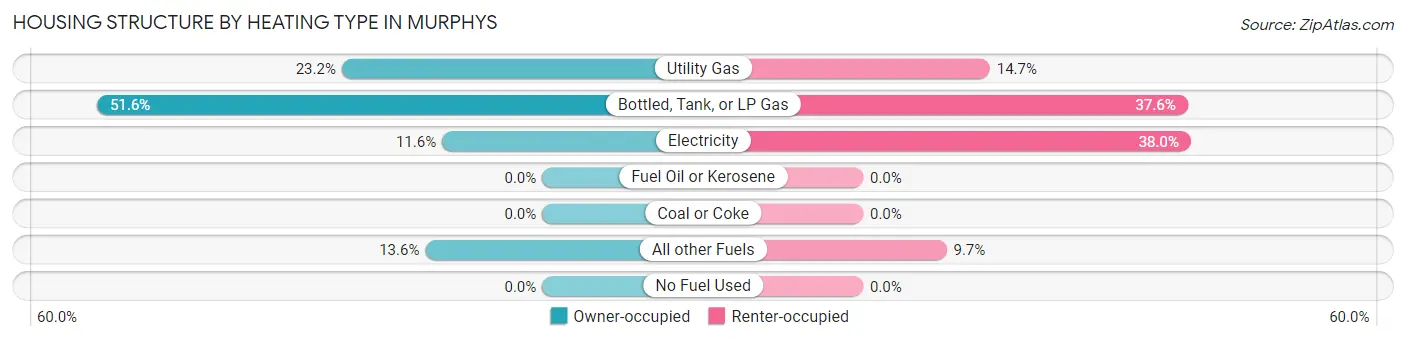
| Heating Type | Owner-occupied | Renter-occupied |
| Utility Gas | 144 (23.2%) | 41 (14.7%) |
| Bottled, Tank, or LP Gas | 320 (51.6%) | 105 (37.6%) |
| Electricity | 72 (11.6%) | 106 (38.0%) |
| Fuel Oil or Kerosene | 0 (0.0%) | 0 (0.0%) |
| Coal or Coke | 0 (0.0%) | 0 (0.0%) |
| All other Fuels | 84 (13.6%) | 27 (9.7%) |
| No Fuel Used | 0 (0.0%) | 0 (0.0%) |
| Total | 620 (100.0%) | 279 (100.0%) |
Household Vehicle Usage in Murphys
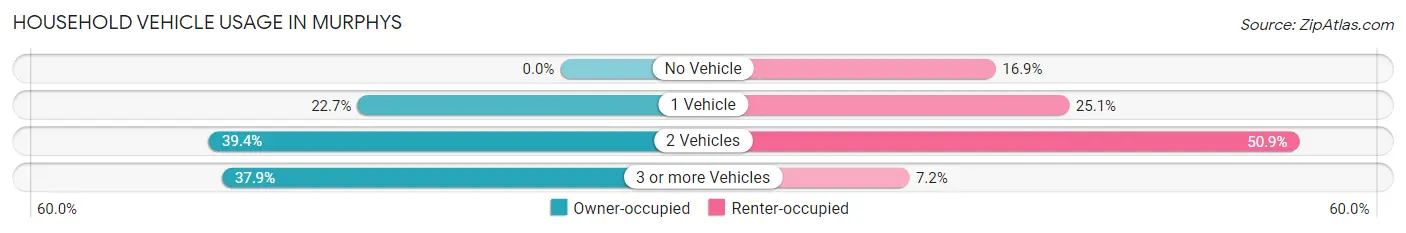
| Vehicles per Household | Owner-occupied | Renter-occupied |
| No Vehicle | 0 (0.0%) | 47 (16.9%) |
| 1 Vehicle | 141 (22.7%) | 70 (25.1%) |
| 2 Vehicles | 244 (39.4%) | 142 (50.9%) |
| 3 or more Vehicles | 235 (37.9%) | 20 (7.2%) |
| Total | 620 (100.0%) | 279 (100.0%) |
Real Estate & Mortgages in Murphys
Real Estate and Mortgage Overview in Murphys
| Characteristic | Without Mortgage | With Mortgage |
| Housing Units | 389 | 231 |
| Median Property Value | $209,500 | $611,000 |
| Median Household Income | $38,322 | $83 |
| Monthly Housing Costs | $848 | $38 |
| Real Estate Taxes | - | - |
Property Value by Mortgage Status in Murphys
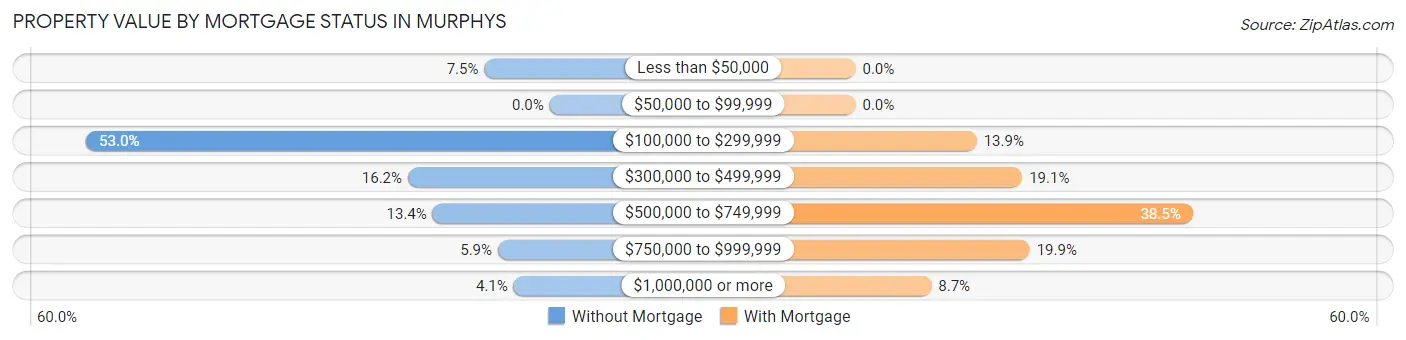
| Property Value | Without Mortgage | With Mortgage |
| Less than $50,000 | 29 (7.5%) | 0 (0.0%) |
| $50,000 to $99,999 | 0 (0.0%) | 0 (0.0%) |
| $100,000 to $299,999 | 206 (53.0%) | 32 (13.9%) |
| $300,000 to $499,999 | 63 (16.2%) | 44 (19.1%) |
| $500,000 to $749,999 | 52 (13.4%) | 89 (38.5%) |
| $750,000 to $999,999 | 23 (5.9%) | 46 (19.9%) |
| $1,000,000 or more | 16 (4.1%) | 20 (8.7%) |
| Total | 389 (100.0%) | 231 (100.0%) |
Household Income by Mortgage Status in Murphys
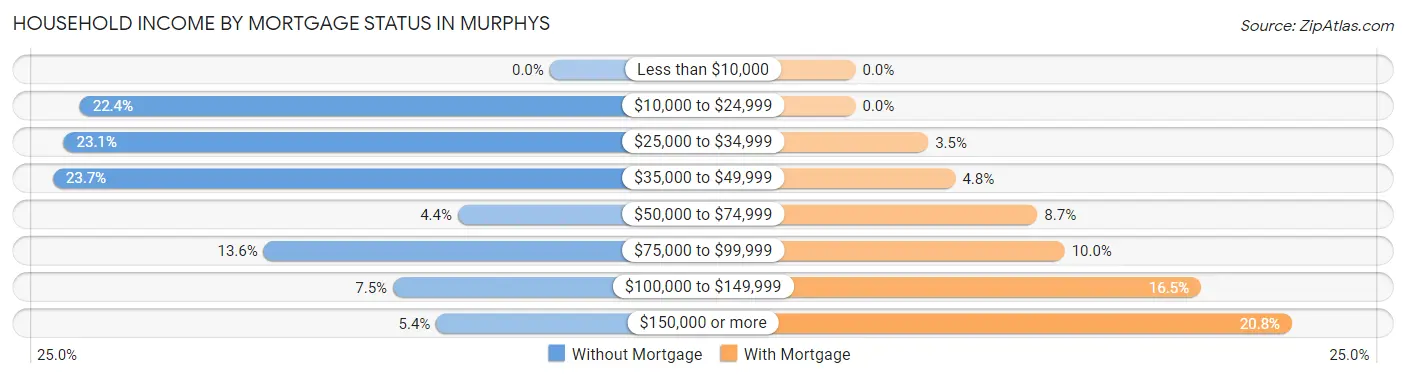
| Household Income | Without Mortgage | With Mortgage |
| Less than $10,000 | 0 (0.0%) | 0 (0.0%) |
| $10,000 to $24,999 | 87 (22.4%) | 0 (0.0%) |
| $25,000 to $34,999 | 90 (23.1%) | 8 (3.5%) |
| $35,000 to $49,999 | 92 (23.6%) | 11 (4.8%) |
| $50,000 to $74,999 | 17 (4.4%) | 20 (8.7%) |
| $75,000 to $99,999 | 53 (13.6%) | 23 (10.0%) |
| $100,000 to $149,999 | 29 (7.5%) | 38 (16.5%) |
| $150,000 or more | 21 (5.4%) | 48 (20.8%) |
| Total | 389 (100.0%) | 231 (100.0%) |
Property Value to Household Income Ratio in Murphys
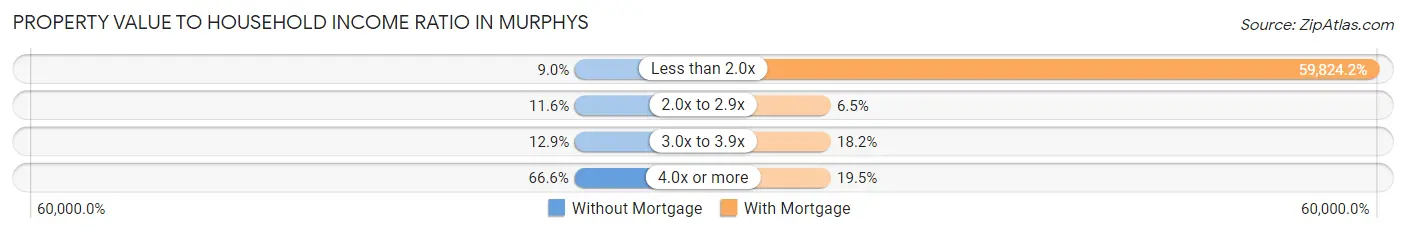
| Value-to-Income Ratio | Without Mortgage | With Mortgage |
| Less than 2.0x | 35 (9.0%) | 138,194 (59,824.2%) |
| 2.0x to 2.9x | 45 (11.6%) | 15 (6.5%) |
| 3.0x to 3.9x | 50 (12.9%) | 42 (18.2%) |
| 4.0x or more | 259 (66.6%) | 45 (19.5%) |
| Total | 389 (100.0%) | 231 (100.0%) |
Real Estate Taxes by Mortgage Status in Murphys
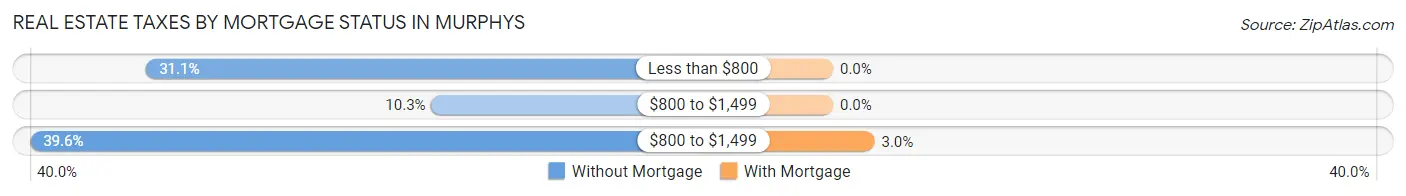
| Property Taxes | Without Mortgage | With Mortgage |
| Less than $800 | 121 (31.1%) | 0 (0.0%) |
| $800 to $1,499 | 40 (10.3%) | 0 (0.0%) |
| $800 to $1,499 | 154 (39.6%) | 7 (3.0%) |
| Total | 389 (100.0%) | 231 (100.0%) |
Health & Disability in Murphys
Health Insurance Coverage by Age in Murphys
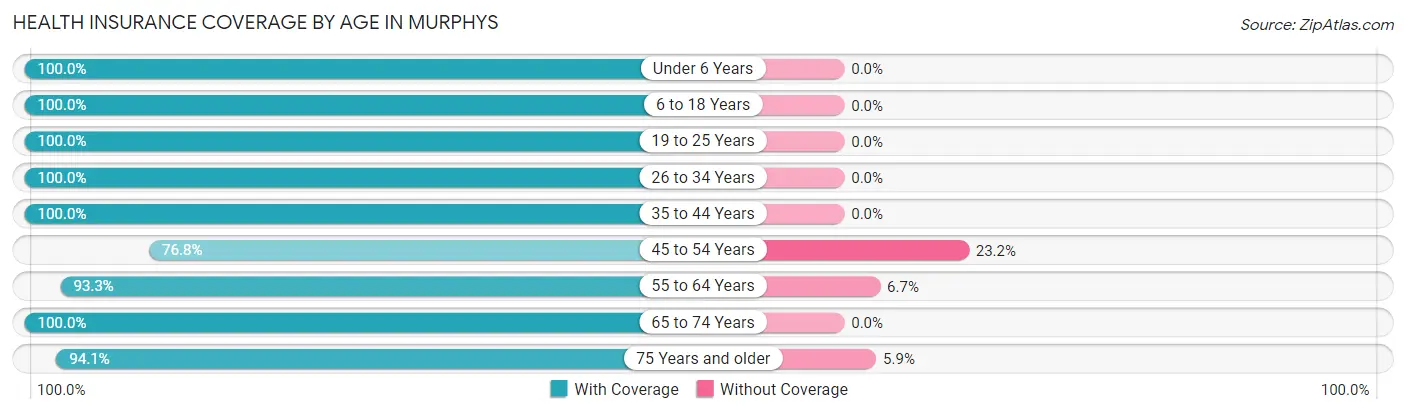
| Age Bracket | With Coverage | Without Coverage |
| Under 6 Years | 71 (100.0%) | 0 (0.0%) |
| 6 to 18 Years | 96 (100.0%) | 0 (0.0%) |
| 19 to 25 Years | 178 (100.0%) | 0 (0.0%) |
| 26 to 34 Years | 100 (100.0%) | 0 (0.0%) |
| 35 to 44 Years | 148 (100.0%) | 0 (0.0%) |
| 45 to 54 Years | 162 (76.8%) | 49 (23.2%) |
| 55 to 64 Years | 307 (93.3%) | 22 (6.7%) |
| 65 to 74 Years | 502 (100.0%) | 0 (0.0%) |
| 75 Years and older | 364 (94.1%) | 23 (5.9%) |
| Total | 1,928 (95.4%) | 94 (4.6%) |
Health Insurance Coverage by Citizenship Status in Murphys
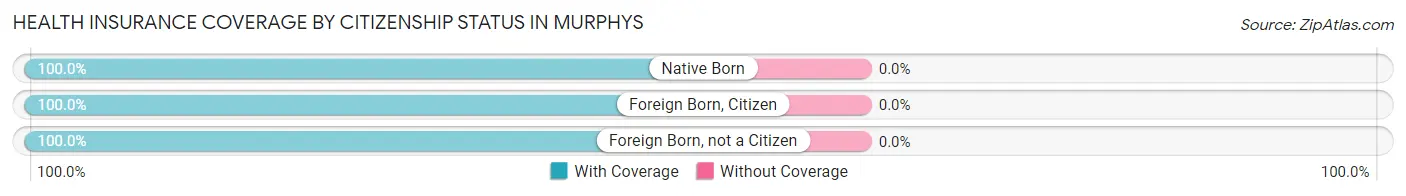
| Citizenship Status | With Coverage | Without Coverage |
| Native Born | 71 (100.0%) | 0 (0.0%) |
| Foreign Born, Citizen | 96 (100.0%) | 0 (0.0%) |
| Foreign Born, not a Citizen | 178 (100.0%) | 0 (0.0%) |
Health Insurance Coverage by Household Income in Murphys
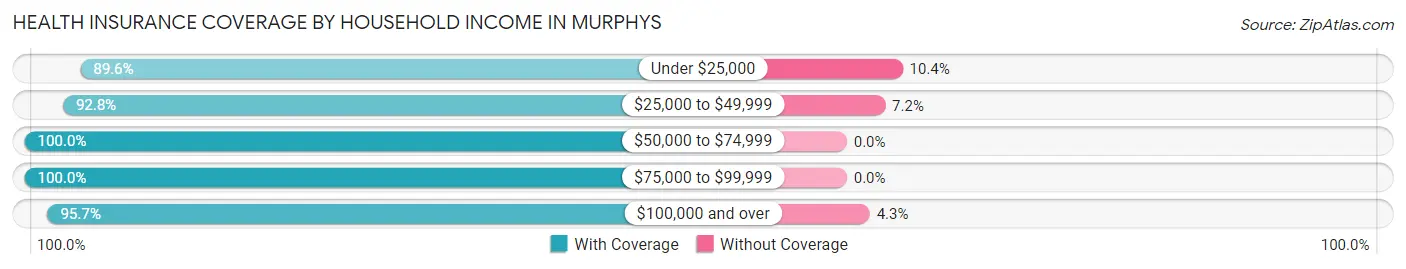
| Household Income | With Coverage | Without Coverage |
| Under $25,000 | 266 (89.6%) | 31 (10.4%) |
| $25,000 to $49,999 | 439 (92.8%) | 34 (7.2%) |
| $50,000 to $74,999 | 248 (100.0%) | 0 (0.0%) |
| $75,000 to $99,999 | 328 (100.0%) | 0 (0.0%) |
| $100,000 and over | 647 (95.7%) | 29 (4.3%) |
Public vs Private Health Insurance Coverage by Age in Murphys
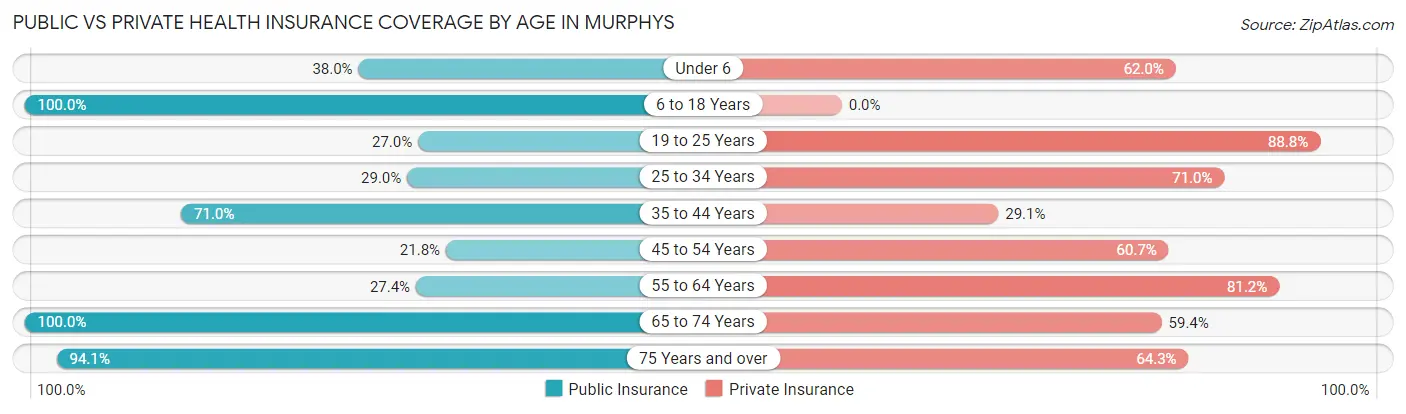
| Age Bracket | Public Insurance | Private Insurance |
| Under 6 | 27 (38.0%) | 44 (62.0%) |
| 6 to 18 Years | 96 (100.0%) | 0 (0.0%) |
| 19 to 25 Years | 48 (27.0%) | 158 (88.8%) |
| 25 to 34 Years | 29 (29.0%) | 71 (71.0%) |
| 35 to 44 Years | 105 (71.0%) | 43 (29.0%) |
| 45 to 54 Years | 46 (21.8%) | 128 (60.7%) |
| 55 to 64 Years | 90 (27.4%) | 267 (81.2%) |
| 65 to 74 Years | 502 (100.0%) | 298 (59.4%) |
| 75 Years and over | 364 (94.1%) | 249 (64.3%) |
| Total | 1,307 (64.6%) | 1,258 (62.2%) |
Disability Status by Sex by Age in Murphys
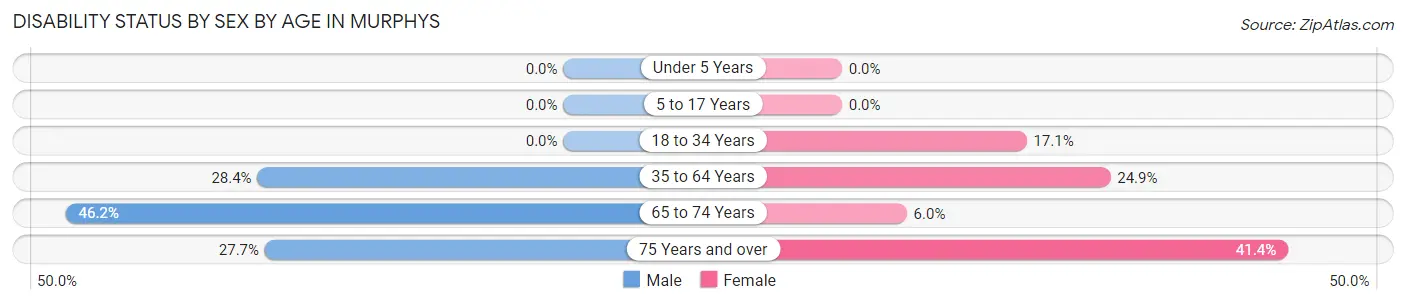
| Age Bracket | Male | Female |
| Under 5 Years | 0 (0.0%) | 0 (0.0%) |
| 5 to 17 Years | 0 (0.0%) | 0 (0.0%) |
| 18 to 34 Years | 0 (0.0%) | 30 (17.1%) |
| 35 to 64 Years | 111 (28.4%) | 74 (24.9%) |
| 65 to 74 Years | 109 (46.2%) | 16 (6.0%) |
| 75 Years and over | 41 (27.7%) | 99 (41.4%) |
Disability Class by Sex by Age in Murphys
Disability Class: Hearing Difficulty
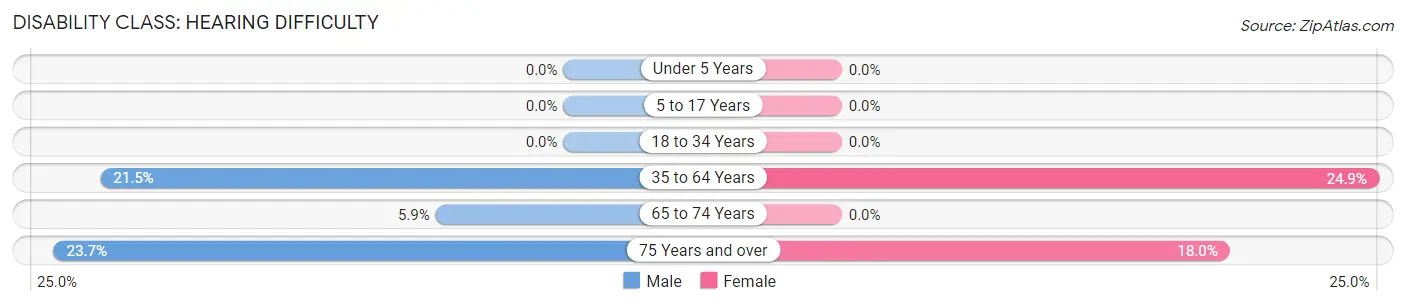
| Age Bracket | Male | Female |
| Under 5 Years | 0 (0.0%) | 0 (0.0%) |
| 5 to 17 Years | 0 (0.0%) | 0 (0.0%) |
| 18 to 34 Years | 0 (0.0%) | 0 (0.0%) |
| 35 to 64 Years | 84 (21.5%) | 74 (24.9%) |
| 65 to 74 Years | 14 (5.9%) | 0 (0.0%) |
| 75 Years and over | 35 (23.6%) | 43 (18.0%) |
Disability Class: Vision Difficulty
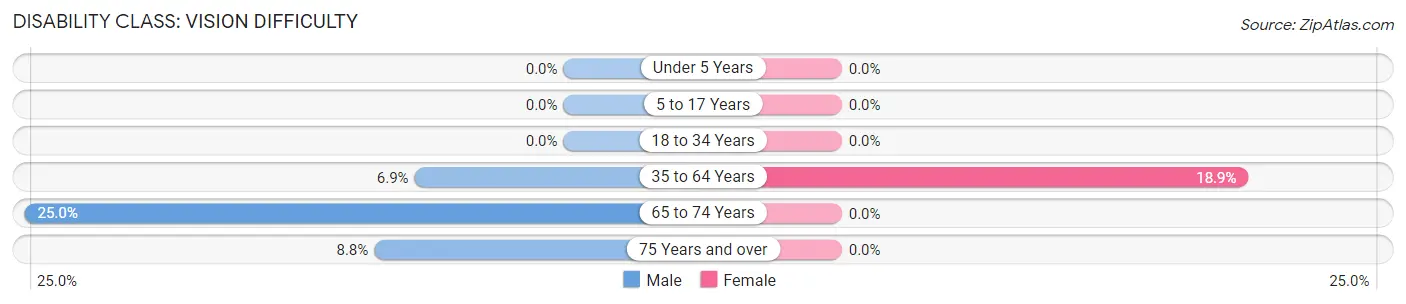
| Age Bracket | Male | Female |
| Under 5 Years | 0 (0.0%) | 0 (0.0%) |
| 5 to 17 Years | 0 (0.0%) | 0 (0.0%) |
| 18 to 34 Years | 0 (0.0%) | 0 (0.0%) |
| 35 to 64 Years | 27 (6.9%) | 56 (18.9%) |
| 65 to 74 Years | 59 (25.0%) | 0 (0.0%) |
| 75 Years and over | 13 (8.8%) | 0 (0.0%) |
Disability Class: Cognitive Difficulty
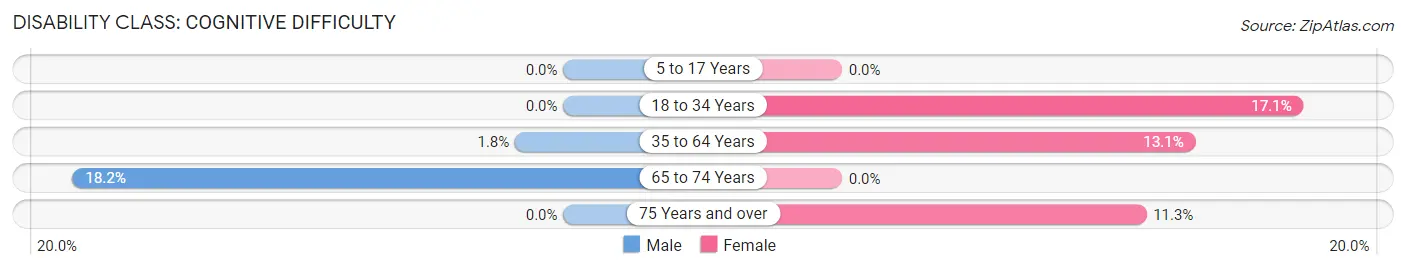
| Age Bracket | Male | Female |
| 5 to 17 Years | 0 (0.0%) | 0 (0.0%) |
| 18 to 34 Years | 0 (0.0%) | 30 (17.1%) |
| 35 to 64 Years | 7 (1.8%) | 39 (13.1%) |
| 65 to 74 Years | 43 (18.2%) | 0 (0.0%) |
| 75 Years and over | 0 (0.0%) | 27 (11.3%) |
Disability Class: Ambulatory Difficulty
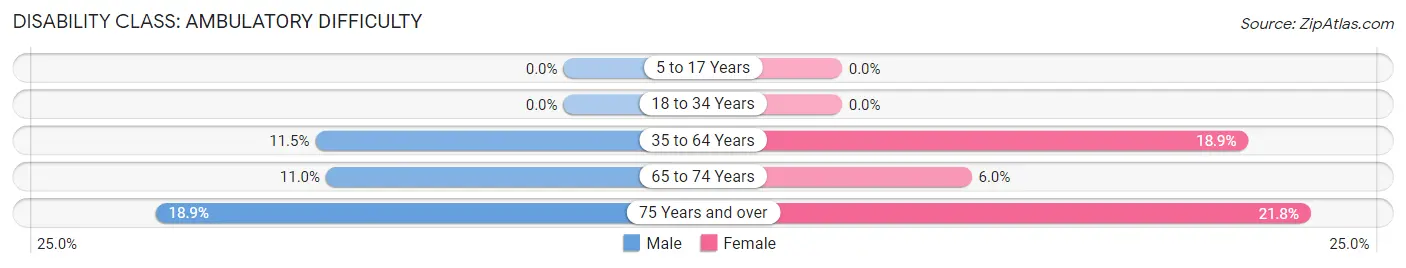
| Age Bracket | Male | Female |
| 5 to 17 Years | 0 (0.0%) | 0 (0.0%) |
| 18 to 34 Years | 0 (0.0%) | 0 (0.0%) |
| 35 to 64 Years | 45 (11.5%) | 56 (18.9%) |
| 65 to 74 Years | 26 (11.0%) | 16 (6.0%) |
| 75 Years and over | 28 (18.9%) | 52 (21.8%) |
Disability Class: Self-Care Difficulty
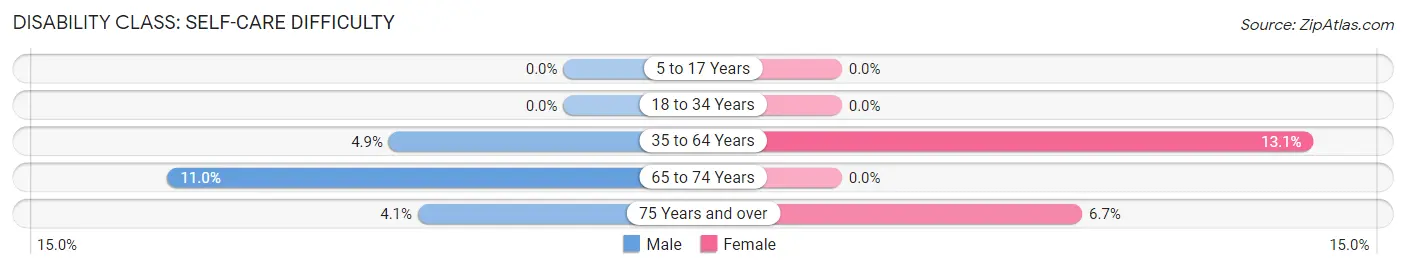
| Age Bracket | Male | Female |
| 5 to 17 Years | 0 (0.0%) | 0 (0.0%) |
| 18 to 34 Years | 0 (0.0%) | 0 (0.0%) |
| 35 to 64 Years | 19 (4.9%) | 39 (13.1%) |
| 65 to 74 Years | 26 (11.0%) | 0 (0.0%) |
| 75 Years and over | 6 (4.1%) | 16 (6.7%) |
Technology Access in Murphys
Computing Device Access in Murphys
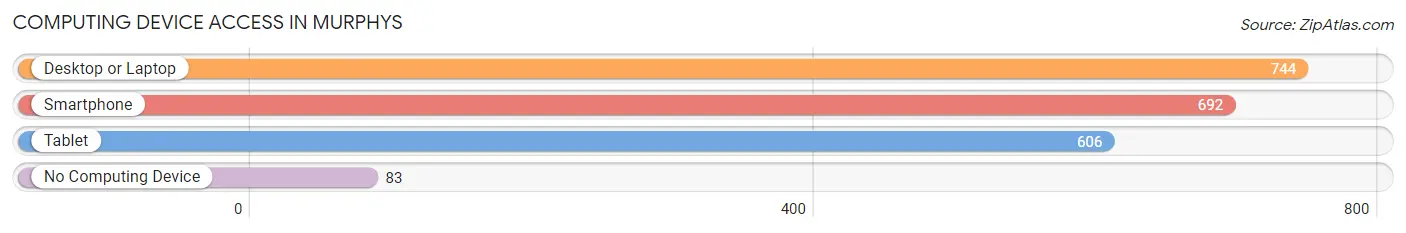
| Device Type | # Households | % Households |
| Desktop or Laptop | 744 | 82.8% |
| Smartphone | 692 | 77.0% |
| Tablet | 606 | 67.4% |
| No Computing Device | 83 | 9.2% |
| Total | 899 | 100.0% |
Internet Access in Murphys
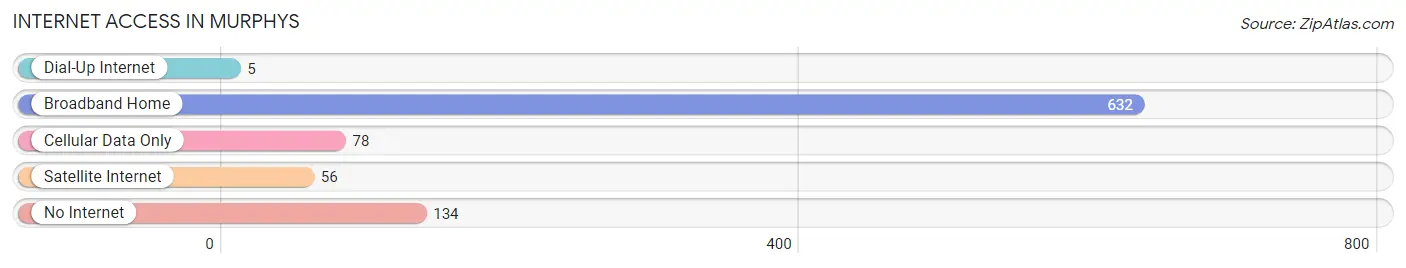
| Internet Type | # Households | % Households |
| Dial-Up Internet | 5 | 0.6% |
| Broadband Home | 632 | 70.3% |
| Cellular Data Only | 78 | 8.7% |
| Satellite Internet | 56 | 6.2% |
| No Internet | 134 | 14.9% |
| Total | 899 | 100.0% |
Murphys Summary
Murphys, California is a small town located in Calaveras County in the Sierra Nevada foothills of Northern California. It is situated at an elevation of 2,000 feet and is surrounded by rolling hills and oak-studded meadows. The town is known for its quaint downtown area, which is lined with historic buildings, antique stores, and restaurants. Murphys is also home to several wineries and is a popular destination for wine tasting.
History
The area that is now Murphys was first inhabited by the Miwok and Yokut Native American tribes. The first European settlers arrived in the area in the early 1850s, and the town of Murphys was founded in 1856. The town was named after John and Daniel Murphy, two brothers who owned a nearby ranch.
Murphys quickly became a popular destination for gold miners, and the town grew rapidly. By the late 1800s, Murphys had become a bustling center of commerce, with several stores, hotels, and saloons. The town also had a post office, a school, and a newspaper.
Geography
Murphys is located in the Sierra Nevada foothills of Northern California, about 70 miles east of Sacramento. The town is situated at an elevation of 2,000 feet and is surrounded by rolling hills and oak-studded meadows. The town is located in the Sierra Nevada mountain range, and the nearby Stanislaus National Forest provides a variety of outdoor activities, including hiking, camping, and fishing.
Economy
The economy of Murphys is largely based on tourism. The town is a popular destination for wine tasting, and there are several wineries in the area. The downtown area is also home to several antique stores, restaurants, and other businesses. The town is also home to several small businesses, including a brewery, a distillery, and a cheese factory.
Demographics
As of the 2010 census, the population of Murphys was 2,063. The median age of the population was 44.7 years, and the median household income was $50,945. The racial makeup of the town was 94.3% White, 0.7% African American, 0.7% Native American, 0.7% Asian, 0.2% Pacific Islander, and 2.6% from other races.
Murphys is a small town with a close-knit community. The town is known for its friendly atmosphere and its commitment to preserving its historic downtown area. The town is also home to several festivals and events throughout the year, including the Murphys Irish Day Festival and the Murphys Music Festival.
Common Questions
What is Per Capita Income in Murphys?
Per Capita income in Murphys is $35,815.
What is the Median Family Income in Murphys?
Median Family Income in Murphys is $78,750.
What is the Median Household income in Murphys?
Median Household Income in Murphys is $51,989.
What is Income or Wage Gap in Murphys?
Income or Wage Gap in Murphys is 44.7%.
Women in Murphys earn 55.3 cents for every dollar earned by a man.
What is Inequality or Gini Index in Murphys?
Inequality or Gini Index in Murphys is 0.43.
What is the Total Population of Murphys?
Total Population of Murphys is 2,022.
What is the Total Male Population of Murphys?
Total Male Population of Murphys is 1,008.
What is the Total Female Population of Murphys?
Total Female Population of Murphys is 1,014.
What is the Ratio of Males per 100 Females in Murphys?
There are 99.41 Males per 100 Females in Murphys.
What is the Ratio of Females per 100 Males in Murphys?
There are 100.60 Females per 100 Males in Murphys.
What is the Median Population Age in Murphys?
Median Population Age in Murphys is 60.7 Years.
What is the Average Family Size in Murphys
Average Family Size in Murphys is 2.8 People.
What is the Average Household Size in Murphys
Average Household Size in Murphys is 2.2 People.
How Large is the Labor Force in Murphys?
There are 758 People in the Labor Forcein in Murphys.
What is the Percentage of People in the Labor Force in Murphys?
40.6% of People are in the Labor Force in Murphys.
What is the Unemployment Rate in Murphys?
Unemployment Rate in Murphys is 2.4%.