Mount Shasta, CA Map & Demographics
Mount Shasta Map
Mount Shasta Overview
$39,162
PER CAPITA INCOME
$58,131
AVG FAMILY INCOME
$47,279
AVG HOUSEHOLD INCOME
32.8%
WAGE / INCOME GAP [ % ]
67.2¢/ $1
WAGE / INCOME GAP [ $ ]
0.55
INEQUALITY / GINI INDEX
3,235
TOTAL POPULATION
1,488
MALE POPULATION
1,747
FEMALE POPULATION
85.17
MALES / 100 FEMALES
117.41
FEMALES / 100 MALES
57.2
MEDIAN AGE
2.4
AVG FAMILY SIZE
1.8
AVG HOUSEHOLD SIZE
1,378
LABOR FORCE [ PEOPLE ]
48.6%
PERCENT IN LABOR FORCE
1.6%
UNEMPLOYMENT RATE
Mount Shasta Zip Codes
Mount Shasta Area Codes
Income in Mount Shasta
Income Overview in Mount Shasta
Per Capita Income in Mount Shasta is $39,162, while median incomes of families and households are $58,131 and $47,279 respectively.
| Characteristic | Number | Measure |
| Per Capita Income | 3,235 | $39,162 |
| Median Family Income | 885 | $58,131 |
| Mean Family Income | 885 | $73,134 |
| Median Household Income | 1,811 | $47,279 |
| Mean Household Income | 1,811 | $69,848 |
| Income Deficit | 885 | $0 |
| Wage / Income Gap (%) | 3,235 | 32.78% |
| Wage / Income Gap ($) | 3,235 | 67.22¢ per $1 |
| Gini / Inequality Index | 3,235 | 0.55 |
Earnings by Sex in Mount Shasta
Average Earnings in Mount Shasta are $29,099, $35,755 for men and $24,036 for women, a difference of 32.8%.
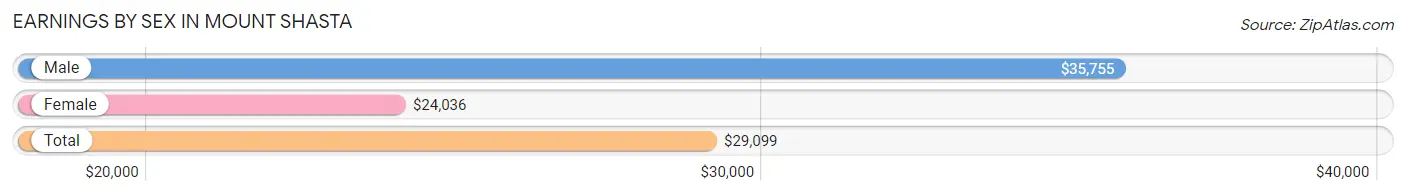
| Sex | Number | Average Earnings |
| Male | 624 (44.0%) | $35,755 |
| Female | 795 (56.0%) | $24,036 |
| Total | 1,419 (100.0%) | $29,099 |
Earnings by Sex by Income Bracket in Mount Shasta
The most common earnings brackets in Mount Shasta are $100,000+ for men (139 | 22.3%) and $55,000 to $64,999 for women (102 | 12.8%).
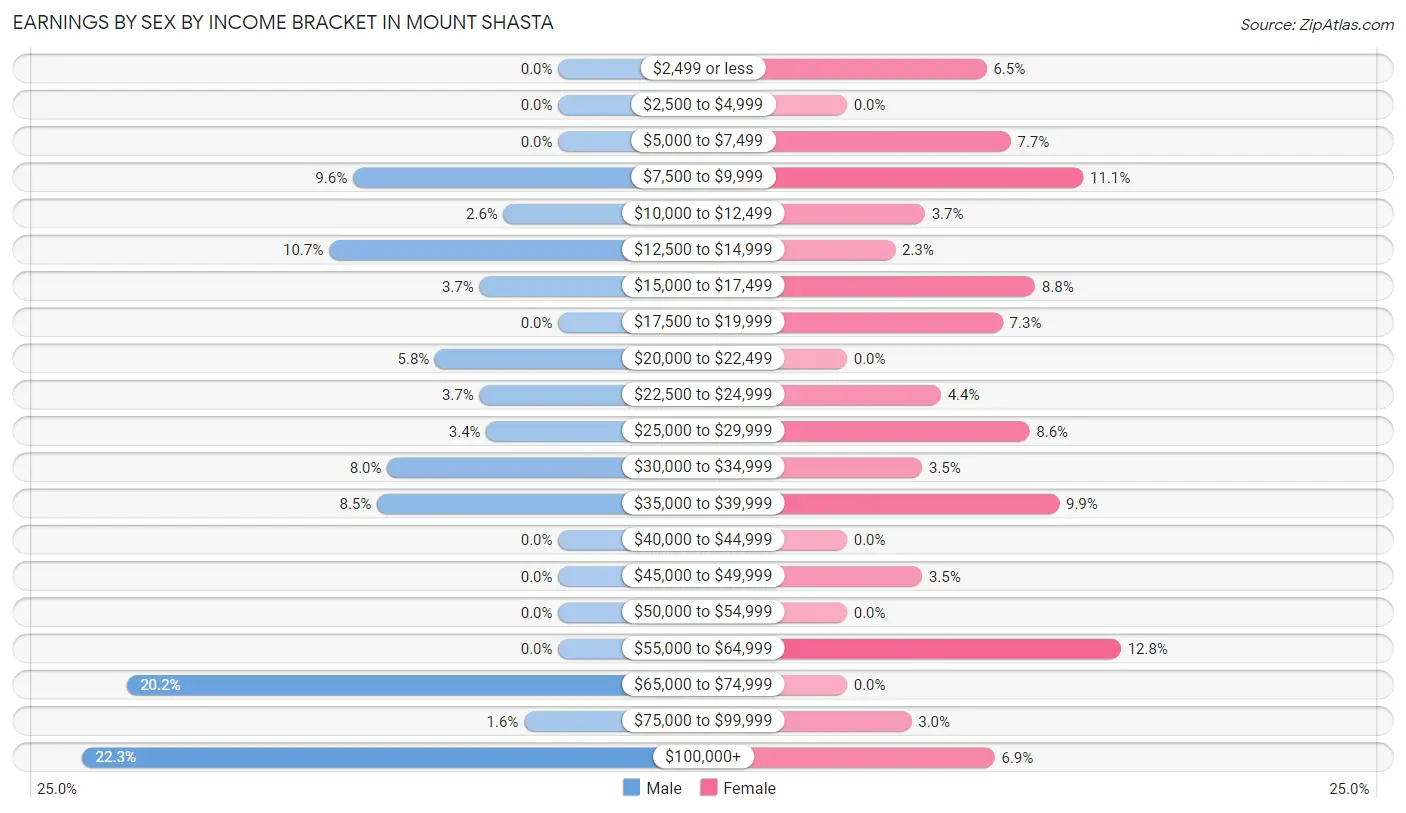
| Income | Male | Female |
| $2,499 or less | 0 (0.0%) | 52 (6.5%) |
| $2,500 to $4,999 | 0 (0.0%) | 0 (0.0%) |
| $5,000 to $7,499 | 0 (0.0%) | 61 (7.7%) |
| $7,500 to $9,999 | 60 (9.6%) | 88 (11.1%) |
| $10,000 to $12,499 | 16 (2.6%) | 29 (3.6%) |
| $12,500 to $14,999 | 67 (10.7%) | 18 (2.3%) |
| $15,000 to $17,499 | 23 (3.7%) | 70 (8.8%) |
| $17,500 to $19,999 | 0 (0.0%) | 58 (7.3%) |
| $20,000 to $22,499 | 36 (5.8%) | 0 (0.0%) |
| $22,500 to $24,999 | 23 (3.7%) | 35 (4.4%) |
| $25,000 to $29,999 | 21 (3.4%) | 68 (8.6%) |
| $30,000 to $34,999 | 50 (8.0%) | 28 (3.5%) |
| $35,000 to $39,999 | 53 (8.5%) | 79 (9.9%) |
| $40,000 to $44,999 | 0 (0.0%) | 0 (0.0%) |
| $45,000 to $49,999 | 0 (0.0%) | 28 (3.5%) |
| $50,000 to $54,999 | 0 (0.0%) | 0 (0.0%) |
| $55,000 to $64,999 | 0 (0.0%) | 102 (12.8%) |
| $65,000 to $74,999 | 126 (20.2%) | 0 (0.0%) |
| $75,000 to $99,999 | 10 (1.6%) | 24 (3.0%) |
| $100,000+ | 139 (22.3%) | 55 (6.9%) |
| Total | 624 (100.0%) | 795 (100.0%) |
Earnings by Sex by Educational Attainment in Mount Shasta
Average earnings in Mount Shasta are $67,544 for men and $23,036 for women, a difference of 65.9%. Men with an educational attainment of bachelor's degree enjoy the highest average annual earnings of $107,065, while those with college or associate's degree education earn the least with $66,685. Women with an educational attainment of bachelor's degree earn the most with the average annual earnings of $29,000, while those with college or associate's degree education have the smallest earnings of $16,821.
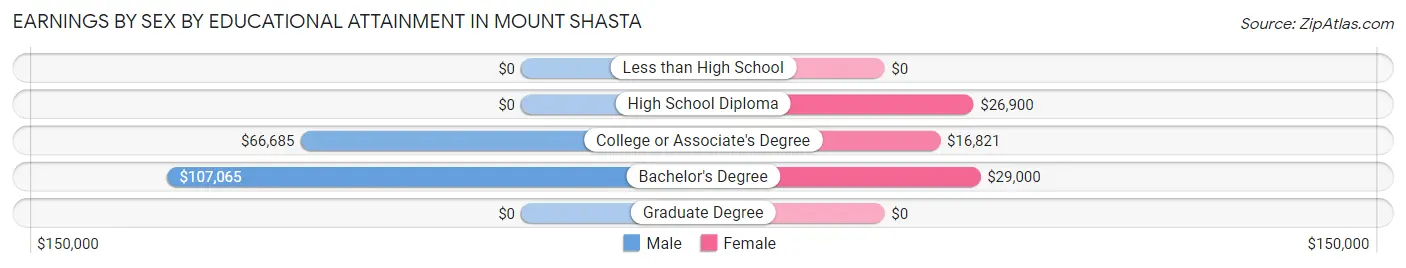
| Educational Attainment | Male Income | Female Income |
| Less than High School | - | - |
| High School Diploma | - | - |
| College or Associate's Degree | $66,685 | $16,821 |
| Bachelor's Degree | $107,065 | $29,000 |
| Graduate Degree | - | - |
| Total | $67,544 | $23,036 |
Family Income in Mount Shasta
Family Income Brackets in Mount Shasta
According to the Mount Shasta family income data, there are 317 families falling into the $50,000 to $74,999 income range, which is the most common income bracket and makes up 35.8% of all families.
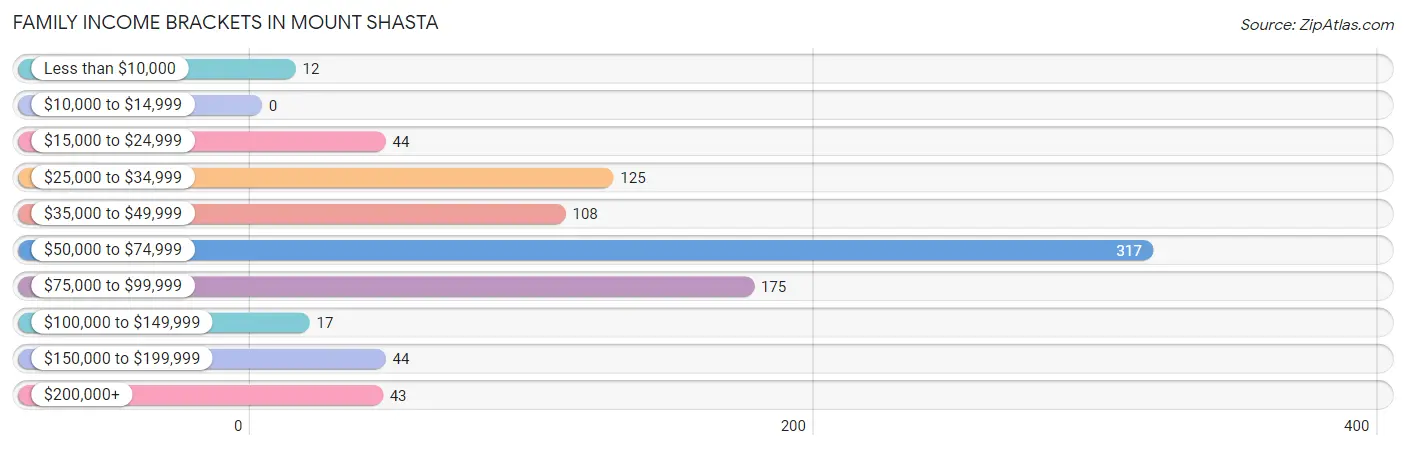
| Income Bracket | # Families | % Families |
| Less than $10,000 | 12 | 1.4% |
| $10,000 to $14,999 | 0 | 0.0% |
| $15,000 to $24,999 | 44 | 5.0% |
| $25,000 to $34,999 | 125 | 14.1% |
| $35,000 to $49,999 | 108 | 12.2% |
| $50,000 to $74,999 | 317 | 35.8% |
| $75,000 to $99,999 | 175 | 19.8% |
| $100,000 to $149,999 | 17 | 1.9% |
| $150,000 to $199,999 | 44 | 5.0% |
| $200,000+ | 43 | 4.9% |
Family Income by Famaliy Size in Mount Shasta
2-person families (684 | 77.3%) account for the highest median family income in Mount Shasta with $58,917 per family, while 2-person families (684 | 77.3%) have the highest median income of $29,458 per family member.
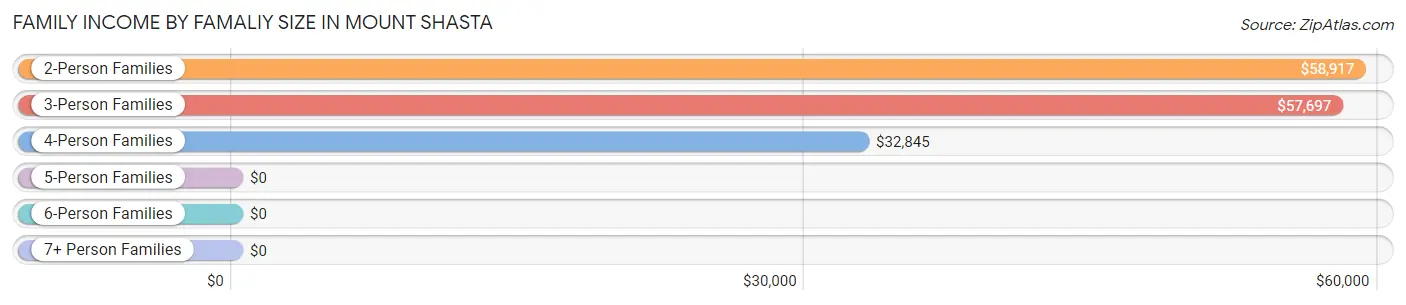
| Income Bracket | # Families | Median Income |
| 2-Person Families | 684 (77.3%) | $58,917 |
| 3-Person Families | 71 (8.0%) | $57,697 |
| 4-Person Families | 96 (10.8%) | $32,845 |
| 5-Person Families | 34 (3.8%) | $0 |
| 6-Person Families | 0 (0.0%) | $0 |
| 7+ Person Families | 0 (0.0%) | $0 |
| Total | 885 (100.0%) | $58,131 |
Family Income by Number of Earners in Mount Shasta
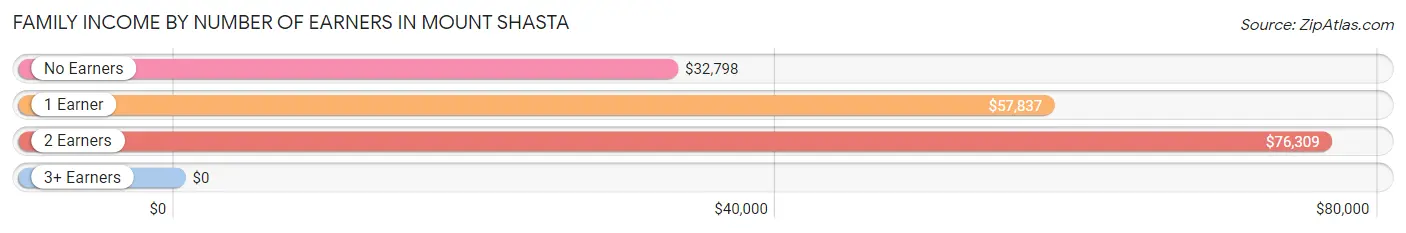
| Number of Earners | # Families | Median Income |
| No Earners | 205 (23.2%) | $32,798 |
| 1 Earner | 316 (35.7%) | $57,837 |
| 2 Earners | 347 (39.2%) | $76,309 |
| 3+ Earners | 17 (1.9%) | $0 |
| Total | 885 (100.0%) | $58,131 |
Household Income in Mount Shasta
Household Income Brackets in Mount Shasta
With 324 households falling in the category, the $25,000 to $34,999 income range is the most frequent in Mount Shasta, accounting for 17.9% of all households. In contrast, only 43 households (2.4%) fall into the $150,000 to $199,999 income bracket, making it the least populous group.
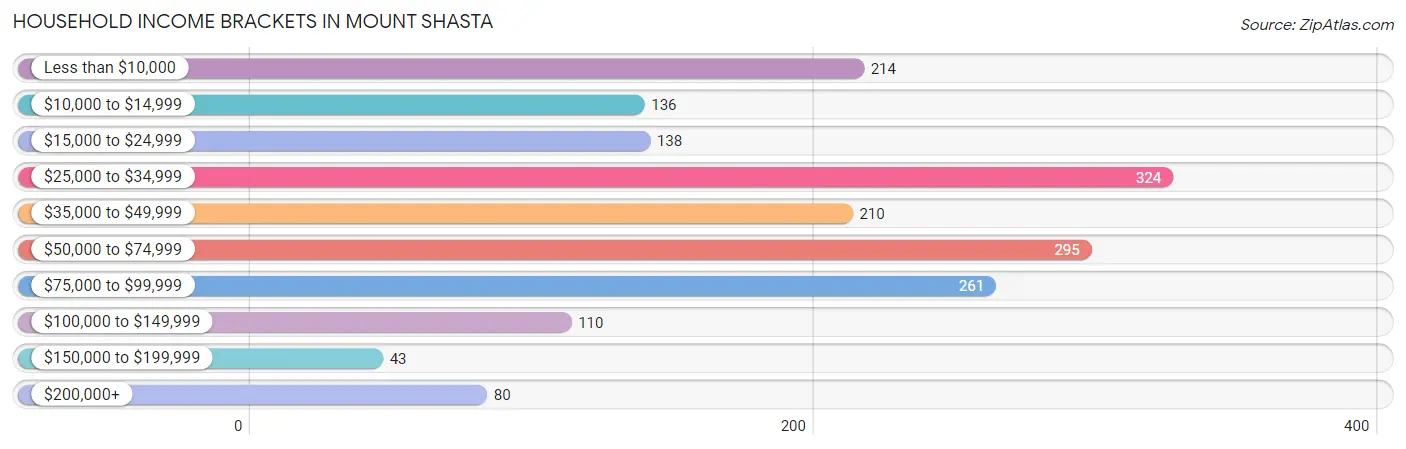
| Income Bracket | # Households | % Households |
| Less than $10,000 | 214 | 11.8% |
| $10,000 to $14,999 | 136 | 7.5% |
| $15,000 to $24,999 | 138 | 7.6% |
| $25,000 to $34,999 | 324 | 17.9% |
| $35,000 to $49,999 | 210 | 11.6% |
| $50,000 to $74,999 | 295 | 16.3% |
| $75,000 to $99,999 | 261 | 14.4% |
| $100,000 to $149,999 | 110 | 6.1% |
| $150,000 to $199,999 | 43 | 2.4% |
| $200,000+ | 80 | 4.4% |
Household Income by Householder Age in Mount Shasta
The median household income in Mount Shasta is $47,279, with the highest median household income of $53,650 found in the 45 to 64 years age bracket for the primary householder. A total of 603 households (33.3%) fall into this category. Meanwhile, the 15 to 24 years age bracket for the primary householder has the lowest median household income of $0, with 117 households (6.5%) in this group.
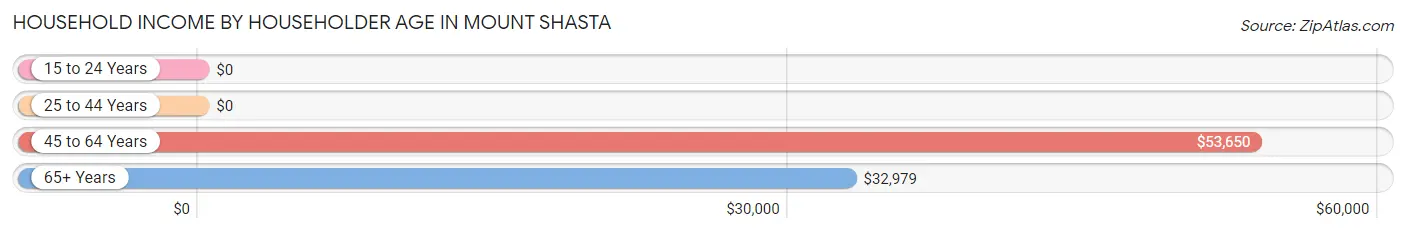
| Income Bracket | # Households | Median Income |
| 15 to 24 Years | 117 (6.5%) | $0 |
| 25 to 44 Years | 260 (14.4%) | $0 |
| 45 to 64 Years | 603 (33.3%) | $53,650 |
| 65+ Years | 831 (45.9%) | $32,979 |
| Total | 1,811 (100.0%) | $47,279 |
Poverty in Mount Shasta
Income Below Poverty by Sex and Age in Mount Shasta
With 18.1% poverty level for males and 18.7% for females among the residents of Mount Shasta, 35 to 44 year old males and 12 to 14 year old females are the most vulnerable to poverty, with 89 males (80.9%) and 65 females (58.0%) in their respective age groups living below the poverty level.
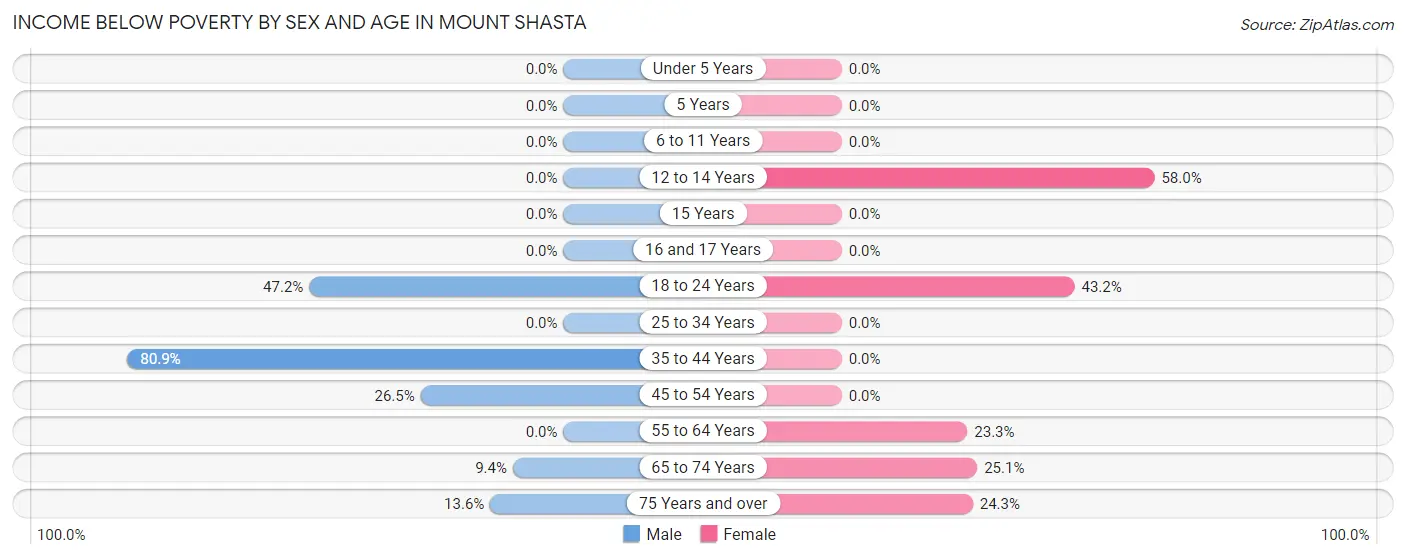
| Age Bracket | Male | Female |
| Under 5 Years | 0 (0.0%) | 0 (0.0%) |
| 5 Years | 0 (0.0%) | 0 (0.0%) |
| 6 to 11 Years | 0 (0.0%) | 0 (0.0%) |
| 12 to 14 Years | 0 (0.0%) | 65 (58.0%) |
| 15 Years | 0 (0.0%) | 0 (0.0%) |
| 16 and 17 Years | 0 (0.0%) | 0 (0.0%) |
| 18 to 24 Years | 67 (47.2%) | 54 (43.2%) |
| 25 to 34 Years | 0 (0.0%) | 0 (0.0%) |
| 35 to 44 Years | 89 (80.9%) | 0 (0.0%) |
| 45 to 54 Years | 44 (26.5%) | 0 (0.0%) |
| 55 to 64 Years | 0 (0.0%) | 76 (23.3%) |
| 65 to 74 Years | 30 (9.4%) | 88 (25.1%) |
| 75 Years and over | 39 (13.6%) | 44 (24.3%) |
| Total | 269 (18.1%) | 327 (18.7%) |
Income Above Poverty by Sex and Age in Mount Shasta
According to the poverty statistics in Mount Shasta, males aged under 5 years and females aged 6 to 11 years are the age groups that are most secure financially, with 100.0% of males and 100.0% of females in these age groups living above the poverty line.
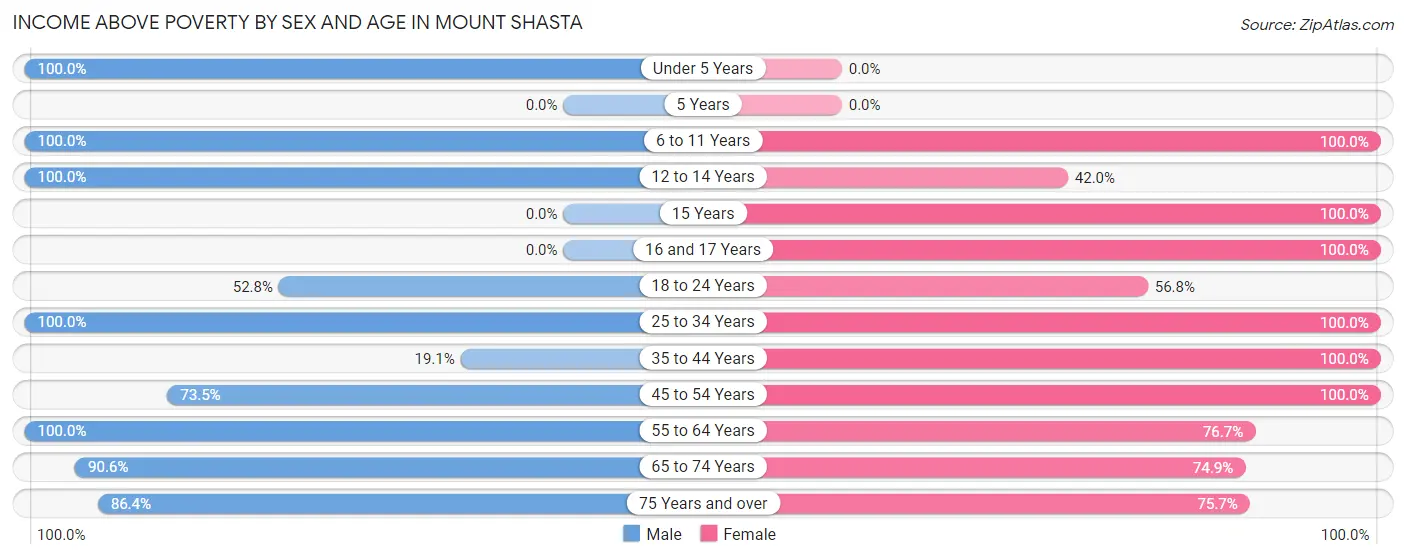
| Age Bracket | Male | Female |
| Under 5 Years | 22 (100.0%) | 0 (0.0%) |
| 5 Years | 0 (0.0%) | 0 (0.0%) |
| 6 to 11 Years | 64 (100.0%) | 150 (100.0%) |
| 12 to 14 Years | 34 (100.0%) | 47 (42.0%) |
| 15 Years | 0 (0.0%) | 17 (100.0%) |
| 16 and 17 Years | 0 (0.0%) | 22 (100.0%) |
| 18 to 24 Years | 75 (52.8%) | 71 (56.8%) |
| 25 to 34 Years | 171 (100.0%) | 177 (100.0%) |
| 35 to 44 Years | 21 (19.1%) | 36 (100.0%) |
| 45 to 54 Years | 122 (73.5%) | 251 (100.0%) |
| 55 to 64 Years | 166 (100.0%) | 250 (76.7%) |
| 65 to 74 Years | 290 (90.6%) | 262 (74.9%) |
| 75 Years and over | 248 (86.4%) | 137 (75.7%) |
| Total | 1,213 (81.9%) | 1,420 (81.3%) |
Income Below Poverty Among Married-Couple Families in Mount Shasta
The poverty statistics for married-couple families in Mount Shasta show that 1.9% or 12 of the total 645 families live below the poverty line. Families with no children have the highest poverty rate of 2.1%, comprising of 12 families. On the other hand, families with 1 or 2 children have the lowest poverty rate of 0.0%, which includes 0 families.
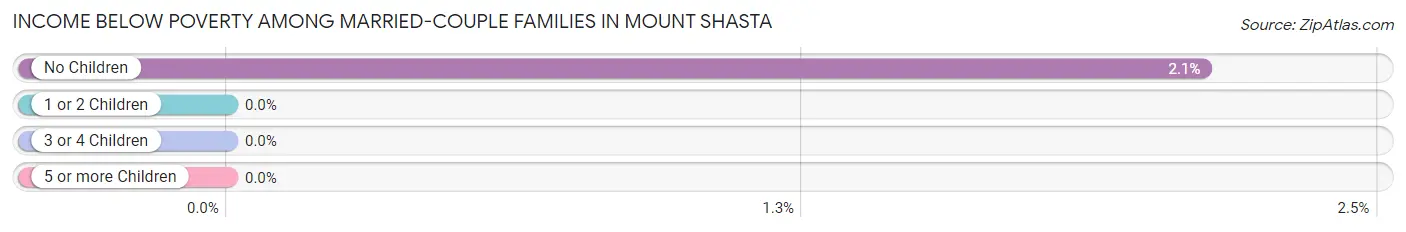
| Children | Above Poverty | Below Poverty |
| No Children | 554 (97.9%) | 12 (2.1%) |
| 1 or 2 Children | 79 (100.0%) | 0 (0.0%) |
| 3 or 4 Children | 0 (0.0%) | 0 (0.0%) |
| 5 or more Children | 0 (0.0%) | 0 (0.0%) |
| Total | 633 (98.1%) | 12 (1.9%) |
Income Below Poverty Among Single-Parent Households in Mount Shasta
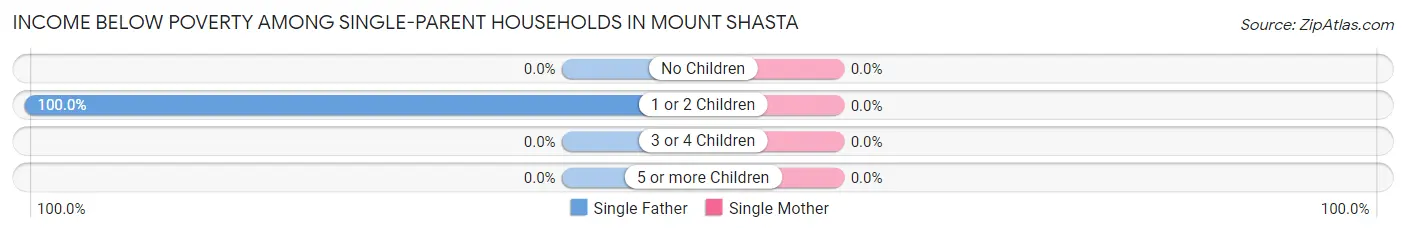
| Children | Single Father | Single Mother |
| No Children | 0 (0.0%) | 0 (0.0%) |
| 1 or 2 Children | 44 (100.0%) | 0 (0.0%) |
| 3 or 4 Children | 0 (0.0%) | 0 (0.0%) |
| 5 or more Children | 0 (0.0%) | 0 (0.0%) |
| Total | 44 (100.0%) | 0 (0.0%) |
Income Below Poverty Among Married-Couple vs Single-Parent Households in Mount Shasta
The poverty data for Mount Shasta shows that 12 of the married-couple family households (1.9%) and 44 of the single-parent households (18.3%) are living below the poverty level. Within the married-couple family households, those with no children have the highest poverty rate, with 12 households (2.1%) falling below the poverty line. Among the single-parent households, those with 1 or 2 children have the highest poverty rate, with 44 household (25.3%) living below poverty.
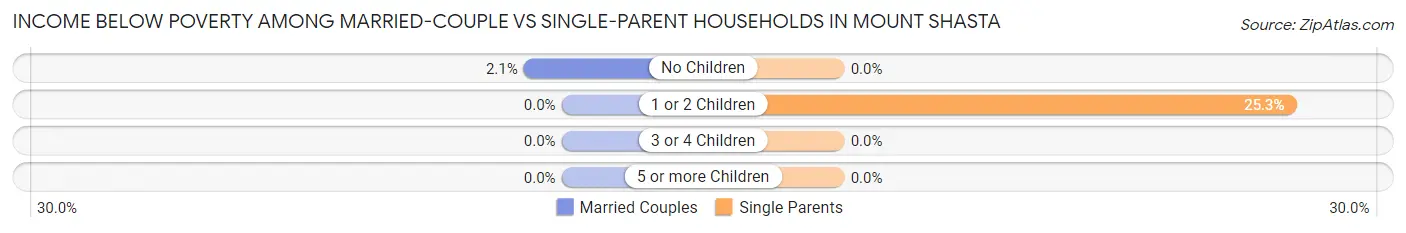
| Children | Married-Couple Families | Single-Parent Households |
| No Children | 12 (2.1%) | 0 (0.0%) |
| 1 or 2 Children | 0 (0.0%) | 44 (25.3%) |
| 3 or 4 Children | 0 (0.0%) | 0 (0.0%) |
| 5 or more Children | 0 (0.0%) | 0 (0.0%) |
| Total | 12 (1.9%) | 44 (18.3%) |
Race in Mount Shasta
The most populous races in Mount Shasta are White / Caucasian (2,737 | 84.6%), Two or more Races (229 | 7.1%), and Hispanic or Latino (175 | 5.4%).
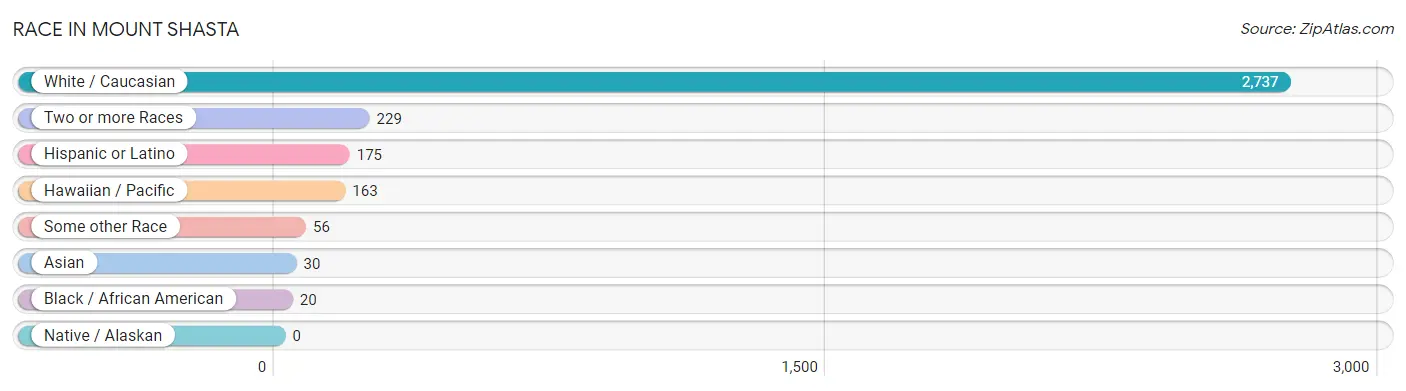
| Race | # Population | % Population |
| Asian | 30 | 0.9% |
| Black / African American | 20 | 0.6% |
| Hawaiian / Pacific | 163 | 5.0% |
| Hispanic or Latino | 175 | 5.4% |
| Native / Alaskan | 0 | 0.0% |
| White / Caucasian | 2,737 | 84.6% |
| Two or more Races | 229 | 7.1% |
| Some other Race | 56 | 1.7% |
| Total | 3,235 | 100.0% |
Ancestry in Mount Shasta
The most populous ancestries reported in Mount Shasta are German (446 | 13.8%), English (411 | 12.7%), Irish (382 | 11.8%), American (340 | 10.5%), and Italian (322 | 10.0%), together accounting for 58.8% of all Mount Shasta residents.
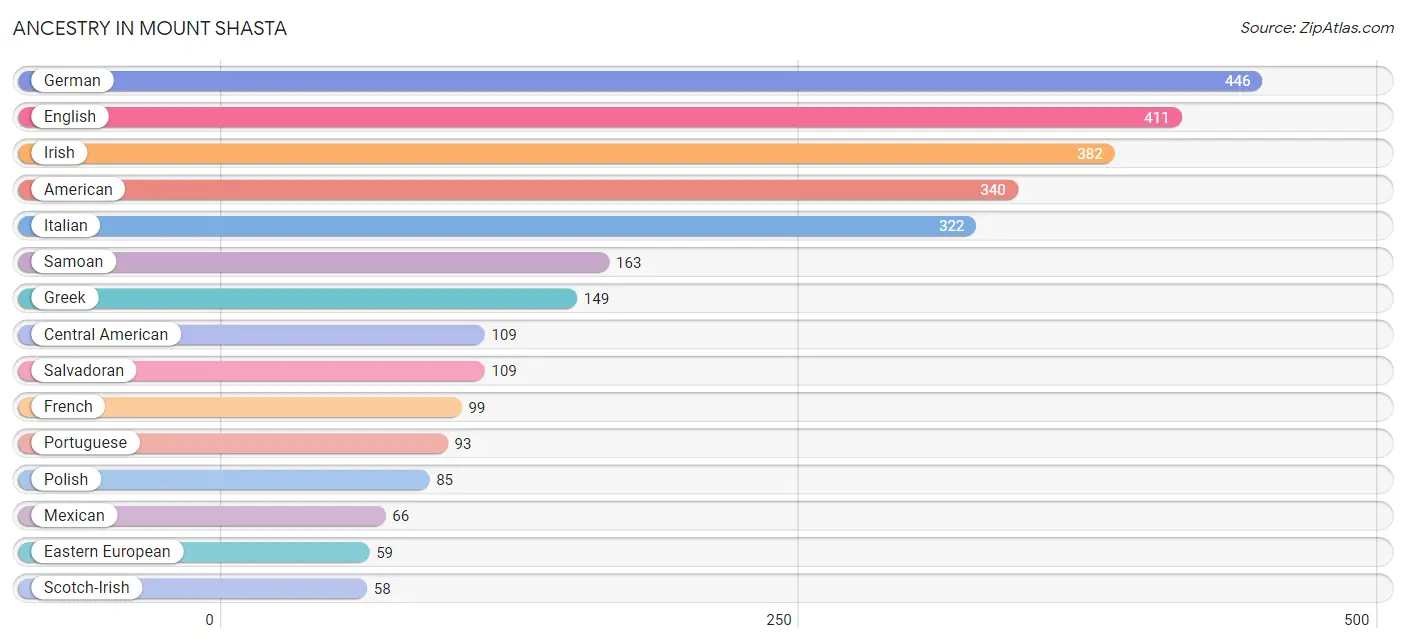
| Ancestry | # Population | % Population |
| American | 340 | 10.5% |
| Arab | 29 | 0.9% |
| British | 39 | 1.2% |
| Canadian | 22 | 0.7% |
| Central American | 109 | 3.4% |
| Creek | 38 | 1.2% |
| Danish | 38 | 1.2% |
| Eastern European | 59 | 1.8% |
| English | 411 | 12.7% |
| French | 99 | 3.1% |
| German | 446 | 13.8% |
| Greek | 149 | 4.6% |
| Indian (Asian) | 38 | 1.2% |
| Irish | 382 | 11.8% |
| Italian | 322 | 10.0% |
| Macedonian | 23 | 0.7% |
| Mexican | 66 | 2.0% |
| Palestinian | 29 | 0.9% |
| Polish | 85 | 2.6% |
| Portuguese | 93 | 2.9% |
| Salvadoran | 109 | 3.4% |
| Samoan | 163 | 5.0% |
| Scotch-Irish | 58 | 1.8% |
| Scottish | 37 | 1.1% |
| Swedish | 48 | 1.5% |
| Thai | 30 | 0.9% |
| Welsh | 42 | 1.3% | View All 27 Rows |
Immigrants in Mount Shasta
The most numerous immigrant groups reported in Mount Shasta came from Oceania (130 | 4.0%), Central America (119 | 3.7%), Latin America (119 | 3.7%), El Salvador (109 | 3.4%), and Europe (55 | 1.7%), together accounting for 16.4% of all Mount Shasta residents.
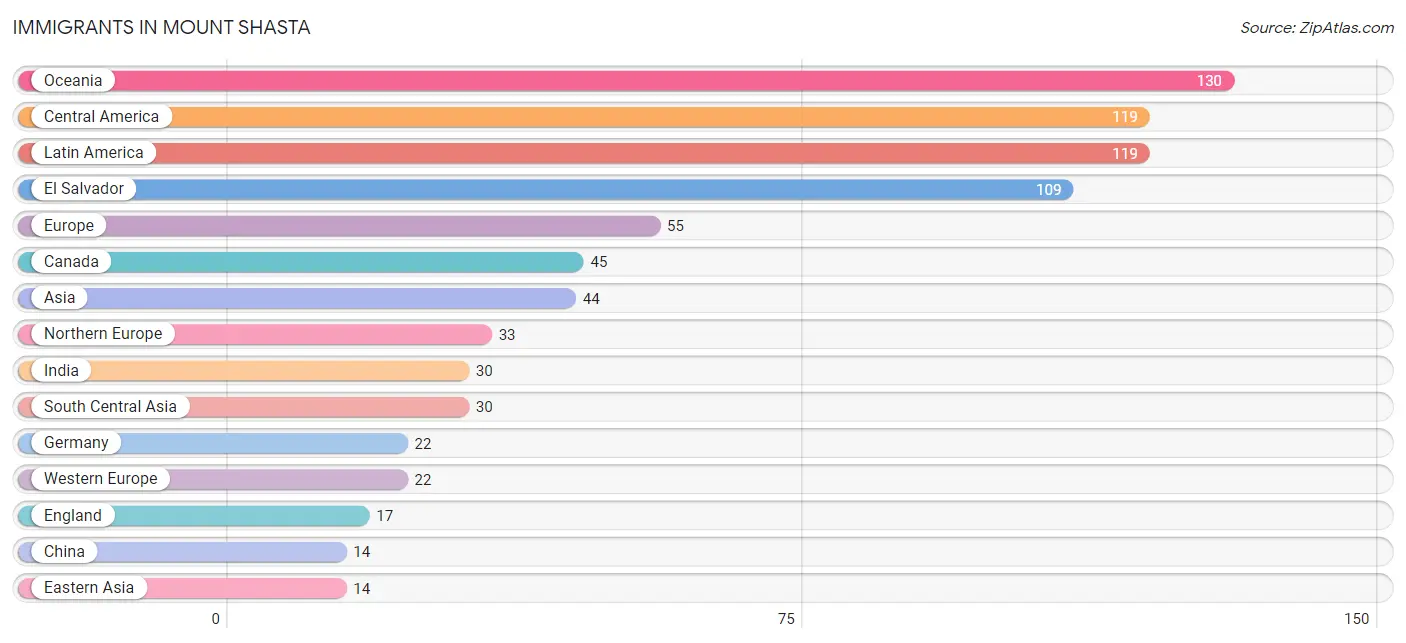
| Immigration Origin | # Population | % Population |
| Asia | 44 | 1.4% |
| Canada | 45 | 1.4% |
| Central America | 119 | 3.7% |
| China | 14 | 0.4% |
| Eastern Asia | 14 | 0.4% |
| El Salvador | 109 | 3.4% |
| England | 17 | 0.5% |
| Europe | 55 | 1.7% |
| Germany | 22 | 0.7% |
| India | 30 | 0.9% |
| Latin America | 119 | 3.7% |
| Mexico | 10 | 0.3% |
| Northern Europe | 33 | 1.0% |
| Oceania | 130 | 4.0% |
| South Central Asia | 30 | 0.9% |
| Western Europe | 22 | 0.7% | View All 16 Rows |
Sex and Age in Mount Shasta
Sex and Age in Mount Shasta
The most populous age groups in Mount Shasta are 65 to 69 Years (201 | 13.5%) for men and 10 to 14 Years (222 | 12.7%) for women.
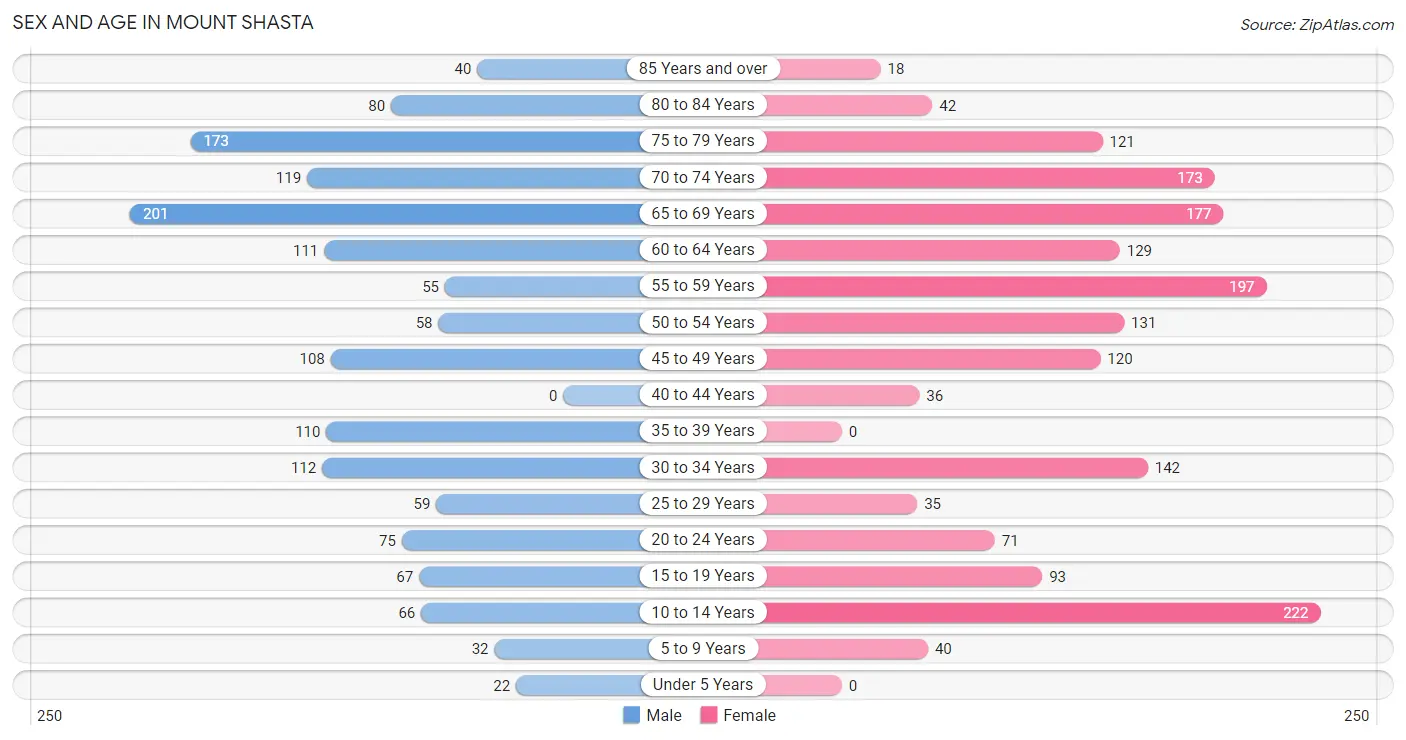
| Age Bracket | Male | Female |
| Under 5 Years | 22 (1.5%) | 0 (0.0%) |
| 5 to 9 Years | 32 (2.1%) | 40 (2.3%) |
| 10 to 14 Years | 66 (4.4%) | 222 (12.7%) |
| 15 to 19 Years | 67 (4.5%) | 93 (5.3%) |
| 20 to 24 Years | 75 (5.0%) | 71 (4.1%) |
| 25 to 29 Years | 59 (4.0%) | 35 (2.0%) |
| 30 to 34 Years | 112 (7.5%) | 142 (8.1%) |
| 35 to 39 Years | 110 (7.4%) | 0 (0.0%) |
| 40 to 44 Years | 0 (0.0%) | 36 (2.1%) |
| 45 to 49 Years | 108 (7.3%) | 120 (6.9%) |
| 50 to 54 Years | 58 (3.9%) | 131 (7.5%) |
| 55 to 59 Years | 55 (3.7%) | 197 (11.3%) |
| 60 to 64 Years | 111 (7.5%) | 129 (7.4%) |
| 65 to 69 Years | 201 (13.5%) | 177 (10.1%) |
| 70 to 74 Years | 119 (8.0%) | 173 (9.9%) |
| 75 to 79 Years | 173 (11.6%) | 121 (6.9%) |
| 80 to 84 Years | 80 (5.4%) | 42 (2.4%) |
| 85 Years and over | 40 (2.7%) | 18 (1.0%) |
| Total | 1,488 (100.0%) | 1,747 (100.0%) |
Families and Households in Mount Shasta
Median Family Size in Mount Shasta
The median family size in Mount Shasta is 2.39 persons per family, with single male/father families (44 | 5.0%) accounting for the largest median family size of 3.7 persons per family. On the other hand, married-couple families (645 | 72.9%) represent the smallest median family size with 2.15 persons per family.
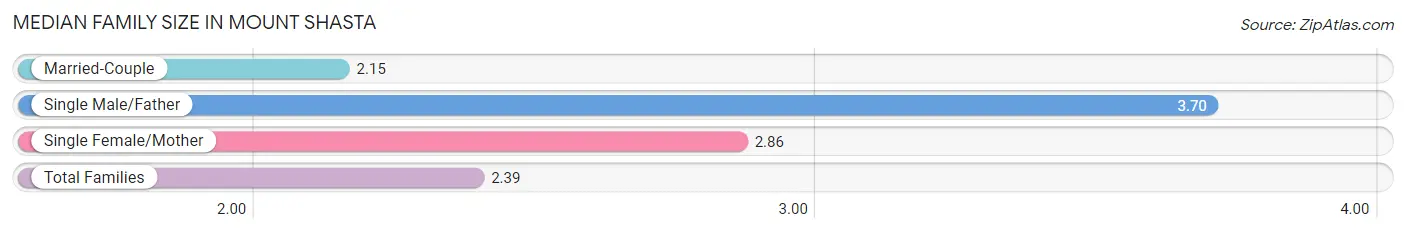
| Family Type | # Families | Family Size |
| Married-Couple | 645 (72.9%) | 2.15 |
| Single Male/Father | 44 (5.0%) | 3.70 |
| Single Female/Mother | 196 (22.2%) | 2.86 |
| Total Families | 885 (100.0%) | 2.39 |
Median Household Size in Mount Shasta
The median household size in Mount Shasta is 1.78 persons per household, with single male/father households (44 | 2.4%) accounting for the largest median household size of 3.7 persons per household. non-family households (926 | 51.1%) represent the smallest median household size with 1.14 persons per household.
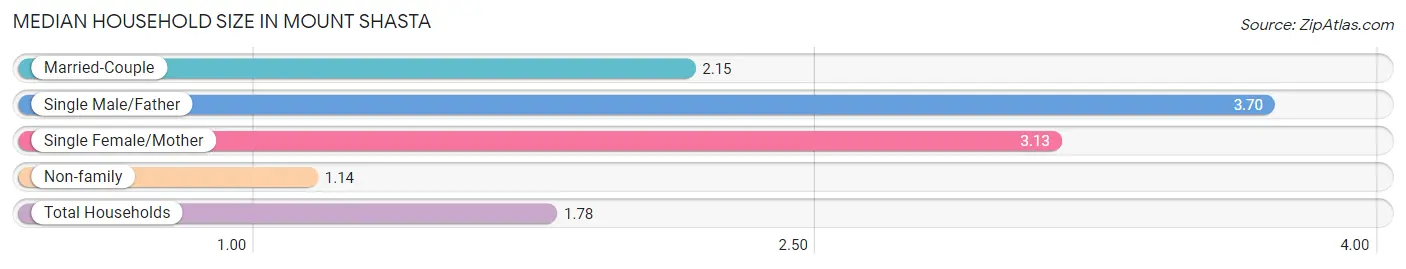
| Household Type | # Households | Household Size |
| Married-Couple | 645 (35.6%) | 2.15 |
| Single Male/Father | 44 (2.4%) | 3.70 |
| Single Female/Mother | 196 (10.8%) | 3.13 |
| Non-family | 926 (51.1%) | 1.14 |
| Total Households | 1,811 (100.0%) | 1.78 |
Household Size by Marriage Status in Mount Shasta
Out of a total of 1,811 households in Mount Shasta, 885 (48.9%) are family households, while 926 (51.1%) are nonfamily households. The most numerous type of family households are 2-person households, comprising 684, and the most common type of nonfamily households are 1-person households, comprising 798.
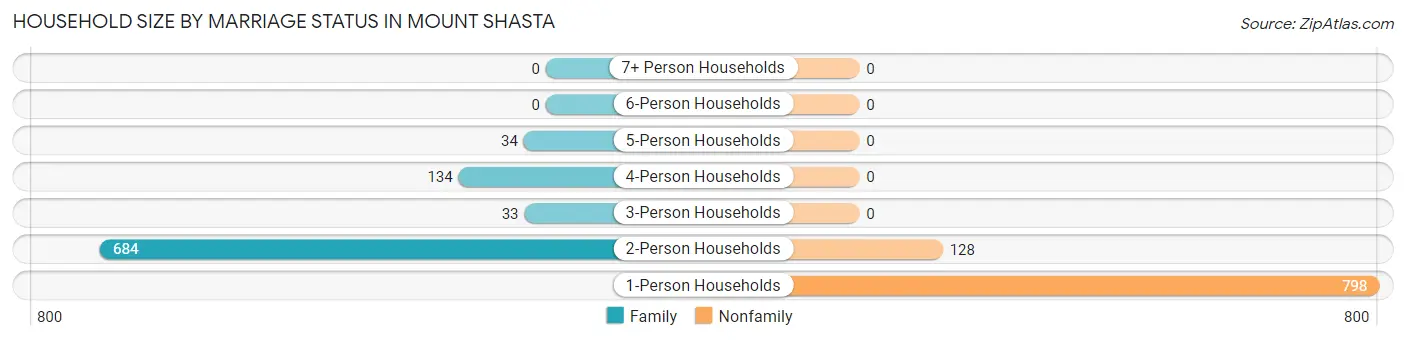
| Household Size | Family Households | Nonfamily Households |
| 1-Person Households | - | 798 (44.1%) |
| 2-Person Households | 684 (37.8%) | 128 (7.1%) |
| 3-Person Households | 33 (1.8%) | 0 (0.0%) |
| 4-Person Households | 134 (7.4%) | 0 (0.0%) |
| 5-Person Households | 34 (1.9%) | 0 (0.0%) |
| 6-Person Households | 0 (0.0%) | 0 (0.0%) |
| 7+ Person Households | 0 (0.0%) | 0 (0.0%) |
| Total | 885 (48.9%) | 926 (51.1%) |
Female Fertility in Mount Shasta
Fertility by Age in Mount Shasta
| Age Bracket | Women with Births | Births / 1,000 Women |
| 15 to 19 years | 0 (0.0%) | 0.0 |
| 20 to 34 years | 0 (0.0%) | 0.0 |
| 35 to 50 years | 0 (0.0%) | 0.0 |
| Total | 0 (0.0%) | 0.0 |
Fertility by Age by Marriage Status in Mount Shasta
| Age Bracket | Married | Unmarried |
| 15 to 19 years | 0 (0.0%) | 0 (0.0%) |
| 20 to 34 years | 0 (0.0%) | 0 (0.0%) |
| 35 to 50 years | 0 (0.0%) | 0 (0.0%) |
| Total | 0 (0.0%) | 0 (0.0%) |
Fertility by Education in Mount Shasta
| Educational Attainment | Women with Births | Births / 1,000 Women |
| Less than High School | 0 (0.0%) | 0.0 |
| High School Diploma | 0 (0.0%) | 0.0 |
| College or Associate's Degree | 0 (0.0%) | 0.0 |
| Bachelor's Degree | 0 (0.0%) | 0.0 |
| Graduate Degree | 0 (0.0%) | 0.0 |
| Total | 0 (0.0%) | 0.0 |
Fertility by Education by Marriage Status in Mount Shasta
| Educational Attainment | Married | Unmarried |
| Less than High School | 0 (0.0%) | 0 (0.0%) |
| High School Diploma | 0 (0.0%) | 0 (0.0%) |
| College or Associate's Degree | 0 (0.0%) | 0 (0.0%) |
| Bachelor's Degree | 0 (0.0%) | 0 (0.0%) |
| Graduate Degree | 0 (0.0%) | 0 (0.0%) |
| Total | 0 (0.0%) | 0 (0.0%) |
Employment Characteristics in Mount Shasta
Employment by Class of Employer in Mount Shasta
Among the 1,312 employed individuals in Mount Shasta, private company employees (806 | 61.4%), self-employed (not incorporated) (128 | 9.8%), and self-employed (incorporated) (121 | 9.2%) make up the most common classes of employment.
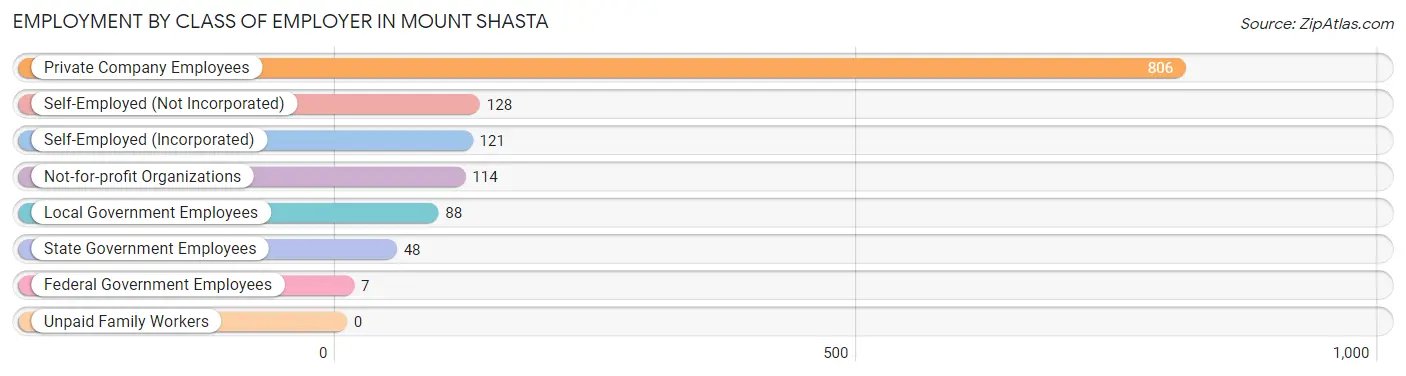
| Employer Class | # Employees | % Employees |
| Private Company Employees | 806 | 61.4% |
| Self-Employed (Incorporated) | 121 | 9.2% |
| Self-Employed (Not Incorporated) | 128 | 9.8% |
| Not-for-profit Organizations | 114 | 8.7% |
| Local Government Employees | 88 | 6.7% |
| State Government Employees | 48 | 3.7% |
| Federal Government Employees | 7 | 0.5% |
| Unpaid Family Workers | 0 | 0.0% |
| Total | 1,312 | 100.0% |
Employment Status by Age in Mount Shasta
According to the labor force statistics for Mount Shasta, out of the total population over 16 years of age (2,836), 48.6% or 1,378 individuals are in the labor force, with 1.6% or 22 of them unemployed. The age group with the highest labor force participation rate is 25 to 29 years, with 100.0% or 94 individuals in the labor force. Within the labor force, the 20 to 24 years age range has the highest percentage of unemployed individuals, with 20.8% or 22 of them being unemployed.
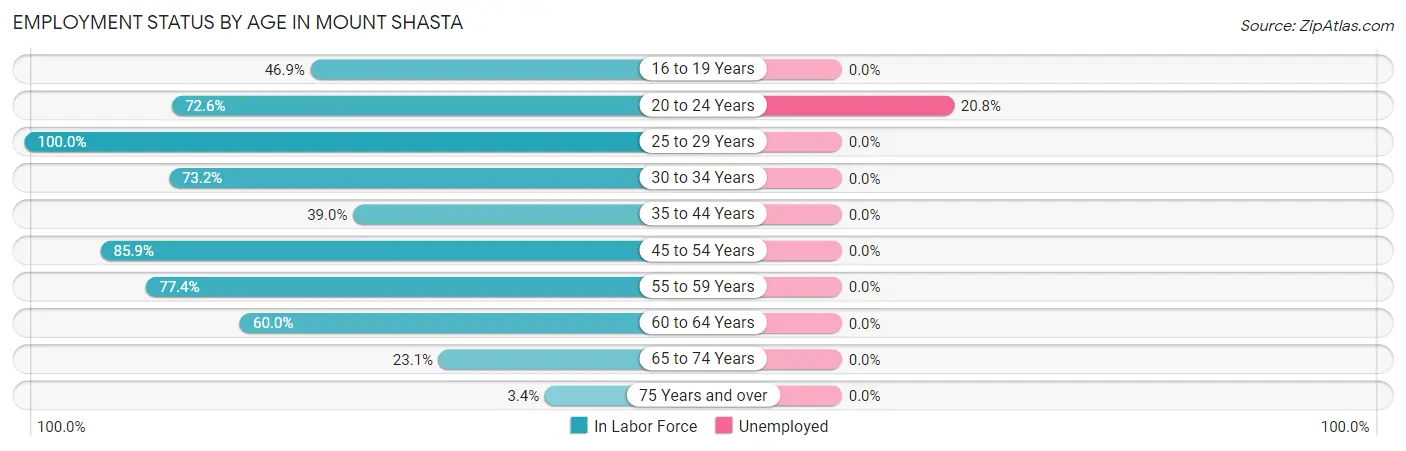
| Age Bracket | In Labor Force | Unemployed |
| 16 to 19 Years | 67 (46.9%) | 0 (0.0%) |
| 20 to 24 Years | 106 (72.6%) | 22 (20.8%) |
| 25 to 29 Years | 94 (100.0%) | 0 (0.0%) |
| 30 to 34 Years | 186 (73.2%) | 0 (0.0%) |
| 35 to 44 Years | 57 (39.0%) | 0 (0.0%) |
| 45 to 54 Years | 358 (85.9%) | 0 (0.0%) |
| 55 to 59 Years | 195 (77.4%) | 0 (0.0%) |
| 60 to 64 Years | 144 (60.0%) | 0 (0.0%) |
| 65 to 74 Years | 155 (23.1%) | 0 (0.0%) |
| 75 Years and over | 16 (3.4%) | 0 (0.0%) |
| Total | 1,378 (48.6%) | 22 (1.6%) |
Employment Status by Educational Attainment in Mount Shasta
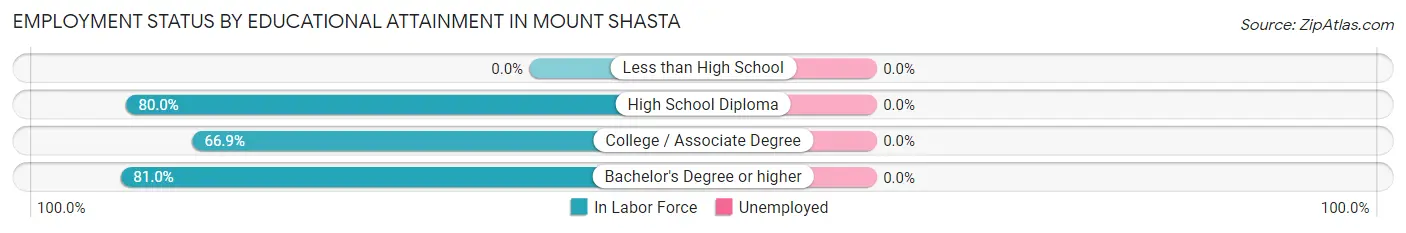
| Educational Attainment | In Labor Force | Unemployed |
| Less than High School | 0 (0.0%) | 0 (0.0%) |
| High School Diploma | 176 (80.0%) | 0 (0.0%) |
| College / Associate Degree | 454 (66.9%) | 0 (0.0%) |
| Bachelor's Degree or higher | 404 (81.0%) | 0 (0.0%) |
| Total | 1,034 (73.7%) | 0 (0.0%) |
Employment Occupations by Sex in Mount Shasta
Management, Business, Science and Arts Occupations
The most common Management, Business, Science and Arts occupations in Mount Shasta are Health Diagnosing & Treating (219 | 16.2%), Management (181 | 13.4%), Community & Social Service (157 | 11.6%), Education Instruction & Library (127 | 9.4%), and Health Technologists (122 | 9.0%).
Management, Business, Science and Arts Occupations by Sex
Within the Management, Business, Science and Arts occupations in Mount Shasta, the most male-oriented occupations are Life, Physical & Social Science (70.7%), Computers, Engineering & Science (63.9%), and Management (56.9%), while the most female-oriented occupations are Health Technologists (84.4%), Education Instruction & Library (61.4%), and Community & Social Service (61.2%).
| Occupation | Male | Female |
| Management | 103 (56.9%) | 78 (43.1%) |
| Business & Financial | 23 (51.1%) | 22 (48.9%) |
| Computers, Engineering & Science | 69 (63.9%) | 39 (36.1%) |
| Computers & Mathematics | 16 (48.5%) | 17 (51.5%) |
| Architecture & Engineering | 0 (0.0%) | 0 (0.0%) |
| Life, Physical & Social Science | 53 (70.7%) | 22 (29.3%) |
| Community & Social Service | 61 (38.9%) | 96 (61.2%) |
| Education, Arts & Media | 0 (0.0%) | 0 (0.0%) |
| Legal Services & Support | 0 (0.0%) | 0 (0.0%) |
| Education Instruction & Library | 49 (38.6%) | 78 (61.4%) |
| Arts, Media & Entertainment | 12 (40.0%) | 18 (60.0%) |
| Health Diagnosing & Treating | 88 (40.2%) | 131 (59.8%) |
| Health Technologists | 19 (15.6%) | 103 (84.4%) |
| Total (Category) | 344 (48.4%) | 366 (51.5%) |
| Total (Overall) | 608 (44.8%) | 748 (55.2%) |
Services Occupations
The most common Services occupations in Mount Shasta are Cleaning & Maintenance (163 | 12.0%), Food Preparation & Serving (86 | 6.3%), Healthcare Support (26 | 1.9%), and Personal Care & Service (15 | 1.1%).
Services Occupations by Sex
Within the Services occupations in Mount Shasta, the most male-oriented occupations are Food Preparation & Serving (100.0%), Personal Care & Service (100.0%), and Cleaning & Maintenance (44.8%), while the most female-oriented occupations are Healthcare Support (100.0%), and Cleaning & Maintenance (55.2%).
| Occupation | Male | Female |
| Healthcare Support | 0 (0.0%) | 26 (100.0%) |
| Security & Protection | 0 (0.0%) | 0 (0.0%) |
| Firefighting & Prevention | 0 (0.0%) | 0 (0.0%) |
| Law Enforcement | 0 (0.0%) | 0 (0.0%) |
| Food Preparation & Serving | 86 (100.0%) | 0 (0.0%) |
| Cleaning & Maintenance | 73 (44.8%) | 90 (55.2%) |
| Personal Care & Service | 15 (100.0%) | 0 (0.0%) |
| Total (Category) | 174 (60.0%) | 116 (40.0%) |
| Total (Overall) | 608 (44.8%) | 748 (55.2%) |
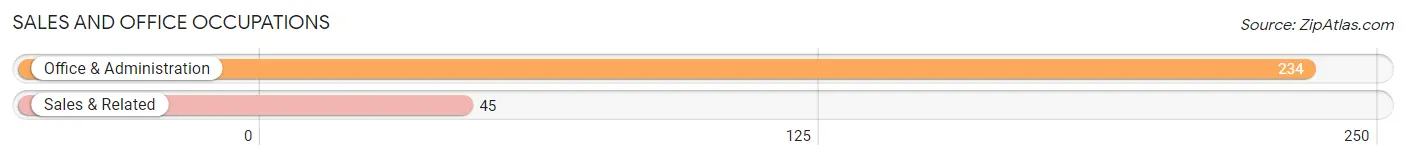
Sales and Office Occupations
The most common Sales and Office occupations in Mount Shasta are Office & Administration (234 | 17.3%), and Sales & Related (45 | 3.3%).
Sales and Office Occupations by Sex
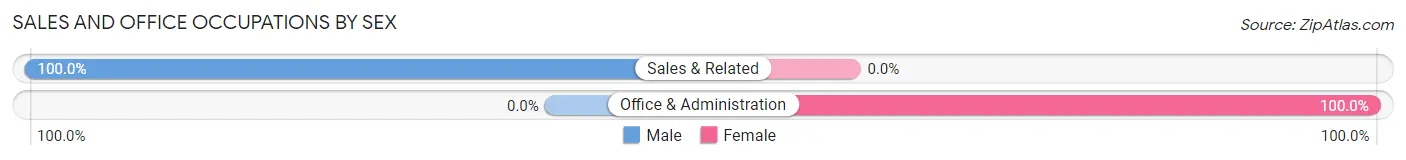
| Occupation | Male | Female |
| Sales & Related | 45 (100.0%) | 0 (0.0%) |
| Office & Administration | 0 (0.0%) | 234 (100.0%) |
| Total (Category) | 45 (16.1%) | 234 (83.9%) |
| Total (Overall) | 608 (44.8%) | 748 (55.2%) |
Natural Resources, Construction and Maintenance Occupations
The most common Natural Resources, Construction and Maintenance occupations in Mount Shasta are , and Installation, Maintenance & Repair (38 | 2.8%).
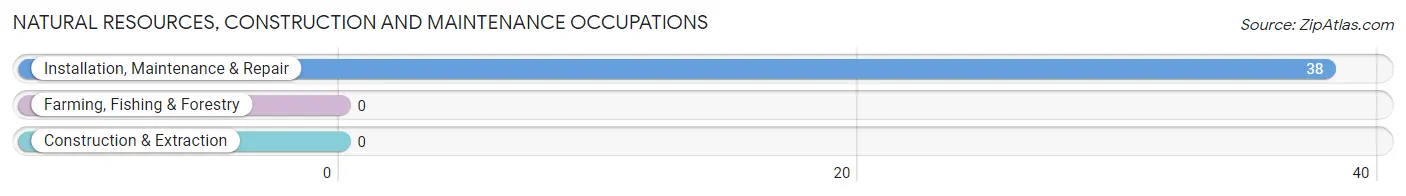
Natural Resources, Construction and Maintenance Occupations by Sex
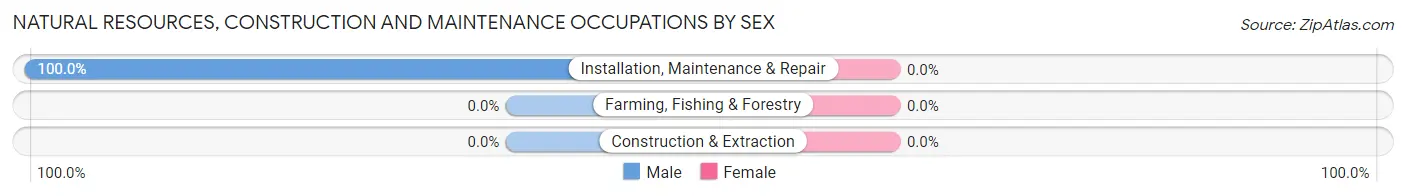
| Occupation | Male | Female |
| Farming, Fishing & Forestry | 0 (0.0%) | 0 (0.0%) |
| Construction & Extraction | 0 (0.0%) | 0 (0.0%) |
| Installation, Maintenance & Repair | 38 (100.0%) | 0 (0.0%) |
| Total (Category) | 38 (100.0%) | 0 (0.0%) |
| Total (Overall) | 608 (44.8%) | 748 (55.2%) |
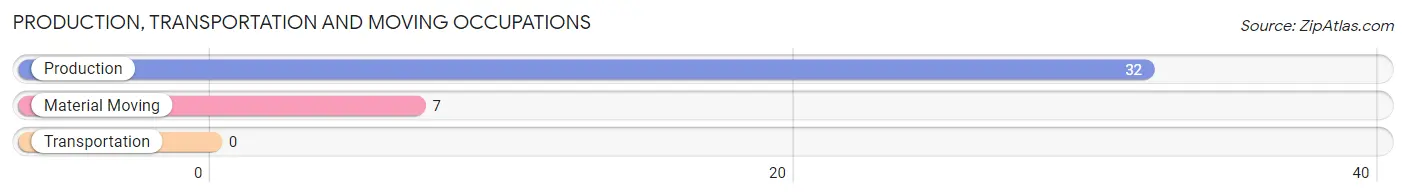
Production, Transportation and Moving Occupations
The most common Production, Transportation and Moving occupations in Mount Shasta are Production (32 | 2.4%), and Material Moving (7 | 0.5%).
Production, Transportation and Moving Occupations by Sex
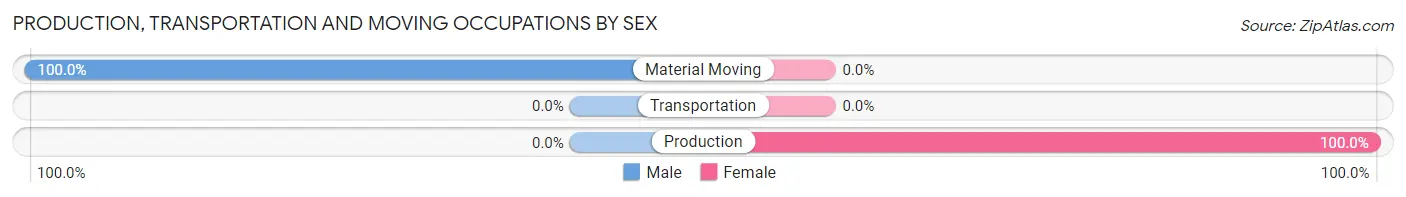
| Occupation | Male | Female |
| Production | 0 (0.0%) | 32 (100.0%) |
| Transportation | 0 (0.0%) | 0 (0.0%) |
| Material Moving | 7 (100.0%) | 0 (0.0%) |
| Total (Category) | 7 (17.9%) | 32 (82.1%) |
| Total (Overall) | 608 (44.8%) | 748 (55.2%) |
Employment Industries by Sex in Mount Shasta
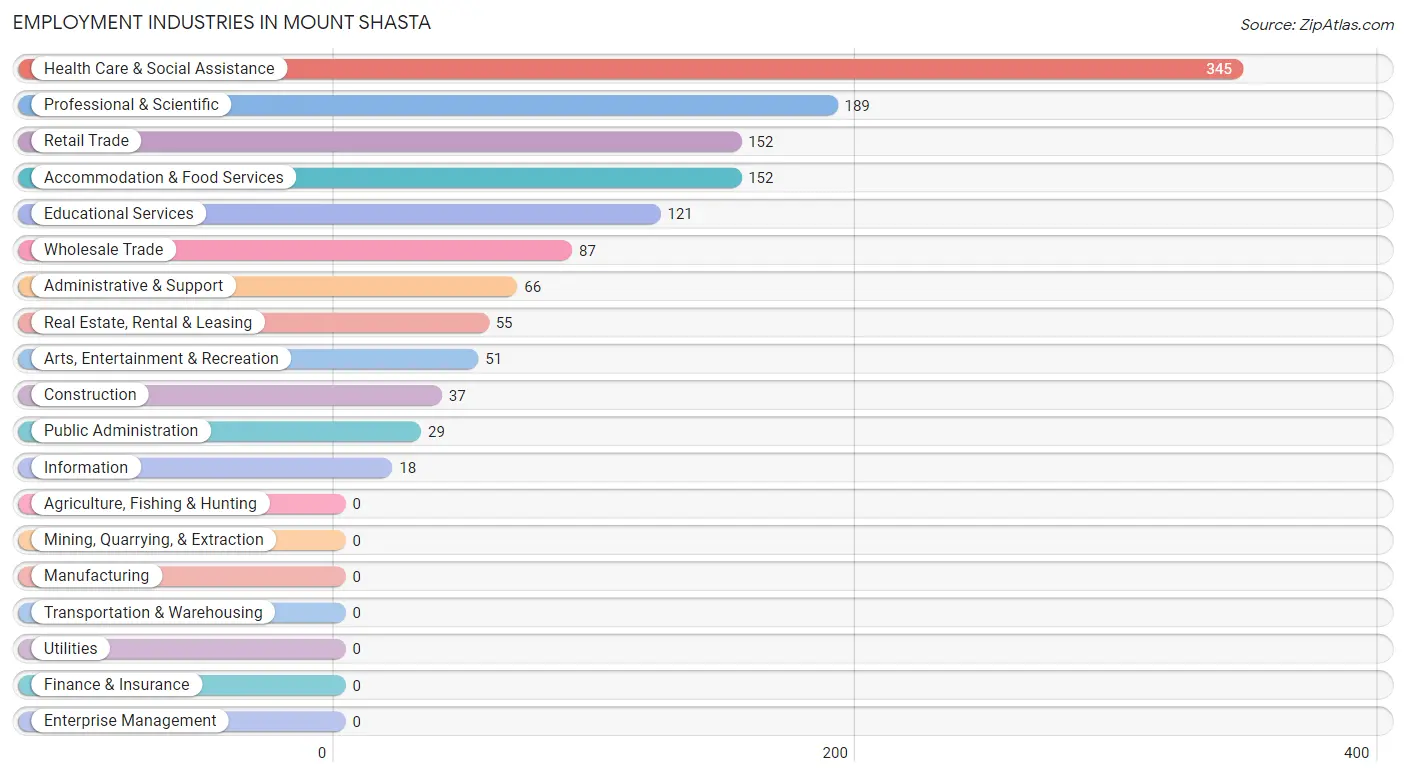
Employment Industries in Mount Shasta
The major employment industries in Mount Shasta include Health Care & Social Assistance (345 | 25.4%), Professional & Scientific (189 | 13.9%), Retail Trade (152 | 11.2%), Accommodation & Food Services (152 | 11.2%), and Educational Services (121 | 8.9%).
Employment Industries by Sex in Mount Shasta
The Mount Shasta industries that see more men than women are Real Estate, Rental & Leasing (100.0%), Arts, Entertainment & Recreation (100.0%), and Professional & Scientific (69.8%), whereas the industries that tend to have a higher number of women are Information (100.0%), Accommodation & Food Services (87.5%), and Public Administration (75.9%).
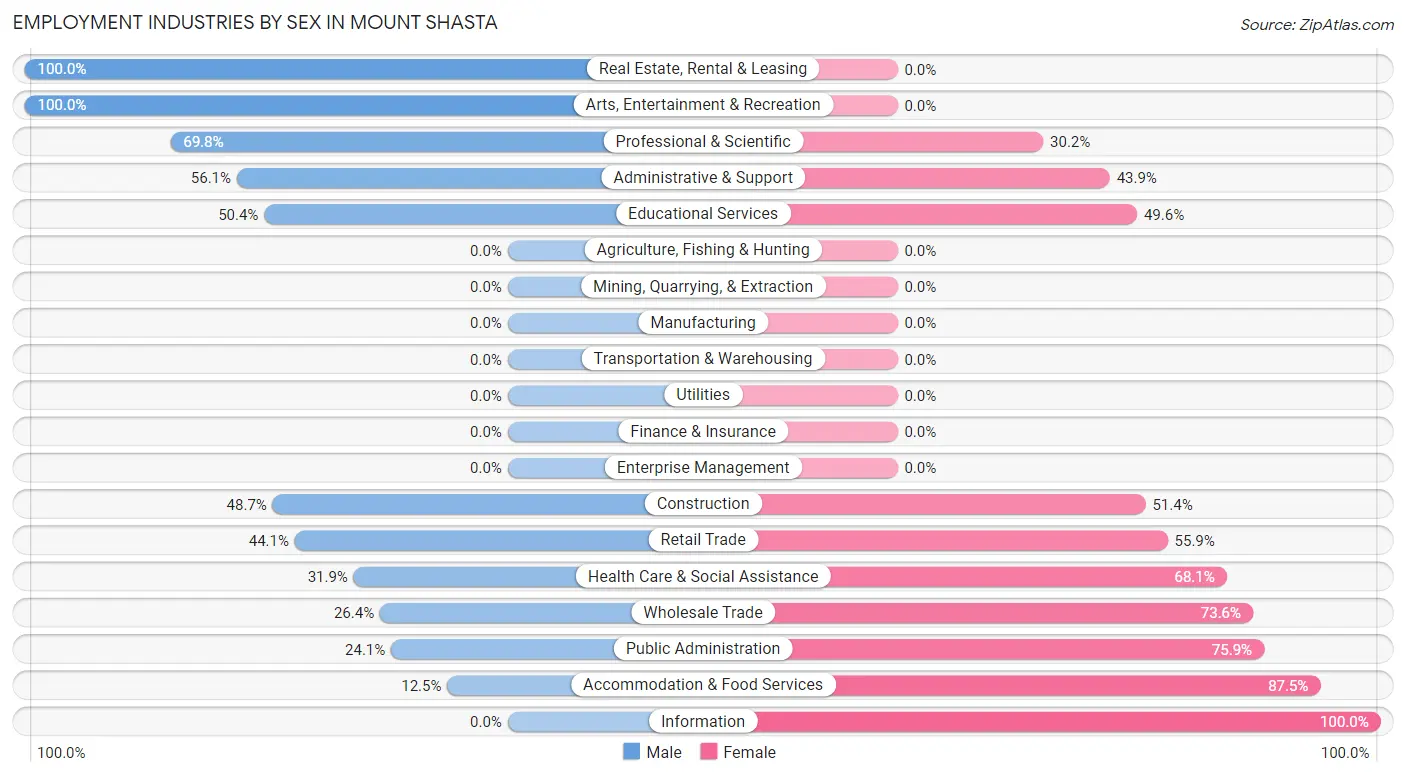
| Industry | Male | Female |
| Agriculture, Fishing & Hunting | 0 (0.0%) | 0 (0.0%) |
| Mining, Quarrying, & Extraction | 0 (0.0%) | 0 (0.0%) |
| Construction | 18 (48.6%) | 19 (51.3%) |
| Manufacturing | 0 (0.0%) | 0 (0.0%) |
| Wholesale Trade | 23 (26.4%) | 64 (73.6%) |
| Retail Trade | 67 (44.1%) | 85 (55.9%) |
| Transportation & Warehousing | 0 (0.0%) | 0 (0.0%) |
| Utilities | 0 (0.0%) | 0 (0.0%) |
| Information | 0 (0.0%) | 18 (100.0%) |
| Finance & Insurance | 0 (0.0%) | 0 (0.0%) |
| Real Estate, Rental & Leasing | 55 (100.0%) | 0 (0.0%) |
| Professional & Scientific | 132 (69.8%) | 57 (30.2%) |
| Enterprise Management | 0 (0.0%) | 0 (0.0%) |
| Administrative & Support | 37 (56.1%) | 29 (43.9%) |
| Educational Services | 61 (50.4%) | 60 (49.6%) |
| Health Care & Social Assistance | 110 (31.9%) | 235 (68.1%) |
| Arts, Entertainment & Recreation | 51 (100.0%) | 0 (0.0%) |
| Accommodation & Food Services | 19 (12.5%) | 133 (87.5%) |
| Public Administration | 7 (24.1%) | 22 (75.9%) |
| Total | 608 (44.8%) | 748 (55.2%) |
Education in Mount Shasta
School Enrollment in Mount Shasta
The most common levels of schooling among the 556 students in Mount Shasta are middle school (256 | 46.0%), high school (110 | 19.8%), and elementary school (87 | 15.7%).
| School Level | # Students | % Students |
| Nursery / Preschool | 0 | 0.0% |
| Kindergarten | 0 | 0.0% |
| Elementary School | 87 | 15.7% |
| Middle School | 256 | 46.0% |
| High School | 110 | 19.8% |
| College / Undergraduate | 59 | 10.6% |
| Graduate / Professional | 44 | 7.9% |
| Total | 556 | 100.0% |
School Enrollment by Age by Funding Source in Mount Shasta
Out of a total of 556 students who are enrolled in schools in Mount Shasta, 34 (6.1%) attend a private institution, while the remaining 522 (93.9%) are enrolled in public schools. The age group of 15 to 17 year olds has the highest likelihood of being enrolled in private schools, with 17 (43.6% in the age bracket) enrolled. Conversely, the age group of 5 to 9 year old has the lowest likelihood of being enrolled in a private school, with 72 (100.0% in the age bracket) attending a public institution.
| Age Bracket | Public School | Private School |
| 3 to 4 Year Olds | 0 (0.0%) | 0 (0.0%) |
| 5 to 9 Year Old | 72 (100.0%) | 0 (0.0%) |
| 10 to 14 Year Olds | 288 (100.0%) | 0 (0.0%) |
| 15 to 17 Year Olds | 22 (56.4%) | 17 (43.6%) |
| 18 to 19 Year Olds | 54 (100.0%) | 0 (0.0%) |
| 20 to 24 Year Olds | 22 (100.0%) | 0 (0.0%) |
| 25 to 34 Year Olds | 20 (100.0%) | 0 (0.0%) |
| 35 Years and over | 44 (72.1%) | 17 (27.9%) |
| Total | 522 (93.9%) | 34 (6.1%) |
Educational Attainment by Field of Study in Mount Shasta
Bio, nature & agricultural (132 | 14.9%), science & technology (108 | 12.2%), education (102 | 11.5%), psychology (100 | 11.3%), and business (70 | 7.9%) are the most common fields of study among 884 individuals in Mount Shasta who have obtained a bachelor's degree or higher.
| Field of Study | # Graduates | % Graduates |
| Computers & Mathematics | 66 | 7.5% |
| Bio, Nature & Agricultural | 132 | 14.9% |
| Physical & Health Sciences | 63 | 7.1% |
| Psychology | 100 | 11.3% |
| Social Sciences | 36 | 4.1% |
| Engineering | 26 | 2.9% |
| Multidisciplinary Studies | 0 | 0.0% |
| Science & Technology | 108 | 12.2% |
| Business | 70 | 7.9% |
| Education | 102 | 11.5% |
| Literature & Languages | 35 | 4.0% |
| Liberal Arts & History | 68 | 7.7% |
| Visual & Performing Arts | 46 | 5.2% |
| Communications | 0 | 0.0% |
| Arts & Humanities | 32 | 3.6% |
| Total | 884 | 100.0% |
Transportation & Commute in Mount Shasta
Vehicle Availability by Sex in Mount Shasta
The most prevalent vehicle ownership categories in Mount Shasta are males with 2 vehicles (343, accounting for 58.2%) and females with 2 vehicles (280, making up 47.4%).
| Vehicles Available | Male | Female |
| No Vehicle | 67 (11.4%) | 0 (0.0%) |
| 1 Vehicle | 48 (8.2%) | 213 (29.5%) |
| 2 Vehicles | 343 (58.2%) | 280 (38.7%) |
| 3 Vehicles | 110 (18.7%) | 195 (27.0%) |
| 4 Vehicles | 21 (3.6%) | 35 (4.8%) |
| 5 or more Vehicles | 0 (0.0%) | 0 (0.0%) |
| Total | 589 (100.0%) | 723 (100.0%) |
Commute Time in Mount Shasta
The most frequently occuring commute durations in Mount Shasta are 5 to 9 minutes (390 commuters, 32.6%), less than 5 minutes (308 commuters, 25.7%), and 60 to 89 minutes (162 commuters, 13.5%).
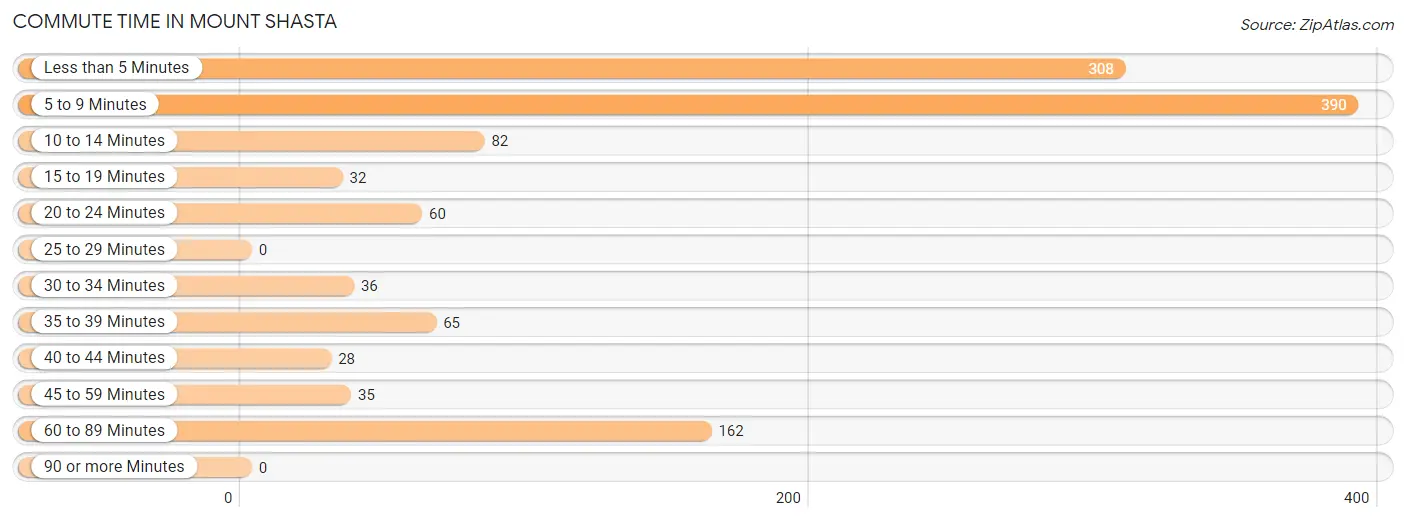
| Commute Time | # Commuters | % Commuters |
| Less than 5 Minutes | 308 | 25.7% |
| 5 to 9 Minutes | 390 | 32.6% |
| 10 to 14 Minutes | 82 | 6.8% |
| 15 to 19 Minutes | 32 | 2.7% |
| 20 to 24 Minutes | 60 | 5.0% |
| 25 to 29 Minutes | 0 | 0.0% |
| 30 to 34 Minutes | 36 | 3.0% |
| 35 to 39 Minutes | 65 | 5.4% |
| 40 to 44 Minutes | 28 | 2.3% |
| 45 to 59 Minutes | 35 | 2.9% |
| 60 to 89 Minutes | 162 | 13.5% |
| 90 or more Minutes | 0 | 0.0% |
Commute Time by Sex in Mount Shasta
The most common commute times in Mount Shasta are less than 5 minutes (194 commuters, 34.5%) for males and 5 to 9 minutes (262 commuters, 41.2%) for females.
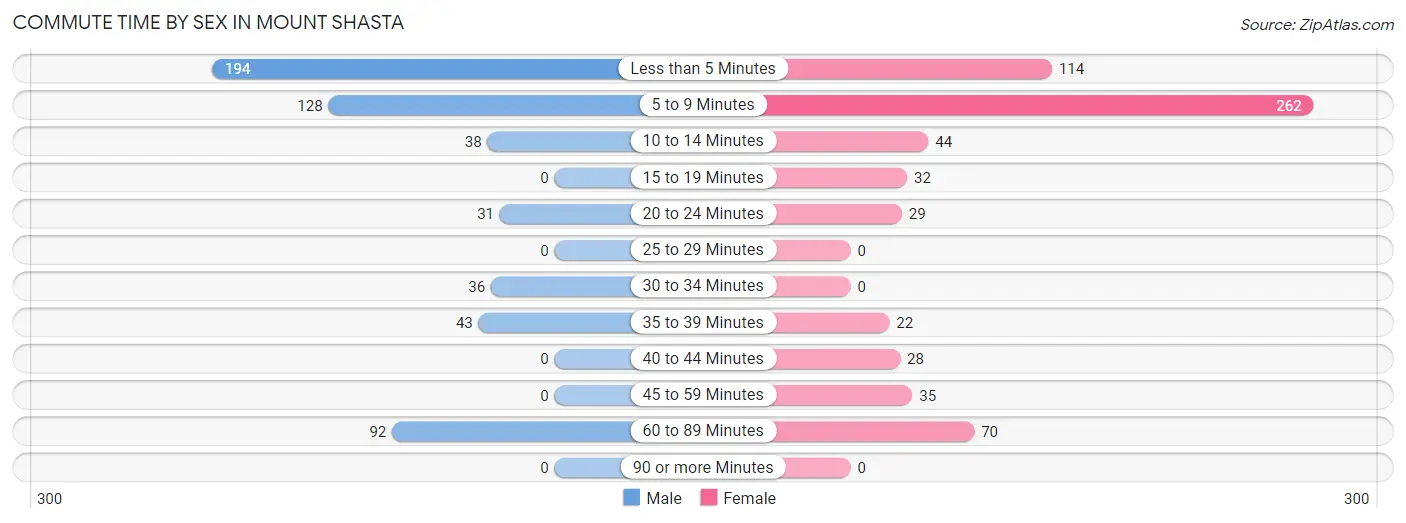
| Commute Time | Male | Female |
| Less than 5 Minutes | 194 (34.5%) | 114 (17.9%) |
| 5 to 9 Minutes | 128 (22.8%) | 262 (41.2%) |
| 10 to 14 Minutes | 38 (6.8%) | 44 (6.9%) |
| 15 to 19 Minutes | 0 (0.0%) | 32 (5.0%) |
| 20 to 24 Minutes | 31 (5.5%) | 29 (4.6%) |
| 25 to 29 Minutes | 0 (0.0%) | 0 (0.0%) |
| 30 to 34 Minutes | 36 (6.4%) | 0 (0.0%) |
| 35 to 39 Minutes | 43 (7.6%) | 22 (3.5%) |
| 40 to 44 Minutes | 0 (0.0%) | 28 (4.4%) |
| 45 to 59 Minutes | 0 (0.0%) | 35 (5.5%) |
| 60 to 89 Minutes | 92 (16.4%) | 70 (11.0%) |
| 90 or more Minutes | 0 (0.0%) | 0 (0.0%) |
Time of Departure to Work by Sex in Mount Shasta
The most frequent times of departure to work in Mount Shasta are 7:30 AM to 7:59 AM (135, 24.0%) for males and 4:00 PM to 11:59 PM (159, 25.0%) for females.
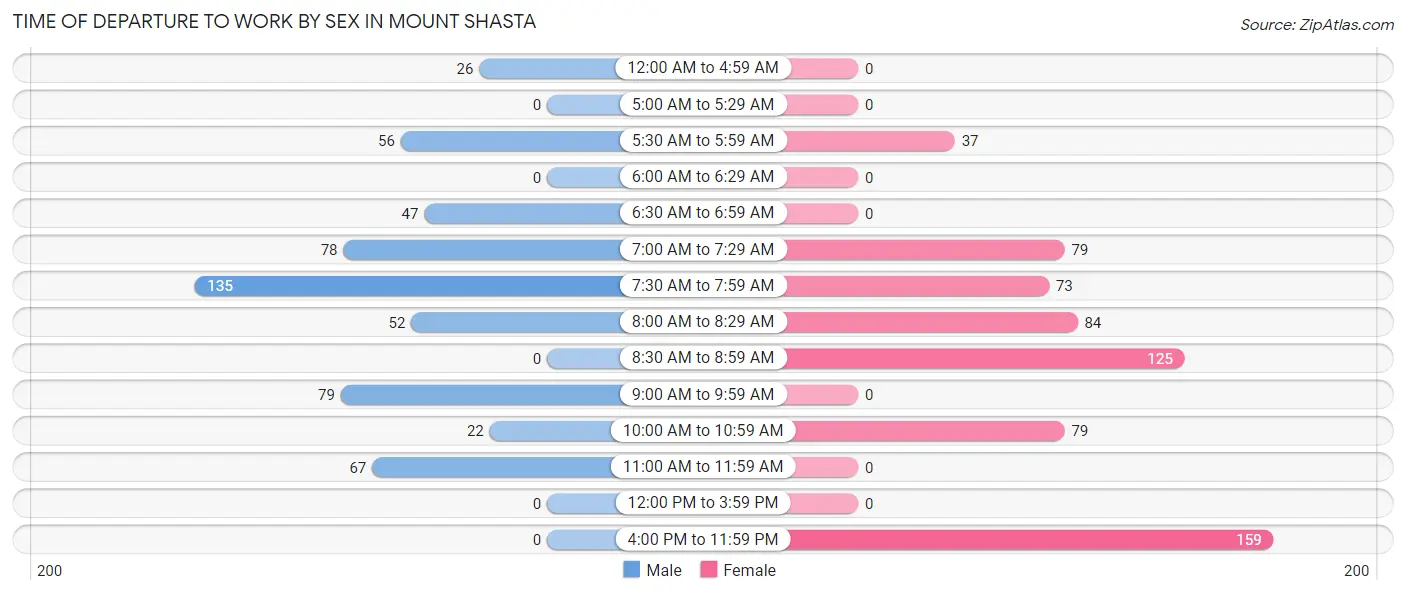
| Time of Departure | Male | Female |
| 12:00 AM to 4:59 AM | 26 (4.6%) | 0 (0.0%) |
| 5:00 AM to 5:29 AM | 0 (0.0%) | 0 (0.0%) |
| 5:30 AM to 5:59 AM | 56 (10.0%) | 37 (5.8%) |
| 6:00 AM to 6:29 AM | 0 (0.0%) | 0 (0.0%) |
| 6:30 AM to 6:59 AM | 47 (8.4%) | 0 (0.0%) |
| 7:00 AM to 7:29 AM | 78 (13.9%) | 79 (12.4%) |
| 7:30 AM to 7:59 AM | 135 (24.0%) | 73 (11.5%) |
| 8:00 AM to 8:29 AM | 52 (9.2%) | 84 (13.2%) |
| 8:30 AM to 8:59 AM | 0 (0.0%) | 125 (19.7%) |
| 9:00 AM to 9:59 AM | 79 (14.1%) | 0 (0.0%) |
| 10:00 AM to 10:59 AM | 22 (3.9%) | 79 (12.4%) |
| 11:00 AM to 11:59 AM | 67 (11.9%) | 0 (0.0%) |
| 12:00 PM to 3:59 PM | 0 (0.0%) | 0 (0.0%) |
| 4:00 PM to 11:59 PM | 0 (0.0%) | 159 (25.0%) |
| Total | 562 (100.0%) | 636 (100.0%) |
Housing Occupancy in Mount Shasta
Occupancy by Ownership in Mount Shasta
Of the total 1,811 dwellings in Mount Shasta, owner-occupied units account for 855 (47.2%), while renter-occupied units make up 956 (52.8%).
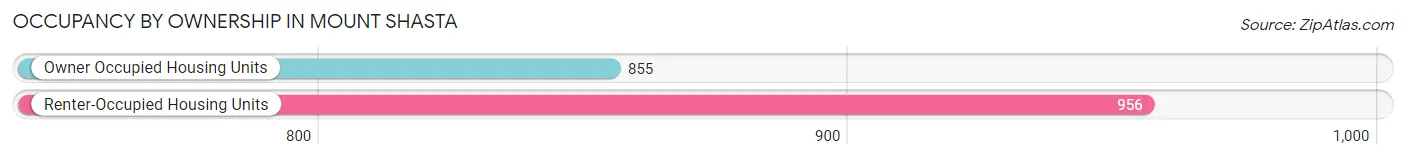
| Occupancy | # Housing Units | % Housing Units |
| Owner Occupied Housing Units | 855 | 47.2% |
| Renter-Occupied Housing Units | 956 | 52.8% |
| Total Occupied Housing Units | 1,811 | 100.0% |
Occupancy by Household Size in Mount Shasta
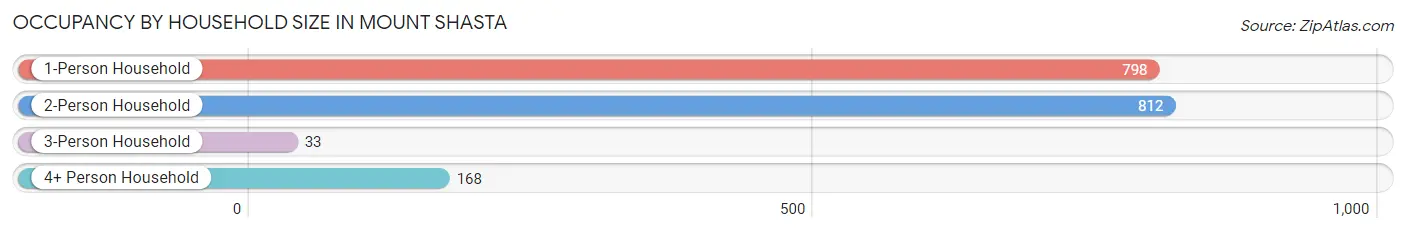
| Household Size | # Housing Units | % Housing Units |
| 1-Person Household | 798 | 44.1% |
| 2-Person Household | 812 | 44.8% |
| 3-Person Household | 33 | 1.8% |
| 4+ Person Household | 168 | 9.3% |
| Total Housing Units | 1,811 | 100.0% |
Occupancy by Ownership by Household Size in Mount Shasta
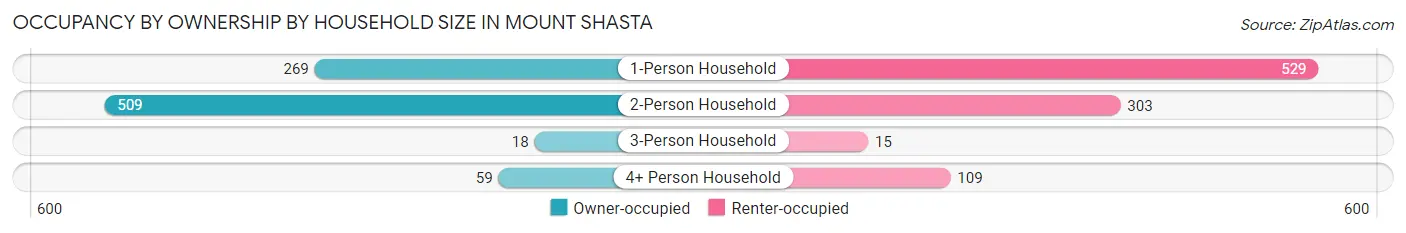
| Household Size | Owner-occupied | Renter-occupied |
| 1-Person Household | 269 (33.7%) | 529 (66.3%) |
| 2-Person Household | 509 (62.7%) | 303 (37.3%) |
| 3-Person Household | 18 (54.5%) | 15 (45.5%) |
| 4+ Person Household | 59 (35.1%) | 109 (64.9%) |
| Total Housing Units | 855 (47.2%) | 956 (52.8%) |
Occupancy by Educational Attainment in Mount Shasta
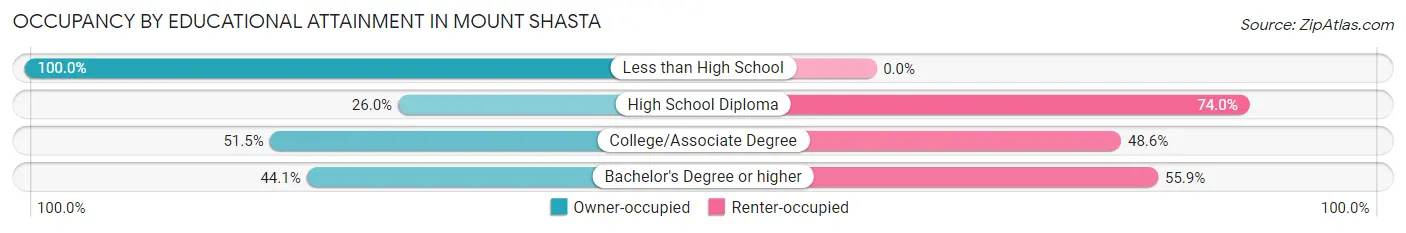
| Household Size | Owner-occupied | Renter-occupied |
| Less than High School | 93 (100.0%) | 0 (0.0%) |
| High School Diploma | 85 (26.0%) | 242 (74.0%) |
| College/Associate Degree | 445 (51.4%) | 420 (48.5%) |
| Bachelor's Degree or higher | 232 (44.1%) | 294 (55.9%) |
Occupancy by Age of Householder in Mount Shasta
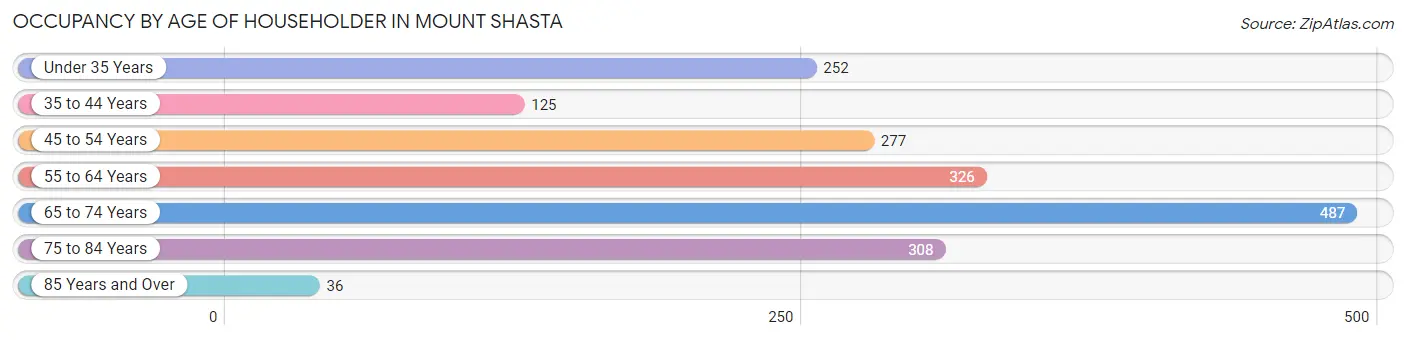
| Age Bracket | # Households | % Households |
| Under 35 Years | 252 | 13.9% |
| 35 to 44 Years | 125 | 6.9% |
| 45 to 54 Years | 277 | 15.3% |
| 55 to 64 Years | 326 | 18.0% |
| 65 to 74 Years | 487 | 26.9% |
| 75 to 84 Years | 308 | 17.0% |
| 85 Years and Over | 36 | 2.0% |
| Total | 1,811 | 100.0% |
Housing Finances in Mount Shasta
Median Income by Occupancy in Mount Shasta
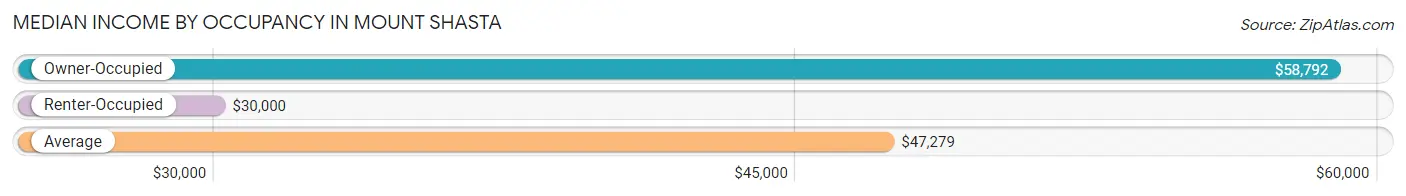
| Occupancy Type | # Households | Median Income |
| Owner-Occupied | 855 (47.2%) | $58,792 |
| Renter-Occupied | 956 (52.8%) | $30,000 |
| Average | 1,811 (100.0%) | $47,279 |
Occupancy by Householder Income Bracket in Mount Shasta
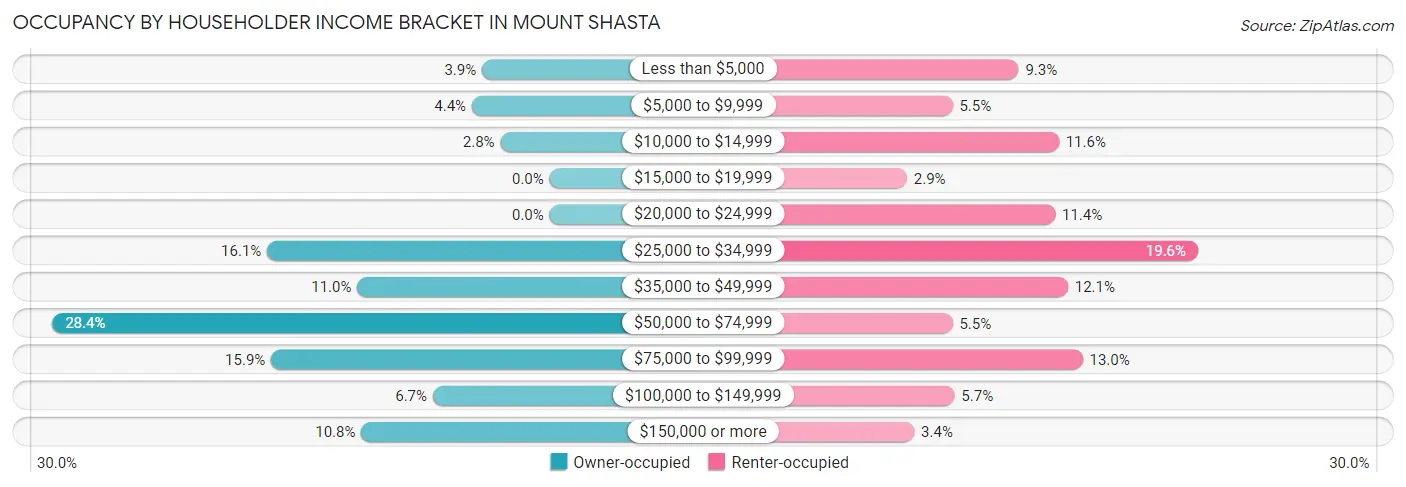
| Income Bracket | Owner-occupied | Renter-occupied |
| Less than $5,000 | 33 (3.9%) | 89 (9.3%) |
| $5,000 to $9,999 | 38 (4.4%) | 53 (5.5%) |
| $10,000 to $14,999 | 24 (2.8%) | 111 (11.6%) |
| $15,000 to $19,999 | 0 (0.0%) | 28 (2.9%) |
| $20,000 to $24,999 | 0 (0.0%) | 109 (11.4%) |
| $25,000 to $34,999 | 138 (16.1%) | 187 (19.6%) |
| $35,000 to $49,999 | 94 (11.0%) | 116 (12.1%) |
| $50,000 to $74,999 | 243 (28.4%) | 53 (5.5%) |
| $75,000 to $99,999 | 136 (15.9%) | 124 (13.0%) |
| $100,000 to $149,999 | 57 (6.7%) | 54 (5.7%) |
| $150,000 or more | 92 (10.8%) | 32 (3.4%) |
| Total | 855 (100.0%) | 956 (100.0%) |
Monthly Housing Cost Tiers in Mount Shasta

| Monthly Cost | Owner-occupied | Renter-occupied |
| Less than $300 | 103 (12.0%) | 0 (0.0%) |
| $300 to $499 | 89 (10.4%) | 89 (9.3%) |
| $500 to $799 | 262 (30.6%) | 40 (4.2%) |
| $800 to $999 | 81 (9.5%) | 123 (12.9%) |
| $1,000 to $1,499 | 28 (3.3%) | 393 (41.1%) |
| $1,500 to $1,999 | 173 (20.2%) | 181 (18.9%) |
| $2,000 to $2,499 | 36 (4.2%) | 38 (4.0%) |
| $2,500 to $2,999 | 20 (2.3%) | 85 (8.9%) |
| $3,000 or more | 63 (7.4%) | 0 (0.0%) |
| Total | 855 (100.0%) | 956 (100.0%) |
Physical Housing Characteristics in Mount Shasta
Housing Structures in Mount Shasta
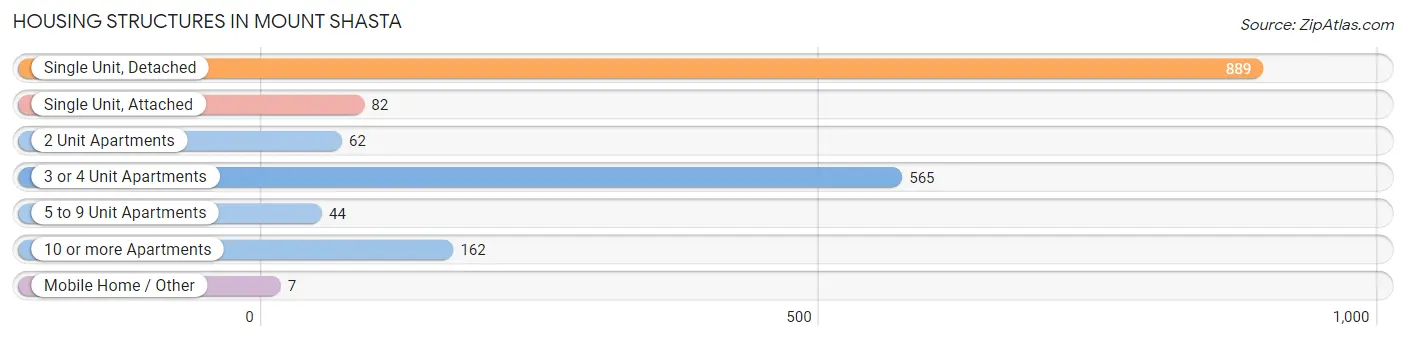
| Structure Type | # Housing Units | % Housing Units |
| Single Unit, Detached | 889 | 49.1% |
| Single Unit, Attached | 82 | 4.5% |
| 2 Unit Apartments | 62 | 3.4% |
| 3 or 4 Unit Apartments | 565 | 31.2% |
| 5 to 9 Unit Apartments | 44 | 2.4% |
| 10 or more Apartments | 162 | 8.9% |
| Mobile Home / Other | 7 | 0.4% |
| Total | 1,811 | 100.0% |
Housing Structures by Occupancy in Mount Shasta
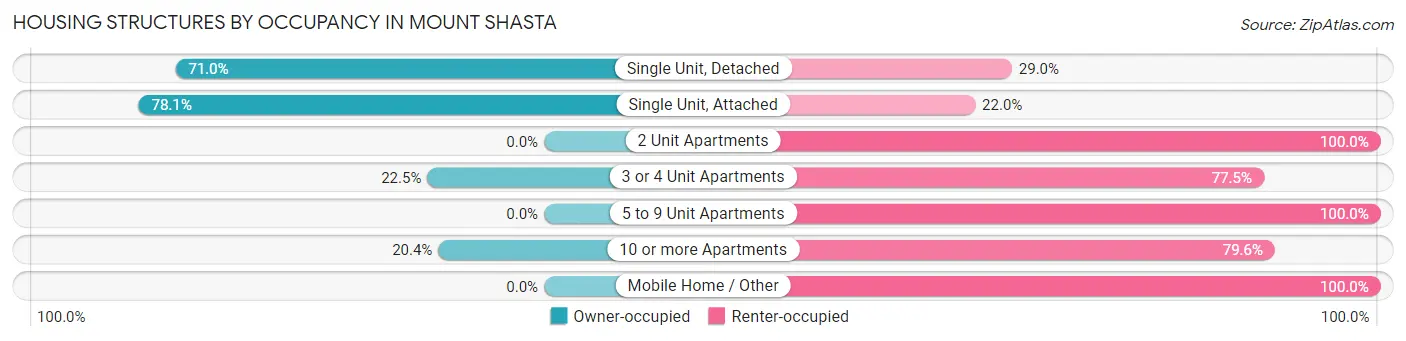
| Structure Type | Owner-occupied | Renter-occupied |
| Single Unit, Detached | 631 (71.0%) | 258 (29.0%) |
| Single Unit, Attached | 64 (78.0%) | 18 (22.0%) |
| 2 Unit Apartments | 0 (0.0%) | 62 (100.0%) |
| 3 or 4 Unit Apartments | 127 (22.5%) | 438 (77.5%) |
| 5 to 9 Unit Apartments | 0 (0.0%) | 44 (100.0%) |
| 10 or more Apartments | 33 (20.4%) | 129 (79.6%) |
| Mobile Home / Other | 0 (0.0%) | 7 (100.0%) |
| Total | 855 (47.2%) | 956 (52.8%) |
Housing Structures by Number of Rooms in Mount Shasta
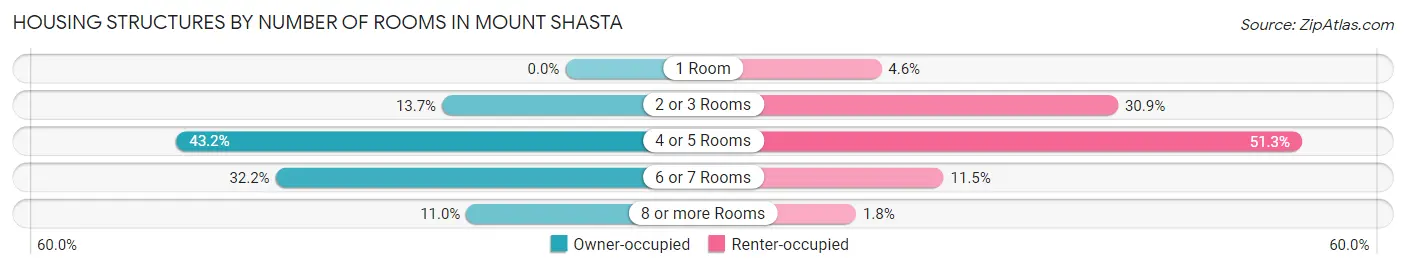
| Number of Rooms | Owner-occupied | Renter-occupied |
| 1 Room | 0 (0.0%) | 44 (4.6%) |
| 2 or 3 Rooms | 117 (13.7%) | 295 (30.9%) |
| 4 or 5 Rooms | 369 (43.2%) | 490 (51.3%) |
| 6 or 7 Rooms | 275 (32.2%) | 110 (11.5%) |
| 8 or more Rooms | 94 (11.0%) | 17 (1.8%) |
| Total | 855 (100.0%) | 956 (100.0%) |
Housing Structure by Heating Type in Mount Shasta
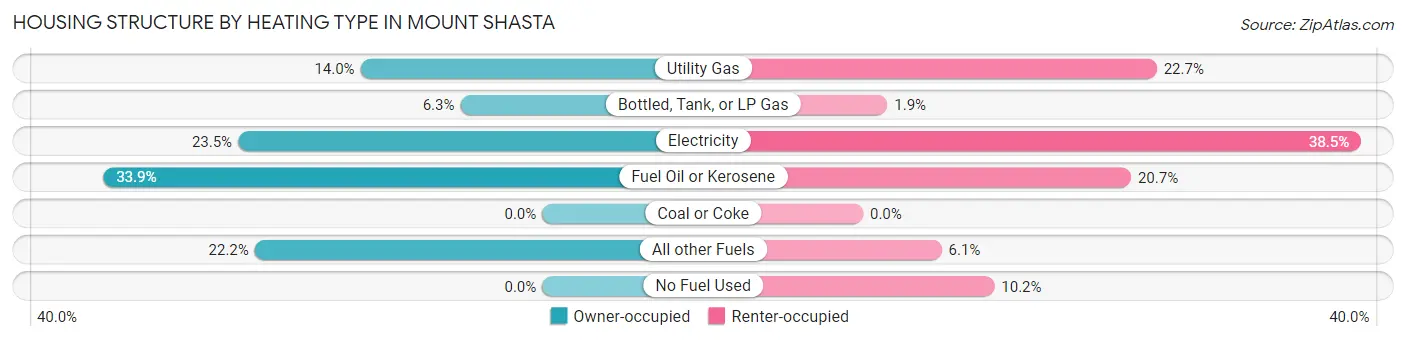
| Heating Type | Owner-occupied | Renter-occupied |
| Utility Gas | 120 (14.0%) | 217 (22.7%) |
| Bottled, Tank, or LP Gas | 54 (6.3%) | 18 (1.9%) |
| Electricity | 201 (23.5%) | 368 (38.5%) |
| Fuel Oil or Kerosene | 290 (33.9%) | 198 (20.7%) |
| Coal or Coke | 0 (0.0%) | 0 (0.0%) |
| All other Fuels | 190 (22.2%) | 58 (6.1%) |
| No Fuel Used | 0 (0.0%) | 97 (10.2%) |
| Total | 855 (100.0%) | 956 (100.0%) |
Household Vehicle Usage in Mount Shasta
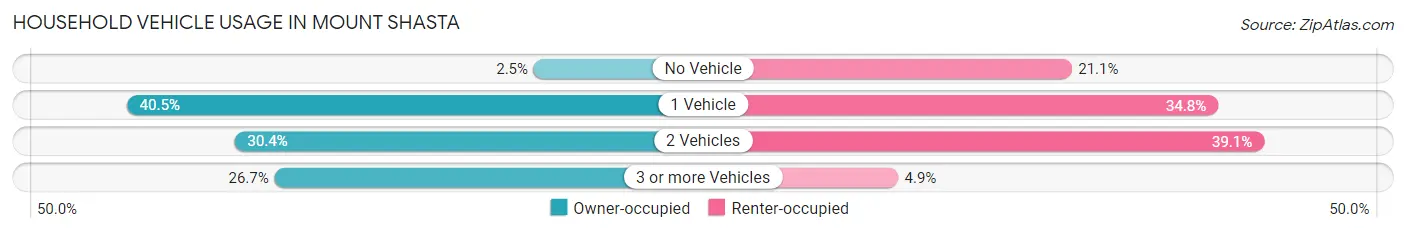
| Vehicles per Household | Owner-occupied | Renter-occupied |
| No Vehicle | 21 (2.5%) | 202 (21.1%) |
| 1 Vehicle | 346 (40.5%) | 333 (34.8%) |
| 2 Vehicles | 260 (30.4%) | 374 (39.1%) |
| 3 or more Vehicles | 228 (26.7%) | 47 (4.9%) |
| Total | 855 (100.0%) | 956 (100.0%) |
Real Estate & Mortgages in Mount Shasta
Real Estate and Mortgage Overview in Mount Shasta
| Characteristic | Without Mortgage | With Mortgage |
| Housing Units | 506 | 349 |
| Median Property Value | $277,000 | $311,500 |
| Median Household Income | $58,222 | $55 |
| Monthly Housing Costs | $601 | $51 |
| Real Estate Taxes | $2,309 | $0 |
Property Value by Mortgage Status in Mount Shasta
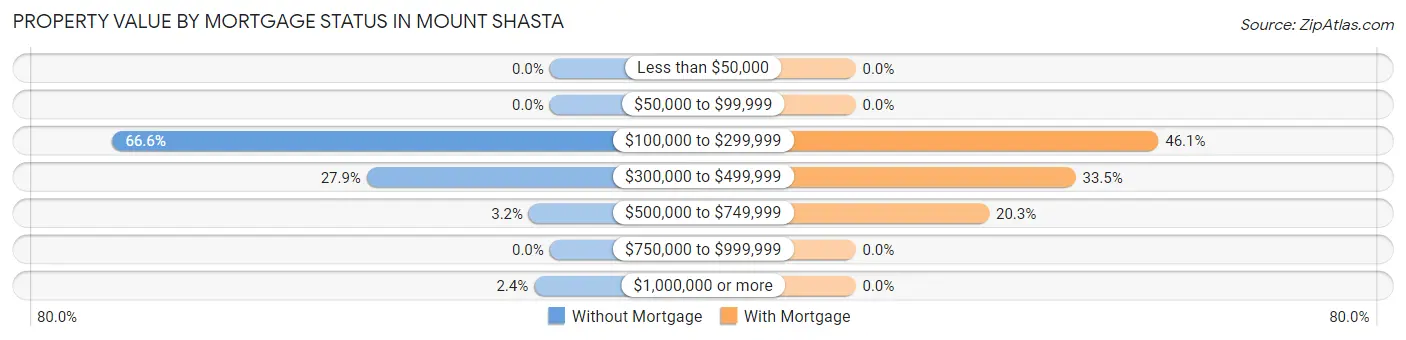
| Property Value | Without Mortgage | With Mortgage |
| Less than $50,000 | 0 (0.0%) | 0 (0.0%) |
| $50,000 to $99,999 | 0 (0.0%) | 0 (0.0%) |
| $100,000 to $299,999 | 337 (66.6%) | 161 (46.1%) |
| $300,000 to $499,999 | 141 (27.9%) | 117 (33.5%) |
| $500,000 to $749,999 | 16 (3.2%) | 71 (20.3%) |
| $750,000 to $999,999 | 0 (0.0%) | 0 (0.0%) |
| $1,000,000 or more | 12 (2.4%) | 0 (0.0%) |
| Total | 506 (100.0%) | 349 (100.0%) |
Household Income by Mortgage Status in Mount Shasta
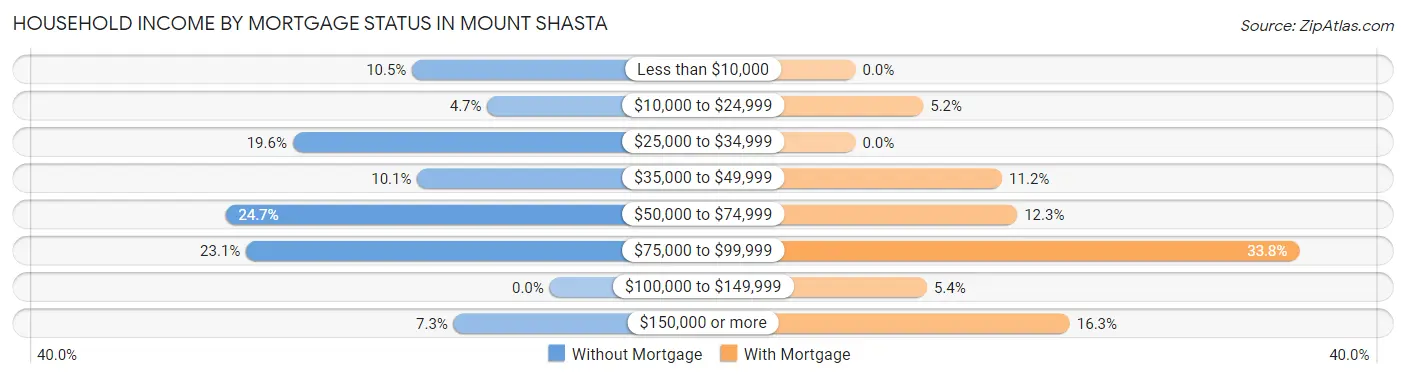
| Household Income | Without Mortgage | With Mortgage |
| Less than $10,000 | 53 (10.5%) | 0 (0.0%) |
| $10,000 to $24,999 | 24 (4.7%) | 18 (5.2%) |
| $25,000 to $34,999 | 99 (19.6%) | 0 (0.0%) |
| $35,000 to $49,999 | 51 (10.1%) | 39 (11.2%) |
| $50,000 to $74,999 | 125 (24.7%) | 43 (12.3%) |
| $75,000 to $99,999 | 117 (23.1%) | 118 (33.8%) |
| $100,000 to $149,999 | 0 (0.0%) | 19 (5.4%) |
| $150,000 or more | 37 (7.3%) | 57 (16.3%) |
| Total | 506 (100.0%) | 349 (100.0%) |
Property Value to Household Income Ratio in Mount Shasta
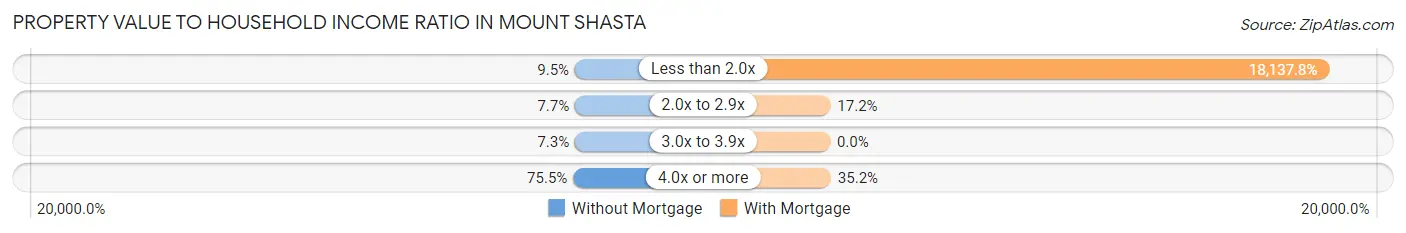
| Value-to-Income Ratio | Without Mortgage | With Mortgage |
| Less than 2.0x | 48 (9.5%) | 63,301 (18,137.8%) |
| 2.0x to 2.9x | 39 (7.7%) | 60 (17.2%) |
| 3.0x to 3.9x | 37 (7.3%) | 0 (0.0%) |
| 4.0x or more | 382 (75.5%) | 123 (35.2%) |
| Total | 506 (100.0%) | 349 (100.0%) |
Real Estate Taxes by Mortgage Status in Mount Shasta
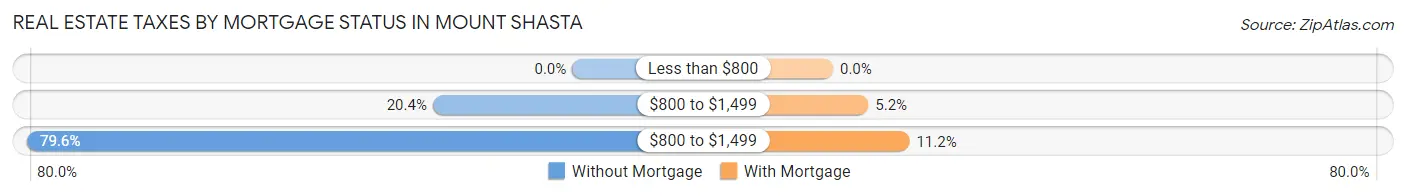
| Property Taxes | Without Mortgage | With Mortgage |
| Less than $800 | 0 (0.0%) | 0 (0.0%) |
| $800 to $1,499 | 103 (20.4%) | 18 (5.2%) |
| $800 to $1,499 | 403 (79.6%) | 39 (11.2%) |
| Total | 506 (100.0%) | 349 (100.0%) |
Health & Disability in Mount Shasta
Health Insurance Coverage by Age in Mount Shasta
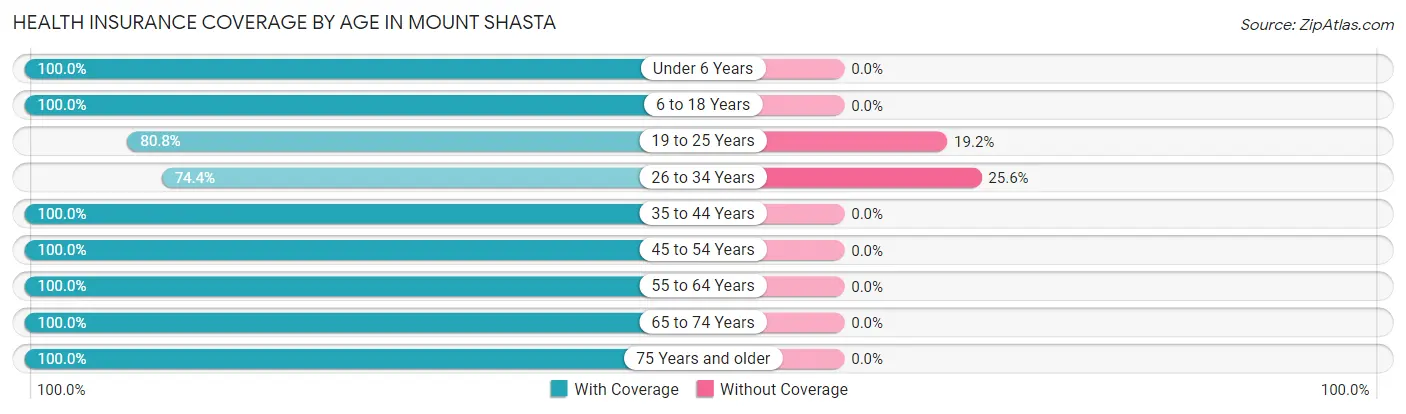
| Age Bracket | With Coverage | Without Coverage |
| Under 6 Years | 22 (100.0%) | 0 (0.0%) |
| 6 to 18 Years | 520 (100.0%) | 0 (0.0%) |
| 19 to 25 Years | 118 (80.8%) | 28 (19.2%) |
| 26 to 34 Years | 259 (74.4%) | 89 (25.6%) |
| 35 to 44 Years | 146 (100.0%) | 0 (0.0%) |
| 45 to 54 Years | 417 (100.0%) | 0 (0.0%) |
| 55 to 64 Years | 492 (100.0%) | 0 (0.0%) |
| 65 to 74 Years | 670 (100.0%) | 0 (0.0%) |
| 75 Years and older | 468 (100.0%) | 0 (0.0%) |
| Total | 3,112 (96.4%) | 117 (3.6%) |
Health Insurance Coverage by Citizenship Status in Mount Shasta
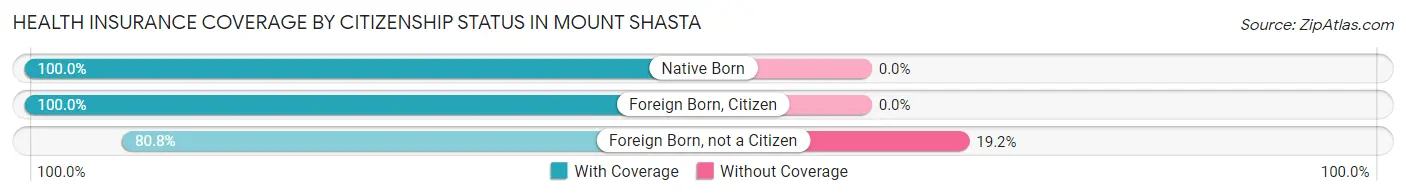
| Citizenship Status | With Coverage | Without Coverage |
| Native Born | 22 (100.0%) | 0 (0.0%) |
| Foreign Born, Citizen | 520 (100.0%) | 0 (0.0%) |
| Foreign Born, not a Citizen | 118 (80.8%) | 28 (19.2%) |
Health Insurance Coverage by Household Income in Mount Shasta
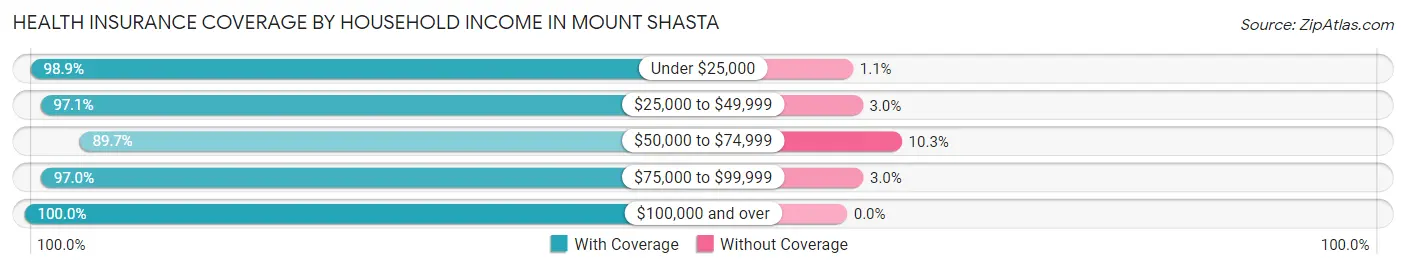
| Household Income | With Coverage | Without Coverage |
| Under $25,000 | 615 (98.9%) | 7 (1.1%) |
| $25,000 to $49,999 | 922 (97.1%) | 28 (2.9%) |
| $50,000 to $74,999 | 550 (89.7%) | 63 (10.3%) |
| $75,000 to $99,999 | 605 (97.0%) | 19 (3.0%) |
| $100,000 and over | 415 (100.0%) | 0 (0.0%) |
Public vs Private Health Insurance Coverage by Age in Mount Shasta
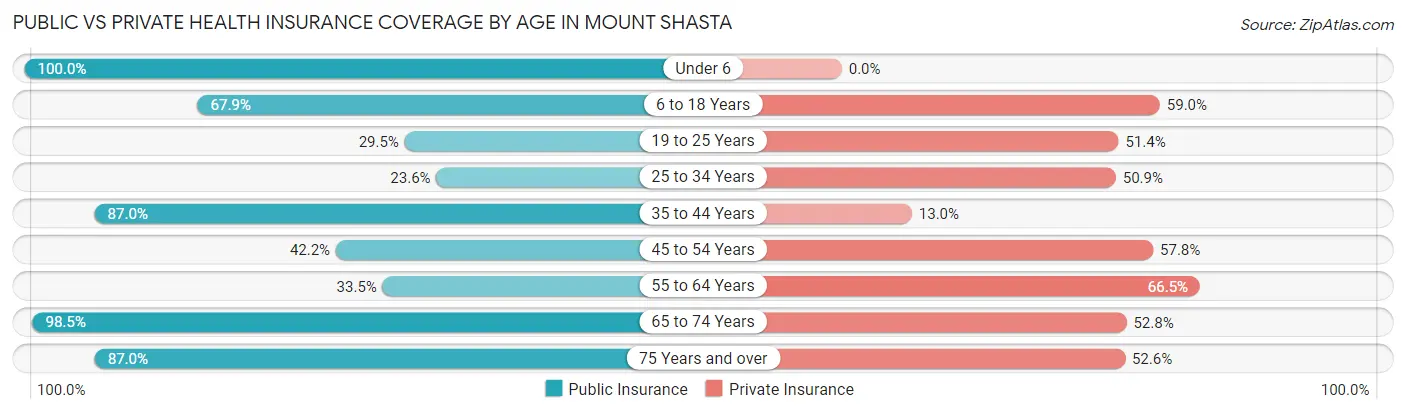
| Age Bracket | Public Insurance | Private Insurance |
| Under 6 | 22 (100.0%) | 0 (0.0%) |
| 6 to 18 Years | 353 (67.9%) | 307 (59.0%) |
| 19 to 25 Years | 43 (29.4%) | 75 (51.4%) |
| 25 to 34 Years | 82 (23.6%) | 177 (50.9%) |
| 35 to 44 Years | 127 (87.0%) | 19 (13.0%) |
| 45 to 54 Years | 176 (42.2%) | 241 (57.8%) |
| 55 to 64 Years | 165 (33.5%) | 327 (66.5%) |
| 65 to 74 Years | 660 (98.5%) | 354 (52.8%) |
| 75 Years and over | 407 (87.0%) | 246 (52.6%) |
| Total | 2,035 (63.0%) | 1,746 (54.1%) |
Disability Status by Sex by Age in Mount Shasta
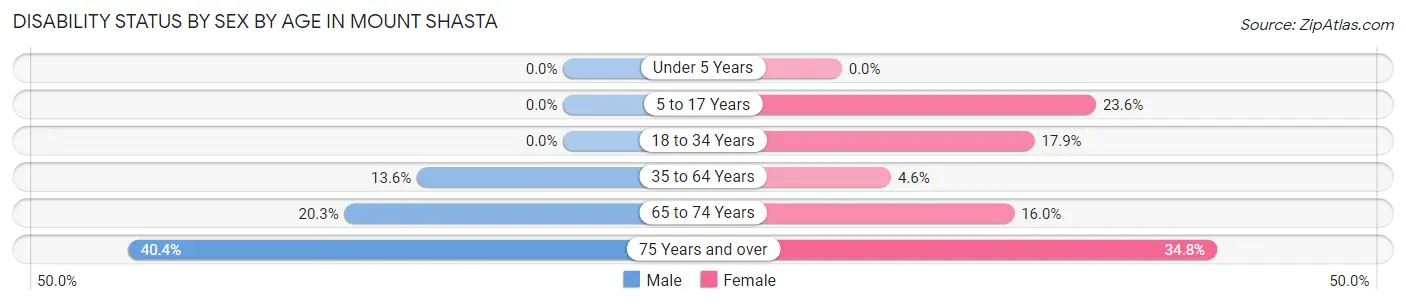
| Age Bracket | Male | Female |
| Under 5 Years | 0 (0.0%) | 0 (0.0%) |
| 5 to 17 Years | 0 (0.0%) | 71 (23.6%) |
| 18 to 34 Years | 0 (0.0%) | 54 (17.9%) |
| 35 to 64 Years | 60 (13.6%) | 28 (4.6%) |
| 65 to 74 Years | 65 (20.3%) | 56 (16.0%) |
| 75 Years and over | 116 (40.4%) | 63 (34.8%) |
Disability Class by Sex by Age in Mount Shasta
Disability Class: Hearing Difficulty
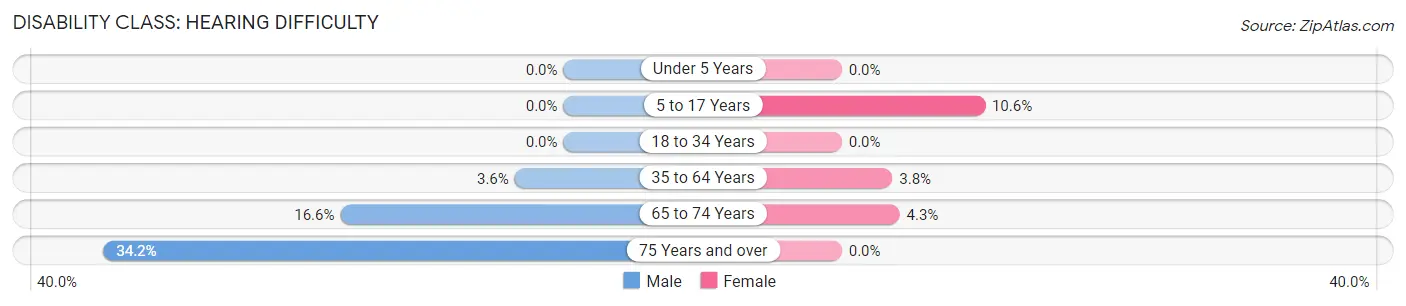
| Age Bracket | Male | Female |
| Under 5 Years | 0 (0.0%) | 0 (0.0%) |
| 5 to 17 Years | 0 (0.0%) | 32 (10.6%) |
| 18 to 34 Years | 0 (0.0%) | 0 (0.0%) |
| 35 to 64 Years | 16 (3.6%) | 23 (3.7%) |
| 65 to 74 Years | 53 (16.6%) | 15 (4.3%) |
| 75 Years and over | 98 (34.2%) | 0 (0.0%) |
Disability Class: Vision Difficulty
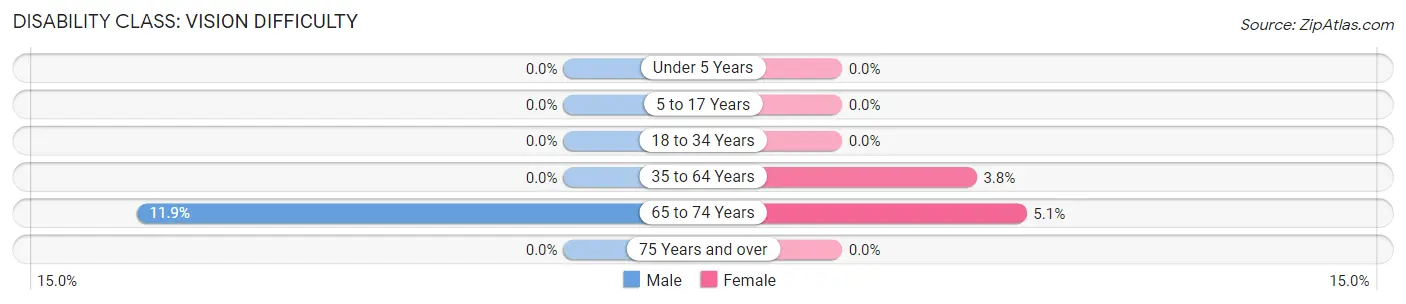
| Age Bracket | Male | Female |
| Under 5 Years | 0 (0.0%) | 0 (0.0%) |
| 5 to 17 Years | 0 (0.0%) | 0 (0.0%) |
| 18 to 34 Years | 0 (0.0%) | 0 (0.0%) |
| 35 to 64 Years | 0 (0.0%) | 23 (3.7%) |
| 65 to 74 Years | 38 (11.9%) | 18 (5.1%) |
| 75 Years and over | 0 (0.0%) | 0 (0.0%) |
Disability Class: Cognitive Difficulty
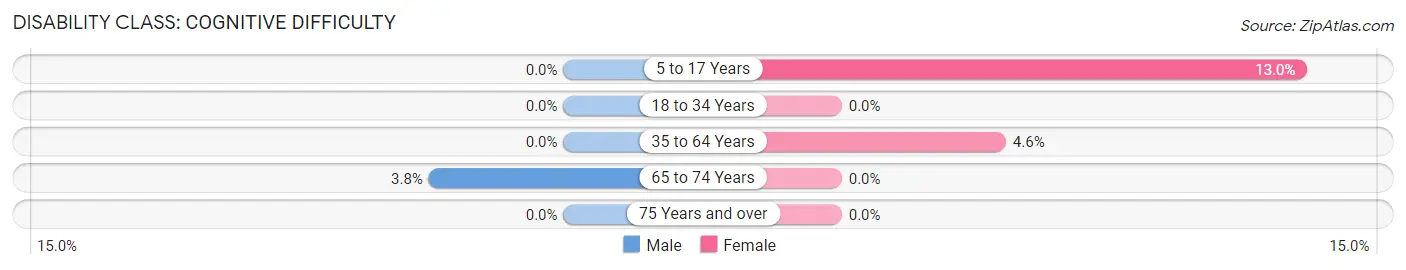
| Age Bracket | Male | Female |
| 5 to 17 Years | 0 (0.0%) | 39 (13.0%) |
| 18 to 34 Years | 0 (0.0%) | 0 (0.0%) |
| 35 to 64 Years | 0 (0.0%) | 28 (4.6%) |
| 65 to 74 Years | 12 (3.7%) | 0 (0.0%) |
| 75 Years and over | 0 (0.0%) | 0 (0.0%) |
Disability Class: Ambulatory Difficulty
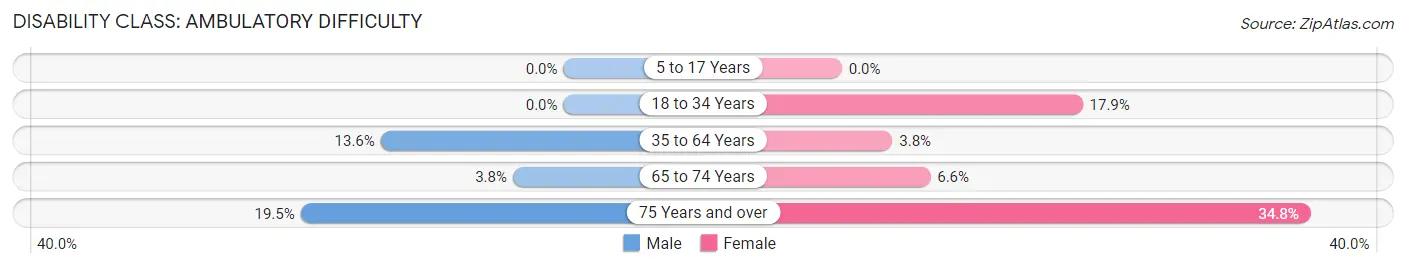
| Age Bracket | Male | Female |
| 5 to 17 Years | 0 (0.0%) | 0 (0.0%) |
| 18 to 34 Years | 0 (0.0%) | 54 (17.9%) |
| 35 to 64 Years | 60 (13.6%) | 23 (3.7%) |
| 65 to 74 Years | 12 (3.7%) | 23 (6.6%) |
| 75 Years and over | 56 (19.5%) | 63 (34.8%) |
Disability Class: Self-Care Difficulty
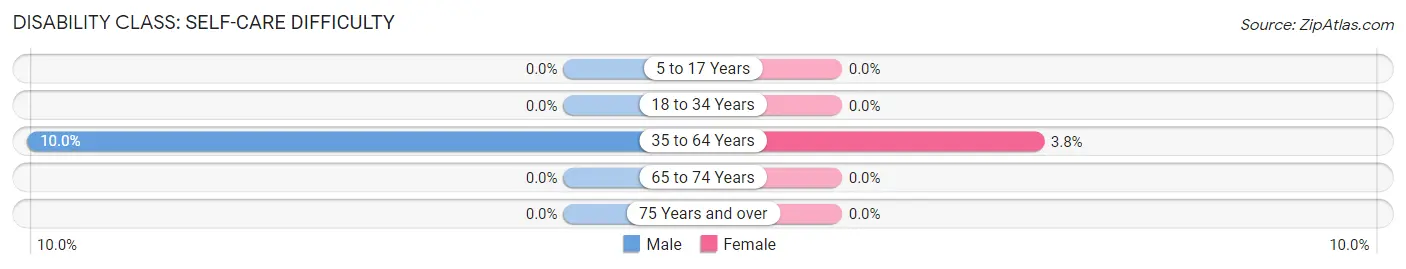
| Age Bracket | Male | Female |
| 5 to 17 Years | 0 (0.0%) | 0 (0.0%) |
| 18 to 34 Years | 0 (0.0%) | 0 (0.0%) |
| 35 to 64 Years | 44 (10.0%) | 23 (3.7%) |
| 65 to 74 Years | 0 (0.0%) | 0 (0.0%) |
| 75 Years and over | 0 (0.0%) | 0 (0.0%) |
Technology Access in Mount Shasta
Computing Device Access in Mount Shasta
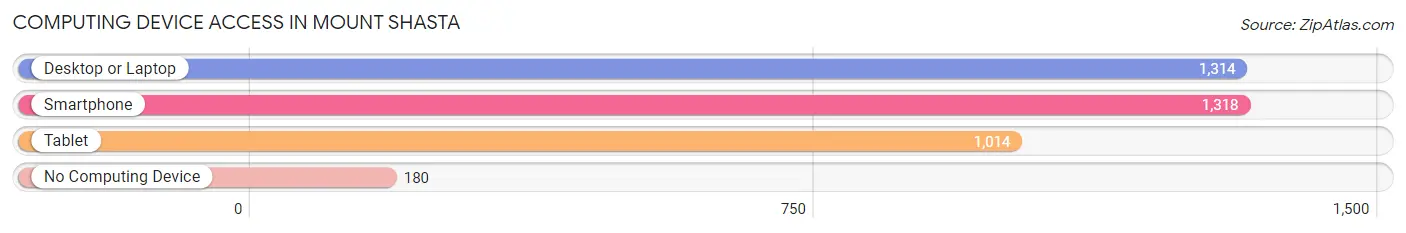
| Device Type | # Households | % Households |
| Desktop or Laptop | 1,314 | 72.6% |
| Smartphone | 1,318 | 72.8% |
| Tablet | 1,014 | 56.0% |
| No Computing Device | 180 | 9.9% |
| Total | 1,811 | 100.0% |
Internet Access in Mount Shasta
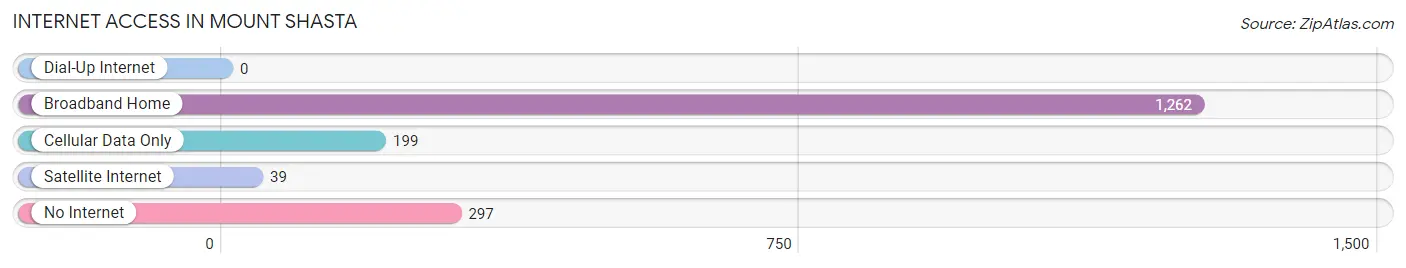
| Internet Type | # Households | % Households |
| Dial-Up Internet | 0 | 0.0% |
| Broadband Home | 1,262 | 69.7% |
| Cellular Data Only | 199 | 11.0% |
| Satellite Internet | 39 | 2.1% |
| No Internet | 297 | 16.4% |
| Total | 1,811 | 100.0% |
Mount Shasta Summary
Mount Shasta is a small city located in Siskiyou County, California, United States. It is situated at the base of the majestic Mount Shasta, a 14,179-foot (4,322 m) active volcano. The city is located in the Shasta-Trinity National Forest and is the gateway to the Mount Shasta Wilderness. The city has a population of 3,394 as of the 2010 census.
History
The area around Mount Shasta has been inhabited by Native Americans for thousands of years. The first recorded European to visit the area was Peter Skene Ogden in 1826. The first permanent settlement was established in 1854 by the Dunsmuir family, who built a sawmill and a hotel. The town was officially incorporated in 1905.
The city was a popular tourist destination in the early 20th century, with visitors coming to see the majestic Mount Shasta and the surrounding area. The city was also a popular destination for mountaineers and climbers, who came to climb the mountain.
Geography
Mount Shasta is located in the Cascade Range of northern California, at the base of Mount Shasta. The city is situated at an elevation of 3,435 feet (1,047 m). The city is surrounded by the Shasta-Trinity National Forest and is the gateway to the Mount Shasta Wilderness.
The city has a total area of 2.2 square miles (5.7 km2), all of which is land. The climate is characterized by warm, dry summers and cold, wet winters.
Economy
The economy of Mount Shasta is largely based on tourism. The city is a popular destination for outdoor recreation, with visitors coming to see the majestic Mount Shasta and the surrounding area. The city is also a popular destination for mountaineers and climbers, who come to climb the mountain.
The city is also home to several businesses, including restaurants, hotels, retail stores, and other services. The city is also home to several manufacturing companies, including a paper mill and a lumber mill.
Demographics
As of the 2010 census, the city had a population of 3,394. The racial makeup of the city was 87.3% White, 0.7% African American, 1.2% Native American, 0.7% Asian, 0.1% Pacific Islander, 6.2% from other races, and 3.9% from two or more races. Hispanic or Latino of any race were 11.3% of the population.
The median income for a household in the city was $37,917, and the median income for a family was $45,938. Males had a median income of $35,938 versus $27,917 for females. The per capita income for the city was $19,938. About 10.3% of families and 13.2% of the population were below the poverty line, including 17.2% of those under age 18 and 8.2% of those age 65 or over.
Mount Shasta is a small city with a rich history, beautiful geography, and a diverse economy. The city is a popular destination for outdoor recreation, with visitors coming to see the majestic Mount Shasta and the surrounding area. The city is also home to several businesses, including restaurants, hotels, retail stores, and other services. The city has a population of 3,394 as of the 2010 census, with a median income of $37,917.
Common Questions
What is Per Capita Income in Mount Shasta?
Per Capita income in Mount Shasta is $39,162.
What is the Median Family Income in Mount Shasta?
Median Family Income in Mount Shasta is $58,131.
What is the Median Household income in Mount Shasta?
Median Household Income in Mount Shasta is $47,279.
What is Income or Wage Gap in Mount Shasta?
Income or Wage Gap in Mount Shasta is 32.8%.
Women in Mount Shasta earn 67.2 cents for every dollar earned by a man.
What is Inequality or Gini Index in Mount Shasta?
Inequality or Gini Index in Mount Shasta is 0.55.
What is the Total Population of Mount Shasta?
Total Population of Mount Shasta is 3,235.
What is the Total Male Population of Mount Shasta?
Total Male Population of Mount Shasta is 1,488.
What is the Total Female Population of Mount Shasta?
Total Female Population of Mount Shasta is 1,747.
What is the Ratio of Males per 100 Females in Mount Shasta?
There are 85.17 Males per 100 Females in Mount Shasta.
What is the Ratio of Females per 100 Males in Mount Shasta?
There are 117.41 Females per 100 Males in Mount Shasta.
What is the Median Population Age in Mount Shasta?
Median Population Age in Mount Shasta is 57.2 Years.
What is the Average Family Size in Mount Shasta
Average Family Size in Mount Shasta is 2.4 People.
What is the Average Household Size in Mount Shasta
Average Household Size in Mount Shasta is 1.8 People.
How Large is the Labor Force in Mount Shasta?
There are 1,378 People in the Labor Forcein in Mount Shasta.
What is the Percentage of People in the Labor Force in Mount Shasta?
48.6% of People are in the Labor Force in Mount Shasta.
What is the Unemployment Rate in Mount Shasta?
Unemployment Rate in Mount Shasta is 1.6%.