Mojave, CA Map & Demographics
Mojave Map
Mojave Overview
$22,991
PER CAPITA INCOME
$57,991
AVG FAMILY INCOME
$46,035
AVG HOUSEHOLD INCOME
12.6%
WAGE / INCOME GAP [ % ]
87.4¢/ $1
WAGE / INCOME GAP [ $ ]
0.45
INEQUALITY / GINI INDEX
3,865
TOTAL POPULATION
1,849
MALE POPULATION
2,016
FEMALE POPULATION
91.72
MALES / 100 FEMALES
109.03
FEMALES / 100 MALES
39.0
MEDIAN AGE
3.5
AVG FAMILY SIZE
2.5
AVG HOUSEHOLD SIZE
1,558
LABOR FORCE [ PEOPLE ]
55.0%
PERCENT IN LABOR FORCE
7.8%
UNEMPLOYMENT RATE
Mojave Zip Codes
Mojave Area Codes
Income in Mojave
Income Overview in Mojave
Per Capita Income in Mojave is $22,991, while median incomes of families and households are $57,991 and $46,035 respectively.
| Characteristic | Number | Measure |
| Per Capita Income | 3,865 | $22,991 |
| Median Family Income | 851 | $57,991 |
| Mean Family Income | 851 | $66,736 |
| Median Household Income | 1,513 | $46,035 |
| Mean Household Income | 1,513 | $60,286 |
| Income Deficit | 851 | $0 |
| Wage / Income Gap (%) | 3,865 | 12.62% |
| Wage / Income Gap ($) | 3,865 | 87.38¢ per $1 |
| Gini / Inequality Index | 3,865 | 0.45 |
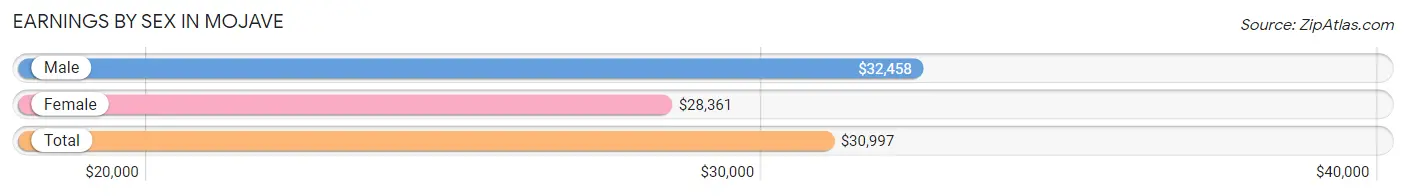
Earnings by Sex in Mojave
Average Earnings in Mojave are $30,997, $32,458 for men and $28,361 for women, a difference of 12.6%.
| Sex | Number | Average Earnings |
| Male | 934 (58.6%) | $32,458 |
| Female | 661 (41.4%) | $28,361 |
| Total | 1,595 (100.0%) | $30,997 |
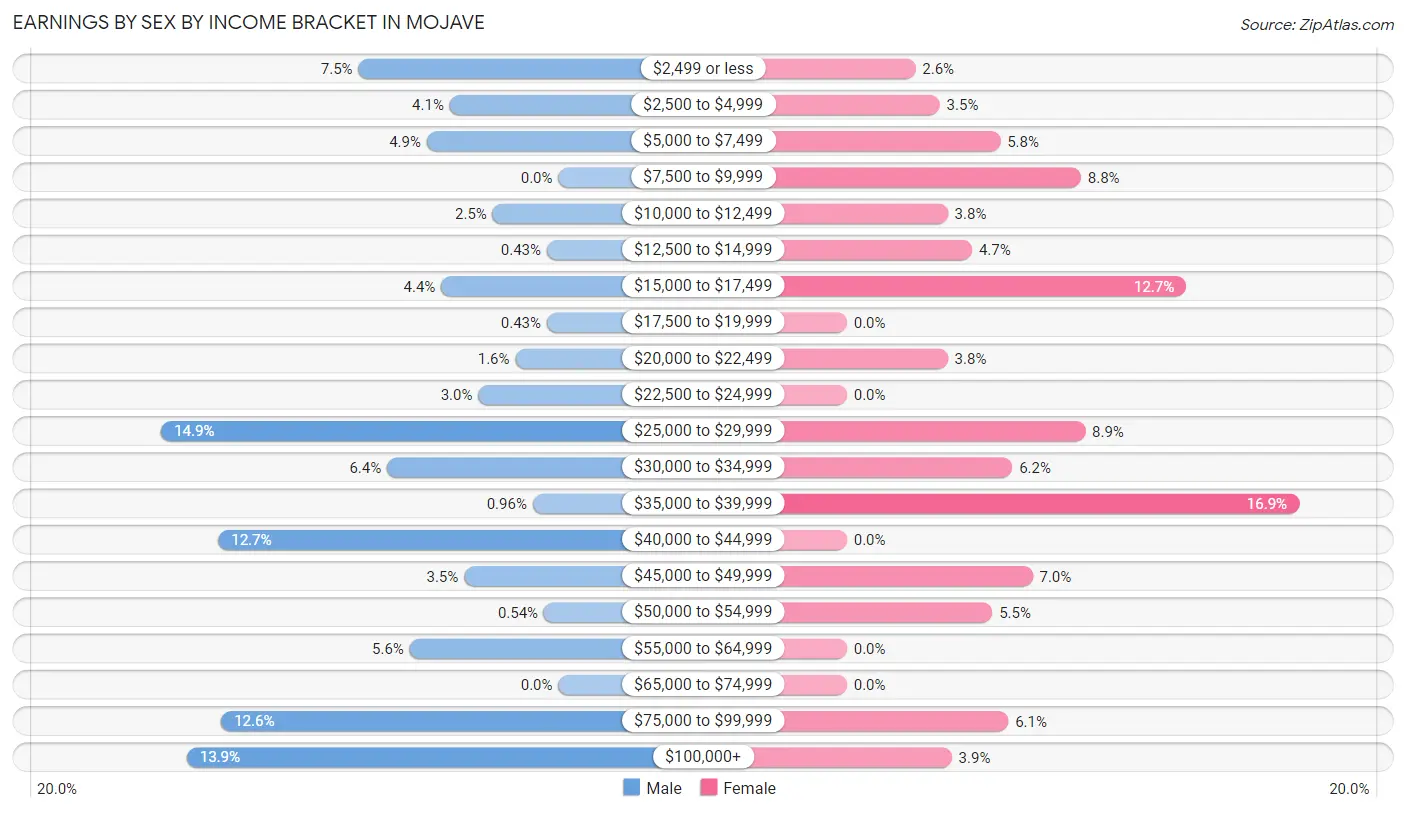
Earnings by Sex by Income Bracket in Mojave
The most common earnings brackets in Mojave are $25,000 to $29,999 for men (139 | 14.9%) and $35,000 to $39,999 for women (112 | 16.9%).
| Income | Male | Female |
| $2,499 or less | 70 (7.5%) | 17 (2.6%) |
| $2,500 to $4,999 | 38 (4.1%) | 23 (3.5%) |
| $5,000 to $7,499 | 46 (4.9%) | 38 (5.8%) |
| $7,500 to $9,999 | 0 (0.0%) | 58 (8.8%) |
| $10,000 to $12,499 | 23 (2.5%) | 25 (3.8%) |
| $12,500 to $14,999 | 4 (0.4%) | 31 (4.7%) |
| $15,000 to $17,499 | 41 (4.4%) | 84 (12.7%) |
| $17,500 to $19,999 | 4 (0.4%) | 0 (0.0%) |
| $20,000 to $22,499 | 15 (1.6%) | 25 (3.8%) |
| $22,500 to $24,999 | 28 (3.0%) | 0 (0.0%) |
| $25,000 to $29,999 | 139 (14.9%) | 59 (8.9%) |
| $30,000 to $34,999 | 60 (6.4%) | 41 (6.2%) |
| $35,000 to $39,999 | 9 (1.0%) | 112 (16.9%) |
| $40,000 to $44,999 | 119 (12.7%) | 0 (0.0%) |
| $45,000 to $49,999 | 33 (3.5%) | 46 (7.0%) |
| $50,000 to $54,999 | 5 (0.5%) | 36 (5.4%) |
| $55,000 to $64,999 | 52 (5.6%) | 0 (0.0%) |
| $65,000 to $74,999 | 0 (0.0%) | 0 (0.0%) |
| $75,000 to $99,999 | 118 (12.6%) | 40 (6.0%) |
| $100,000+ | 130 (13.9%) | 26 (3.9%) |
| Total | 934 (100.0%) | 661 (100.0%) |
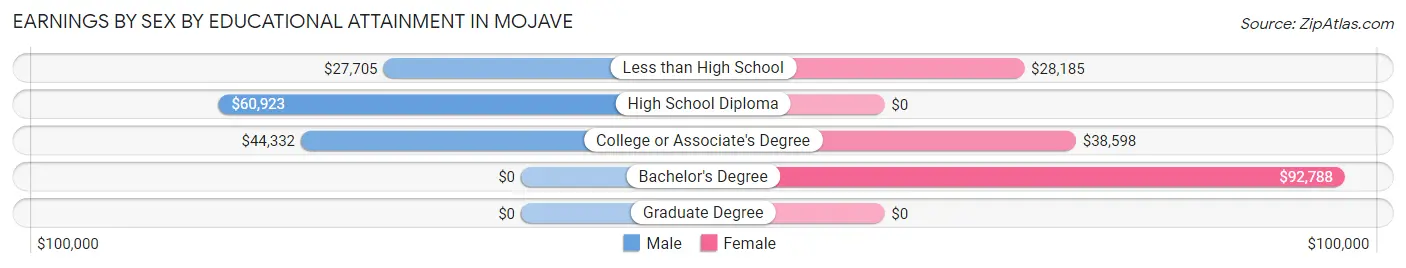
Earnings by Sex by Educational Attainment in Mojave
Average earnings in Mojave are $42,000 for men and $28,556 for women, a difference of 32.0%. Men with an educational attainment of high school diploma enjoy the highest average annual earnings of $60,923, while those with less than high school education earn the least with $27,705. Women with an educational attainment of bachelor's degree earn the most with the average annual earnings of $92,788, while those with less than high school education have the smallest earnings of $28,185.
| Educational Attainment | Male Income | Female Income |
| Less than High School | $27,705 | $28,185 |
| High School Diploma | $60,923 | $0 |
| College or Associate's Degree | $44,332 | $38,598 |
| Bachelor's Degree | - | - |
| Graduate Degree | - | - |
| Total | $42,000 | $28,556 |
Family Income in Mojave
Family Income Brackets in Mojave
According to the Mojave family income data, there are 158 families falling into the $50,000 to $74,999 income range, which is the most common income bracket and makes up 18.6% of all families. Conversely, the $200,000+ income bracket is the least frequent group with only 28 families (3.3%) belonging to this category.
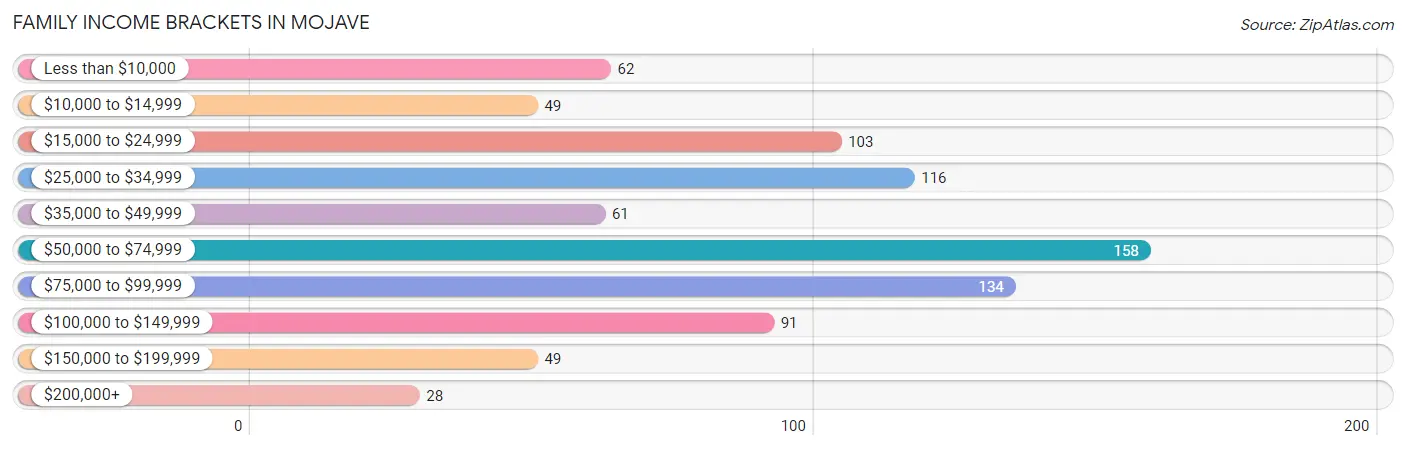
| Income Bracket | # Families | % Families |
| Less than $10,000 | 62 | 7.3% |
| $10,000 to $14,999 | 49 | 5.8% |
| $15,000 to $24,999 | 103 | 12.1% |
| $25,000 to $34,999 | 116 | 13.6% |
| $35,000 to $49,999 | 61 | 7.2% |
| $50,000 to $74,999 | 158 | 18.6% |
| $75,000 to $99,999 | 134 | 15.7% |
| $100,000 to $149,999 | 91 | 10.7% |
| $150,000 to $199,999 | 49 | 5.8% |
| $200,000+ | 28 | 3.3% |
Family Income by Famaliy Size in Mojave
3-person families (78 | 9.2%) account for the highest median family income in Mojave with $149,015 per family, while 3-person families (78 | 9.2%) have the highest median income of $49,672 per family member.
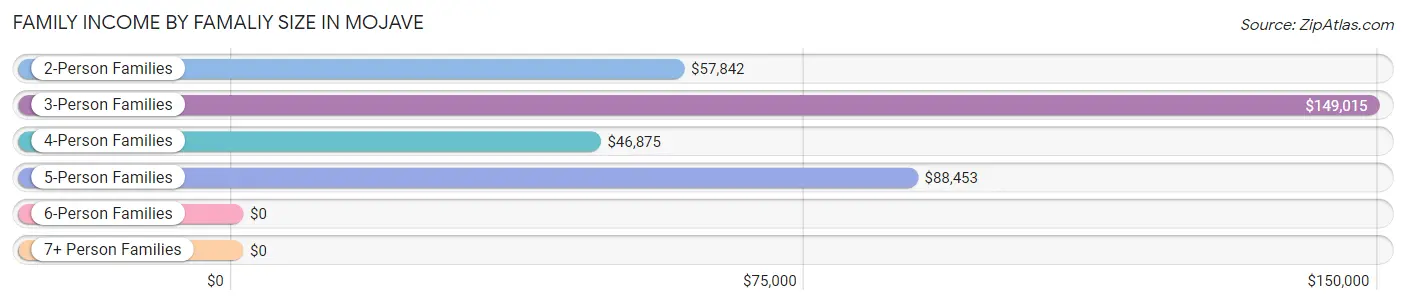
| Income Bracket | # Families | Median Income |
| 2-Person Families | 405 (47.6%) | $57,842 |
| 3-Person Families | 78 (9.2%) | $149,015 |
| 4-Person Families | 155 (18.2%) | $46,875 |
| 5-Person Families | 73 (8.6%) | $88,453 |
| 6-Person Families | 140 (16.5%) | $0 |
| 7+ Person Families | 0 (0.0%) | $0 |
| Total | 851 (100.0%) | $57,991 |
Family Income by Number of Earners in Mojave
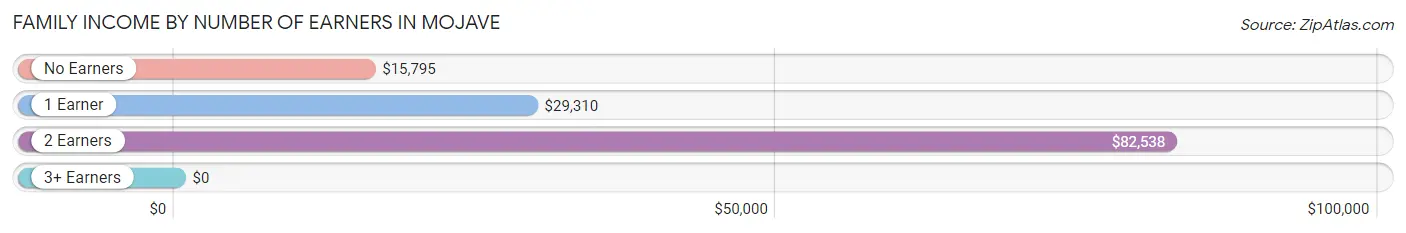
| Number of Earners | # Families | Median Income |
| No Earners | 133 (15.6%) | $15,795 |
| 1 Earner | 316 (37.1%) | $29,310 |
| 2 Earners | 339 (39.8%) | $82,538 |
| 3+ Earners | 63 (7.4%) | $0 |
| Total | 851 (100.0%) | $57,991 |
Household Income in Mojave
Household Income Brackets in Mojave
With 228 households falling in the category, the $35,000 to $49,999 income range is the most frequent in Mojave, accounting for 15.1% of all households. In contrast, only 29 households (1.9%) fall into the $200,000+ income bracket, making it the least populous group.
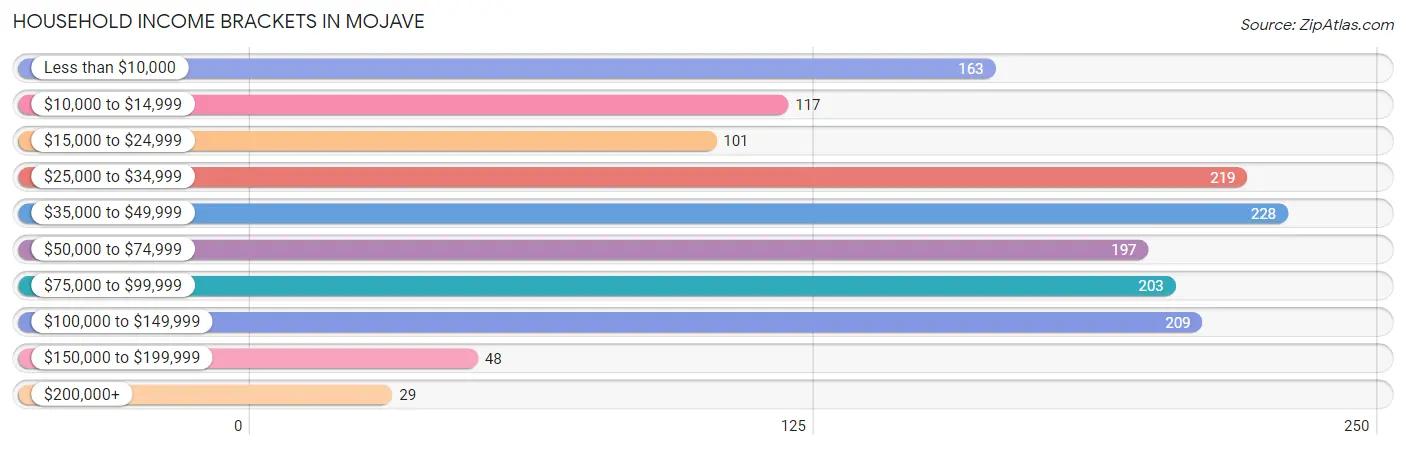
| Income Bracket | # Households | % Households |
| Less than $10,000 | 163 | 10.8% |
| $10,000 to $14,999 | 117 | 7.7% |
| $15,000 to $24,999 | 101 | 6.7% |
| $25,000 to $34,999 | 219 | 14.5% |
| $35,000 to $49,999 | 228 | 15.1% |
| $50,000 to $74,999 | 197 | 13.0% |
| $75,000 to $99,999 | 203 | 13.4% |
| $100,000 to $149,999 | 209 | 13.8% |
| $150,000 to $199,999 | 48 | 3.2% |
| $200,000+ | 29 | 1.9% |
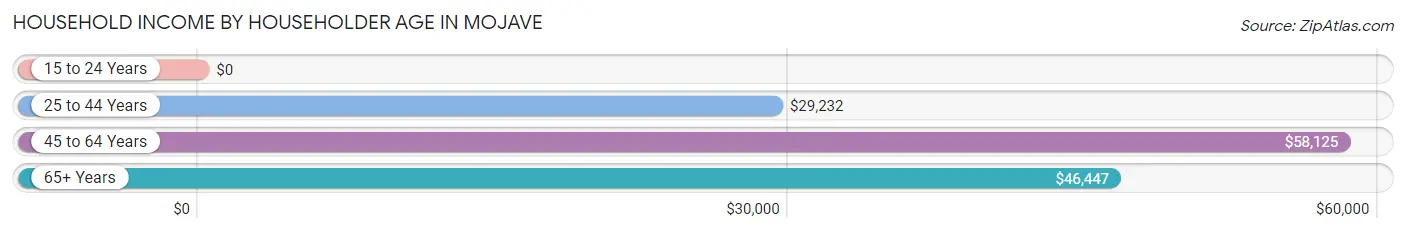
Household Income by Householder Age in Mojave
The median household income in Mojave is $46,035, with the highest median household income of $58,125 found in the 45 to 64 years age bracket for the primary householder. A total of 686 households (45.3%) fall into this category.
| Income Bracket | # Households | Median Income |
| 15 to 24 Years | 0 (0.0%) | $0 |
| 25 to 44 Years | 479 (31.7%) | $29,232 |
| 45 to 64 Years | 686 (45.3%) | $58,125 |
| 65+ Years | 348 (23.0%) | $46,447 |
| Total | 1,513 (100.0%) | $46,035 |
Poverty in Mojave
Income Below Poverty by Sex and Age in Mojave
With 32.1% poverty level for males and 39.9% for females among the residents of Mojave, 12 to 14 year old males and 35 to 44 year old females are the most vulnerable to poverty, with 220 males (100.0%) and 192 females (75.9%) in their respective age groups living below the poverty level.
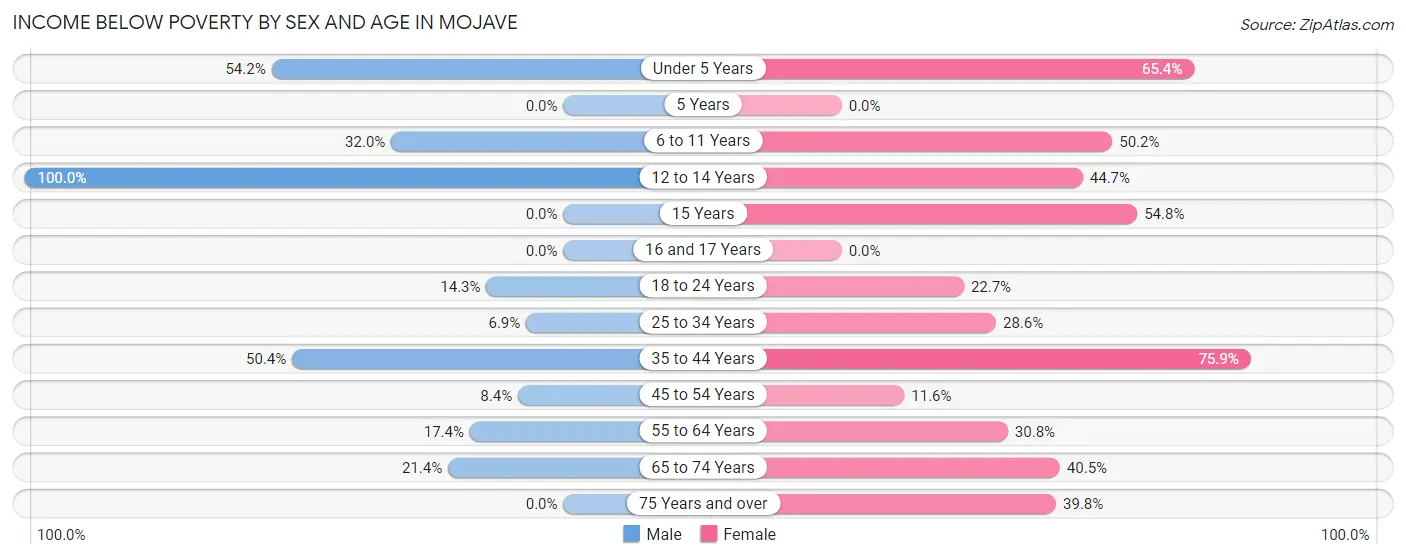
| Age Bracket | Male | Female |
| Under 5 Years | 13 (54.2%) | 153 (65.4%) |
| 5 Years | 0 (0.0%) | 0 (0.0%) |
| 6 to 11 Years | 62 (32.0%) | 119 (50.2%) |
| 12 to 14 Years | 220 (100.0%) | 17 (44.7%) |
| 15 Years | 0 (0.0%) | 17 (54.8%) |
| 16 and 17 Years | 0 (0.0%) | 0 (0.0%) |
| 18 to 24 Years | 10 (14.3%) | 34 (22.7%) |
| 25 to 34 Years | 15 (6.9%) | 61 (28.6%) |
| 35 to 44 Years | 145 (50.3%) | 192 (75.9%) |
| 45 to 54 Years | 16 (8.4%) | 36 (11.6%) |
| 55 to 64 Years | 50 (17.4%) | 74 (30.8%) |
| 65 to 74 Years | 55 (21.4%) | 51 (40.5%) |
| 75 Years and over | 0 (0.0%) | 37 (39.8%) |
| Total | 586 (32.1%) | 791 (39.9%) |
Income Above Poverty by Sex and Age in Mojave
According to the poverty statistics in Mojave, males aged 16 and 17 years and females aged 16 and 17 years are the age groups that are most secure financially, with 100.0% of males and 100.0% of females in these age groups living above the poverty line.
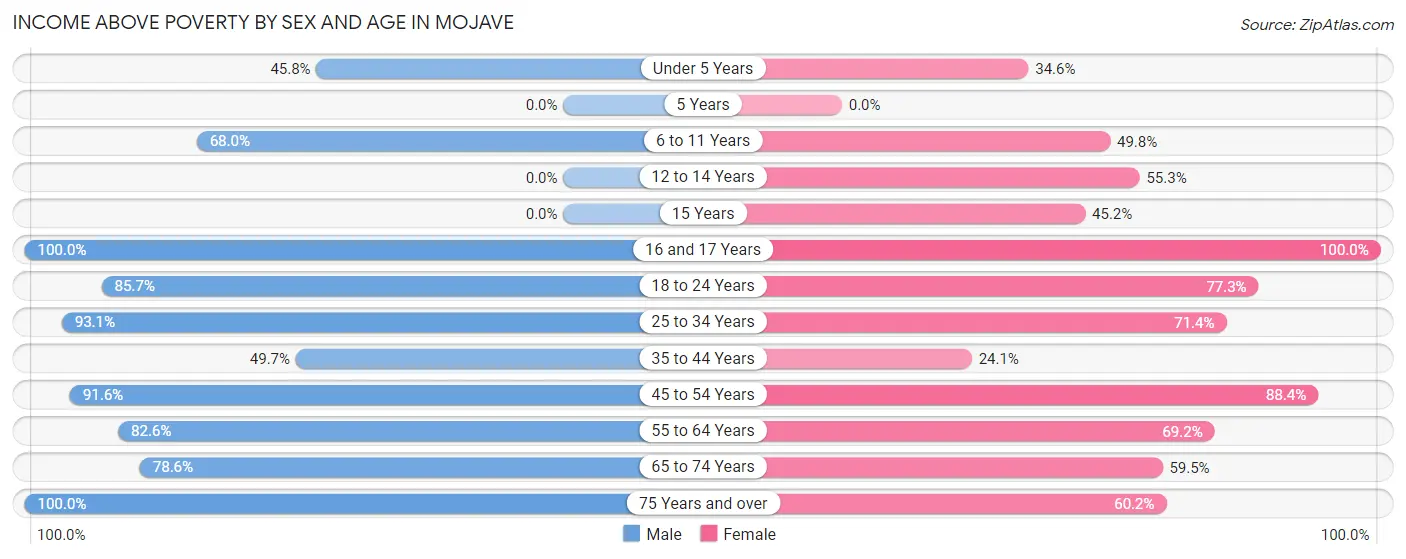
| Age Bracket | Male | Female |
| Under 5 Years | 11 (45.8%) | 81 (34.6%) |
| 5 Years | 0 (0.0%) | 0 (0.0%) |
| 6 to 11 Years | 132 (68.0%) | 118 (49.8%) |
| 12 to 14 Years | 0 (0.0%) | 21 (55.3%) |
| 15 Years | 0 (0.0%) | 14 (45.2%) |
| 16 and 17 Years | 27 (100.0%) | 59 (100.0%) |
| 18 to 24 Years | 60 (85.7%) | 116 (77.3%) |
| 25 to 34 Years | 202 (93.1%) | 152 (71.4%) |
| 35 to 44 Years | 143 (49.6%) | 61 (24.1%) |
| 45 to 54 Years | 174 (91.6%) | 274 (88.4%) |
| 55 to 64 Years | 238 (82.6%) | 166 (69.2%) |
| 65 to 74 Years | 202 (78.6%) | 75 (59.5%) |
| 75 Years and over | 52 (100.0%) | 56 (60.2%) |
| Total | 1,241 (67.9%) | 1,193 (60.1%) |
Income Below Poverty Among Married-Couple Families in Mojave
The poverty statistics for married-couple families in Mojave show that 26.2% or 171 of the total 652 families live below the poverty line. Families with 3 or 4 children have the highest poverty rate of 65.3%, comprising of 111 families. On the other hand, families with 1 or 2 children have the lowest poverty rate of 9.4%, which includes 9 families.
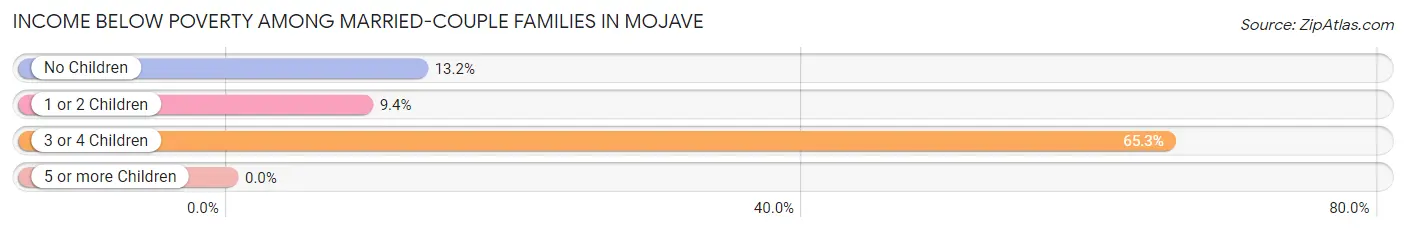
| Children | Above Poverty | Below Poverty |
| No Children | 335 (86.8%) | 51 (13.2%) |
| 1 or 2 Children | 87 (90.6%) | 9 (9.4%) |
| 3 or 4 Children | 59 (34.7%) | 111 (65.3%) |
| 5 or more Children | 0 (0.0%) | 0 (0.0%) |
| Total | 481 (73.8%) | 171 (26.2%) |
Income Below Poverty Among Single-Parent Households in Mojave
According to the poverty data in Mojave, 12.8% or 11 single-father households and 78.8% or 89 single-mother households are living below the poverty line. Among single-father households, those with 3 or 4 children have the highest poverty rate, with 11 households (55.0%) experiencing poverty. Likewise, among single-mother households, those with 1 or 2 children have the highest poverty rate, with 65 households (100.0%) falling below the poverty line.
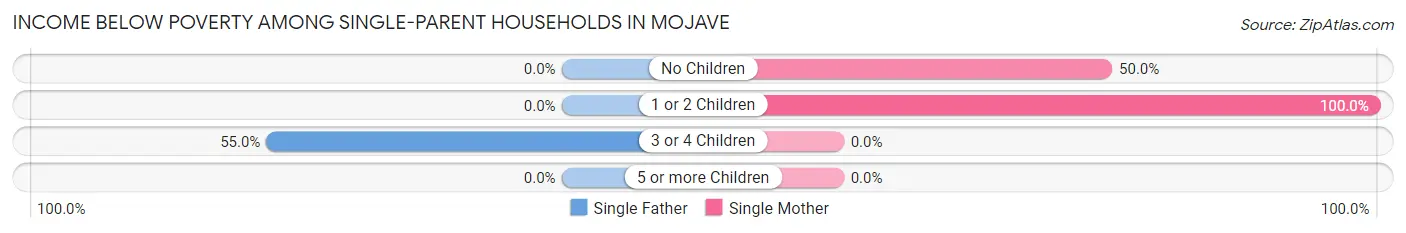
| Children | Single Father | Single Mother |
| No Children | 0 (0.0%) | 24 (50.0%) |
| 1 or 2 Children | 0 (0.0%) | 65 (100.0%) |
| 3 or 4 Children | 11 (55.0%) | 0 (0.0%) |
| 5 or more Children | 0 (0.0%) | 0 (0.0%) |
| Total | 11 (12.8%) | 89 (78.8%) |
Income Below Poverty Among Married-Couple vs Single-Parent Households in Mojave
The poverty data for Mojave shows that 171 of the married-couple family households (26.2%) and 100 of the single-parent households (50.2%) are living below the poverty level. Within the married-couple family households, those with 3 or 4 children have the highest poverty rate, with 111 households (65.3%) falling below the poverty line. Among the single-parent households, those with 3 or 4 children have the highest poverty rate, with 11 household (55.0%) living below poverty.
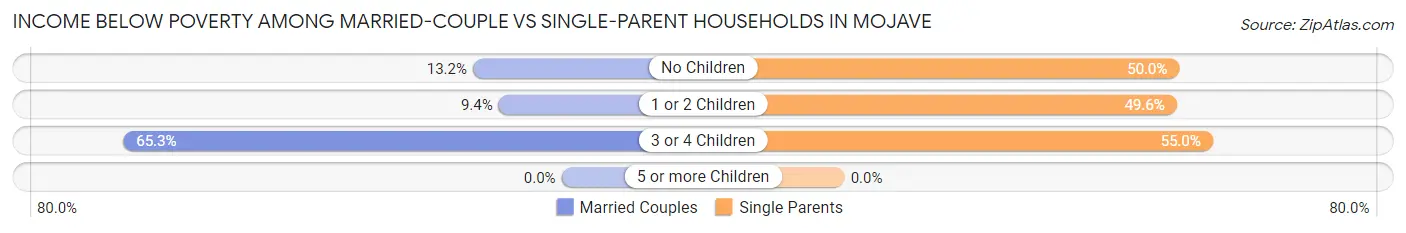
| Children | Married-Couple Families | Single-Parent Households |
| No Children | 51 (13.2%) | 24 (50.0%) |
| 1 or 2 Children | 9 (9.4%) | 65 (49.6%) |
| 3 or 4 Children | 111 (65.3%) | 11 (55.0%) |
| 5 or more Children | 0 (0.0%) | 0 (0.0%) |
| Total | 171 (26.2%) | 100 (50.2%) |
Race in Mojave
The most populous races in Mojave are Hispanic or Latino (2,043 | 52.9%), White / Caucasian (1,583 | 41.0%), and Two or more Races (856 | 22.2%).
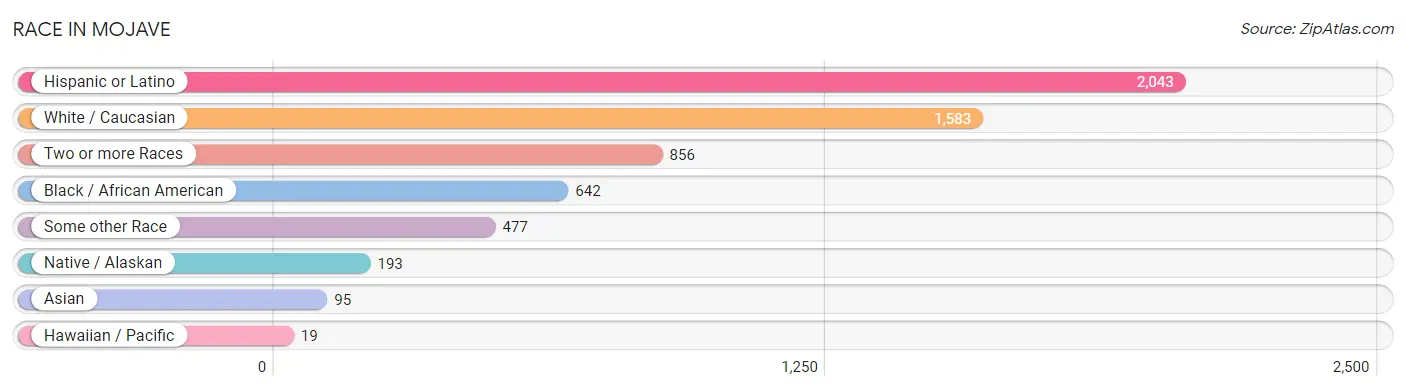
| Race | # Population | % Population |
| Asian | 95 | 2.5% |
| Black / African American | 642 | 16.6% |
| Hawaiian / Pacific | 19 | 0.5% |
| Hispanic or Latino | 2,043 | 52.9% |
| Native / Alaskan | 193 | 5.0% |
| White / Caucasian | 1,583 | 41.0% |
| Two or more Races | 856 | 22.2% |
| Some other Race | 477 | 12.3% |
| Total | 3,865 | 100.0% |
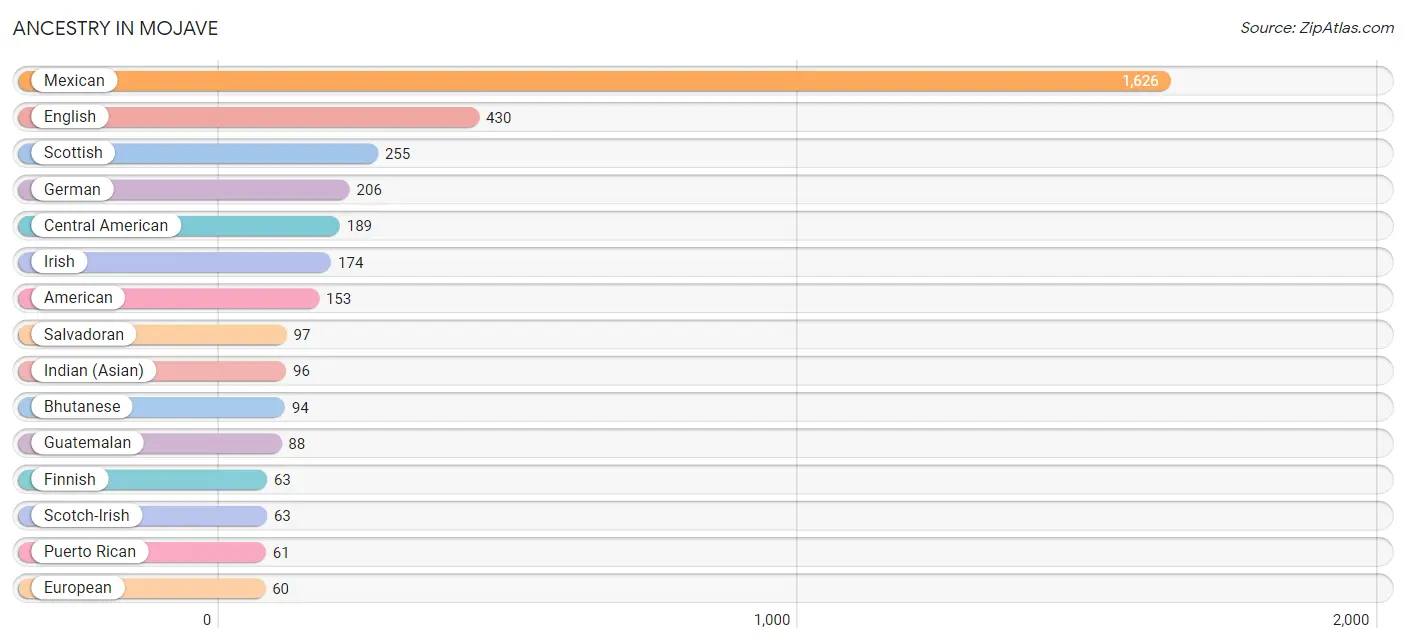
Ancestry in Mojave
The most populous ancestries reported in Mojave are Mexican (1,626 | 42.1%), English (430 | 11.1%), Scottish (255 | 6.6%), German (206 | 5.3%), and Central American (189 | 4.9%), together accounting for 70.0% of all Mojave residents.
| Ancestry | # Population | % Population |
| American | 153 | 4.0% |
| Austrian | 5 | 0.1% |
| Bhutanese | 94 | 2.4% |
| Canadian | 42 | 1.1% |
| Central American | 189 | 4.9% |
| Cherokee | 44 | 1.1% |
| Cuban | 44 | 1.1% |
| Dutch | 23 | 0.6% |
| English | 430 | 11.1% |
| European | 60 | 1.5% |
| Finnish | 63 | 1.6% |
| French Canadian | 12 | 0.3% |
| German | 206 | 5.3% |
| Guamanian / Chamorro | 19 | 0.5% |
| Guatemalan | 88 | 2.3% |
| Honduran | 4 | 0.1% |
| Hungarian | 11 | 0.3% |
| Indian (Asian) | 96 | 2.5% |
| Irish | 174 | 4.5% |
| Italian | 25 | 0.6% |
| Korean | 5 | 0.1% |
| Mexican | 1,626 | 42.1% |
| Mexican American Indian | 33 | 0.9% |
| Norwegian | 33 | 0.9% |
| Peruvian | 31 | 0.8% |
| Polish | 7 | 0.2% |
| Portuguese | 42 | 1.1% |
| Puerto Rican | 61 | 1.6% |
| Russian | 18 | 0.5% |
| Salvadoran | 97 | 2.5% |
| Scotch-Irish | 63 | 1.6% |
| Scottish | 255 | 6.6% |
| Seminole | 25 | 0.6% |
| South American | 31 | 0.8% |
| Spanish | 36 | 0.9% |
| Sri Lankan | 50 | 1.3% |
| Thai | 26 | 0.7% |
| Yugoslavian | 5 | 0.1% | View All 38 Rows |
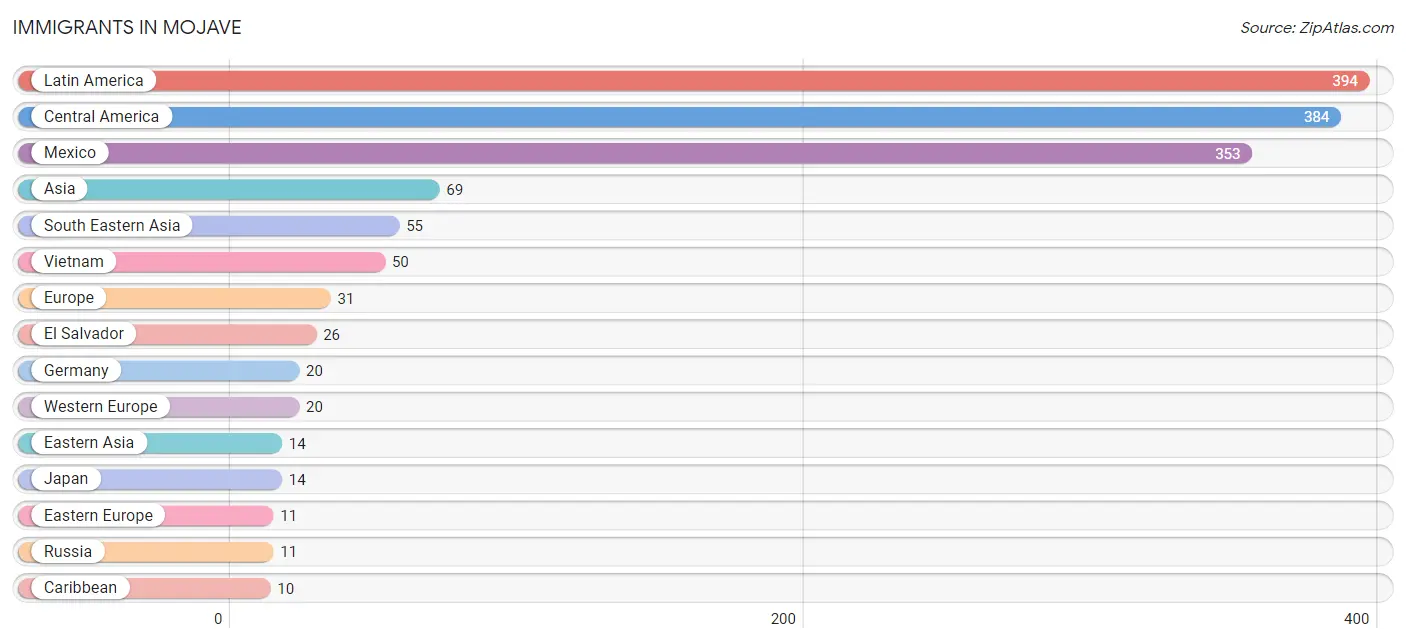
Immigrants in Mojave
The most numerous immigrant groups reported in Mojave came from Latin America (394 | 10.2%), Central America (384 | 9.9%), Mexico (353 | 9.1%), Asia (69 | 1.8%), and South Eastern Asia (55 | 1.4%), together accounting for 32.5% of all Mojave residents.
| Immigration Origin | # Population | % Population |
| Asia | 69 | 1.8% |
| Caribbean | 10 | 0.3% |
| Central America | 384 | 9.9% |
| Cuba | 10 | 0.3% |
| Eastern Asia | 14 | 0.4% |
| Eastern Europe | 11 | 0.3% |
| El Salvador | 26 | 0.7% |
| Europe | 31 | 0.8% |
| Germany | 20 | 0.5% |
| Guatemala | 5 | 0.1% |
| Japan | 14 | 0.4% |
| Latin America | 394 | 10.2% |
| Mexico | 353 | 9.1% |
| Philippines | 5 | 0.1% |
| Russia | 11 | 0.3% |
| South Eastern Asia | 55 | 1.4% |
| Vietnam | 50 | 1.3% |
| Western Europe | 20 | 0.5% | View All 18 Rows |
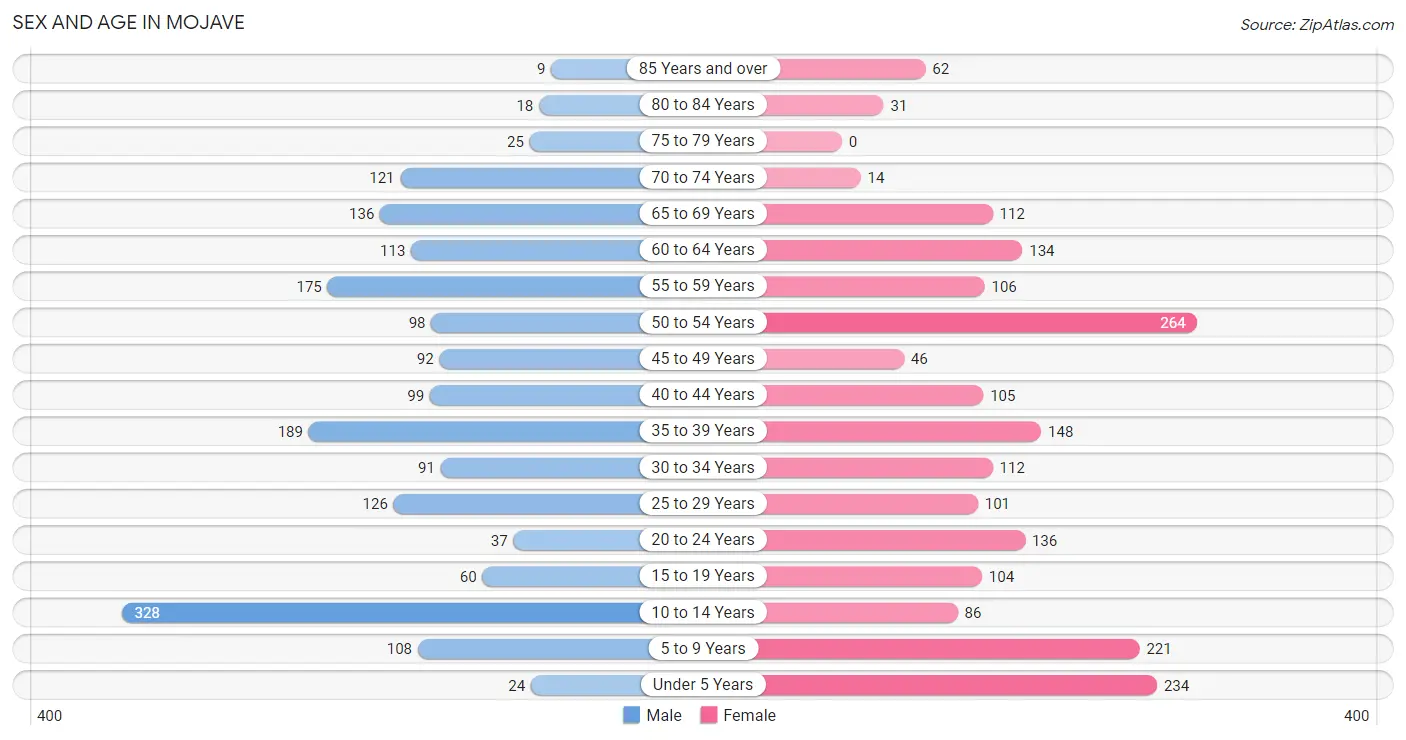
Sex and Age in Mojave
Sex and Age in Mojave
The most populous age groups in Mojave are 10 to 14 Years (328 | 17.7%) for men and 50 to 54 Years (264 | 13.1%) for women.
| Age Bracket | Male | Female |
| Under 5 Years | 24 (1.3%) | 234 (11.6%) |
| 5 to 9 Years | 108 (5.8%) | 221 (11.0%) |
| 10 to 14 Years | 328 (17.7%) | 86 (4.3%) |
| 15 to 19 Years | 60 (3.2%) | 104 (5.2%) |
| 20 to 24 Years | 37 (2.0%) | 136 (6.8%) |
| 25 to 29 Years | 126 (6.8%) | 101 (5.0%) |
| 30 to 34 Years | 91 (4.9%) | 112 (5.6%) |
| 35 to 39 Years | 189 (10.2%) | 148 (7.3%) |
| 40 to 44 Years | 99 (5.3%) | 105 (5.2%) |
| 45 to 49 Years | 92 (5.0%) | 46 (2.3%) |
| 50 to 54 Years | 98 (5.3%) | 264 (13.1%) |
| 55 to 59 Years | 175 (9.5%) | 106 (5.3%) |
| 60 to 64 Years | 113 (6.1%) | 134 (6.7%) |
| 65 to 69 Years | 136 (7.4%) | 112 (5.6%) |
| 70 to 74 Years | 121 (6.5%) | 14 (0.7%) |
| 75 to 79 Years | 25 (1.3%) | 0 (0.0%) |
| 80 to 84 Years | 18 (1.0%) | 31 (1.5%) |
| 85 Years and over | 9 (0.5%) | 62 (3.1%) |
| Total | 1,849 (100.0%) | 2,016 (100.0%) |
Families and Households in Mojave
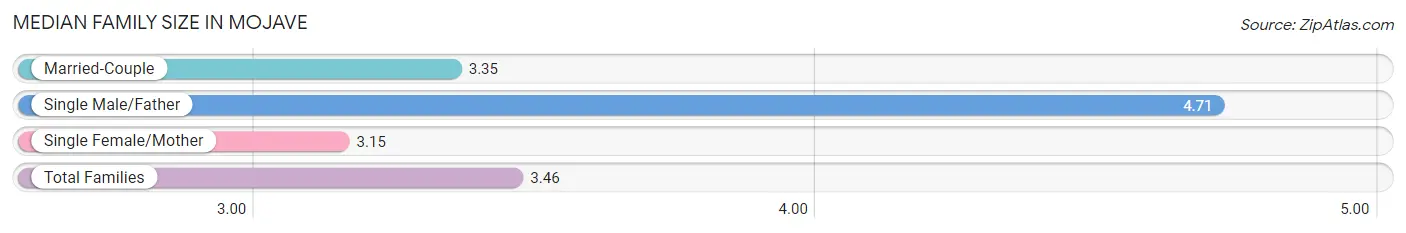
Median Family Size in Mojave
The median family size in Mojave is 3.46 persons per family, with single male/father families (86 | 10.1%) accounting for the largest median family size of 4.71 persons per family. On the other hand, single female/mother families (113 | 13.3%) represent the smallest median family size with 3.15 persons per family.
| Family Type | # Families | Family Size |
| Married-Couple | 652 (76.6%) | 3.35 |
| Single Male/Father | 86 (10.1%) | 4.71 |
| Single Female/Mother | 113 (13.3%) | 3.15 |
| Total Families | 851 (100.0%) | 3.46 |
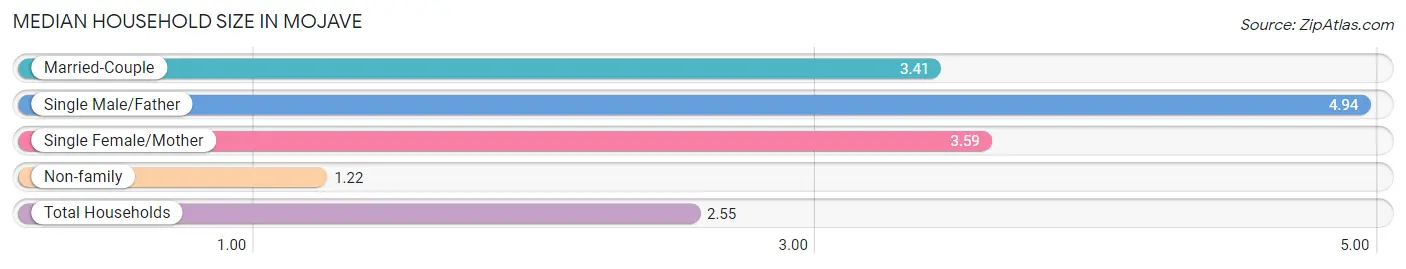
Median Household Size in Mojave
The median household size in Mojave is 2.55 persons per household, with single male/father households (86 | 5.7%) accounting for the largest median household size of 4.94 persons per household. non-family households (662 | 43.8%) represent the smallest median household size with 1.22 persons per household.
| Household Type | # Households | Household Size |
| Married-Couple | 652 (43.1%) | 3.41 |
| Single Male/Father | 86 (5.7%) | 4.94 |
| Single Female/Mother | 113 (7.5%) | 3.59 |
| Non-family | 662 (43.8%) | 1.22 |
| Total Households | 1,513 (100.0%) | 2.55 |
Household Size by Marriage Status in Mojave
Out of a total of 1,513 households in Mojave, 851 (56.2%) are family households, while 662 (43.8%) are nonfamily households. The most numerous type of family households are 2-person households, comprising 393, and the most common type of nonfamily households are 1-person households, comprising 572.
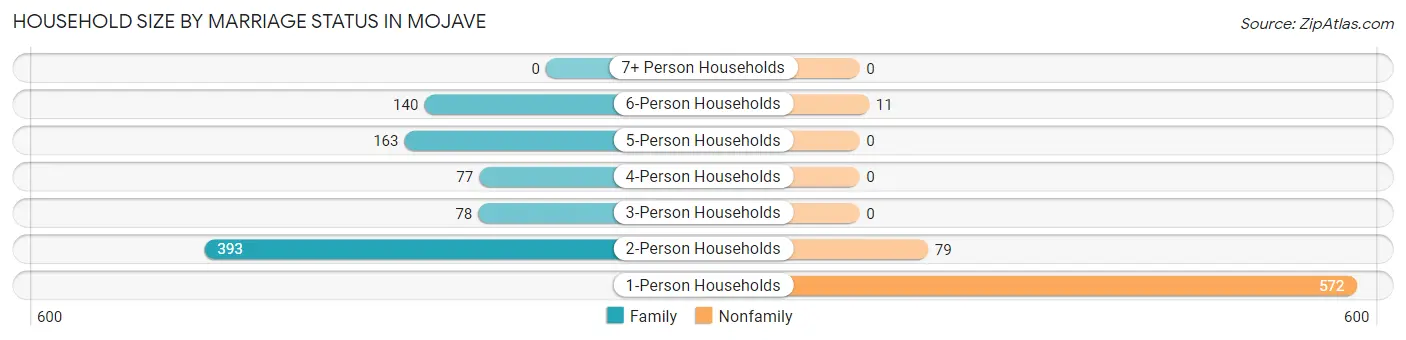
| Household Size | Family Households | Nonfamily Households |
| 1-Person Households | - | 572 (37.8%) |
| 2-Person Households | 393 (26.0%) | 79 (5.2%) |
| 3-Person Households | 78 (5.2%) | 0 (0.0%) |
| 4-Person Households | 77 (5.1%) | 0 (0.0%) |
| 5-Person Households | 163 (10.8%) | 0 (0.0%) |
| 6-Person Households | 140 (9.2%) | 11 (0.7%) |
| 7+ Person Households | 0 (0.0%) | 0 (0.0%) |
| Total | 851 (56.2%) | 662 (43.8%) |
Female Fertility in Mojave
Fertility by Age in Mojave
Average fertility rate in Mojave is 59.0 births per 1,000 women. Women in the age bracket of 35 to 50 years have the highest fertility rate with 104.0 births per 1,000 women. Women in the age bracket of 35 to 50 years acount for 73.9% of all women with births.
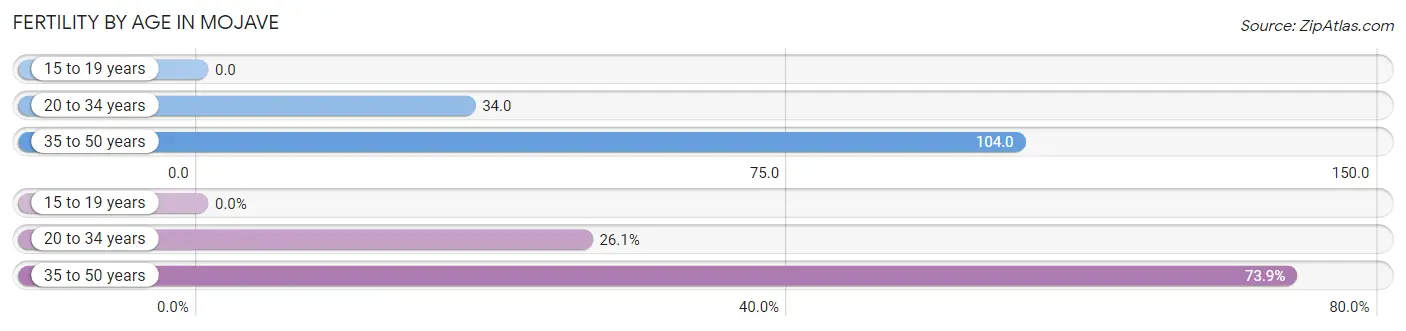
| Age Bracket | Women with Births | Births / 1,000 Women |
| 15 to 19 years | 0 (0.0%) | 0.0 |
| 20 to 34 years | 12 (26.1%) | 34.0 |
| 35 to 50 years | 34 (73.9%) | 104.0 |
| Total | 46 (100.0%) | 59.0 |
Fertility by Age by Marriage Status in Mojave
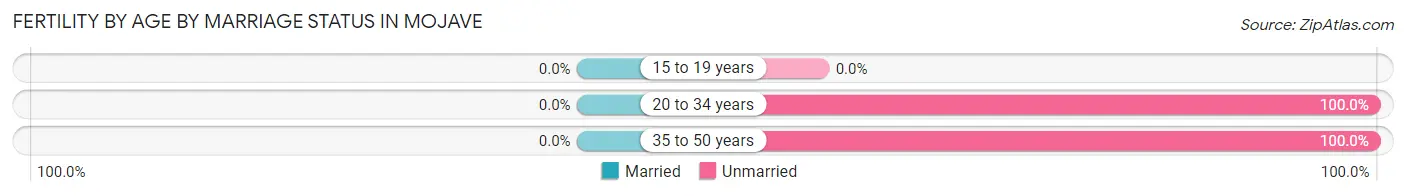
| Age Bracket | Married | Unmarried |
| 15 to 19 years | 0 (0.0%) | 0 (0.0%) |
| 20 to 34 years | 0 (0.0%) | 12 (100.0%) |
| 35 to 50 years | 0 (0.0%) | 34 (100.0%) |
| Total | 0 (0.0%) | 46 (100.0%) |
Fertility by Education in Mojave
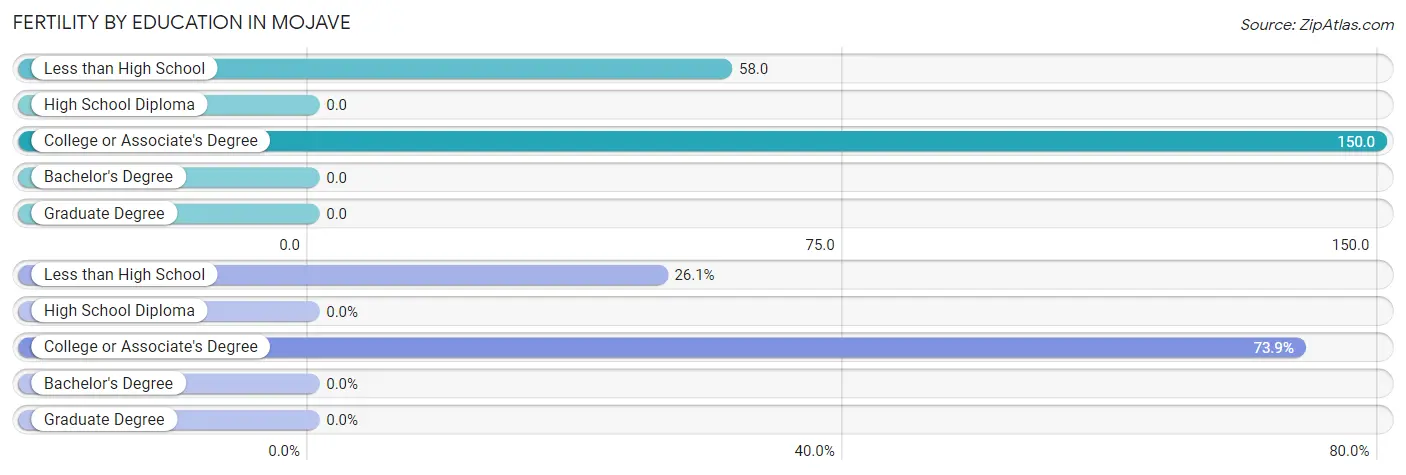
| Educational Attainment | Women with Births | Births / 1,000 Women |
| Less than High School | 12 (26.1%) | 58.0 |
| High School Diploma | 0 (0.0%) | 0.0 |
| College or Associate's Degree | 34 (73.9%) | 150.0 |
| Bachelor's Degree | 0 (0.0%) | 0.0 |
| Graduate Degree | 0 (0.0%) | 0.0 |
| Total | 46 (100.0%) | 59.0 |
Fertility by Education by Marriage Status in Mojave
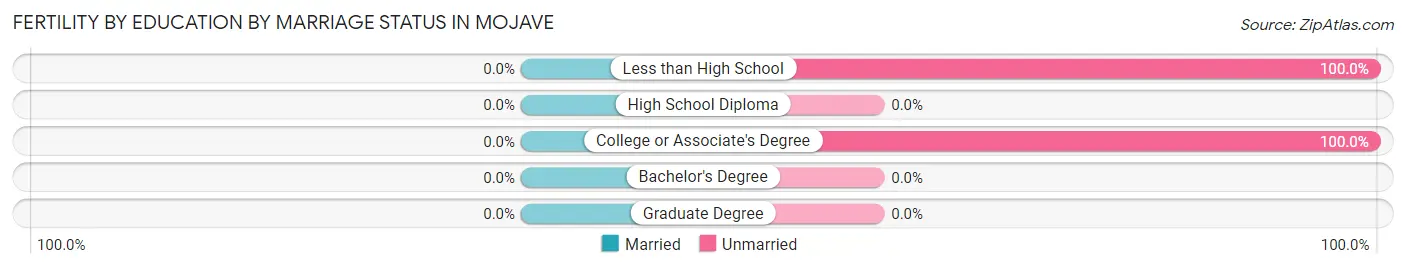
| Educational Attainment | Married | Unmarried |
| Less than High School | 0 (0.0%) | 12 (100.0%) |
| High School Diploma | 0 (0.0%) | 0 (0.0%) |
| College or Associate's Degree | 0 (0.0%) | 34 (100.0%) |
| Bachelor's Degree | 0 (0.0%) | 0 (0.0%) |
| Graduate Degree | 0 (0.0%) | 0 (0.0%) |
| Total | 0 (0.0%) | 46 (100.0%) |
Employment Characteristics in Mojave
Employment by Class of Employer in Mojave
Among the 1,377 employed individuals in Mojave, private company employees (1,081 | 78.5%), local government employees (73 | 5.3%), and self-employed (not incorporated) (68 | 4.9%) make up the most common classes of employment.
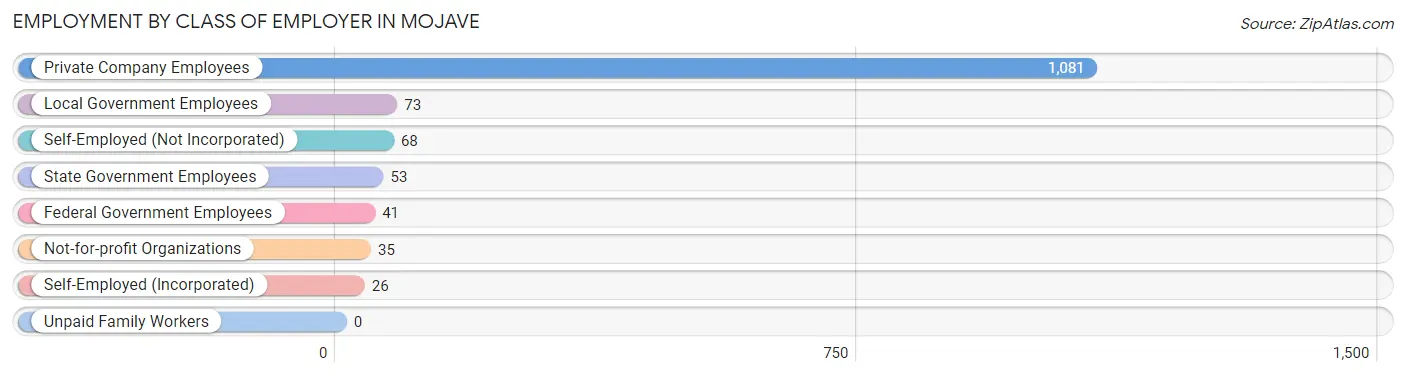
| Employer Class | # Employees | % Employees |
| Private Company Employees | 1,081 | 78.5% |
| Self-Employed (Incorporated) | 26 | 1.9% |
| Self-Employed (Not Incorporated) | 68 | 4.9% |
| Not-for-profit Organizations | 35 | 2.5% |
| Local Government Employees | 73 | 5.3% |
| State Government Employees | 53 | 3.8% |
| Federal Government Employees | 41 | 3.0% |
| Unpaid Family Workers | 0 | 0.0% |
| Total | 1,377 | 100.0% |
Employment Status by Age in Mojave
According to the labor force statistics for Mojave, out of the total population over 16 years of age (2,833), 55.0% or 1,558 individuals are in the labor force, with 7.8% or 122 of them unemployed. The age group with the highest labor force participation rate is 25 to 29 years, with 83.3% or 189 individuals in the labor force. Within the labor force, the 60 to 64 years age range has the highest percentage of unemployed individuals, with 20.5% or 15 of them being unemployed.
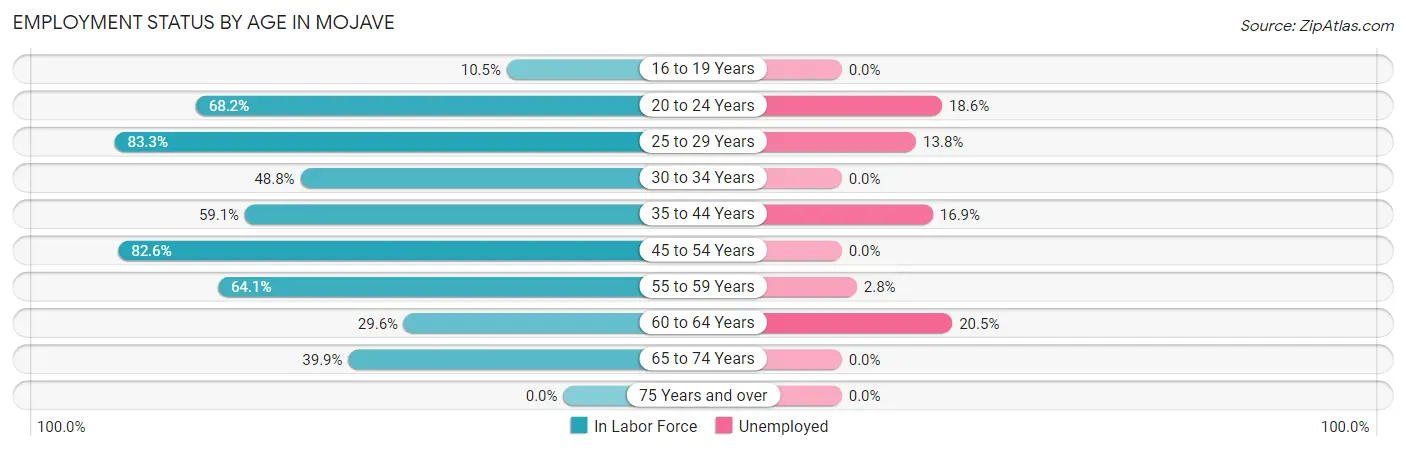
| Age Bracket | In Labor Force | Unemployed |
| 16 to 19 Years | 14 (10.5%) | 0 (0.0%) |
| 20 to 24 Years | 118 (68.2%) | 22 (18.6%) |
| 25 to 29 Years | 189 (83.3%) | 26 (13.8%) |
| 30 to 34 Years | 99 (48.8%) | 0 (0.0%) |
| 35 to 44 Years | 320 (59.1%) | 54 (16.9%) |
| 45 to 54 Years | 413 (82.6%) | 0 (0.0%) |
| 55 to 59 Years | 180 (64.1%) | 5 (2.8%) |
| 60 to 64 Years | 73 (29.6%) | 15 (20.5%) |
| 65 to 74 Years | 153 (39.9%) | 0 (0.0%) |
| 75 Years and over | 0 (0.0%) | 0 (0.0%) |
| Total | 1,558 (55.0%) | 122 (7.8%) |
Employment Status by Educational Attainment in Mojave
According to labor force statistics for Mojave, 63.7% of individuals (1,273) out of the total population between 25 and 64 years of age (1,999) are in the labor force, with 7.8% or 99 of them being unemployed. The group with the highest labor force participation rate are those with the educational attainment of high school diploma, with 75.8% or 522 individuals in the labor force. Within the labor force, individuals with bachelor's degree or higher education have the highest percentage of unemployment, with 23.8% or 15 of them being unemployed.
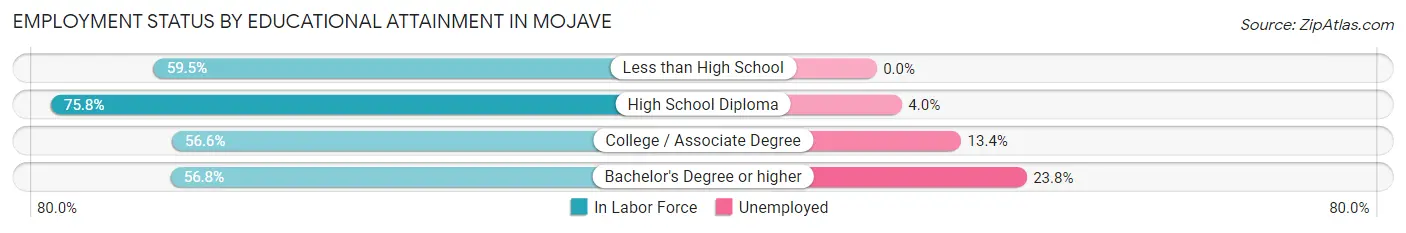
| Educational Attainment | In Labor Force | Unemployed |
| Less than High School | 210 (59.5%) | 0 (0.0%) |
| High School Diploma | 522 (75.8%) | 28 (4.0%) |
| College / Associate Degree | 479 (56.6%) | 113 (13.4%) |
| Bachelor's Degree or higher | 63 (56.8%) | 26 (23.8%) |
| Total | 1,273 (63.7%) | 156 (7.8%) |
Employment Occupations by Sex in Mojave
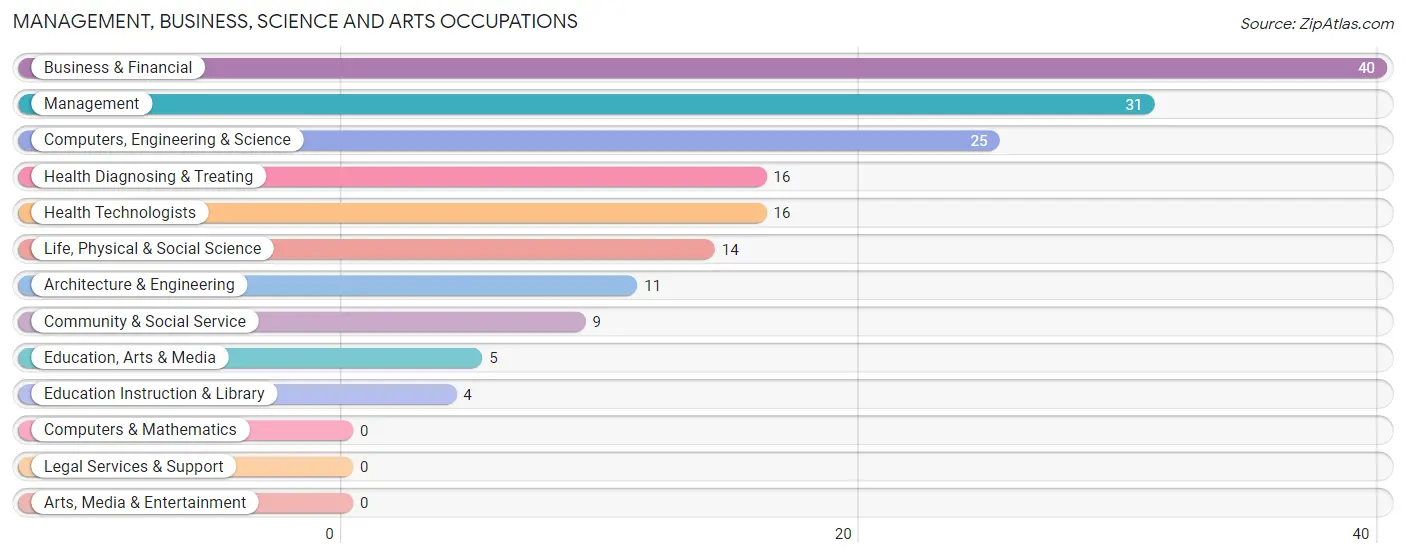
Management, Business, Science and Arts Occupations
The most common Management, Business, Science and Arts occupations in Mojave are Business & Financial (40 | 2.8%), Management (31 | 2.2%), Computers, Engineering & Science (25 | 1.7%), Health Diagnosing & Treating (16 | 1.1%), and Health Technologists (16 | 1.1%).
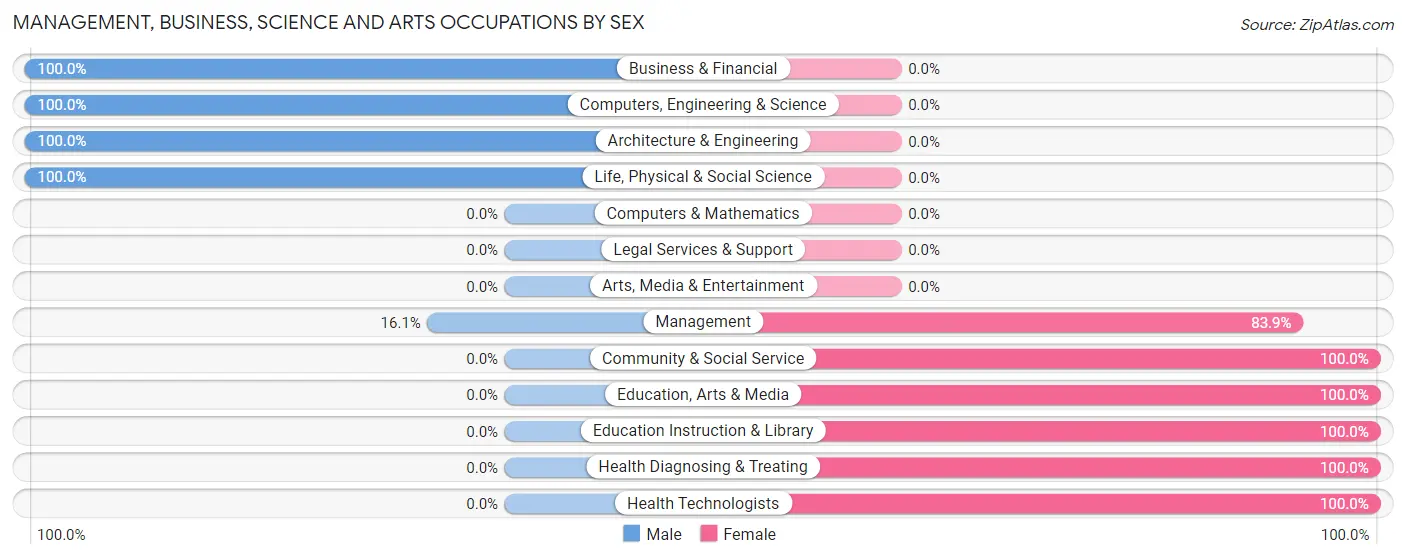
Management, Business, Science and Arts Occupations by Sex
Within the Management, Business, Science and Arts occupations in Mojave, the most male-oriented occupations are Business & Financial (100.0%), Computers, Engineering & Science (100.0%), and Architecture & Engineering (100.0%), while the most female-oriented occupations are Community & Social Service (100.0%), Education, Arts & Media (100.0%), and Education Instruction & Library (100.0%).
| Occupation | Male | Female |
| Management | 5 (16.1%) | 26 (83.9%) |
| Business & Financial | 40 (100.0%) | 0 (0.0%) |
| Computers, Engineering & Science | 25 (100.0%) | 0 (0.0%) |
| Computers & Mathematics | 0 (0.0%) | 0 (0.0%) |
| Architecture & Engineering | 11 (100.0%) | 0 (0.0%) |
| Life, Physical & Social Science | 14 (100.0%) | 0 (0.0%) |
| Community & Social Service | 0 (0.0%) | 9 (100.0%) |
| Education, Arts & Media | 0 (0.0%) | 5 (100.0%) |
| Legal Services & Support | 0 (0.0%) | 0 (0.0%) |
| Education Instruction & Library | 0 (0.0%) | 4 (100.0%) |
| Arts, Media & Entertainment | 0 (0.0%) | 0 (0.0%) |
| Health Diagnosing & Treating | 0 (0.0%) | 16 (100.0%) |
| Health Technologists | 0 (0.0%) | 16 (100.0%) |
| Total (Category) | 70 (57.9%) | 51 (42.1%) |
| Total (Overall) | 871 (60.6%) | 566 (39.4%) |
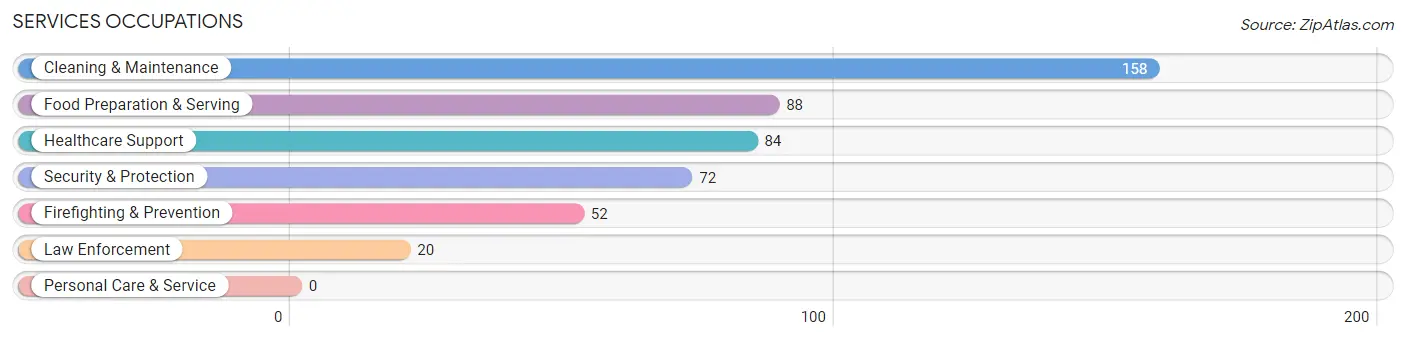
Services Occupations
The most common Services occupations in Mojave are Cleaning & Maintenance (158 | 11.0%), Food Preparation & Serving (88 | 6.1%), Healthcare Support (84 | 5.9%), Security & Protection (72 | 5.0%), and Firefighting & Prevention (52 | 3.6%).
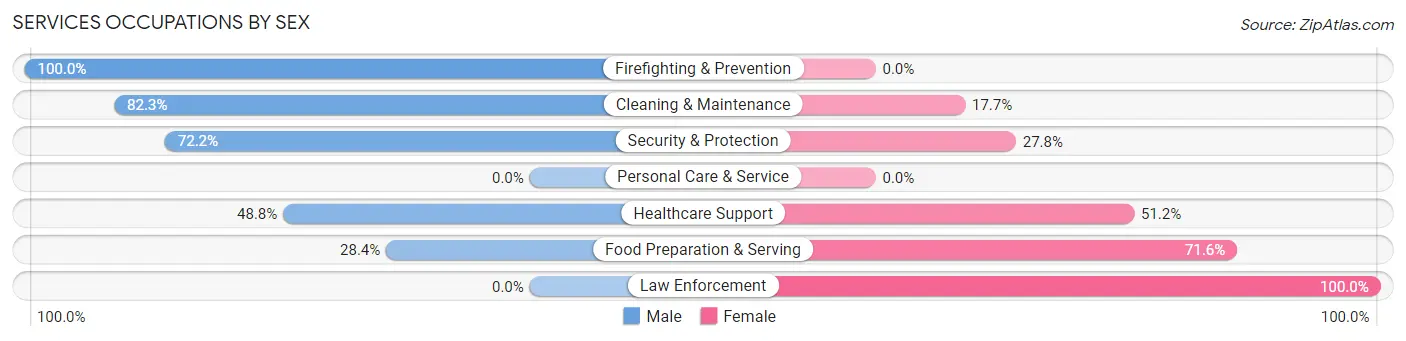
Services Occupations by Sex
Within the Services occupations in Mojave, the most male-oriented occupations are Firefighting & Prevention (100.0%), Cleaning & Maintenance (82.3%), and Security & Protection (72.2%), while the most female-oriented occupations are Law Enforcement (100.0%), Food Preparation & Serving (71.6%), and Healthcare Support (51.2%).
| Occupation | Male | Female |
| Healthcare Support | 41 (48.8%) | 43 (51.2%) |
| Security & Protection | 52 (72.2%) | 20 (27.8%) |
| Firefighting & Prevention | 52 (100.0%) | 0 (0.0%) |
| Law Enforcement | 0 (0.0%) | 20 (100.0%) |
| Food Preparation & Serving | 25 (28.4%) | 63 (71.6%) |
| Cleaning & Maintenance | 130 (82.3%) | 28 (17.7%) |
| Personal Care & Service | 0 (0.0%) | 0 (0.0%) |
| Total (Category) | 248 (61.7%) | 154 (38.3%) |
| Total (Overall) | 871 (60.6%) | 566 (39.4%) |
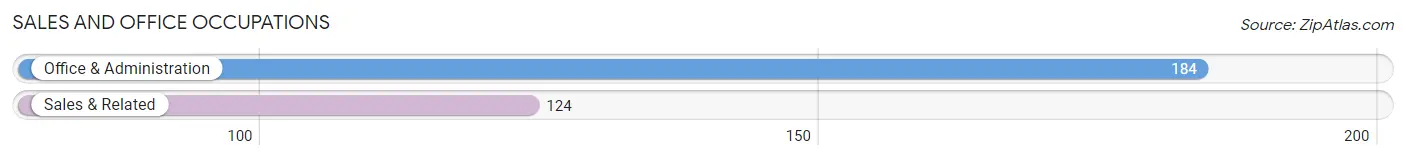
Sales and Office Occupations
The most common Sales and Office occupations in Mojave are Office & Administration (184 | 12.8%), and Sales & Related (124 | 8.6%).
Sales and Office Occupations by Sex
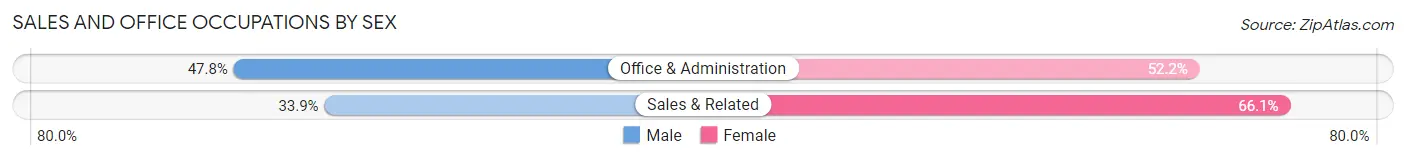
| Occupation | Male | Female |
| Sales & Related | 42 (33.9%) | 82 (66.1%) |
| Office & Administration | 88 (47.8%) | 96 (52.2%) |
| Total (Category) | 130 (42.2%) | 178 (57.8%) |
| Total (Overall) | 871 (60.6%) | 566 (39.4%) |
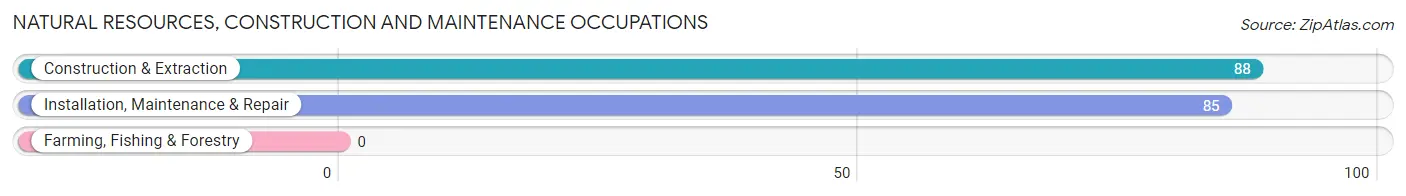
Natural Resources, Construction and Maintenance Occupations
The most common Natural Resources, Construction and Maintenance occupations in Mojave are Construction & Extraction (88 | 6.1%), and Installation, Maintenance & Repair (85 | 5.9%).
Natural Resources, Construction and Maintenance Occupations by Sex
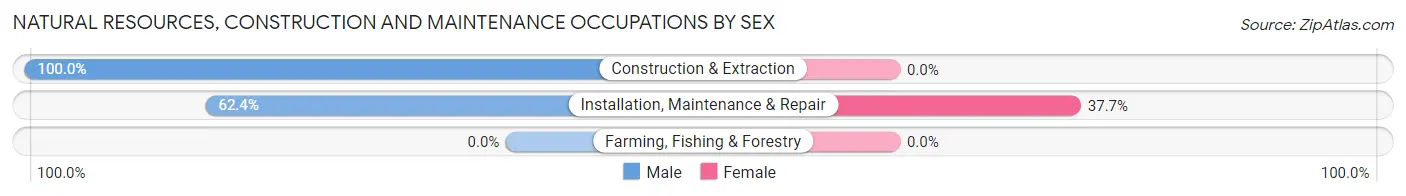
| Occupation | Male | Female |
| Farming, Fishing & Forestry | 0 (0.0%) | 0 (0.0%) |
| Construction & Extraction | 88 (100.0%) | 0 (0.0%) |
| Installation, Maintenance & Repair | 53 (62.4%) | 32 (37.7%) |
| Total (Category) | 141 (81.5%) | 32 (18.5%) |
| Total (Overall) | 871 (60.6%) | 566 (39.4%) |
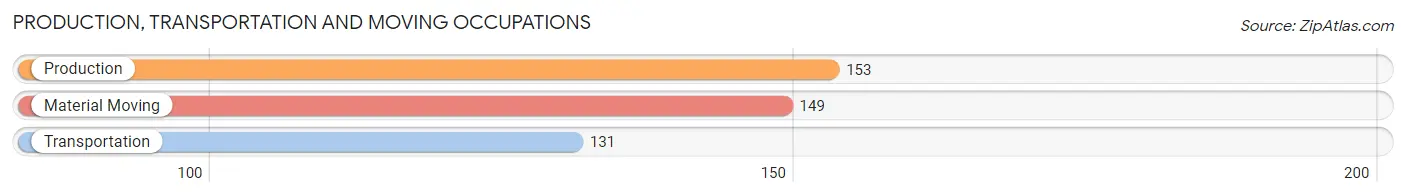
Production, Transportation and Moving Occupations
The most common Production, Transportation and Moving occupations in Mojave are Production (153 | 10.6%), Material Moving (149 | 10.4%), and Transportation (131 | 9.1%).
Production, Transportation and Moving Occupations by Sex
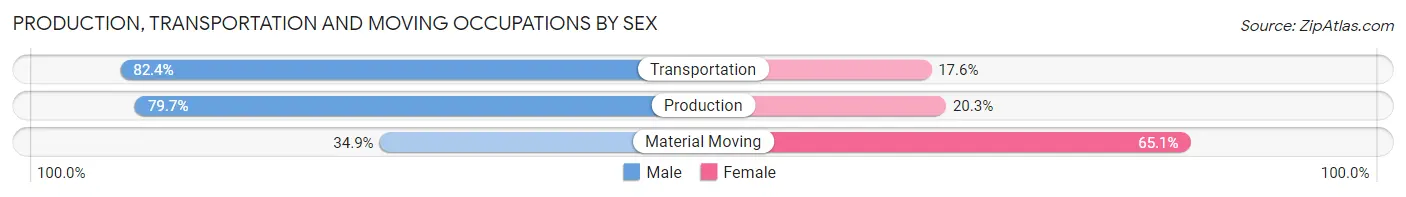
| Occupation | Male | Female |
| Production | 122 (79.7%) | 31 (20.3%) |
| Transportation | 108 (82.4%) | 23 (17.6%) |
| Material Moving | 52 (34.9%) | 97 (65.1%) |
| Total (Category) | 282 (65.1%) | 151 (34.9%) |
| Total (Overall) | 871 (60.6%) | 566 (39.4%) |
Employment Industries by Sex in Mojave
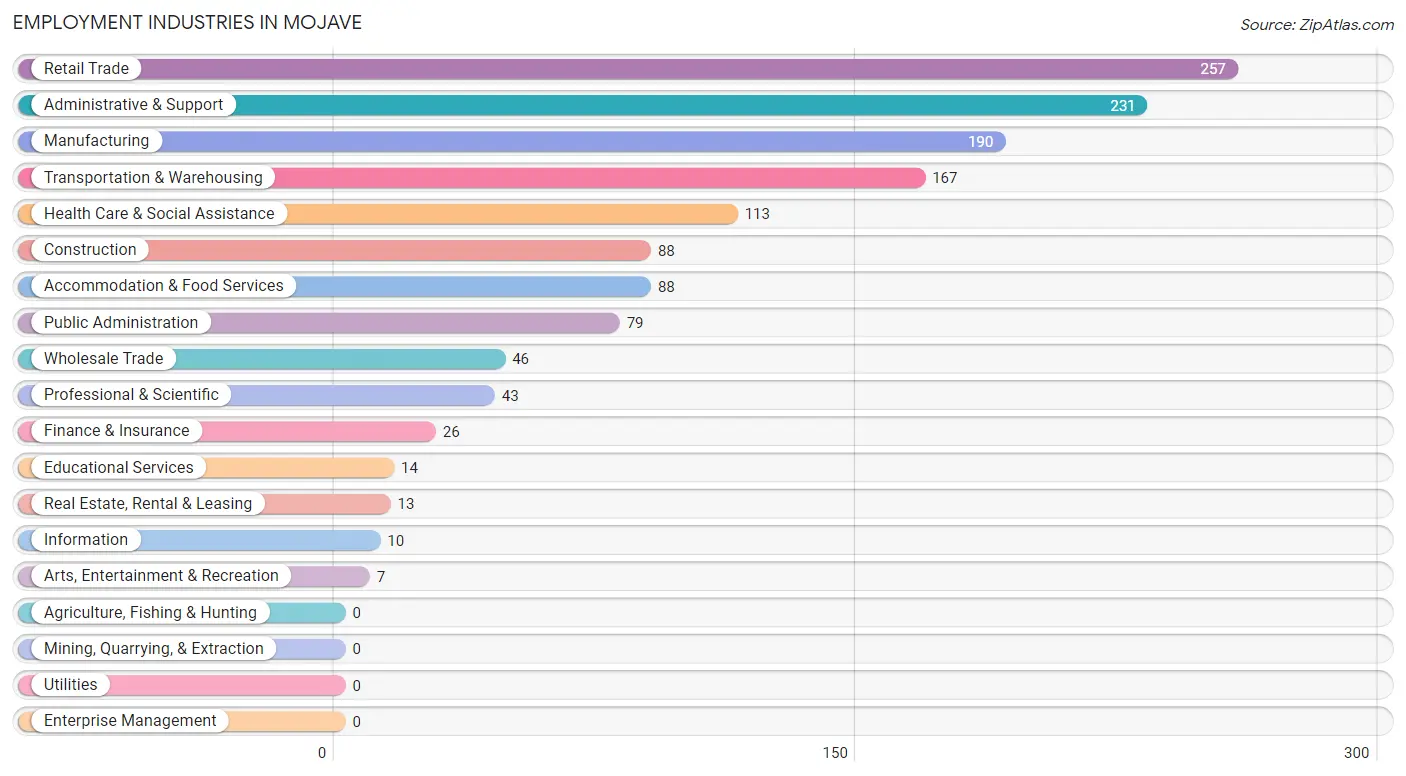
Employment Industries in Mojave
The major employment industries in Mojave include Retail Trade (257 | 17.9%), Administrative & Support (231 | 16.1%), Manufacturing (190 | 13.2%), Transportation & Warehousing (167 | 11.6%), and Health Care & Social Assistance (113 | 7.9%).
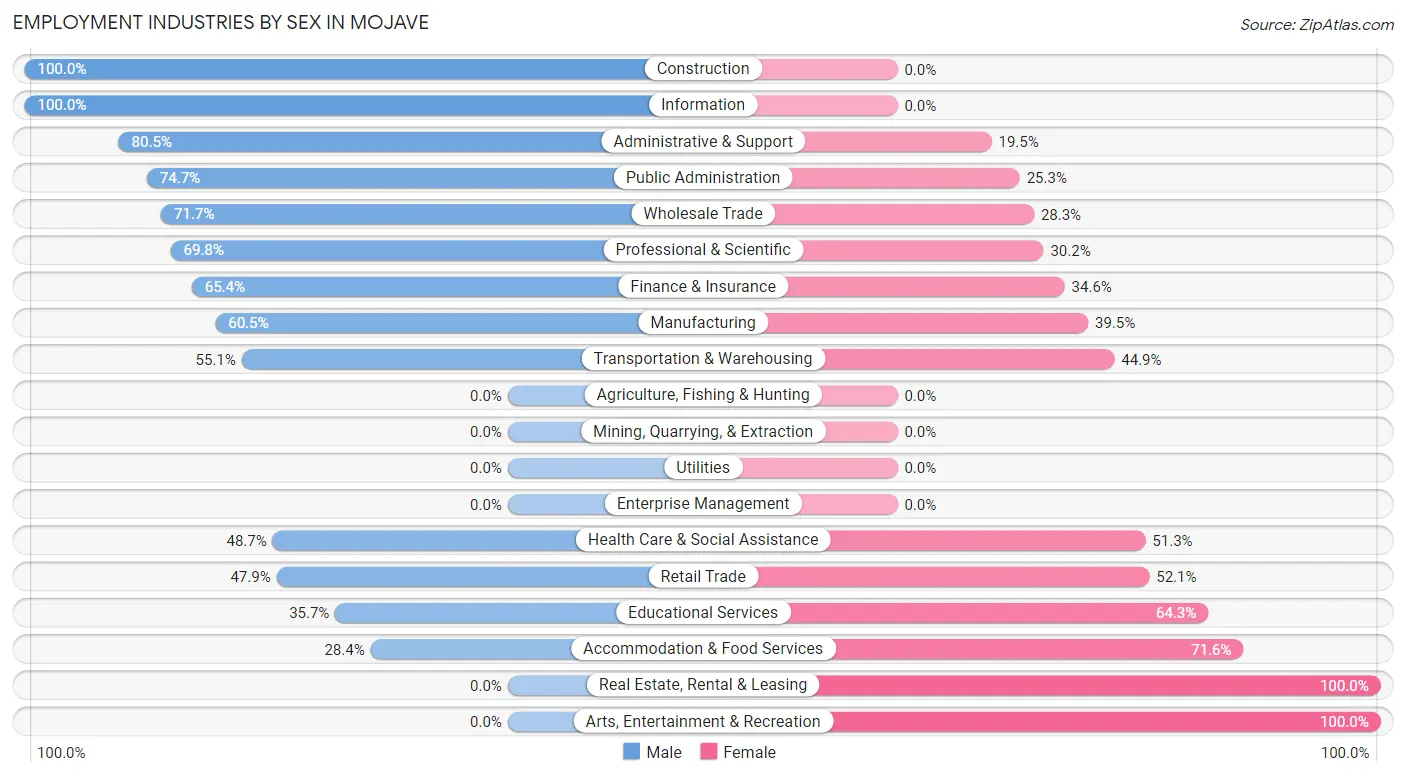
Employment Industries by Sex in Mojave
The Mojave industries that see more men than women are Construction (100.0%), Information (100.0%), and Administrative & Support (80.5%), whereas the industries that tend to have a higher number of women are Real Estate, Rental & Leasing (100.0%), Arts, Entertainment & Recreation (100.0%), and Accommodation & Food Services (71.6%).
| Industry | Male | Female |
| Agriculture, Fishing & Hunting | 0 (0.0%) | 0 (0.0%) |
| Mining, Quarrying, & Extraction | 0 (0.0%) | 0 (0.0%) |
| Construction | 88 (100.0%) | 0 (0.0%) |
| Manufacturing | 115 (60.5%) | 75 (39.5%) |
| Wholesale Trade | 33 (71.7%) | 13 (28.3%) |
| Retail Trade | 123 (47.9%) | 134 (52.1%) |
| Transportation & Warehousing | 92 (55.1%) | 75 (44.9%) |
| Utilities | 0 (0.0%) | 0 (0.0%) |
| Information | 10 (100.0%) | 0 (0.0%) |
| Finance & Insurance | 17 (65.4%) | 9 (34.6%) |
| Real Estate, Rental & Leasing | 0 (0.0%) | 13 (100.0%) |
| Professional & Scientific | 30 (69.8%) | 13 (30.2%) |
| Enterprise Management | 0 (0.0%) | 0 (0.0%) |
| Administrative & Support | 186 (80.5%) | 45 (19.5%) |
| Educational Services | 5 (35.7%) | 9 (64.3%) |
| Health Care & Social Assistance | 55 (48.7%) | 58 (51.3%) |
| Arts, Entertainment & Recreation | 0 (0.0%) | 7 (100.0%) |
| Accommodation & Food Services | 25 (28.4%) | 63 (71.6%) |
| Public Administration | 59 (74.7%) | 20 (25.3%) |
| Total | 871 (60.6%) | 566 (39.4%) |
Education in Mojave
School Enrollment in Mojave
The most common levels of schooling among the 957 students in Mojave are elementary school (372 | 38.9%), middle school (248 | 25.9%), and high school (227 | 23.7%).
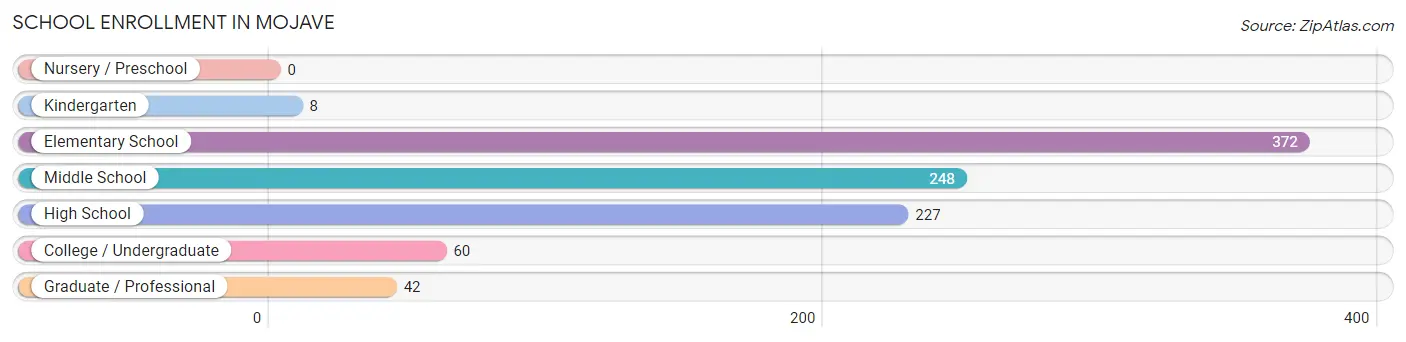
| School Level | # Students | % Students |
| Nursery / Preschool | 0 | 0.0% |
| Kindergarten | 8 | 0.8% |
| Elementary School | 372 | 38.9% |
| Middle School | 248 | 25.9% |
| High School | 227 | 23.7% |
| College / Undergraduate | 60 | 6.3% |
| Graduate / Professional | 42 | 4.4% |
| Total | 957 | 100.0% |
School Enrollment by Age by Funding Source in Mojave
Out of a total of 957 students who are enrolled in schools in Mojave, 110 (11.5%) attend a private institution, while the remaining 847 (88.5%) are enrolled in public schools. The age group of 25 to 34 year olds has the highest likelihood of being enrolled in private schools, with 26 (68.4% in the age bracket) enrolled. Conversely, the age group of 18 to 19 year olds has the lowest likelihood of being enrolled in a private school, with 33 (100.0% in the age bracket) attending a public institution.
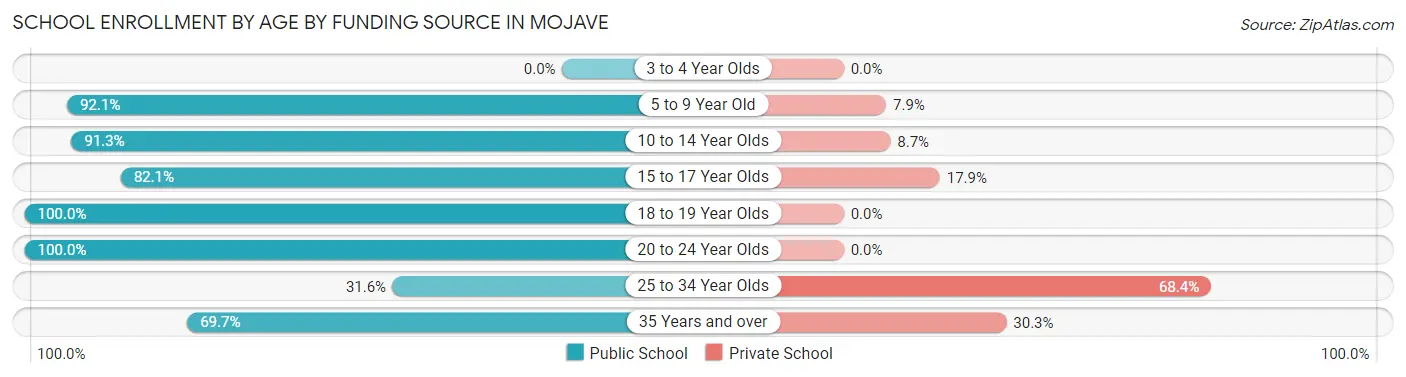
| Age Bracket | Public School | Private School |
| 3 to 4 Year Olds | 0 (0.0%) | 0 (0.0%) |
| 5 to 9 Year Old | 303 (92.1%) | 26 (7.9%) |
| 10 to 14 Year Olds | 378 (91.3%) | 36 (8.7%) |
| 15 to 17 Year Olds | 55 (82.1%) | 12 (17.9%) |
| 18 to 19 Year Olds | 33 (100.0%) | 0 (0.0%) |
| 20 to 24 Year Olds | 43 (100.0%) | 0 (0.0%) |
| 25 to 34 Year Olds | 12 (31.6%) | 26 (68.4%) |
| 35 Years and over | 23 (69.7%) | 10 (30.3%) |
| Total | 847 (88.5%) | 110 (11.5%) |
Educational Attainment by Field of Study in Mojave
Liberal arts & history (37 | 28.2%), bio, nature & agricultural (24 | 18.3%), social sciences (16 | 12.2%), psychology (15 | 11.5%), and communications (13 | 9.9%) are the most common fields of study among 131 individuals in Mojave who have obtained a bachelor's degree or higher.
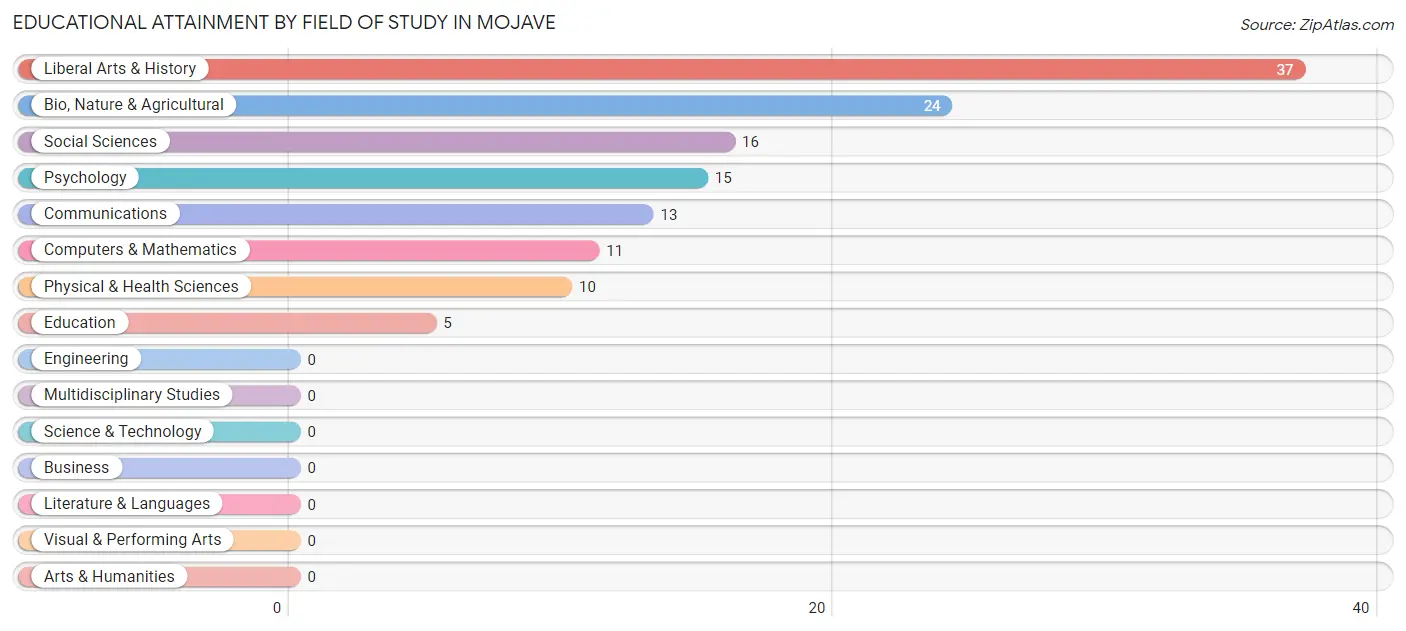
| Field of Study | # Graduates | % Graduates |
| Computers & Mathematics | 11 | 8.4% |
| Bio, Nature & Agricultural | 24 | 18.3% |
| Physical & Health Sciences | 10 | 7.6% |
| Psychology | 15 | 11.5% |
| Social Sciences | 16 | 12.2% |
| Engineering | 0 | 0.0% |
| Multidisciplinary Studies | 0 | 0.0% |
| Science & Technology | 0 | 0.0% |
| Business | 0 | 0.0% |
| Education | 5 | 3.8% |
| Literature & Languages | 0 | 0.0% |
| Liberal Arts & History | 37 | 28.2% |
| Visual & Performing Arts | 0 | 0.0% |
| Communications | 13 | 9.9% |
| Arts & Humanities | 0 | 0.0% |
| Total | 131 | 100.0% |
Transportation & Commute in Mojave
Vehicle Availability by Sex in Mojave
The most prevalent vehicle ownership categories in Mojave are males with 1 vehicle (213, accounting for 26.1%) and females with 1 vehicle (246, making up 38.0%).
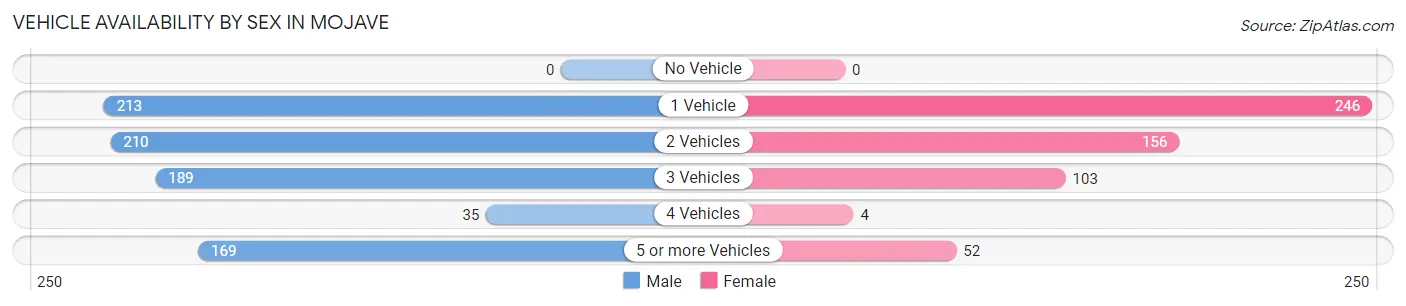
| Vehicles Available | Male | Female |
| No Vehicle | 0 (0.0%) | 0 (0.0%) |
| 1 Vehicle | 213 (26.1%) | 246 (43.9%) |
| 2 Vehicles | 210 (25.7%) | 156 (27.8%) |
| 3 Vehicles | 189 (23.2%) | 103 (18.4%) |
| 4 Vehicles | 35 (4.3%) | 4 (0.7%) |
| 5 or more Vehicles | 169 (20.7%) | 52 (9.3%) |
| Total | 816 (100.0%) | 561 (100.0%) |
Commute Time in Mojave
The most frequently occuring commute durations in Mojave are 5 to 9 minutes (272 commuters, 21.8%), 30 to 34 minutes (269 commuters, 21.5%), and 25 to 29 minutes (185 commuters, 14.8%).
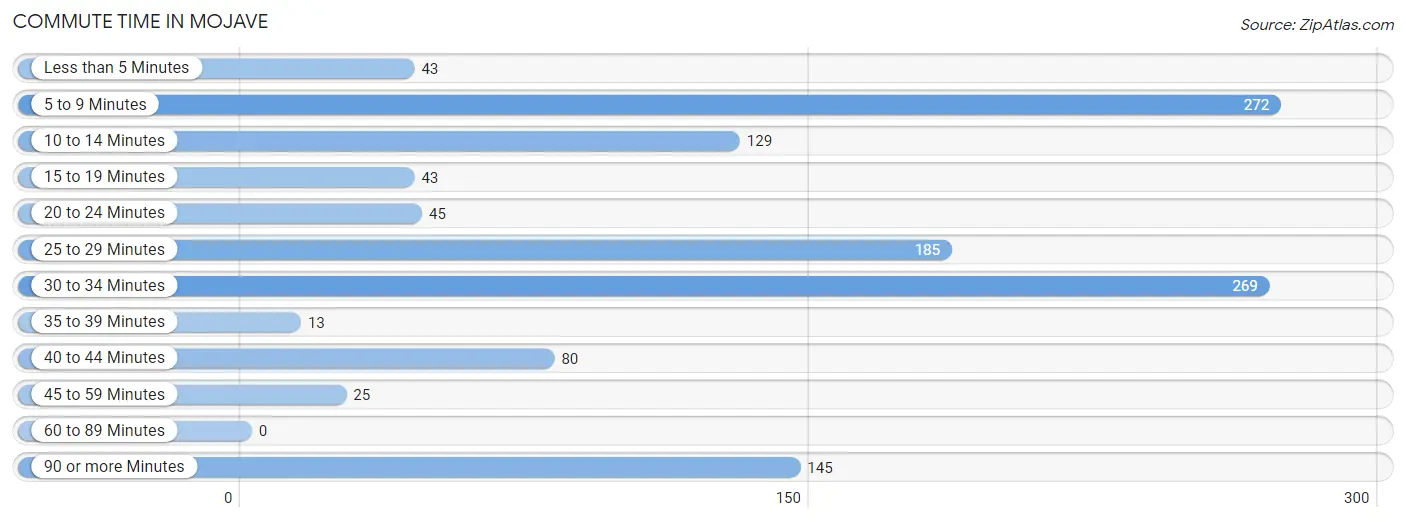
| Commute Time | # Commuters | % Commuters |
| Less than 5 Minutes | 43 | 3.4% |
| 5 to 9 Minutes | 272 | 21.8% |
| 10 to 14 Minutes | 129 | 10.3% |
| 15 to 19 Minutes | 43 | 3.4% |
| 20 to 24 Minutes | 45 | 3.6% |
| 25 to 29 Minutes | 185 | 14.8% |
| 30 to 34 Minutes | 269 | 21.5% |
| 35 to 39 Minutes | 13 | 1.0% |
| 40 to 44 Minutes | 80 | 6.4% |
| 45 to 59 Minutes | 25 | 2.0% |
| 60 to 89 Minutes | 0 | 0.0% |
| 90 or more Minutes | 145 | 11.6% |
Commute Time by Sex in Mojave
The most common commute times in Mojave are 5 to 9 minutes (172 commuters, 24.1%) for males and 90 or more minutes (117 commuters, 21.8%) for females.
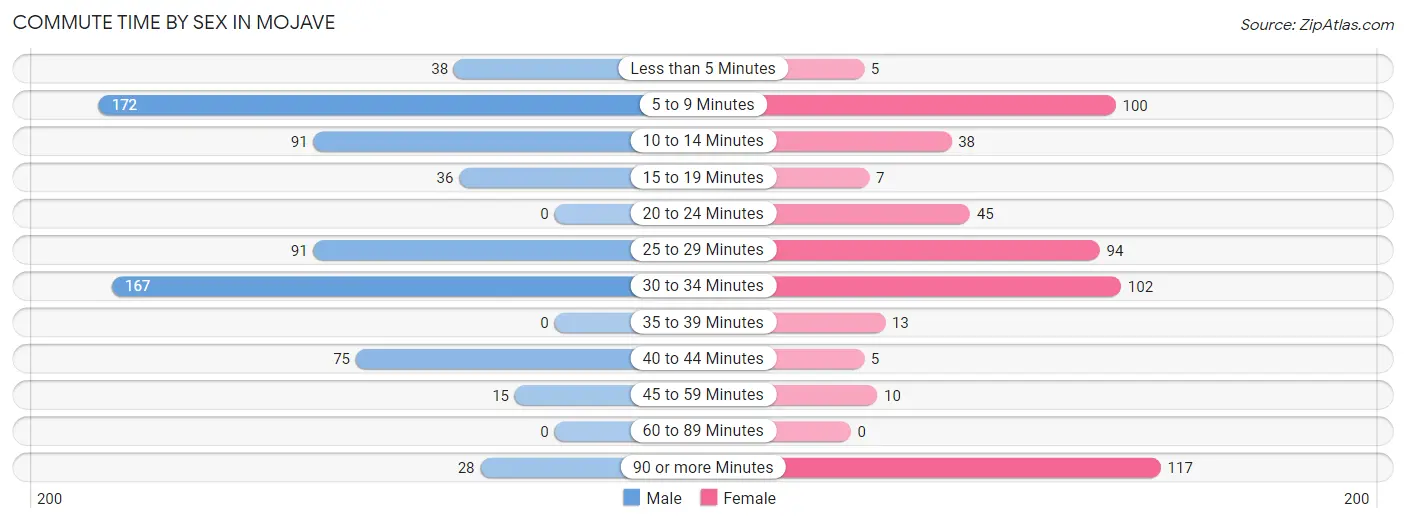
| Commute Time | Male | Female |
| Less than 5 Minutes | 38 (5.3%) | 5 (0.9%) |
| 5 to 9 Minutes | 172 (24.1%) | 100 (18.7%) |
| 10 to 14 Minutes | 91 (12.8%) | 38 (7.1%) |
| 15 to 19 Minutes | 36 (5.1%) | 7 (1.3%) |
| 20 to 24 Minutes | 0 (0.0%) | 45 (8.4%) |
| 25 to 29 Minutes | 91 (12.8%) | 94 (17.5%) |
| 30 to 34 Minutes | 167 (23.4%) | 102 (19.0%) |
| 35 to 39 Minutes | 0 (0.0%) | 13 (2.4%) |
| 40 to 44 Minutes | 75 (10.5%) | 5 (0.9%) |
| 45 to 59 Minutes | 15 (2.1%) | 10 (1.9%) |
| 60 to 89 Minutes | 0 (0.0%) | 0 (0.0%) |
| 90 or more Minutes | 28 (3.9%) | 117 (21.8%) |
Time of Departure to Work by Sex in Mojave
The most frequent times of departure to work in Mojave are 5:00 AM to 5:29 AM (174, 24.4%) for males and 12:00 AM to 4:59 AM (173, 32.3%) for females.
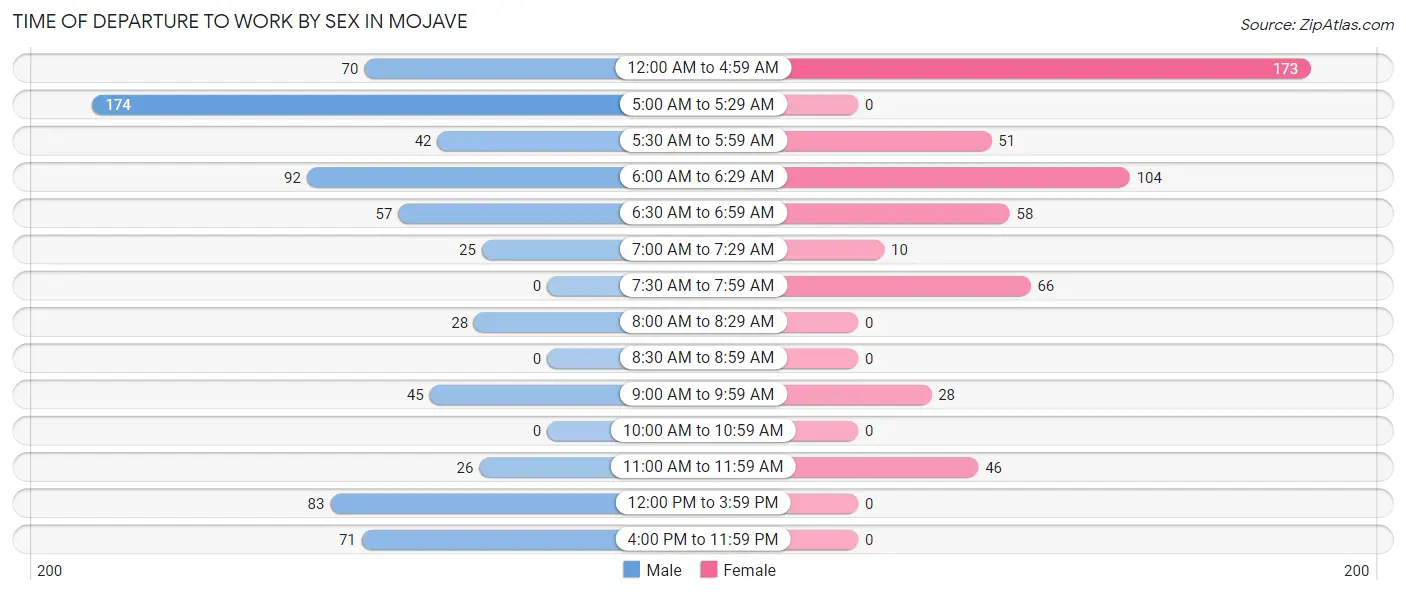
| Time of Departure | Male | Female |
| 12:00 AM to 4:59 AM | 70 (9.8%) | 173 (32.3%) |
| 5:00 AM to 5:29 AM | 174 (24.4%) | 0 (0.0%) |
| 5:30 AM to 5:59 AM | 42 (5.9%) | 51 (9.5%) |
| 6:00 AM to 6:29 AM | 92 (12.9%) | 104 (19.4%) |
| 6:30 AM to 6:59 AM | 57 (8.0%) | 58 (10.8%) |
| 7:00 AM to 7:29 AM | 25 (3.5%) | 10 (1.9%) |
| 7:30 AM to 7:59 AM | 0 (0.0%) | 66 (12.3%) |
| 8:00 AM to 8:29 AM | 28 (3.9%) | 0 (0.0%) |
| 8:30 AM to 8:59 AM | 0 (0.0%) | 0 (0.0%) |
| 9:00 AM to 9:59 AM | 45 (6.3%) | 28 (5.2%) |
| 10:00 AM to 10:59 AM | 0 (0.0%) | 0 (0.0%) |
| 11:00 AM to 11:59 AM | 26 (3.6%) | 46 (8.6%) |
| 12:00 PM to 3:59 PM | 83 (11.6%) | 0 (0.0%) |
| 4:00 PM to 11:59 PM | 71 (10.0%) | 0 (0.0%) |
| Total | 713 (100.0%) | 536 (100.0%) |
Housing Occupancy in Mojave
Occupancy by Ownership in Mojave
Of the total 1,513 dwellings in Mojave, owner-occupied units account for 603 (39.9%), while renter-occupied units make up 910 (60.2%).
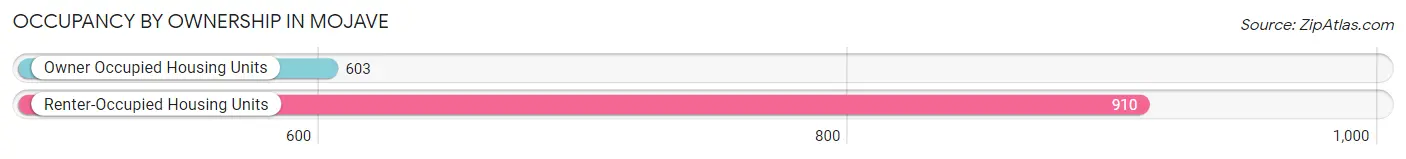
| Occupancy | # Housing Units | % Housing Units |
| Owner Occupied Housing Units | 603 | 39.9% |
| Renter-Occupied Housing Units | 910 | 60.2% |
| Total Occupied Housing Units | 1,513 | 100.0% |
Occupancy by Household Size in Mojave
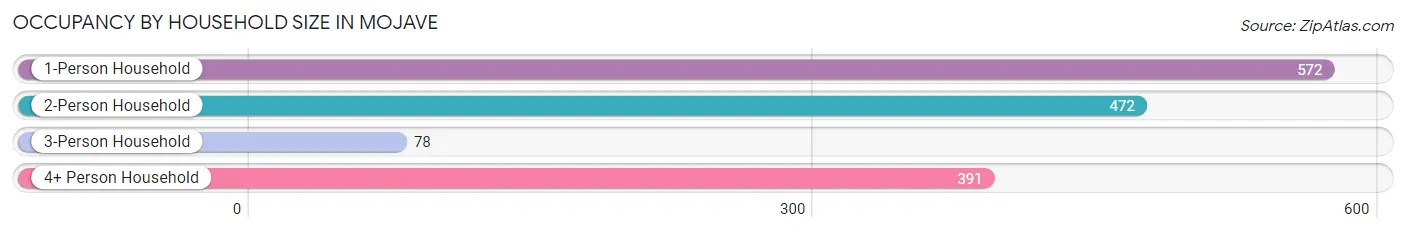
| Household Size | # Housing Units | % Housing Units |
| 1-Person Household | 572 | 37.8% |
| 2-Person Household | 472 | 31.2% |
| 3-Person Household | 78 | 5.2% |
| 4+ Person Household | 391 | 25.8% |
| Total Housing Units | 1,513 | 100.0% |
Occupancy by Ownership by Household Size in Mojave
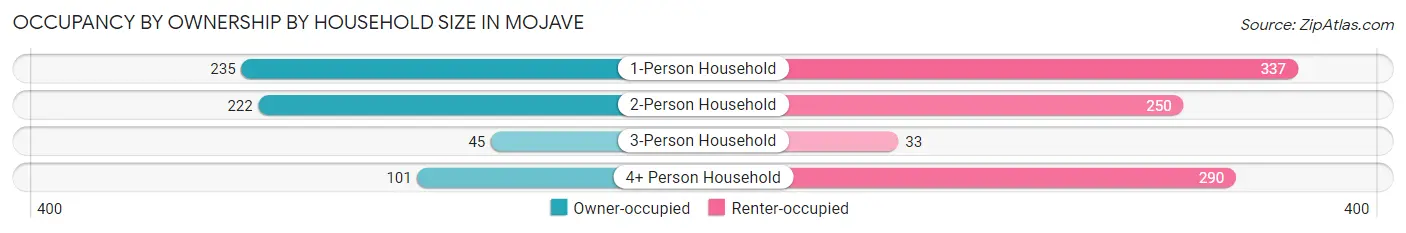
| Household Size | Owner-occupied | Renter-occupied |
| 1-Person Household | 235 (41.1%) | 337 (58.9%) |
| 2-Person Household | 222 (47.0%) | 250 (53.0%) |
| 3-Person Household | 45 (57.7%) | 33 (42.3%) |
| 4+ Person Household | 101 (25.8%) | 290 (74.2%) |
| Total Housing Units | 603 (39.9%) | 910 (60.2%) |
Occupancy by Educational Attainment in Mojave
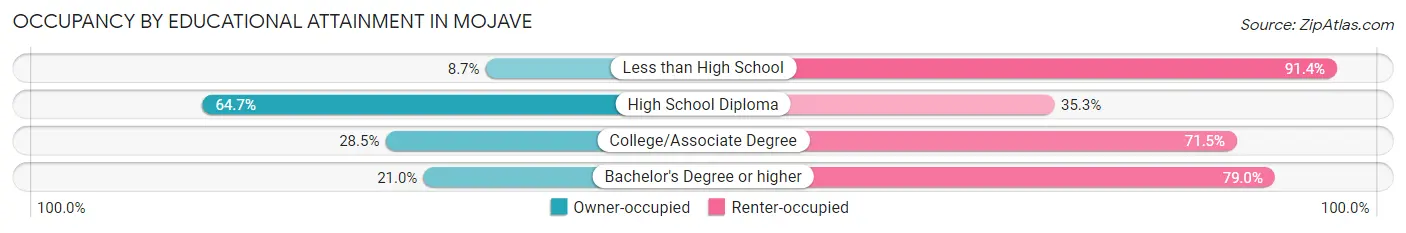
| Household Size | Owner-occupied | Renter-occupied |
| Less than High School | 18 (8.6%) | 190 (91.3%) |
| High School Diploma | 389 (64.7%) | 212 (35.3%) |
| College/Associate Degree | 183 (28.5%) | 459 (71.5%) |
| Bachelor's Degree or higher | 13 (21.0%) | 49 (79.0%) |
Occupancy by Age of Householder in Mojave
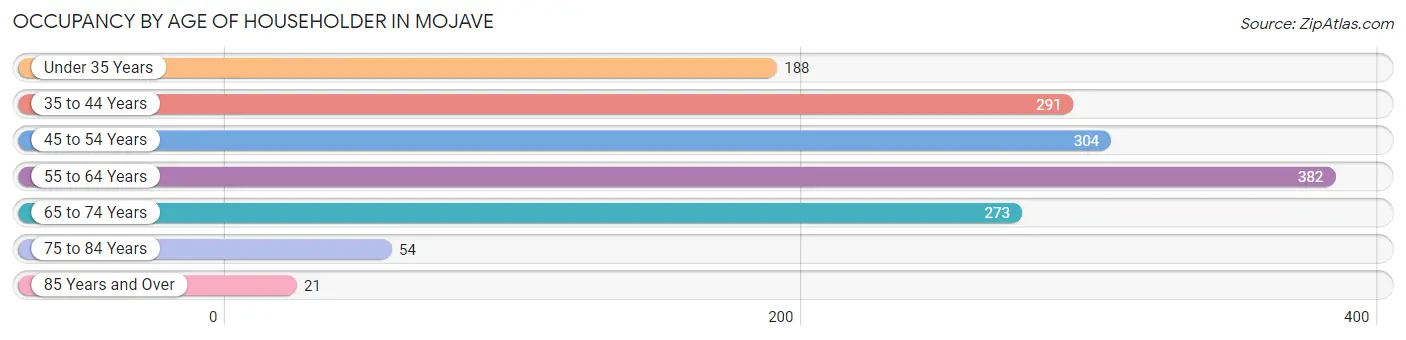
| Age Bracket | # Households | % Households |
| Under 35 Years | 188 | 12.4% |
| 35 to 44 Years | 291 | 19.2% |
| 45 to 54 Years | 304 | 20.1% |
| 55 to 64 Years | 382 | 25.3% |
| 65 to 74 Years | 273 | 18.0% |
| 75 to 84 Years | 54 | 3.6% |
| 85 Years and Over | 21 | 1.4% |
| Total | 1,513 | 100.0% |
Housing Finances in Mojave
Median Income by Occupancy in Mojave
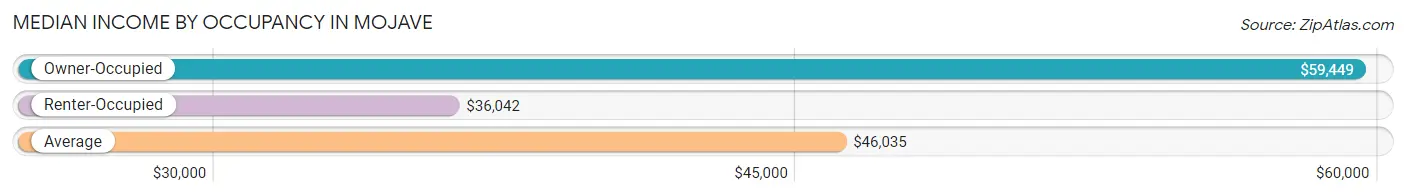
| Occupancy Type | # Households | Median Income |
| Owner-Occupied | 603 (39.9%) | $59,449 |
| Renter-Occupied | 910 (60.2%) | $36,042 |
| Average | 1,513 (100.0%) | $46,035 |
Occupancy by Householder Income Bracket in Mojave
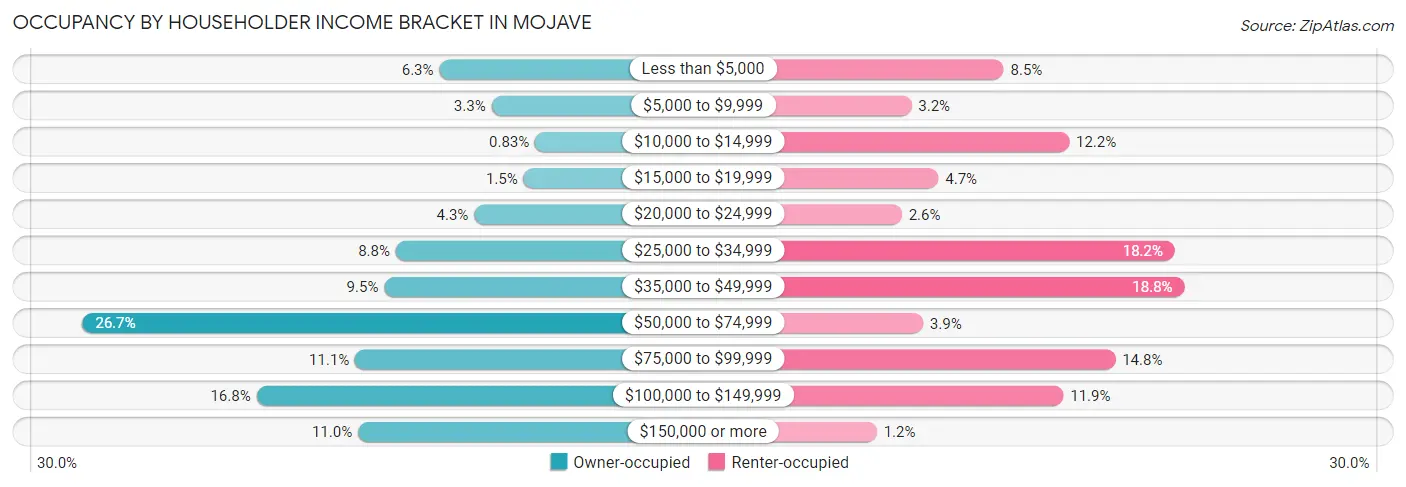
| Income Bracket | Owner-occupied | Renter-occupied |
| Less than $5,000 | 38 (6.3%) | 77 (8.5%) |
| $5,000 to $9,999 | 20 (3.3%) | 29 (3.2%) |
| $10,000 to $14,999 | 5 (0.8%) | 111 (12.2%) |
| $15,000 to $19,999 | 9 (1.5%) | 43 (4.7%) |
| $20,000 to $24,999 | 26 (4.3%) | 24 (2.6%) |
| $25,000 to $34,999 | 53 (8.8%) | 166 (18.2%) |
| $35,000 to $49,999 | 57 (9.5%) | 171 (18.8%) |
| $50,000 to $74,999 | 161 (26.7%) | 35 (3.8%) |
| $75,000 to $99,999 | 67 (11.1%) | 135 (14.8%) |
| $100,000 to $149,999 | 101 (16.8%) | 108 (11.9%) |
| $150,000 or more | 66 (11.0%) | 11 (1.2%) |
| Total | 603 (100.0%) | 910 (100.0%) |
Monthly Housing Cost Tiers in Mojave
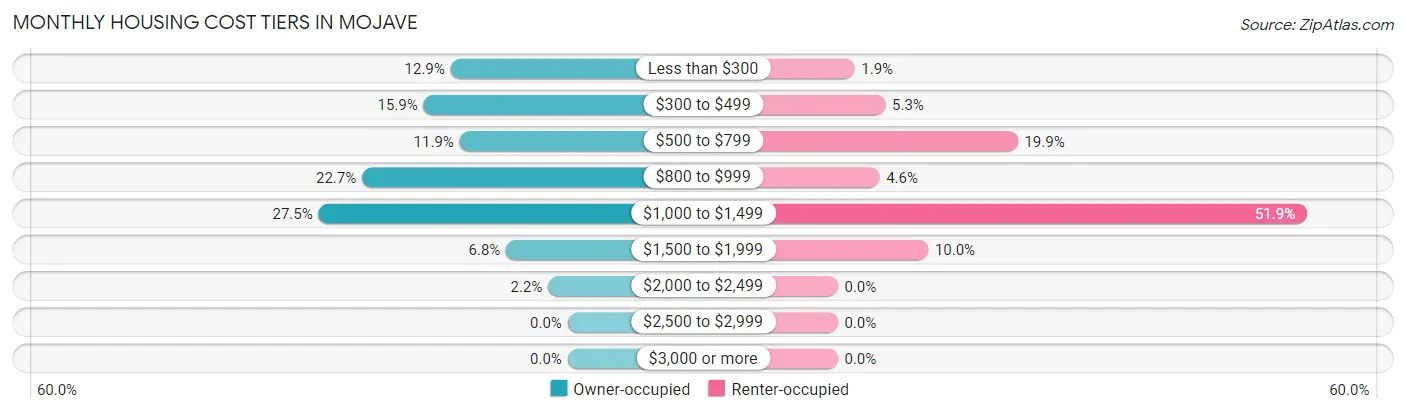
| Monthly Cost | Owner-occupied | Renter-occupied |
| Less than $300 | 78 (12.9%) | 17 (1.9%) |
| $300 to $499 | 96 (15.9%) | 48 (5.3%) |
| $500 to $799 | 72 (11.9%) | 181 (19.9%) |
| $800 to $999 | 137 (22.7%) | 42 (4.6%) |
| $1,000 to $1,499 | 166 (27.5%) | 472 (51.9%) |
| $1,500 to $1,999 | 41 (6.8%) | 91 (10.0%) |
| $2,000 to $2,499 | 13 (2.2%) | 0 (0.0%) |
| $2,500 to $2,999 | 0 (0.0%) | 0 (0.0%) |
| $3,000 or more | 0 (0.0%) | 0 (0.0%) |
| Total | 603 (100.0%) | 910 (100.0%) |
Physical Housing Characteristics in Mojave
Housing Structures in Mojave
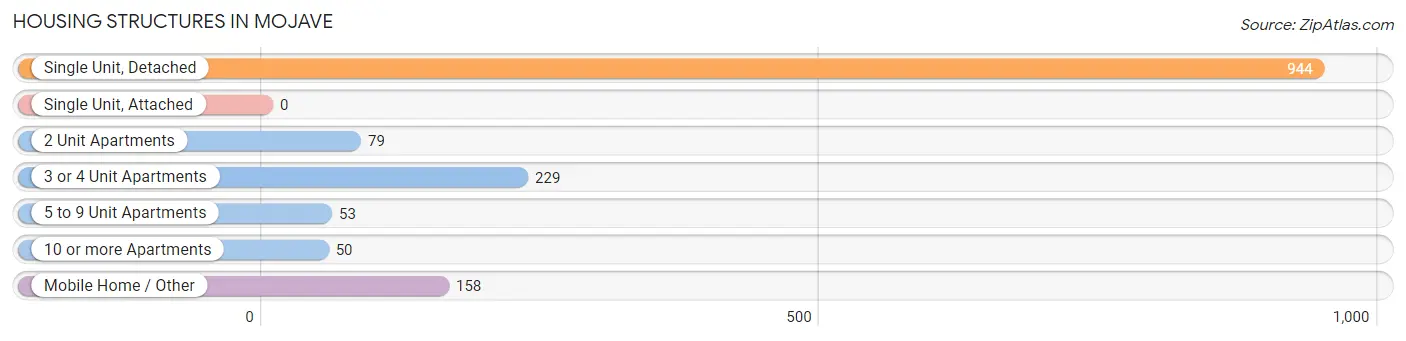
| Structure Type | # Housing Units | % Housing Units |
| Single Unit, Detached | 944 | 62.4% |
| Single Unit, Attached | 0 | 0.0% |
| 2 Unit Apartments | 79 | 5.2% |
| 3 or 4 Unit Apartments | 229 | 15.1% |
| 5 to 9 Unit Apartments | 53 | 3.5% |
| 10 or more Apartments | 50 | 3.3% |
| Mobile Home / Other | 158 | 10.4% |
| Total | 1,513 | 100.0% |
Housing Structures by Occupancy in Mojave
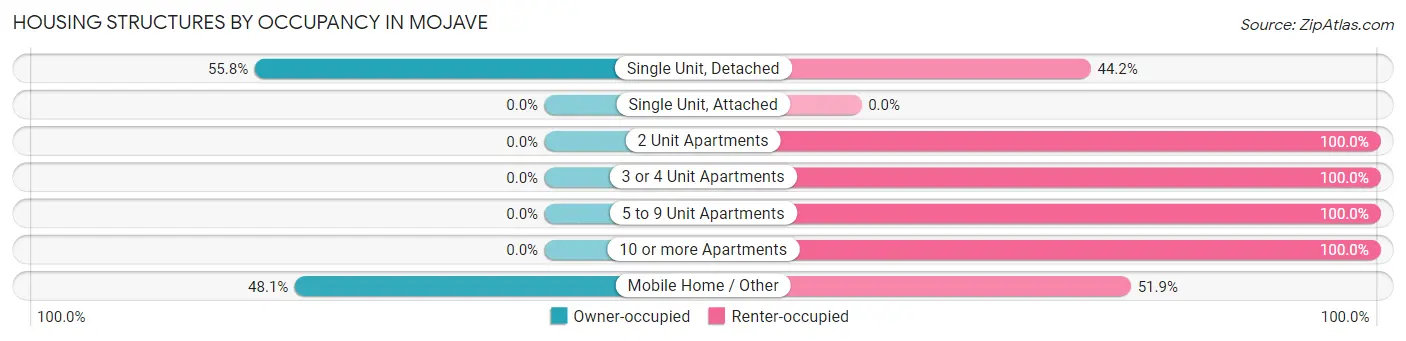
| Structure Type | Owner-occupied | Renter-occupied |
| Single Unit, Detached | 527 (55.8%) | 417 (44.2%) |
| Single Unit, Attached | 0 (0.0%) | 0 (0.0%) |
| 2 Unit Apartments | 0 (0.0%) | 79 (100.0%) |
| 3 or 4 Unit Apartments | 0 (0.0%) | 229 (100.0%) |
| 5 to 9 Unit Apartments | 0 (0.0%) | 53 (100.0%) |
| 10 or more Apartments | 0 (0.0%) | 50 (100.0%) |
| Mobile Home / Other | 76 (48.1%) | 82 (51.9%) |
| Total | 603 (39.9%) | 910 (60.2%) |
Housing Structures by Number of Rooms in Mojave
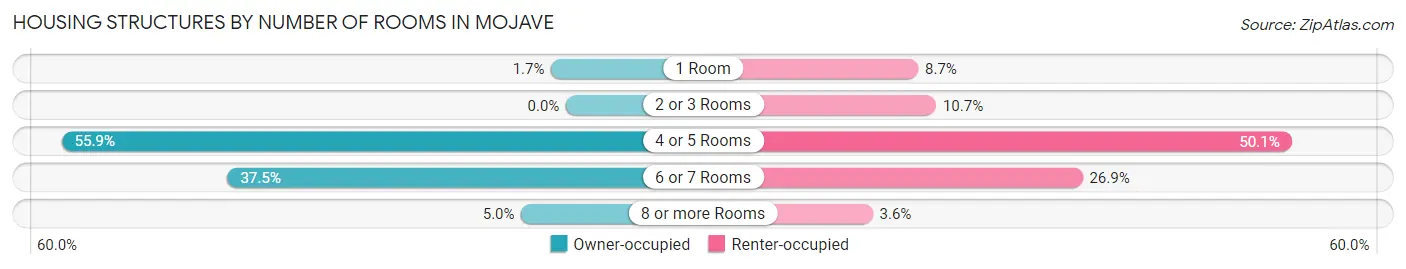
| Number of Rooms | Owner-occupied | Renter-occupied |
| 1 Room | 10 (1.7%) | 79 (8.7%) |
| 2 or 3 Rooms | 0 (0.0%) | 97 (10.7%) |
| 4 or 5 Rooms | 337 (55.9%) | 456 (50.1%) |
| 6 or 7 Rooms | 226 (37.5%) | 245 (26.9%) |
| 8 or more Rooms | 30 (5.0%) | 33 (3.6%) |
| Total | 603 (100.0%) | 910 (100.0%) |
Housing Structure by Heating Type in Mojave
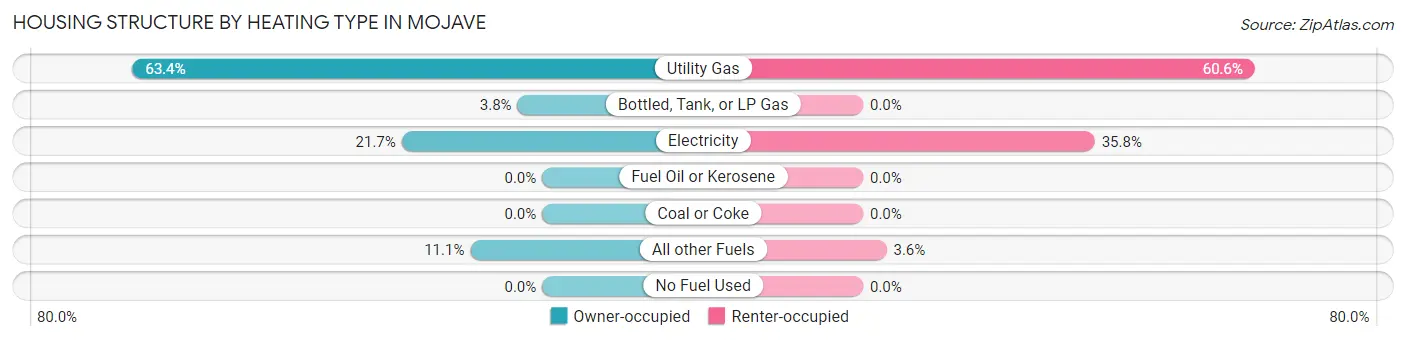
| Heating Type | Owner-occupied | Renter-occupied |
| Utility Gas | 382 (63.3%) | 551 (60.6%) |
| Bottled, Tank, or LP Gas | 23 (3.8%) | 0 (0.0%) |
| Electricity | 131 (21.7%) | 326 (35.8%) |
| Fuel Oil or Kerosene | 0 (0.0%) | 0 (0.0%) |
| Coal or Coke | 0 (0.0%) | 0 (0.0%) |
| All other Fuels | 67 (11.1%) | 33 (3.6%) |
| No Fuel Used | 0 (0.0%) | 0 (0.0%) |
| Total | 603 (100.0%) | 910 (100.0%) |
Household Vehicle Usage in Mojave
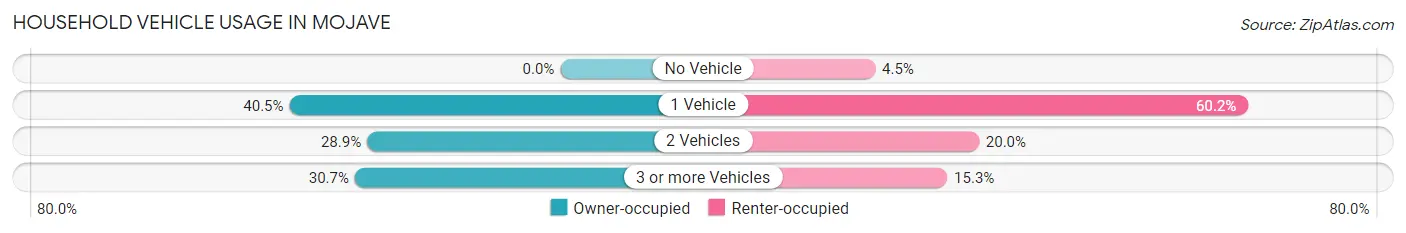
| Vehicles per Household | Owner-occupied | Renter-occupied |
| No Vehicle | 0 (0.0%) | 41 (4.5%) |
| 1 Vehicle | 244 (40.5%) | 548 (60.2%) |
| 2 Vehicles | 174 (28.9%) | 182 (20.0%) |
| 3 or more Vehicles | 185 (30.7%) | 139 (15.3%) |
| Total | 603 (100.0%) | 910 (100.0%) |
Real Estate & Mortgages in Mojave
Real Estate and Mortgage Overview in Mojave
| Characteristic | Without Mortgage | With Mortgage |
| Housing Units | 269 | 334 |
| Median Property Value | $91,900 | $185,600 |
| Median Household Income | $60,744 | $37 |
| Monthly Housing Costs | $437 | $0 |
| Real Estate Taxes | $835 | $14 |
Property Value by Mortgage Status in Mojave
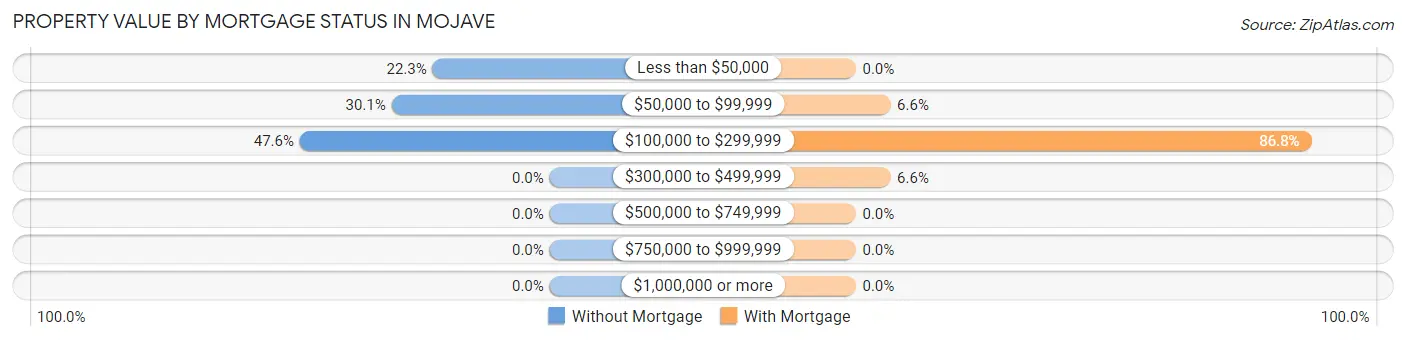
| Property Value | Without Mortgage | With Mortgage |
| Less than $50,000 | 60 (22.3%) | 0 (0.0%) |
| $50,000 to $99,999 | 81 (30.1%) | 22 (6.6%) |
| $100,000 to $299,999 | 128 (47.6%) | 290 (86.8%) |
| $300,000 to $499,999 | 0 (0.0%) | 22 (6.6%) |
| $500,000 to $749,999 | 0 (0.0%) | 0 (0.0%) |
| $750,000 to $999,999 | 0 (0.0%) | 0 (0.0%) |
| $1,000,000 or more | 0 (0.0%) | 0 (0.0%) |
| Total | 269 (100.0%) | 334 (100.0%) |
Household Income by Mortgage Status in Mojave
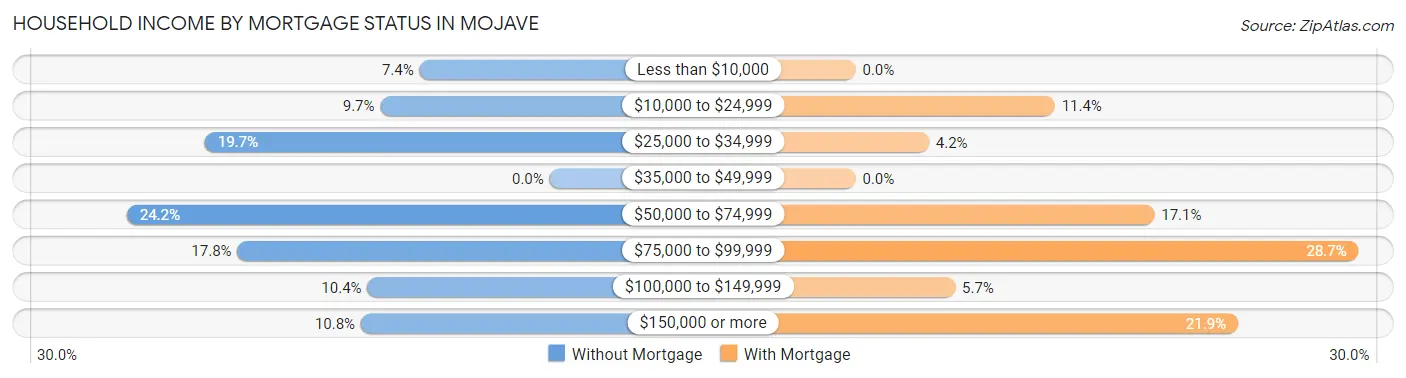
| Household Income | Without Mortgage | With Mortgage |
| Less than $10,000 | 20 (7.4%) | 0 (0.0%) |
| $10,000 to $24,999 | 26 (9.7%) | 38 (11.4%) |
| $25,000 to $34,999 | 53 (19.7%) | 14 (4.2%) |
| $35,000 to $49,999 | 0 (0.0%) | 0 (0.0%) |
| $50,000 to $74,999 | 65 (24.2%) | 57 (17.1%) |
| $75,000 to $99,999 | 48 (17.8%) | 96 (28.7%) |
| $100,000 to $149,999 | 28 (10.4%) | 19 (5.7%) |
| $150,000 or more | 29 (10.8%) | 73 (21.9%) |
| Total | 269 (100.0%) | 334 (100.0%) |
Property Value to Household Income Ratio in Mojave
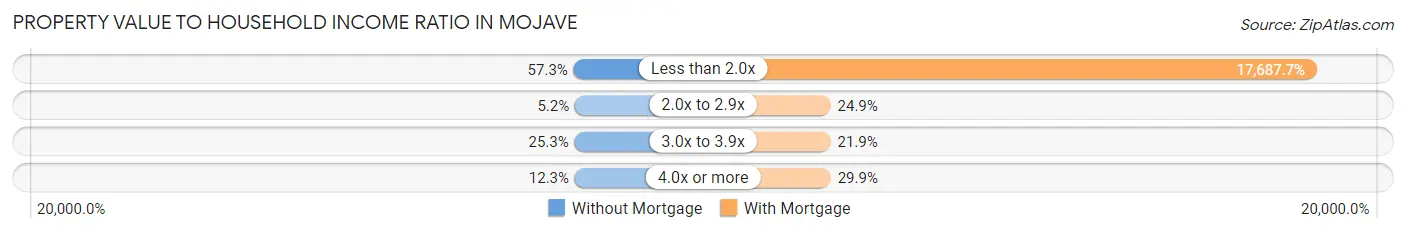
| Value-to-Income Ratio | Without Mortgage | With Mortgage |
| Less than 2.0x | 154 (57.3%) | 59,077 (17,687.7%) |
| 2.0x to 2.9x | 14 (5.2%) | 83 (24.8%) |
| 3.0x to 3.9x | 68 (25.3%) | 73 (21.9%) |
| 4.0x or more | 33 (12.3%) | 100 (29.9%) |
| Total | 269 (100.0%) | 334 (100.0%) |
Real Estate Taxes by Mortgage Status in Mojave
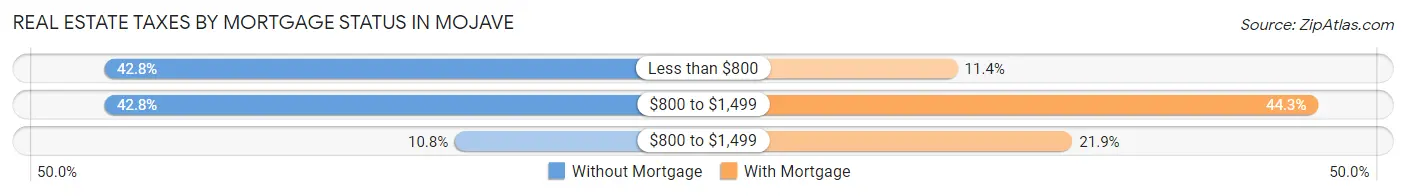
| Property Taxes | Without Mortgage | With Mortgage |
| Less than $800 | 115 (42.7%) | 38 (11.4%) |
| $800 to $1,499 | 115 (42.7%) | 148 (44.3%) |
| $800 to $1,499 | 29 (10.8%) | 73 (21.9%) |
| Total | 269 (100.0%) | 334 (100.0%) |
Health & Disability in Mojave
Health Insurance Coverage by Age in Mojave
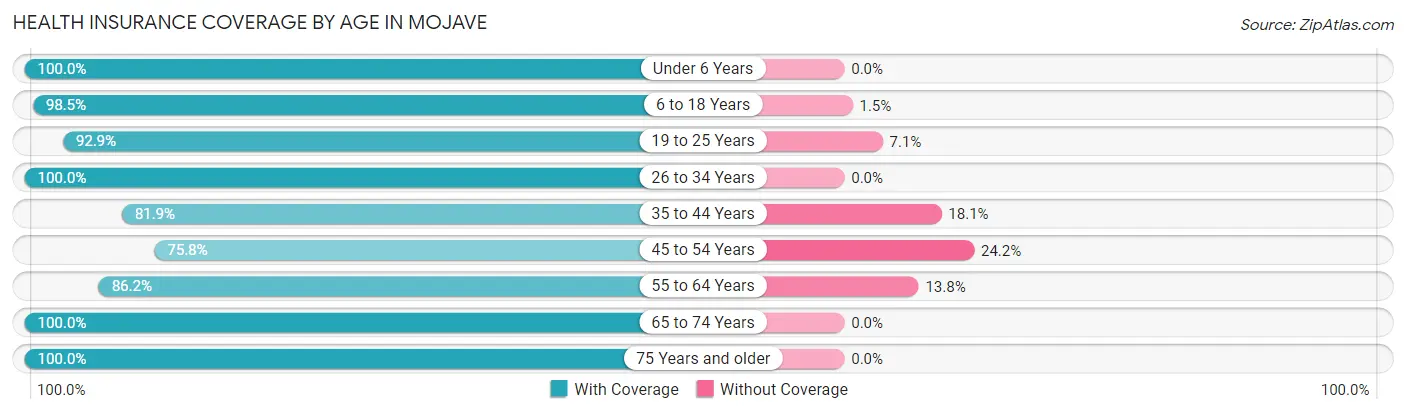
| Age Bracket | With Coverage | Without Coverage |
| Under 6 Years | 258 (100.0%) | 0 (0.0%) |
| 6 to 18 Years | 893 (98.5%) | 14 (1.5%) |
| 19 to 25 Years | 221 (92.9%) | 17 (7.1%) |
| 26 to 34 Years | 365 (100.0%) | 0 (0.0%) |
| 35 to 44 Years | 443 (81.9%) | 98 (18.1%) |
| 45 to 54 Years | 379 (75.8%) | 121 (24.2%) |
| 55 to 64 Years | 455 (86.2%) | 73 (13.8%) |
| 65 to 74 Years | 383 (100.0%) | 0 (0.0%) |
| 75 Years and older | 145 (100.0%) | 0 (0.0%) |
| Total | 3,542 (91.6%) | 323 (8.4%) |
Health Insurance Coverage by Citizenship Status in Mojave
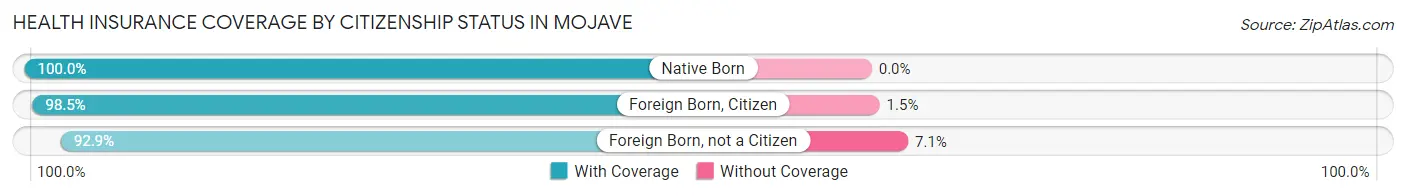
| Citizenship Status | With Coverage | Without Coverage |
| Native Born | 258 (100.0%) | 0 (0.0%) |
| Foreign Born, Citizen | 893 (98.5%) | 14 (1.5%) |
| Foreign Born, not a Citizen | 221 (92.9%) | 17 (7.1%) |
Health Insurance Coverage by Household Income in Mojave
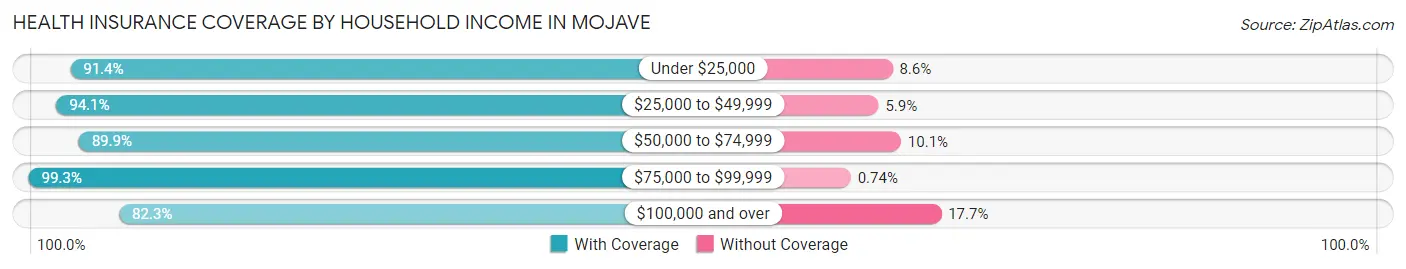
| Household Income | With Coverage | Without Coverage |
| Under $25,000 | 716 (91.4%) | 67 (8.6%) |
| $25,000 to $49,999 | 1,187 (94.1%) | 75 (5.9%) |
| $50,000 to $74,999 | 310 (89.9%) | 35 (10.1%) |
| $75,000 to $99,999 | 673 (99.3%) | 5 (0.7%) |
| $100,000 and over | 656 (82.3%) | 141 (17.7%) |
Public vs Private Health Insurance Coverage by Age in Mojave
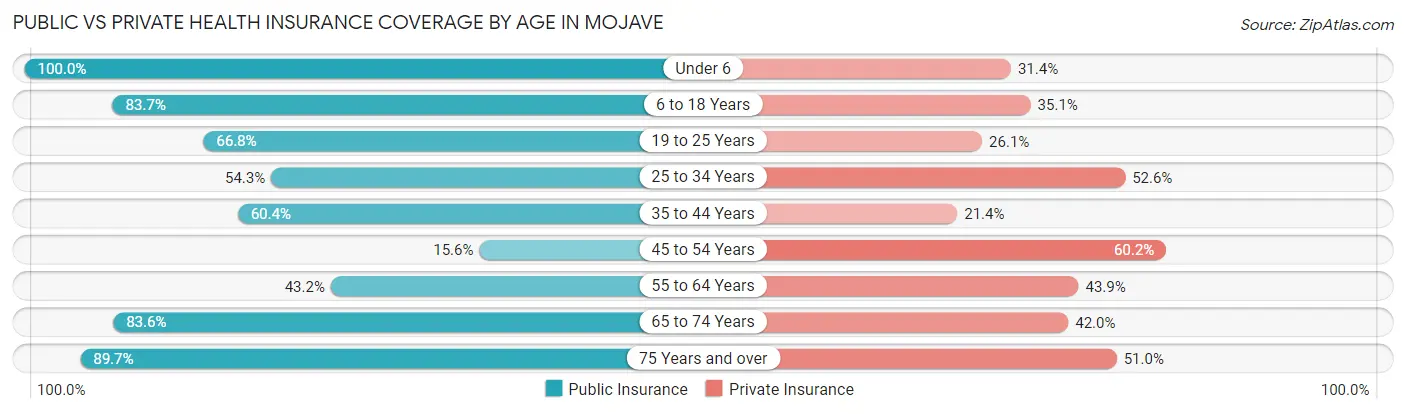
| Age Bracket | Public Insurance | Private Insurance |
| Under 6 | 258 (100.0%) | 81 (31.4%) |
| 6 to 18 Years | 759 (83.7%) | 318 (35.1%) |
| 19 to 25 Years | 159 (66.8%) | 62 (26.1%) |
| 25 to 34 Years | 198 (54.2%) | 192 (52.6%) |
| 35 to 44 Years | 327 (60.4%) | 116 (21.4%) |
| 45 to 54 Years | 78 (15.6%) | 301 (60.2%) |
| 55 to 64 Years | 228 (43.2%) | 232 (43.9%) |
| 65 to 74 Years | 320 (83.6%) | 161 (42.0%) |
| 75 Years and over | 130 (89.7%) | 74 (51.0%) |
| Total | 2,457 (63.6%) | 1,537 (39.8%) |
Disability Status by Sex by Age in Mojave
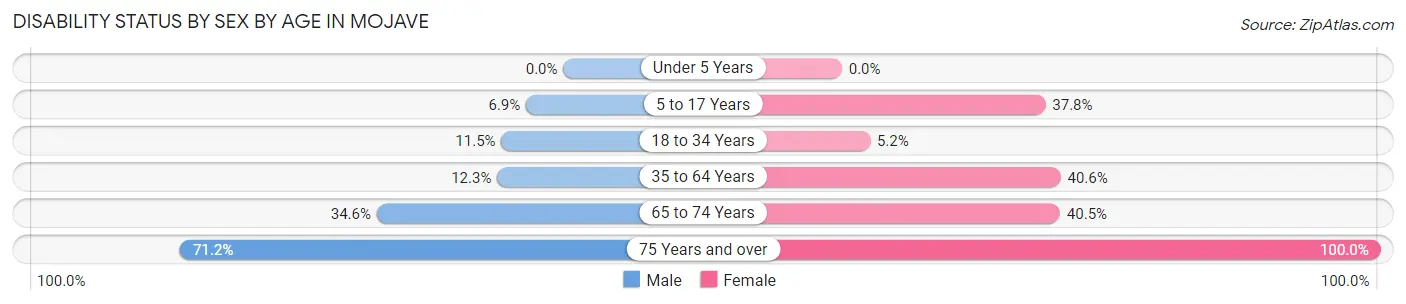
| Age Bracket | Male | Female |
| Under 5 Years | 0 (0.0%) | 0 (0.0%) |
| 5 to 17 Years | 32 (6.9%) | 150 (37.8%) |
| 18 to 34 Years | 33 (11.5%) | 19 (5.2%) |
| 35 to 64 Years | 94 (12.3%) | 326 (40.6%) |
| 65 to 74 Years | 89 (34.6%) | 51 (40.5%) |
| 75 Years and over | 37 (71.2%) | 93 (100.0%) |
Disability Class by Sex by Age in Mojave
Disability Class: Hearing Difficulty
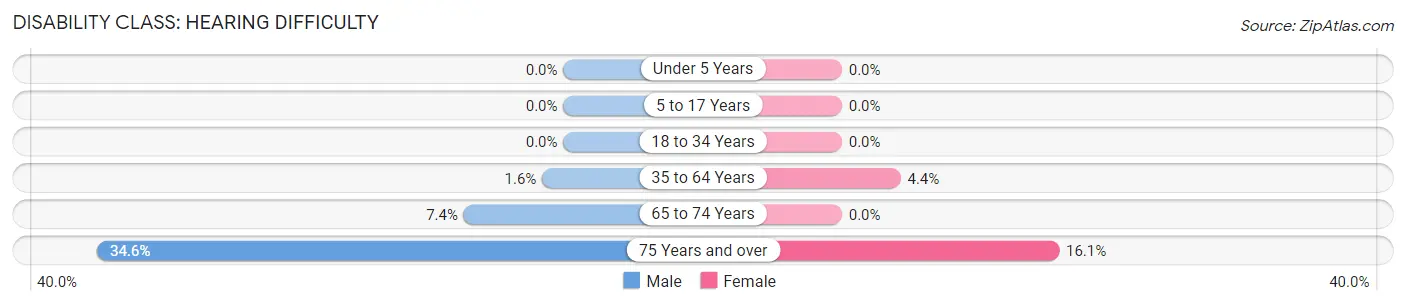
| Age Bracket | Male | Female |
| Under 5 Years | 0 (0.0%) | 0 (0.0%) |
| 5 to 17 Years | 0 (0.0%) | 0 (0.0%) |
| 18 to 34 Years | 0 (0.0%) | 0 (0.0%) |
| 35 to 64 Years | 12 (1.6%) | 35 (4.4%) |
| 65 to 74 Years | 19 (7.4%) | 0 (0.0%) |
| 75 Years and over | 18 (34.6%) | 15 (16.1%) |
Disability Class: Vision Difficulty
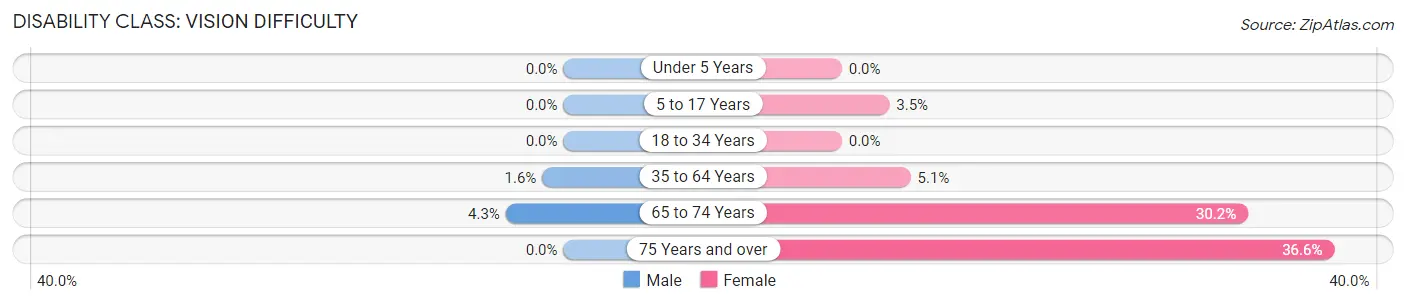
| Age Bracket | Male | Female |
| Under 5 Years | 0 (0.0%) | 0 (0.0%) |
| 5 to 17 Years | 0 (0.0%) | 14 (3.5%) |
| 18 to 34 Years | 0 (0.0%) | 0 (0.0%) |
| 35 to 64 Years | 12 (1.6%) | 41 (5.1%) |
| 65 to 74 Years | 11 (4.3%) | 38 (30.2%) |
| 75 Years and over | 0 (0.0%) | 34 (36.6%) |
Disability Class: Cognitive Difficulty
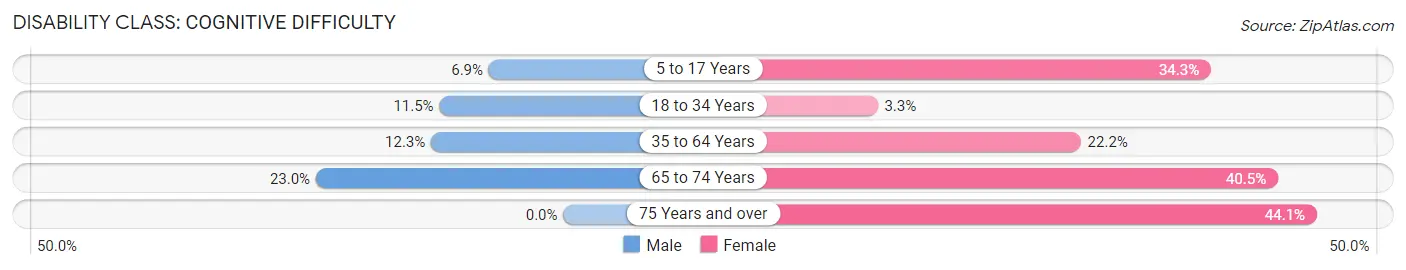
| Age Bracket | Male | Female |
| 5 to 17 Years | 32 (6.9%) | 136 (34.3%) |
| 18 to 34 Years | 33 (11.5%) | 12 (3.3%) |
| 35 to 64 Years | 94 (12.3%) | 178 (22.2%) |
| 65 to 74 Years | 59 (23.0%) | 51 (40.5%) |
| 75 Years and over | 0 (0.0%) | 41 (44.1%) |
Disability Class: Ambulatory Difficulty
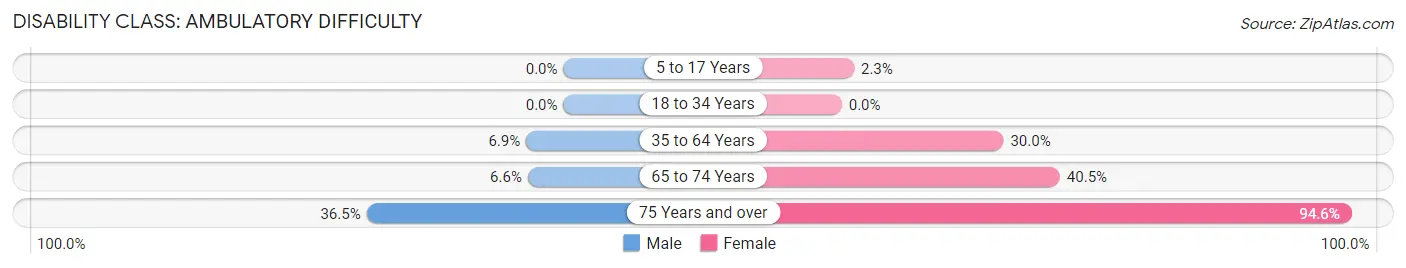
| Age Bracket | Male | Female |
| 5 to 17 Years | 0 (0.0%) | 9 (2.3%) |
| 18 to 34 Years | 0 (0.0%) | 0 (0.0%) |
| 35 to 64 Years | 53 (6.9%) | 241 (30.0%) |
| 65 to 74 Years | 17 (6.6%) | 51 (40.5%) |
| 75 Years and over | 19 (36.5%) | 88 (94.6%) |
Disability Class: Self-Care Difficulty
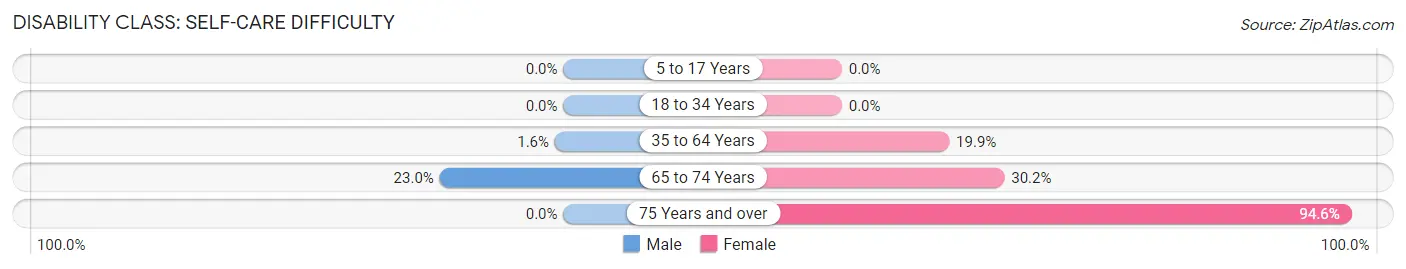
| Age Bracket | Male | Female |
| 5 to 17 Years | 0 (0.0%) | 0 (0.0%) |
| 18 to 34 Years | 0 (0.0%) | 0 (0.0%) |
| 35 to 64 Years | 12 (1.6%) | 160 (19.9%) |
| 65 to 74 Years | 59 (23.0%) | 38 (30.2%) |
| 75 Years and over | 0 (0.0%) | 88 (94.6%) |
Technology Access in Mojave
Computing Device Access in Mojave
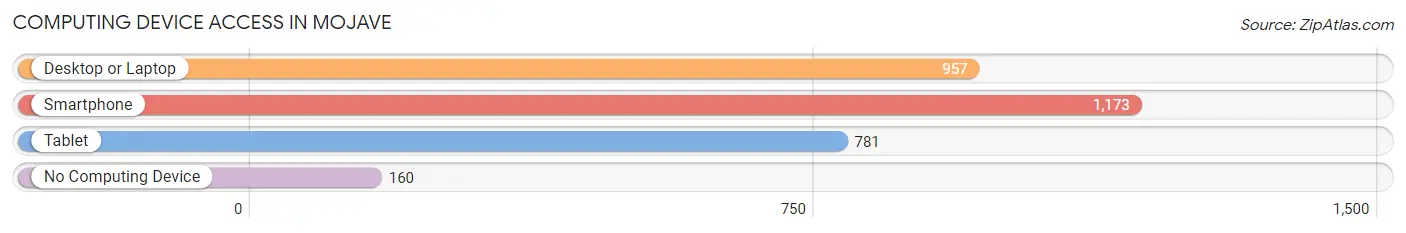
| Device Type | # Households | % Households |
| Desktop or Laptop | 957 | 63.2% |
| Smartphone | 1,173 | 77.5% |
| Tablet | 781 | 51.6% |
| No Computing Device | 160 | 10.6% |
| Total | 1,513 | 100.0% |
Internet Access in Mojave
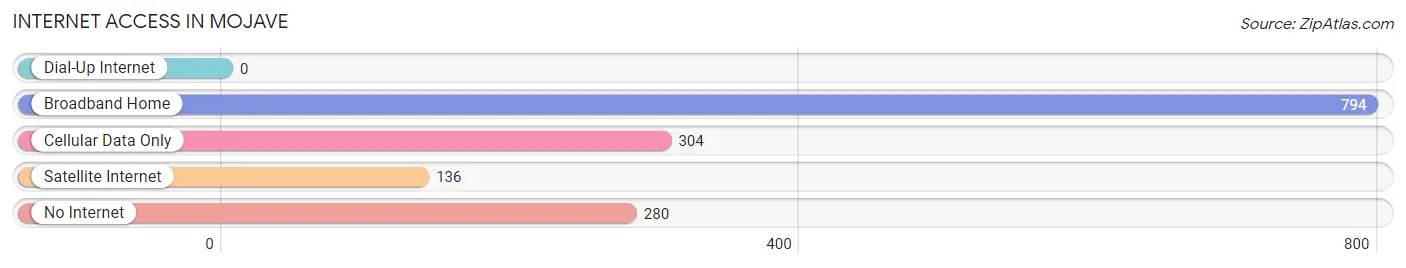
| Internet Type | # Households | % Households |
| Dial-Up Internet | 0 | 0.0% |
| Broadband Home | 794 | 52.5% |
| Cellular Data Only | 304 | 20.1% |
| Satellite Internet | 136 | 9.0% |
| No Internet | 280 | 18.5% |
| Total | 1,513 | 100.0% |
Mojave Summary
Mojave is a small desert town located in the Mojave Desert in Kern County, California. It is situated at the intersection of State Route 14 and State Route 58, approximately 90 miles north of Los Angeles. The town has a population of approximately 4,238 people, according to the 2010 census.
History
Mojave was founded in 1876 by the Southern Pacific Railroad as a stop on the line between Los Angeles and Salt Lake City. The town was named after the Mojave Indians, who had inhabited the area for centuries. The town was originally a mining camp, and the surrounding area was used for mining gold, silver, and copper. The town was also a popular stop for travelers on the Southern Pacific Railroad.
In the early 1900s, Mojave began to grow as a railroad town. The town was home to a number of businesses, including a hotel, saloon, and general store. The town also had a post office, which opened in 1906.
In the 1920s, Mojave began to experience a decline in population as the mining industry began to decline. The town was also affected by the Great Depression, and many of the businesses in town closed.
In the 1940s, Mojave began to experience a resurgence in population as the military began to use the area for training. The town was home to a number of military bases, including the Mojave Air and Space Port, which is now the home of the world’s first commercial spaceport.
Geography
Mojave is located in the Mojave Desert in Kern County, California. The town is situated at the intersection of State Route 14 and State Route 58, approximately 90 miles north of Los Angeles. The town is surrounded by the Tehachapi Mountains to the west and the Sierra Nevada Mountains to the east.
The town has a total area of 4.2 square miles, all of which is land. The town has an elevation of 2,812 feet above sea level.
Economy
Mojave’s economy is largely based on tourism and the military. The town is home to a number of tourist attractions, including the Mojave Air and Space Port, which is the home of the world’s first commercial spaceport. The town is also home to a number of military bases, including the Edwards Air Force Base and the China Lake Naval Air Weapons Station.
The town is also home to a number of businesses, including restaurants, hotels, and retail stores. The town is also home to a number of manufacturing companies, including a solar panel manufacturing plant.
Demographics
According to the 2010 census, Mojave has a population of 4,238 people. The town has a median age of 33.7 years, and the median household income is $37,941. The town is predominantly white, with 78.3% of the population identifying as white. The town also has a large Hispanic population, with 19.3% of the population identifying as Hispanic or Latino. The town also has a small African American population, with 1.3% of the population identifying as African American.
Common Questions
What is Per Capita Income in Mojave?
Per Capita income in Mojave is $22,991.
What is the Median Family Income in Mojave?
Median Family Income in Mojave is $57,991.
What is the Median Household income in Mojave?
Median Household Income in Mojave is $46,035.
What is Income or Wage Gap in Mojave?
Income or Wage Gap in Mojave is 12.6%.
Women in Mojave earn 87.4 cents for every dollar earned by a man.
What is Inequality or Gini Index in Mojave?
Inequality or Gini Index in Mojave is 0.45.
What is the Total Population of Mojave?
Total Population of Mojave is 3,865.
What is the Total Male Population of Mojave?
Total Male Population of Mojave is 1,849.
What is the Total Female Population of Mojave?
Total Female Population of Mojave is 2,016.
What is the Ratio of Males per 100 Females in Mojave?
There are 91.72 Males per 100 Females in Mojave.
What is the Ratio of Females per 100 Males in Mojave?
There are 109.03 Females per 100 Males in Mojave.
What is the Median Population Age in Mojave?
Median Population Age in Mojave is 39.0 Years.
What is the Average Family Size in Mojave
Average Family Size in Mojave is 3.5 People.
What is the Average Household Size in Mojave
Average Household Size in Mojave is 2.5 People.
How Large is the Labor Force in Mojave?
There are 1,558 People in the Labor Forcein in Mojave.
What is the Percentage of People in the Labor Force in Mojave?
55.0% of People are in the Labor Force in Mojave.
What is the Unemployment Rate in Mojave?
Unemployment Rate in Mojave is 7.8%.