Mission Hills, CA Map & Demographics
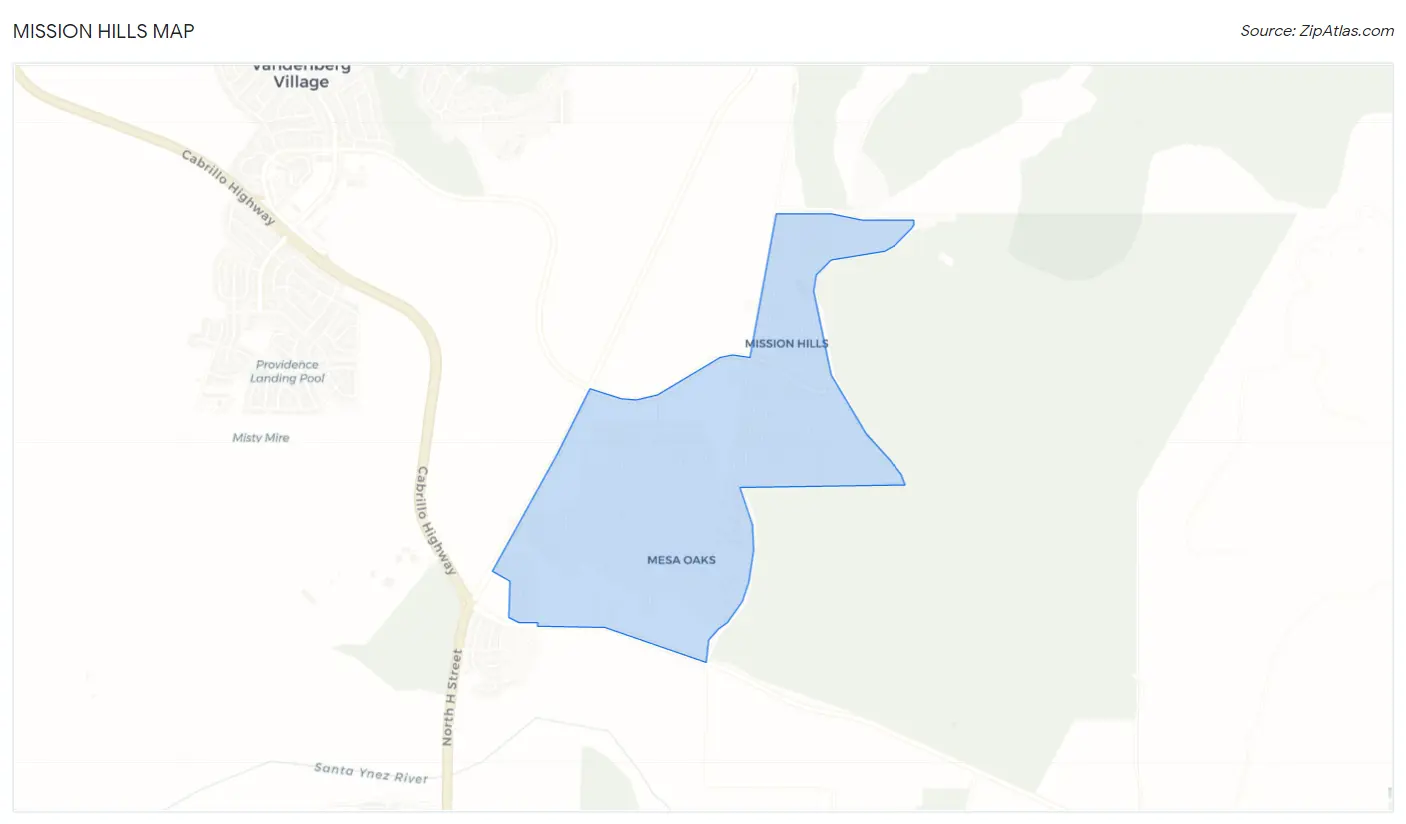
Mission Hills Map
Mission Hills Overview
$43,758
PER CAPITA INCOME
$126,250
AVG FAMILY INCOME
$102,024
AVG HOUSEHOLD INCOME
40.0%
WAGE / INCOME GAP [ % ]
60.0¢/ $1
WAGE / INCOME GAP [ $ ]
0.39
INEQUALITY / GINI INDEX
3,458
TOTAL POPULATION
1,583
MALE POPULATION
1,875
FEMALE POPULATION
84.43
MALES / 100 FEMALES
118.45
FEMALES / 100 MALES
44.5
MEDIAN AGE
3.4
AVG FAMILY SIZE
3.0
AVG HOUSEHOLD SIZE
1,833
LABOR FORCE [ PEOPLE ]
67.6%
PERCENT IN LABOR FORCE
5.0%
UNEMPLOYMENT RATE
Mission Hills Zip Codes
Income in Mission Hills
Income Overview in Mission Hills
Per Capita Income in Mission Hills is $43,758, while median incomes of families and households are $126,250 and $102,024 respectively.
| Characteristic | Number | Measure |
| Per Capita Income | 3,458 | $43,758 |
| Median Family Income | 930 | $126,250 |
| Mean Family Income | 930 | $143,183 |
| Median Household Income | 1,166 | $102,024 |
| Mean Household Income | 1,166 | $128,512 |
| Income Deficit | 930 | $0 |
| Wage / Income Gap (%) | 3,458 | 39.99% |
| Wage / Income Gap ($) | 3,458 | 60.01¢ per $1 |
| Gini / Inequality Index | 3,458 | 0.39 |
Earnings by Sex in Mission Hills
Average Earnings in Mission Hills are $40,986, $57,643 for men and $34,590 for women, a difference of 40.0%.
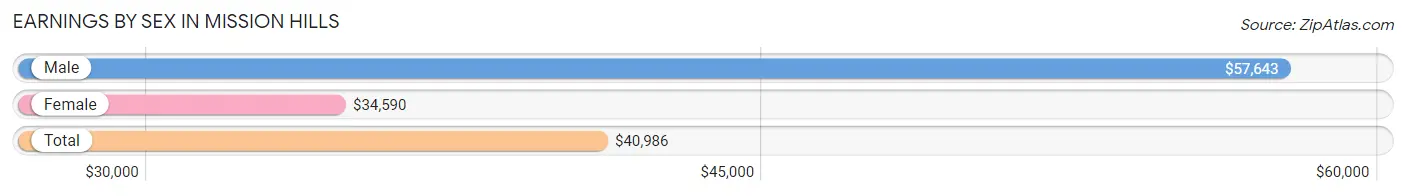
| Sex | Number | Average Earnings |
| Male | 914 (50.7%) | $57,643 |
| Female | 890 (49.3%) | $34,590 |
| Total | 1,804 (100.0%) | $40,986 |
Earnings by Sex by Income Bracket in Mission Hills
The most common earnings brackets in Mission Hills are $100,000+ for men (279 | 30.5%) and $25,000 to $29,999 for women (90 | 10.1%).
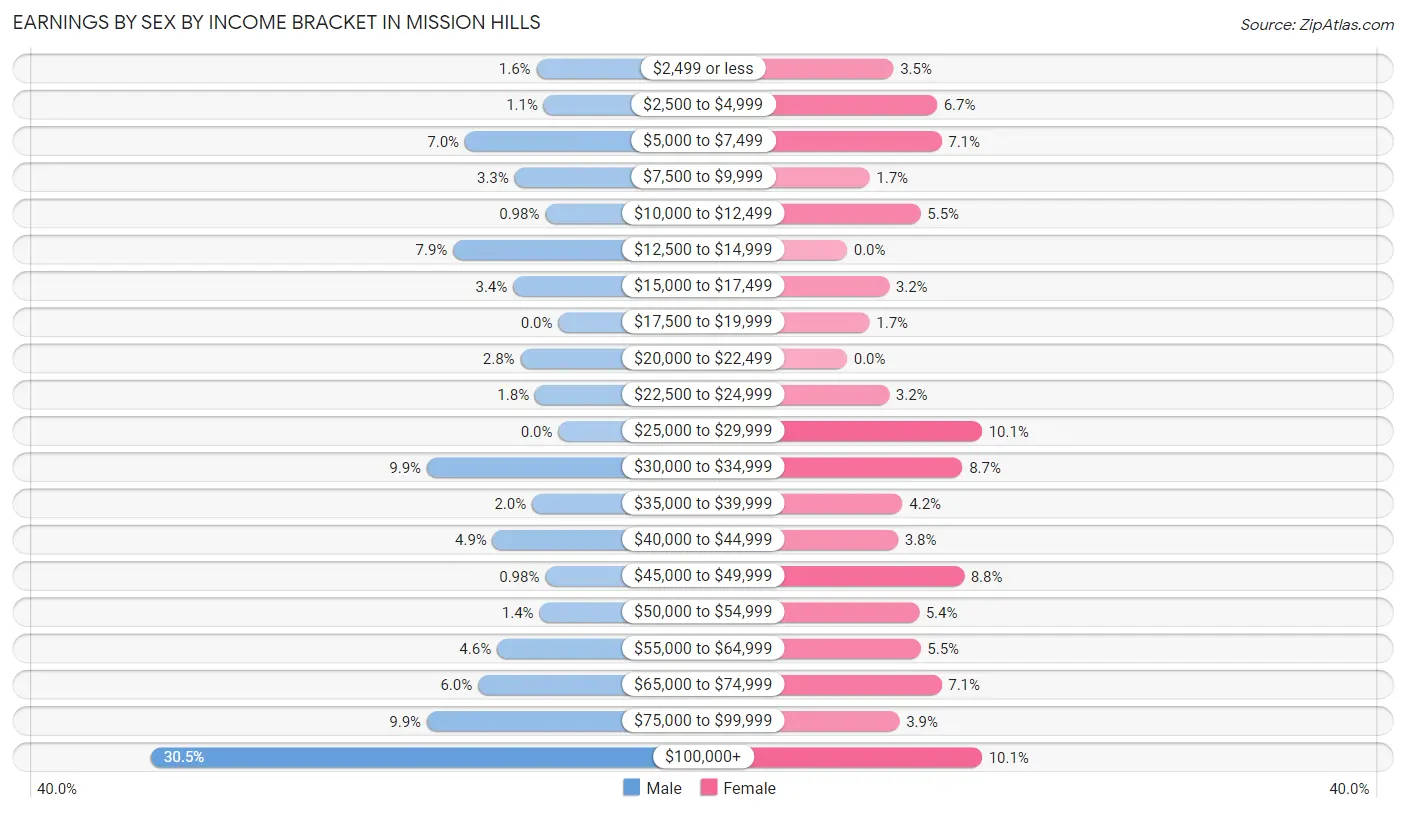
| Income | Male | Female |
| $2,499 or less | 15 (1.6%) | 31 (3.5%) |
| $2,500 to $4,999 | 10 (1.1%) | 60 (6.7%) |
| $5,000 to $7,499 | 64 (7.0%) | 63 (7.1%) |
| $7,500 to $9,999 | 30 (3.3%) | 15 (1.7%) |
| $10,000 to $12,499 | 9 (1.0%) | 49 (5.5%) |
| $12,500 to $14,999 | 72 (7.9%) | 0 (0.0%) |
| $15,000 to $17,499 | 31 (3.4%) | 28 (3.2%) |
| $17,500 to $19,999 | 0 (0.0%) | 15 (1.7%) |
| $20,000 to $22,499 | 26 (2.8%) | 0 (0.0%) |
| $22,500 to $24,999 | 16 (1.8%) | 28 (3.2%) |
| $25,000 to $29,999 | 0 (0.0%) | 90 (10.1%) |
| $30,000 to $34,999 | 90 (9.9%) | 77 (8.6%) |
| $35,000 to $39,999 | 18 (2.0%) | 37 (4.2%) |
| $40,000 to $44,999 | 45 (4.9%) | 34 (3.8%) |
| $45,000 to $49,999 | 9 (1.0%) | 78 (8.8%) |
| $50,000 to $54,999 | 13 (1.4%) | 48 (5.4%) |
| $55,000 to $64,999 | 42 (4.6%) | 49 (5.5%) |
| $65,000 to $74,999 | 55 (6.0%) | 63 (7.1%) |
| $75,000 to $99,999 | 90 (9.9%) | 35 (3.9%) |
| $100,000+ | 279 (30.5%) | 90 (10.1%) |
| Total | 914 (100.0%) | 890 (100.0%) |
Earnings by Sex by Educational Attainment in Mission Hills
Average earnings in Mission Hills are $65,954 for men and $36,563 for women, a difference of 44.6%. Men with an educational attainment of bachelor's degree enjoy the highest average annual earnings of $136,372, while those with college or associate's degree education earn the least with $40,777. Women with an educational attainment of graduate degree earn the most with the average annual earnings of $63,024, while those with high school diploma education have the smallest earnings of $33,432.
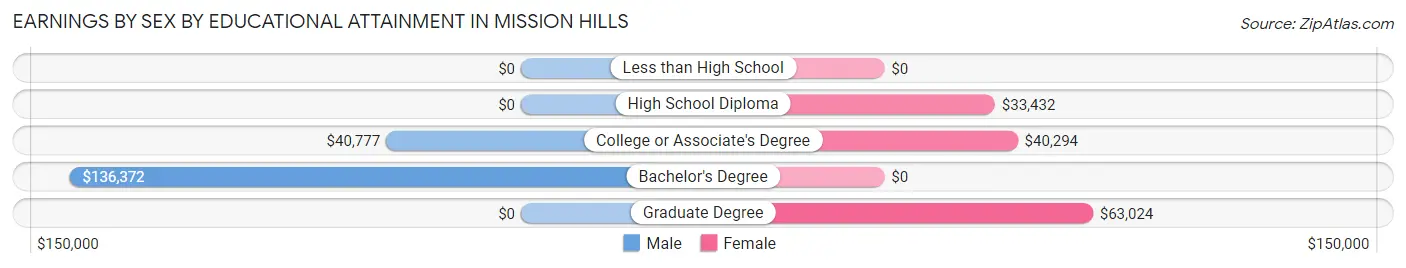
| Educational Attainment | Male Income | Female Income |
| Less than High School | - | - |
| High School Diploma | - | - |
| College or Associate's Degree | $40,777 | $40,294 |
| Bachelor's Degree | $136,372 | $0 |
| Graduate Degree | - | - |
| Total | $65,954 | $36,563 |
Family Income in Mission Hills
Family Income Brackets in Mission Hills
According to the Mission Hills family income data, there are 268 families falling into the $100,000 to $149,999 income range, which is the most common income bracket and makes up 28.8% of all families.
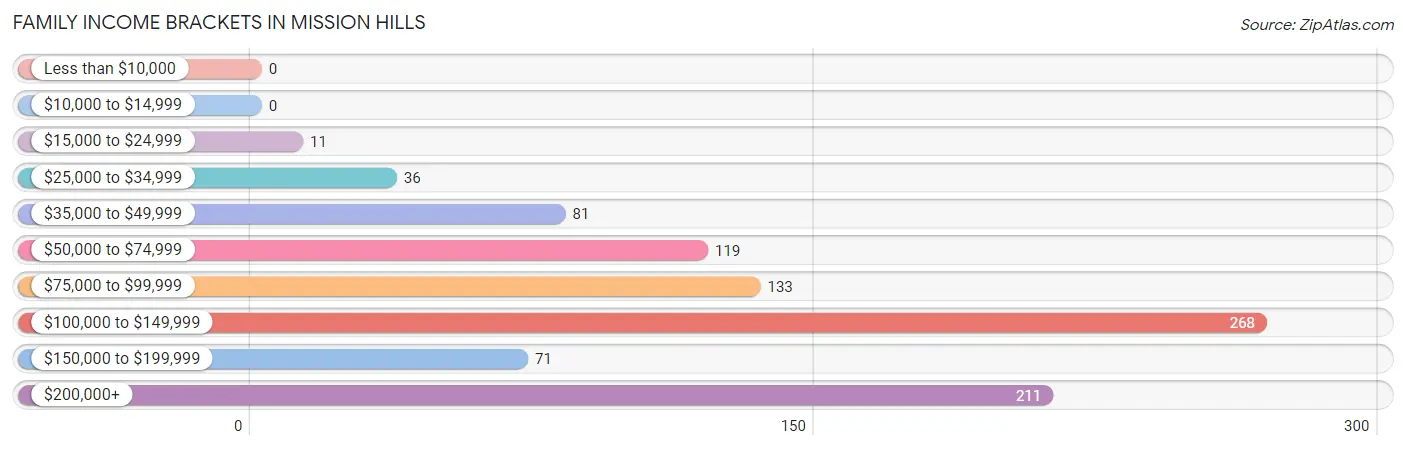
| Income Bracket | # Families | % Families |
| Less than $10,000 | 0 | 0.0% |
| $10,000 to $14,999 | 0 | 0.0% |
| $15,000 to $24,999 | 11 | 1.2% |
| $25,000 to $34,999 | 36 | 3.9% |
| $35,000 to $49,999 | 81 | 8.7% |
| $50,000 to $74,999 | 119 | 12.8% |
| $75,000 to $99,999 | 133 | 14.3% |
| $100,000 to $149,999 | 268 | 28.8% |
| $150,000 to $199,999 | 71 | 7.6% |
| $200,000+ | 211 | 22.7% |
Family Income by Famaliy Size in Mission Hills
5-person families (149 | 16.0%) account for the highest median family income in Mission Hills with $143,877 per family, while 2-person families (414 | 44.5%) have the highest median income of $53,625 per family member.
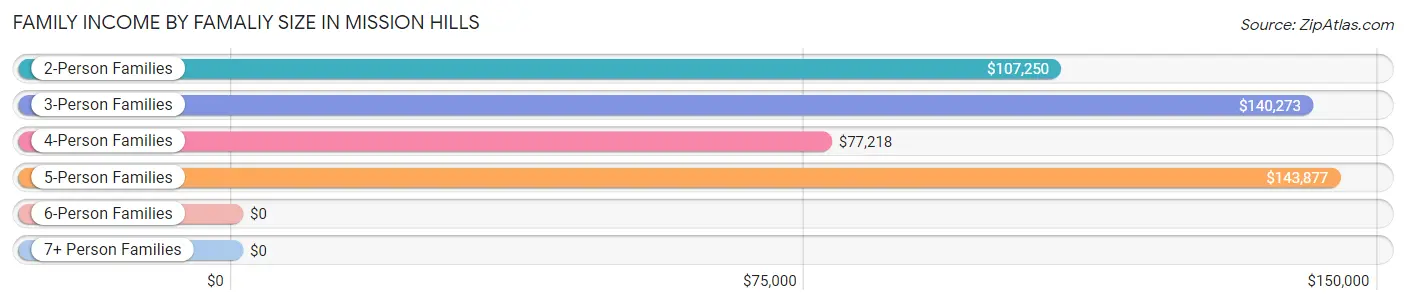
| Income Bracket | # Families | Median Income |
| 2-Person Families | 414 (44.5%) | $107,250 |
| 3-Person Families | 203 (21.8%) | $140,273 |
| 4-Person Families | 109 (11.7%) | $77,218 |
| 5-Person Families | 149 (16.0%) | $143,877 |
| 6-Person Families | 40 (4.3%) | $0 |
| 7+ Person Families | 15 (1.6%) | $0 |
| Total | 930 (100.0%) | $126,250 |
Family Income by Number of Earners in Mission Hills
The median family income in Mission Hills is $126,250, with families comprising 3+ earners (179) having the highest median family income of $143,496, while families with no earners (77) have the lowest median family income of $88,594, accounting for 19.3% and 8.3% of families, respectively.
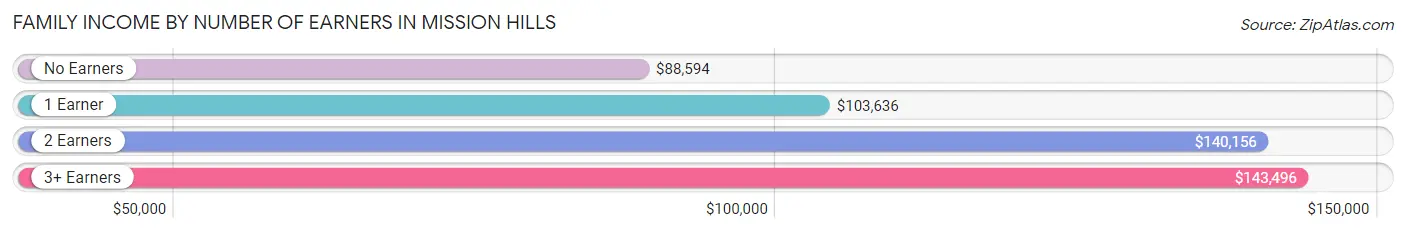
| Number of Earners | # Families | Median Income |
| No Earners | 77 (8.3%) | $88,594 |
| 1 Earner | 326 (35.0%) | $103,636 |
| 2 Earners | 348 (37.4%) | $140,156 |
| 3+ Earners | 179 (19.3%) | $143,496 |
| Total | 930 (100.0%) | $126,250 |
Household Income in Mission Hills
Household Income Brackets in Mission Hills
With 312 households falling in the category, the $100,000 to $149,999 income range is the most frequent in Mission Hills, accounting for 26.8% of all households.
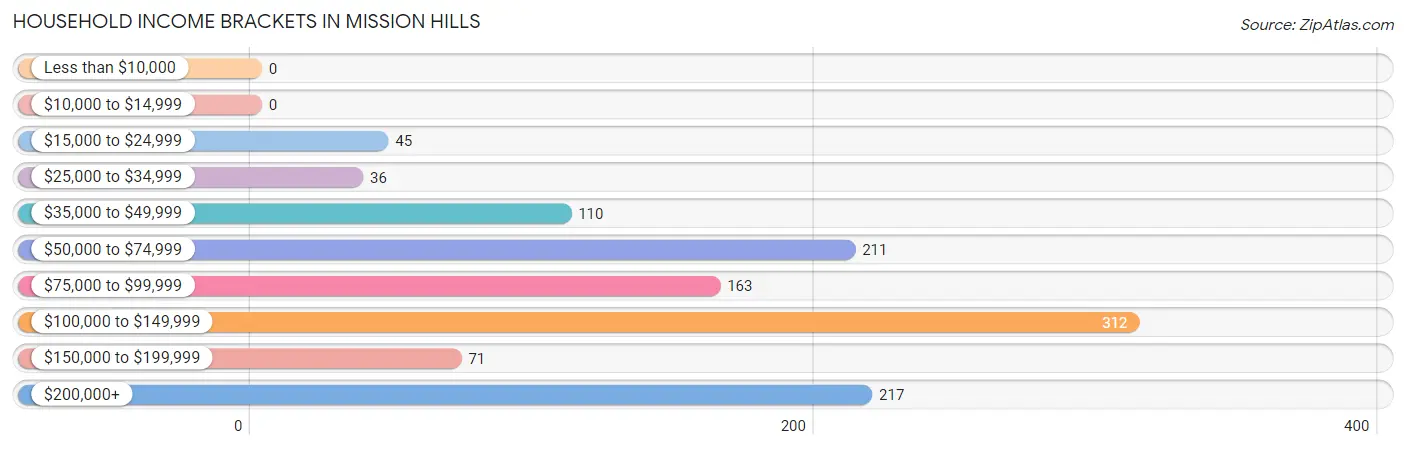
| Income Bracket | # Households | % Households |
| Less than $10,000 | 0 | 0.0% |
| $10,000 to $14,999 | 0 | 0.0% |
| $15,000 to $24,999 | 45 | 3.9% |
| $25,000 to $34,999 | 36 | 3.1% |
| $35,000 to $49,999 | 110 | 9.4% |
| $50,000 to $74,999 | 211 | 18.1% |
| $75,000 to $99,999 | 163 | 14.0% |
| $100,000 to $149,999 | 312 | 26.8% |
| $150,000 to $199,999 | 71 | 6.1% |
| $200,000+ | 217 | 18.6% |
Household Income by Householder Age in Mission Hills
The median household income in Mission Hills is $102,024, with the highest median household income of $123,750 found in the 45 to 64 years age bracket for the primary householder. A total of 582 households (49.9%) fall into this category.
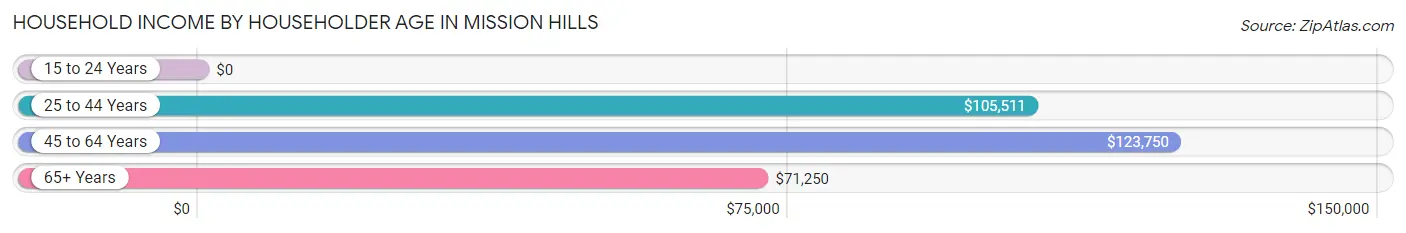
| Income Bracket | # Households | Median Income |
| 15 to 24 Years | 0 (0.0%) | $0 |
| 25 to 44 Years | 293 (25.1%) | $105,511 |
| 45 to 64 Years | 582 (49.9%) | $123,750 |
| 65+ Years | 291 (25.0%) | $71,250 |
| Total | 1,166 (100.0%) | $102,024 |
Poverty in Mission Hills
Income Below Poverty by Sex and Age in Mission Hills
With 0.7% poverty level for males and 2.6% for females among the residents of Mission Hills, 25 to 34 year old males and 15 year old females are the most vulnerable to poverty, with 9 males (5.3%) and 8 females (14.8%) in their respective age groups living below the poverty level.
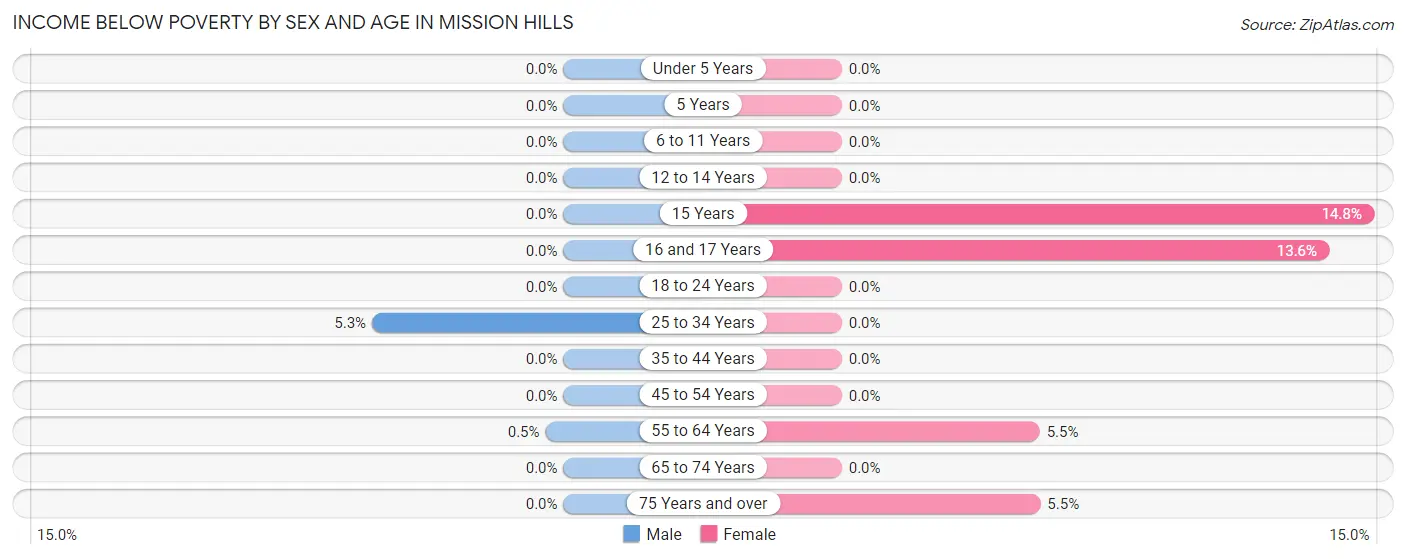
| Age Bracket | Male | Female |
| Under 5 Years | 0 (0.0%) | 0 (0.0%) |
| 5 Years | 0 (0.0%) | 0 (0.0%) |
| 6 to 11 Years | 0 (0.0%) | 0 (0.0%) |
| 12 to 14 Years | 0 (0.0%) | 0 (0.0%) |
| 15 Years | 0 (0.0%) | 8 (14.8%) |
| 16 and 17 Years | 0 (0.0%) | 8 (13.6%) |
| 18 to 24 Years | 0 (0.0%) | 0 (0.0%) |
| 25 to 34 Years | 9 (5.3%) | 0 (0.0%) |
| 35 to 44 Years | 0 (0.0%) | 0 (0.0%) |
| 45 to 54 Years | 0 (0.0%) | 0 (0.0%) |
| 55 to 64 Years | 2 (0.5%) | 21 (5.5%) |
| 65 to 74 Years | 0 (0.0%) | 0 (0.0%) |
| 75 Years and over | 0 (0.0%) | 11 (5.5%) |
| Total | 11 (0.7%) | 48 (2.6%) |
Income Above Poverty by Sex and Age in Mission Hills
According to the poverty statistics in Mission Hills, males aged under 5 years and females aged under 5 years are the age groups that are most secure financially, with 100.0% of males and 100.0% of females in these age groups living above the poverty line.
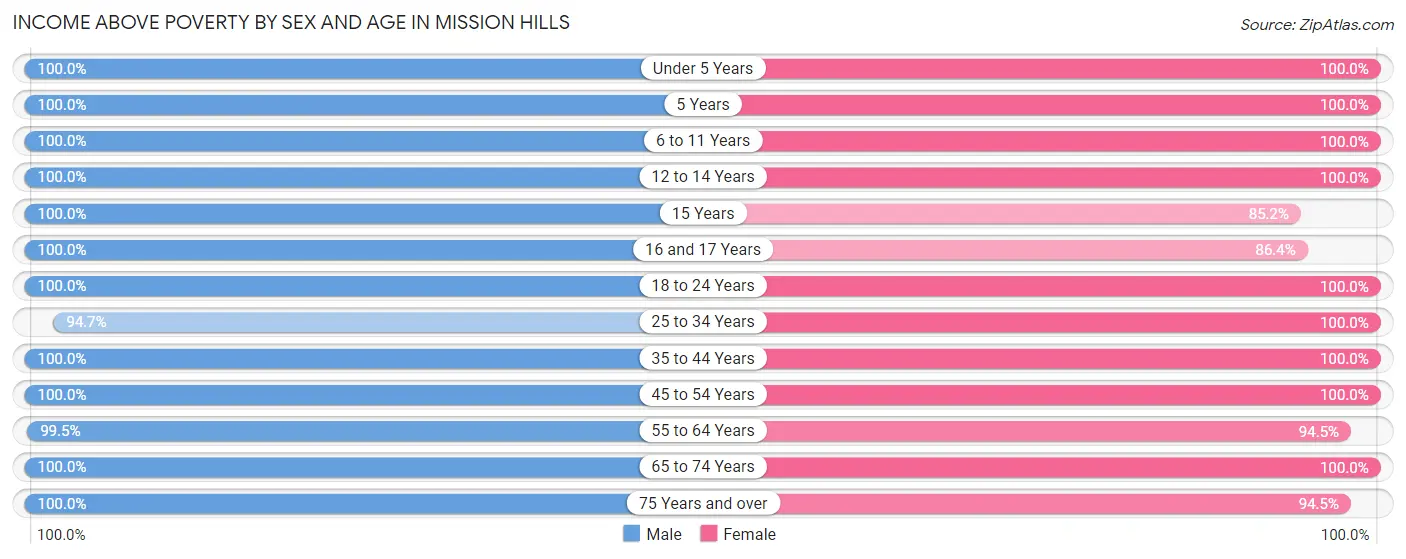
| Age Bracket | Male | Female |
| Under 5 Years | 12 (100.0%) | 11 (100.0%) |
| 5 Years | 56 (100.0%) | 31 (100.0%) |
| 6 to 11 Years | 127 (100.0%) | 126 (100.0%) |
| 12 to 14 Years | 83 (100.0%) | 237 (100.0%) |
| 15 Years | 9 (100.0%) | 46 (85.2%) |
| 16 and 17 Years | 44 (100.0%) | 51 (86.4%) |
| 18 to 24 Years | 91 (100.0%) | 66 (100.0%) |
| 25 to 34 Years | 160 (94.7%) | 107 (100.0%) |
| 35 to 44 Years | 139 (100.0%) | 329 (100.0%) |
| 45 to 54 Years | 242 (100.0%) | 148 (100.0%) |
| 55 to 64 Years | 400 (99.5%) | 360 (94.5%) |
| 65 to 74 Years | 124 (100.0%) | 127 (100.0%) |
| 75 Years and over | 85 (100.0%) | 188 (94.5%) |
| Total | 1,572 (99.3%) | 1,827 (97.4%) |
Income Below Poverty Among Married-Couple Families in Mission Hills
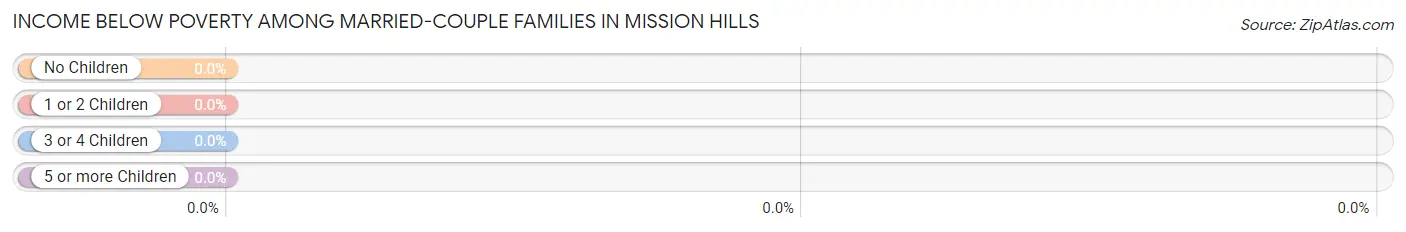
| Children | Above Poverty | Below Poverty |
| No Children | 477 (100.0%) | 0 (0.0%) |
| 1 or 2 Children | 162 (100.0%) | 0 (0.0%) |
| 3 or 4 Children | 91 (100.0%) | 0 (0.0%) |
| 5 or more Children | 0 (0.0%) | 0 (0.0%) |
| Total | 730 (100.0%) | 0 (0.0%) |
Income Below Poverty Among Single-Parent Households in Mission Hills
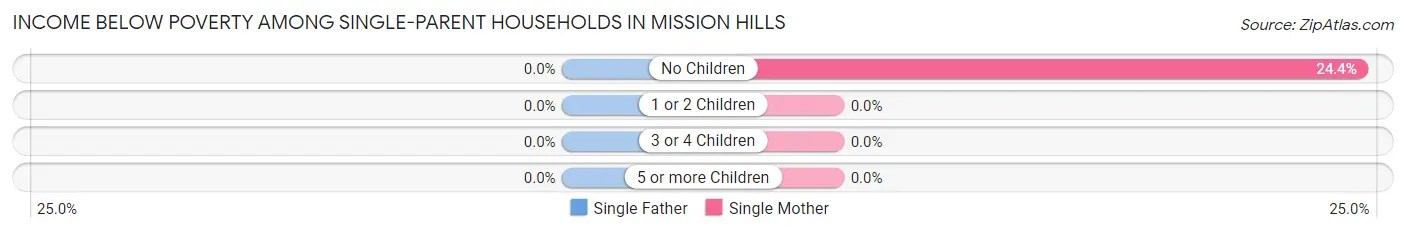
| Children | Single Father | Single Mother |
| No Children | 0 (0.0%) | 11 (24.4%) |
| 1 or 2 Children | 0 (0.0%) | 0 (0.0%) |
| 3 or 4 Children | 0 (0.0%) | 0 (0.0%) |
| 5 or more Children | 0 (0.0%) | 0 (0.0%) |
| Total | 0 (0.0%) | 11 (10.0%) |
Income Below Poverty Among Married-Couple vs Single-Parent Households in Mission Hills
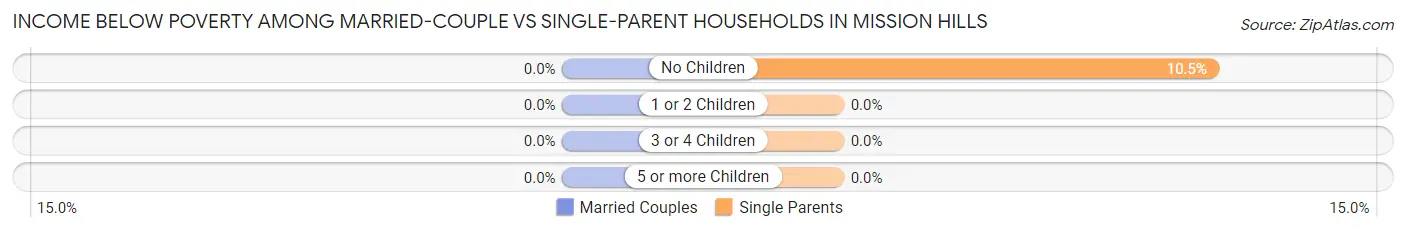
| Children | Married-Couple Families | Single-Parent Households |
| No Children | 0 (0.0%) | 11 (10.5%) |
| 1 or 2 Children | 0 (0.0%) | 0 (0.0%) |
| 3 or 4 Children | 0 (0.0%) | 0 (0.0%) |
| 5 or more Children | 0 (0.0%) | 0 (0.0%) |
| Total | 0 (0.0%) | 11 (5.5%) |
Race in Mission Hills
The most populous races in Mission Hills are White / Caucasian (1,942 | 56.2%), Hispanic or Latino (1,266 | 36.6%), and Two or more Races (1,134 | 32.8%).
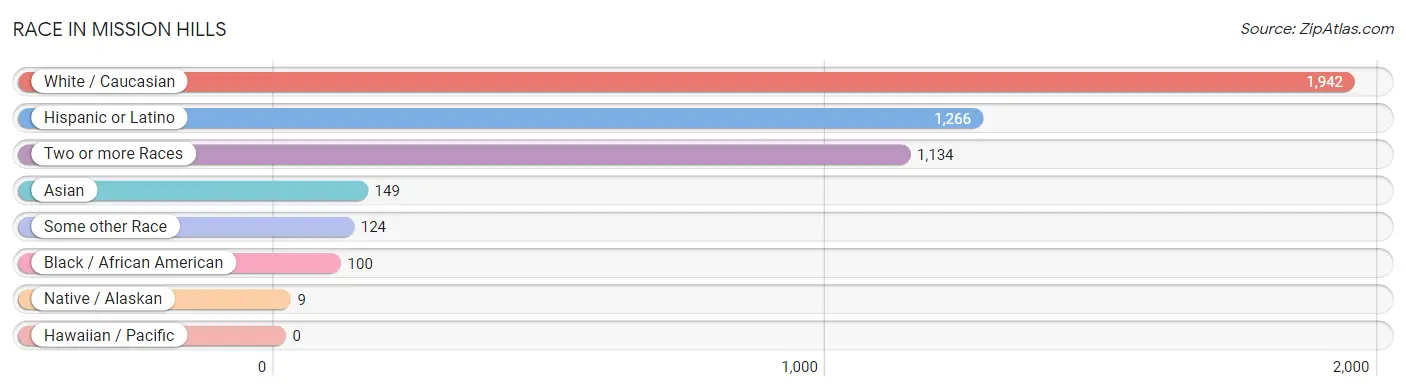
| Race | # Population | % Population |
| Asian | 149 | 4.3% |
| Black / African American | 100 | 2.9% |
| Hawaiian / Pacific | 0 | 0.0% |
| Hispanic or Latino | 1,266 | 36.6% |
| Native / Alaskan | 9 | 0.3% |
| White / Caucasian | 1,942 | 56.2% |
| Two or more Races | 1,134 | 32.8% |
| Some other Race | 124 | 3.6% |
| Total | 3,458 | 100.0% |
Ancestry in Mission Hills
The most populous ancestries reported in Mission Hills are Mexican (1,224 | 35.4%), German (436 | 12.6%), English (348 | 10.1%), Irish (245 | 7.1%), and European (185 | 5.3%), together accounting for 70.5% of all Mission Hills residents.
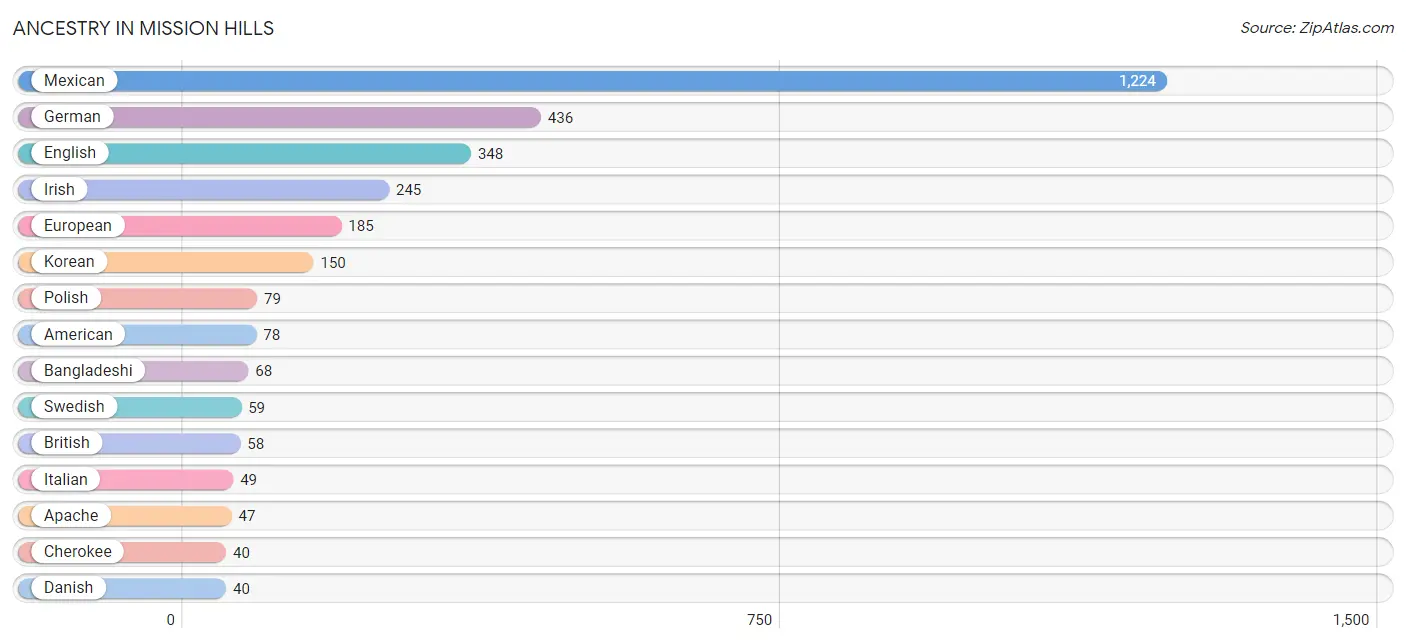
| Ancestry | # Population | % Population |
| African | 9 | 0.3% |
| American | 78 | 2.3% |
| Apache | 47 | 1.4% |
| Bangladeshi | 68 | 2.0% |
| Bhutanese | 8 | 0.2% |
| British | 58 | 1.7% |
| Burmese | 26 | 0.7% |
| Celtic | 16 | 0.5% |
| Central American | 11 | 0.3% |
| Cherokee | 40 | 1.2% |
| Chilean | 10 | 0.3% |
| Colombian | 10 | 0.3% |
| Czech | 17 | 0.5% |
| Danish | 40 | 1.2% |
| Dutch | 37 | 1.1% |
| English | 348 | 10.1% |
| European | 185 | 5.3% |
| Finnish | 16 | 0.5% |
| French | 25 | 0.7% |
| French Canadian | 9 | 0.3% |
| German | 436 | 12.6% |
| Irish | 245 | 7.1% |
| Italian | 49 | 1.4% |
| Korean | 150 | 4.3% |
| Lithuanian | 11 | 0.3% |
| Mexican | 1,224 | 35.4% |
| Mexican American Indian | 35 | 1.0% |
| Nicaraguan | 11 | 0.3% |
| Norwegian | 28 | 0.8% |
| Polish | 79 | 2.3% |
| Portuguese | 26 | 0.7% |
| Scandinavian | 6 | 0.2% |
| Scotch-Irish | 27 | 0.8% |
| Scottish | 23 | 0.7% |
| South American | 20 | 0.6% |
| Spanish | 11 | 0.3% |
| Subsaharan African | 9 | 0.3% |
| Swedish | 59 | 1.7% |
| Swiss | 17 | 0.5% |
| Thai | 13 | 0.4% |
| Ukrainian | 8 | 0.2% | View All 41 Rows |
Immigrants in Mission Hills
The most numerous immigrant groups reported in Mission Hills came from Latin America (379 | 11.0%), Central America (369 | 10.7%), Mexico (369 | 10.7%), Asia (79 | 2.3%), and Europe (40 | 1.2%), together accounting for 35.7% of all Mission Hills residents.
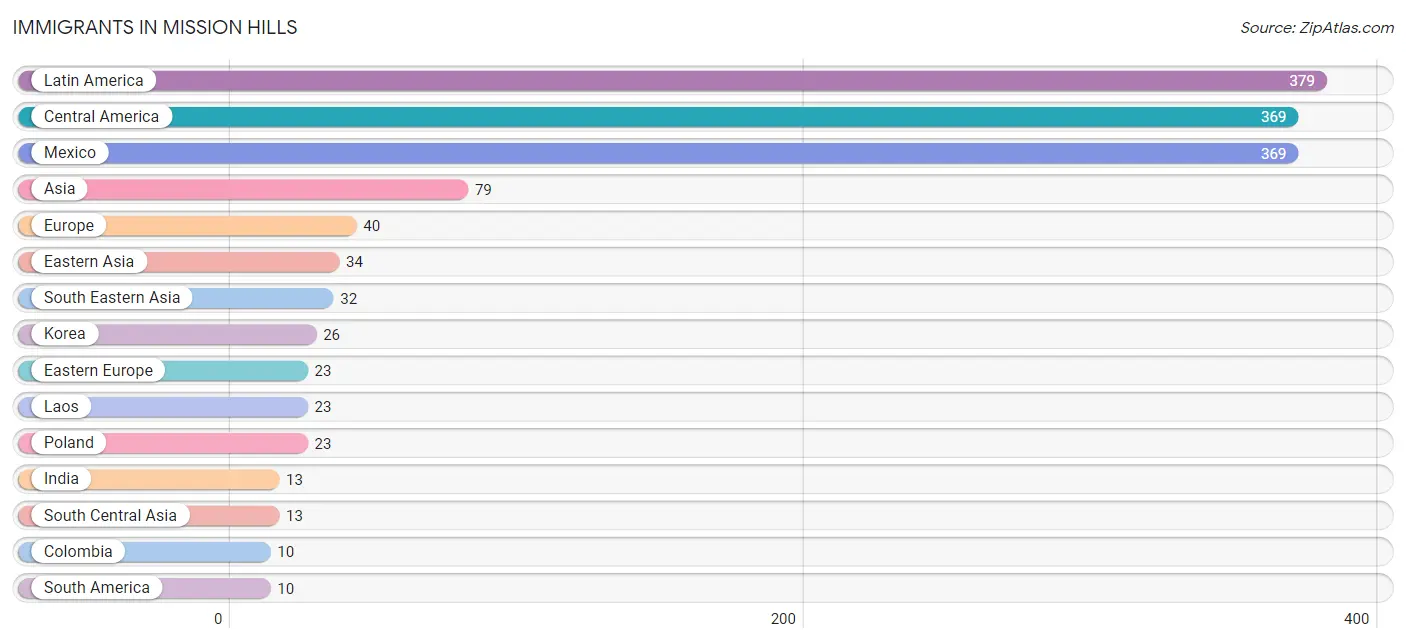
| Immigration Origin | # Population | % Population |
| Asia | 79 | 2.3% |
| Central America | 369 | 10.7% |
| Colombia | 10 | 0.3% |
| Eastern Asia | 34 | 1.0% |
| Eastern Europe | 23 | 0.7% |
| England | 9 | 0.3% |
| Europe | 40 | 1.2% |
| Germany | 8 | 0.2% |
| India | 13 | 0.4% |
| Japan | 8 | 0.2% |
| Korea | 26 | 0.7% |
| Laos | 23 | 0.7% |
| Latin America | 379 | 11.0% |
| Mexico | 369 | 10.7% |
| Northern Europe | 9 | 0.3% |
| Philippines | 9 | 0.3% |
| Poland | 23 | 0.7% |
| South America | 10 | 0.3% |
| South Central Asia | 13 | 0.4% |
| South Eastern Asia | 32 | 0.9% |
| Western Europe | 8 | 0.2% | View All 21 Rows |
Sex and Age in Mission Hills
Sex and Age in Mission Hills
The most populous age groups in Mission Hills are 60 to 64 Years (278 | 17.6%) for men and 60 to 64 Years (303 | 16.2%) for women.
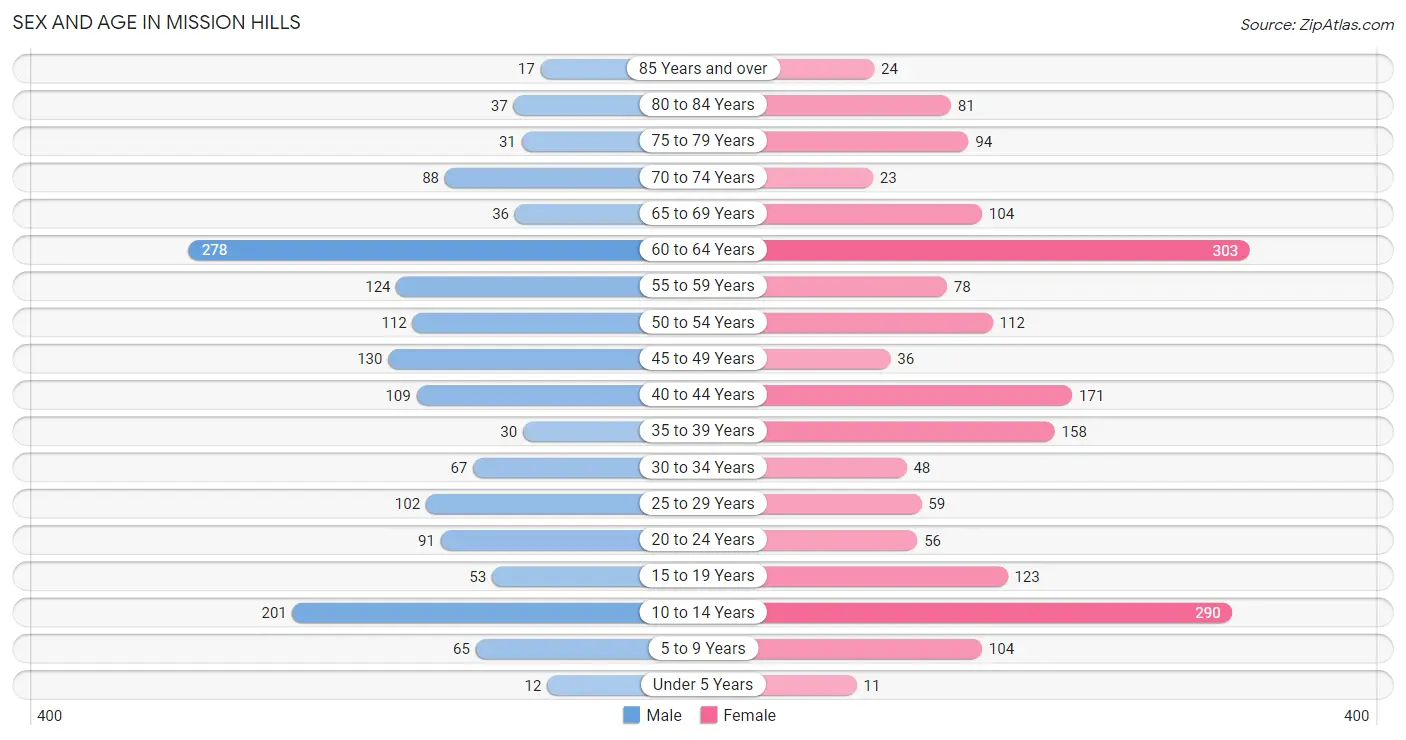
| Age Bracket | Male | Female |
| Under 5 Years | 12 (0.8%) | 11 (0.6%) |
| 5 to 9 Years | 65 (4.1%) | 104 (5.6%) |
| 10 to 14 Years | 201 (12.7%) | 290 (15.5%) |
| 15 to 19 Years | 53 (3.4%) | 123 (6.6%) |
| 20 to 24 Years | 91 (5.8%) | 56 (3.0%) |
| 25 to 29 Years | 102 (6.4%) | 59 (3.2%) |
| 30 to 34 Years | 67 (4.2%) | 48 (2.6%) |
| 35 to 39 Years | 30 (1.9%) | 158 (8.4%) |
| 40 to 44 Years | 109 (6.9%) | 171 (9.1%) |
| 45 to 49 Years | 130 (8.2%) | 36 (1.9%) |
| 50 to 54 Years | 112 (7.1%) | 112 (6.0%) |
| 55 to 59 Years | 124 (7.8%) | 78 (4.2%) |
| 60 to 64 Years | 278 (17.6%) | 303 (16.2%) |
| 65 to 69 Years | 36 (2.3%) | 104 (5.6%) |
| 70 to 74 Years | 88 (5.6%) | 23 (1.2%) |
| 75 to 79 Years | 31 (2.0%) | 94 (5.0%) |
| 80 to 84 Years | 37 (2.3%) | 81 (4.3%) |
| 85 Years and over | 17 (1.1%) | 24 (1.3%) |
| Total | 1,583 (100.0%) | 1,875 (100.0%) |
Families and Households in Mission Hills
Median Family Size in Mission Hills
The median family size in Mission Hills is 3.39 persons per family, with married-couple families (730 | 78.5%) accounting for the largest median family size of 3.51 persons per family. On the other hand, single male/father families (90 | 9.7%) represent the smallest median family size with 2.62 persons per family.
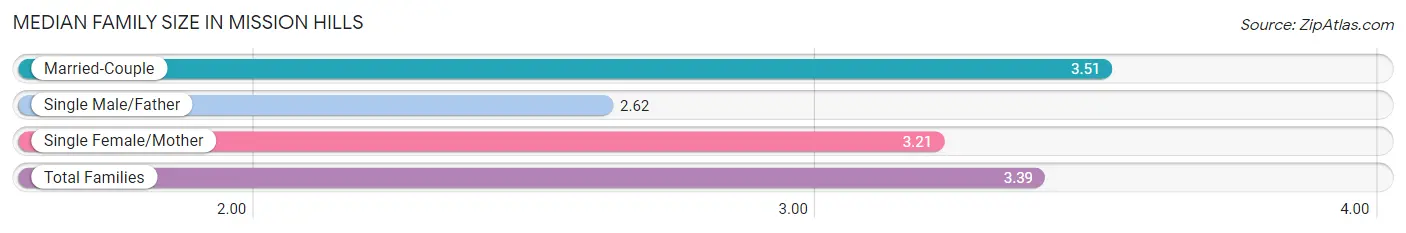
| Family Type | # Families | Family Size |
| Married-Couple | 730 (78.5%) | 3.51 |
| Single Male/Father | 90 (9.7%) | 2.62 |
| Single Female/Mother | 110 (11.8%) | 3.21 |
| Total Families | 930 (100.0%) | 3.39 |
Median Household Size in Mission Hills
The median household size in Mission Hills is 2.97 persons per household, with married-couple households (730 | 62.6%) accounting for the largest median household size of 3.55 persons per household. non-family households (236 | 20.2%) represent the smallest median household size with 1.15 persons per household.
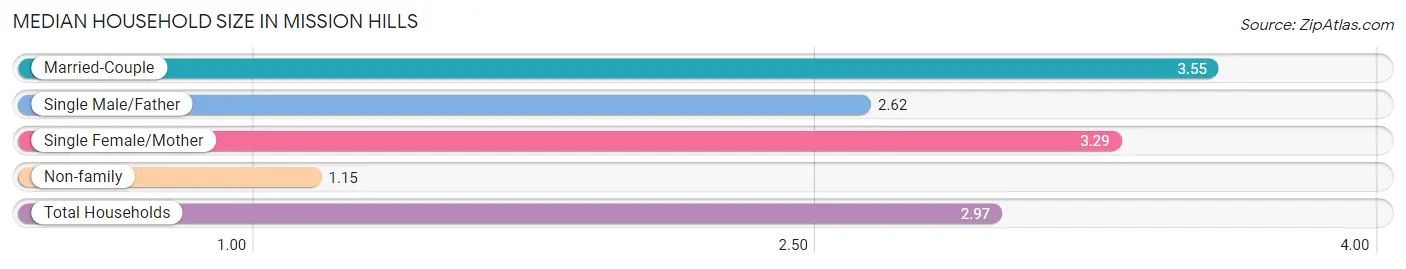
| Household Type | # Households | Household Size |
| Married-Couple | 730 (62.6%) | 3.55 |
| Single Male/Father | 90 (7.7%) | 2.62 |
| Single Female/Mother | 110 (9.4%) | 3.29 |
| Non-family | 236 (20.2%) | 1.15 |
| Total Households | 1,166 (100.0%) | 2.97 |
Household Size by Marriage Status in Mission Hills
Out of a total of 1,166 households in Mission Hills, 930 (79.8%) are family households, while 236 (20.2%) are nonfamily households. The most numerous type of family households are 2-person households, comprising 406, and the most common type of nonfamily households are 1-person households, comprising 209.
| Household Size | Family Households | Nonfamily Households |
| 1-Person Households | - | 209 (17.9%) |
| 2-Person Households | 406 (34.8%) | 21 (1.8%) |
| 3-Person Households | 193 (16.6%) | 6 (0.5%) |
| 4-Person Households | 127 (10.9%) | 0 (0.0%) |
| 5-Person Households | 140 (12.0%) | 0 (0.0%) |
| 6-Person Households | 49 (4.2%) | 0 (0.0%) |
| 7+ Person Households | 15 (1.3%) | 0 (0.0%) |
| Total | 930 (79.8%) | 236 (20.2%) |
Female Fertility in Mission Hills
Fertility by Age in Mission Hills
| Age Bracket | Women with Births | Births / 1,000 Women |
| 15 to 19 years | 0 (0.0%) | 0.0 |
| 20 to 34 years | 0 (0.0%) | 0.0 |
| 35 to 50 years | 0 (0.0%) | 0.0 |
| Total | 0 (0.0%) | 0.0 |
Fertility by Age by Marriage Status in Mission Hills
| Age Bracket | Married | Unmarried |
| 15 to 19 years | 0 (0.0%) | 0 (0.0%) |
| 20 to 34 years | 0 (0.0%) | 0 (0.0%) |
| 35 to 50 years | 0 (0.0%) | 0 (0.0%) |
| Total | 0 (0.0%) | 0 (0.0%) |
Fertility by Education in Mission Hills
| Educational Attainment | Women with Births | Births / 1,000 Women |
| Less than High School | 0 (0.0%) | 0.0 |
| High School Diploma | 0 (0.0%) | 0.0 |
| College or Associate's Degree | 0 (0.0%) | 0.0 |
| Bachelor's Degree | 0 (0.0%) | 0.0 |
| Graduate Degree | 0 (0.0%) | 0.0 |
| Total | 0 (0.0%) | 0.0 |
Fertility by Education by Marriage Status in Mission Hills
| Educational Attainment | Married | Unmarried |
| Less than High School | 0 (0.0%) | 0 (0.0%) |
| High School Diploma | 0 (0.0%) | 0 (0.0%) |
| College or Associate's Degree | 0 (0.0%) | 0 (0.0%) |
| Bachelor's Degree | 0 (0.0%) | 0 (0.0%) |
| Graduate Degree | 0 (0.0%) | 0 (0.0%) |
| Total | 0 (0.0%) | 0 (0.0%) |
Employment Characteristics in Mission Hills
Employment by Class of Employer in Mission Hills
Among the 1,625 employed individuals in Mission Hills, private company employees (937 | 57.7%), federal government employees (173 | 10.6%), and not-for-profit organizations (172 | 10.6%) make up the most common classes of employment.
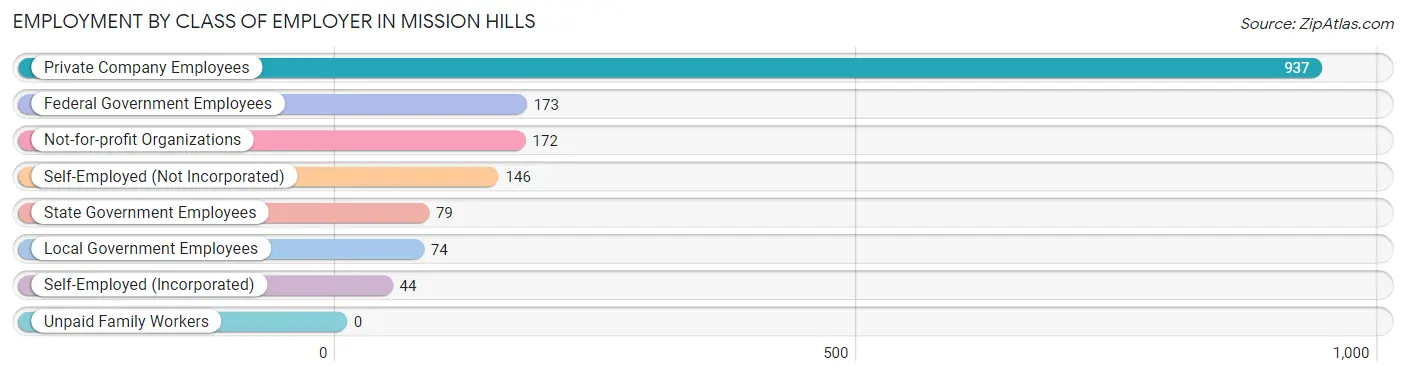
| Employer Class | # Employees | % Employees |
| Private Company Employees | 937 | 57.7% |
| Self-Employed (Incorporated) | 44 | 2.7% |
| Self-Employed (Not Incorporated) | 146 | 9.0% |
| Not-for-profit Organizations | 172 | 10.6% |
| Local Government Employees | 74 | 4.5% |
| State Government Employees | 79 | 4.9% |
| Federal Government Employees | 173 | 10.6% |
| Unpaid Family Workers | 0 | 0.0% |
| Total | 1,625 | 100.0% |
Employment Status by Age in Mission Hills
According to the labor force statistics for Mission Hills, out of the total population over 16 years of age (2,712), 67.6% or 1,833 individuals are in the labor force, with 5.0% or 92 of them unemployed. The age group with the highest labor force participation rate is 25 to 29 years, with 94.4% or 152 individuals in the labor force. Within the labor force, the 75 years and over age range has the highest percentage of unemployed individuals, with 52.6% or 10 of them being unemployed.
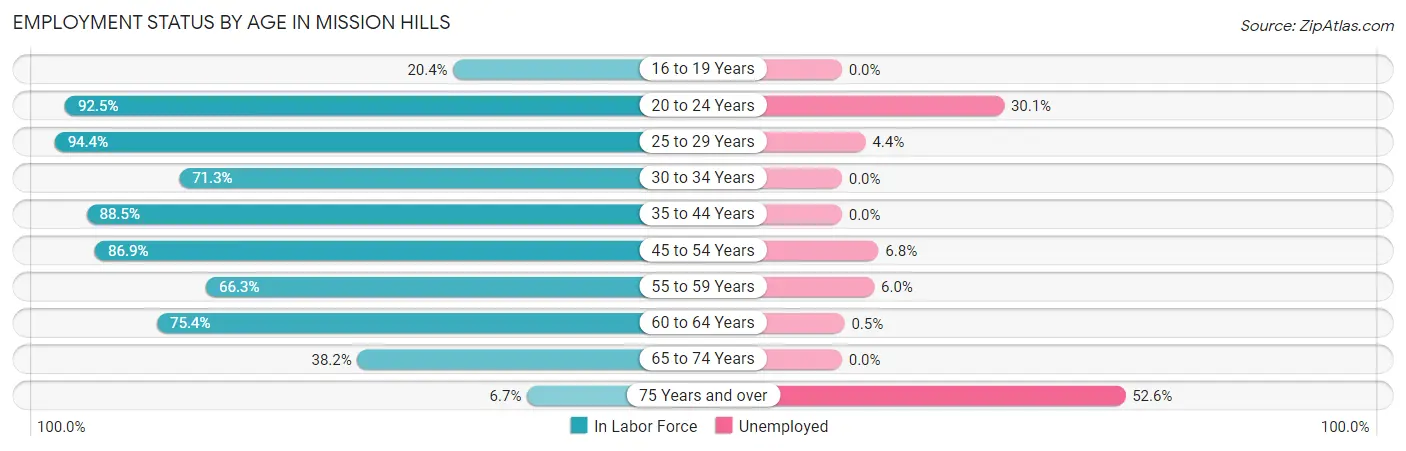
| Age Bracket | In Labor Force | Unemployed |
| 16 to 19 Years | 23 (20.4%) | 0 (0.0%) |
| 20 to 24 Years | 136 (92.5%) | 41 (30.1%) |
| 25 to 29 Years | 152 (94.4%) | 7 (4.4%) |
| 30 to 34 Years | 82 (71.3%) | 0 (0.0%) |
| 35 to 44 Years | 414 (88.5%) | 0 (0.0%) |
| 45 to 54 Years | 339 (86.9%) | 23 (6.8%) |
| 55 to 59 Years | 134 (66.3%) | 8 (6.0%) |
| 60 to 64 Years | 438 (75.4%) | 2 (0.5%) |
| 65 to 74 Years | 96 (38.2%) | 0 (0.0%) |
| 75 Years and over | 19 (6.7%) | 10 (52.6%) |
| Total | 1,833 (67.6%) | 92 (5.0%) |
Employment Status by Educational Attainment in Mission Hills
According to labor force statistics for Mission Hills, 81.3% of individuals (1,559) out of the total population between 25 and 64 years of age (1,917) are in the labor force, with 2.5% or 39 of them being unemployed. The group with the highest labor force participation rate are those with the educational attainment of bachelor's degree or higher, with 93.7% or 567 individuals in the labor force. Within the labor force, individuals with less than high school education have the highest percentage of unemployment, with 26.7% or 16 of them being unemployed.
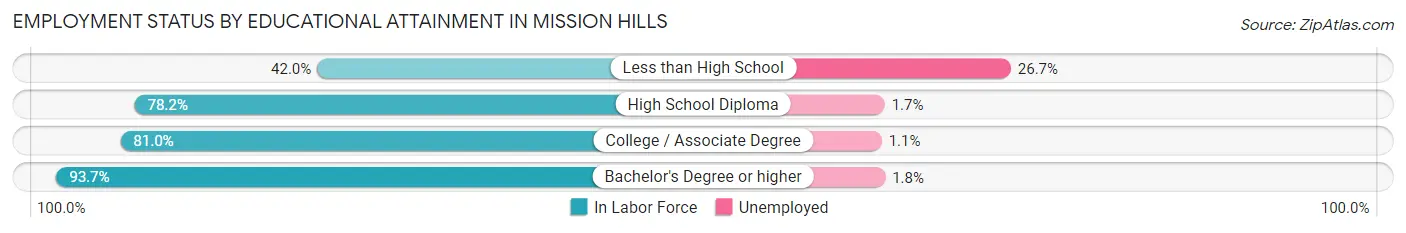
| Educational Attainment | In Labor Force | Unemployed |
| Less than High School | 60 (42.0%) | 38 (26.7%) |
| High School Diploma | 408 (78.2%) | 9 (1.7%) |
| College / Associate Degree | 524 (81.0%) | 7 (1.1%) |
| Bachelor's Degree or higher | 567 (93.7%) | 11 (1.8%) |
| Total | 1,559 (81.3%) | 48 (2.5%) |
Employment Occupations by Sex in Mission Hills
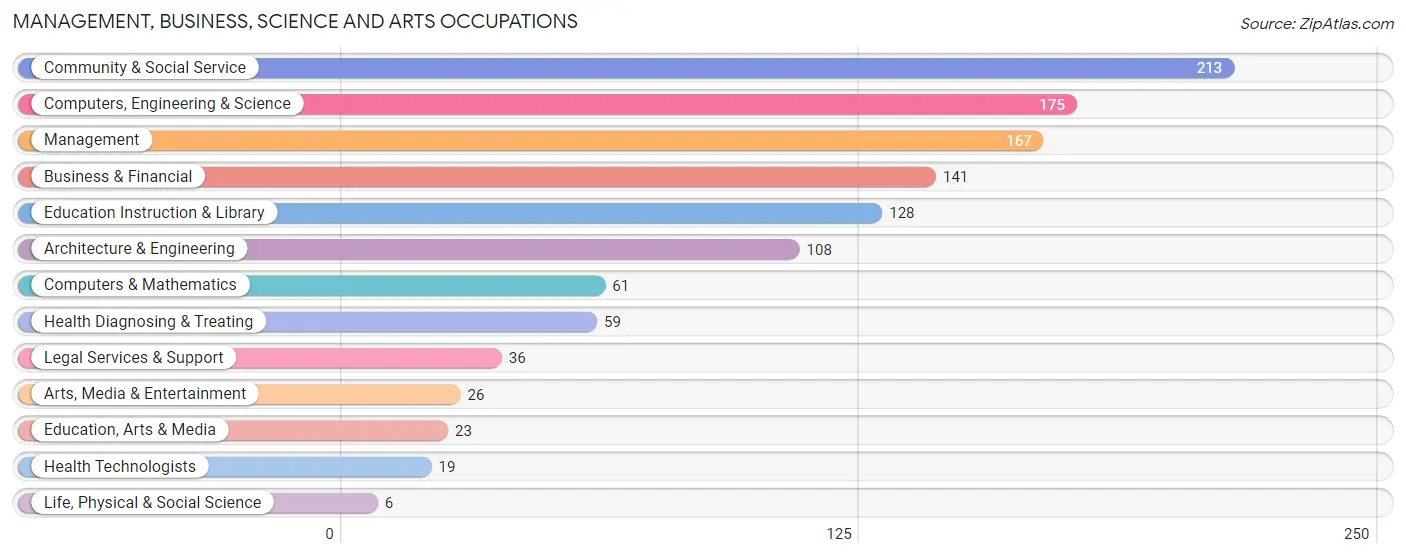
Management, Business, Science and Arts Occupations
The most common Management, Business, Science and Arts occupations in Mission Hills are Community & Social Service (213 | 12.3%), Computers, Engineering & Science (175 | 10.1%), Management (167 | 9.7%), Business & Financial (141 | 8.2%), and Education Instruction & Library (128 | 7.4%).
Management, Business, Science and Arts Occupations by Sex
Within the Management, Business, Science and Arts occupations in Mission Hills, the most male-oriented occupations are Education, Arts & Media (100.0%), Arts, Media & Entertainment (100.0%), and Health Technologists (100.0%), while the most female-oriented occupations are Life, Physical & Social Science (100.0%), Legal Services & Support (86.1%), and Education Instruction & Library (81.2%).
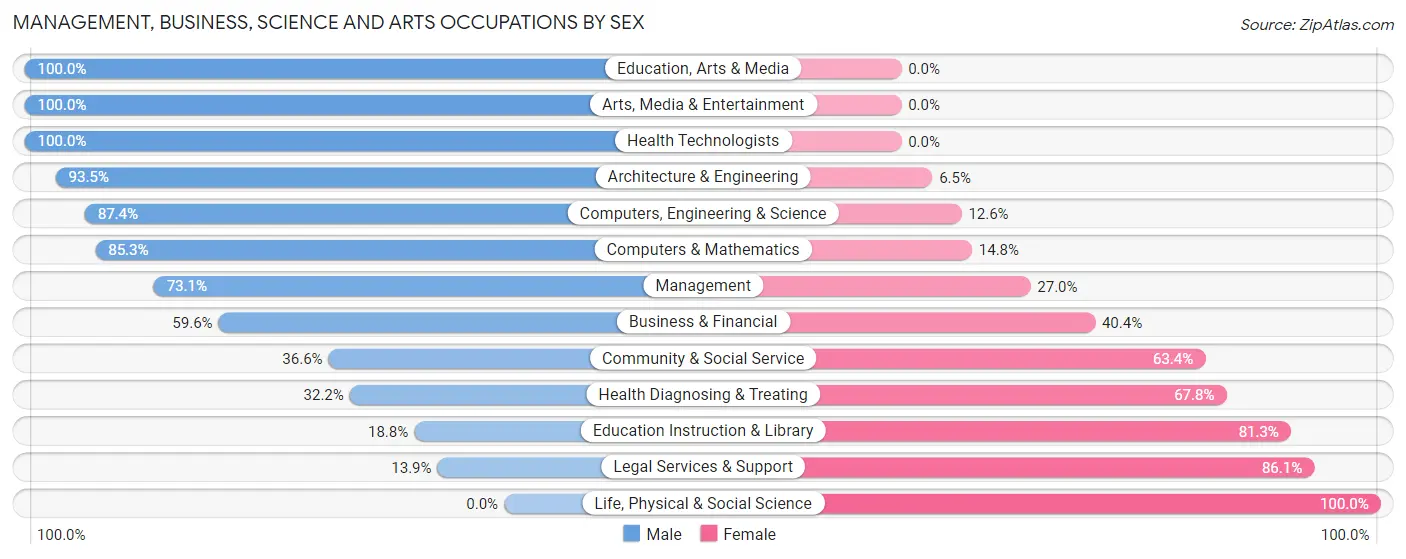
| Occupation | Male | Female |
| Management | 122 (73.1%) | 45 (27.0%) |
| Business & Financial | 84 (59.6%) | 57 (40.4%) |
| Computers, Engineering & Science | 153 (87.4%) | 22 (12.6%) |
| Computers & Mathematics | 52 (85.3%) | 9 (14.7%) |
| Architecture & Engineering | 101 (93.5%) | 7 (6.5%) |
| Life, Physical & Social Science | 0 (0.0%) | 6 (100.0%) |
| Community & Social Service | 78 (36.6%) | 135 (63.4%) |
| Education, Arts & Media | 23 (100.0%) | 0 (0.0%) |
| Legal Services & Support | 5 (13.9%) | 31 (86.1%) |
| Education Instruction & Library | 24 (18.8%) | 104 (81.2%) |
| Arts, Media & Entertainment | 26 (100.0%) | 0 (0.0%) |
| Health Diagnosing & Treating | 19 (32.2%) | 40 (67.8%) |
| Health Technologists | 19 (100.0%) | 0 (0.0%) |
| Total (Category) | 456 (60.4%) | 299 (39.6%) |
| Total (Overall) | 883 (51.1%) | 844 (48.9%) |
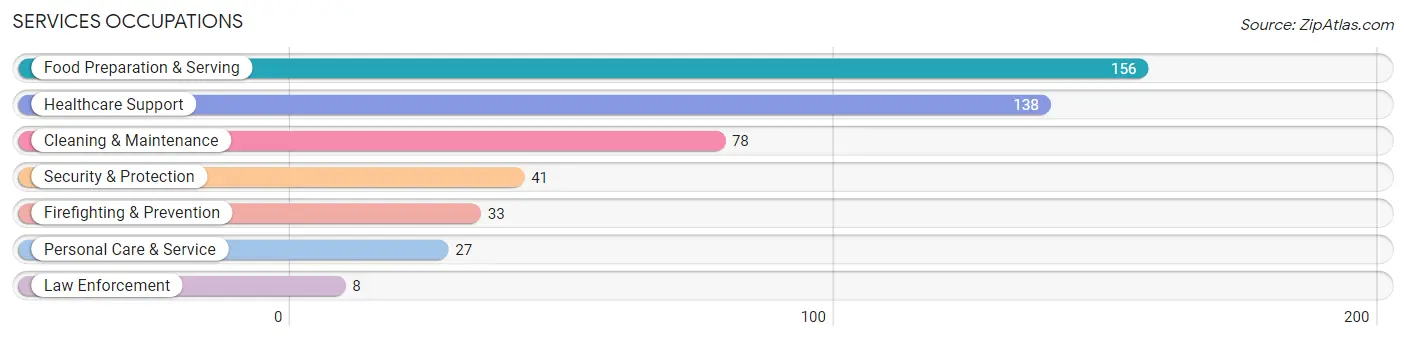
Services Occupations
The most common Services occupations in Mission Hills are Food Preparation & Serving (156 | 9.0%), Healthcare Support (138 | 8.0%), Cleaning & Maintenance (78 | 4.5%), Security & Protection (41 | 2.4%), and Firefighting & Prevention (33 | 1.9%).
Services Occupations by Sex
Within the Services occupations in Mission Hills, the most male-oriented occupations are Security & Protection (100.0%), Firefighting & Prevention (100.0%), and Law Enforcement (100.0%), while the most female-oriented occupations are Personal Care & Service (100.0%), Food Preparation & Serving (86.5%), and Healthcare Support (81.2%).
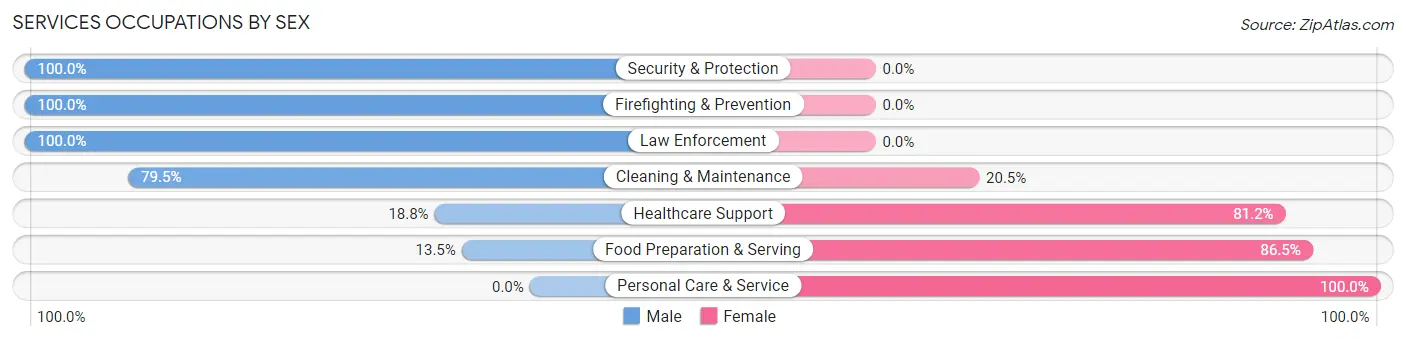
| Occupation | Male | Female |
| Healthcare Support | 26 (18.8%) | 112 (81.2%) |
| Security & Protection | 41 (100.0%) | 0 (0.0%) |
| Firefighting & Prevention | 33 (100.0%) | 0 (0.0%) |
| Law Enforcement | 8 (100.0%) | 0 (0.0%) |
| Food Preparation & Serving | 21 (13.5%) | 135 (86.5%) |
| Cleaning & Maintenance | 62 (79.5%) | 16 (20.5%) |
| Personal Care & Service | 0 (0.0%) | 27 (100.0%) |
| Total (Category) | 150 (34.1%) | 290 (65.9%) |
| Total (Overall) | 883 (51.1%) | 844 (48.9%) |
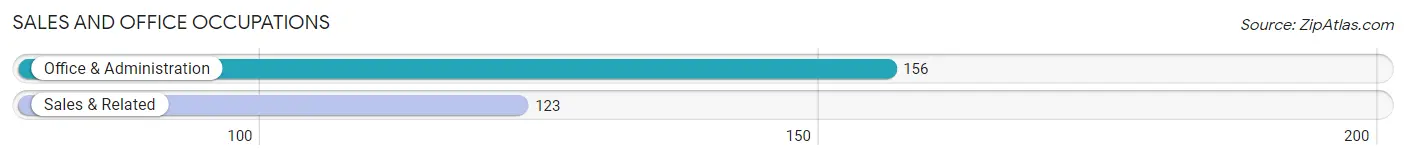
Sales and Office Occupations
The most common Sales and Office occupations in Mission Hills are Office & Administration (156 | 9.0%), and Sales & Related (123 | 7.1%).
Sales and Office Occupations by Sex
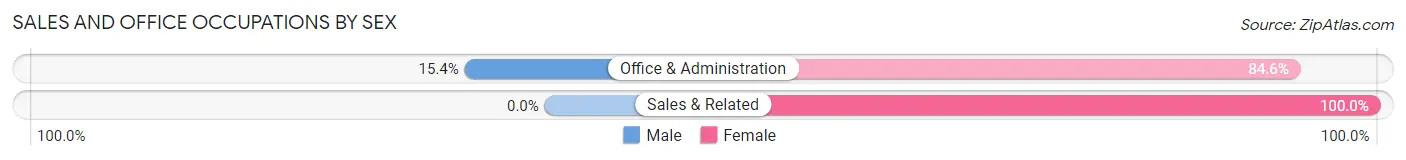
| Occupation | Male | Female |
| Sales & Related | 0 (0.0%) | 123 (100.0%) |
| Office & Administration | 24 (15.4%) | 132 (84.6%) |
| Total (Category) | 24 (8.6%) | 255 (91.4%) |
| Total (Overall) | 883 (51.1%) | 844 (48.9%) |
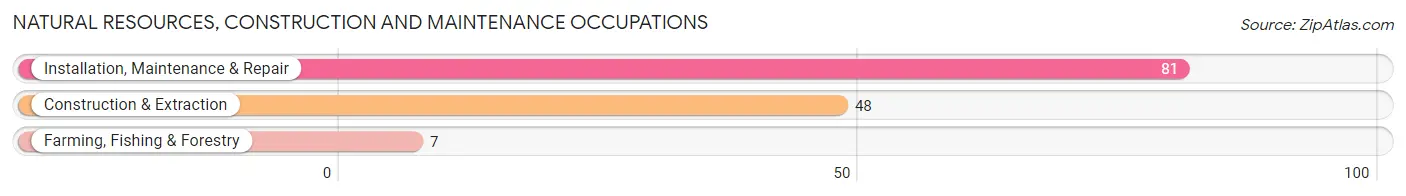
Natural Resources, Construction and Maintenance Occupations
The most common Natural Resources, Construction and Maintenance occupations in Mission Hills are Installation, Maintenance & Repair (81 | 4.7%), Construction & Extraction (48 | 2.8%), and Farming, Fishing & Forestry (7 | 0.4%).
Natural Resources, Construction and Maintenance Occupations by Sex
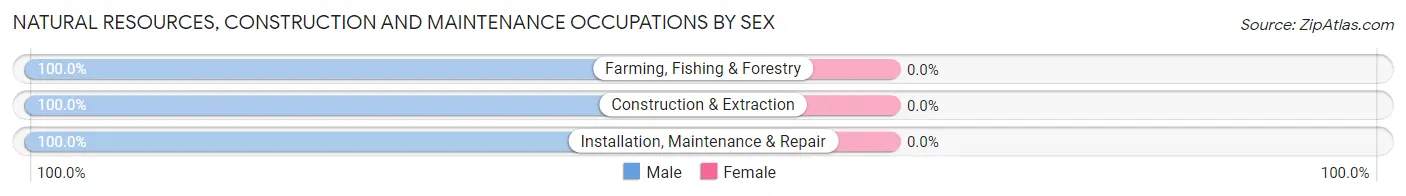
| Occupation | Male | Female |
| Farming, Fishing & Forestry | 7 (100.0%) | 0 (0.0%) |
| Construction & Extraction | 48 (100.0%) | 0 (0.0%) |
| Installation, Maintenance & Repair | 81 (100.0%) | 0 (0.0%) |
| Total (Category) | 136 (100.0%) | 0 (0.0%) |
| Total (Overall) | 883 (51.1%) | 844 (48.9%) |
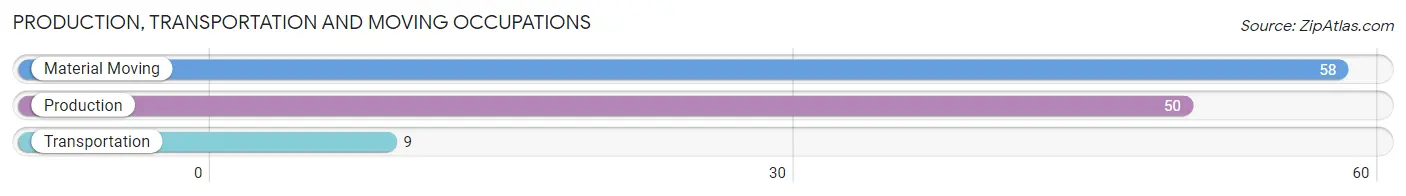
Production, Transportation and Moving Occupations
The most common Production, Transportation and Moving occupations in Mission Hills are Material Moving (58 | 3.4%), Production (50 | 2.9%), and Transportation (9 | 0.5%).
Production, Transportation and Moving Occupations by Sex
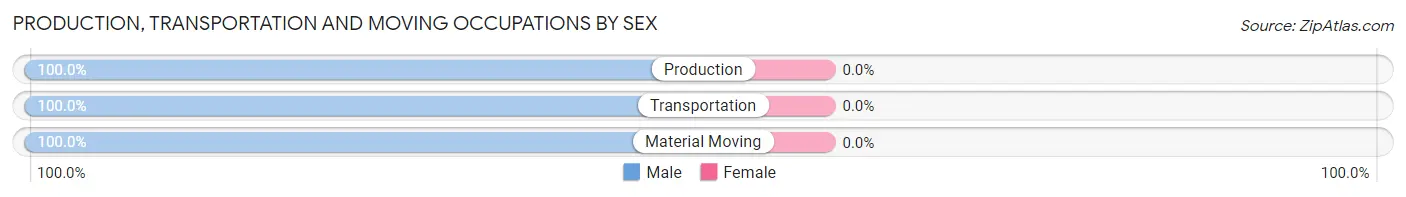
| Occupation | Male | Female |
| Production | 50 (100.0%) | 0 (0.0%) |
| Transportation | 9 (100.0%) | 0 (0.0%) |
| Material Moving | 58 (100.0%) | 0 (0.0%) |
| Total (Category) | 117 (100.0%) | 0 (0.0%) |
| Total (Overall) | 883 (51.1%) | 844 (48.9%) |
Employment Industries by Sex in Mission Hills
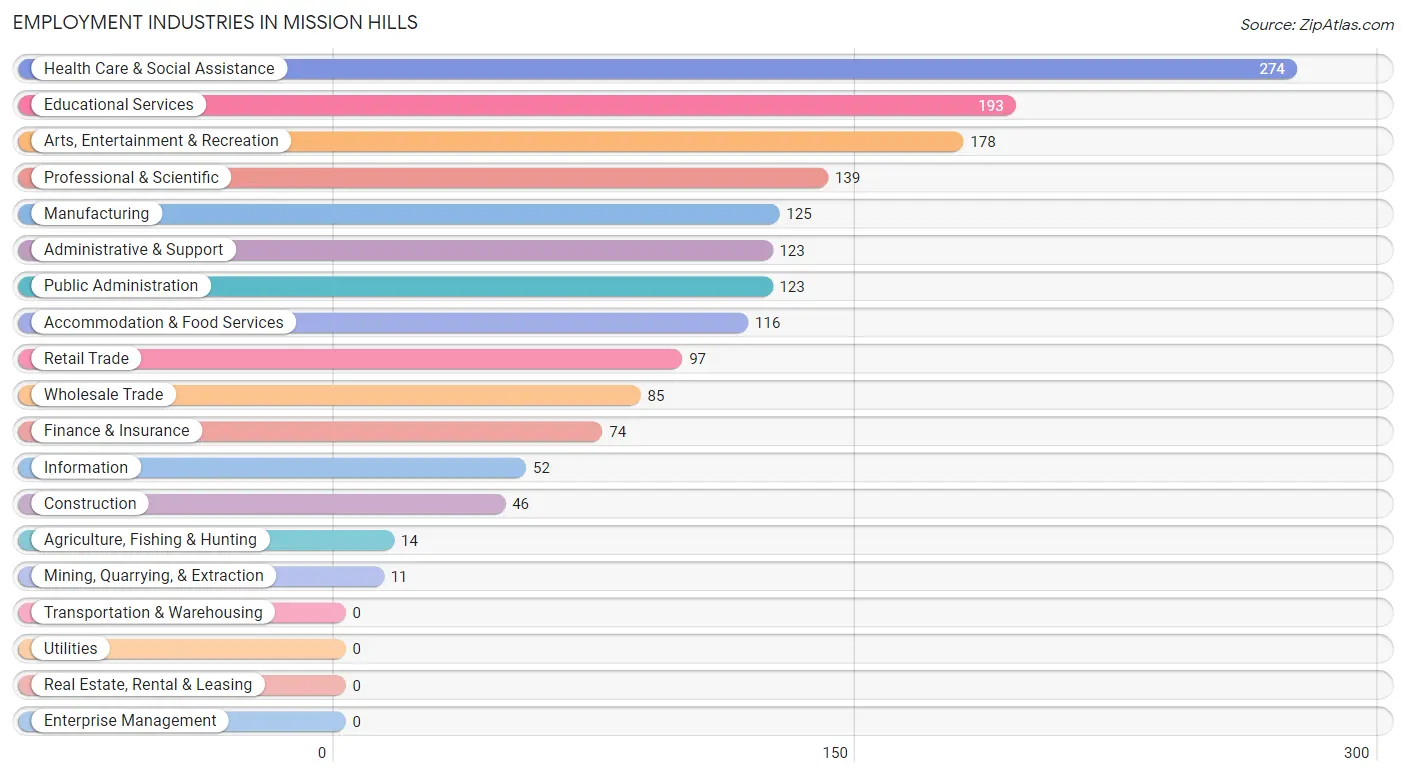
Employment Industries in Mission Hills
The major employment industries in Mission Hills include Health Care & Social Assistance (274 | 15.9%), Educational Services (193 | 11.2%), Arts, Entertainment & Recreation (178 | 10.3%), Professional & Scientific (139 | 8.1%), and Manufacturing (125 | 7.2%).
Employment Industries by Sex in Mission Hills
The Mission Hills industries that see more men than women are Agriculture, Fishing & Hunting (100.0%), Mining, Quarrying, & Extraction (100.0%), and Construction (100.0%), whereas the industries that tend to have a higher number of women are Retail Trade (90.7%), Arts, Entertainment & Recreation (77.0%), and Accommodation & Food Services (74.1%).
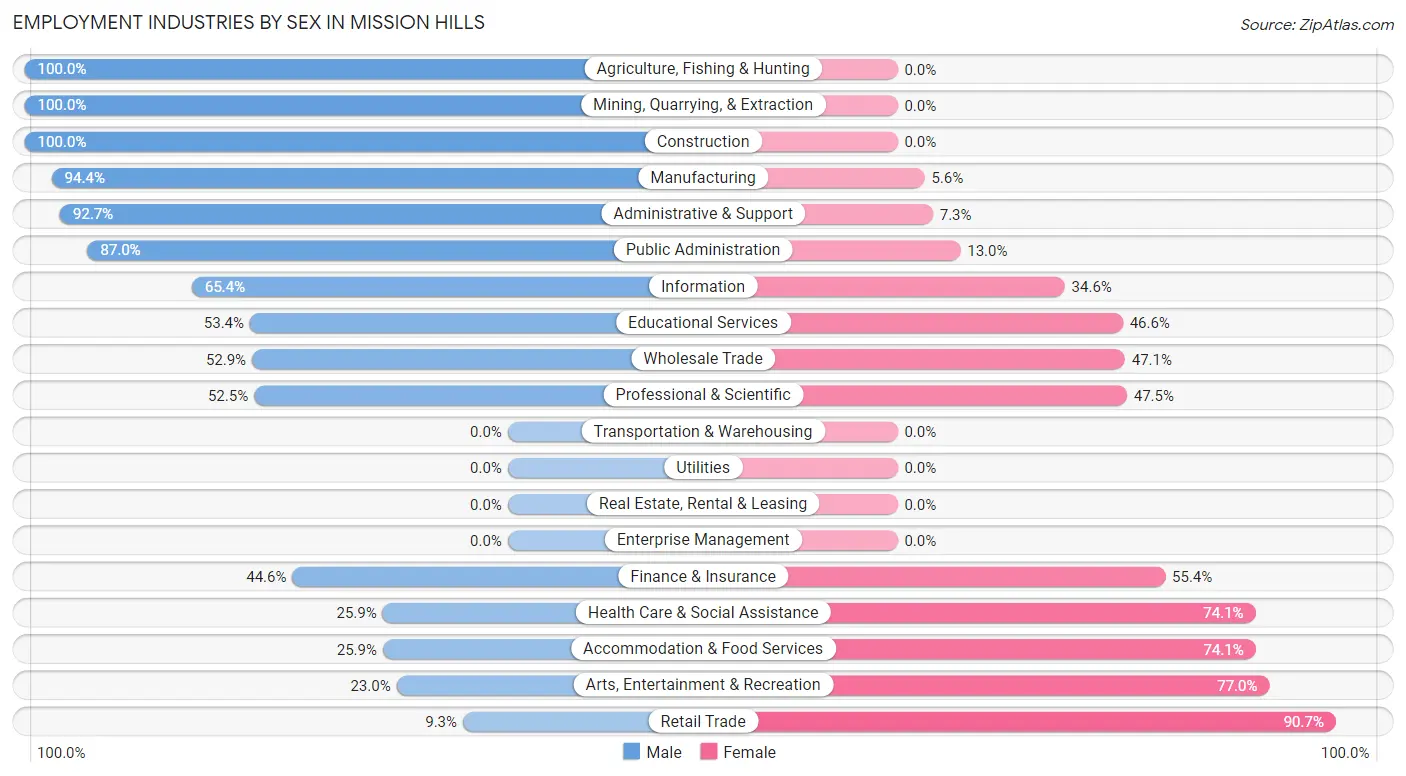
| Industry | Male | Female |
| Agriculture, Fishing & Hunting | 14 (100.0%) | 0 (0.0%) |
| Mining, Quarrying, & Extraction | 11 (100.0%) | 0 (0.0%) |
| Construction | 46 (100.0%) | 0 (0.0%) |
| Manufacturing | 118 (94.4%) | 7 (5.6%) |
| Wholesale Trade | 45 (52.9%) | 40 (47.1%) |
| Retail Trade | 9 (9.3%) | 88 (90.7%) |
| Transportation & Warehousing | 0 (0.0%) | 0 (0.0%) |
| Utilities | 0 (0.0%) | 0 (0.0%) |
| Information | 34 (65.4%) | 18 (34.6%) |
| Finance & Insurance | 33 (44.6%) | 41 (55.4%) |
| Real Estate, Rental & Leasing | 0 (0.0%) | 0 (0.0%) |
| Professional & Scientific | 73 (52.5%) | 66 (47.5%) |
| Enterprise Management | 0 (0.0%) | 0 (0.0%) |
| Administrative & Support | 114 (92.7%) | 9 (7.3%) |
| Educational Services | 103 (53.4%) | 90 (46.6%) |
| Health Care & Social Assistance | 71 (25.9%) | 203 (74.1%) |
| Arts, Entertainment & Recreation | 41 (23.0%) | 137 (77.0%) |
| Accommodation & Food Services | 30 (25.9%) | 86 (74.1%) |
| Public Administration | 107 (87.0%) | 16 (13.0%) |
| Total | 883 (51.1%) | 844 (48.9%) |
Education in Mission Hills
School Enrollment in Mission Hills
The most common levels of schooling among the 965 students in Mission Hills are middle school (337 | 34.9%), elementary school (192 | 19.9%), and high school (172 | 17.8%).
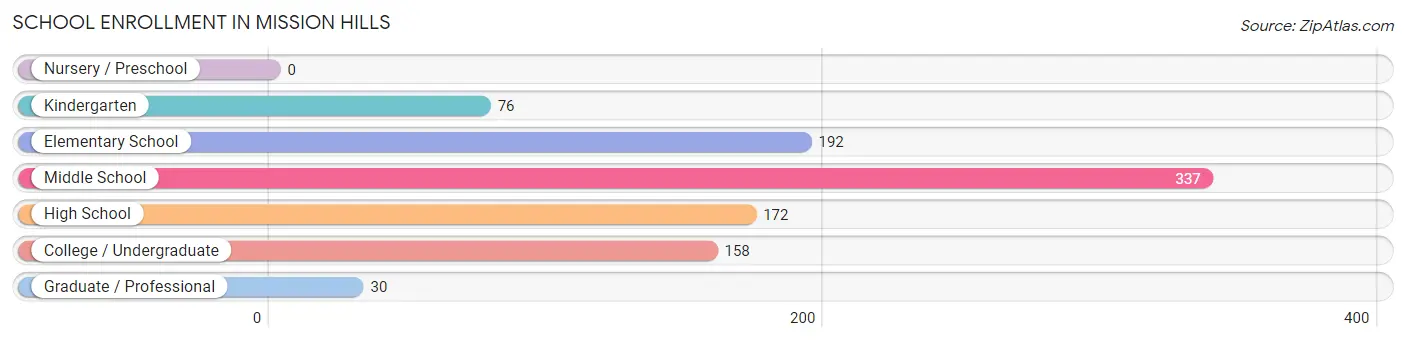
| School Level | # Students | % Students |
| Nursery / Preschool | 0 | 0.0% |
| Kindergarten | 76 | 7.9% |
| Elementary School | 192 | 19.9% |
| Middle School | 337 | 34.9% |
| High School | 172 | 17.8% |
| College / Undergraduate | 158 | 16.4% |
| Graduate / Professional | 30 | 3.1% |
| Total | 965 | 100.0% |
School Enrollment by Age by Funding Source in Mission Hills
Out of a total of 965 students who are enrolled in schools in Mission Hills, 6 (0.6%) attend a private institution, while the remaining 959 (99.4%) are enrolled in public schools. The age group of 10 to 14 year olds has the highest likelihood of being enrolled in private schools, with 6 (1.3% in the age bracket) enrolled. Conversely, the age group of 5 to 9 year old has the lowest likelihood of being enrolled in a private school, with 151 (100.0% in the age bracket) attending a public institution.
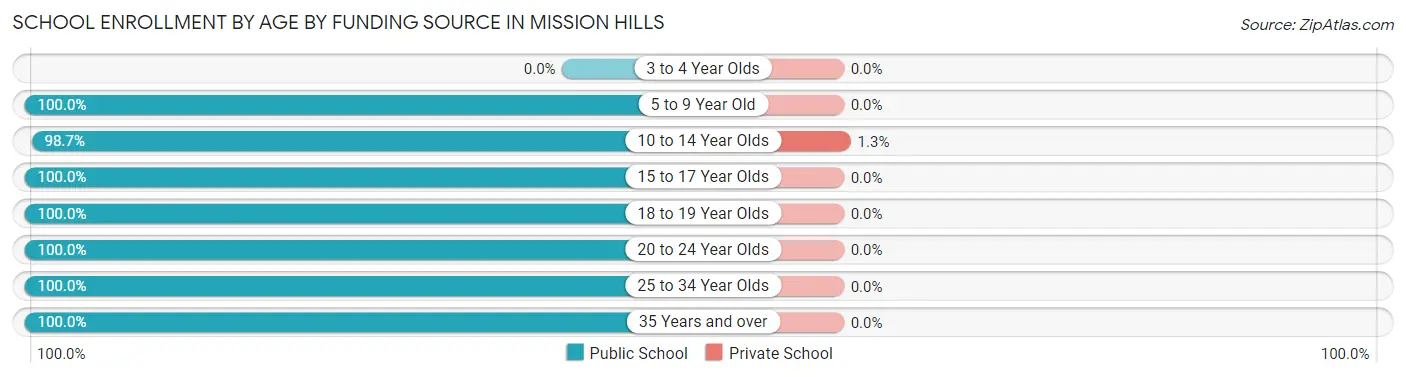
| Age Bracket | Public School | Private School |
| 3 to 4 Year Olds | 0 (0.0%) | 0 (0.0%) |
| 5 to 9 Year Old | 151 (100.0%) | 0 (0.0%) |
| 10 to 14 Year Olds | 454 (98.7%) | 6 (1.3%) |
| 15 to 17 Year Olds | 166 (100.0%) | 0 (0.0%) |
| 18 to 19 Year Olds | 5 (100.0%) | 0 (0.0%) |
| 20 to 24 Year Olds | 44 (100.0%) | 0 (0.0%) |
| 25 to 34 Year Olds | 60 (100.0%) | 0 (0.0%) |
| 35 Years and over | 79 (100.0%) | 0 (0.0%) |
| Total | 959 (99.4%) | 6 (0.6%) |
Educational Attainment by Field of Study in Mission Hills
Business (126 | 16.0%), social sciences (113 | 14.3%), computers & mathematics (103 | 13.1%), engineering (70 | 8.9%), and bio, nature & agricultural (66 | 8.4%) are the most common fields of study among 788 individuals in Mission Hills who have obtained a bachelor's degree or higher.
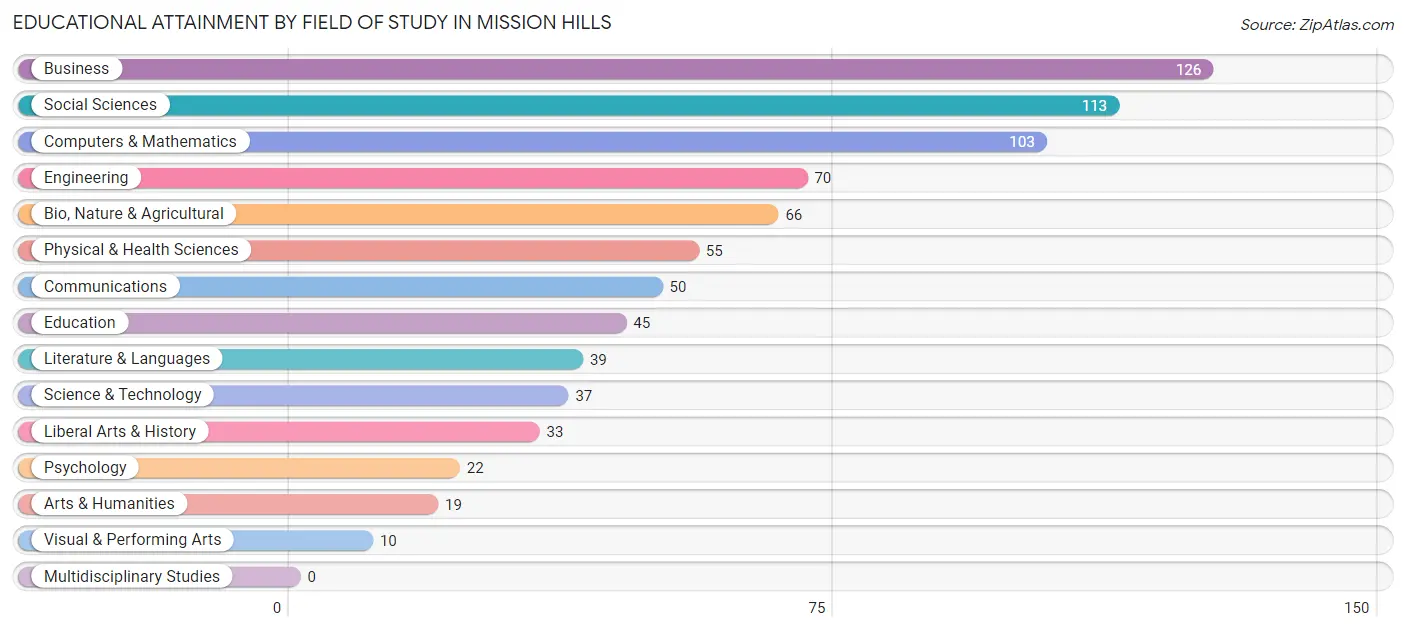
| Field of Study | # Graduates | % Graduates |
| Computers & Mathematics | 103 | 13.1% |
| Bio, Nature & Agricultural | 66 | 8.4% |
| Physical & Health Sciences | 55 | 7.0% |
| Psychology | 22 | 2.8% |
| Social Sciences | 113 | 14.3% |
| Engineering | 70 | 8.9% |
| Multidisciplinary Studies | 0 | 0.0% |
| Science & Technology | 37 | 4.7% |
| Business | 126 | 16.0% |
| Education | 45 | 5.7% |
| Literature & Languages | 39 | 5.0% |
| Liberal Arts & History | 33 | 4.2% |
| Visual & Performing Arts | 10 | 1.3% |
| Communications | 50 | 6.4% |
| Arts & Humanities | 19 | 2.4% |
| Total | 788 | 100.0% |
Transportation & Commute in Mission Hills
Vehicle Availability by Sex in Mission Hills
The most prevalent vehicle ownership categories in Mission Hills are males with 3 vehicles (294, accounting for 36.6%) and females with 3 vehicles (257, making up 35.8%).
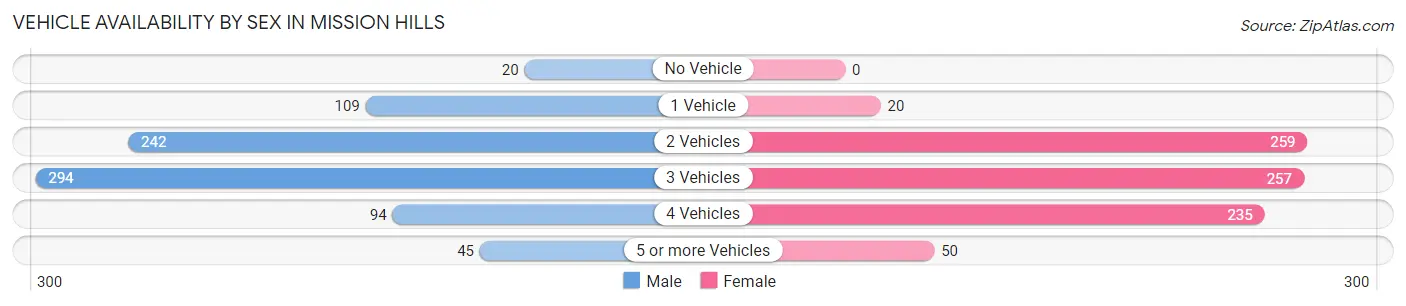
| Vehicles Available | Male | Female |
| No Vehicle | 20 (2.5%) | 0 (0.0%) |
| 1 Vehicle | 109 (13.6%) | 20 (2.4%) |
| 2 Vehicles | 242 (30.1%) | 259 (31.6%) |
| 3 Vehicles | 294 (36.6%) | 257 (31.3%) |
| 4 Vehicles | 94 (11.7%) | 235 (28.6%) |
| 5 or more Vehicles | 45 (5.6%) | 50 (6.1%) |
| Total | 804 (100.0%) | 821 (100.0%) |
Commute Time in Mission Hills
The most frequently occuring commute durations in Mission Hills are 30 to 34 minutes (239 commuters, 16.1%), 25 to 29 minutes (213 commuters, 14.3%), and 20 to 24 minutes (197 commuters, 13.3%).
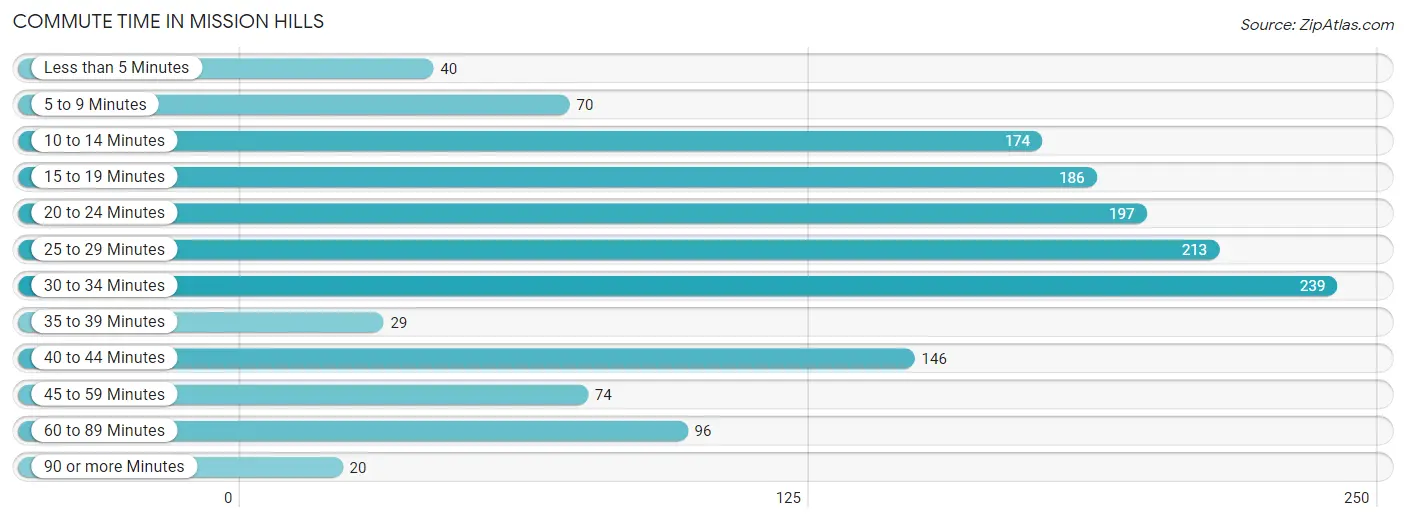
| Commute Time | # Commuters | % Commuters |
| Less than 5 Minutes | 40 | 2.7% |
| 5 to 9 Minutes | 70 | 4.7% |
| 10 to 14 Minutes | 174 | 11.7% |
| 15 to 19 Minutes | 186 | 12.5% |
| 20 to 24 Minutes | 197 | 13.3% |
| 25 to 29 Minutes | 213 | 14.3% |
| 30 to 34 Minutes | 239 | 16.1% |
| 35 to 39 Minutes | 29 | 1.9% |
| 40 to 44 Minutes | 146 | 9.8% |
| 45 to 59 Minutes | 74 | 5.0% |
| 60 to 89 Minutes | 96 | 6.5% |
| 90 or more Minutes | 20 | 1.3% |
Commute Time by Sex in Mission Hills
The most common commute times in Mission Hills are 20 to 24 minutes (167 commuters, 23.0%) for males and 40 to 44 minutes (146 commuters, 19.3%) for females.
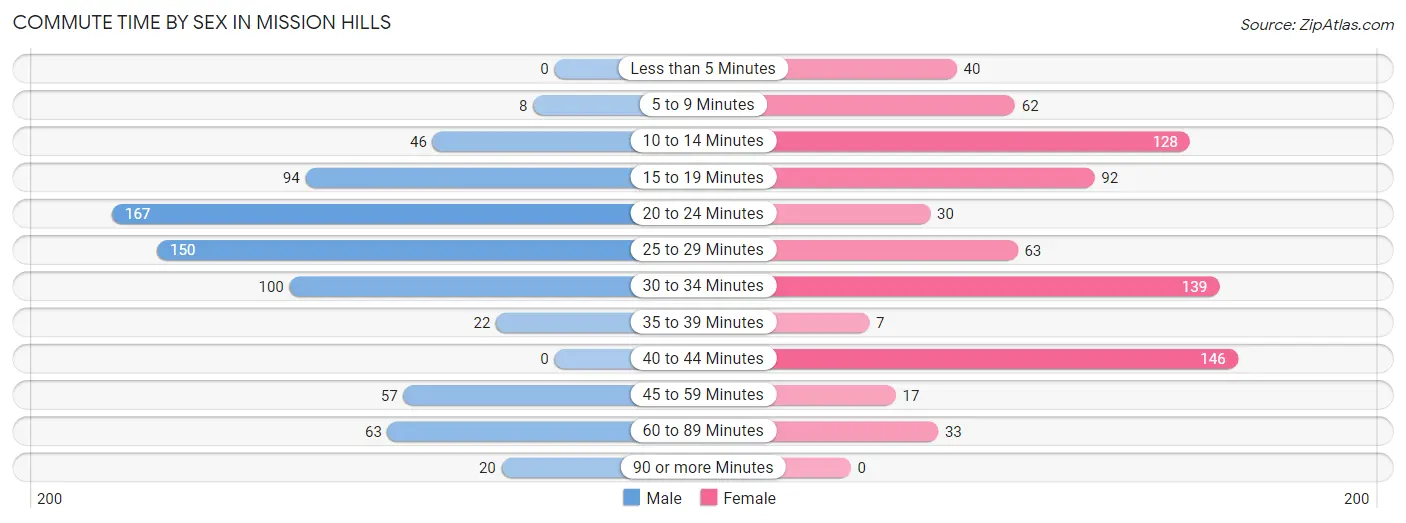
| Commute Time | Male | Female |
| Less than 5 Minutes | 0 (0.0%) | 40 (5.3%) |
| 5 to 9 Minutes | 8 (1.1%) | 62 (8.2%) |
| 10 to 14 Minutes | 46 (6.3%) | 128 (16.9%) |
| 15 to 19 Minutes | 94 (12.9%) | 92 (12.1%) |
| 20 to 24 Minutes | 167 (23.0%) | 30 (4.0%) |
| 25 to 29 Minutes | 150 (20.6%) | 63 (8.3%) |
| 30 to 34 Minutes | 100 (13.8%) | 139 (18.4%) |
| 35 to 39 Minutes | 22 (3.0%) | 7 (0.9%) |
| 40 to 44 Minutes | 0 (0.0%) | 146 (19.3%) |
| 45 to 59 Minutes | 57 (7.8%) | 17 (2.2%) |
| 60 to 89 Minutes | 63 (8.7%) | 33 (4.4%) |
| 90 or more Minutes | 20 (2.8%) | 0 (0.0%) |
Time of Departure to Work by Sex in Mission Hills
The most frequent times of departure to work in Mission Hills are 7:30 AM to 7:59 AM (228, 31.4%) for males and 7:30 AM to 7:59 AM (183, 24.2%) for females.
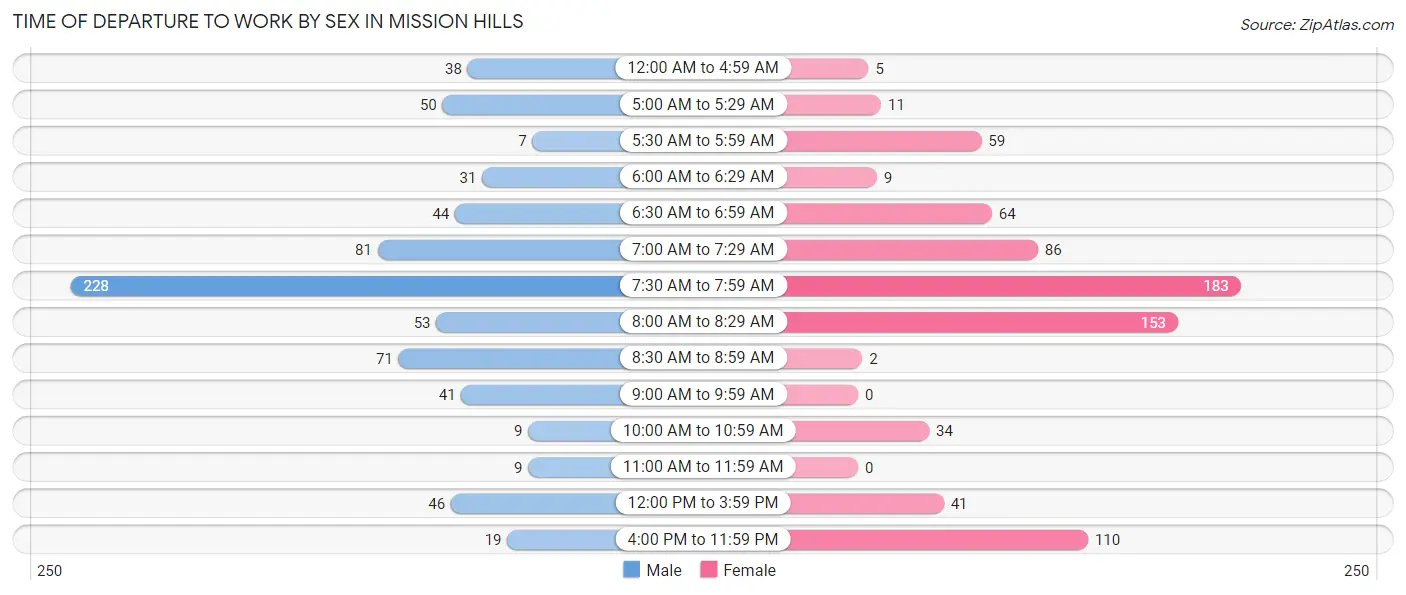
| Time of Departure | Male | Female |
| 12:00 AM to 4:59 AM | 38 (5.2%) | 5 (0.7%) |
| 5:00 AM to 5:29 AM | 50 (6.9%) | 11 (1.5%) |
| 5:30 AM to 5:59 AM | 7 (1.0%) | 59 (7.8%) |
| 6:00 AM to 6:29 AM | 31 (4.3%) | 9 (1.2%) |
| 6:30 AM to 6:59 AM | 44 (6.0%) | 64 (8.5%) |
| 7:00 AM to 7:29 AM | 81 (11.1%) | 86 (11.4%) |
| 7:30 AM to 7:59 AM | 228 (31.4%) | 183 (24.2%) |
| 8:00 AM to 8:29 AM | 53 (7.3%) | 153 (20.2%) |
| 8:30 AM to 8:59 AM | 71 (9.8%) | 2 (0.3%) |
| 9:00 AM to 9:59 AM | 41 (5.6%) | 0 (0.0%) |
| 10:00 AM to 10:59 AM | 9 (1.2%) | 34 (4.5%) |
| 11:00 AM to 11:59 AM | 9 (1.2%) | 0 (0.0%) |
| 12:00 PM to 3:59 PM | 46 (6.3%) | 41 (5.4%) |
| 4:00 PM to 11:59 PM | 19 (2.6%) | 110 (14.5%) |
| Total | 727 (100.0%) | 757 (100.0%) |
Housing Occupancy in Mission Hills
Occupancy by Ownership in Mission Hills
Of the total 1,166 dwellings in Mission Hills, owner-occupied units account for 874 (75.0%), while renter-occupied units make up 292 (25.0%).
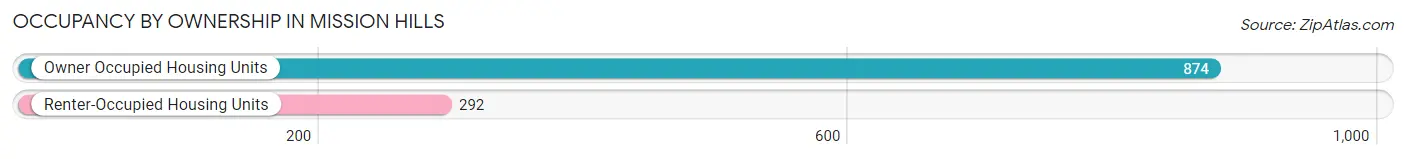
| Occupancy | # Housing Units | % Housing Units |
| Owner Occupied Housing Units | 874 | 75.0% |
| Renter-Occupied Housing Units | 292 | 25.0% |
| Total Occupied Housing Units | 1,166 | 100.0% |
Occupancy by Household Size in Mission Hills
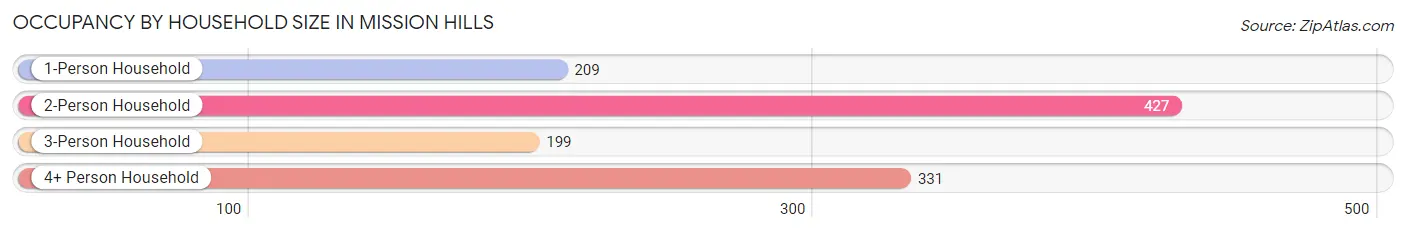
| Household Size | # Housing Units | % Housing Units |
| 1-Person Household | 209 | 17.9% |
| 2-Person Household | 427 | 36.6% |
| 3-Person Household | 199 | 17.1% |
| 4+ Person Household | 331 | 28.4% |
| Total Housing Units | 1,166 | 100.0% |
Occupancy by Ownership by Household Size in Mission Hills
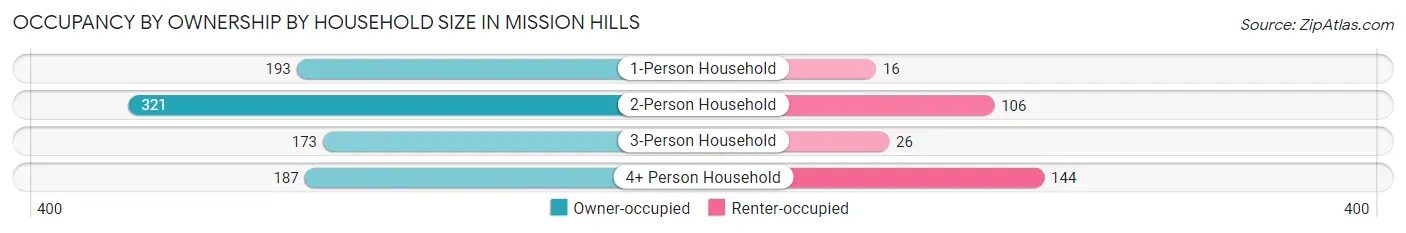
| Household Size | Owner-occupied | Renter-occupied |
| 1-Person Household | 193 (92.3%) | 16 (7.7%) |
| 2-Person Household | 321 (75.2%) | 106 (24.8%) |
| 3-Person Household | 173 (86.9%) | 26 (13.1%) |
| 4+ Person Household | 187 (56.5%) | 144 (43.5%) |
| Total Housing Units | 874 (75.0%) | 292 (25.0%) |
Occupancy by Educational Attainment in Mission Hills
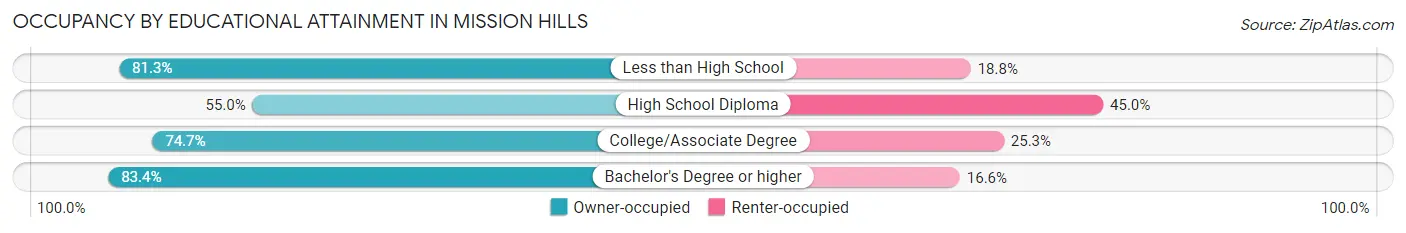
| Household Size | Owner-occupied | Renter-occupied |
| Less than High School | 39 (81.2%) | 9 (18.8%) |
| High School Diploma | 110 (55.0%) | 90 (45.0%) |
| College/Associate Degree | 348 (74.7%) | 118 (25.3%) |
| Bachelor's Degree or higher | 377 (83.4%) | 75 (16.6%) |
Occupancy by Age of Householder in Mission Hills
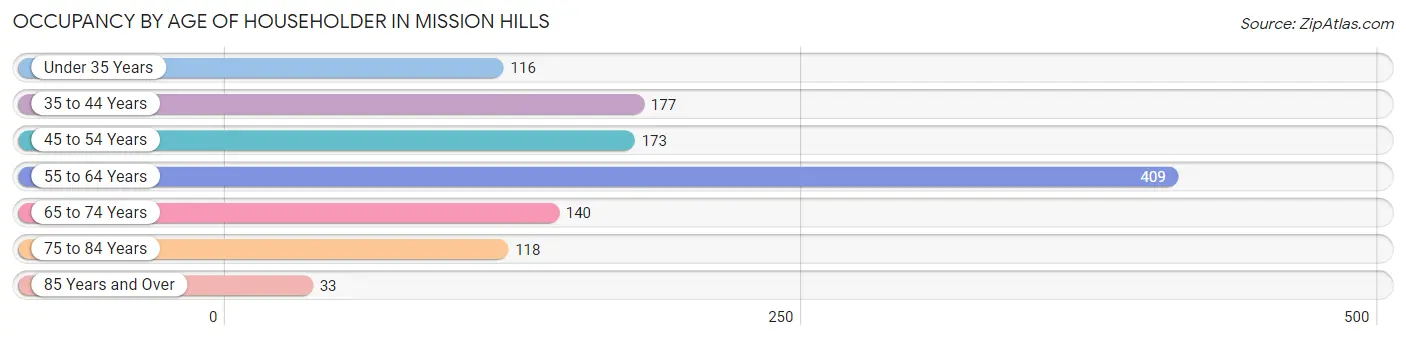
| Age Bracket | # Households | % Households |
| Under 35 Years | 116 | 10.0% |
| 35 to 44 Years | 177 | 15.2% |
| 45 to 54 Years | 173 | 14.8% |
| 55 to 64 Years | 409 | 35.1% |
| 65 to 74 Years | 140 | 12.0% |
| 75 to 84 Years | 118 | 10.1% |
| 85 Years and Over | 33 | 2.8% |
| Total | 1,166 | 100.0% |
Housing Finances in Mission Hills
Median Income by Occupancy in Mission Hills
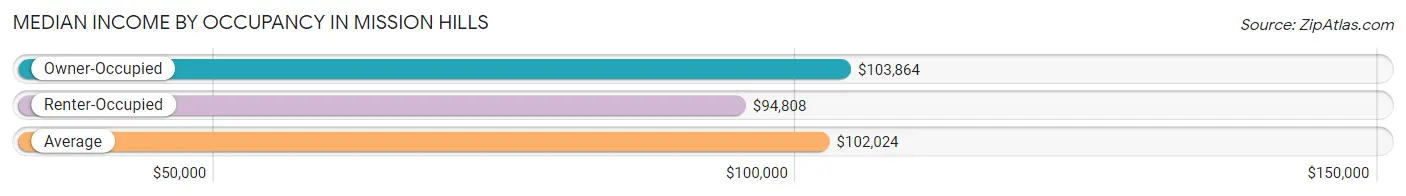
| Occupancy Type | # Households | Median Income |
| Owner-Occupied | 874 (75.0%) | $103,864 |
| Renter-Occupied | 292 (25.0%) | $94,808 |
| Average | 1,166 (100.0%) | $102,024 |
Occupancy by Householder Income Bracket in Mission Hills
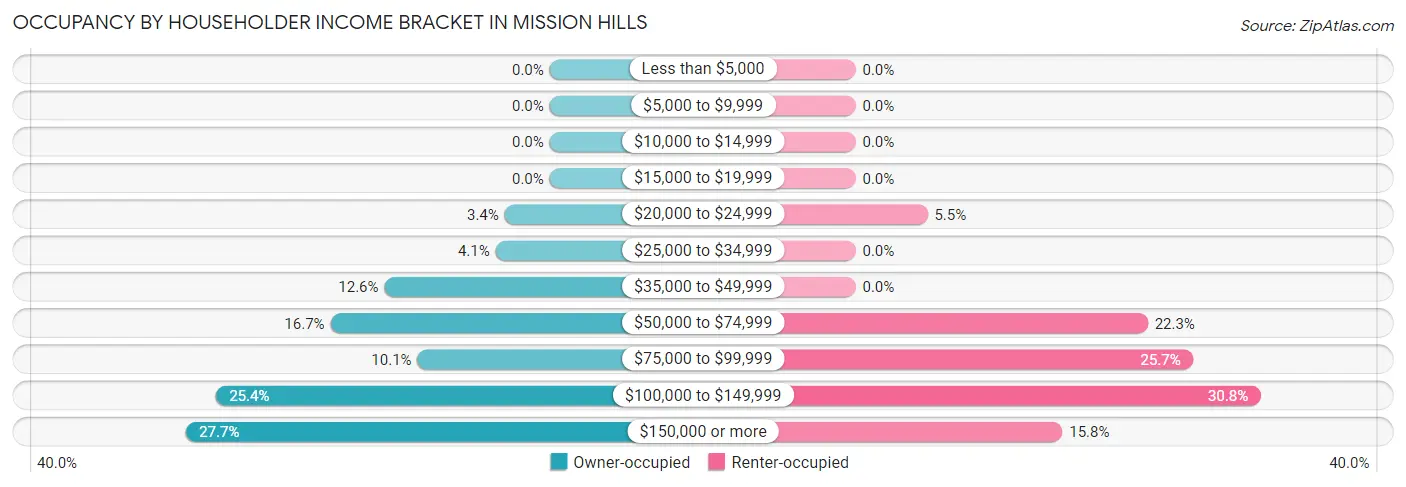
| Income Bracket | Owner-occupied | Renter-occupied |
| Less than $5,000 | 0 (0.0%) | 0 (0.0%) |
| $5,000 to $9,999 | 0 (0.0%) | 0 (0.0%) |
| $10,000 to $14,999 | 0 (0.0%) | 0 (0.0%) |
| $15,000 to $19,999 | 0 (0.0%) | 0 (0.0%) |
| $20,000 to $24,999 | 30 (3.4%) | 16 (5.5%) |
| $25,000 to $34,999 | 36 (4.1%) | 0 (0.0%) |
| $35,000 to $49,999 | 110 (12.6%) | 0 (0.0%) |
| $50,000 to $74,999 | 146 (16.7%) | 65 (22.3%) |
| $75,000 to $99,999 | 88 (10.1%) | 75 (25.7%) |
| $100,000 to $149,999 | 222 (25.4%) | 90 (30.8%) |
| $150,000 or more | 242 (27.7%) | 46 (15.8%) |
| Total | 874 (100.0%) | 292 (100.0%) |
Monthly Housing Cost Tiers in Mission Hills
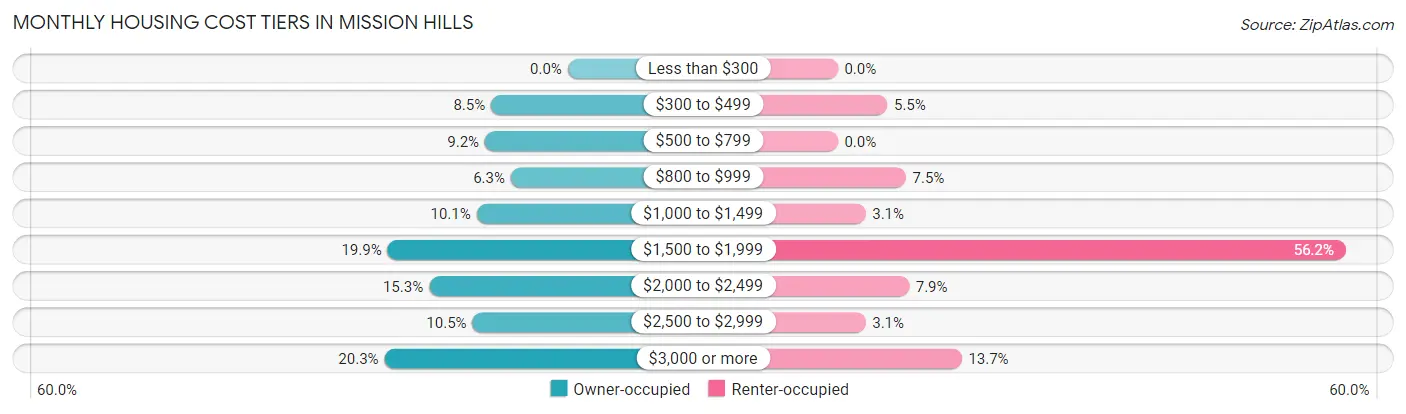
| Monthly Cost | Owner-occupied | Renter-occupied |
| Less than $300 | 0 (0.0%) | 0 (0.0%) |
| $300 to $499 | 74 (8.5%) | 16 (5.5%) |
| $500 to $799 | 80 (9.1%) | 0 (0.0%) |
| $800 to $999 | 55 (6.3%) | 22 (7.5%) |
| $1,000 to $1,499 | 88 (10.1%) | 9 (3.1%) |
| $1,500 to $1,999 | 174 (19.9%) | 164 (56.2%) |
| $2,000 to $2,499 | 134 (15.3%) | 23 (7.9%) |
| $2,500 to $2,999 | 92 (10.5%) | 9 (3.1%) |
| $3,000 or more | 177 (20.3%) | 40 (13.7%) |
| Total | 874 (100.0%) | 292 (100.0%) |
Physical Housing Characteristics in Mission Hills
Housing Structures in Mission Hills
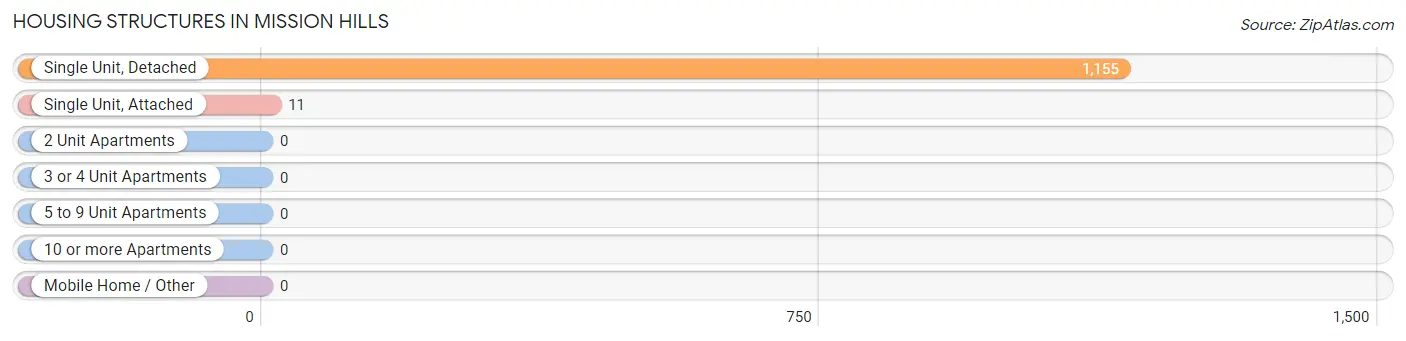
| Structure Type | # Housing Units | % Housing Units |
| Single Unit, Detached | 1,155 | 99.1% |
| Single Unit, Attached | 11 | 0.9% |
| 2 Unit Apartments | 0 | 0.0% |
| 3 or 4 Unit Apartments | 0 | 0.0% |
| 5 to 9 Unit Apartments | 0 | 0.0% |
| 10 or more Apartments | 0 | 0.0% |
| Mobile Home / Other | 0 | 0.0% |
| Total | 1,166 | 100.0% |
Housing Structures by Occupancy in Mission Hills
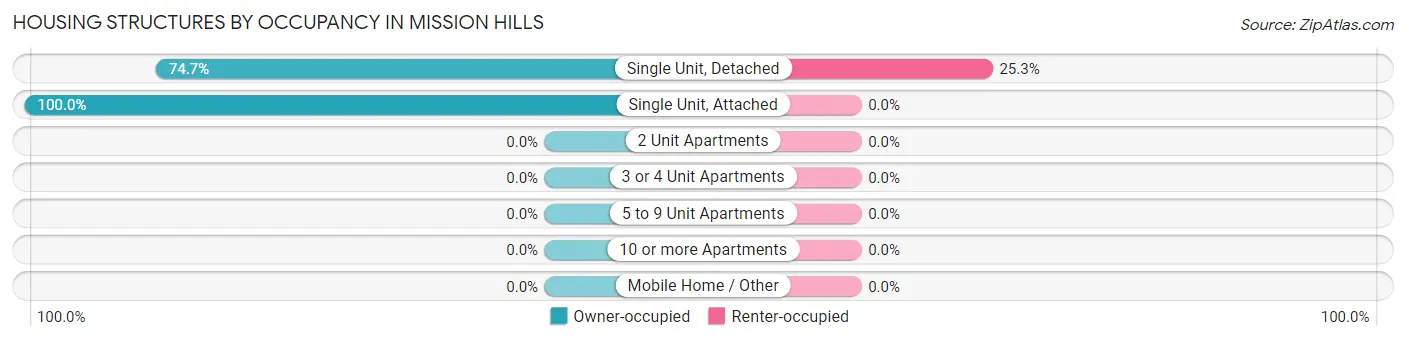
| Structure Type | Owner-occupied | Renter-occupied |
| Single Unit, Detached | 863 (74.7%) | 292 (25.3%) |
| Single Unit, Attached | 11 (100.0%) | 0 (0.0%) |
| 2 Unit Apartments | 0 (0.0%) | 0 (0.0%) |
| 3 or 4 Unit Apartments | 0 (0.0%) | 0 (0.0%) |
| 5 to 9 Unit Apartments | 0 (0.0%) | 0 (0.0%) |
| 10 or more Apartments | 0 (0.0%) | 0 (0.0%) |
| Mobile Home / Other | 0 (0.0%) | 0 (0.0%) |
| Total | 874 (75.0%) | 292 (25.0%) |
Housing Structures by Number of Rooms in Mission Hills
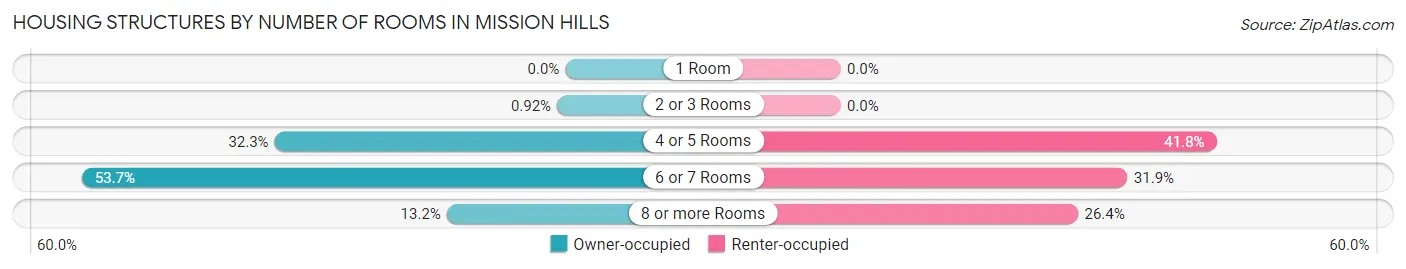
| Number of Rooms | Owner-occupied | Renter-occupied |
| 1 Room | 0 (0.0%) | 0 (0.0%) |
| 2 or 3 Rooms | 8 (0.9%) | 0 (0.0%) |
| 4 or 5 Rooms | 282 (32.3%) | 122 (41.8%) |
| 6 or 7 Rooms | 469 (53.7%) | 93 (31.9%) |
| 8 or more Rooms | 115 (13.2%) | 77 (26.4%) |
| Total | 874 (100.0%) | 292 (100.0%) |
Housing Structure by Heating Type in Mission Hills
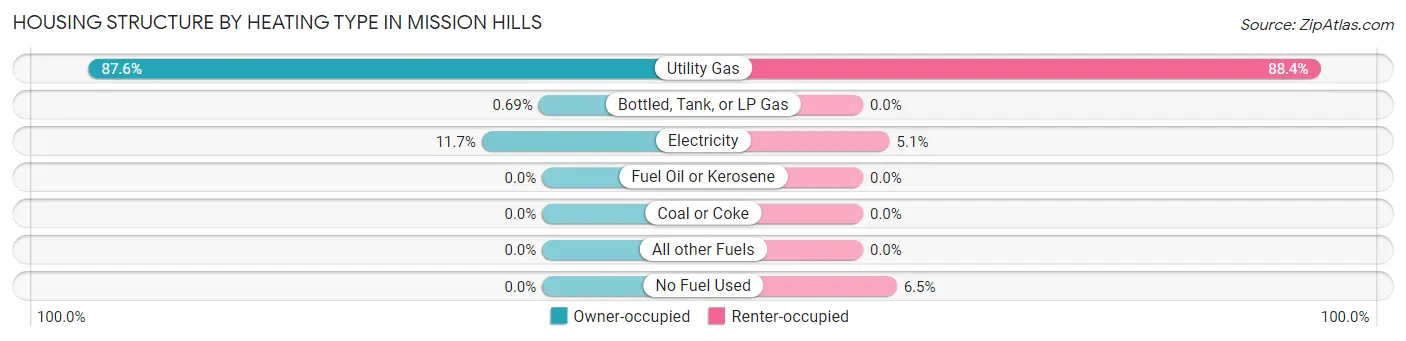
| Heating Type | Owner-occupied | Renter-occupied |
| Utility Gas | 766 (87.6%) | 258 (88.4%) |
| Bottled, Tank, or LP Gas | 6 (0.7%) | 0 (0.0%) |
| Electricity | 102 (11.7%) | 15 (5.1%) |
| Fuel Oil or Kerosene | 0 (0.0%) | 0 (0.0%) |
| Coal or Coke | 0 (0.0%) | 0 (0.0%) |
| All other Fuels | 0 (0.0%) | 0 (0.0%) |
| No Fuel Used | 0 (0.0%) | 19 (6.5%) |
| Total | 874 (100.0%) | 292 (100.0%) |
Household Vehicle Usage in Mission Hills
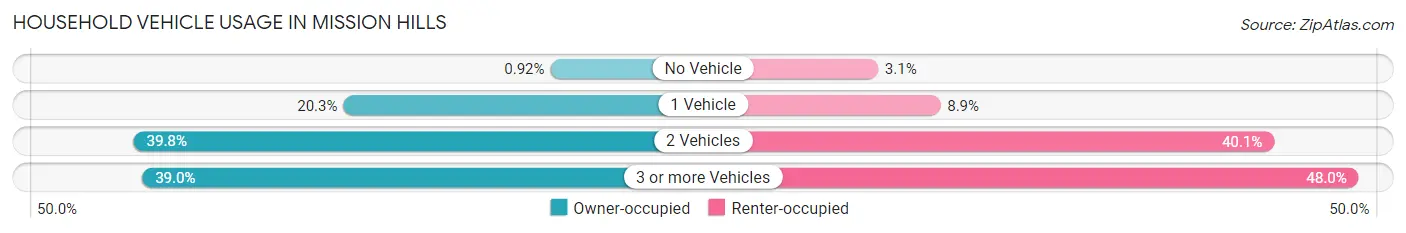
| Vehicles per Household | Owner-occupied | Renter-occupied |
| No Vehicle | 8 (0.9%) | 9 (3.1%) |
| 1 Vehicle | 177 (20.3%) | 26 (8.9%) |
| 2 Vehicles | 348 (39.8%) | 117 (40.1%) |
| 3 or more Vehicles | 341 (39.0%) | 140 (47.9%) |
| Total | 874 (100.0%) | 292 (100.0%) |
Real Estate & Mortgages in Mission Hills
Real Estate and Mortgage Overview in Mission Hills
| Characteristic | Without Mortgage | With Mortgage |
| Housing Units | 199 | 675 |
| Median Property Value | $450,900 | $449,700 |
| Median Household Income | $68,125 | $200 |
| Monthly Housing Costs | $638 | $177 |
| Real Estate Taxes | $2,580 | $0 |
Property Value by Mortgage Status in Mission Hills
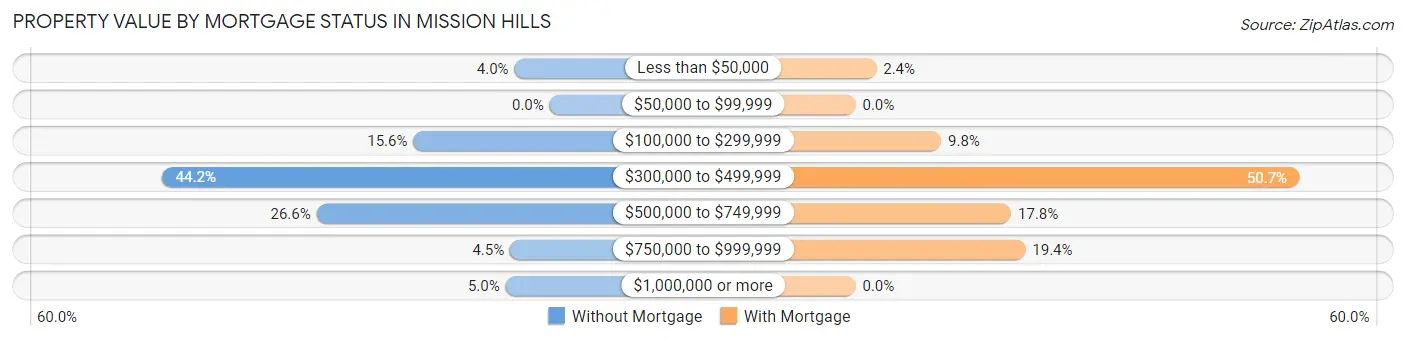
| Property Value | Without Mortgage | With Mortgage |
| Less than $50,000 | 8 (4.0%) | 16 (2.4%) |
| $50,000 to $99,999 | 0 (0.0%) | 0 (0.0%) |
| $100,000 to $299,999 | 31 (15.6%) | 66 (9.8%) |
| $300,000 to $499,999 | 88 (44.2%) | 342 (50.7%) |
| $500,000 to $749,999 | 53 (26.6%) | 120 (17.8%) |
| $750,000 to $999,999 | 9 (4.5%) | 131 (19.4%) |
| $1,000,000 or more | 10 (5.0%) | 0 (0.0%) |
| Total | 199 (100.0%) | 675 (100.0%) |
Household Income by Mortgage Status in Mission Hills
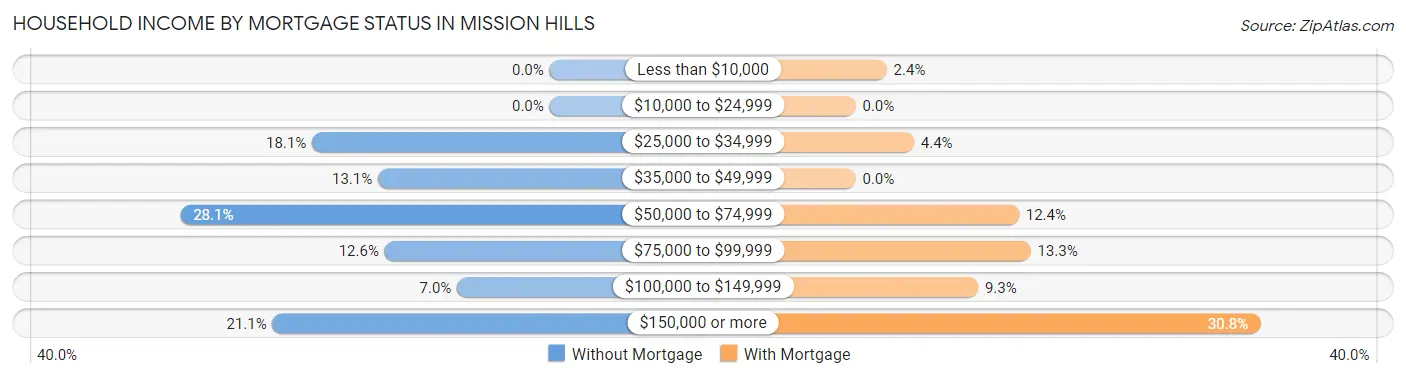
| Household Income | Without Mortgage | With Mortgage |
| Less than $10,000 | 0 (0.0%) | 16 (2.4%) |
| $10,000 to $24,999 | 0 (0.0%) | 0 (0.0%) |
| $25,000 to $34,999 | 36 (18.1%) | 30 (4.4%) |
| $35,000 to $49,999 | 26 (13.1%) | 0 (0.0%) |
| $50,000 to $74,999 | 56 (28.1%) | 84 (12.4%) |
| $75,000 to $99,999 | 25 (12.6%) | 90 (13.3%) |
| $100,000 to $149,999 | 14 (7.0%) | 63 (9.3%) |
| $150,000 or more | 42 (21.1%) | 208 (30.8%) |
| Total | 199 (100.0%) | 675 (100.0%) |
Property Value to Household Income Ratio in Mission Hills
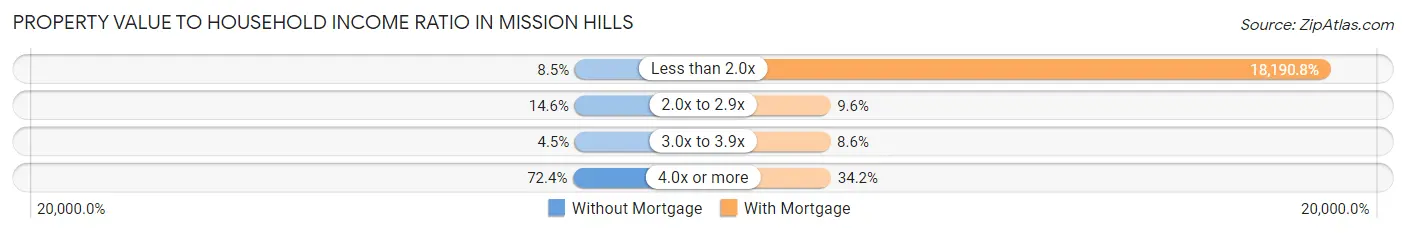
| Value-to-Income Ratio | Without Mortgage | With Mortgage |
| Less than 2.0x | 17 (8.5%) | 122,788 (18,190.8%) |
| 2.0x to 2.9x | 29 (14.6%) | 65 (9.6%) |
| 3.0x to 3.9x | 9 (4.5%) | 58 (8.6%) |
| 4.0x or more | 144 (72.4%) | 231 (34.2%) |
| Total | 199 (100.0%) | 675 (100.0%) |
Real Estate Taxes by Mortgage Status in Mission Hills
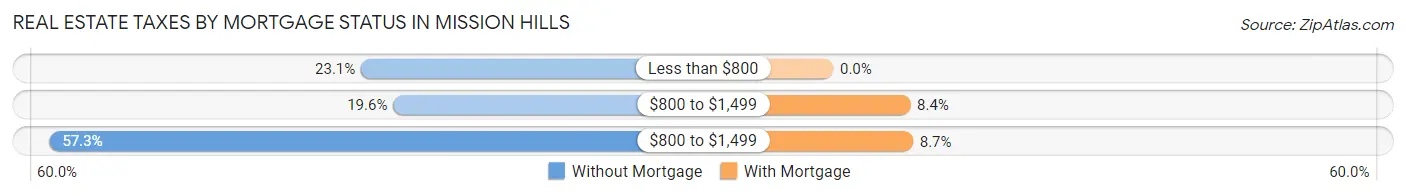
| Property Taxes | Without Mortgage | With Mortgage |
| Less than $800 | 46 (23.1%) | 0 (0.0%) |
| $800 to $1,499 | 39 (19.6%) | 57 (8.4%) |
| $800 to $1,499 | 114 (57.3%) | 59 (8.7%) |
| Total | 199 (100.0%) | 675 (100.0%) |
Health & Disability in Mission Hills
Health Insurance Coverage by Age in Mission Hills
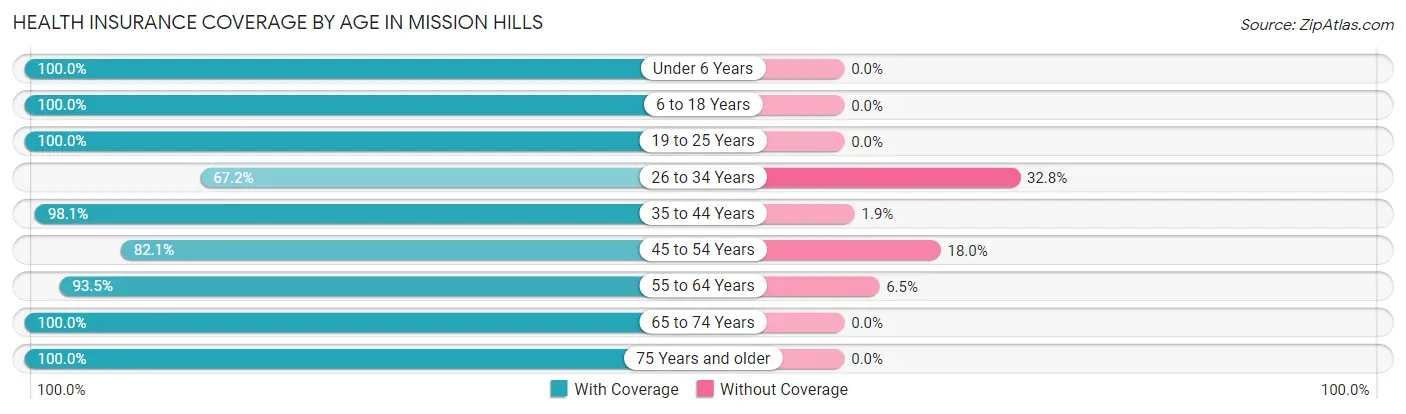
| Age Bracket | With Coverage | Without Coverage |
| Under 6 Years | 110 (100.0%) | 0 (0.0%) |
| 6 to 18 Years | 744 (100.0%) | 0 (0.0%) |
| 19 to 25 Years | 238 (100.0%) | 0 (0.0%) |
| 26 to 34 Years | 117 (67.2%) | 57 (32.8%) |
| 35 to 44 Years | 459 (98.1%) | 9 (1.9%) |
| 45 to 54 Years | 320 (82.1%) | 70 (17.9%) |
| 55 to 64 Years | 732 (93.5%) | 51 (6.5%) |
| 65 to 74 Years | 251 (100.0%) | 0 (0.0%) |
| 75 Years and older | 284 (100.0%) | 0 (0.0%) |
| Total | 3,255 (94.6%) | 187 (5.4%) |
Health Insurance Coverage by Citizenship Status in Mission Hills
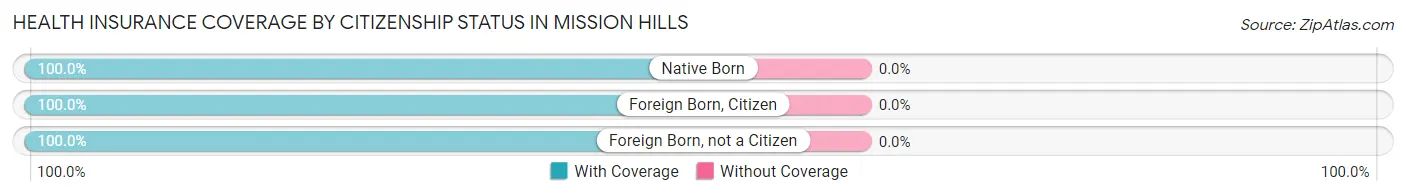
| Citizenship Status | With Coverage | Without Coverage |
| Native Born | 110 (100.0%) | 0 (0.0%) |
| Foreign Born, Citizen | 744 (100.0%) | 0 (0.0%) |
| Foreign Born, not a Citizen | 238 (100.0%) | 0 (0.0%) |
Health Insurance Coverage by Household Income in Mission Hills
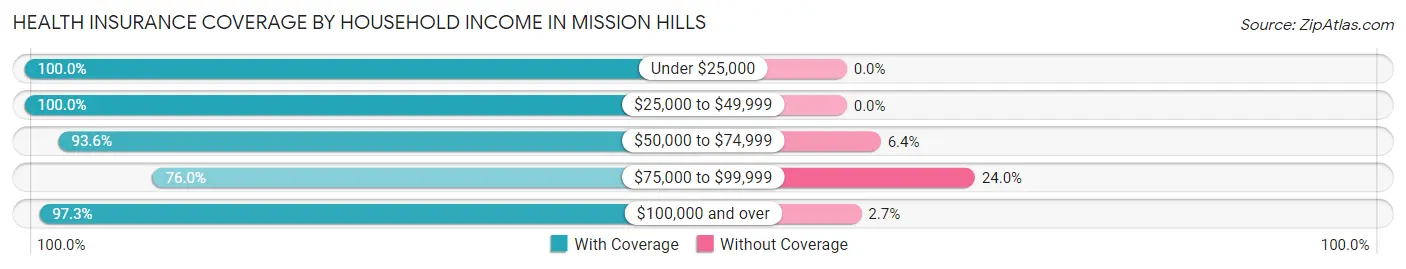
| Household Income | With Coverage | Without Coverage |
| Under $25,000 | 51 (100.0%) | 0 (0.0%) |
| $25,000 to $49,999 | 486 (100.0%) | 0 (0.0%) |
| $50,000 to $74,999 | 442 (93.6%) | 30 (6.4%) |
| $75,000 to $99,999 | 323 (76.0%) | 102 (24.0%) |
| $100,000 and over | 1,953 (97.3%) | 55 (2.7%) |
Public vs Private Health Insurance Coverage by Age in Mission Hills
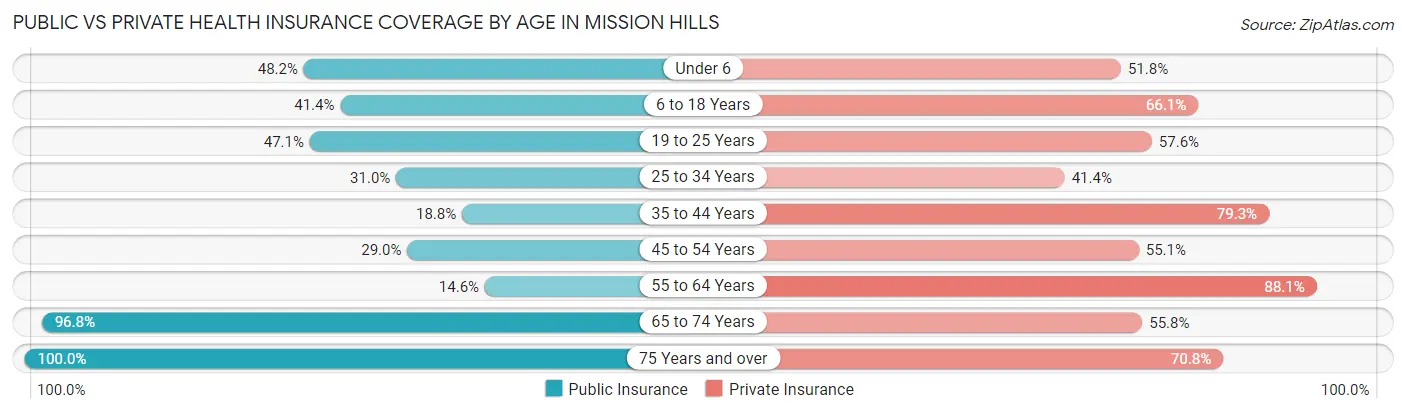
| Age Bracket | Public Insurance | Private Insurance |
| Under 6 | 53 (48.2%) | 57 (51.8%) |
| 6 to 18 Years | 308 (41.4%) | 492 (66.1%) |
| 19 to 25 Years | 112 (47.1%) | 137 (57.6%) |
| 25 to 34 Years | 54 (31.0%) | 72 (41.4%) |
| 35 to 44 Years | 88 (18.8%) | 371 (79.3%) |
| 45 to 54 Years | 113 (29.0%) | 215 (55.1%) |
| 55 to 64 Years | 114 (14.6%) | 690 (88.1%) |
| 65 to 74 Years | 243 (96.8%) | 140 (55.8%) |
| 75 Years and over | 284 (100.0%) | 201 (70.8%) |
| Total | 1,369 (39.8%) | 2,375 (69.0%) |
Disability Status by Sex by Age in Mission Hills
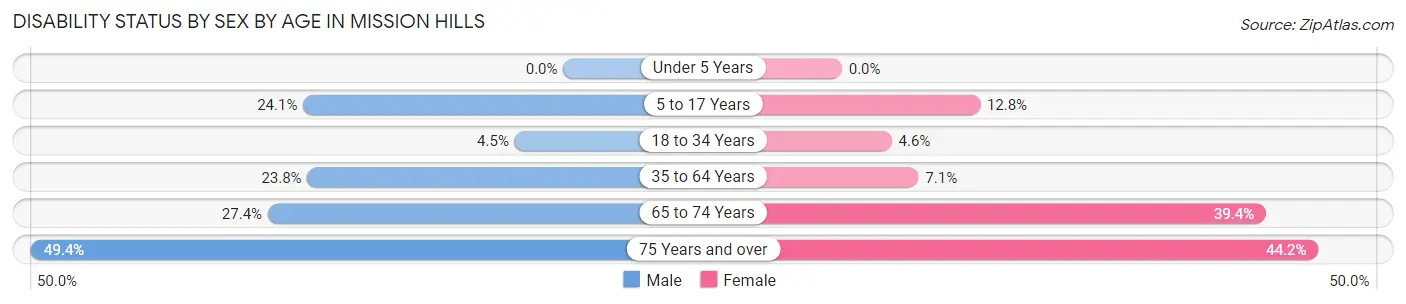
| Age Bracket | Male | Female |
| Under 5 Years | 0 (0.0%) | 0 (0.0%) |
| 5 to 17 Years | 77 (24.1%) | 65 (12.8%) |
| 18 to 34 Years | 11 (4.5%) | 8 (4.6%) |
| 35 to 64 Years | 186 (23.7%) | 61 (7.1%) |
| 65 to 74 Years | 34 (27.4%) | 50 (39.4%) |
| 75 Years and over | 42 (49.4%) | 88 (44.2%) |
Disability Class by Sex by Age in Mission Hills
Disability Class: Hearing Difficulty
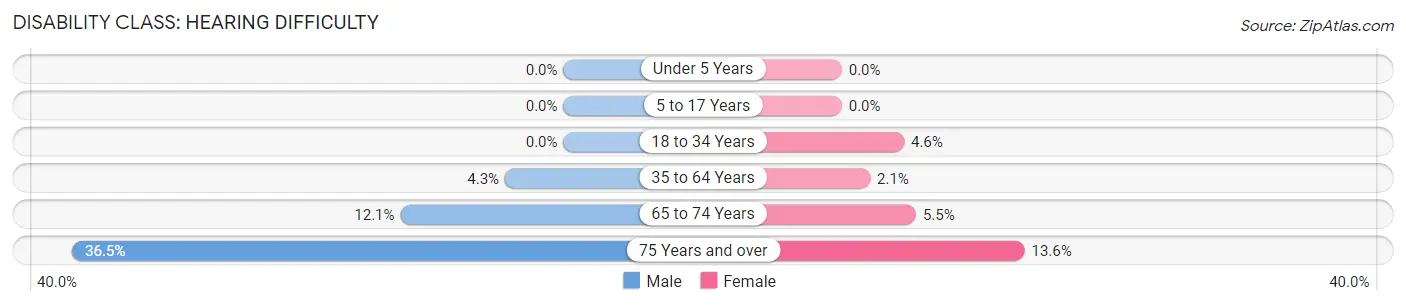
| Age Bracket | Male | Female |
| Under 5 Years | 0 (0.0%) | 0 (0.0%) |
| 5 to 17 Years | 0 (0.0%) | 0 (0.0%) |
| 18 to 34 Years | 0 (0.0%) | 8 (4.6%) |
| 35 to 64 Years | 34 (4.3%) | 18 (2.1%) |
| 65 to 74 Years | 15 (12.1%) | 7 (5.5%) |
| 75 Years and over | 31 (36.5%) | 27 (13.6%) |
Disability Class: Vision Difficulty
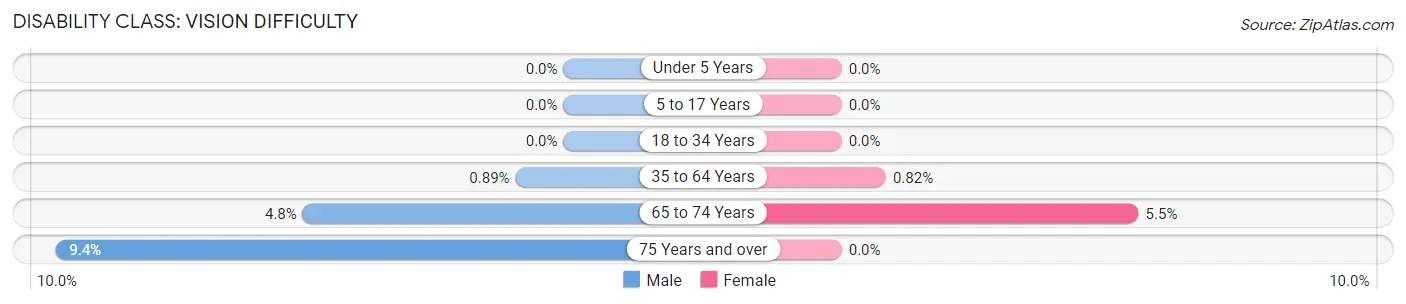
| Age Bracket | Male | Female |
| Under 5 Years | 0 (0.0%) | 0 (0.0%) |
| 5 to 17 Years | 0 (0.0%) | 0 (0.0%) |
| 18 to 34 Years | 0 (0.0%) | 0 (0.0%) |
| 35 to 64 Years | 7 (0.9%) | 7 (0.8%) |
| 65 to 74 Years | 6 (4.8%) | 7 (5.5%) |
| 75 Years and over | 8 (9.4%) | 0 (0.0%) |
Disability Class: Cognitive Difficulty
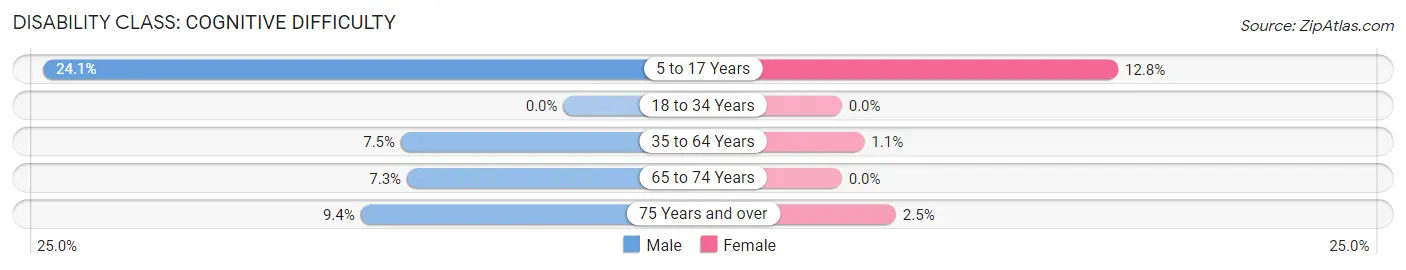
| Age Bracket | Male | Female |
| 5 to 17 Years | 77 (24.1%) | 65 (12.8%) |
| 18 to 34 Years | 0 (0.0%) | 0 (0.0%) |
| 35 to 64 Years | 59 (7.5%) | 9 (1.1%) |
| 65 to 74 Years | 9 (7.3%) | 0 (0.0%) |
| 75 Years and over | 8 (9.4%) | 5 (2.5%) |
Disability Class: Ambulatory Difficulty
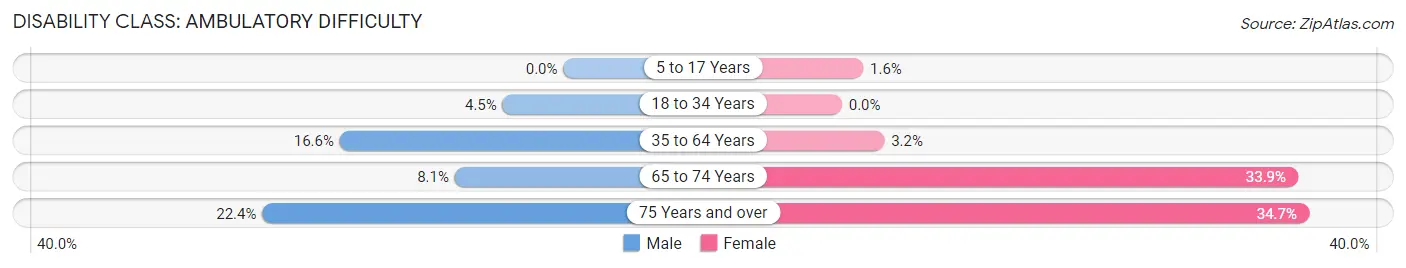
| Age Bracket | Male | Female |
| 5 to 17 Years | 0 (0.0%) | 8 (1.6%) |
| 18 to 34 Years | 11 (4.5%) | 0 (0.0%) |
| 35 to 64 Years | 130 (16.6%) | 27 (3.2%) |
| 65 to 74 Years | 10 (8.1%) | 43 (33.9%) |
| 75 Years and over | 19 (22.4%) | 69 (34.7%) |
Disability Class: Self-Care Difficulty
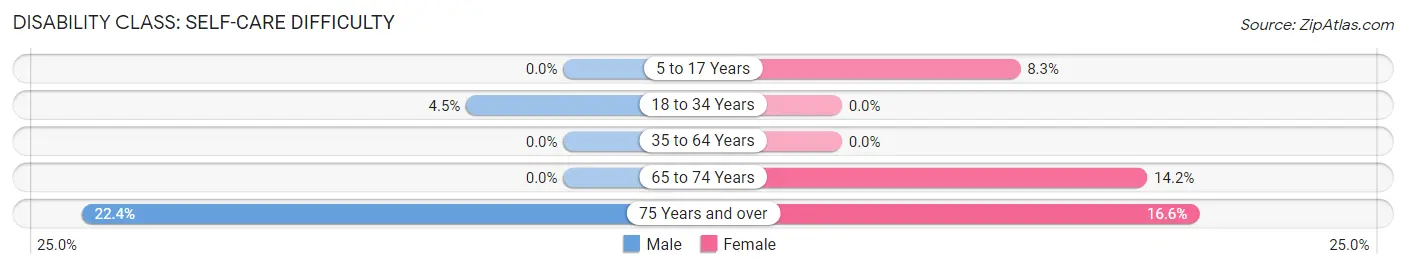
| Age Bracket | Male | Female |
| 5 to 17 Years | 0 (0.0%) | 42 (8.3%) |
| 18 to 34 Years | 11 (4.5%) | 0 (0.0%) |
| 35 to 64 Years | 0 (0.0%) | 0 (0.0%) |
| 65 to 74 Years | 0 (0.0%) | 18 (14.2%) |
| 75 Years and over | 19 (22.4%) | 33 (16.6%) |
Technology Access in Mission Hills
Computing Device Access in Mission Hills
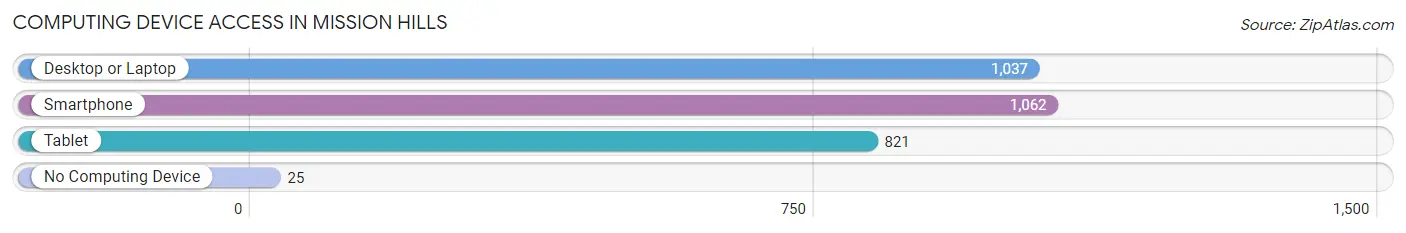
| Device Type | # Households | % Households |
| Desktop or Laptop | 1,037 | 88.9% |
| Smartphone | 1,062 | 91.1% |
| Tablet | 821 | 70.4% |
| No Computing Device | 25 | 2.1% |
| Total | 1,166 | 100.0% |
Internet Access in Mission Hills
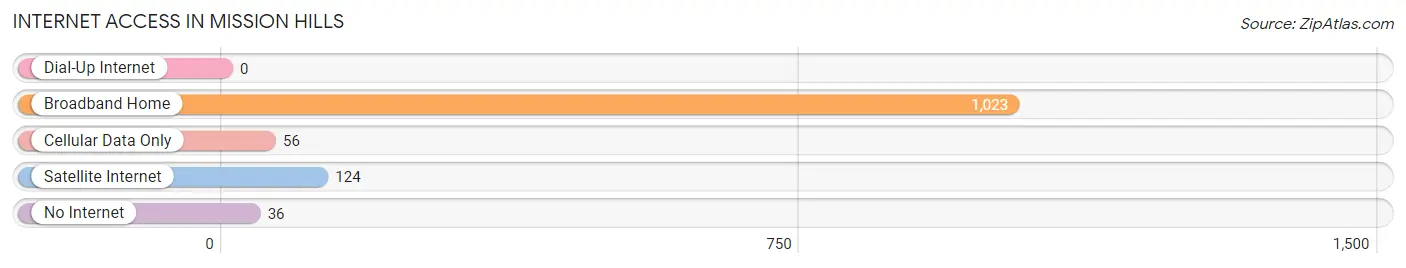
| Internet Type | # Households | % Households |
| Dial-Up Internet | 0 | 0.0% |
| Broadband Home | 1,023 | 87.7% |
| Cellular Data Only | 56 | 4.8% |
| Satellite Internet | 124 | 10.6% |
| No Internet | 36 | 3.1% |
| Total | 1,166 | 100.0% |
Mission Hills Summary
History
Mission Hills is a small, affluent neighborhood located in the San Fernando Valley region of Los Angeles, California. It is bordered by the cities of Los Angeles and San Fernando, and is part of the larger community of the San Fernando Valley. The area was originally part of the Rancho Ex-Mission San Fernando, which was granted to Francisco Reyes in 1846. The area was later subdivided and sold to various buyers, and in the early 1900s, the area was developed as a residential neighborhood.
The area was originally known as “Mission Hills” due to its proximity to the Mission San Fernando Rey de España, which was founded in 1797. The mission was the eighteenth of the twenty-one missions established in California by the Spanish Franciscans. The mission was named after Saint Ferdinand, the patron saint of Spain. The mission was abandoned in 1834, but the area still retains its name.
In the early 1900s, the area was developed as a residential neighborhood. The area was home to many prominent families, including the Dohenys, the Chandlers, and the Van Nuys. The area was also home to many celebrities, including Humphrey Bogart, Clark Gable, and Marilyn Monroe.
Geography
Mission Hills is located in the San Fernando Valley region of Los Angeles, California. It is bordered by the cities of Los Angeles and San Fernando, and is part of the larger community of the San Fernando Valley. The area is located in the foothills of the Santa Monica Mountains, and is approximately 8 miles northwest of downtown Los Angeles.
The area is characterized by its hilly terrain, with elevations ranging from 500 to 1,000 feet. The area is home to several parks, including the Sepulveda Basin Recreation Area, the Mission Hills Park, and the Mission Hills Golf Course. The area is also home to several schools, including the Los Angeles Mission College and the Los Angeles Valley College.
Economy
Mission Hills is an affluent neighborhood, and the area is home to many professionals and business owners. The area is home to several corporate headquarters, including the Doheny Oil Company, the Chandler Corporation, and the Van Nuys Corporation. The area is also home to several medical centers, including the Mission Hills Medical Center and the Mission Hills Surgery Center.
The area is also home to several retail stores, restaurants, and other businesses. The area is home to several shopping centers, including the Mission Hills Shopping Center and the Mission Hills Plaza. The area is also home to several movie theaters, including the Mission Hills Cinema and the Mission Hills Drive-In.
Demographics
As of the 2010 census, the population of Mission Hills was 8,845. The population is predominantly white (77.3%), with a significant Hispanic population (17.2%). The median household income is $90,845, and the median home value is $817,000. The area is home to a large number of professionals and business owners, and the unemployment rate is low (3.2%). The area is also home to a large number of college-educated residents (44.2%).
Common Questions
What is Per Capita Income in Mission Hills?
Per Capita income in Mission Hills is $43,758.
What is the Median Family Income in Mission Hills?
Median Family Income in Mission Hills is $126,250.
What is the Median Household income in Mission Hills?
Median Household Income in Mission Hills is $102,024.
What is Income or Wage Gap in Mission Hills?
Income or Wage Gap in Mission Hills is 40.0%.
Women in Mission Hills earn 60.0 cents for every dollar earned by a man.
What is Inequality or Gini Index in Mission Hills?
Inequality or Gini Index in Mission Hills is 0.39.
What is the Total Population of Mission Hills?
Total Population of Mission Hills is 3,458.
What is the Total Male Population of Mission Hills?
Total Male Population of Mission Hills is 1,583.
What is the Total Female Population of Mission Hills?
Total Female Population of Mission Hills is 1,875.
What is the Ratio of Males per 100 Females in Mission Hills?
There are 84.43 Males per 100 Females in Mission Hills.
What is the Ratio of Females per 100 Males in Mission Hills?
There are 118.45 Females per 100 Males in Mission Hills.
What is the Median Population Age in Mission Hills?
Median Population Age in Mission Hills is 44.5 Years.
What is the Average Family Size in Mission Hills
Average Family Size in Mission Hills is 3.4 People.
What is the Average Household Size in Mission Hills
Average Household Size in Mission Hills is 3.0 People.
How Large is the Labor Force in Mission Hills?
There are 1,833 People in the Labor Forcein in Mission Hills.
What is the Percentage of People in the Labor Force in Mission Hills?
67.6% of People are in the Labor Force in Mission Hills.
What is the Unemployment Rate in Mission Hills?
Unemployment Rate in Mission Hills is 5.0%.