Millville, CA Map & Demographics
Millville Map
Millville Overview
$54,190
PER CAPITA INCOME
$152,955
AVG FAMILY INCOME
$112,500
AVG HOUSEHOLD INCOME
15.1%
WAGE / INCOME GAP [ % ]
84.9¢/ $1
WAGE / INCOME GAP [ $ ]
0.40
INEQUALITY / GINI INDEX
794
TOTAL POPULATION
422
MALE POPULATION
372
FEMALE POPULATION
113.44
MALES / 100 FEMALES
88.15
FEMALES / 100 MALES
46.5
MEDIAN AGE
3.2
AVG FAMILY SIZE
2.6
AVG HOUSEHOLD SIZE
446
LABOR FORCE [ PEOPLE ]
60.9%
PERCENT IN LABOR FORCE
5.4%
UNEMPLOYMENT RATE
Millville Zip Codes
Millville Area Codes
Income in Millville
Income Overview in Millville
Per Capita Income in Millville is $54,190, while median incomes of families and households are $152,955 and $112,500 respectively.
| Characteristic | Number | Measure |
| Per Capita Income | 794 | $54,190 |
| Median Family Income | 214 | $152,955 |
| Mean Family Income | 214 | $138,236 |
| Median Household Income | 310 | $112,500 |
| Mean Household Income | 310 | $120,792 |
| Income Deficit | 214 | $0 |
| Wage / Income Gap (%) | 794 | 15.14% |
| Wage / Income Gap ($) | 794 | 84.86¢ per $1 |
| Gini / Inequality Index | 794 | 0.40 |
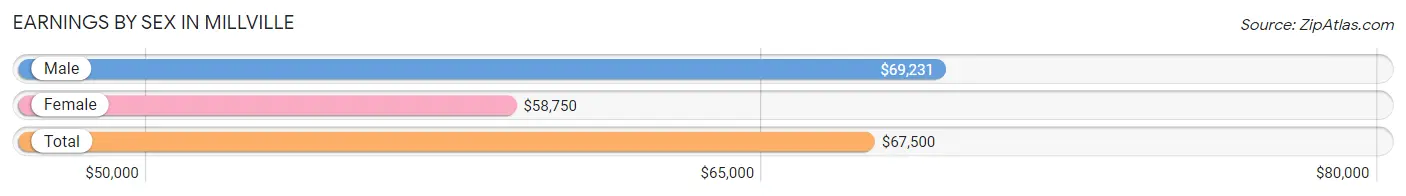
Earnings by Sex in Millville
Average Earnings in Millville are $67,500, $69,231 for men and $58,750 for women, a difference of 15.1%.
| Sex | Number | Average Earnings |
| Male | 306 (64.8%) | $69,231 |
| Female | 166 (35.2%) | $58,750 |
| Total | 472 (100.0%) | $67,500 |
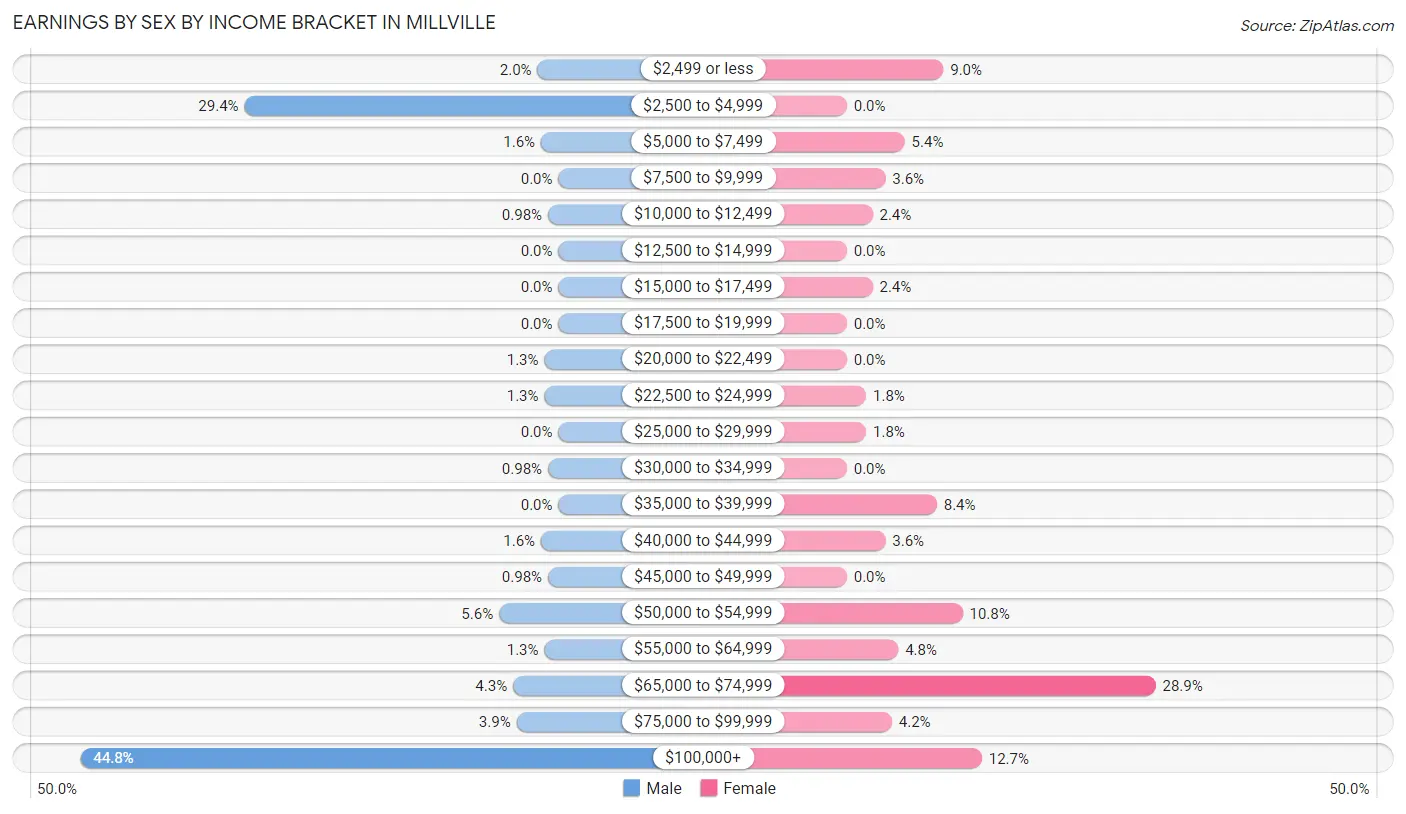
Earnings by Sex by Income Bracket in Millville
The most common earnings brackets in Millville are $100,000+ for men (137 | 44.8%) and $65,000 to $74,999 for women (48 | 28.9%).
| Income | Male | Female |
| $2,499 or less | 6 (2.0%) | 15 (9.0%) |
| $2,500 to $4,999 | 90 (29.4%) | 0 (0.0%) |
| $5,000 to $7,499 | 5 (1.6%) | 9 (5.4%) |
| $7,500 to $9,999 | 0 (0.0%) | 6 (3.6%) |
| $10,000 to $12,499 | 3 (1.0%) | 4 (2.4%) |
| $12,500 to $14,999 | 0 (0.0%) | 0 (0.0%) |
| $15,000 to $17,499 | 0 (0.0%) | 4 (2.4%) |
| $17,500 to $19,999 | 0 (0.0%) | 0 (0.0%) |
| $20,000 to $22,499 | 4 (1.3%) | 0 (0.0%) |
| $22,500 to $24,999 | 4 (1.3%) | 3 (1.8%) |
| $25,000 to $29,999 | 0 (0.0%) | 3 (1.8%) |
| $30,000 to $34,999 | 3 (1.0%) | 0 (0.0%) |
| $35,000 to $39,999 | 0 (0.0%) | 14 (8.4%) |
| $40,000 to $44,999 | 5 (1.6%) | 6 (3.6%) |
| $45,000 to $49,999 | 3 (1.0%) | 0 (0.0%) |
| $50,000 to $54,999 | 17 (5.6%) | 18 (10.8%) |
| $55,000 to $64,999 | 4 (1.3%) | 8 (4.8%) |
| $65,000 to $74,999 | 13 (4.3%) | 48 (28.9%) |
| $75,000 to $99,999 | 12 (3.9%) | 7 (4.2%) |
| $100,000+ | 137 (44.8%) | 21 (12.7%) |
| Total | 306 (100.0%) | 166 (100.0%) |
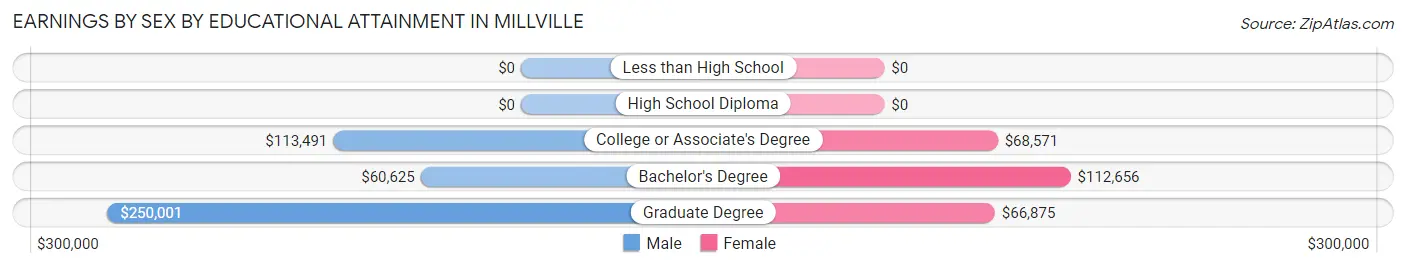
Earnings by Sex by Educational Attainment in Millville
Average earnings in Millville are $113,338 for men and $66,250 for women, a difference of 41.5%. Men with an educational attainment of graduate degree enjoy the highest average annual earnings of $250,001, while those with bachelor's degree education earn the least with $60,625. Women with an educational attainment of bachelor's degree earn the most with the average annual earnings of $112,656, while those with graduate degree education have the smallest earnings of $66,875.
| Educational Attainment | Male Income | Female Income |
| Less than High School | - | - |
| High School Diploma | - | - |
| College or Associate's Degree | $113,491 | $68,571 |
| Bachelor's Degree | $60,625 | $112,656 |
| Graduate Degree | $250,001 | $66,875 |
| Total | $113,338 | $66,250 |
Family Income in Millville
Family Income Brackets in Millville
According to the Millville family income data, there are 100 families falling into the $150,000 to $199,999 income range, which is the most common income bracket and makes up 46.7% of all families.
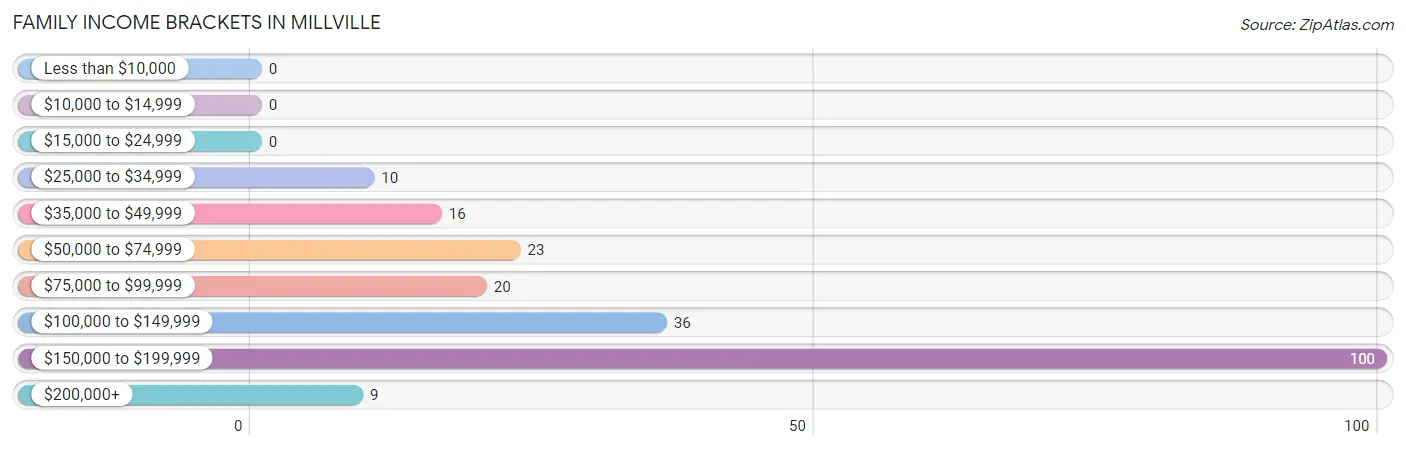
| Income Bracket | # Families | % Families |
| Less than $10,000 | 0 | 0.0% |
| $10,000 to $14,999 | 0 | 0.0% |
| $15,000 to $24,999 | 0 | 0.0% |
| $25,000 to $34,999 | 10 | 4.7% |
| $35,000 to $49,999 | 16 | 7.5% |
| $50,000 to $74,999 | 23 | 10.7% |
| $75,000 to $99,999 | 20 | 9.3% |
| $100,000 to $149,999 | 36 | 16.8% |
| $150,000 to $199,999 | 100 | 46.7% |
| $200,000+ | 9 | 4.2% |
Family Income by Famaliy Size in Millville
3-person families (55 | 25.7%) account for the highest median family income in Millville with $186,042 per family, while 3-person families (55 | 25.7%) have the highest median income of $62,014 per family member.
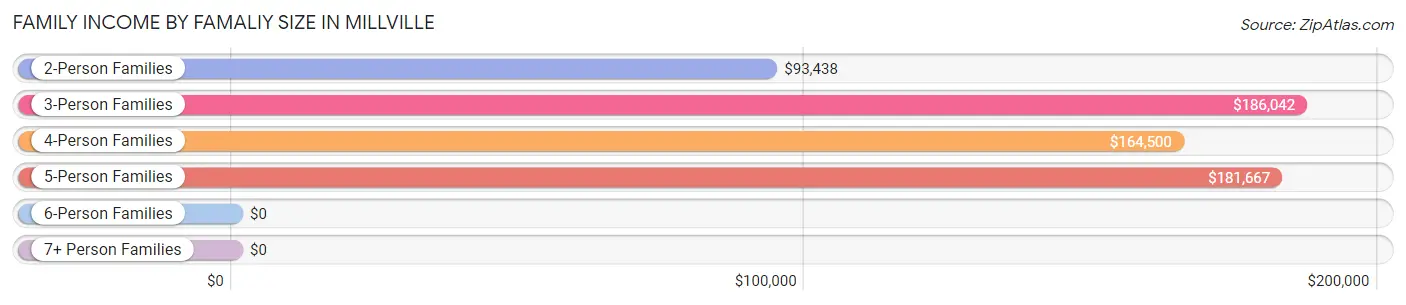
| Income Bracket | # Families | Median Income |
| 2-Person Families | 109 (50.9%) | $93,438 |
| 3-Person Families | 55 (25.7%) | $186,042 |
| 4-Person Families | 40 (18.7%) | $164,500 |
| 5-Person Families | 10 (4.7%) | $181,667 |
| 6-Person Families | 0 (0.0%) | $0 |
| 7+ Person Families | 0 (0.0%) | $0 |
| Total | 214 (100.0%) | $152,955 |
Family Income by Number of Earners in Millville
The median family income in Millville is $152,955, with families comprising 3+ earners (52) having the highest median family income of $185,952, while families with no earners (44) have the lowest median family income of $63,750, accounting for 24.3% and 20.6% of families, respectively.
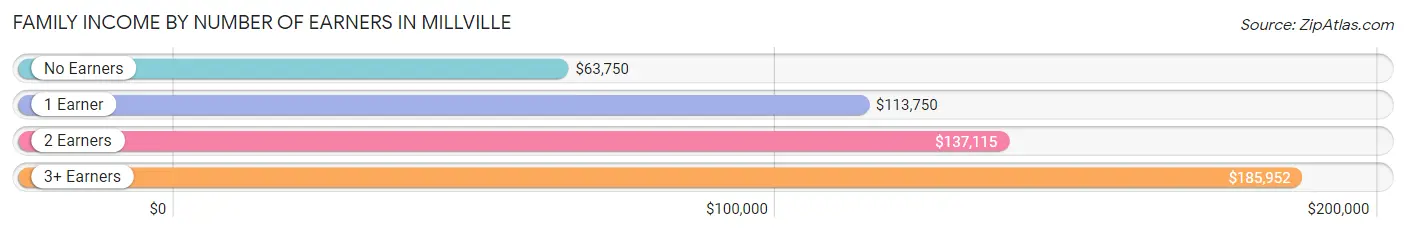
| Number of Earners | # Families | Median Income |
| No Earners | 44 (20.6%) | $63,750 |
| 1 Earner | 50 (23.4%) | $113,750 |
| 2 Earners | 68 (31.8%) | $137,115 |
| 3+ Earners | 52 (24.3%) | $185,952 |
| Total | 214 (100.0%) | $152,955 |
Household Income in Millville
Household Income Brackets in Millville
With 100 households falling in the category, the $150,000 to $199,999 income range is the most frequent in Millville, accounting for 32.3% of all households. In contrast, only 6 households (1.9%) fall into the less than $10,000 income bracket, making it the least populous group.
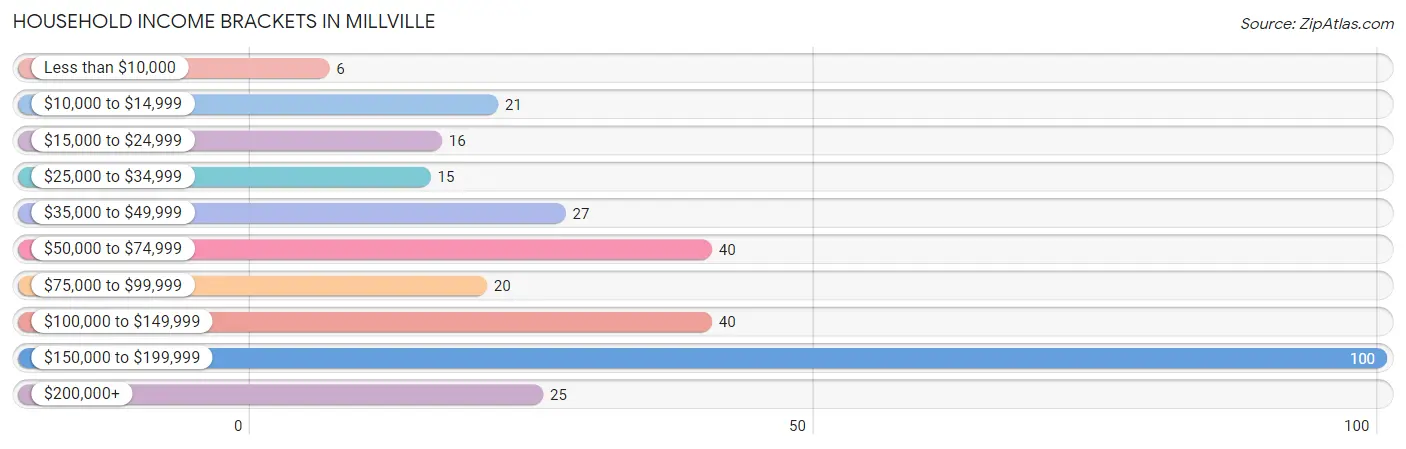
| Income Bracket | # Households | % Households |
| Less than $10,000 | 6 | 1.9% |
| $10,000 to $14,999 | 21 | 6.8% |
| $15,000 to $24,999 | 16 | 5.2% |
| $25,000 to $34,999 | 15 | 4.8% |
| $35,000 to $49,999 | 27 | 8.7% |
| $50,000 to $74,999 | 40 | 12.9% |
| $75,000 to $99,999 | 20 | 6.5% |
| $100,000 to $149,999 | 40 | 12.9% |
| $150,000 to $199,999 | 100 | 32.3% |
| $200,000+ | 25 | 8.1% |
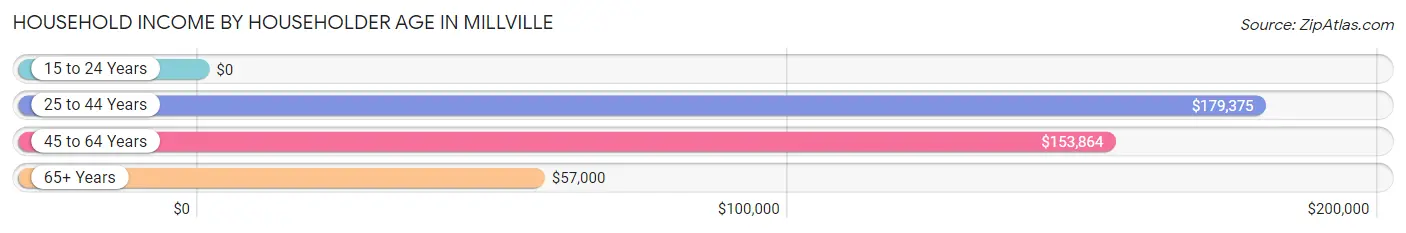
Household Income by Householder Age in Millville
The median household income in Millville is $112,500, with the highest median household income of $179,375 found in the 25 to 44 years age bracket for the primary householder. A total of 44 households (14.2%) fall into this category.
| Income Bracket | # Households | Median Income |
| 15 to 24 Years | 0 (0.0%) | $0 |
| 25 to 44 Years | 44 (14.2%) | $179,375 |
| 45 to 64 Years | 138 (44.5%) | $153,864 |
| 65+ Years | 128 (41.3%) | $57,000 |
| Total | 310 (100.0%) | $112,500 |
Poverty in Millville
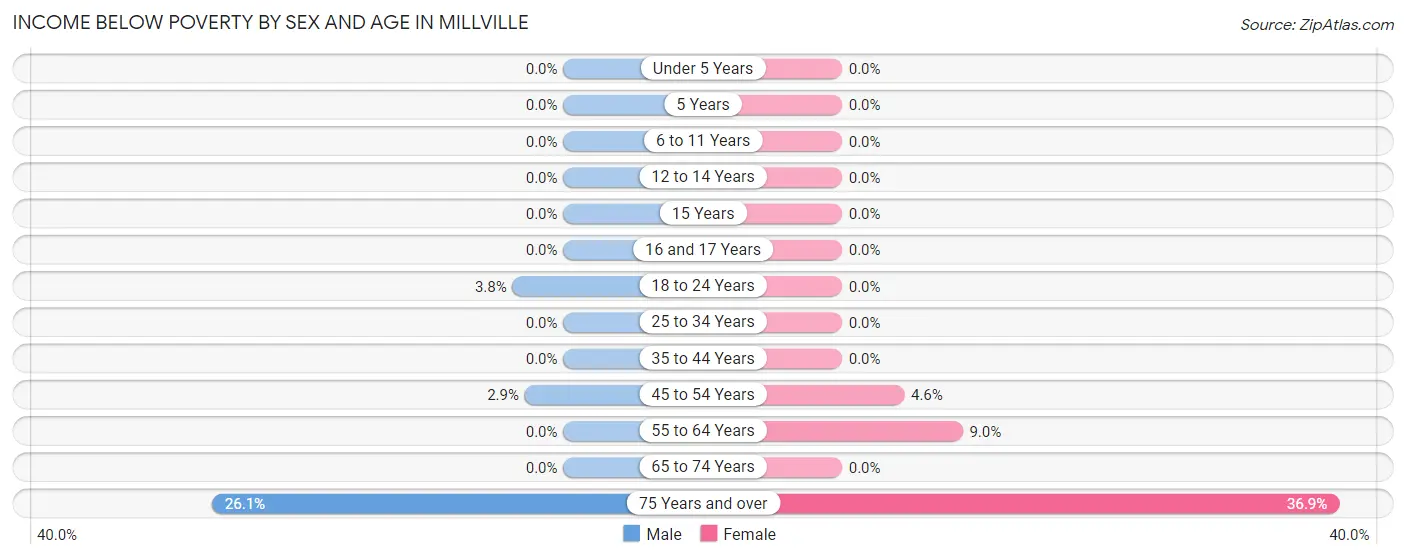
Income Below Poverty by Sex and Age in Millville
With 3.1% poverty level for males and 8.9% for females among the residents of Millville, 75 year old and over males and 75 year old and over females are the most vulnerable to poverty, with 6 males (26.1%) and 24 females (36.9%) in their respective age groups living below the poverty level.
| Age Bracket | Male | Female |
| Under 5 Years | 0 (0.0%) | 0 (0.0%) |
| 5 Years | 0 (0.0%) | 0 (0.0%) |
| 6 to 11 Years | 0 (0.0%) | 0 (0.0%) |
| 12 to 14 Years | 0 (0.0%) | 0 (0.0%) |
| 15 Years | 0 (0.0%) | 0 (0.0%) |
| 16 and 17 Years | 0 (0.0%) | 0 (0.0%) |
| 18 to 24 Years | 4 (3.8%) | 0 (0.0%) |
| 25 to 34 Years | 0 (0.0%) | 0 (0.0%) |
| 35 to 44 Years | 0 (0.0%) | 0 (0.0%) |
| 45 to 54 Years | 3 (2.9%) | 3 (4.6%) |
| 55 to 64 Years | 0 (0.0%) | 6 (9.0%) |
| 65 to 74 Years | 0 (0.0%) | 0 (0.0%) |
| 75 Years and over | 6 (26.1%) | 24 (36.9%) |
| Total | 13 (3.1%) | 33 (8.9%) |
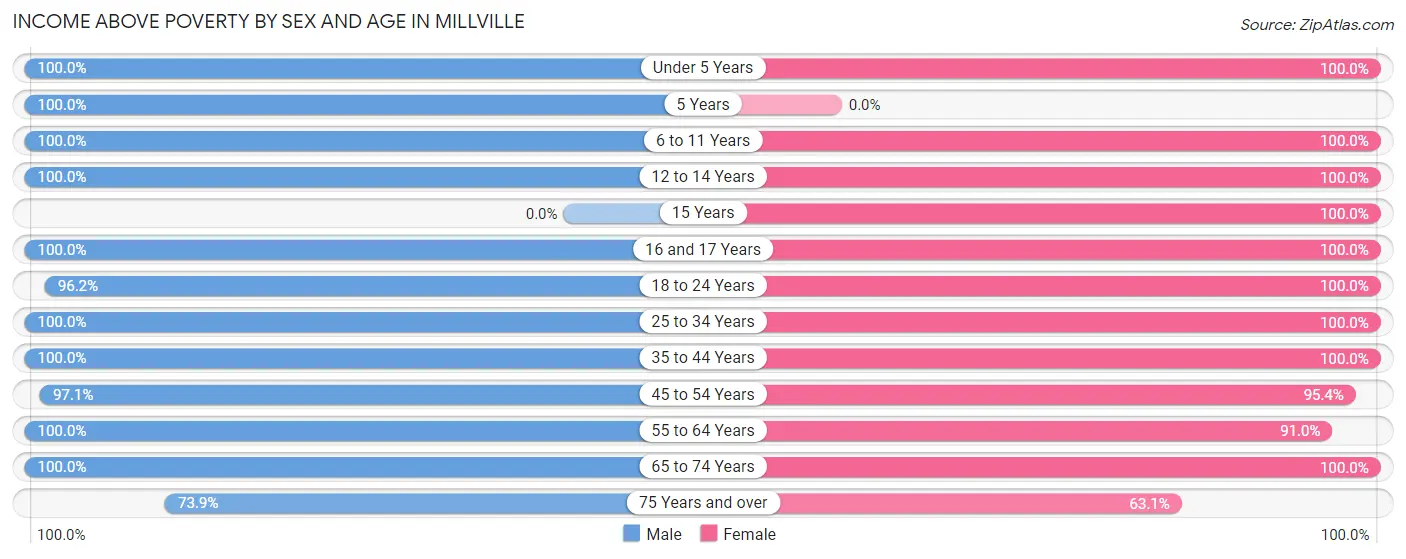
Income Above Poverty by Sex and Age in Millville
According to the poverty statistics in Millville, males aged under 5 years and females aged under 5 years are the age groups that are most secure financially, with 100.0% of males and 100.0% of females in these age groups living above the poverty line.
| Age Bracket | Male | Female |
| Under 5 Years | 5 (100.0%) | 11 (100.0%) |
| 5 Years | 1 (100.0%) | 0 (0.0%) |
| 6 to 11 Years | 19 (100.0%) | 7 (100.0%) |
| 12 to 14 Years | 7 (100.0%) | 10 (100.0%) |
| 15 Years | 0 (0.0%) | 2 (100.0%) |
| 16 and 17 Years | 7 (100.0%) | 2 (100.0%) |
| 18 to 24 Years | 102 (96.2%) | 14 (100.0%) |
| 25 to 34 Years | 13 (100.0%) | 18 (100.0%) |
| 35 to 44 Years | 38 (100.0%) | 46 (100.0%) |
| 45 to 54 Years | 102 (97.1%) | 62 (95.4%) |
| 55 to 64 Years | 49 (100.0%) | 61 (91.0%) |
| 65 to 74 Years | 49 (100.0%) | 65 (100.0%) |
| 75 Years and over | 17 (73.9%) | 41 (63.1%) |
| Total | 409 (96.9%) | 339 (91.1%) |
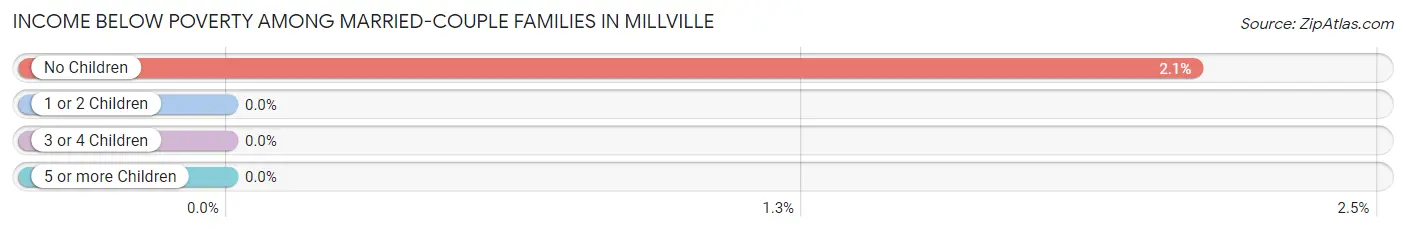
Income Below Poverty Among Married-Couple Families in Millville
The poverty statistics for married-couple families in Millville show that 1.6% or 3 of the total 190 families live below the poverty line. Families with no children have the highest poverty rate of 2.1%, comprising of 3 families. On the other hand, families with 1 or 2 children have the lowest poverty rate of 0.0%, which includes 0 families.
| Children | Above Poverty | Below Poverty |
| No Children | 140 (97.9%) | 3 (2.1%) |
| 1 or 2 Children | 42 (100.0%) | 0 (0.0%) |
| 3 or 4 Children | 5 (100.0%) | 0 (0.0%) |
| 5 or more Children | 0 (0.0%) | 0 (0.0%) |
| Total | 187 (98.4%) | 3 (1.6%) |
Income Below Poverty Among Single-Parent Households in Millville
| Children | Single Father | Single Mother |
| No Children | 0 (0.0%) | 0 (0.0%) |
| 1 or 2 Children | 0 (0.0%) | 0 (0.0%) |
| 3 or 4 Children | 0 (0.0%) | 0 (0.0%) |
| 5 or more Children | 0 (0.0%) | 0 (0.0%) |
| Total | 0 (0.0%) | 0 (0.0%) |
Income Below Poverty Among Married-Couple vs Single-Parent Households in Millville
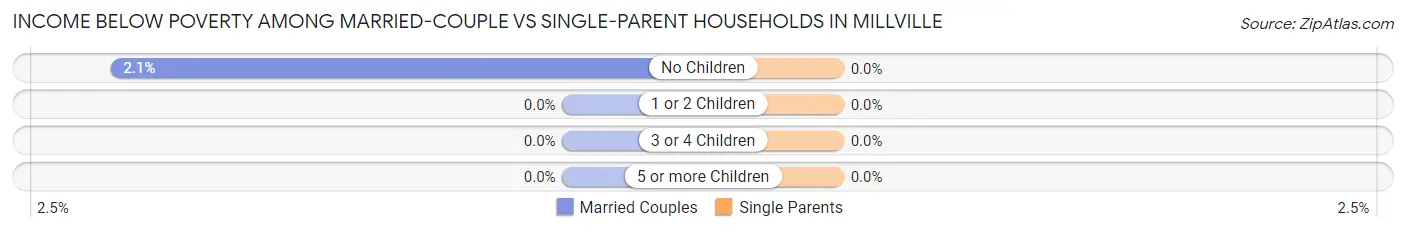
| Children | Married-Couple Families | Single-Parent Households |
| No Children | 3 (2.1%) | 0 (0.0%) |
| 1 or 2 Children | 0 (0.0%) | 0 (0.0%) |
| 3 or 4 Children | 0 (0.0%) | 0 (0.0%) |
| 5 or more Children | 0 (0.0%) | 0 (0.0%) |
| Total | 3 (1.6%) | 0 (0.0%) |
Race in Millville
The most populous races in Millville are White / Caucasian (737 | 92.8%), Two or more Races (54 | 6.8%), and Hispanic or Latino (49 | 6.2%).
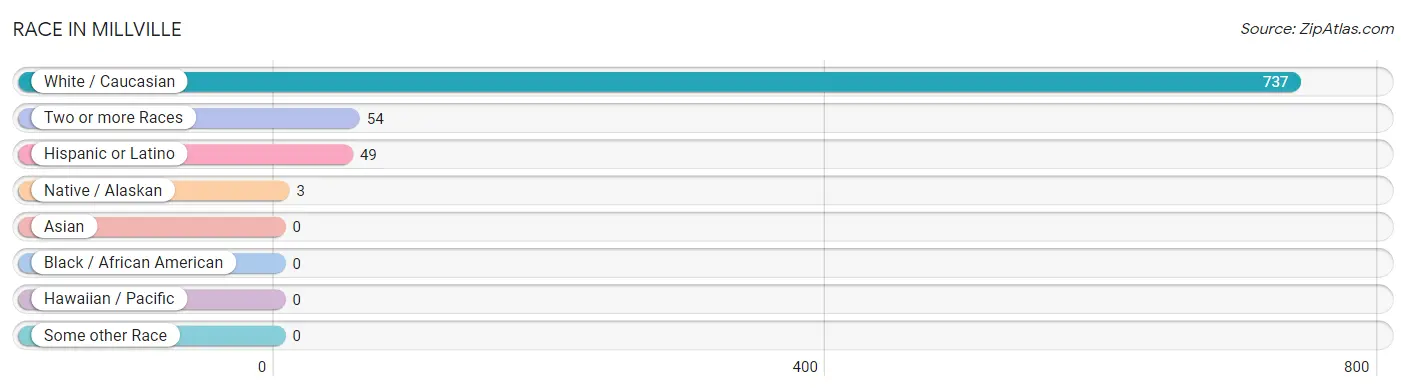
| Race | # Population | % Population |
| Asian | 0 | 0.0% |
| Black / African American | 0 | 0.0% |
| Hawaiian / Pacific | 0 | 0.0% |
| Hispanic or Latino | 49 | 6.2% |
| Native / Alaskan | 3 | 0.4% |
| White / Caucasian | 737 | 92.8% |
| Two or more Races | 54 | 6.8% |
| Some other Race | 0 | 0.0% |
| Total | 794 | 100.0% |
Ancestry in Millville
The most populous ancestries reported in Millville are German (102 | 12.9%), English (78 | 9.8%), Irish (78 | 9.8%), Italian (71 | 8.9%), and Mexican (45 | 5.7%), together accounting for 47.1% of all Millville residents.
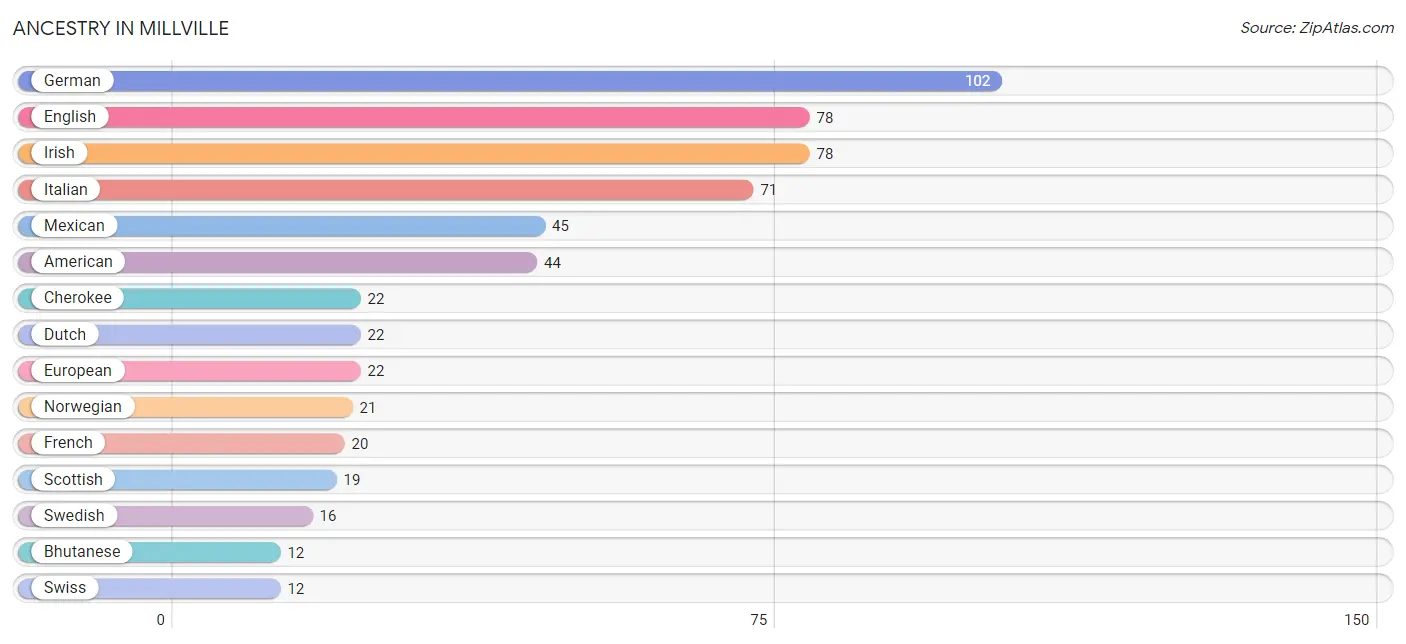
| Ancestry | # Population | % Population |
| American | 44 | 5.5% |
| Basque | 4 | 0.5% |
| Bhutanese | 12 | 1.5% |
| British | 1 | 0.1% |
| Cherokee | 22 | 2.8% |
| Czech | 4 | 0.5% |
| Danish | 7 | 0.9% |
| Dutch | 22 | 2.8% |
| English | 78 | 9.8% |
| European | 22 | 2.8% |
| French | 20 | 2.5% |
| French Canadian | 5 | 0.6% |
| German | 102 | 12.9% |
| Irish | 78 | 9.8% |
| Italian | 71 | 8.9% |
| Mexican | 45 | 5.7% |
| Northern European | 9 | 1.1% |
| Norwegian | 21 | 2.6% |
| Portuguese | 7 | 0.9% |
| Scandinavian | 4 | 0.5% |
| Scottish | 19 | 2.4% |
| Slavic | 4 | 0.5% |
| Slovak | 3 | 0.4% |
| Swedish | 16 | 2.0% |
| Swiss | 12 | 1.5% | View All 25 Rows |
Immigrants in Millville
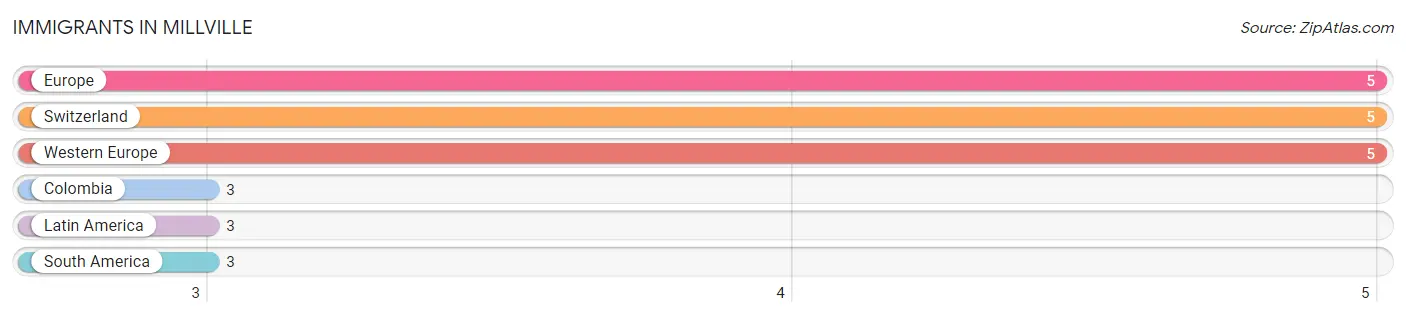
The most numerous immigrant groups reported in Millville came from Europe (5 | 0.6%), Switzerland (5 | 0.6%), Western Europe (5 | 0.6%), Colombia (3 | 0.4%), and Latin America (3 | 0.4%), together accounting for 2.7% of all Millville residents.
| Immigration Origin | # Population | % Population |
| Colombia | 3 | 0.4% |
| Europe | 5 | 0.6% |
| Latin America | 3 | 0.4% |
| South America | 3 | 0.4% |
| Switzerland | 5 | 0.6% |
| Western Europe | 5 | 0.6% | View All 6 Rows |
Sex and Age in Millville
Sex and Age in Millville
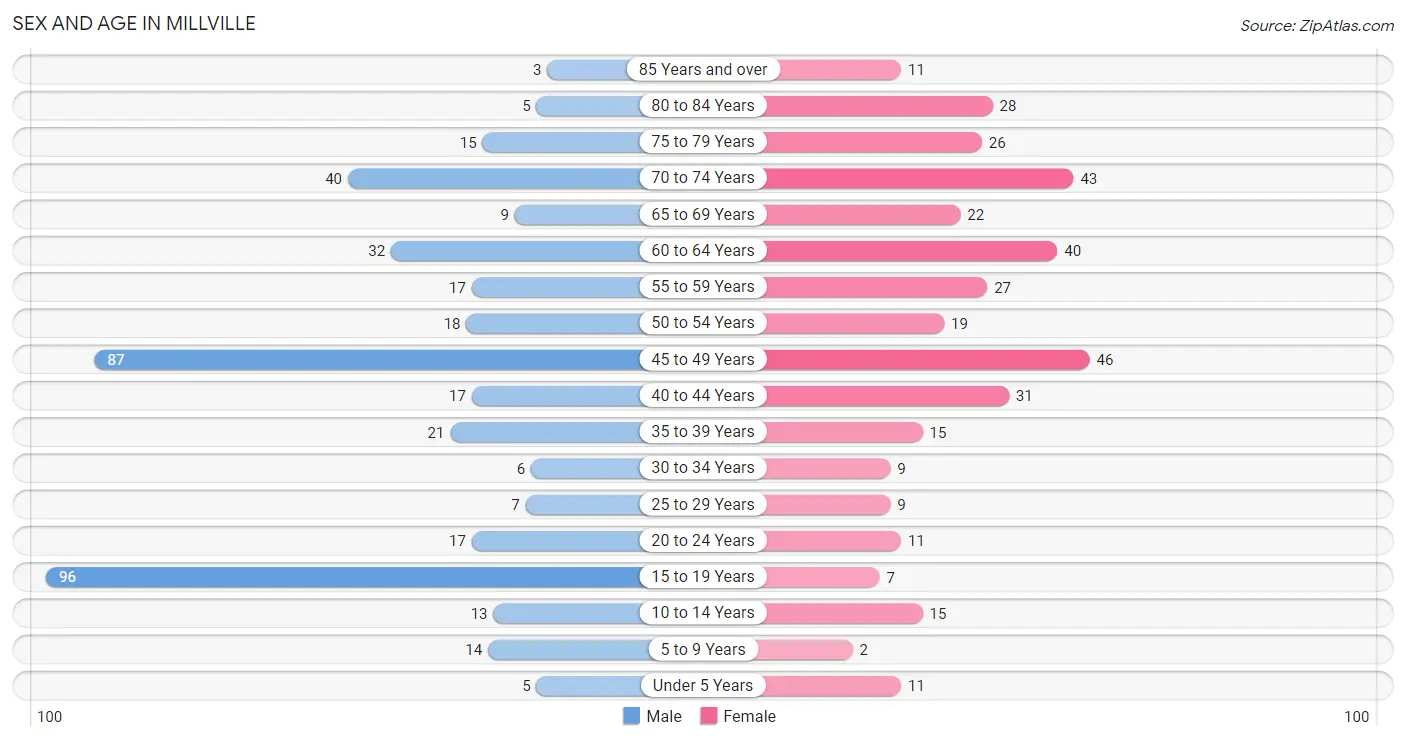
The most populous age groups in Millville are 15 to 19 Years (96 | 22.8%) for men and 45 to 49 Years (46 | 12.4%) for women.
| Age Bracket | Male | Female |
| Under 5 Years | 5 (1.2%) | 11 (3.0%) |
| 5 to 9 Years | 14 (3.3%) | 2 (0.5%) |
| 10 to 14 Years | 13 (3.1%) | 15 (4.0%) |
| 15 to 19 Years | 96 (22.8%) | 7 (1.9%) |
| 20 to 24 Years | 17 (4.0%) | 11 (3.0%) |
| 25 to 29 Years | 7 (1.7%) | 9 (2.4%) |
| 30 to 34 Years | 6 (1.4%) | 9 (2.4%) |
| 35 to 39 Years | 21 (5.0%) | 15 (4.0%) |
| 40 to 44 Years | 17 (4.0%) | 31 (8.3%) |
| 45 to 49 Years | 87 (20.6%) | 46 (12.4%) |
| 50 to 54 Years | 18 (4.3%) | 19 (5.1%) |
| 55 to 59 Years | 17 (4.0%) | 27 (7.3%) |
| 60 to 64 Years | 32 (7.6%) | 40 (10.7%) |
| 65 to 69 Years | 9 (2.1%) | 22 (5.9%) |
| 70 to 74 Years | 40 (9.5%) | 43 (11.6%) |
| 75 to 79 Years | 15 (3.5%) | 26 (7.0%) |
| 80 to 84 Years | 5 (1.2%) | 28 (7.5%) |
| 85 Years and over | 3 (0.7%) | 11 (3.0%) |
| Total | 422 (100.0%) | 372 (100.0%) |
Families and Households in Millville
Median Family Size in Millville
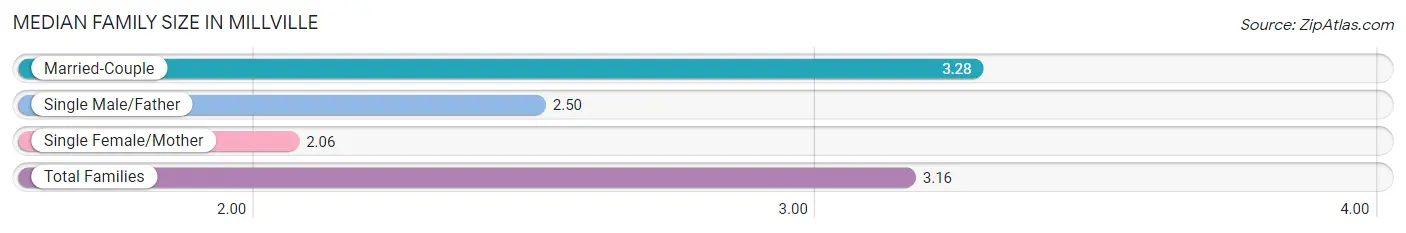
The median family size in Millville is 3.16 persons per family, with married-couple families (190 | 88.8%) accounting for the largest median family size of 3.28 persons per family. On the other hand, single female/mother families (18 | 8.4%) represent the smallest median family size with 2.06 persons per family.
| Family Type | # Families | Family Size |
| Married-Couple | 190 (88.8%) | 3.28 |
| Single Male/Father | 6 (2.8%) | 2.50 |
| Single Female/Mother | 18 (8.4%) | 2.06 |
| Total Families | 214 (100.0%) | 3.16 |
Median Household Size in Millville
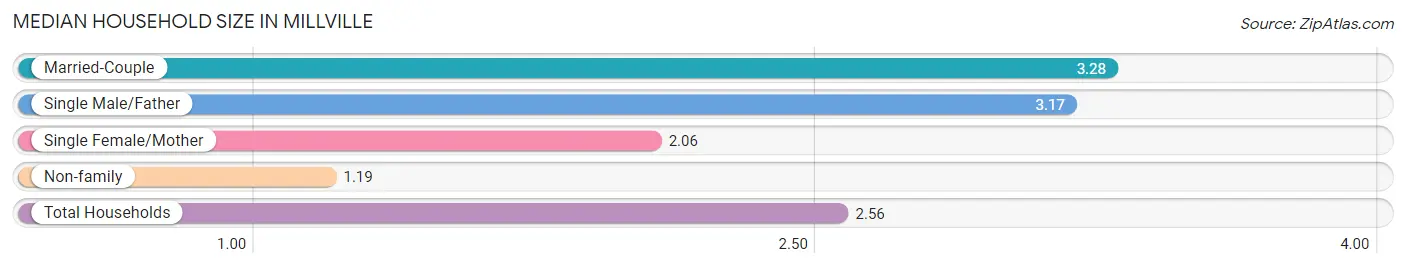
The median household size in Millville is 2.56 persons per household, with married-couple households (190 | 61.3%) accounting for the largest median household size of 3.28 persons per household. non-family households (96 | 31.0%) represent the smallest median household size with 1.19 persons per household.
| Household Type | # Households | Household Size |
| Married-Couple | 190 (61.3%) | 3.28 |
| Single Male/Father | 6 (1.9%) | 3.17 |
| Single Female/Mother | 18 (5.8%) | 2.06 |
| Non-family | 96 (31.0%) | 1.19 |
| Total Households | 310 (100.0%) | 2.56 |
Household Size by Marriage Status in Millville
Out of a total of 310 households in Millville, 214 (69.0%) are family households, while 96 (31.0%) are nonfamily households. The most numerous type of family households are 2-person households, comprising 105, and the most common type of nonfamily households are 1-person households, comprising 82.
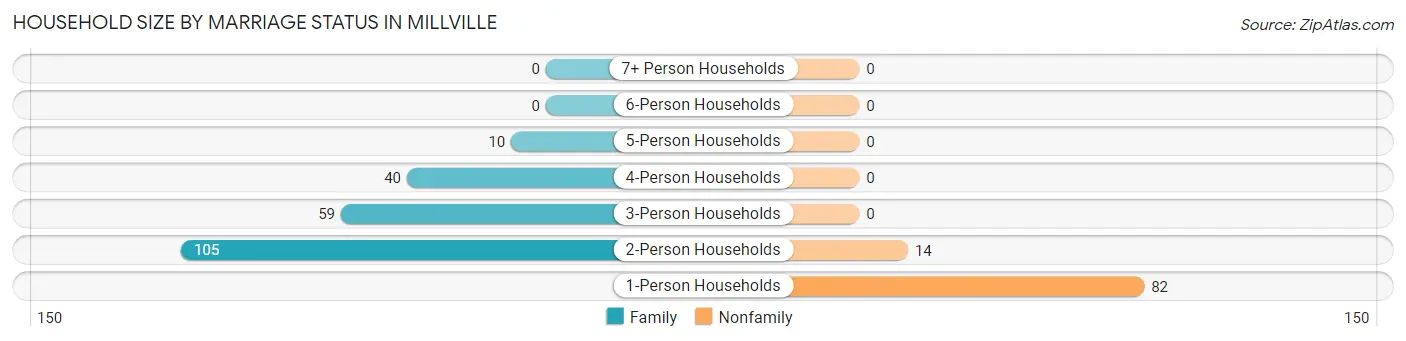
| Household Size | Family Households | Nonfamily Households |
| 1-Person Households | - | 82 (26.5%) |
| 2-Person Households | 105 (33.9%) | 14 (4.5%) |
| 3-Person Households | 59 (19.0%) | 0 (0.0%) |
| 4-Person Households | 40 (12.9%) | 0 (0.0%) |
| 5-Person Households | 10 (3.2%) | 0 (0.0%) |
| 6-Person Households | 0 (0.0%) | 0 (0.0%) |
| 7+ Person Households | 0 (0.0%) | 0 (0.0%) |
| Total | 214 (69.0%) | 96 (31.0%) |
Female Fertility in Millville
Fertility by Age in Millville
| Age Bracket | Women with Births | Births / 1,000 Women |
| 15 to 19 years | 0 (0.0%) | 0.0 |
| 20 to 34 years | 0 (0.0%) | 0.0 |
| 35 to 50 years | 0 (0.0%) | 0.0 |
| Total | 0 (0.0%) | 0.0 |
Fertility by Age by Marriage Status in Millville
| Age Bracket | Married | Unmarried |
| 15 to 19 years | 0 (0.0%) | 0 (0.0%) |
| 20 to 34 years | 0 (0.0%) | 0 (0.0%) |
| 35 to 50 years | 0 (0.0%) | 0 (0.0%) |
| Total | 0 (0.0%) | 0 (0.0%) |
Fertility by Education in Millville
| Educational Attainment | Women with Births | Births / 1,000 Women |
| Less than High School | 0 (0.0%) | 0.0 |
| High School Diploma | 0 (0.0%) | 0.0 |
| College or Associate's Degree | 0 (0.0%) | 0.0 |
| Bachelor's Degree | 0 (0.0%) | 0.0 |
| Graduate Degree | 0 (0.0%) | 0.0 |
| Total | 0 (0.0%) | 0.0 |
Fertility by Education by Marriage Status in Millville
| Educational Attainment | Married | Unmarried |
| Less than High School | 0 (0.0%) | 0 (0.0%) |
| High School Diploma | 0 (0.0%) | 0 (0.0%) |
| College or Associate's Degree | 0 (0.0%) | 0 (0.0%) |
| Bachelor's Degree | 0 (0.0%) | 0 (0.0%) |
| Graduate Degree | 0 (0.0%) | 0 (0.0%) |
| Total | 0 (0.0%) | 0 (0.0%) |
Employment Characteristics in Millville
Employment by Class of Employer in Millville
Among the 419 employed individuals in Millville, private company employees (243 | 58.0%), local government employees (80 | 19.1%), and self-employed (not incorporated) (56 | 13.4%) make up the most common classes of employment.
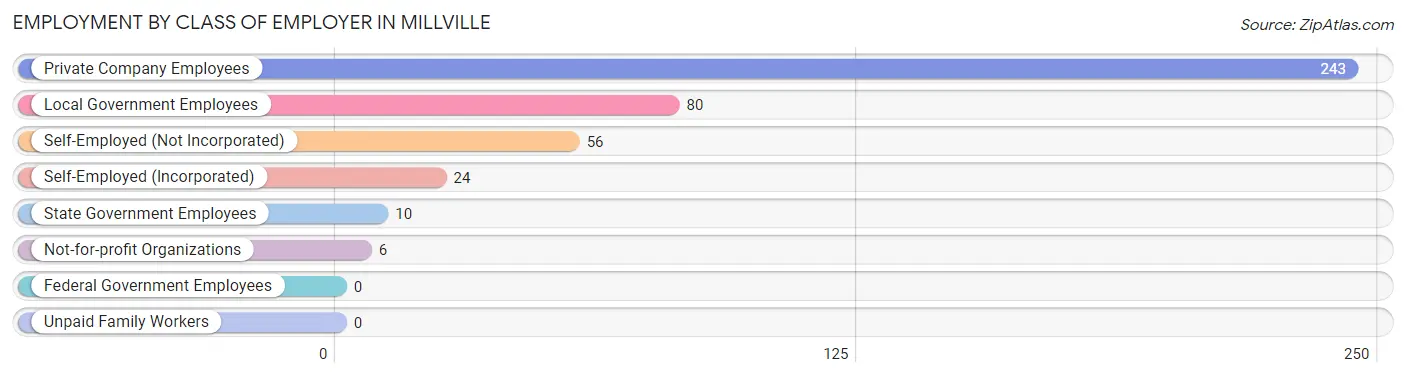
| Employer Class | # Employees | % Employees |
| Private Company Employees | 243 | 58.0% |
| Self-Employed (Incorporated) | 24 | 5.7% |
| Self-Employed (Not Incorporated) | 56 | 13.4% |
| Not-for-profit Organizations | 6 | 1.4% |
| Local Government Employees | 80 | 19.1% |
| State Government Employees | 10 | 2.4% |
| Federal Government Employees | 0 | 0.0% |
| Unpaid Family Workers | 0 | 0.0% |
| Total | 419 | 100.0% |
Employment Status by Age in Millville
According to the labor force statistics for Millville, out of the total population over 16 years of age (732), 60.9% or 446 individuals are in the labor force, with 5.4% or 24 of them unemployed. The age group with the highest labor force participation rate is 30 to 34 years, with 100.0% or 15 individuals in the labor force. Within the labor force, the 25 to 29 years age range has the highest percentage of unemployed individuals, with 50.0% or 5 of them being unemployed.
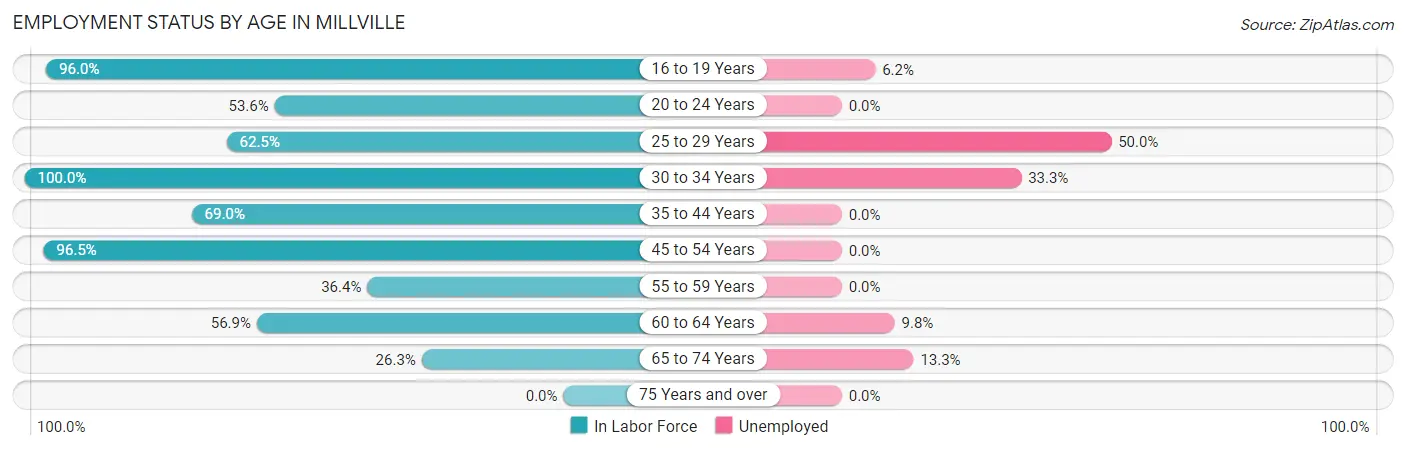
| Age Bracket | In Labor Force | Unemployed |
| 16 to 19 Years | 97 (96.0%) | 6 (6.2%) |
| 20 to 24 Years | 15 (53.6%) | 0 (0.0%) |
| 25 to 29 Years | 10 (62.5%) | 5 (50.0%) |
| 30 to 34 Years | 15 (100.0%) | 5 (33.3%) |
| 35 to 44 Years | 58 (69.0%) | 0 (0.0%) |
| 45 to 54 Years | 164 (96.5%) | 0 (0.0%) |
| 55 to 59 Years | 16 (36.4%) | 0 (0.0%) |
| 60 to 64 Years | 41 (56.9%) | 4 (9.8%) |
| 65 to 74 Years | 30 (26.3%) | 4 (13.3%) |
| 75 Years and over | 0 (0.0%) | 0 (0.0%) |
| Total | 446 (60.9%) | 24 (5.4%) |
Employment Status by Educational Attainment in Millville
According to labor force statistics for Millville, 75.8% of individuals (304) out of the total population between 25 and 64 years of age (401) are in the labor force, with 4.6% or 14 of them being unemployed. The group with the highest labor force participation rate are those with the educational attainment of less than high school, with 100.0% or 18 individuals in the labor force. Within the labor force, individuals with less than high school education have the highest percentage of unemployment, with 27.8% or 5 of them being unemployed.
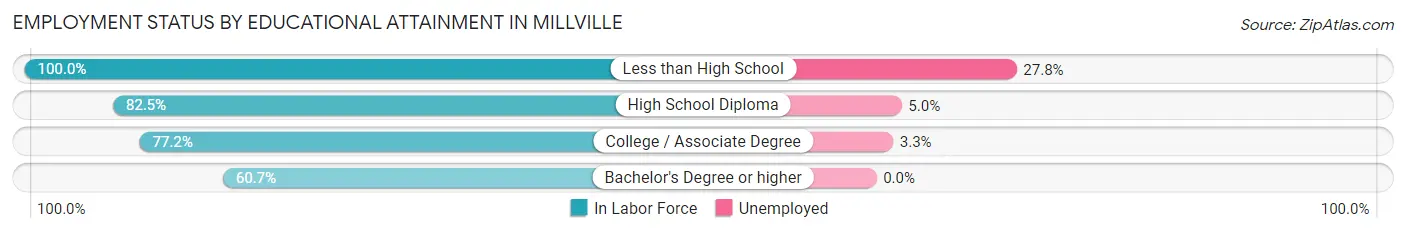
| Educational Attainment | In Labor Force | Unemployed |
| Less than High School | 18 (100.0%) | 5 (27.8%) |
| High School Diploma | 80 (82.5%) | 5 (5.0%) |
| College / Associate Degree | 152 (77.2%) | 7 (3.3%) |
| Bachelor's Degree or higher | 54 (60.7%) | 0 (0.0%) |
| Total | 304 (75.8%) | 18 (4.6%) |
Employment Occupations by Sex in Millville
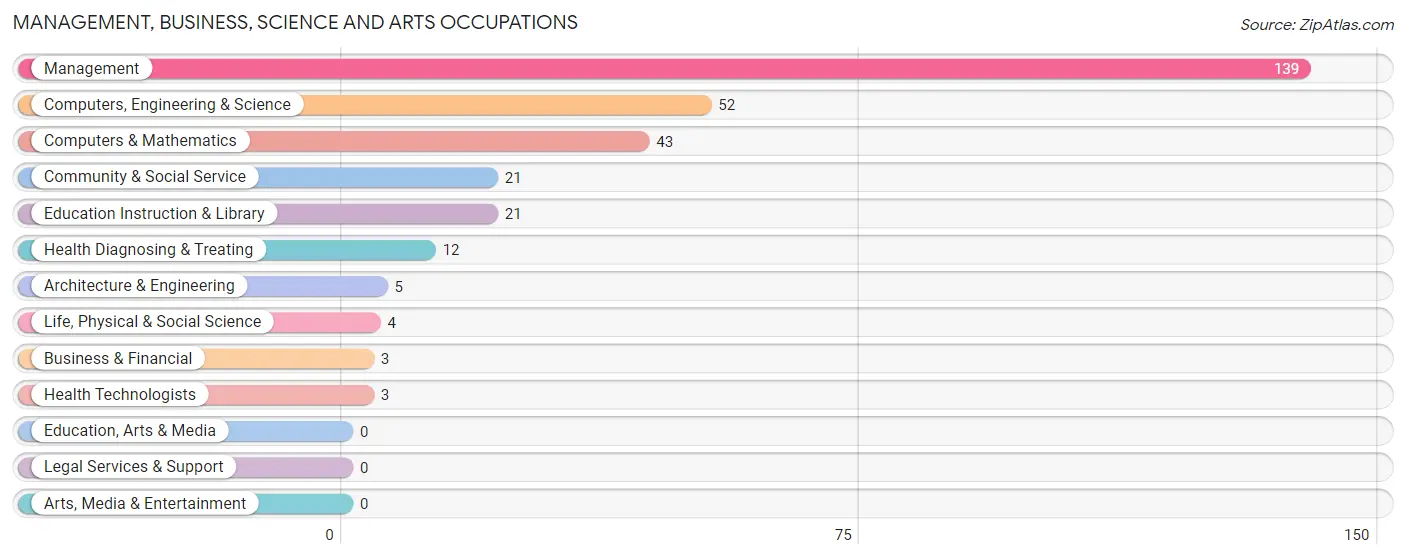
Management, Business, Science and Arts Occupations
The most common Management, Business, Science and Arts occupations in Millville are Management (139 | 32.9%), Computers, Engineering & Science (52 | 12.3%), Computers & Mathematics (43 | 10.2%), Community & Social Service (21 | 5.0%), and Education Instruction & Library (21 | 5.0%).
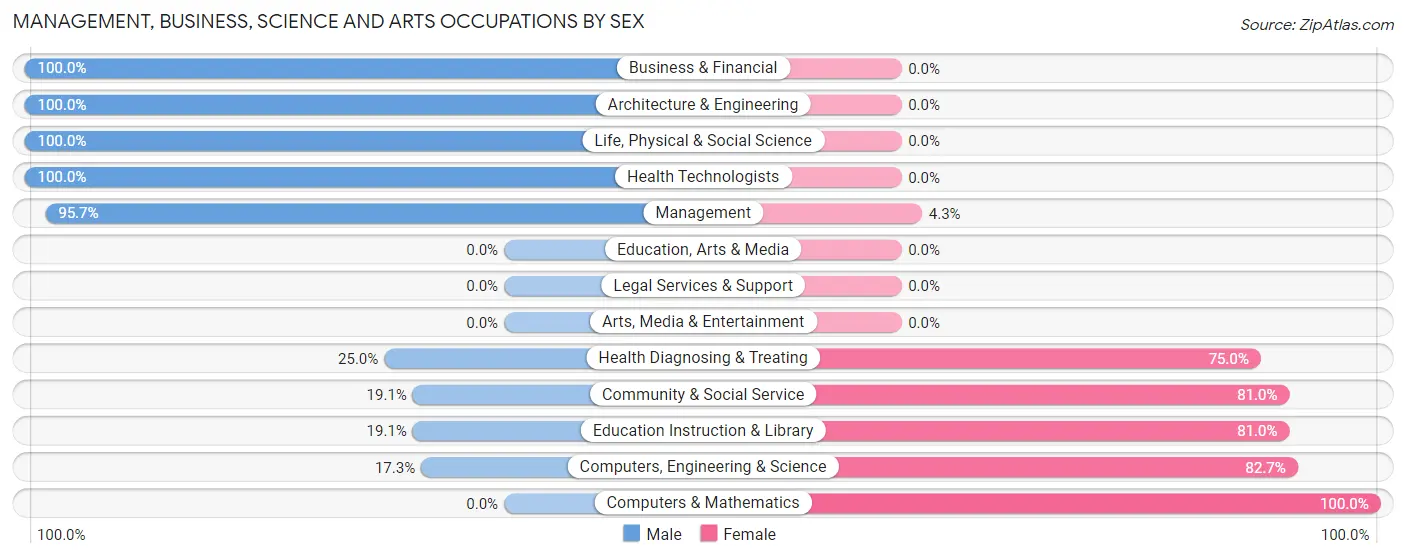
Management, Business, Science and Arts Occupations by Sex
Within the Management, Business, Science and Arts occupations in Millville, the most male-oriented occupations are Business & Financial (100.0%), Architecture & Engineering (100.0%), and Life, Physical & Social Science (100.0%), while the most female-oriented occupations are Computers & Mathematics (100.0%), Computers, Engineering & Science (82.7%), and Community & Social Service (80.9%).
| Occupation | Male | Female |
| Management | 133 (95.7%) | 6 (4.3%) |
| Business & Financial | 3 (100.0%) | 0 (0.0%) |
| Computers, Engineering & Science | 9 (17.3%) | 43 (82.7%) |
| Computers & Mathematics | 0 (0.0%) | 43 (100.0%) |
| Architecture & Engineering | 5 (100.0%) | 0 (0.0%) |
| Life, Physical & Social Science | 4 (100.0%) | 0 (0.0%) |
| Community & Social Service | 4 (19.1%) | 17 (80.9%) |
| Education, Arts & Media | 0 (0.0%) | 0 (0.0%) |
| Legal Services & Support | 0 (0.0%) | 0 (0.0%) |
| Education Instruction & Library | 4 (19.1%) | 17 (80.9%) |
| Arts, Media & Entertainment | 0 (0.0%) | 0 (0.0%) |
| Health Diagnosing & Treating | 3 (25.0%) | 9 (75.0%) |
| Health Technologists | 3 (100.0%) | 0 (0.0%) |
| Total (Category) | 152 (67.0%) | 75 (33.0%) |
| Total (Overall) | 288 (68.2%) | 134 (31.8%) |
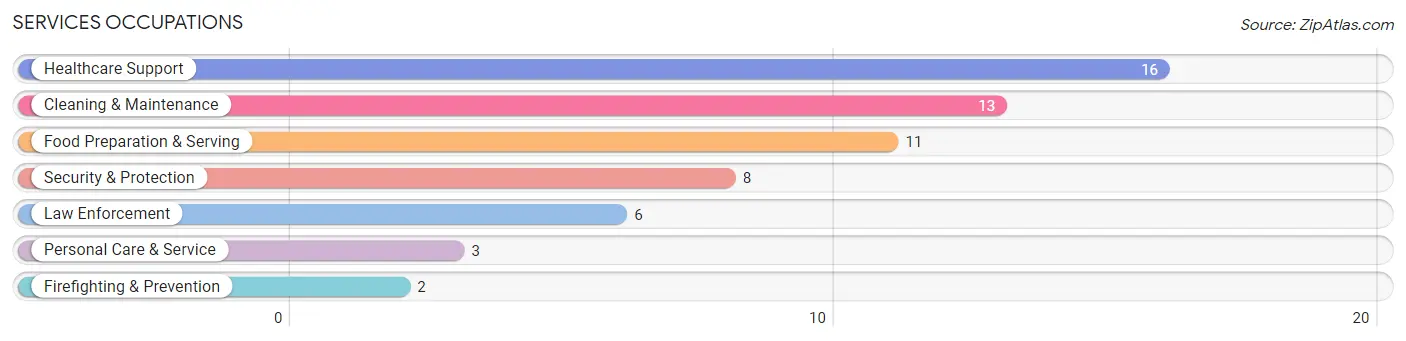
Services Occupations
The most common Services occupations in Millville are Healthcare Support (16 | 3.8%), Cleaning & Maintenance (13 | 3.1%), Food Preparation & Serving (11 | 2.6%), Security & Protection (8 | 1.9%), and Law Enforcement (6 | 1.4%).
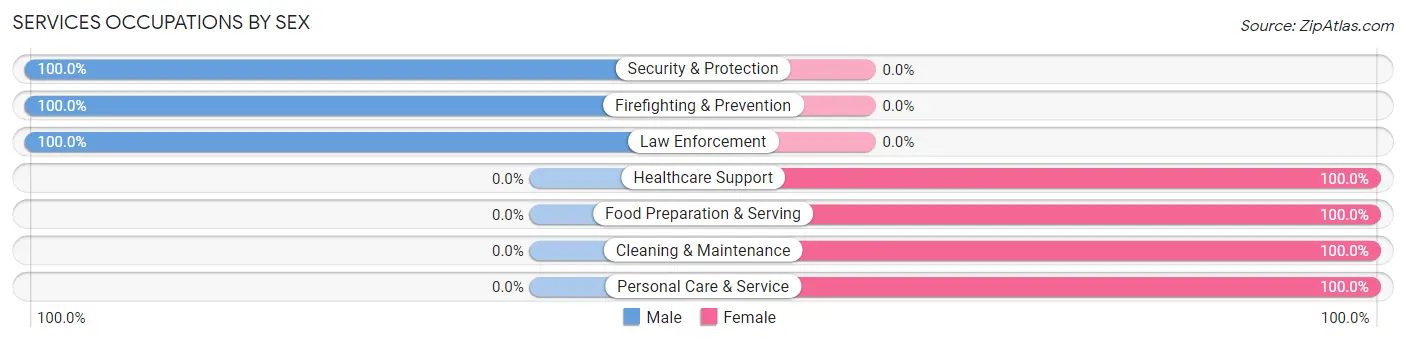
Services Occupations by Sex
Within the Services occupations in Millville, the most male-oriented occupations are Security & Protection (100.0%), Firefighting & Prevention (100.0%), and Law Enforcement (100.0%), while the most female-oriented occupations are Healthcare Support (100.0%), Food Preparation & Serving (100.0%), and Cleaning & Maintenance (100.0%).
| Occupation | Male | Female |
| Healthcare Support | 0 (0.0%) | 16 (100.0%) |
| Security & Protection | 8 (100.0%) | 0 (0.0%) |
| Firefighting & Prevention | 2 (100.0%) | 0 (0.0%) |
| Law Enforcement | 6 (100.0%) | 0 (0.0%) |
| Food Preparation & Serving | 0 (0.0%) | 11 (100.0%) |
| Cleaning & Maintenance | 0 (0.0%) | 13 (100.0%) |
| Personal Care & Service | 0 (0.0%) | 3 (100.0%) |
| Total (Category) | 8 (15.7%) | 43 (84.3%) |
| Total (Overall) | 288 (68.2%) | 134 (31.8%) |
Sales and Office Occupations
The most common Sales and Office occupations in Millville are Office & Administration (13 | 3.1%), and Sales & Related (4 | 0.9%).
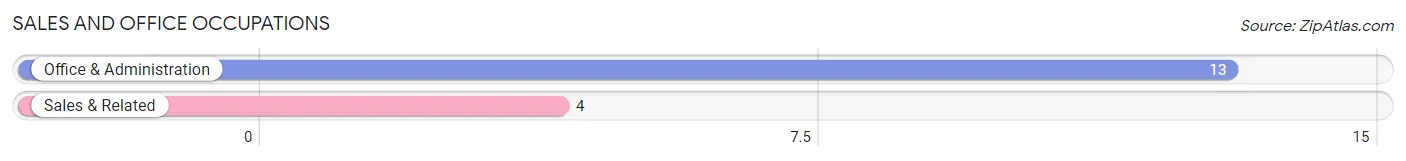
Sales and Office Occupations by Sex

| Occupation | Male | Female |
| Sales & Related | 4 (100.0%) | 0 (0.0%) |
| Office & Administration | 0 (0.0%) | 13 (100.0%) |
| Total (Category) | 4 (23.5%) | 13 (76.5%) |
| Total (Overall) | 288 (68.2%) | 134 (31.8%) |
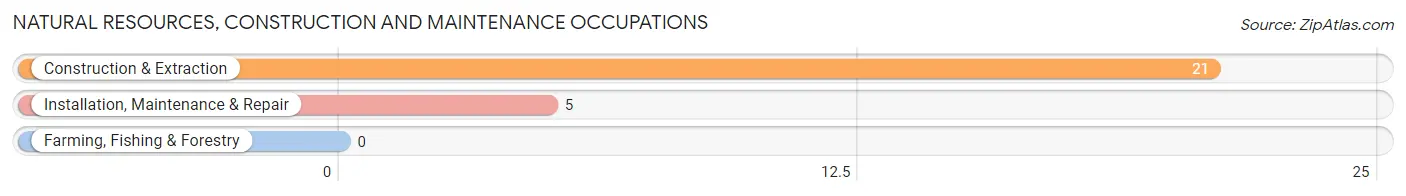
Natural Resources, Construction and Maintenance Occupations
The most common Natural Resources, Construction and Maintenance occupations in Millville are Construction & Extraction (21 | 5.0%), and Installation, Maintenance & Repair (5 | 1.2%).
Natural Resources, Construction and Maintenance Occupations by Sex
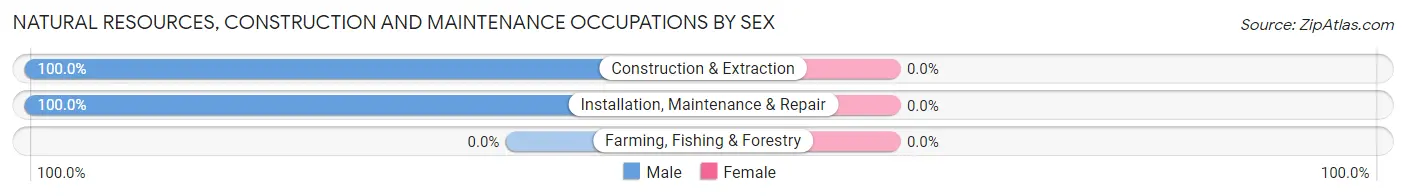
| Occupation | Male | Female |
| Farming, Fishing & Forestry | 0 (0.0%) | 0 (0.0%) |
| Construction & Extraction | 21 (100.0%) | 0 (0.0%) |
| Installation, Maintenance & Repair | 5 (100.0%) | 0 (0.0%) |
| Total (Category) | 26 (100.0%) | 0 (0.0%) |
| Total (Overall) | 288 (68.2%) | 134 (31.8%) |
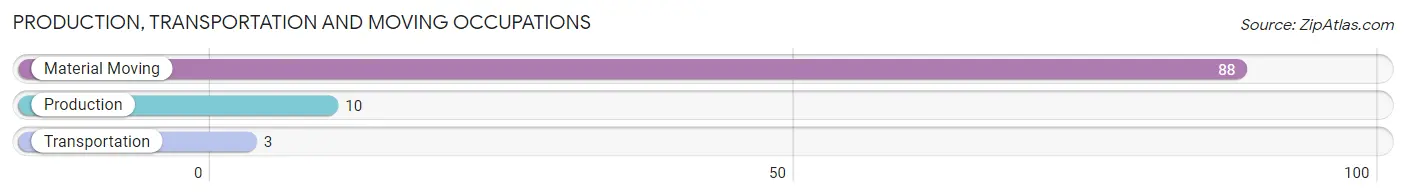
Production, Transportation and Moving Occupations
The most common Production, Transportation and Moving occupations in Millville are Material Moving (88 | 20.8%), Production (10 | 2.4%), and Transportation (3 | 0.7%).
Production, Transportation and Moving Occupations by Sex
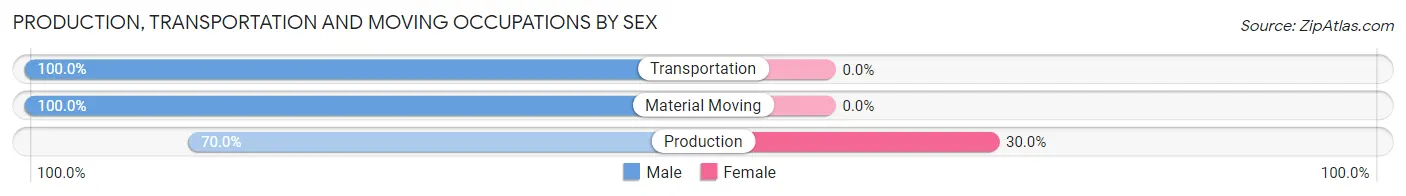
| Occupation | Male | Female |
| Production | 7 (70.0%) | 3 (30.0%) |
| Transportation | 3 (100.0%) | 0 (0.0%) |
| Material Moving | 88 (100.0%) | 0 (0.0%) |
| Total (Category) | 98 (97.0%) | 3 (3.0%) |
| Total (Overall) | 288 (68.2%) | 134 (31.8%) |
Employment Industries by Sex in Millville
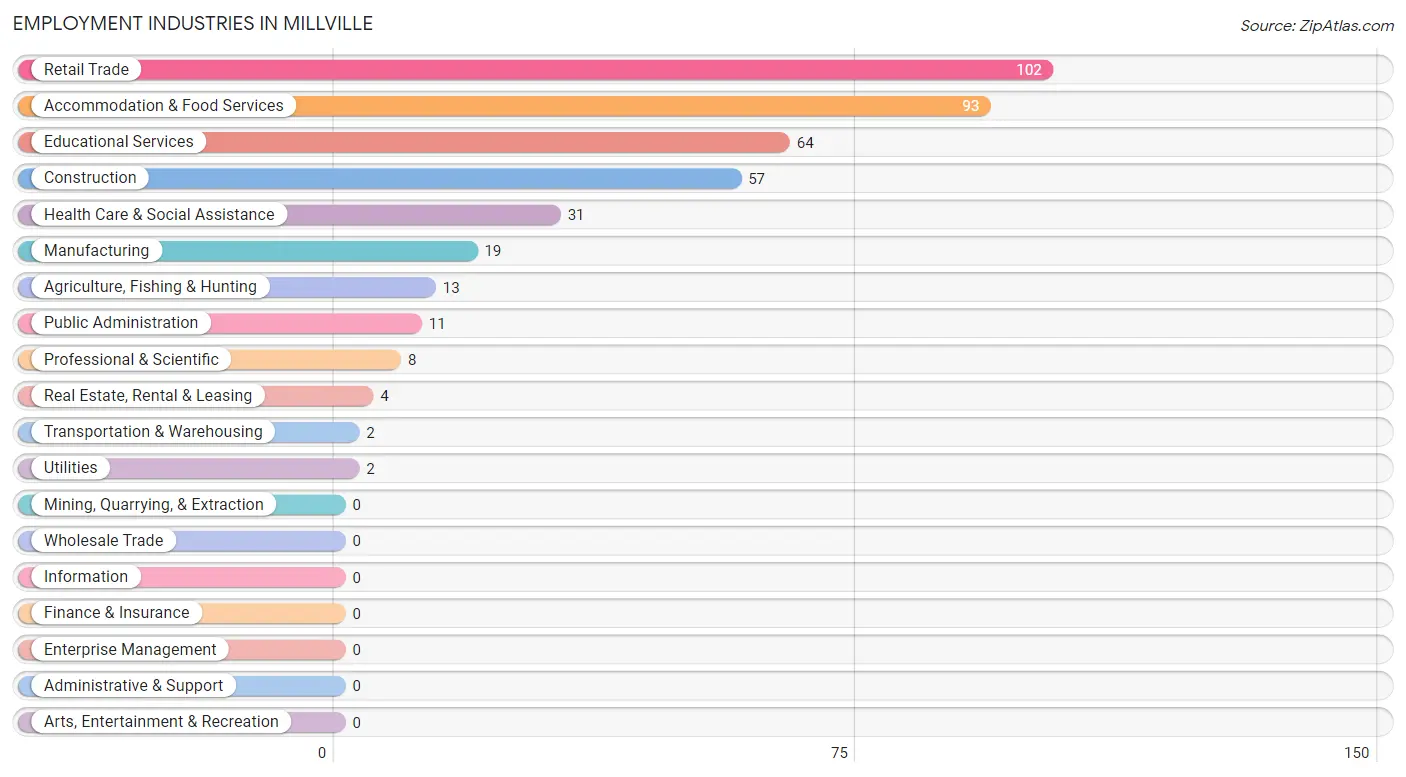
Employment Industries in Millville
The major employment industries in Millville include Retail Trade (102 | 24.2%), Accommodation & Food Services (93 | 22.0%), Educational Services (64 | 15.2%), Construction (57 | 13.5%), and Health Care & Social Assistance (31 | 7.3%).
Employment Industries by Sex in Millville
The Millville industries that see more men than women are Agriculture, Fishing & Hunting (100.0%), Construction (100.0%), and Transportation & Warehousing (100.0%), whereas the industries that tend to have a higher number of women are Real Estate, Rental & Leasing (100.0%), Educational Services (93.8%), and Health Care & Social Assistance (90.3%).
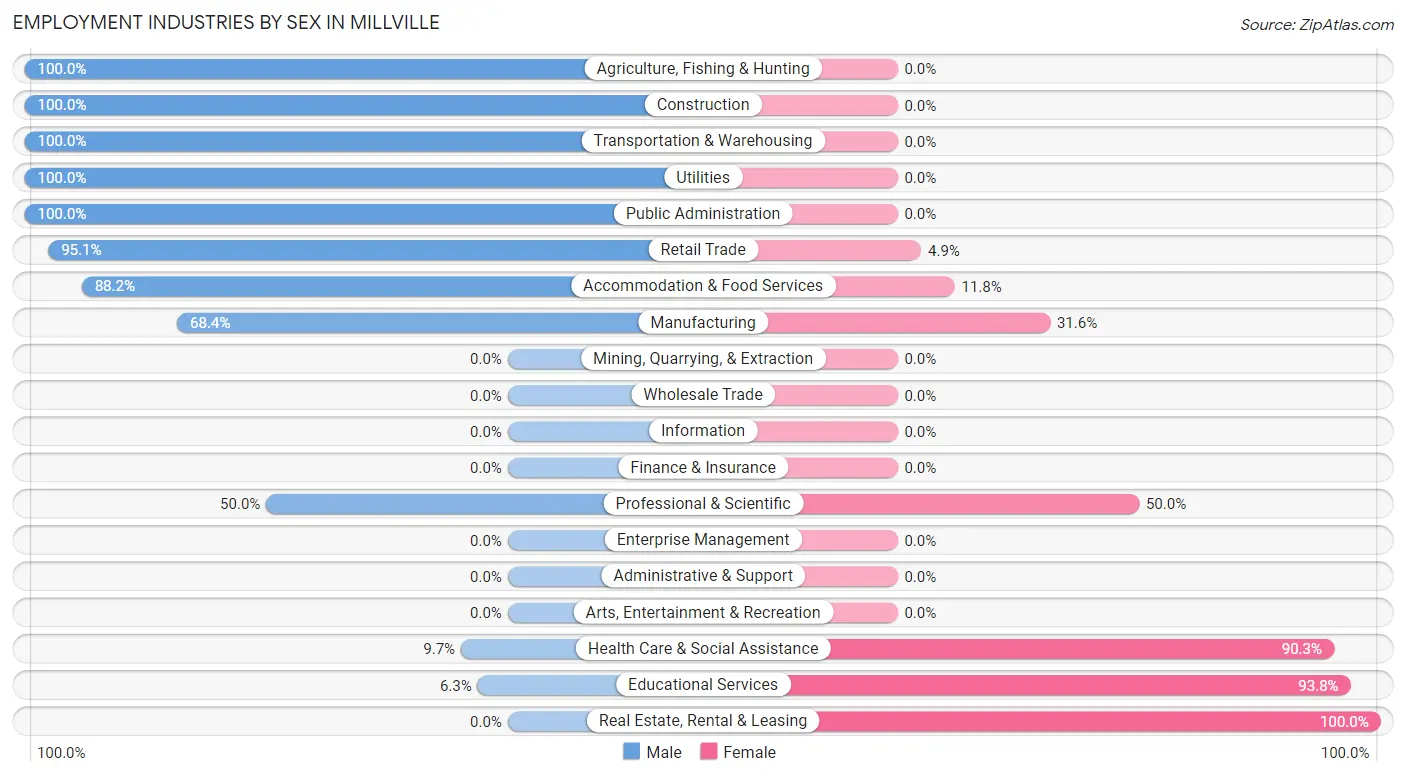
| Industry | Male | Female |
| Agriculture, Fishing & Hunting | 13 (100.0%) | 0 (0.0%) |
| Mining, Quarrying, & Extraction | 0 (0.0%) | 0 (0.0%) |
| Construction | 57 (100.0%) | 0 (0.0%) |
| Manufacturing | 13 (68.4%) | 6 (31.6%) |
| Wholesale Trade | 0 (0.0%) | 0 (0.0%) |
| Retail Trade | 97 (95.1%) | 5 (4.9%) |
| Transportation & Warehousing | 2 (100.0%) | 0 (0.0%) |
| Utilities | 2 (100.0%) | 0 (0.0%) |
| Information | 0 (0.0%) | 0 (0.0%) |
| Finance & Insurance | 0 (0.0%) | 0 (0.0%) |
| Real Estate, Rental & Leasing | 0 (0.0%) | 4 (100.0%) |
| Professional & Scientific | 4 (50.0%) | 4 (50.0%) |
| Enterprise Management | 0 (0.0%) | 0 (0.0%) |
| Administrative & Support | 0 (0.0%) | 0 (0.0%) |
| Educational Services | 4 (6.2%) | 60 (93.8%) |
| Health Care & Social Assistance | 3 (9.7%) | 28 (90.3%) |
| Arts, Entertainment & Recreation | 0 (0.0%) | 0 (0.0%) |
| Accommodation & Food Services | 82 (88.2%) | 11 (11.8%) |
| Public Administration | 11 (100.0%) | 0 (0.0%) |
| Total | 288 (68.2%) | 134 (31.8%) |
Education in Millville
School Enrollment in Millville
The most common levels of schooling among the 171 students in Millville are high school (104 | 60.8%), college / undergraduate (27 | 15.8%), and elementary school (19 | 11.1%).
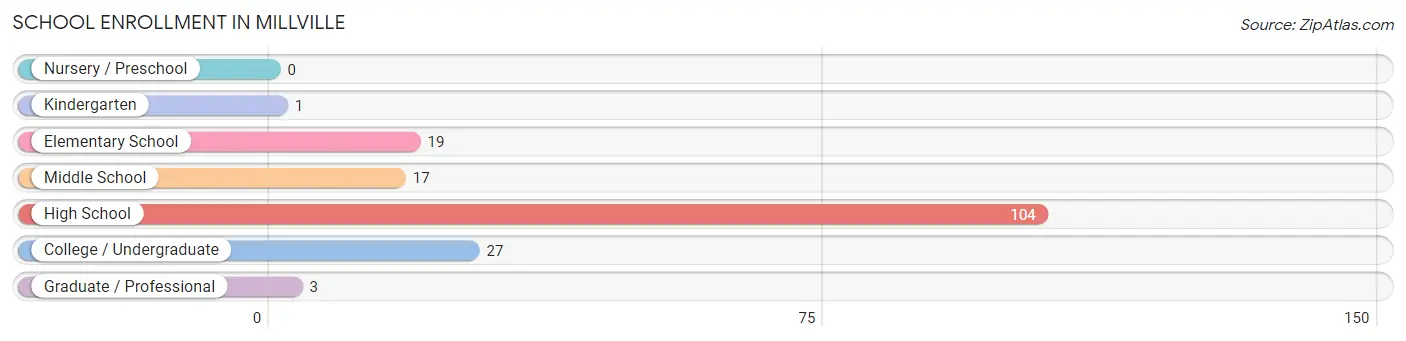
| School Level | # Students | % Students |
| Nursery / Preschool | 0 | 0.0% |
| Kindergarten | 1 | 0.6% |
| Elementary School | 19 | 11.1% |
| Middle School | 17 | 9.9% |
| High School | 104 | 60.8% |
| College / Undergraduate | 27 | 15.8% |
| Graduate / Professional | 3 | 1.8% |
| Total | 171 | 100.0% |
School Enrollment by Age by Funding Source in Millville
Out of a total of 171 students who are enrolled in schools in Millville, 25 (14.6%) attend a private institution, while the remaining 146 (85.4%) are enrolled in public schools. The age group of 35 years and over has the highest likelihood of being enrolled in private schools, with 3 (60.0% in the age bracket) enrolled. Conversely, the age group of 18 to 19 year olds has the lowest likelihood of being enrolled in a private school, with 92 (100.0% in the age bracket) attending a public institution.
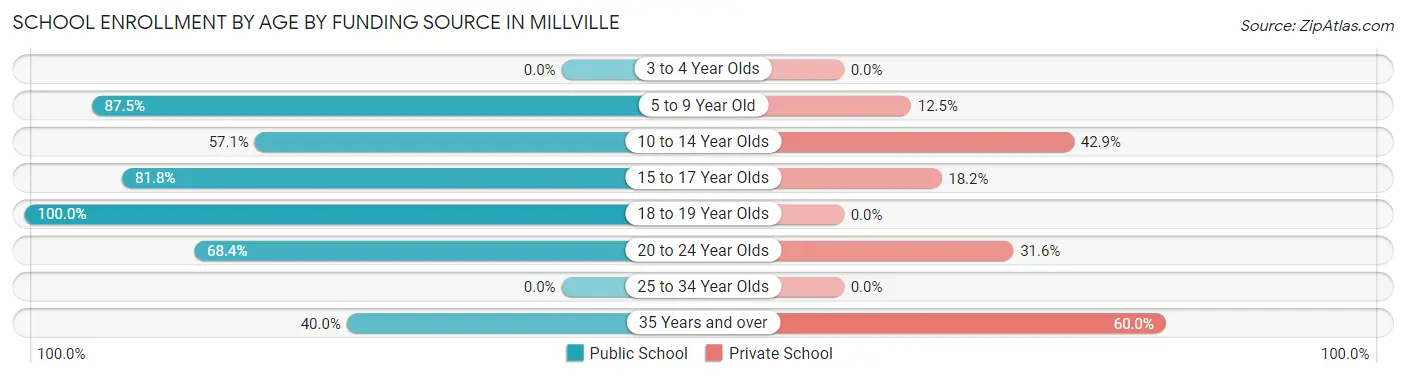
| Age Bracket | Public School | Private School |
| 3 to 4 Year Olds | 0 (0.0%) | 0 (0.0%) |
| 5 to 9 Year Old | 14 (87.5%) | 2 (12.5%) |
| 10 to 14 Year Olds | 16 (57.1%) | 12 (42.9%) |
| 15 to 17 Year Olds | 9 (81.8%) | 2 (18.2%) |
| 18 to 19 Year Olds | 92 (100.0%) | 0 (0.0%) |
| 20 to 24 Year Olds | 13 (68.4%) | 6 (31.6%) |
| 25 to 34 Year Olds | 0 (0.0%) | 0 (0.0%) |
| 35 Years and over | 2 (40.0%) | 3 (60.0%) |
| Total | 146 (85.4%) | 25 (14.6%) |
Educational Attainment by Field of Study in Millville
Business (41 | 23.3%), bio, nature & agricultural (33 | 18.8%), literature & languages (21 | 11.9%), education (16 | 9.1%), and engineering (12 | 6.8%) are the most common fields of study among 176 individuals in Millville who have obtained a bachelor's degree or higher.
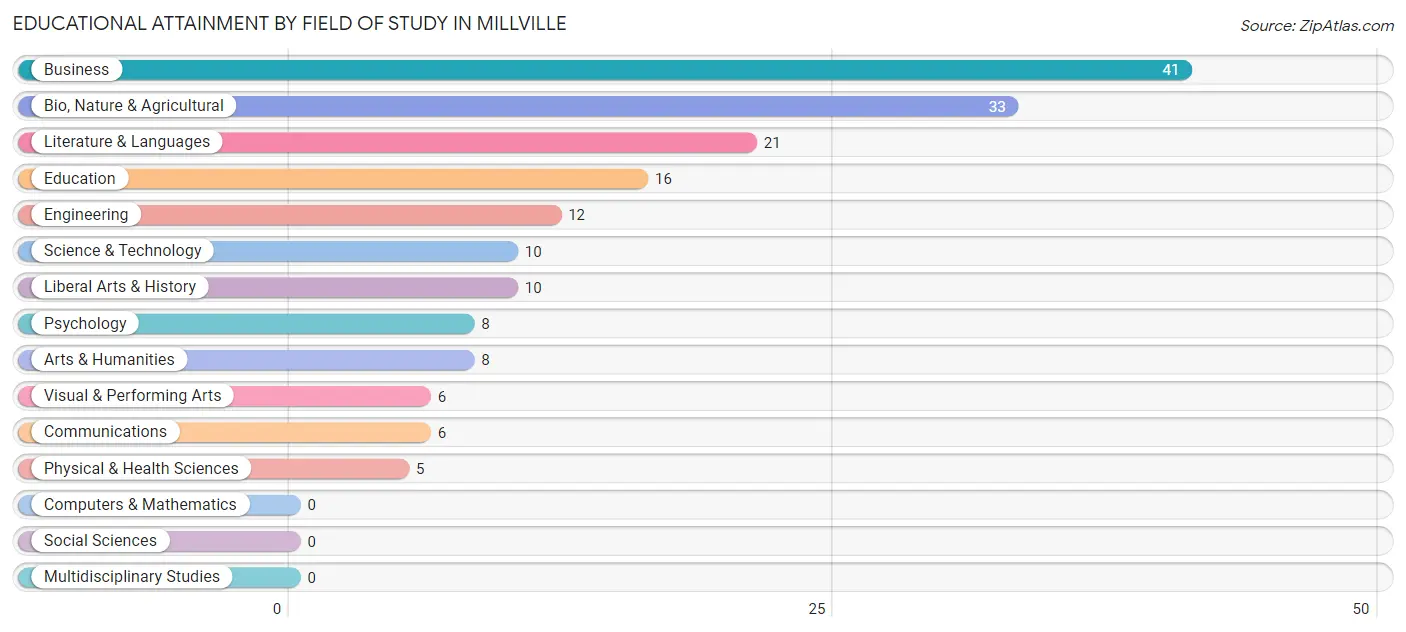
| Field of Study | # Graduates | % Graduates |
| Computers & Mathematics | 0 | 0.0% |
| Bio, Nature & Agricultural | 33 | 18.8% |
| Physical & Health Sciences | 5 | 2.8% |
| Psychology | 8 | 4.5% |
| Social Sciences | 0 | 0.0% |
| Engineering | 12 | 6.8% |
| Multidisciplinary Studies | 0 | 0.0% |
| Science & Technology | 10 | 5.7% |
| Business | 41 | 23.3% |
| Education | 16 | 9.1% |
| Literature & Languages | 21 | 11.9% |
| Liberal Arts & History | 10 | 5.7% |
| Visual & Performing Arts | 6 | 3.4% |
| Communications | 6 | 3.4% |
| Arts & Humanities | 8 | 4.5% |
| Total | 176 | 100.0% |
Transportation & Commute in Millville
Vehicle Availability by Sex in Millville
The most prevalent vehicle ownership categories in Millville are males with 4 vehicles (168, accounting for 58.3%) and females with 4 vehicles (43, making up 128.2%).
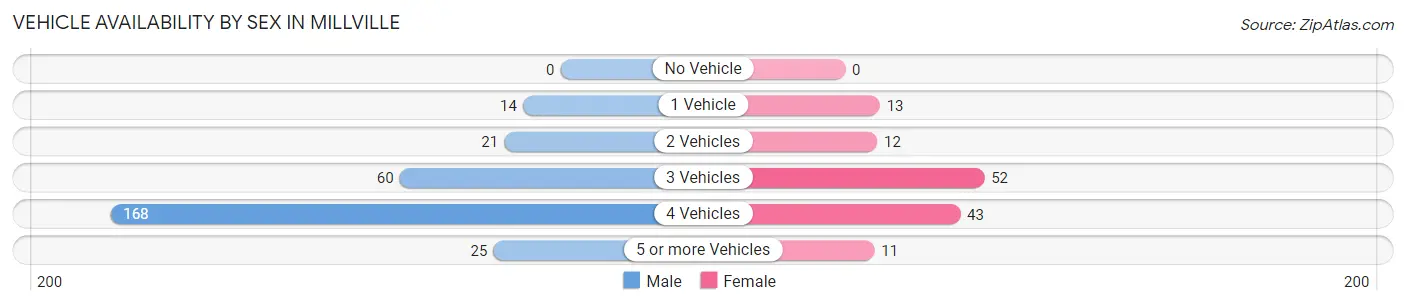
| Vehicles Available | Male | Female |
| No Vehicle | 0 (0.0%) | 0 (0.0%) |
| 1 Vehicle | 14 (4.9%) | 13 (9.9%) |
| 2 Vehicles | 21 (7.3%) | 12 (9.2%) |
| 3 Vehicles | 60 (20.8%) | 52 (39.7%) |
| 4 Vehicles | 168 (58.3%) | 43 (32.8%) |
| 5 or more Vehicles | 25 (8.7%) | 11 (8.4%) |
| Total | 288 (100.0%) | 131 (100.0%) |
Commute Time in Millville
The most frequently occuring commute durations in Millville are 20 to 24 minutes (158 commuters, 42.5%), 25 to 29 minutes (84 commuters, 22.6%), and 30 to 34 minutes (40 commuters, 10.7%).
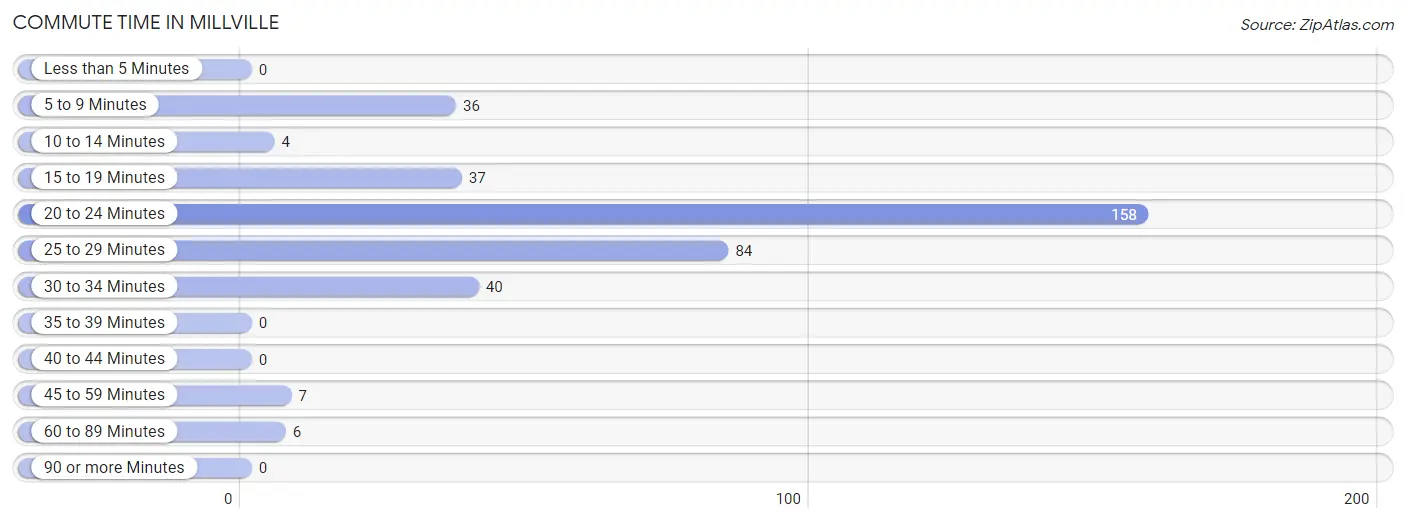
| Commute Time | # Commuters | % Commuters |
| Less than 5 Minutes | 0 | 0.0% |
| 5 to 9 Minutes | 36 | 9.7% |
| 10 to 14 Minutes | 4 | 1.1% |
| 15 to 19 Minutes | 37 | 10.0% |
| 20 to 24 Minutes | 158 | 42.5% |
| 25 to 29 Minutes | 84 | 22.6% |
| 30 to 34 Minutes | 40 | 10.7% |
| 35 to 39 Minutes | 0 | 0.0% |
| 40 to 44 Minutes | 0 | 0.0% |
| 45 to 59 Minutes | 7 | 1.9% |
| 60 to 89 Minutes | 6 | 1.6% |
| 90 or more Minutes | 0 | 0.0% |
Commute Time by Sex in Millville
The most common commute times in Millville are 20 to 24 minutes (123 commuters, 43.3%) for males and 20 to 24 minutes (35 commuters, 39.8%) for females.
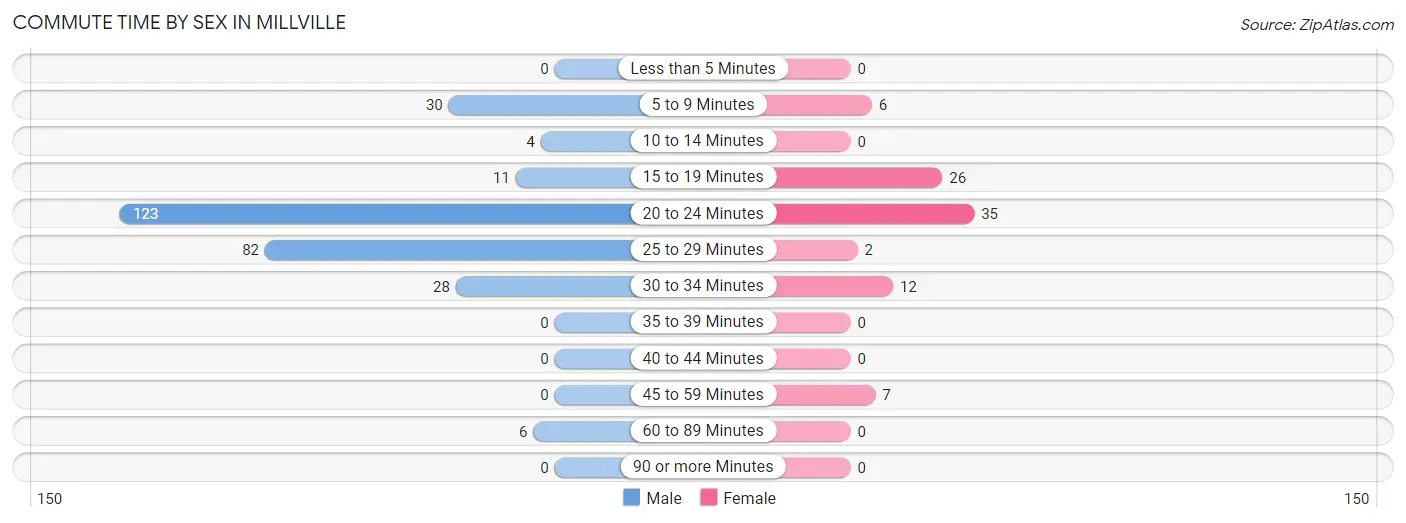
| Commute Time | Male | Female |
| Less than 5 Minutes | 0 (0.0%) | 0 (0.0%) |
| 5 to 9 Minutes | 30 (10.6%) | 6 (6.8%) |
| 10 to 14 Minutes | 4 (1.4%) | 0 (0.0%) |
| 15 to 19 Minutes | 11 (3.9%) | 26 (29.5%) |
| 20 to 24 Minutes | 123 (43.3%) | 35 (39.8%) |
| 25 to 29 Minutes | 82 (28.9%) | 2 (2.3%) |
| 30 to 34 Minutes | 28 (9.9%) | 12 (13.6%) |
| 35 to 39 Minutes | 0 (0.0%) | 0 (0.0%) |
| 40 to 44 Minutes | 0 (0.0%) | 0 (0.0%) |
| 45 to 59 Minutes | 0 (0.0%) | 7 (8.0%) |
| 60 to 89 Minutes | 6 (2.1%) | 0 (0.0%) |
| 90 or more Minutes | 0 (0.0%) | 0 (0.0%) |
Time of Departure to Work by Sex in Millville
The most frequent times of departure to work in Millville are 12:00 AM to 4:59 AM (105, 37.0%) for males and 7:00 AM to 7:29 AM (29, 33.0%) for females.
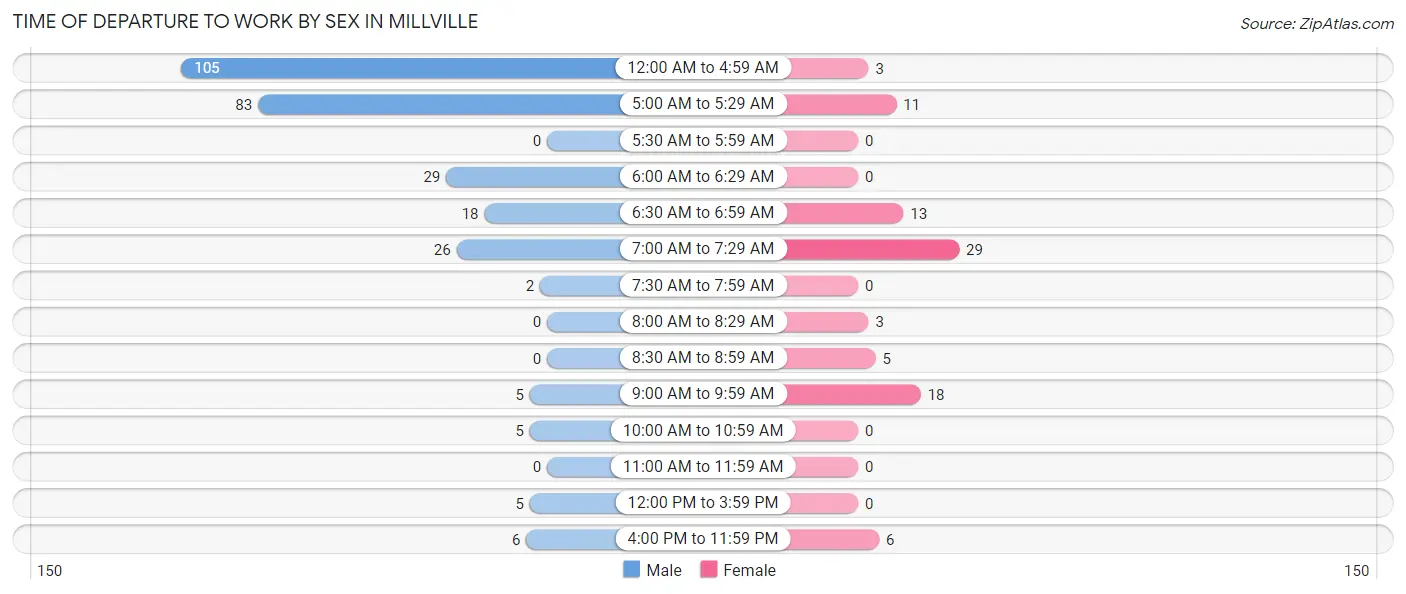
| Time of Departure | Male | Female |
| 12:00 AM to 4:59 AM | 105 (37.0%) | 3 (3.4%) |
| 5:00 AM to 5:29 AM | 83 (29.2%) | 11 (12.5%) |
| 5:30 AM to 5:59 AM | 0 (0.0%) | 0 (0.0%) |
| 6:00 AM to 6:29 AM | 29 (10.2%) | 0 (0.0%) |
| 6:30 AM to 6:59 AM | 18 (6.3%) | 13 (14.8%) |
| 7:00 AM to 7:29 AM | 26 (9.1%) | 29 (33.0%) |
| 7:30 AM to 7:59 AM | 2 (0.7%) | 0 (0.0%) |
| 8:00 AM to 8:29 AM | 0 (0.0%) | 3 (3.4%) |
| 8:30 AM to 8:59 AM | 0 (0.0%) | 5 (5.7%) |
| 9:00 AM to 9:59 AM | 5 (1.8%) | 18 (20.4%) |
| 10:00 AM to 10:59 AM | 5 (1.8%) | 0 (0.0%) |
| 11:00 AM to 11:59 AM | 0 (0.0%) | 0 (0.0%) |
| 12:00 PM to 3:59 PM | 5 (1.8%) | 0 (0.0%) |
| 4:00 PM to 11:59 PM | 6 (2.1%) | 6 (6.8%) |
| Total | 284 (100.0%) | 88 (100.0%) |
Housing Occupancy in Millville
Occupancy by Ownership in Millville
Of the total 310 dwellings in Millville, owner-occupied units account for 264 (85.2%), while renter-occupied units make up 46 (14.8%).
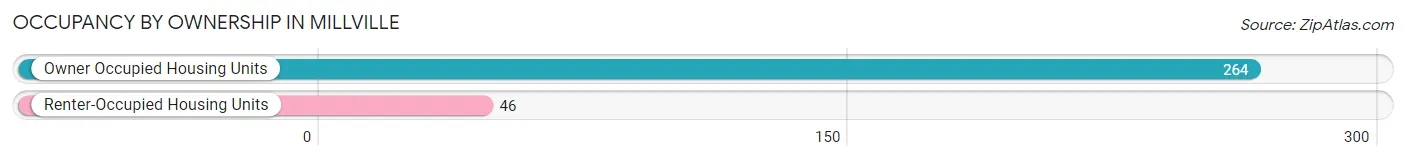
| Occupancy | # Housing Units | % Housing Units |
| Owner Occupied Housing Units | 264 | 85.2% |
| Renter-Occupied Housing Units | 46 | 14.8% |
| Total Occupied Housing Units | 310 | 100.0% |
Occupancy by Household Size in Millville
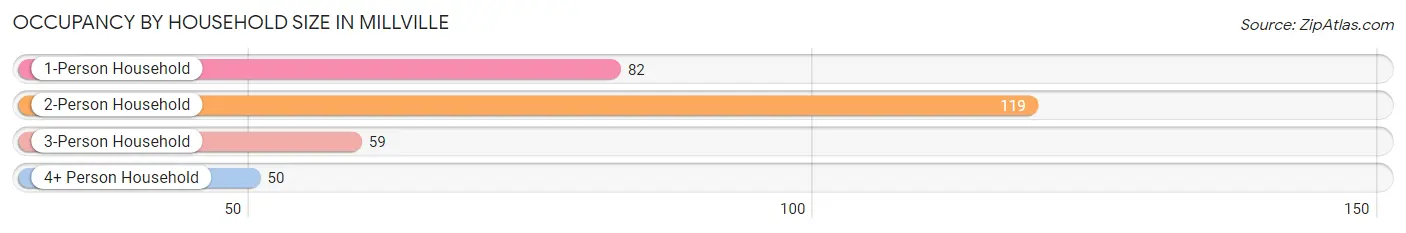
| Household Size | # Housing Units | % Housing Units |
| 1-Person Household | 82 | 26.5% |
| 2-Person Household | 119 | 38.4% |
| 3-Person Household | 59 | 19.0% |
| 4+ Person Household | 50 | 16.1% |
| Total Housing Units | 310 | 100.0% |
Occupancy by Ownership by Household Size in Millville
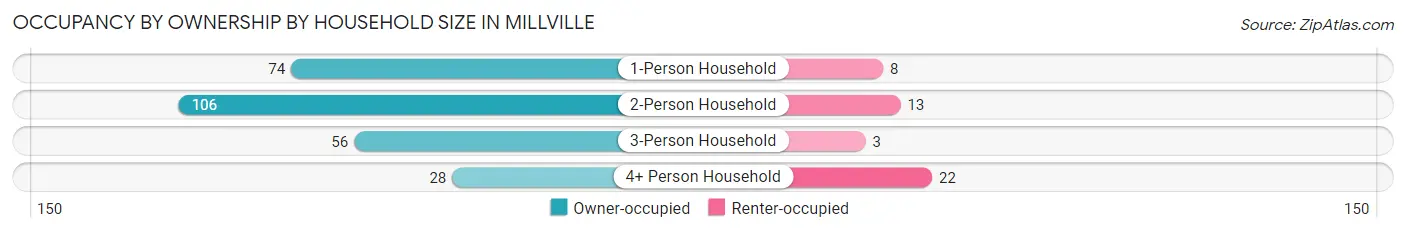
| Household Size | Owner-occupied | Renter-occupied |
| 1-Person Household | 74 (90.2%) | 8 (9.8%) |
| 2-Person Household | 106 (89.1%) | 13 (10.9%) |
| 3-Person Household | 56 (94.9%) | 3 (5.1%) |
| 4+ Person Household | 28 (56.0%) | 22 (44.0%) |
| Total Housing Units | 264 (85.2%) | 46 (14.8%) |
Occupancy by Educational Attainment in Millville
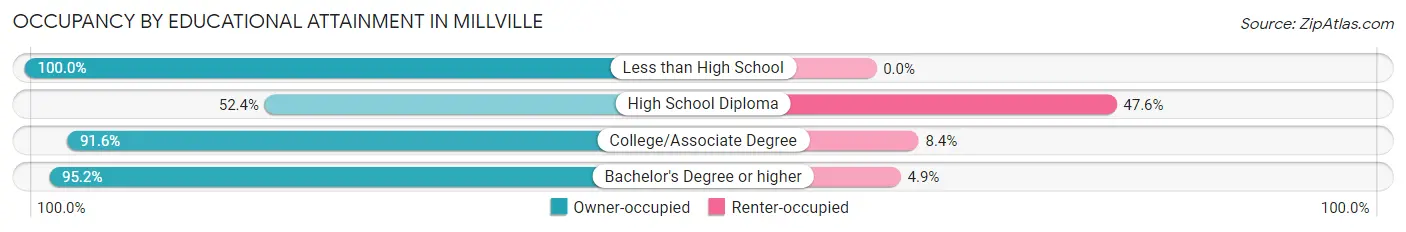
| Household Size | Owner-occupied | Renter-occupied |
| Less than High School | 13 (100.0%) | 0 (0.0%) |
| High School Diploma | 33 (52.4%) | 30 (47.6%) |
| College/Associate Degree | 120 (91.6%) | 11 (8.4%) |
| Bachelor's Degree or higher | 98 (95.2%) | 5 (4.9%) |
Occupancy by Age of Householder in Millville
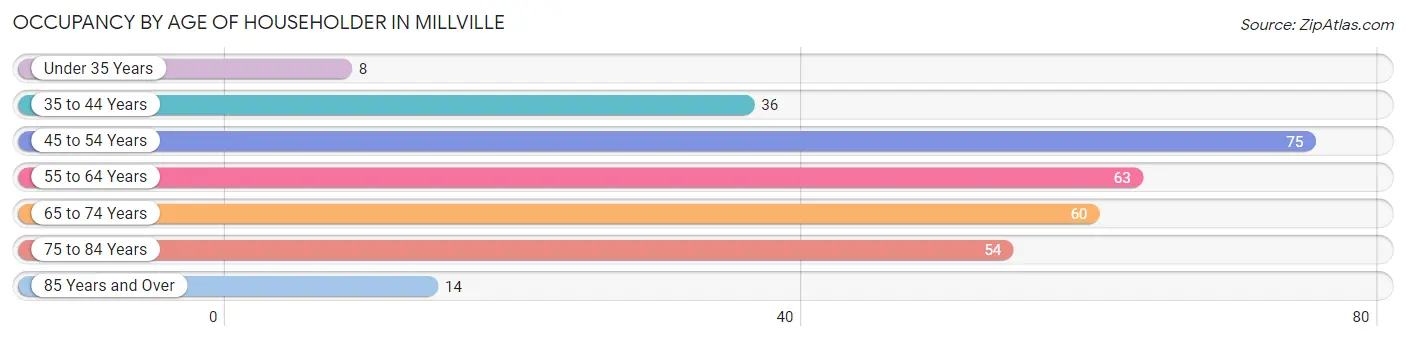
| Age Bracket | # Households | % Households |
| Under 35 Years | 8 | 2.6% |
| 35 to 44 Years | 36 | 11.6% |
| 45 to 54 Years | 75 | 24.2% |
| 55 to 64 Years | 63 | 20.3% |
| 65 to 74 Years | 60 | 19.4% |
| 75 to 84 Years | 54 | 17.4% |
| 85 Years and Over | 14 | 4.5% |
| Total | 310 | 100.0% |
Housing Finances in Millville
Median Income by Occupancy in Millville
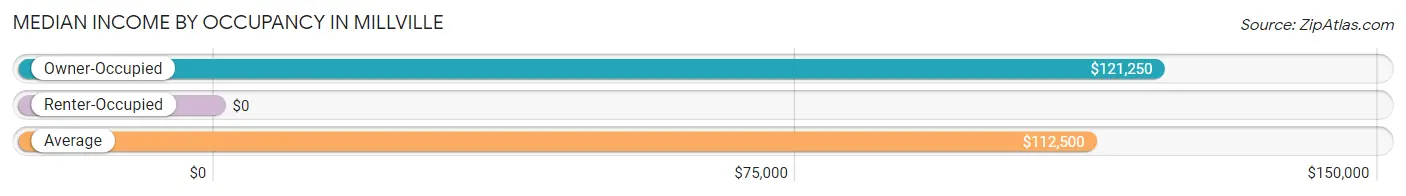
| Occupancy Type | # Households | Median Income |
| Owner-Occupied | 264 (85.2%) | $121,250 |
| Renter-Occupied | 46 (14.8%) | $0 |
| Average | 310 (100.0%) | $112,500 |
Occupancy by Householder Income Bracket in Millville
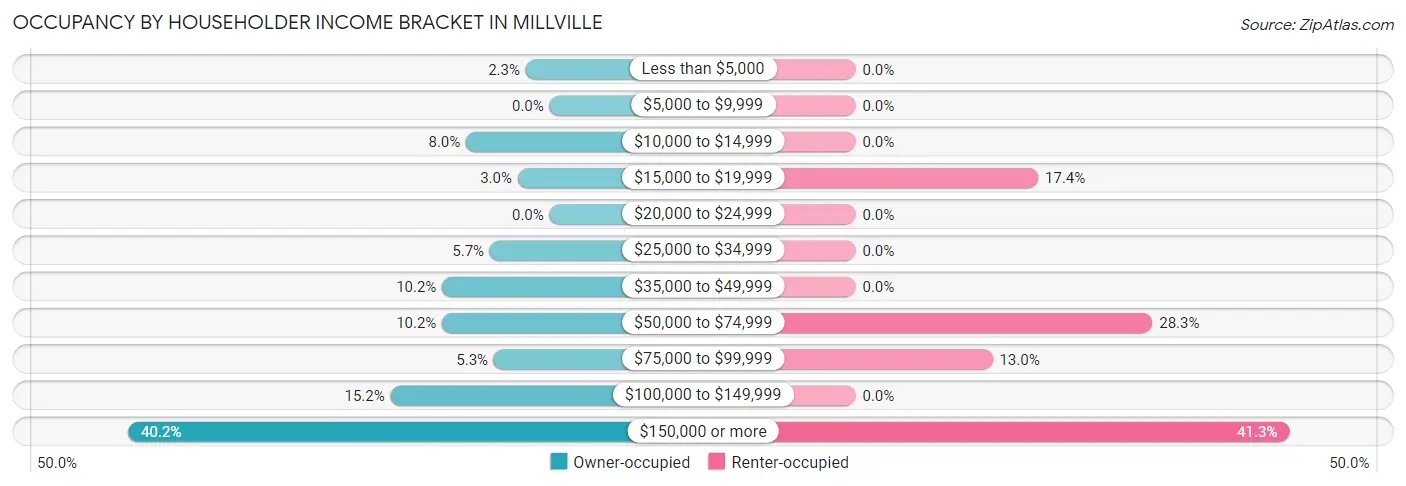
| Income Bracket | Owner-occupied | Renter-occupied |
| Less than $5,000 | 6 (2.3%) | 0 (0.0%) |
| $5,000 to $9,999 | 0 (0.0%) | 0 (0.0%) |
| $10,000 to $14,999 | 21 (8.0%) | 0 (0.0%) |
| $15,000 to $19,999 | 8 (3.0%) | 8 (17.4%) |
| $20,000 to $24,999 | 0 (0.0%) | 0 (0.0%) |
| $25,000 to $34,999 | 15 (5.7%) | 0 (0.0%) |
| $35,000 to $49,999 | 27 (10.2%) | 0 (0.0%) |
| $50,000 to $74,999 | 27 (10.2%) | 13 (28.3%) |
| $75,000 to $99,999 | 14 (5.3%) | 6 (13.0%) |
| $100,000 to $149,999 | 40 (15.1%) | 0 (0.0%) |
| $150,000 or more | 106 (40.2%) | 19 (41.3%) |
| Total | 264 (100.0%) | 46 (100.0%) |
Monthly Housing Cost Tiers in Millville
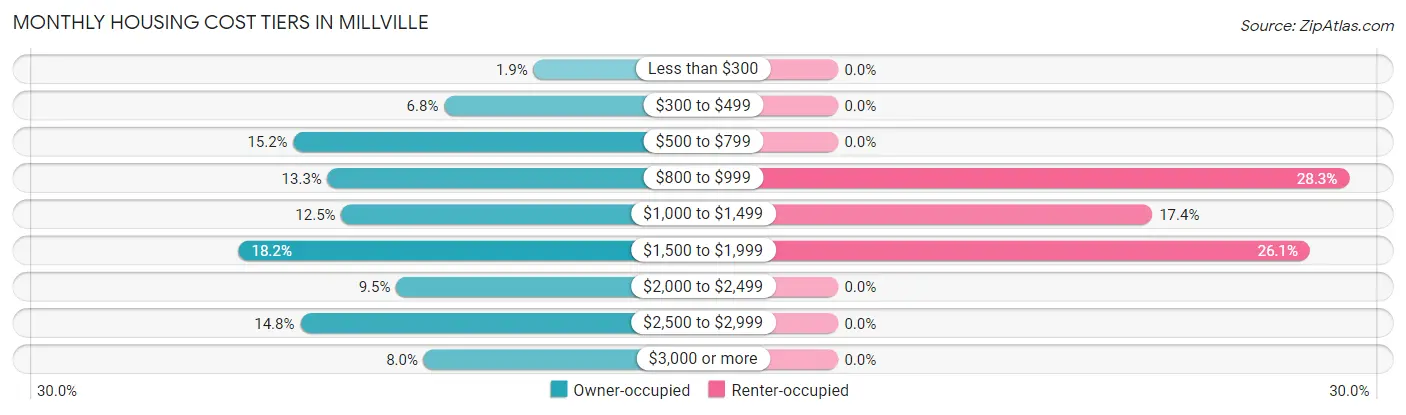
| Monthly Cost | Owner-occupied | Renter-occupied |
| Less than $300 | 5 (1.9%) | 0 (0.0%) |
| $300 to $499 | 18 (6.8%) | 0 (0.0%) |
| $500 to $799 | 40 (15.1%) | 0 (0.0%) |
| $800 to $999 | 35 (13.3%) | 13 (28.3%) |
| $1,000 to $1,499 | 33 (12.5%) | 8 (17.4%) |
| $1,500 to $1,999 | 48 (18.2%) | 12 (26.1%) |
| $2,000 to $2,499 | 25 (9.5%) | 0 (0.0%) |
| $2,500 to $2,999 | 39 (14.8%) | 0 (0.0%) |
| $3,000 or more | 21 (8.0%) | 0 (0.0%) |
| Total | 264 (100.0%) | 46 (100.0%) |
Physical Housing Characteristics in Millville
Housing Structures in Millville
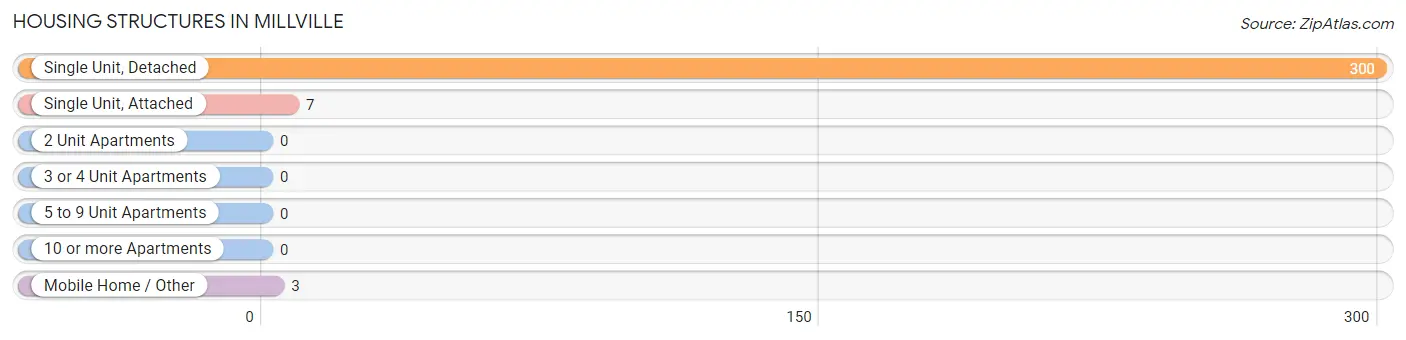
| Structure Type | # Housing Units | % Housing Units |
| Single Unit, Detached | 300 | 96.8% |
| Single Unit, Attached | 7 | 2.3% |
| 2 Unit Apartments | 0 | 0.0% |
| 3 or 4 Unit Apartments | 0 | 0.0% |
| 5 to 9 Unit Apartments | 0 | 0.0% |
| 10 or more Apartments | 0 | 0.0% |
| Mobile Home / Other | 3 | 1.0% |
| Total | 310 | 100.0% |
Housing Structures by Occupancy in Millville
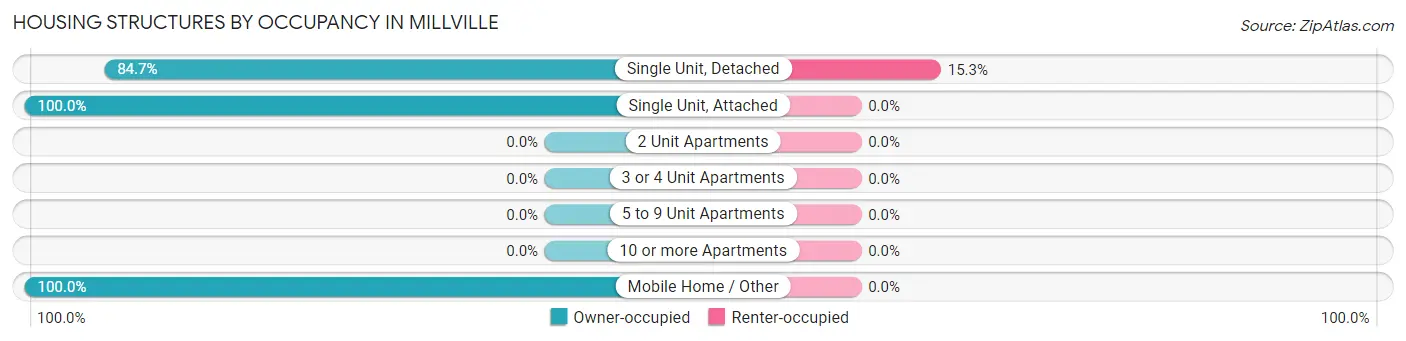
| Structure Type | Owner-occupied | Renter-occupied |
| Single Unit, Detached | 254 (84.7%) | 46 (15.3%) |
| Single Unit, Attached | 7 (100.0%) | 0 (0.0%) |
| 2 Unit Apartments | 0 (0.0%) | 0 (0.0%) |
| 3 or 4 Unit Apartments | 0 (0.0%) | 0 (0.0%) |
| 5 to 9 Unit Apartments | 0 (0.0%) | 0 (0.0%) |
| 10 or more Apartments | 0 (0.0%) | 0 (0.0%) |
| Mobile Home / Other | 3 (100.0%) | 0 (0.0%) |
| Total | 264 (85.2%) | 46 (14.8%) |
Housing Structures by Number of Rooms in Millville
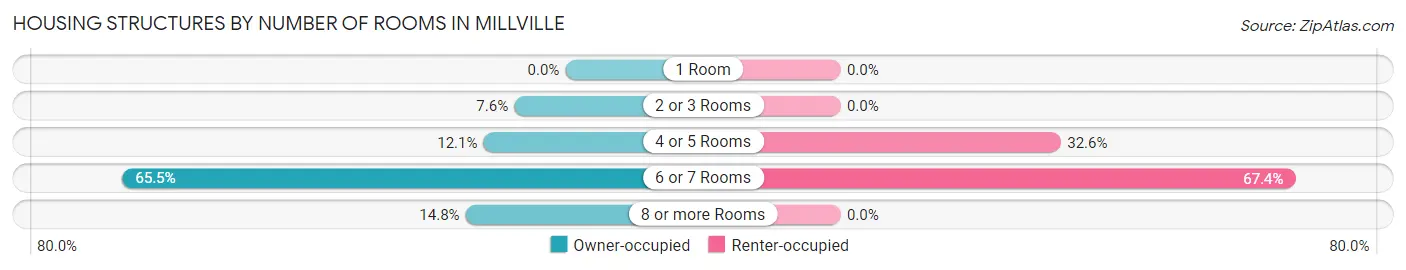
| Number of Rooms | Owner-occupied | Renter-occupied |
| 1 Room | 0 (0.0%) | 0 (0.0%) |
| 2 or 3 Rooms | 20 (7.6%) | 0 (0.0%) |
| 4 or 5 Rooms | 32 (12.1%) | 15 (32.6%) |
| 6 or 7 Rooms | 173 (65.5%) | 31 (67.4%) |
| 8 or more Rooms | 39 (14.8%) | 0 (0.0%) |
| Total | 264 (100.0%) | 46 (100.0%) |
Housing Structure by Heating Type in Millville
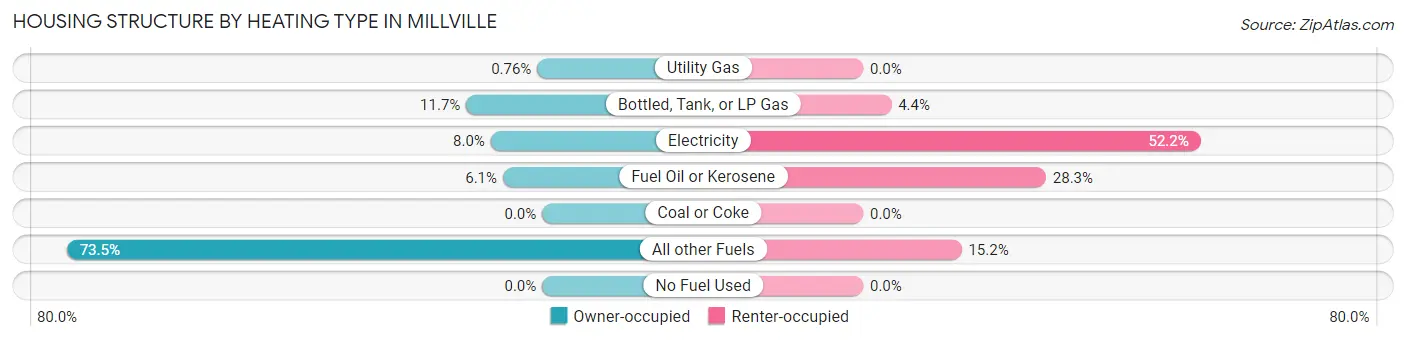
| Heating Type | Owner-occupied | Renter-occupied |
| Utility Gas | 2 (0.8%) | 0 (0.0%) |
| Bottled, Tank, or LP Gas | 31 (11.7%) | 2 (4.3%) |
| Electricity | 21 (8.0%) | 24 (52.2%) |
| Fuel Oil or Kerosene | 16 (6.1%) | 13 (28.3%) |
| Coal or Coke | 0 (0.0%) | 0 (0.0%) |
| All other Fuels | 194 (73.5%) | 7 (15.2%) |
| No Fuel Used | 0 (0.0%) | 0 (0.0%) |
| Total | 264 (100.0%) | 46 (100.0%) |
Household Vehicle Usage in Millville
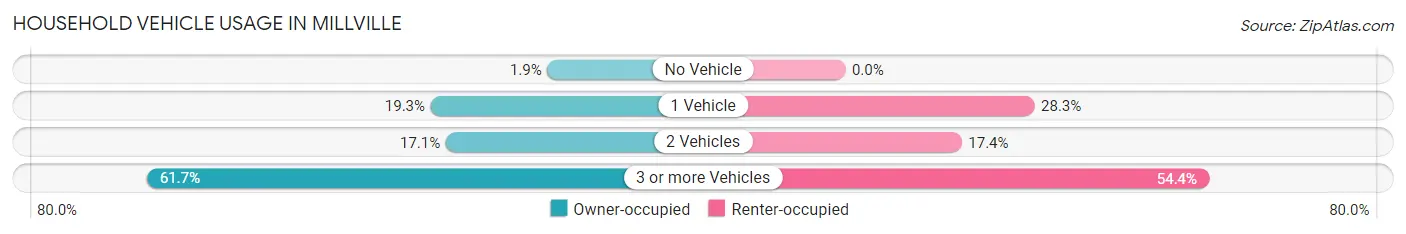
| Vehicles per Household | Owner-occupied | Renter-occupied |
| No Vehicle | 5 (1.9%) | 0 (0.0%) |
| 1 Vehicle | 51 (19.3%) | 13 (28.3%) |
| 2 Vehicles | 45 (17.1%) | 8 (17.4%) |
| 3 or more Vehicles | 163 (61.7%) | 25 (54.3%) |
| Total | 264 (100.0%) | 46 (100.0%) |
Real Estate & Mortgages in Millville
Real Estate and Mortgage Overview in Millville
| Characteristic | Without Mortgage | With Mortgage |
| Housing Units | 125 | 139 |
| Median Property Value | $337,500 | $355,400 |
| Median Household Income | $46,563 | $85 |
| Monthly Housing Costs | $795 | $21 |
| Real Estate Taxes | $3,803 | $0 |
Property Value by Mortgage Status in Millville
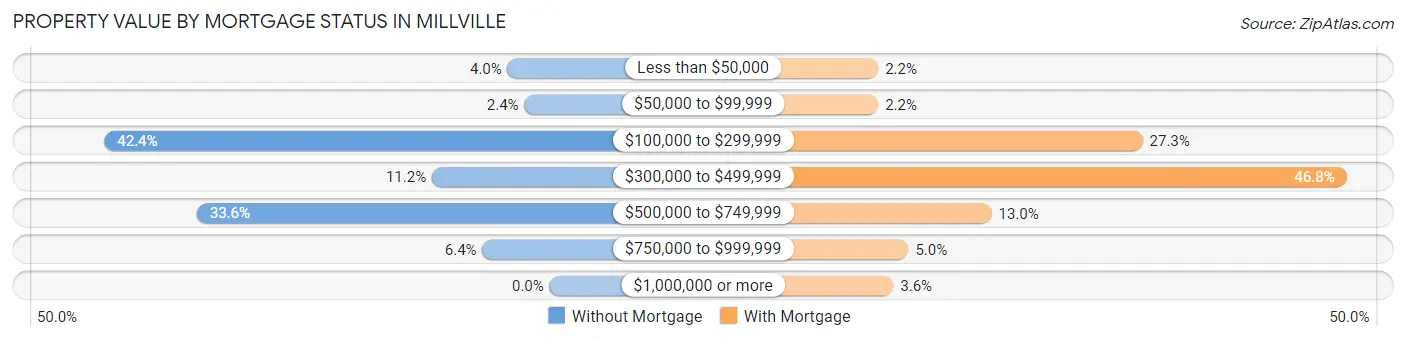
| Property Value | Without Mortgage | With Mortgage |
| Less than $50,000 | 5 (4.0%) | 3 (2.2%) |
| $50,000 to $99,999 | 3 (2.4%) | 3 (2.2%) |
| $100,000 to $299,999 | 53 (42.4%) | 38 (27.3%) |
| $300,000 to $499,999 | 14 (11.2%) | 65 (46.8%) |
| $500,000 to $749,999 | 42 (33.6%) | 18 (13.0%) |
| $750,000 to $999,999 | 8 (6.4%) | 7 (5.0%) |
| $1,000,000 or more | 0 (0.0%) | 5 (3.6%) |
| Total | 125 (100.0%) | 139 (100.0%) |
Household Income by Mortgage Status in Millville
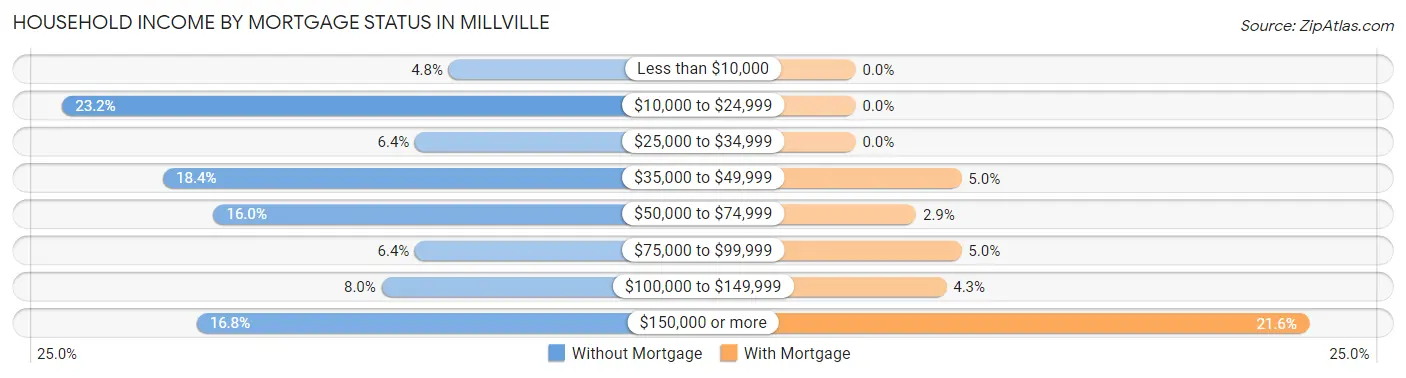
| Household Income | Without Mortgage | With Mortgage |
| Less than $10,000 | 6 (4.8%) | 0 (0.0%) |
| $10,000 to $24,999 | 29 (23.2%) | 0 (0.0%) |
| $25,000 to $34,999 | 8 (6.4%) | 0 (0.0%) |
| $35,000 to $49,999 | 23 (18.4%) | 7 (5.0%) |
| $50,000 to $74,999 | 20 (16.0%) | 4 (2.9%) |
| $75,000 to $99,999 | 8 (6.4%) | 7 (5.0%) |
| $100,000 to $149,999 | 10 (8.0%) | 6 (4.3%) |
| $150,000 or more | 21 (16.8%) | 30 (21.6%) |
| Total | 125 (100.0%) | 139 (100.0%) |
Property Value to Household Income Ratio in Millville
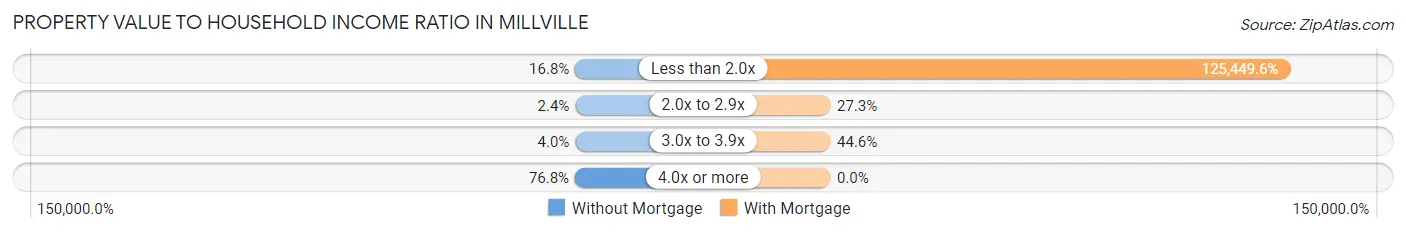
| Value-to-Income Ratio | Without Mortgage | With Mortgage |
| Less than 2.0x | 21 (16.8%) | 174,375 (125,449.6%) |
| 2.0x to 2.9x | 3 (2.4%) | 38 (27.3%) |
| 3.0x to 3.9x | 5 (4.0%) | 62 (44.6%) |
| 4.0x or more | 96 (76.8%) | 0 (0.0%) |
| Total | 125 (100.0%) | 139 (100.0%) |
Real Estate Taxes by Mortgage Status in Millville
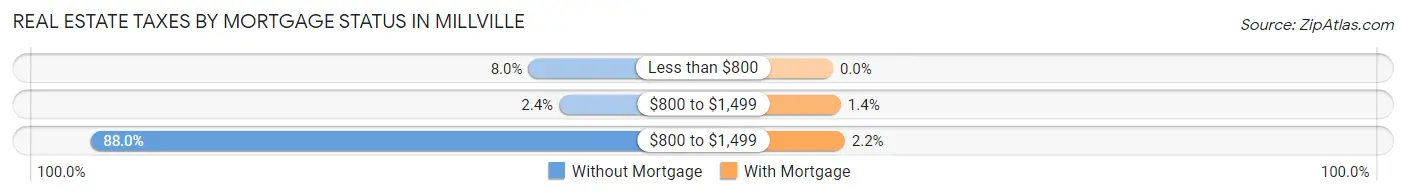
| Property Taxes | Without Mortgage | With Mortgage |
| Less than $800 | 10 (8.0%) | 0 (0.0%) |
| $800 to $1,499 | 3 (2.4%) | 2 (1.4%) |
| $800 to $1,499 | 110 (88.0%) | 3 (2.2%) |
| Total | 125 (100.0%) | 139 (100.0%) |
Health & Disability in Millville
Health Insurance Coverage by Age in Millville
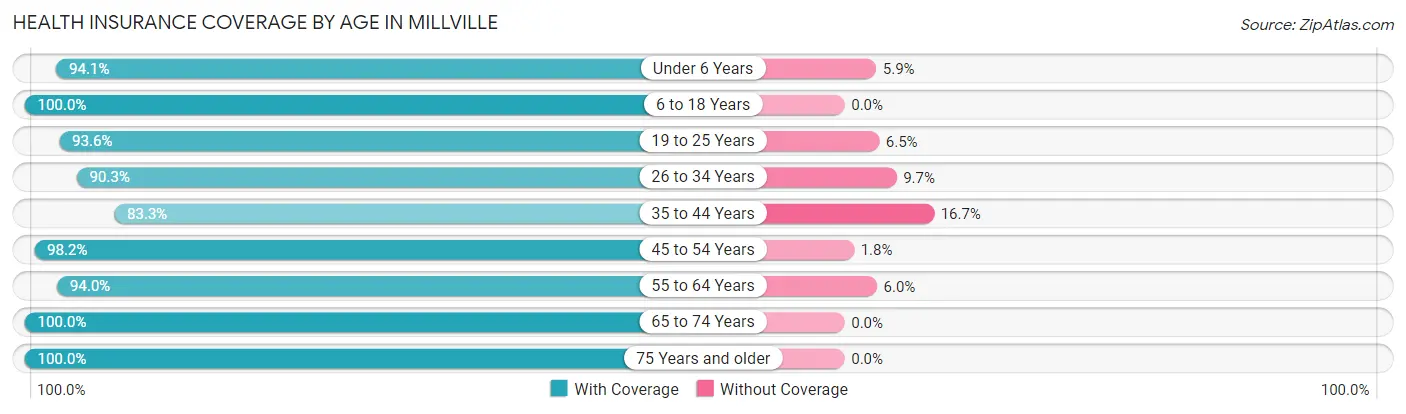
| Age Bracket | With Coverage | Without Coverage |
| Under 6 Years | 16 (94.1%) | 1 (5.9%) |
| 6 to 18 Years | 143 (100.0%) | 0 (0.0%) |
| 19 to 25 Years | 29 (93.5%) | 2 (6.5%) |
| 26 to 34 Years | 28 (90.3%) | 3 (9.7%) |
| 35 to 44 Years | 70 (83.3%) | 14 (16.7%) |
| 45 to 54 Years | 167 (98.2%) | 3 (1.8%) |
| 55 to 64 Years | 109 (94.0%) | 7 (6.0%) |
| 65 to 74 Years | 114 (100.0%) | 0 (0.0%) |
| 75 Years and older | 88 (100.0%) | 0 (0.0%) |
| Total | 764 (96.2%) | 30 (3.8%) |
Health Insurance Coverage by Citizenship Status in Millville
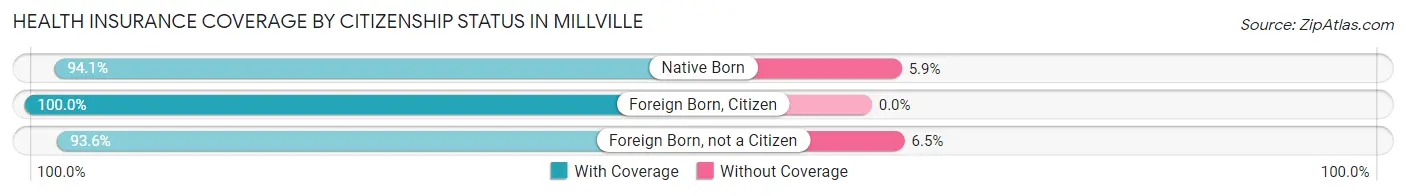
| Citizenship Status | With Coverage | Without Coverage |
| Native Born | 16 (94.1%) | 1 (5.9%) |
| Foreign Born, Citizen | 143 (100.0%) | 0 (0.0%) |
| Foreign Born, not a Citizen | 29 (93.5%) | 2 (6.5%) |
Health Insurance Coverage by Household Income in Millville
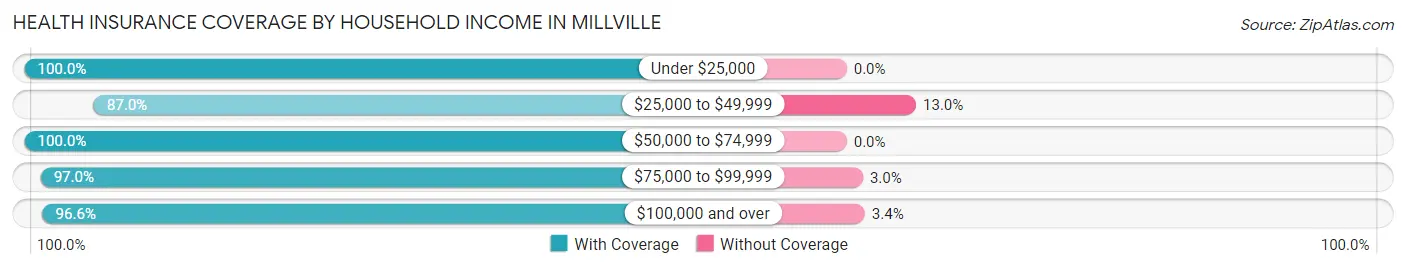
| Household Income | With Coverage | Without Coverage |
| Under $25,000 | 43 (100.0%) | 0 (0.0%) |
| $25,000 to $49,999 | 67 (87.0%) | 10 (13.0%) |
| $50,000 to $74,999 | 77 (100.0%) | 0 (0.0%) |
| $75,000 to $99,999 | 64 (97.0%) | 2 (3.0%) |
| $100,000 and over | 513 (96.6%) | 18 (3.4%) |
Public vs Private Health Insurance Coverage by Age in Millville
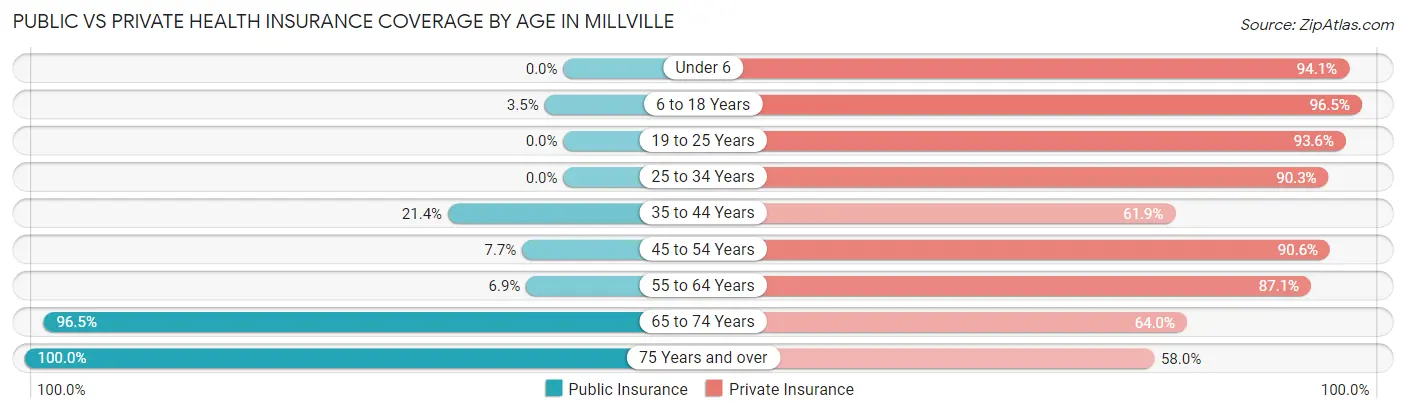
| Age Bracket | Public Insurance | Private Insurance |
| Under 6 | 0 (0.0%) | 16 (94.1%) |
| 6 to 18 Years | 5 (3.5%) | 138 (96.5%) |
| 19 to 25 Years | 0 (0.0%) | 29 (93.5%) |
| 25 to 34 Years | 0 (0.0%) | 28 (90.3%) |
| 35 to 44 Years | 18 (21.4%) | 52 (61.9%) |
| 45 to 54 Years | 13 (7.6%) | 154 (90.6%) |
| 55 to 64 Years | 8 (6.9%) | 101 (87.1%) |
| 65 to 74 Years | 110 (96.5%) | 73 (64.0%) |
| 75 Years and over | 88 (100.0%) | 51 (58.0%) |
| Total | 242 (30.5%) | 642 (80.9%) |
Disability Status by Sex by Age in Millville
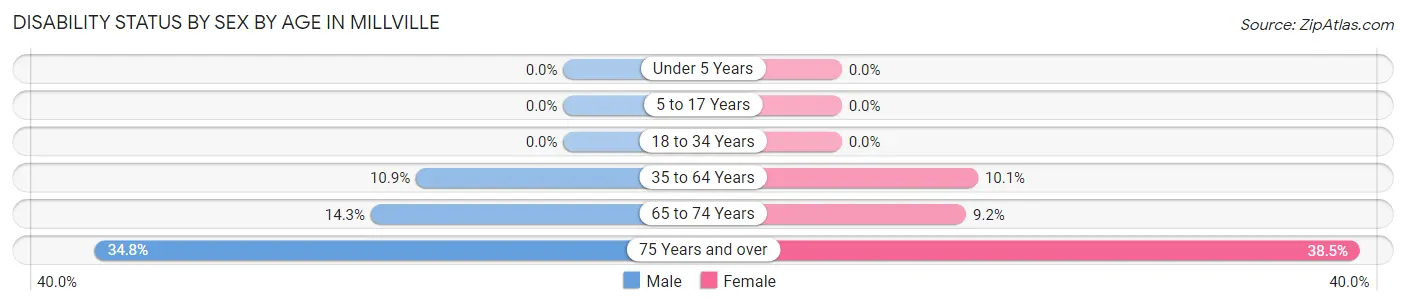
| Age Bracket | Male | Female |
| Under 5 Years | 0 (0.0%) | 0 (0.0%) |
| 5 to 17 Years | 0 (0.0%) | 0 (0.0%) |
| 18 to 34 Years | 0 (0.0%) | 0 (0.0%) |
| 35 to 64 Years | 21 (10.9%) | 18 (10.1%) |
| 65 to 74 Years | 7 (14.3%) | 6 (9.2%) |
| 75 Years and over | 8 (34.8%) | 25 (38.5%) |
Disability Class by Sex by Age in Millville
Disability Class: Hearing Difficulty
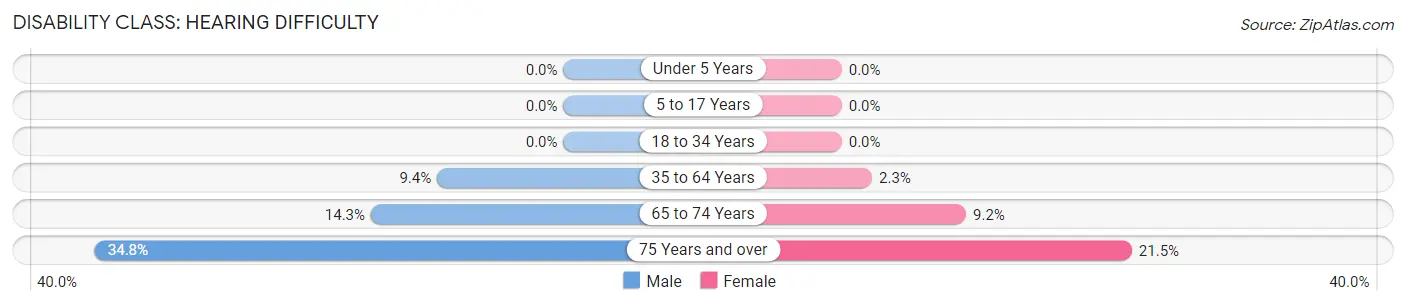
| Age Bracket | Male | Female |
| Under 5 Years | 0 (0.0%) | 0 (0.0%) |
| 5 to 17 Years | 0 (0.0%) | 0 (0.0%) |
| 18 to 34 Years | 0 (0.0%) | 0 (0.0%) |
| 35 to 64 Years | 18 (9.4%) | 4 (2.2%) |
| 65 to 74 Years | 7 (14.3%) | 6 (9.2%) |
| 75 Years and over | 8 (34.8%) | 14 (21.5%) |
Disability Class: Vision Difficulty
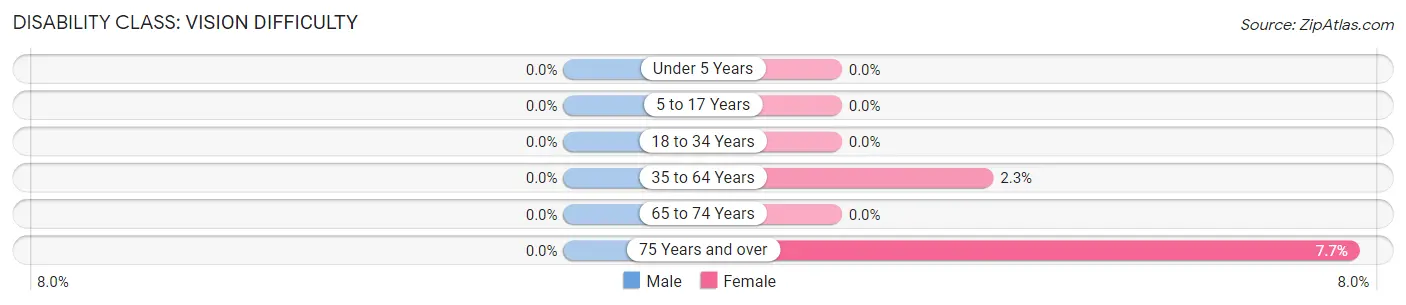
| Age Bracket | Male | Female |
| Under 5 Years | 0 (0.0%) | 0 (0.0%) |
| 5 to 17 Years | 0 (0.0%) | 0 (0.0%) |
| 18 to 34 Years | 0 (0.0%) | 0 (0.0%) |
| 35 to 64 Years | 0 (0.0%) | 4 (2.2%) |
| 65 to 74 Years | 0 (0.0%) | 0 (0.0%) |
| 75 Years and over | 0 (0.0%) | 5 (7.7%) |
Disability Class: Cognitive Difficulty
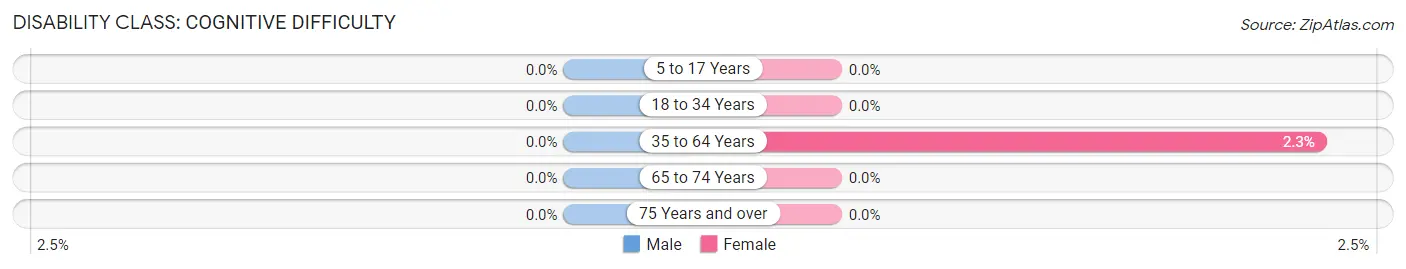
| Age Bracket | Male | Female |
| 5 to 17 Years | 0 (0.0%) | 0 (0.0%) |
| 18 to 34 Years | 0 (0.0%) | 0 (0.0%) |
| 35 to 64 Years | 0 (0.0%) | 4 (2.2%) |
| 65 to 74 Years | 0 (0.0%) | 0 (0.0%) |
| 75 Years and over | 0 (0.0%) | 0 (0.0%) |
Disability Class: Ambulatory Difficulty
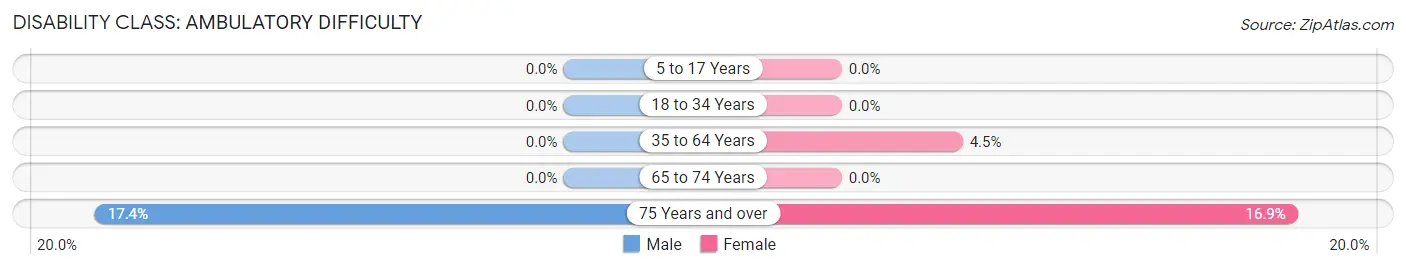
| Age Bracket | Male | Female |
| 5 to 17 Years | 0 (0.0%) | 0 (0.0%) |
| 18 to 34 Years | 0 (0.0%) | 0 (0.0%) |
| 35 to 64 Years | 0 (0.0%) | 8 (4.5%) |
| 65 to 74 Years | 0 (0.0%) | 0 (0.0%) |
| 75 Years and over | 4 (17.4%) | 11 (16.9%) |
Disability Class: Self-Care Difficulty
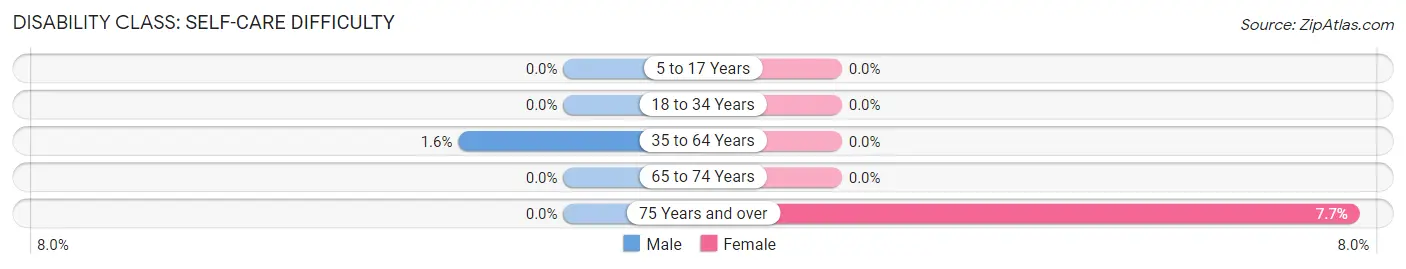
| Age Bracket | Male | Female |
| 5 to 17 Years | 0 (0.0%) | 0 (0.0%) |
| 18 to 34 Years | 0 (0.0%) | 0 (0.0%) |
| 35 to 64 Years | 3 (1.6%) | 0 (0.0%) |
| 65 to 74 Years | 0 (0.0%) | 0 (0.0%) |
| 75 Years and over | 0 (0.0%) | 5 (7.7%) |
Technology Access in Millville
Computing Device Access in Millville
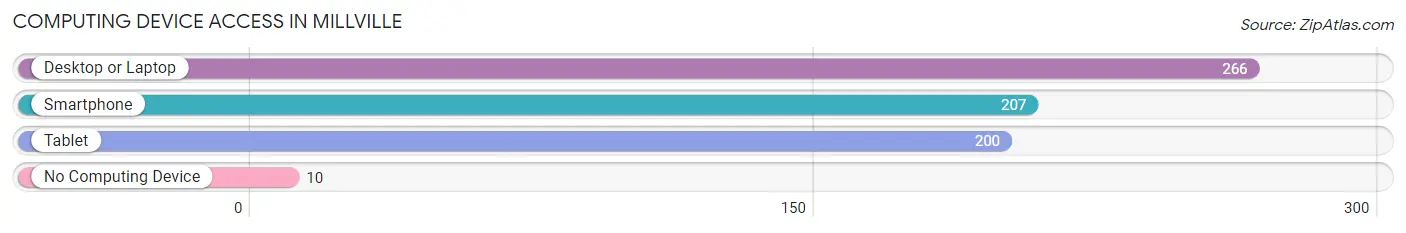
| Device Type | # Households | % Households |
| Desktop or Laptop | 266 | 85.8% |
| Smartphone | 207 | 66.8% |
| Tablet | 200 | 64.5% |
| No Computing Device | 10 | 3.2% |
| Total | 310 | 100.0% |
Internet Access in Millville
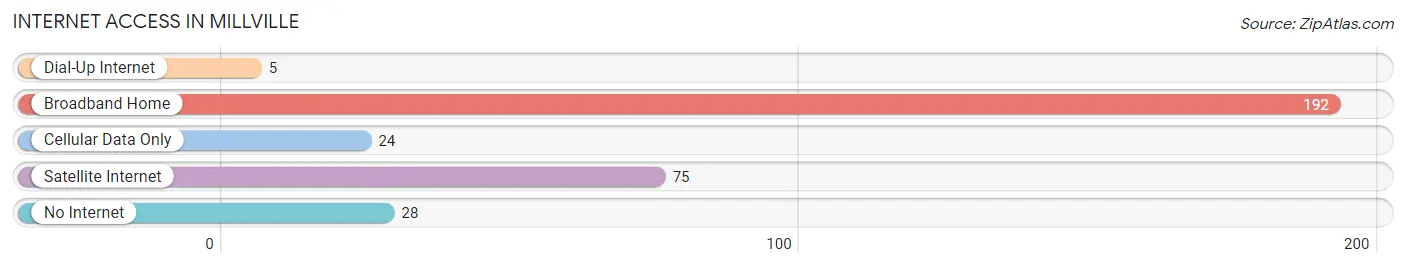
| Internet Type | # Households | % Households |
| Dial-Up Internet | 5 | 1.6% |
| Broadband Home | 192 | 61.9% |
| Cellular Data Only | 24 | 7.7% |
| Satellite Internet | 75 | 24.2% |
| No Internet | 28 | 9.0% |
| Total | 310 | 100.0% |
Millville Summary
Millville is a small unincorporated community located in Shasta County, California. It is situated in the northern part of the state, about 20 miles east of Redding. The population of Millville was estimated to be around 1,000 people in 2020.
History
Millville was first settled in the late 1800s by miners and loggers who were attracted to the area by the abundance of timber and gold. The town was originally called “Milltown”, but the name was changed to Millville in 1891. The town was incorporated in 1895 and was the first incorporated town in Shasta County.
The town was a major hub for the lumber industry in the early 1900s. The lumber industry provided jobs for many of the town’s residents and helped to fuel the local economy. The town also had a thriving agricultural industry, with many of the town’s residents working in the fields and orchards.
In the 1950s, the town began to decline as the lumber industry moved away and the agricultural industry began to decline. The town’s population decreased and many of the businesses closed. In the late 1970s, the town began to experience a resurgence as people began to move back to the area and new businesses opened.
Geography
Millville is located in the northern part of Shasta County, about 20 miles east of Redding. The town is situated in the foothills of the Cascade Mountains and is surrounded by rolling hills and forests. The town is located at an elevation of 1,400 feet and has a mild climate with hot summers and cold winters.
The town is located near several recreational areas, including Whiskeytown National Recreation Area, Lassen Volcanic National Park, and Shasta Lake. The town is also close to several rivers, including the Sacramento River, the McCloud River, and the Pit River.
Economy
Millville’s economy is largely based on tourism and agriculture. The town is home to several wineries and vineyards, as well as a number of small businesses. The town is also home to several restaurants, cafes, and bars.
The town is also home to several manufacturing companies, including a paper mill and a wood products plant. The town is also home to a number of small farms and ranches.
Demographics
As of 2020, the population of Millville was estimated to be around 1,000 people. The town is predominantly white, with about 90% of the population being white. The town also has a small Hispanic population, with about 5% of the population being Hispanic. The town also has a small African American population, with about 2% of the population being African American.
The median household income in Millville is around $50,000, which is slightly lower than the national average. The town also has a higher than average poverty rate, with about 20% of the population living below the poverty line.
Conclusion
Millville is a small unincorporated community located in Shasta County, California. It is situated in the northern part of the state, about 20 miles east of Redding. The town has a population of around 1,000 people and is predominantly white. The town’s economy is largely based on tourism and agriculture, with several wineries, vineyards, restaurants, cafes, and bars. The town also has a number of small businesses and manufacturing companies. The median household income in Millville is around $50,000, which is slightly lower than the national average. The town also has a higher than average poverty rate, with about 20% of the population living below the poverty line.
Common Questions
What is Per Capita Income in Millville?
Per Capita income in Millville is $54,190.
What is the Median Family Income in Millville?
Median Family Income in Millville is $152,955.
What is the Median Household income in Millville?
Median Household Income in Millville is $112,500.
What is Income or Wage Gap in Millville?
Income or Wage Gap in Millville is 15.1%.
Women in Millville earn 84.9 cents for every dollar earned by a man.
What is Inequality or Gini Index in Millville?
Inequality or Gini Index in Millville is 0.40.
What is the Total Population of Millville?
Total Population of Millville is 794.
What is the Total Male Population of Millville?
Total Male Population of Millville is 422.
What is the Total Female Population of Millville?
Total Female Population of Millville is 372.
What is the Ratio of Males per 100 Females in Millville?
There are 113.44 Males per 100 Females in Millville.
What is the Ratio of Females per 100 Males in Millville?
There are 88.15 Females per 100 Males in Millville.
What is the Median Population Age in Millville?
Median Population Age in Millville is 46.5 Years.
What is the Average Family Size in Millville
Average Family Size in Millville is 3.2 People.
What is the Average Household Size in Millville
Average Household Size in Millville is 2.6 People.
How Large is the Labor Force in Millville?
There are 446 People in the Labor Forcein in Millville.
What is the Percentage of People in the Labor Force in Millville?
60.9% of People are in the Labor Force in Millville.
What is the Unemployment Rate in Millville?
Unemployment Rate in Millville is 5.4%.