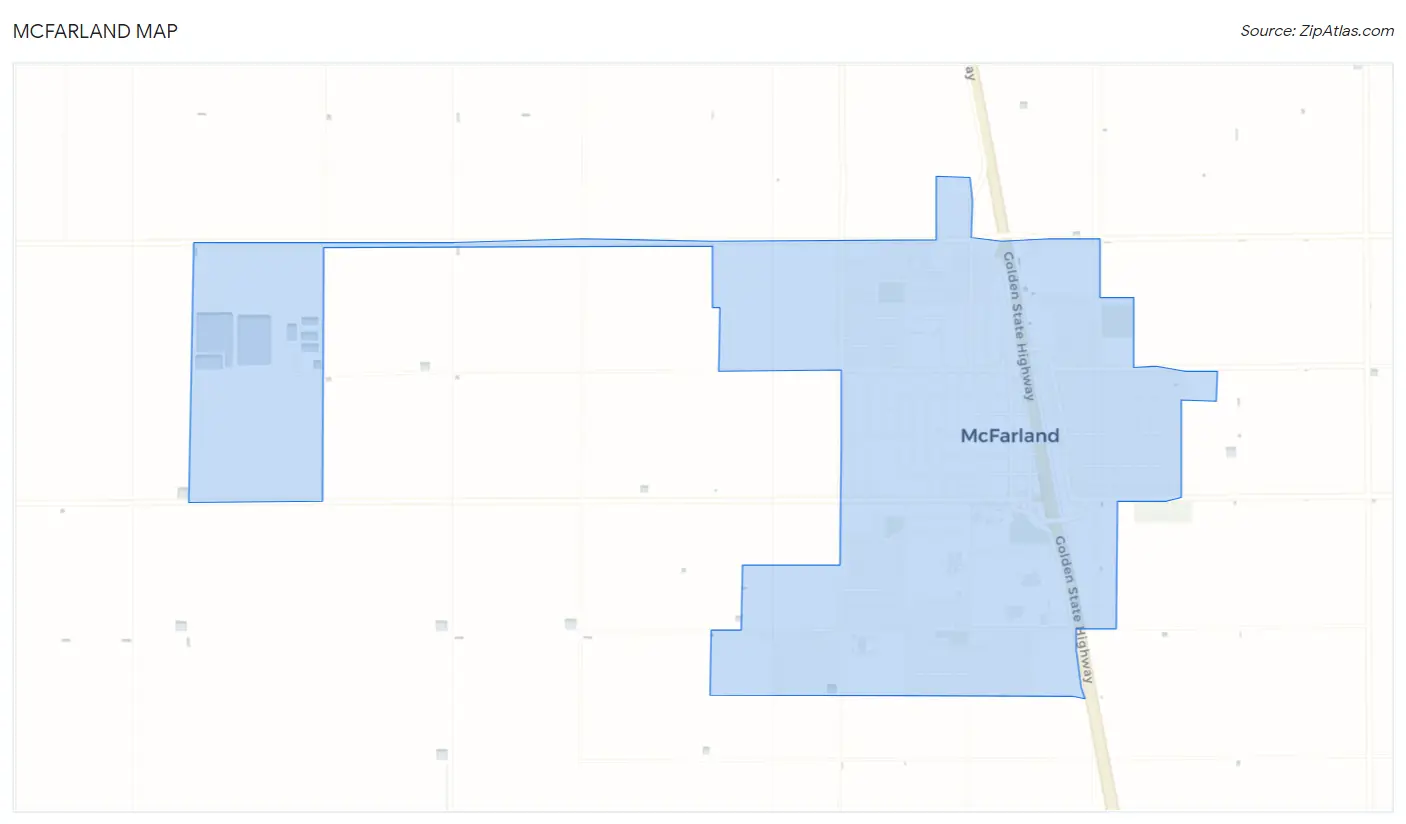
McFarland, CA Map & Demographics
McFarland Map
McFarland Overview
$14,419
PER CAPITA INCOME
$44,101
AVG FAMILY INCOME
$42,641
AVG HOUSEHOLD INCOME
26.0%
WAGE / INCOME GAP [ % ]
74.0¢/ $1
WAGE / INCOME GAP [ $ ]
$10,928
FAMILY INCOME DEFICIT
0.40
INEQUALITY / GINI INDEX
13,971
TOTAL POPULATION
7,149
MALE POPULATION
6,822
FEMALE POPULATION
104.79
MALES / 100 FEMALES
95.43
FEMALES / 100 MALES
25.4
MEDIAN AGE
4.4
AVG FAMILY SIZE
4.0
AVG HOUSEHOLD SIZE
5,502
LABOR FORCE [ PEOPLE ]
57.1%
PERCENT IN LABOR FORCE
6.4%
UNEMPLOYMENT RATE
Income in McFarland
Income Overview in McFarland
Per Capita Income in McFarland is $14,419, while median incomes of families and households are $44,101 and $42,641 respectively.
| Characteristic | Number | Measure |
| Per Capita Income | 13,971 | $14,419 |
| Median Family Income | 2,818 | $44,101 |
| Mean Family Income | 2,818 | $59,883 |
| Median Household Income | 3,323 | $42,641 |
| Mean Household Income | 3,323 | $57,155 |
| Income Deficit | 2,818 | $10,928 |
| Wage / Income Gap (%) | 13,971 | 25.98% |
| Wage / Income Gap ($) | 13,971 | 74.02¢ per $1 |
| Gini / Inequality Index | 13,971 | 0.40 |
Earnings by Sex in McFarland
Average Earnings in McFarland are $24,076, $27,907 for men and $20,656 for women, a difference of 26.0%.
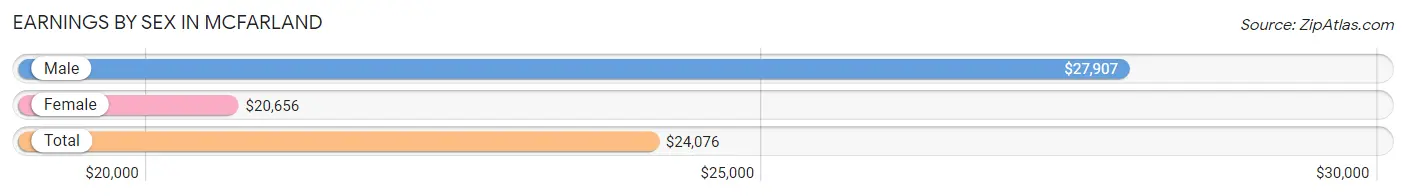
| Sex | Number | Average Earnings |
| Male | 3,158 (53.2%) | $27,907 |
| Female | 2,776 (46.8%) | $20,656 |
| Total | 5,934 (100.0%) | $24,076 |
Earnings by Sex by Income Bracket in McFarland
The most common earnings brackets in McFarland are $25,000 to $29,999 for men (399 | 12.6%) and $25,000 to $29,999 for women (432 | 15.6%).
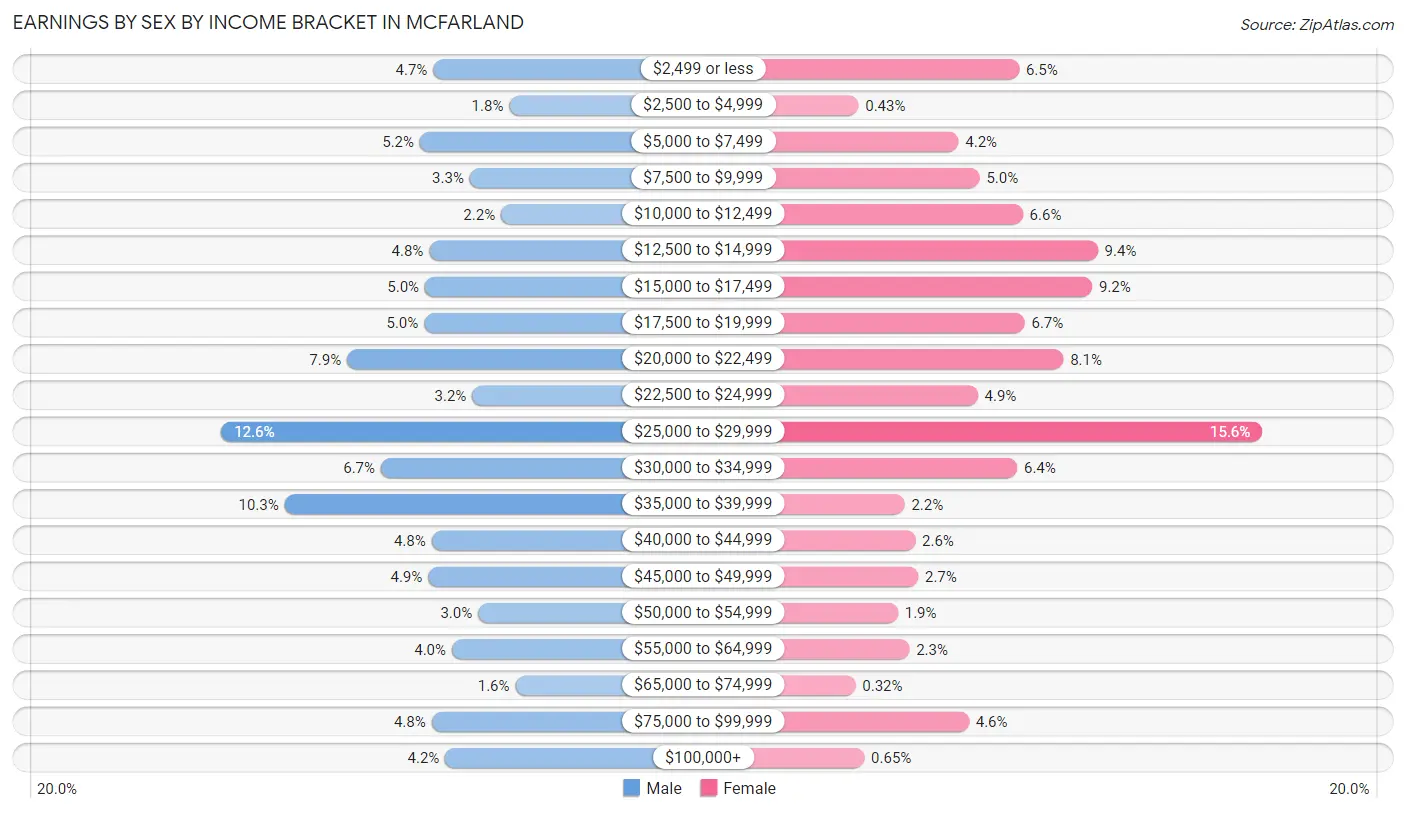
| Income | Male | Female |
| $2,499 or less | 148 (4.7%) | 179 (6.5%) |
| $2,500 to $4,999 | 58 (1.8%) | 12 (0.4%) |
| $5,000 to $7,499 | 164 (5.2%) | 116 (4.2%) |
| $7,500 to $9,999 | 105 (3.3%) | 138 (5.0%) |
| $10,000 to $12,499 | 68 (2.1%) | 183 (6.6%) |
| $12,500 to $14,999 | 153 (4.8%) | 261 (9.4%) |
| $15,000 to $17,499 | 158 (5.0%) | 255 (9.2%) |
| $17,500 to $19,999 | 159 (5.0%) | 185 (6.7%) |
| $20,000 to $22,499 | 250 (7.9%) | 225 (8.1%) |
| $22,500 to $24,999 | 102 (3.2%) | 136 (4.9%) |
| $25,000 to $29,999 | 399 (12.6%) | 432 (15.6%) |
| $30,000 to $34,999 | 210 (6.7%) | 177 (6.4%) |
| $35,000 to $39,999 | 324 (10.3%) | 60 (2.2%) |
| $40,000 to $44,999 | 150 (4.8%) | 71 (2.6%) |
| $45,000 to $49,999 | 154 (4.9%) | 74 (2.7%) |
| $50,000 to $54,999 | 95 (3.0%) | 53 (1.9%) |
| $55,000 to $64,999 | 126 (4.0%) | 65 (2.3%) |
| $65,000 to $74,999 | 51 (1.6%) | 9 (0.3%) |
| $75,000 to $99,999 | 150 (4.8%) | 127 (4.6%) |
| $100,000+ | 134 (4.2%) | 18 (0.6%) |
| Total | 3,158 (100.0%) | 2,776 (100.0%) |
Earnings by Sex by Educational Attainment in McFarland
Average earnings in McFarland are $29,788 for men and $22,528 for women, a difference of 24.4%. Men with an educational attainment of bachelor's degree enjoy the highest average annual earnings of $46,071, while those with high school diploma education earn the least with $24,422. Women with an educational attainment of college or associate's degree earn the most with the average annual earnings of $30,893, while those with less than high school education have the smallest earnings of $17,860.
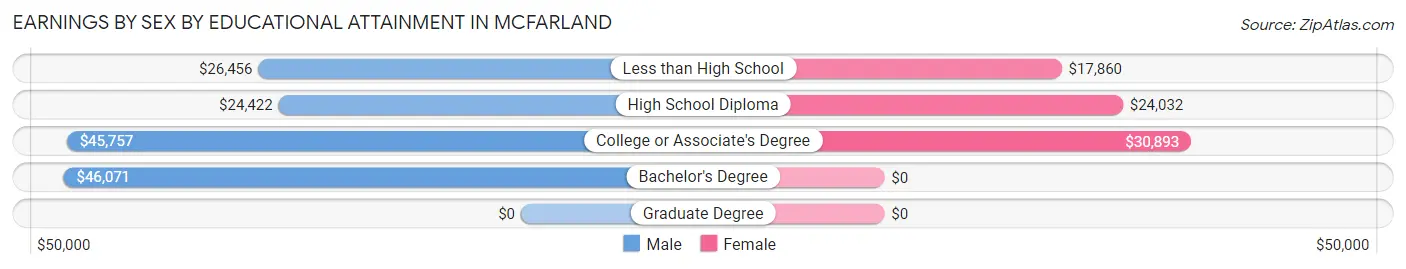
| Educational Attainment | Male Income | Female Income |
| Less than High School | $26,456 | $17,860 |
| High School Diploma | $24,422 | $24,032 |
| College or Associate's Degree | $45,757 | $30,893 |
| Bachelor's Degree | $46,071 | $0 |
| Graduate Degree | - | - |
| Total | $29,788 | $22,528 |
Family Income in McFarland
Family Income Brackets in McFarland
According to the McFarland family income data, there are 637 families falling into the $35,000 to $49,999 income range, which is the most common income bracket and makes up 22.6% of all families. Conversely, the $200,000+ income bracket is the least frequent group with only 59 families (2.1%) belonging to this category.
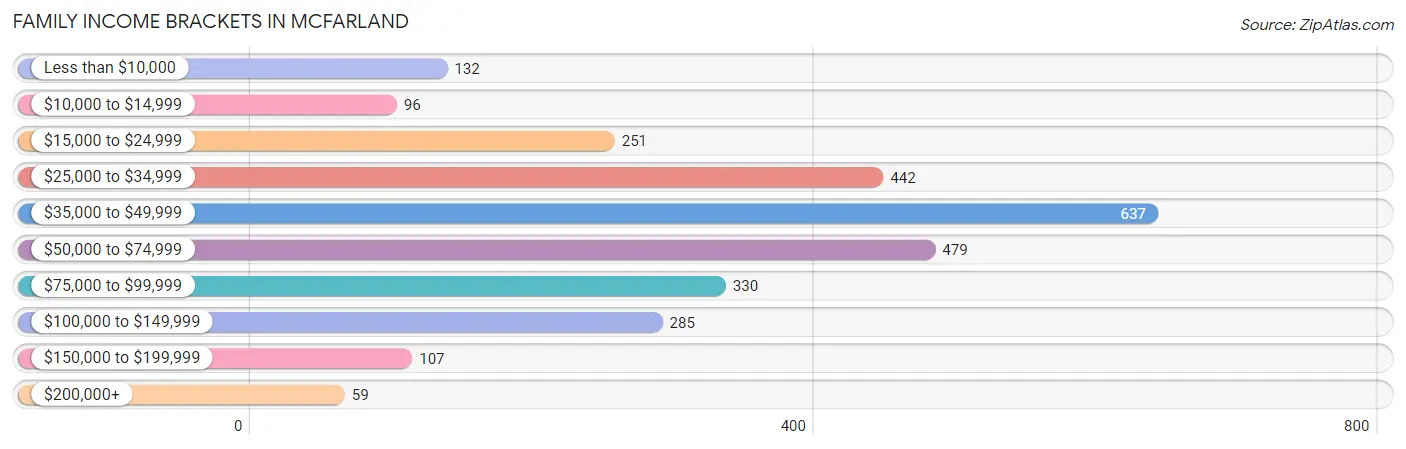
| Income Bracket | # Families | % Families |
| Less than $10,000 | 132 | 4.7% |
| $10,000 to $14,999 | 96 | 3.4% |
| $15,000 to $24,999 | 251 | 8.9% |
| $25,000 to $34,999 | 442 | 15.7% |
| $35,000 to $49,999 | 637 | 22.6% |
| $50,000 to $74,999 | 479 | 17.0% |
| $75,000 to $99,999 | 330 | 11.7% |
| $100,000 to $149,999 | 285 | 10.1% |
| $150,000 to $199,999 | 107 | 3.8% |
| $200,000+ | 59 | 2.1% |
Family Income by Famaliy Size in McFarland
4-person families (886 | 31.4%) account for the highest median family income in McFarland with $62,629 per family, while 2-person families (470 | 16.7%) have the highest median income of $20,054 per family member.
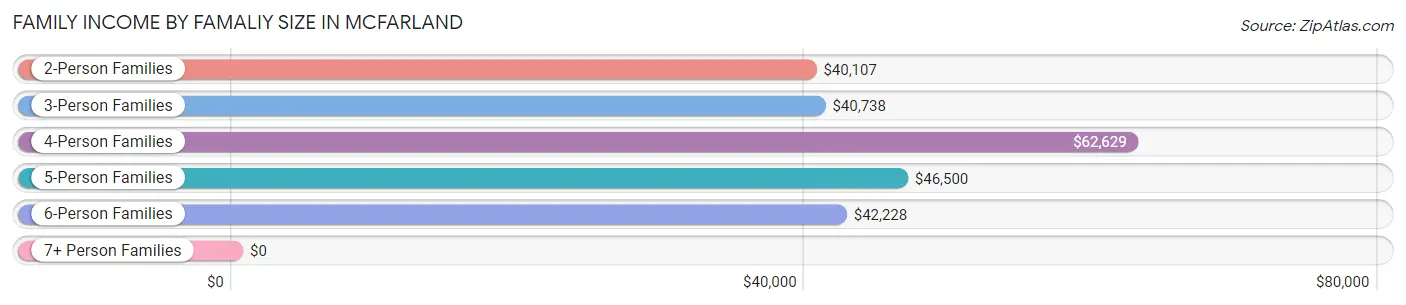
| Income Bracket | # Families | Median Income |
| 2-Person Families | 470 (16.7%) | $40,107 |
| 3-Person Families | 472 (16.8%) | $40,738 |
| 4-Person Families | 886 (31.4%) | $62,629 |
| 5-Person Families | 622 (22.1%) | $46,500 |
| 6-Person Families | 189 (6.7%) | $42,228 |
| 7+ Person Families | 179 (6.4%) | $0 |
| Total | 2,818 (100.0%) | $44,101 |
Family Income by Number of Earners in McFarland
The median family income in McFarland is $44,101, with families comprising 3+ earners (539) having the highest median family income of $81,688, while families with no earners (262) have the lowest median family income of $18,690, accounting for 19.1% and 9.3% of families, respectively.
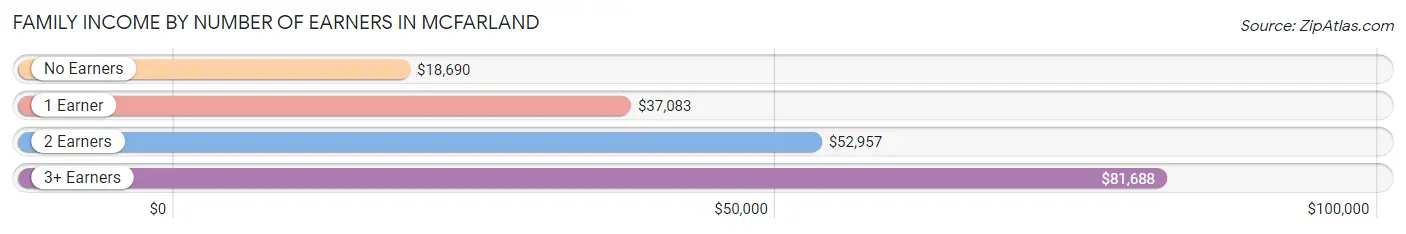
| Number of Earners | # Families | Median Income |
| No Earners | 262 (9.3%) | $18,690 |
| 1 Earner | 878 (31.2%) | $37,083 |
| 2 Earners | 1,139 (40.4%) | $52,957 |
| 3+ Earners | 539 (19.1%) | $81,688 |
| Total | 2,818 (100.0%) | $44,101 |
Household Income in McFarland
Household Income Brackets in McFarland
With 628 households falling in the category, the $35,000 to $49,999 income range is the most frequent in McFarland, accounting for 18.9% of all households. In contrast, only 60 households (1.8%) fall into the $200,000+ income bracket, making it the least populous group.
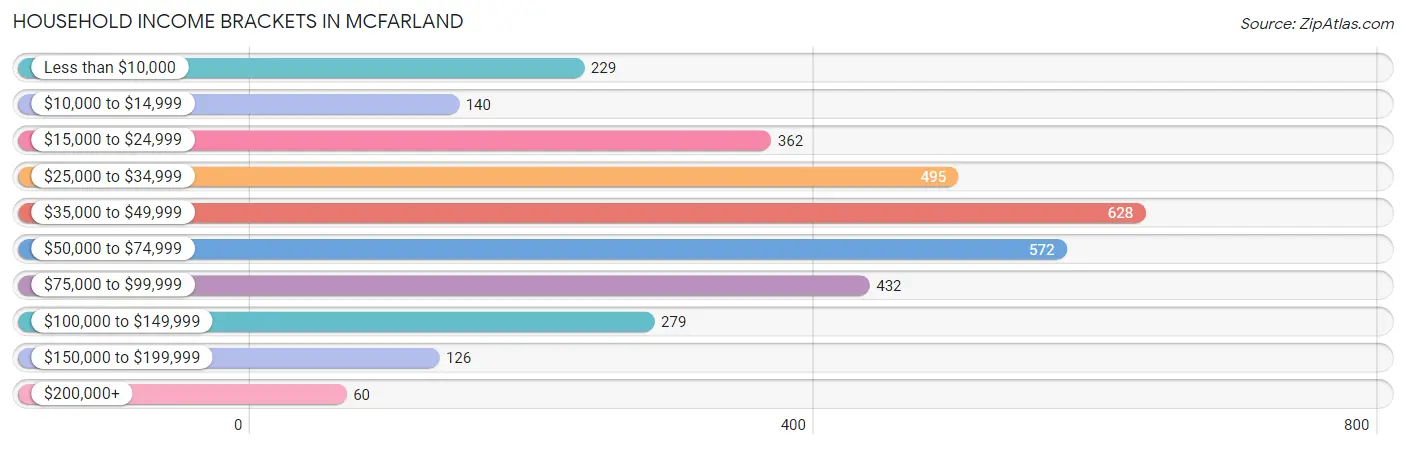
| Income Bracket | # Households | % Households |
| Less than $10,000 | 229 | 6.9% |
| $10,000 to $14,999 | 140 | 4.2% |
| $15,000 to $24,999 | 362 | 10.9% |
| $25,000 to $34,999 | 495 | 14.9% |
| $35,000 to $49,999 | 628 | 18.9% |
| $50,000 to $74,999 | 572 | 17.2% |
| $75,000 to $99,999 | 432 | 13.0% |
| $100,000 to $149,999 | 279 | 8.4% |
| $150,000 to $199,999 | 126 | 3.8% |
| $200,000+ | 60 | 1.8% |
Household Income by Householder Age in McFarland
The median household income in McFarland is $42,641, with the highest median household income of $52,587 found in the 45 to 64 years age bracket for the primary householder. A total of 1,331 households (40.1%) fall into this category. Meanwhile, the 65+ years age bracket for the primary householder has the lowest median household income of $25,795, with 509 households (15.3%) in this group.
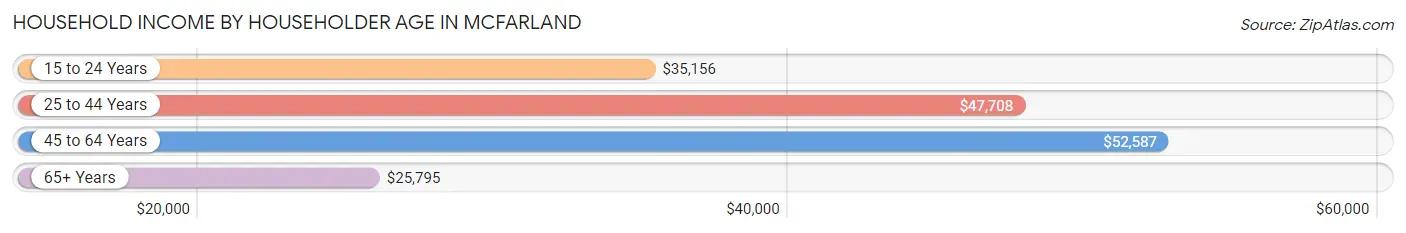
| Income Bracket | # Households | Median Income |
| 15 to 24 Years | 263 (7.9%) | $35,156 |
| 25 to 44 Years | 1,220 (36.7%) | $47,708 |
| 45 to 64 Years | 1,331 (40.1%) | $52,587 |
| 65+ Years | 509 (15.3%) | $25,795 |
| Total | 3,323 (100.0%) | $42,641 |
Poverty in McFarland
Income Below Poverty by Sex and Age in McFarland
With 25.2% poverty level for males and 28.4% for females among the residents of McFarland, 5 year old males and 16 and 17 year old females are the most vulnerable to poverty, with 40 males (88.9%) and 219 females (75.8%) in their respective age groups living below the poverty level.
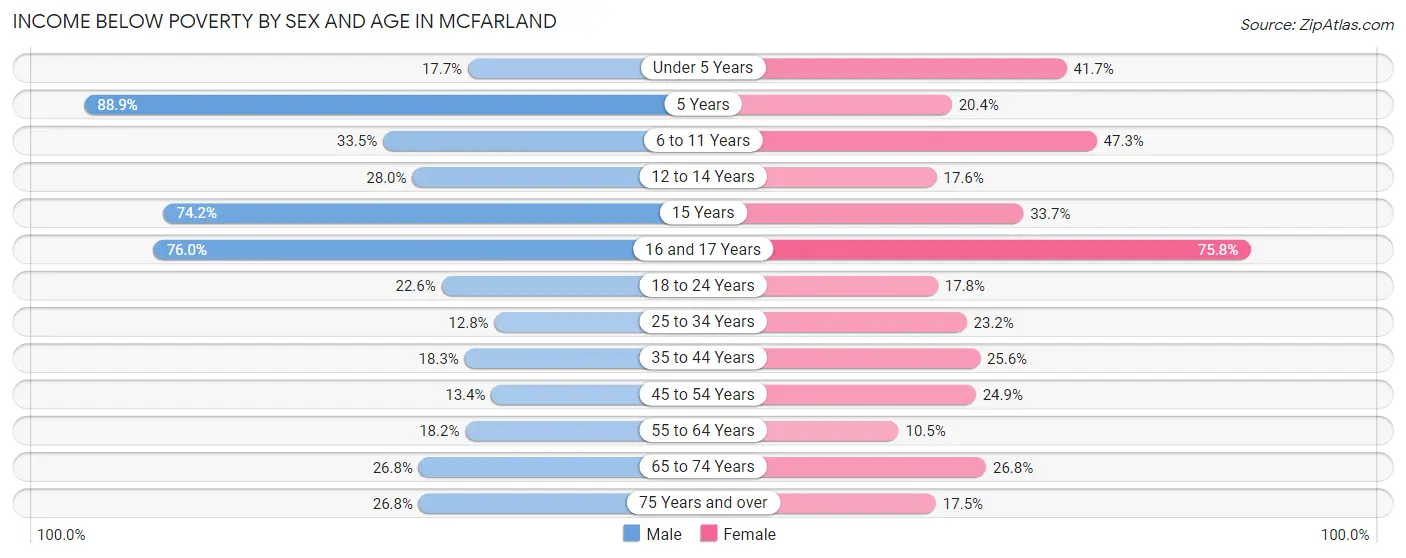
| Age Bracket | Male | Female |
| Under 5 Years | 96 (17.7%) | 189 (41.7%) |
| 5 Years | 40 (88.9%) | 41 (20.4%) |
| 6 to 11 Years | 254 (33.5%) | 431 (47.3%) |
| 12 to 14 Years | 197 (28.0%) | 83 (17.6%) |
| 15 Years | 92 (74.2%) | 32 (33.7%) |
| 16 and 17 Years | 203 (76.0%) | 219 (75.8%) |
| 18 to 24 Years | 239 (22.6%) | 163 (17.8%) |
| 25 to 34 Years | 102 (12.8%) | 184 (23.2%) |
| 35 to 44 Years | 183 (18.3%) | 252 (25.6%) |
| 45 to 54 Years | 67 (13.4%) | 176 (24.9%) |
| 55 to 64 Years | 57 (18.2%) | 57 (10.5%) |
| 65 to 74 Years | 73 (26.8%) | 79 (26.8%) |
| 75 Years and over | 22 (26.8%) | 29 (17.5%) |
| Total | 1,625 (25.2%) | 1,935 (28.4%) |
Income Above Poverty by Sex and Age in McFarland
According to the poverty statistics in McFarland, males aged 25 to 34 years and females aged 55 to 64 years are the age groups that are most secure financially, with 87.2% of males and 89.5% of females in these age groups living above the poverty line.
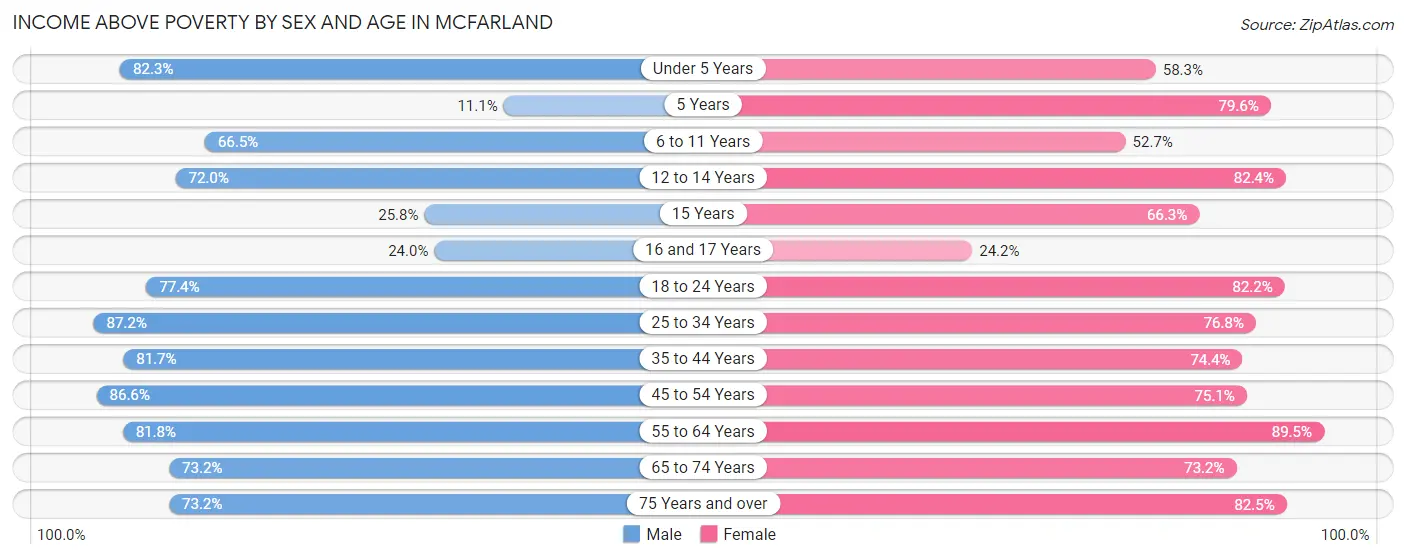
| Age Bracket | Male | Female |
| Under 5 Years | 446 (82.3%) | 264 (58.3%) |
| 5 Years | 5 (11.1%) | 160 (79.6%) |
| 6 to 11 Years | 505 (66.5%) | 480 (52.7%) |
| 12 to 14 Years | 506 (72.0%) | 389 (82.4%) |
| 15 Years | 32 (25.8%) | 63 (66.3%) |
| 16 and 17 Years | 64 (24.0%) | 70 (24.2%) |
| 18 to 24 Years | 818 (77.4%) | 751 (82.2%) |
| 25 to 34 Years | 695 (87.2%) | 610 (76.8%) |
| 35 to 44 Years | 816 (81.7%) | 731 (74.4%) |
| 45 to 54 Years | 434 (86.6%) | 532 (75.1%) |
| 55 to 64 Years | 256 (81.8%) | 484 (89.5%) |
| 65 to 74 Years | 199 (73.2%) | 216 (73.2%) |
| 75 Years and over | 60 (73.2%) | 137 (82.5%) |
| Total | 4,836 (74.9%) | 4,887 (71.6%) |
Income Below Poverty Among Married-Couple Families in McFarland
The poverty statistics for married-couple families in McFarland show that 16.5% or 284 of the total 1,718 families live below the poverty line. Families with 5 or more children have the highest poverty rate of 83.1%, comprising of 49 families. On the other hand, families with no children have the lowest poverty rate of 8.0%, which includes 43 families.
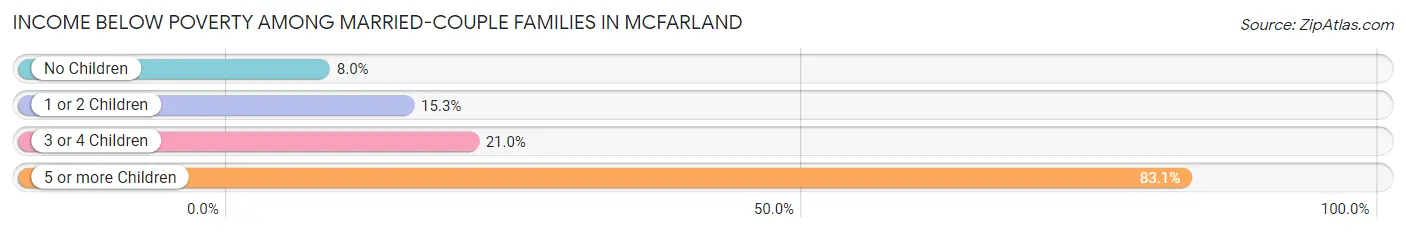
| Children | Above Poverty | Below Poverty |
| No Children | 495 (92.0%) | 43 (8.0%) |
| 1 or 2 Children | 646 (84.7%) | 117 (15.3%) |
| 3 or 4 Children | 283 (79.0%) | 75 (20.9%) |
| 5 or more Children | 10 (17.0%) | 49 (83.1%) |
| Total | 1,434 (83.5%) | 284 (16.5%) |
Income Below Poverty Among Single-Parent Households in McFarland
According to the poverty data in McFarland, 28.1% or 52 single-father households and 36.0% or 329 single-mother households are living below the poverty line. Among single-father households, those with 3 or 4 children have the highest poverty rate, with 28 households (82.4%) experiencing poverty. Likewise, among single-mother households, those with 3 or 4 children have the highest poverty rate, with 132 households (79.5%) falling below the poverty line.
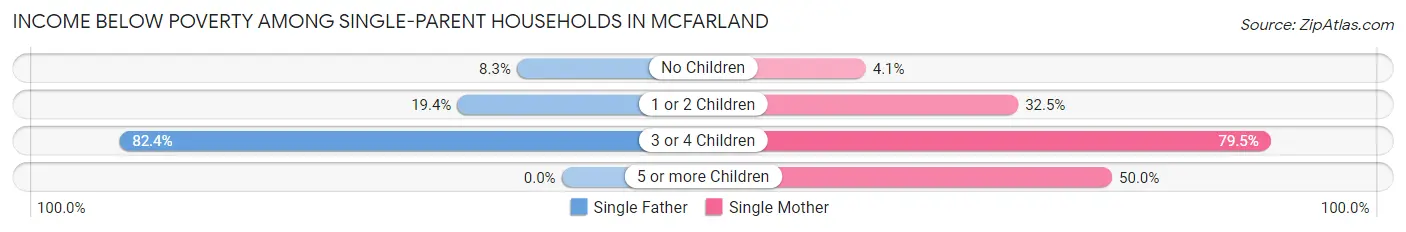
| Children | Single Father | Single Mother |
| No Children | 4 (8.3%) | 7 (4.1%) |
| 1 or 2 Children | 20 (19.4%) | 185 (32.5%) |
| 3 or 4 Children | 28 (82.4%) | 132 (79.5%) |
| 5 or more Children | 0 (0.0%) | 5 (50.0%) |
| Total | 52 (28.1%) | 329 (36.0%) |
Income Below Poverty Among Married-Couple vs Single-Parent Households in McFarland
The poverty data for McFarland shows that 284 of the married-couple family households (16.5%) and 381 of the single-parent households (34.6%) are living below the poverty level. Within the married-couple family households, those with 5 or more children have the highest poverty rate, with 49 households (83.1%) falling below the poverty line. Among the single-parent households, those with 3 or 4 children have the highest poverty rate, with 160 household (80.0%) living below poverty.
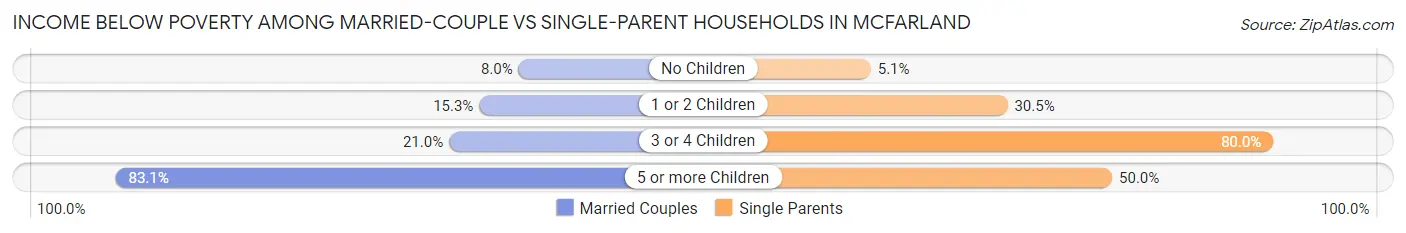
| Children | Married-Couple Families | Single-Parent Households |
| No Children | 43 (8.0%) | 11 (5.1%) |
| 1 or 2 Children | 117 (15.3%) | 205 (30.5%) |
| 3 or 4 Children | 75 (20.9%) | 160 (80.0%) |
| 5 or more Children | 49 (83.1%) | 5 (50.0%) |
| Total | 284 (16.5%) | 381 (34.6%) |
Race in McFarland
The most populous races in McFarland are Hispanic or Latino (12,613 | 90.3%), White / Caucasian (6,448 | 46.2%), and Two or more Races (4,833 | 34.6%).
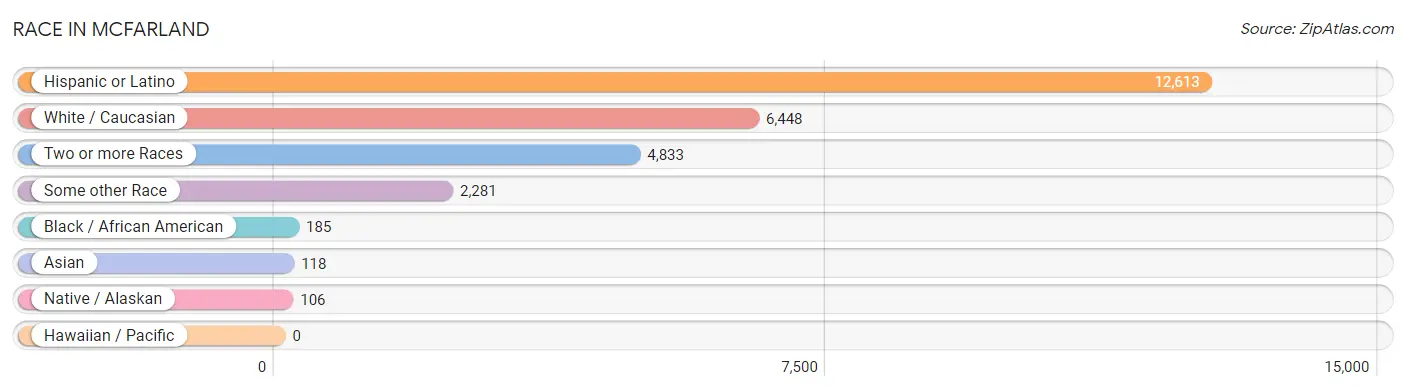
| Race | # Population | % Population |
| Asian | 118 | 0.8% |
| Black / African American | 185 | 1.3% |
| Hawaiian / Pacific | 0 | 0.0% |
| Hispanic or Latino | 12,613 | 90.3% |
| Native / Alaskan | 106 | 0.8% |
| White / Caucasian | 6,448 | 46.2% |
| Two or more Races | 4,833 | 34.6% |
| Some other Race | 2,281 | 16.3% |
| Total | 13,971 | 100.0% |
Ancestry in McFarland
The most populous ancestries reported in McFarland are Mexican (12,157 | 87.0%), American (842 | 6.0%), Korean (159 | 1.1%), Central American (145 | 1.0%), and Irish (92 | 0.7%), together accounting for 95.9% of all McFarland residents.
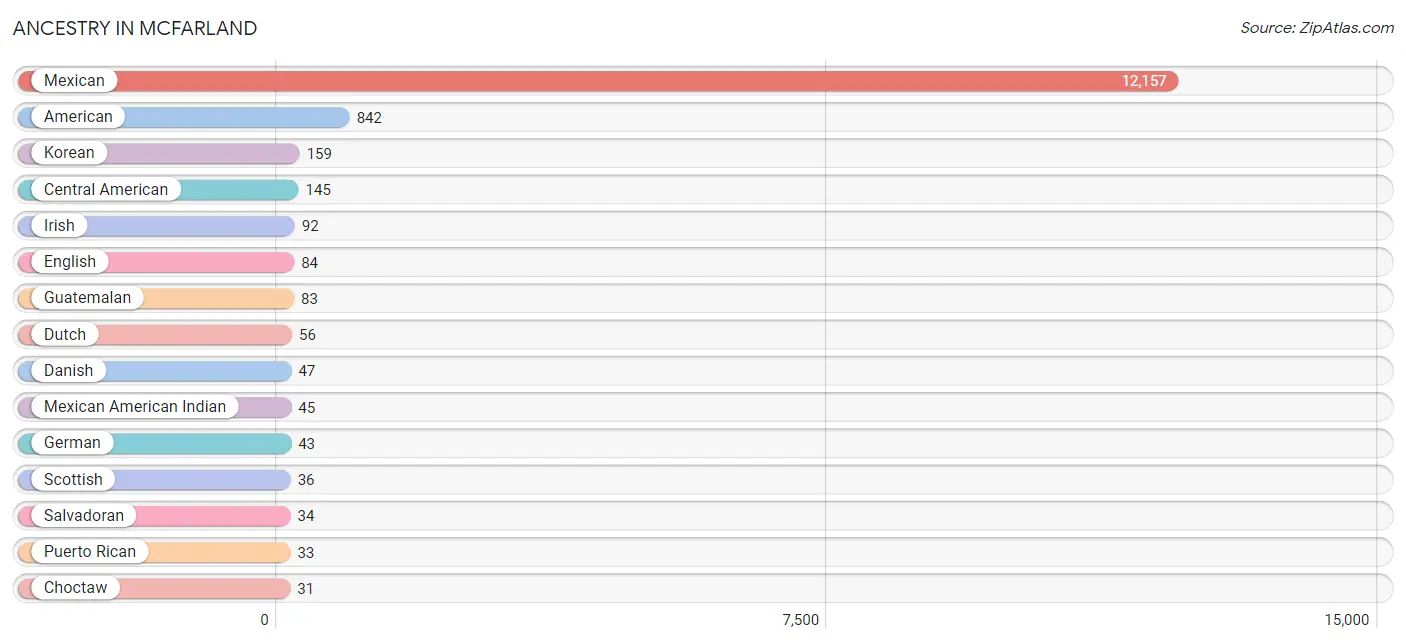
| Ancestry | # Population | % Population |
| American | 842 | 6.0% |
| Apache | 4 | 0.0% |
| Blackfeet | 9 | 0.1% |
| Burmese | 8 | 0.1% |
| Central American | 145 | 1.0% |
| Cherokee | 15 | 0.1% |
| Choctaw | 31 | 0.2% |
| Costa Rican | 8 | 0.1% |
| Cuban | 6 | 0.0% |
| Danish | 47 | 0.3% |
| Dutch | 56 | 0.4% |
| English | 84 | 0.6% |
| European | 7 | 0.1% |
| French | 11 | 0.1% |
| German | 43 | 0.3% |
| Guatemalan | 83 | 0.6% |
| Honduran | 11 | 0.1% |
| Irish | 92 | 0.7% |
| Italian | 10 | 0.1% |
| Jamaican | 8 | 0.1% |
| Japanese | 9 | 0.1% |
| Korean | 159 | 1.1% |
| Mexican | 12,157 | 87.0% |
| Mexican American Indian | 45 | 0.3% |
| Nicaraguan | 9 | 0.1% |
| Puerto Rican | 33 | 0.2% |
| Salvadoran | 34 | 0.2% |
| Scottish | 36 | 0.3% |
| Shoshone | 3 | 0.0% |
| Spaniard | 15 | 0.1% |
| Sri Lankan | 1 | 0.0% | View All 31 Rows |
Immigrants in McFarland
The most numerous immigrant groups reported in McFarland came from Central America (4,079 | 29.2%), Latin America (4,079 | 29.2%), Mexico (3,965 | 28.4%), El Salvador (50 | 0.4%), and Guatemala (45 | 0.3%), together accounting for 87.5% of all McFarland residents.
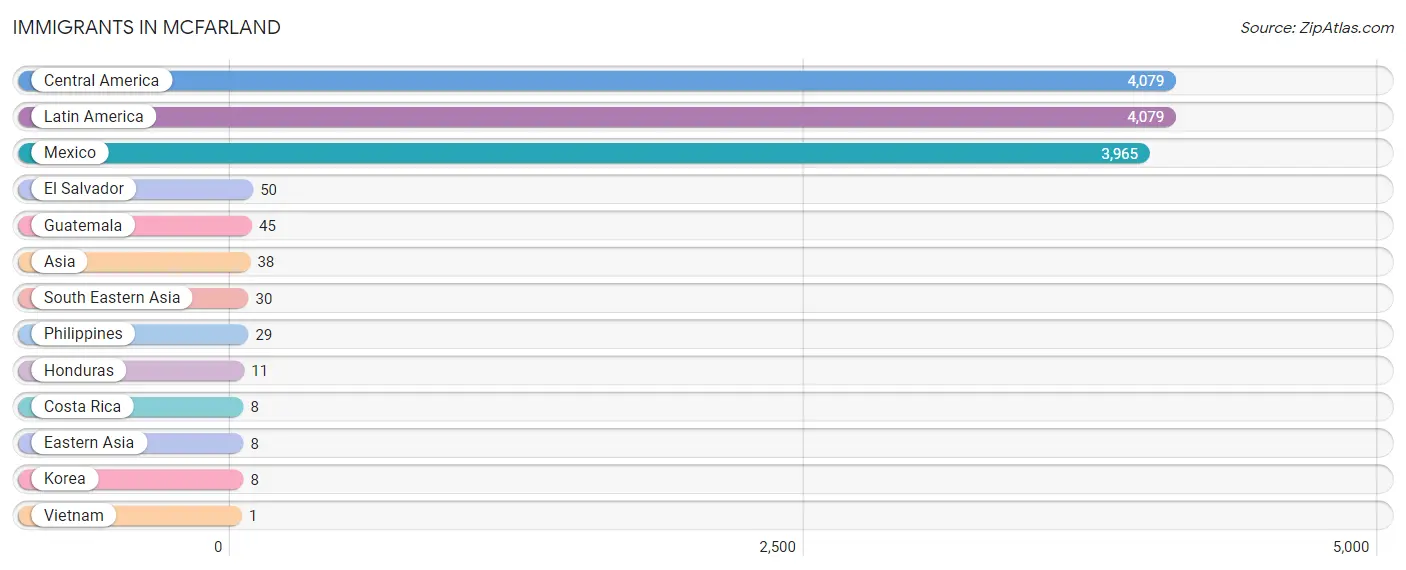
| Immigration Origin | # Population | % Population |
| Asia | 38 | 0.3% |
| Central America | 4,079 | 29.2% |
| Costa Rica | 8 | 0.1% |
| Eastern Asia | 8 | 0.1% |
| El Salvador | 50 | 0.4% |
| Guatemala | 45 | 0.3% |
| Honduras | 11 | 0.1% |
| Korea | 8 | 0.1% |
| Latin America | 4,079 | 29.2% |
| Mexico | 3,965 | 28.4% |
| Philippines | 29 | 0.2% |
| South Eastern Asia | 30 | 0.2% |
| Vietnam | 1 | 0.0% | View All 13 Rows |
Sex and Age in McFarland
Sex and Age in McFarland
The most populous age groups in McFarland are 10 to 14 Years (877 | 12.3%) for men and 10 to 14 Years (890 | 13.1%) for women.
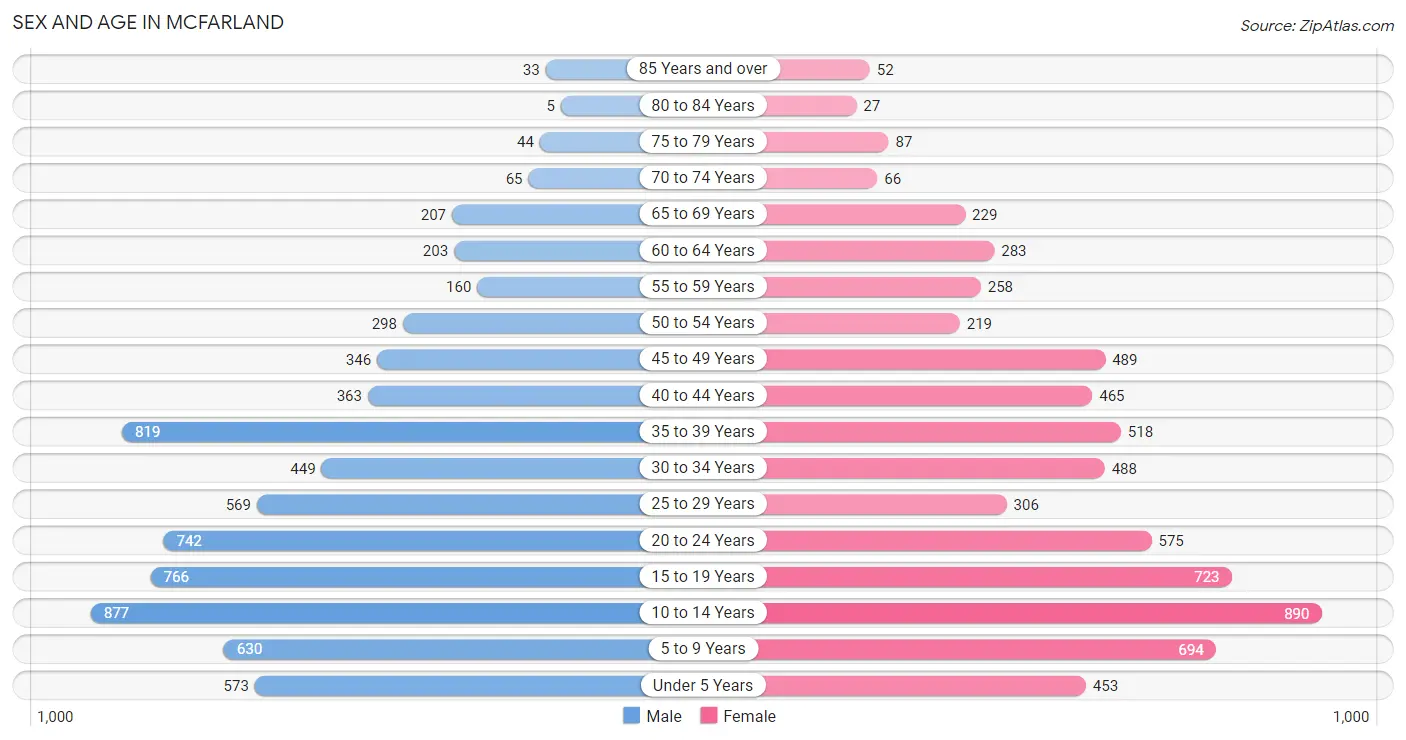
| Age Bracket | Male | Female |
| Under 5 Years | 573 (8.0%) | 453 (6.6%) |
| 5 to 9 Years | 630 (8.8%) | 694 (10.2%) |
| 10 to 14 Years | 877 (12.3%) | 890 (13.1%) |
| 15 to 19 Years | 766 (10.7%) | 723 (10.6%) |
| 20 to 24 Years | 742 (10.4%) | 575 (8.4%) |
| 25 to 29 Years | 569 (8.0%) | 306 (4.5%) |
| 30 to 34 Years | 449 (6.3%) | 488 (7.1%) |
| 35 to 39 Years | 819 (11.5%) | 518 (7.6%) |
| 40 to 44 Years | 363 (5.1%) | 465 (6.8%) |
| 45 to 49 Years | 346 (4.8%) | 489 (7.2%) |
| 50 to 54 Years | 298 (4.2%) | 219 (3.2%) |
| 55 to 59 Years | 160 (2.2%) | 258 (3.8%) |
| 60 to 64 Years | 203 (2.8%) | 283 (4.2%) |
| 65 to 69 Years | 207 (2.9%) | 229 (3.4%) |
| 70 to 74 Years | 65 (0.9%) | 66 (1.0%) |
| 75 to 79 Years | 44 (0.6%) | 87 (1.3%) |
| 80 to 84 Years | 5 (0.1%) | 27 (0.4%) |
| 85 Years and over | 33 (0.5%) | 52 (0.8%) |
| Total | 7,149 (100.0%) | 6,822 (100.0%) |
Families and Households in McFarland
Median Family Size in McFarland
The median family size in McFarland is 4.40 persons per family, with single female/mother families (915 | 32.5%) accounting for the largest median family size of 4.58 persons per family. On the other hand, single male/father families (185 | 6.6%) represent the smallest median family size with 4.17 persons per family.
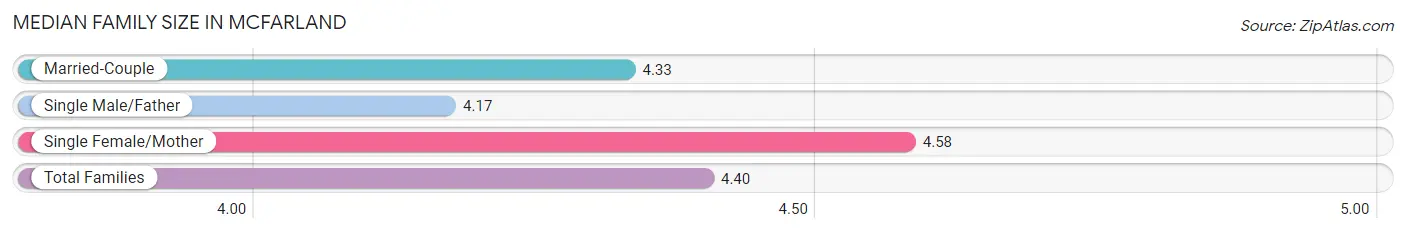
| Family Type | # Families | Family Size |
| Married-Couple | 1,718 (61.0%) | 4.33 |
| Single Male/Father | 185 (6.6%) | 4.17 |
| Single Female/Mother | 915 (32.5%) | 4.58 |
| Total Families | 2,818 (100.0%) | 4.40 |
Median Household Size in McFarland
The median household size in McFarland is 3.99 persons per household, with single female/mother households (915 | 27.5%) accounting for the largest median household size of 4.78 persons per household. non-family households (505 | 15.2%) represent the smallest median household size with 1.06 persons per household.
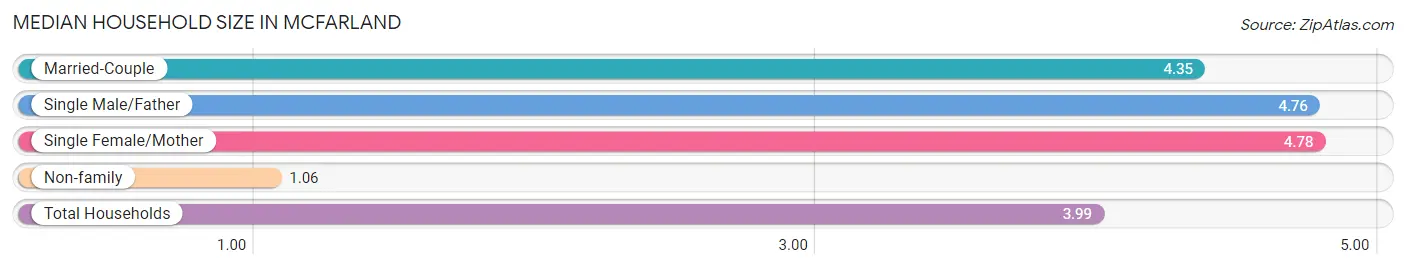
| Household Type | # Households | Household Size |
| Married-Couple | 1,718 (51.7%) | 4.35 |
| Single Male/Father | 185 (5.6%) | 4.76 |
| Single Female/Mother | 915 (27.5%) | 4.78 |
| Non-family | 505 (15.2%) | 1.06 |
| Total Households | 3,323 (100.0%) | 3.99 |
Household Size by Marriage Status in McFarland
Out of a total of 3,323 households in McFarland, 2,818 (84.8%) are family households, while 505 (15.2%) are nonfamily households. The most numerous type of family households are 4-person households, comprising 916, and the most common type of nonfamily households are 1-person households, comprising 471.
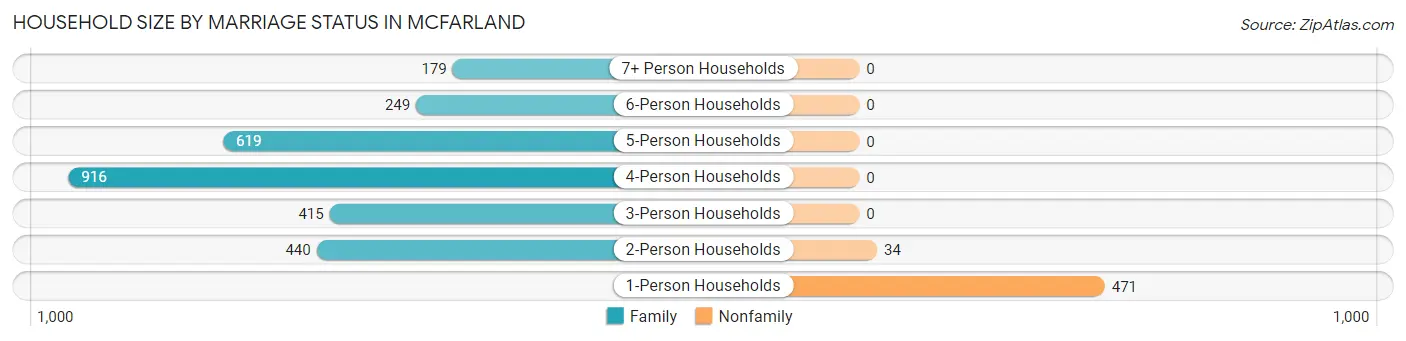
| Household Size | Family Households | Nonfamily Households |
| 1-Person Households | - | 471 (14.2%) |
| 2-Person Households | 440 (13.2%) | 34 (1.0%) |
| 3-Person Households | 415 (12.5%) | 0 (0.0%) |
| 4-Person Households | 916 (27.6%) | 0 (0.0%) |
| 5-Person Households | 619 (18.6%) | 0 (0.0%) |
| 6-Person Households | 249 (7.5%) | 0 (0.0%) |
| 7+ Person Households | 179 (5.4%) | 0 (0.0%) |
| Total | 2,818 (84.8%) | 505 (15.2%) |
Female Fertility in McFarland
Fertility by Age in McFarland
Average fertility rate in McFarland is 64.0 births per 1,000 women. Women in the age bracket of 20 to 34 years have the highest fertility rate with 143.0 births per 1,000 women. Women in the age bracket of 20 to 34 years acount for 84.9% of all women with births.
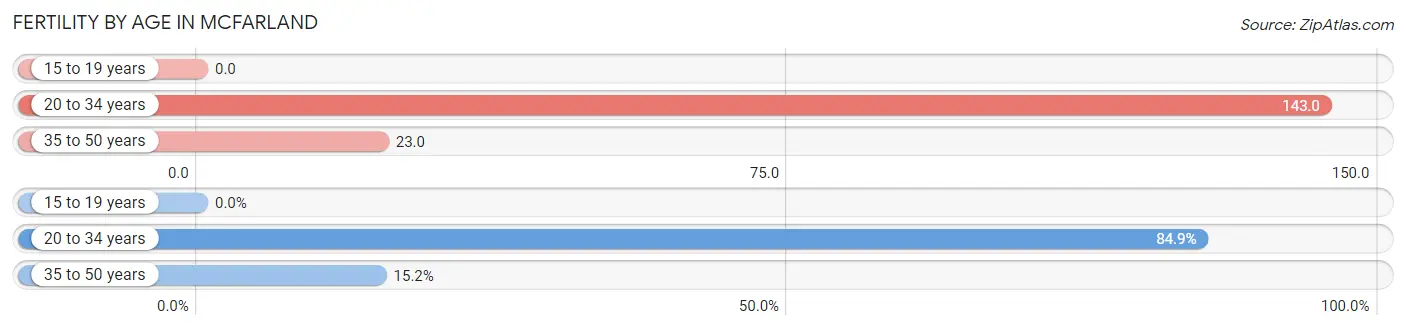
| Age Bracket | Women with Births | Births / 1,000 Women |
| 15 to 19 years | 0 (0.0%) | 0.0 |
| 20 to 34 years | 196 (84.9%) | 143.0 |
| 35 to 50 years | 35 (15.1%) | 23.0 |
| Total | 231 (100.0%) | 64.0 |
Fertility by Age by Marriage Status in McFarland
43.7% of women with births (231) in McFarland are married. The highest percentage of unmarried women with births falls into 20 to 34 years age bracket with 65.3% of them unmarried at the time of birth, while the lowest percentage of unmarried women with births belong to 35 to 50 years age bracket with 5.7% of them unmarried.
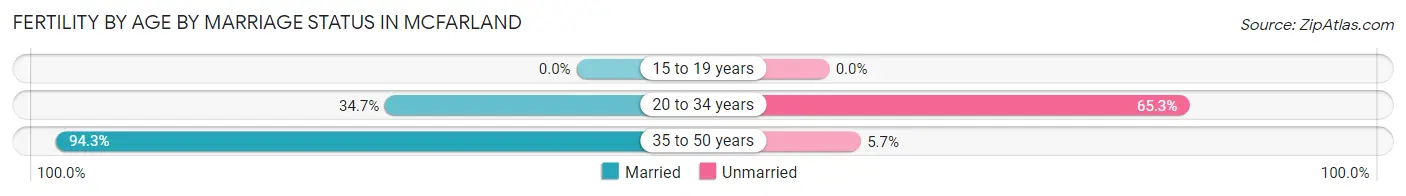
| Age Bracket | Married | Unmarried |
| 15 to 19 years | 0 (0.0%) | 0 (0.0%) |
| 20 to 34 years | 68 (34.7%) | 128 (65.3%) |
| 35 to 50 years | 33 (94.3%) | 2 (5.7%) |
| Total | 101 (43.7%) | 130 (56.3%) |
Fertility by Education in McFarland
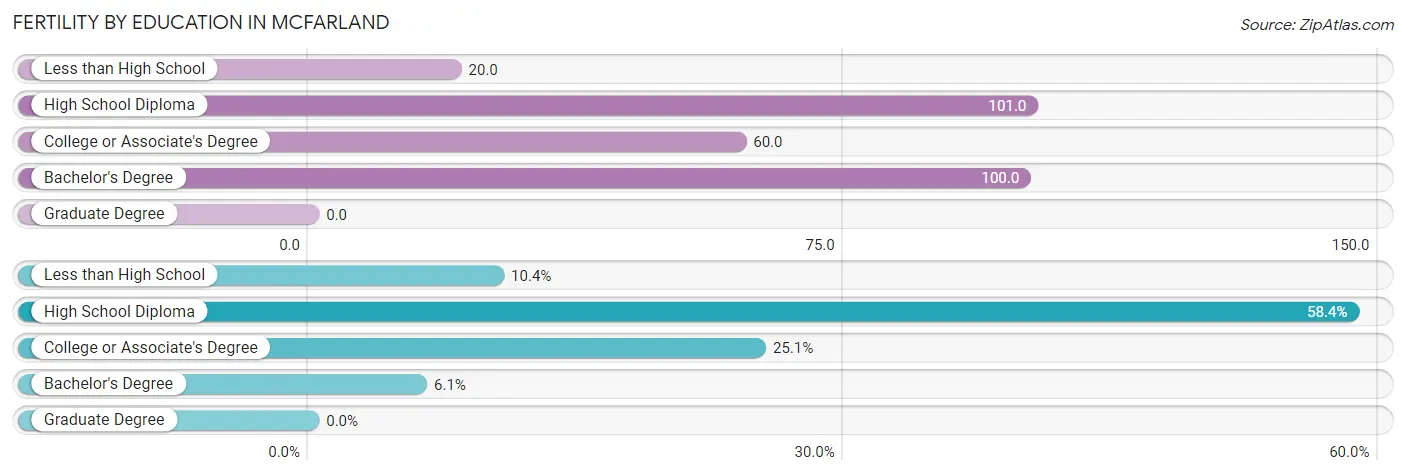
| Educational Attainment | Women with Births | Births / 1,000 Women |
| Less than High School | 24 (10.4%) | 20.0 |
| High School Diploma | 135 (58.4%) | 101.0 |
| College or Associate's Degree | 58 (25.1%) | 60.0 |
| Bachelor's Degree | 14 (6.1%) | 100.0 |
| Graduate Degree | 0 (0.0%) | 0.0 |
| Total | 231 (100.0%) | 64.0 |
Fertility by Education by Marriage Status in McFarland
56.3% of women with births in McFarland are unmarried. Women with the educational attainment of less than high school are most likely to be married with 100.0% of them married at childbirth, while women with the educational attainment of college or associate's degree are least likely to be married with 79.3% of them unmarried at childbirth.
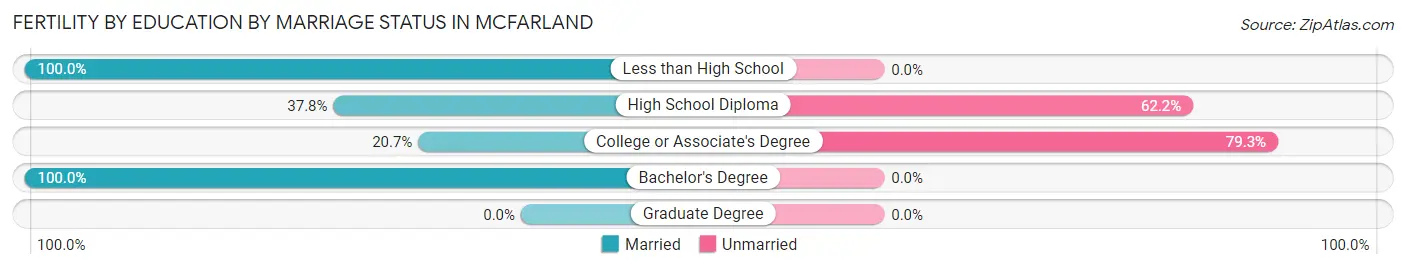
| Educational Attainment | Married | Unmarried |
| Less than High School | 24 (100.0%) | 0 (0.0%) |
| High School Diploma | 51 (37.8%) | 84 (62.2%) |
| College or Associate's Degree | 12 (20.7%) | 46 (79.3%) |
| Bachelor's Degree | 14 (100.0%) | 0 (0.0%) |
| Graduate Degree | 0 (0.0%) | 0 (0.0%) |
| Total | 101 (43.7%) | 130 (56.3%) |
Employment Characteristics in McFarland
Employment by Class of Employer in McFarland
Among the 5,042 employed individuals in McFarland, private company employees (4,166 | 82.6%), local government employees (291 | 5.8%), and not-for-profit organizations (207 | 4.1%) make up the most common classes of employment.
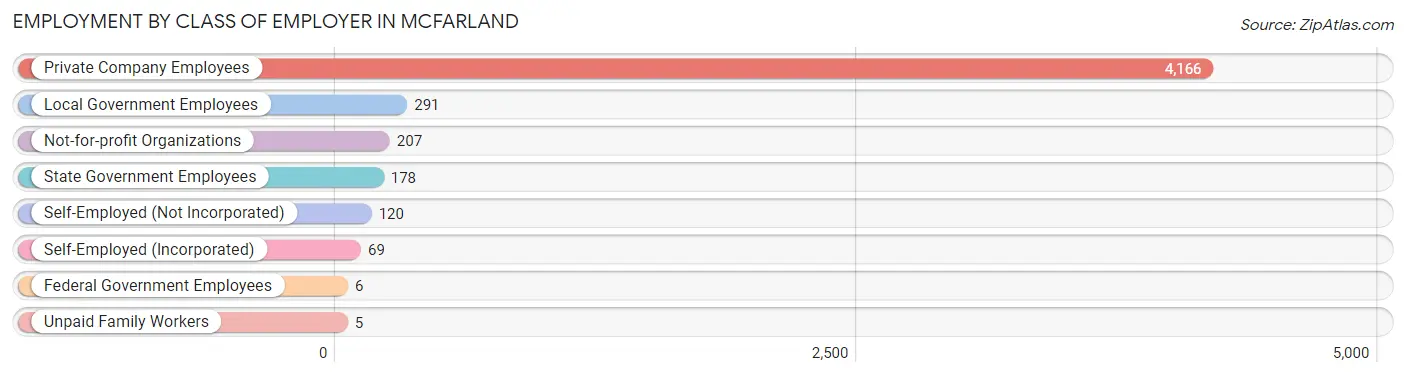
| Employer Class | # Employees | % Employees |
| Private Company Employees | 4,166 | 82.6% |
| Self-Employed (Incorporated) | 69 | 1.4% |
| Self-Employed (Not Incorporated) | 120 | 2.4% |
| Not-for-profit Organizations | 207 | 4.1% |
| Local Government Employees | 291 | 5.8% |
| State Government Employees | 178 | 3.5% |
| Federal Government Employees | 6 | 0.1% |
| Unpaid Family Workers | 5 | 0.1% |
| Total | 5,042 | 100.0% |
Employment Status by Age in McFarland
According to the labor force statistics for McFarland, out of the total population over 16 years of age (9,635), 57.1% or 5,502 individuals are in the labor force, with 6.4% or 352 of them unemployed. The age group with the highest labor force participation rate is 20 to 24 years, with 71.6% or 943 individuals in the labor force. Within the labor force, the 75 years and over age range has the highest percentage of unemployed individuals, with 100.0% or 15 of them being unemployed.
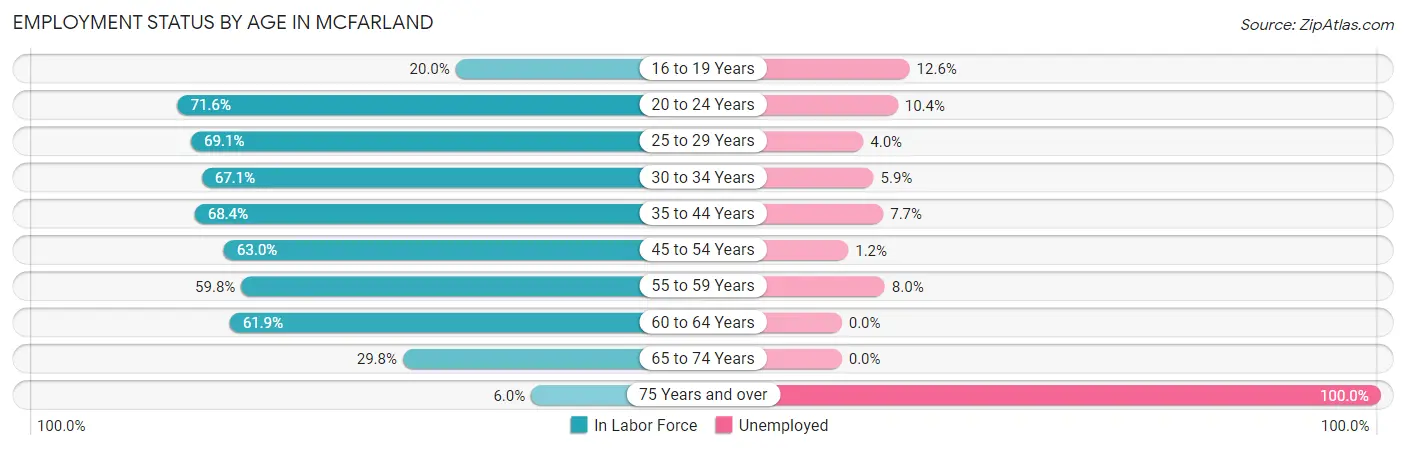
| Age Bracket | In Labor Force | Unemployed |
| 16 to 19 Years | 254 (20.0%) | 32 (12.6%) |
| 20 to 24 Years | 943 (71.6%) | 98 (10.4%) |
| 25 to 29 Years | 605 (69.1%) | 24 (4.0%) |
| 30 to 34 Years | 629 (67.1%) | 37 (5.9%) |
| 35 to 44 Years | 1,481 (68.4%) | 114 (7.7%) |
| 45 to 54 Years | 852 (63.0%) | 10 (1.2%) |
| 55 to 59 Years | 250 (59.8%) | 20 (8.0%) |
| 60 to 64 Years | 301 (61.9%) | 0 (0.0%) |
| 65 to 74 Years | 169 (29.8%) | 0 (0.0%) |
| 75 Years and over | 15 (6.0%) | 15 (100.0%) |
| Total | 5,502 (57.1%) | 352 (6.4%) |
Employment Status by Educational Attainment in McFarland
According to labor force statistics for McFarland, 66.1% of individuals (4,120) out of the total population between 25 and 64 years of age (6,233) are in the labor force, with 5.0% or 206 of them being unemployed. The group with the highest labor force participation rate are those with the educational attainment of bachelor's degree or higher, with 89.6% or 242 individuals in the labor force. Within the labor force, individuals with high school diploma education have the highest percentage of unemployment, with 6.6% or 92 of them being unemployed.
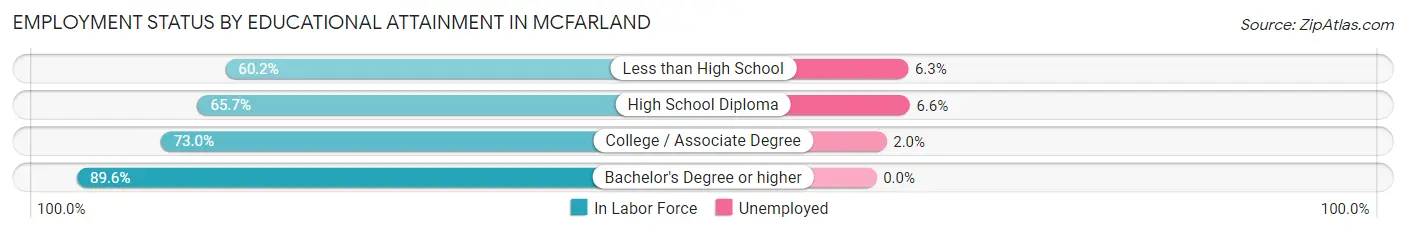
| Educational Attainment | In Labor Force | Unemployed |
| Less than High School | 1,519 (60.2%) | 159 (6.3%) |
| High School Diploma | 1,387 (65.7%) | 139 (6.6%) |
| College / Associate Degree | 969 (73.0%) | 27 (2.0%) |
| Bachelor's Degree or higher | 242 (89.6%) | 0 (0.0%) |
| Total | 4,120 (66.1%) | 312 (5.0%) |
Employment Occupations by Sex in McFarland
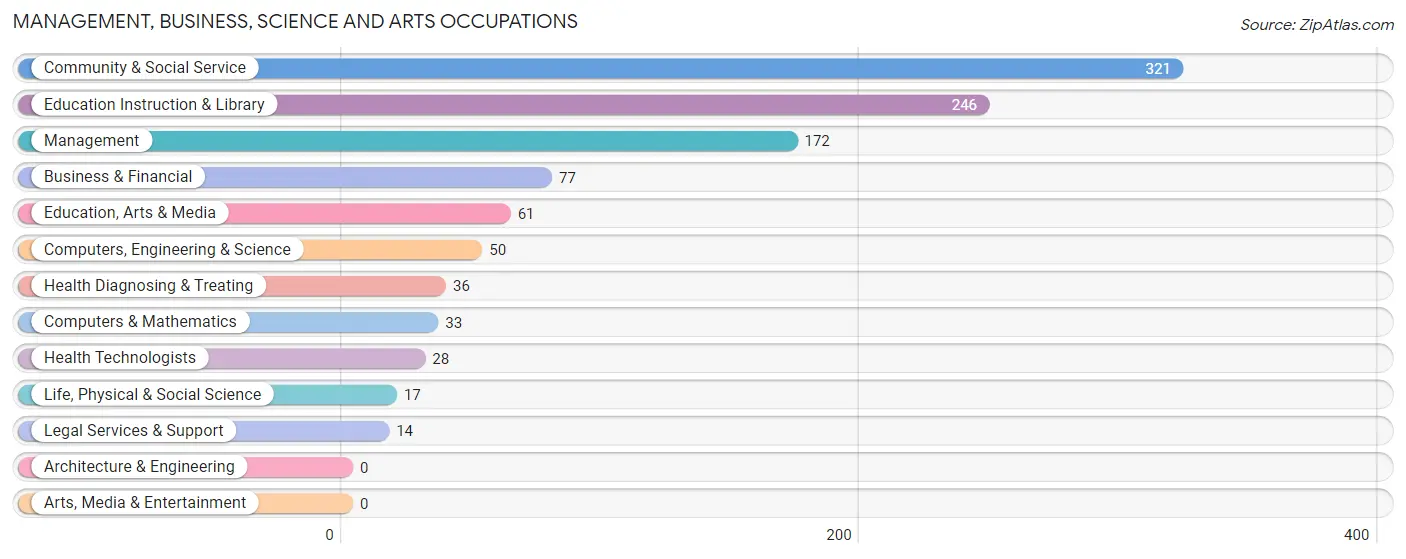
Management, Business, Science and Arts Occupations
The most common Management, Business, Science and Arts occupations in McFarland are Community & Social Service (321 | 6.2%), Education Instruction & Library (246 | 4.8%), Management (172 | 3.3%), Business & Financial (77 | 1.5%), and Education, Arts & Media (61 | 1.2%).
Management, Business, Science and Arts Occupations by Sex
Within the Management, Business, Science and Arts occupations in McFarland, the most male-oriented occupations are Computers, Engineering & Science (100.0%), Computers & Mathematics (100.0%), and Life, Physical & Social Science (100.0%), while the most female-oriented occupations are Legal Services & Support (100.0%), Health Diagnosing & Treating (72.2%), and Business & Financial (70.1%).
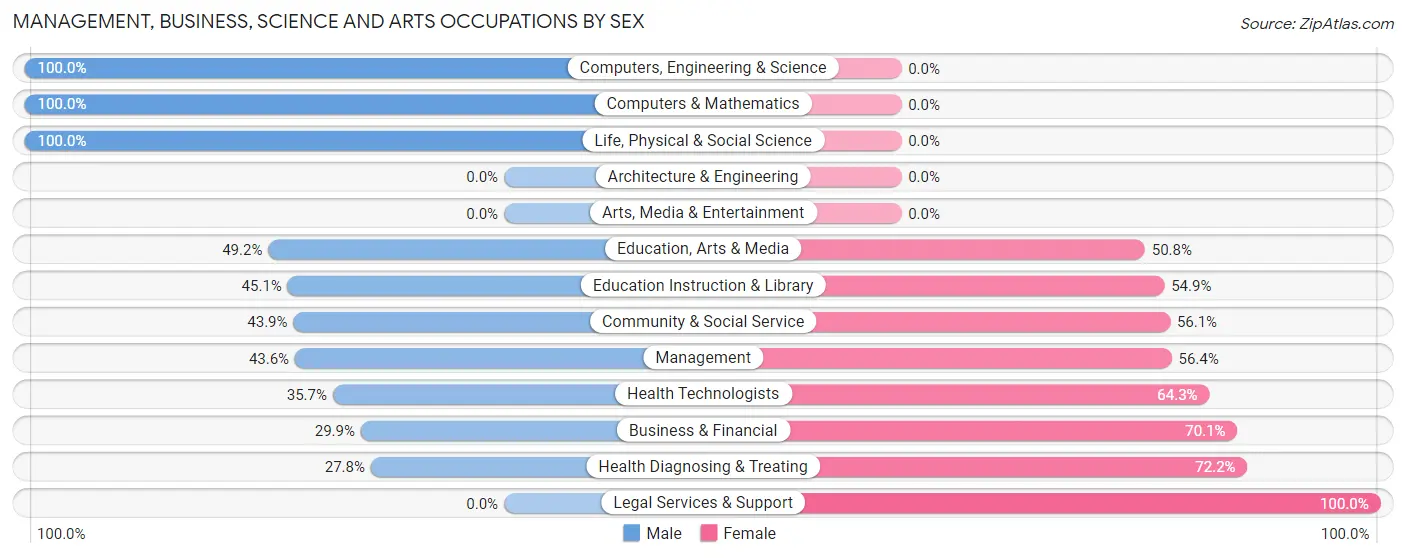
| Occupation | Male | Female |
| Management | 75 (43.6%) | 97 (56.4%) |
| Business & Financial | 23 (29.9%) | 54 (70.1%) |
| Computers, Engineering & Science | 50 (100.0%) | 0 (0.0%) |
| Computers & Mathematics | 33 (100.0%) | 0 (0.0%) |
| Architecture & Engineering | 0 (0.0%) | 0 (0.0%) |
| Life, Physical & Social Science | 17 (100.0%) | 0 (0.0%) |
| Community & Social Service | 141 (43.9%) | 180 (56.1%) |
| Education, Arts & Media | 30 (49.2%) | 31 (50.8%) |
| Legal Services & Support | 0 (0.0%) | 14 (100.0%) |
| Education Instruction & Library | 111 (45.1%) | 135 (54.9%) |
| Arts, Media & Entertainment | 0 (0.0%) | 0 (0.0%) |
| Health Diagnosing & Treating | 10 (27.8%) | 26 (72.2%) |
| Health Technologists | 10 (35.7%) | 18 (64.3%) |
| Total (Category) | 299 (45.6%) | 357 (54.4%) |
| Total (Overall) | 2,773 (53.9%) | 2,375 (46.1%) |
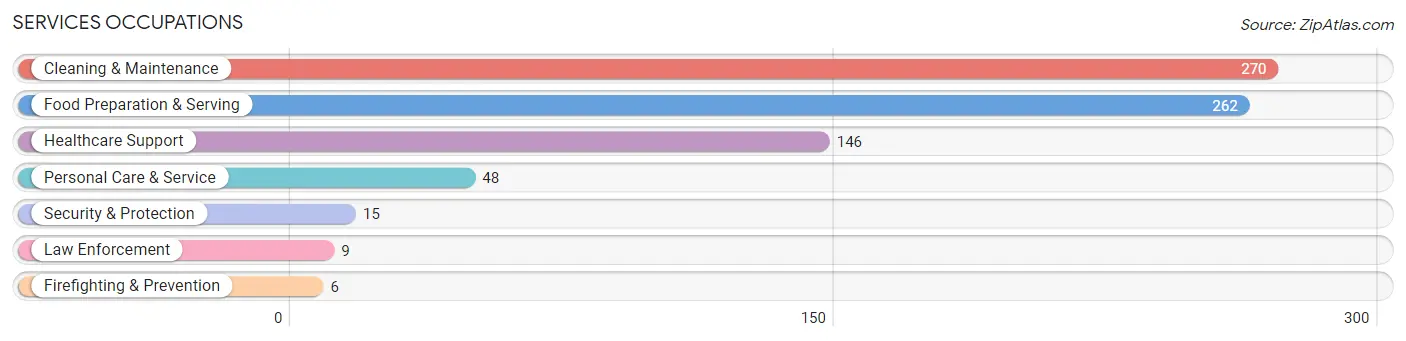
Services Occupations
The most common Services occupations in McFarland are Cleaning & Maintenance (270 | 5.2%), Food Preparation & Serving (262 | 5.1%), Healthcare Support (146 | 2.8%), Personal Care & Service (48 | 0.9%), and Security & Protection (15 | 0.3%).
Services Occupations by Sex
Within the Services occupations in McFarland, the most male-oriented occupations are Security & Protection (100.0%), Firefighting & Prevention (100.0%), and Law Enforcement (100.0%), while the most female-oriented occupations are Healthcare Support (83.6%), Food Preparation & Serving (81.7%), and Personal Care & Service (66.7%).
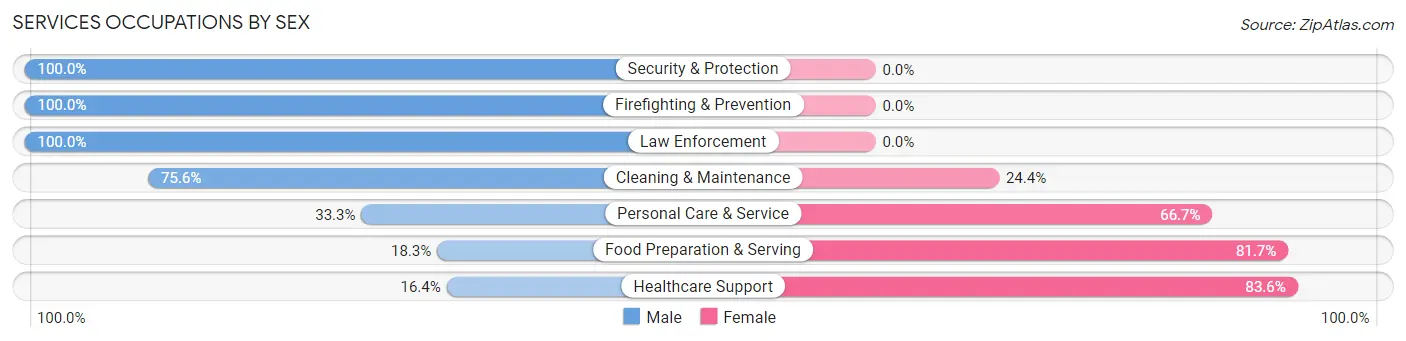
| Occupation | Male | Female |
| Healthcare Support | 24 (16.4%) | 122 (83.6%) |
| Security & Protection | 15 (100.0%) | 0 (0.0%) |
| Firefighting & Prevention | 6 (100.0%) | 0 (0.0%) |
| Law Enforcement | 9 (100.0%) | 0 (0.0%) |
| Food Preparation & Serving | 48 (18.3%) | 214 (81.7%) |
| Cleaning & Maintenance | 204 (75.6%) | 66 (24.4%) |
| Personal Care & Service | 16 (33.3%) | 32 (66.7%) |
| Total (Category) | 307 (41.4%) | 434 (58.6%) |
| Total (Overall) | 2,773 (53.9%) | 2,375 (46.1%) |
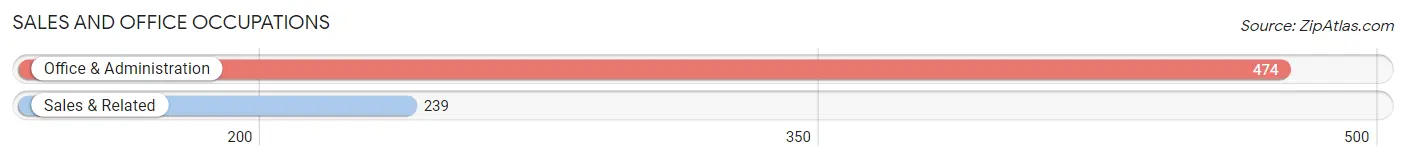
Sales and Office Occupations
The most common Sales and Office occupations in McFarland are Office & Administration (474 | 9.2%), and Sales & Related (239 | 4.6%).
Sales and Office Occupations by Sex
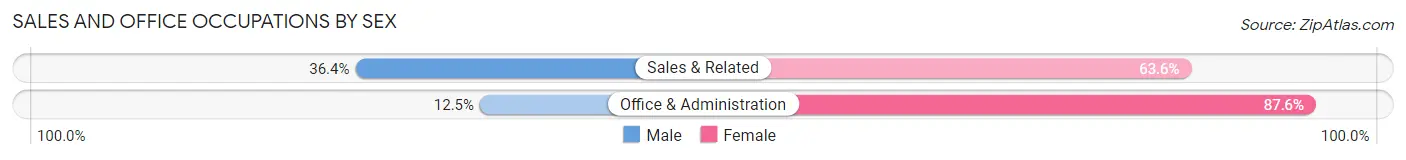
| Occupation | Male | Female |
| Sales & Related | 87 (36.4%) | 152 (63.6%) |
| Office & Administration | 59 (12.4%) | 415 (87.5%) |
| Total (Category) | 146 (20.5%) | 567 (79.5%) |
| Total (Overall) | 2,773 (53.9%) | 2,375 (46.1%) |
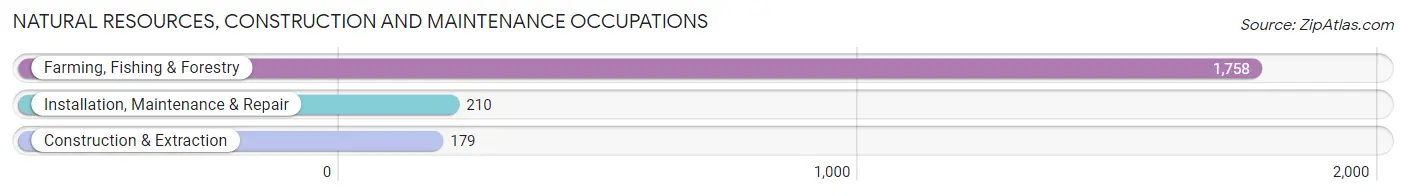
Natural Resources, Construction and Maintenance Occupations
The most common Natural Resources, Construction and Maintenance occupations in McFarland are Farming, Fishing & Forestry (1,758 | 34.2%), Installation, Maintenance & Repair (210 | 4.1%), and Construction & Extraction (179 | 3.5%).
Natural Resources, Construction and Maintenance Occupations by Sex
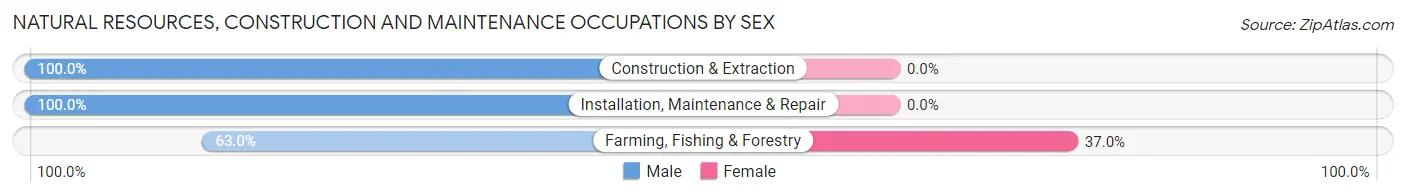
| Occupation | Male | Female |
| Farming, Fishing & Forestry | 1,107 (63.0%) | 651 (37.0%) |
| Construction & Extraction | 179 (100.0%) | 0 (0.0%) |
| Installation, Maintenance & Repair | 210 (100.0%) | 0 (0.0%) |
| Total (Category) | 1,496 (69.7%) | 651 (30.3%) |
| Total (Overall) | 2,773 (53.9%) | 2,375 (46.1%) |
Production, Transportation and Moving Occupations
The most common Production, Transportation and Moving occupations in McFarland are Material Moving (467 | 9.1%), Production (252 | 4.9%), and Transportation (172 | 3.3%).
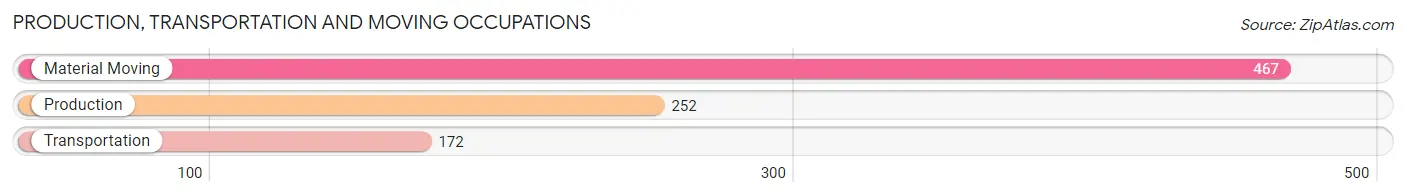
Production, Transportation and Moving Occupations by Sex
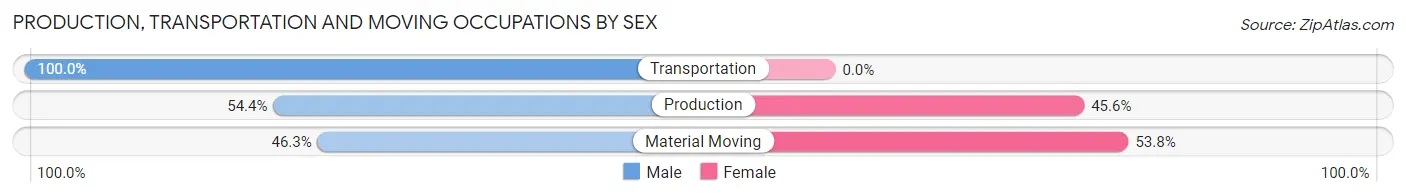
| Occupation | Male | Female |
| Production | 137 (54.4%) | 115 (45.6%) |
| Transportation | 172 (100.0%) | 0 (0.0%) |
| Material Moving | 216 (46.3%) | 251 (53.7%) |
| Total (Category) | 525 (58.9%) | 366 (41.1%) |
| Total (Overall) | 2,773 (53.9%) | 2,375 (46.1%) |
Employment Industries by Sex in McFarland
Employment Industries in McFarland
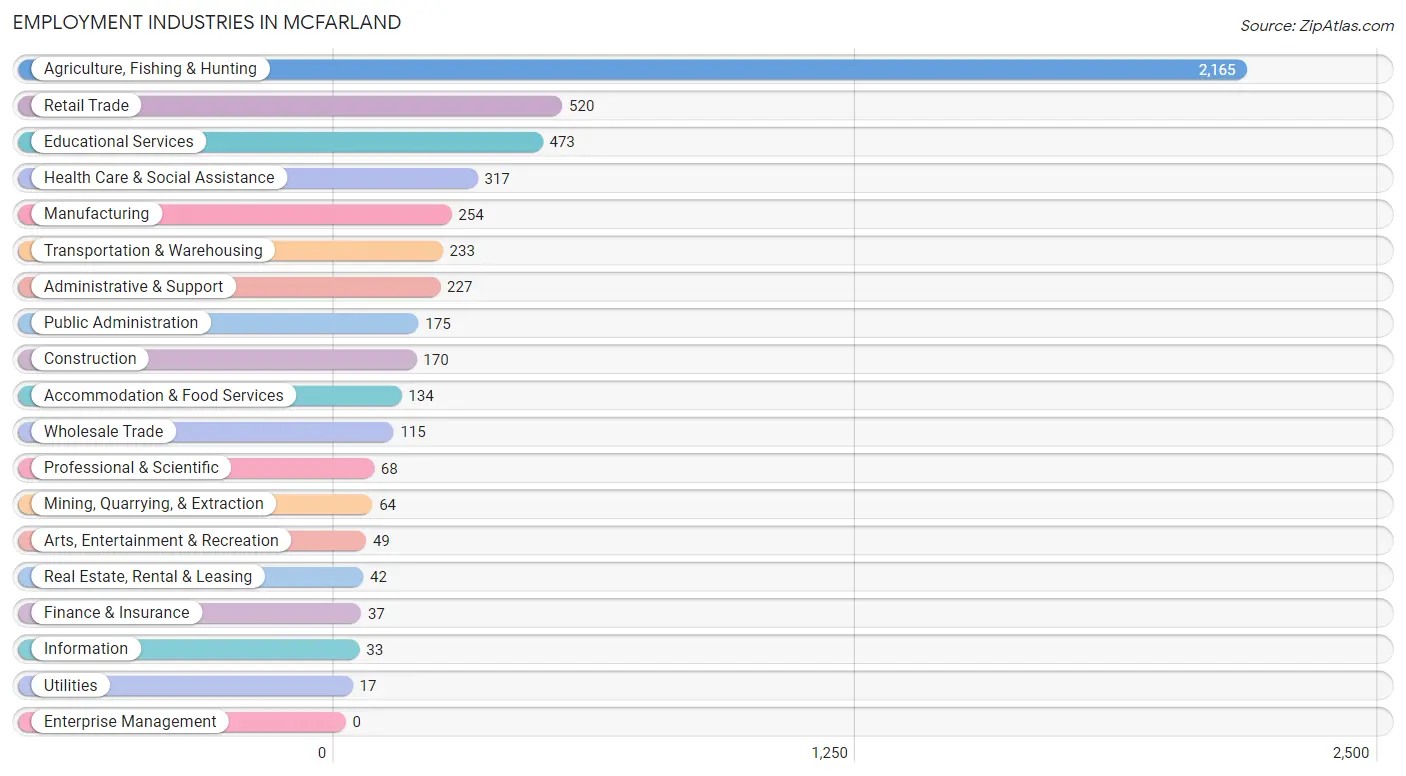
The major employment industries in McFarland include Agriculture, Fishing & Hunting (2,165 | 42.1%), Retail Trade (520 | 10.1%), Educational Services (473 | 9.2%), Health Care & Social Assistance (317 | 6.2%), and Manufacturing (254 | 4.9%).
Employment Industries by Sex in McFarland
The McFarland industries that see more men than women are Mining, Quarrying, & Extraction (100.0%), Utilities (100.0%), and Information (100.0%), whereas the industries that tend to have a higher number of women are Professional & Scientific (100.0%), Health Care & Social Assistance (87.1%), and Educational Services (74.4%).
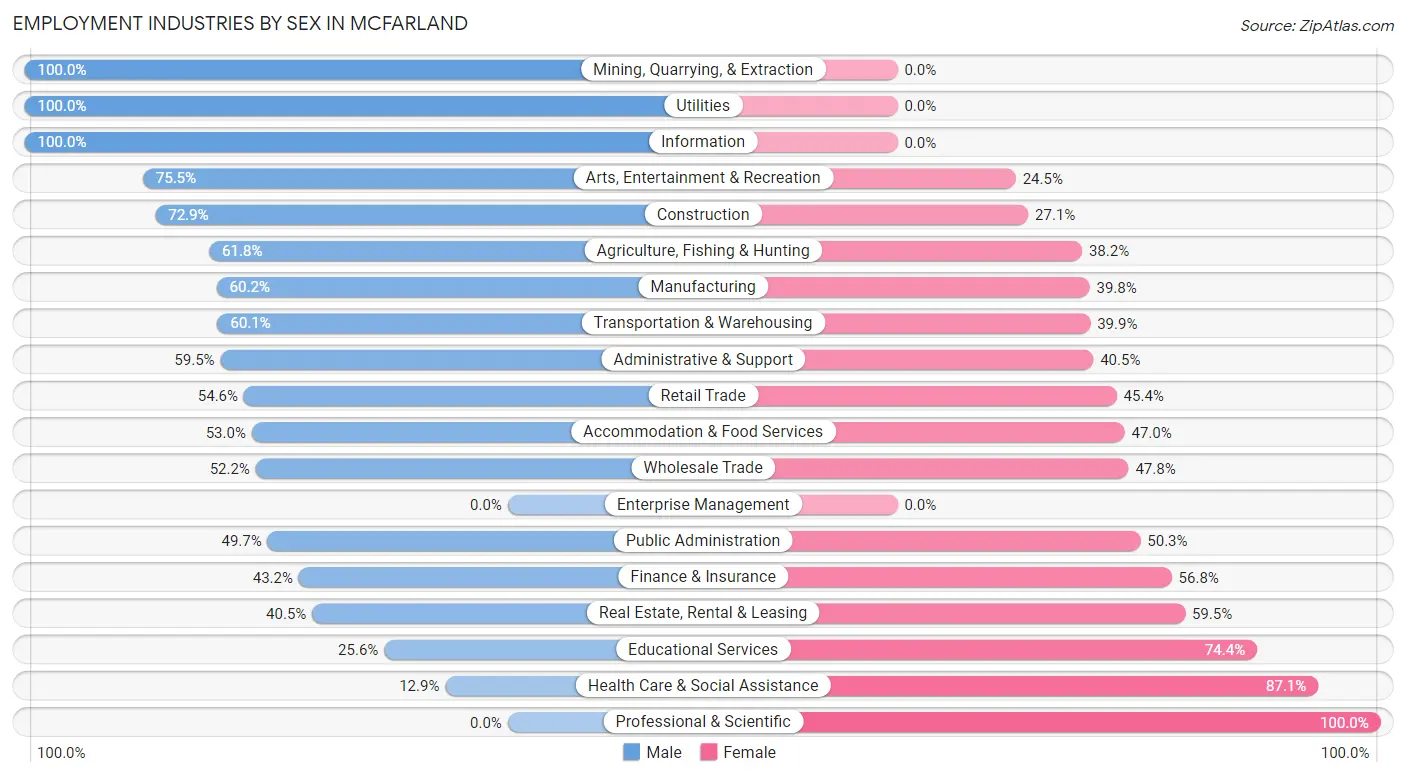
| Industry | Male | Female |
| Agriculture, Fishing & Hunting | 1,338 (61.8%) | 827 (38.2%) |
| Mining, Quarrying, & Extraction | 64 (100.0%) | 0 (0.0%) |
| Construction | 124 (72.9%) | 46 (27.1%) |
| Manufacturing | 153 (60.2%) | 101 (39.8%) |
| Wholesale Trade | 60 (52.2%) | 55 (47.8%) |
| Retail Trade | 284 (54.6%) | 236 (45.4%) |
| Transportation & Warehousing | 140 (60.1%) | 93 (39.9%) |
| Utilities | 17 (100.0%) | 0 (0.0%) |
| Information | 33 (100.0%) | 0 (0.0%) |
| Finance & Insurance | 16 (43.2%) | 21 (56.8%) |
| Real Estate, Rental & Leasing | 17 (40.5%) | 25 (59.5%) |
| Professional & Scientific | 0 (0.0%) | 68 (100.0%) |
| Enterprise Management | 0 (0.0%) | 0 (0.0%) |
| Administrative & Support | 135 (59.5%) | 92 (40.5%) |
| Educational Services | 121 (25.6%) | 352 (74.4%) |
| Health Care & Social Assistance | 41 (12.9%) | 276 (87.1%) |
| Arts, Entertainment & Recreation | 37 (75.5%) | 12 (24.5%) |
| Accommodation & Food Services | 71 (53.0%) | 63 (47.0%) |
| Public Administration | 87 (49.7%) | 88 (50.3%) |
| Total | 2,773 (53.9%) | 2,375 (46.1%) |
Education in McFarland
School Enrollment in McFarland
The most common levels of schooling among the 4,764 students in McFarland are middle school (1,325 | 27.8%), high school (1,251 | 26.3%), and elementary school (1,165 | 24.4%).
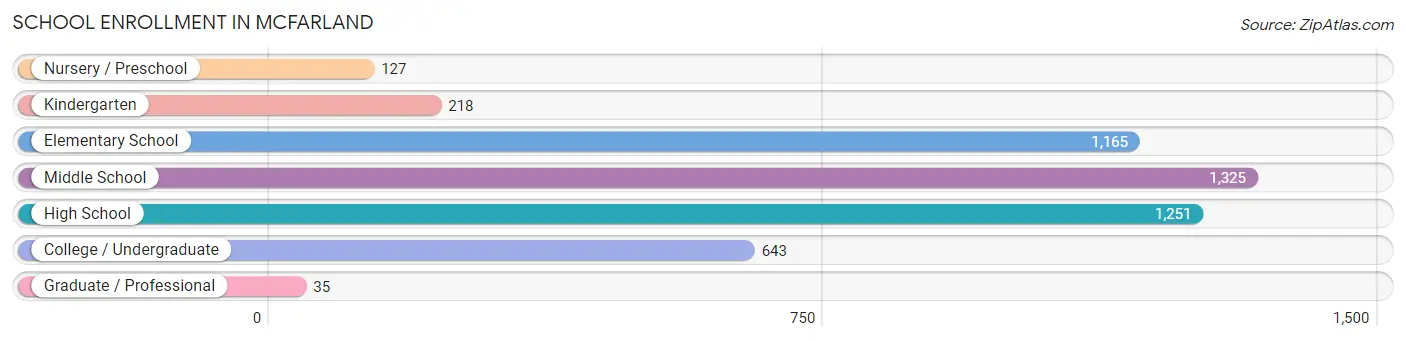
| School Level | # Students | % Students |
| Nursery / Preschool | 127 | 2.7% |
| Kindergarten | 218 | 4.6% |
| Elementary School | 1,165 | 24.4% |
| Middle School | 1,325 | 27.8% |
| High School | 1,251 | 26.3% |
| College / Undergraduate | 643 | 13.5% |
| Graduate / Professional | 35 | 0.7% |
| Total | 4,764 | 100.0% |
School Enrollment by Age by Funding Source in McFarland
Out of a total of 4,764 students who are enrolled in schools in McFarland, 338 (7.1%) attend a private institution, while the remaining 4,426 (92.9%) are enrolled in public schools. The age group of 25 to 34 year olds has the highest likelihood of being enrolled in private schools, with 75 (68.8% in the age bracket) enrolled. Conversely, the age group of 3 to 4 year olds has the lowest likelihood of being enrolled in a private school, with 85 (100.0% in the age bracket) attending a public institution.
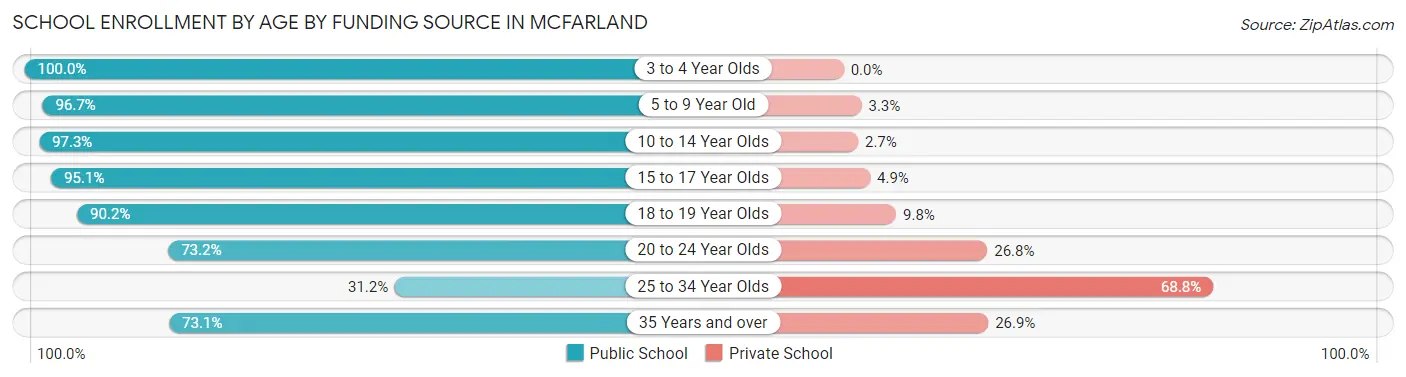
| Age Bracket | Public School | Private School |
| 3 to 4 Year Olds | 85 (100.0%) | 0 (0.0%) |
| 5 to 9 Year Old | 1,218 (96.7%) | 42 (3.3%) |
| 10 to 14 Year Olds | 1,668 (97.3%) | 46 (2.7%) |
| 15 to 17 Year Olds | 734 (95.1%) | 38 (4.9%) |
| 18 to 19 Year Olds | 434 (90.2%) | 47 (9.8%) |
| 20 to 24 Year Olds | 156 (73.2%) | 57 (26.8%) |
| 25 to 34 Year Olds | 34 (31.2%) | 75 (68.8%) |
| 35 Years and over | 95 (73.1%) | 35 (26.9%) |
| Total | 4,426 (92.9%) | 338 (7.1%) |
Educational Attainment by Field of Study in McFarland
Business (52 | 15.5%), social sciences (45 | 13.4%), literature & languages (41 | 12.2%), science & technology (40 | 11.9%), and visual & performing arts (39 | 11.6%) are the most common fields of study among 336 individuals in McFarland who have obtained a bachelor's degree or higher.
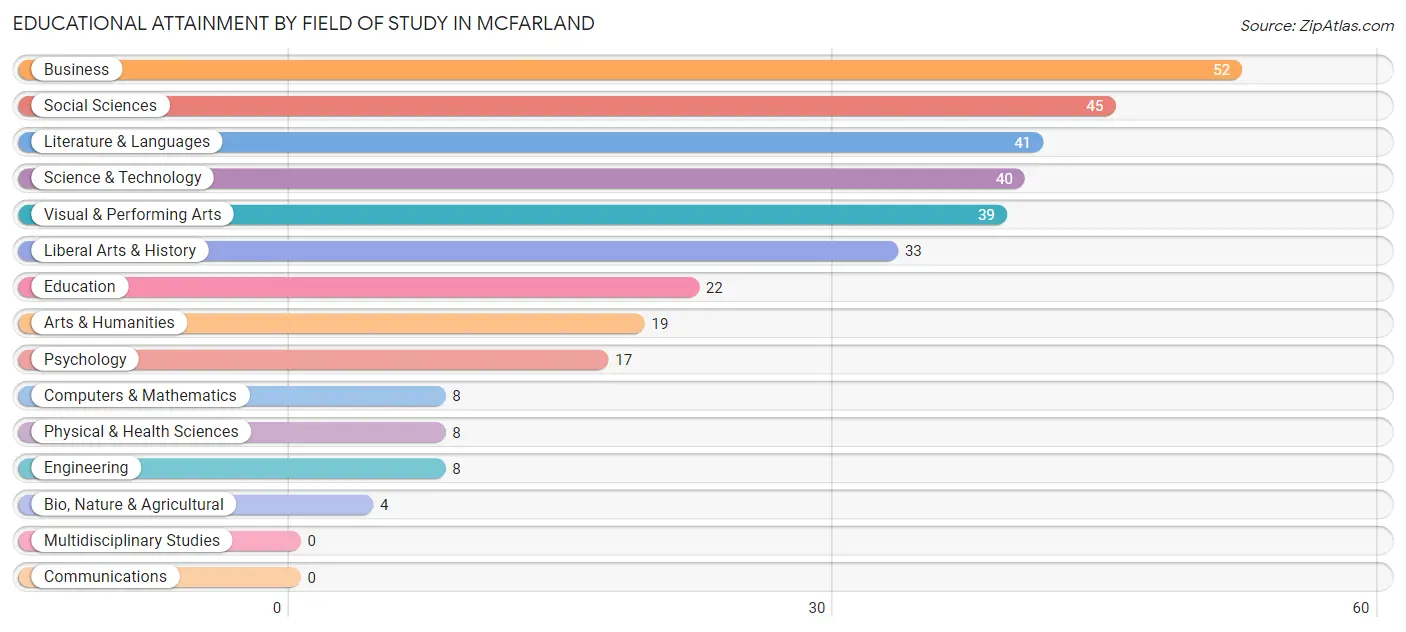
| Field of Study | # Graduates | % Graduates |
| Computers & Mathematics | 8 | 2.4% |
| Bio, Nature & Agricultural | 4 | 1.2% |
| Physical & Health Sciences | 8 | 2.4% |
| Psychology | 17 | 5.1% |
| Social Sciences | 45 | 13.4% |
| Engineering | 8 | 2.4% |
| Multidisciplinary Studies | 0 | 0.0% |
| Science & Technology | 40 | 11.9% |
| Business | 52 | 15.5% |
| Education | 22 | 6.6% |
| Literature & Languages | 41 | 12.2% |
| Liberal Arts & History | 33 | 9.8% |
| Visual & Performing Arts | 39 | 11.6% |
| Communications | 0 | 0.0% |
| Arts & Humanities | 19 | 5.7% |
| Total | 336 | 100.0% |
Transportation & Commute in McFarland
Vehicle Availability by Sex in McFarland
The most prevalent vehicle ownership categories in McFarland are males with 2 vehicles (911, accounting for 33.4%) and females with 2 vehicles (864, making up 39.4%).
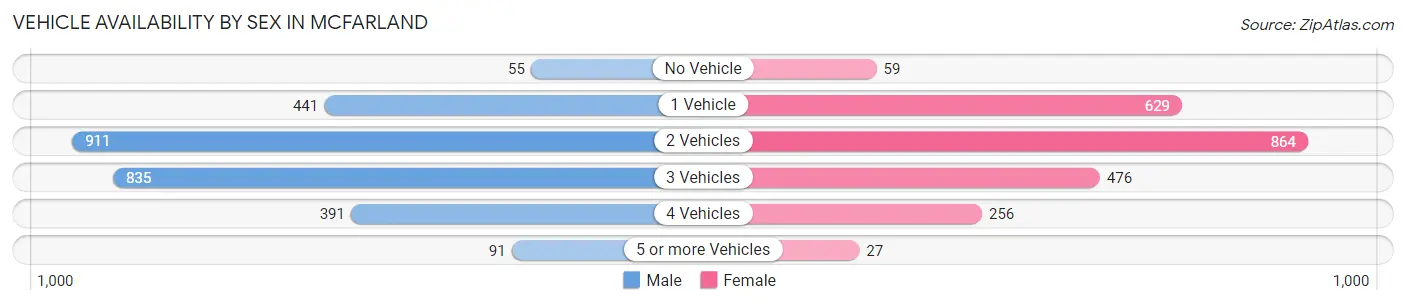
| Vehicles Available | Male | Female |
| No Vehicle | 55 (2.0%) | 59 (2.5%) |
| 1 Vehicle | 441 (16.2%) | 629 (27.2%) |
| 2 Vehicles | 911 (33.4%) | 864 (37.4%) |
| 3 Vehicles | 835 (30.6%) | 476 (20.6%) |
| 4 Vehicles | 391 (14.3%) | 256 (11.1%) |
| 5 or more Vehicles | 91 (3.3%) | 27 (1.2%) |
| Total | 2,724 (100.0%) | 2,311 (100.0%) |
Commute Time in McFarland
The most frequently occuring commute durations in McFarland are 15 to 19 minutes (1,594 commuters, 32.7%), 10 to 14 minutes (700 commuters, 14.4%), and 5 to 9 minutes (628 commuters, 12.9%).
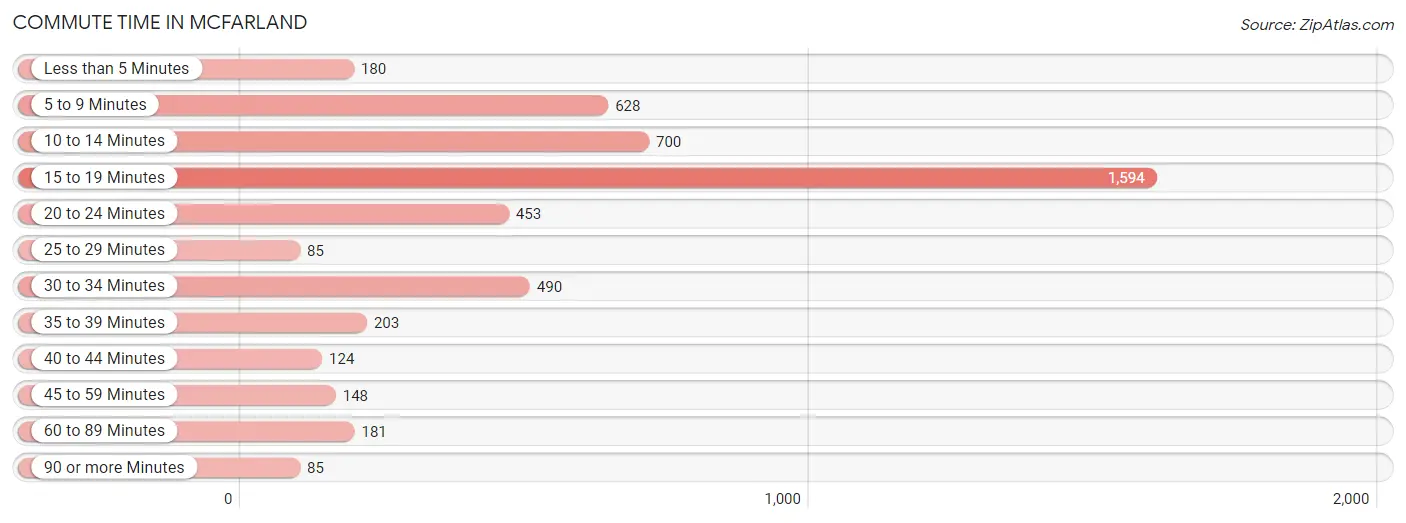
| Commute Time | # Commuters | % Commuters |
| Less than 5 Minutes | 180 | 3.7% |
| 5 to 9 Minutes | 628 | 12.9% |
| 10 to 14 Minutes | 700 | 14.4% |
| 15 to 19 Minutes | 1,594 | 32.7% |
| 20 to 24 Minutes | 453 | 9.3% |
| 25 to 29 Minutes | 85 | 1.8% |
| 30 to 34 Minutes | 490 | 10.1% |
| 35 to 39 Minutes | 203 | 4.2% |
| 40 to 44 Minutes | 124 | 2.5% |
| 45 to 59 Minutes | 148 | 3.0% |
| 60 to 89 Minutes | 181 | 3.7% |
| 90 or more Minutes | 85 | 1.8% |
Commute Time by Sex in McFarland
The most common commute times in McFarland are 15 to 19 minutes (957 commuters, 36.3%) for males and 15 to 19 minutes (637 commuters, 28.5%) for females.
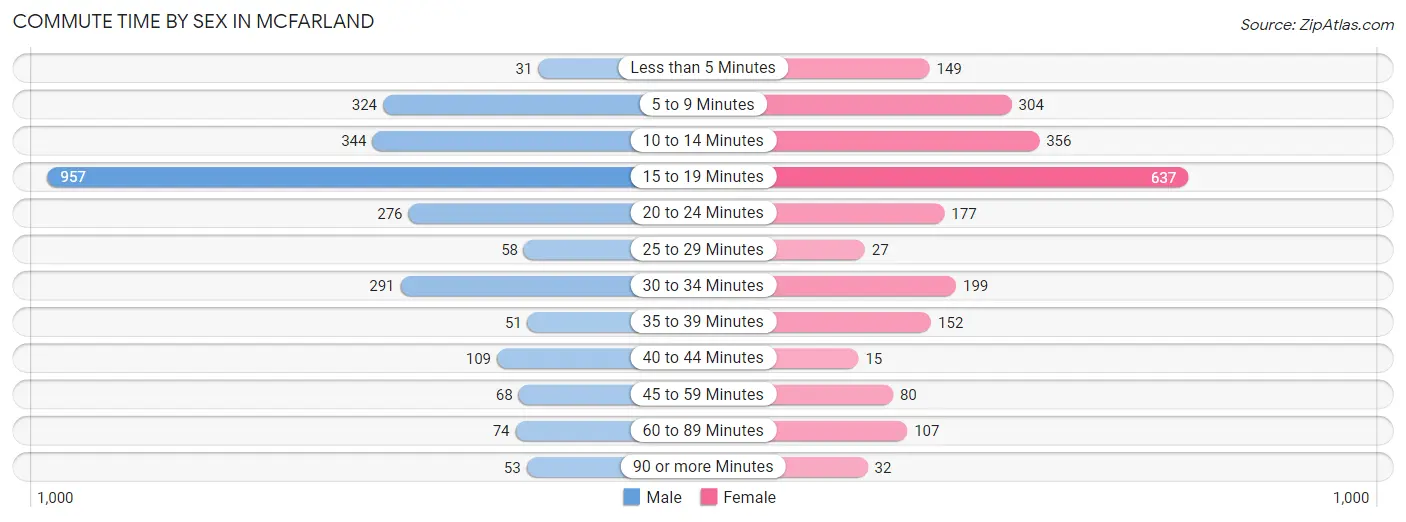
| Commute Time | Male | Female |
| Less than 5 Minutes | 31 (1.2%) | 149 (6.7%) |
| 5 to 9 Minutes | 324 (12.3%) | 304 (13.6%) |
| 10 to 14 Minutes | 344 (13.1%) | 356 (15.9%) |
| 15 to 19 Minutes | 957 (36.3%) | 637 (28.5%) |
| 20 to 24 Minutes | 276 (10.5%) | 177 (7.9%) |
| 25 to 29 Minutes | 58 (2.2%) | 27 (1.2%) |
| 30 to 34 Minutes | 291 (11.0%) | 199 (8.9%) |
| 35 to 39 Minutes | 51 (1.9%) | 152 (6.8%) |
| 40 to 44 Minutes | 109 (4.1%) | 15 (0.7%) |
| 45 to 59 Minutes | 68 (2.6%) | 80 (3.6%) |
| 60 to 89 Minutes | 74 (2.8%) | 107 (4.8%) |
| 90 or more Minutes | 53 (2.0%) | 32 (1.4%) |
Time of Departure to Work by Sex in McFarland
The most frequent times of departure to work in McFarland are 6:00 AM to 6:29 AM (1,161, 44.0%) for males and 6:00 AM to 6:29 AM (833, 37.3%) for females.
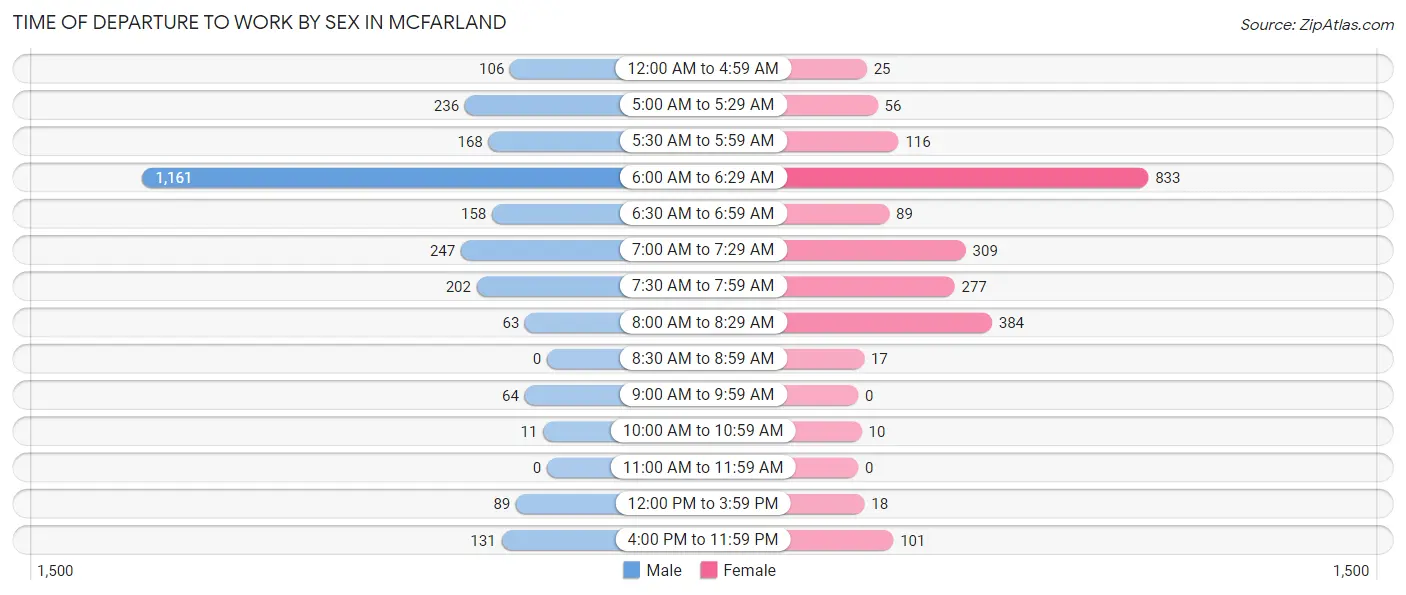
| Time of Departure | Male | Female |
| 12:00 AM to 4:59 AM | 106 (4.0%) | 25 (1.1%) |
| 5:00 AM to 5:29 AM | 236 (8.9%) | 56 (2.5%) |
| 5:30 AM to 5:59 AM | 168 (6.4%) | 116 (5.2%) |
| 6:00 AM to 6:29 AM | 1,161 (44.0%) | 833 (37.3%) |
| 6:30 AM to 6:59 AM | 158 (6.0%) | 89 (4.0%) |
| 7:00 AM to 7:29 AM | 247 (9.4%) | 309 (13.8%) |
| 7:30 AM to 7:59 AM | 202 (7.7%) | 277 (12.4%) |
| 8:00 AM to 8:29 AM | 63 (2.4%) | 384 (17.2%) |
| 8:30 AM to 8:59 AM | 0 (0.0%) | 17 (0.8%) |
| 9:00 AM to 9:59 AM | 64 (2.4%) | 0 (0.0%) |
| 10:00 AM to 10:59 AM | 11 (0.4%) | 10 (0.4%) |
| 11:00 AM to 11:59 AM | 0 (0.0%) | 0 (0.0%) |
| 12:00 PM to 3:59 PM | 89 (3.4%) | 18 (0.8%) |
| 4:00 PM to 11:59 PM | 131 (5.0%) | 101 (4.5%) |
| Total | 2,636 (100.0%) | 2,235 (100.0%) |
Housing Occupancy in McFarland
Occupancy by Ownership in McFarland
Of the total 3,323 dwellings in McFarland, owner-occupied units account for 1,815 (54.6%), while renter-occupied units make up 1,508 (45.4%).
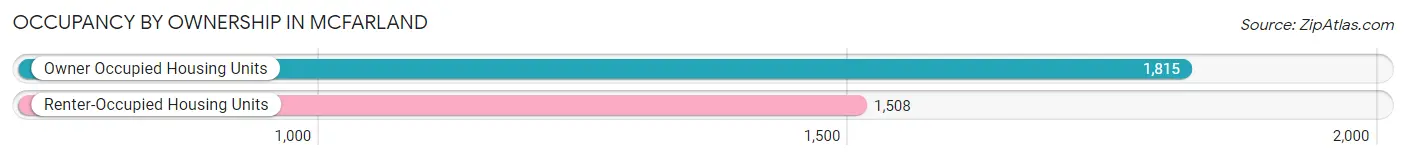
| Occupancy | # Housing Units | % Housing Units |
| Owner Occupied Housing Units | 1,815 | 54.6% |
| Renter-Occupied Housing Units | 1,508 | 45.4% |
| Total Occupied Housing Units | 3,323 | 100.0% |
Occupancy by Household Size in McFarland
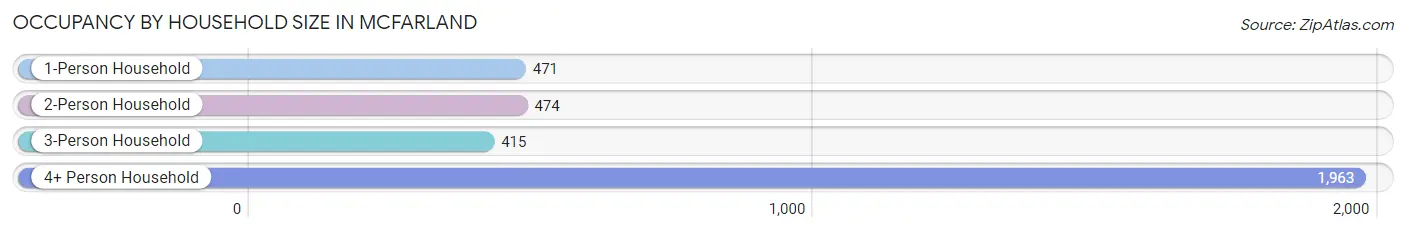
| Household Size | # Housing Units | % Housing Units |
| 1-Person Household | 471 | 14.2% |
| 2-Person Household | 474 | 14.3% |
| 3-Person Household | 415 | 12.5% |
| 4+ Person Household | 1,963 | 59.1% |
| Total Housing Units | 3,323 | 100.0% |
Occupancy by Ownership by Household Size in McFarland
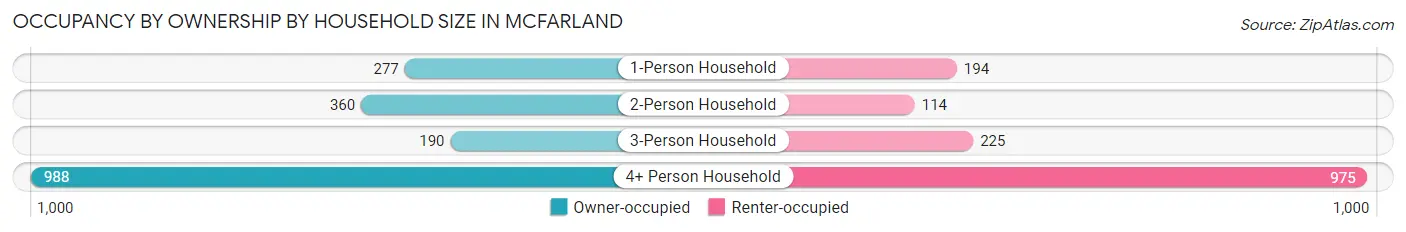
| Household Size | Owner-occupied | Renter-occupied |
| 1-Person Household | 277 (58.8%) | 194 (41.2%) |
| 2-Person Household | 360 (75.9%) | 114 (24.0%) |
| 3-Person Household | 190 (45.8%) | 225 (54.2%) |
| 4+ Person Household | 988 (50.3%) | 975 (49.7%) |
| Total Housing Units | 1,815 (54.6%) | 1,508 (45.4%) |
Occupancy by Educational Attainment in McFarland
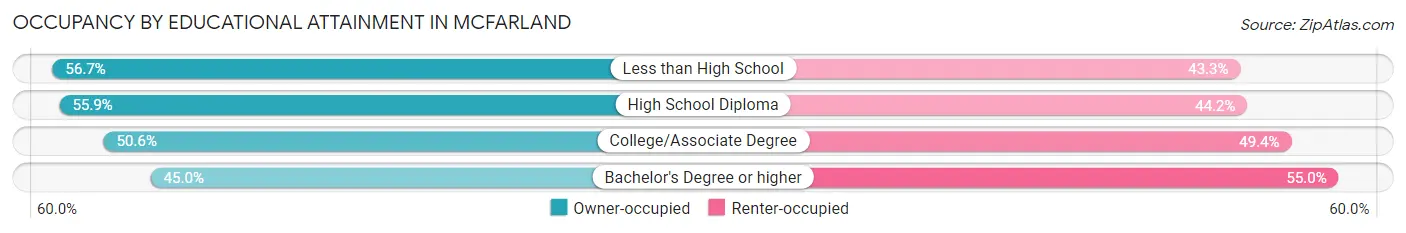
| Household Size | Owner-occupied | Renter-occupied |
| Less than High School | 885 (56.7%) | 676 (43.3%) |
| High School Diploma | 492 (55.8%) | 389 (44.2%) |
| College/Associate Degree | 375 (50.6%) | 366 (49.4%) |
| Bachelor's Degree or higher | 63 (45.0%) | 77 (55.0%) |
Occupancy by Age of Householder in McFarland
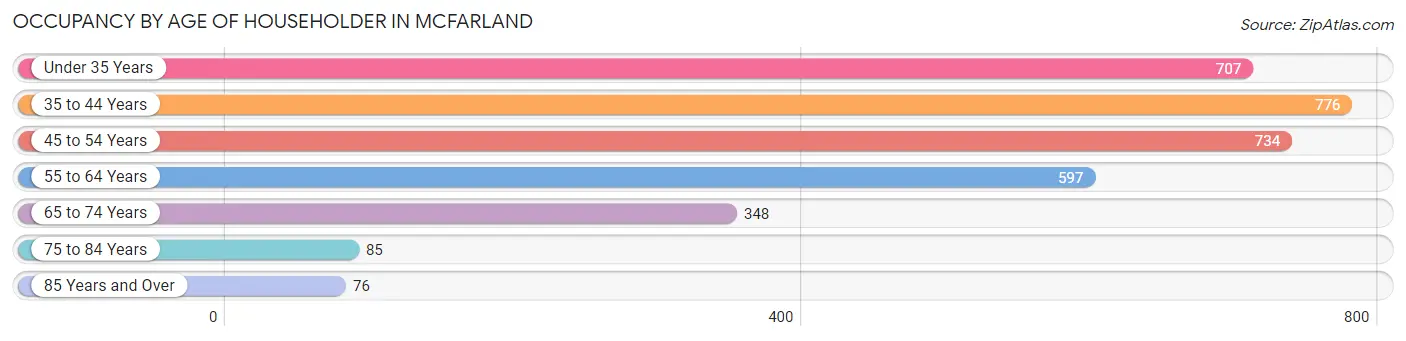
| Age Bracket | # Households | % Households |
| Under 35 Years | 707 | 21.3% |
| 35 to 44 Years | 776 | 23.4% |
| 45 to 54 Years | 734 | 22.1% |
| 55 to 64 Years | 597 | 18.0% |
| 65 to 74 Years | 348 | 10.5% |
| 75 to 84 Years | 85 | 2.6% |
| 85 Years and Over | 76 | 2.3% |
| Total | 3,323 | 100.0% |
Housing Finances in McFarland
Median Income by Occupancy in McFarland
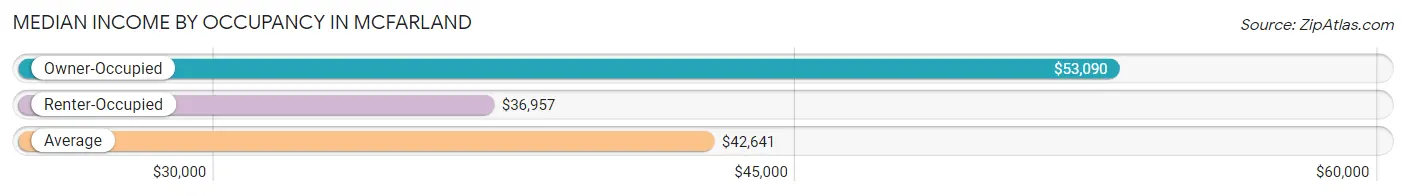
| Occupancy Type | # Households | Median Income |
| Owner-Occupied | 1,815 (54.6%) | $53,090 |
| Renter-Occupied | 1,508 (45.4%) | $36,957 |
| Average | 3,323 (100.0%) | $42,641 |
Occupancy by Householder Income Bracket in McFarland
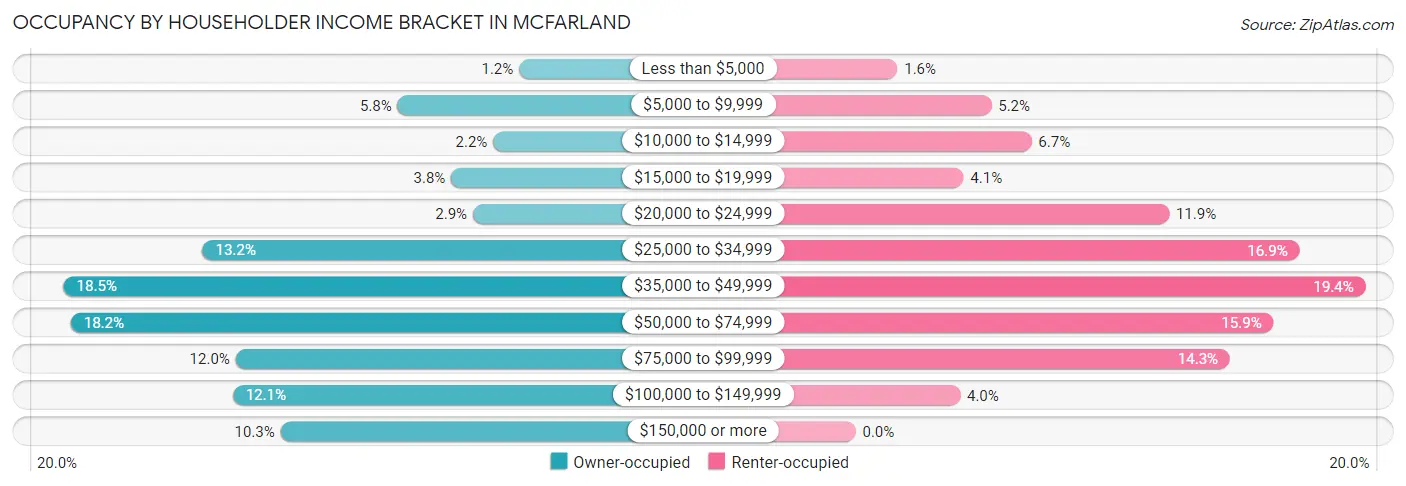
| Income Bracket | Owner-occupied | Renter-occupied |
| Less than $5,000 | 21 (1.2%) | 24 (1.6%) |
| $5,000 to $9,999 | 105 (5.8%) | 78 (5.2%) |
| $10,000 to $14,999 | 39 (2.1%) | 101 (6.7%) |
| $15,000 to $19,999 | 68 (3.7%) | 62 (4.1%) |
| $20,000 to $24,999 | 53 (2.9%) | 180 (11.9%) |
| $25,000 to $34,999 | 240 (13.2%) | 255 (16.9%) |
| $35,000 to $49,999 | 336 (18.5%) | 293 (19.4%) |
| $50,000 to $74,999 | 331 (18.2%) | 240 (15.9%) |
| $75,000 to $99,999 | 217 (12.0%) | 215 (14.3%) |
| $100,000 to $149,999 | 219 (12.1%) | 60 (4.0%) |
| $150,000 or more | 186 (10.2%) | 0 (0.0%) |
| Total | 1,815 (100.0%) | 1,508 (100.0%) |
Monthly Housing Cost Tiers in McFarland
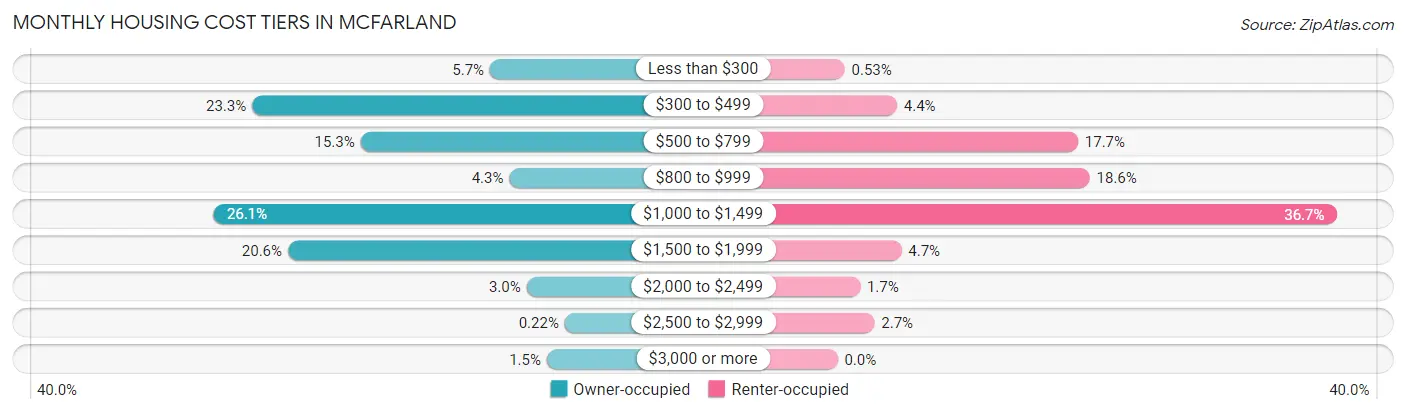
| Monthly Cost | Owner-occupied | Renter-occupied |
| Less than $300 | 104 (5.7%) | 8 (0.5%) |
| $300 to $499 | 422 (23.3%) | 66 (4.4%) |
| $500 to $799 | 277 (15.3%) | 267 (17.7%) |
| $800 to $999 | 78 (4.3%) | 280 (18.6%) |
| $1,000 to $1,499 | 473 (26.1%) | 554 (36.7%) |
| $1,500 to $1,999 | 374 (20.6%) | 71 (4.7%) |
| $2,000 to $2,499 | 55 (3.0%) | 25 (1.7%) |
| $2,500 to $2,999 | 4 (0.2%) | 41 (2.7%) |
| $3,000 or more | 28 (1.5%) | 0 (0.0%) |
| Total | 1,815 (100.0%) | 1,508 (100.0%) |
Physical Housing Characteristics in McFarland
Housing Structures in McFarland
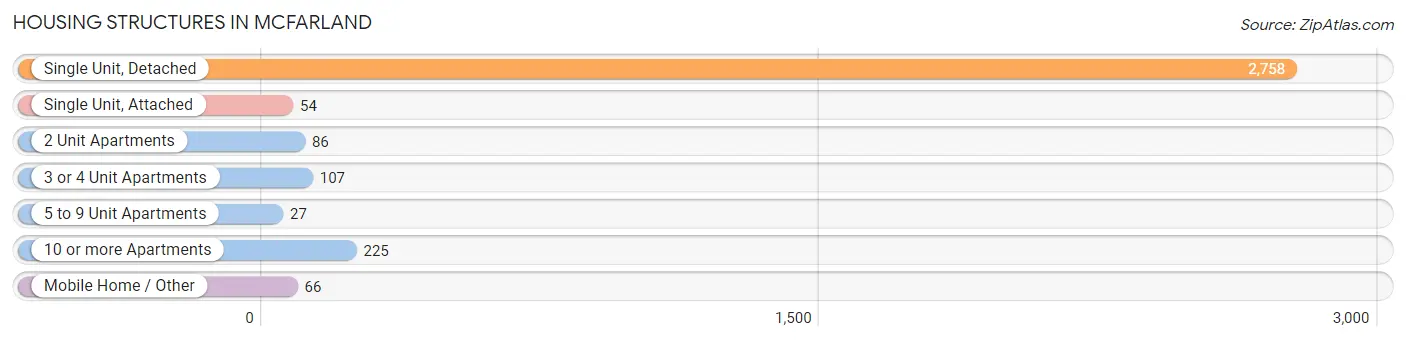
| Structure Type | # Housing Units | % Housing Units |
| Single Unit, Detached | 2,758 | 83.0% |
| Single Unit, Attached | 54 | 1.6% |
| 2 Unit Apartments | 86 | 2.6% |
| 3 or 4 Unit Apartments | 107 | 3.2% |
| 5 to 9 Unit Apartments | 27 | 0.8% |
| 10 or more Apartments | 225 | 6.8% |
| Mobile Home / Other | 66 | 2.0% |
| Total | 3,323 | 100.0% |
Housing Structures by Occupancy in McFarland
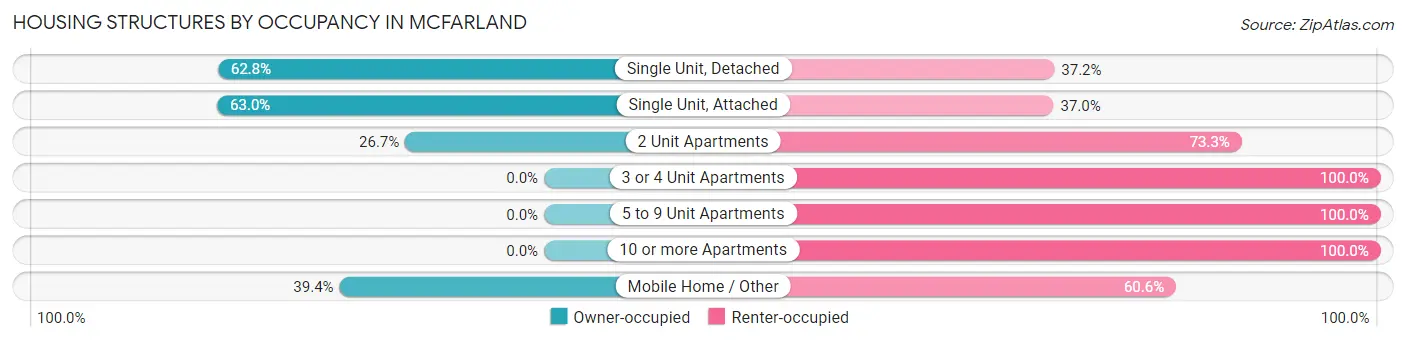
| Structure Type | Owner-occupied | Renter-occupied |
| Single Unit, Detached | 1,732 (62.8%) | 1,026 (37.2%) |
| Single Unit, Attached | 34 (63.0%) | 20 (37.0%) |
| 2 Unit Apartments | 23 (26.7%) | 63 (73.3%) |
| 3 or 4 Unit Apartments | 0 (0.0%) | 107 (100.0%) |
| 5 to 9 Unit Apartments | 0 (0.0%) | 27 (100.0%) |
| 10 or more Apartments | 0 (0.0%) | 225 (100.0%) |
| Mobile Home / Other | 26 (39.4%) | 40 (60.6%) |
| Total | 1,815 (54.6%) | 1,508 (45.4%) |
Housing Structures by Number of Rooms in McFarland
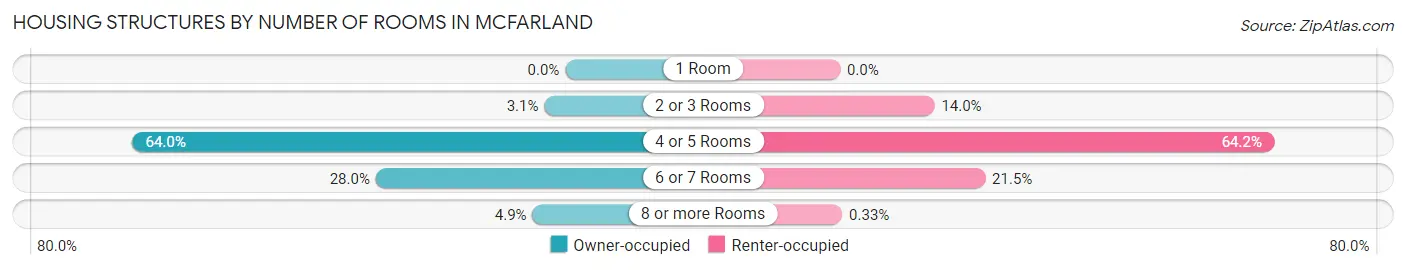
| Number of Rooms | Owner-occupied | Renter-occupied |
| 1 Room | 0 (0.0%) | 0 (0.0%) |
| 2 or 3 Rooms | 56 (3.1%) | 211 (14.0%) |
| 4 or 5 Rooms | 1,162 (64.0%) | 968 (64.2%) |
| 6 or 7 Rooms | 509 (28.0%) | 324 (21.5%) |
| 8 or more Rooms | 88 (4.9%) | 5 (0.3%) |
| Total | 1,815 (100.0%) | 1,508 (100.0%) |
Housing Structure by Heating Type in McFarland
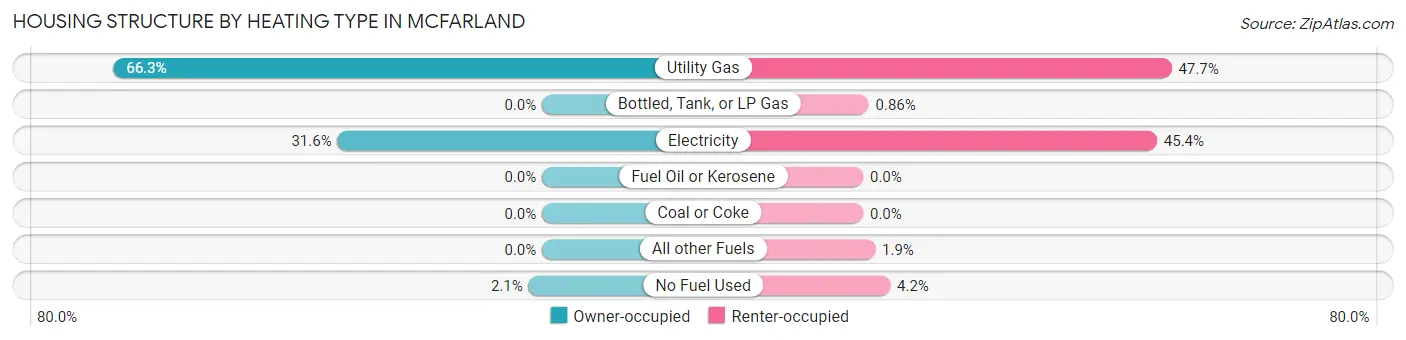
| Heating Type | Owner-occupied | Renter-occupied |
| Utility Gas | 1,203 (66.3%) | 719 (47.7%) |
| Bottled, Tank, or LP Gas | 0 (0.0%) | 13 (0.9%) |
| Electricity | 574 (31.6%) | 685 (45.4%) |
| Fuel Oil or Kerosene | 0 (0.0%) | 0 (0.0%) |
| Coal or Coke | 0 (0.0%) | 0 (0.0%) |
| All other Fuels | 0 (0.0%) | 28 (1.9%) |
| No Fuel Used | 38 (2.1%) | 63 (4.2%) |
| Total | 1,815 (100.0%) | 1,508 (100.0%) |
Household Vehicle Usage in McFarland
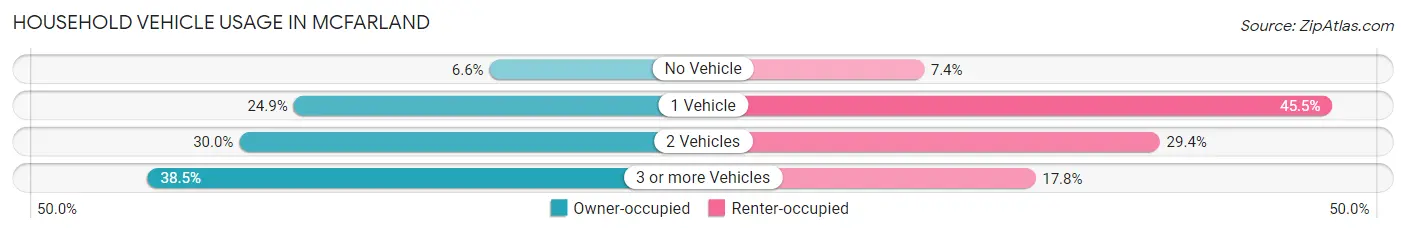
| Vehicles per Household | Owner-occupied | Renter-occupied |
| No Vehicle | 120 (6.6%) | 111 (7.4%) |
| 1 Vehicle | 452 (24.9%) | 686 (45.5%) |
| 2 Vehicles | 544 (30.0%) | 443 (29.4%) |
| 3 or more Vehicles | 699 (38.5%) | 268 (17.8%) |
| Total | 1,815 (100.0%) | 1,508 (100.0%) |
Real Estate & Mortgages in McFarland
Real Estate and Mortgage Overview in McFarland
| Characteristic | Without Mortgage | With Mortgage |
| Housing Units | 718 | 1,097 |
| Median Property Value | $218,600 | $244,300 |
| Median Household Income | $36,058 | $104 |
| Monthly Housing Costs | $416 | $28 |
| Real Estate Taxes | $1,414 | $30 |
Property Value by Mortgage Status in McFarland
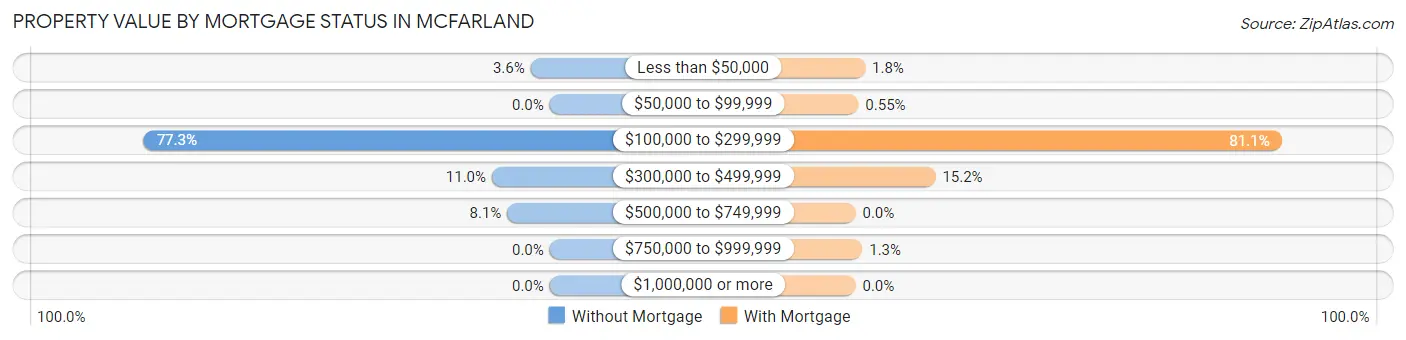
| Property Value | Without Mortgage | With Mortgage |
| Less than $50,000 | 26 (3.6%) | 20 (1.8%) |
| $50,000 to $99,999 | 0 (0.0%) | 6 (0.5%) |
| $100,000 to $299,999 | 555 (77.3%) | 890 (81.1%) |
| $300,000 to $499,999 | 79 (11.0%) | 167 (15.2%) |
| $500,000 to $749,999 | 58 (8.1%) | 0 (0.0%) |
| $750,000 to $999,999 | 0 (0.0%) | 14 (1.3%) |
| $1,000,000 or more | 0 (0.0%) | 0 (0.0%) |
| Total | 718 (100.0%) | 1,097 (100.0%) |
Household Income by Mortgage Status in McFarland
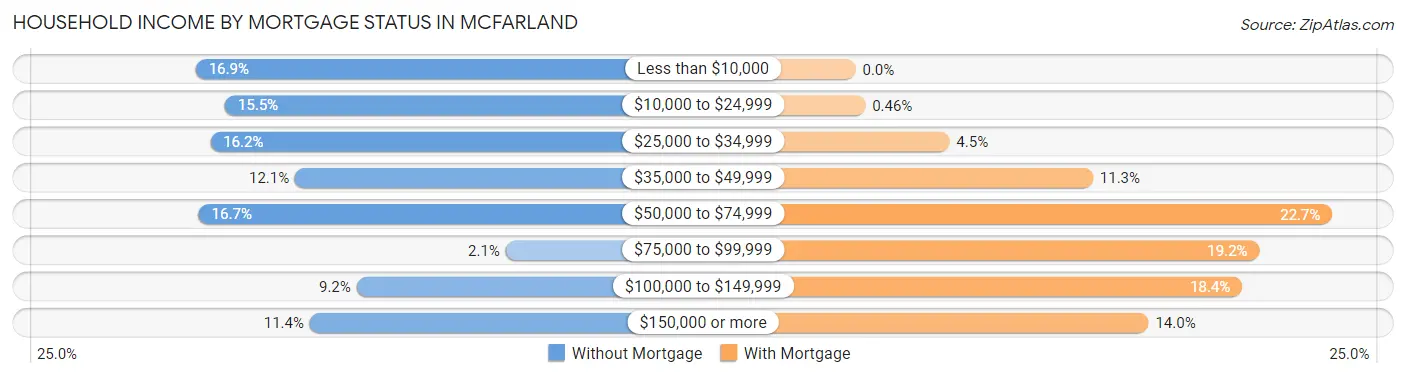
| Household Income | Without Mortgage | With Mortgage |
| Less than $10,000 | 121 (16.9%) | 0 (0.0%) |
| $10,000 to $24,999 | 111 (15.5%) | 5 (0.5%) |
| $25,000 to $34,999 | 116 (16.2%) | 49 (4.5%) |
| $35,000 to $49,999 | 87 (12.1%) | 124 (11.3%) |
| $50,000 to $74,999 | 120 (16.7%) | 249 (22.7%) |
| $75,000 to $99,999 | 15 (2.1%) | 211 (19.2%) |
| $100,000 to $149,999 | 66 (9.2%) | 202 (18.4%) |
| $150,000 or more | 82 (11.4%) | 153 (14.0%) |
| Total | 718 (100.0%) | 1,097 (100.0%) |
Property Value to Household Income Ratio in McFarland
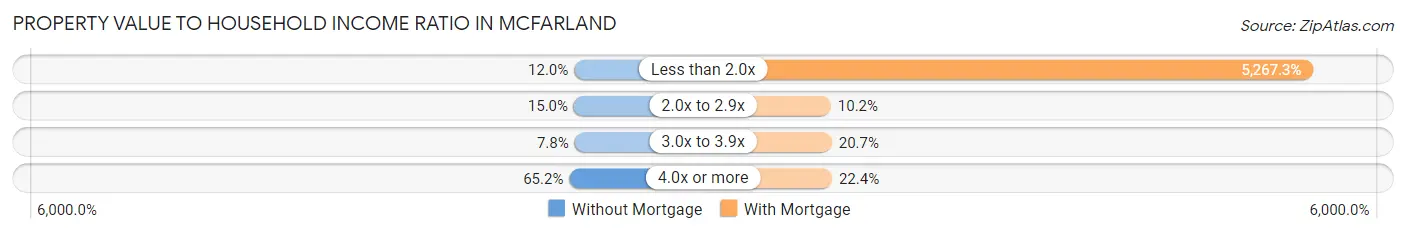
| Value-to-Income Ratio | Without Mortgage | With Mortgage |
| Less than 2.0x | 86 (12.0%) | 57,782 (5,267.3%) |
| 2.0x to 2.9x | 108 (15.0%) | 112 (10.2%) |
| 3.0x to 3.9x | 56 (7.8%) | 227 (20.7%) |
| 4.0x or more | 468 (65.2%) | 246 (22.4%) |
| Total | 718 (100.0%) | 1,097 (100.0%) |
Real Estate Taxes by Mortgage Status in McFarland
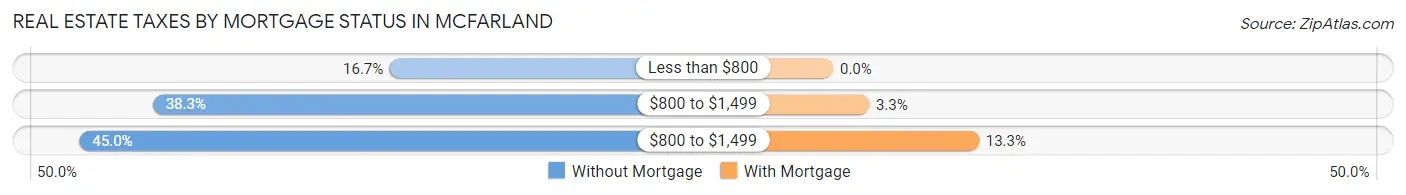
| Property Taxes | Without Mortgage | With Mortgage |
| Less than $800 | 120 (16.7%) | 0 (0.0%) |
| $800 to $1,499 | 275 (38.3%) | 36 (3.3%) |
| $800 to $1,499 | 323 (45.0%) | 146 (13.3%) |
| Total | 718 (100.0%) | 1,097 (100.0%) |
Health & Disability in McFarland
Health Insurance Coverage by Age in McFarland
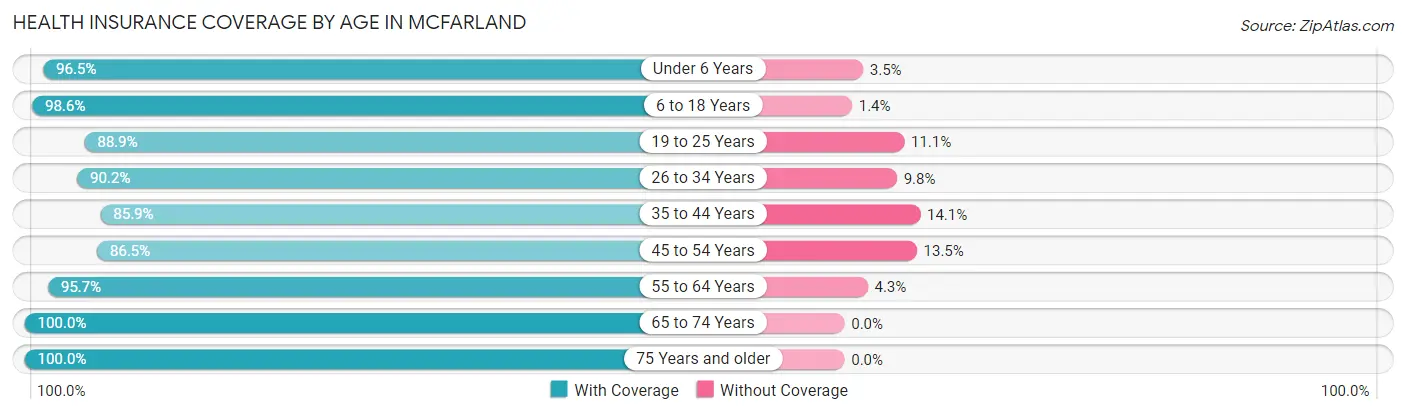
| Age Bracket | With Coverage | Without Coverage |
| Under 6 Years | 1,228 (96.5%) | 44 (3.5%) |
| 6 to 18 Years | 3,882 (98.6%) | 55 (1.4%) |
| 19 to 25 Years | 1,603 (88.9%) | 201 (11.1%) |
| 26 to 34 Years | 1,300 (90.2%) | 141 (9.8%) |
| 35 to 44 Years | 1,702 (85.9%) | 280 (14.1%) |
| 45 to 54 Years | 1,046 (86.5%) | 163 (13.5%) |
| 55 to 64 Years | 817 (95.7%) | 37 (4.3%) |
| 65 to 74 Years | 567 (100.0%) | 0 (0.0%) |
| 75 Years and older | 248 (100.0%) | 0 (0.0%) |
| Total | 12,393 (93.1%) | 921 (6.9%) |
Health Insurance Coverage by Citizenship Status in McFarland
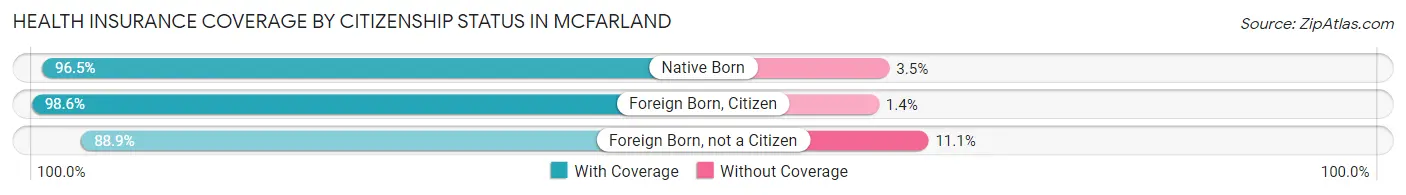
| Citizenship Status | With Coverage | Without Coverage |
| Native Born | 1,228 (96.5%) | 44 (3.5%) |
| Foreign Born, Citizen | 3,882 (98.6%) | 55 (1.4%) |
| Foreign Born, not a Citizen | 1,603 (88.9%) | 201 (11.1%) |
Health Insurance Coverage by Household Income in McFarland
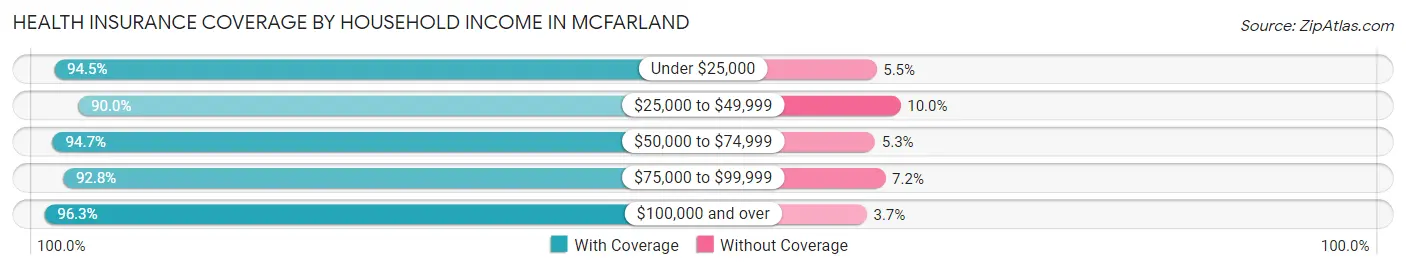
| Household Income | With Coverage | Without Coverage |
| Under $25,000 | 1,881 (94.5%) | 110 (5.5%) |
| $25,000 to $49,999 | 3,964 (90.0%) | 442 (10.0%) |
| $50,000 to $74,999 | 2,667 (94.7%) | 148 (5.3%) |
| $75,000 to $99,999 | 1,884 (92.8%) | 146 (7.2%) |
| $100,000 and over | 1,953 (96.3%) | 75 (3.7%) |
Public vs Private Health Insurance Coverage by Age in McFarland
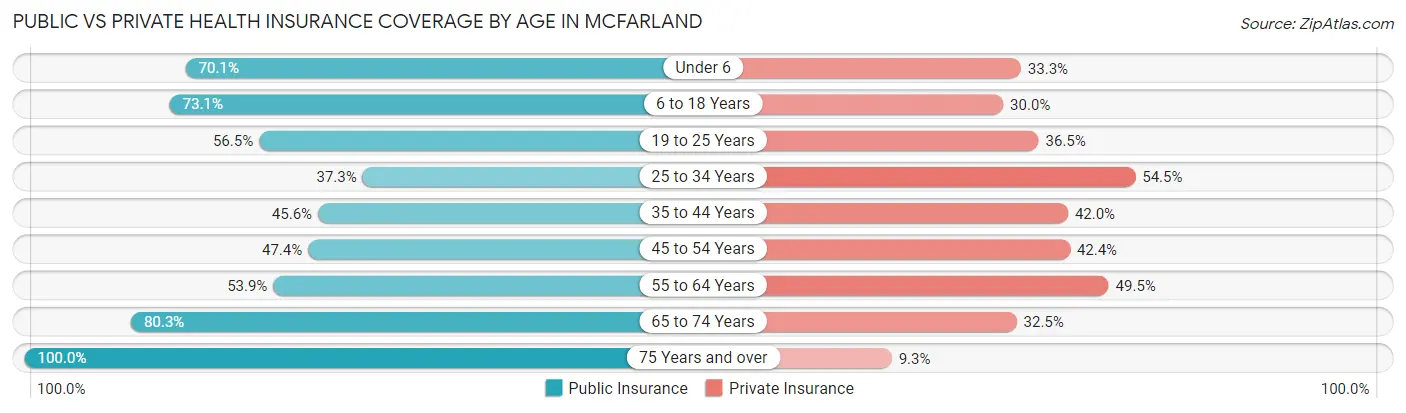
| Age Bracket | Public Insurance | Private Insurance |
| Under 6 | 892 (70.1%) | 423 (33.3%) |
| 6 to 18 Years | 2,877 (73.1%) | 1,179 (29.9%) |
| 19 to 25 Years | 1,019 (56.5%) | 659 (36.5%) |
| 25 to 34 Years | 537 (37.3%) | 785 (54.5%) |
| 35 to 44 Years | 903 (45.6%) | 832 (42.0%) |
| 45 to 54 Years | 573 (47.4%) | 512 (42.3%) |
| 55 to 64 Years | 460 (53.9%) | 423 (49.5%) |
| 65 to 74 Years | 455 (80.2%) | 184 (32.5%) |
| 75 Years and over | 248 (100.0%) | 23 (9.3%) |
| Total | 7,964 (59.8%) | 5,020 (37.7%) |
Disability Status by Sex by Age in McFarland
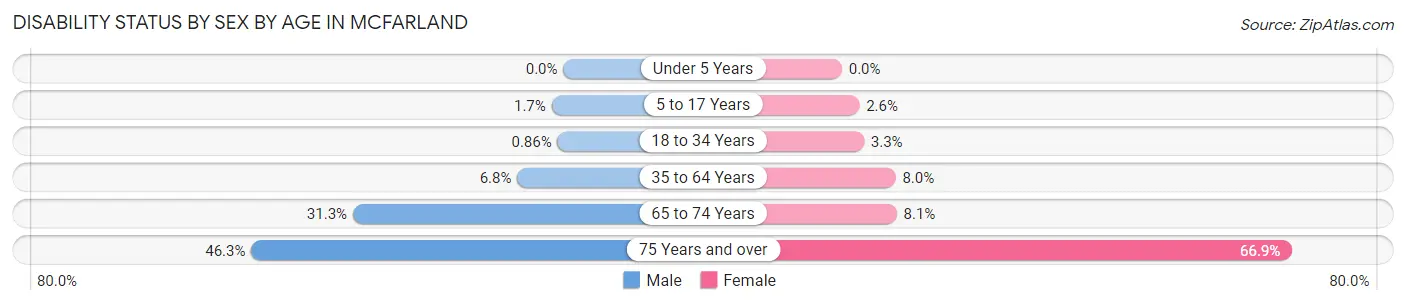
| Age Bracket | Male | Female |
| Under 5 Years | 0 (0.0%) | 0 (0.0%) |
| 5 to 17 Years | 33 (1.7%) | 51 (2.6%) |
| 18 to 34 Years | 16 (0.9%) | 56 (3.3%) |
| 35 to 64 Years | 124 (6.8%) | 178 (8.0%) |
| 65 to 74 Years | 85 (31.2%) | 24 (8.1%) |
| 75 Years and over | 38 (46.3%) | 111 (66.9%) |
Disability Class by Sex by Age in McFarland
Disability Class: Hearing Difficulty
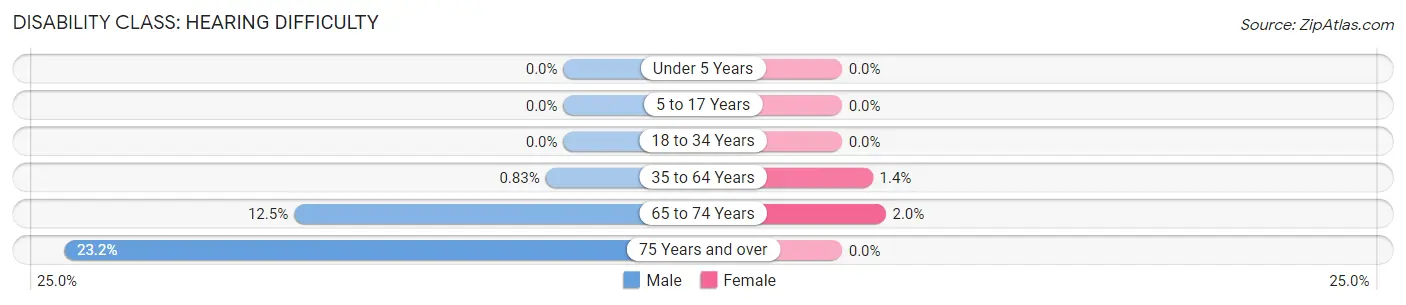
| Age Bracket | Male | Female |
| Under 5 Years | 0 (0.0%) | 0 (0.0%) |
| 5 to 17 Years | 0 (0.0%) | 0 (0.0%) |
| 18 to 34 Years | 0 (0.0%) | 0 (0.0%) |
| 35 to 64 Years | 15 (0.8%) | 32 (1.4%) |
| 65 to 74 Years | 34 (12.5%) | 6 (2.0%) |
| 75 Years and over | 19 (23.2%) | 0 (0.0%) |
Disability Class: Vision Difficulty
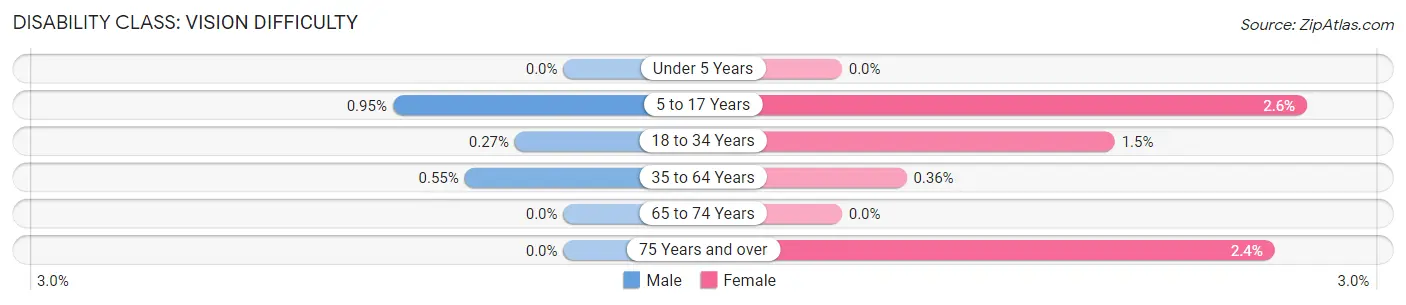
| Age Bracket | Male | Female |
| Under 5 Years | 0 (0.0%) | 0 (0.0%) |
| 5 to 17 Years | 18 (0.9%) | 51 (2.6%) |
| 18 to 34 Years | 5 (0.3%) | 26 (1.5%) |
| 35 to 64 Years | 10 (0.5%) | 8 (0.4%) |
| 65 to 74 Years | 0 (0.0%) | 0 (0.0%) |
| 75 Years and over | 0 (0.0%) | 4 (2.4%) |
Disability Class: Cognitive Difficulty
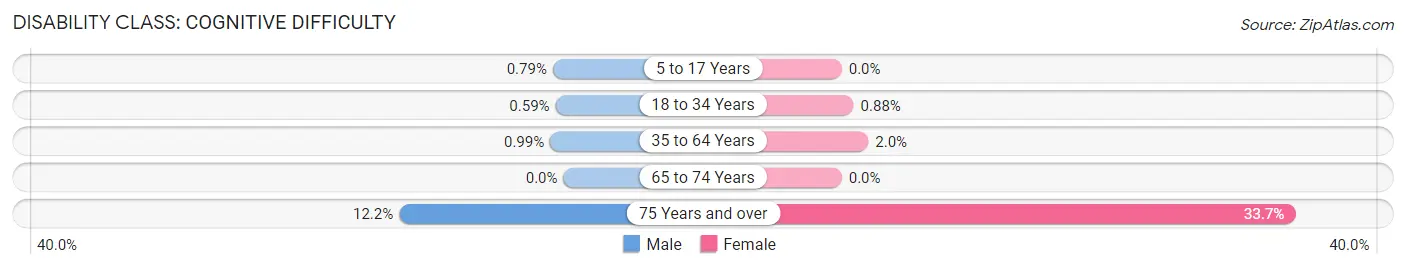
| Age Bracket | Male | Female |
| 5 to 17 Years | 15 (0.8%) | 0 (0.0%) |
| 18 to 34 Years | 11 (0.6%) | 15 (0.9%) |
| 35 to 64 Years | 18 (1.0%) | 44 (2.0%) |
| 65 to 74 Years | 0 (0.0%) | 0 (0.0%) |
| 75 Years and over | 10 (12.2%) | 56 (33.7%) |
Disability Class: Ambulatory Difficulty
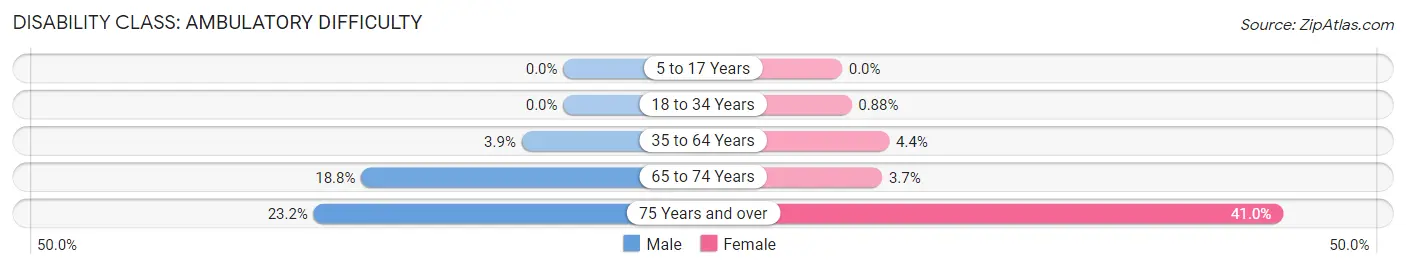
| Age Bracket | Male | Female |
| 5 to 17 Years | 0 (0.0%) | 0 (0.0%) |
| 18 to 34 Years | 0 (0.0%) | 15 (0.9%) |
| 35 to 64 Years | 70 (3.9%) | 98 (4.4%) |
| 65 to 74 Years | 51 (18.8%) | 11 (3.7%) |
| 75 Years and over | 19 (23.2%) | 68 (41.0%) |
Disability Class: Self-Care Difficulty
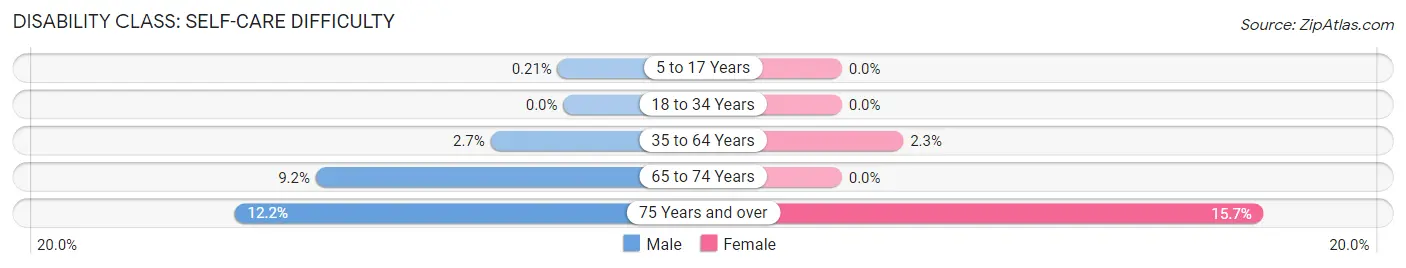
| Age Bracket | Male | Female |
| 5 to 17 Years | 4 (0.2%) | 0 (0.0%) |
| 18 to 34 Years | 0 (0.0%) | 0 (0.0%) |
| 35 to 64 Years | 49 (2.7%) | 51 (2.3%) |
| 65 to 74 Years | 25 (9.2%) | 0 (0.0%) |
| 75 Years and over | 10 (12.2%) | 26 (15.7%) |
Technology Access in McFarland
Computing Device Access in McFarland
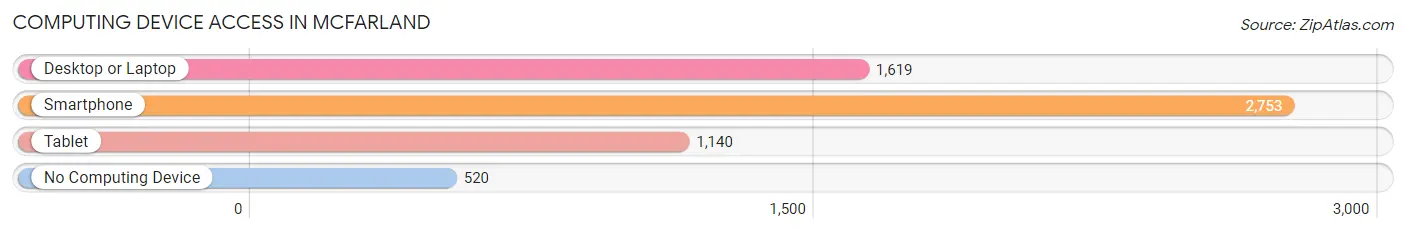
| Device Type | # Households | % Households |
| Desktop or Laptop | 1,619 | 48.7% |
| Smartphone | 2,753 | 82.9% |
| Tablet | 1,140 | 34.3% |
| No Computing Device | 520 | 15.7% |
| Total | 3,323 | 100.0% |
Internet Access in McFarland
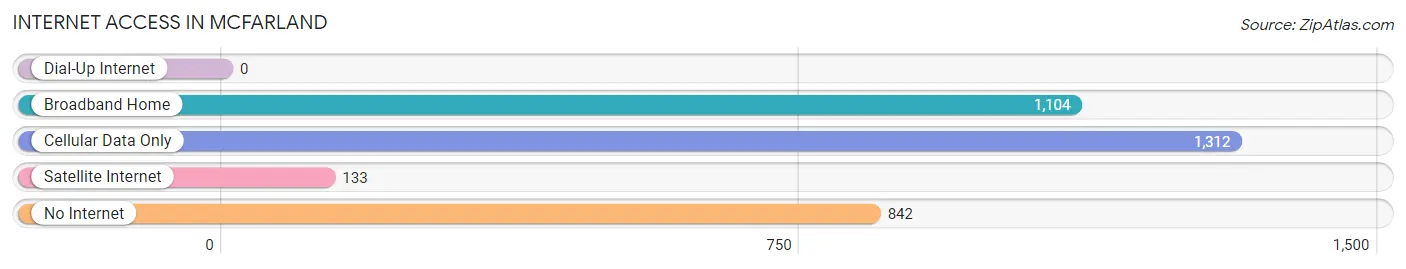
| Internet Type | # Households | % Households |
| Dial-Up Internet | 0 | 0.0% |
| Broadband Home | 1,104 | 33.2% |
| Cellular Data Only | 1,312 | 39.5% |
| Satellite Internet | 133 | 4.0% |
| No Internet | 842 | 25.3% |
| Total | 3,323 | 100.0% |
McFarland Summary
McFarland, California is a small city located in Kern County, California. It is situated in the San Joaquin Valley, approximately 8 miles north of the city of Bakersfield. The city has a population of approximately 13,000 people and is known for its agricultural production, particularly of grapes and almonds.
History
McFarland was founded in 1906 by John McFarland, a rancher from Missouri. He purchased land in the area and began to develop it for agricultural production. The town was originally called McFarlandville, but the name was changed to McFarland in 1910.
The city was incorporated in 1951 and has since grown to become a major agricultural center in the San Joaquin Valley. The city is home to a number of large agricultural companies, including the McFarland-based Delano Farms Company, which is one of the largest grape producers in the United States.
Geography
McFarland is located in the San Joaquin Valley, approximately 8 miles north of Bakersfield. The city is situated at an elevation of approximately 300 feet above sea level. The city is surrounded by agricultural land, with the Kern River to the east and the Sierra Nevada Mountains to the west.
The climate in McFarland is semi-arid, with hot summers and mild winters. The average annual temperature is approximately 70 degrees Fahrenheit. The average annual precipitation is approximately 8 inches.
Economy
McFarland’s economy is largely based on agriculture. The city is home to a number of large agricultural companies, including the Delano Farms Company, which is one of the largest grape producers in the United States. Other major agricultural products produced in the area include almonds, pistachios, and cotton.
The city is also home to a number of small businesses, including restaurants, retail stores, and service providers. The city is also home to a number of manufacturing companies, including a plant that produces plastic containers.
Demographics
As of the 2010 census, the population of McFarland was 13,049. The racial makeup of the city was 68.3% White, 0.7% African American, 0.7% Native American, 0.7% Asian, 0.1% Pacific Islander, 25.3% from other races, and 4.2% from two or more races. Hispanic or Latino of any race were 51.2% of the population.
The median household income in McFarland was $37,917, and the median family income was $41,917. The per capita income for the city was $14,917. About 20.3% of families and 24.2% of the population were below the poverty line, including 33.3% of those under age 18 and 11.2% of those age 65 or over.
McFarland is a small city with a rich history and a vibrant economy. The city is home to a number of large agricultural companies, as well as a number of small businesses. The city has a diverse population, with a majority of the population being of Hispanic or Latino descent. The city is a great place to live and work, and is a great example of the agricultural production that is so important to the San Joaquin Valley.
Common Questions
What is Per Capita Income in McFarland?
Per Capita income in McFarland is $14,419.
What is the Median Family Income in McFarland?
Median Family Income in McFarland is $44,101.
What is the Median Household income in McFarland?
Median Household Income in McFarland is $42,641.
What is Income or Wage Gap in McFarland?
Income or Wage Gap in McFarland is 26.0%.
Women in McFarland earn 74.0 cents for every dollar earned by a man.
What is Family Income Deficit in McFarland?
Family Income Deficit in McFarland is $10,928.
Families that are below poverty line in McFarland earn $10,928 less on average than the poverty threshold level.
What is Inequality or Gini Index in McFarland?
Inequality or Gini Index in McFarland is 0.40.
What is the Total Population of McFarland?
Total Population of McFarland is 13,971.
What is the Total Male Population of McFarland?
Total Male Population of McFarland is 7,149.
What is the Total Female Population of McFarland?
Total Female Population of McFarland is 6,822.
What is the Ratio of Males per 100 Females in McFarland?
There are 104.79 Males per 100 Females in McFarland.
What is the Ratio of Females per 100 Males in McFarland?
There are 95.43 Females per 100 Males in McFarland.
What is the Median Population Age in McFarland?
Median Population Age in McFarland is 25.4 Years.
What is the Average Family Size in McFarland
Average Family Size in McFarland is 4.4 People.
What is the Average Household Size in McFarland
Average Household Size in McFarland is 4.0 People.
How Large is the Labor Force in McFarland?
There are 5,502 People in the Labor Forcein in McFarland.
What is the Percentage of People in the Labor Force in McFarland?
57.1% of People are in the Labor Force in McFarland.
What is the Unemployment Rate in McFarland?
Unemployment Rate in McFarland is 6.4%.