Mccloud, CA Map & Demographics
Mccloud Map
Mccloud Overview
$32,474
PER CAPITA INCOME
$56,875
AVG FAMILY INCOME
$42,500
AVG HOUSEHOLD INCOME
0.45
INEQUALITY / GINI INDEX
959
TOTAL POPULATION
499
MALE POPULATION
460
FEMALE POPULATION
108.48
MALES / 100 FEMALES
92.18
FEMALES / 100 MALES
50.6
MEDIAN AGE
3.2
AVG FAMILY SIZE
2.2
AVG HOUSEHOLD SIZE
367
LABOR FORCE [ PEOPLE ]
43.5%
PERCENT IN LABOR FORCE
10.4%
UNEMPLOYMENT RATE
Mccloud Zip Codes
Mccloud Area Codes
Income in Mccloud
Income Overview in Mccloud
Per Capita Income in Mccloud is $32,474, while median incomes of families and households are $56,875 and $42,500 respectively.
| Characteristic | Number | Measure |
| Per Capita Income | 959 | $32,474 |
| Median Family Income | 236 | $56,875 |
| Mean Family Income | 236 | $76,783 |
| Median Household Income | 430 | $42,500 |
| Mean Household Income | 430 | $61,225 |
| Income Deficit | 236 | $0 |
| Wage / Income Gap (%) | 959 | 0.00% |
| Wage / Income Gap ($) | 959 | 100.00¢ per $1 |
| Gini / Inequality Index | 959 | 0.45 |
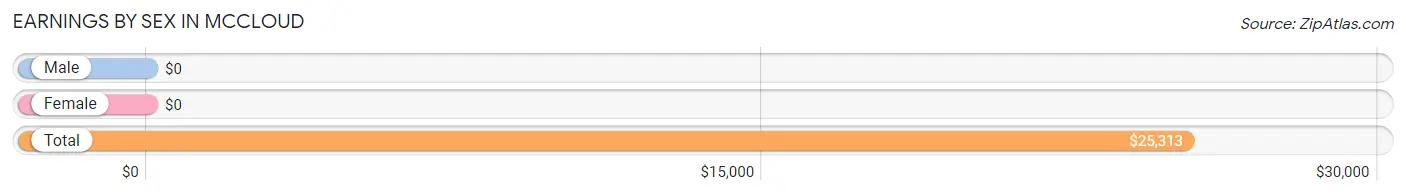
Earnings by Sex in Mccloud
| Sex | Number | Average Earnings |
| Male | 209 (52.2%) | $0 |
| Female | 191 (47.7%) | $0 |
| Total | 400 (100.0%) | $25,313 |
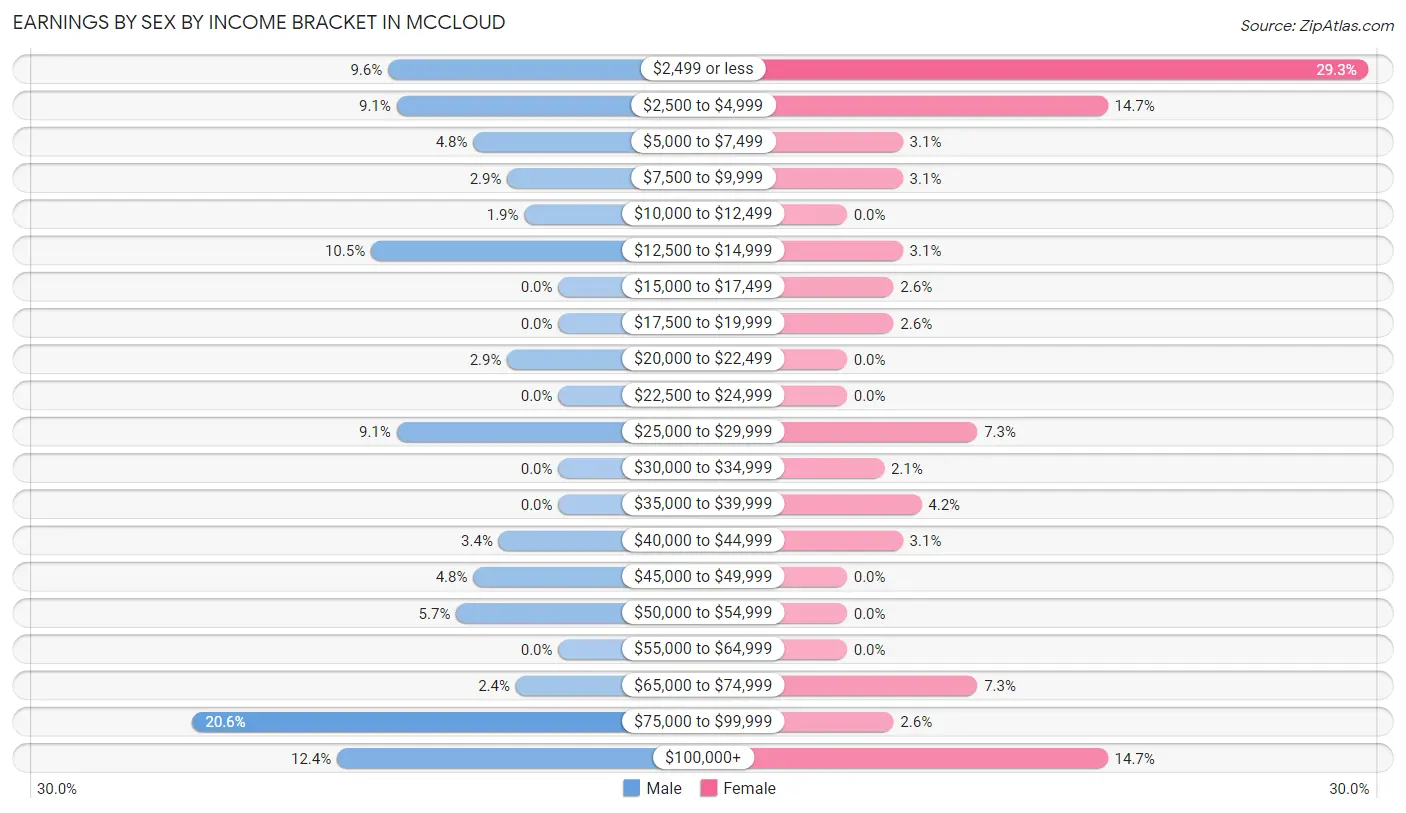
Earnings by Sex by Income Bracket in Mccloud
The most common earnings brackets in Mccloud are $75,000 to $99,999 for men (43 | 20.6%) and $2,499 or less for women (56 | 29.3%).
| Income | Male | Female |
| $2,499 or less | 20 (9.6%) | 56 (29.3%) |
| $2,500 to $4,999 | 19 (9.1%) | 28 (14.7%) |
| $5,000 to $7,499 | 10 (4.8%) | 6 (3.1%) |
| $7,500 to $9,999 | 6 (2.9%) | 6 (3.1%) |
| $10,000 to $12,499 | 4 (1.9%) | 0 (0.0%) |
| $12,500 to $14,999 | 22 (10.5%) | 6 (3.1%) |
| $15,000 to $17,499 | 0 (0.0%) | 5 (2.6%) |
| $17,500 to $19,999 | 0 (0.0%) | 5 (2.6%) |
| $20,000 to $22,499 | 6 (2.9%) | 0 (0.0%) |
| $22,500 to $24,999 | 0 (0.0%) | 0 (0.0%) |
| $25,000 to $29,999 | 19 (9.1%) | 14 (7.3%) |
| $30,000 to $34,999 | 0 (0.0%) | 4 (2.1%) |
| $35,000 to $39,999 | 0 (0.0%) | 8 (4.2%) |
| $40,000 to $44,999 | 7 (3.4%) | 6 (3.1%) |
| $45,000 to $49,999 | 10 (4.8%) | 0 (0.0%) |
| $50,000 to $54,999 | 12 (5.7%) | 0 (0.0%) |
| $55,000 to $64,999 | 0 (0.0%) | 0 (0.0%) |
| $65,000 to $74,999 | 5 (2.4%) | 14 (7.3%) |
| $75,000 to $99,999 | 43 (20.6%) | 5 (2.6%) |
| $100,000+ | 26 (12.4%) | 28 (14.7%) |
| Total | 209 (100.0%) | 191 (100.0%) |
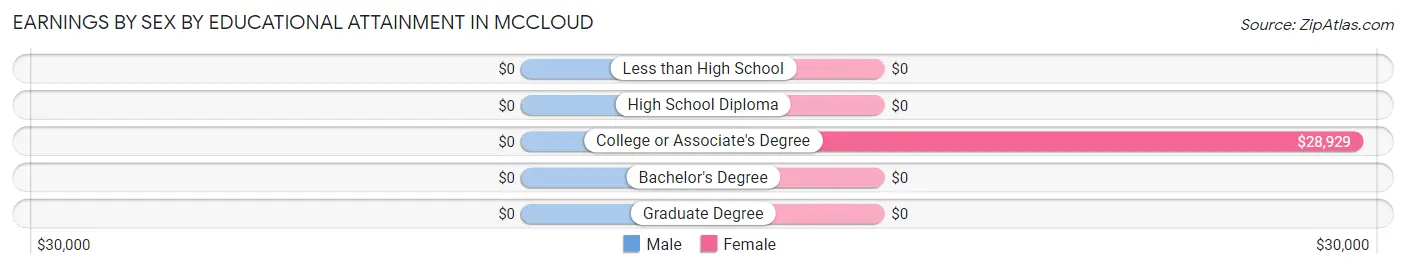
Earnings by Sex by Educational Attainment in Mccloud
| Educational Attainment | Male Income | Female Income |
| Less than High School | - | - |
| High School Diploma | - | - |
| College or Associate's Degree | - | - |
| Bachelor's Degree | - | - |
| Graduate Degree | - | - |
| Total | $42,143 | $35,469 |
Family Income in Mccloud
Family Income Brackets in Mccloud
According to the Mccloud family income data, there are 50 families falling into the $35,000 to $49,999 income range, which is the most common income bracket and makes up 21.2% of all families.
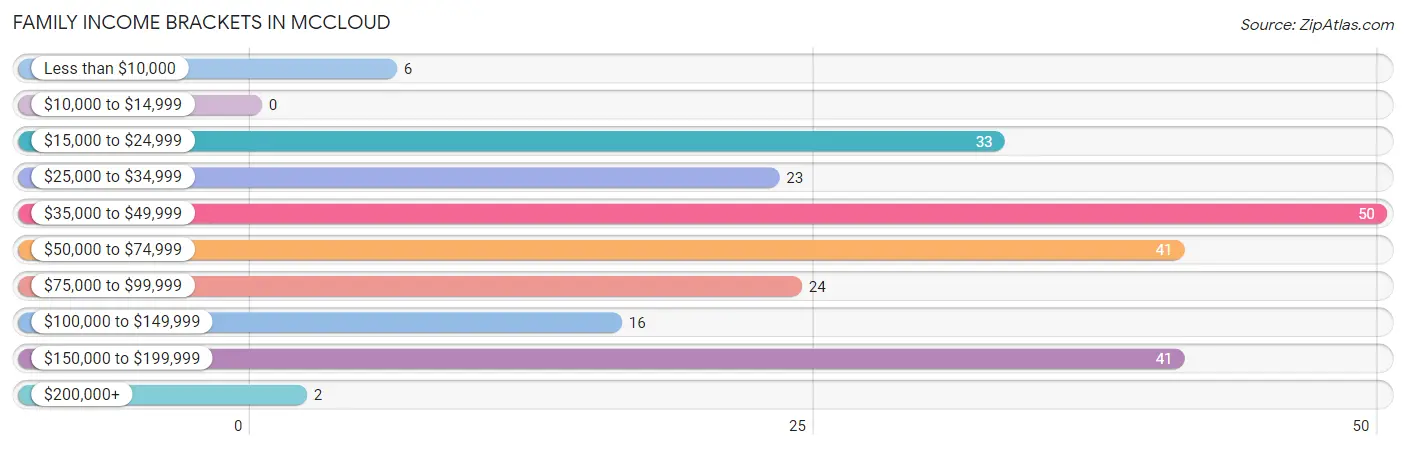
| Income Bracket | # Families | % Families |
| Less than $10,000 | 6 | 2.5% |
| $10,000 to $14,999 | 0 | 0.0% |
| $15,000 to $24,999 | 33 | 14.0% |
| $25,000 to $34,999 | 23 | 9.7% |
| $35,000 to $49,999 | 50 | 21.2% |
| $50,000 to $74,999 | 41 | 17.4% |
| $75,000 to $99,999 | 24 | 10.2% |
| $100,000 to $149,999 | 16 | 6.8% |
| $150,000 to $199,999 | 41 | 17.4% |
| $200,000+ | 2 | 0.8% |
Family Income by Famaliy Size in Mccloud
3-person families (36 | 15.2%) account for the highest median family income in Mccloud with $71,250 per family, while 3-person families (36 | 15.2%) have the highest median income of $23,750 per family member.
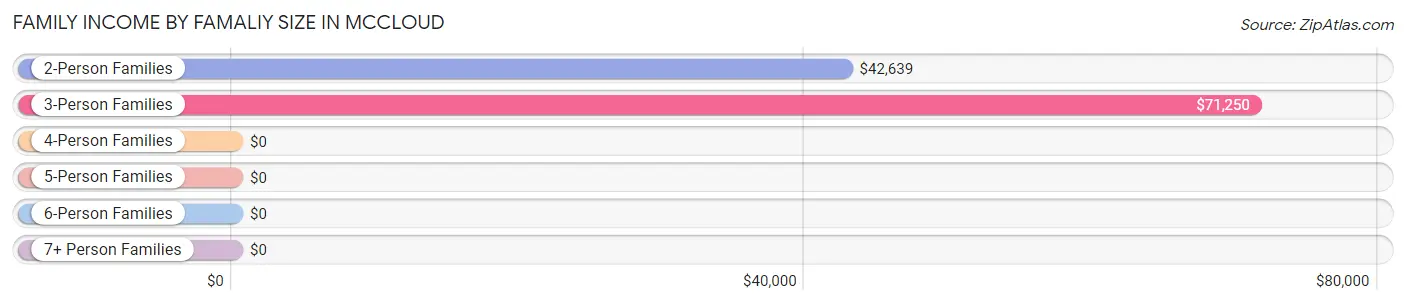
| Income Bracket | # Families | Median Income |
| 2-Person Families | 163 (69.1%) | $42,639 |
| 3-Person Families | 36 (15.2%) | $71,250 |
| 4-Person Families | 14 (5.9%) | $0 |
| 5-Person Families | 12 (5.1%) | $0 |
| 6-Person Families | 11 (4.7%) | $0 |
| 7+ Person Families | 0 (0.0%) | $0 |
| Total | 236 (100.0%) | $56,875 |
Family Income by Number of Earners in Mccloud
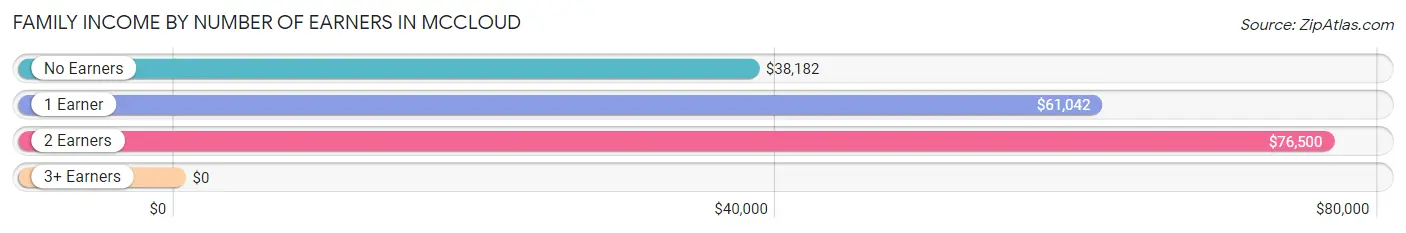
| Number of Earners | # Families | Median Income |
| No Earners | 94 (39.8%) | $38,182 |
| 1 Earner | 81 (34.3%) | $61,042 |
| 2 Earners | 24 (10.2%) | $76,500 |
| 3+ Earners | 37 (15.7%) | $0 |
| Total | 236 (100.0%) | $56,875 |
Household Income in Mccloud
Household Income Brackets in Mccloud
With 79 households falling in the category, the $50,000 to $74,999 income range is the most frequent in Mccloud, accounting for 18.4% of all households. In contrast, only 2 households (0.5%) fall into the $200,000+ income bracket, making it the least populous group.
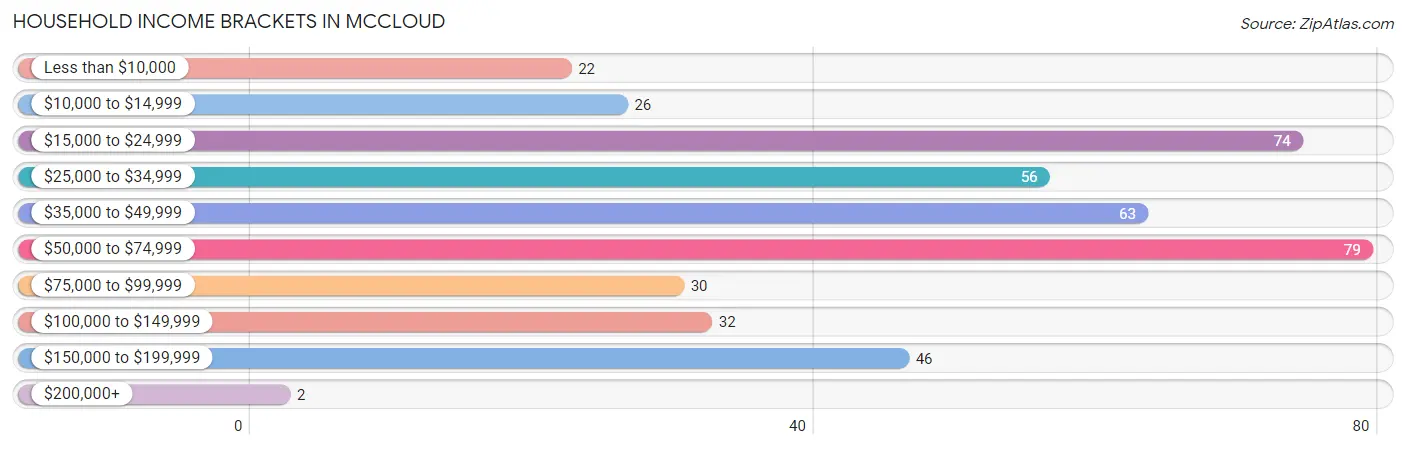
| Income Bracket | # Households | % Households |
| Less than $10,000 | 22 | 5.1% |
| $10,000 to $14,999 | 26 | 6.0% |
| $15,000 to $24,999 | 74 | 17.2% |
| $25,000 to $34,999 | 56 | 13.0% |
| $35,000 to $49,999 | 63 | 14.7% |
| $50,000 to $74,999 | 79 | 18.4% |
| $75,000 to $99,999 | 30 | 7.0% |
| $100,000 to $149,999 | 32 | 7.4% |
| $150,000 to $199,999 | 46 | 10.7% |
| $200,000+ | 2 | 0.5% |
Household Income by Householder Age in Mccloud
The median household income in Mccloud is $42,500, with the highest median household income of $142,969 found in the 25 to 44 years age bracket for the primary householder. A total of 55 households (12.8%) fall into this category.
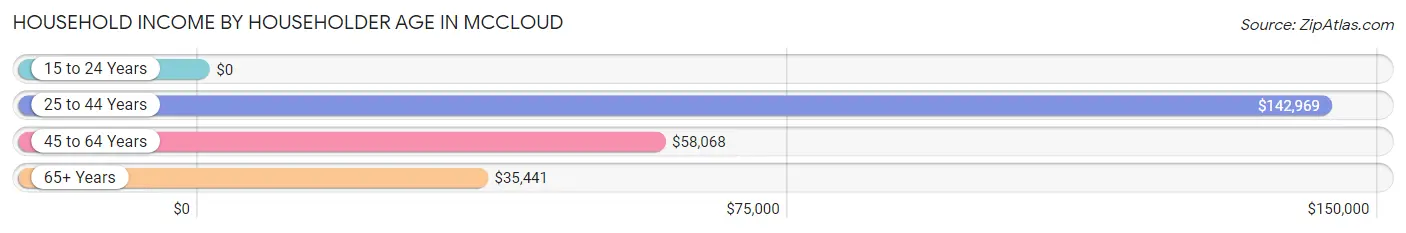
| Income Bracket | # Households | Median Income |
| 15 to 24 Years | 0 (0.0%) | $0 |
| 25 to 44 Years | 55 (12.8%) | $142,969 |
| 45 to 64 Years | 155 (36.0%) | $58,068 |
| 65+ Years | 220 (51.2%) | $35,441 |
| Total | 430 (100.0%) | $42,500 |
Poverty in Mccloud
Income Below Poverty by Sex and Age in Mccloud
With 18.2% poverty level for males and 10.0% for females among the residents of Mccloud, 6 to 11 year old males and 45 to 54 year old females are the most vulnerable to poverty, with 26 males (72.2%) and 16 females (26.7%) in their respective age groups living below the poverty level.
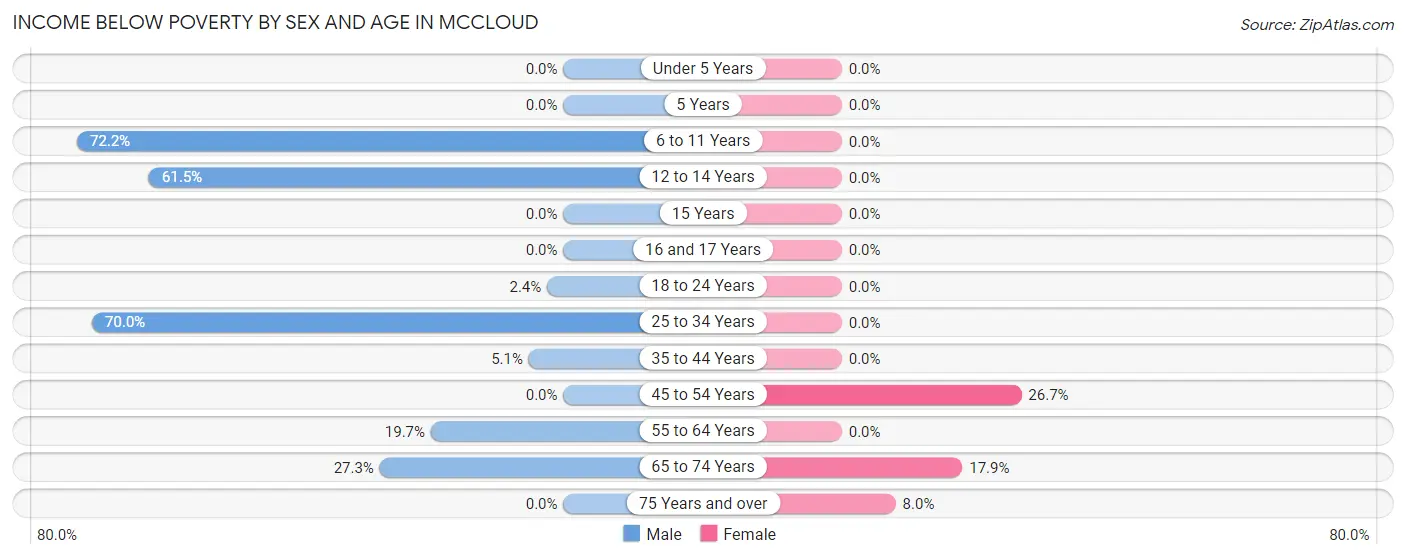
| Age Bracket | Male | Female |
| Under 5 Years | 0 (0.0%) | 0 (0.0%) |
| 5 Years | 0 (0.0%) | 0 (0.0%) |
| 6 to 11 Years | 26 (72.2%) | 0 (0.0%) |
| 12 to 14 Years | 24 (61.5%) | 0 (0.0%) |
| 15 Years | 0 (0.0%) | 0 (0.0%) |
| 16 and 17 Years | 0 (0.0%) | 0 (0.0%) |
| 18 to 24 Years | 2 (2.4%) | 0 (0.0%) |
| 25 to 34 Years | 7 (70.0%) | 0 (0.0%) |
| 35 to 44 Years | 2 (5.1%) | 0 (0.0%) |
| 45 to 54 Years | 0 (0.0%) | 16 (26.7%) |
| 55 to 64 Years | 12 (19.7%) | 0 (0.0%) |
| 65 to 74 Years | 18 (27.3%) | 22 (17.9%) |
| 75 Years and over | 0 (0.0%) | 8 (8.0%) |
| Total | 91 (18.2%) | 46 (10.0%) |
Income Above Poverty by Sex and Age in Mccloud
According to the poverty statistics in Mccloud, males aged 15 years and females aged 6 to 11 years are the age groups that are most secure financially, with 100.0% of males and 100.0% of females in these age groups living above the poverty line.
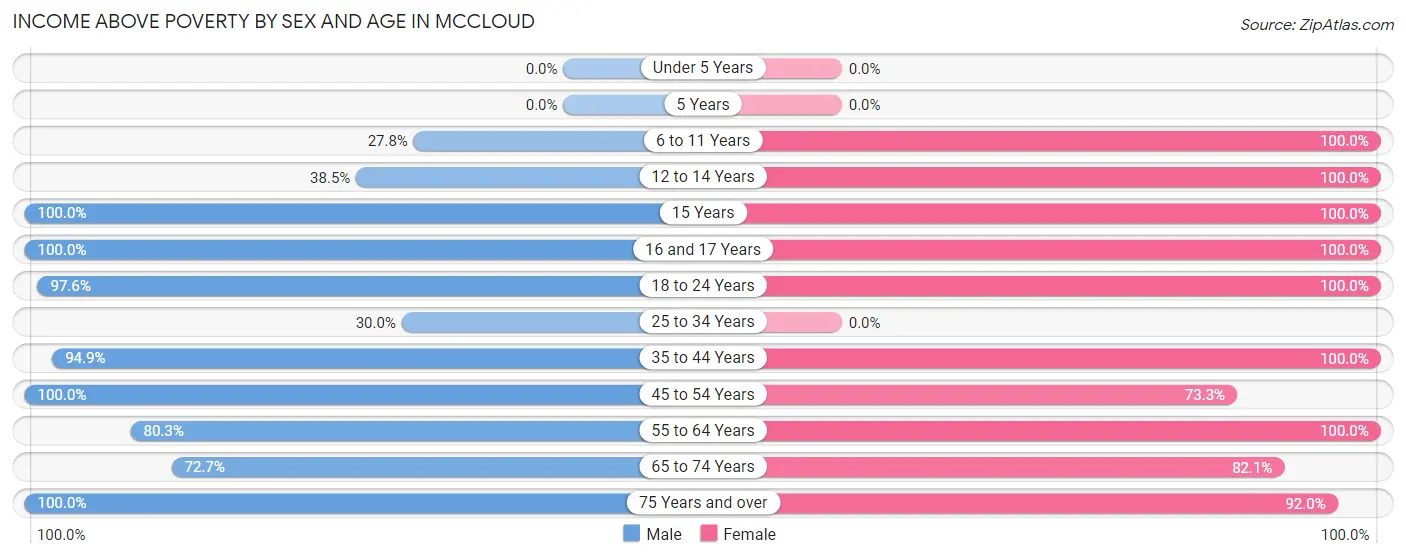
| Age Bracket | Male | Female |
| Under 5 Years | 0 (0.0%) | 0 (0.0%) |
| 5 Years | 0 (0.0%) | 0 (0.0%) |
| 6 to 11 Years | 10 (27.8%) | 14 (100.0%) |
| 12 to 14 Years | 15 (38.5%) | 7 (100.0%) |
| 15 Years | 17 (100.0%) | 3 (100.0%) |
| 16 and 17 Years | 17 (100.0%) | 9 (100.0%) |
| 18 to 24 Years | 81 (97.6%) | 63 (100.0%) |
| 25 to 34 Years | 3 (30.0%) | 0 (0.0%) |
| 35 to 44 Years | 37 (94.9%) | 47 (100.0%) |
| 45 to 54 Years | 69 (100.0%) | 44 (73.3%) |
| 55 to 64 Years | 49 (80.3%) | 34 (100.0%) |
| 65 to 74 Years | 48 (72.7%) | 101 (82.1%) |
| 75 Years and over | 62 (100.0%) | 92 (92.0%) |
| Total | 408 (81.8%) | 414 (90.0%) |
Income Below Poverty Among Married-Couple Families in Mccloud
The poverty statistics for married-couple families in Mccloud show that 8.9% or 16 of the total 179 families live below the poverty line. Families with no children have the highest poverty rate of 13.1%, comprising of 16 families. On the other hand, families with 1 or 2 children have the lowest poverty rate of 0.0%, which includes 0 families.
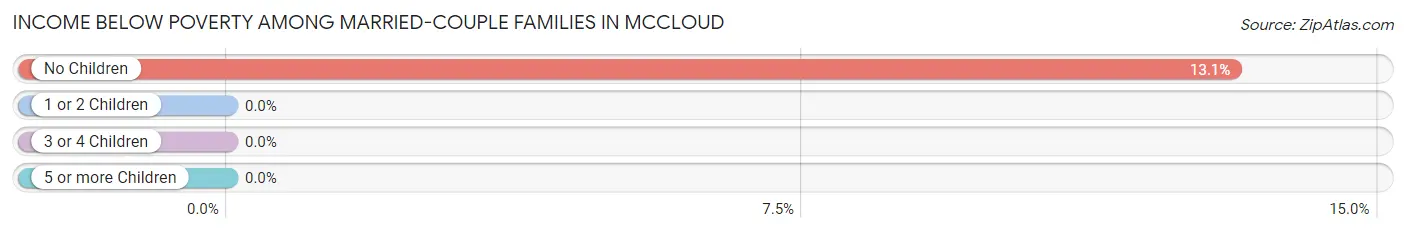
| Children | Above Poverty | Below Poverty |
| No Children | 106 (86.9%) | 16 (13.1%) |
| 1 or 2 Children | 57 (100.0%) | 0 (0.0%) |
| 3 or 4 Children | 0 (0.0%) | 0 (0.0%) |
| 5 or more Children | 0 (0.0%) | 0 (0.0%) |
| Total | 163 (91.1%) | 16 (8.9%) |
Income Below Poverty Among Single-Parent Households in Mccloud
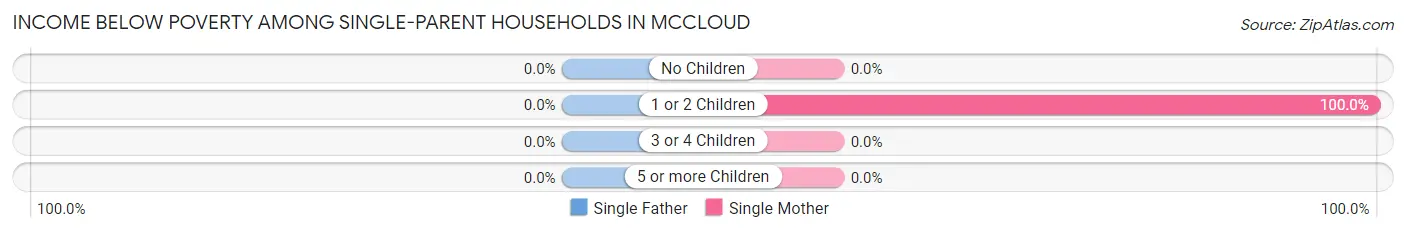
| Children | Single Father | Single Mother |
| No Children | 0 (0.0%) | 0 (0.0%) |
| 1 or 2 Children | 0 (0.0%) | 6 (100.0%) |
| 3 or 4 Children | 0 (0.0%) | 0 (0.0%) |
| 5 or more Children | 0 (0.0%) | 0 (0.0%) |
| Total | 0 (0.0%) | 6 (21.4%) |
Income Below Poverty Among Married-Couple vs Single-Parent Households in Mccloud
The poverty data for Mccloud shows that 16 of the married-couple family households (8.9%) and 6 of the single-parent households (10.5%) are living below the poverty level. Within the married-couple family households, those with no children have the highest poverty rate, with 16 households (13.1%) falling below the poverty line. Among the single-parent households, those with 1 or 2 children have the highest poverty rate, with 6 household (50.0%) living below poverty.
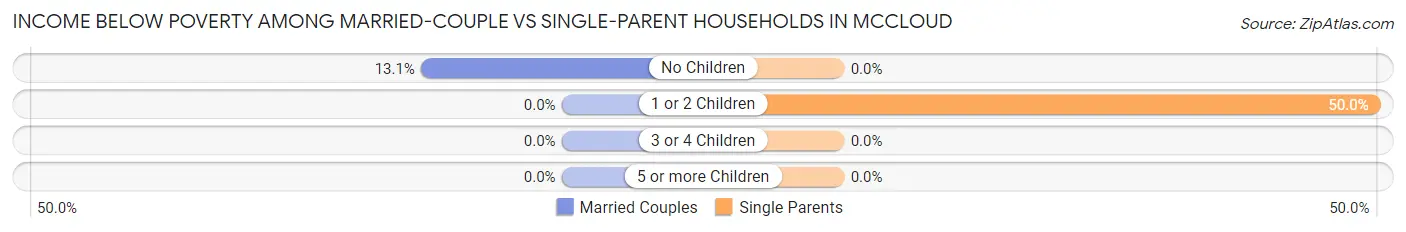
| Children | Married-Couple Families | Single-Parent Households |
| No Children | 16 (13.1%) | 0 (0.0%) |
| 1 or 2 Children | 0 (0.0%) | 6 (50.0%) |
| 3 or 4 Children | 0 (0.0%) | 0 (0.0%) |
| 5 or more Children | 0 (0.0%) | 0 (0.0%) |
| Total | 16 (8.9%) | 6 (10.5%) |
Race in Mccloud
The most populous races in Mccloud are White / Caucasian (813 | 84.8%), Two or more Races (112 | 11.7%), and Hispanic or Latino (62 | 6.5%).
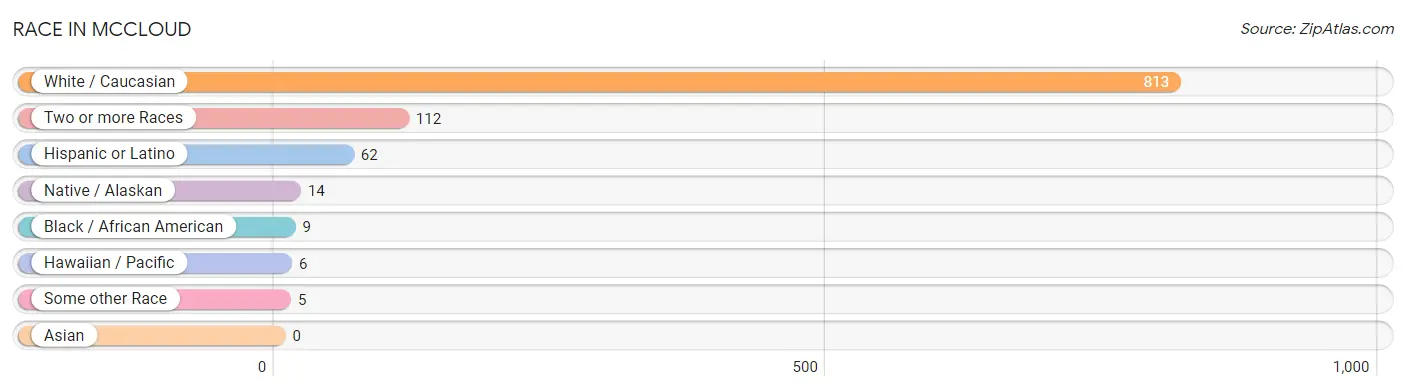
| Race | # Population | % Population |
| Asian | 0 | 0.0% |
| Black / African American | 9 | 0.9% |
| Hawaiian / Pacific | 6 | 0.6% |
| Hispanic or Latino | 62 | 6.5% |
| Native / Alaskan | 14 | 1.5% |
| White / Caucasian | 813 | 84.8% |
| Two or more Races | 112 | 11.7% |
| Some other Race | 5 | 0.5% |
| Total | 959 | 100.0% |
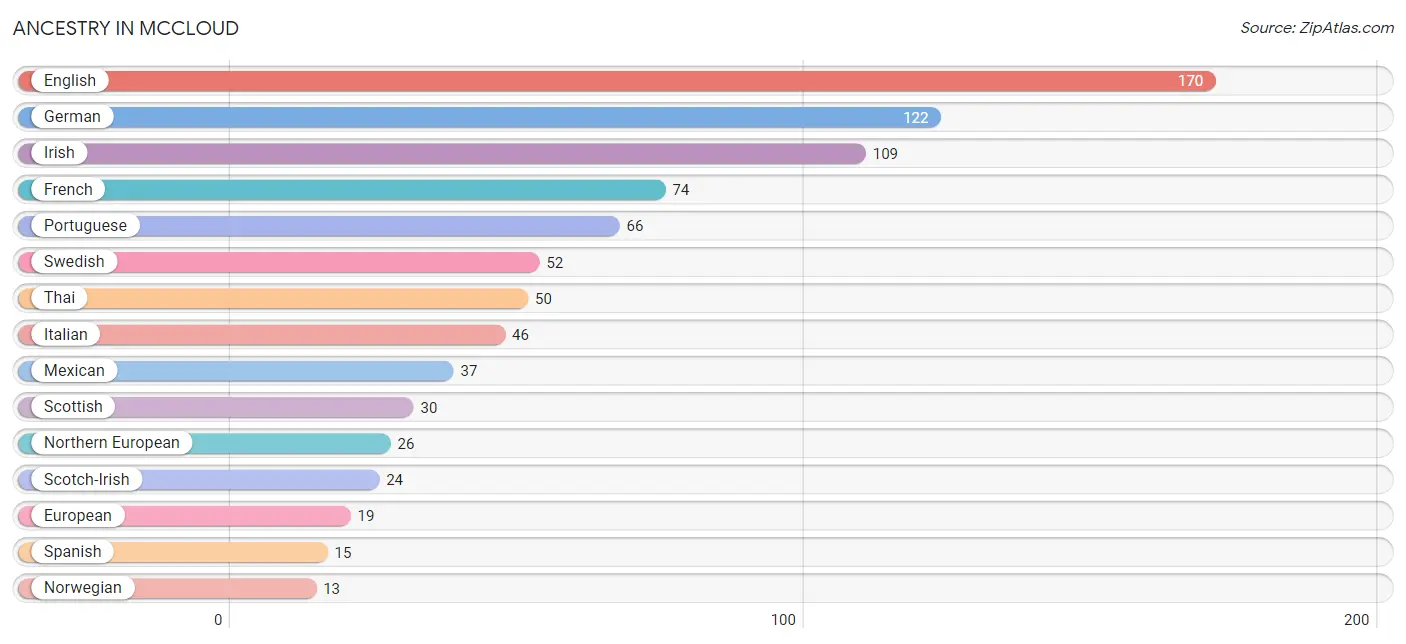
Ancestry in Mccloud
The most populous ancestries reported in Mccloud are English (170 | 17.7%), German (122 | 12.7%), Irish (109 | 11.4%), French (74 | 7.7%), and Portuguese (66 | 6.9%), together accounting for 56.4% of all Mccloud residents.
| Ancestry | # Population | % Population |
| American | 12 | 1.3% |
| Apache | 2 | 0.2% |
| Blackfeet | 1 | 0.1% |
| British | 1 | 0.1% |
| Canadian | 8 | 0.8% |
| Cherokee | 4 | 0.4% |
| Chickasaw | 8 | 0.8% |
| Choctaw | 5 | 0.5% |
| Cuban | 8 | 0.8% |
| Czech | 6 | 0.6% |
| Dutch | 12 | 1.3% |
| English | 170 | 17.7% |
| European | 19 | 2.0% |
| French | 74 | 7.7% |
| German | 122 | 12.7% |
| Indian (Asian) | 4 | 0.4% |
| Irish | 109 | 11.4% |
| Italian | 46 | 4.8% |
| Mexican | 37 | 3.9% |
| Northern European | 26 | 2.7% |
| Norwegian | 13 | 1.4% |
| Polish | 6 | 0.6% |
| Portuguese | 66 | 6.9% |
| Puerto Rican | 2 | 0.2% |
| Scandinavian | 4 | 0.4% |
| Scotch-Irish | 24 | 2.5% |
| Scottish | 30 | 3.1% |
| Spanish | 15 | 1.6% |
| Swedish | 52 | 5.4% |
| Thai | 50 | 5.2% |
| Ukrainian | 5 | 0.5% |
| Yaqui | 3 | 0.3% | View All 32 Rows |
Immigrants in Mccloud
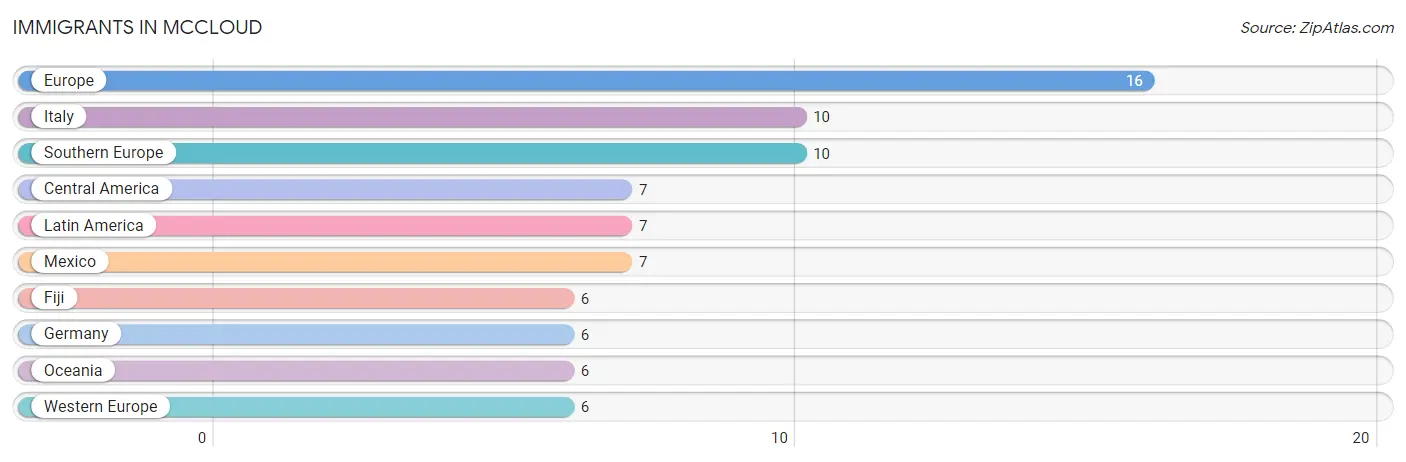
The most numerous immigrant groups reported in Mccloud came from Europe (16 | 1.7%), Italy (10 | 1.0%), Southern Europe (10 | 1.0%), Central America (7 | 0.7%), and Latin America (7 | 0.7%), together accounting for 5.2% of all Mccloud residents.
| Immigration Origin | # Population | % Population |
| Central America | 7 | 0.7% |
| Europe | 16 | 1.7% |
| Fiji | 6 | 0.6% |
| Germany | 6 | 0.6% |
| Italy | 10 | 1.0% |
| Latin America | 7 | 0.7% |
| Mexico | 7 | 0.7% |
| Oceania | 6 | 0.6% |
| Southern Europe | 10 | 1.0% |
| Western Europe | 6 | 0.6% | View All 10 Rows |
Sex and Age in Mccloud
Sex and Age in Mccloud
The most populous age groups in Mccloud are 15 to 19 Years (70 | 14.0%) for men and 15 to 19 Years (75 | 16.3%) for women.
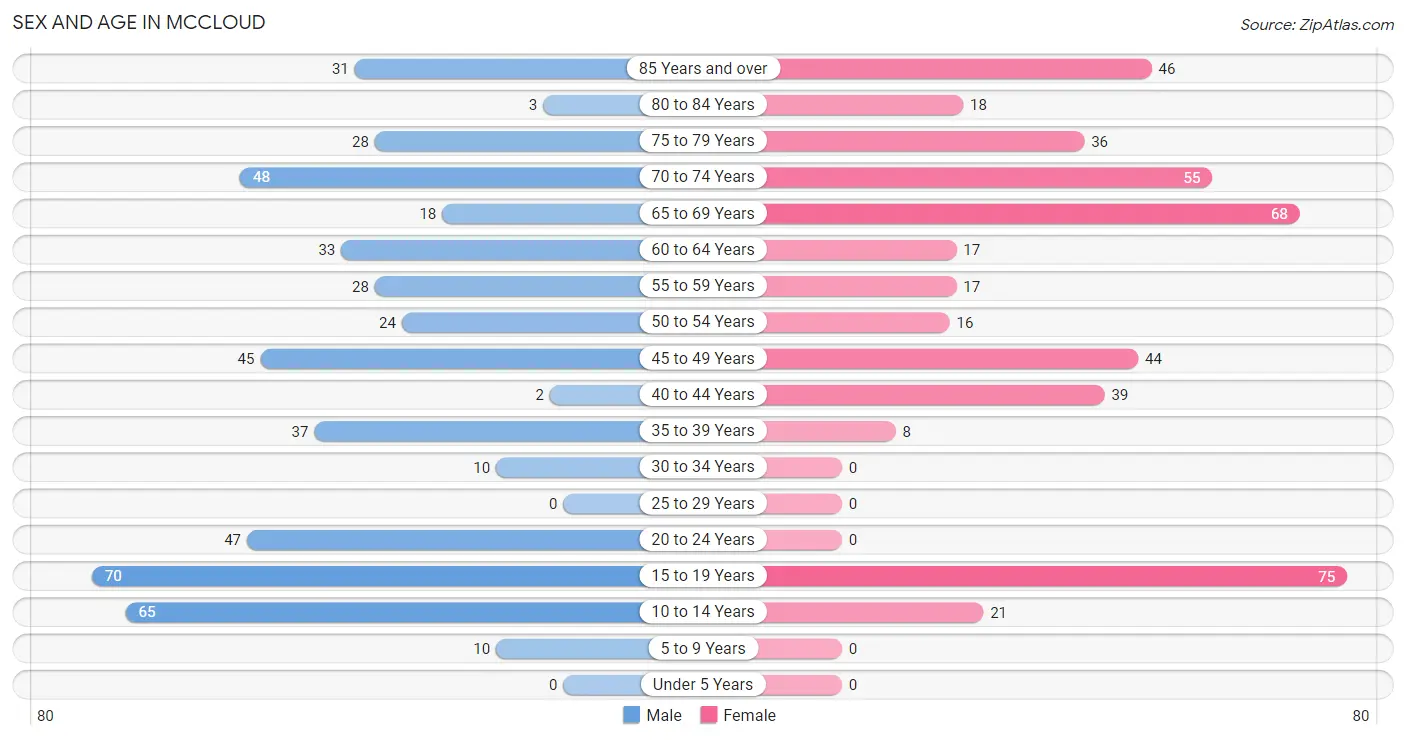
| Age Bracket | Male | Female |
| Under 5 Years | 0 (0.0%) | 0 (0.0%) |
| 5 to 9 Years | 10 (2.0%) | 0 (0.0%) |
| 10 to 14 Years | 65 (13.0%) | 21 (4.6%) |
| 15 to 19 Years | 70 (14.0%) | 75 (16.3%) |
| 20 to 24 Years | 47 (9.4%) | 0 (0.0%) |
| 25 to 29 Years | 0 (0.0%) | 0 (0.0%) |
| 30 to 34 Years | 10 (2.0%) | 0 (0.0%) |
| 35 to 39 Years | 37 (7.4%) | 8 (1.7%) |
| 40 to 44 Years | 2 (0.4%) | 39 (8.5%) |
| 45 to 49 Years | 45 (9.0%) | 44 (9.6%) |
| 50 to 54 Years | 24 (4.8%) | 16 (3.5%) |
| 55 to 59 Years | 28 (5.6%) | 17 (3.7%) |
| 60 to 64 Years | 33 (6.6%) | 17 (3.7%) |
| 65 to 69 Years | 18 (3.6%) | 68 (14.8%) |
| 70 to 74 Years | 48 (9.6%) | 55 (12.0%) |
| 75 to 79 Years | 28 (5.6%) | 36 (7.8%) |
| 80 to 84 Years | 3 (0.6%) | 18 (3.9%) |
| 85 Years and over | 31 (6.2%) | 46 (10.0%) |
| Total | 499 (100.0%) | 460 (100.0%) |
Families and Households in Mccloud
Median Family Size in Mccloud
The median family size in Mccloud is 3.19 persons per family, with single female/mother families (28 | 11.9%) accounting for the largest median family size of 4.25 persons per family. On the other hand, single male/father families (29 | 12.3%) represent the smallest median family size with 2.76 persons per family.
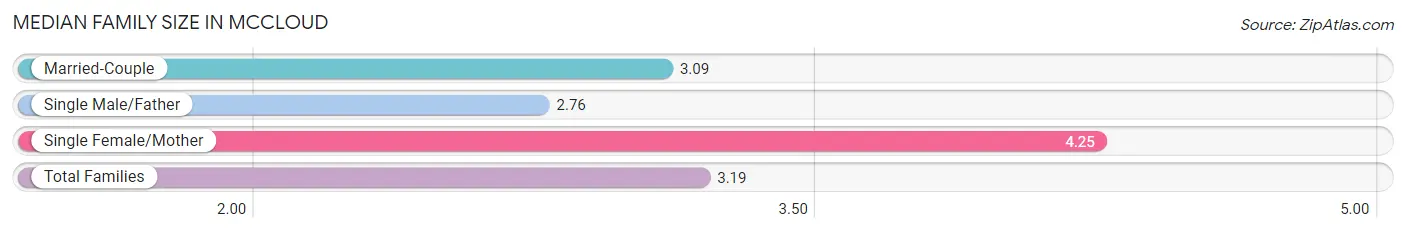
| Family Type | # Families | Family Size |
| Married-Couple | 179 (75.8%) | 3.09 |
| Single Male/Father | 29 (12.3%) | 2.76 |
| Single Female/Mother | 28 (11.9%) | 4.25 |
| Total Families | 236 (100.0%) | 3.19 |
Median Household Size in Mccloud
The median household size in Mccloud is 2.22 persons per household, with single female/mother households (28 | 6.5%) accounting for the largest median household size of 4.25 persons per household. non-family households (194 | 45.1%) represent the smallest median household size with 1.04 persons per household.
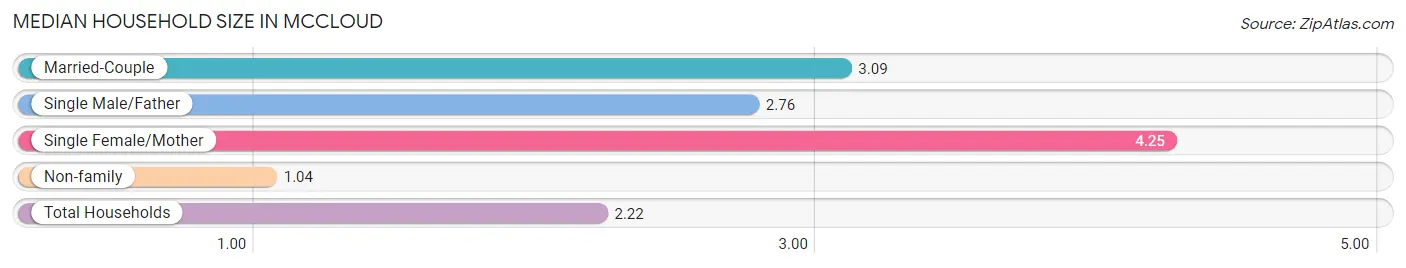
| Household Type | # Households | Household Size |
| Married-Couple | 179 (41.6%) | 3.09 |
| Single Male/Father | 29 (6.7%) | 2.76 |
| Single Female/Mother | 28 (6.5%) | 4.25 |
| Non-family | 194 (45.1%) | 1.04 |
| Total Households | 430 (100.0%) | 2.22 |
Household Size by Marriage Status in Mccloud
Out of a total of 430 households in Mccloud, 236 (54.9%) are family households, while 194 (45.1%) are nonfamily households. The most numerous type of family households are 2-person households, comprising 163, and the most common type of nonfamily households are 1-person households, comprising 189.
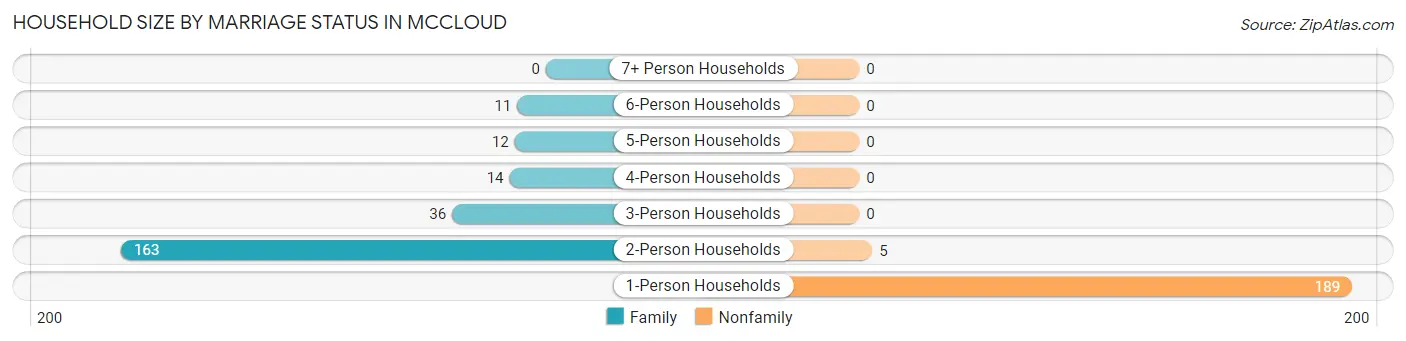
| Household Size | Family Households | Nonfamily Households |
| 1-Person Households | - | 189 (44.0%) |
| 2-Person Households | 163 (37.9%) | 5 (1.2%) |
| 3-Person Households | 36 (8.4%) | 0 (0.0%) |
| 4-Person Households | 14 (3.3%) | 0 (0.0%) |
| 5-Person Households | 12 (2.8%) | 0 (0.0%) |
| 6-Person Households | 11 (2.6%) | 0 (0.0%) |
| 7+ Person Households | 0 (0.0%) | 0 (0.0%) |
| Total | 236 (54.9%) | 194 (45.1%) |
Female Fertility in Mccloud
Fertility by Age in Mccloud
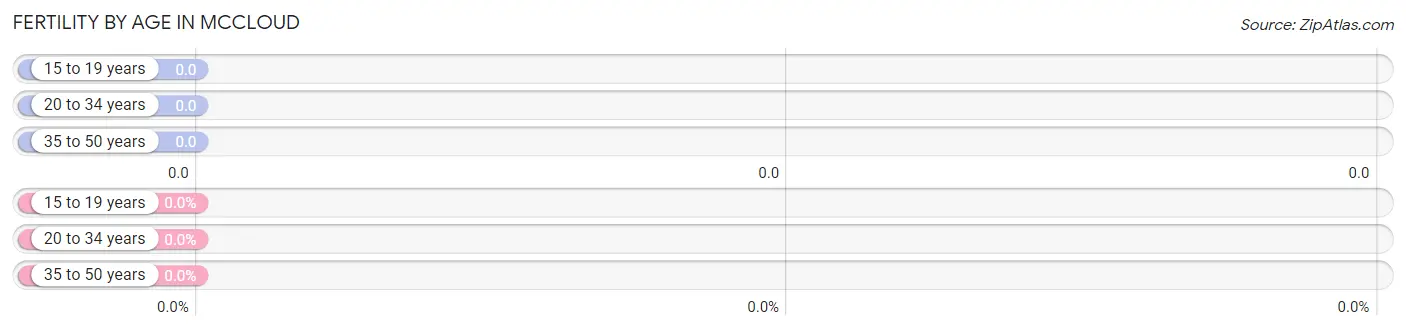
| Age Bracket | Women with Births | Births / 1,000 Women |
| 15 to 19 years | 0 (0.0%) | 0.0 |
| 20 to 34 years | 0 (0.0%) | 0.0 |
| 35 to 50 years | 0 (0.0%) | 0.0 |
| Total | 0 (0.0%) | 0.0 |
Fertility by Age by Marriage Status in Mccloud
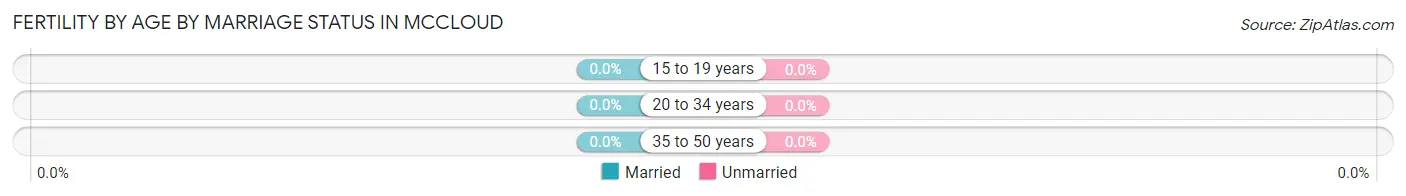
| Age Bracket | Married | Unmarried |
| 15 to 19 years | 0 (0.0%) | 0 (0.0%) |
| 20 to 34 years | 0 (0.0%) | 0 (0.0%) |
| 35 to 50 years | 0 (0.0%) | 0 (0.0%) |
| Total | 0 (0.0%) | 0 (0.0%) |
Fertility by Education in Mccloud
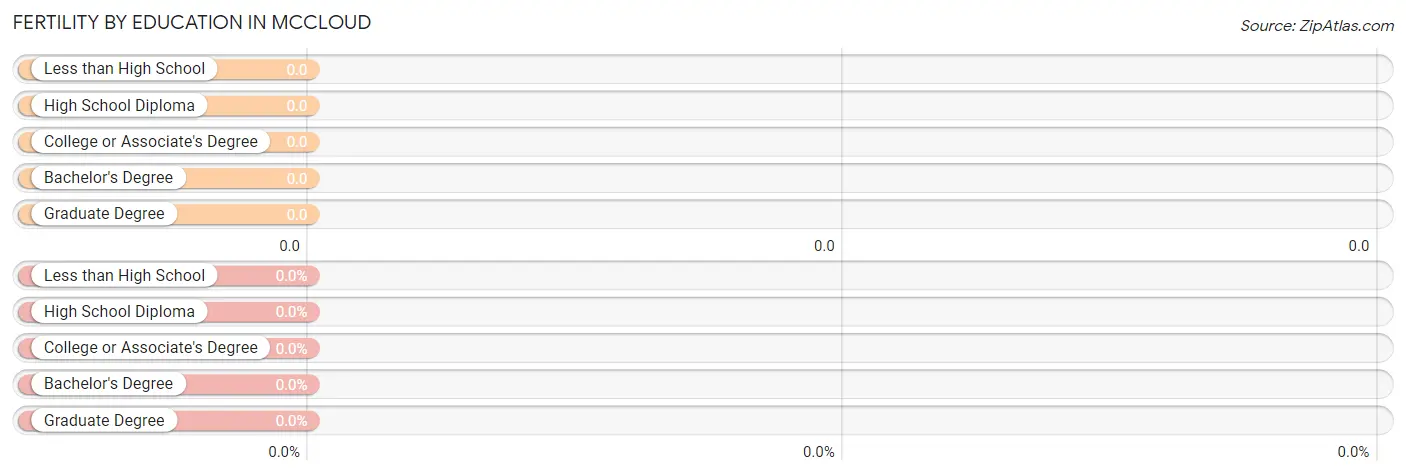
| Educational Attainment | Women with Births | Births / 1,000 Women |
| Less than High School | 0 (0.0%) | 0.0 |
| High School Diploma | 0 (0.0%) | 0.0 |
| College or Associate's Degree | 0 (0.0%) | 0.0 |
| Bachelor's Degree | 0 (0.0%) | 0.0 |
| Graduate Degree | 0 (0.0%) | 0.0 |
| Total | 0 (0.0%) | 0.0 |
Fertility by Education by Marriage Status in Mccloud
| Educational Attainment | Married | Unmarried |
| Less than High School | 0 (0.0%) | 0 (0.0%) |
| High School Diploma | 0 (0.0%) | 0 (0.0%) |
| College or Associate's Degree | 0 (0.0%) | 0 (0.0%) |
| Bachelor's Degree | 0 (0.0%) | 0 (0.0%) |
| Graduate Degree | 0 (0.0%) | 0 (0.0%) |
| Total | 0 (0.0%) | 0 (0.0%) |
Employment Characteristics in Mccloud
Employment by Class of Employer in Mccloud
Among the 313 employed individuals in Mccloud, private company employees (236 | 75.4%), self-employed (not incorporated) (42 | 13.4%), and local government employees (19 | 6.1%) make up the most common classes of employment.
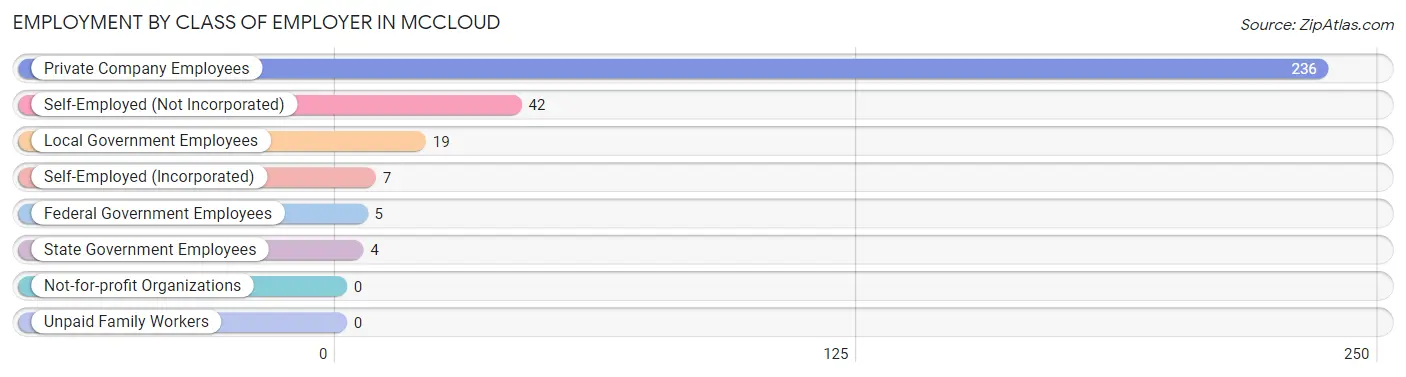
| Employer Class | # Employees | % Employees |
| Private Company Employees | 236 | 75.4% |
| Self-Employed (Incorporated) | 7 | 2.2% |
| Self-Employed (Not Incorporated) | 42 | 13.4% |
| Not-for-profit Organizations | 0 | 0.0% |
| Local Government Employees | 19 | 6.1% |
| State Government Employees | 4 | 1.3% |
| Federal Government Employees | 5 | 1.6% |
| Unpaid Family Workers | 0 | 0.0% |
| Total | 313 | 100.0% |
Employment Status by Age in Mccloud
According to the labor force statistics for Mccloud, out of the total population over 16 years of age (843), 43.5% or 367 individuals are in the labor force, with 10.4% or 38 of them unemployed. The age group with the highest labor force participation rate is 20 to 24 years, with 100.0% or 47 individuals in the labor force. Within the labor force, the 65 to 74 years age range has the highest percentage of unemployed individuals, with 49.1% or 26 of them being unemployed.
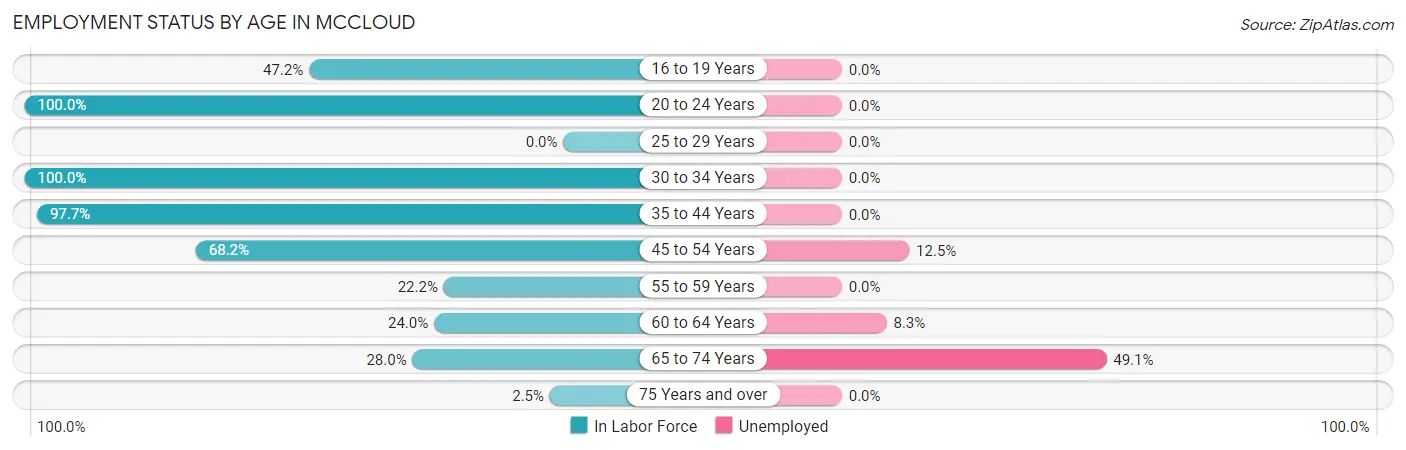
| Age Bracket | In Labor Force | Unemployed |
| 16 to 19 Years | 59 (47.2%) | 0 (0.0%) |
| 20 to 24 Years | 47 (100.0%) | 0 (0.0%) |
| 25 to 29 Years | 0 (0.0%) | 0 (0.0%) |
| 30 to 34 Years | 10 (100.0%) | 0 (0.0%) |
| 35 to 44 Years | 84 (97.7%) | 0 (0.0%) |
| 45 to 54 Years | 88 (68.2%) | 11 (12.5%) |
| 55 to 59 Years | 10 (22.2%) | 0 (0.0%) |
| 60 to 64 Years | 12 (24.0%) | 1 (8.3%) |
| 65 to 74 Years | 53 (28.0%) | 26 (49.1%) |
| 75 Years and over | 4 (2.5%) | 0 (0.0%) |
| Total | 367 (43.5%) | 38 (10.4%) |
Employment Status by Educational Attainment in Mccloud
According to labor force statistics for Mccloud, 63.8% of individuals (204) out of the total population between 25 and 64 years of age (320) are in the labor force, with 5.9% or 12 of them being unemployed. The group with the highest labor force participation rate are those with the educational attainment of less than high school, with 77.8% or 7 individuals in the labor force. Within the labor force, individuals with less than high school education have the highest percentage of unemployment, with 14.3% or 1 of them being unemployed.
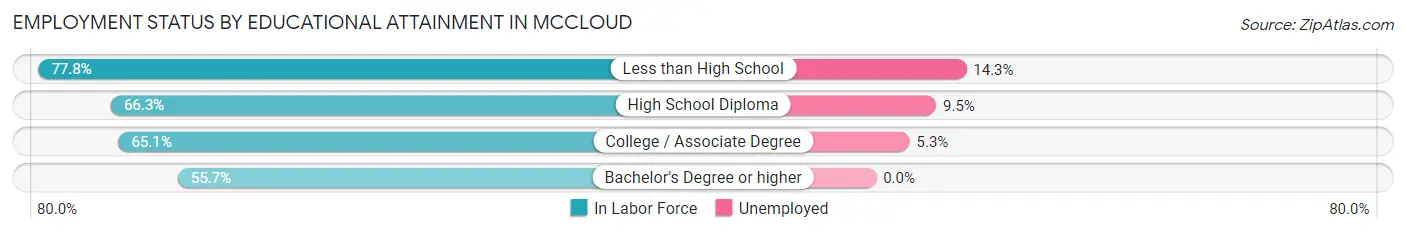
| Educational Attainment | In Labor Force | Unemployed |
| Less than High School | 7 (77.8%) | 1 (14.3%) |
| High School Diploma | 63 (66.3%) | 9 (9.5%) |
| College / Associate Degree | 95 (65.1%) | 8 (5.3%) |
| Bachelor's Degree or higher | 39 (55.7%) | 0 (0.0%) |
| Total | 204 (63.8%) | 19 (5.9%) |
Employment Occupations by Sex in Mccloud
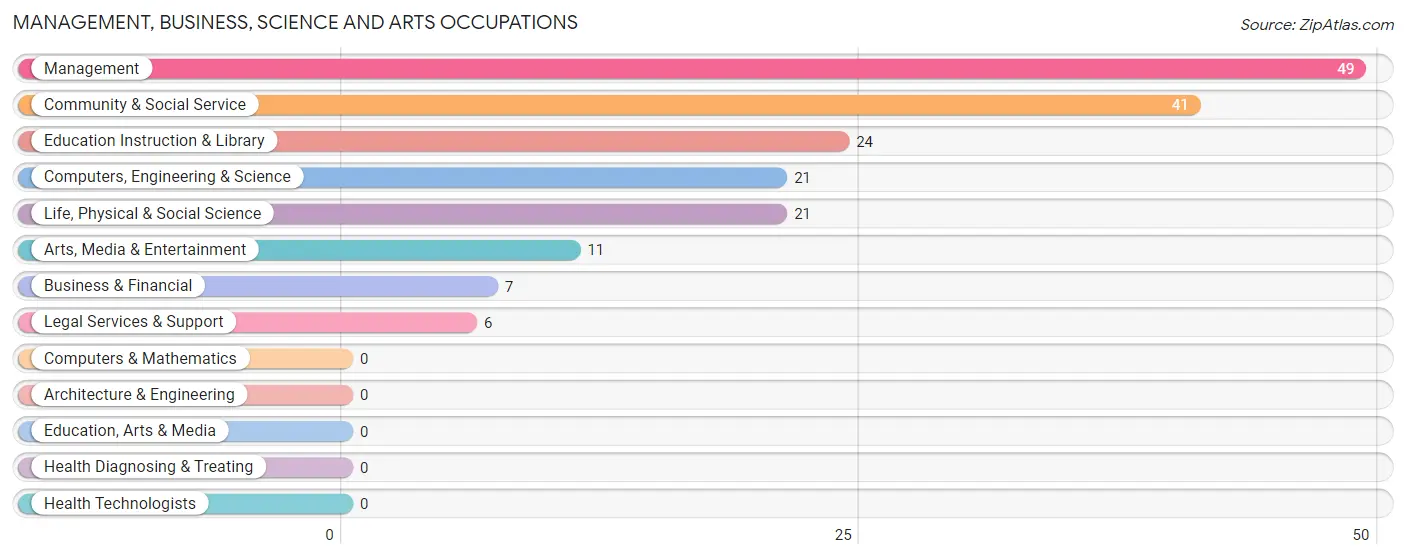
Management, Business, Science and Arts Occupations
The most common Management, Business, Science and Arts occupations in Mccloud are Management (49 | 14.9%), Community & Social Service (41 | 12.5%), Education Instruction & Library (24 | 7.3%), Computers, Engineering & Science (21 | 6.4%), and Life, Physical & Social Science (21 | 6.4%).
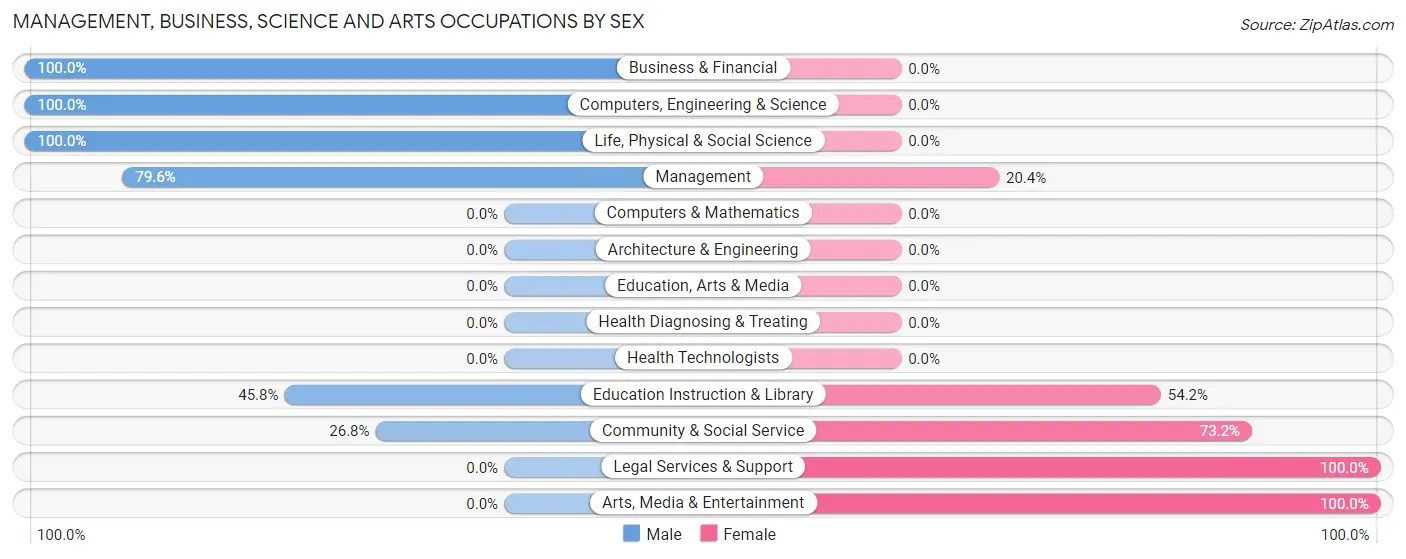
Management, Business, Science and Arts Occupations by Sex
Within the Management, Business, Science and Arts occupations in Mccloud, the most male-oriented occupations are Business & Financial (100.0%), Computers, Engineering & Science (100.0%), and Life, Physical & Social Science (100.0%), while the most female-oriented occupations are Legal Services & Support (100.0%), Arts, Media & Entertainment (100.0%), and Community & Social Service (73.2%).
| Occupation | Male | Female |
| Management | 39 (79.6%) | 10 (20.4%) |
| Business & Financial | 7 (100.0%) | 0 (0.0%) |
| Computers, Engineering & Science | 21 (100.0%) | 0 (0.0%) |
| Computers & Mathematics | 0 (0.0%) | 0 (0.0%) |
| Architecture & Engineering | 0 (0.0%) | 0 (0.0%) |
| Life, Physical & Social Science | 21 (100.0%) | 0 (0.0%) |
| Community & Social Service | 11 (26.8%) | 30 (73.2%) |
| Education, Arts & Media | 0 (0.0%) | 0 (0.0%) |
| Legal Services & Support | 0 (0.0%) | 6 (100.0%) |
| Education Instruction & Library | 11 (45.8%) | 13 (54.2%) |
| Arts, Media & Entertainment | 0 (0.0%) | 11 (100.0%) |
| Health Diagnosing & Treating | 0 (0.0%) | 0 (0.0%) |
| Health Technologists | 0 (0.0%) | 0 (0.0%) |
| Total (Category) | 78 (66.1%) | 40 (33.9%) |
| Total (Overall) | 184 (55.9%) | 145 (44.1%) |
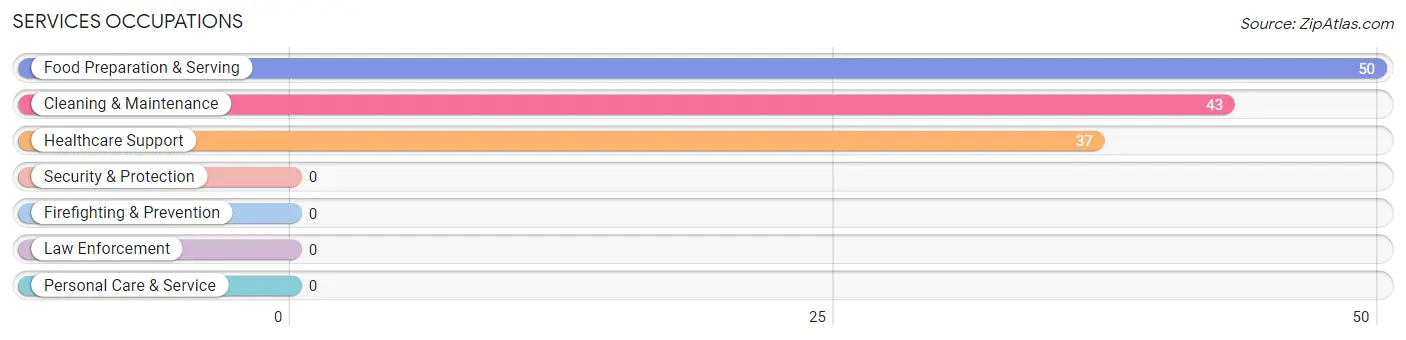
Services Occupations
The most common Services occupations in Mccloud are Food Preparation & Serving (50 | 15.2%), Cleaning & Maintenance (43 | 13.1%), and Healthcare Support (37 | 11.3%).
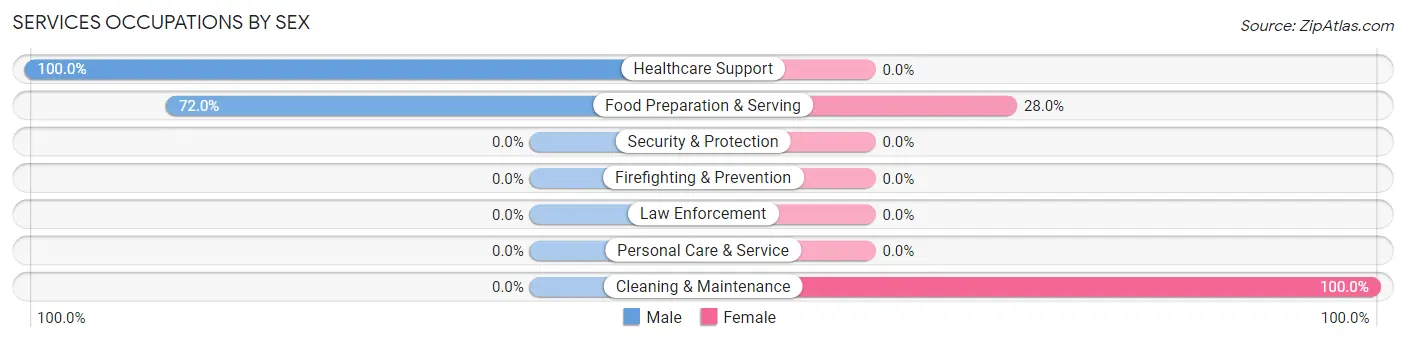
Services Occupations by Sex
Within the Services occupations in Mccloud, the most male-oriented occupations are Healthcare Support (100.0%), and Food Preparation & Serving (72.0%), while the most female-oriented occupations are Cleaning & Maintenance (100.0%), and Food Preparation & Serving (28.0%).
| Occupation | Male | Female |
| Healthcare Support | 37 (100.0%) | 0 (0.0%) |
| Security & Protection | 0 (0.0%) | 0 (0.0%) |
| Firefighting & Prevention | 0 (0.0%) | 0 (0.0%) |
| Law Enforcement | 0 (0.0%) | 0 (0.0%) |
| Food Preparation & Serving | 36 (72.0%) | 14 (28.0%) |
| Cleaning & Maintenance | 0 (0.0%) | 43 (100.0%) |
| Personal Care & Service | 0 (0.0%) | 0 (0.0%) |
| Total (Category) | 73 (56.1%) | 57 (43.9%) |
| Total (Overall) | 184 (55.9%) | 145 (44.1%) |
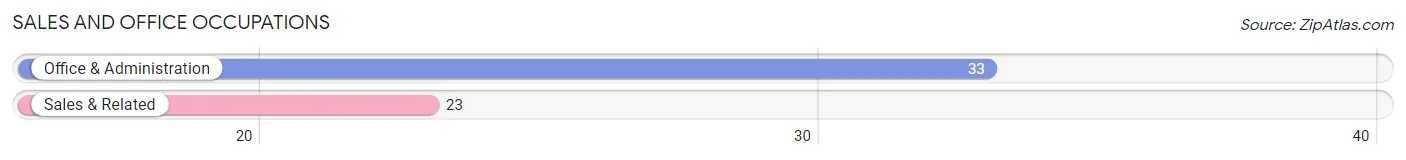
Sales and Office Occupations
The most common Sales and Office occupations in Mccloud are Office & Administration (33 | 10.0%), and Sales & Related (23 | 7.0%).
Sales and Office Occupations by Sex

| Occupation | Male | Female |
| Sales & Related | 13 (56.5%) | 10 (43.5%) |
| Office & Administration | 0 (0.0%) | 33 (100.0%) |
| Total (Category) | 13 (23.2%) | 43 (76.8%) |
| Total (Overall) | 184 (55.9%) | 145 (44.1%) |
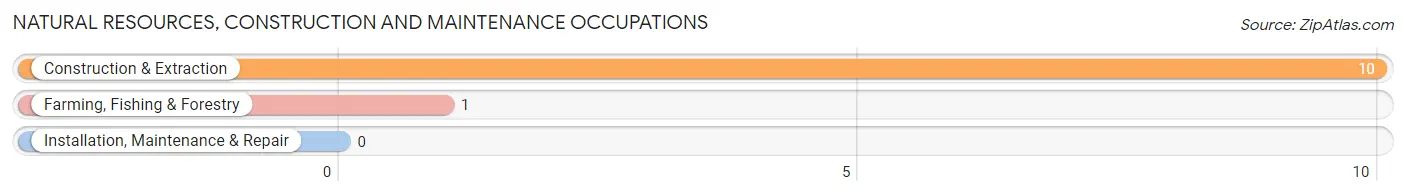
Natural Resources, Construction and Maintenance Occupations
The most common Natural Resources, Construction and Maintenance occupations in Mccloud are Construction & Extraction (10 | 3.0%), and Farming, Fishing & Forestry (1 | 0.3%).
Natural Resources, Construction and Maintenance Occupations by Sex
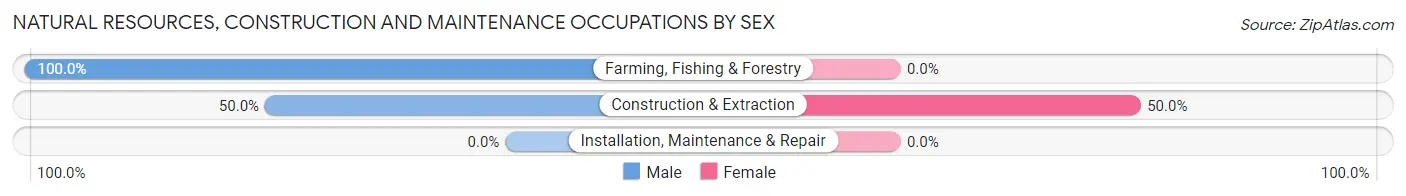
| Occupation | Male | Female |
| Farming, Fishing & Forestry | 1 (100.0%) | 0 (0.0%) |
| Construction & Extraction | 5 (50.0%) | 5 (50.0%) |
| Installation, Maintenance & Repair | 0 (0.0%) | 0 (0.0%) |
| Total (Category) | 6 (54.5%) | 5 (45.5%) |
| Total (Overall) | 184 (55.9%) | 145 (44.1%) |
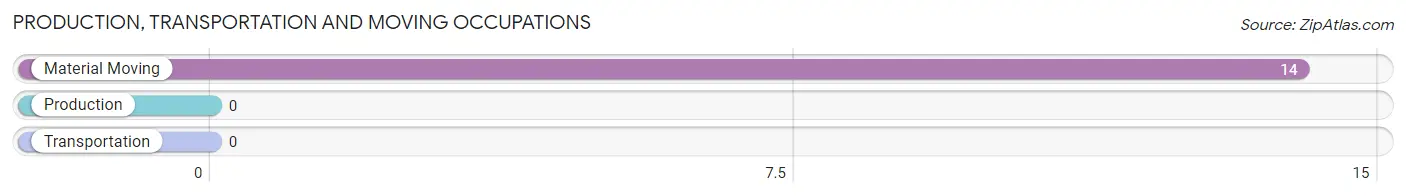
Production, Transportation and Moving Occupations
The most common Production, Transportation and Moving occupations in Mccloud are , and Material Moving (14 | 4.3%).
Production, Transportation and Moving Occupations by Sex
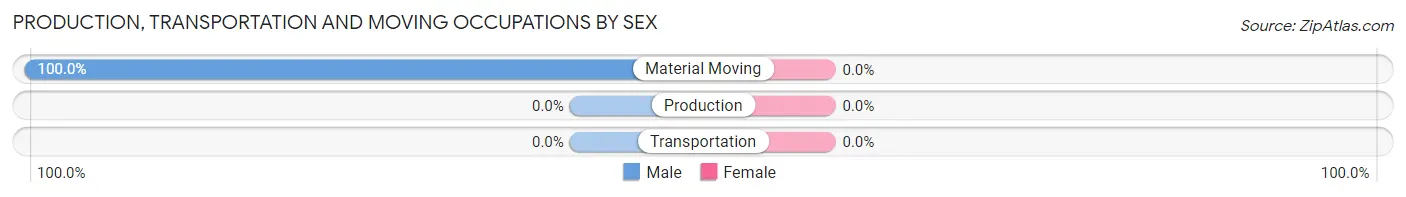
| Occupation | Male | Female |
| Production | 0 (0.0%) | 0 (0.0%) |
| Transportation | 0 (0.0%) | 0 (0.0%) |
| Material Moving | 14 (100.0%) | 0 (0.0%) |
| Total (Category) | 14 (100.0%) | 0 (0.0%) |
| Total (Overall) | 184 (55.9%) | 145 (44.1%) |
Employment Industries by Sex in Mccloud
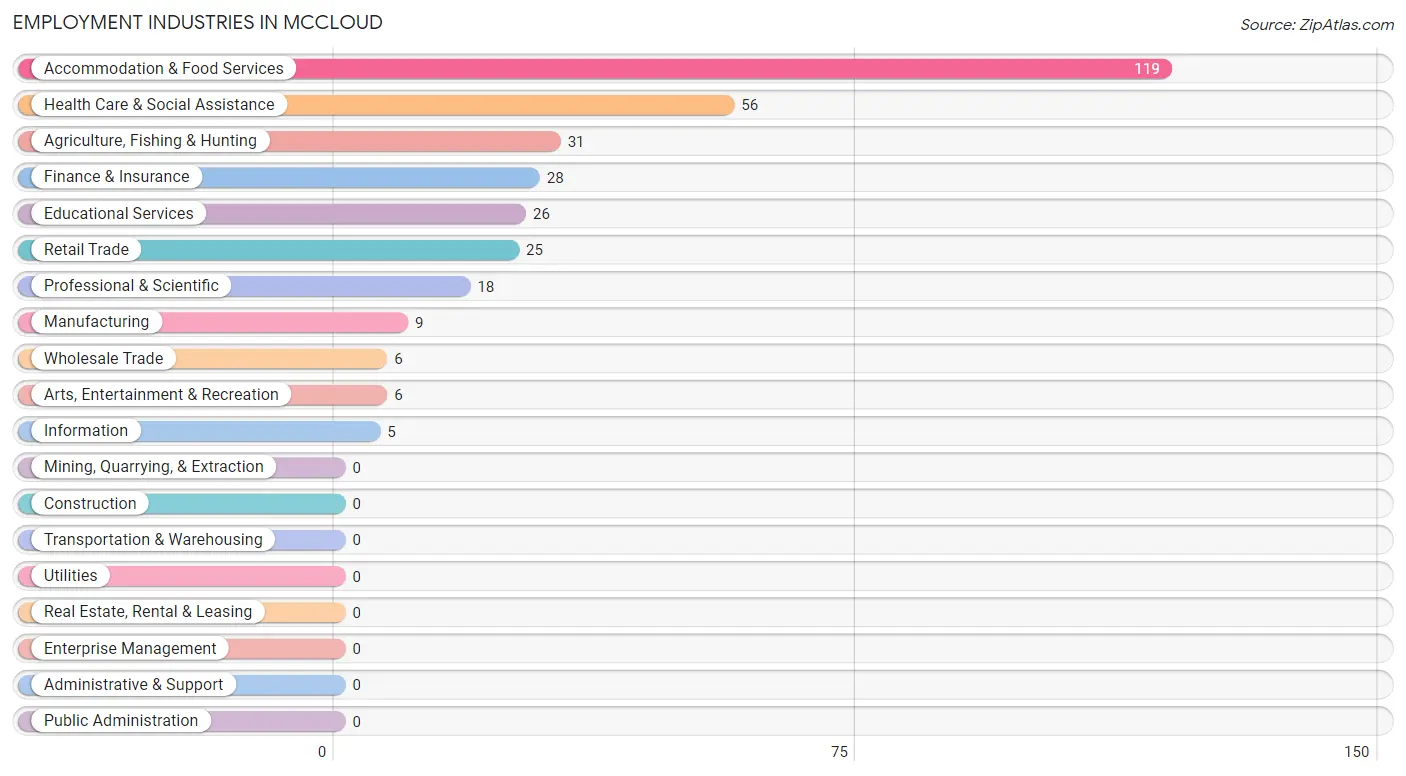
Employment Industries in Mccloud
The major employment industries in Mccloud include Accommodation & Food Services (119 | 36.2%), Health Care & Social Assistance (56 | 17.0%), Agriculture, Fishing & Hunting (31 | 9.4%), Finance & Insurance (28 | 8.5%), and Educational Services (26 | 7.9%).
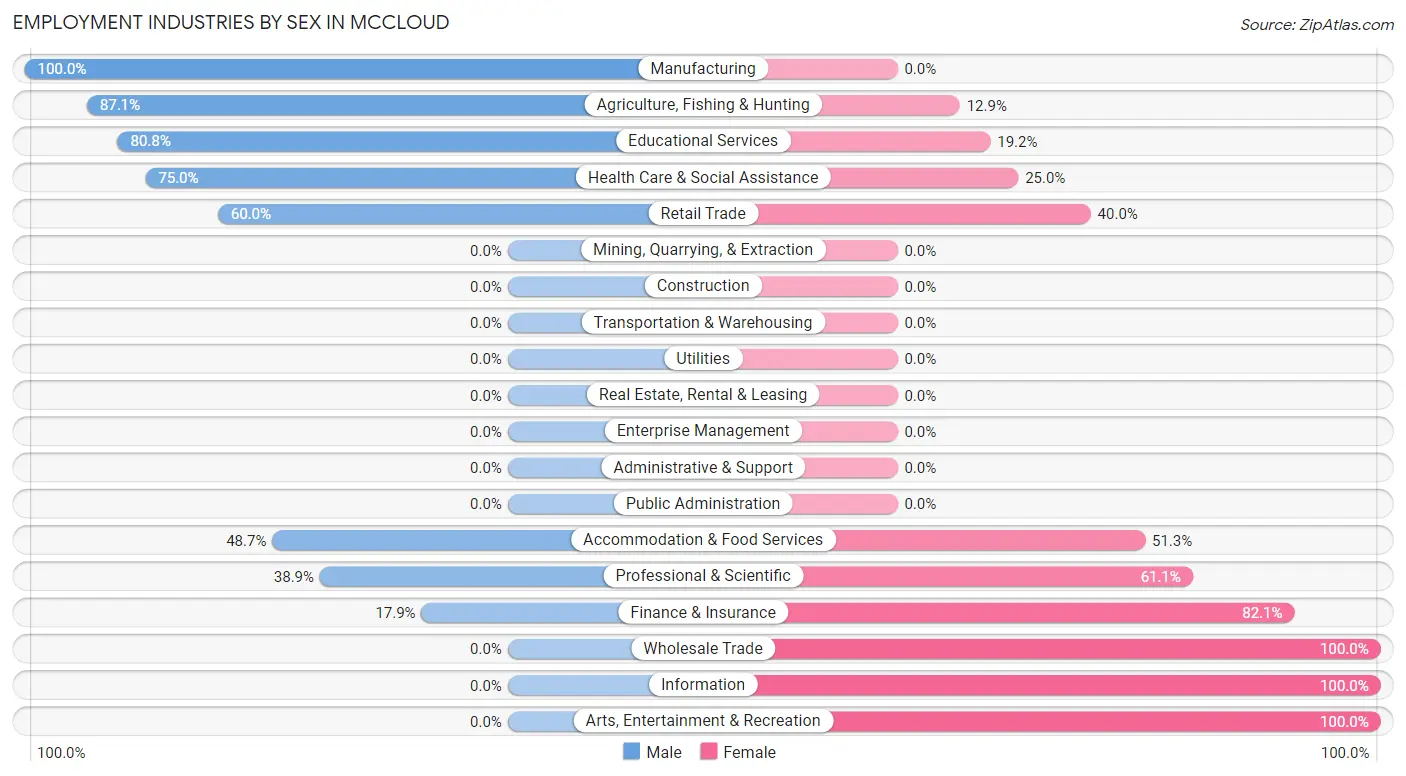
Employment Industries by Sex in Mccloud
The Mccloud industries that see more men than women are Manufacturing (100.0%), Agriculture, Fishing & Hunting (87.1%), and Educational Services (80.8%), whereas the industries that tend to have a higher number of women are Wholesale Trade (100.0%), Information (100.0%), and Arts, Entertainment & Recreation (100.0%).
| Industry | Male | Female |
| Agriculture, Fishing & Hunting | 27 (87.1%) | 4 (12.9%) |
| Mining, Quarrying, & Extraction | 0 (0.0%) | 0 (0.0%) |
| Construction | 0 (0.0%) | 0 (0.0%) |
| Manufacturing | 9 (100.0%) | 0 (0.0%) |
| Wholesale Trade | 0 (0.0%) | 6 (100.0%) |
| Retail Trade | 15 (60.0%) | 10 (40.0%) |
| Transportation & Warehousing | 0 (0.0%) | 0 (0.0%) |
| Utilities | 0 (0.0%) | 0 (0.0%) |
| Information | 0 (0.0%) | 5 (100.0%) |
| Finance & Insurance | 5 (17.9%) | 23 (82.1%) |
| Real Estate, Rental & Leasing | 0 (0.0%) | 0 (0.0%) |
| Professional & Scientific | 7 (38.9%) | 11 (61.1%) |
| Enterprise Management | 0 (0.0%) | 0 (0.0%) |
| Administrative & Support | 0 (0.0%) | 0 (0.0%) |
| Educational Services | 21 (80.8%) | 5 (19.2%) |
| Health Care & Social Assistance | 42 (75.0%) | 14 (25.0%) |
| Arts, Entertainment & Recreation | 0 (0.0%) | 6 (100.0%) |
| Accommodation & Food Services | 58 (48.7%) | 61 (51.3%) |
| Public Administration | 0 (0.0%) | 0 (0.0%) |
| Total | 184 (55.9%) | 145 (44.1%) |
Education in Mccloud
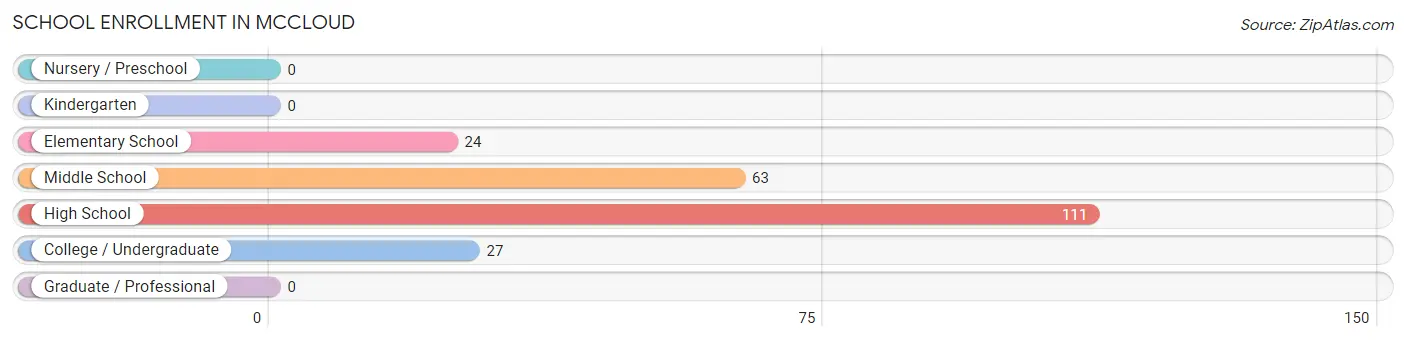
School Enrollment in Mccloud
The most common levels of schooling among the 225 students in Mccloud are high school (111 | 49.3%), middle school (63 | 28.0%), and college / undergraduate (27 | 12.0%).
| School Level | # Students | % Students |
| Nursery / Preschool | 0 | 0.0% |
| Kindergarten | 0 | 0.0% |
| Elementary School | 24 | 10.7% |
| Middle School | 63 | 28.0% |
| High School | 111 | 49.3% |
| College / Undergraduate | 27 | 12.0% |
| Graduate / Professional | 0 | 0.0% |
| Total | 225 | 100.0% |
School Enrollment by Age by Funding Source in Mccloud
Out of a total of 225 students who are enrolled in schools in Mccloud, 2 (0.9%) attend a private institution, while the remaining 223 (99.1%) are enrolled in public schools. The age group of 18 to 19 year olds has the highest likelihood of being enrolled in private schools, with 2 (2.8% in the age bracket) enrolled. Conversely, the age group of 5 to 9 year old has the lowest likelihood of being enrolled in a private school, with 10 (100.0% in the age bracket) attending a public institution.
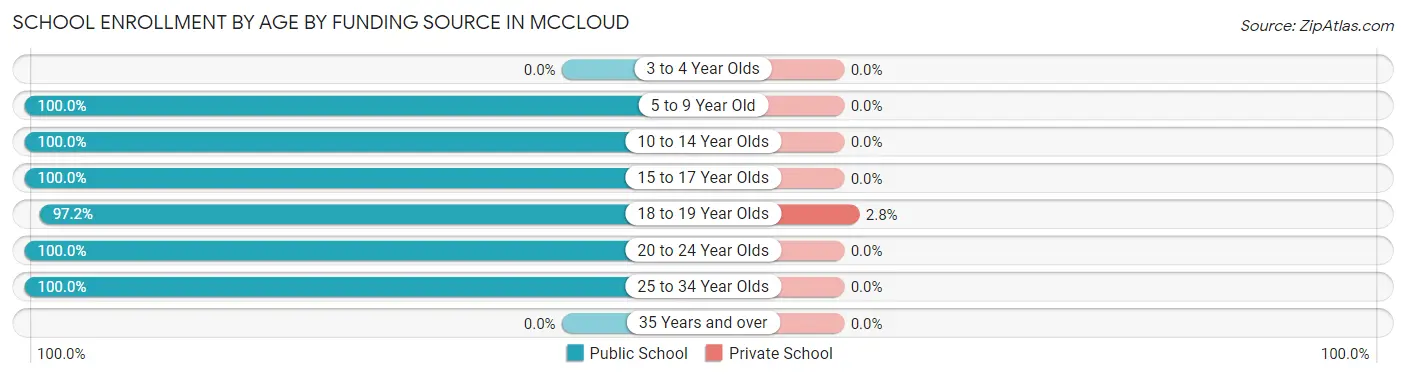
| Age Bracket | Public School | Private School |
| 3 to 4 Year Olds | 0 (0.0%) | 0 (0.0%) |
| 5 to 9 Year Old | 10 (100.0%) | 0 (0.0%) |
| 10 to 14 Year Olds | 86 (100.0%) | 0 (0.0%) |
| 15 to 17 Year Olds | 43 (100.0%) | 0 (0.0%) |
| 18 to 19 Year Olds | 69 (97.2%) | 2 (2.8%) |
| 20 to 24 Year Olds | 14 (100.0%) | 0 (0.0%) |
| 25 to 34 Year Olds | 1 (100.0%) | 0 (0.0%) |
| 35 Years and over | 0 (0.0%) | 0 (0.0%) |
| Total | 223 (99.1%) | 2 (0.9%) |
Educational Attainment by Field of Study in Mccloud
Business (32 | 26.7%), visual & performing arts (23 | 19.2%), education (20 | 16.7%), arts & humanities (12 | 10.0%), and communications (8 | 6.7%) are the most common fields of study among 120 individuals in Mccloud who have obtained a bachelor's degree or higher.
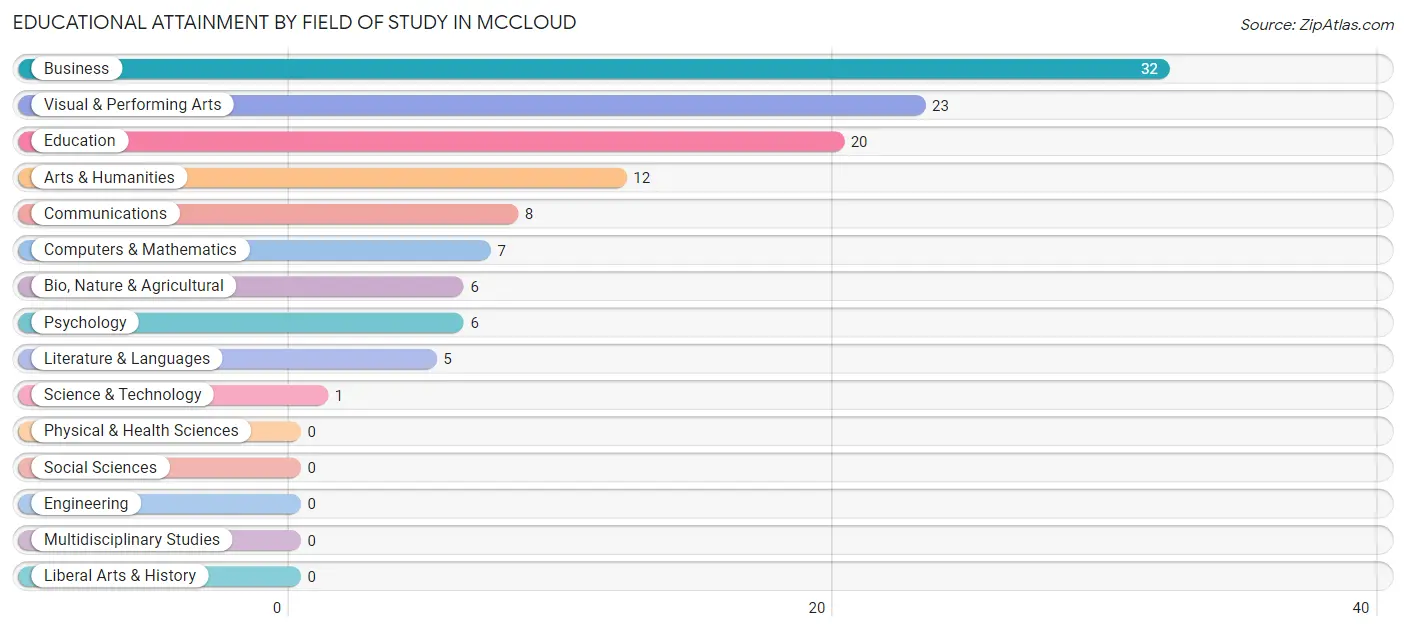
| Field of Study | # Graduates | % Graduates |
| Computers & Mathematics | 7 | 5.8% |
| Bio, Nature & Agricultural | 6 | 5.0% |
| Physical & Health Sciences | 0 | 0.0% |
| Psychology | 6 | 5.0% |
| Social Sciences | 0 | 0.0% |
| Engineering | 0 | 0.0% |
| Multidisciplinary Studies | 0 | 0.0% |
| Science & Technology | 1 | 0.8% |
| Business | 32 | 26.7% |
| Education | 20 | 16.7% |
| Literature & Languages | 5 | 4.2% |
| Liberal Arts & History | 0 | 0.0% |
| Visual & Performing Arts | 23 | 19.2% |
| Communications | 8 | 6.7% |
| Arts & Humanities | 12 | 10.0% |
| Total | 120 | 100.0% |
Transportation & Commute in Mccloud
Vehicle Availability by Sex in Mccloud
The most prevalent vehicle ownership categories in Mccloud are males with 4 vehicles (67, accounting for 37.6%) and females with 4 vehicles (6, making up 50.0%).
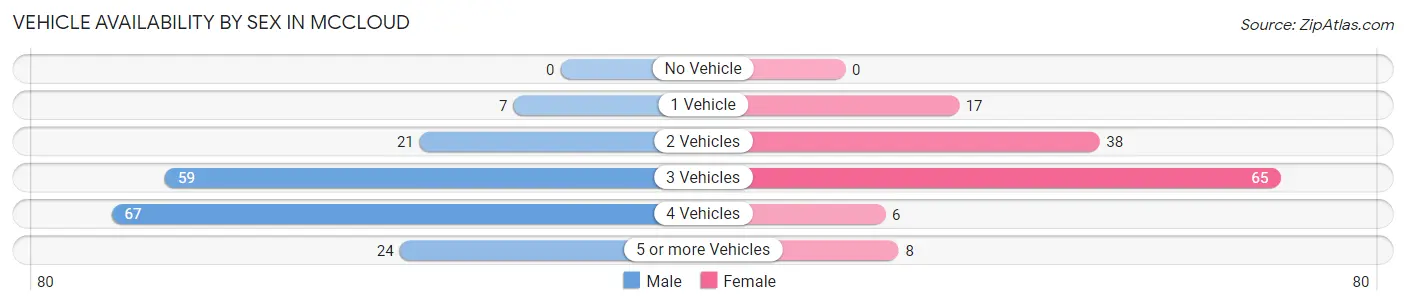
| Vehicles Available | Male | Female |
| No Vehicle | 0 (0.0%) | 0 (0.0%) |
| 1 Vehicle | 7 (3.9%) | 17 (12.7%) |
| 2 Vehicles | 21 (11.8%) | 38 (28.4%) |
| 3 Vehicles | 59 (33.2%) | 65 (48.5%) |
| 4 Vehicles | 67 (37.6%) | 6 (4.5%) |
| 5 or more Vehicles | 24 (13.5%) | 8 (6.0%) |
| Total | 178 (100.0%) | 134 (100.0%) |
Commute Time in Mccloud
The most frequently occuring commute durations in Mccloud are less than 5 minutes (90 commuters, 30.0%), 5 to 9 minutes (69 commuters, 23.0%), and 20 to 24 minutes (36 commuters, 12.0%).
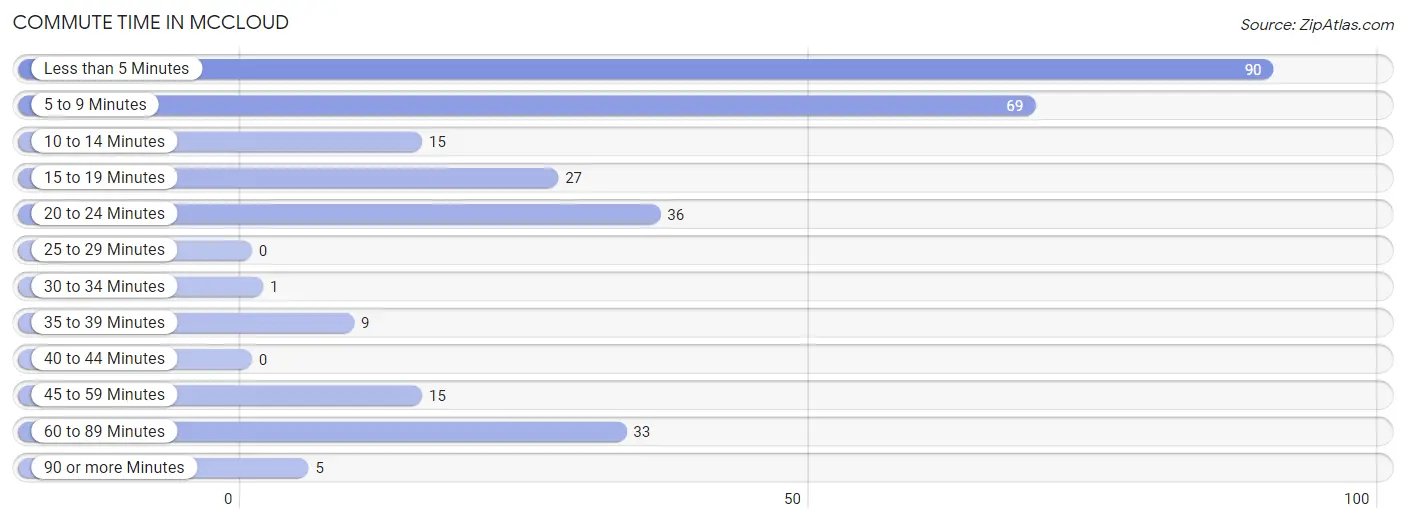
| Commute Time | # Commuters | % Commuters |
| Less than 5 Minutes | 90 | 30.0% |
| 5 to 9 Minutes | 69 | 23.0% |
| 10 to 14 Minutes | 15 | 5.0% |
| 15 to 19 Minutes | 27 | 9.0% |
| 20 to 24 Minutes | 36 | 12.0% |
| 25 to 29 Minutes | 0 | 0.0% |
| 30 to 34 Minutes | 1 | 0.3% |
| 35 to 39 Minutes | 9 | 3.0% |
| 40 to 44 Minutes | 0 | 0.0% |
| 45 to 59 Minutes | 15 | 5.0% |
| 60 to 89 Minutes | 33 | 11.0% |
| 90 or more Minutes | 5 | 1.7% |
Commute Time by Sex in Mccloud
The most common commute times in Mccloud are 5 to 9 minutes (49 commuters, 28.5%) for males and less than 5 minutes (69 commuters, 53.9%) for females.
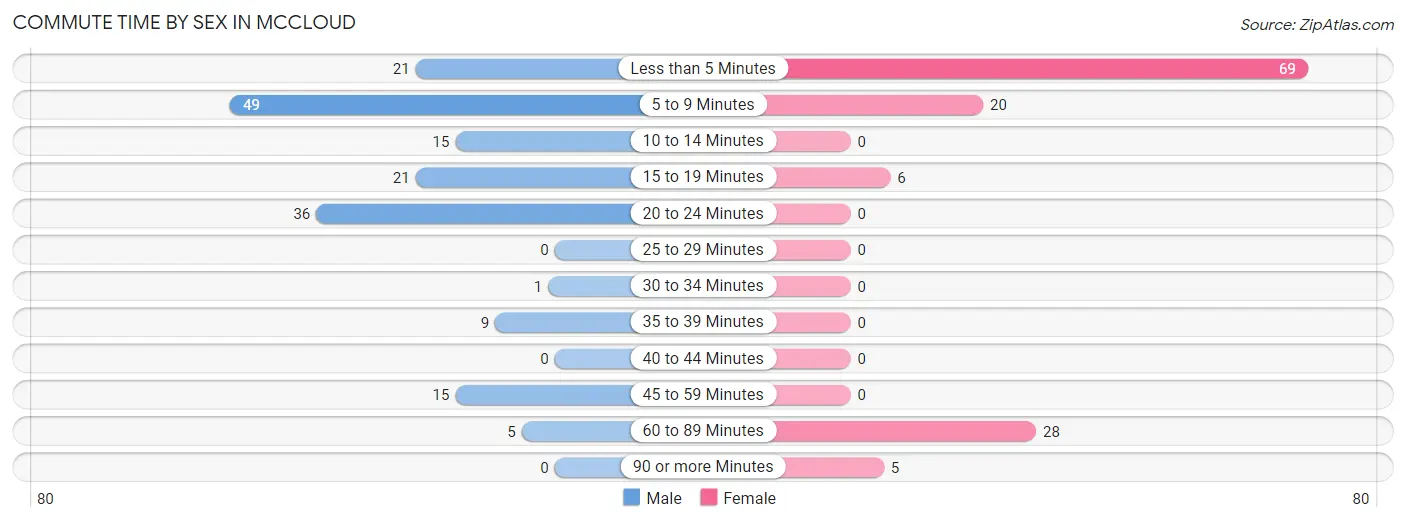
| Commute Time | Male | Female |
| Less than 5 Minutes | 21 (12.2%) | 69 (53.9%) |
| 5 to 9 Minutes | 49 (28.5%) | 20 (15.6%) |
| 10 to 14 Minutes | 15 (8.7%) | 0 (0.0%) |
| 15 to 19 Minutes | 21 (12.2%) | 6 (4.7%) |
| 20 to 24 Minutes | 36 (20.9%) | 0 (0.0%) |
| 25 to 29 Minutes | 0 (0.0%) | 0 (0.0%) |
| 30 to 34 Minutes | 1 (0.6%) | 0 (0.0%) |
| 35 to 39 Minutes | 9 (5.2%) | 0 (0.0%) |
| 40 to 44 Minutes | 0 (0.0%) | 0 (0.0%) |
| 45 to 59 Minutes | 15 (8.7%) | 0 (0.0%) |
| 60 to 89 Minutes | 5 (2.9%) | 28 (21.9%) |
| 90 or more Minutes | 0 (0.0%) | 5 (3.9%) |
Time of Departure to Work by Sex in Mccloud
The most frequent times of departure to work in Mccloud are 7:30 AM to 7:59 AM (51, 29.6%) for males and 6:30 AM to 6:59 AM (41, 32.0%) for females.
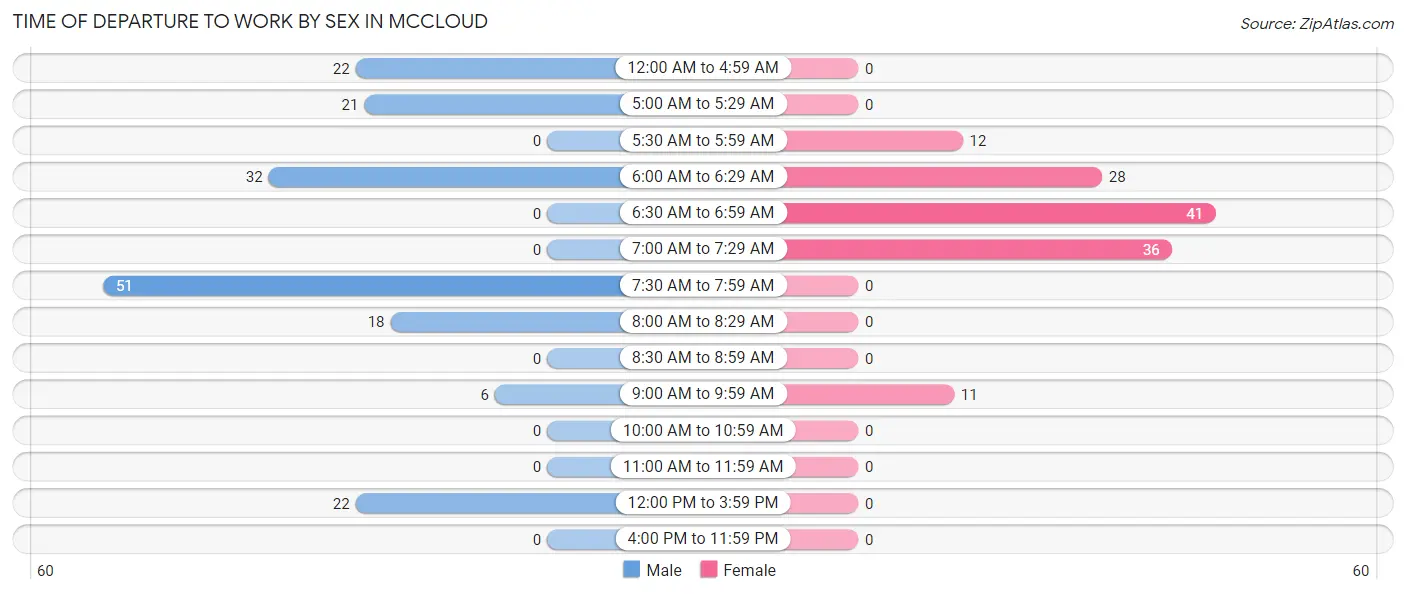
| Time of Departure | Male | Female |
| 12:00 AM to 4:59 AM | 22 (12.8%) | 0 (0.0%) |
| 5:00 AM to 5:29 AM | 21 (12.2%) | 0 (0.0%) |
| 5:30 AM to 5:59 AM | 0 (0.0%) | 12 (9.4%) |
| 6:00 AM to 6:29 AM | 32 (18.6%) | 28 (21.9%) |
| 6:30 AM to 6:59 AM | 0 (0.0%) | 41 (32.0%) |
| 7:00 AM to 7:29 AM | 0 (0.0%) | 36 (28.1%) |
| 7:30 AM to 7:59 AM | 51 (29.6%) | 0 (0.0%) |
| 8:00 AM to 8:29 AM | 18 (10.5%) | 0 (0.0%) |
| 8:30 AM to 8:59 AM | 0 (0.0%) | 0 (0.0%) |
| 9:00 AM to 9:59 AM | 6 (3.5%) | 11 (8.6%) |
| 10:00 AM to 10:59 AM | 0 (0.0%) | 0 (0.0%) |
| 11:00 AM to 11:59 AM | 0 (0.0%) | 0 (0.0%) |
| 12:00 PM to 3:59 PM | 22 (12.8%) | 0 (0.0%) |
| 4:00 PM to 11:59 PM | 0 (0.0%) | 0 (0.0%) |
| Total | 172 (100.0%) | 128 (100.0%) |
Housing Occupancy in Mccloud
Occupancy by Ownership in Mccloud
Of the total 430 dwellings in Mccloud, owner-occupied units account for 308 (71.6%), while renter-occupied units make up 122 (28.4%).
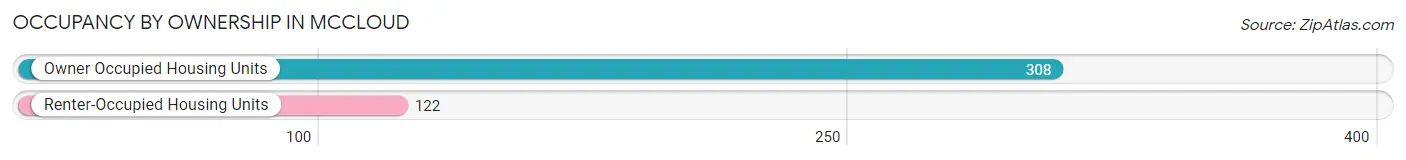
| Occupancy | # Housing Units | % Housing Units |
| Owner Occupied Housing Units | 308 | 71.6% |
| Renter-Occupied Housing Units | 122 | 28.4% |
| Total Occupied Housing Units | 430 | 100.0% |
Occupancy by Household Size in Mccloud
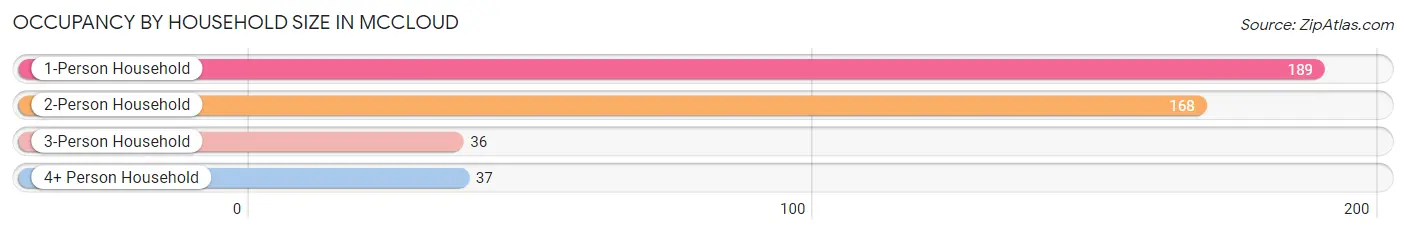
| Household Size | # Housing Units | % Housing Units |
| 1-Person Household | 189 | 44.0% |
| 2-Person Household | 168 | 39.1% |
| 3-Person Household | 36 | 8.4% |
| 4+ Person Household | 37 | 8.6% |
| Total Housing Units | 430 | 100.0% |
Occupancy by Ownership by Household Size in Mccloud
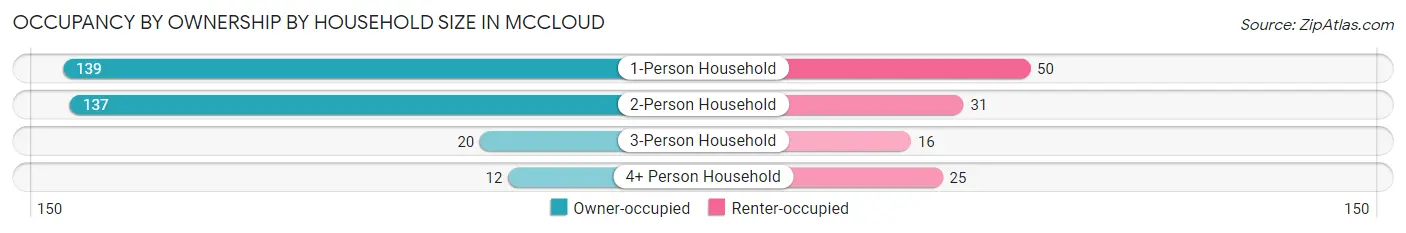
| Household Size | Owner-occupied | Renter-occupied |
| 1-Person Household | 139 (73.5%) | 50 (26.5%) |
| 2-Person Household | 137 (81.6%) | 31 (18.4%) |
| 3-Person Household | 20 (55.6%) | 16 (44.4%) |
| 4+ Person Household | 12 (32.4%) | 25 (67.6%) |
| Total Housing Units | 308 (71.6%) | 122 (28.4%) |
Occupancy by Educational Attainment in Mccloud
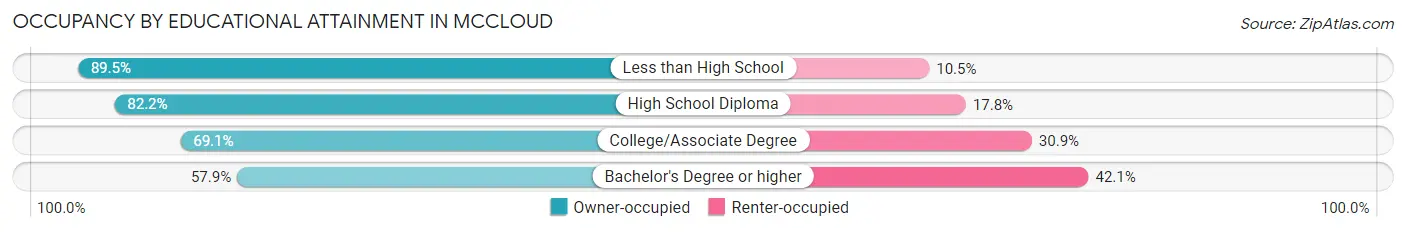
| Household Size | Owner-occupied | Renter-occupied |
| Less than High School | 17 (89.5%) | 2 (10.5%) |
| High School Diploma | 97 (82.2%) | 21 (17.8%) |
| College/Associate Degree | 150 (69.1%) | 67 (30.9%) |
| Bachelor's Degree or higher | 44 (57.9%) | 32 (42.1%) |
Occupancy by Age of Householder in Mccloud
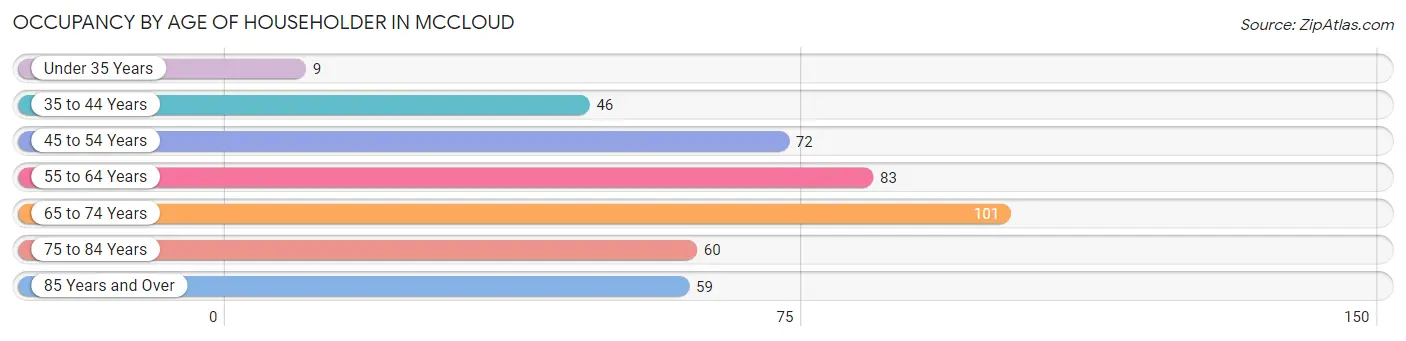
| Age Bracket | # Households | % Households |
| Under 35 Years | 9 | 2.1% |
| 35 to 44 Years | 46 | 10.7% |
| 45 to 54 Years | 72 | 16.7% |
| 55 to 64 Years | 83 | 19.3% |
| 65 to 74 Years | 101 | 23.5% |
| 75 to 84 Years | 60 | 14.0% |
| 85 Years and Over | 59 | 13.7% |
| Total | 430 | 100.0% |
Housing Finances in Mccloud
Median Income by Occupancy in Mccloud
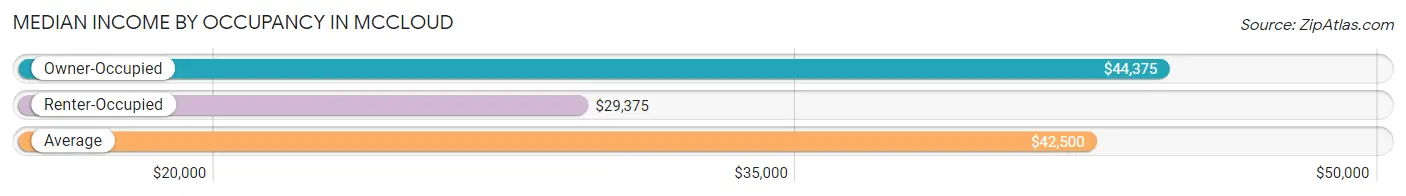
| Occupancy Type | # Households | Median Income |
| Owner-Occupied | 308 (71.6%) | $44,375 |
| Renter-Occupied | 122 (28.4%) | $29,375 |
| Average | 430 (100.0%) | $42,500 |
Occupancy by Householder Income Bracket in Mccloud
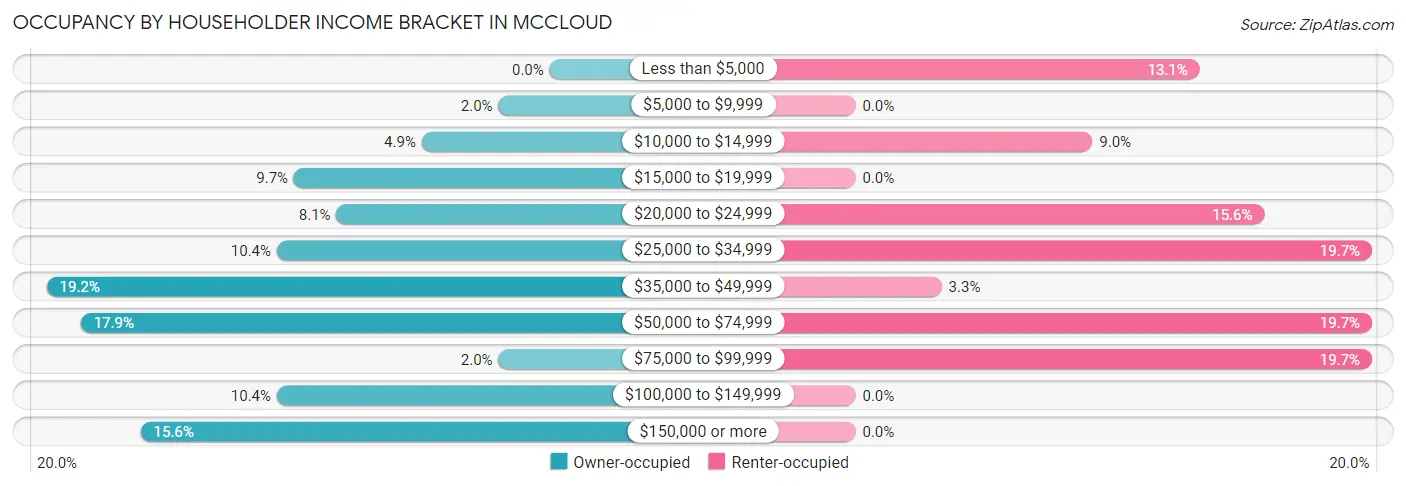
| Income Bracket | Owner-occupied | Renter-occupied |
| Less than $5,000 | 0 (0.0%) | 16 (13.1%) |
| $5,000 to $9,999 | 6 (1.9%) | 0 (0.0%) |
| $10,000 to $14,999 | 15 (4.9%) | 11 (9.0%) |
| $15,000 to $19,999 | 30 (9.7%) | 0 (0.0%) |
| $20,000 to $24,999 | 25 (8.1%) | 19 (15.6%) |
| $25,000 to $34,999 | 32 (10.4%) | 24 (19.7%) |
| $35,000 to $49,999 | 59 (19.2%) | 4 (3.3%) |
| $50,000 to $74,999 | 55 (17.9%) | 24 (19.7%) |
| $75,000 to $99,999 | 6 (1.9%) | 24 (19.7%) |
| $100,000 to $149,999 | 32 (10.4%) | 0 (0.0%) |
| $150,000 or more | 48 (15.6%) | 0 (0.0%) |
| Total | 308 (100.0%) | 122 (100.0%) |
Monthly Housing Cost Tiers in Mccloud
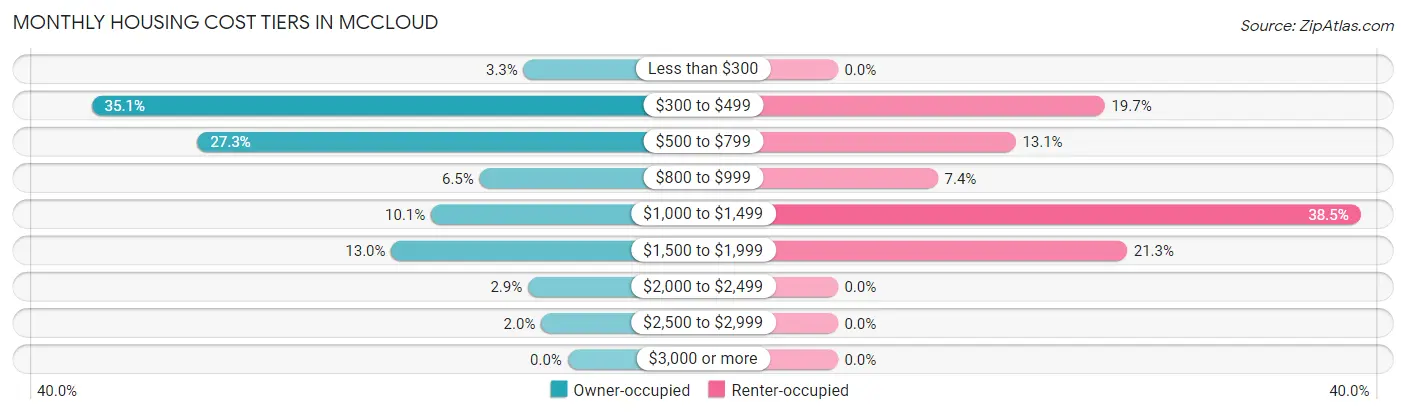
| Monthly Cost | Owner-occupied | Renter-occupied |
| Less than $300 | 10 (3.3%) | 0 (0.0%) |
| $300 to $499 | 108 (35.1%) | 24 (19.7%) |
| $500 to $799 | 84 (27.3%) | 16 (13.1%) |
| $800 to $999 | 20 (6.5%) | 9 (7.4%) |
| $1,000 to $1,499 | 31 (10.1%) | 47 (38.5%) |
| $1,500 to $1,999 | 40 (13.0%) | 26 (21.3%) |
| $2,000 to $2,499 | 9 (2.9%) | 0 (0.0%) |
| $2,500 to $2,999 | 6 (1.9%) | 0 (0.0%) |
| $3,000 or more | 0 (0.0%) | 0 (0.0%) |
| Total | 308 (100.0%) | 122 (100.0%) |
Physical Housing Characteristics in Mccloud
Housing Structures in Mccloud
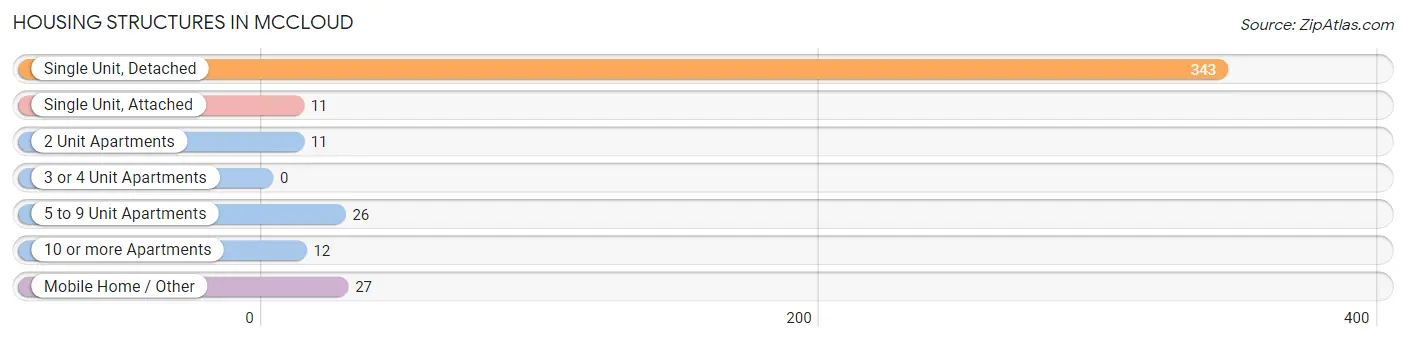
| Structure Type | # Housing Units | % Housing Units |
| Single Unit, Detached | 343 | 79.8% |
| Single Unit, Attached | 11 | 2.6% |
| 2 Unit Apartments | 11 | 2.6% |
| 3 or 4 Unit Apartments | 0 | 0.0% |
| 5 to 9 Unit Apartments | 26 | 6.0% |
| 10 or more Apartments | 12 | 2.8% |
| Mobile Home / Other | 27 | 6.3% |
| Total | 430 | 100.0% |
Housing Structures by Occupancy in Mccloud
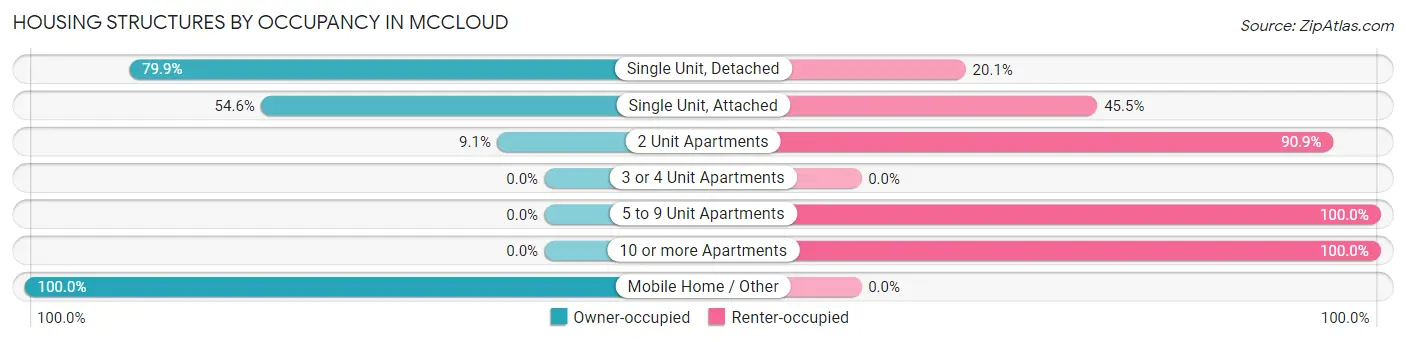
| Structure Type | Owner-occupied | Renter-occupied |
| Single Unit, Detached | 274 (79.9%) | 69 (20.1%) |
| Single Unit, Attached | 6 (54.5%) | 5 (45.5%) |
| 2 Unit Apartments | 1 (9.1%) | 10 (90.9%) |
| 3 or 4 Unit Apartments | 0 (0.0%) | 0 (0.0%) |
| 5 to 9 Unit Apartments | 0 (0.0%) | 26 (100.0%) |
| 10 or more Apartments | 0 (0.0%) | 12 (100.0%) |
| Mobile Home / Other | 27 (100.0%) | 0 (0.0%) |
| Total | 308 (71.6%) | 122 (28.4%) |
Housing Structures by Number of Rooms in Mccloud
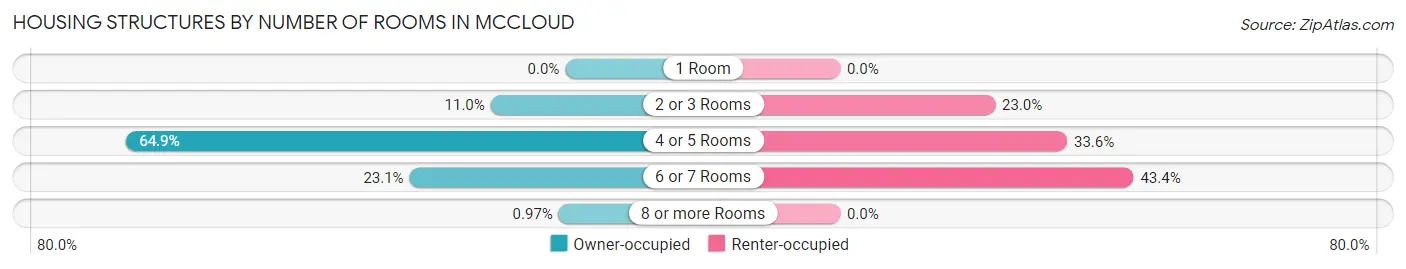
| Number of Rooms | Owner-occupied | Renter-occupied |
| 1 Room | 0 (0.0%) | 0 (0.0%) |
| 2 or 3 Rooms | 34 (11.0%) | 28 (23.0%) |
| 4 or 5 Rooms | 200 (64.9%) | 41 (33.6%) |
| 6 or 7 Rooms | 71 (23.1%) | 53 (43.4%) |
| 8 or more Rooms | 3 (1.0%) | 0 (0.0%) |
| Total | 308 (100.0%) | 122 (100.0%) |
Housing Structure by Heating Type in Mccloud
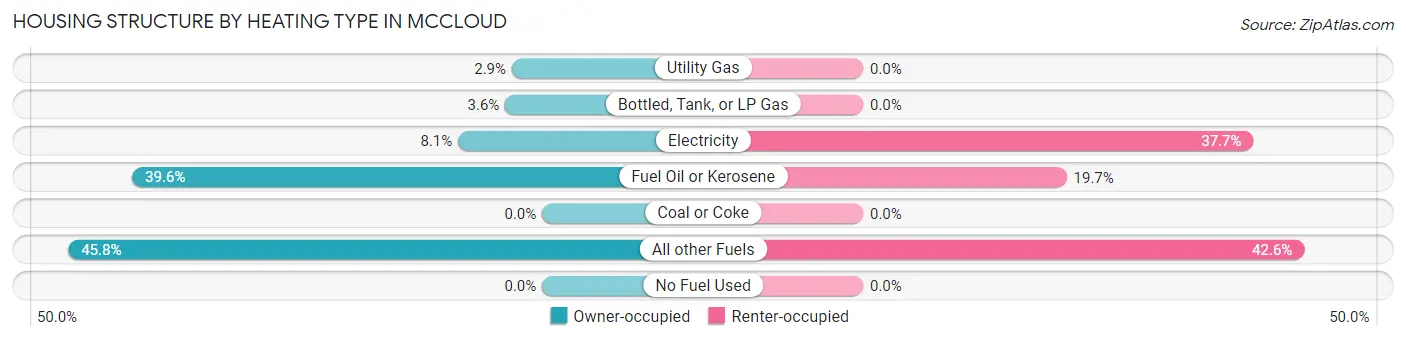
| Heating Type | Owner-occupied | Renter-occupied |
| Utility Gas | 9 (2.9%) | 0 (0.0%) |
| Bottled, Tank, or LP Gas | 11 (3.6%) | 0 (0.0%) |
| Electricity | 25 (8.1%) | 46 (37.7%) |
| Fuel Oil or Kerosene | 122 (39.6%) | 24 (19.7%) |
| Coal or Coke | 0 (0.0%) | 0 (0.0%) |
| All other Fuels | 141 (45.8%) | 52 (42.6%) |
| No Fuel Used | 0 (0.0%) | 0 (0.0%) |
| Total | 308 (100.0%) | 122 (100.0%) |
Household Vehicle Usage in Mccloud
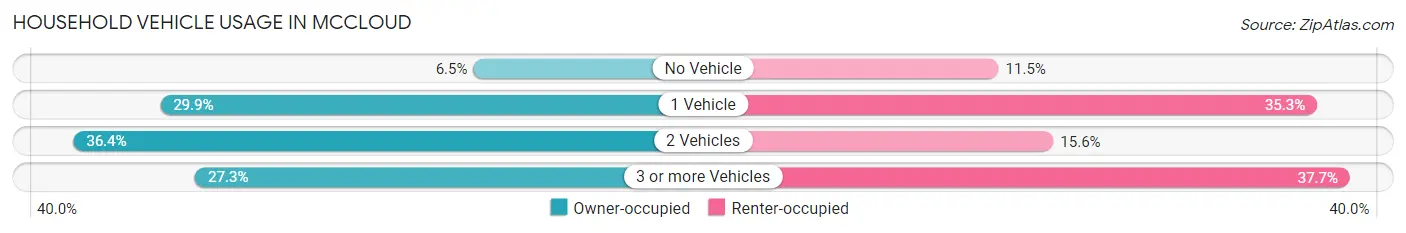
| Vehicles per Household | Owner-occupied | Renter-occupied |
| No Vehicle | 20 (6.5%) | 14 (11.5%) |
| 1 Vehicle | 92 (29.9%) | 43 (35.2%) |
| 2 Vehicles | 112 (36.4%) | 19 (15.6%) |
| 3 or more Vehicles | 84 (27.3%) | 46 (37.7%) |
| Total | 308 (100.0%) | 122 (100.0%) |
Real Estate & Mortgages in Mccloud
Real Estate and Mortgage Overview in Mccloud
| Characteristic | Without Mortgage | With Mortgage |
| Housing Units | 212 | 96 |
| Median Property Value | $279,600 | $327,700 |
| Median Household Income | $39,773 | $17 |
| Monthly Housing Costs | $481 | $0 |
| Real Estate Taxes | $1,406 | $0 |
Property Value by Mortgage Status in Mccloud
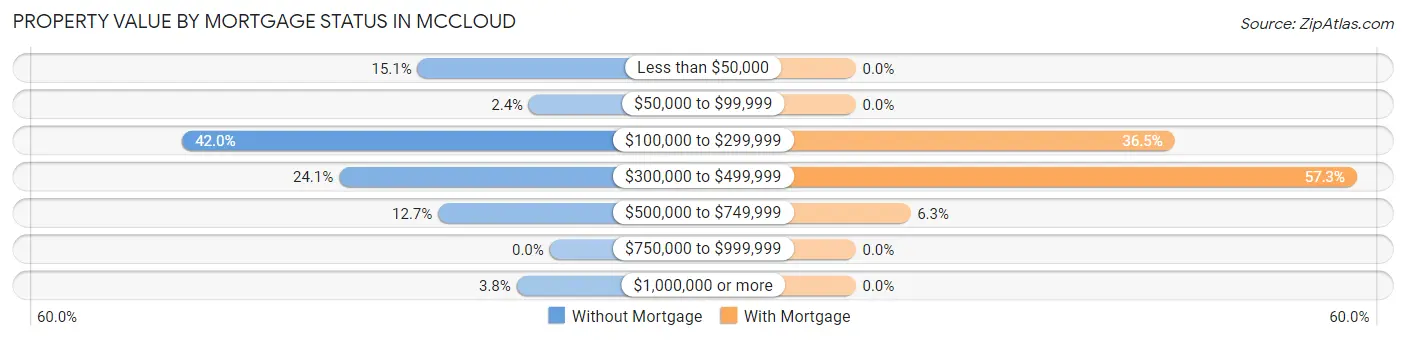
| Property Value | Without Mortgage | With Mortgage |
| Less than $50,000 | 32 (15.1%) | 0 (0.0%) |
| $50,000 to $99,999 | 5 (2.4%) | 0 (0.0%) |
| $100,000 to $299,999 | 89 (42.0%) | 35 (36.5%) |
| $300,000 to $499,999 | 51 (24.1%) | 55 (57.3%) |
| $500,000 to $749,999 | 27 (12.7%) | 6 (6.2%) |
| $750,000 to $999,999 | 0 (0.0%) | 0 (0.0%) |
| $1,000,000 or more | 8 (3.8%) | 0 (0.0%) |
| Total | 212 (100.0%) | 96 (100.0%) |
Household Income by Mortgage Status in Mccloud
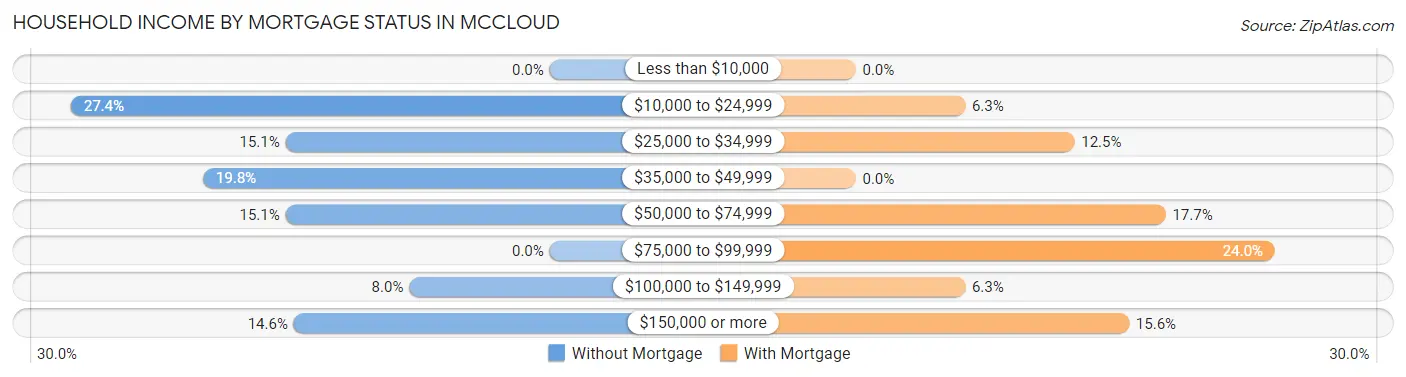
| Household Income | Without Mortgage | With Mortgage |
| Less than $10,000 | 0 (0.0%) | 0 (0.0%) |
| $10,000 to $24,999 | 58 (27.4%) | 6 (6.2%) |
| $25,000 to $34,999 | 32 (15.1%) | 12 (12.5%) |
| $35,000 to $49,999 | 42 (19.8%) | 0 (0.0%) |
| $50,000 to $74,999 | 32 (15.1%) | 17 (17.7%) |
| $75,000 to $99,999 | 0 (0.0%) | 23 (24.0%) |
| $100,000 to $149,999 | 17 (8.0%) | 6 (6.2%) |
| $150,000 or more | 31 (14.6%) | 15 (15.6%) |
| Total | 212 (100.0%) | 96 (100.0%) |
Property Value to Household Income Ratio in Mccloud
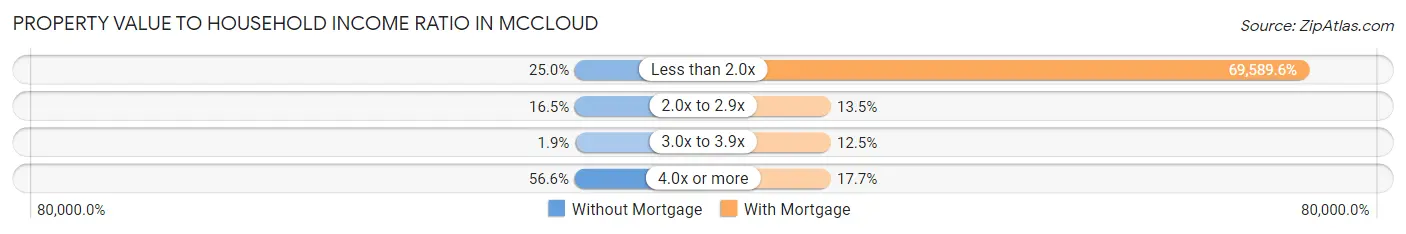
| Value-to-Income Ratio | Without Mortgage | With Mortgage |
| Less than 2.0x | 53 (25.0%) | 66,806 (69,589.6%) |
| 2.0x to 2.9x | 35 (16.5%) | 13 (13.5%) |
| 3.0x to 3.9x | 4 (1.9%) | 12 (12.5%) |
| 4.0x or more | 120 (56.6%) | 17 (17.7%) |
| Total | 212 (100.0%) | 96 (100.0%) |
Real Estate Taxes by Mortgage Status in Mccloud
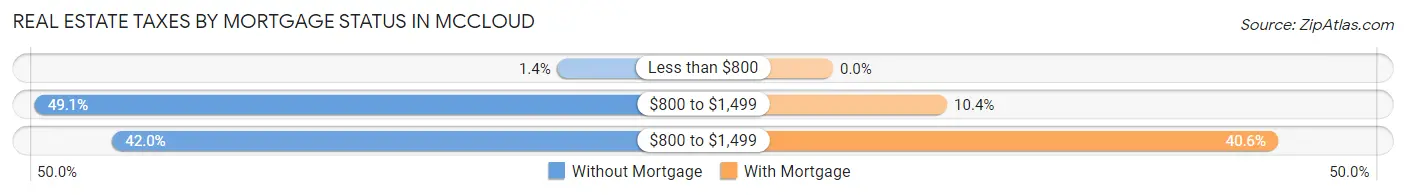
| Property Taxes | Without Mortgage | With Mortgage |
| Less than $800 | 3 (1.4%) | 0 (0.0%) |
| $800 to $1,499 | 104 (49.1%) | 10 (10.4%) |
| $800 to $1,499 | 89 (42.0%) | 39 (40.6%) |
| Total | 212 (100.0%) | 96 (100.0%) |
Health & Disability in Mccloud
Health Insurance Coverage by Age in Mccloud
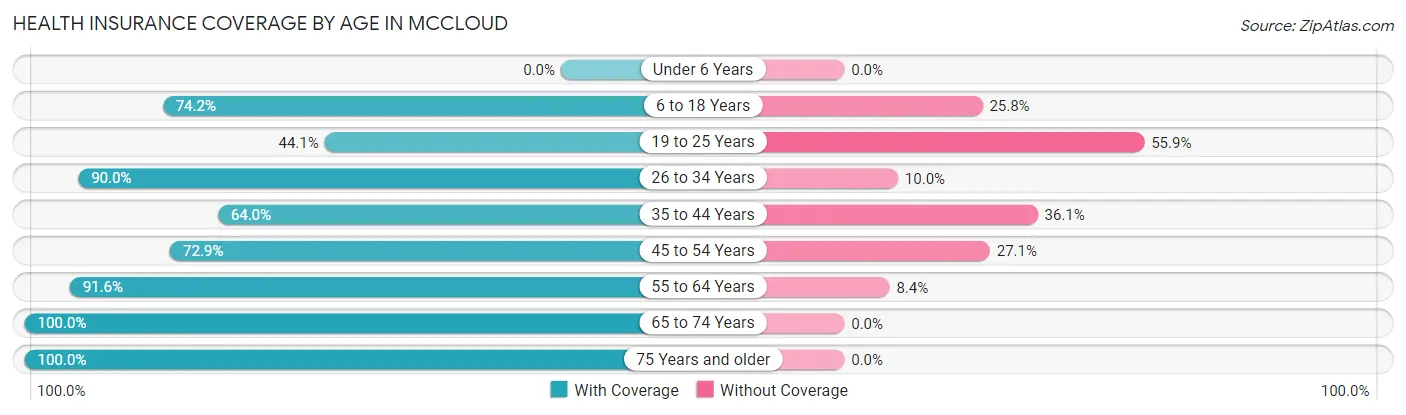
| Age Bracket | With Coverage | Without Coverage |
| Under 6 Years | 0 (0.0%) | 0 (0.0%) |
| 6 to 18 Years | 170 (74.2%) | 59 (25.8%) |
| 19 to 25 Years | 26 (44.1%) | 33 (55.9%) |
| 26 to 34 Years | 9 (90.0%) | 1 (10.0%) |
| 35 to 44 Years | 55 (63.9%) | 31 (36.0%) |
| 45 to 54 Years | 94 (72.9%) | 35 (27.1%) |
| 55 to 64 Years | 87 (91.6%) | 8 (8.4%) |
| 65 to 74 Years | 189 (100.0%) | 0 (0.0%) |
| 75 Years and older | 162 (100.0%) | 0 (0.0%) |
| Total | 792 (82.6%) | 167 (17.4%) |
Health Insurance Coverage by Citizenship Status in Mccloud
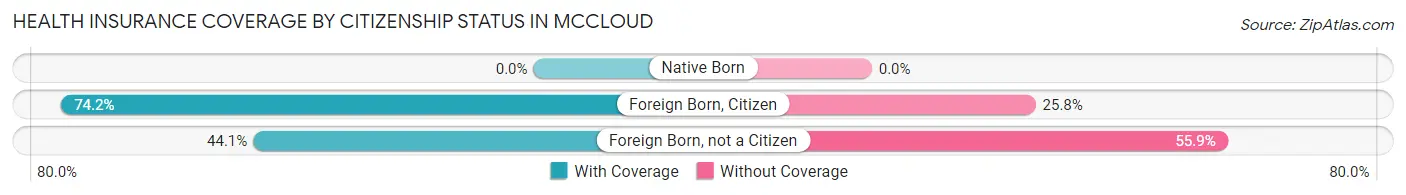
| Citizenship Status | With Coverage | Without Coverage |
| Native Born | 0 (0.0%) | 0 (0.0%) |
| Foreign Born, Citizen | 170 (74.2%) | 59 (25.8%) |
| Foreign Born, not a Citizen | 26 (44.1%) | 33 (55.9%) |
Health Insurance Coverage by Household Income in Mccloud
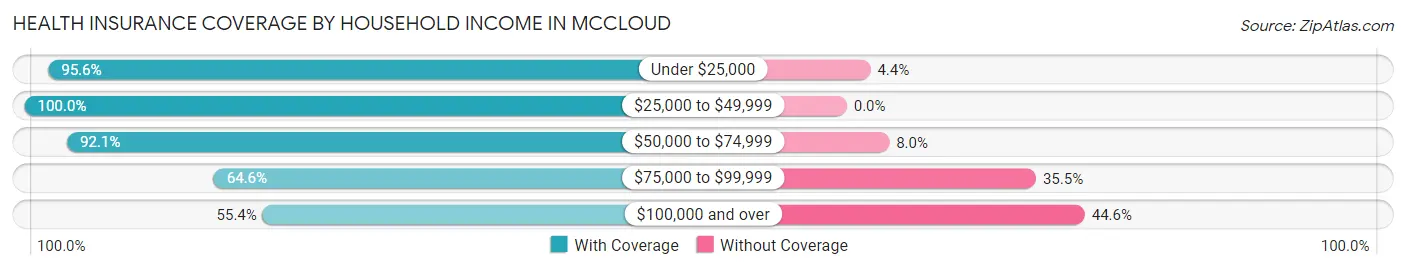
| Household Income | With Coverage | Without Coverage |
| Under $25,000 | 215 (95.6%) | 10 (4.4%) |
| $25,000 to $49,999 | 212 (100.0%) | 0 (0.0%) |
| $50,000 to $74,999 | 162 (92.0%) | 14 (8.0%) |
| $75,000 to $99,999 | 71 (64.5%) | 39 (35.4%) |
| $100,000 and over | 128 (55.4%) | 103 (44.6%) |
Public vs Private Health Insurance Coverage by Age in Mccloud
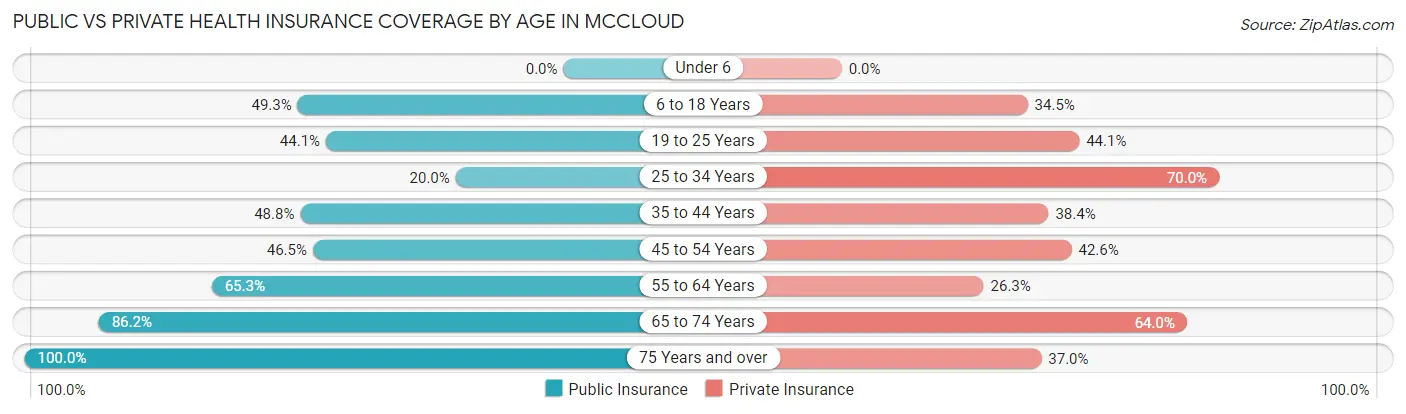
| Age Bracket | Public Insurance | Private Insurance |
| Under 6 | 0 (0.0%) | 0 (0.0%) |
| 6 to 18 Years | 113 (49.3%) | 79 (34.5%) |
| 19 to 25 Years | 26 (44.1%) | 26 (44.1%) |
| 25 to 34 Years | 2 (20.0%) | 7 (70.0%) |
| 35 to 44 Years | 42 (48.8%) | 33 (38.4%) |
| 45 to 54 Years | 60 (46.5%) | 55 (42.6%) |
| 55 to 64 Years | 62 (65.3%) | 25 (26.3%) |
| 65 to 74 Years | 163 (86.2%) | 121 (64.0%) |
| 75 Years and over | 162 (100.0%) | 60 (37.0%) |
| Total | 630 (65.7%) | 406 (42.3%) |
Disability Status by Sex by Age in Mccloud
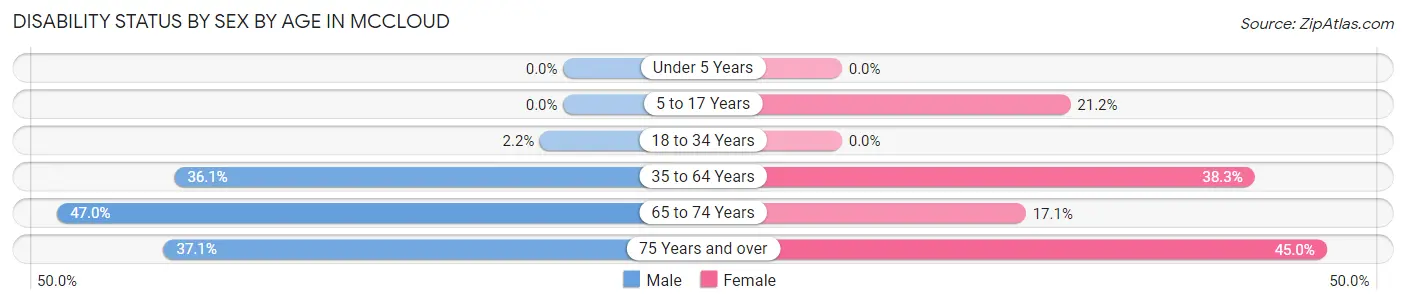
| Age Bracket | Male | Female |
| Under 5 Years | 0 (0.0%) | 0 (0.0%) |
| 5 to 17 Years | 0 (0.0%) | 7 (21.2%) |
| 18 to 34 Years | 2 (2.1%) | 0 (0.0%) |
| 35 to 64 Years | 61 (36.1%) | 54 (38.3%) |
| 65 to 74 Years | 31 (47.0%) | 21 (17.1%) |
| 75 Years and over | 23 (37.1%) | 45 (45.0%) |
Disability Class by Sex by Age in Mccloud
Disability Class: Hearing Difficulty
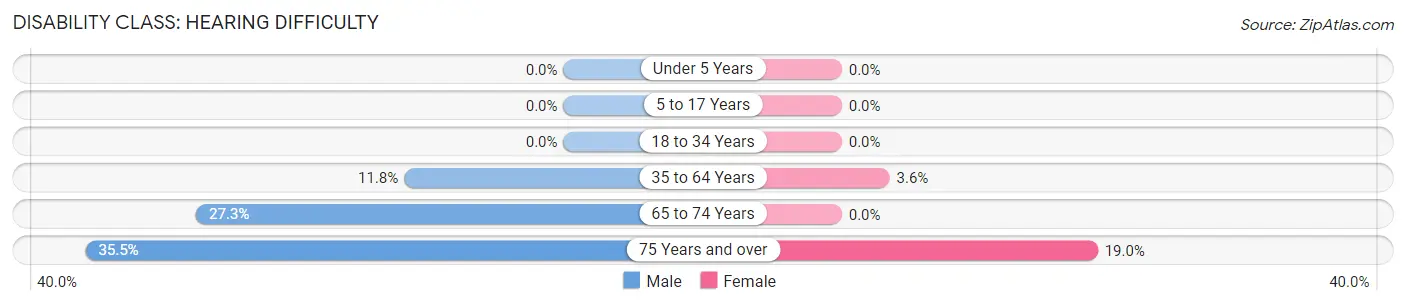
| Age Bracket | Male | Female |
| Under 5 Years | 0 (0.0%) | 0 (0.0%) |
| 5 to 17 Years | 0 (0.0%) | 0 (0.0%) |
| 18 to 34 Years | 0 (0.0%) | 0 (0.0%) |
| 35 to 64 Years | 20 (11.8%) | 5 (3.5%) |
| 65 to 74 Years | 18 (27.3%) | 0 (0.0%) |
| 75 Years and over | 22 (35.5%) | 19 (19.0%) |
Disability Class: Vision Difficulty
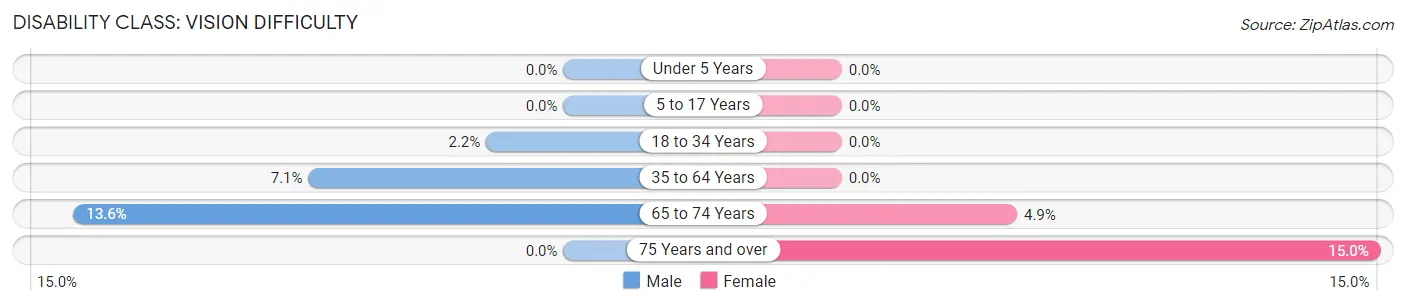
| Age Bracket | Male | Female |
| Under 5 Years | 0 (0.0%) | 0 (0.0%) |
| 5 to 17 Years | 0 (0.0%) | 0 (0.0%) |
| 18 to 34 Years | 2 (2.1%) | 0 (0.0%) |
| 35 to 64 Years | 12 (7.1%) | 0 (0.0%) |
| 65 to 74 Years | 9 (13.6%) | 6 (4.9%) |
| 75 Years and over | 0 (0.0%) | 15 (15.0%) |
Disability Class: Cognitive Difficulty
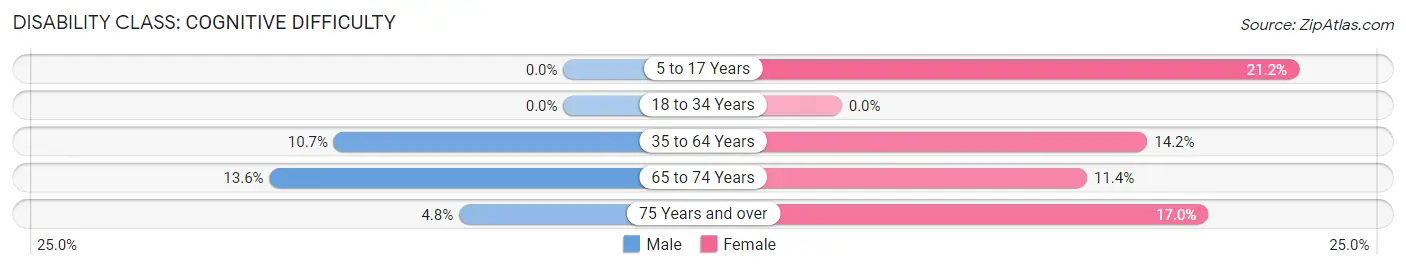
| Age Bracket | Male | Female |
| 5 to 17 Years | 0 (0.0%) | 7 (21.2%) |
| 18 to 34 Years | 0 (0.0%) | 0 (0.0%) |
| 35 to 64 Years | 18 (10.6%) | 20 (14.2%) |
| 65 to 74 Years | 9 (13.6%) | 14 (11.4%) |
| 75 Years and over | 3 (4.8%) | 17 (17.0%) |
Disability Class: Ambulatory Difficulty
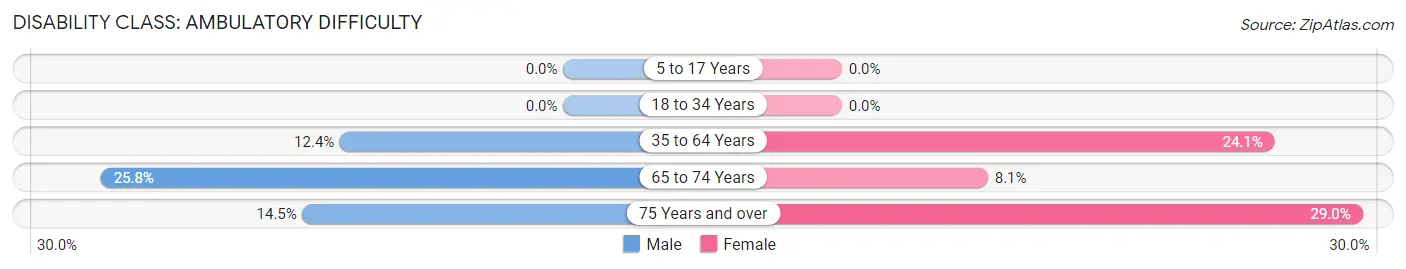
| Age Bracket | Male | Female |
| 5 to 17 Years | 0 (0.0%) | 0 (0.0%) |
| 18 to 34 Years | 0 (0.0%) | 0 (0.0%) |
| 35 to 64 Years | 21 (12.4%) | 34 (24.1%) |
| 65 to 74 Years | 17 (25.8%) | 10 (8.1%) |
| 75 Years and over | 9 (14.5%) | 29 (29.0%) |
Disability Class: Self-Care Difficulty
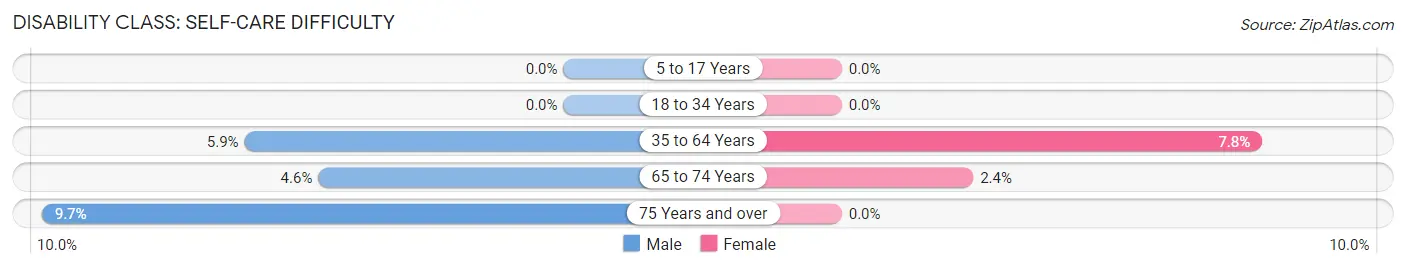
| Age Bracket | Male | Female |
| 5 to 17 Years | 0 (0.0%) | 0 (0.0%) |
| 18 to 34 Years | 0 (0.0%) | 0 (0.0%) |
| 35 to 64 Years | 10 (5.9%) | 11 (7.8%) |
| 65 to 74 Years | 3 (4.5%) | 3 (2.4%) |
| 75 Years and over | 6 (9.7%) | 0 (0.0%) |
Technology Access in Mccloud
Computing Device Access in Mccloud
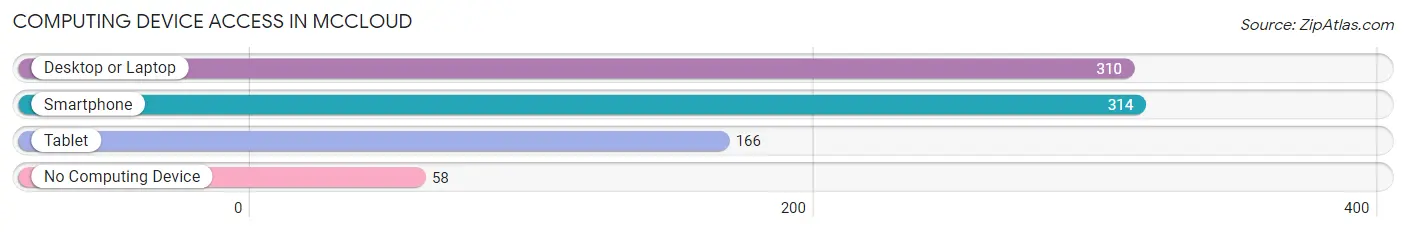
| Device Type | # Households | % Households |
| Desktop or Laptop | 310 | 72.1% |
| Smartphone | 314 | 73.0% |
| Tablet | 166 | 38.6% |
| No Computing Device | 58 | 13.5% |
| Total | 430 | 100.0% |
Internet Access in Mccloud
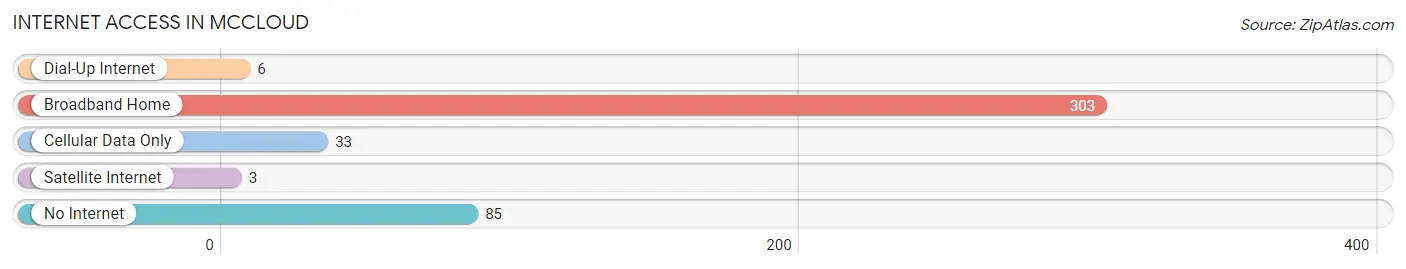
| Internet Type | # Households | % Households |
| Dial-Up Internet | 6 | 1.4% |
| Broadband Home | 303 | 70.5% |
| Cellular Data Only | 33 | 7.7% |
| Satellite Internet | 3 | 0.7% |
| No Internet | 85 | 19.8% |
| Total | 430 | 100.0% |
Mccloud Summary
Mccloud, California is a small town located in Siskiyou County, California. It is situated in the Shasta Cascade region of Northern California, and is surrounded by the Shasta-Trinity National Forest. The town has a population of approximately 1,000 people, and is known for its picturesque mountain views and outdoor recreation opportunities.
Geography
Mccloud is located in the Shasta Cascade region of Northern California, and is situated in the Shasta-Trinity National Forest. The town is located at an elevation of 3,000 feet, and is surrounded by the Cascade Range and the Klamath Mountains. The town is located on the McCloud River, which is a tributary of the Sacramento River. The town is located approximately 80 miles north of Redding, California, and is accessible via State Route 89.
Climate
Mccloud has a Mediterranean climate, with hot, dry summers and cool, wet winters. The average high temperature in the summer is around 90 degrees Fahrenheit, and the average low temperature in the winter is around 30 degrees Fahrenheit. The town receives an average of 20 inches of precipitation per year, with most of the precipitation occurring in the winter months.
Demographics
As of the 2010 census, the population of Mccloud was 1,039. The racial makeup of the town was 94.3% White, 0.7% African American, 0.7% Native American, 0.7% Asian, 0.2% Pacific Islander, 1.2% from other races, and 2.1% from two or more races. Hispanic or Latino of any race were 4.2% of the population.
Economy
Mccloud’s economy is largely based on tourism and outdoor recreation. The town is home to several resorts, campgrounds, and other recreational facilities. The town is also home to several restaurants, shops, and other businesses. The town is also home to several logging and timber companies, as well as a few small manufacturing companies.
History
Mccloud was founded in 1883 by a group of settlers from the Midwest. The town was named after Alexander McCloud, who was a prominent local businessman and politician. The town quickly grew, and by the early 1900s, it had become a popular tourist destination. The town was also home to several logging and timber companies, which helped to fuel the local economy.
In the 1950s, the town began to decline as the logging industry began to decline. The town was revitalized in the 1970s, when it became a popular destination for outdoor recreation. The town has since become a popular destination for tourists, and is home to several resorts, campgrounds, and other recreational facilities.
Common Questions
What is Per Capita Income in Mccloud?
Per Capita income in Mccloud is $32,474.
What is the Median Family Income in Mccloud?
Median Family Income in Mccloud is $56,875.
What is the Median Household income in Mccloud?
Median Household Income in Mccloud is $42,500.
What is Inequality or Gini Index in Mccloud?
Inequality or Gini Index in Mccloud is 0.45.
What is the Total Population of Mccloud?
Total Population of Mccloud is 959.
What is the Total Male Population of Mccloud?
Total Male Population of Mccloud is 499.
What is the Total Female Population of Mccloud?
Total Female Population of Mccloud is 460.
What is the Ratio of Males per 100 Females in Mccloud?
There are 108.48 Males per 100 Females in Mccloud.
What is the Ratio of Females per 100 Males in Mccloud?
There are 92.18 Females per 100 Males in Mccloud.
What is the Median Population Age in Mccloud?
Median Population Age in Mccloud is 50.6 Years.
What is the Average Family Size in Mccloud
Average Family Size in Mccloud is 3.2 People.
What is the Average Household Size in Mccloud
Average Household Size in Mccloud is 2.2 People.
How Large is the Labor Force in Mccloud?
There are 367 People in the Labor Forcein in Mccloud.
What is the Percentage of People in the Labor Force in Mccloud?
43.5% of People are in the Labor Force in Mccloud.
What is the Unemployment Rate in Mccloud?
Unemployment Rate in Mccloud is 10.4%.