Marysville, CA Map & Demographics
Marysville Map
Marysville Overview
$25,755
PER CAPITA INCOME
$59,100
AVG FAMILY INCOME
$52,012
AVG HOUSEHOLD INCOME
39.6%
WAGE / INCOME GAP [ % ]
60.4¢/ $1
WAGE / INCOME GAP [ $ ]
$11,288
FAMILY INCOME DEFICIT
0.44
INEQUALITY / GINI INDEX
12,681
TOTAL POPULATION
6,409
MALE POPULATION
6,272
FEMALE POPULATION
102.18
MALES / 100 FEMALES
97.86
FEMALES / 100 MALES
33.6
MEDIAN AGE
3.3
AVG FAMILY SIZE
2.6
AVG HOUSEHOLD SIZE
5,455
LABOR FORCE [ PEOPLE ]
56.5%
PERCENT IN LABOR FORCE
7.7%
UNEMPLOYMENT RATE
Marysville Zip Codes
Marysville Area Codes
Income in Marysville
Income Overview in Marysville
Per Capita Income in Marysville is $25,755, while median incomes of families and households are $59,100 and $52,012 respectively.
| Characteristic | Number | Measure |
| Per Capita Income | 12,681 | $25,755 |
| Median Family Income | 2,868 | $59,100 |
| Mean Family Income | 2,868 | $75,326 |
| Median Household Income | 4,733 | $52,012 |
| Mean Household Income | 4,733 | $66,851 |
| Income Deficit | 2,868 | $11,288 |
| Wage / Income Gap (%) | 12,681 | 39.59% |
| Wage / Income Gap ($) | 12,681 | 60.41¢ per $1 |
| Gini / Inequality Index | 12,681 | 0.44 |
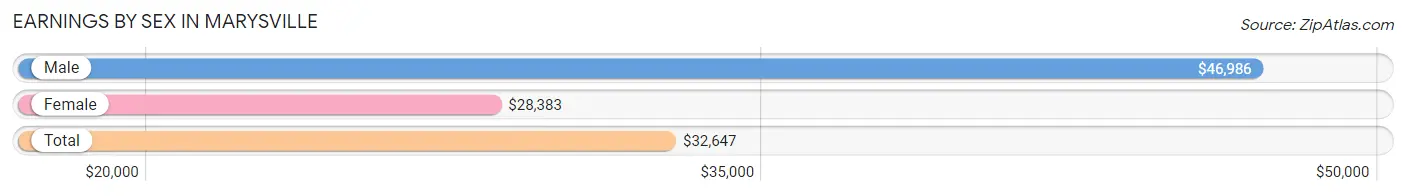
Earnings by Sex in Marysville
Average Earnings in Marysville are $32,647, $46,986 for men and $28,383 for women, a difference of 39.6%.
| Sex | Number | Average Earnings |
| Male | 2,774 (47.9%) | $46,986 |
| Female | 3,013 (52.1%) | $28,383 |
| Total | 5,787 (100.0%) | $32,647 |
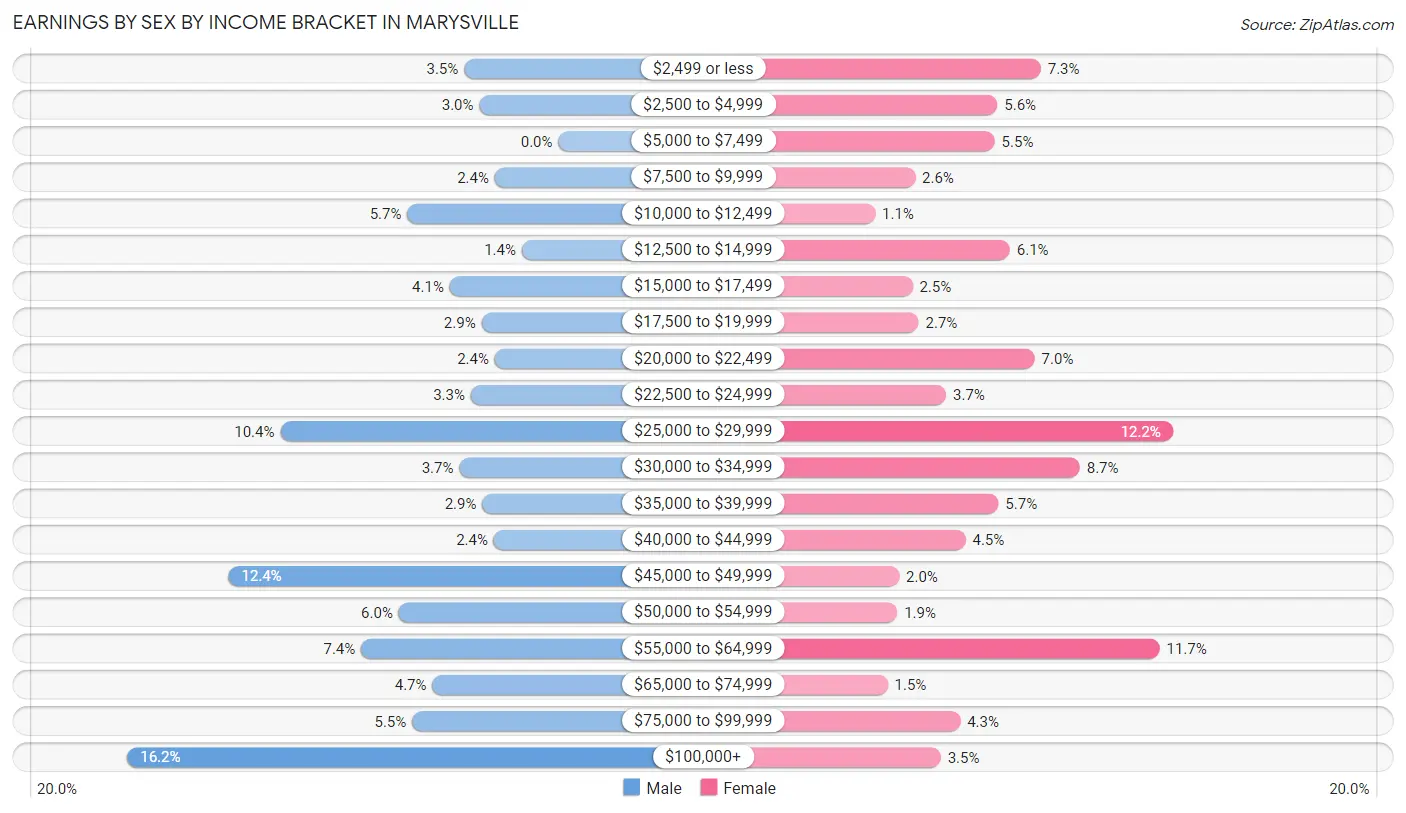
Earnings by Sex by Income Bracket in Marysville
The most common earnings brackets in Marysville are $100,000+ for men (448 | 16.2%) and $25,000 to $29,999 for women (368 | 12.2%).
| Income | Male | Female |
| $2,499 or less | 98 (3.5%) | 219 (7.3%) |
| $2,500 to $4,999 | 82 (3.0%) | 170 (5.6%) |
| $5,000 to $7,499 | 0 (0.0%) | 167 (5.5%) |
| $7,500 to $9,999 | 66 (2.4%) | 77 (2.6%) |
| $10,000 to $12,499 | 157 (5.7%) | 32 (1.1%) |
| $12,500 to $14,999 | 38 (1.4%) | 184 (6.1%) |
| $15,000 to $17,499 | 113 (4.1%) | 74 (2.5%) |
| $17,500 to $19,999 | 80 (2.9%) | 81 (2.7%) |
| $20,000 to $22,499 | 66 (2.4%) | 212 (7.0%) |
| $22,500 to $24,999 | 91 (3.3%) | 112 (3.7%) |
| $25,000 to $29,999 | 289 (10.4%) | 368 (12.2%) |
| $30,000 to $34,999 | 103 (3.7%) | 263 (8.7%) |
| $35,000 to $39,999 | 79 (2.9%) | 171 (5.7%) |
| $40,000 to $44,999 | 67 (2.4%) | 134 (4.4%) |
| $45,000 to $49,999 | 343 (12.4%) | 59 (2.0%) |
| $50,000 to $54,999 | 166 (6.0%) | 57 (1.9%) |
| $55,000 to $64,999 | 205 (7.4%) | 353 (11.7%) |
| $65,000 to $74,999 | 131 (4.7%) | 46 (1.5%) |
| $75,000 to $99,999 | 152 (5.5%) | 128 (4.3%) |
| $100,000+ | 448 (16.2%) | 106 (3.5%) |
| Total | 2,774 (100.0%) | 3,013 (100.0%) |
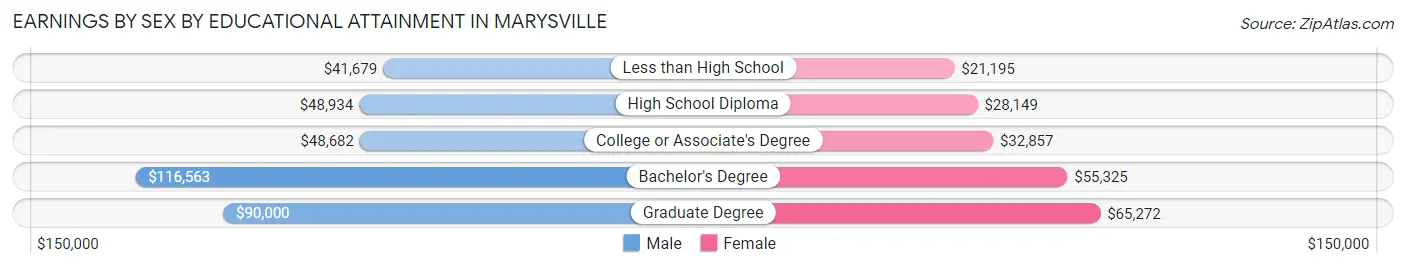
Earnings by Sex by Educational Attainment in Marysville
Average earnings in Marysville are $49,486 for men and $29,902 for women, a difference of 39.6%. Men with an educational attainment of bachelor's degree enjoy the highest average annual earnings of $116,563, while those with less than high school education earn the least with $41,679. Women with an educational attainment of graduate degree earn the most with the average annual earnings of $65,272, while those with less than high school education have the smallest earnings of $21,195.
| Educational Attainment | Male Income | Female Income |
| Less than High School | $41,679 | $21,195 |
| High School Diploma | $48,934 | $28,149 |
| College or Associate's Degree | $48,682 | $32,857 |
| Bachelor's Degree | $116,563 | $55,325 |
| Graduate Degree | $90,000 | $65,272 |
| Total | $49,486 | $29,902 |
Family Income in Marysville
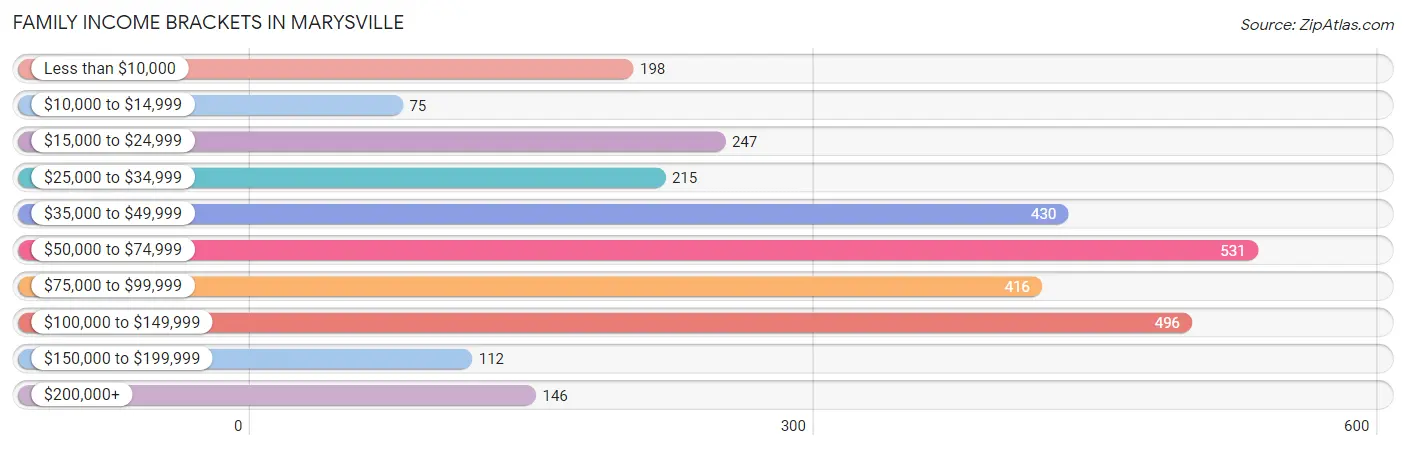
Family Income Brackets in Marysville
According to the Marysville family income data, there are 531 families falling into the $50,000 to $74,999 income range, which is the most common income bracket and makes up 18.5% of all families. Conversely, the $10,000 to $14,999 income bracket is the least frequent group with only 75 families (2.6%) belonging to this category.
| Income Bracket | # Families | % Families |
| Less than $10,000 | 198 | 6.9% |
| $10,000 to $14,999 | 75 | 2.6% |
| $15,000 to $24,999 | 247 | 8.6% |
| $25,000 to $34,999 | 215 | 7.5% |
| $35,000 to $49,999 | 430 | 15.0% |
| $50,000 to $74,999 | 531 | 18.5% |
| $75,000 to $99,999 | 416 | 14.5% |
| $100,000 to $149,999 | 496 | 17.3% |
| $150,000 to $199,999 | 112 | 3.9% |
| $200,000+ | 146 | 5.1% |
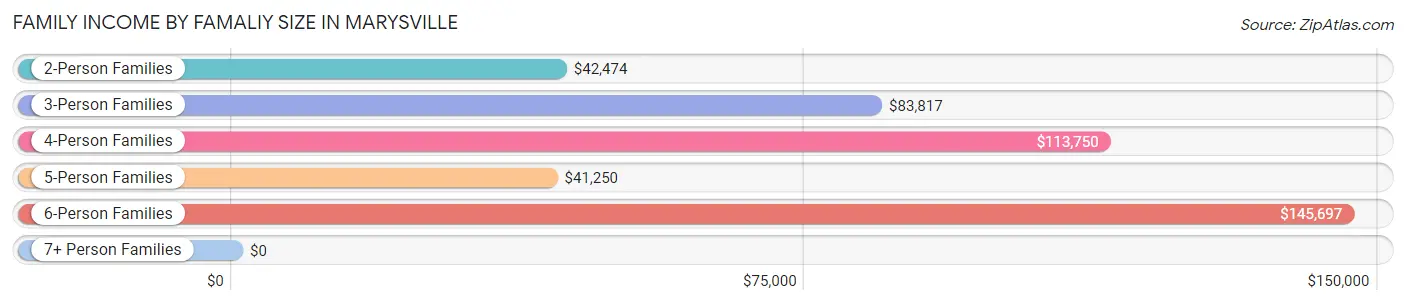
Family Income by Famaliy Size in Marysville
6-person families (198 | 6.9%) account for the highest median family income in Marysville with $145,697 per family, while 4-person families (276 | 9.6%) have the highest median income of $28,438 per family member.
| Income Bracket | # Families | Median Income |
| 2-Person Families | 1,287 (44.9%) | $42,474 |
| 3-Person Families | 680 (23.7%) | $83,817 |
| 4-Person Families | 276 (9.6%) | $113,750 |
| 5-Person Families | 413 (14.4%) | $41,250 |
| 6-Person Families | 198 (6.9%) | $145,697 |
| 7+ Person Families | 14 (0.5%) | $0 |
| Total | 2,868 (100.0%) | $59,100 |
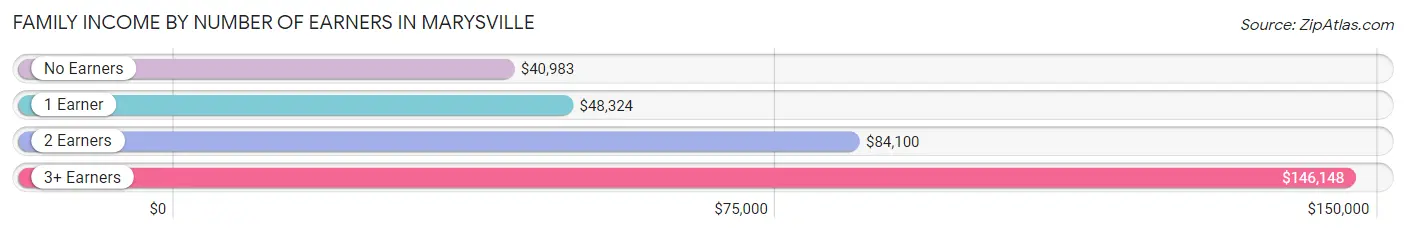
Family Income by Number of Earners in Marysville
The median family income in Marysville is $59,100, with families comprising 3+ earners (216) having the highest median family income of $146,148, while families with no earners (323) have the lowest median family income of $40,983, accounting for 7.5% and 11.3% of families, respectively.
| Number of Earners | # Families | Median Income |
| No Earners | 323 (11.3%) | $40,983 |
| 1 Earner | 1,581 (55.1%) | $48,324 |
| 2 Earners | 748 (26.1%) | $84,100 |
| 3+ Earners | 216 (7.5%) | $146,148 |
| Total | 2,868 (100.0%) | $59,100 |
Household Income in Marysville
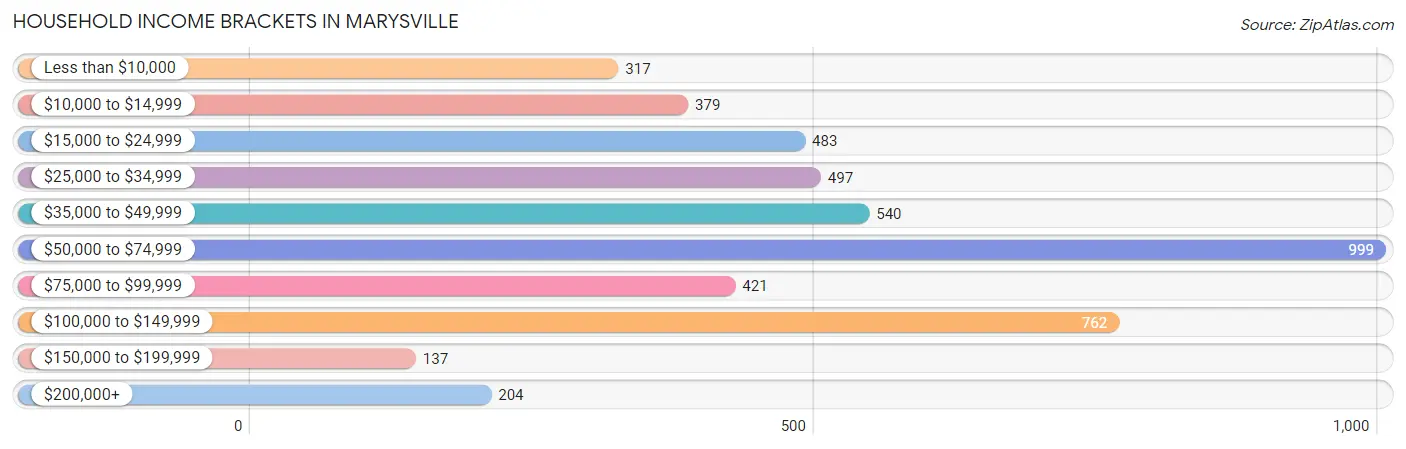
Household Income Brackets in Marysville
With 999 households falling in the category, the $50,000 to $74,999 income range is the most frequent in Marysville, accounting for 21.1% of all households. In contrast, only 137 households (2.9%) fall into the $150,000 to $199,999 income bracket, making it the least populous group.
| Income Bracket | # Households | % Households |
| Less than $10,000 | 317 | 6.7% |
| $10,000 to $14,999 | 379 | 8.0% |
| $15,000 to $24,999 | 483 | 10.2% |
| $25,000 to $34,999 | 497 | 10.5% |
| $35,000 to $49,999 | 540 | 11.4% |
| $50,000 to $74,999 | 999 | 21.1% |
| $75,000 to $99,999 | 421 | 8.9% |
| $100,000 to $149,999 | 762 | 16.1% |
| $150,000 to $199,999 | 137 | 2.9% |
| $200,000+ | 204 | 4.3% |
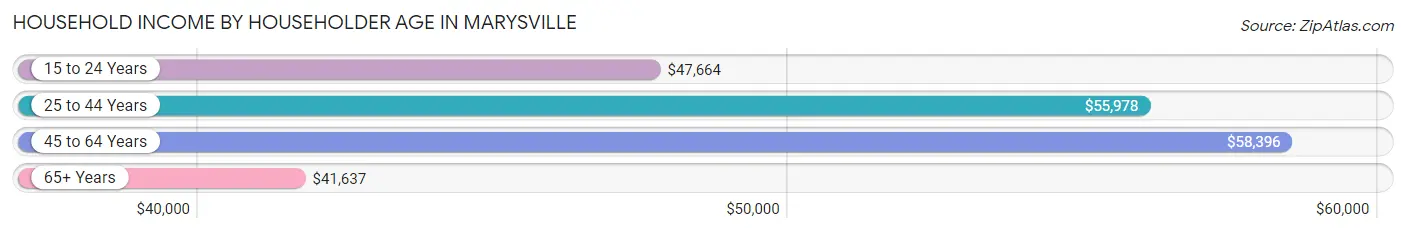
Household Income by Householder Age in Marysville
The median household income in Marysville is $52,012, with the highest median household income of $58,396 found in the 45 to 64 years age bracket for the primary householder. A total of 1,675 households (35.4%) fall into this category. Meanwhile, the 65+ years age bracket for the primary householder has the lowest median household income of $41,637, with 1,022 households (21.6%) in this group.
| Income Bracket | # Households | Median Income |
| 15 to 24 Years | 193 (4.1%) | $47,664 |
| 25 to 44 Years | 1,843 (38.9%) | $55,978 |
| 45 to 64 Years | 1,675 (35.4%) | $58,396 |
| 65+ Years | 1,022 (21.6%) | $41,637 |
| Total | 4,733 (100.0%) | $52,012 |
Poverty in Marysville
Income Below Poverty by Sex and Age in Marysville
With 21.7% poverty level for males and 26.7% for females among the residents of Marysville, 15 year old males and 16 and 17 year old females are the most vulnerable to poverty, with 159 males (55.8%) and 234 females (67.6%) in their respective age groups living below the poverty level.
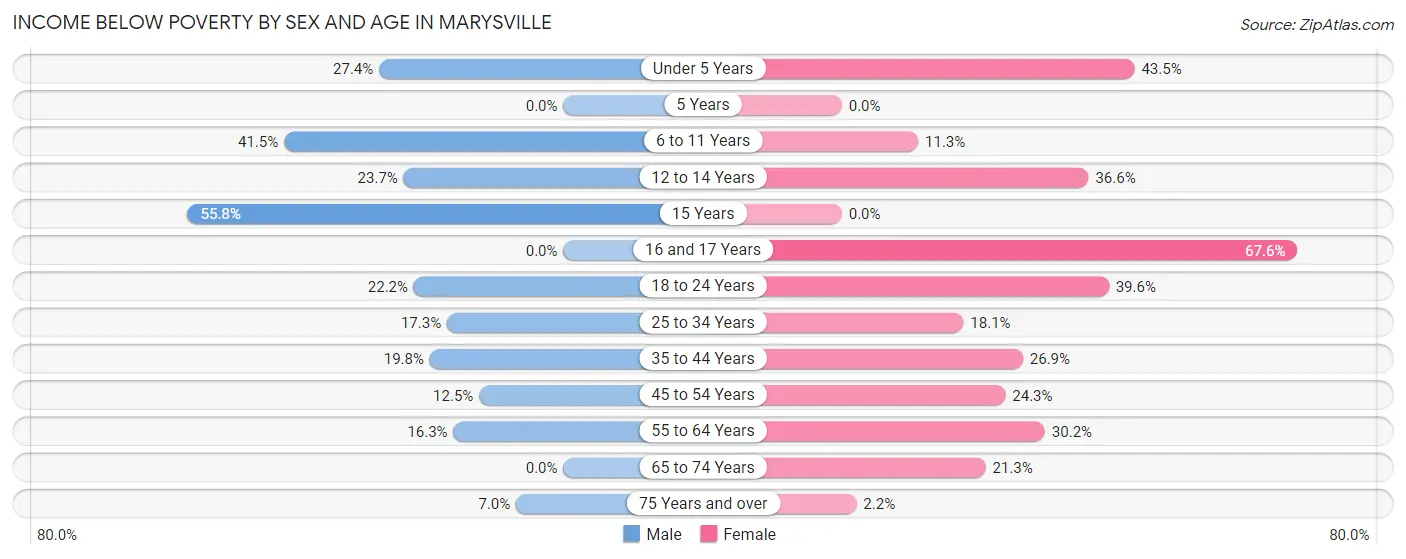
| Age Bracket | Male | Female |
| Under 5 Years | 116 (27.4%) | 186 (43.5%) |
| 5 Years | 0 (0.0%) | 0 (0.0%) |
| 6 to 11 Years | 338 (41.5%) | 41 (11.3%) |
| 12 to 14 Years | 92 (23.7%) | 63 (36.6%) |
| 15 Years | 159 (55.8%) | 0 (0.0%) |
| 16 and 17 Years | 0 (0.0%) | 234 (67.6%) |
| 18 to 24 Years | 113 (22.2%) | 176 (39.6%) |
| 25 to 34 Years | 136 (17.3%) | 188 (18.1%) |
| 35 to 44 Years | 166 (19.8%) | 270 (26.9%) |
| 45 to 54 Years | 71 (12.5%) | 136 (24.3%) |
| 55 to 64 Years | 111 (16.3%) | 247 (30.2%) |
| 65 to 74 Years | 0 (0.0%) | 105 (21.3%) |
| 75 Years and over | 13 (7.0%) | 9 (2.2%) |
| Total | 1,315 (21.7%) | 1,655 (26.7%) |
Income Above Poverty by Sex and Age in Marysville
According to the poverty statistics in Marysville, males aged 5 years and females aged 5 years are the age groups that are most secure financially, with 100.0% of males and 100.0% of females in these age groups living above the poverty line.
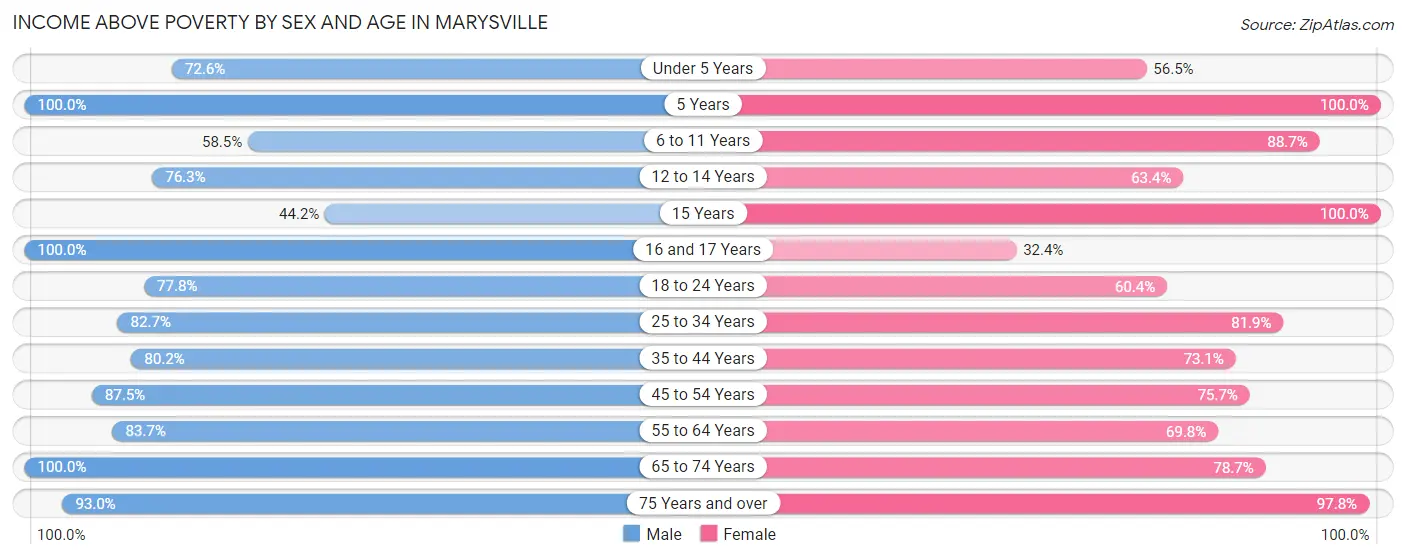
| Age Bracket | Male | Female |
| Under 5 Years | 308 (72.6%) | 242 (56.5%) |
| 5 Years | 25 (100.0%) | 106 (100.0%) |
| 6 to 11 Years | 477 (58.5%) | 321 (88.7%) |
| 12 to 14 Years | 296 (76.3%) | 109 (63.4%) |
| 15 Years | 126 (44.2%) | 5 (100.0%) |
| 16 and 17 Years | 190 (100.0%) | 112 (32.4%) |
| 18 to 24 Years | 396 (77.8%) | 268 (60.4%) |
| 25 to 34 Years | 651 (82.7%) | 853 (81.9%) |
| 35 to 44 Years | 671 (80.2%) | 734 (73.1%) |
| 45 to 54 Years | 497 (87.5%) | 424 (75.7%) |
| 55 to 64 Years | 569 (83.7%) | 572 (69.8%) |
| 65 to 74 Years | 368 (100.0%) | 387 (78.7%) |
| 75 Years and over | 172 (93.0%) | 406 (97.8%) |
| Total | 4,746 (78.3%) | 4,539 (73.3%) |
Income Below Poverty Among Married-Couple Families in Marysville
The poverty statistics for married-couple families in Marysville show that 6.1% or 88 of the total 1,435 families live below the poverty line. Families with 3 or 4 children have the highest poverty rate of 26.6%, comprising of 51 families. On the other hand, families with 5 or more children have the lowest poverty rate of 0.0%, which includes 0 families.
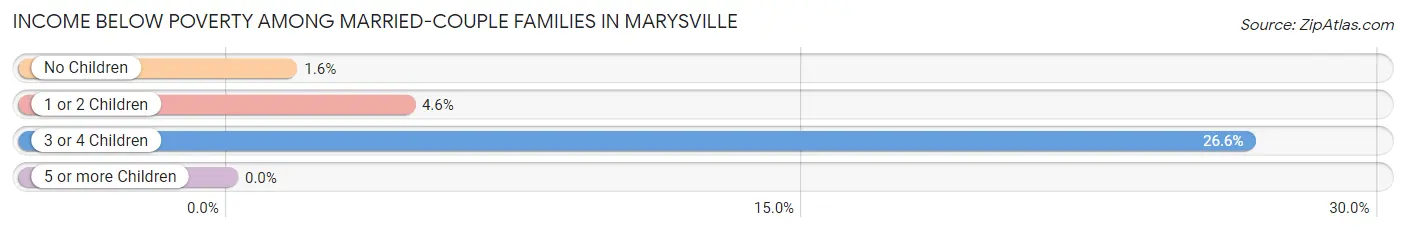
| Children | Above Poverty | Below Poverty |
| No Children | 634 (98.5%) | 10 (1.5%) |
| 1 or 2 Children | 558 (95.4%) | 27 (4.6%) |
| 3 or 4 Children | 141 (73.4%) | 51 (26.6%) |
| 5 or more Children | 14 (100.0%) | 0 (0.0%) |
| Total | 1,347 (93.9%) | 88 (6.1%) |
Income Below Poverty Among Single-Parent Households in Marysville
According to the poverty data in Marysville, 13.0% or 42 single-father households and 39.4% or 437 single-mother households are living below the poverty line. Among single-father households, those with 1 or 2 children have the highest poverty rate, with 42 households (22.2%) experiencing poverty. Likewise, among single-mother households, those with 3 or 4 children have the highest poverty rate, with 190 households (95.0%) falling below the poverty line.
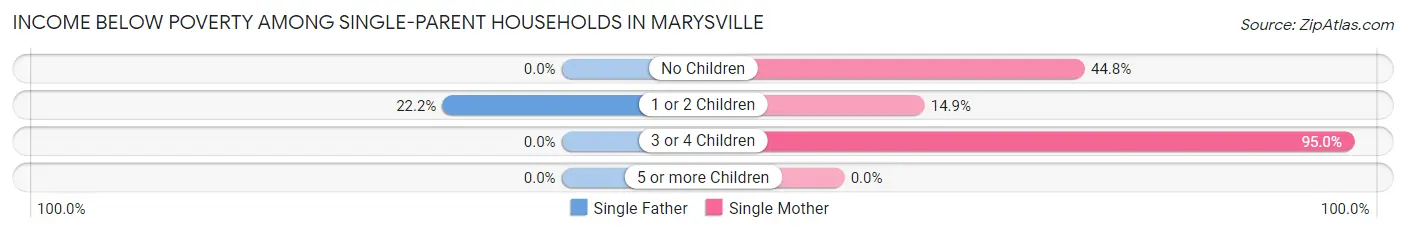
| Children | Single Father | Single Mother |
| No Children | 0 (0.0%) | 167 (44.8%) |
| 1 or 2 Children | 42 (22.2%) | 80 (14.9%) |
| 3 or 4 Children | 0 (0.0%) | 190 (95.0%) |
| 5 or more Children | 0 (0.0%) | 0 (0.0%) |
| Total | 42 (13.0%) | 437 (39.4%) |
Income Below Poverty Among Married-Couple vs Single-Parent Households in Marysville
The poverty data for Marysville shows that 88 of the married-couple family households (6.1%) and 479 of the single-parent households (33.4%) are living below the poverty level. Within the married-couple family households, those with 3 or 4 children have the highest poverty rate, with 51 households (26.6%) falling below the poverty line. Among the single-parent households, those with 3 or 4 children have the highest poverty rate, with 190 household (95.0%) living below poverty.
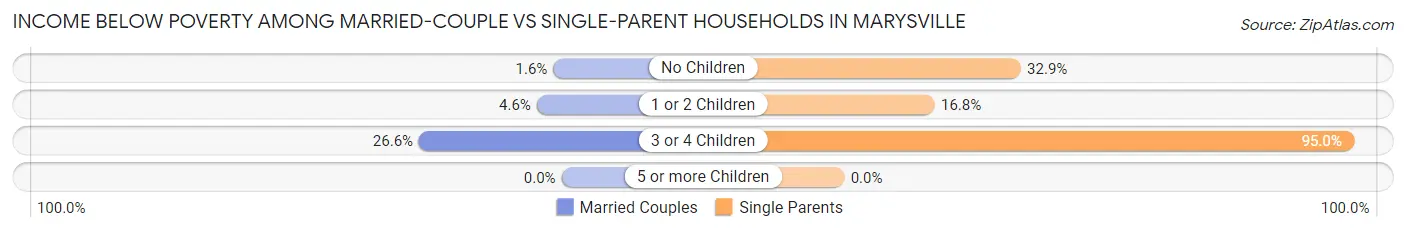
| Children | Married-Couple Families | Single-Parent Households |
| No Children | 10 (1.5%) | 167 (32.9%) |
| 1 or 2 Children | 27 (4.6%) | 122 (16.8%) |
| 3 or 4 Children | 51 (26.6%) | 190 (95.0%) |
| 5 or more Children | 0 (0.0%) | 0 (0.0%) |
| Total | 88 (6.1%) | 479 (33.4%) |
Race in Marysville
The most populous races in Marysville are White / Caucasian (8,691 | 68.5%), Hispanic or Latino (3,509 | 27.7%), and Two or more Races (1,655 | 13.1%).
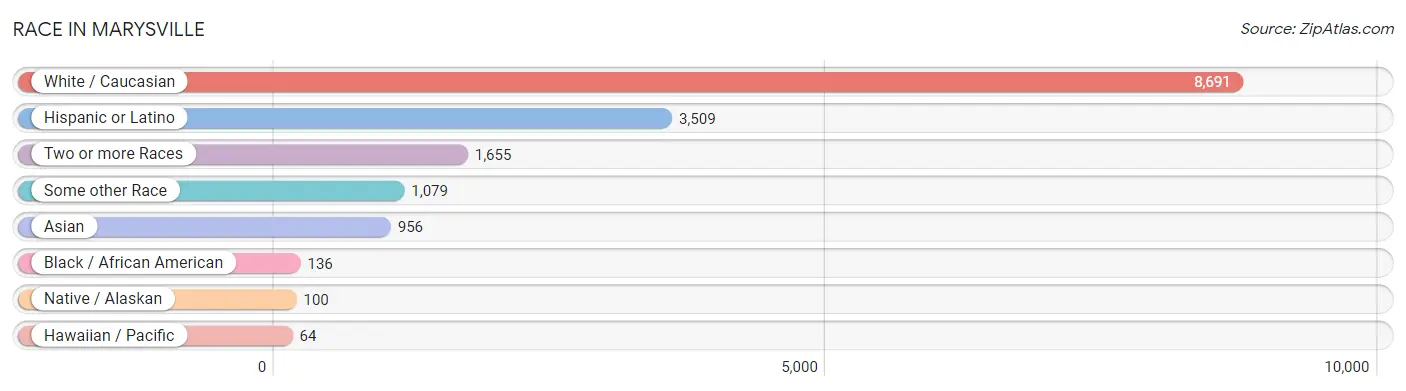
| Race | # Population | % Population |
| Asian | 956 | 7.5% |
| Black / African American | 136 | 1.1% |
| Hawaiian / Pacific | 64 | 0.5% |
| Hispanic or Latino | 3,509 | 27.7% |
| Native / Alaskan | 100 | 0.8% |
| White / Caucasian | 8,691 | 68.5% |
| Two or more Races | 1,655 | 13.1% |
| Some other Race | 1,079 | 8.5% |
| Total | 12,681 | 100.0% |
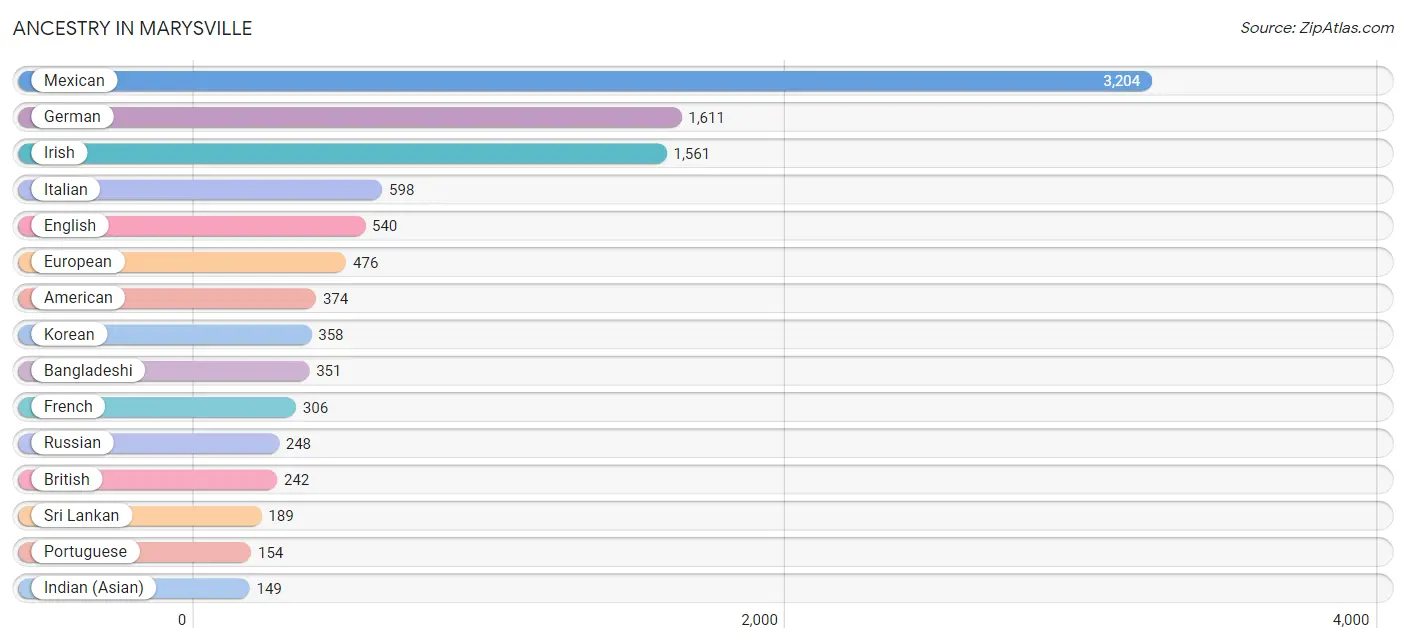
Ancestry in Marysville
The most populous ancestries reported in Marysville are Mexican (3,204 | 25.3%), German (1,611 | 12.7%), Irish (1,561 | 12.3%), Italian (598 | 4.7%), and English (540 | 4.3%), together accounting for 59.3% of all Marysville residents.
| Ancestry | # Population | % Population |
| Afghan | 123 | 1.0% |
| American | 374 | 2.9% |
| Apache | 35 | 0.3% |
| Arab | 14 | 0.1% |
| Armenian | 28 | 0.2% |
| Austrian | 146 | 1.1% |
| Bangladeshi | 351 | 2.8% |
| Basque | 9 | 0.1% |
| Bhutanese | 52 | 0.4% |
| Blackfeet | 85 | 0.7% |
| British | 242 | 1.9% |
| Burmese | 54 | 0.4% |
| Central American | 129 | 1.0% |
| Cherokee | 41 | 0.3% |
| Chickasaw | 148 | 1.2% |
| Czech | 57 | 0.4% |
| Danish | 16 | 0.1% |
| Dominican | 8 | 0.1% |
| Dutch | 75 | 0.6% |
| English | 540 | 4.3% |
| European | 476 | 3.7% |
| Finnish | 22 | 0.2% |
| French | 306 | 2.4% |
| French Canadian | 28 | 0.2% |
| German | 1,611 | 12.7% |
| Greek | 57 | 0.4% |
| Guamanian / Chamorro | 64 | 0.5% |
| Guatemalan | 81 | 0.6% |
| Haitian | 8 | 0.1% |
| Indian (Asian) | 149 | 1.2% |
| Irish | 1,561 | 12.3% |
| Italian | 598 | 4.7% |
| Jamaican | 55 | 0.4% |
| Korean | 358 | 2.8% |
| Mexican | 3,204 | 25.3% |
| Mexican American Indian | 74 | 0.6% |
| Moroccan | 14 | 0.1% |
| Native Hawaiian | 9 | 0.1% |
| Northern European | 10 | 0.1% |
| Norwegian | 147 | 1.2% |
| Panamanian | 13 | 0.1% |
| Polish | 18 | 0.1% |
| Portuguese | 154 | 1.2% |
| Puerto Rican | 47 | 0.4% |
| Russian | 248 | 2.0% |
| Salvadoran | 35 | 0.3% |
| Scandinavian | 132 | 1.0% |
| Scotch-Irish | 29 | 0.2% |
| Scottish | 113 | 0.9% |
| Senegalese | 11 | 0.1% |
| Slavic | 16 | 0.1% |
| South American | 11 | 0.1% |
| Spaniard | 99 | 0.8% |
| Sri Lankan | 189 | 1.5% |
| Subsaharan African | 11 | 0.1% |
| Swedish | 127 | 1.0% |
| Swiss | 23 | 0.2% |
| Thai | 89 | 0.7% |
| Ukrainian | 16 | 0.1% |
| Venezuelan | 11 | 0.1% |
| Welsh | 23 | 0.2% | View All 61 Rows |
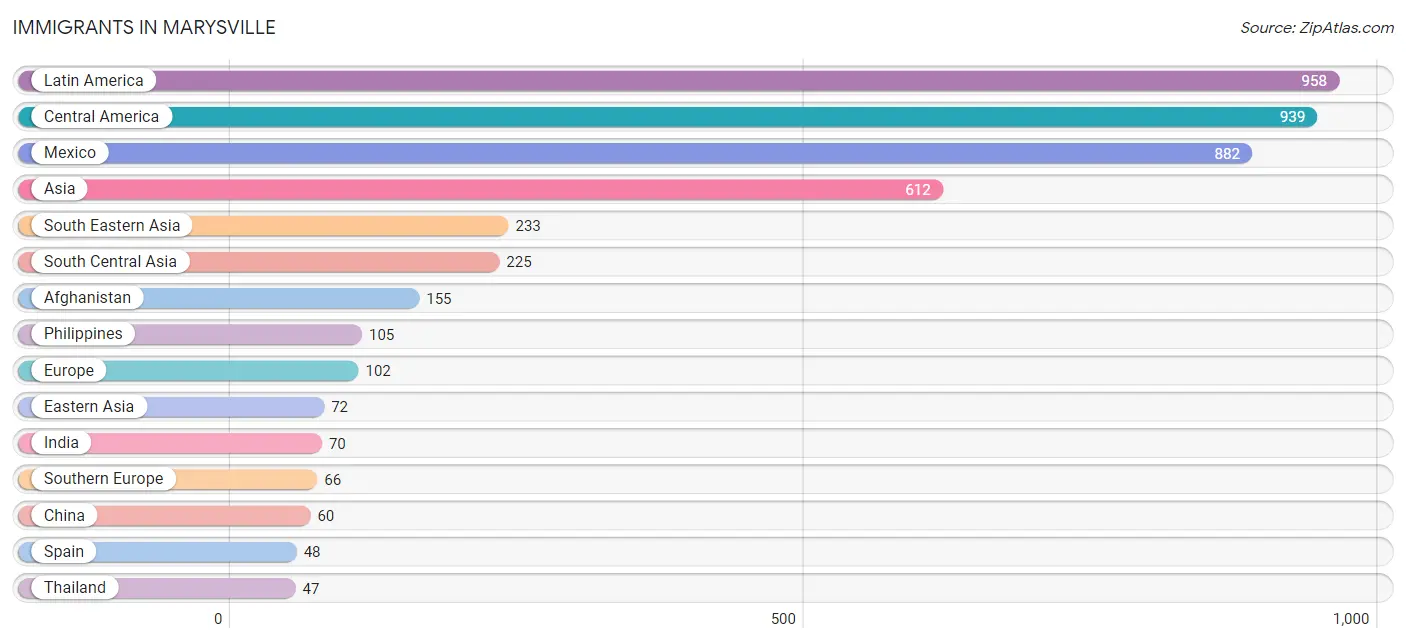
Immigrants in Marysville
The most numerous immigrant groups reported in Marysville came from Latin America (958 | 7.5%), Central America (939 | 7.4%), Mexico (882 | 7.0%), Asia (612 | 4.8%), and South Eastern Asia (233 | 1.8%), together accounting for 28.6% of all Marysville residents.
| Immigration Origin | # Population | % Population |
| Afghanistan | 155 | 1.2% |
| Armenia | 7 | 0.1% |
| Asia | 612 | 4.8% |
| Caribbean | 8 | 0.1% |
| Central America | 939 | 7.4% |
| China | 60 | 0.5% |
| Eastern Asia | 72 | 0.6% |
| Eastern Europe | 25 | 0.2% |
| El Salvador | 25 | 0.2% |
| England | 11 | 0.1% |
| Europe | 102 | 0.8% |
| Guatemala | 32 | 0.3% |
| Haiti | 8 | 0.1% |
| India | 70 | 0.5% |
| Italy | 18 | 0.1% |
| Korea | 12 | 0.1% |
| Laos | 38 | 0.3% |
| Latin America | 958 | 7.5% |
| Mexico | 882 | 7.0% |
| Northern Europe | 11 | 0.1% |
| Philippines | 105 | 0.8% |
| Russia | 25 | 0.2% |
| South America | 11 | 0.1% |
| South Central Asia | 225 | 1.8% |
| South Eastern Asia | 233 | 1.8% |
| Southern Europe | 66 | 0.5% |
| Spain | 48 | 0.4% |
| Thailand | 47 | 0.4% |
| Venezuela | 11 | 0.1% |
| Vietnam | 43 | 0.3% |
| Western Asia | 7 | 0.1% | View All 31 Rows |
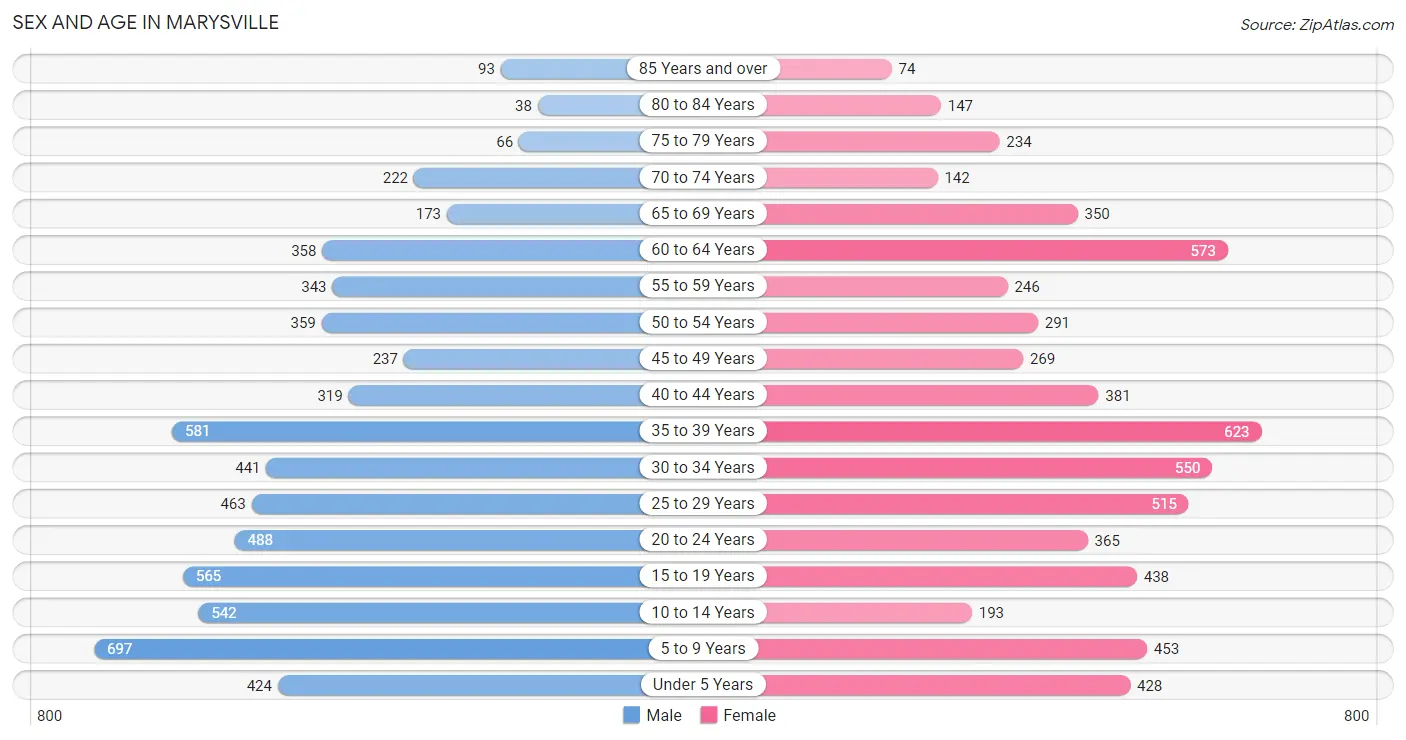
Sex and Age in Marysville
Sex and Age in Marysville
The most populous age groups in Marysville are 5 to 9 Years (697 | 10.9%) for men and 35 to 39 Years (623 | 9.9%) for women.
| Age Bracket | Male | Female |
| Under 5 Years | 424 (6.6%) | 428 (6.8%) |
| 5 to 9 Years | 697 (10.9%) | 453 (7.2%) |
| 10 to 14 Years | 542 (8.5%) | 193 (3.1%) |
| 15 to 19 Years | 565 (8.8%) | 438 (7.0%) |
| 20 to 24 Years | 488 (7.6%) | 365 (5.8%) |
| 25 to 29 Years | 463 (7.2%) | 515 (8.2%) |
| 30 to 34 Years | 441 (6.9%) | 550 (8.8%) |
| 35 to 39 Years | 581 (9.1%) | 623 (9.9%) |
| 40 to 44 Years | 319 (5.0%) | 381 (6.1%) |
| 45 to 49 Years | 237 (3.7%) | 269 (4.3%) |
| 50 to 54 Years | 359 (5.6%) | 291 (4.6%) |
| 55 to 59 Years | 343 (5.3%) | 246 (3.9%) |
| 60 to 64 Years | 358 (5.6%) | 573 (9.1%) |
| 65 to 69 Years | 173 (2.7%) | 350 (5.6%) |
| 70 to 74 Years | 222 (3.5%) | 142 (2.3%) |
| 75 to 79 Years | 66 (1.0%) | 234 (3.7%) |
| 80 to 84 Years | 38 (0.6%) | 147 (2.3%) |
| 85 Years and over | 93 (1.5%) | 74 (1.2%) |
| Total | 6,409 (100.0%) | 6,272 (100.0%) |
Families and Households in Marysville
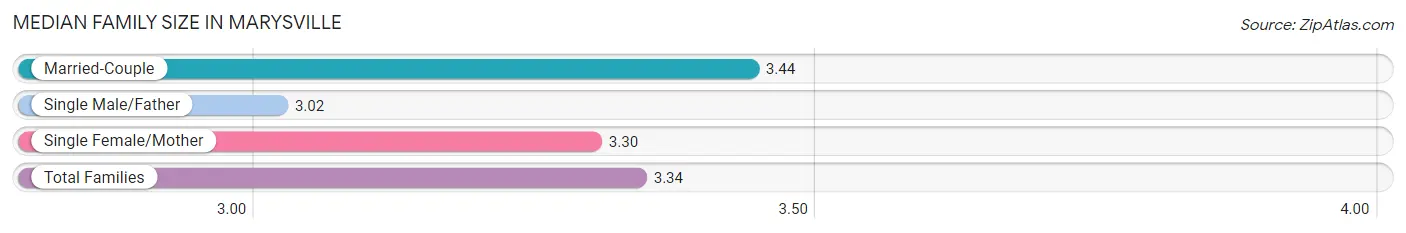
Median Family Size in Marysville
The median family size in Marysville is 3.34 persons per family, with married-couple families (1,435 | 50.0%) accounting for the largest median family size of 3.44 persons per family. On the other hand, single male/father families (324 | 11.3%) represent the smallest median family size with 3.02 persons per family.
| Family Type | # Families | Family Size |
| Married-Couple | 1,435 (50.0%) | 3.44 |
| Single Male/Father | 324 (11.3%) | 3.02 |
| Single Female/Mother | 1,109 (38.7%) | 3.30 |
| Total Families | 2,868 (100.0%) | 3.34 |
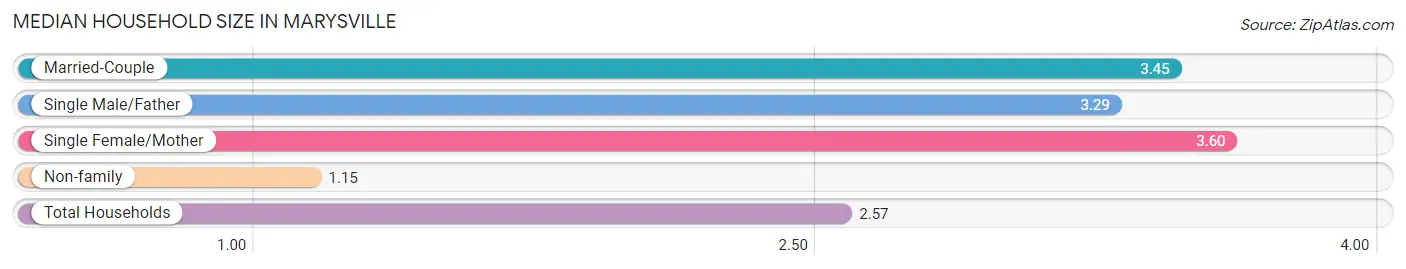
Median Household Size in Marysville
The median household size in Marysville is 2.57 persons per household, with single female/mother households (1,109 | 23.4%) accounting for the largest median household size of 3.6 persons per household. non-family households (1,865 | 39.4%) represent the smallest median household size with 1.15 persons per household.
| Household Type | # Households | Household Size |
| Married-Couple | 1,435 (30.3%) | 3.45 |
| Single Male/Father | 324 (6.9%) | 3.29 |
| Single Female/Mother | 1,109 (23.4%) | 3.60 |
| Non-family | 1,865 (39.4%) | 1.15 |
| Total Households | 4,733 (100.0%) | 2.57 |
Household Size by Marriage Status in Marysville
Out of a total of 4,733 households in Marysville, 2,868 (60.6%) are family households, while 1,865 (39.4%) are nonfamily households. The most numerous type of family households are 2-person households, comprising 1,044, and the most common type of nonfamily households are 1-person households, comprising 1,591.
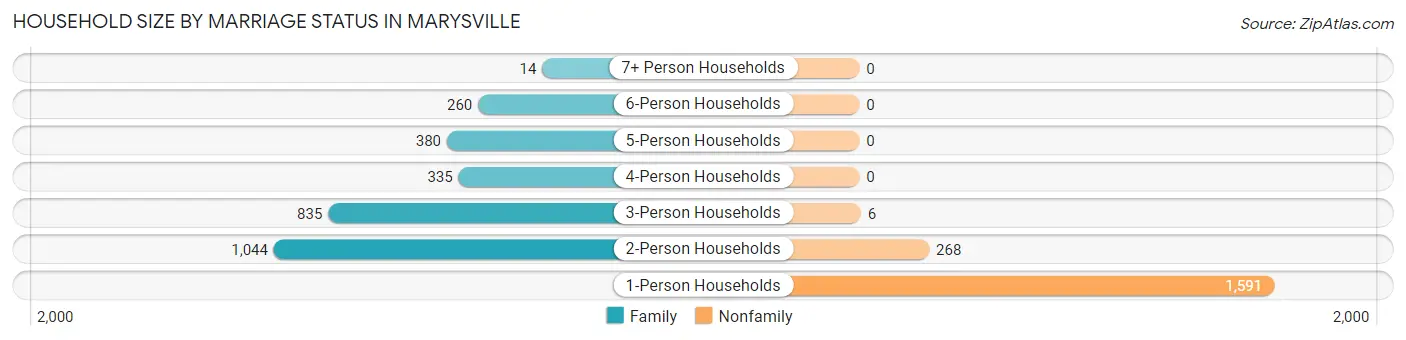
| Household Size | Family Households | Nonfamily Households |
| 1-Person Households | - | 1,591 (33.6%) |
| 2-Person Households | 1,044 (22.1%) | 268 (5.7%) |
| 3-Person Households | 835 (17.6%) | 6 (0.1%) |
| 4-Person Households | 335 (7.1%) | 0 (0.0%) |
| 5-Person Households | 380 (8.0%) | 0 (0.0%) |
| 6-Person Households | 260 (5.5%) | 0 (0.0%) |
| 7+ Person Households | 14 (0.3%) | 0 (0.0%) |
| Total | 2,868 (60.6%) | 1,865 (39.4%) |
Female Fertility in Marysville
Fertility by Age in Marysville
Average fertility rate in Marysville is 63.0 births per 1,000 women. Women in the age bracket of 20 to 34 years have the highest fertility rate with 125.0 births per 1,000 women. Women in the age bracket of 20 to 34 years acount for 89.9% of all women with births.
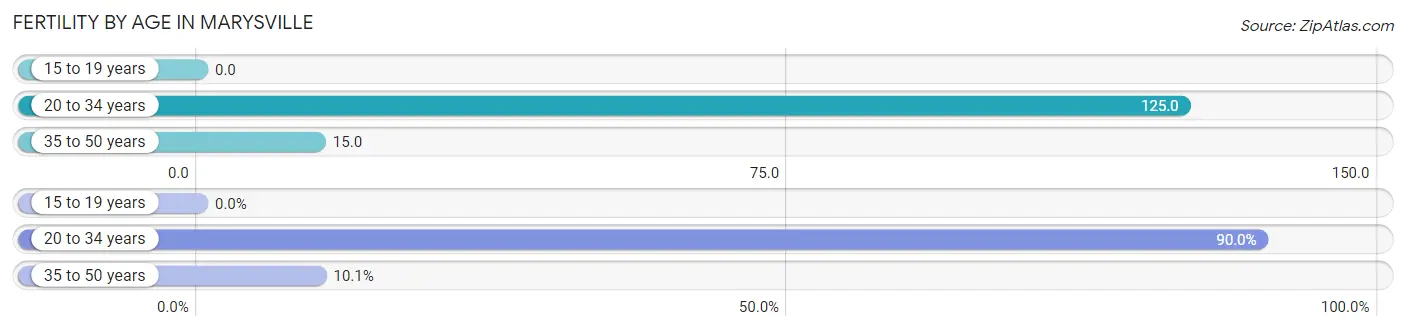
| Age Bracket | Women with Births | Births / 1,000 Women |
| 15 to 19 years | 0 (0.0%) | 0.0 |
| 20 to 34 years | 179 (89.9%) | 125.0 |
| 35 to 50 years | 20 (10.1%) | 15.0 |
| Total | 199 (100.0%) | 63.0 |
Fertility by Age by Marriage Status in Marysville
37.7% of women with births (199) in Marysville are married. The highest percentage of unmarried women with births falls into 20 to 34 years age bracket with 69.3% of them unmarried at the time of birth, while the lowest percentage of unmarried women with births belong to 35 to 50 years age bracket with 0.0% of them unmarried.
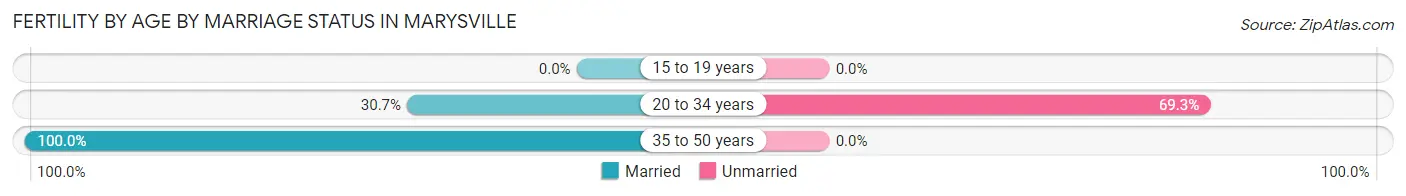
| Age Bracket | Married | Unmarried |
| 15 to 19 years | 0 (0.0%) | 0 (0.0%) |
| 20 to 34 years | 55 (30.7%) | 124 (69.3%) |
| 35 to 50 years | 20 (100.0%) | 0 (0.0%) |
| Total | 75 (37.7%) | 124 (62.3%) |
Fertility by Education in Marysville
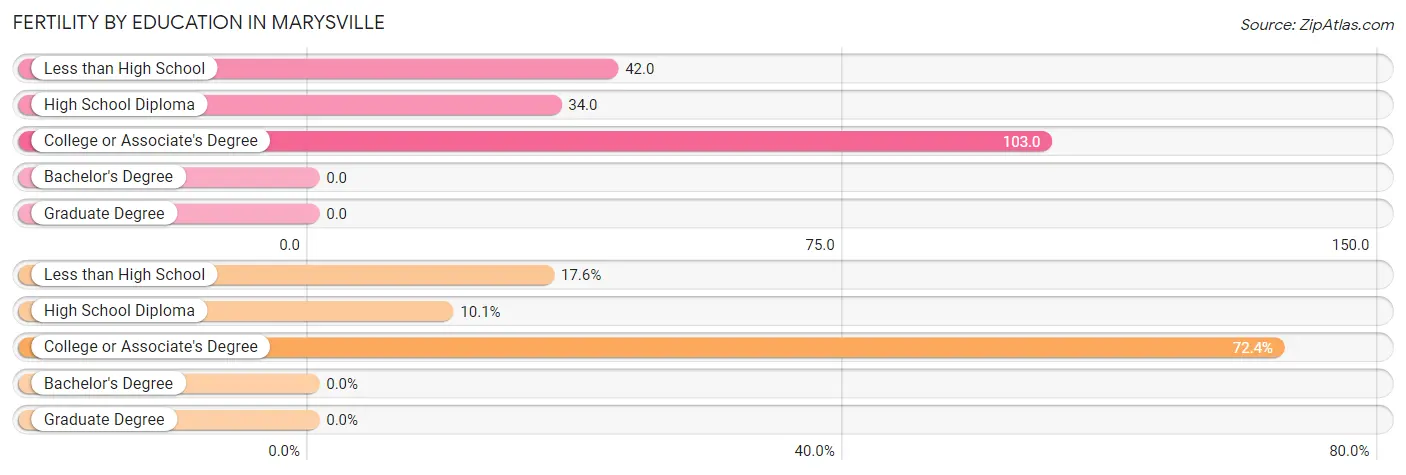
| Educational Attainment | Women with Births | Births / 1,000 Women |
| Less than High School | 35 (17.6%) | 42.0 |
| High School Diploma | 20 (10.1%) | 34.0 |
| College or Associate's Degree | 144 (72.4%) | 103.0 |
| Bachelor's Degree | 0 (0.0%) | 0.0 |
| Graduate Degree | 0 (0.0%) | 0.0 |
| Total | 199 (100.0%) | 63.0 |
Fertility by Education by Marriage Status in Marysville
62.3% of women with births in Marysville are unmarried. Women with the educational attainment of less than high school are most likely to be married with 100.0% of them married at childbirth, while women with the educational attainment of college or associate's degree are least likely to be married with 86.1% of them unmarried at childbirth.
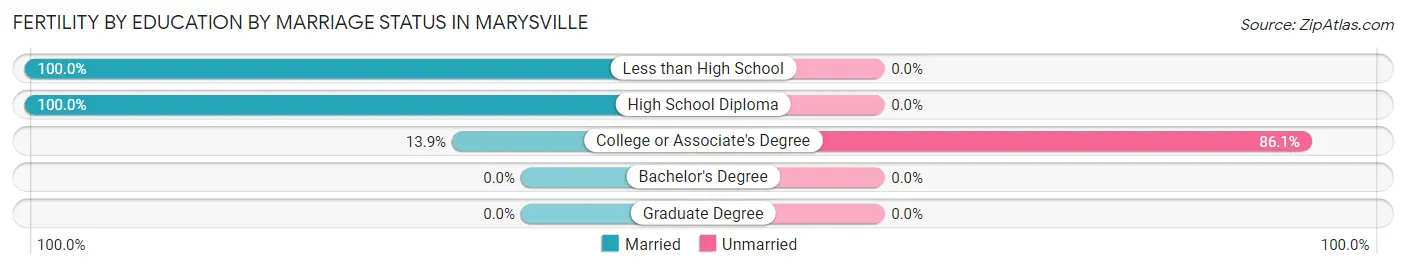
| Educational Attainment | Married | Unmarried |
| Less than High School | 35 (100.0%) | 0 (0.0%) |
| High School Diploma | 20 (100.0%) | 0 (0.0%) |
| College or Associate's Degree | 20 (13.9%) | 124 (86.1%) |
| Bachelor's Degree | 0 (0.0%) | 0 (0.0%) |
| Graduate Degree | 0 (0.0%) | 0 (0.0%) |
| Total | 75 (37.7%) | 124 (62.3%) |
Employment Characteristics in Marysville
Employment by Class of Employer in Marysville
Among the 4,957 employed individuals in Marysville, private company employees (3,341 | 67.4%), local government employees (620 | 12.5%), and not-for-profit organizations (478 | 9.6%) make up the most common classes of employment.
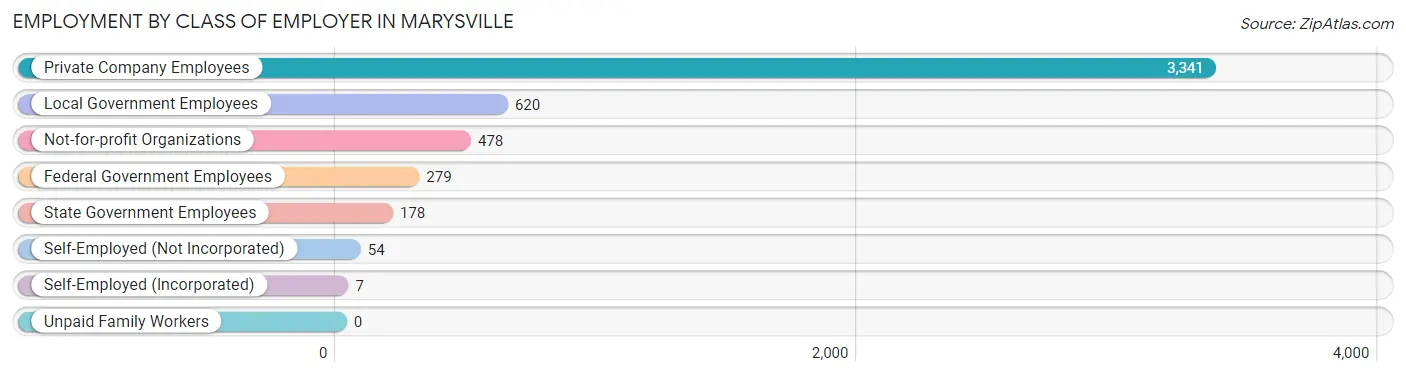
| Employer Class | # Employees | % Employees |
| Private Company Employees | 3,341 | 67.4% |
| Self-Employed (Incorporated) | 7 | 0.1% |
| Self-Employed (Not Incorporated) | 54 | 1.1% |
| Not-for-profit Organizations | 478 | 9.6% |
| Local Government Employees | 620 | 12.5% |
| State Government Employees | 178 | 3.6% |
| Federal Government Employees | 279 | 5.6% |
| Unpaid Family Workers | 0 | 0.0% |
| Total | 4,957 | 100.0% |
Employment Status by Age in Marysville
According to the labor force statistics for Marysville, out of the total population over 16 years of age (9,654), 56.5% or 5,455 individuals are in the labor force, with 7.7% or 420 of them unemployed. The age group with the highest labor force participation rate is 35 to 44 years, with 79.7% or 1,517 individuals in the labor force. Within the labor force, the 16 to 19 years age range has the highest percentage of unemployed individuals, with 16.3% or 17 of them being unemployed.
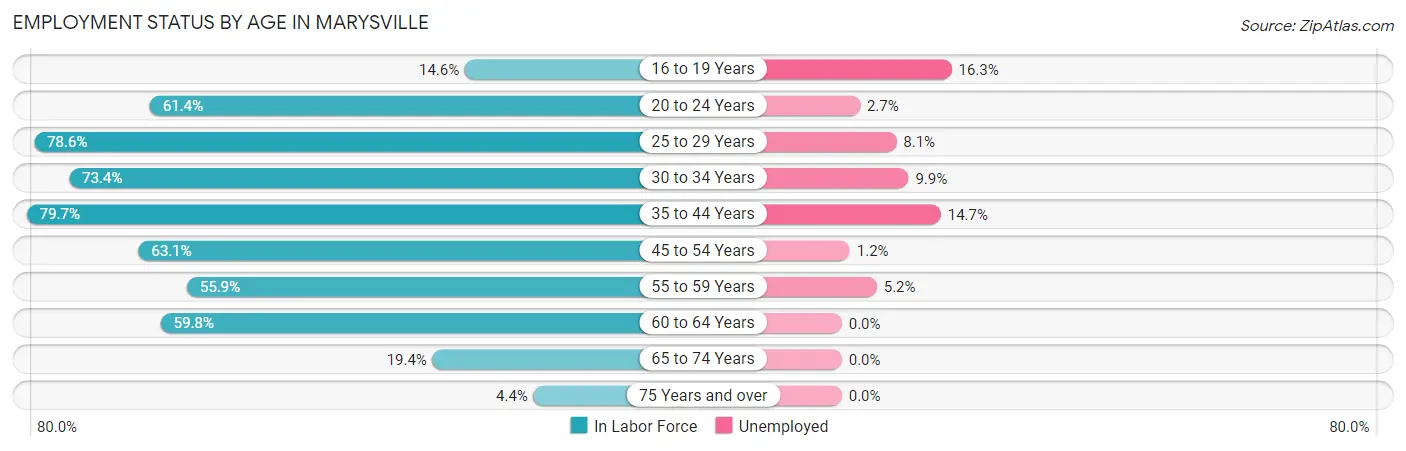
| Age Bracket | In Labor Force | Unemployed |
| 16 to 19 Years | 104 (14.6%) | 17 (16.3%) |
| 20 to 24 Years | 524 (61.4%) | 14 (2.7%) |
| 25 to 29 Years | 769 (78.6%) | 62 (8.1%) |
| 30 to 34 Years | 727 (73.4%) | 72 (9.9%) |
| 35 to 44 Years | 1,517 (79.7%) | 223 (14.7%) |
| 45 to 54 Years | 729 (63.1%) | 9 (1.2%) |
| 55 to 59 Years | 329 (55.9%) | 17 (5.2%) |
| 60 to 64 Years | 557 (59.8%) | 0 (0.0%) |
| 65 to 74 Years | 172 (19.4%) | 0 (0.0%) |
| 75 Years and over | 29 (4.4%) | 0 (0.0%) |
| Total | 5,455 (56.5%) | 420 (7.7%) |
Employment Status by Educational Attainment in Marysville
According to labor force statistics for Marysville, 70.7% of individuals (4,630) out of the total population between 25 and 64 years of age (6,549) are in the labor force, with 8.3% or 384 of them being unemployed. The group with the highest labor force participation rate are those with the educational attainment of bachelor's degree or higher, with 84.3% or 605 individuals in the labor force. Within the labor force, individuals with college / associate degree education have the highest percentage of unemployment, with 10.5% or 238 of them being unemployed.
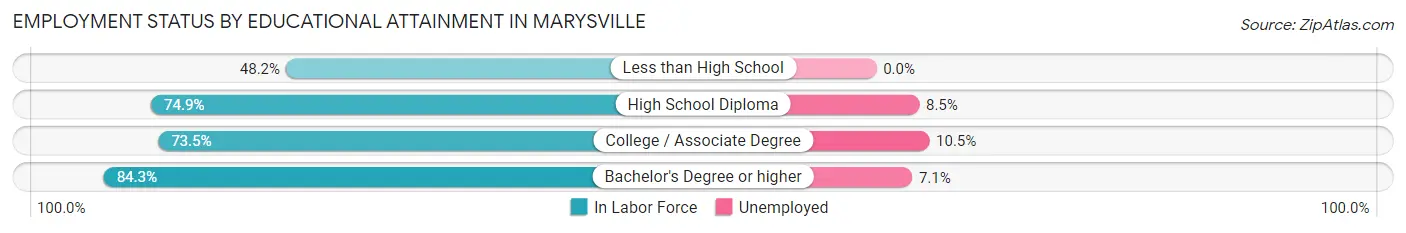
| Educational Attainment | In Labor Force | Unemployed |
| Less than High School | 545 (48.2%) | 0 (0.0%) |
| High School Diploma | 1,213 (74.9%) | 138 (8.5%) |
| College / Associate Degree | 2,265 (73.5%) | 324 (10.5%) |
| Bachelor's Degree or higher | 605 (84.3%) | 51 (7.1%) |
| Total | 4,630 (70.7%) | 544 (8.3%) |
Employment Occupations by Sex in Marysville
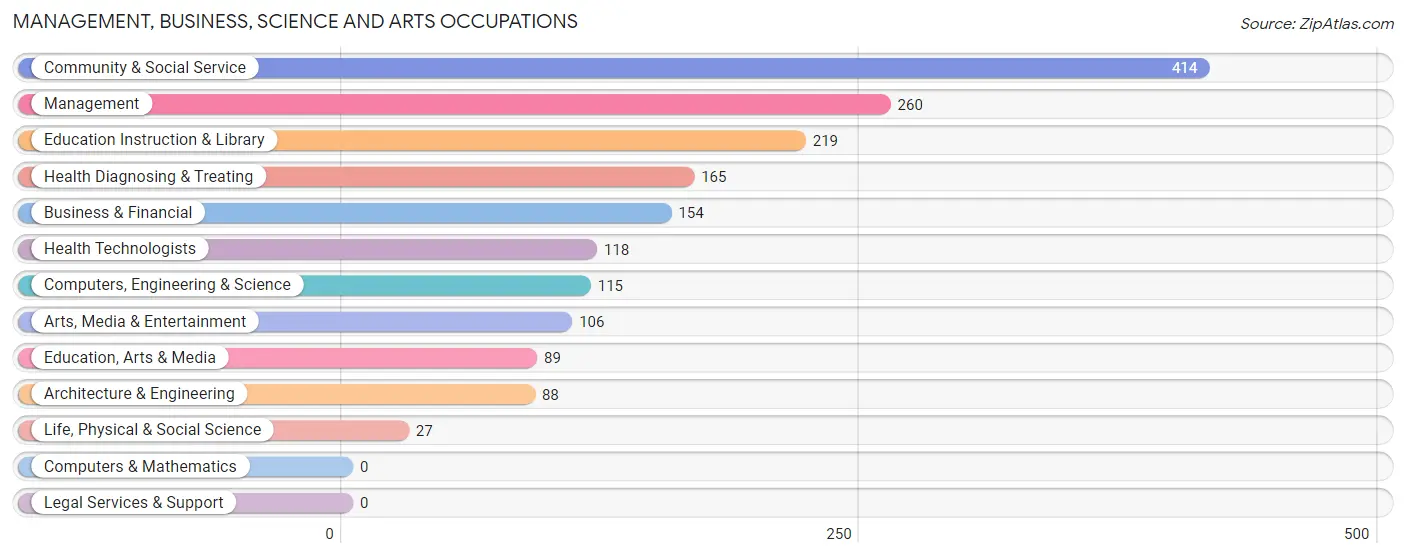
Management, Business, Science and Arts Occupations
The most common Management, Business, Science and Arts occupations in Marysville are Community & Social Service (414 | 8.4%), Management (260 | 5.2%), Education Instruction & Library (219 | 4.4%), Health Diagnosing & Treating (165 | 3.3%), and Business & Financial (154 | 3.1%).
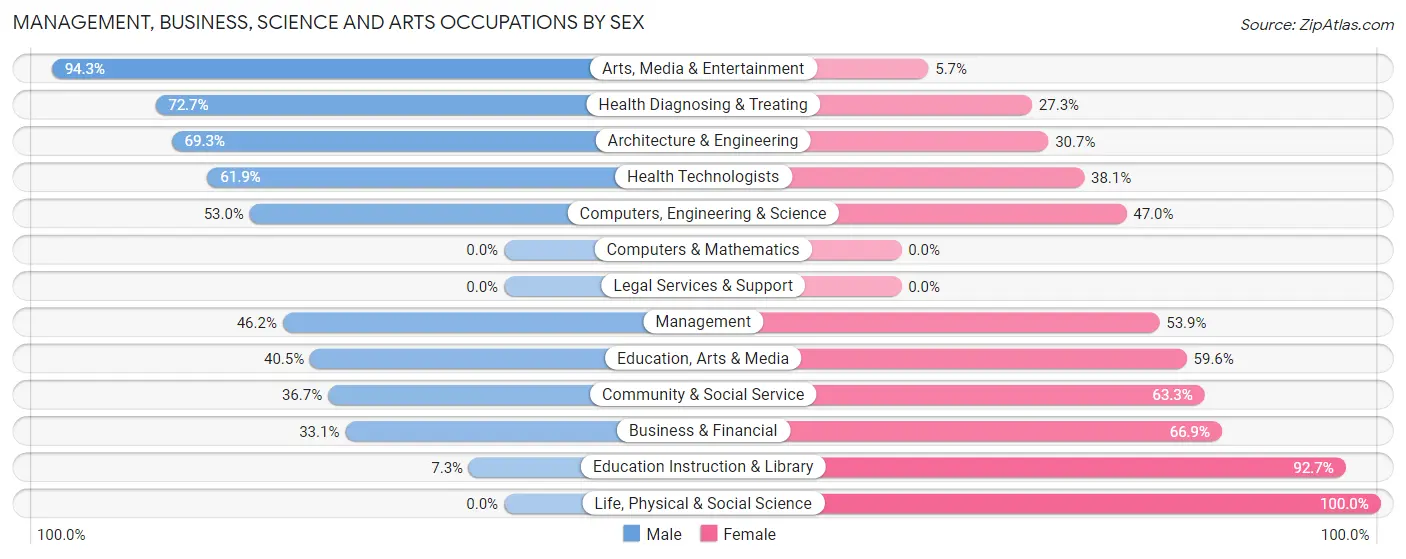
Management, Business, Science and Arts Occupations by Sex
Within the Management, Business, Science and Arts occupations in Marysville, the most male-oriented occupations are Arts, Media & Entertainment (94.3%), Health Diagnosing & Treating (72.7%), and Architecture & Engineering (69.3%), while the most female-oriented occupations are Life, Physical & Social Science (100.0%), Education Instruction & Library (92.7%), and Business & Financial (66.9%).
| Occupation | Male | Female |
| Management | 120 (46.2%) | 140 (53.8%) |
| Business & Financial | 51 (33.1%) | 103 (66.9%) |
| Computers, Engineering & Science | 61 (53.0%) | 54 (47.0%) |
| Computers & Mathematics | 0 (0.0%) | 0 (0.0%) |
| Architecture & Engineering | 61 (69.3%) | 27 (30.7%) |
| Life, Physical & Social Science | 0 (0.0%) | 27 (100.0%) |
| Community & Social Service | 152 (36.7%) | 262 (63.3%) |
| Education, Arts & Media | 36 (40.5%) | 53 (59.6%) |
| Legal Services & Support | 0 (0.0%) | 0 (0.0%) |
| Education Instruction & Library | 16 (7.3%) | 203 (92.7%) |
| Arts, Media & Entertainment | 100 (94.3%) | 6 (5.7%) |
| Health Diagnosing & Treating | 120 (72.7%) | 45 (27.3%) |
| Health Technologists | 73 (61.9%) | 45 (38.1%) |
| Total (Category) | 504 (45.5%) | 604 (54.5%) |
| Total (Overall) | 2,316 (46.7%) | 2,643 (53.3%) |
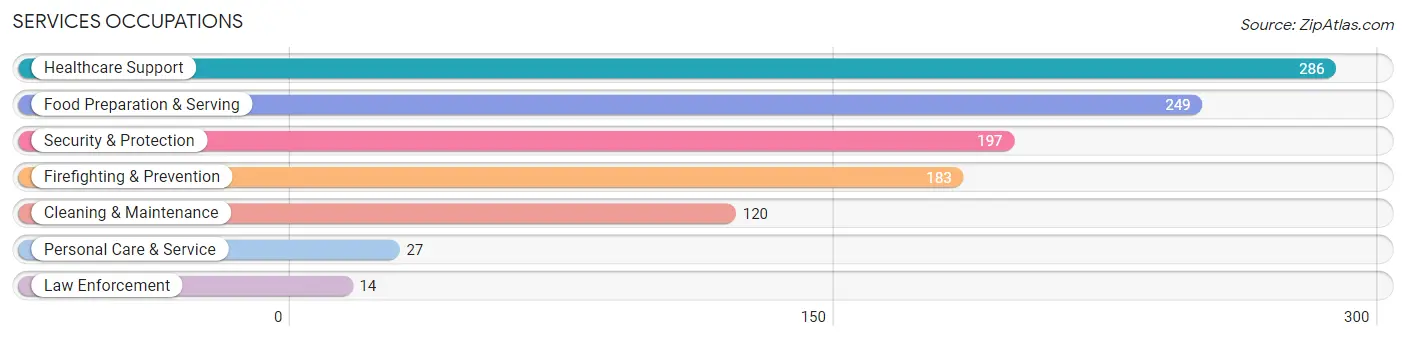
Services Occupations
The most common Services occupations in Marysville are Healthcare Support (286 | 5.8%), Food Preparation & Serving (249 | 5.0%), Security & Protection (197 | 4.0%), Firefighting & Prevention (183 | 3.7%), and Cleaning & Maintenance (120 | 2.4%).
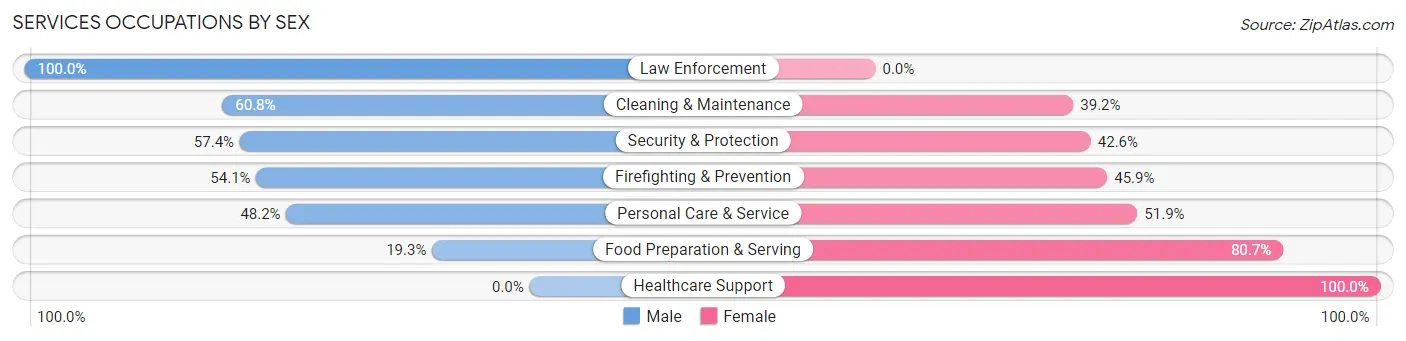
Services Occupations by Sex
Within the Services occupations in Marysville, the most male-oriented occupations are Law Enforcement (100.0%), Cleaning & Maintenance (60.8%), and Security & Protection (57.4%), while the most female-oriented occupations are Healthcare Support (100.0%), Food Preparation & Serving (80.7%), and Personal Care & Service (51.8%).
| Occupation | Male | Female |
| Healthcare Support | 0 (0.0%) | 286 (100.0%) |
| Security & Protection | 113 (57.4%) | 84 (42.6%) |
| Firefighting & Prevention | 99 (54.1%) | 84 (45.9%) |
| Law Enforcement | 14 (100.0%) | 0 (0.0%) |
| Food Preparation & Serving | 48 (19.3%) | 201 (80.7%) |
| Cleaning & Maintenance | 73 (60.8%) | 47 (39.2%) |
| Personal Care & Service | 13 (48.1%) | 14 (51.8%) |
| Total (Category) | 247 (28.1%) | 632 (71.9%) |
| Total (Overall) | 2,316 (46.7%) | 2,643 (53.3%) |
Sales and Office Occupations
The most common Sales and Office occupations in Marysville are Office & Administration (796 | 16.1%), and Sales & Related (553 | 11.2%).
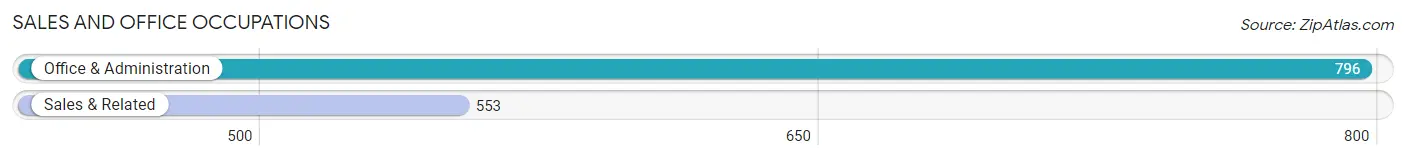
Sales and Office Occupations by Sex
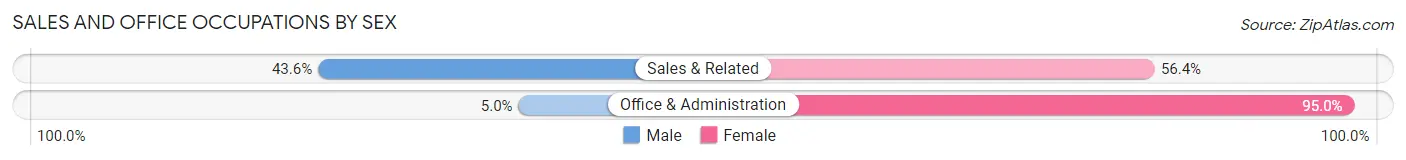
| Occupation | Male | Female |
| Sales & Related | 241 (43.6%) | 312 (56.4%) |
| Office & Administration | 40 (5.0%) | 756 (95.0%) |
| Total (Category) | 281 (20.8%) | 1,068 (79.2%) |
| Total (Overall) | 2,316 (46.7%) | 2,643 (53.3%) |
Natural Resources, Construction and Maintenance Occupations
The most common Natural Resources, Construction and Maintenance occupations in Marysville are Installation, Maintenance & Repair (361 | 7.3%), Construction & Extraction (254 | 5.1%), and Farming, Fishing & Forestry (130 | 2.6%).
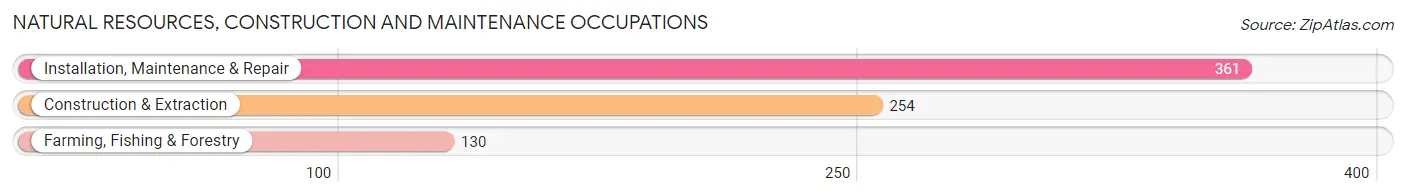
Natural Resources, Construction and Maintenance Occupations by Sex
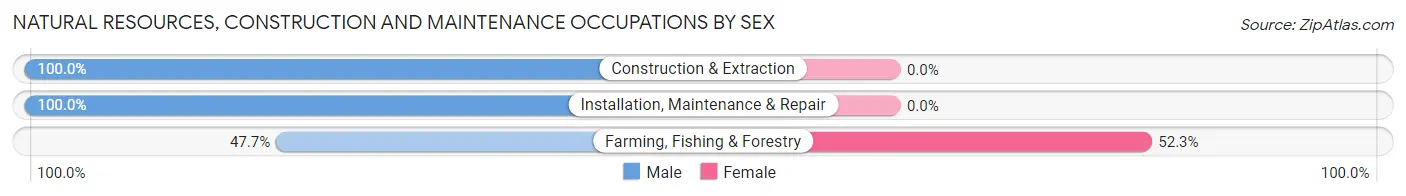
| Occupation | Male | Female |
| Farming, Fishing & Forestry | 62 (47.7%) | 68 (52.3%) |
| Construction & Extraction | 254 (100.0%) | 0 (0.0%) |
| Installation, Maintenance & Repair | 361 (100.0%) | 0 (0.0%) |
| Total (Category) | 677 (90.9%) | 68 (9.1%) |
| Total (Overall) | 2,316 (46.7%) | 2,643 (53.3%) |
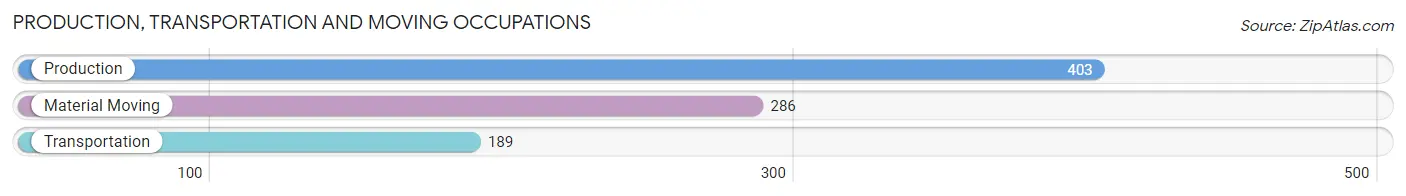
Production, Transportation and Moving Occupations
The most common Production, Transportation and Moving occupations in Marysville are Production (403 | 8.1%), Material Moving (286 | 5.8%), and Transportation (189 | 3.8%).
Production, Transportation and Moving Occupations by Sex
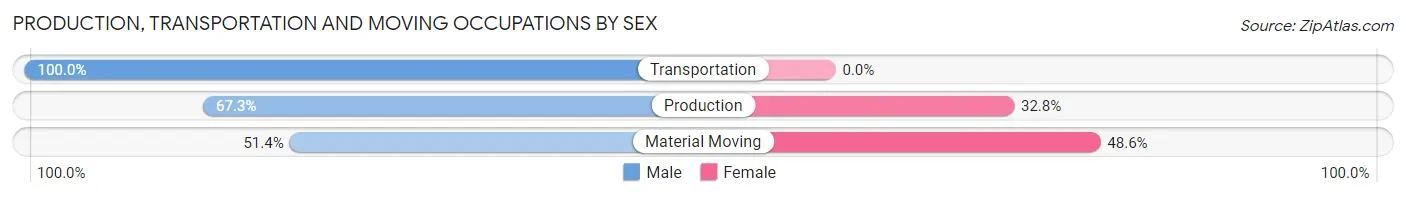
| Occupation | Male | Female |
| Production | 271 (67.2%) | 132 (32.8%) |
| Transportation | 189 (100.0%) | 0 (0.0%) |
| Material Moving | 147 (51.4%) | 139 (48.6%) |
| Total (Category) | 607 (69.1%) | 271 (30.9%) |
| Total (Overall) | 2,316 (46.7%) | 2,643 (53.3%) |
Employment Industries by Sex in Marysville
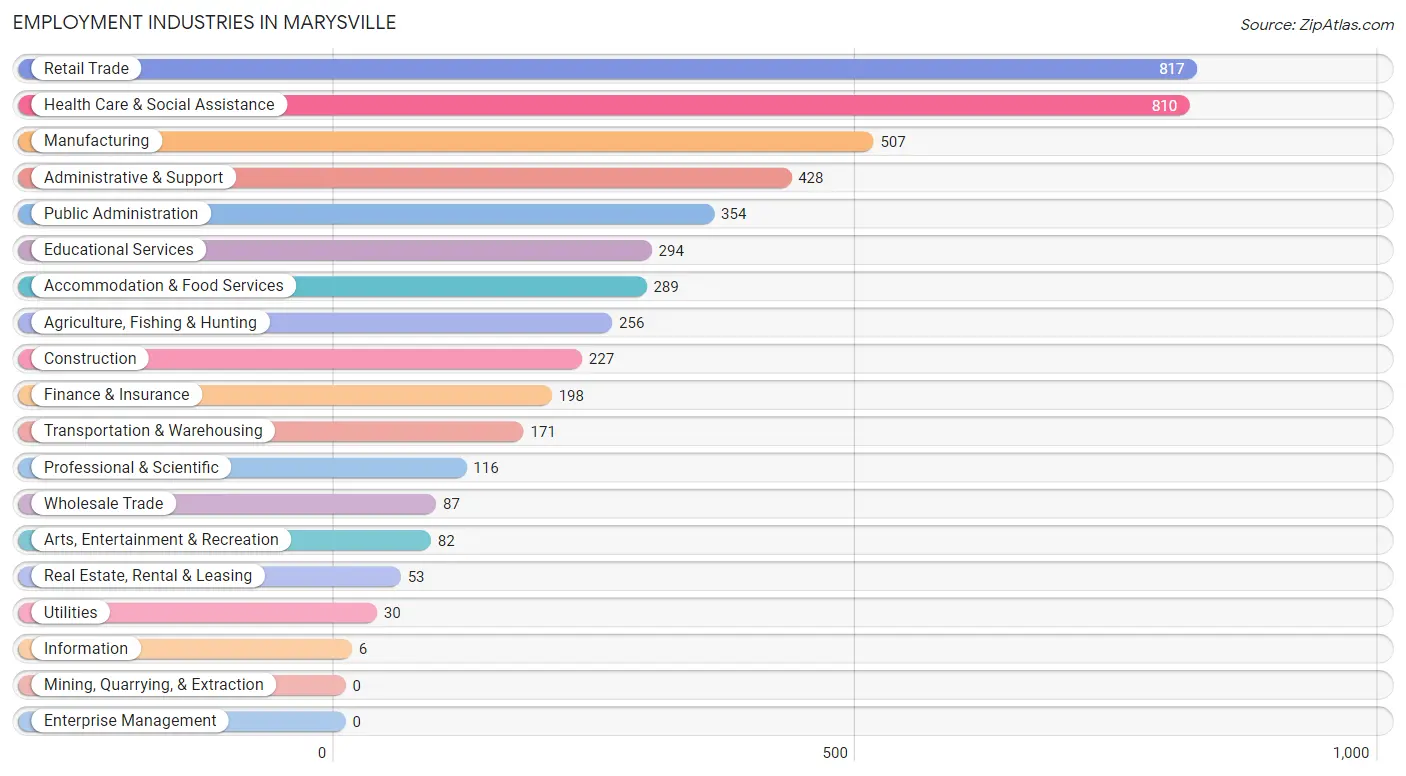
Employment Industries in Marysville
The major employment industries in Marysville include Retail Trade (817 | 16.5%), Health Care & Social Assistance (810 | 16.3%), Manufacturing (507 | 10.2%), Administrative & Support (428 | 8.6%), and Public Administration (354 | 7.1%).
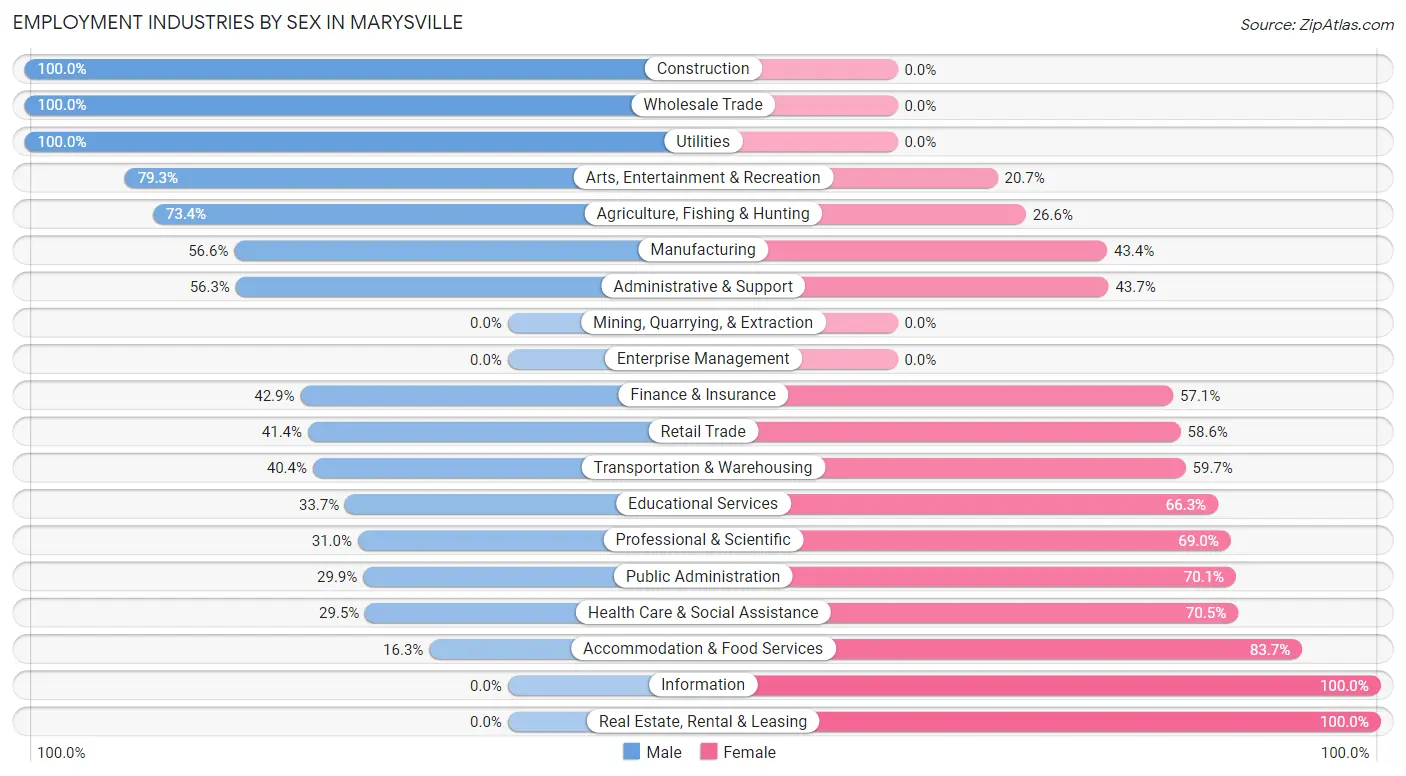
Employment Industries by Sex in Marysville
The Marysville industries that see more men than women are Construction (100.0%), Wholesale Trade (100.0%), and Utilities (100.0%), whereas the industries that tend to have a higher number of women are Information (100.0%), Real Estate, Rental & Leasing (100.0%), and Accommodation & Food Services (83.7%).
| Industry | Male | Female |
| Agriculture, Fishing & Hunting | 188 (73.4%) | 68 (26.6%) |
| Mining, Quarrying, & Extraction | 0 (0.0%) | 0 (0.0%) |
| Construction | 227 (100.0%) | 0 (0.0%) |
| Manufacturing | 287 (56.6%) | 220 (43.4%) |
| Wholesale Trade | 87 (100.0%) | 0 (0.0%) |
| Retail Trade | 338 (41.4%) | 479 (58.6%) |
| Transportation & Warehousing | 69 (40.4%) | 102 (59.7%) |
| Utilities | 30 (100.0%) | 0 (0.0%) |
| Information | 0 (0.0%) | 6 (100.0%) |
| Finance & Insurance | 85 (42.9%) | 113 (57.1%) |
| Real Estate, Rental & Leasing | 0 (0.0%) | 53 (100.0%) |
| Professional & Scientific | 36 (31.0%) | 80 (69.0%) |
| Enterprise Management | 0 (0.0%) | 0 (0.0%) |
| Administrative & Support | 241 (56.3%) | 187 (43.7%) |
| Educational Services | 99 (33.7%) | 195 (66.3%) |
| Health Care & Social Assistance | 239 (29.5%) | 571 (70.5%) |
| Arts, Entertainment & Recreation | 65 (79.3%) | 17 (20.7%) |
| Accommodation & Food Services | 47 (16.3%) | 242 (83.7%) |
| Public Administration | 106 (29.9%) | 248 (70.1%) |
| Total | 2,316 (46.7%) | 2,643 (53.3%) |
Education in Marysville
School Enrollment in Marysville
The most common levels of schooling among the 3,764 students in Marysville are high school (974 | 25.9%), elementary school (928 | 24.6%), and college / undergraduate (781 | 20.7%).
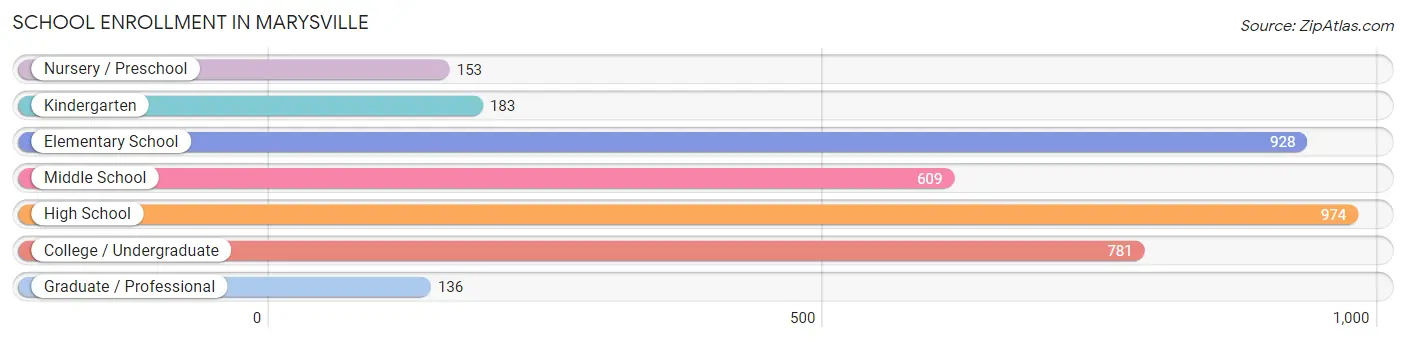
| School Level | # Students | % Students |
| Nursery / Preschool | 153 | 4.1% |
| Kindergarten | 183 | 4.9% |
| Elementary School | 928 | 24.6% |
| Middle School | 609 | 16.2% |
| High School | 974 | 25.9% |
| College / Undergraduate | 781 | 20.7% |
| Graduate / Professional | 136 | 3.6% |
| Total | 3,764 | 100.0% |
School Enrollment by Age by Funding Source in Marysville
Out of a total of 3,764 students who are enrolled in schools in Marysville, 512 (13.6%) attend a private institution, while the remaining 3,252 (86.4%) are enrolled in public schools. The age group of 3 to 4 year olds has the highest likelihood of being enrolled in private schools, with 97 (63.4% in the age bracket) enrolled. Conversely, the age group of 18 to 19 year olds has the lowest likelihood of being enrolled in a private school, with 117 (96.7% in the age bracket) attending a public institution.
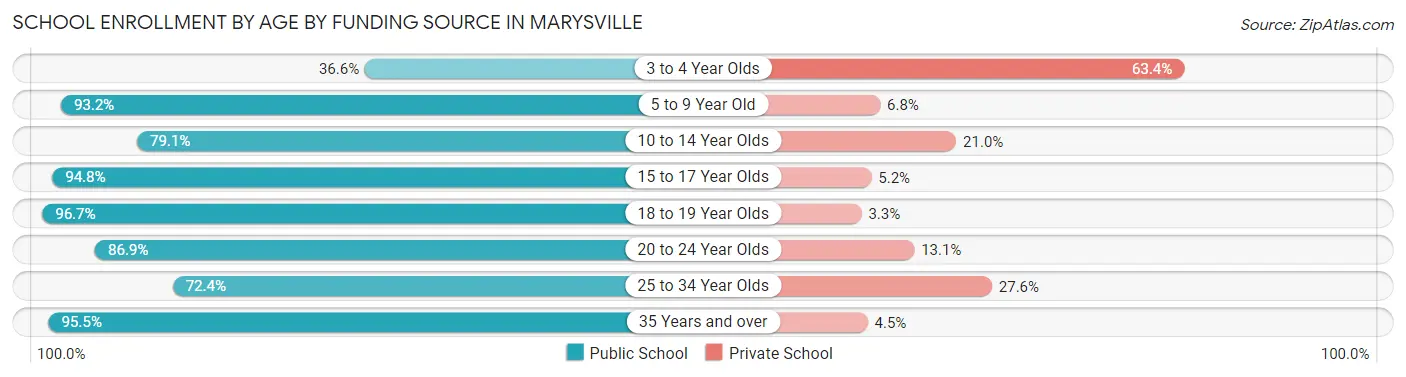
| Age Bracket | Public School | Private School |
| 3 to 4 Year Olds | 56 (36.6%) | 97 (63.4%) |
| 5 to 9 Year Old | 1,032 (93.2%) | 75 (6.8%) |
| 10 to 14 Year Olds | 581 (79.0%) | 154 (20.9%) |
| 15 to 17 Year Olds | 790 (94.8%) | 43 (5.2%) |
| 18 to 19 Year Olds | 117 (96.7%) | 4 (3.3%) |
| 20 to 24 Year Olds | 304 (86.9%) | 46 (13.1%) |
| 25 to 34 Year Olds | 223 (72.4%) | 85 (27.6%) |
| 35 Years and over | 150 (95.5%) | 7 (4.5%) |
| Total | 3,252 (86.4%) | 512 (13.6%) |
Educational Attainment by Field of Study in Marysville
Education (236 | 17.5%), social sciences (206 | 15.2%), business (160 | 11.8%), arts & humanities (143 | 10.6%), and bio, nature & agricultural (131 | 9.7%) are the most common fields of study among 1,352 individuals in Marysville who have obtained a bachelor's degree or higher.
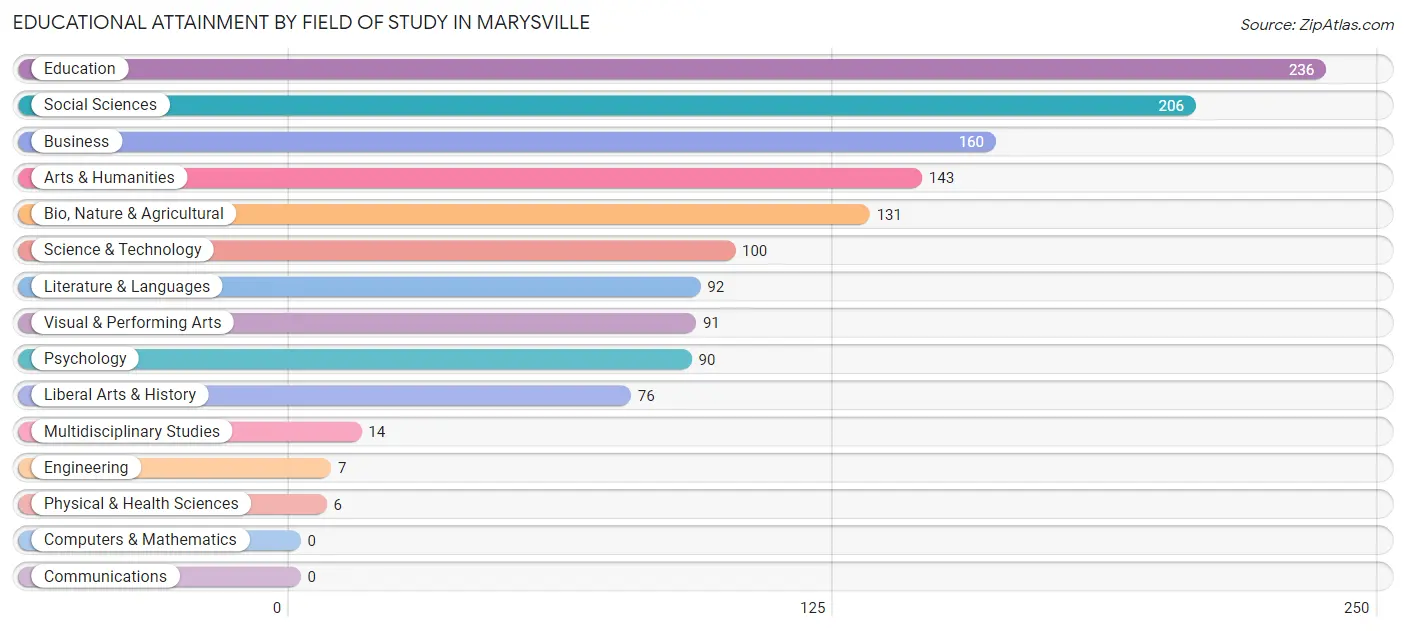
| Field of Study | # Graduates | % Graduates |
| Computers & Mathematics | 0 | 0.0% |
| Bio, Nature & Agricultural | 131 | 9.7% |
| Physical & Health Sciences | 6 | 0.4% |
| Psychology | 90 | 6.7% |
| Social Sciences | 206 | 15.2% |
| Engineering | 7 | 0.5% |
| Multidisciplinary Studies | 14 | 1.0% |
| Science & Technology | 100 | 7.4% |
| Business | 160 | 11.8% |
| Education | 236 | 17.5% |
| Literature & Languages | 92 | 6.8% |
| Liberal Arts & History | 76 | 5.6% |
| Visual & Performing Arts | 91 | 6.7% |
| Communications | 0 | 0.0% |
| Arts & Humanities | 143 | 10.6% |
| Total | 1,352 | 100.0% |
Transportation & Commute in Marysville
Vehicle Availability by Sex in Marysville
The most prevalent vehicle ownership categories in Marysville are males with 2 vehicles (868, accounting for 36.7%) and females with 2 vehicles (509, making up 33.5%).
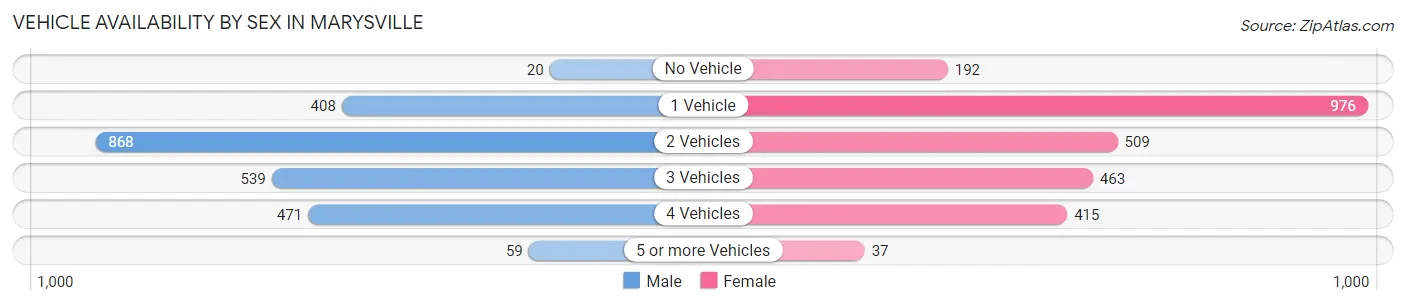
| Vehicles Available | Male | Female |
| No Vehicle | 20 (0.9%) | 192 (7.4%) |
| 1 Vehicle | 408 (17.2%) | 976 (37.7%) |
| 2 Vehicles | 868 (36.7%) | 509 (19.6%) |
| 3 Vehicles | 539 (22.8%) | 463 (17.9%) |
| 4 Vehicles | 471 (19.9%) | 415 (16.0%) |
| 5 or more Vehicles | 59 (2.5%) | 37 (1.4%) |
| Total | 2,365 (100.0%) | 2,592 (100.0%) |
Commute Time in Marysville
The most frequently occuring commute durations in Marysville are 10 to 14 minutes (814 commuters, 17.0%), 45 to 59 minutes (807 commuters, 16.9%), and 15 to 19 minutes (794 commuters, 16.6%).
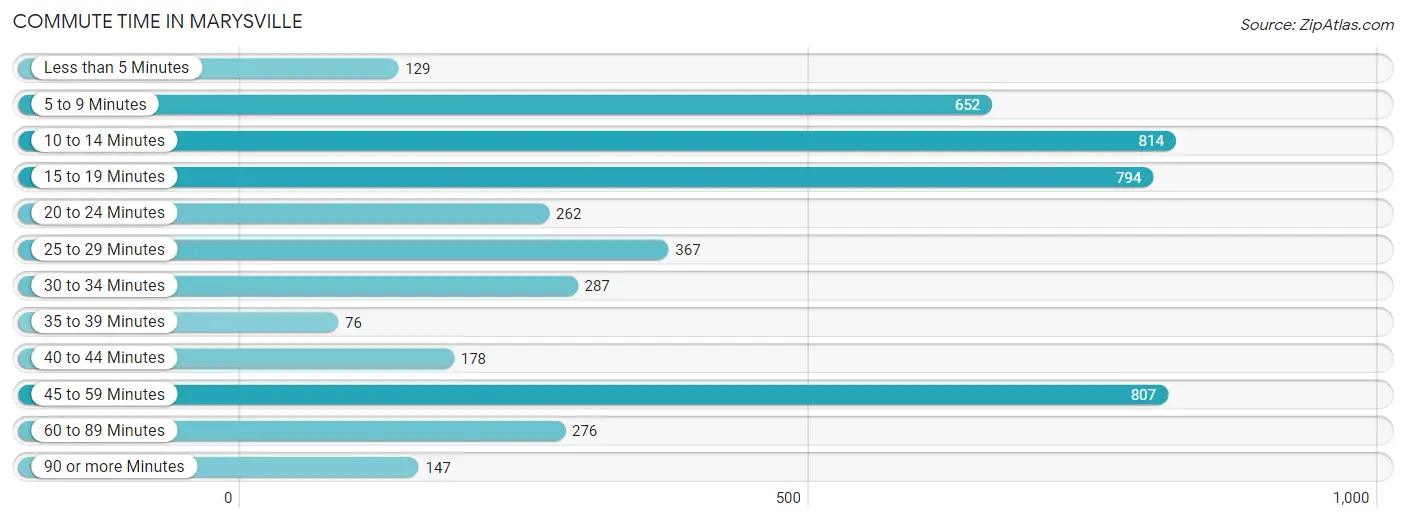
| Commute Time | # Commuters | % Commuters |
| Less than 5 Minutes | 129 | 2.7% |
| 5 to 9 Minutes | 652 | 13.6% |
| 10 to 14 Minutes | 814 | 17.0% |
| 15 to 19 Minutes | 794 | 16.6% |
| 20 to 24 Minutes | 262 | 5.5% |
| 25 to 29 Minutes | 367 | 7.7% |
| 30 to 34 Minutes | 287 | 6.0% |
| 35 to 39 Minutes | 76 | 1.6% |
| 40 to 44 Minutes | 178 | 3.7% |
| 45 to 59 Minutes | 807 | 16.9% |
| 60 to 89 Minutes | 276 | 5.8% |
| 90 or more Minutes | 147 | 3.1% |
Commute Time by Sex in Marysville
The most common commute times in Marysville are 45 to 59 minutes (562 commuters, 24.7%) for males and 15 to 19 minutes (477 commuters, 19.0%) for females.
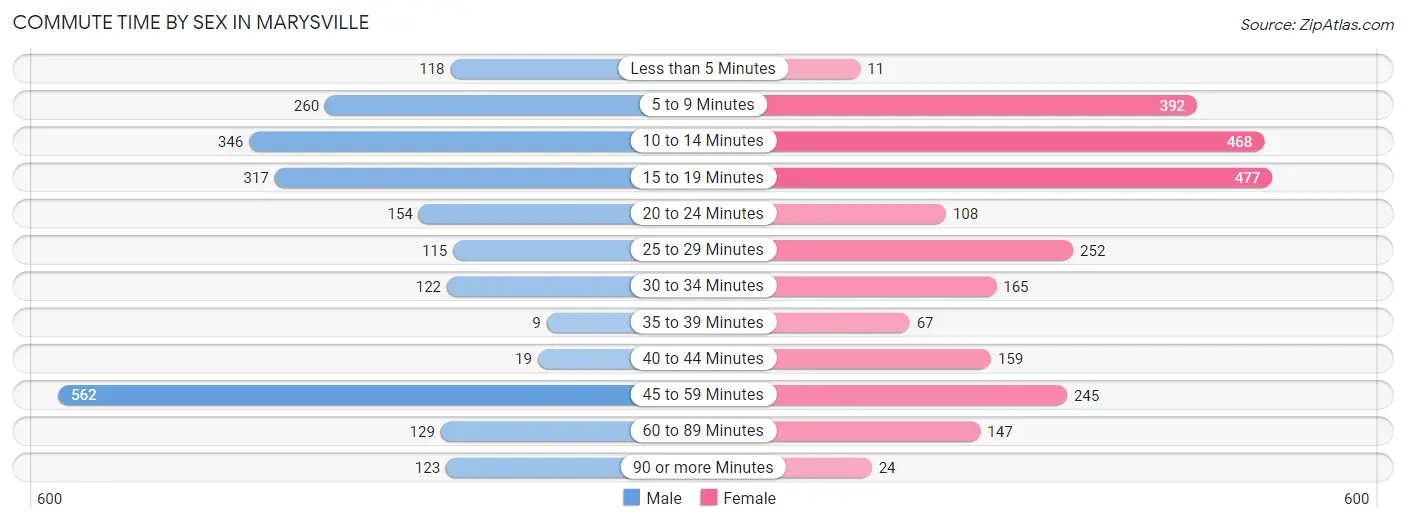
| Commute Time | Male | Female |
| Less than 5 Minutes | 118 (5.2%) | 11 (0.4%) |
| 5 to 9 Minutes | 260 (11.4%) | 392 (15.6%) |
| 10 to 14 Minutes | 346 (15.2%) | 468 (18.6%) |
| 15 to 19 Minutes | 317 (13.9%) | 477 (19.0%) |
| 20 to 24 Minutes | 154 (6.8%) | 108 (4.3%) |
| 25 to 29 Minutes | 115 (5.1%) | 252 (10.0%) |
| 30 to 34 Minutes | 122 (5.4%) | 165 (6.6%) |
| 35 to 39 Minutes | 9 (0.4%) | 67 (2.7%) |
| 40 to 44 Minutes | 19 (0.8%) | 159 (6.3%) |
| 45 to 59 Minutes | 562 (24.7%) | 245 (9.7%) |
| 60 to 89 Minutes | 129 (5.7%) | 147 (5.8%) |
| 90 or more Minutes | 123 (5.4%) | 24 (0.9%) |
Time of Departure to Work by Sex in Marysville
The most frequent times of departure to work in Marysville are 7:30 AM to 7:59 AM (345, 15.2%) for males and 7:30 AM to 7:59 AM (458, 18.2%) for females.
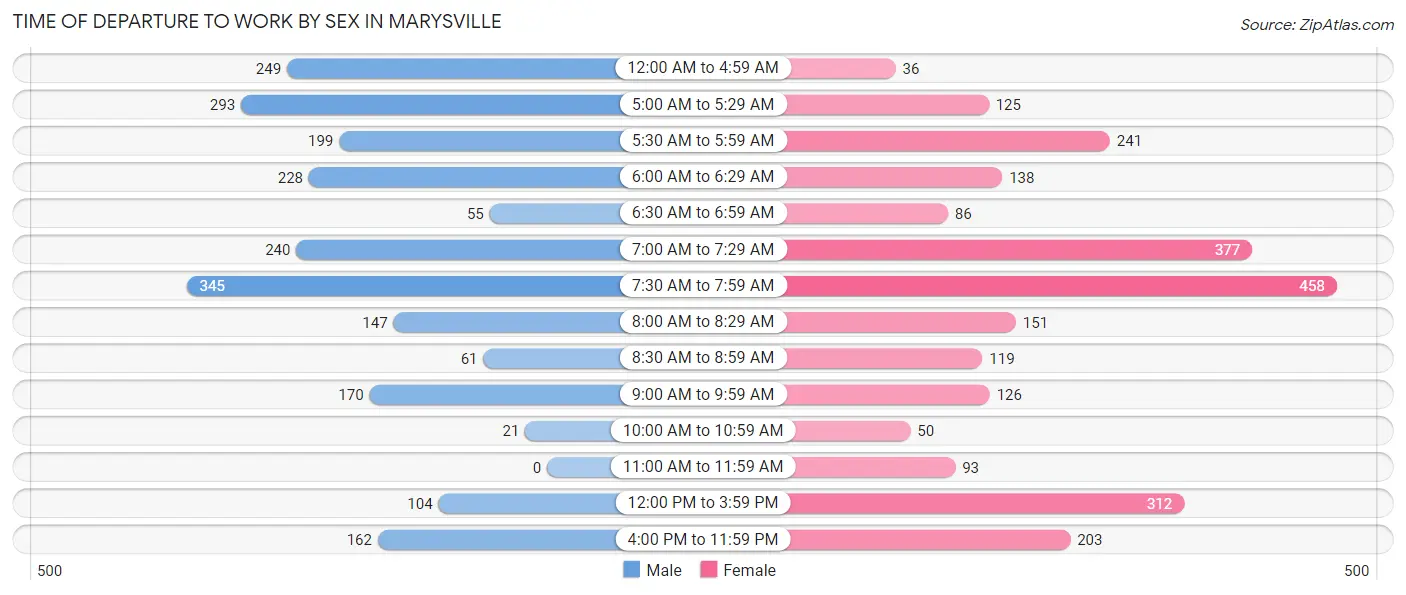
| Time of Departure | Male | Female |
| 12:00 AM to 4:59 AM | 249 (11.0%) | 36 (1.4%) |
| 5:00 AM to 5:29 AM | 293 (12.9%) | 125 (5.0%) |
| 5:30 AM to 5:59 AM | 199 (8.7%) | 241 (9.6%) |
| 6:00 AM to 6:29 AM | 228 (10.0%) | 138 (5.5%) |
| 6:30 AM to 6:59 AM | 55 (2.4%) | 86 (3.4%) |
| 7:00 AM to 7:29 AM | 240 (10.5%) | 377 (15.0%) |
| 7:30 AM to 7:59 AM | 345 (15.2%) | 458 (18.2%) |
| 8:00 AM to 8:29 AM | 147 (6.5%) | 151 (6.0%) |
| 8:30 AM to 8:59 AM | 61 (2.7%) | 119 (4.7%) |
| 9:00 AM to 9:59 AM | 170 (7.5%) | 126 (5.0%) |
| 10:00 AM to 10:59 AM | 21 (0.9%) | 50 (2.0%) |
| 11:00 AM to 11:59 AM | 0 (0.0%) | 93 (3.7%) |
| 12:00 PM to 3:59 PM | 104 (4.6%) | 312 (12.4%) |
| 4:00 PM to 11:59 PM | 162 (7.1%) | 203 (8.1%) |
| Total | 2,274 (100.0%) | 2,515 (100.0%) |
Housing Occupancy in Marysville
Occupancy by Ownership in Marysville
Of the total 4,733 dwellings in Marysville, owner-occupied units account for 1,896 (40.1%), while renter-occupied units make up 2,837 (59.9%).
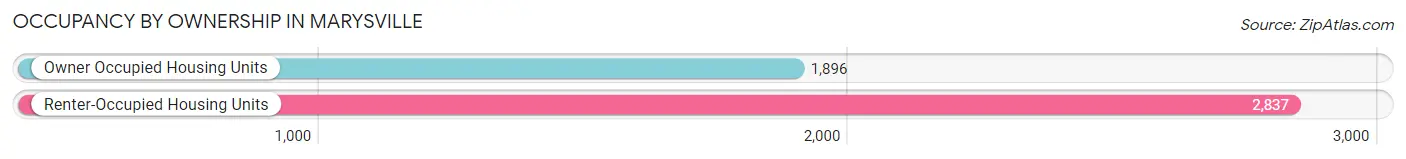
| Occupancy | # Housing Units | % Housing Units |
| Owner Occupied Housing Units | 1,896 | 40.1% |
| Renter-Occupied Housing Units | 2,837 | 59.9% |
| Total Occupied Housing Units | 4,733 | 100.0% |
Occupancy by Household Size in Marysville
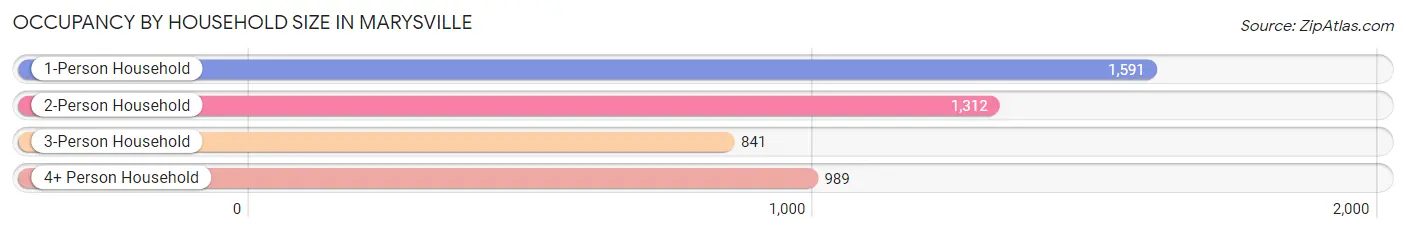
| Household Size | # Housing Units | % Housing Units |
| 1-Person Household | 1,591 | 33.6% |
| 2-Person Household | 1,312 | 27.7% |
| 3-Person Household | 841 | 17.8% |
| 4+ Person Household | 989 | 20.9% |
| Total Housing Units | 4,733 | 100.0% |
Occupancy by Ownership by Household Size in Marysville
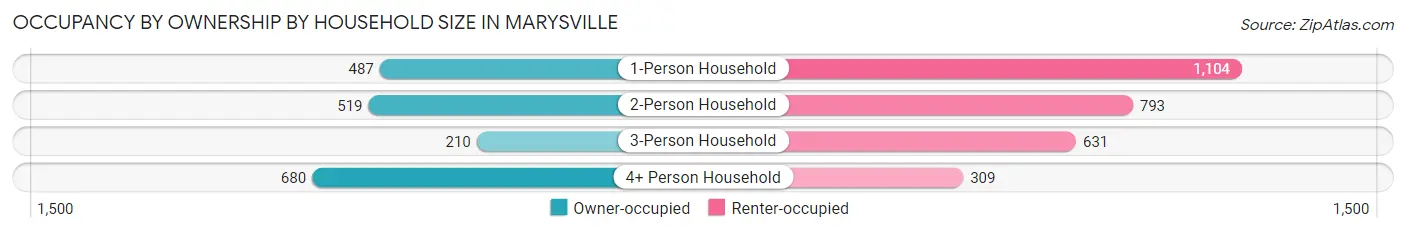
| Household Size | Owner-occupied | Renter-occupied |
| 1-Person Household | 487 (30.6%) | 1,104 (69.4%) |
| 2-Person Household | 519 (39.6%) | 793 (60.4%) |
| 3-Person Household | 210 (25.0%) | 631 (75.0%) |
| 4+ Person Household | 680 (68.8%) | 309 (31.2%) |
| Total Housing Units | 1,896 (40.1%) | 2,837 (59.9%) |
Occupancy by Educational Attainment in Marysville
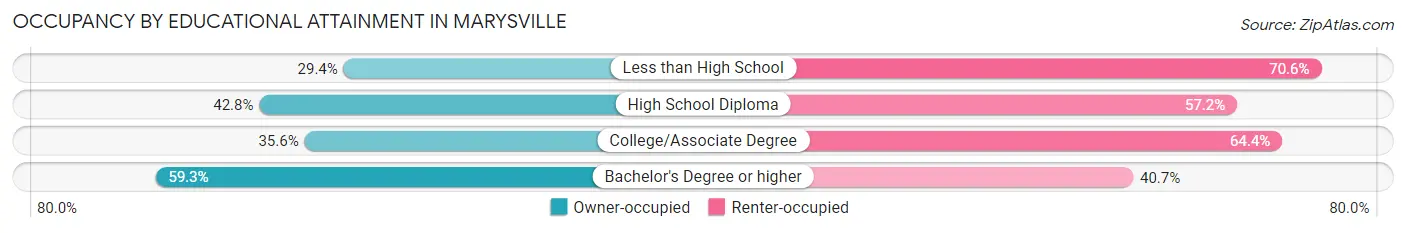
| Household Size | Owner-occupied | Renter-occupied |
| Less than High School | 202 (29.4%) | 485 (70.6%) |
| High School Diploma | 444 (42.8%) | 594 (57.2%) |
| College/Associate Degree | 802 (35.6%) | 1,450 (64.4%) |
| Bachelor's Degree or higher | 448 (59.3%) | 308 (40.7%) |
Occupancy by Age of Householder in Marysville
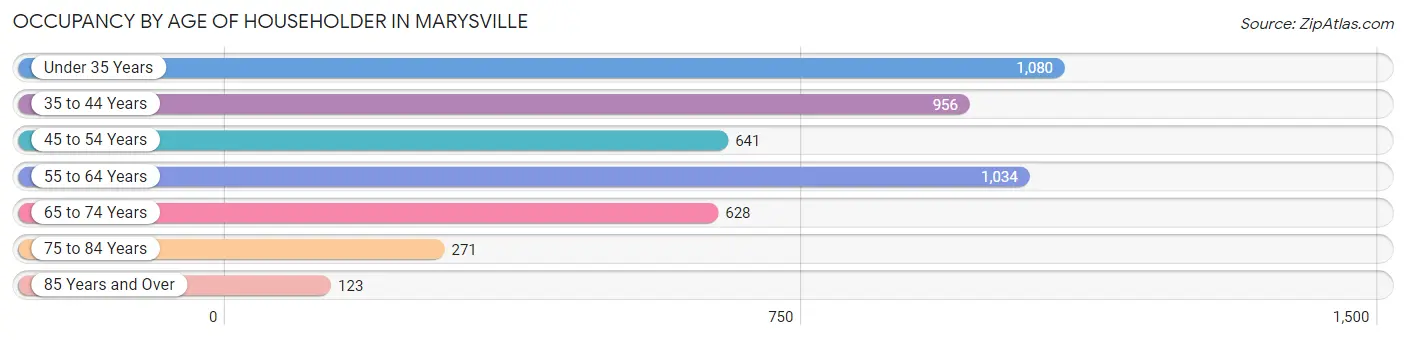
| Age Bracket | # Households | % Households |
| Under 35 Years | 1,080 | 22.8% |
| 35 to 44 Years | 956 | 20.2% |
| 45 to 54 Years | 641 | 13.5% |
| 55 to 64 Years | 1,034 | 21.8% |
| 65 to 74 Years | 628 | 13.3% |
| 75 to 84 Years | 271 | 5.7% |
| 85 Years and Over | 123 | 2.6% |
| Total | 4,733 | 100.0% |
Housing Finances in Marysville
Median Income by Occupancy in Marysville
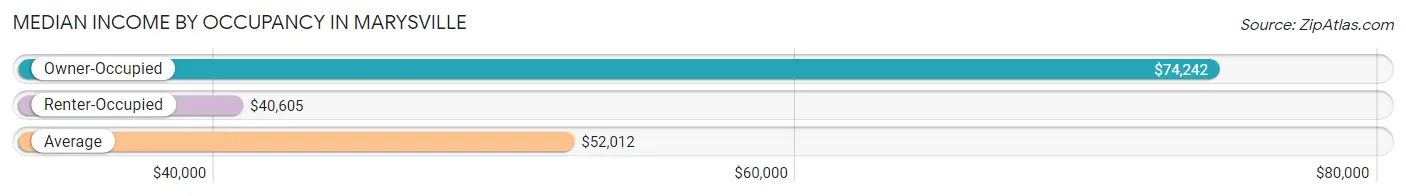
| Occupancy Type | # Households | Median Income |
| Owner-Occupied | 1,896 (40.1%) | $74,242 |
| Renter-Occupied | 2,837 (59.9%) | $40,605 |
| Average | 4,733 (100.0%) | $52,012 |
Occupancy by Householder Income Bracket in Marysville
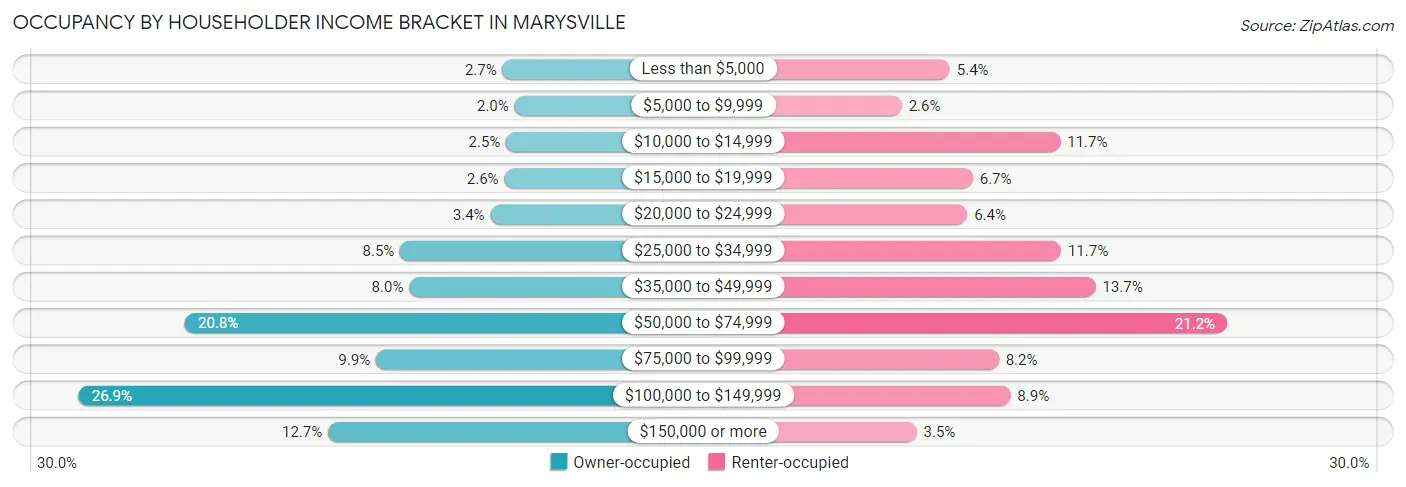
| Income Bracket | Owner-occupied | Renter-occupied |
| Less than $5,000 | 51 (2.7%) | 153 (5.4%) |
| $5,000 to $9,999 | 38 (2.0%) | 75 (2.6%) |
| $10,000 to $14,999 | 47 (2.5%) | 332 (11.7%) |
| $15,000 to $19,999 | 49 (2.6%) | 190 (6.7%) |
| $20,000 to $24,999 | 64 (3.4%) | 181 (6.4%) |
| $25,000 to $34,999 | 162 (8.5%) | 333 (11.7%) |
| $35,000 to $49,999 | 152 (8.0%) | 389 (13.7%) |
| $50,000 to $74,999 | 395 (20.8%) | 602 (21.2%) |
| $75,000 to $99,999 | 188 (9.9%) | 232 (8.2%) |
| $100,000 to $149,999 | 510 (26.9%) | 251 (8.8%) |
| $150,000 or more | 240 (12.7%) | 99 (3.5%) |
| Total | 1,896 (100.0%) | 2,837 (100.0%) |
Monthly Housing Cost Tiers in Marysville
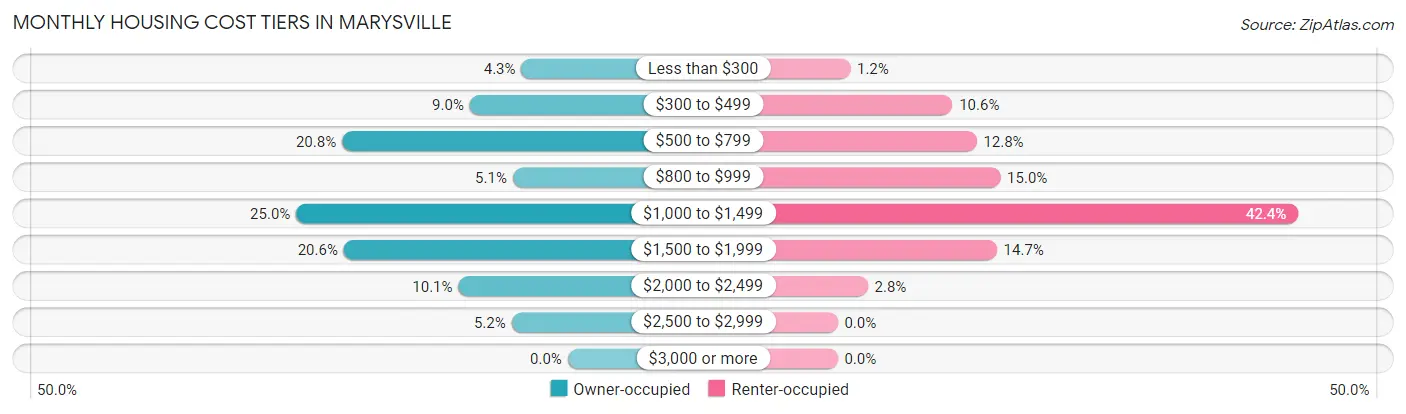
| Monthly Cost | Owner-occupied | Renter-occupied |
| Less than $300 | 81 (4.3%) | 33 (1.2%) |
| $300 to $499 | 171 (9.0%) | 300 (10.6%) |
| $500 to $799 | 394 (20.8%) | 363 (12.8%) |
| $800 to $999 | 96 (5.1%) | 425 (15.0%) |
| $1,000 to $1,499 | 474 (25.0%) | 1,203 (42.4%) |
| $1,500 to $1,999 | 391 (20.6%) | 416 (14.7%) |
| $2,000 to $2,499 | 191 (10.1%) | 79 (2.8%) |
| $2,500 to $2,999 | 98 (5.2%) | 0 (0.0%) |
| $3,000 or more | 0 (0.0%) | 0 (0.0%) |
| Total | 1,896 (100.0%) | 2,837 (100.0%) |
Physical Housing Characteristics in Marysville
Housing Structures in Marysville
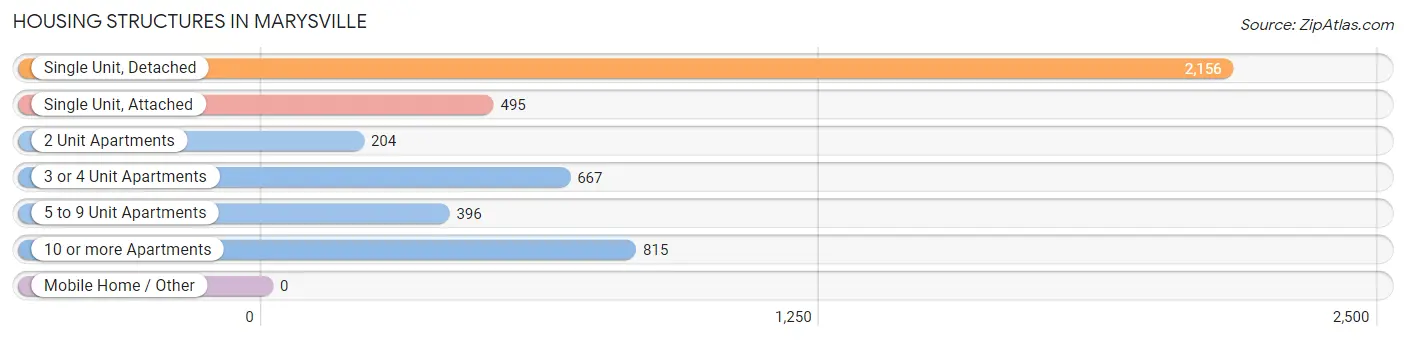
| Structure Type | # Housing Units | % Housing Units |
| Single Unit, Detached | 2,156 | 45.6% |
| Single Unit, Attached | 495 | 10.5% |
| 2 Unit Apartments | 204 | 4.3% |
| 3 or 4 Unit Apartments | 667 | 14.1% |
| 5 to 9 Unit Apartments | 396 | 8.4% |
| 10 or more Apartments | 815 | 17.2% |
| Mobile Home / Other | 0 | 0.0% |
| Total | 4,733 | 100.0% |
Housing Structures by Occupancy in Marysville
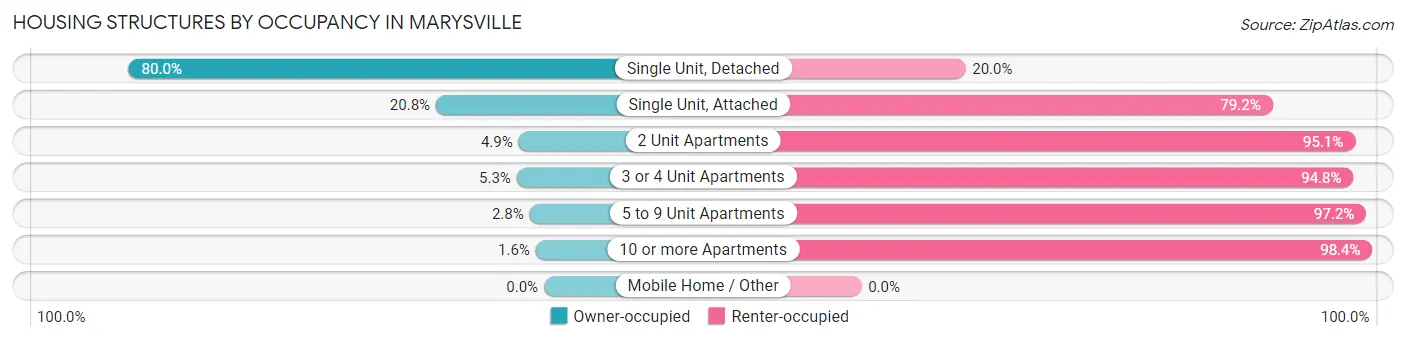
| Structure Type | Owner-occupied | Renter-occupied |
| Single Unit, Detached | 1,724 (80.0%) | 432 (20.0%) |
| Single Unit, Attached | 103 (20.8%) | 392 (79.2%) |
| 2 Unit Apartments | 10 (4.9%) | 194 (95.1%) |
| 3 or 4 Unit Apartments | 35 (5.2%) | 632 (94.8%) |
| 5 to 9 Unit Apartments | 11 (2.8%) | 385 (97.2%) |
| 10 or more Apartments | 13 (1.6%) | 802 (98.4%) |
| Mobile Home / Other | 0 (0.0%) | 0 (0.0%) |
| Total | 1,896 (40.1%) | 2,837 (59.9%) |
Housing Structures by Number of Rooms in Marysville
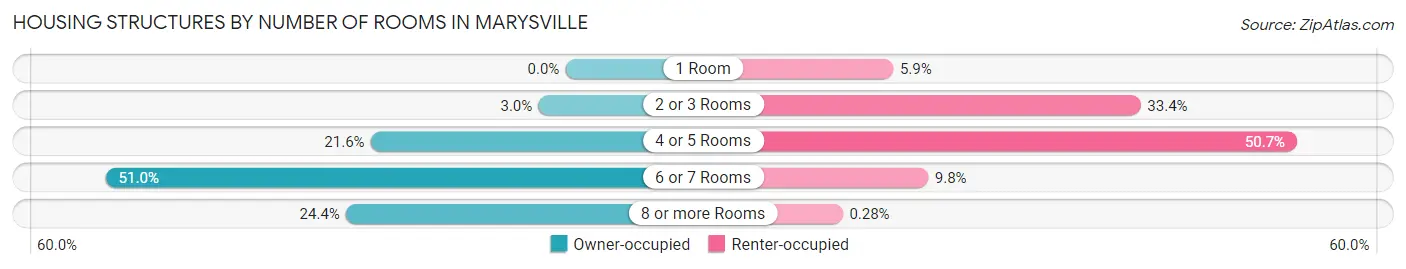
| Number of Rooms | Owner-occupied | Renter-occupied |
| 1 Room | 0 (0.0%) | 167 (5.9%) |
| 2 or 3 Rooms | 57 (3.0%) | 946 (33.4%) |
| 4 or 5 Rooms | 410 (21.6%) | 1,439 (50.7%) |
| 6 or 7 Rooms | 967 (51.0%) | 277 (9.8%) |
| 8 or more Rooms | 462 (24.4%) | 8 (0.3%) |
| Total | 1,896 (100.0%) | 2,837 (100.0%) |
Housing Structure by Heating Type in Marysville
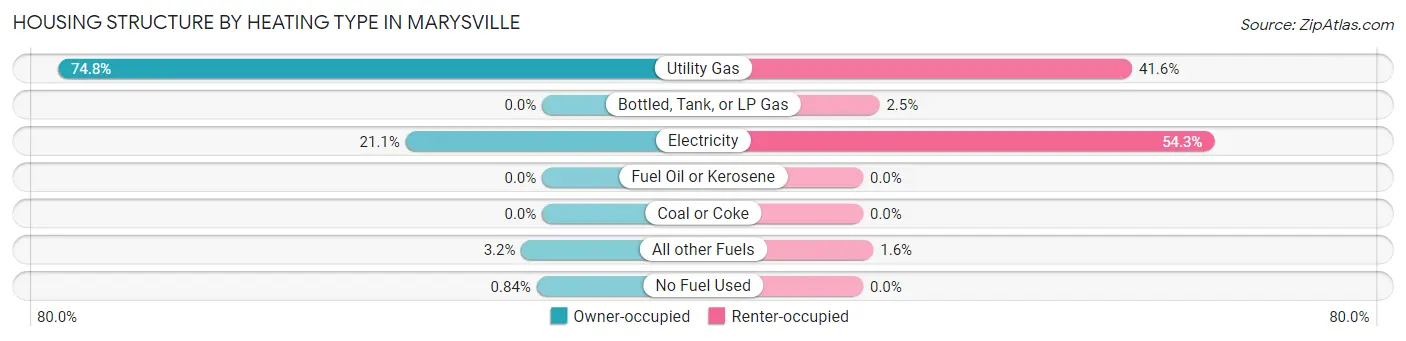
| Heating Type | Owner-occupied | Renter-occupied |
| Utility Gas | 1,419 (74.8%) | 1,180 (41.6%) |
| Bottled, Tank, or LP Gas | 0 (0.0%) | 72 (2.5%) |
| Electricity | 400 (21.1%) | 1,540 (54.3%) |
| Fuel Oil or Kerosene | 0 (0.0%) | 0 (0.0%) |
| Coal or Coke | 0 (0.0%) | 0 (0.0%) |
| All other Fuels | 61 (3.2%) | 45 (1.6%) |
| No Fuel Used | 16 (0.8%) | 0 (0.0%) |
| Total | 1,896 (100.0%) | 2,837 (100.0%) |
Household Vehicle Usage in Marysville
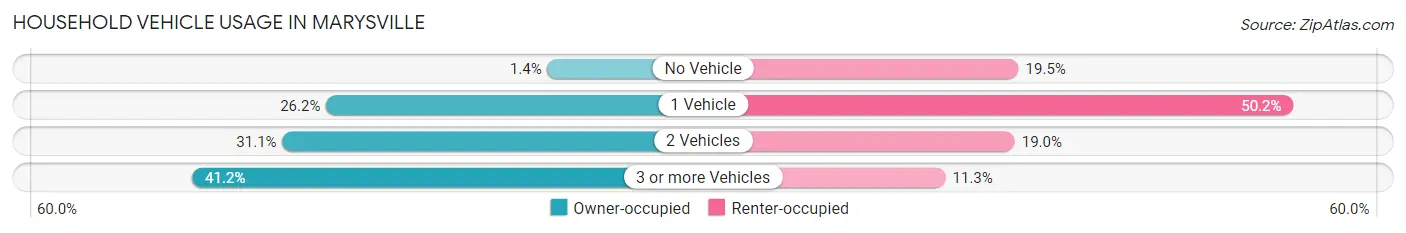
| Vehicles per Household | Owner-occupied | Renter-occupied |
| No Vehicle | 27 (1.4%) | 552 (19.5%) |
| 1 Vehicle | 497 (26.2%) | 1,425 (50.2%) |
| 2 Vehicles | 590 (31.1%) | 540 (19.0%) |
| 3 or more Vehicles | 782 (41.2%) | 320 (11.3%) |
| Total | 1,896 (100.0%) | 2,837 (100.0%) |
Real Estate & Mortgages in Marysville
Real Estate and Mortgage Overview in Marysville
| Characteristic | Without Mortgage | With Mortgage |
| Housing Units | 647 | 1,249 |
| Median Property Value | $279,400 | $260,400 |
| Median Household Income | $70,767 | $168 |
| Monthly Housing Costs | $579 | $0 |
| Real Estate Taxes | $1,844 | $42 |
Property Value by Mortgage Status in Marysville
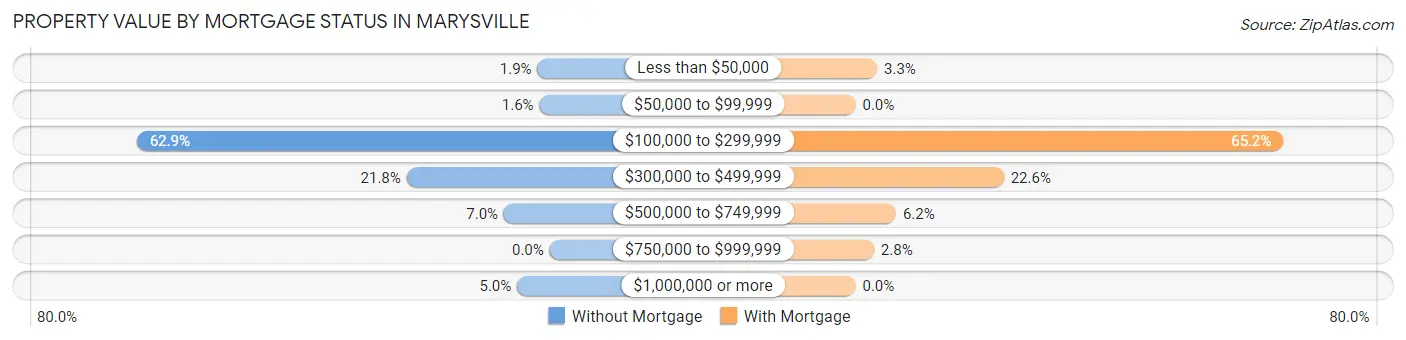
| Property Value | Without Mortgage | With Mortgage |
| Less than $50,000 | 12 (1.8%) | 41 (3.3%) |
| $50,000 to $99,999 | 10 (1.5%) | 0 (0.0%) |
| $100,000 to $299,999 | 407 (62.9%) | 814 (65.2%) |
| $300,000 to $499,999 | 141 (21.8%) | 282 (22.6%) |
| $500,000 to $749,999 | 45 (7.0%) | 77 (6.2%) |
| $750,000 to $999,999 | 0 (0.0%) | 35 (2.8%) |
| $1,000,000 or more | 32 (5.0%) | 0 (0.0%) |
| Total | 647 (100.0%) | 1,249 (100.0%) |
Household Income by Mortgage Status in Marysville
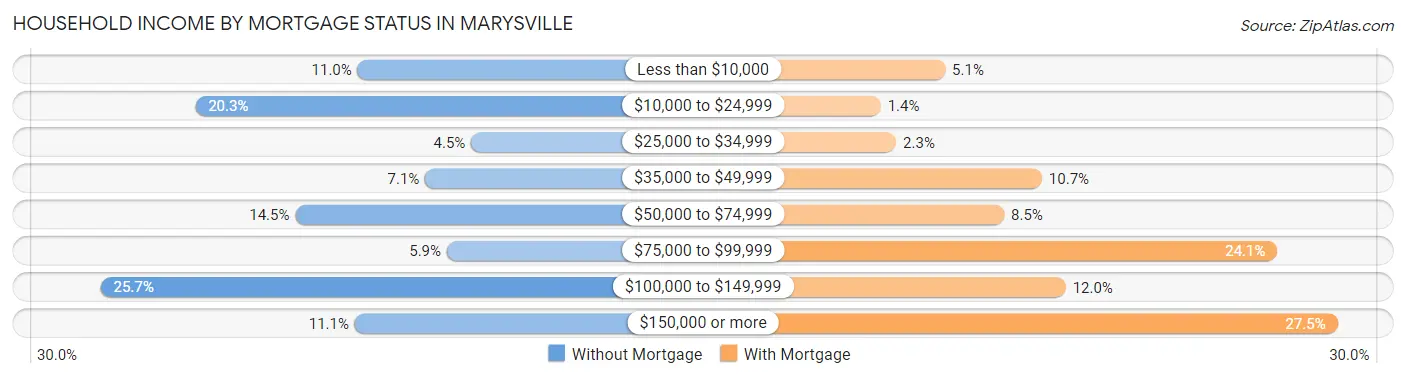
| Household Income | Without Mortgage | With Mortgage |
| Less than $10,000 | 71 (11.0%) | 64 (5.1%) |
| $10,000 to $24,999 | 131 (20.3%) | 18 (1.4%) |
| $25,000 to $34,999 | 29 (4.5%) | 29 (2.3%) |
| $35,000 to $49,999 | 46 (7.1%) | 133 (10.6%) |
| $50,000 to $74,999 | 94 (14.5%) | 106 (8.5%) |
| $75,000 to $99,999 | 38 (5.9%) | 301 (24.1%) |
| $100,000 to $149,999 | 166 (25.7%) | 150 (12.0%) |
| $150,000 or more | 72 (11.1%) | 344 (27.5%) |
| Total | 647 (100.0%) | 1,249 (100.0%) |
Property Value to Household Income Ratio in Marysville
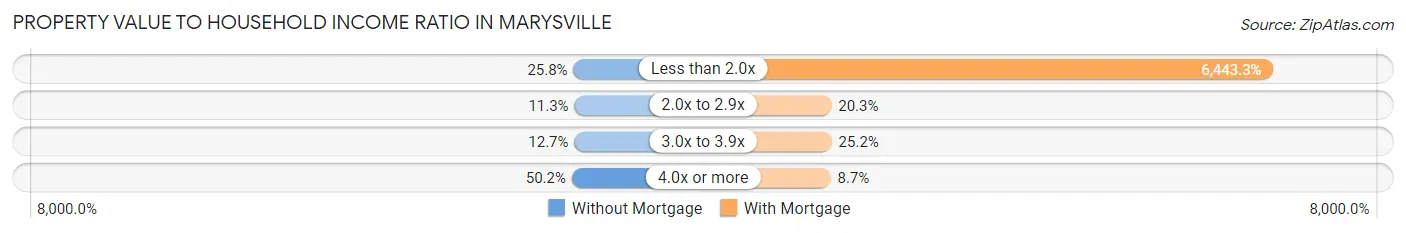
| Value-to-Income Ratio | Without Mortgage | With Mortgage |
| Less than 2.0x | 167 (25.8%) | 80,477 (6,443.3%) |
| 2.0x to 2.9x | 73 (11.3%) | 254 (20.3%) |
| 3.0x to 3.9x | 82 (12.7%) | 315 (25.2%) |
| 4.0x or more | 325 (50.2%) | 108 (8.6%) |
| Total | 647 (100.0%) | 1,249 (100.0%) |
Real Estate Taxes by Mortgage Status in Marysville
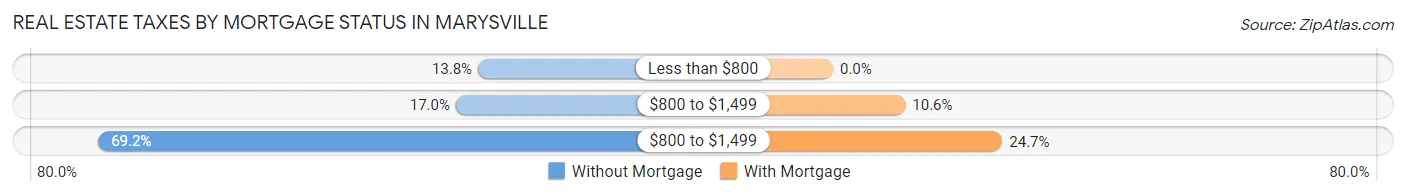
| Property Taxes | Without Mortgage | With Mortgage |
| Less than $800 | 89 (13.8%) | 0 (0.0%) |
| $800 to $1,499 | 110 (17.0%) | 132 (10.6%) |
| $800 to $1,499 | 448 (69.2%) | 309 (24.7%) |
| Total | 647 (100.0%) | 1,249 (100.0%) |
Health & Disability in Marysville
Health Insurance Coverage by Age in Marysville
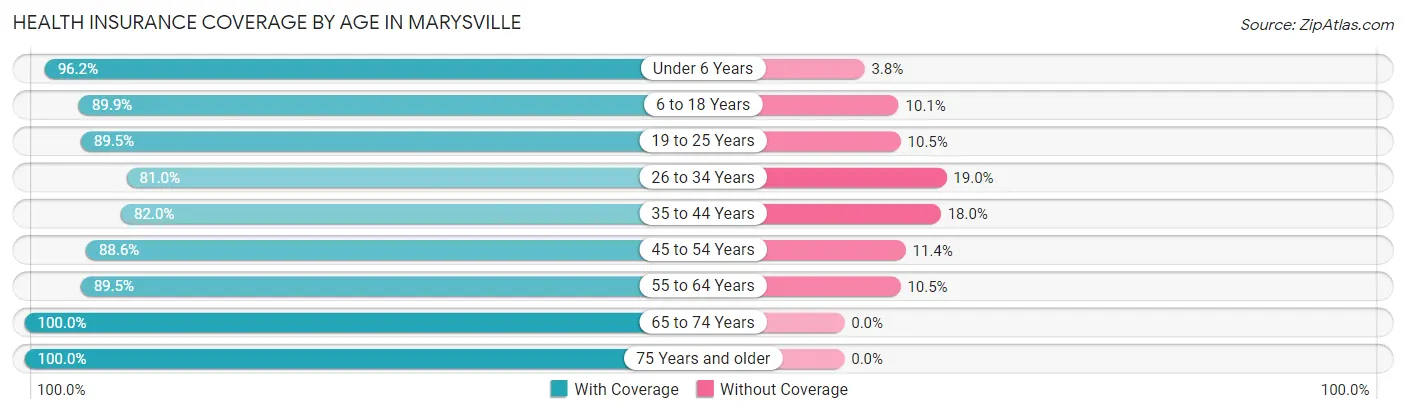
| Age Bracket | With Coverage | Without Coverage |
| Under 6 Years | 946 (96.2%) | 37 (3.8%) |
| 6 to 18 Years | 2,421 (89.9%) | 273 (10.1%) |
| 19 to 25 Years | 912 (89.5%) | 107 (10.5%) |
| 26 to 34 Years | 1,263 (81.0%) | 297 (19.0%) |
| 35 to 44 Years | 1,510 (82.0%) | 331 (18.0%) |
| 45 to 54 Years | 999 (88.6%) | 129 (11.4%) |
| 55 to 64 Years | 1,342 (89.5%) | 157 (10.5%) |
| 65 to 74 Years | 860 (100.0%) | 0 (0.0%) |
| 75 Years and older | 600 (100.0%) | 0 (0.0%) |
| Total | 10,853 (89.1%) | 1,331 (10.9%) |
Health Insurance Coverage by Citizenship Status in Marysville
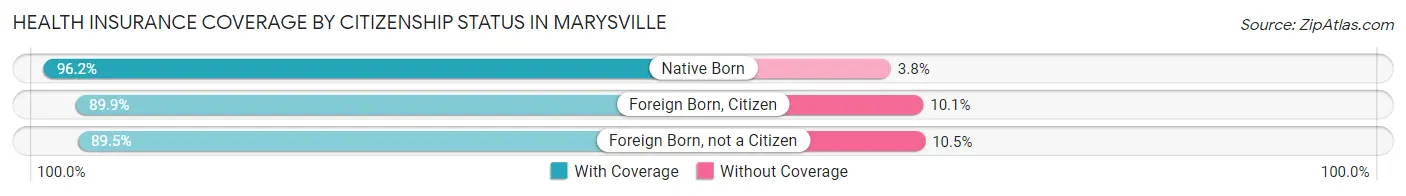
| Citizenship Status | With Coverage | Without Coverage |
| Native Born | 946 (96.2%) | 37 (3.8%) |
| Foreign Born, Citizen | 2,421 (89.9%) | 273 (10.1%) |
| Foreign Born, not a Citizen | 912 (89.5%) | 107 (10.5%) |
Health Insurance Coverage by Household Income in Marysville
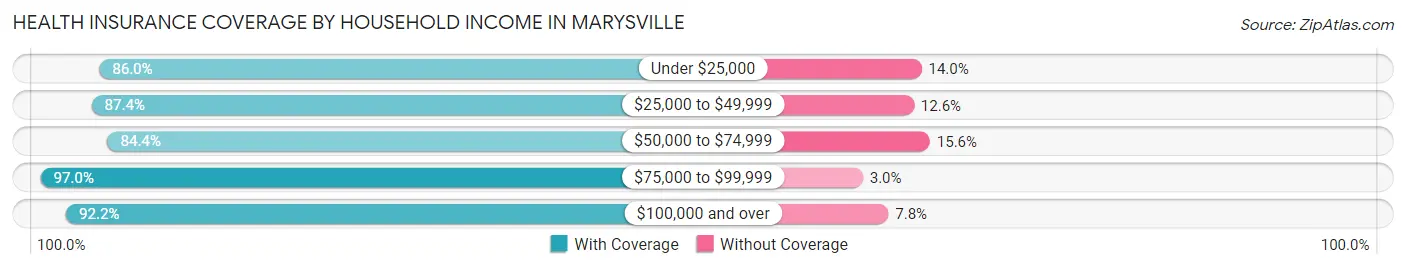
| Household Income | With Coverage | Without Coverage |
| Under $25,000 | 2,081 (86.0%) | 339 (14.0%) |
| $25,000 to $49,999 | 1,912 (87.4%) | 275 (12.6%) |
| $50,000 to $74,999 | 2,078 (84.4%) | 383 (15.6%) |
| $75,000 to $99,999 | 1,131 (97.0%) | 35 (3.0%) |
| $100,000 and over | 3,538 (92.2%) | 299 (7.8%) |
Public vs Private Health Insurance Coverage by Age in Marysville
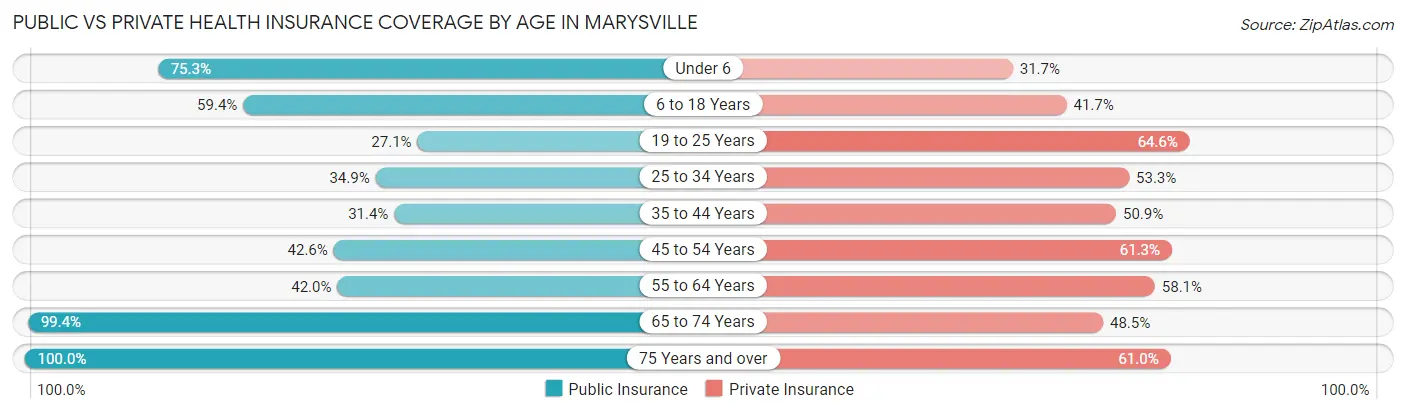
| Age Bracket | Public Insurance | Private Insurance |
| Under 6 | 740 (75.3%) | 312 (31.7%) |
| 6 to 18 Years | 1,601 (59.4%) | 1,124 (41.7%) |
| 19 to 25 Years | 276 (27.1%) | 658 (64.6%) |
| 25 to 34 Years | 544 (34.9%) | 832 (53.3%) |
| 35 to 44 Years | 578 (31.4%) | 937 (50.9%) |
| 45 to 54 Years | 481 (42.6%) | 691 (61.3%) |
| 55 to 64 Years | 629 (42.0%) | 871 (58.1%) |
| 65 to 74 Years | 855 (99.4%) | 417 (48.5%) |
| 75 Years and over | 600 (100.0%) | 366 (61.0%) |
| Total | 6,304 (51.7%) | 6,208 (50.9%) |
Disability Status by Sex by Age in Marysville
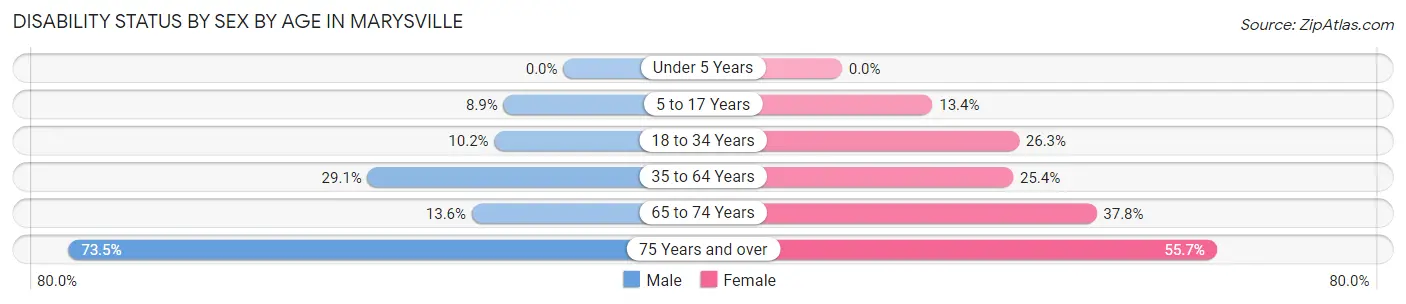
| Age Bracket | Male | Female |
| Under 5 Years | 0 (0.0%) | 0 (0.0%) |
| 5 to 17 Years | 152 (8.9%) | 134 (13.4%) |
| 18 to 34 Years | 125 (10.2%) | 387 (26.3%) |
| 35 to 64 Years | 606 (29.1%) | 606 (25.4%) |
| 65 to 74 Years | 50 (13.6%) | 186 (37.8%) |
| 75 Years and over | 136 (73.5%) | 231 (55.7%) |
Disability Class by Sex by Age in Marysville
Disability Class: Hearing Difficulty
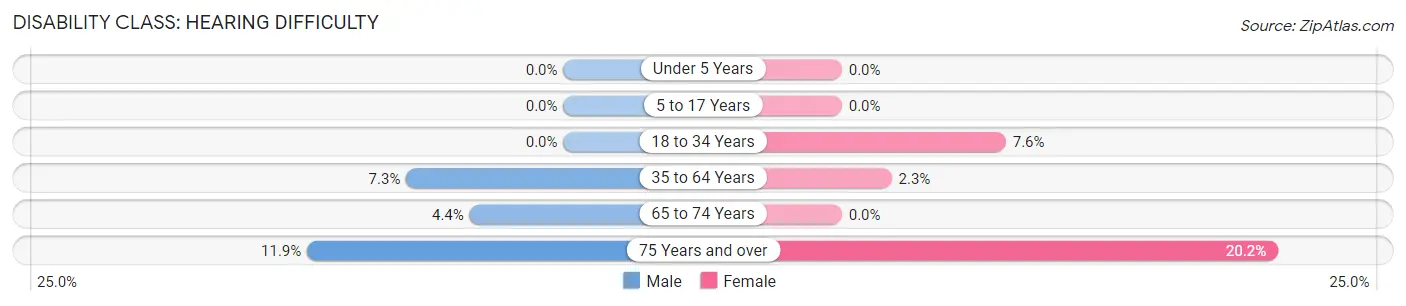
| Age Bracket | Male | Female |
| Under 5 Years | 0 (0.0%) | 0 (0.0%) |
| 5 to 17 Years | 0 (0.0%) | 0 (0.0%) |
| 18 to 34 Years | 0 (0.0%) | 112 (7.6%) |
| 35 to 64 Years | 152 (7.3%) | 55 (2.3%) |
| 65 to 74 Years | 16 (4.3%) | 0 (0.0%) |
| 75 Years and over | 22 (11.9%) | 84 (20.2%) |
Disability Class: Vision Difficulty
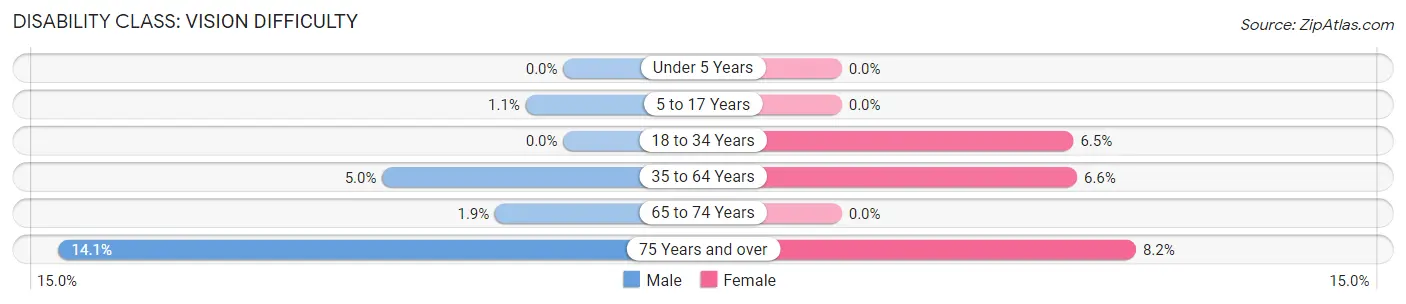
| Age Bracket | Male | Female |
| Under 5 Years | 0 (0.0%) | 0 (0.0%) |
| 5 to 17 Years | 18 (1.1%) | 0 (0.0%) |
| 18 to 34 Years | 0 (0.0%) | 95 (6.5%) |
| 35 to 64 Years | 105 (5.0%) | 156 (6.6%) |
| 65 to 74 Years | 7 (1.9%) | 0 (0.0%) |
| 75 Years and over | 26 (14.1%) | 34 (8.2%) |
Disability Class: Cognitive Difficulty
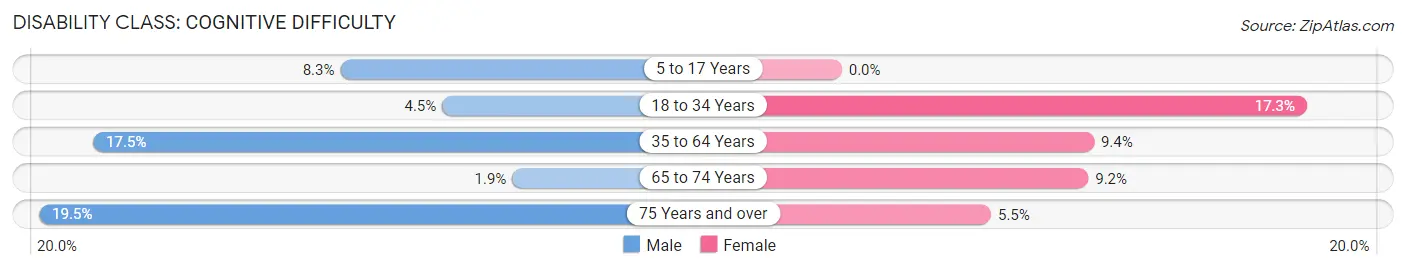
| Age Bracket | Male | Female |
| 5 to 17 Years | 142 (8.3%) | 0 (0.0%) |
| 18 to 34 Years | 55 (4.5%) | 254 (17.3%) |
| 35 to 64 Years | 364 (17.5%) | 223 (9.4%) |
| 65 to 74 Years | 7 (1.9%) | 45 (9.1%) |
| 75 Years and over | 36 (19.5%) | 23 (5.5%) |
Disability Class: Ambulatory Difficulty
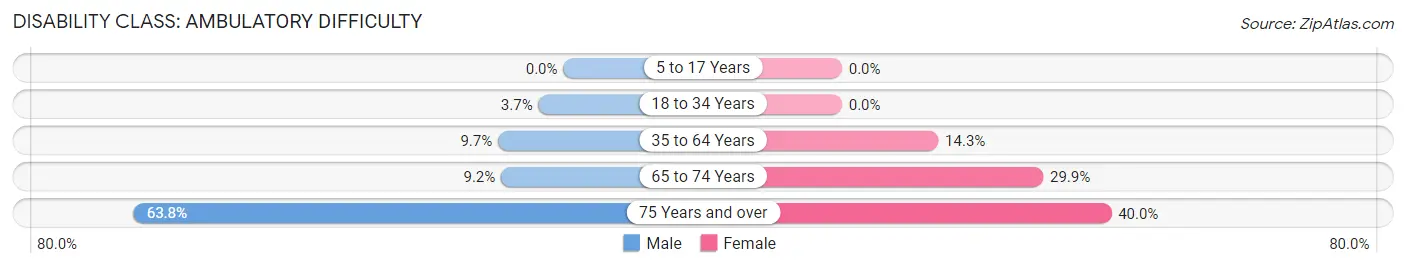
| Age Bracket | Male | Female |
| 5 to 17 Years | 0 (0.0%) | 0 (0.0%) |
| 18 to 34 Years | 45 (3.7%) | 0 (0.0%) |
| 35 to 64 Years | 202 (9.7%) | 341 (14.3%) |
| 65 to 74 Years | 34 (9.2%) | 147 (29.9%) |
| 75 Years and over | 118 (63.8%) | 166 (40.0%) |
Disability Class: Self-Care Difficulty
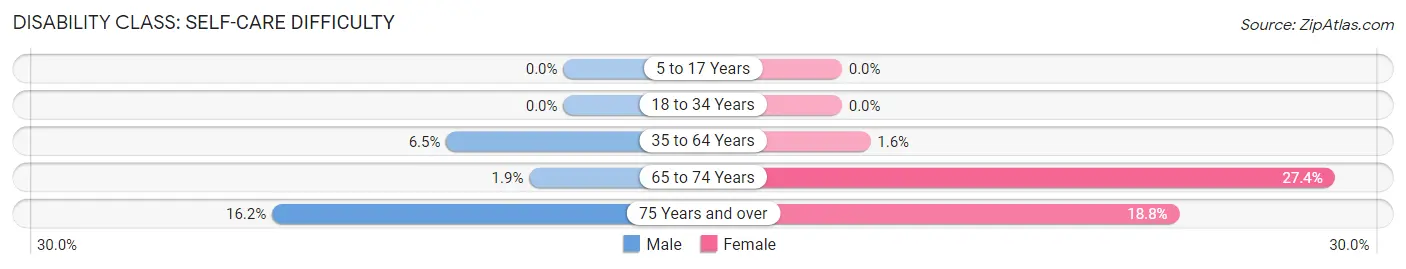
| Age Bracket | Male | Female |
| 5 to 17 Years | 0 (0.0%) | 0 (0.0%) |
| 18 to 34 Years | 0 (0.0%) | 0 (0.0%) |
| 35 to 64 Years | 136 (6.5%) | 38 (1.6%) |
| 65 to 74 Years | 7 (1.9%) | 135 (27.4%) |
| 75 Years and over | 30 (16.2%) | 78 (18.8%) |
Technology Access in Marysville
Computing Device Access in Marysville
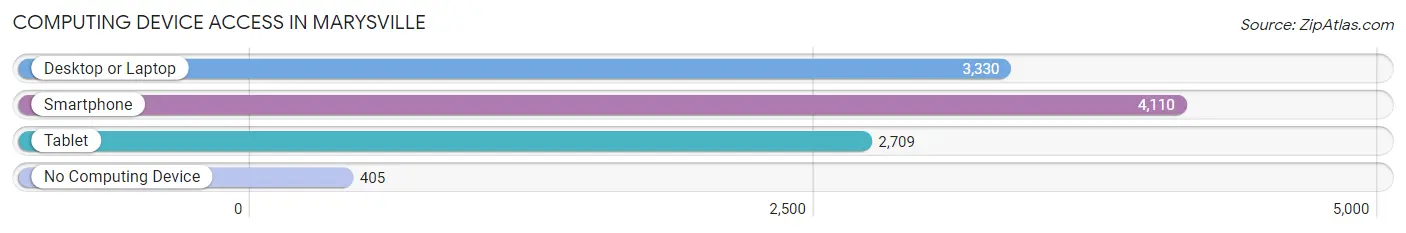
| Device Type | # Households | % Households |
| Desktop or Laptop | 3,330 | 70.4% |
| Smartphone | 4,110 | 86.8% |
| Tablet | 2,709 | 57.2% |
| No Computing Device | 405 | 8.6% |
| Total | 4,733 | 100.0% |
Internet Access in Marysville
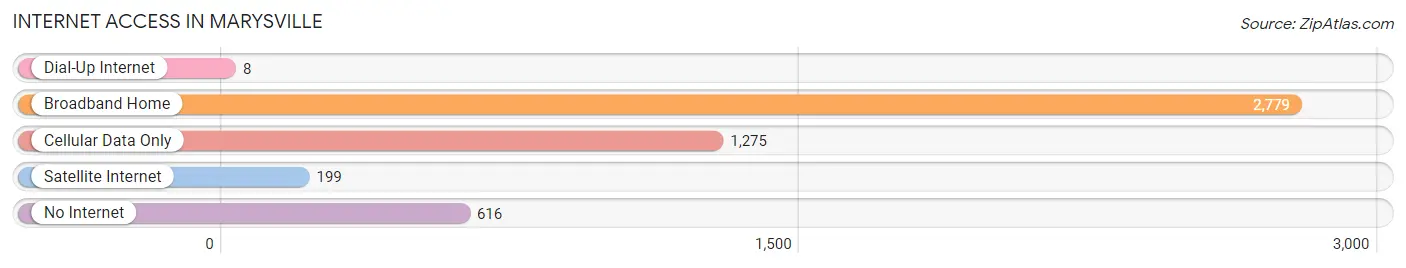
| Internet Type | # Households | % Households |
| Dial-Up Internet | 8 | 0.2% |
| Broadband Home | 2,779 | 58.7% |
| Cellular Data Only | 1,275 | 26.9% |
| Satellite Internet | 199 | 4.2% |
| No Internet | 616 | 13.0% |
| Total | 4,733 | 100.0% |
Marysville Summary
Marysville, California is a city located in Yuba County, California, United States. It is situated in the foothills of the Sierra Nevada Mountains, approximately 40 miles north of Sacramento. The city has a population of 12,072 as of the 2010 census, making it the largest city in Yuba County.
History
The area that is now Marysville was originally inhabited by the Maidu and Konkow Native American tribes. The first European settlers arrived in the area in 1842, led by John Sutter. The city was founded in 1851 by Charles Covillaud, who named it after his wife, Mary. The city was incorporated in 1855 and quickly became a major hub for the gold rush.
In the late 19th century, Marysville was a major center for the lumber industry, with several sawmills located in the area. The city also became a major transportation hub, with the completion of the Central Pacific Railroad in 1869.
Geography
Marysville is located at 39°10'N 121°34'W, at an elevation of 118 feet. The city is situated in the foothills of the Sierra Nevada Mountains, approximately 40 miles north of Sacramento. The city is bordered by the Yuba River to the east and the Feather River to the west.
The climate in Marysville is characterized by hot, dry summers and cool, wet winters. The average annual temperature is 61°F, with an average high of 90°F in the summer and an average low of 33°F in the winter.
Economy
The economy of Marysville is largely based on agriculture and manufacturing. The city is home to several large agricultural companies, including Sun-Maid Raisins, Pacific Coast Producers, and California Dried Fruit. The city is also home to several manufacturing companies, including Sierra Pacific Industries, a lumber company, and Marysville Machine Works, a machine shop.
The city is also home to several retail stores, restaurants, and other businesses. The city is served by the Yuba County Airport, which offers flights to several major cities in California.
Demographics
As of the 2010 census, Marysville had a population of 12,072. The racial makeup of the city was 68.3% White, 5.2% African American, 1.2% Native American, 1.7% Asian, 0.2% Pacific Islander, 18.3% from other races, and 5.3% from two or more races. Hispanic or Latino of any race were 33.2% of the population.
The median income for a household in Marysville was $41,945, and the median income for a family was $48,945. The per capita income for the city was $19,945. About 17.2% of families and 20.7% of the population were below the poverty line, including 28.2% of those under age 18 and 8.2% of those age 65 or over.
Common Questions
What is Per Capita Income in Marysville?
Per Capita income in Marysville is $25,755.
What is the Median Family Income in Marysville?
Median Family Income in Marysville is $59,100.
What is the Median Household income in Marysville?
Median Household Income in Marysville is $52,012.
What is Income or Wage Gap in Marysville?
Income or Wage Gap in Marysville is 39.6%.
Women in Marysville earn 60.4 cents for every dollar earned by a man.
What is Family Income Deficit in Marysville?
Family Income Deficit in Marysville is $11,288.
Families that are below poverty line in Marysville earn $11,288 less on average than the poverty threshold level.
What is Inequality or Gini Index in Marysville?
Inequality or Gini Index in Marysville is 0.44.
What is the Total Population of Marysville?
Total Population of Marysville is 12,681.
What is the Total Male Population of Marysville?
Total Male Population of Marysville is 6,409.
What is the Total Female Population of Marysville?
Total Female Population of Marysville is 6,272.
What is the Ratio of Males per 100 Females in Marysville?
There are 102.18 Males per 100 Females in Marysville.
What is the Ratio of Females per 100 Males in Marysville?
There are 97.86 Females per 100 Males in Marysville.
What is the Median Population Age in Marysville?
Median Population Age in Marysville is 33.6 Years.
What is the Average Family Size in Marysville
Average Family Size in Marysville is 3.3 People.
What is the Average Household Size in Marysville
Average Household Size in Marysville is 2.6 People.
How Large is the Labor Force in Marysville?
There are 5,455 People in the Labor Forcein in Marysville.
What is the Percentage of People in the Labor Force in Marysville?
56.5% of People are in the Labor Force in Marysville.
What is the Unemployment Rate in Marysville?
Unemployment Rate in Marysville is 7.7%.