Mariposa, CA Map & Demographics
Mariposa Map
Mariposa Overview
$27,321
PER CAPITA INCOME
$66,858
AVG FAMILY INCOME
$33,750
AVG HOUSEHOLD INCOME
60.6%
WAGE / INCOME GAP [ % ]
39.4¢/ $1
WAGE / INCOME GAP [ $ ]
0.43
INEQUALITY / GINI INDEX
1,060
TOTAL POPULATION
472
MALE POPULATION
588
FEMALE POPULATION
80.27
MALES / 100 FEMALES
124.58
FEMALES / 100 MALES
55.4
MEDIAN AGE
2.5
AVG FAMILY SIZE
1.6
AVG HOUSEHOLD SIZE
306
LABOR FORCE [ PEOPLE ]
34.2%
PERCENT IN LABOR FORCE
8.2%
UNEMPLOYMENT RATE
Mariposa Zip Codes
Mariposa Area Codes
Income in Mariposa
Income Overview in Mariposa
Per Capita Income in Mariposa is $27,321, while median incomes of families and households are $66,858 and $33,750 respectively.
| Characteristic | Number | Measure |
| Per Capita Income | 1,060 | $27,321 |
| Median Family Income | 233 | $66,858 |
| Mean Family Income | 233 | $81,108 |
| Median Household Income | 584 | $33,750 |
| Mean Household Income | 584 | $51,957 |
| Income Deficit | 233 | $0 |
| Wage / Income Gap (%) | 1,060 | 60.59% |
| Wage / Income Gap ($) | 1,060 | 39.41¢ per $1 |
| Gini / Inequality Index | 1,060 | 0.43 |
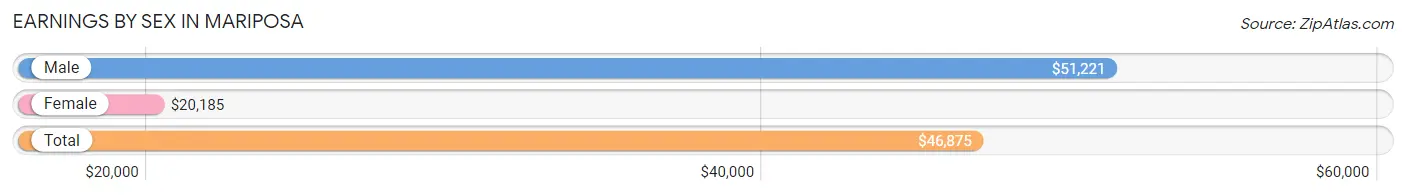
Earnings by Sex in Mariposa
Average Earnings in Mariposa are $46,875, $51,221 for men and $20,185 for women, a difference of 60.6%.
| Sex | Number | Average Earnings |
| Male | 204 (60.4%) | $51,221 |
| Female | 134 (39.6%) | $20,185 |
| Total | 338 (100.0%) | $46,875 |
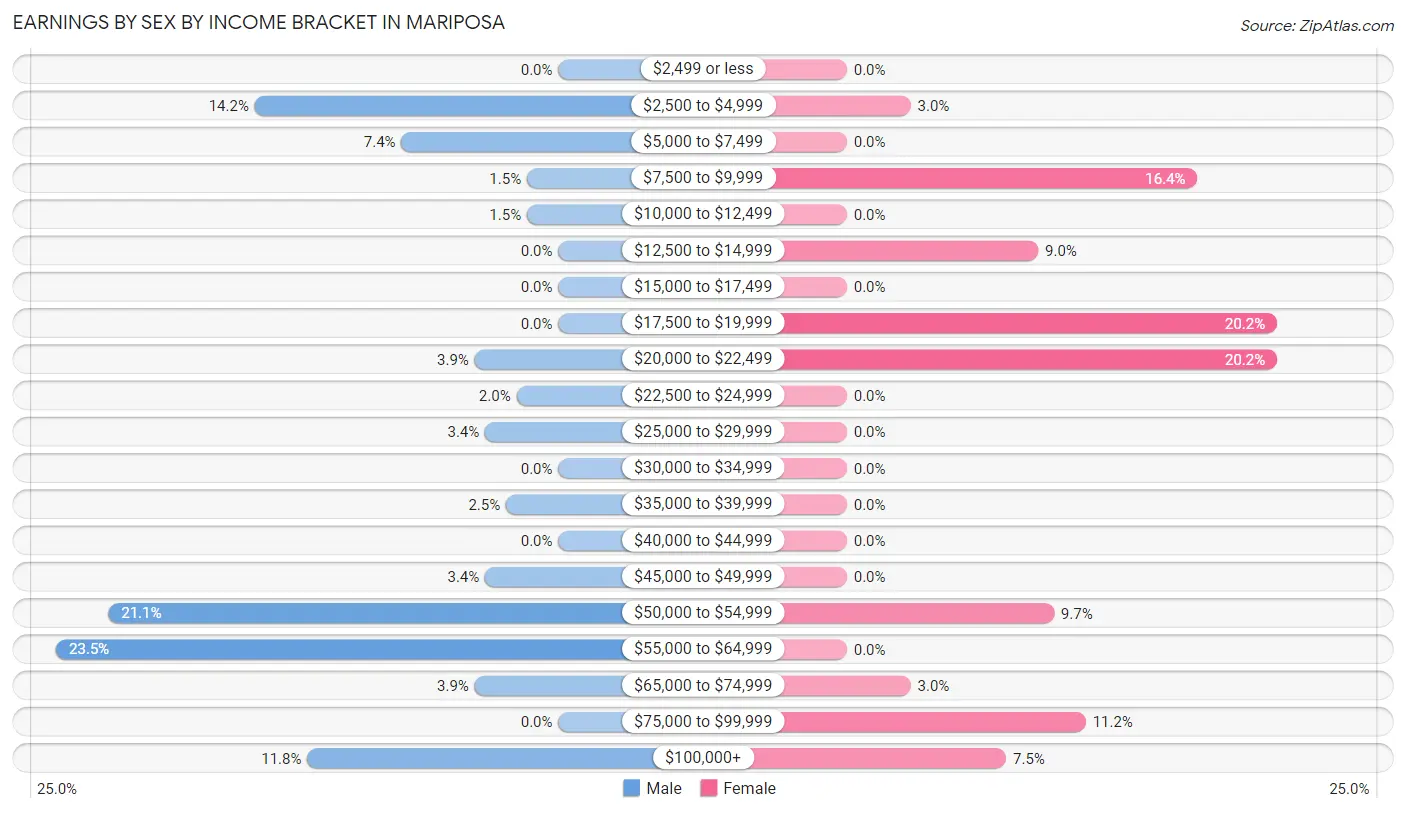
Earnings by Sex by Income Bracket in Mariposa
The most common earnings brackets in Mariposa are $55,000 to $64,999 for men (48 | 23.5%) and $17,500 to $19,999 for women (27 | 20.2%).
| Income | Male | Female |
| $2,499 or less | 0 (0.0%) | 0 (0.0%) |
| $2,500 to $4,999 | 29 (14.2%) | 4 (3.0%) |
| $5,000 to $7,499 | 15 (7.3%) | 0 (0.0%) |
| $7,500 to $9,999 | 3 (1.5%) | 22 (16.4%) |
| $10,000 to $12,499 | 3 (1.5%) | 0 (0.0%) |
| $12,500 to $14,999 | 0 (0.0%) | 12 (9.0%) |
| $15,000 to $17,499 | 0 (0.0%) | 0 (0.0%) |
| $17,500 to $19,999 | 0 (0.0%) | 27 (20.2%) |
| $20,000 to $22,499 | 8 (3.9%) | 27 (20.2%) |
| $22,500 to $24,999 | 4 (2.0%) | 0 (0.0%) |
| $25,000 to $29,999 | 7 (3.4%) | 0 (0.0%) |
| $30,000 to $34,999 | 0 (0.0%) | 0 (0.0%) |
| $35,000 to $39,999 | 5 (2.5%) | 0 (0.0%) |
| $40,000 to $44,999 | 0 (0.0%) | 0 (0.0%) |
| $45,000 to $49,999 | 7 (3.4%) | 0 (0.0%) |
| $50,000 to $54,999 | 43 (21.1%) | 13 (9.7%) |
| $55,000 to $64,999 | 48 (23.5%) | 0 (0.0%) |
| $65,000 to $74,999 | 8 (3.9%) | 4 (3.0%) |
| $75,000 to $99,999 | 0 (0.0%) | 15 (11.2%) |
| $100,000+ | 24 (11.8%) | 10 (7.5%) |
| Total | 204 (100.0%) | 134 (100.0%) |
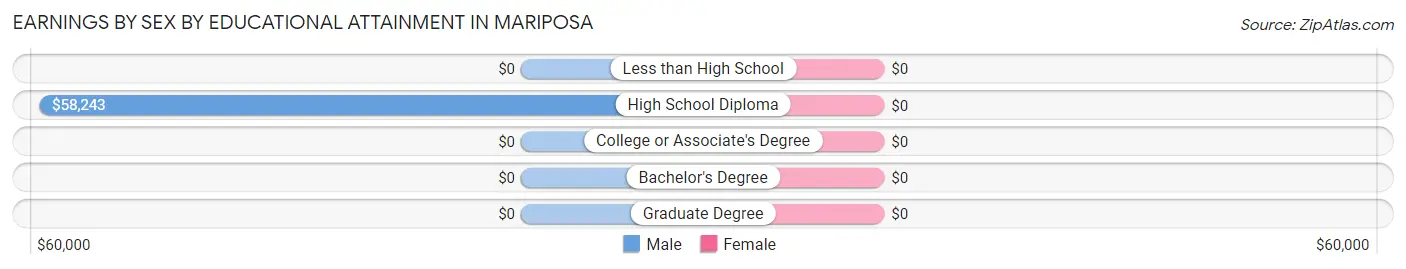
Earnings by Sex by Educational Attainment in Mariposa
| Educational Attainment | Male Income | Female Income |
| Less than High School | - | - |
| High School Diploma | $58,243 | $0 |
| College or Associate's Degree | - | - |
| Bachelor's Degree | - | - |
| Graduate Degree | - | - |
| Total | $51,047 | $0 |
Family Income in Mariposa
Family Income Brackets in Mariposa
According to the Mariposa family income data, there are 91 families falling into the $50,000 to $74,999 income range, which is the most common income bracket and makes up 39.1% of all families.
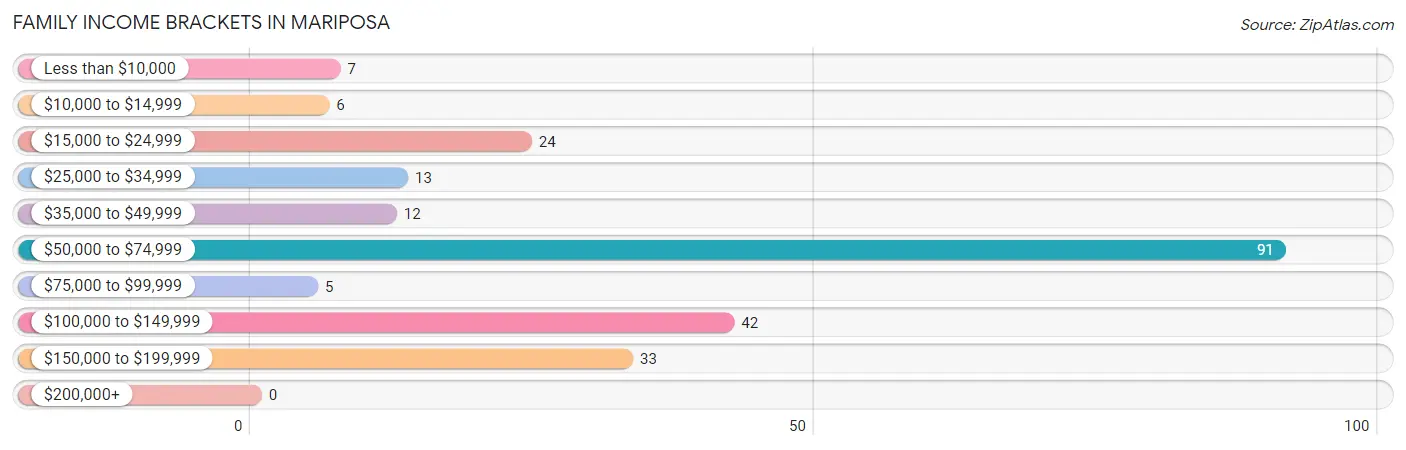
| Income Bracket | # Families | % Families |
| Less than $10,000 | 7 | 3.0% |
| $10,000 to $14,999 | 6 | 2.6% |
| $15,000 to $24,999 | 24 | 10.3% |
| $25,000 to $34,999 | 13 | 5.6% |
| $35,000 to $49,999 | 12 | 5.2% |
| $50,000 to $74,999 | 91 | 39.1% |
| $75,000 to $99,999 | 5 | 2.1% |
| $100,000 to $149,999 | 42 | 18.0% |
| $150,000 to $199,999 | 33 | 14.2% |
| $200,000+ | 0 | 0.0% |
Family Income by Famaliy Size in Mariposa
4-person families (33 | 14.2%) account for the highest median family income in Mariposa with $68,657 per family, while 2-person families (107 | 45.9%) have the highest median income of $31,534 per family member.
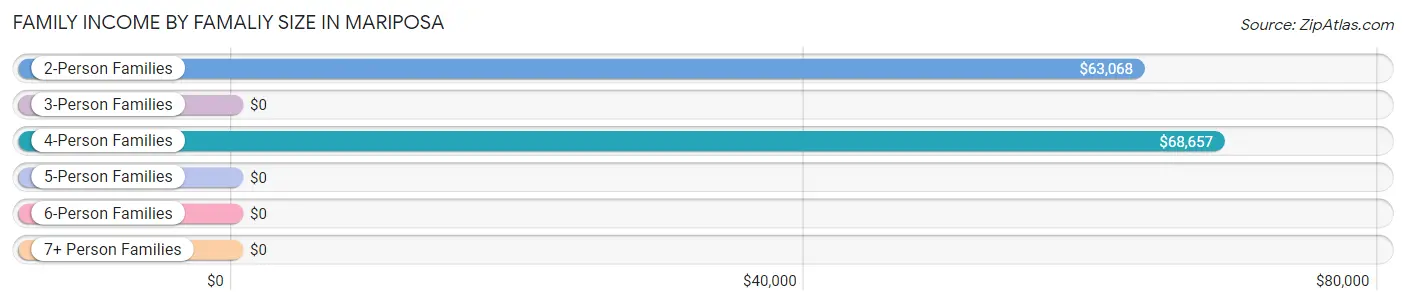
| Income Bracket | # Families | Median Income |
| 2-Person Families | 107 (45.9%) | $63,068 |
| 3-Person Families | 86 (36.9%) | $0 |
| 4-Person Families | 33 (14.2%) | $68,657 |
| 5-Person Families | 7 (3.0%) | $0 |
| 6-Person Families | 0 (0.0%) | $0 |
| 7+ Person Families | 0 (0.0%) | $0 |
| Total | 233 (100.0%) | $66,858 |
Family Income by Number of Earners in Mariposa
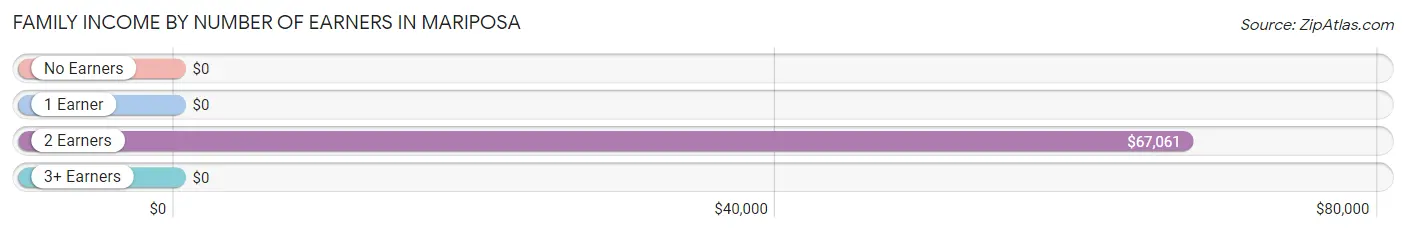
| Number of Earners | # Families | Median Income |
| No Earners | 80 (34.3%) | $0 |
| 1 Earner | 68 (29.2%) | $0 |
| 2 Earners | 85 (36.5%) | $67,061 |
| 3+ Earners | 0 (0.0%) | $0 |
| Total | 233 (100.0%) | $66,858 |
Household Income in Mariposa
Household Income Brackets in Mariposa
With 159 households falling in the category, the $50,000 to $74,999 income range is the most frequent in Mariposa, accounting for 27.2% of all households.
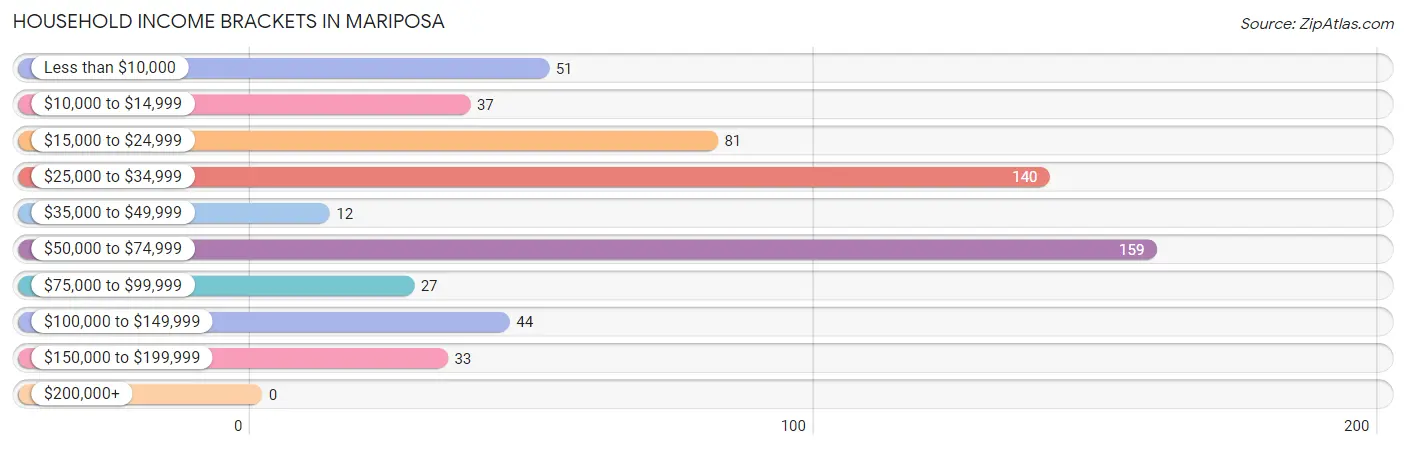
| Income Bracket | # Households | % Households |
| Less than $10,000 | 51 | 8.7% |
| $10,000 to $14,999 | 37 | 6.3% |
| $15,000 to $24,999 | 81 | 13.9% |
| $25,000 to $34,999 | 140 | 24.0% |
| $35,000 to $49,999 | 12 | 2.1% |
| $50,000 to $74,999 | 159 | 27.2% |
| $75,000 to $99,999 | 27 | 4.6% |
| $100,000 to $149,999 | 44 | 7.5% |
| $150,000 to $199,999 | 33 | 5.7% |
| $200,000+ | 0 | 0.0% |
Household Income by Householder Age in Mariposa
The median household income in Mariposa is $33,750, with the highest median household income of $66,149 found in the 25 to 44 years age bracket for the primary householder. A total of 134 households (23.0%) fall into this category.
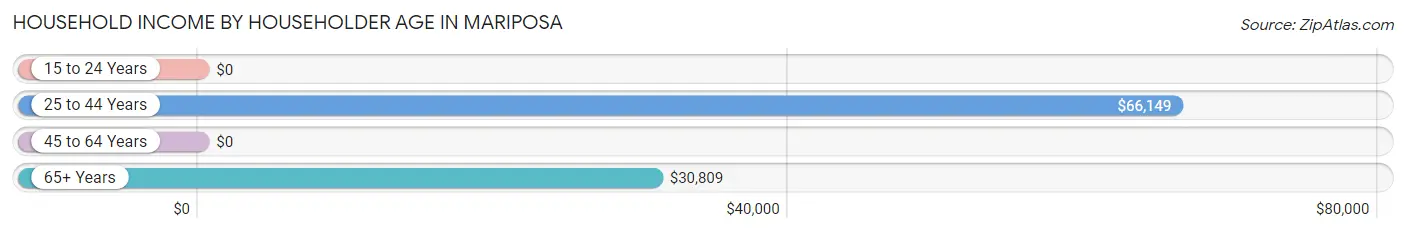
| Income Bracket | # Households | Median Income |
| 15 to 24 Years | 0 (0.0%) | $0 |
| 25 to 44 Years | 134 (23.0%) | $66,149 |
| 45 to 64 Years | 163 (27.9%) | $0 |
| 65+ Years | 287 (49.1%) | $30,809 |
| Total | 584 (100.0%) | $33,750 |
Poverty in Mariposa
Income Below Poverty by Sex and Age in Mariposa
With 27.6% poverty level for males and 21.7% for females among the residents of Mariposa, under 5 year old males and 12 to 14 year old females are the most vulnerable to poverty, with 7 males (100.0%) and 10 females (100.0%) in their respective age groups living below the poverty level.
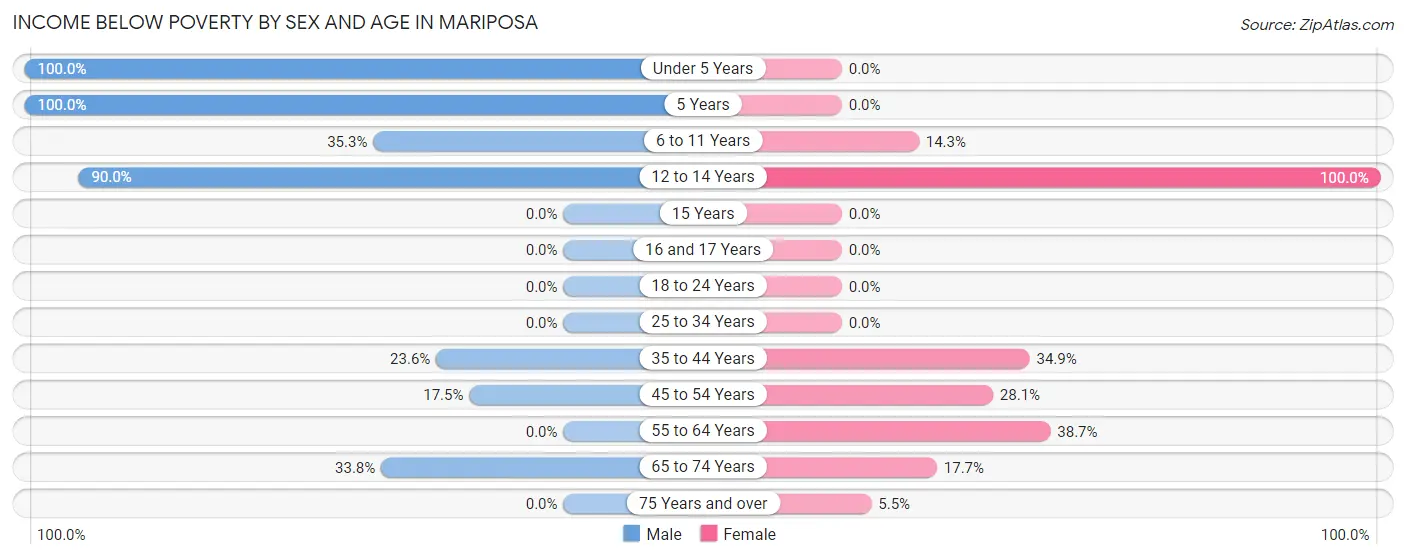
| Age Bracket | Male | Female |
| Under 5 Years | 7 (100.0%) | 0 (0.0%) |
| 5 Years | 17 (100.0%) | 0 (0.0%) |
| 6 to 11 Years | 12 (35.3%) | 8 (14.3%) |
| 12 to 14 Years | 9 (90.0%) | 10 (100.0%) |
| 15 Years | 0 (0.0%) | 0 (0.0%) |
| 16 and 17 Years | 0 (0.0%) | 0 (0.0%) |
| 18 to 24 Years | 0 (0.0%) | 0 (0.0%) |
| 25 to 34 Years | 0 (0.0%) | 0 (0.0%) |
| 35 to 44 Years | 17 (23.6%) | 23 (34.8%) |
| 45 to 54 Years | 11 (17.5%) | 23 (28.1%) |
| 55 to 64 Years | 0 (0.0%) | 36 (38.7%) |
| 65 to 74 Years | 45 (33.8%) | 12 (17.6%) |
| 75 Years and over | 0 (0.0%) | 10 (5.5%) |
| Total | 118 (27.6%) | 122 (21.7%) |
Income Above Poverty by Sex and Age in Mariposa
According to the poverty statistics in Mariposa, males aged 15 years and females aged under 5 years are the age groups that are most secure financially, with 100.0% of males and 100.0% of females in these age groups living above the poverty line.
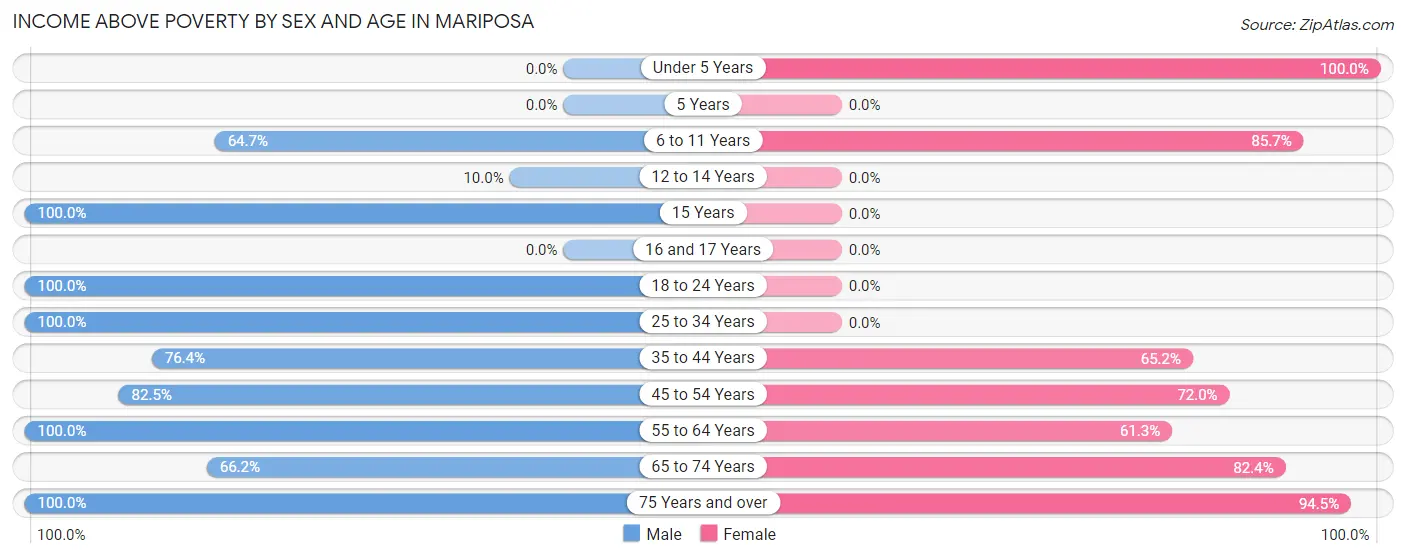
| Age Bracket | Male | Female |
| Under 5 Years | 0 (0.0%) | 4 (100.0%) |
| 5 Years | 0 (0.0%) | 0 (0.0%) |
| 6 to 11 Years | 22 (64.7%) | 48 (85.7%) |
| 12 to 14 Years | 1 (10.0%) | 0 (0.0%) |
| 15 Years | 28 (100.0%) | 0 (0.0%) |
| 16 and 17 Years | 0 (0.0%) | 0 (0.0%) |
| 18 to 24 Years | 6 (100.0%) | 0 (0.0%) |
| 25 to 34 Years | 26 (100.0%) | 0 (0.0%) |
| 35 to 44 Years | 55 (76.4%) | 43 (65.1%) |
| 45 to 54 Years | 52 (82.5%) | 59 (72.0%) |
| 55 to 64 Years | 7 (100.0%) | 57 (61.3%) |
| 65 to 74 Years | 88 (66.2%) | 56 (82.4%) |
| 75 Years and over | 25 (100.0%) | 172 (94.5%) |
| Total | 310 (72.4%) | 439 (78.2%) |
Income Below Poverty Among Married-Couple Families in Mariposa
The poverty statistics for married-couple families in Mariposa show that 6.6% or 13 of the total 198 families live below the poverty line. Families with 3 or 4 children have the highest poverty rate of 100.0%, comprising of 7 families. On the other hand, families with no children have the lowest poverty rate of 0.0%, which includes 0 families.
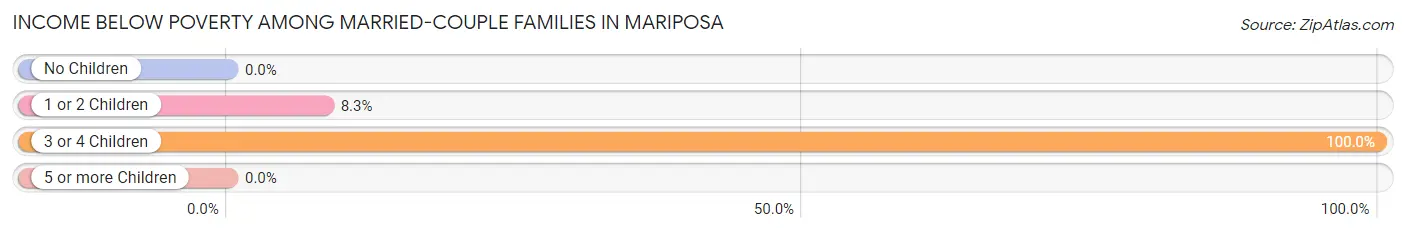
| Children | Above Poverty | Below Poverty |
| No Children | 119 (100.0%) | 0 (0.0%) |
| 1 or 2 Children | 66 (91.7%) | 6 (8.3%) |
| 3 or 4 Children | 0 (0.0%) | 7 (100.0%) |
| 5 or more Children | 0 (0.0%) | 0 (0.0%) |
| Total | 185 (93.4%) | 13 (6.6%) |
Income Below Poverty Among Single-Parent Households in Mariposa
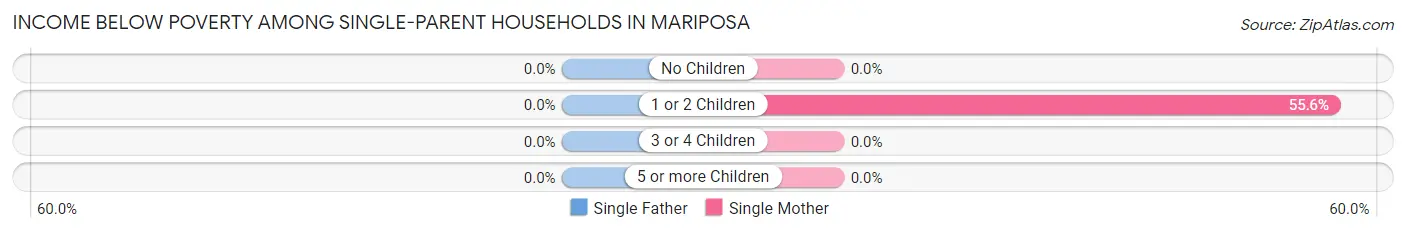
| Children | Single Father | Single Mother |
| No Children | 0 (0.0%) | 0 (0.0%) |
| 1 or 2 Children | 0 (0.0%) | 10 (55.6%) |
| 3 or 4 Children | 0 (0.0%) | 0 (0.0%) |
| 5 or more Children | 0 (0.0%) | 0 (0.0%) |
| Total | 0 (0.0%) | 10 (33.3%) |
Income Below Poverty Among Married-Couple vs Single-Parent Households in Mariposa
The poverty data for Mariposa shows that 13 of the married-couple family households (6.6%) and 10 of the single-parent households (28.6%) are living below the poverty level. Within the married-couple family households, those with 3 or 4 children have the highest poverty rate, with 7 households (100.0%) falling below the poverty line. Among the single-parent households, those with 1 or 2 children have the highest poverty rate, with 10 household (55.6%) living below poverty.
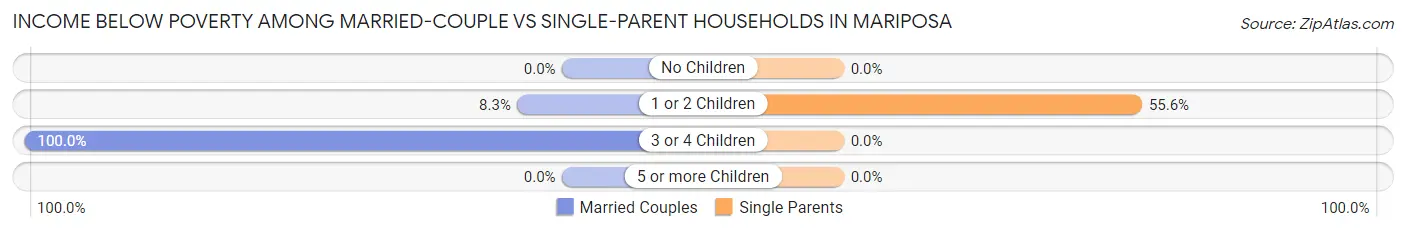
| Children | Married-Couple Families | Single-Parent Households |
| No Children | 0 (0.0%) | 0 (0.0%) |
| 1 or 2 Children | 6 (8.3%) | 10 (55.6%) |
| 3 or 4 Children | 7 (100.0%) | 0 (0.0%) |
| 5 or more Children | 0 (0.0%) | 0 (0.0%) |
| Total | 13 (6.6%) | 10 (28.6%) |
Race in Mariposa
The most populous races in Mariposa are White / Caucasian (896 | 84.5%), Two or more Races (97 | 9.1%), and Hispanic or Latino (89 | 8.4%).
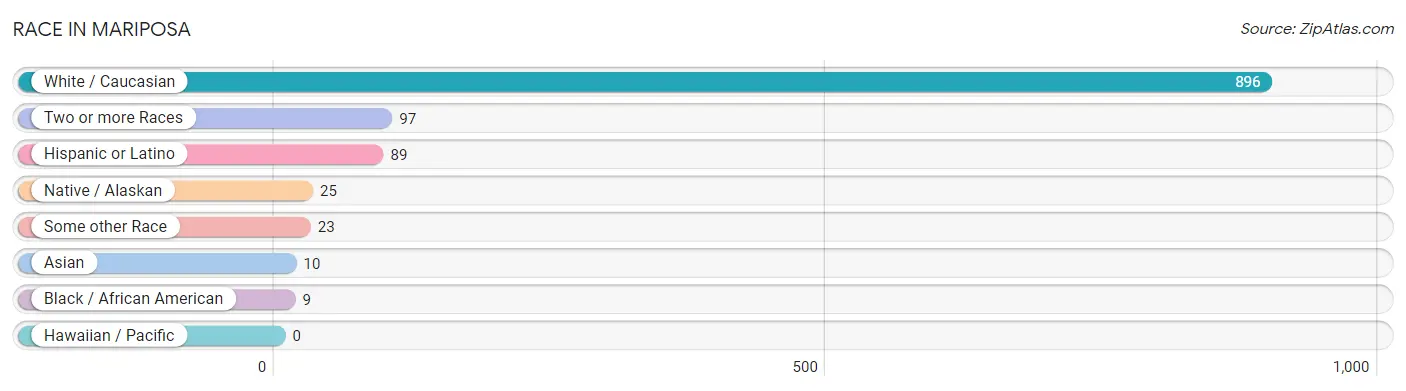
| Race | # Population | % Population |
| Asian | 10 | 0.9% |
| Black / African American | 9 | 0.9% |
| Hawaiian / Pacific | 0 | 0.0% |
| Hispanic or Latino | 89 | 8.4% |
| Native / Alaskan | 25 | 2.4% |
| White / Caucasian | 896 | 84.5% |
| Two or more Races | 97 | 9.1% |
| Some other Race | 23 | 2.2% |
| Total | 1,060 | 100.0% |
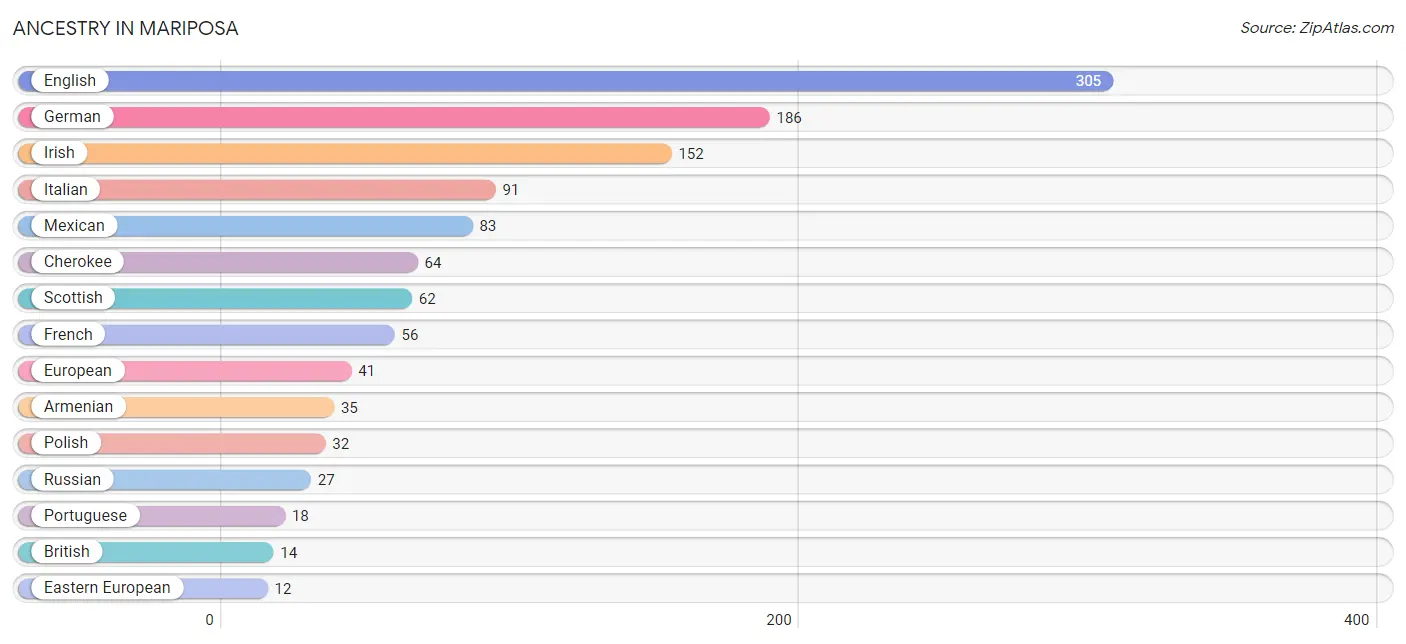
Ancestry in Mariposa
The most populous ancestries reported in Mariposa are English (305 | 28.8%), German (186 | 17.5%), Irish (152 | 14.3%), Italian (91 | 8.6%), and Mexican (83 | 7.8%), together accounting for 77.1% of all Mariposa residents.
| Ancestry | # Population | % Population |
| Armenian | 35 | 3.3% |
| Bhutanese | 6 | 0.6% |
| British | 14 | 1.3% |
| Cherokee | 64 | 6.0% |
| Creek | 9 | 0.9% |
| Danish | 6 | 0.6% |
| Dutch | 4 | 0.4% |
| Eastern European | 12 | 1.1% |
| English | 305 | 28.8% |
| European | 41 | 3.9% |
| Finnish | 3 | 0.3% |
| French | 56 | 5.3% |
| French Canadian | 9 | 0.9% |
| German | 186 | 17.5% |
| Hungarian | 11 | 1.0% |
| Indian (Asian) | 4 | 0.4% |
| Irish | 152 | 14.3% |
| Italian | 91 | 8.6% |
| Korean | 8 | 0.7% |
| Lithuanian | 8 | 0.7% |
| Mexican | 83 | 7.8% |
| Norwegian | 5 | 0.5% |
| Polish | 32 | 3.0% |
| Portuguese | 18 | 1.7% |
| Russian | 27 | 2.5% |
| Scotch-Irish | 9 | 0.9% |
| Scottish | 62 | 5.9% |
| Sioux | 3 | 0.3% |
| Slovak | 11 | 1.0% |
| Welsh | 2 | 0.2% | View All 30 Rows |
Immigrants in Mariposa
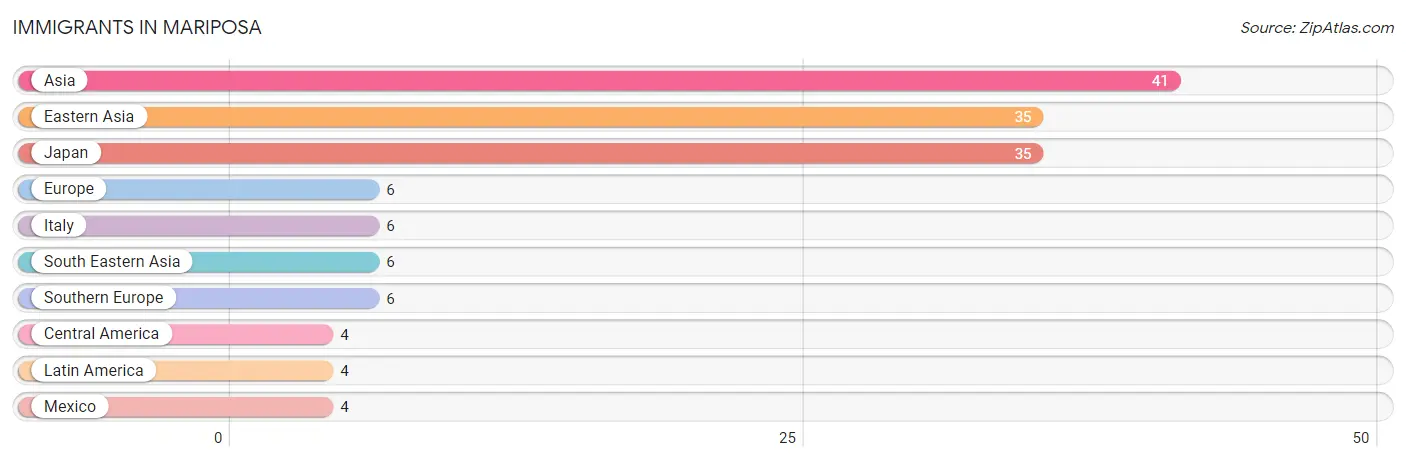
The most numerous immigrant groups reported in Mariposa came from Asia (41 | 3.9%), Eastern Asia (35 | 3.3%), Japan (35 | 3.3%), Europe (6 | 0.6%), and Italy (6 | 0.6%), together accounting for 11.6% of all Mariposa residents.
| Immigration Origin | # Population | % Population |
| Asia | 41 | 3.9% |
| Central America | 4 | 0.4% |
| Eastern Asia | 35 | 3.3% |
| Europe | 6 | 0.6% |
| Italy | 6 | 0.6% |
| Japan | 35 | 3.3% |
| Latin America | 4 | 0.4% |
| Mexico | 4 | 0.4% |
| South Eastern Asia | 6 | 0.6% |
| Southern Europe | 6 | 0.6% | View All 10 Rows |
Sex and Age in Mariposa
Sex and Age in Mariposa
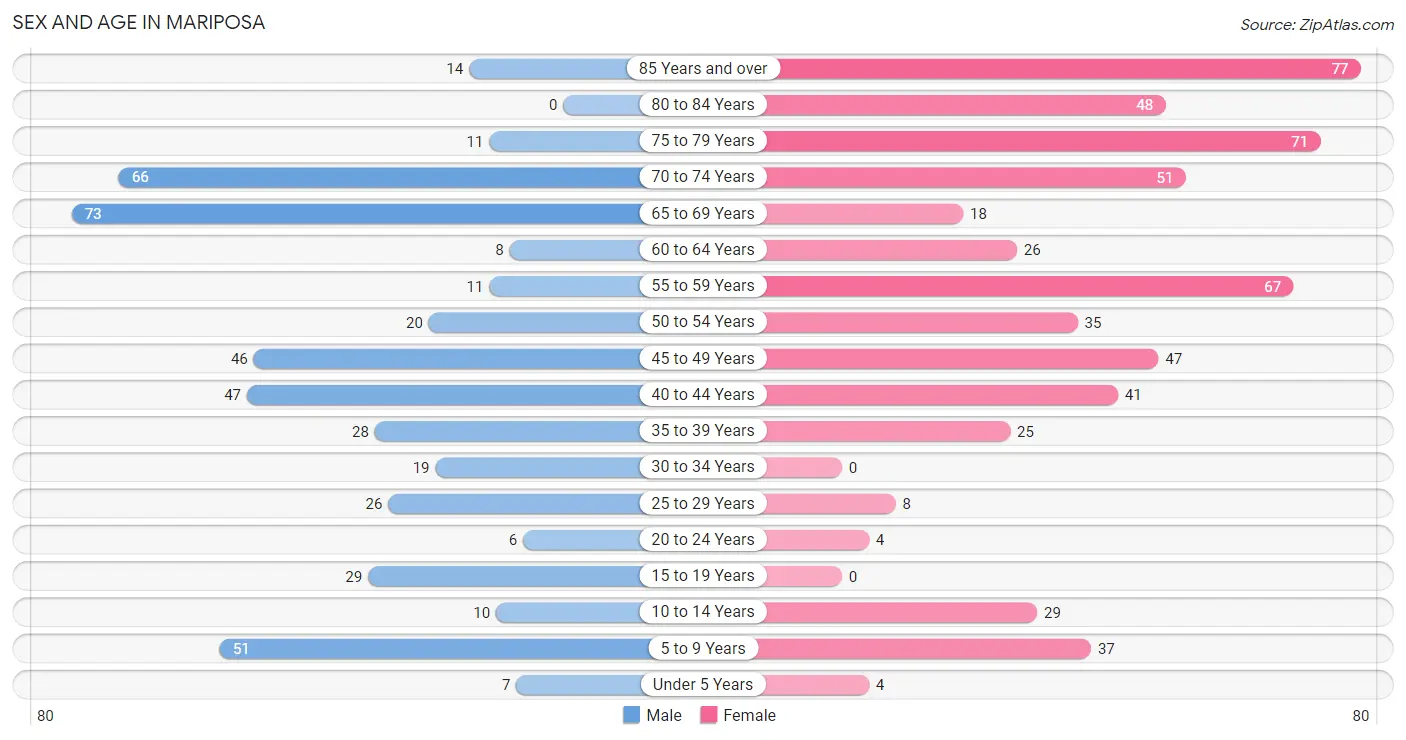
The most populous age groups in Mariposa are 65 to 69 Years (73 | 15.5%) for men and 85 Years and over (77 | 13.1%) for women.
| Age Bracket | Male | Female |
| Under 5 Years | 7 (1.5%) | 4 (0.7%) |
| 5 to 9 Years | 51 (10.8%) | 37 (6.3%) |
| 10 to 14 Years | 10 (2.1%) | 29 (4.9%) |
| 15 to 19 Years | 29 (6.1%) | 0 (0.0%) |
| 20 to 24 Years | 6 (1.3%) | 4 (0.7%) |
| 25 to 29 Years | 26 (5.5%) | 8 (1.4%) |
| 30 to 34 Years | 19 (4.0%) | 0 (0.0%) |
| 35 to 39 Years | 28 (5.9%) | 25 (4.3%) |
| 40 to 44 Years | 47 (10.0%) | 41 (7.0%) |
| 45 to 49 Years | 46 (9.8%) | 47 (8.0%) |
| 50 to 54 Years | 20 (4.2%) | 35 (5.9%) |
| 55 to 59 Years | 11 (2.3%) | 67 (11.4%) |
| 60 to 64 Years | 8 (1.7%) | 26 (4.4%) |
| 65 to 69 Years | 73 (15.5%) | 18 (3.1%) |
| 70 to 74 Years | 66 (14.0%) | 51 (8.7%) |
| 75 to 79 Years | 11 (2.3%) | 71 (12.1%) |
| 80 to 84 Years | 0 (0.0%) | 48 (8.2%) |
| 85 Years and over | 14 (3.0%) | 77 (13.1%) |
| Total | 472 (100.0%) | 588 (100.0%) |
Families and Households in Mariposa
Median Family Size in Mariposa
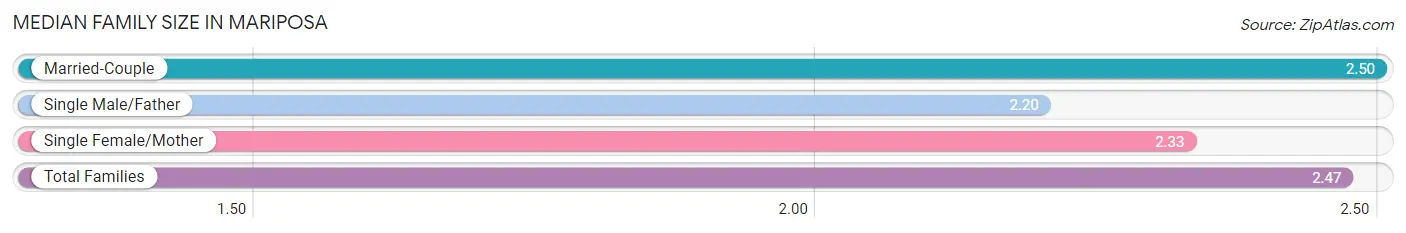
The median family size in Mariposa is 2.47 persons per family, with married-couple families (198 | 85.0%) accounting for the largest median family size of 2.5 persons per family. On the other hand, single male/father families (5 | 2.1%) represent the smallest median family size with 2.20 persons per family.
| Family Type | # Families | Family Size |
| Married-Couple | 198 (85.0%) | 2.50 |
| Single Male/Father | 5 (2.1%) | 2.20 |
| Single Female/Mother | 30 (12.9%) | 2.33 |
| Total Families | 233 (100.0%) | 2.47 |
Median Household Size in Mariposa
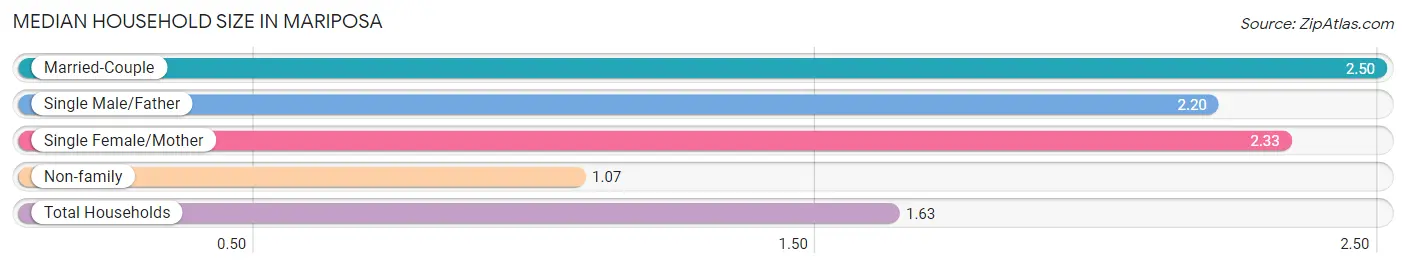
The median household size in Mariposa is 1.63 persons per household, with married-couple households (198 | 33.9%) accounting for the largest median household size of 2.5 persons per household. non-family households (351 | 60.1%) represent the smallest median household size with 1.07 persons per household.
| Household Type | # Households | Household Size |
| Married-Couple | 198 (33.9%) | 2.50 |
| Single Male/Father | 5 (0.9%) | 2.20 |
| Single Female/Mother | 30 (5.1%) | 2.33 |
| Non-family | 351 (60.1%) | 1.07 |
| Total Households | 584 (100.0%) | 1.63 |
Household Size by Marriage Status in Mariposa
Out of a total of 584 households in Mariposa, 233 (39.9%) are family households, while 351 (60.1%) are nonfamily households. The most numerous type of family households are 2-person households, comprising 107, and the most common type of nonfamily households are 1-person households, comprising 340.
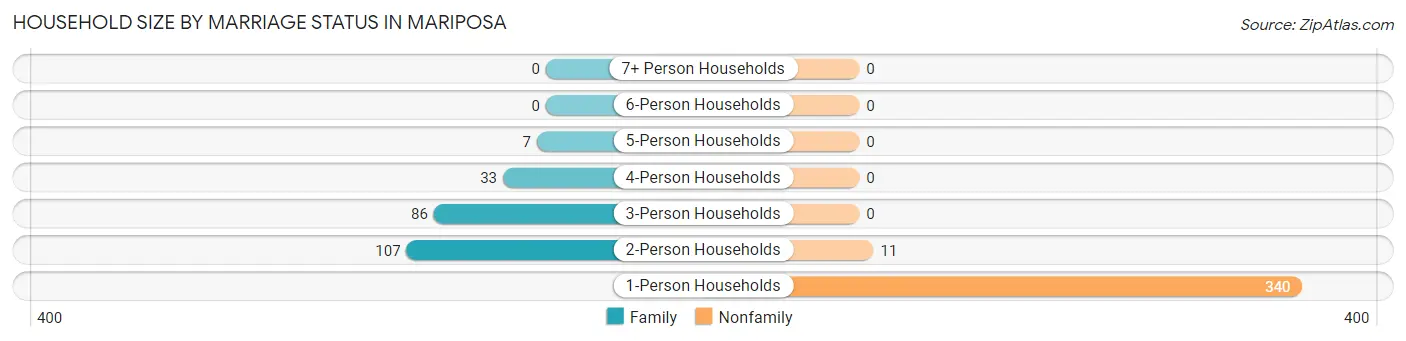
| Household Size | Family Households | Nonfamily Households |
| 1-Person Households | - | 340 (58.2%) |
| 2-Person Households | 107 (18.3%) | 11 (1.9%) |
| 3-Person Households | 86 (14.7%) | 0 (0.0%) |
| 4-Person Households | 33 (5.7%) | 0 (0.0%) |
| 5-Person Households | 7 (1.2%) | 0 (0.0%) |
| 6-Person Households | 0 (0.0%) | 0 (0.0%) |
| 7+ Person Households | 0 (0.0%) | 0 (0.0%) |
| Total | 233 (39.9%) | 351 (60.1%) |
Female Fertility in Mariposa
Fertility by Age in Mariposa
Average fertility rate in Mariposa is 56.0 births per 1,000 women. Women in the age bracket of 35 to 50 years have the highest fertility rate with 62.0 births per 1,000 women. Women in the age bracket of 35 to 50 years acount for 100.0% of all women with births.
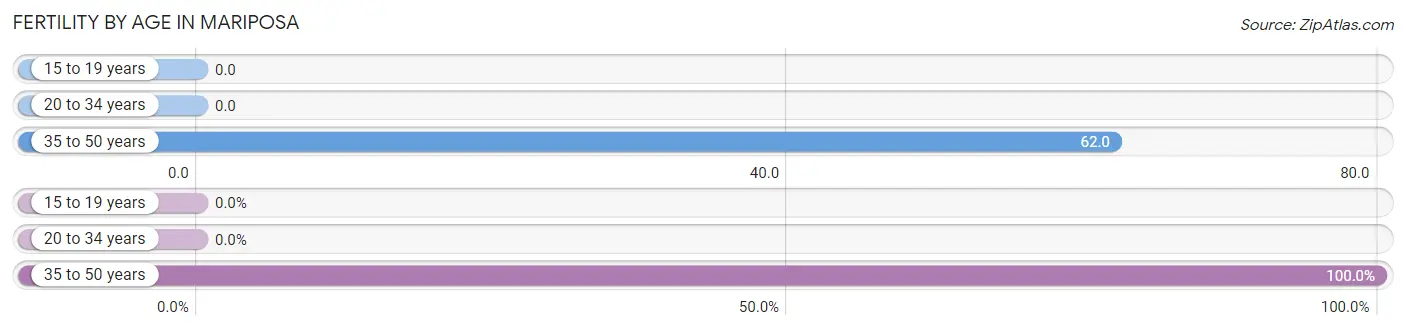
| Age Bracket | Women with Births | Births / 1,000 Women |
| 15 to 19 years | 0 (0.0%) | 0.0 |
| 20 to 34 years | 0 (0.0%) | 0.0 |
| 35 to 50 years | 7 (100.0%) | 62.0 |
| Total | 7 (100.0%) | 56.0 |
Fertility by Age by Marriage Status in Mariposa
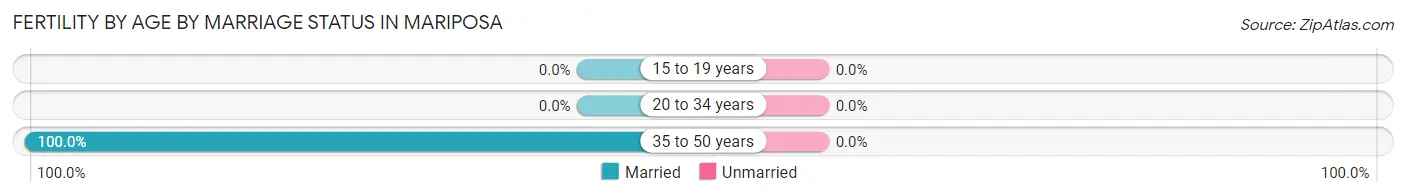
| Age Bracket | Married | Unmarried |
| 15 to 19 years | 0 (0.0%) | 0 (0.0%) |
| 20 to 34 years | 0 (0.0%) | 0 (0.0%) |
| 35 to 50 years | 7 (100.0%) | 0 (0.0%) |
| Total | 7 (100.0%) | 0 (0.0%) |
Fertility by Education in Mariposa
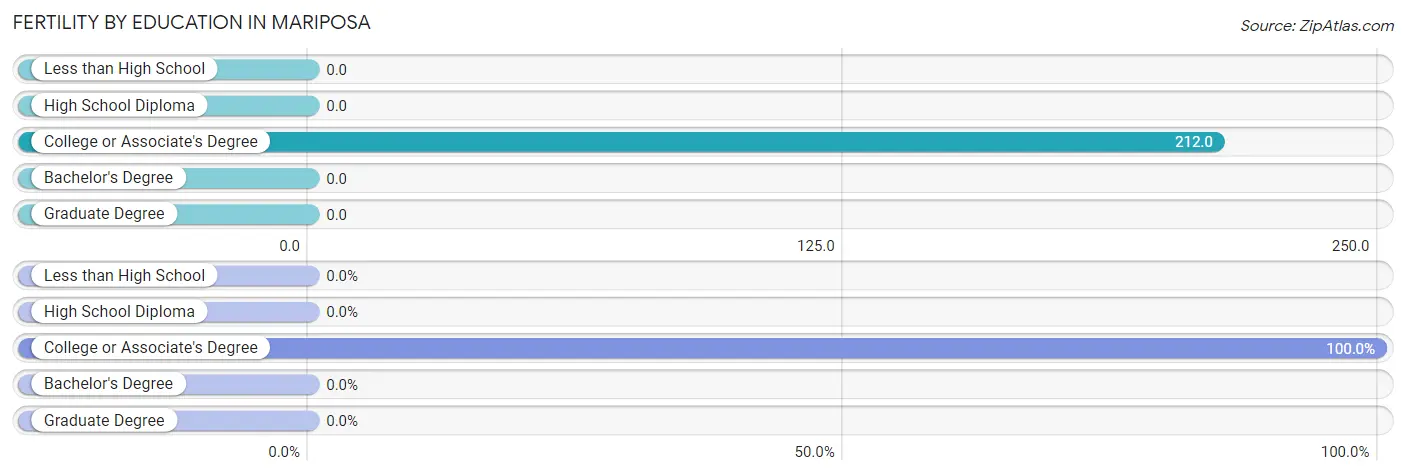
| Educational Attainment | Women with Births | Births / 1,000 Women |
| Less than High School | 0 (0.0%) | 0.0 |
| High School Diploma | 0 (0.0%) | 0.0 |
| College or Associate's Degree | 7 (100.0%) | 212.0 |
| Bachelor's Degree | 0 (0.0%) | 0.0 |
| Graduate Degree | 0 (0.0%) | 0.0 |
| Total | 7 (100.0%) | 56.0 |
Fertility by Education by Marriage Status in Mariposa
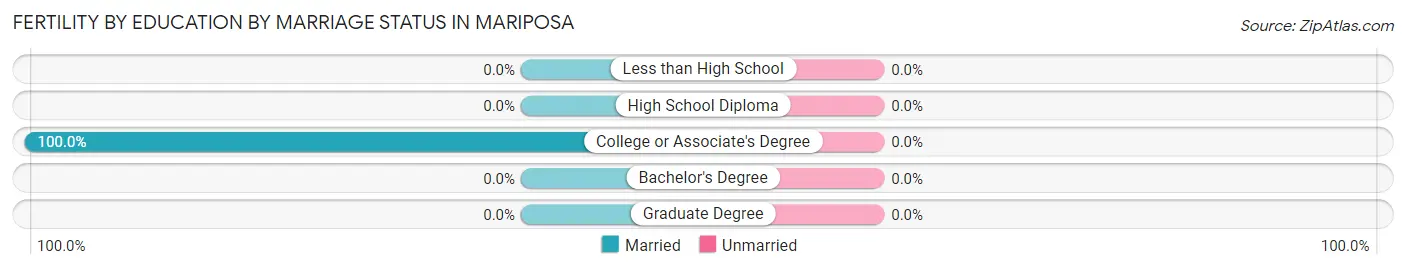
| Educational Attainment | Married | Unmarried |
| Less than High School | 0 (0.0%) | 0 (0.0%) |
| High School Diploma | 0 (0.0%) | 0 (0.0%) |
| College or Associate's Degree | 7 (100.0%) | 0 (0.0%) |
| Bachelor's Degree | 0 (0.0%) | 0 (0.0%) |
| Graduate Degree | 0 (0.0%) | 0 (0.0%) |
| Total | 7 (100.0%) | 0 (0.0%) |
Employment Characteristics in Mariposa
Employment by Class of Employer in Mariposa
Among the 281 employed individuals in Mariposa, private company employees (145 | 51.6%), self-employed (not incorporated) (50 | 17.8%), and local government employees (33 | 11.7%) make up the most common classes of employment.
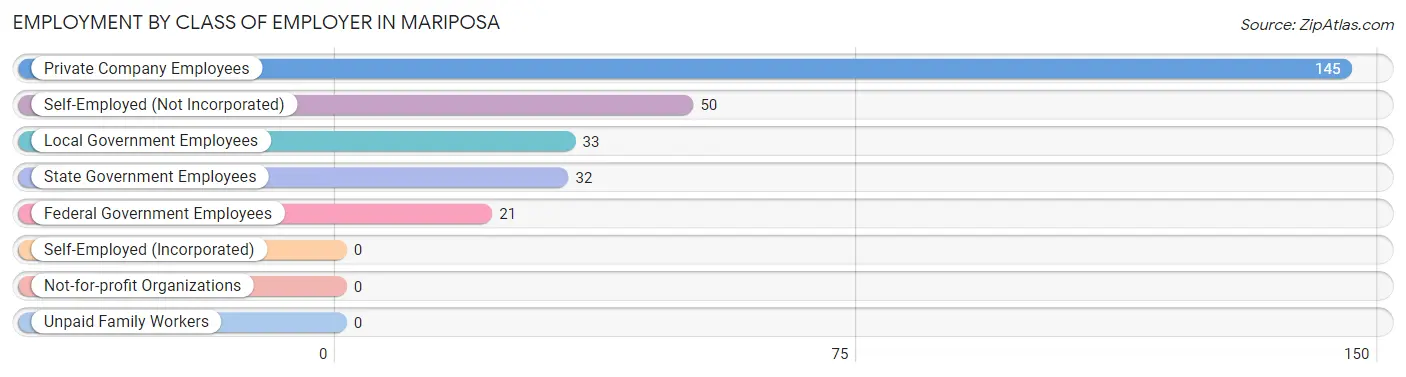
| Employer Class | # Employees | % Employees |
| Private Company Employees | 145 | 51.6% |
| Self-Employed (Incorporated) | 0 | 0.0% |
| Self-Employed (Not Incorporated) | 50 | 17.8% |
| Not-for-profit Organizations | 0 | 0.0% |
| Local Government Employees | 33 | 11.7% |
| State Government Employees | 32 | 11.4% |
| Federal Government Employees | 21 | 7.5% |
| Unpaid Family Workers | 0 | 0.0% |
| Total | 281 | 100.0% |
Employment Status by Age in Mariposa
According to the labor force statistics for Mariposa, out of the total population over 16 years of age (894), 34.2% or 306 individuals are in the labor force, with 8.2% or 25 of them unemployed. The age group with the highest labor force participation rate is 35 to 44 years, with 83.0% or 117 individuals in the labor force. Within the labor force, the 45 to 54 years age range has the highest percentage of unemployed individuals, with 17.6% or 16 of them being unemployed.
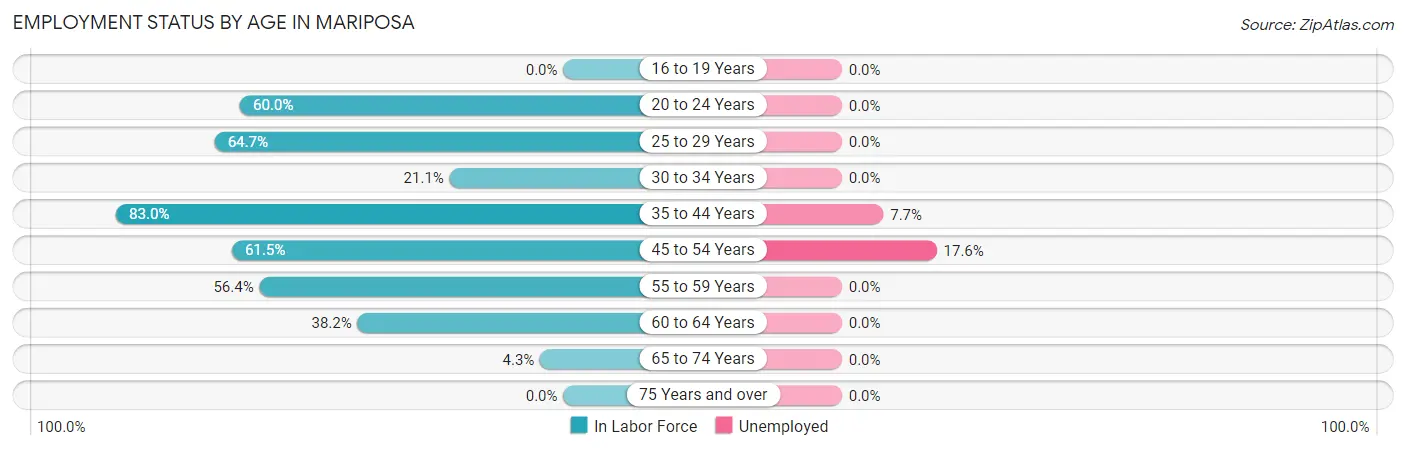
| Age Bracket | In Labor Force | Unemployed |
| 16 to 19 Years | 0 (0.0%) | 0 (0.0%) |
| 20 to 24 Years | 6 (60.0%) | 0 (0.0%) |
| 25 to 29 Years | 22 (64.7%) | 0 (0.0%) |
| 30 to 34 Years | 4 (21.1%) | 0 (0.0%) |
| 35 to 44 Years | 117 (83.0%) | 9 (7.7%) |
| 45 to 54 Years | 91 (61.5%) | 16 (17.6%) |
| 55 to 59 Years | 44 (56.4%) | 0 (0.0%) |
| 60 to 64 Years | 13 (38.2%) | 0 (0.0%) |
| 65 to 74 Years | 9 (4.3%) | 0 (0.0%) |
| 75 Years and over | 0 (0.0%) | 0 (0.0%) |
| Total | 306 (34.2%) | 25 (8.2%) |
Employment Status by Educational Attainment in Mariposa
According to labor force statistics for Mariposa, 64.1% of individuals (291) out of the total population between 25 and 64 years of age (454) are in the labor force, with 8.6% or 25 of them being unemployed. The group with the highest labor force participation rate are those with the educational attainment of less than high school, with 83.3% or 20 individuals in the labor force. Within the labor force, individuals with college / associate degree education have the highest percentage of unemployment, with 18.0% or 16 of them being unemployed.
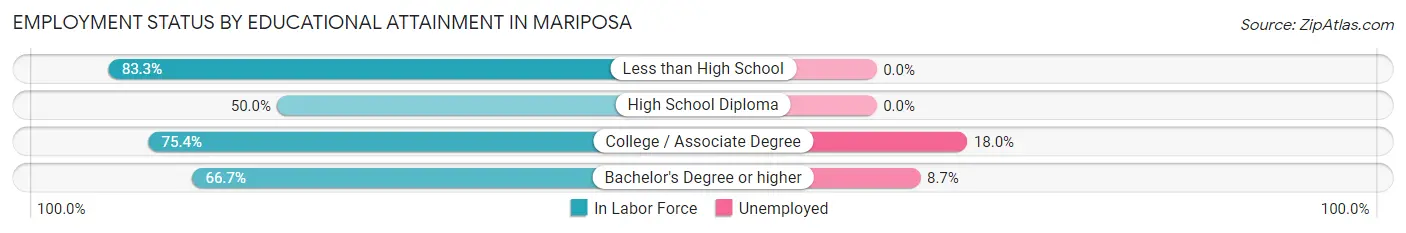
| Educational Attainment | In Labor Force | Unemployed |
| Less than High School | 20 (83.3%) | 0 (0.0%) |
| High School Diploma | 78 (50.0%) | 0 (0.0%) |
| College / Associate Degree | 89 (75.4%) | 21 (18.0%) |
| Bachelor's Degree or higher | 104 (66.7%) | 14 (8.7%) |
| Total | 291 (64.1%) | 39 (8.6%) |
Employment Occupations by Sex in Mariposa
Management, Business, Science and Arts Occupations
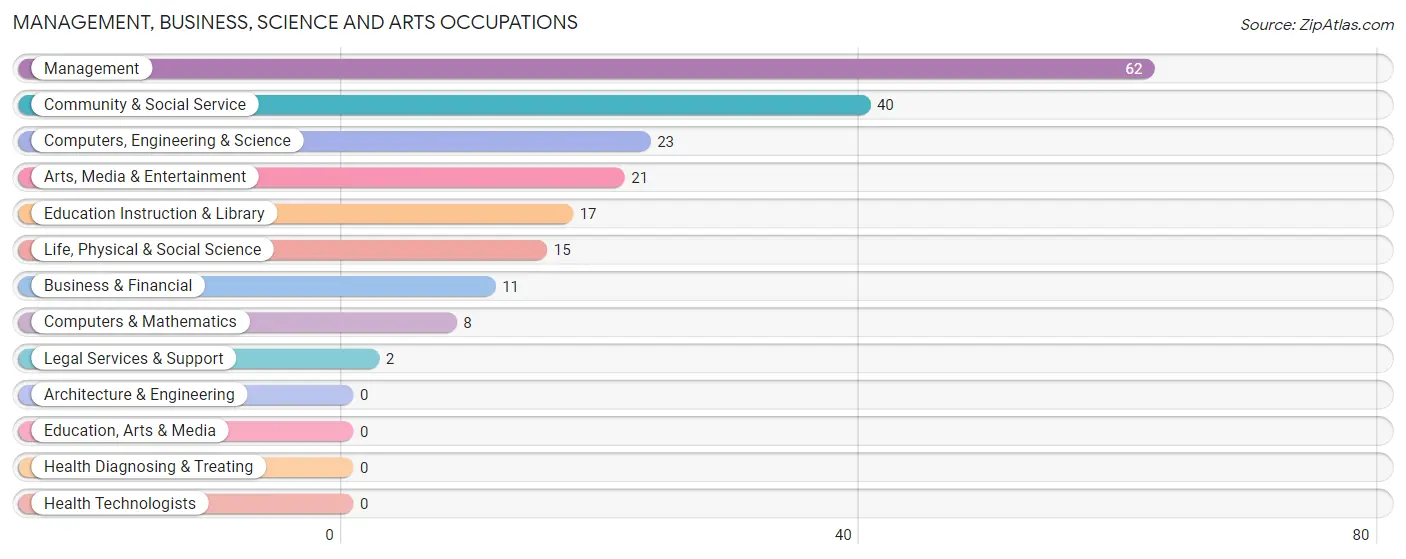
The most common Management, Business, Science and Arts occupations in Mariposa are Management (62 | 22.1%), Community & Social Service (40 | 14.2%), Computers, Engineering & Science (23 | 8.2%), Arts, Media & Entertainment (21 | 7.5%), and Education Instruction & Library (17 | 6.0%).
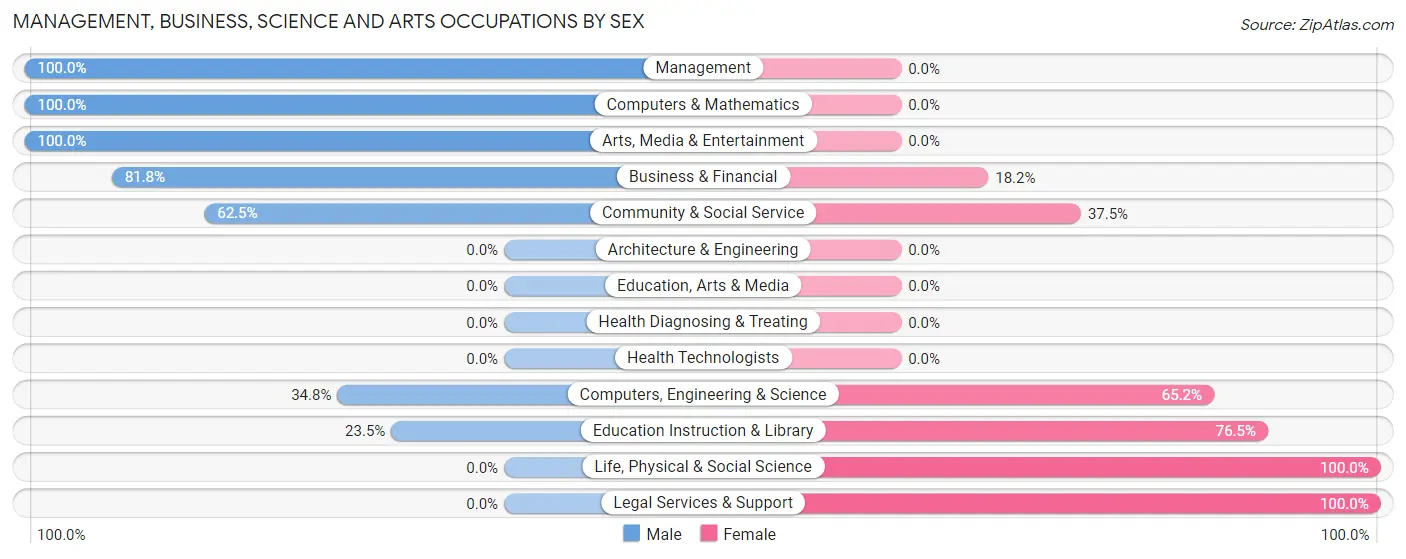
Management, Business, Science and Arts Occupations by Sex
Within the Management, Business, Science and Arts occupations in Mariposa, the most male-oriented occupations are Management (100.0%), Computers & Mathematics (100.0%), and Arts, Media & Entertainment (100.0%), while the most female-oriented occupations are Life, Physical & Social Science (100.0%), Legal Services & Support (100.0%), and Education Instruction & Library (76.5%).
| Occupation | Male | Female |
| Management | 62 (100.0%) | 0 (0.0%) |
| Business & Financial | 9 (81.8%) | 2 (18.2%) |
| Computers, Engineering & Science | 8 (34.8%) | 15 (65.2%) |
| Computers & Mathematics | 8 (100.0%) | 0 (0.0%) |
| Architecture & Engineering | 0 (0.0%) | 0 (0.0%) |
| Life, Physical & Social Science | 0 (0.0%) | 15 (100.0%) |
| Community & Social Service | 25 (62.5%) | 15 (37.5%) |
| Education, Arts & Media | 0 (0.0%) | 0 (0.0%) |
| Legal Services & Support | 0 (0.0%) | 2 (100.0%) |
| Education Instruction & Library | 4 (23.5%) | 13 (76.5%) |
| Arts, Media & Entertainment | 21 (100.0%) | 0 (0.0%) |
| Health Diagnosing & Treating | 0 (0.0%) | 0 (0.0%) |
| Health Technologists | 0 (0.0%) | 0 (0.0%) |
| Total (Category) | 104 (76.5%) | 32 (23.5%) |
| Total (Overall) | 167 (59.4%) | 114 (40.6%) |
Services Occupations
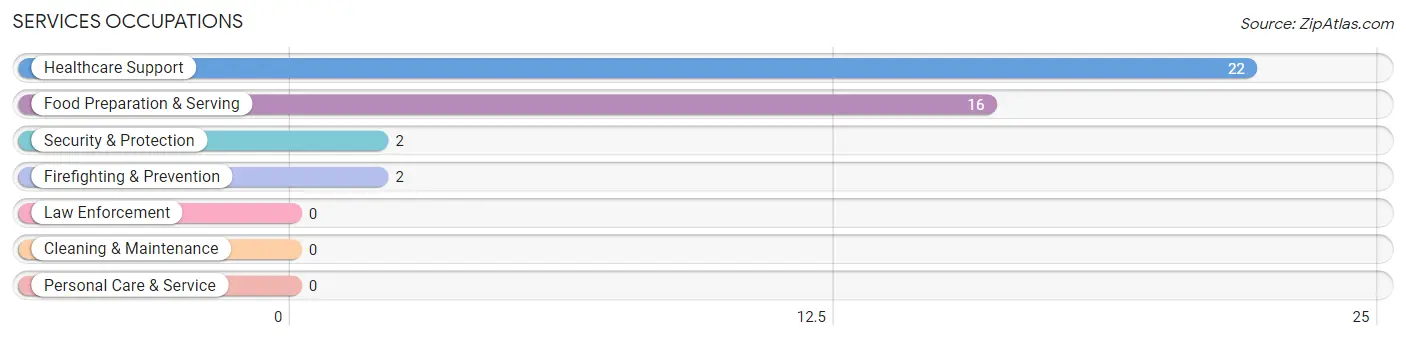
The most common Services occupations in Mariposa are Healthcare Support (22 | 7.8%), Food Preparation & Serving (16 | 5.7%), Security & Protection (2 | 0.7%), and Firefighting & Prevention (2 | 0.7%).
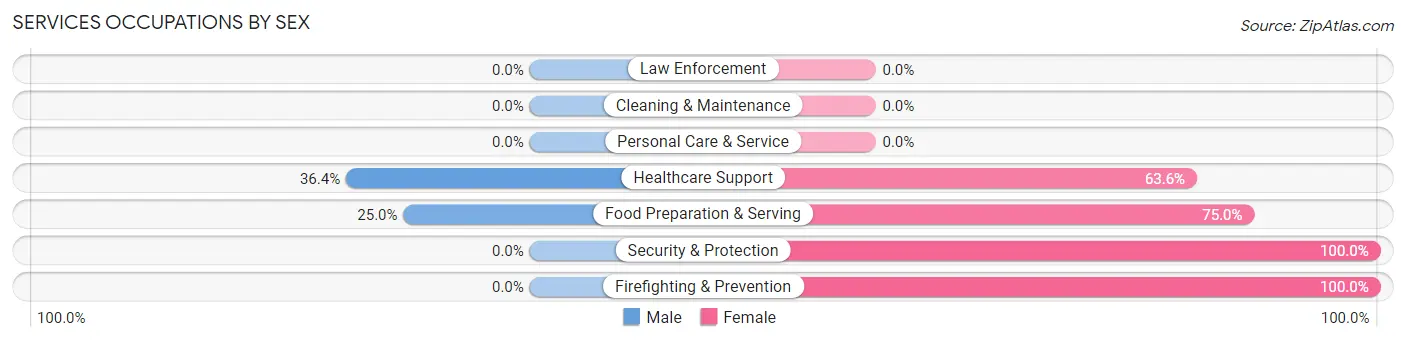
Services Occupations by Sex
Within the Services occupations in Mariposa, the most male-oriented occupations are Healthcare Support (36.4%), and Food Preparation & Serving (25.0%), while the most female-oriented occupations are Security & Protection (100.0%), Firefighting & Prevention (100.0%), and Food Preparation & Serving (75.0%).
| Occupation | Male | Female |
| Healthcare Support | 8 (36.4%) | 14 (63.6%) |
| Security & Protection | 0 (0.0%) | 2 (100.0%) |
| Firefighting & Prevention | 0 (0.0%) | 2 (100.0%) |
| Law Enforcement | 0 (0.0%) | 0 (0.0%) |
| Food Preparation & Serving | 4 (25.0%) | 12 (75.0%) |
| Cleaning & Maintenance | 0 (0.0%) | 0 (0.0%) |
| Personal Care & Service | 0 (0.0%) | 0 (0.0%) |
| Total (Category) | 12 (30.0%) | 28 (70.0%) |
| Total (Overall) | 167 (59.4%) | 114 (40.6%) |
Sales and Office Occupations
The most common Sales and Office occupations in Mariposa are Sales & Related (59 | 21.0%), and Office & Administration (2 | 0.7%).
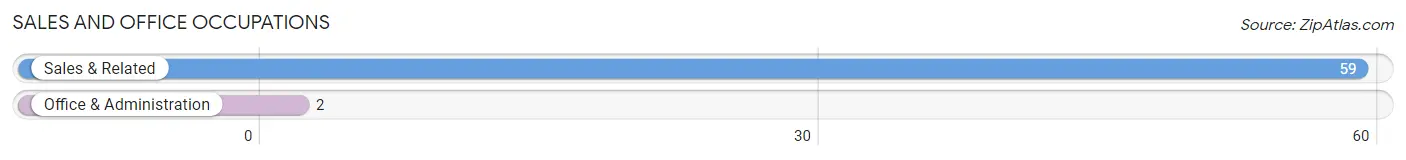
Sales and Office Occupations by Sex
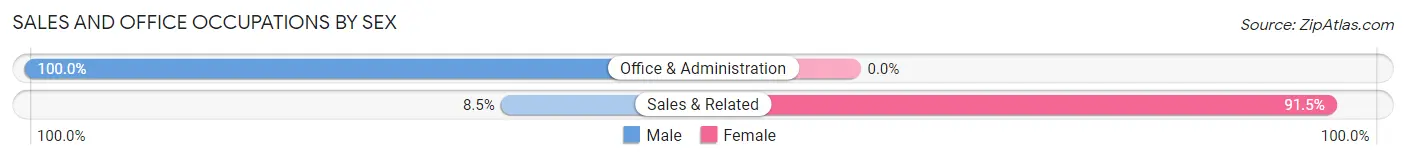
| Occupation | Male | Female |
| Sales & Related | 5 (8.5%) | 54 (91.5%) |
| Office & Administration | 2 (100.0%) | 0 (0.0%) |
| Total (Category) | 7 (11.5%) | 54 (88.5%) |
| Total (Overall) | 167 (59.4%) | 114 (40.6%) |
Natural Resources, Construction and Maintenance Occupations
The most common Natural Resources, Construction and Maintenance occupations in Mariposa are , and Construction & Extraction (16 | 5.7%).
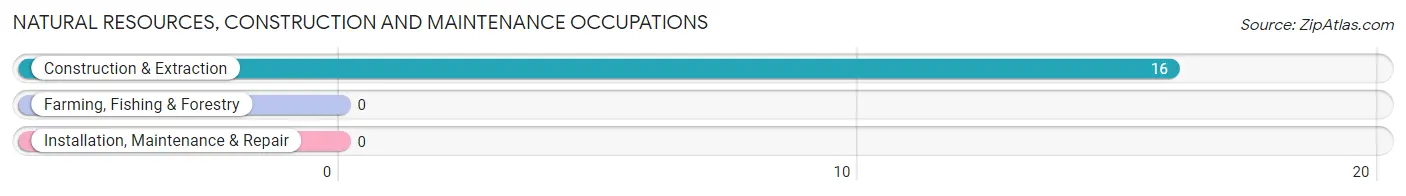
Natural Resources, Construction and Maintenance Occupations by Sex
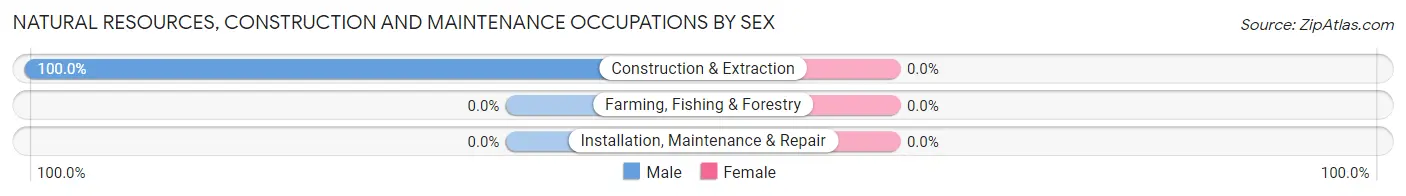
| Occupation | Male | Female |
| Farming, Fishing & Forestry | 0 (0.0%) | 0 (0.0%) |
| Construction & Extraction | 16 (100.0%) | 0 (0.0%) |
| Installation, Maintenance & Repair | 0 (0.0%) | 0 (0.0%) |
| Total (Category) | 16 (100.0%) | 0 (0.0%) |
| Total (Overall) | 167 (59.4%) | 114 (40.6%) |
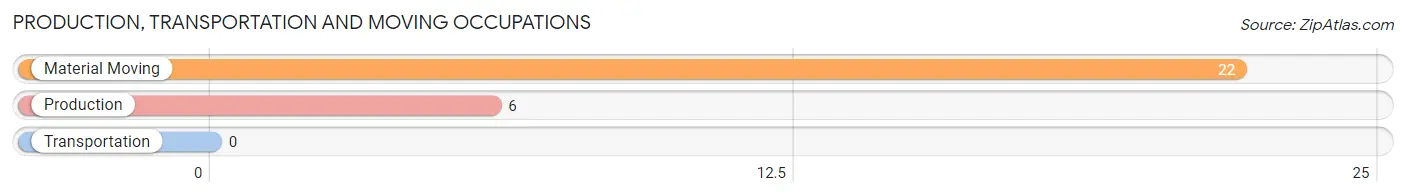
Production, Transportation and Moving Occupations
The most common Production, Transportation and Moving occupations in Mariposa are Material Moving (22 | 7.8%), and Production (6 | 2.1%).
Production, Transportation and Moving Occupations by Sex
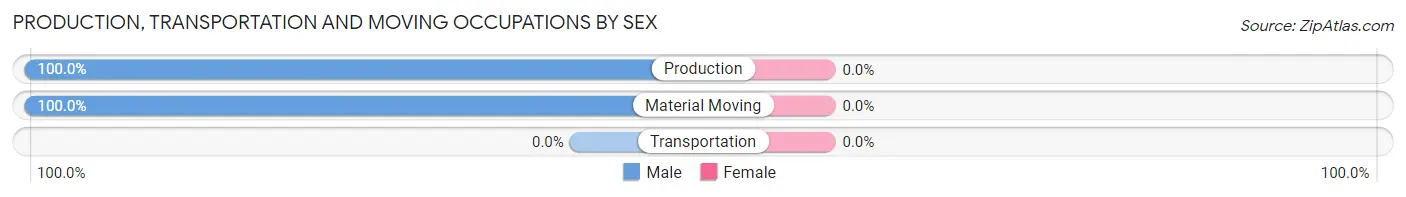
| Occupation | Male | Female |
| Production | 6 (100.0%) | 0 (0.0%) |
| Transportation | 0 (0.0%) | 0 (0.0%) |
| Material Moving | 22 (100.0%) | 0 (0.0%) |
| Total (Category) | 28 (100.0%) | 0 (0.0%) |
| Total (Overall) | 167 (59.4%) | 114 (40.6%) |
Employment Industries by Sex in Mariposa
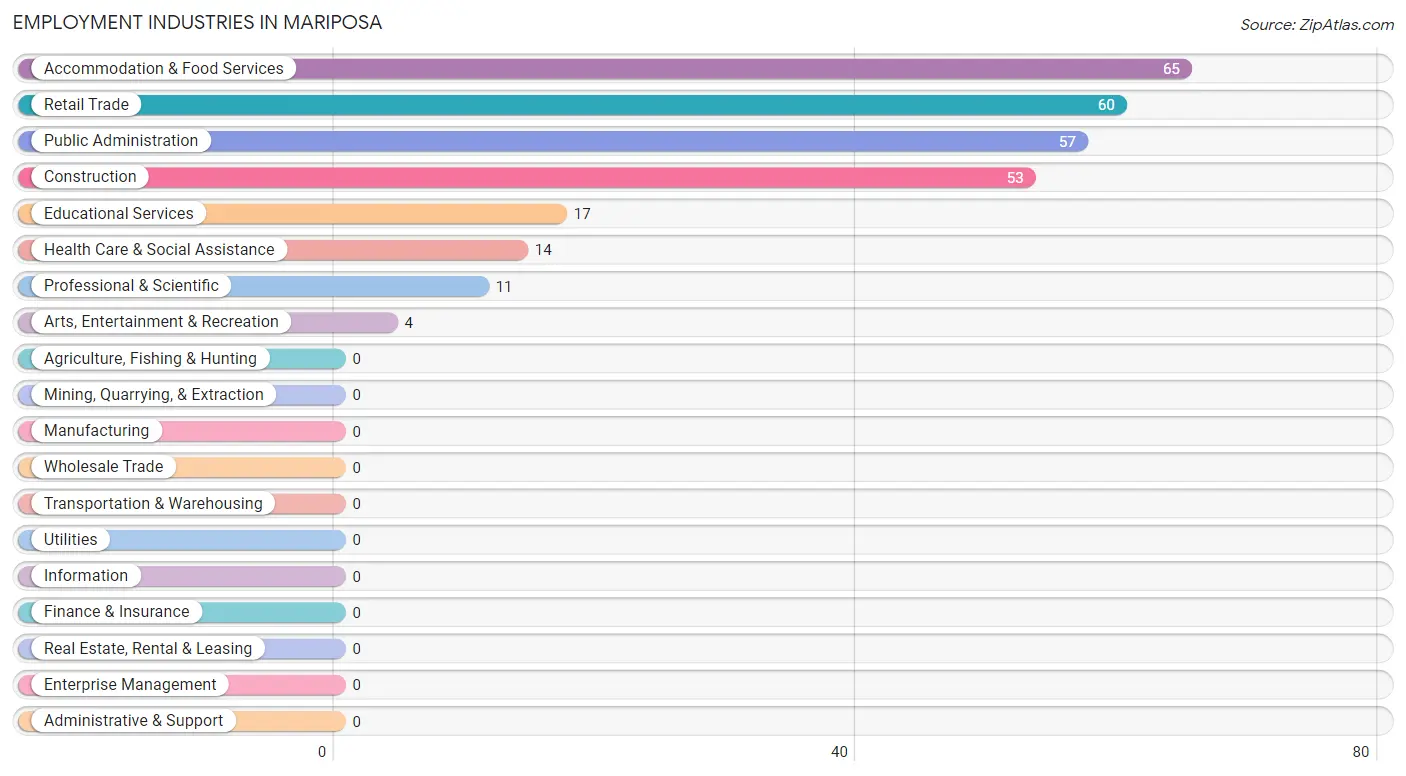
Employment Industries in Mariposa
The major employment industries in Mariposa include Accommodation & Food Services (65 | 23.1%), Retail Trade (60 | 21.3%), Public Administration (57 | 20.3%), Construction (53 | 18.9%), and Educational Services (17 | 6.0%).
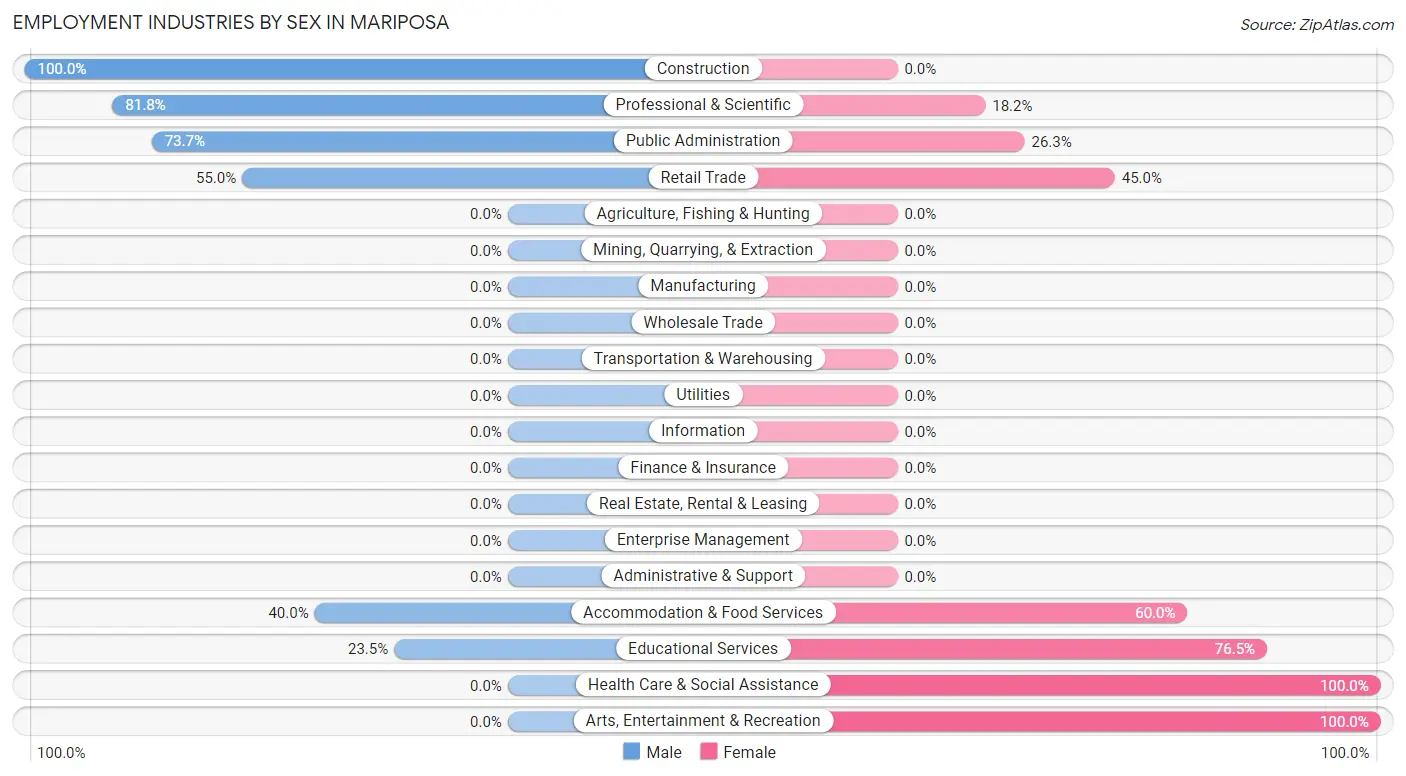
Employment Industries by Sex in Mariposa
The Mariposa industries that see more men than women are Construction (100.0%), Professional & Scientific (81.8%), and Public Administration (73.7%), whereas the industries that tend to have a higher number of women are Health Care & Social Assistance (100.0%), Arts, Entertainment & Recreation (100.0%), and Educational Services (76.5%).
| Industry | Male | Female |
| Agriculture, Fishing & Hunting | 0 (0.0%) | 0 (0.0%) |
| Mining, Quarrying, & Extraction | 0 (0.0%) | 0 (0.0%) |
| Construction | 53 (100.0%) | 0 (0.0%) |
| Manufacturing | 0 (0.0%) | 0 (0.0%) |
| Wholesale Trade | 0 (0.0%) | 0 (0.0%) |
| Retail Trade | 33 (55.0%) | 27 (45.0%) |
| Transportation & Warehousing | 0 (0.0%) | 0 (0.0%) |
| Utilities | 0 (0.0%) | 0 (0.0%) |
| Information | 0 (0.0%) | 0 (0.0%) |
| Finance & Insurance | 0 (0.0%) | 0 (0.0%) |
| Real Estate, Rental & Leasing | 0 (0.0%) | 0 (0.0%) |
| Professional & Scientific | 9 (81.8%) | 2 (18.2%) |
| Enterprise Management | 0 (0.0%) | 0 (0.0%) |
| Administrative & Support | 0 (0.0%) | 0 (0.0%) |
| Educational Services | 4 (23.5%) | 13 (76.5%) |
| Health Care & Social Assistance | 0 (0.0%) | 14 (100.0%) |
| Arts, Entertainment & Recreation | 0 (0.0%) | 4 (100.0%) |
| Accommodation & Food Services | 26 (40.0%) | 39 (60.0%) |
| Public Administration | 42 (73.7%) | 15 (26.3%) |
| Total | 167 (59.4%) | 114 (40.6%) |
Education in Mariposa
School Enrollment in Mariposa
The most common levels of schooling among the 192 students in Mariposa are elementary school (59 | 30.7%), college / undergraduate (49 | 25.5%), and middle school (39 | 20.3%).
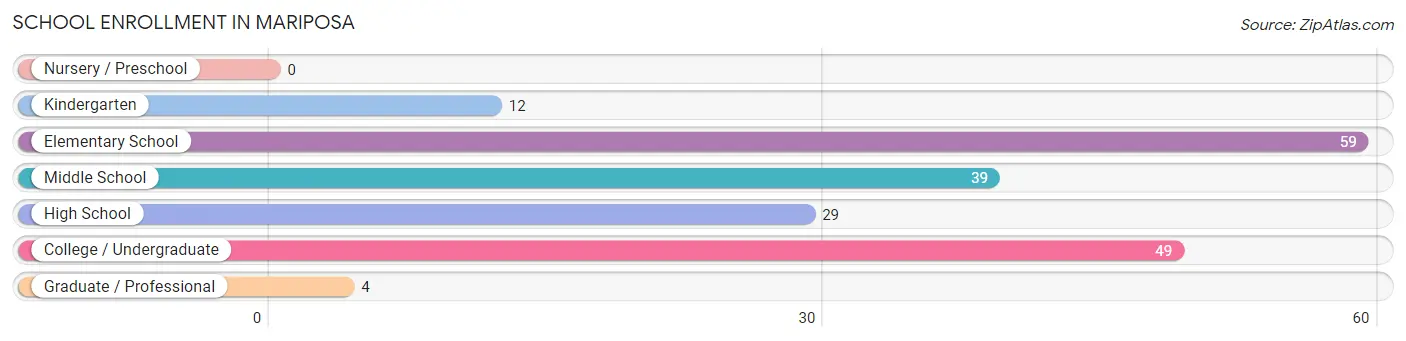
| School Level | # Students | % Students |
| Nursery / Preschool | 0 | 0.0% |
| Kindergarten | 12 | 6.2% |
| Elementary School | 59 | 30.7% |
| Middle School | 39 | 20.3% |
| High School | 29 | 15.1% |
| College / Undergraduate | 49 | 25.5% |
| Graduate / Professional | 4 | 2.1% |
| Total | 192 | 100.0% |
School Enrollment by Age by Funding Source in Mariposa
Out of a total of 192 students who are enrolled in schools in Mariposa, 74 (38.5%) attend a private institution, while the remaining 118 (61.5%) are enrolled in public schools. The age group of 35 years and over has the highest likelihood of being enrolled in private schools, with 39 (90.7% in the age bracket) enrolled. Conversely, the age group of 10 to 14 year olds has the lowest likelihood of being enrolled in a private school, with 39 (100.0% in the age bracket) attending a public institution.
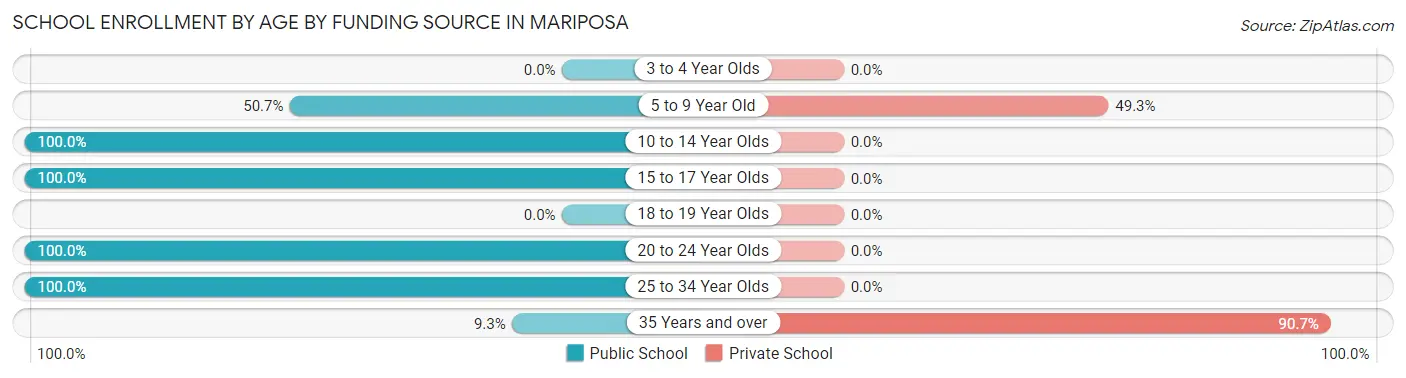
| Age Bracket | Public School | Private School |
| 3 to 4 Year Olds | 0 (0.0%) | 0 (0.0%) |
| 5 to 9 Year Old | 36 (50.7%) | 35 (49.3%) |
| 10 to 14 Year Olds | 39 (100.0%) | 0 (0.0%) |
| 15 to 17 Year Olds | 29 (100.0%) | 0 (0.0%) |
| 18 to 19 Year Olds | 0 (0.0%) | 0 (0.0%) |
| 20 to 24 Year Olds | 6 (100.0%) | 0 (0.0%) |
| 25 to 34 Year Olds | 4 (100.0%) | 0 (0.0%) |
| 35 Years and over | 4 (9.3%) | 39 (90.7%) |
| Total | 118 (61.5%) | 74 (38.5%) |
Educational Attainment by Field of Study in Mariposa
Bio, nature & agricultural (86 | 25.8%), business (62 | 18.6%), education (52 | 15.6%), computers & mathematics (32 | 9.6%), and social sciences (29 | 8.7%) are the most common fields of study among 334 individuals in Mariposa who have obtained a bachelor's degree or higher.
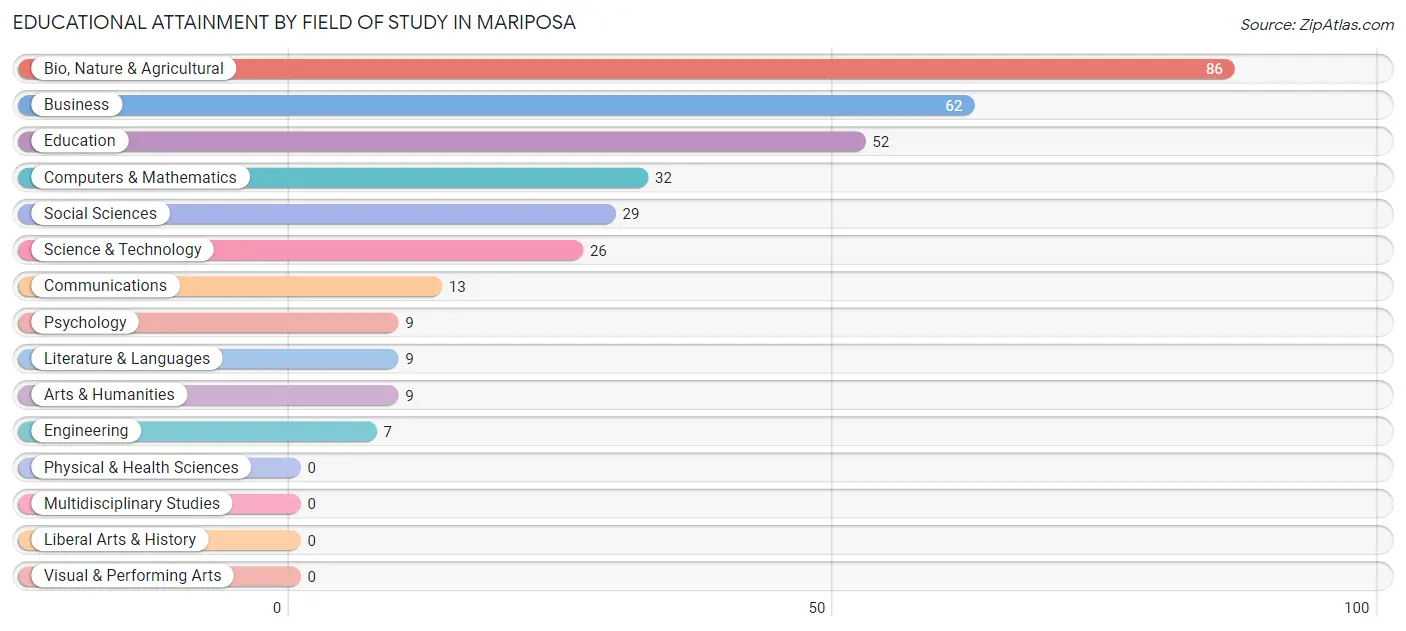
| Field of Study | # Graduates | % Graduates |
| Computers & Mathematics | 32 | 9.6% |
| Bio, Nature & Agricultural | 86 | 25.8% |
| Physical & Health Sciences | 0 | 0.0% |
| Psychology | 9 | 2.7% |
| Social Sciences | 29 | 8.7% |
| Engineering | 7 | 2.1% |
| Multidisciplinary Studies | 0 | 0.0% |
| Science & Technology | 26 | 7.8% |
| Business | 62 | 18.6% |
| Education | 52 | 15.6% |
| Literature & Languages | 9 | 2.7% |
| Liberal Arts & History | 0 | 0.0% |
| Visual & Performing Arts | 0 | 0.0% |
| Communications | 13 | 3.9% |
| Arts & Humanities | 9 | 2.7% |
| Total | 334 | 100.0% |
Transportation & Commute in Mariposa
Vehicle Availability by Sex in Mariposa
The most prevalent vehicle ownership categories in Mariposa are males with 2 vehicles (78, accounting for 46.7%) and females with 2 vehicles (31, making up 68.4%).
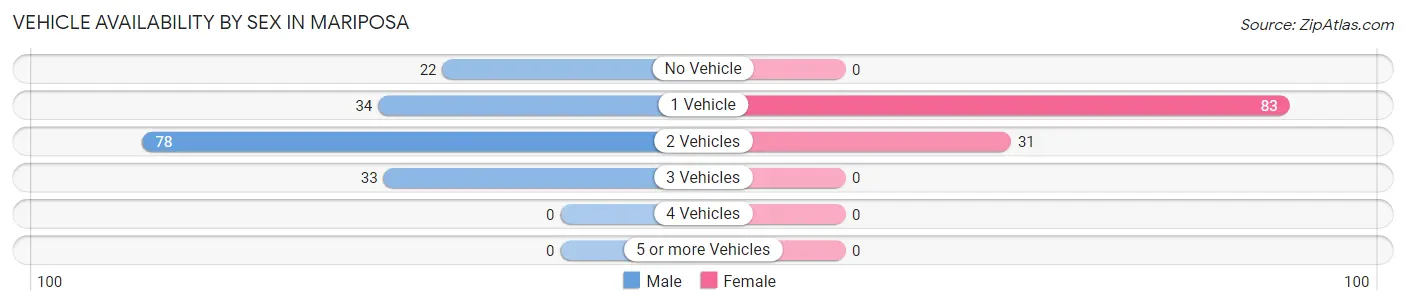
| Vehicles Available | Male | Female |
| No Vehicle | 22 (13.2%) | 0 (0.0%) |
| 1 Vehicle | 34 (20.4%) | 83 (72.8%) |
| 2 Vehicles | 78 (46.7%) | 31 (27.2%) |
| 3 Vehicles | 33 (19.8%) | 0 (0.0%) |
| 4 Vehicles | 0 (0.0%) | 0 (0.0%) |
| 5 or more Vehicles | 0 (0.0%) | 0 (0.0%) |
| Total | 167 (100.0%) | 114 (100.0%) |
Commute Time in Mariposa
The most frequently occuring commute durations in Mariposa are 5 to 9 minutes (67 commuters, 26.3%), 25 to 29 minutes (37 commuters, 14.5%), and 60 to 89 minutes (34 commuters, 13.3%).
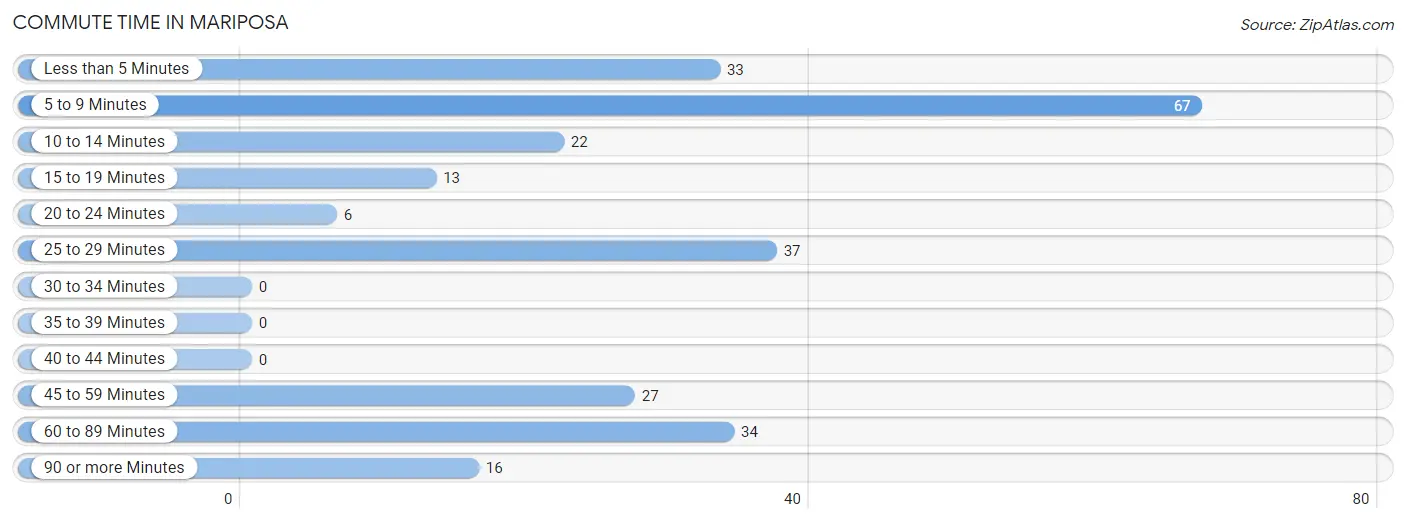
| Commute Time | # Commuters | % Commuters |
| Less than 5 Minutes | 33 | 12.9% |
| 5 to 9 Minutes | 67 | 26.3% |
| 10 to 14 Minutes | 22 | 8.6% |
| 15 to 19 Minutes | 13 | 5.1% |
| 20 to 24 Minutes | 6 | 2.4% |
| 25 to 29 Minutes | 37 | 14.5% |
| 30 to 34 Minutes | 0 | 0.0% |
| 35 to 39 Minutes | 0 | 0.0% |
| 40 to 44 Minutes | 0 | 0.0% |
| 45 to 59 Minutes | 27 | 10.6% |
| 60 to 89 Minutes | 34 | 13.3% |
| 90 or more Minutes | 16 | 6.3% |
Commute Time by Sex in Mariposa
The most common commute times in Mariposa are 25 to 29 minutes (37 commuters, 23.7%) for males and 5 to 9 minutes (37 commuters, 37.4%) for females.
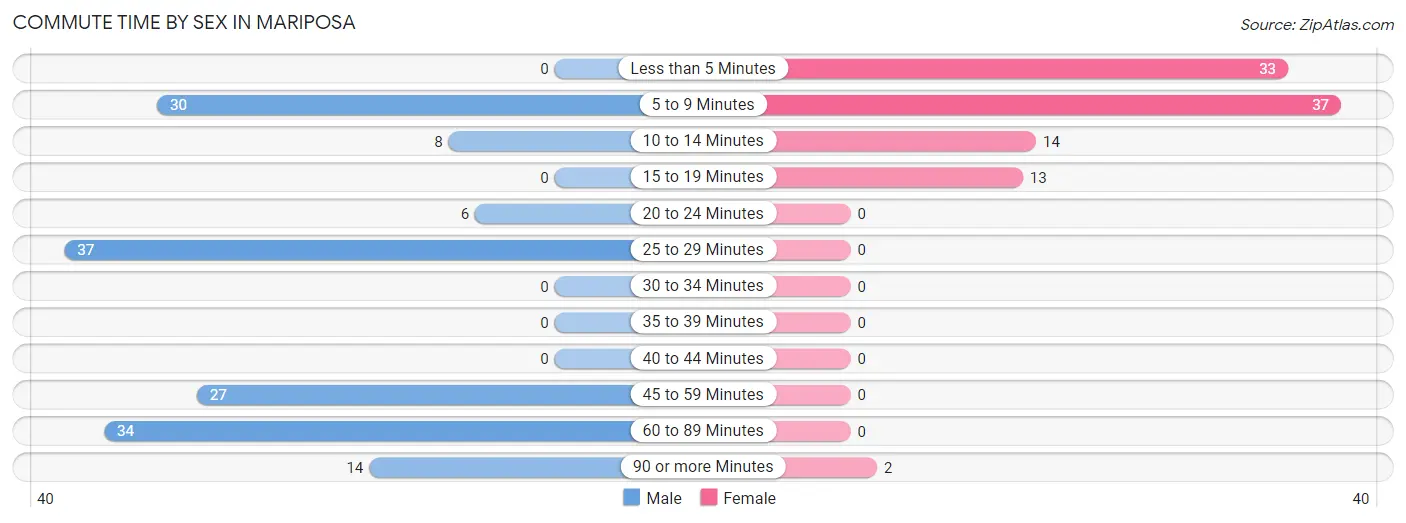
| Commute Time | Male | Female |
| Less than 5 Minutes | 0 (0.0%) | 33 (33.3%) |
| 5 to 9 Minutes | 30 (19.2%) | 37 (37.4%) |
| 10 to 14 Minutes | 8 (5.1%) | 14 (14.1%) |
| 15 to 19 Minutes | 0 (0.0%) | 13 (13.1%) |
| 20 to 24 Minutes | 6 (3.8%) | 0 (0.0%) |
| 25 to 29 Minutes | 37 (23.7%) | 0 (0.0%) |
| 30 to 34 Minutes | 0 (0.0%) | 0 (0.0%) |
| 35 to 39 Minutes | 0 (0.0%) | 0 (0.0%) |
| 40 to 44 Minutes | 0 (0.0%) | 0 (0.0%) |
| 45 to 59 Minutes | 27 (17.3%) | 0 (0.0%) |
| 60 to 89 Minutes | 34 (21.8%) | 0 (0.0%) |
| 90 or more Minutes | 14 (9.0%) | 2 (2.0%) |
Time of Departure to Work by Sex in Mariposa
The most frequent times of departure to work in Mariposa are 6:30 AM to 6:59 AM (62, 39.7%) for males and 8:00 AM to 8:29 AM (35, 35.3%) for females.
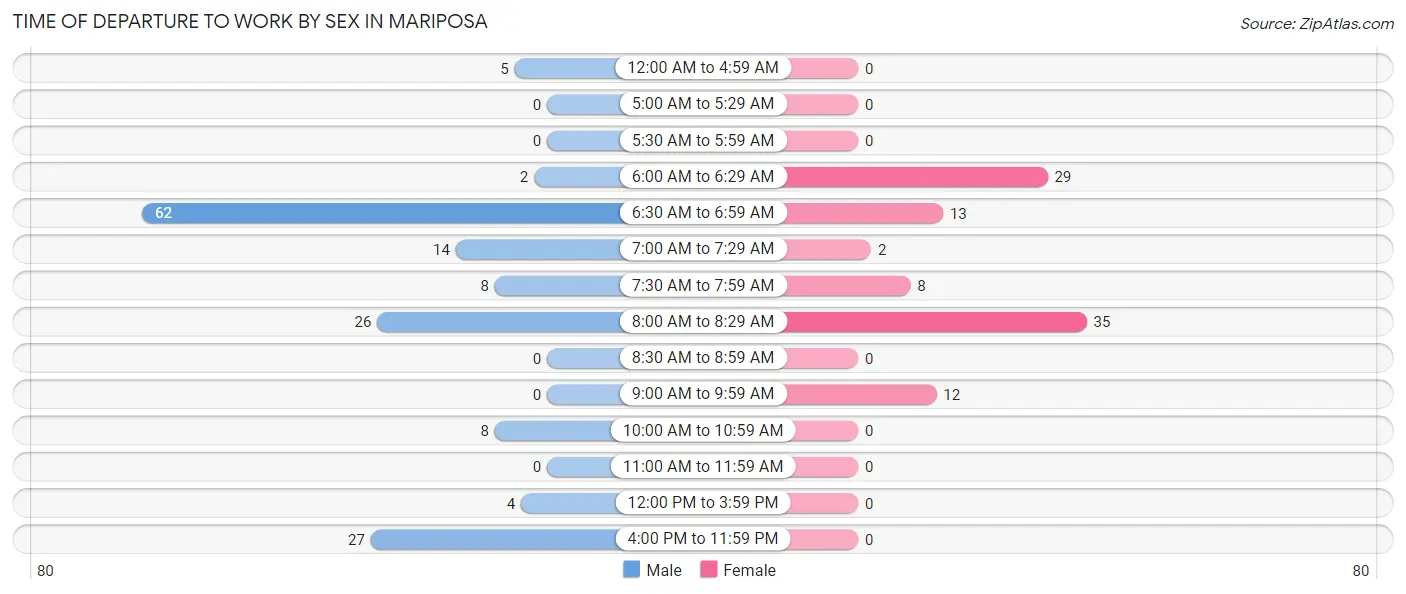
| Time of Departure | Male | Female |
| 12:00 AM to 4:59 AM | 5 (3.2%) | 0 (0.0%) |
| 5:00 AM to 5:29 AM | 0 (0.0%) | 0 (0.0%) |
| 5:30 AM to 5:59 AM | 0 (0.0%) | 0 (0.0%) |
| 6:00 AM to 6:29 AM | 2 (1.3%) | 29 (29.3%) |
| 6:30 AM to 6:59 AM | 62 (39.7%) | 13 (13.1%) |
| 7:00 AM to 7:29 AM | 14 (9.0%) | 2 (2.0%) |
| 7:30 AM to 7:59 AM | 8 (5.1%) | 8 (8.1%) |
| 8:00 AM to 8:29 AM | 26 (16.7%) | 35 (35.3%) |
| 8:30 AM to 8:59 AM | 0 (0.0%) | 0 (0.0%) |
| 9:00 AM to 9:59 AM | 0 (0.0%) | 12 (12.1%) |
| 10:00 AM to 10:59 AM | 8 (5.1%) | 0 (0.0%) |
| 11:00 AM to 11:59 AM | 0 (0.0%) | 0 (0.0%) |
| 12:00 PM to 3:59 PM | 4 (2.6%) | 0 (0.0%) |
| 4:00 PM to 11:59 PM | 27 (17.3%) | 0 (0.0%) |
| Total | 156 (100.0%) | 99 (100.0%) |
Housing Occupancy in Mariposa
Occupancy by Ownership in Mariposa
Of the total 584 dwellings in Mariposa, owner-occupied units account for 398 (68.1%), while renter-occupied units make up 186 (31.9%).
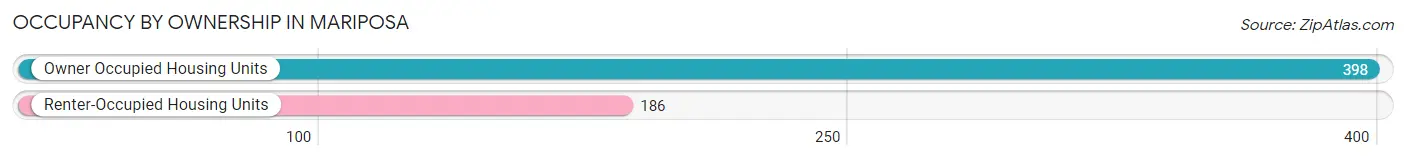
| Occupancy | # Housing Units | % Housing Units |
| Owner Occupied Housing Units | 398 | 68.1% |
| Renter-Occupied Housing Units | 186 | 31.9% |
| Total Occupied Housing Units | 584 | 100.0% |
Occupancy by Household Size in Mariposa
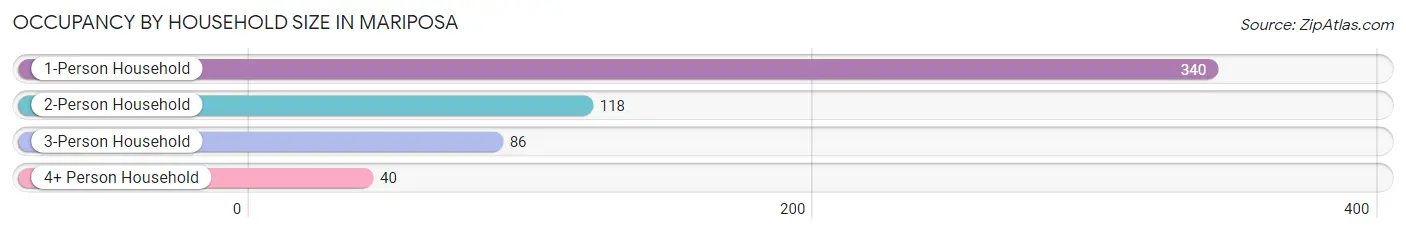
| Household Size | # Housing Units | % Housing Units |
| 1-Person Household | 340 | 58.2% |
| 2-Person Household | 118 | 20.2% |
| 3-Person Household | 86 | 14.7% |
| 4+ Person Household | 40 | 6.9% |
| Total Housing Units | 584 | 100.0% |
Occupancy by Ownership by Household Size in Mariposa
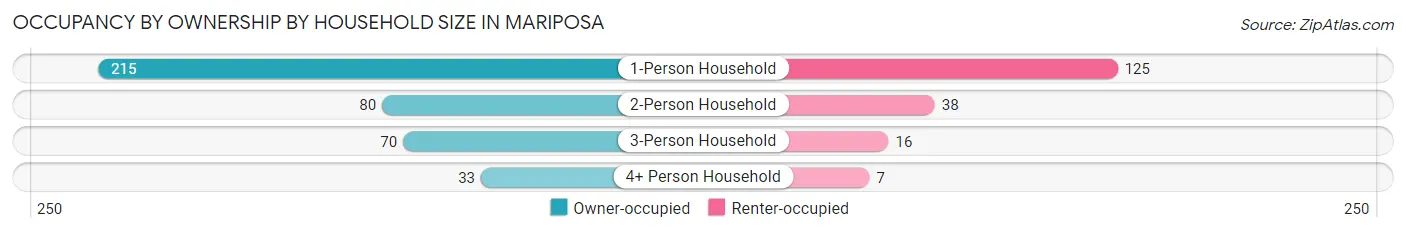
| Household Size | Owner-occupied | Renter-occupied |
| 1-Person Household | 215 (63.2%) | 125 (36.8%) |
| 2-Person Household | 80 (67.8%) | 38 (32.2%) |
| 3-Person Household | 70 (81.4%) | 16 (18.6%) |
| 4+ Person Household | 33 (82.5%) | 7 (17.5%) |
| Total Housing Units | 398 (68.1%) | 186 (31.9%) |
Occupancy by Educational Attainment in Mariposa
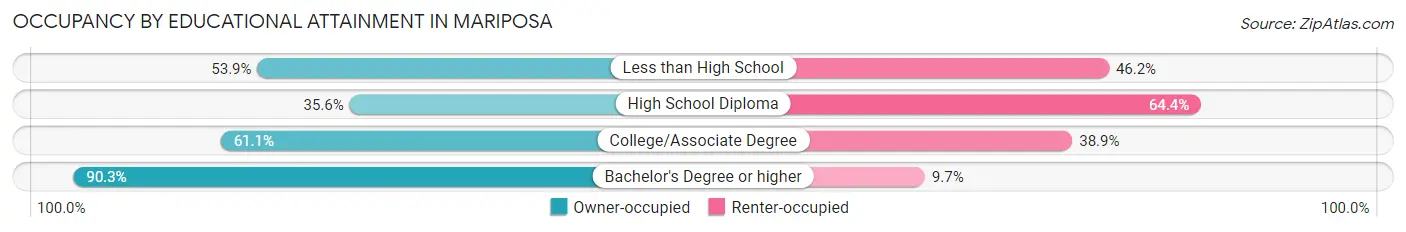
| Household Size | Owner-occupied | Renter-occupied |
| Less than High School | 14 (53.8%) | 12 (46.2%) |
| High School Diploma | 37 (35.6%) | 67 (64.4%) |
| College/Associate Degree | 132 (61.1%) | 84 (38.9%) |
| Bachelor's Degree or higher | 215 (90.3%) | 23 (9.7%) |
Occupancy by Age of Householder in Mariposa
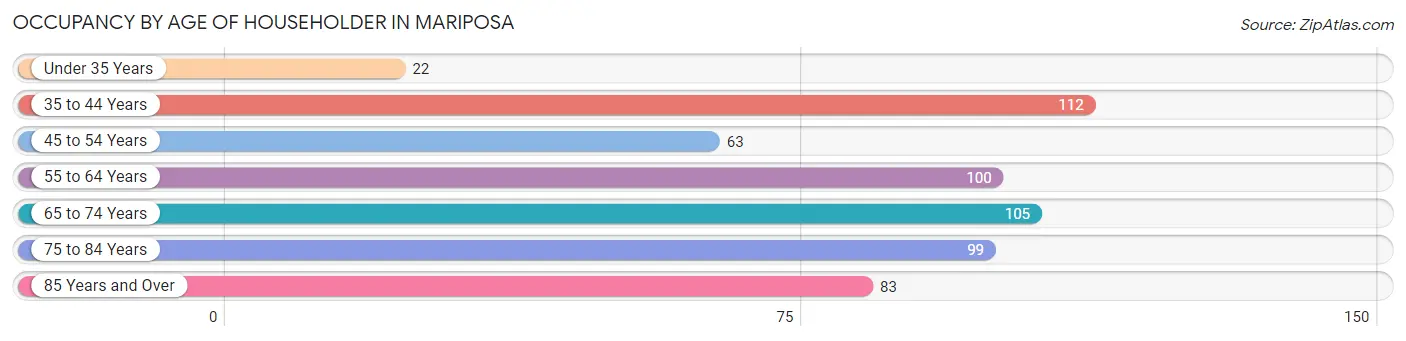
| Age Bracket | # Households | % Households |
| Under 35 Years | 22 | 3.8% |
| 35 to 44 Years | 112 | 19.2% |
| 45 to 54 Years | 63 | 10.8% |
| 55 to 64 Years | 100 | 17.1% |
| 65 to 74 Years | 105 | 18.0% |
| 75 to 84 Years | 99 | 17.0% |
| 85 Years and Over | 83 | 14.2% |
| Total | 584 | 100.0% |
Housing Finances in Mariposa
Median Income by Occupancy in Mariposa
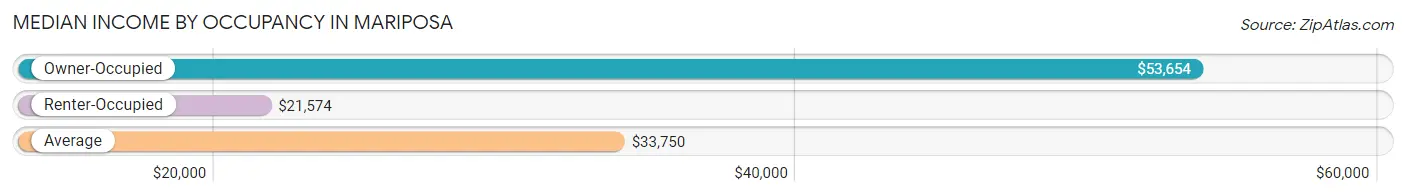
| Occupancy Type | # Households | Median Income |
| Owner-Occupied | 398 (68.1%) | $53,654 |
| Renter-Occupied | 186 (31.9%) | $21,574 |
| Average | 584 (100.0%) | $33,750 |
Occupancy by Householder Income Bracket in Mariposa
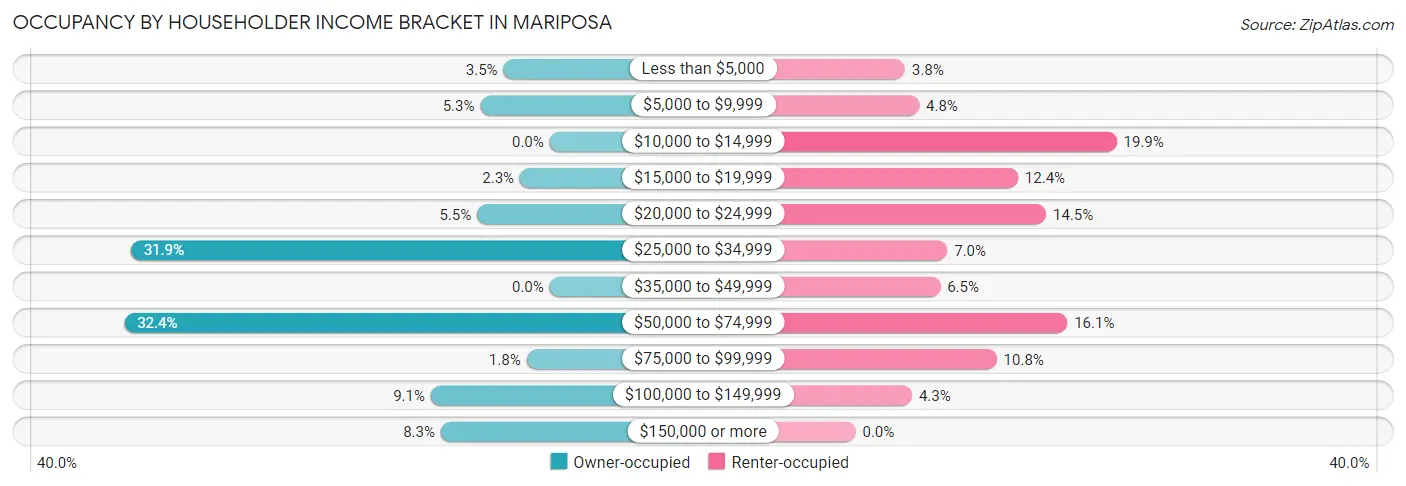
| Income Bracket | Owner-occupied | Renter-occupied |
| Less than $5,000 | 14 (3.5%) | 7 (3.8%) |
| $5,000 to $9,999 | 21 (5.3%) | 9 (4.8%) |
| $10,000 to $14,999 | 0 (0.0%) | 37 (19.9%) |
| $15,000 to $19,999 | 9 (2.3%) | 23 (12.4%) |
| $20,000 to $24,999 | 22 (5.5%) | 27 (14.5%) |
| $25,000 to $34,999 | 127 (31.9%) | 13 (7.0%) |
| $35,000 to $49,999 | 0 (0.0%) | 12 (6.5%) |
| $50,000 to $74,999 | 129 (32.4%) | 30 (16.1%) |
| $75,000 to $99,999 | 7 (1.8%) | 20 (10.7%) |
| $100,000 to $149,999 | 36 (9.0%) | 8 (4.3%) |
| $150,000 or more | 33 (8.3%) | 0 (0.0%) |
| Total | 398 (100.0%) | 186 (100.0%) |
Monthly Housing Cost Tiers in Mariposa
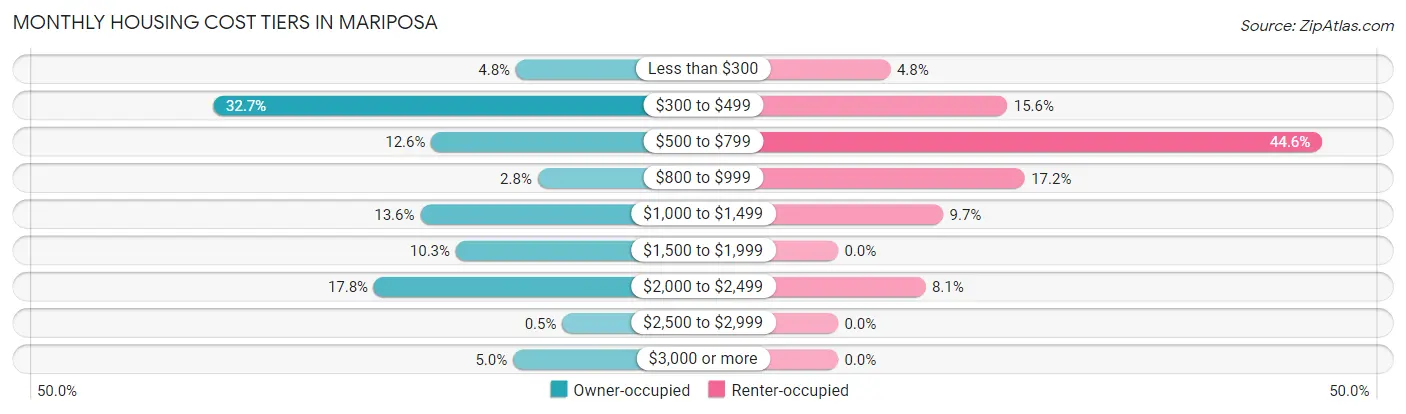
| Monthly Cost | Owner-occupied | Renter-occupied |
| Less than $300 | 19 (4.8%) | 9 (4.8%) |
| $300 to $499 | 130 (32.7%) | 29 (15.6%) |
| $500 to $799 | 50 (12.6%) | 83 (44.6%) |
| $800 to $999 | 11 (2.8%) | 32 (17.2%) |
| $1,000 to $1,499 | 54 (13.6%) | 18 (9.7%) |
| $1,500 to $1,999 | 41 (10.3%) | 0 (0.0%) |
| $2,000 to $2,499 | 71 (17.8%) | 15 (8.1%) |
| $2,500 to $2,999 | 2 (0.5%) | 0 (0.0%) |
| $3,000 or more | 20 (5.0%) | 0 (0.0%) |
| Total | 398 (100.0%) | 186 (100.0%) |
Physical Housing Characteristics in Mariposa
Housing Structures in Mariposa
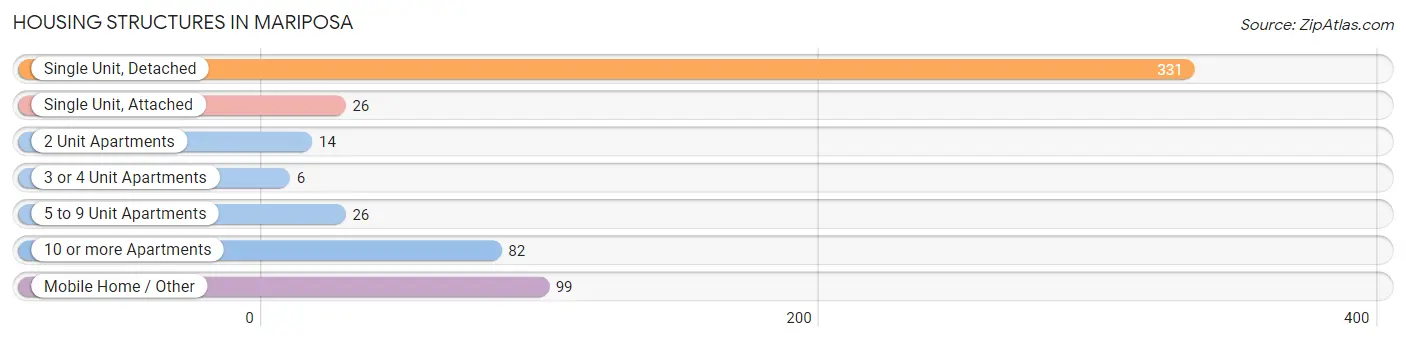
| Structure Type | # Housing Units | % Housing Units |
| Single Unit, Detached | 331 | 56.7% |
| Single Unit, Attached | 26 | 4.4% |
| 2 Unit Apartments | 14 | 2.4% |
| 3 or 4 Unit Apartments | 6 | 1.0% |
| 5 to 9 Unit Apartments | 26 | 4.4% |
| 10 or more Apartments | 82 | 14.0% |
| Mobile Home / Other | 99 | 17.0% |
| Total | 584 | 100.0% |
Housing Structures by Occupancy in Mariposa
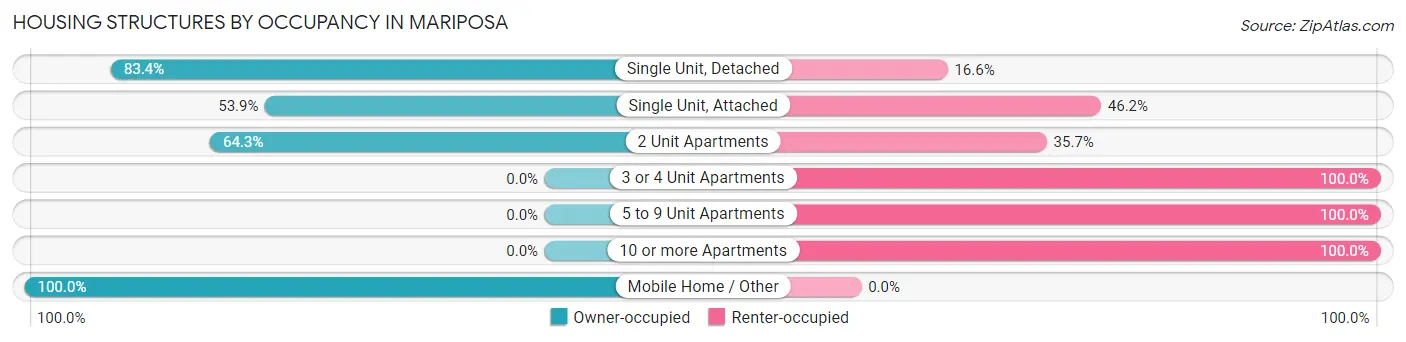
| Structure Type | Owner-occupied | Renter-occupied |
| Single Unit, Detached | 276 (83.4%) | 55 (16.6%) |
| Single Unit, Attached | 14 (53.8%) | 12 (46.2%) |
| 2 Unit Apartments | 9 (64.3%) | 5 (35.7%) |
| 3 or 4 Unit Apartments | 0 (0.0%) | 6 (100.0%) |
| 5 to 9 Unit Apartments | 0 (0.0%) | 26 (100.0%) |
| 10 or more Apartments | 0 (0.0%) | 82 (100.0%) |
| Mobile Home / Other | 99 (100.0%) | 0 (0.0%) |
| Total | 398 (68.1%) | 186 (31.9%) |
Housing Structures by Number of Rooms in Mariposa
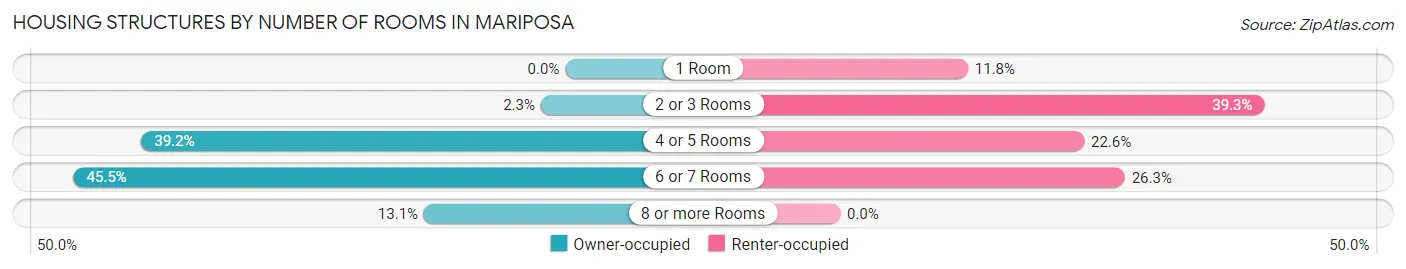
| Number of Rooms | Owner-occupied | Renter-occupied |
| 1 Room | 0 (0.0%) | 22 (11.8%) |
| 2 or 3 Rooms | 9 (2.3%) | 73 (39.3%) |
| 4 or 5 Rooms | 156 (39.2%) | 42 (22.6%) |
| 6 or 7 Rooms | 181 (45.5%) | 49 (26.3%) |
| 8 or more Rooms | 52 (13.1%) | 0 (0.0%) |
| Total | 398 (100.0%) | 186 (100.0%) |
Housing Structure by Heating Type in Mariposa
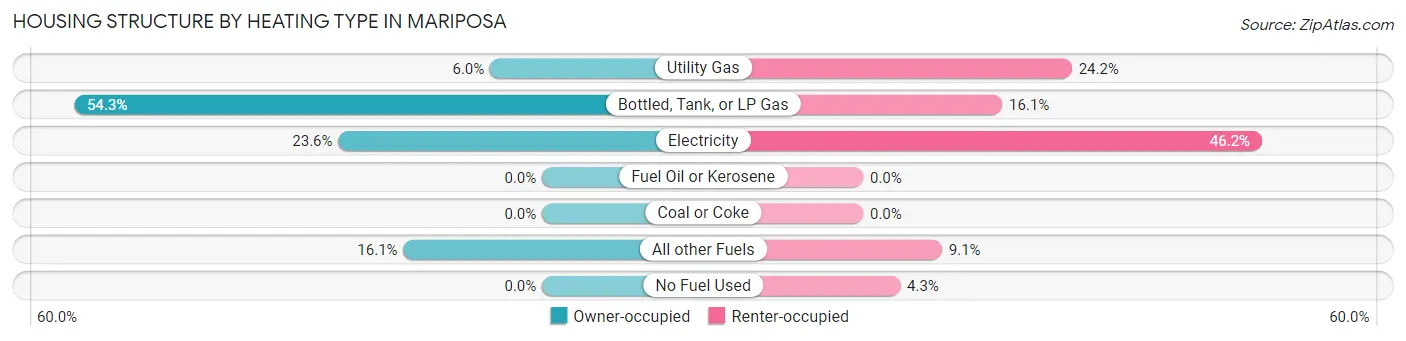
| Heating Type | Owner-occupied | Renter-occupied |
| Utility Gas | 24 (6.0%) | 45 (24.2%) |
| Bottled, Tank, or LP Gas | 216 (54.3%) | 30 (16.1%) |
| Electricity | 94 (23.6%) | 86 (46.2%) |
| Fuel Oil or Kerosene | 0 (0.0%) | 0 (0.0%) |
| Coal or Coke | 0 (0.0%) | 0 (0.0%) |
| All other Fuels | 64 (16.1%) | 17 (9.1%) |
| No Fuel Used | 0 (0.0%) | 8 (4.3%) |
| Total | 398 (100.0%) | 186 (100.0%) |
Household Vehicle Usage in Mariposa
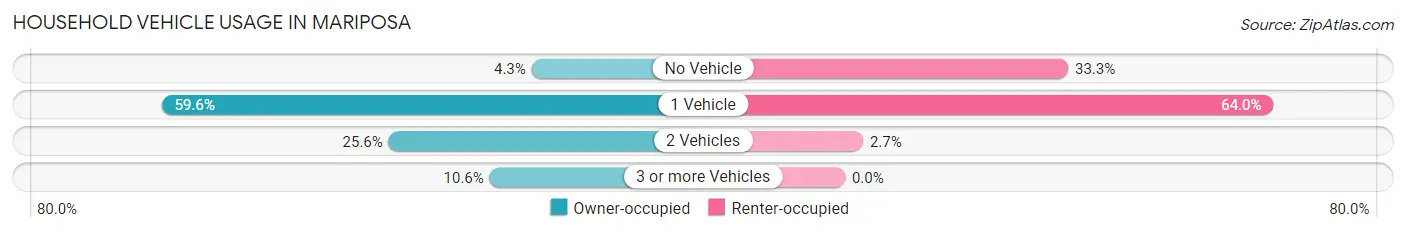
| Vehicles per Household | Owner-occupied | Renter-occupied |
| No Vehicle | 17 (4.3%) | 62 (33.3%) |
| 1 Vehicle | 237 (59.6%) | 119 (64.0%) |
| 2 Vehicles | 102 (25.6%) | 5 (2.7%) |
| 3 or more Vehicles | 42 (10.5%) | 0 (0.0%) |
| Total | 398 (100.0%) | 186 (100.0%) |
Real Estate & Mortgages in Mariposa
Real Estate and Mortgage Overview in Mariposa
| Characteristic | Without Mortgage | With Mortgage |
| Housing Units | 199 | 199 |
| Median Property Value | $167,000 | $356,900 |
| Median Household Income | $29,659 | $33 |
| Monthly Housing Costs | $434 | $20 |
| Real Estate Taxes | - | - |
Property Value by Mortgage Status in Mariposa
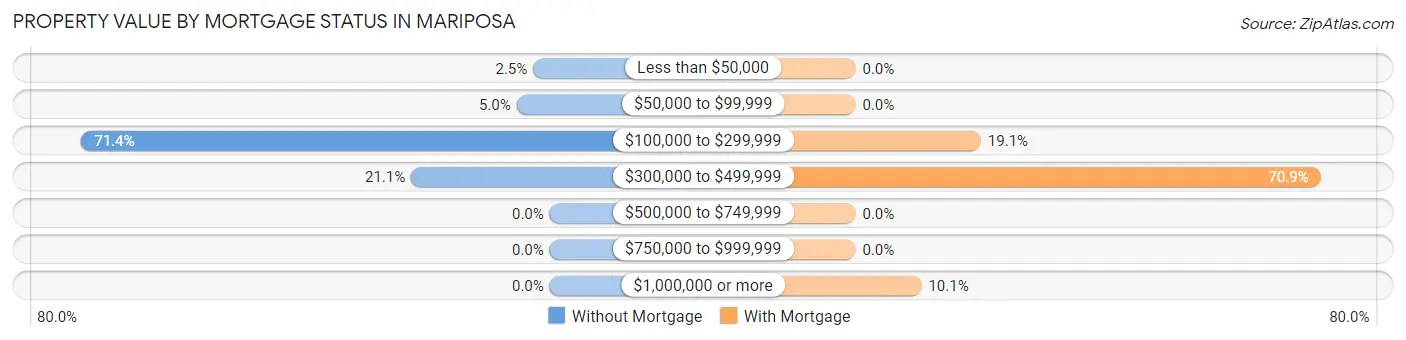
| Property Value | Without Mortgage | With Mortgage |
| Less than $50,000 | 5 (2.5%) | 0 (0.0%) |
| $50,000 to $99,999 | 10 (5.0%) | 0 (0.0%) |
| $100,000 to $299,999 | 142 (71.4%) | 38 (19.1%) |
| $300,000 to $499,999 | 42 (21.1%) | 141 (70.9%) |
| $500,000 to $749,999 | 0 (0.0%) | 0 (0.0%) |
| $750,000 to $999,999 | 0 (0.0%) | 0 (0.0%) |
| $1,000,000 or more | 0 (0.0%) | 20 (10.1%) |
| Total | 199 (100.0%) | 199 (100.0%) |
Household Income by Mortgage Status in Mariposa
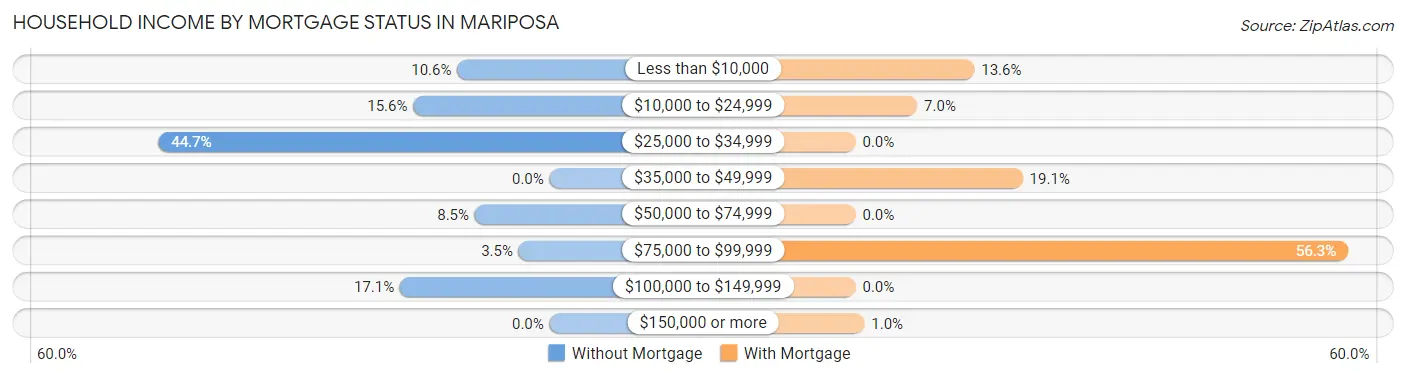
| Household Income | Without Mortgage | With Mortgage |
| Less than $10,000 | 21 (10.5%) | 27 (13.6%) |
| $10,000 to $24,999 | 31 (15.6%) | 14 (7.0%) |
| $25,000 to $34,999 | 89 (44.7%) | 0 (0.0%) |
| $35,000 to $49,999 | 0 (0.0%) | 38 (19.1%) |
| $50,000 to $74,999 | 17 (8.5%) | 0 (0.0%) |
| $75,000 to $99,999 | 7 (3.5%) | 112 (56.3%) |
| $100,000 to $149,999 | 34 (17.1%) | 0 (0.0%) |
| $150,000 or more | 0 (0.0%) | 2 (1.0%) |
| Total | 199 (100.0%) | 199 (100.0%) |
Property Value to Household Income Ratio in Mariposa
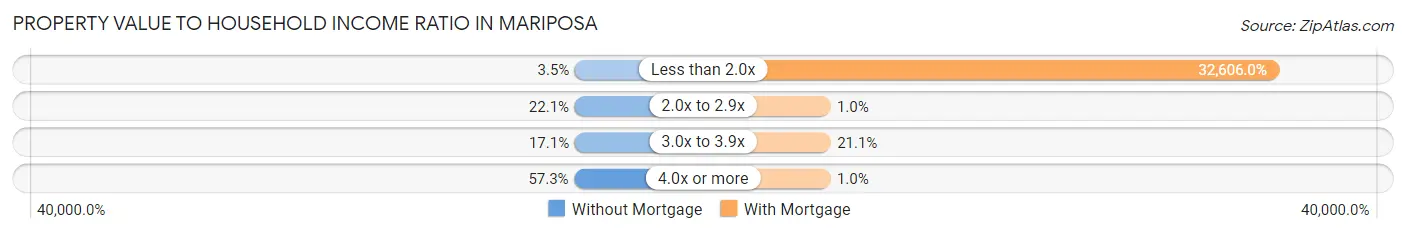
| Value-to-Income Ratio | Without Mortgage | With Mortgage |
| Less than 2.0x | 7 (3.5%) | 64,886 (32,606.0%) |
| 2.0x to 2.9x | 44 (22.1%) | 2 (1.0%) |
| 3.0x to 3.9x | 34 (17.1%) | 42 (21.1%) |
| 4.0x or more | 114 (57.3%) | 2 (1.0%) |
| Total | 199 (100.0%) | 199 (100.0%) |
Real Estate Taxes by Mortgage Status in Mariposa
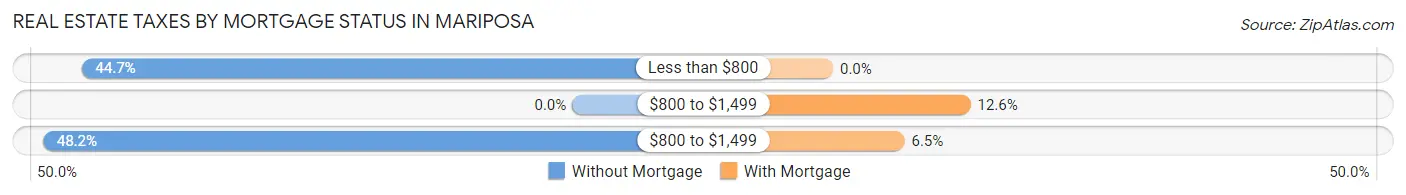
| Property Taxes | Without Mortgage | With Mortgage |
| Less than $800 | 89 (44.7%) | 0 (0.0%) |
| $800 to $1,499 | 0 (0.0%) | 25 (12.6%) |
| $800 to $1,499 | 96 (48.2%) | 13 (6.5%) |
| Total | 199 (100.0%) | 199 (100.0%) |
Health & Disability in Mariposa
Health Insurance Coverage by Age in Mariposa
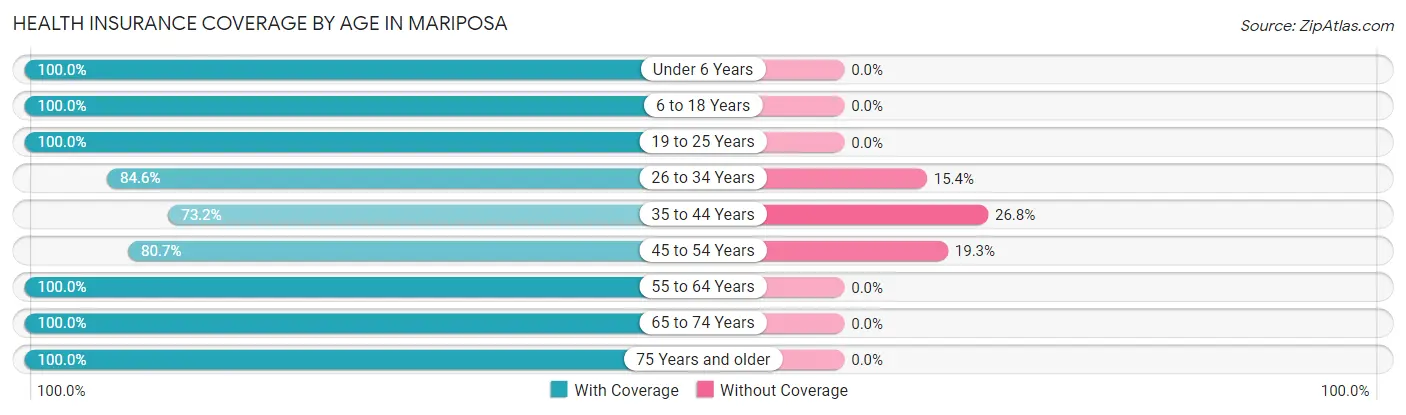
| Age Bracket | With Coverage | Without Coverage |
| Under 6 Years | 28 (100.0%) | 0 (0.0%) |
| 6 to 18 Years | 138 (100.0%) | 0 (0.0%) |
| 19 to 25 Years | 6 (100.0%) | 0 (0.0%) |
| 26 to 34 Years | 22 (84.6%) | 4 (15.4%) |
| 35 to 44 Years | 101 (73.2%) | 37 (26.8%) |
| 45 to 54 Years | 117 (80.7%) | 28 (19.3%) |
| 55 to 64 Years | 100 (100.0%) | 0 (0.0%) |
| 65 to 74 Years | 201 (100.0%) | 0 (0.0%) |
| 75 Years and older | 207 (100.0%) | 0 (0.0%) |
| Total | 920 (93.0%) | 69 (7.0%) |
Health Insurance Coverage by Citizenship Status in Mariposa
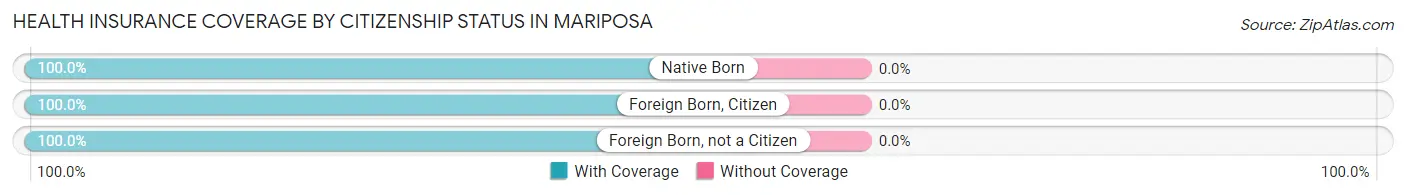
| Citizenship Status | With Coverage | Without Coverage |
| Native Born | 28 (100.0%) | 0 (0.0%) |
| Foreign Born, Citizen | 138 (100.0%) | 0 (0.0%) |
| Foreign Born, not a Citizen | 6 (100.0%) | 0 (0.0%) |
Health Insurance Coverage by Household Income in Mariposa
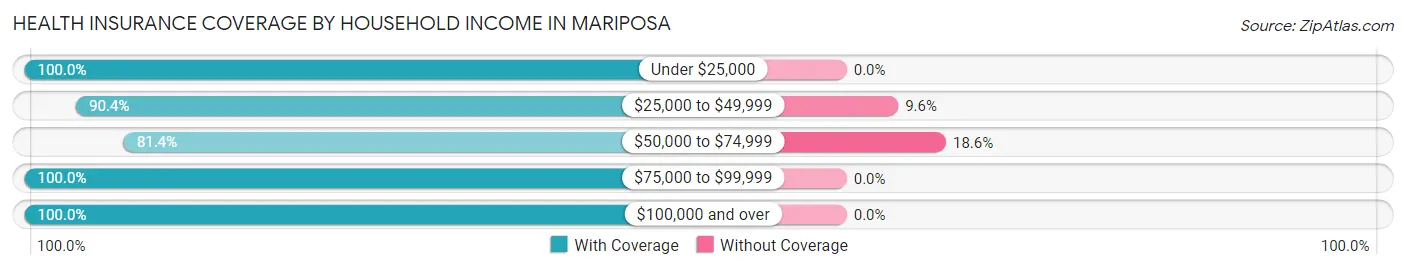
| Household Income | With Coverage | Without Coverage |
| Under $25,000 | 286 (100.0%) | 0 (0.0%) |
| $25,000 to $49,999 | 150 (90.4%) | 16 (9.6%) |
| $50,000 to $74,999 | 232 (81.4%) | 53 (18.6%) |
| $75,000 to $99,999 | 33 (100.0%) | 0 (0.0%) |
| $100,000 and over | 180 (100.0%) | 0 (0.0%) |
Public vs Private Health Insurance Coverage by Age in Mariposa
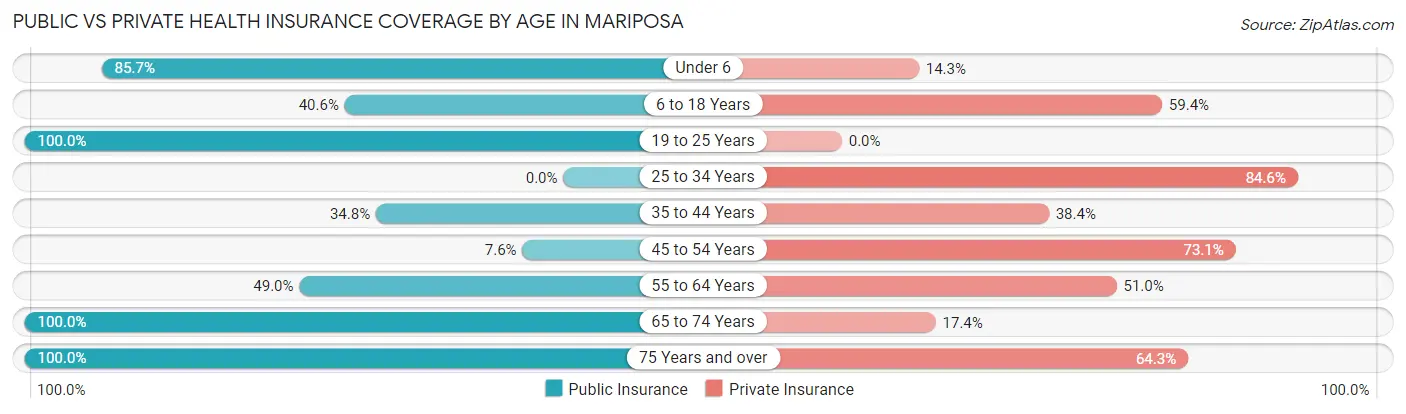
| Age Bracket | Public Insurance | Private Insurance |
| Under 6 | 24 (85.7%) | 4 (14.3%) |
| 6 to 18 Years | 56 (40.6%) | 82 (59.4%) |
| 19 to 25 Years | 6 (100.0%) | 0 (0.0%) |
| 25 to 34 Years | 0 (0.0%) | 22 (84.6%) |
| 35 to 44 Years | 48 (34.8%) | 53 (38.4%) |
| 45 to 54 Years | 11 (7.6%) | 106 (73.1%) |
| 55 to 64 Years | 49 (49.0%) | 51 (51.0%) |
| 65 to 74 Years | 201 (100.0%) | 35 (17.4%) |
| 75 Years and over | 207 (100.0%) | 133 (64.2%) |
| Total | 602 (60.9%) | 486 (49.1%) |
Disability Status by Sex by Age in Mariposa
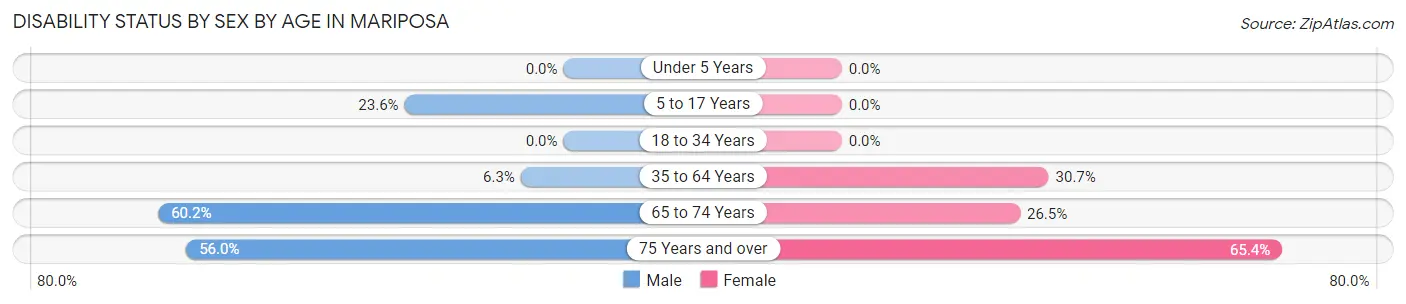
| Age Bracket | Male | Female |
| Under 5 Years | 0 (0.0%) | 0 (0.0%) |
| 5 to 17 Years | 21 (23.6%) | 0 (0.0%) |
| 18 to 34 Years | 0 (0.0%) | 0 (0.0%) |
| 35 to 64 Years | 9 (6.3%) | 74 (30.7%) |
| 65 to 74 Years | 80 (60.2%) | 18 (26.5%) |
| 75 Years and over | 14 (56.0%) | 119 (65.4%) |
Disability Class by Sex by Age in Mariposa
Disability Class: Hearing Difficulty
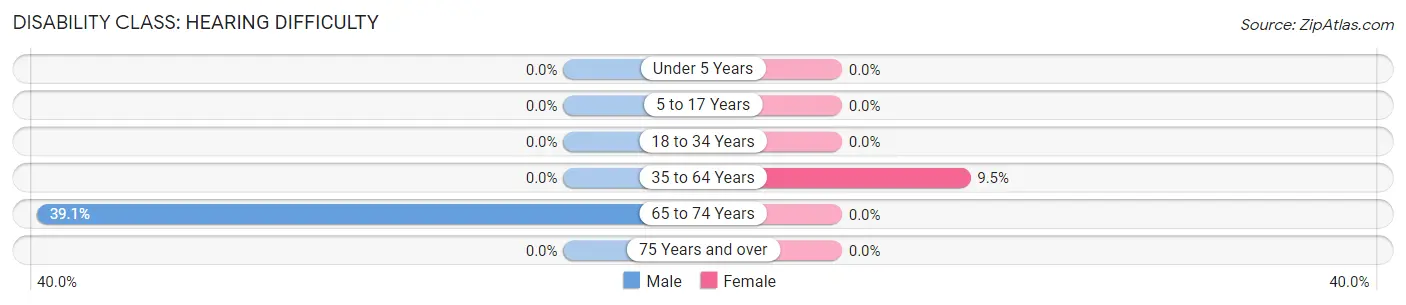
| Age Bracket | Male | Female |
| Under 5 Years | 0 (0.0%) | 0 (0.0%) |
| 5 to 17 Years | 0 (0.0%) | 0 (0.0%) |
| 18 to 34 Years | 0 (0.0%) | 0 (0.0%) |
| 35 to 64 Years | 0 (0.0%) | 23 (9.5%) |
| 65 to 74 Years | 52 (39.1%) | 0 (0.0%) |
| 75 Years and over | 0 (0.0%) | 0 (0.0%) |
Disability Class: Vision Difficulty
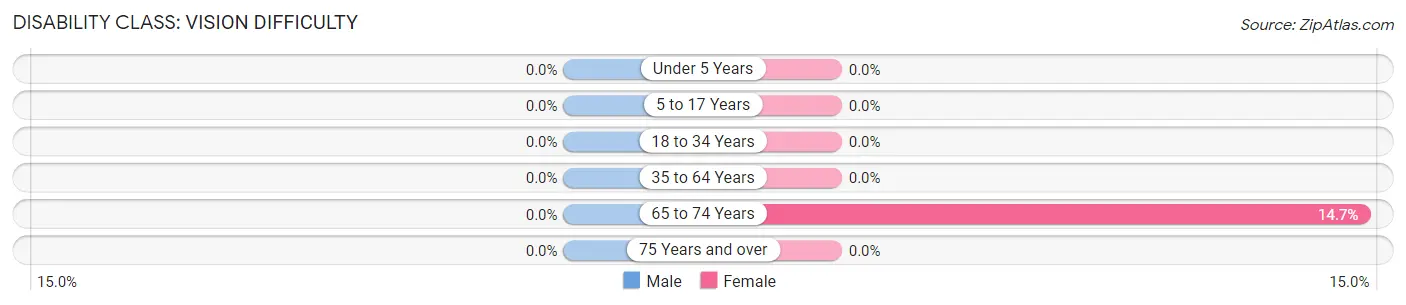
| Age Bracket | Male | Female |
| Under 5 Years | 0 (0.0%) | 0 (0.0%) |
| 5 to 17 Years | 0 (0.0%) | 0 (0.0%) |
| 18 to 34 Years | 0 (0.0%) | 0 (0.0%) |
| 35 to 64 Years | 0 (0.0%) | 0 (0.0%) |
| 65 to 74 Years | 0 (0.0%) | 10 (14.7%) |
| 75 Years and over | 0 (0.0%) | 0 (0.0%) |
Disability Class: Cognitive Difficulty
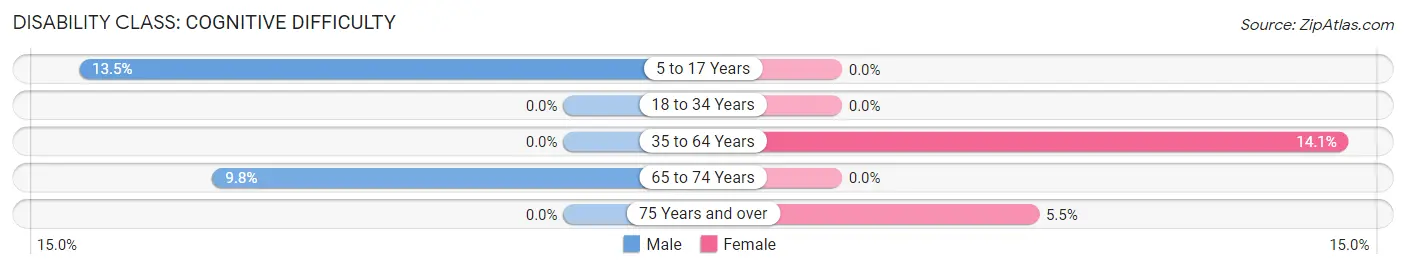
| Age Bracket | Male | Female |
| 5 to 17 Years | 12 (13.5%) | 0 (0.0%) |
| 18 to 34 Years | 0 (0.0%) | 0 (0.0%) |
| 35 to 64 Years | 0 (0.0%) | 34 (14.1%) |
| 65 to 74 Years | 13 (9.8%) | 0 (0.0%) |
| 75 Years and over | 0 (0.0%) | 10 (5.5%) |
Disability Class: Ambulatory Difficulty
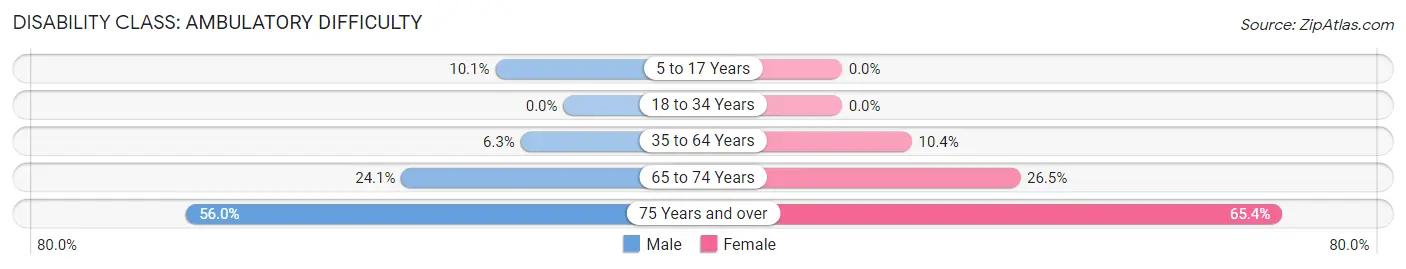
| Age Bracket | Male | Female |
| 5 to 17 Years | 9 (10.1%) | 0 (0.0%) |
| 18 to 34 Years | 0 (0.0%) | 0 (0.0%) |
| 35 to 64 Years | 9 (6.3%) | 25 (10.4%) |
| 65 to 74 Years | 32 (24.1%) | 18 (26.5%) |
| 75 Years and over | 14 (56.0%) | 119 (65.4%) |
Disability Class: Self-Care Difficulty
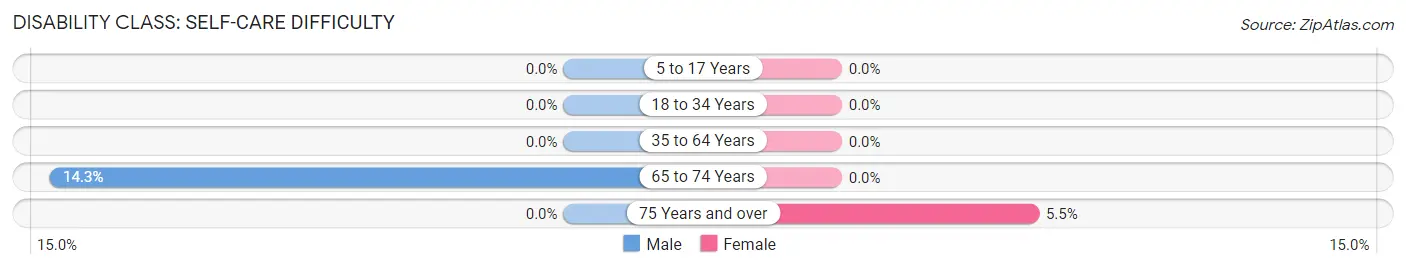
| Age Bracket | Male | Female |
| 5 to 17 Years | 0 (0.0%) | 0 (0.0%) |
| 18 to 34 Years | 0 (0.0%) | 0 (0.0%) |
| 35 to 64 Years | 0 (0.0%) | 0 (0.0%) |
| 65 to 74 Years | 19 (14.3%) | 0 (0.0%) |
| 75 Years and over | 0 (0.0%) | 10 (5.5%) |
Technology Access in Mariposa
Computing Device Access in Mariposa
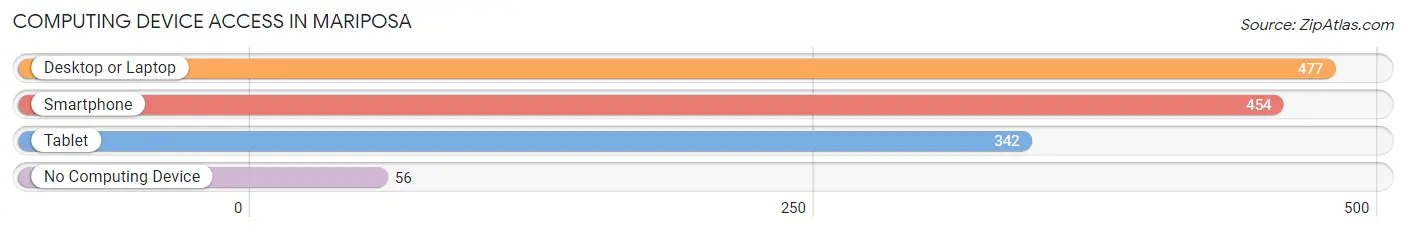
| Device Type | # Households | % Households |
| Desktop or Laptop | 477 | 81.7% |
| Smartphone | 454 | 77.7% |
| Tablet | 342 | 58.6% |
| No Computing Device | 56 | 9.6% |
| Total | 584 | 100.0% |
Internet Access in Mariposa
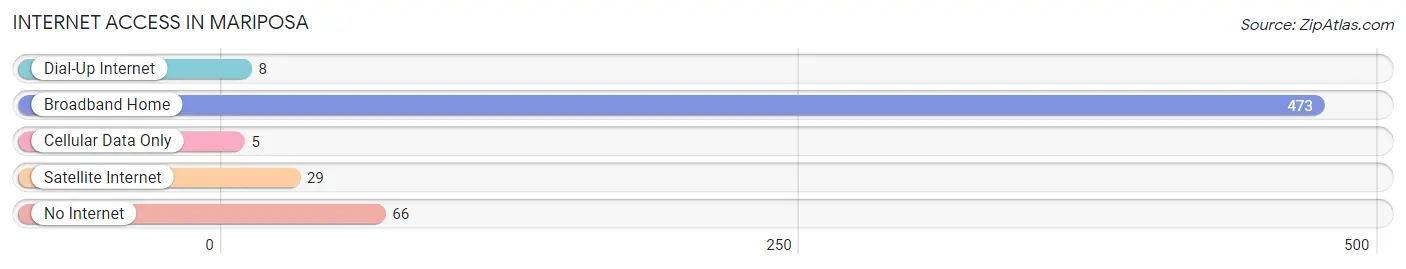
| Internet Type | # Households | % Households |
| Dial-Up Internet | 8 | 1.4% |
| Broadband Home | 473 | 81.0% |
| Cellular Data Only | 5 | 0.9% |
| Satellite Internet | 29 | 5.0% |
| No Internet | 66 | 11.3% |
| Total | 584 | 100.0% |
Mariposa Summary
Mariposa, California is a small town located in the Sierra Nevada foothills of Central California. It is situated in the heart of the Gold Country, and is the county seat of Mariposa County. The town is known for its rich history, stunning geography, and vibrant economy.
History
Mariposa was founded in 1849 during the California Gold Rush. It was named after the Spanish word for butterfly, as the area was known for its abundance of the insects. The town quickly became a hub for miners, merchants, and other settlers. In 1851, Mariposa County was established, and Mariposa became the county seat.
During the late 19th century, Mariposa was a bustling center of commerce and industry. It was home to several large businesses, including a flour mill, a brewery, and a tannery. The town also had a thriving agricultural industry, with orchards, vineyards, and dairies.
In the early 20th century, Mariposa began to decline. The Gold Rush had ended, and many of the businesses had closed. The town was further impacted by the Great Depression and World War II. By the 1950s, Mariposa had become a quiet, rural community.
In recent years, Mariposa has experienced a resurgence. The town has become a popular tourist destination, with many visitors drawn to its historic buildings and scenic beauty.
Geography
Mariposa is located in the Sierra Nevada foothills, about 50 miles south of Yosemite National Park. The town is situated at an elevation of 2,000 feet, and is surrounded by rolling hills and lush forests. The Merced River runs through the center of town, and is a popular spot for fishing and swimming.
The climate in Mariposa is mild and sunny, with hot summers and cool winters. The average annual temperature is around 60 degrees Fahrenheit. The area receives an average of 20 inches of rain per year.
Economy
Mariposa’s economy is largely based on tourism. The town is home to several popular attractions, including the Mariposa County Museum, the Mariposa County Fairgrounds, and the Mariposa County Historical Park. The town also has several wineries, restaurants, and shops.
Agriculture is also an important part of the local economy. The area is known for its apples, peaches, and other fruits. There are also several vineyards and wineries in the area.
Demographics
As of the 2010 census, Mariposa had a population of 2,173. The town is predominantly white (90.2%), with small Hispanic (4.2%) and Native American (2.2%) populations. The median household income is $37,917, and the median age is 44.
Mariposa is a small, close-knit community. The town is known for its friendly atmosphere and welcoming attitude. It is a popular destination for visitors, and is a great place to live and work.
Common Questions
What is Per Capita Income in Mariposa?
Per Capita income in Mariposa is $27,321.
What is the Median Family Income in Mariposa?
Median Family Income in Mariposa is $66,858.
What is the Median Household income in Mariposa?
Median Household Income in Mariposa is $33,750.
What is Income or Wage Gap in Mariposa?
Income or Wage Gap in Mariposa is 60.6%.
Women in Mariposa earn 39.4 cents for every dollar earned by a man.
What is Inequality or Gini Index in Mariposa?
Inequality or Gini Index in Mariposa is 0.43.
What is the Total Population of Mariposa?
Total Population of Mariposa is 1,060.
What is the Total Male Population of Mariposa?
Total Male Population of Mariposa is 472.
What is the Total Female Population of Mariposa?
Total Female Population of Mariposa is 588.
What is the Ratio of Males per 100 Females in Mariposa?
There are 80.27 Males per 100 Females in Mariposa.
What is the Ratio of Females per 100 Males in Mariposa?
There are 124.58 Females per 100 Males in Mariposa.
What is the Median Population Age in Mariposa?
Median Population Age in Mariposa is 55.4 Years.
What is the Average Family Size in Mariposa
Average Family Size in Mariposa is 2.5 People.
What is the Average Household Size in Mariposa
Average Household Size in Mariposa is 1.6 People.
How Large is the Labor Force in Mariposa?
There are 306 People in the Labor Forcein in Mariposa.
What is the Percentage of People in the Labor Force in Mariposa?
34.2% of People are in the Labor Force in Mariposa.
What is the Unemployment Rate in Mariposa?
Unemployment Rate in Mariposa is 8.2%.