Magalia, CA Map & Demographics
Magalia Map
Magalia Overview
$29,493
PER CAPITA INCOME
$70,793
AVG FAMILY INCOME
$57,170
AVG HOUSEHOLD INCOME
12.4%
WAGE / INCOME GAP [ % ]
87.6¢/ $1
WAGE / INCOME GAP [ $ ]
0.42
INEQUALITY / GINI INDEX
9,245
TOTAL POPULATION
4,549
MALE POPULATION
4,696
FEMALE POPULATION
96.87
MALES / 100 FEMALES
103.23
FEMALES / 100 MALES
47.6
MEDIAN AGE
3.0
AVG FAMILY SIZE
2.5
AVG HOUSEHOLD SIZE
3,656
LABOR FORCE [ PEOPLE ]
47.8%
PERCENT IN LABOR FORCE
8.0%
UNEMPLOYMENT RATE
Magalia Zip Codes
Magalia Area Codes
Income in Magalia
Income Overview in Magalia
Per Capita Income in Magalia is $29,493, while median incomes of families and households are $70,793 and $57,170 respectively.
| Characteristic | Number | Measure |
| Per Capita Income | 9,245 | $29,493 |
| Median Family Income | 2,325 | $70,793 |
| Mean Family Income | 2,325 | $88,541 |
| Median Household Income | 3,650 | $57,170 |
| Mean Household Income | 3,650 | $75,016 |
| Income Deficit | 2,325 | $0 |
| Wage / Income Gap (%) | 9,245 | 12.41% |
| Wage / Income Gap ($) | 9,245 | 87.59¢ per $1 |
| Gini / Inequality Index | 9,245 | 0.42 |
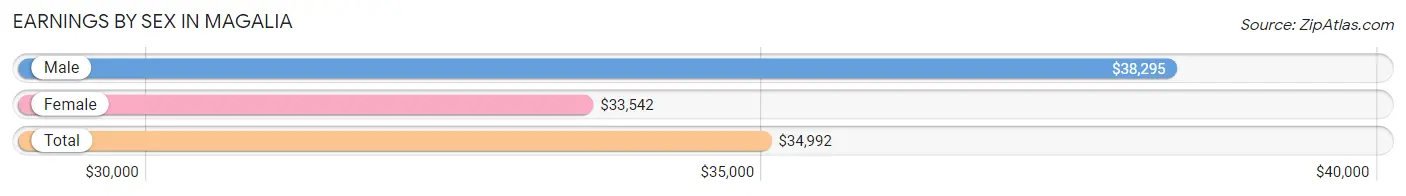
Earnings by Sex in Magalia
Average Earnings in Magalia are $34,992, $38,295 for men and $33,542 for women, a difference of 12.4%.
| Sex | Number | Average Earnings |
| Male | 1,889 (49.3%) | $38,295 |
| Female | 1,943 (50.7%) | $33,542 |
| Total | 3,832 (100.0%) | $34,992 |
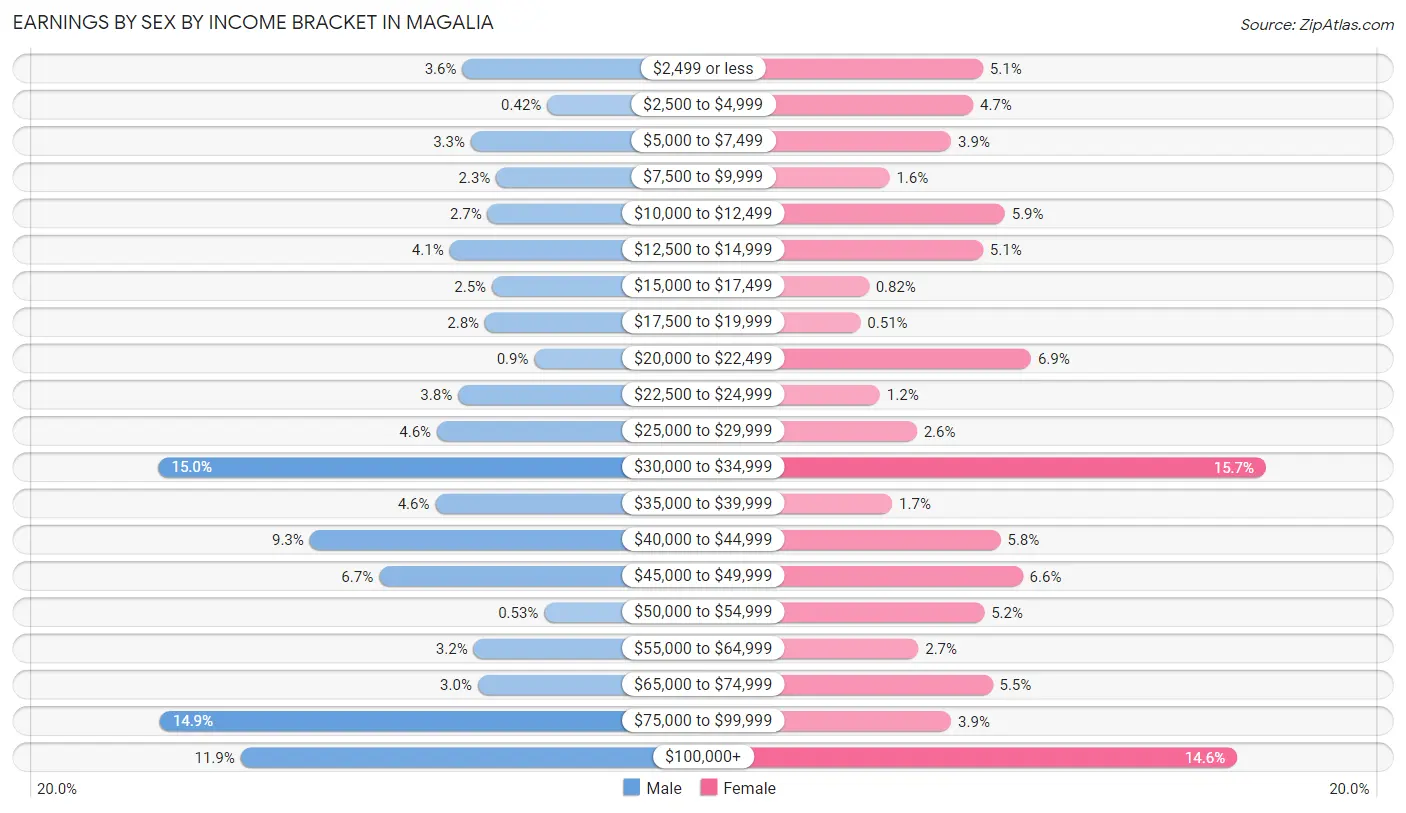
Earnings by Sex by Income Bracket in Magalia
The most common earnings brackets in Magalia are $30,000 to $34,999 for men (283 | 15.0%) and $30,000 to $34,999 for women (305 | 15.7%).
| Income | Male | Female |
| $2,499 or less | 68 (3.6%) | 99 (5.1%) |
| $2,500 to $4,999 | 8 (0.4%) | 92 (4.7%) |
| $5,000 to $7,499 | 62 (3.3%) | 76 (3.9%) |
| $7,500 to $9,999 | 44 (2.3%) | 31 (1.6%) |
| $10,000 to $12,499 | 50 (2.6%) | 115 (5.9%) |
| $12,500 to $14,999 | 77 (4.1%) | 99 (5.1%) |
| $15,000 to $17,499 | 47 (2.5%) | 16 (0.8%) |
| $17,500 to $19,999 | 52 (2.8%) | 10 (0.5%) |
| $20,000 to $22,499 | 17 (0.9%) | 134 (6.9%) |
| $22,500 to $24,999 | 71 (3.8%) | 24 (1.2%) |
| $25,000 to $29,999 | 86 (4.5%) | 51 (2.6%) |
| $30,000 to $34,999 | 283 (15.0%) | 305 (15.7%) |
| $35,000 to $39,999 | 87 (4.6%) | 33 (1.7%) |
| $40,000 to $44,999 | 176 (9.3%) | 112 (5.8%) |
| $45,000 to $49,999 | 127 (6.7%) | 128 (6.6%) |
| $50,000 to $54,999 | 10 (0.5%) | 100 (5.1%) |
| $55,000 to $64,999 | 60 (3.2%) | 52 (2.7%) |
| $65,000 to $74,999 | 57 (3.0%) | 106 (5.5%) |
| $75,000 to $99,999 | 282 (14.9%) | 76 (3.9%) |
| $100,000+ | 225 (11.9%) | 284 (14.6%) |
| Total | 1,889 (100.0%) | 1,943 (100.0%) |
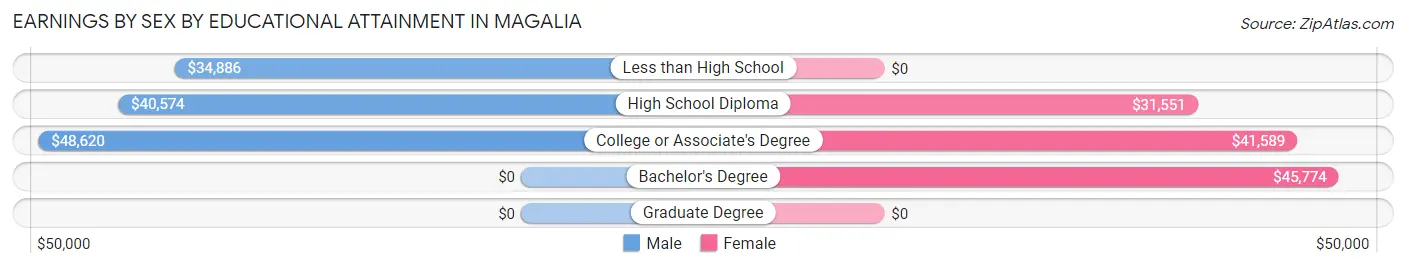
Earnings by Sex by Educational Attainment in Magalia
Average earnings in Magalia are $42,028 for men and $40,962 for women, a difference of 2.5%. Men with an educational attainment of college or associate's degree enjoy the highest average annual earnings of $48,620, while those with less than high school education earn the least with $34,886. Women with an educational attainment of bachelor's degree earn the most with the average annual earnings of $45,774, while those with high school diploma education have the smallest earnings of $31,551.
| Educational Attainment | Male Income | Female Income |
| Less than High School | $34,886 | $0 |
| High School Diploma | $40,574 | $31,551 |
| College or Associate's Degree | $48,620 | $41,589 |
| Bachelor's Degree | - | - |
| Graduate Degree | - | - |
| Total | $42,028 | $40,962 |
Family Income in Magalia
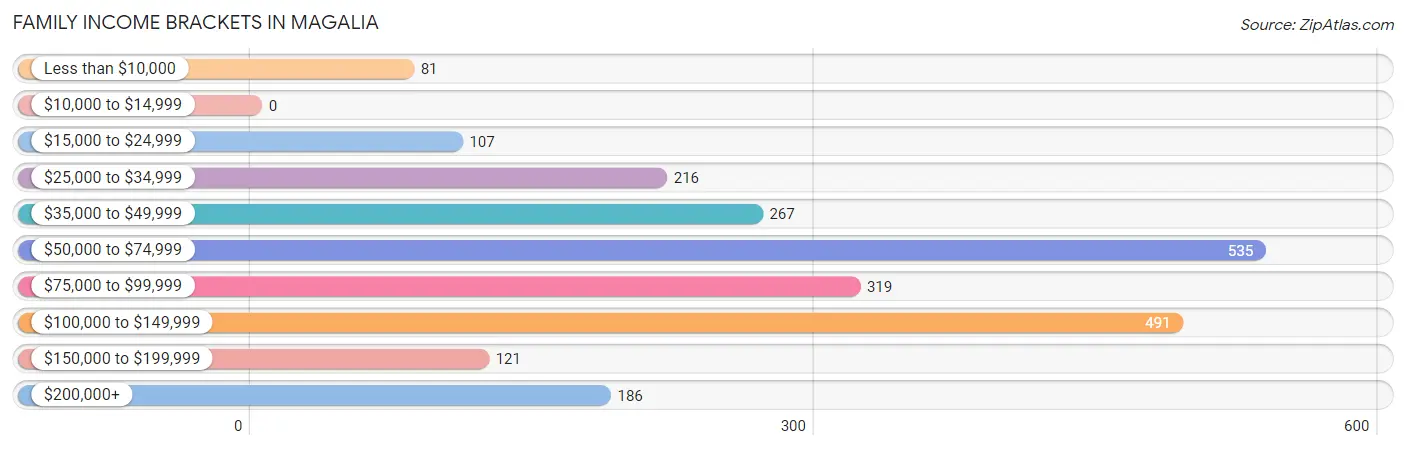
Family Income Brackets in Magalia
According to the Magalia family income data, there are 535 families falling into the $50,000 to $74,999 income range, which is the most common income bracket and makes up 23.0% of all families.
| Income Bracket | # Families | % Families |
| Less than $10,000 | 81 | 3.5% |
| $10,000 to $14,999 | 0 | 0.0% |
| $15,000 to $24,999 | 107 | 4.6% |
| $25,000 to $34,999 | 216 | 9.3% |
| $35,000 to $49,999 | 267 | 11.5% |
| $50,000 to $74,999 | 535 | 23.0% |
| $75,000 to $99,999 | 319 | 13.7% |
| $100,000 to $149,999 | 491 | 21.1% |
| $150,000 to $199,999 | 121 | 5.2% |
| $200,000+ | 186 | 8.0% |
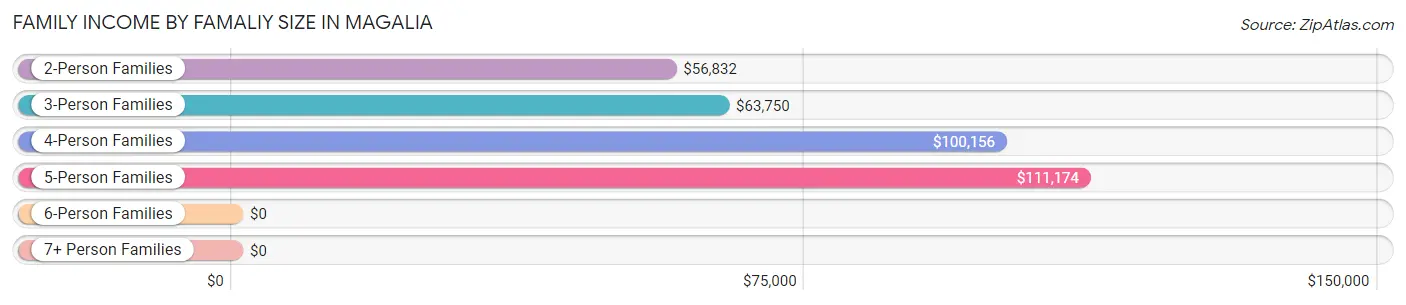
Family Income by Famaliy Size in Magalia
5-person families (335 | 14.4%) account for the highest median family income in Magalia with $111,174 per family, while 2-person families (1,201 | 51.7%) have the highest median income of $28,416 per family member.
| Income Bracket | # Families | Median Income |
| 2-Person Families | 1,201 (51.7%) | $56,832 |
| 3-Person Families | 411 (17.7%) | $63,750 |
| 4-Person Families | 310 (13.3%) | $100,156 |
| 5-Person Families | 335 (14.4%) | $111,174 |
| 6-Person Families | 63 (2.7%) | $0 |
| 7+ Person Families | 5 (0.2%) | $0 |
| Total | 2,325 (100.0%) | $70,793 |
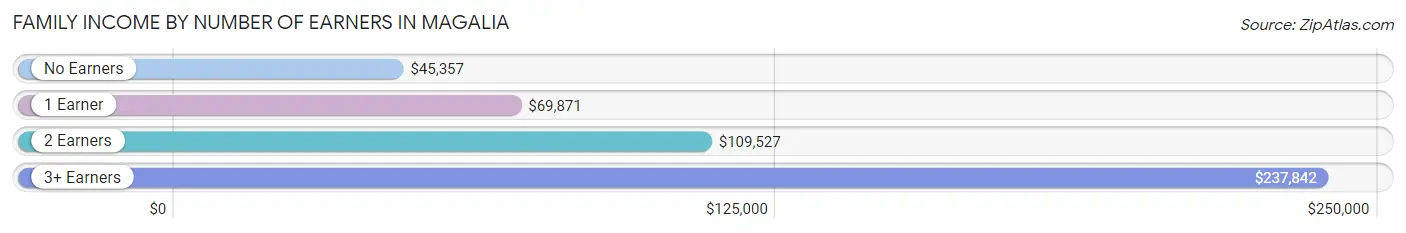
Family Income by Number of Earners in Magalia
The median family income in Magalia is $70,793, with families comprising 3+ earners (178) having the highest median family income of $237,842, while families with no earners (582) have the lowest median family income of $45,357, accounting for 7.7% and 25.0% of families, respectively.
| Number of Earners | # Families | Median Income |
| No Earners | 582 (25.0%) | $45,357 |
| 1 Earner | 947 (40.7%) | $69,871 |
| 2 Earners | 618 (26.6%) | $109,527 |
| 3+ Earners | 178 (7.7%) | $237,842 |
| Total | 2,325 (100.0%) | $70,793 |
Household Income in Magalia
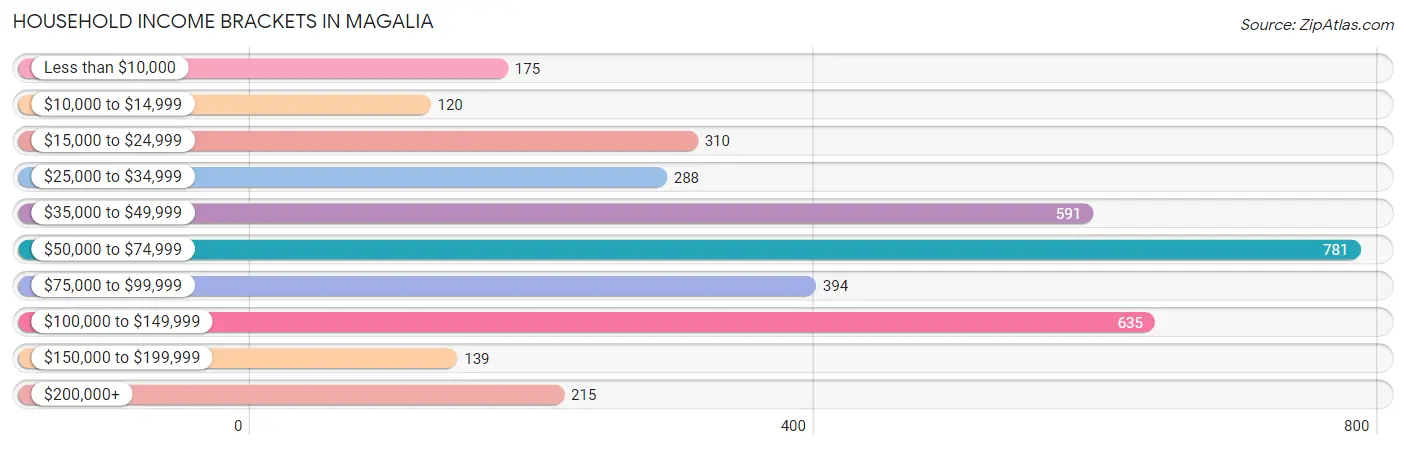
Household Income Brackets in Magalia
With 781 households falling in the category, the $50,000 to $74,999 income range is the most frequent in Magalia, accounting for 21.4% of all households. In contrast, only 120 households (3.3%) fall into the $10,000 to $14,999 income bracket, making it the least populous group.
| Income Bracket | # Households | % Households |
| Less than $10,000 | 175 | 4.8% |
| $10,000 to $14,999 | 120 | 3.3% |
| $15,000 to $24,999 | 310 | 8.5% |
| $25,000 to $34,999 | 288 | 7.9% |
| $35,000 to $49,999 | 591 | 16.2% |
| $50,000 to $74,999 | 781 | 21.4% |
| $75,000 to $99,999 | 394 | 10.8% |
| $100,000 to $149,999 | 635 | 17.4% |
| $150,000 to $199,999 | 139 | 3.8% |
| $200,000+ | 215 | 5.9% |
Household Income by Householder Age in Magalia
The median household income in Magalia is $57,170, with the highest median household income of $81,887 found in the 25 to 44 years age bracket for the primary householder. A total of 645 households (17.7%) fall into this category. Meanwhile, the 65+ years age bracket for the primary householder has the lowest median household income of $39,509, with 1,431 households (39.2%) in this group.
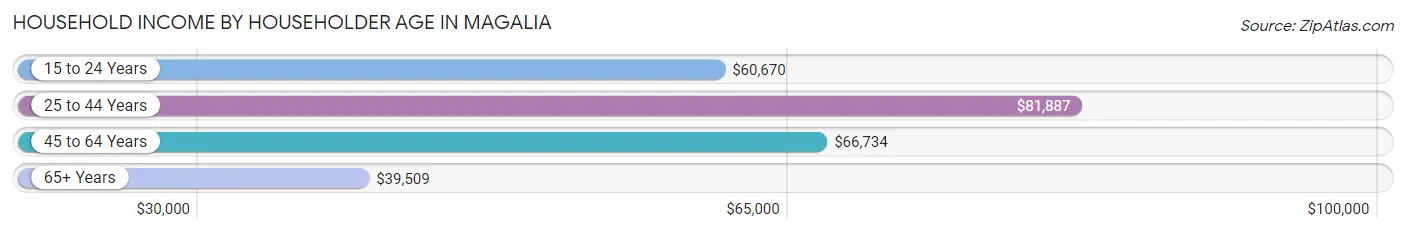
| Income Bracket | # Households | Median Income |
| 15 to 24 Years | 101 (2.8%) | $60,670 |
| 25 to 44 Years | 645 (17.7%) | $81,887 |
| 45 to 64 Years | 1,473 (40.4%) | $66,734 |
| 65+ Years | 1,431 (39.2%) | $39,509 |
| Total | 3,650 (100.0%) | $57,170 |
Poverty in Magalia
Income Below Poverty by Sex and Age in Magalia
With 12.0% poverty level for males and 10.5% for females among the residents of Magalia, 12 to 14 year old males and 6 to 11 year old females are the most vulnerable to poverty, with 55 males (47.0%) and 46 females (27.4%) in their respective age groups living below the poverty level.
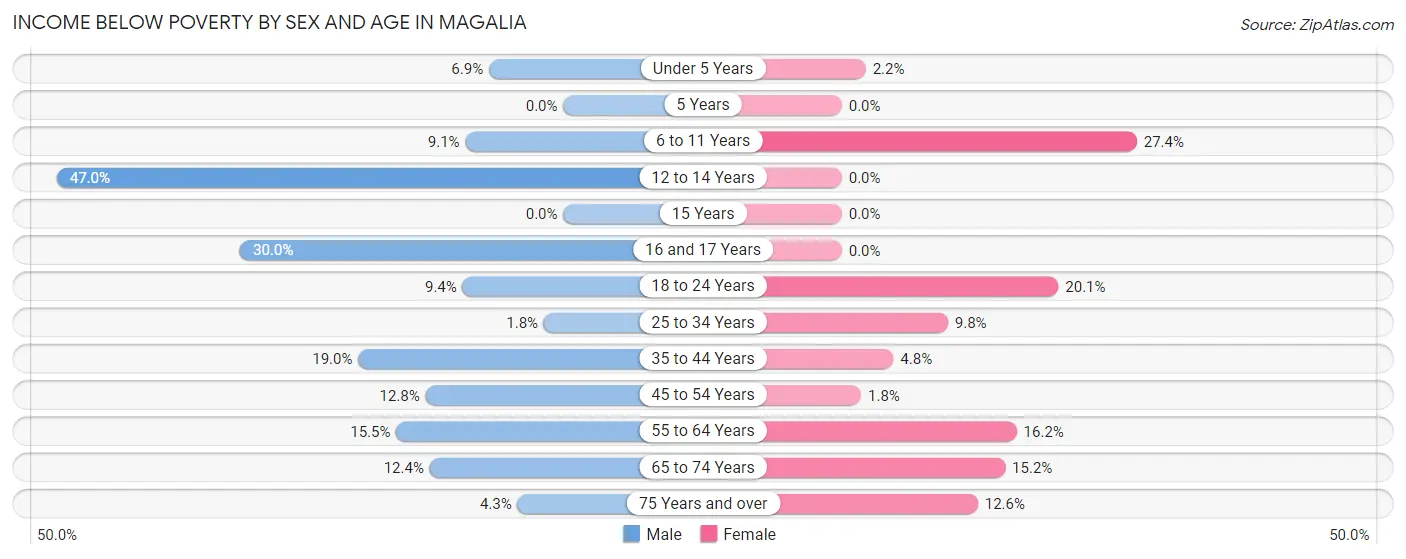
| Age Bracket | Male | Female |
| Under 5 Years | 22 (6.9%) | 7 (2.2%) |
| 5 Years | 0 (0.0%) | 0 (0.0%) |
| 6 to 11 Years | 17 (9.1%) | 46 (27.4%) |
| 12 to 14 Years | 55 (47.0%) | 0 (0.0%) |
| 15 Years | 0 (0.0%) | 0 (0.0%) |
| 16 and 17 Years | 18 (30.0%) | 0 (0.0%) |
| 18 to 24 Years | 30 (9.3%) | 79 (20.1%) |
| 25 to 34 Years | 9 (1.8%) | 49 (9.8%) |
| 35 to 44 Years | 86 (19.0%) | 15 (4.8%) |
| 45 to 54 Years | 67 (12.8%) | 13 (1.8%) |
| 55 to 64 Years | 126 (15.5%) | 118 (16.2%) |
| 65 to 74 Years | 95 (12.4%) | 112 (15.2%) |
| 75 Years and over | 11 (4.3%) | 51 (12.6%) |
| Total | 536 (12.0%) | 490 (10.5%) |
Income Above Poverty by Sex and Age in Magalia
According to the poverty statistics in Magalia, males aged 5 years and females aged 12 to 14 years are the age groups that are most secure financially, with 100.0% of males and 100.0% of females in these age groups living above the poverty line.
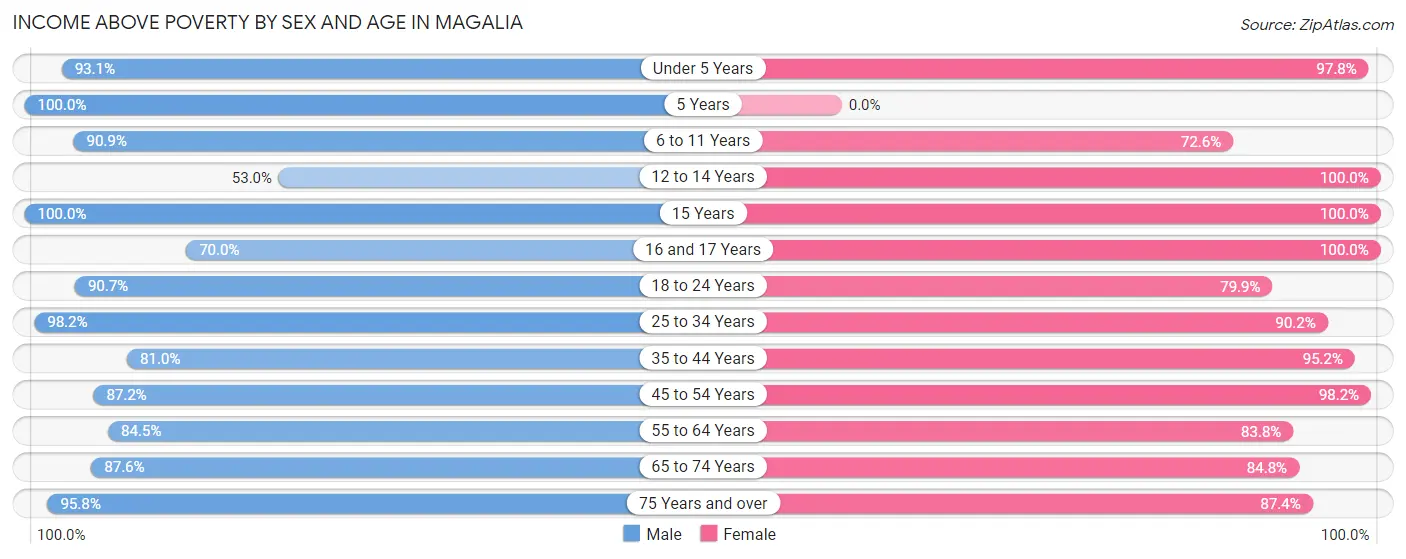
| Age Bracket | Male | Female |
| Under 5 Years | 297 (93.1%) | 309 (97.8%) |
| 5 Years | 86 (100.0%) | 0 (0.0%) |
| 6 to 11 Years | 170 (90.9%) | 122 (72.6%) |
| 12 to 14 Years | 62 (53.0%) | 176 (100.0%) |
| 15 Years | 52 (100.0%) | 65 (100.0%) |
| 16 and 17 Years | 42 (70.0%) | 152 (100.0%) |
| 18 to 24 Years | 291 (90.6%) | 314 (79.9%) |
| 25 to 34 Years | 492 (98.2%) | 449 (90.2%) |
| 35 to 44 Years | 366 (81.0%) | 298 (95.2%) |
| 45 to 54 Years | 457 (87.2%) | 713 (98.2%) |
| 55 to 64 Years | 687 (84.5%) | 609 (83.8%) |
| 65 to 74 Years | 671 (87.6%) | 627 (84.8%) |
| 75 Years and over | 248 (95.8%) | 353 (87.4%) |
| Total | 3,921 (88.0%) | 4,187 (89.5%) |
Income Below Poverty Among Married-Couple Families in Magalia
The poverty statistics for married-couple families in Magalia show that 1.3% or 20 of the total 1,563 families live below the poverty line. Families with 1 or 2 children have the highest poverty rate of 1.6%, comprising of 6 families. On the other hand, families with 3 or 4 children have the lowest poverty rate of 0.0%, which includes 0 families.
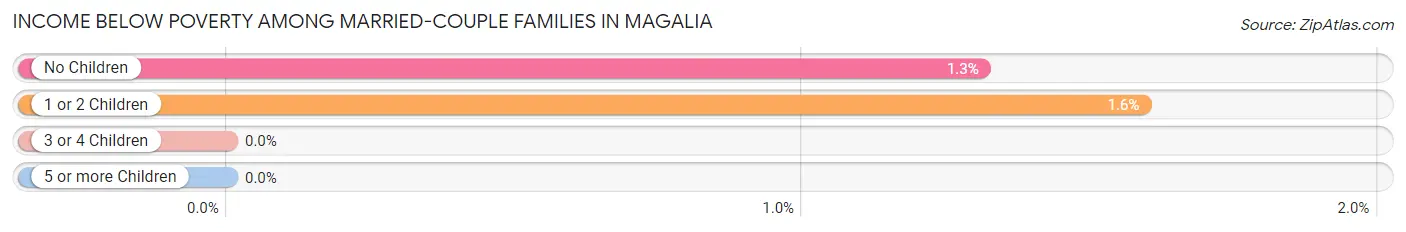
| Children | Above Poverty | Below Poverty |
| No Children | 1,054 (98.7%) | 14 (1.3%) |
| 1 or 2 Children | 372 (98.4%) | 6 (1.6%) |
| 3 or 4 Children | 117 (100.0%) | 0 (0.0%) |
| 5 or more Children | 0 (0.0%) | 0 (0.0%) |
| Total | 1,543 (98.7%) | 20 (1.3%) |
Income Below Poverty Among Single-Parent Households in Magalia
According to the poverty data in Magalia, 10.6% or 29 single-father households and 19.3% or 94 single-mother households are living below the poverty line. Among single-father households, those with 1 or 2 children have the highest poverty rate, with 29 households (24.8%) experiencing poverty. Likewise, among single-mother households, those with 3 or 4 children have the highest poverty rate, with 26 households (30.9%) falling below the poverty line.
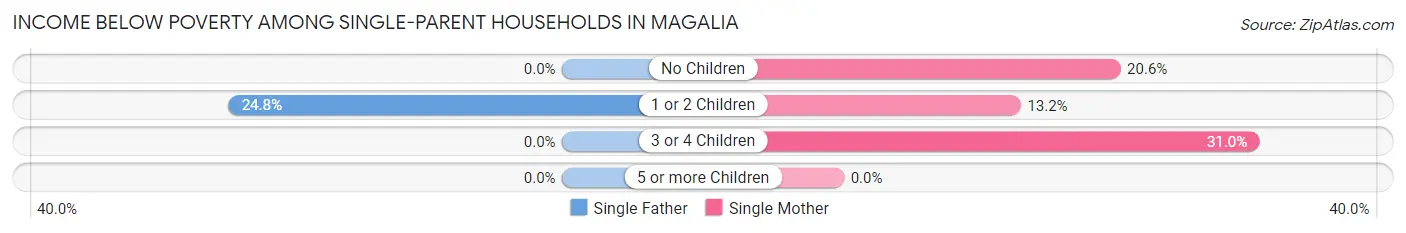
| Children | Single Father | Single Mother |
| No Children | 0 (0.0%) | 41 (20.6%) |
| 1 or 2 Children | 29 (24.8%) | 27 (13.2%) |
| 3 or 4 Children | 0 (0.0%) | 26 (30.9%) |
| 5 or more Children | 0 (0.0%) | 0 (0.0%) |
| Total | 29 (10.6%) | 94 (19.3%) |
Income Below Poverty Among Married-Couple vs Single-Parent Households in Magalia
The poverty data for Magalia shows that 20 of the married-couple family households (1.3%) and 123 of the single-parent households (16.1%) are living below the poverty level. Within the married-couple family households, those with 1 or 2 children have the highest poverty rate, with 6 households (1.6%) falling below the poverty line. Among the single-parent households, those with 3 or 4 children have the highest poverty rate, with 26 household (30.9%) living below poverty.
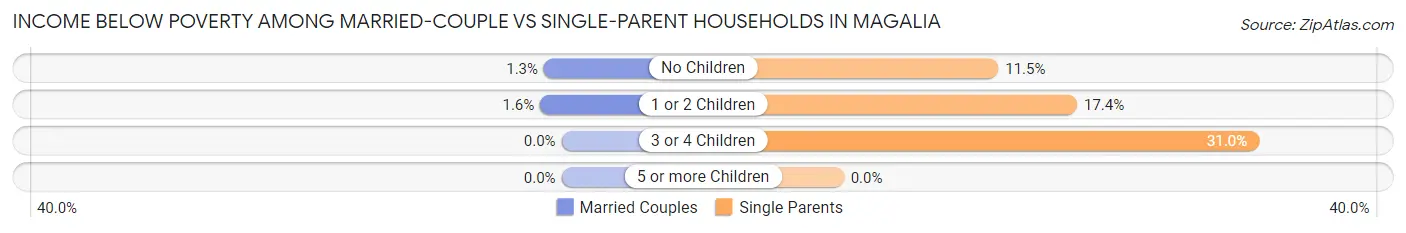
| Children | Married-Couple Families | Single-Parent Households |
| No Children | 14 (1.3%) | 41 (11.5%) |
| 1 or 2 Children | 6 (1.6%) | 56 (17.4%) |
| 3 or 4 Children | 0 (0.0%) | 26 (30.9%) |
| 5 or more Children | 0 (0.0%) | 0 (0.0%) |
| Total | 20 (1.3%) | 123 (16.1%) |
Race in Magalia
The most populous races in Magalia are White / Caucasian (7,257 | 78.5%), Two or more Races (1,304 | 14.1%), and Hispanic or Latino (954 | 10.3%).
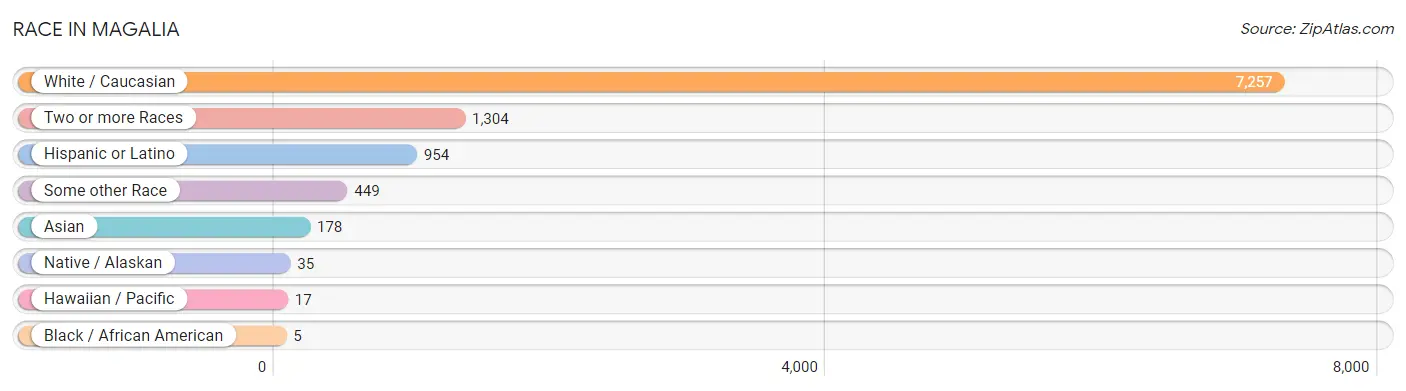
| Race | # Population | % Population |
| Asian | 178 | 1.9% |
| Black / African American | 5 | 0.1% |
| Hawaiian / Pacific | 17 | 0.2% |
| Hispanic or Latino | 954 | 10.3% |
| Native / Alaskan | 35 | 0.4% |
| White / Caucasian | 7,257 | 78.5% |
| Two or more Races | 1,304 | 14.1% |
| Some other Race | 449 | 4.9% |
| Total | 9,245 | 100.0% |
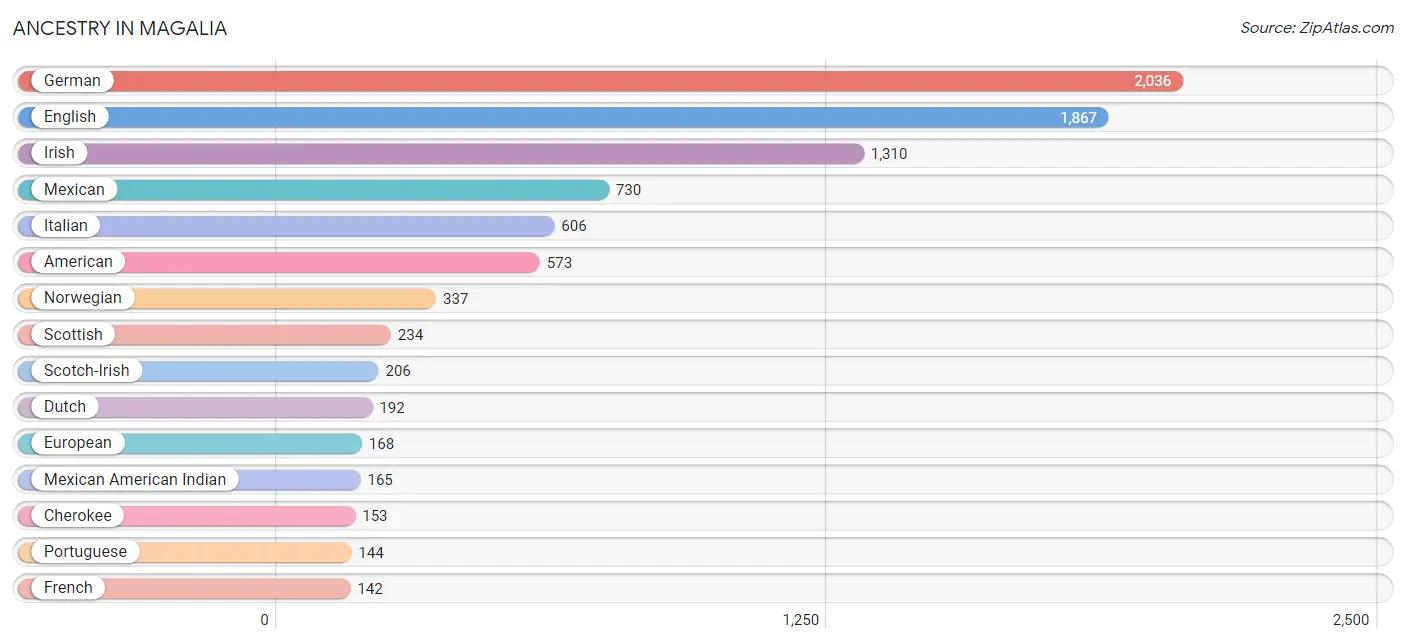
Ancestry in Magalia
The most populous ancestries reported in Magalia are German (2,036 | 22.0%), English (1,867 | 20.2%), Irish (1,310 | 14.2%), Mexican (730 | 7.9%), and Italian (606 | 6.6%), together accounting for 70.8% of all Magalia residents.
| Ancestry | # Population | % Population |
| American | 573 | 6.2% |
| Apache | 26 | 0.3% |
| Armenian | 136 | 1.5% |
| Australian | 18 | 0.2% |
| Bhutanese | 127 | 1.4% |
| Blackfeet | 86 | 0.9% |
| British | 17 | 0.2% |
| Burmese | 51 | 0.5% |
| Canadian | 58 | 0.6% |
| Central American | 9 | 0.1% |
| Cherokee | 153 | 1.7% |
| Choctaw | 29 | 0.3% |
| Czech | 32 | 0.4% |
| Czechoslovakian | 10 | 0.1% |
| Danish | 63 | 0.7% |
| Dutch | 192 | 2.1% |
| Eastern European | 37 | 0.4% |
| English | 1,867 | 20.2% |
| European | 168 | 1.8% |
| French | 142 | 1.5% |
| French Canadian | 43 | 0.5% |
| German | 2,036 | 22.0% |
| Greek | 113 | 1.2% |
| Guamanian / Chamorro | 17 | 0.2% |
| Hopi | 5 | 0.1% |
| Hungarian | 7 | 0.1% |
| Irish | 1,310 | 14.2% |
| Italian | 606 | 6.6% |
| Jamaican | 11 | 0.1% |
| Korean | 66 | 0.7% |
| Latvian | 10 | 0.1% |
| Lithuanian | 11 | 0.1% |
| Malaysian | 27 | 0.3% |
| Mexican | 730 | 7.9% |
| Mexican American Indian | 165 | 1.8% |
| Navajo | 137 | 1.5% |
| Nicaraguan | 9 | 0.1% |
| Northern European | 24 | 0.3% |
| Norwegian | 337 | 3.6% |
| Polish | 61 | 0.7% |
| Portuguese | 144 | 1.6% |
| Puerto Rican | 8 | 0.1% |
| Russian | 105 | 1.1% |
| Scotch-Irish | 206 | 2.2% |
| Scottish | 234 | 2.5% |
| Sioux | 24 | 0.3% |
| Spaniard | 133 | 1.4% |
| Spanish | 64 | 0.7% |
| Sri Lankan | 95 | 1.0% |
| Swedish | 36 | 0.4% |
| Swiss | 19 | 0.2% |
| Welsh | 57 | 0.6% | View All 52 Rows |
Immigrants in Magalia
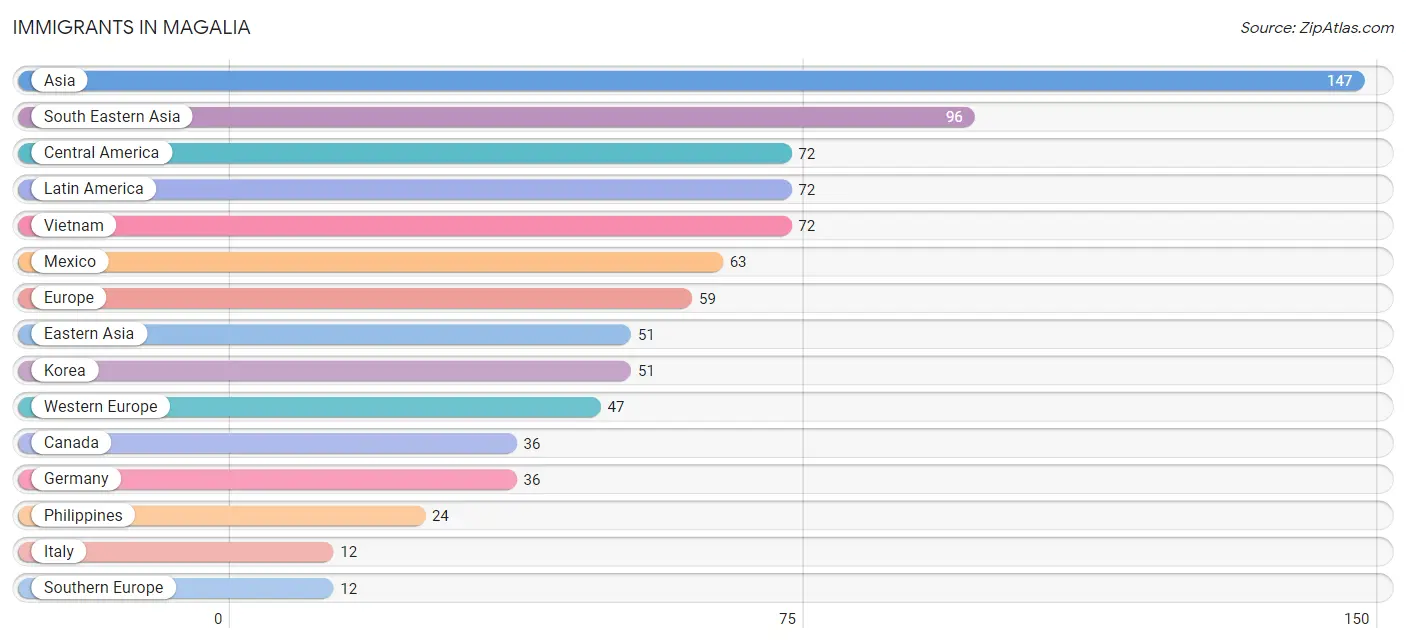
The most numerous immigrant groups reported in Magalia came from Asia (147 | 1.6%), South Eastern Asia (96 | 1.0%), Central America (72 | 0.8%), Latin America (72 | 0.8%), and Vietnam (72 | 0.8%), together accounting for 5.0% of all Magalia residents.
| Immigration Origin | # Population | % Population |
| Asia | 147 | 1.6% |
| Canada | 36 | 0.4% |
| Central America | 72 | 0.8% |
| Eastern Asia | 51 | 0.5% |
| Europe | 59 | 0.6% |
| Germany | 36 | 0.4% |
| Italy | 12 | 0.1% |
| Korea | 51 | 0.5% |
| Latin America | 72 | 0.8% |
| Mexico | 63 | 0.7% |
| Netherlands | 11 | 0.1% |
| Nicaragua | 9 | 0.1% |
| Philippines | 24 | 0.3% |
| South Eastern Asia | 96 | 1.0% |
| Southern Europe | 12 | 0.1% |
| Vietnam | 72 | 0.8% |
| Western Europe | 47 | 0.5% | View All 17 Rows |
Sex and Age in Magalia
Sex and Age in Magalia
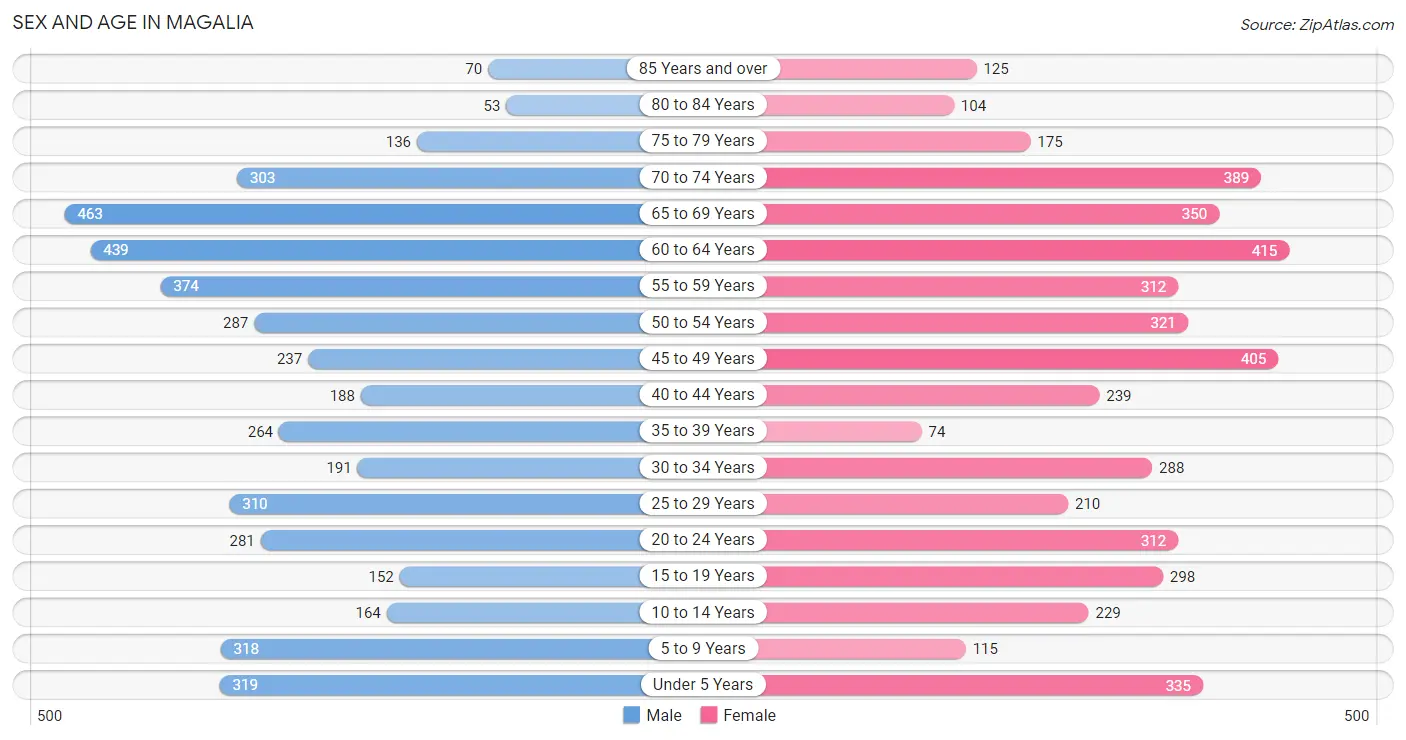
The most populous age groups in Magalia are 65 to 69 Years (463 | 10.2%) for men and 60 to 64 Years (415 | 8.8%) for women.
| Age Bracket | Male | Female |
| Under 5 Years | 319 (7.0%) | 335 (7.1%) |
| 5 to 9 Years | 318 (7.0%) | 115 (2.5%) |
| 10 to 14 Years | 164 (3.6%) | 229 (4.9%) |
| 15 to 19 Years | 152 (3.3%) | 298 (6.4%) |
| 20 to 24 Years | 281 (6.2%) | 312 (6.6%) |
| 25 to 29 Years | 310 (6.8%) | 210 (4.5%) |
| 30 to 34 Years | 191 (4.2%) | 288 (6.1%) |
| 35 to 39 Years | 264 (5.8%) | 74 (1.6%) |
| 40 to 44 Years | 188 (4.1%) | 239 (5.1%) |
| 45 to 49 Years | 237 (5.2%) | 405 (8.6%) |
| 50 to 54 Years | 287 (6.3%) | 321 (6.8%) |
| 55 to 59 Years | 374 (8.2%) | 312 (6.6%) |
| 60 to 64 Years | 439 (9.7%) | 415 (8.8%) |
| 65 to 69 Years | 463 (10.2%) | 350 (7.4%) |
| 70 to 74 Years | 303 (6.7%) | 389 (8.3%) |
| 75 to 79 Years | 136 (3.0%) | 175 (3.7%) |
| 80 to 84 Years | 53 (1.2%) | 104 (2.2%) |
| 85 Years and over | 70 (1.5%) | 125 (2.7%) |
| Total | 4,549 (100.0%) | 4,696 (100.0%) |
Families and Households in Magalia
Median Family Size in Magalia
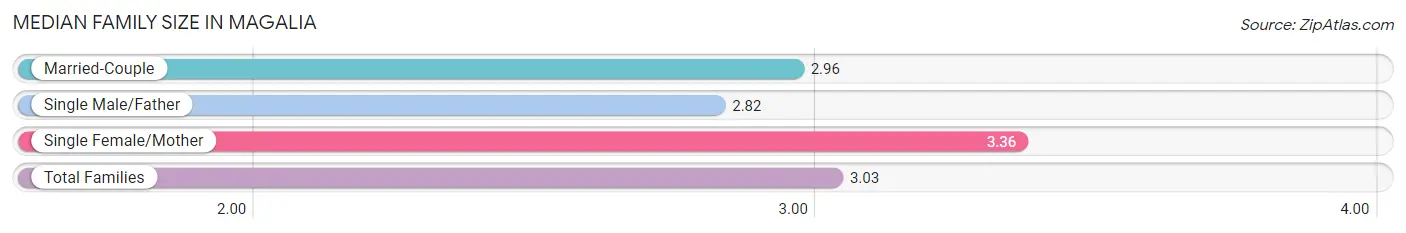
The median family size in Magalia is 3.03 persons per family, with single female/mother families (488 | 21.0%) accounting for the largest median family size of 3.36 persons per family. On the other hand, single male/father families (274 | 11.8%) represent the smallest median family size with 2.82 persons per family.
| Family Type | # Families | Family Size |
| Married-Couple | 1,563 (67.2%) | 2.96 |
| Single Male/Father | 274 (11.8%) | 2.82 |
| Single Female/Mother | 488 (21.0%) | 3.36 |
| Total Families | 2,325 (100.0%) | 3.03 |
Median Household Size in Magalia
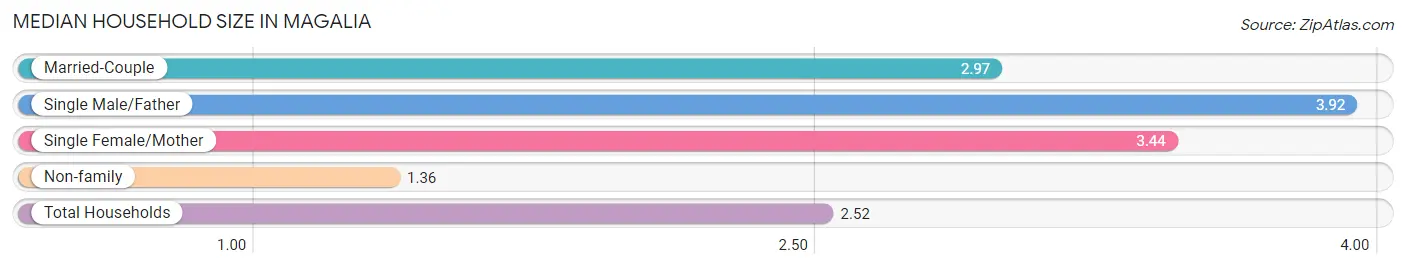
The median household size in Magalia is 2.52 persons per household, with single male/father households (274 | 7.5%) accounting for the largest median household size of 3.92 persons per household. non-family households (1,325 | 36.3%) represent the smallest median household size with 1.36 persons per household.
| Household Type | # Households | Household Size |
| Married-Couple | 1,563 (42.8%) | 2.97 |
| Single Male/Father | 274 (7.5%) | 3.92 |
| Single Female/Mother | 488 (13.4%) | 3.44 |
| Non-family | 1,325 (36.3%) | 1.36 |
| Total Households | 3,650 (100.0%) | 2.52 |
Household Size by Marriage Status in Magalia
Out of a total of 3,650 households in Magalia, 2,325 (63.7%) are family households, while 1,325 (36.3%) are nonfamily households. The most numerous type of family households are 2-person households, comprising 1,167, and the most common type of nonfamily households are 1-person households, comprising 825.
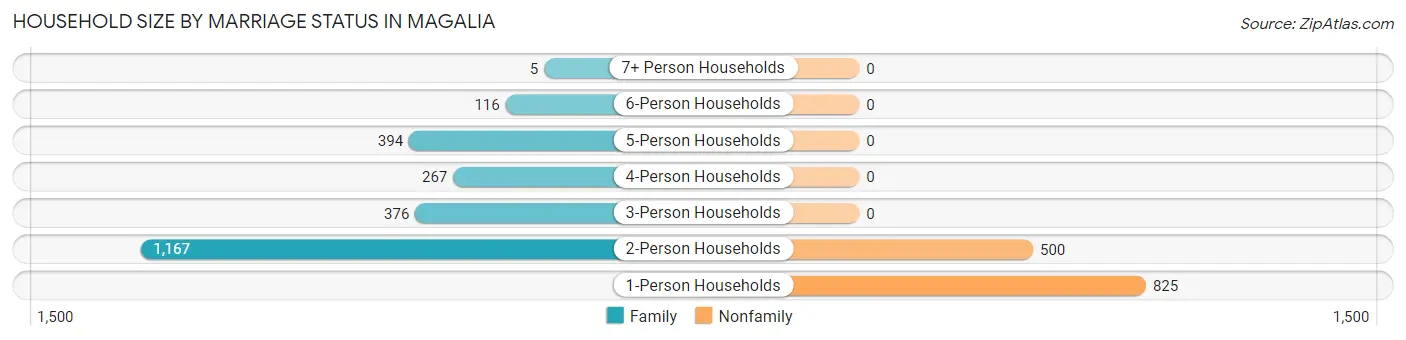
| Household Size | Family Households | Nonfamily Households |
| 1-Person Households | - | 825 (22.6%) |
| 2-Person Households | 1,167 (32.0%) | 500 (13.7%) |
| 3-Person Households | 376 (10.3%) | 0 (0.0%) |
| 4-Person Households | 267 (7.3%) | 0 (0.0%) |
| 5-Person Households | 394 (10.8%) | 0 (0.0%) |
| 6-Person Households | 116 (3.2%) | 0 (0.0%) |
| 7+ Person Households | 5 (0.1%) | 0 (0.0%) |
| Total | 2,325 (63.7%) | 1,325 (36.3%) |
Female Fertility in Magalia
Fertility by Age in Magalia
Average fertility rate in Magalia is 72.0 births per 1,000 women. Women in the age bracket of 20 to 34 years have the highest fertility rate with 120.0 births per 1,000 women. Women in the age bracket of 20 to 34 years acount for 69.8% of all women with births.
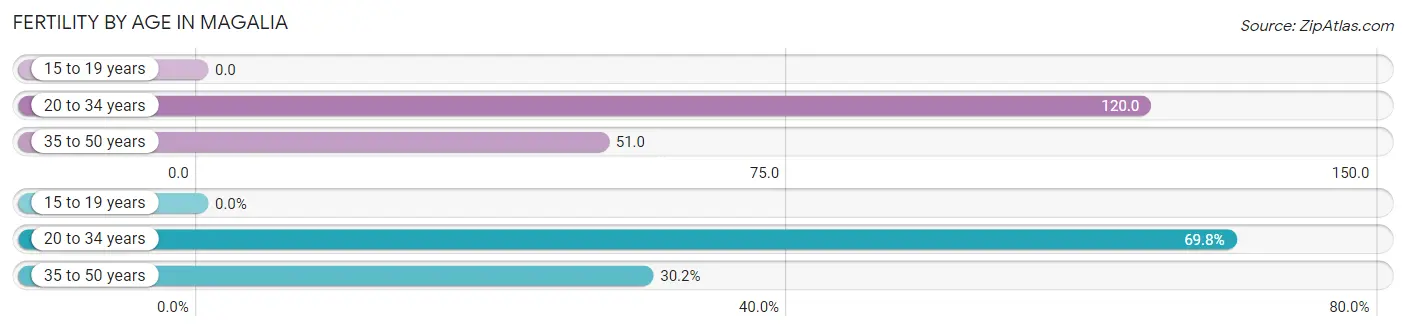
| Age Bracket | Women with Births | Births / 1,000 Women |
| 15 to 19 years | 0 (0.0%) | 0.0 |
| 20 to 34 years | 97 (69.8%) | 120.0 |
| 35 to 50 years | 42 (30.2%) | 51.0 |
| Total | 139 (100.0%) | 72.0 |
Fertility by Age by Marriage Status in Magalia
77.7% of women with births (139) in Magalia are married. The highest percentage of unmarried women with births falls into 35 to 50 years age bracket with 57.1% of them unmarried at the time of birth, while the lowest percentage of unmarried women with births belong to 20 to 34 years age bracket with 7.2% of them unmarried.
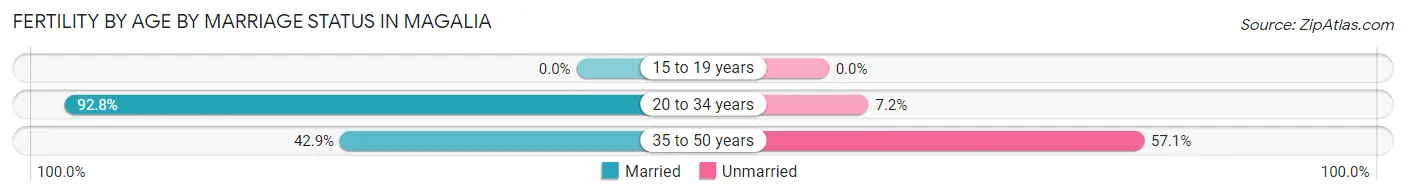
| Age Bracket | Married | Unmarried |
| 15 to 19 years | 0 (0.0%) | 0 (0.0%) |
| 20 to 34 years | 90 (92.8%) | 7 (7.2%) |
| 35 to 50 years | 18 (42.9%) | 24 (57.1%) |
| Total | 108 (77.7%) | 31 (22.3%) |
Fertility by Education in Magalia
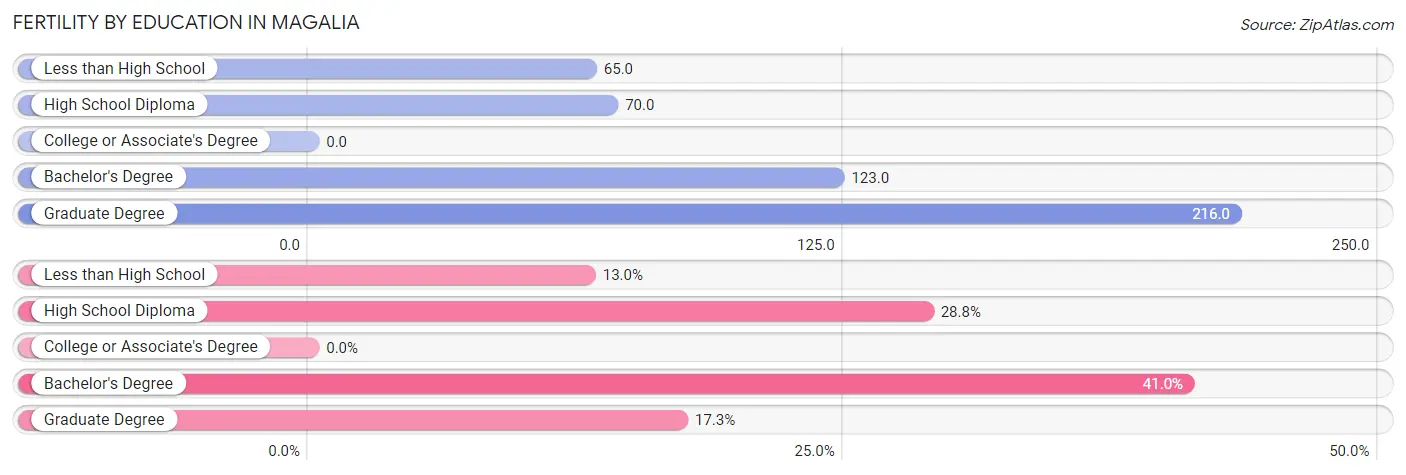
| Educational Attainment | Women with Births | Births / 1,000 Women |
| Less than High School | 18 (13.0%) | 65.0 |
| High School Diploma | 40 (28.8%) | 70.0 |
| College or Associate's Degree | 0 (0.0%) | 0.0 |
| Bachelor's Degree | 57 (41.0%) | 123.0 |
| Graduate Degree | 24 (17.3%) | 216.0 |
| Total | 139 (100.0%) | 72.0 |
Fertility by Education by Marriage Status in Magalia
22.3% of women with births in Magalia are unmarried. Women with the educational attainment of less than high school are most likely to be married with 100.0% of them married at childbirth, while women with the educational attainment of high school diploma are least likely to be married with 55.0% of them unmarried at childbirth.
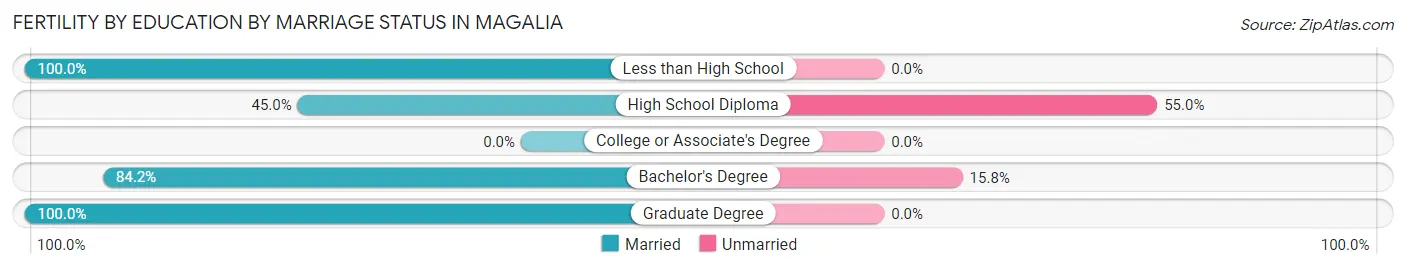
| Educational Attainment | Married | Unmarried |
| Less than High School | 18 (100.0%) | 0 (0.0%) |
| High School Diploma | 18 (45.0%) | 22 (55.0%) |
| College or Associate's Degree | 0 (0.0%) | 0 (0.0%) |
| Bachelor's Degree | 48 (84.2%) | 9 (15.8%) |
| Graduate Degree | 24 (100.0%) | 0 (0.0%) |
| Total | 108 (77.7%) | 31 (22.3%) |
Employment Characteristics in Magalia
Employment by Class of Employer in Magalia
Among the 3,229 employed individuals in Magalia, private company employees (1,919 | 59.4%), local government employees (382 | 11.8%), and not-for-profit organizations (268 | 8.3%) make up the most common classes of employment.
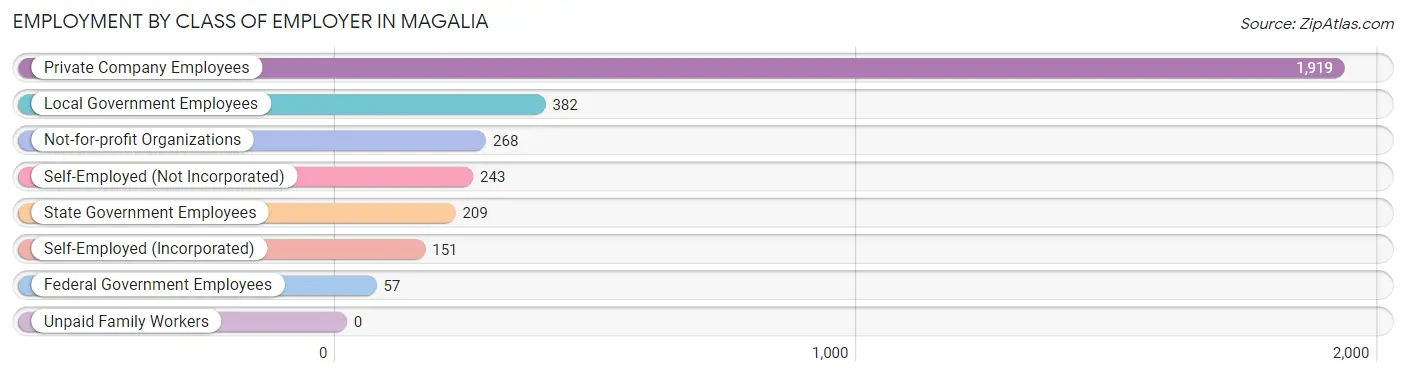
| Employer Class | # Employees | % Employees |
| Private Company Employees | 1,919 | 59.4% |
| Self-Employed (Incorporated) | 151 | 4.7% |
| Self-Employed (Not Incorporated) | 243 | 7.5% |
| Not-for-profit Organizations | 268 | 8.3% |
| Local Government Employees | 382 | 11.8% |
| State Government Employees | 209 | 6.5% |
| Federal Government Employees | 57 | 1.8% |
| Unpaid Family Workers | 0 | 0.0% |
| Total | 3,229 | 100.0% |
Employment Status by Age in Magalia
According to the labor force statistics for Magalia, out of the total population over 16 years of age (7,648), 47.8% or 3,656 individuals are in the labor force, with 8.0% or 292 of them unemployed. The age group with the highest labor force participation rate is 25 to 29 years, with 83.7% or 435 individuals in the labor force. Within the labor force, the 16 to 19 years age range has the highest percentage of unemployed individuals, with 21.8% or 22 of them being unemployed.
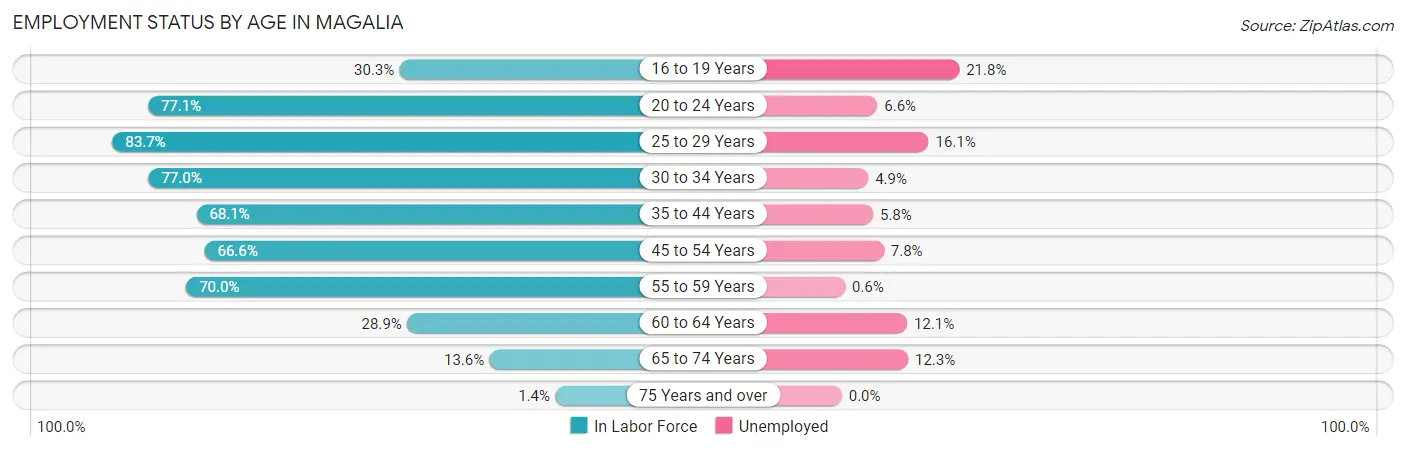
| Age Bracket | In Labor Force | Unemployed |
| 16 to 19 Years | 101 (30.3%) | 22 (21.8%) |
| 20 to 24 Years | 457 (77.1%) | 30 (6.6%) |
| 25 to 29 Years | 435 (83.7%) | 70 (16.1%) |
| 30 to 34 Years | 369 (77.0%) | 18 (4.9%) |
| 35 to 44 Years | 521 (68.1%) | 30 (5.8%) |
| 45 to 54 Years | 832 (66.6%) | 65 (7.8%) |
| 55 to 59 Years | 480 (70.0%) | 3 (0.6%) |
| 60 to 64 Years | 247 (28.9%) | 30 (12.1%) |
| 65 to 74 Years | 205 (13.6%) | 25 (12.3%) |
| 75 Years and over | 9 (1.4%) | 0 (0.0%) |
| Total | 3,656 (47.8%) | 292 (8.0%) |
Employment Status by Educational Attainment in Magalia
According to labor force statistics for Magalia, 63.4% of individuals (2,887) out of the total population between 25 and 64 years of age (4,554) are in the labor force, with 7.5% or 217 of them being unemployed. The group with the highest labor force participation rate are those with the educational attainment of bachelor's degree or higher, with 73.8% or 720 individuals in the labor force. Within the labor force, individuals with high school diploma education have the highest percentage of unemployment, with 12.2% or 116 of them being unemployed.
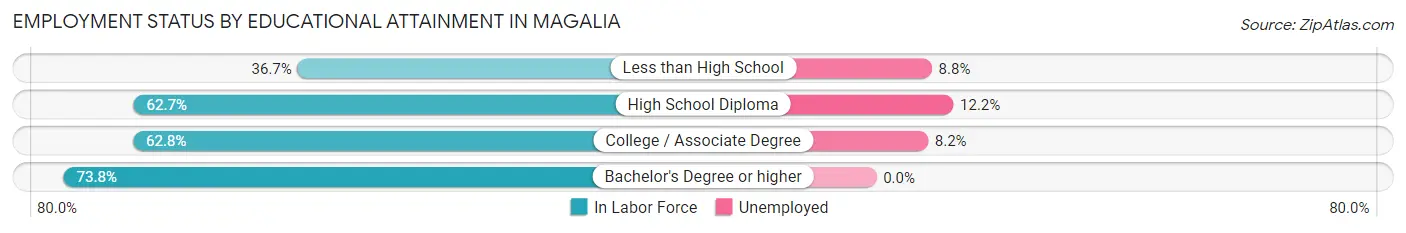
| Educational Attainment | In Labor Force | Unemployed |
| Less than High School | 114 (36.7%) | 27 (8.8%) |
| High School Diploma | 952 (62.7%) | 185 (12.2%) |
| College / Associate Degree | 1,099 (62.8%) | 143 (8.2%) |
| Bachelor's Degree or higher | 720 (73.8%) | 0 (0.0%) |
| Total | 2,887 (63.4%) | 342 (7.5%) |
Employment Occupations by Sex in Magalia
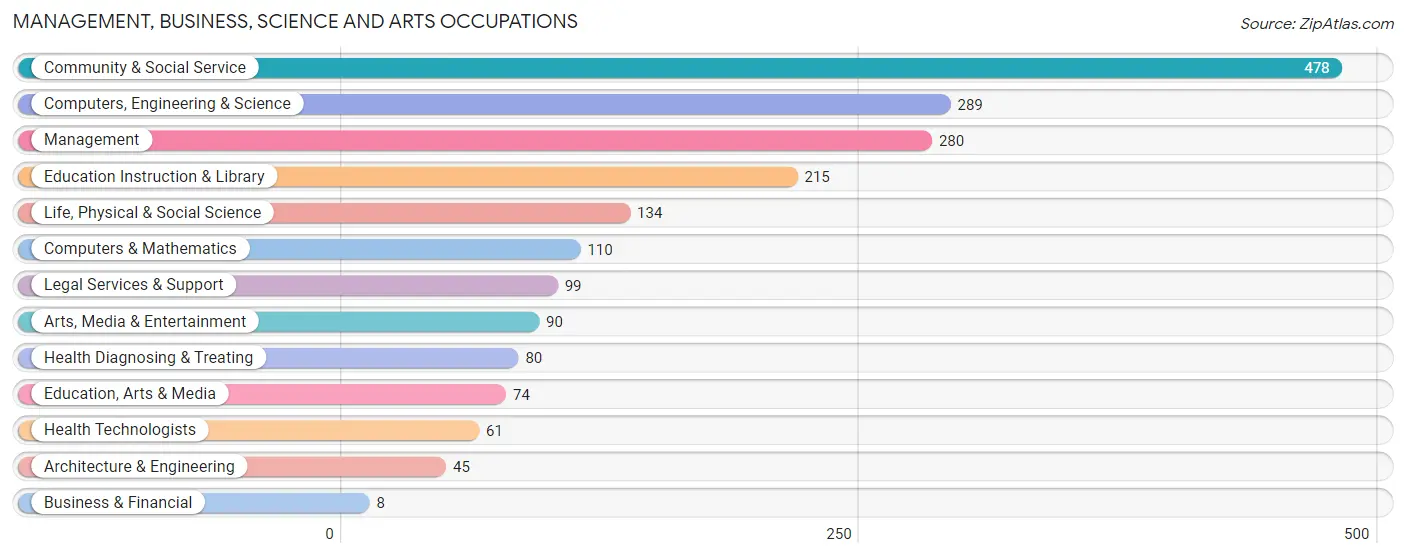
Management, Business, Science and Arts Occupations
The most common Management, Business, Science and Arts occupations in Magalia are Community & Social Service (478 | 14.2%), Computers, Engineering & Science (289 | 8.6%), Management (280 | 8.3%), Education Instruction & Library (215 | 6.4%), and Life, Physical & Social Science (134 | 4.0%).
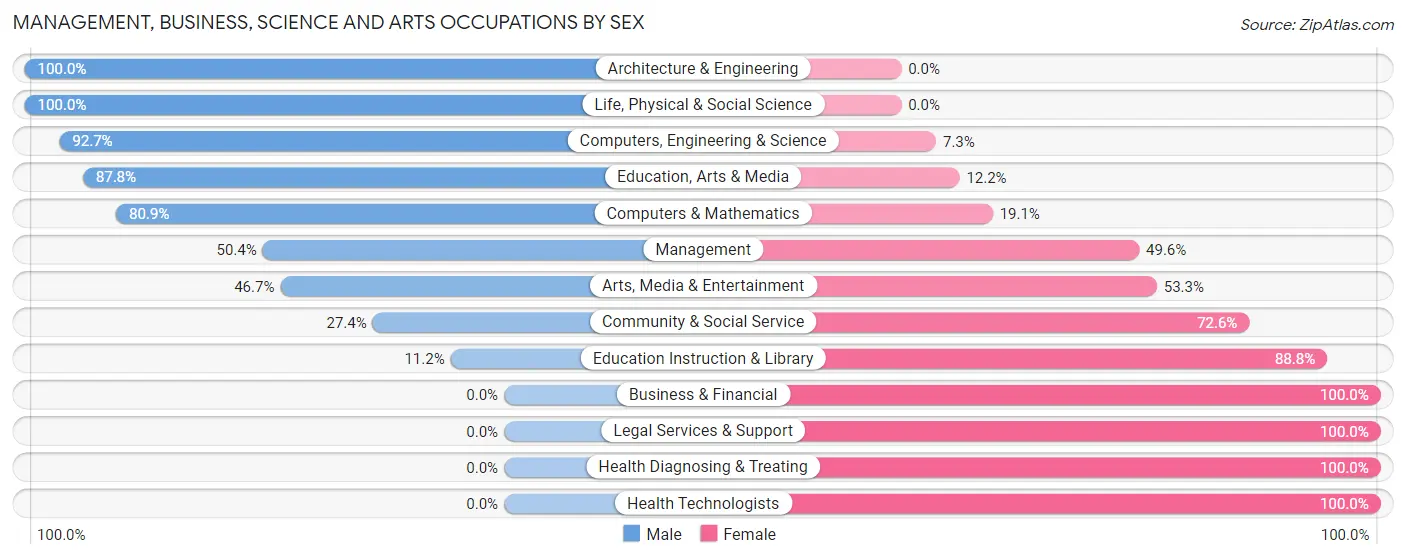
Management, Business, Science and Arts Occupations by Sex
Within the Management, Business, Science and Arts occupations in Magalia, the most male-oriented occupations are Architecture & Engineering (100.0%), Life, Physical & Social Science (100.0%), and Computers, Engineering & Science (92.7%), while the most female-oriented occupations are Business & Financial (100.0%), Legal Services & Support (100.0%), and Health Diagnosing & Treating (100.0%).
| Occupation | Male | Female |
| Management | 141 (50.4%) | 139 (49.6%) |
| Business & Financial | 0 (0.0%) | 8 (100.0%) |
| Computers, Engineering & Science | 268 (92.7%) | 21 (7.3%) |
| Computers & Mathematics | 89 (80.9%) | 21 (19.1%) |
| Architecture & Engineering | 45 (100.0%) | 0 (0.0%) |
| Life, Physical & Social Science | 134 (100.0%) | 0 (0.0%) |
| Community & Social Service | 131 (27.4%) | 347 (72.6%) |
| Education, Arts & Media | 65 (87.8%) | 9 (12.2%) |
| Legal Services & Support | 0 (0.0%) | 99 (100.0%) |
| Education Instruction & Library | 24 (11.2%) | 191 (88.8%) |
| Arts, Media & Entertainment | 42 (46.7%) | 48 (53.3%) |
| Health Diagnosing & Treating | 0 (0.0%) | 80 (100.0%) |
| Health Technologists | 0 (0.0%) | 61 (100.0%) |
| Total (Category) | 540 (47.6%) | 595 (52.4%) |
| Total (Overall) | 1,663 (49.5%) | 1,695 (50.5%) |
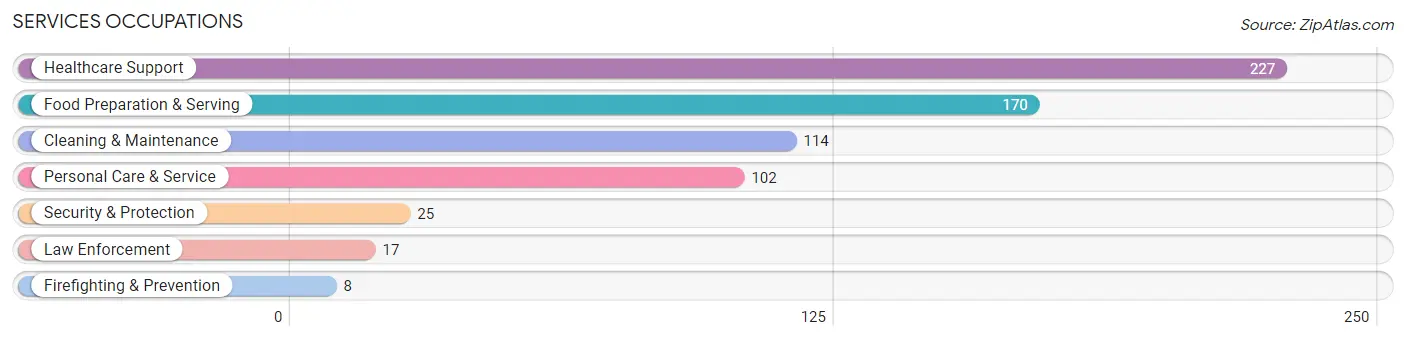
Services Occupations
The most common Services occupations in Magalia are Healthcare Support (227 | 6.8%), Food Preparation & Serving (170 | 5.1%), Cleaning & Maintenance (114 | 3.4%), Personal Care & Service (102 | 3.0%), and Security & Protection (25 | 0.7%).
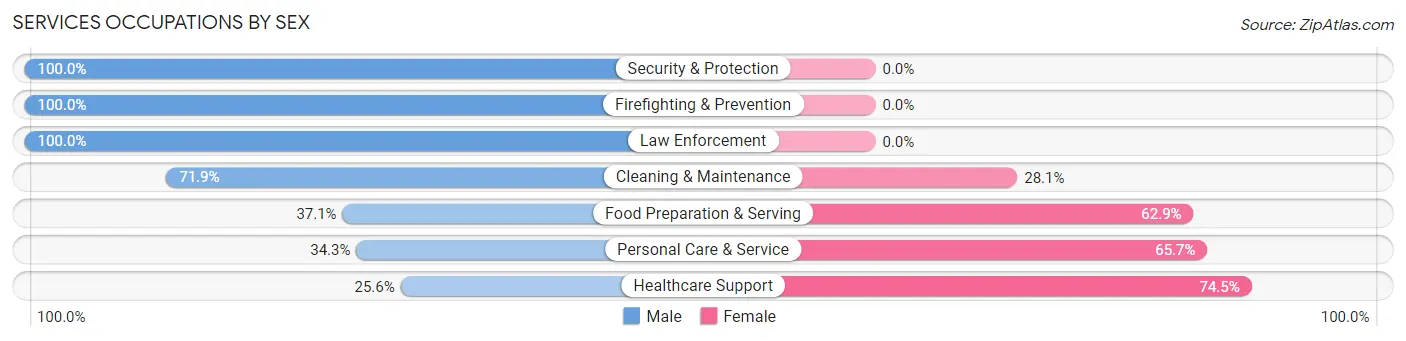
Services Occupations by Sex
Within the Services occupations in Magalia, the most male-oriented occupations are Security & Protection (100.0%), Firefighting & Prevention (100.0%), and Law Enforcement (100.0%), while the most female-oriented occupations are Healthcare Support (74.5%), Personal Care & Service (65.7%), and Food Preparation & Serving (62.9%).
| Occupation | Male | Female |
| Healthcare Support | 58 (25.6%) | 169 (74.5%) |
| Security & Protection | 25 (100.0%) | 0 (0.0%) |
| Firefighting & Prevention | 8 (100.0%) | 0 (0.0%) |
| Law Enforcement | 17 (100.0%) | 0 (0.0%) |
| Food Preparation & Serving | 63 (37.1%) | 107 (62.9%) |
| Cleaning & Maintenance | 82 (71.9%) | 32 (28.1%) |
| Personal Care & Service | 35 (34.3%) | 67 (65.7%) |
| Total (Category) | 263 (41.2%) | 375 (58.8%) |
| Total (Overall) | 1,663 (49.5%) | 1,695 (50.5%) |
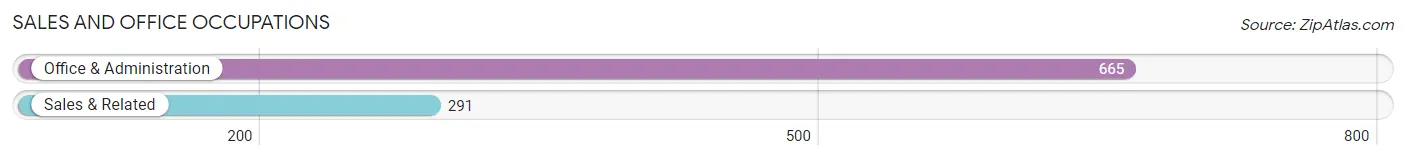
Sales and Office Occupations
The most common Sales and Office occupations in Magalia are Office & Administration (665 | 19.8%), and Sales & Related (291 | 8.7%).
Sales and Office Occupations by Sex
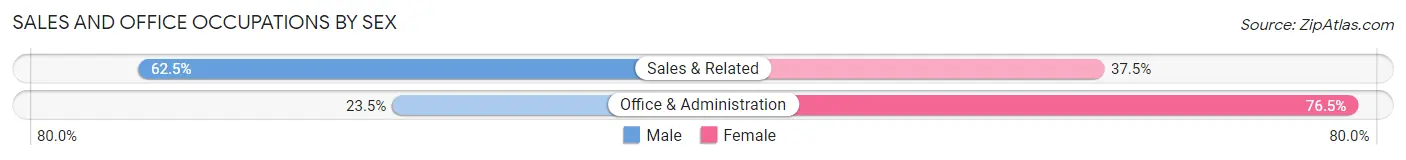
| Occupation | Male | Female |
| Sales & Related | 182 (62.5%) | 109 (37.5%) |
| Office & Administration | 156 (23.5%) | 509 (76.5%) |
| Total (Category) | 338 (35.4%) | 618 (64.6%) |
| Total (Overall) | 1,663 (49.5%) | 1,695 (50.5%) |
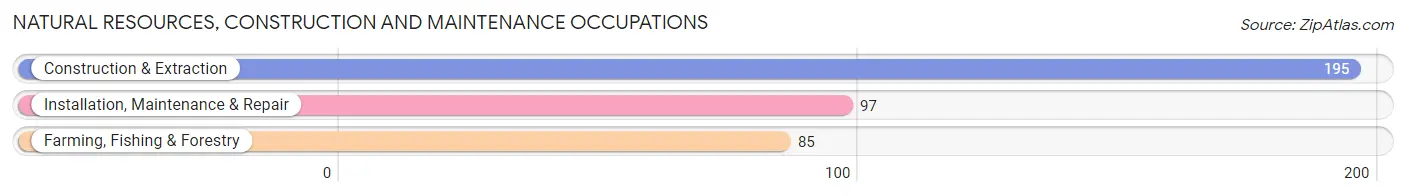
Natural Resources, Construction and Maintenance Occupations
The most common Natural Resources, Construction and Maintenance occupations in Magalia are Construction & Extraction (195 | 5.8%), Installation, Maintenance & Repair (97 | 2.9%), and Farming, Fishing & Forestry (85 | 2.5%).
Natural Resources, Construction and Maintenance Occupations by Sex
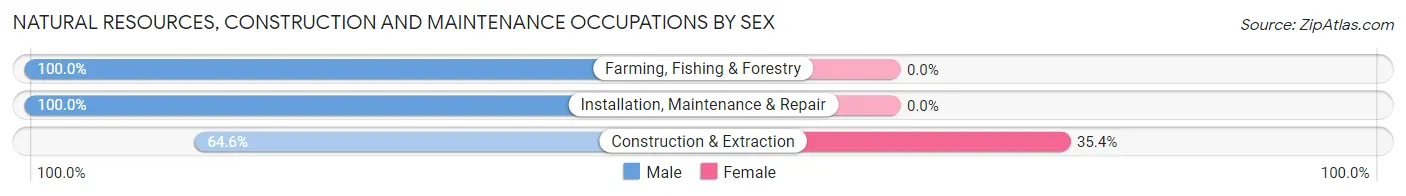
| Occupation | Male | Female |
| Farming, Fishing & Forestry | 85 (100.0%) | 0 (0.0%) |
| Construction & Extraction | 126 (64.6%) | 69 (35.4%) |
| Installation, Maintenance & Repair | 97 (100.0%) | 0 (0.0%) |
| Total (Category) | 308 (81.7%) | 69 (18.3%) |
| Total (Overall) | 1,663 (49.5%) | 1,695 (50.5%) |
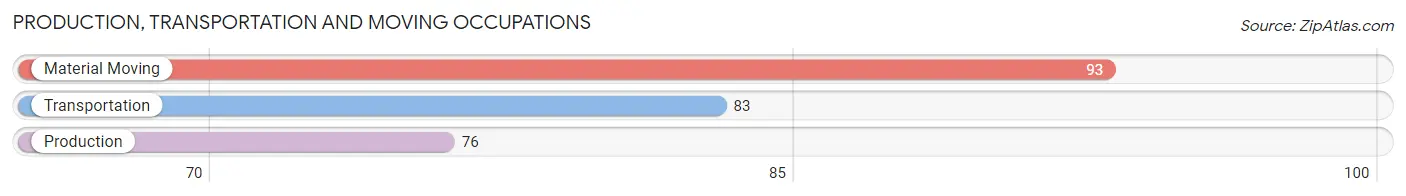
Production, Transportation and Moving Occupations
The most common Production, Transportation and Moving occupations in Magalia are Material Moving (93 | 2.8%), Transportation (83 | 2.5%), and Production (76 | 2.3%).
Production, Transportation and Moving Occupations by Sex
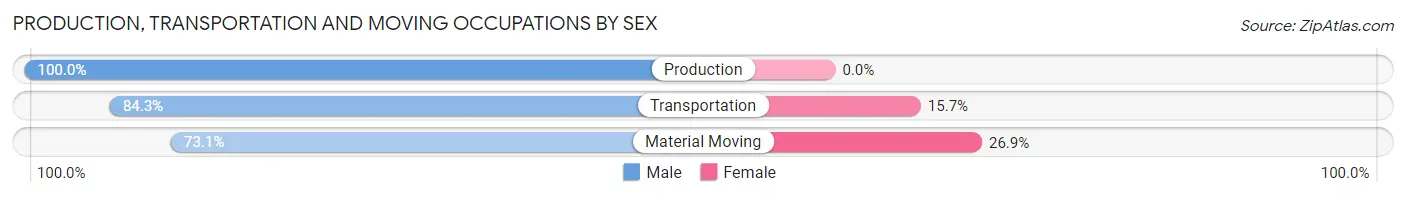
| Occupation | Male | Female |
| Production | 76 (100.0%) | 0 (0.0%) |
| Transportation | 70 (84.3%) | 13 (15.7%) |
| Material Moving | 68 (73.1%) | 25 (26.9%) |
| Total (Category) | 214 (84.9%) | 38 (15.1%) |
| Total (Overall) | 1,663 (49.5%) | 1,695 (50.5%) |
Employment Industries by Sex in Magalia
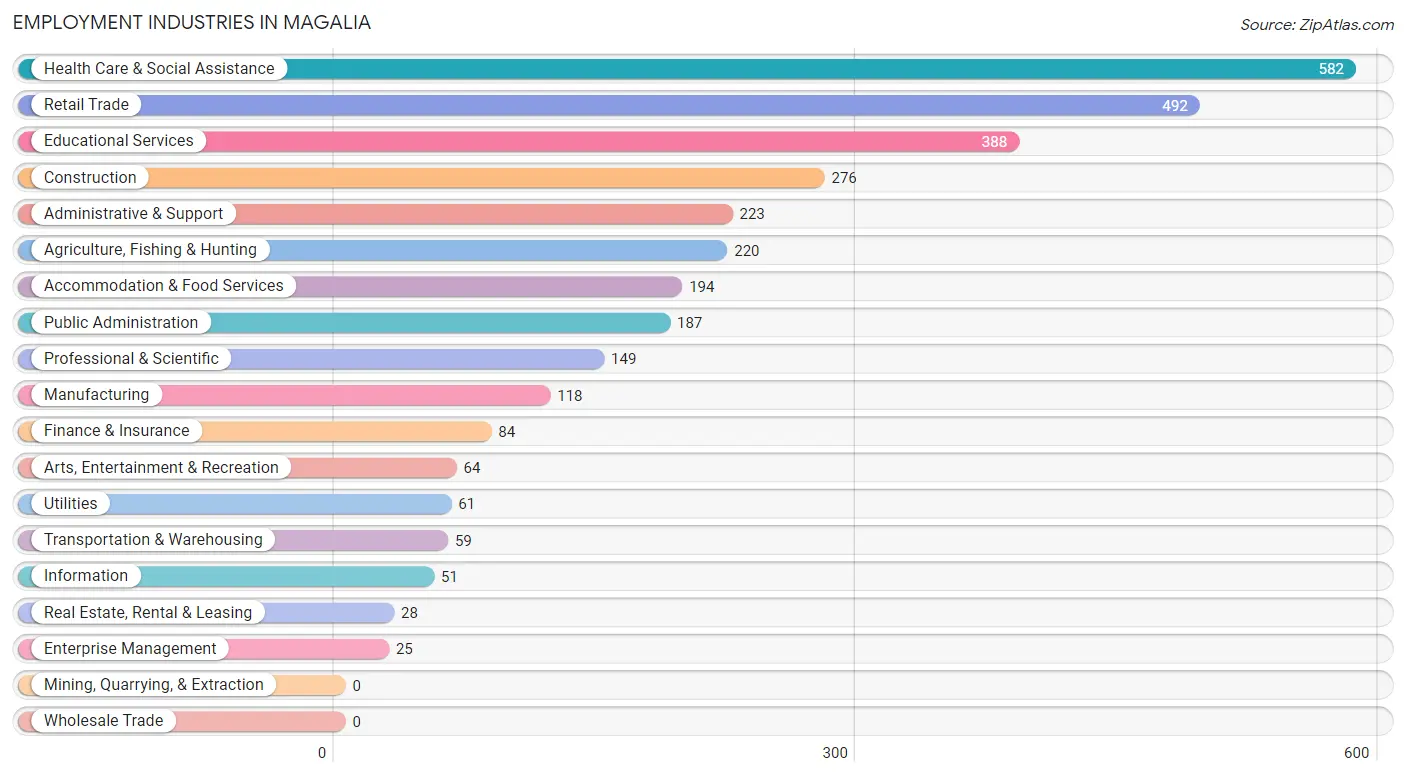
Employment Industries in Magalia
The major employment industries in Magalia include Health Care & Social Assistance (582 | 17.3%), Retail Trade (492 | 14.6%), Educational Services (388 | 11.6%), Construction (276 | 8.2%), and Administrative & Support (223 | 6.6%).
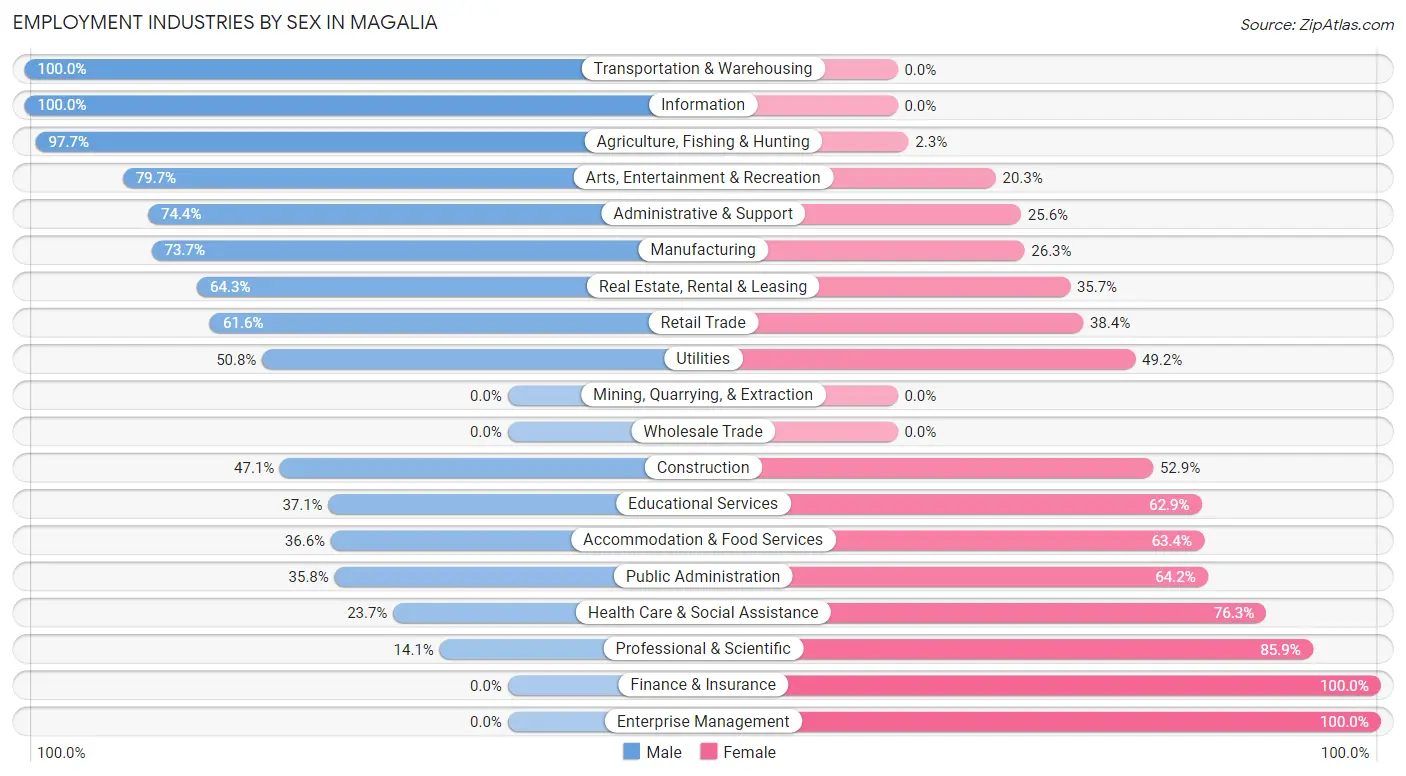
Employment Industries by Sex in Magalia
The Magalia industries that see more men than women are Transportation & Warehousing (100.0%), Information (100.0%), and Agriculture, Fishing & Hunting (97.7%), whereas the industries that tend to have a higher number of women are Finance & Insurance (100.0%), Enterprise Management (100.0%), and Professional & Scientific (85.9%).
| Industry | Male | Female |
| Agriculture, Fishing & Hunting | 215 (97.7%) | 5 (2.3%) |
| Mining, Quarrying, & Extraction | 0 (0.0%) | 0 (0.0%) |
| Construction | 130 (47.1%) | 146 (52.9%) |
| Manufacturing | 87 (73.7%) | 31 (26.3%) |
| Wholesale Trade | 0 (0.0%) | 0 (0.0%) |
| Retail Trade | 303 (61.6%) | 189 (38.4%) |
| Transportation & Warehousing | 59 (100.0%) | 0 (0.0%) |
| Utilities | 31 (50.8%) | 30 (49.2%) |
| Information | 51 (100.0%) | 0 (0.0%) |
| Finance & Insurance | 0 (0.0%) | 84 (100.0%) |
| Real Estate, Rental & Leasing | 18 (64.3%) | 10 (35.7%) |
| Professional & Scientific | 21 (14.1%) | 128 (85.9%) |
| Enterprise Management | 0 (0.0%) | 25 (100.0%) |
| Administrative & Support | 166 (74.4%) | 57 (25.6%) |
| Educational Services | 144 (37.1%) | 244 (62.9%) |
| Health Care & Social Assistance | 138 (23.7%) | 444 (76.3%) |
| Arts, Entertainment & Recreation | 51 (79.7%) | 13 (20.3%) |
| Accommodation & Food Services | 71 (36.6%) | 123 (63.4%) |
| Public Administration | 67 (35.8%) | 120 (64.2%) |
| Total | 1,663 (49.5%) | 1,695 (50.5%) |
Education in Magalia
School Enrollment in Magalia
The most common levels of schooling among the 1,686 students in Magalia are college / undergraduate (405 | 24.0%), high school (382 | 22.7%), and middle school (308 | 18.3%).
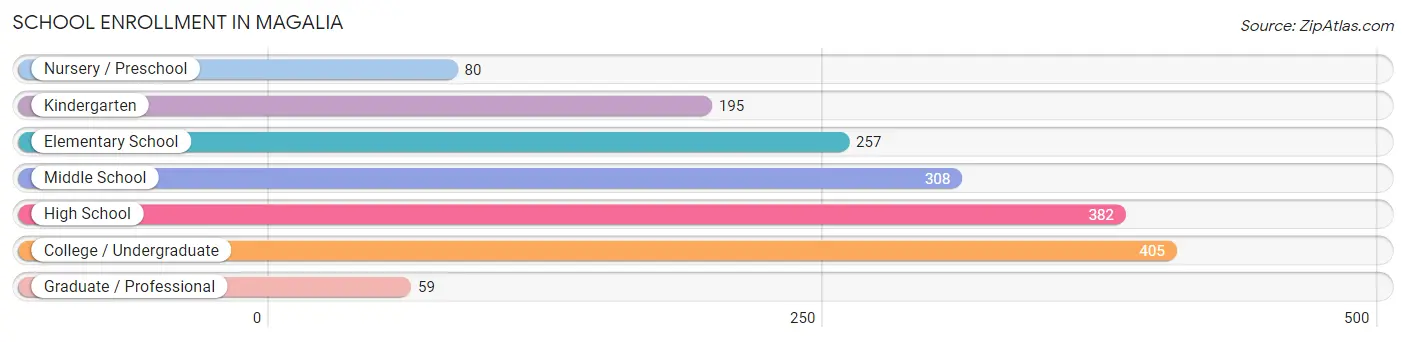
| School Level | # Students | % Students |
| Nursery / Preschool | 80 | 4.7% |
| Kindergarten | 195 | 11.6% |
| Elementary School | 257 | 15.2% |
| Middle School | 308 | 18.3% |
| High School | 382 | 22.7% |
| College / Undergraduate | 405 | 24.0% |
| Graduate / Professional | 59 | 3.5% |
| Total | 1,686 | 100.0% |
School Enrollment by Age by Funding Source in Magalia
Out of a total of 1,686 students who are enrolled in schools in Magalia, 98 (5.8%) attend a private institution, while the remaining 1,588 (94.2%) are enrolled in public schools. The age group of 3 to 4 year olds has the highest likelihood of being enrolled in private schools, with 57 (62.6% in the age bracket) enrolled. Conversely, the age group of 10 to 14 year olds has the lowest likelihood of being enrolled in a private school, with 363 (100.0% in the age bracket) attending a public institution.
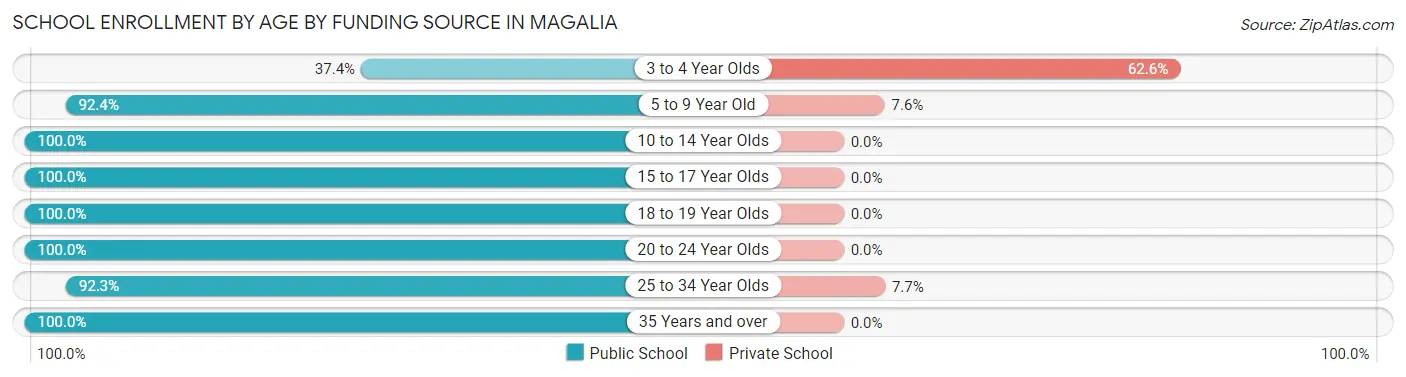
| Age Bracket | Public School | Private School |
| 3 to 4 Year Olds | 34 (37.4%) | 57 (62.6%) |
| 5 to 9 Year Old | 400 (92.4%) | 33 (7.6%) |
| 10 to 14 Year Olds | 363 (100.0%) | 0 (0.0%) |
| 15 to 17 Year Olds | 329 (100.0%) | 0 (0.0%) |
| 18 to 19 Year Olds | 111 (100.0%) | 0 (0.0%) |
| 20 to 24 Year Olds | 203 (100.0%) | 0 (0.0%) |
| 25 to 34 Year Olds | 96 (92.3%) | 8 (7.7%) |
| 35 Years and over | 52 (100.0%) | 0 (0.0%) |
| Total | 1,588 (94.2%) | 98 (5.8%) |
Educational Attainment by Field of Study in Magalia
Social sciences (310 | 22.5%), business (233 | 16.9%), arts & humanities (168 | 12.2%), liberal arts & history (147 | 10.7%), and science & technology (143 | 10.4%) are the most common fields of study among 1,376 individuals in Magalia who have obtained a bachelor's degree or higher.
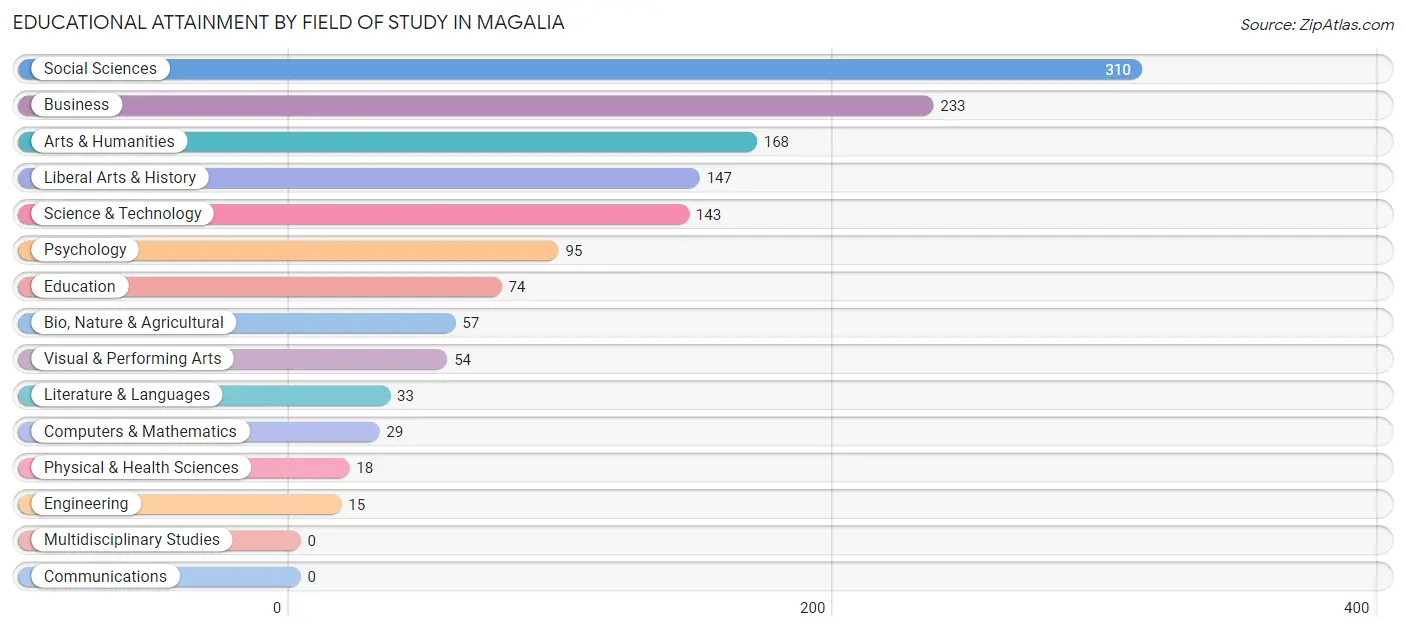
| Field of Study | # Graduates | % Graduates |
| Computers & Mathematics | 29 | 2.1% |
| Bio, Nature & Agricultural | 57 | 4.1% |
| Physical & Health Sciences | 18 | 1.3% |
| Psychology | 95 | 6.9% |
| Social Sciences | 310 | 22.5% |
| Engineering | 15 | 1.1% |
| Multidisciplinary Studies | 0 | 0.0% |
| Science & Technology | 143 | 10.4% |
| Business | 233 | 16.9% |
| Education | 74 | 5.4% |
| Literature & Languages | 33 | 2.4% |
| Liberal Arts & History | 147 | 10.7% |
| Visual & Performing Arts | 54 | 3.9% |
| Communications | 0 | 0.0% |
| Arts & Humanities | 168 | 12.2% |
| Total | 1,376 | 100.0% |
Transportation & Commute in Magalia
Vehicle Availability by Sex in Magalia
The most prevalent vehicle ownership categories in Magalia are males with 2 vehicles (742, accounting for 45.6%) and females with 2 vehicles (644, making up 47.7%).
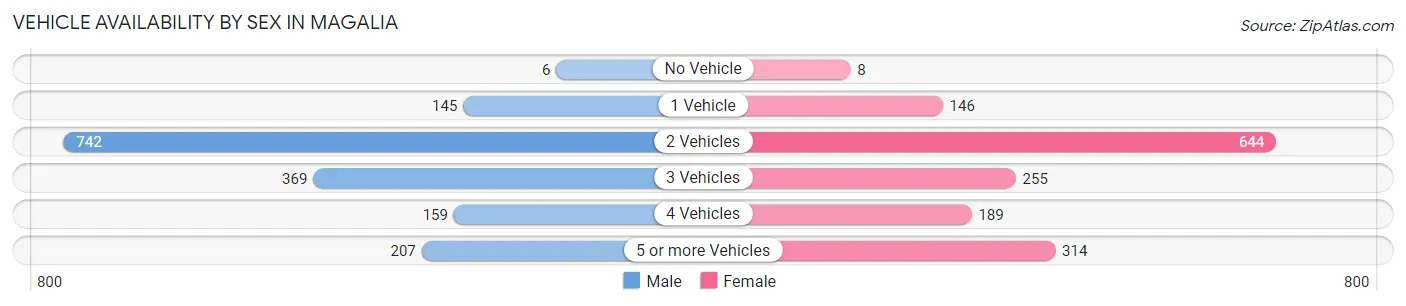
| Vehicles Available | Male | Female |
| No Vehicle | 6 (0.4%) | 8 (0.5%) |
| 1 Vehicle | 145 (8.9%) | 146 (9.4%) |
| 2 Vehicles | 742 (45.6%) | 644 (41.4%) |
| 3 Vehicles | 369 (22.7%) | 255 (16.4%) |
| 4 Vehicles | 159 (9.8%) | 189 (12.1%) |
| 5 or more Vehicles | 207 (12.7%) | 314 (20.2%) |
| Total | 1,628 (100.0%) | 1,556 (100.0%) |
Commute Time in Magalia
The most frequently occuring commute durations in Magalia are 30 to 34 minutes (513 commuters, 18.1%), 35 to 39 minutes (391 commuters, 13.8%), and 45 to 59 minutes (343 commuters, 12.1%).
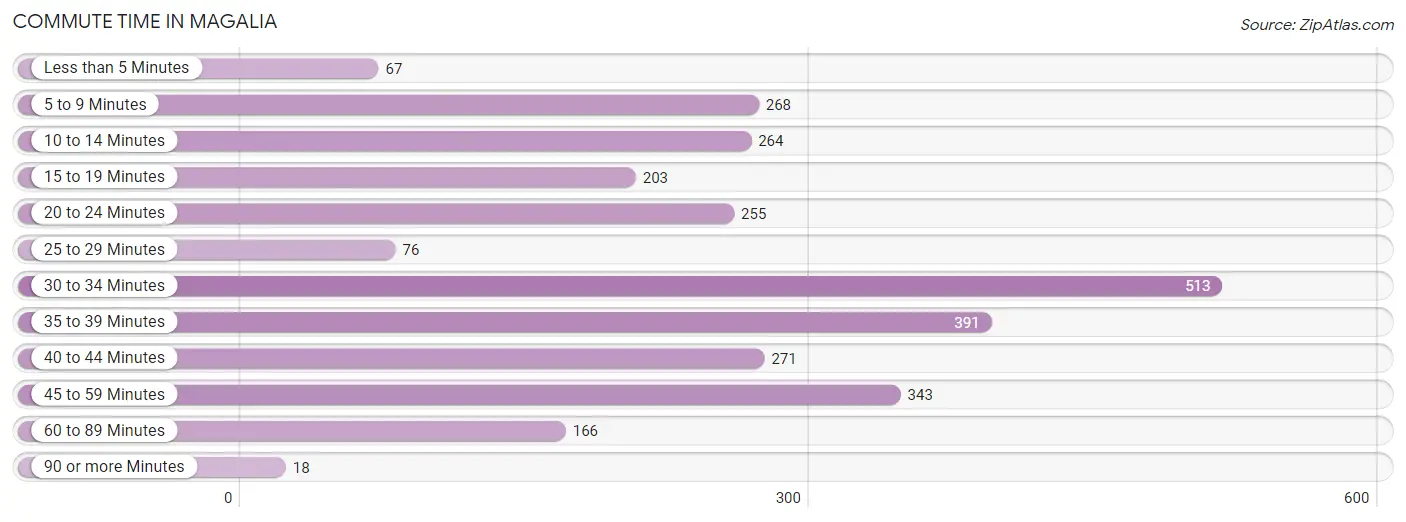
| Commute Time | # Commuters | % Commuters |
| Less than 5 Minutes | 67 | 2.4% |
| 5 to 9 Minutes | 268 | 9.5% |
| 10 to 14 Minutes | 264 | 9.3% |
| 15 to 19 Minutes | 203 | 7.2% |
| 20 to 24 Minutes | 255 | 9.0% |
| 25 to 29 Minutes | 76 | 2.7% |
| 30 to 34 Minutes | 513 | 18.1% |
| 35 to 39 Minutes | 391 | 13.8% |
| 40 to 44 Minutes | 271 | 9.6% |
| 45 to 59 Minutes | 343 | 12.1% |
| 60 to 89 Minutes | 166 | 5.9% |
| 90 or more Minutes | 18 | 0.6% |
Commute Time by Sex in Magalia
The most common commute times in Magalia are 30 to 34 minutes (241 commuters, 16.4%) for males and 30 to 34 minutes (272 commuters, 20.0%) for females.
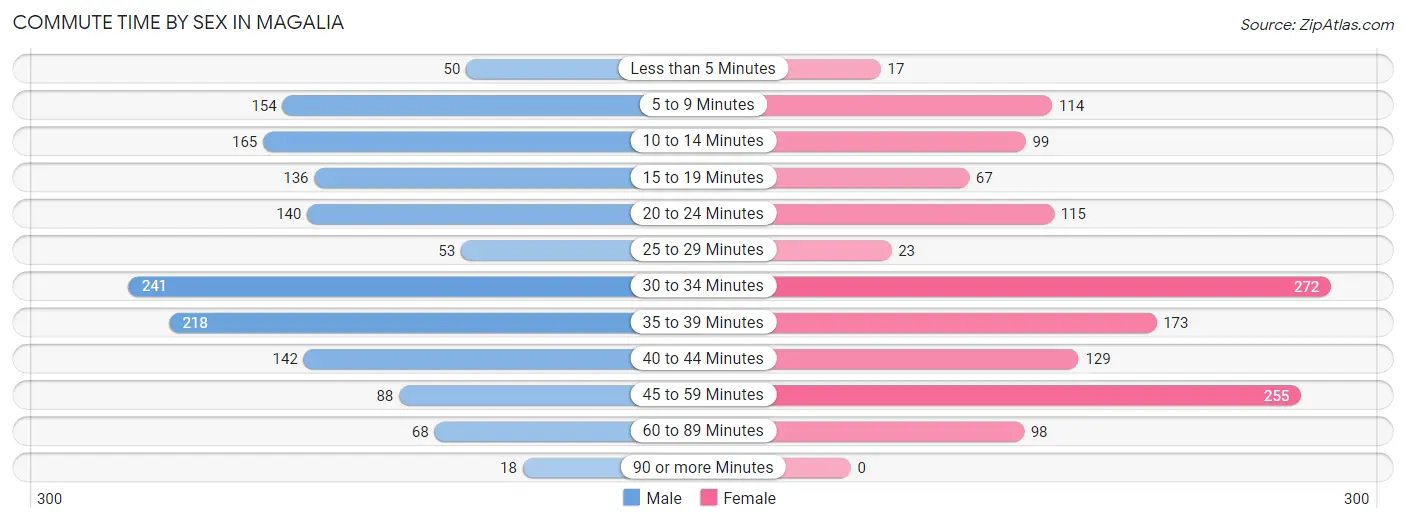
| Commute Time | Male | Female |
| Less than 5 Minutes | 50 (3.4%) | 17 (1.3%) |
| 5 to 9 Minutes | 154 (10.4%) | 114 (8.4%) |
| 10 to 14 Minutes | 165 (11.2%) | 99 (7.3%) |
| 15 to 19 Minutes | 136 (9.2%) | 67 (4.9%) |
| 20 to 24 Minutes | 140 (9.5%) | 115 (8.4%) |
| 25 to 29 Minutes | 53 (3.6%) | 23 (1.7%) |
| 30 to 34 Minutes | 241 (16.4%) | 272 (20.0%) |
| 35 to 39 Minutes | 218 (14.8%) | 173 (12.7%) |
| 40 to 44 Minutes | 142 (9.6%) | 129 (9.5%) |
| 45 to 59 Minutes | 88 (6.0%) | 255 (18.7%) |
| 60 to 89 Minutes | 68 (4.6%) | 98 (7.2%) |
| 90 or more Minutes | 18 (1.2%) | 0 (0.0%) |
Time of Departure to Work by Sex in Magalia
The most frequent times of departure to work in Magalia are 12:00 AM to 4:59 AM (220, 14.9%) for males and 8:00 AM to 8:29 AM (305, 22.4%) for females.
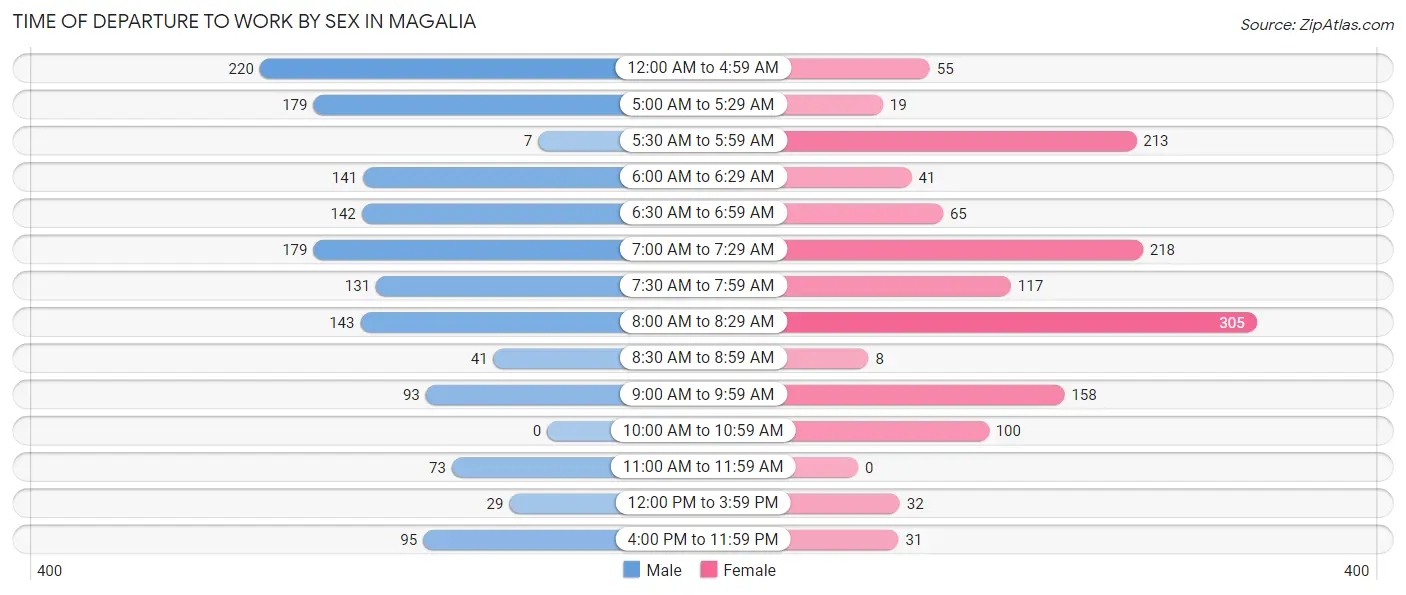
| Time of Departure | Male | Female |
| 12:00 AM to 4:59 AM | 220 (14.9%) | 55 (4.0%) |
| 5:00 AM to 5:29 AM | 179 (12.1%) | 19 (1.4%) |
| 5:30 AM to 5:59 AM | 7 (0.5%) | 213 (15.6%) |
| 6:00 AM to 6:29 AM | 141 (9.6%) | 41 (3.0%) |
| 6:30 AM to 6:59 AM | 142 (9.6%) | 65 (4.8%) |
| 7:00 AM to 7:29 AM | 179 (12.1%) | 218 (16.0%) |
| 7:30 AM to 7:59 AM | 131 (8.9%) | 117 (8.6%) |
| 8:00 AM to 8:29 AM | 143 (9.7%) | 305 (22.4%) |
| 8:30 AM to 8:59 AM | 41 (2.8%) | 8 (0.6%) |
| 9:00 AM to 9:59 AM | 93 (6.3%) | 158 (11.6%) |
| 10:00 AM to 10:59 AM | 0 (0.0%) | 100 (7.3%) |
| 11:00 AM to 11:59 AM | 73 (5.0%) | 0 (0.0%) |
| 12:00 PM to 3:59 PM | 29 (2.0%) | 32 (2.4%) |
| 4:00 PM to 11:59 PM | 95 (6.5%) | 31 (2.3%) |
| Total | 1,473 (100.0%) | 1,362 (100.0%) |
Housing Occupancy in Magalia
Occupancy by Ownership in Magalia
Of the total 3,650 dwellings in Magalia, owner-occupied units account for 2,977 (81.6%), while renter-occupied units make up 673 (18.4%).
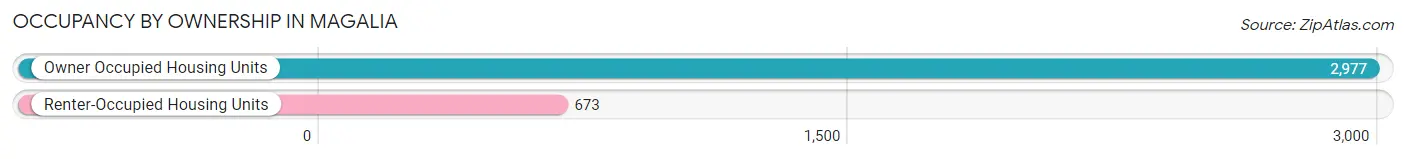
| Occupancy | # Housing Units | % Housing Units |
| Owner Occupied Housing Units | 2,977 | 81.6% |
| Renter-Occupied Housing Units | 673 | 18.4% |
| Total Occupied Housing Units | 3,650 | 100.0% |
Occupancy by Household Size in Magalia
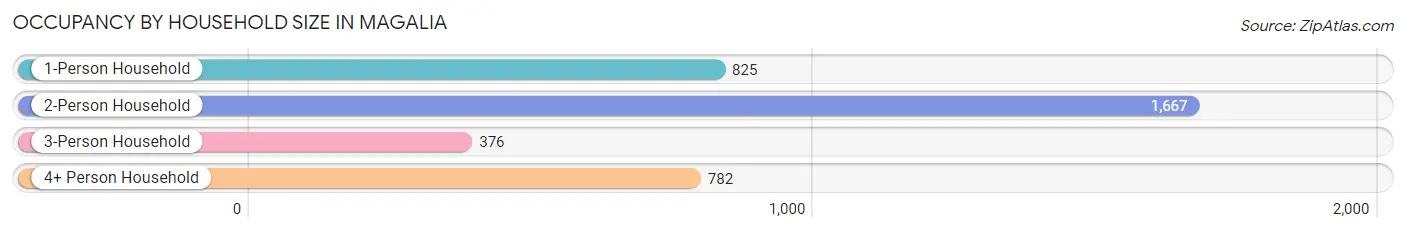
| Household Size | # Housing Units | % Housing Units |
| 1-Person Household | 825 | 22.6% |
| 2-Person Household | 1,667 | 45.7% |
| 3-Person Household | 376 | 10.3% |
| 4+ Person Household | 782 | 21.4% |
| Total Housing Units | 3,650 | 100.0% |
Occupancy by Ownership by Household Size in Magalia
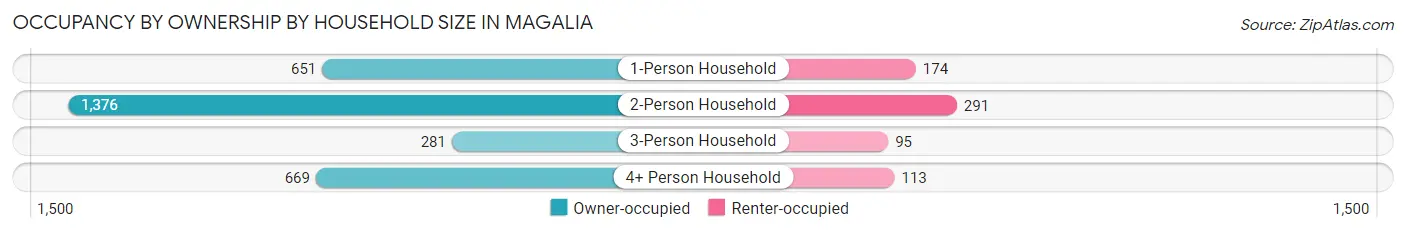
| Household Size | Owner-occupied | Renter-occupied |
| 1-Person Household | 651 (78.9%) | 174 (21.1%) |
| 2-Person Household | 1,376 (82.5%) | 291 (17.5%) |
| 3-Person Household | 281 (74.7%) | 95 (25.3%) |
| 4+ Person Household | 669 (85.6%) | 113 (14.4%) |
| Total Housing Units | 2,977 (81.6%) | 673 (18.4%) |
Occupancy by Educational Attainment in Magalia
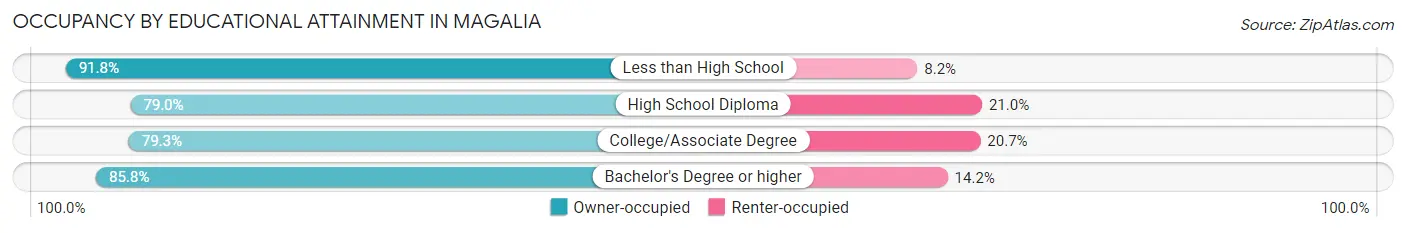
| Household Size | Owner-occupied | Renter-occupied |
| Less than High School | 270 (91.8%) | 24 (8.2%) |
| High School Diploma | 772 (79.0%) | 205 (21.0%) |
| College/Associate Degree | 1,305 (79.3%) | 340 (20.7%) |
| Bachelor's Degree or higher | 630 (85.8%) | 104 (14.2%) |
Occupancy by Age of Householder in Magalia
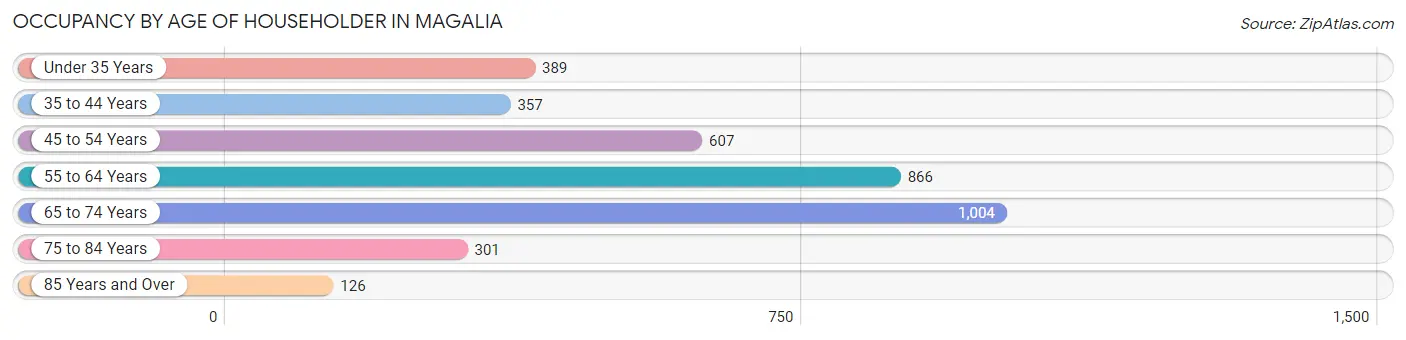
| Age Bracket | # Households | % Households |
| Under 35 Years | 389 | 10.7% |
| 35 to 44 Years | 357 | 9.8% |
| 45 to 54 Years | 607 | 16.6% |
| 55 to 64 Years | 866 | 23.7% |
| 65 to 74 Years | 1,004 | 27.5% |
| 75 to 84 Years | 301 | 8.3% |
| 85 Years and Over | 126 | 3.5% |
| Total | 3,650 | 100.0% |
Housing Finances in Magalia
Median Income by Occupancy in Magalia
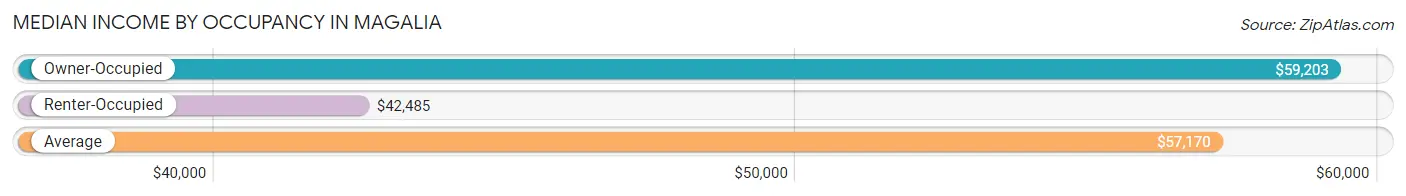
| Occupancy Type | # Households | Median Income |
| Owner-Occupied | 2,977 (81.6%) | $59,203 |
| Renter-Occupied | 673 (18.4%) | $42,485 |
| Average | 3,650 (100.0%) | $57,170 |
Occupancy by Householder Income Bracket in Magalia
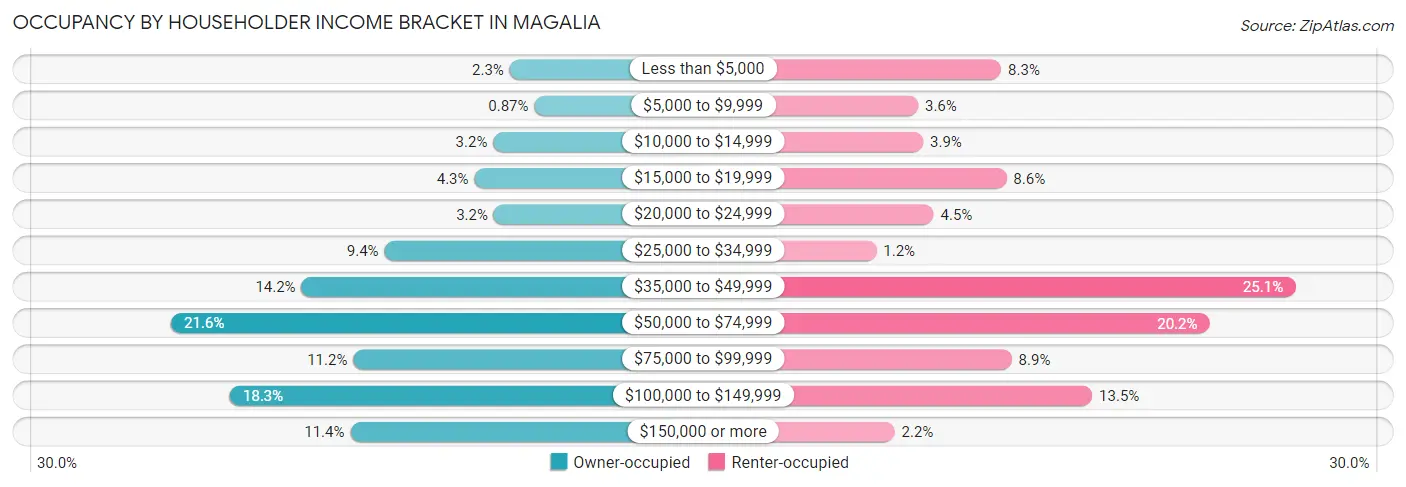
| Income Bracket | Owner-occupied | Renter-occupied |
| Less than $5,000 | 68 (2.3%) | 56 (8.3%) |
| $5,000 to $9,999 | 26 (0.9%) | 24 (3.6%) |
| $10,000 to $14,999 | 96 (3.2%) | 26 (3.9%) |
| $15,000 to $19,999 | 128 (4.3%) | 58 (8.6%) |
| $20,000 to $24,999 | 95 (3.2%) | 30 (4.5%) |
| $25,000 to $34,999 | 281 (9.4%) | 8 (1.2%) |
| $35,000 to $49,999 | 422 (14.2%) | 169 (25.1%) |
| $50,000 to $74,999 | 644 (21.6%) | 136 (20.2%) |
| $75,000 to $99,999 | 334 (11.2%) | 60 (8.9%) |
| $100,000 to $149,999 | 544 (18.3%) | 91 (13.5%) |
| $150,000 or more | 339 (11.4%) | 15 (2.2%) |
| Total | 2,977 (100.0%) | 673 (100.0%) |
Monthly Housing Cost Tiers in Magalia
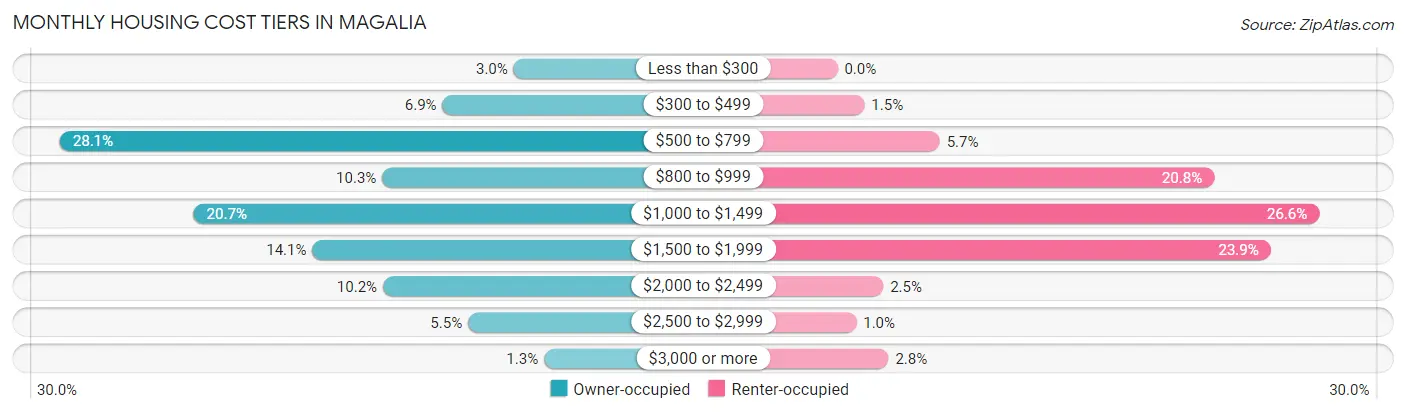
| Monthly Cost | Owner-occupied | Renter-occupied |
| Less than $300 | 89 (3.0%) | 0 (0.0%) |
| $300 to $499 | 206 (6.9%) | 10 (1.5%) |
| $500 to $799 | 835 (28.1%) | 38 (5.7%) |
| $800 to $999 | 305 (10.2%) | 140 (20.8%) |
| $1,000 to $1,499 | 615 (20.7%) | 179 (26.6%) |
| $1,500 to $1,999 | 420 (14.1%) | 161 (23.9%) |
| $2,000 to $2,499 | 304 (10.2%) | 17 (2.5%) |
| $2,500 to $2,999 | 164 (5.5%) | 7 (1.0%) |
| $3,000 or more | 39 (1.3%) | 19 (2.8%) |
| Total | 2,977 (100.0%) | 673 (100.0%) |
Physical Housing Characteristics in Magalia
Housing Structures in Magalia
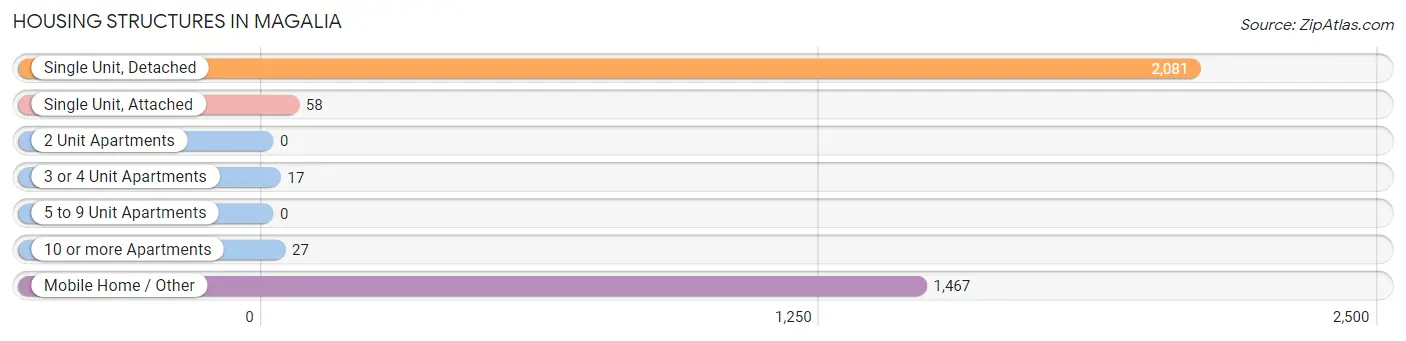
| Structure Type | # Housing Units | % Housing Units |
| Single Unit, Detached | 2,081 | 57.0% |
| Single Unit, Attached | 58 | 1.6% |
| 2 Unit Apartments | 0 | 0.0% |
| 3 or 4 Unit Apartments | 17 | 0.5% |
| 5 to 9 Unit Apartments | 0 | 0.0% |
| 10 or more Apartments | 27 | 0.7% |
| Mobile Home / Other | 1,467 | 40.2% |
| Total | 3,650 | 100.0% |
Housing Structures by Occupancy in Magalia
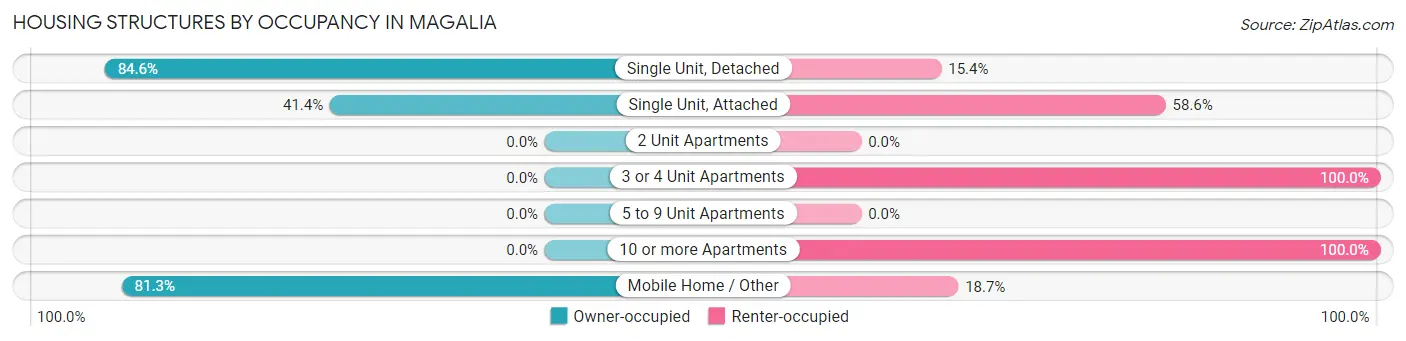
| Structure Type | Owner-occupied | Renter-occupied |
| Single Unit, Detached | 1,760 (84.6%) | 321 (15.4%) |
| Single Unit, Attached | 24 (41.4%) | 34 (58.6%) |
| 2 Unit Apartments | 0 (0.0%) | 0 (0.0%) |
| 3 or 4 Unit Apartments | 0 (0.0%) | 17 (100.0%) |
| 5 to 9 Unit Apartments | 0 (0.0%) | 0 (0.0%) |
| 10 or more Apartments | 0 (0.0%) | 27 (100.0%) |
| Mobile Home / Other | 1,193 (81.3%) | 274 (18.7%) |
| Total | 2,977 (81.6%) | 673 (18.4%) |
Housing Structures by Number of Rooms in Magalia
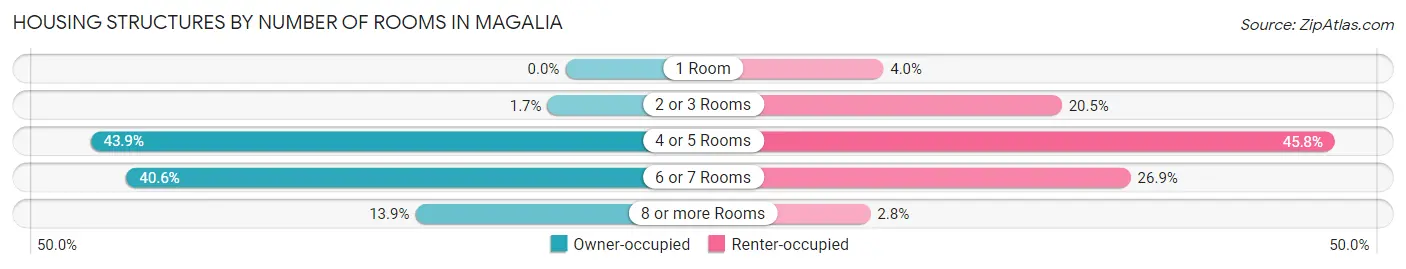
| Number of Rooms | Owner-occupied | Renter-occupied |
| 1 Room | 0 (0.0%) | 27 (4.0%) |
| 2 or 3 Rooms | 49 (1.7%) | 138 (20.5%) |
| 4 or 5 Rooms | 1,307 (43.9%) | 308 (45.8%) |
| 6 or 7 Rooms | 1,208 (40.6%) | 181 (26.9%) |
| 8 or more Rooms | 413 (13.9%) | 19 (2.8%) |
| Total | 2,977 (100.0%) | 673 (100.0%) |
Housing Structure by Heating Type in Magalia
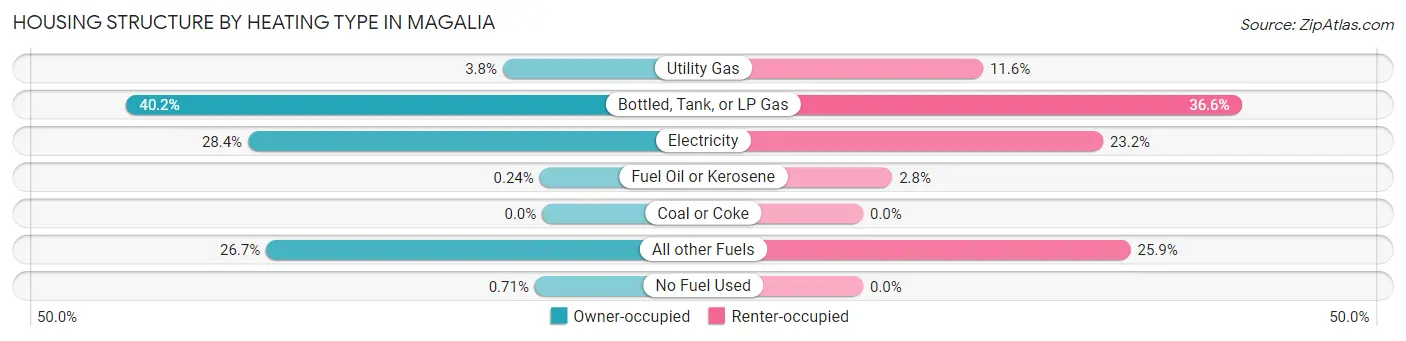
| Heating Type | Owner-occupied | Renter-occupied |
| Utility Gas | 113 (3.8%) | 78 (11.6%) |
| Bottled, Tank, or LP Gas | 1,196 (40.2%) | 246 (36.5%) |
| Electricity | 846 (28.4%) | 156 (23.2%) |
| Fuel Oil or Kerosene | 7 (0.2%) | 19 (2.8%) |
| Coal or Coke | 0 (0.0%) | 0 (0.0%) |
| All other Fuels | 794 (26.7%) | 174 (25.9%) |
| No Fuel Used | 21 (0.7%) | 0 (0.0%) |
| Total | 2,977 (100.0%) | 673 (100.0%) |
Household Vehicle Usage in Magalia
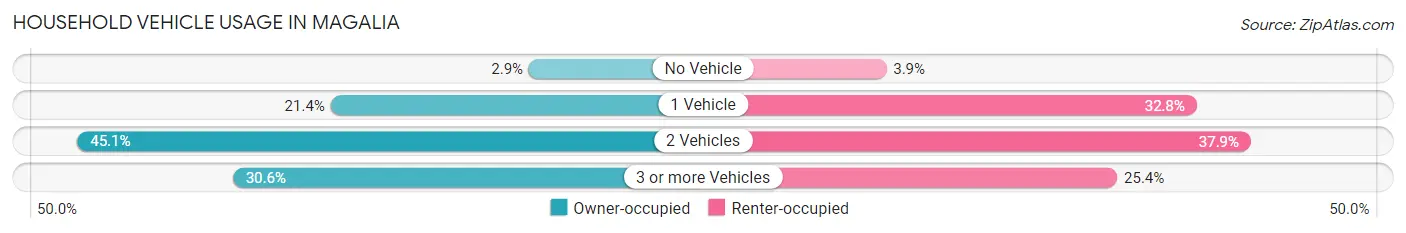
| Vehicles per Household | Owner-occupied | Renter-occupied |
| No Vehicle | 87 (2.9%) | 26 (3.9%) |
| 1 Vehicle | 638 (21.4%) | 221 (32.8%) |
| 2 Vehicles | 1,342 (45.1%) | 255 (37.9%) |
| 3 or more Vehicles | 910 (30.6%) | 171 (25.4%) |
| Total | 2,977 (100.0%) | 673 (100.0%) |
Real Estate & Mortgages in Magalia
Real Estate and Mortgage Overview in Magalia
| Characteristic | Without Mortgage | With Mortgage |
| Housing Units | 1,197 | 1,780 |
| Median Property Value | $210,200 | $243,500 |
| Median Household Income | $45,670 | $278 |
| Monthly Housing Costs | $590 | $39 |
| Real Estate Taxes | $1,267 | $41 |
Property Value by Mortgage Status in Magalia
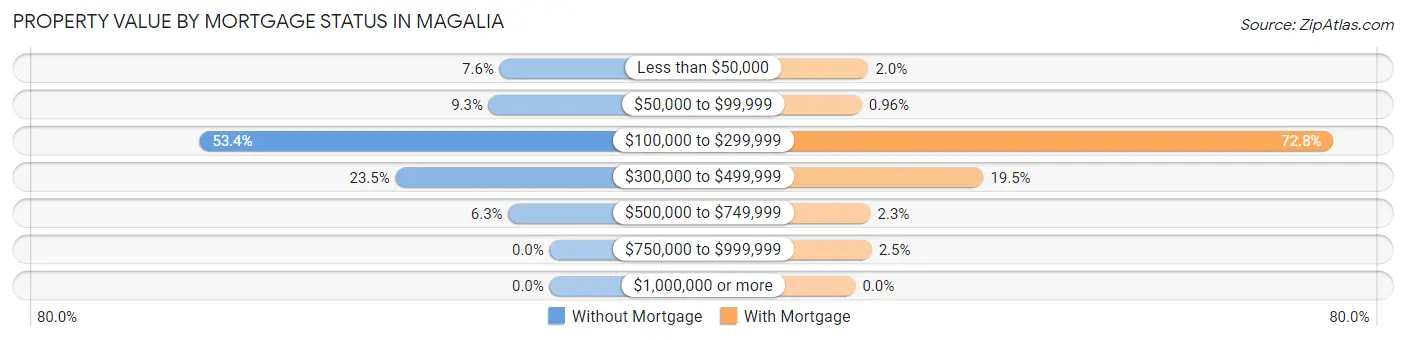
| Property Value | Without Mortgage | With Mortgage |
| Less than $50,000 | 91 (7.6%) | 35 (2.0%) |
| $50,000 to $99,999 | 111 (9.3%) | 17 (1.0%) |
| $100,000 to $299,999 | 639 (53.4%) | 1,296 (72.8%) |
| $300,000 to $499,999 | 281 (23.5%) | 347 (19.5%) |
| $500,000 to $749,999 | 75 (6.3%) | 41 (2.3%) |
| $750,000 to $999,999 | 0 (0.0%) | 44 (2.5%) |
| $1,000,000 or more | 0 (0.0%) | 0 (0.0%) |
| Total | 1,197 (100.0%) | 1,780 (100.0%) |
Household Income by Mortgage Status in Magalia
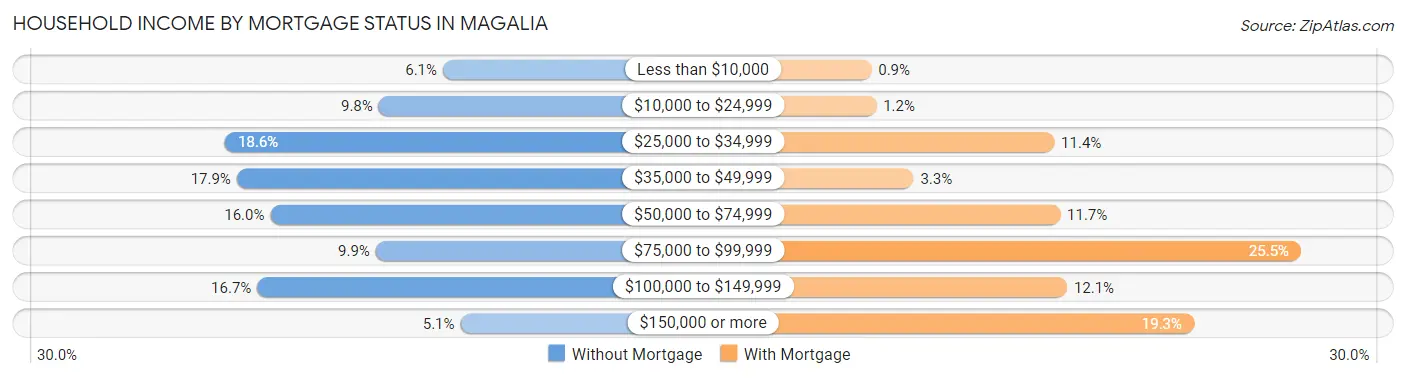
| Household Income | Without Mortgage | With Mortgage |
| Less than $10,000 | 73 (6.1%) | 16 (0.9%) |
| $10,000 to $24,999 | 117 (9.8%) | 21 (1.2%) |
| $25,000 to $34,999 | 222 (18.5%) | 202 (11.4%) |
| $35,000 to $49,999 | 214 (17.9%) | 59 (3.3%) |
| $50,000 to $74,999 | 191 (16.0%) | 208 (11.7%) |
| $75,000 to $99,999 | 119 (9.9%) | 453 (25.5%) |
| $100,000 to $149,999 | 200 (16.7%) | 215 (12.1%) |
| $150,000 or more | 61 (5.1%) | 344 (19.3%) |
| Total | 1,197 (100.0%) | 1,780 (100.0%) |
Property Value to Household Income Ratio in Magalia
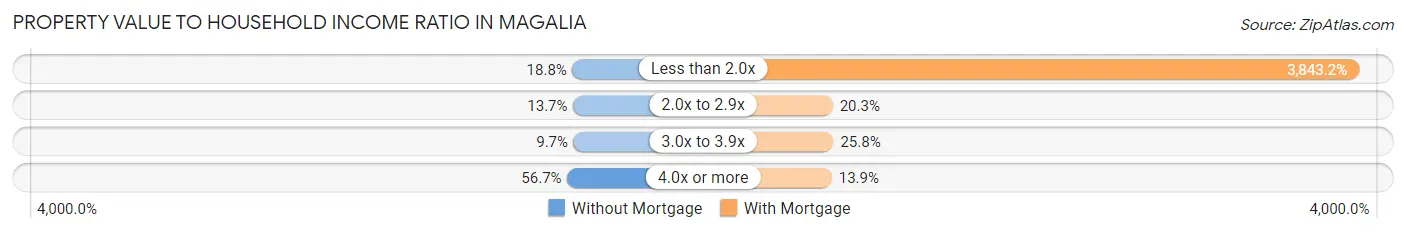
| Value-to-Income Ratio | Without Mortgage | With Mortgage |
| Less than 2.0x | 225 (18.8%) | 68,409 (3,843.2%) |
| 2.0x to 2.9x | 164 (13.7%) | 362 (20.3%) |
| 3.0x to 3.9x | 116 (9.7%) | 459 (25.8%) |
| 4.0x or more | 679 (56.7%) | 247 (13.9%) |
| Total | 1,197 (100.0%) | 1,780 (100.0%) |
Real Estate Taxes by Mortgage Status in Magalia
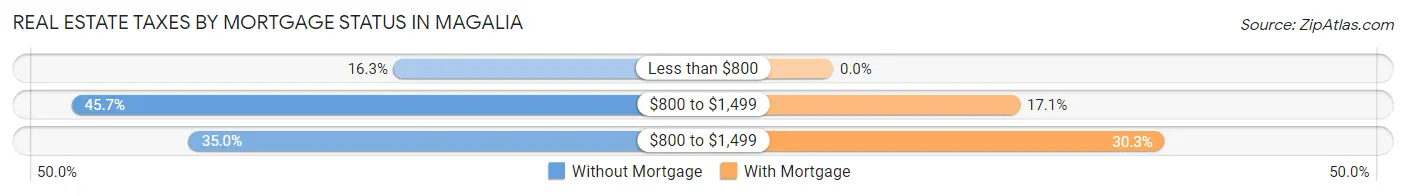
| Property Taxes | Without Mortgage | With Mortgage |
| Less than $800 | 195 (16.3%) | 0 (0.0%) |
| $800 to $1,499 | 547 (45.7%) | 304 (17.1%) |
| $800 to $1,499 | 419 (35.0%) | 539 (30.3%) |
| Total | 1,197 (100.0%) | 1,780 (100.0%) |
Health & Disability in Magalia
Health Insurance Coverage by Age in Magalia
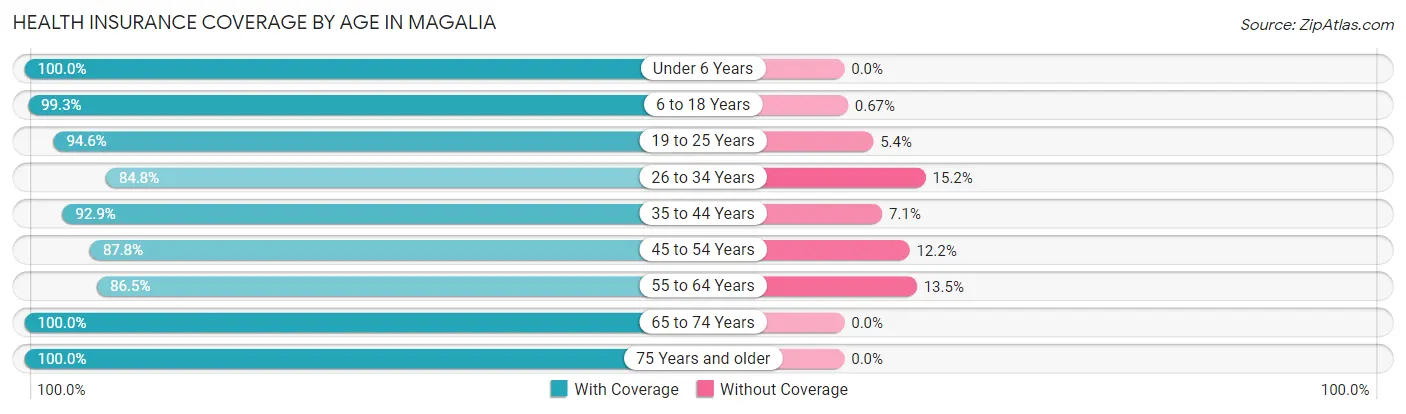
| Age Bracket | With Coverage | Without Coverage |
| Under 6 Years | 786 (100.0%) | 0 (0.0%) |
| 6 to 18 Years | 1,043 (99.3%) | 7 (0.7%) |
| 19 to 25 Years | 773 (94.6%) | 44 (5.4%) |
| 26 to 34 Years | 733 (84.8%) | 131 (15.2%) |
| 35 to 44 Years | 711 (92.9%) | 54 (7.1%) |
| 45 to 54 Years | 1,098 (87.8%) | 152 (12.2%) |
| 55 to 64 Years | 1,332 (86.5%) | 208 (13.5%) |
| 65 to 74 Years | 1,505 (100.0%) | 0 (0.0%) |
| 75 Years and older | 663 (100.0%) | 0 (0.0%) |
| Total | 8,644 (93.5%) | 596 (6.5%) |
Health Insurance Coverage by Citizenship Status in Magalia
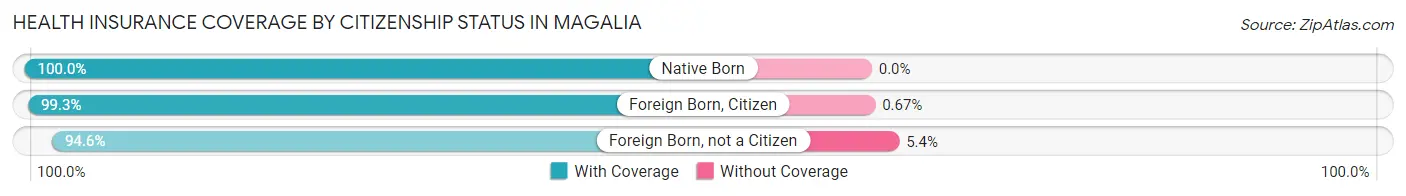
| Citizenship Status | With Coverage | Without Coverage |
| Native Born | 786 (100.0%) | 0 (0.0%) |
| Foreign Born, Citizen | 1,043 (99.3%) | 7 (0.7%) |
| Foreign Born, not a Citizen | 773 (94.6%) | 44 (5.4%) |
Health Insurance Coverage by Household Income in Magalia
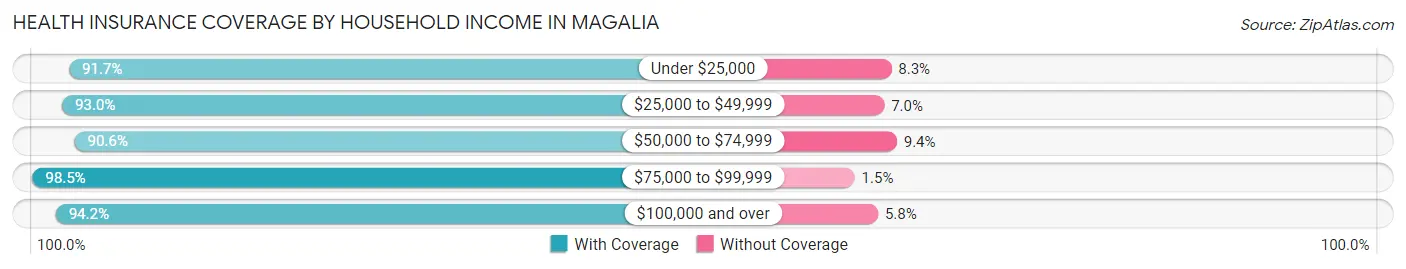
| Household Income | With Coverage | Without Coverage |
| Under $25,000 | 769 (91.7%) | 70 (8.3%) |
| $25,000 to $49,999 | 1,858 (93.0%) | 140 (7.0%) |
| $50,000 to $74,999 | 1,548 (90.6%) | 160 (9.4%) |
| $75,000 to $99,999 | 1,136 (98.5%) | 17 (1.5%) |
| $100,000 and over | 3,288 (94.2%) | 204 (5.8%) |
Public vs Private Health Insurance Coverage by Age in Magalia
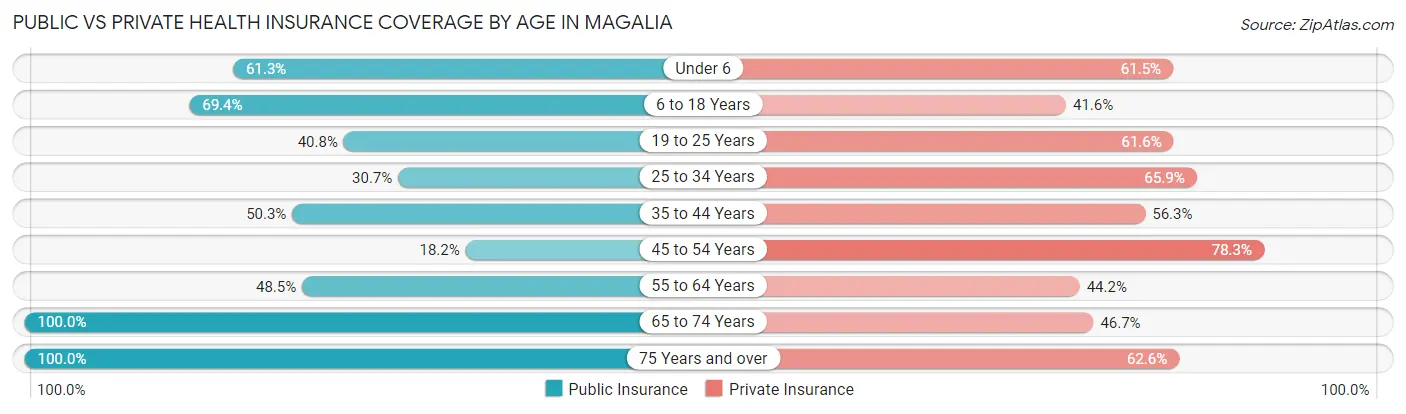
| Age Bracket | Public Insurance | Private Insurance |
| Under 6 | 482 (61.3%) | 483 (61.5%) |
| 6 to 18 Years | 729 (69.4%) | 437 (41.6%) |
| 19 to 25 Years | 333 (40.8%) | 503 (61.6%) |
| 25 to 34 Years | 265 (30.7%) | 569 (65.9%) |
| 35 to 44 Years | 385 (50.3%) | 431 (56.3%) |
| 45 to 54 Years | 227 (18.2%) | 979 (78.3%) |
| 55 to 64 Years | 747 (48.5%) | 680 (44.2%) |
| 65 to 74 Years | 1,505 (100.0%) | 703 (46.7%) |
| 75 Years and over | 663 (100.0%) | 415 (62.6%) |
| Total | 5,336 (57.8%) | 5,200 (56.3%) |
Disability Status by Sex by Age in Magalia
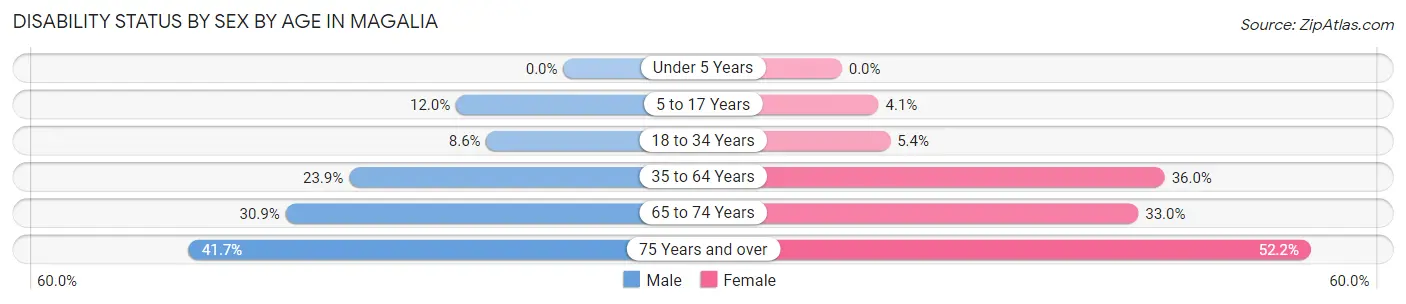
| Age Bracket | Male | Female |
| Under 5 Years | 0 (0.0%) | 0 (0.0%) |
| 5 to 17 Years | 71 (11.9%) | 23 (4.1%) |
| 18 to 34 Years | 70 (8.6%) | 48 (5.4%) |
| 35 to 64 Years | 427 (23.9%) | 635 (36.0%) |
| 65 to 74 Years | 237 (30.9%) | 244 (33.0%) |
| 75 Years and over | 108 (41.7%) | 211 (52.2%) |
Disability Class by Sex by Age in Magalia
Disability Class: Hearing Difficulty
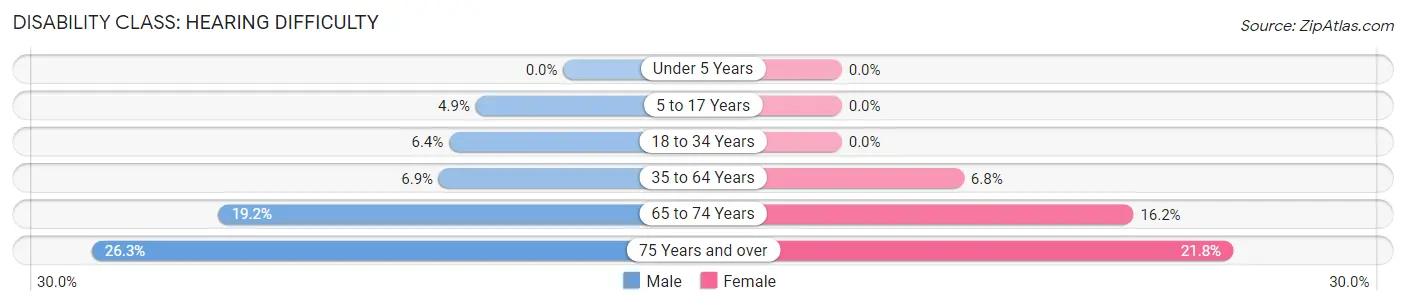
| Age Bracket | Male | Female |
| Under 5 Years | 0 (0.0%) | 0 (0.0%) |
| 5 to 17 Years | 29 (4.9%) | 0 (0.0%) |
| 18 to 34 Years | 52 (6.4%) | 0 (0.0%) |
| 35 to 64 Years | 124 (6.9%) | 120 (6.8%) |
| 65 to 74 Years | 147 (19.2%) | 120 (16.2%) |
| 75 Years and over | 68 (26.3%) | 88 (21.8%) |
Disability Class: Vision Difficulty
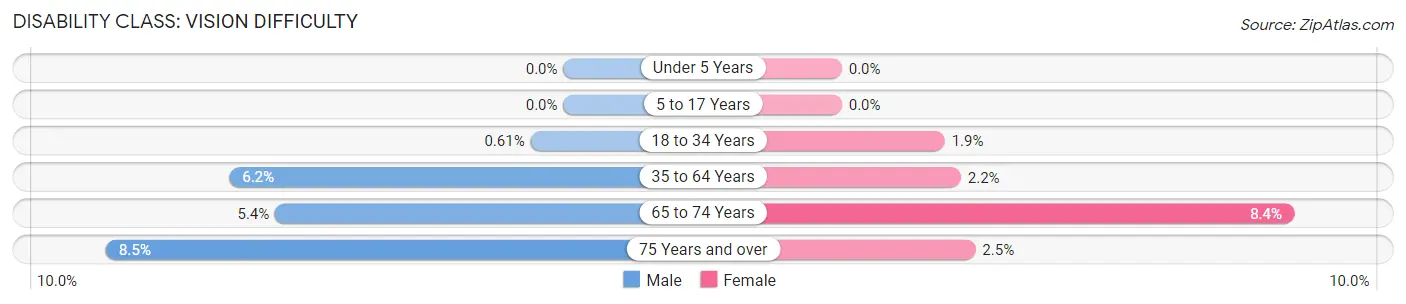
| Age Bracket | Male | Female |
| Under 5 Years | 0 (0.0%) | 0 (0.0%) |
| 5 to 17 Years | 0 (0.0%) | 0 (0.0%) |
| 18 to 34 Years | 5 (0.6%) | 17 (1.9%) |
| 35 to 64 Years | 111 (6.2%) | 39 (2.2%) |
| 65 to 74 Years | 41 (5.3%) | 62 (8.4%) |
| 75 Years and over | 22 (8.5%) | 10 (2.5%) |
Disability Class: Cognitive Difficulty
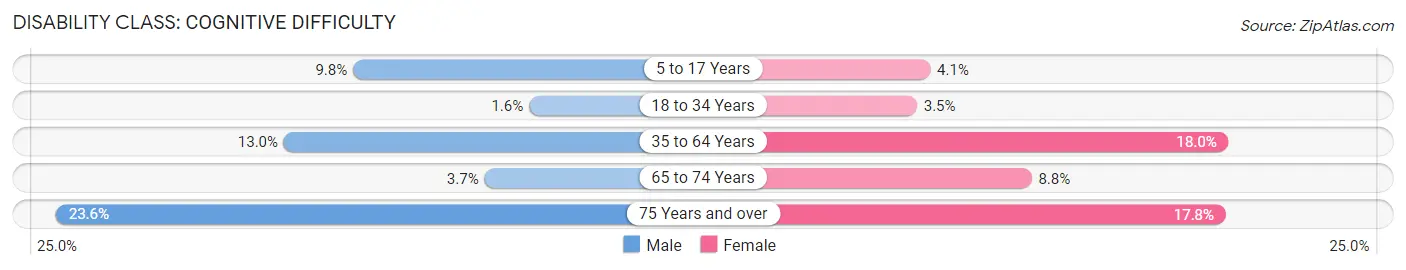
| Age Bracket | Male | Female |
| 5 to 17 Years | 58 (9.8%) | 23 (4.1%) |
| 18 to 34 Years | 13 (1.6%) | 31 (3.5%) |
| 35 to 64 Years | 232 (13.0%) | 317 (17.9%) |
| 65 to 74 Years | 28 (3.7%) | 65 (8.8%) |
| 75 Years and over | 61 (23.5%) | 72 (17.8%) |
Disability Class: Ambulatory Difficulty
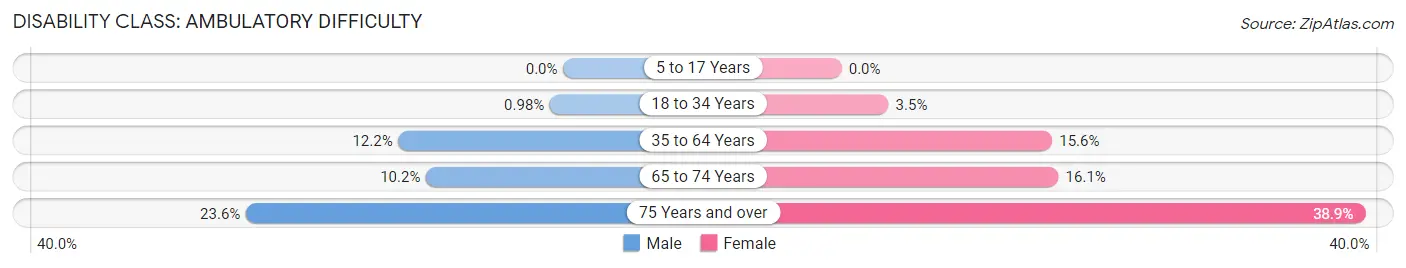
| Age Bracket | Male | Female |
| 5 to 17 Years | 0 (0.0%) | 0 (0.0%) |
| 18 to 34 Years | 8 (1.0%) | 31 (3.5%) |
| 35 to 64 Years | 219 (12.2%) | 276 (15.6%) |
| 65 to 74 Years | 78 (10.2%) | 119 (16.1%) |
| 75 Years and over | 61 (23.5%) | 157 (38.9%) |
Disability Class: Self-Care Difficulty
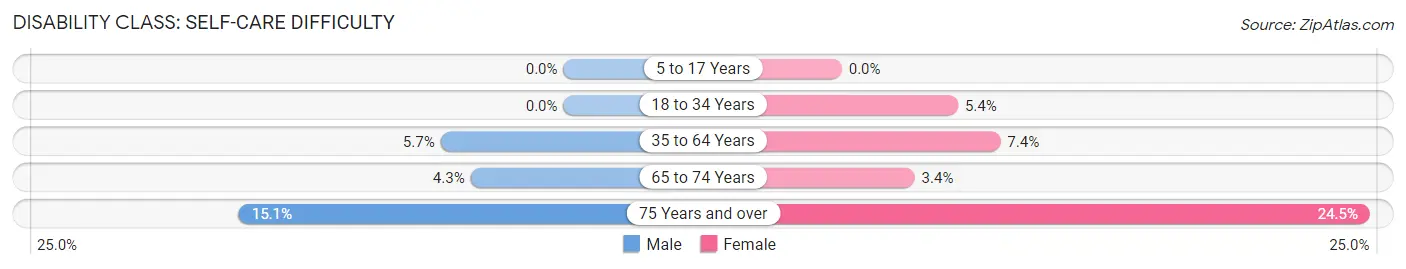
| Age Bracket | Male | Female |
| 5 to 17 Years | 0 (0.0%) | 0 (0.0%) |
| 18 to 34 Years | 0 (0.0%) | 48 (5.4%) |
| 35 to 64 Years | 102 (5.7%) | 130 (7.4%) |
| 65 to 74 Years | 33 (4.3%) | 25 (3.4%) |
| 75 Years and over | 39 (15.1%) | 99 (24.5%) |
Technology Access in Magalia
Computing Device Access in Magalia
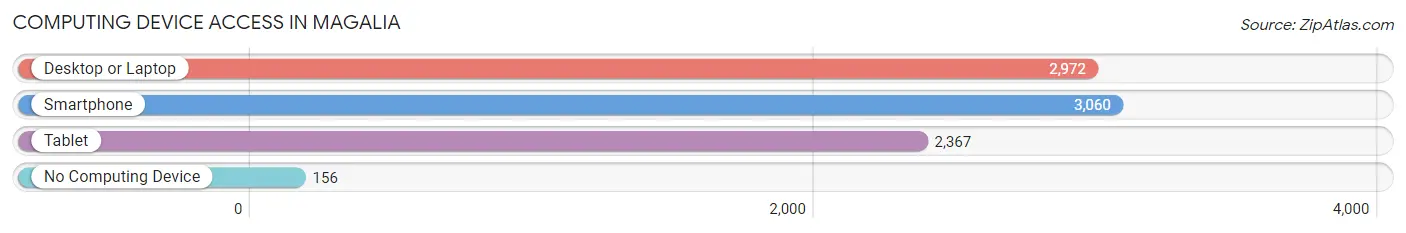
| Device Type | # Households | % Households |
| Desktop or Laptop | 2,972 | 81.4% |
| Smartphone | 3,060 | 83.8% |
| Tablet | 2,367 | 64.8% |
| No Computing Device | 156 | 4.3% |
| Total | 3,650 | 100.0% |
Internet Access in Magalia
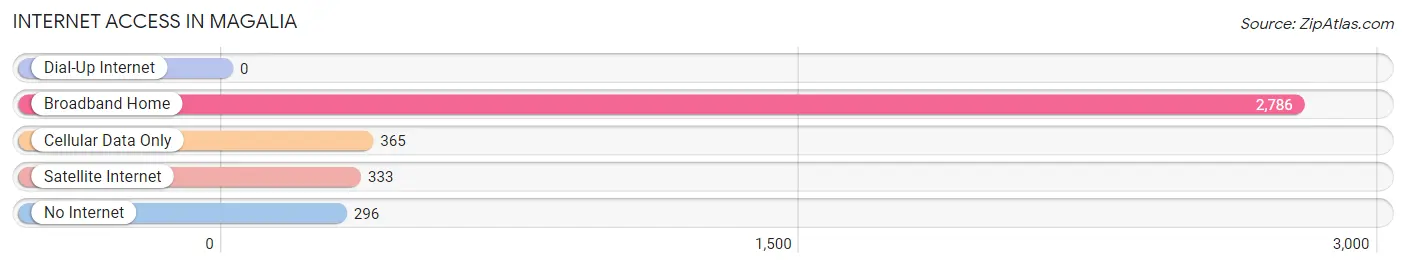
| Internet Type | # Households | % Households |
| Dial-Up Internet | 0 | 0.0% |
| Broadband Home | 2,786 | 76.3% |
| Cellular Data Only | 365 | 10.0% |
| Satellite Internet | 333 | 9.1% |
| No Internet | 296 | 8.1% |
| Total | 3,650 | 100.0% |
Magalia Summary
Magalia, California is a small unincorporated community located in Butte County, California. It is situated in the foothills of the Sierra Nevada Mountains, approximately 10 miles north of the city of Chico. The population of Magalia was 11,310 as of the 2010 census.
History
The area now known as Magalia was originally inhabited by the Maidu Native American tribe. The first non-native settlers arrived in the area in the 1850s, and the town was officially founded in 1854. The town was originally known as Dogtown, but was later renamed Magalia after the Spanish word for “meadow”.
The town grew rapidly in the late 19th century, and by the early 20th century it had become a popular tourist destination. The town was home to several resorts, including the Magalia Hotel, which was built in 1891 and was the largest hotel in the area.
In the 1950s, the town began to decline as the popularity of the resorts declined. The town was further impacted by the construction of the Oroville Dam in the 1960s, which flooded much of the surrounding area.
Geography
Magalia is located in the foothills of the Sierra Nevada Mountains, approximately 10 miles north of the city of Chico. The town is situated at an elevation of 2,000 feet above sea level. The town is surrounded by forests and is located near several lakes, including Lake Oroville and Lake Concow.
The climate in Magalia is generally mild, with hot summers and cool winters. The average annual temperature is around 60 degrees Fahrenheit.
Economy
The economy of Magalia is largely based on tourism and agriculture. The town is home to several resorts, including the Magalia Hotel, which is a popular destination for visitors. The town is also home to several wineries and vineyards, which produce a variety of wines.
Agriculture is also an important part of the local economy. The area is home to several farms, which produce a variety of fruits and vegetables, including apples, pears, peaches, and tomatoes.
Demographics
As of the 2010 census, the population of Magalia was 11,310. The racial makeup of the town was 87.3% White, 0.7% African American, 1.2% Native American, 0.7% Asian, 0.1% Pacific Islander, 6.7% from other races, and 3.2% from two or more races. Hispanic or Latino of any race were 11.3% of the population.
The median household income in Magalia was $41,944, and the median family income was $50,944. The per capita income for the town was $20,944. About 11.3% of families and 14.3% of the population were below the poverty line, including 19.3% of those under age 18 and 8.3% of those age 65 or over.
Common Questions
What is Per Capita Income in Magalia?
Per Capita income in Magalia is $29,493.
What is the Median Family Income in Magalia?
Median Family Income in Magalia is $70,793.
What is the Median Household income in Magalia?
Median Household Income in Magalia is $57,170.
What is Income or Wage Gap in Magalia?
Income or Wage Gap in Magalia is 12.4%.
Women in Magalia earn 87.6 cents for every dollar earned by a man.
What is Inequality or Gini Index in Magalia?
Inequality or Gini Index in Magalia is 0.42.
What is the Total Population of Magalia?
Total Population of Magalia is 9,245.
What is the Total Male Population of Magalia?
Total Male Population of Magalia is 4,549.
What is the Total Female Population of Magalia?
Total Female Population of Magalia is 4,696.
What is the Ratio of Males per 100 Females in Magalia?
There are 96.87 Males per 100 Females in Magalia.
What is the Ratio of Females per 100 Males in Magalia?
There are 103.23 Females per 100 Males in Magalia.
What is the Median Population Age in Magalia?
Median Population Age in Magalia is 47.6 Years.
What is the Average Family Size in Magalia
Average Family Size in Magalia is 3.0 People.
What is the Average Household Size in Magalia
Average Household Size in Magalia is 2.5 People.
How Large is the Labor Force in Magalia?
There are 3,656 People in the Labor Forcein in Magalia.
What is the Percentage of People in the Labor Force in Magalia?
47.8% of People are in the Labor Force in Magalia.
What is the Unemployment Rate in Magalia?
Unemployment Rate in Magalia is 8.0%.