Lompico, CA Map & Demographics
Lompico Map
Lompico Overview
$51,961
PER CAPITA INCOME
$112,566
AVG FAMILY INCOME
$87,545
AVG HOUSEHOLD INCOME
35.9%
WAGE / INCOME GAP [ % ]
64.1¢/ $1
WAGE / INCOME GAP [ $ ]
0.42
INEQUALITY / GINI INDEX
911
TOTAL POPULATION
487
MALE POPULATION
424
FEMALE POPULATION
114.86
MALES / 100 FEMALES
87.06
FEMALES / 100 MALES
50.2
MEDIAN AGE
2.6
AVG FAMILY SIZE
2.0
AVG HOUSEHOLD SIZE
516
LABOR FORCE [ PEOPLE ]
63.9%
PERCENT IN LABOR FORCE
3.3%
UNEMPLOYMENT RATE
Income in Lompico
Income Overview in Lompico
Per Capita Income in Lompico is $51,961, while median incomes of families and households are $112,566 and $87,545 respectively.
| Characteristic | Number | Measure |
| Per Capita Income | 911 | $51,961 |
| Median Family Income | 215 | $112,566 |
| Mean Family Income | 215 | $142,937 |
| Median Household Income | 457 | $87,545 |
| Mean Household Income | 457 | $102,856 |
| Income Deficit | 215 | $0 |
| Wage / Income Gap (%) | 911 | 35.89% |
| Wage / Income Gap ($) | 911 | 64.11¢ per $1 |
| Gini / Inequality Index | 911 | 0.42 |
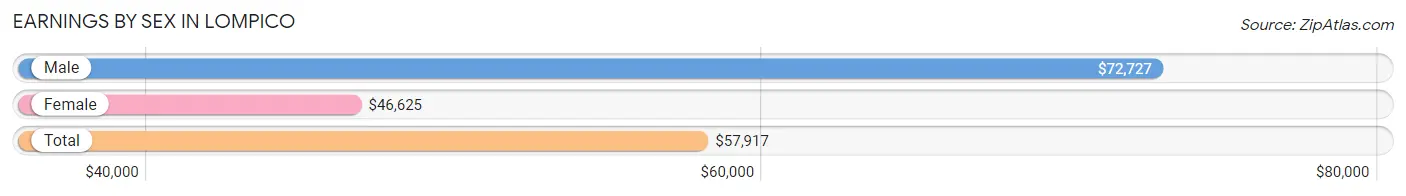
Earnings by Sex in Lompico
Average Earnings in Lompico are $57,917, $72,727 for men and $46,625 for women, a difference of 35.9%.
| Sex | Number | Average Earnings |
| Male | 278 (50.4%) | $72,727 |
| Female | 273 (49.5%) | $46,625 |
| Total | 551 (100.0%) | $57,917 |
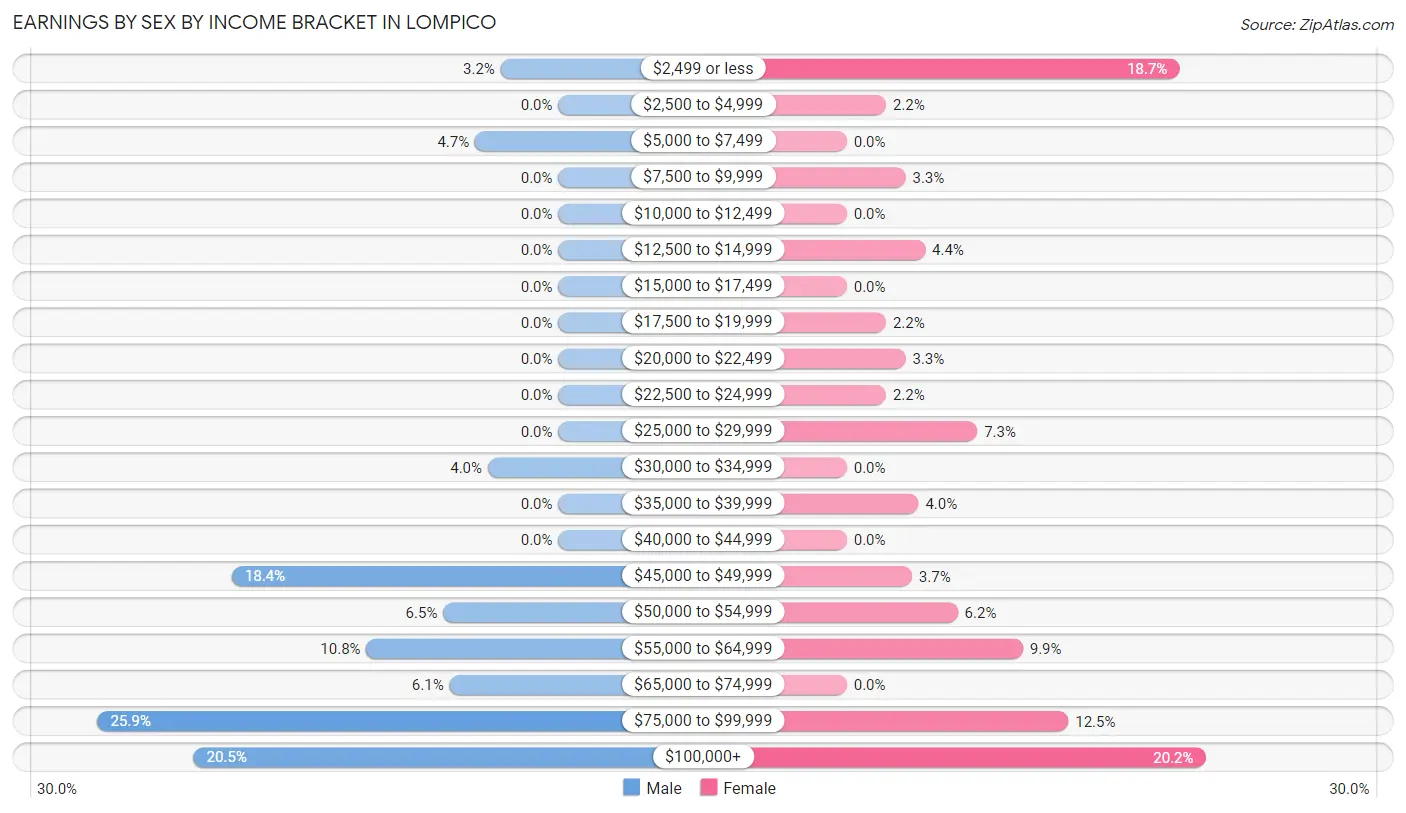
Earnings by Sex by Income Bracket in Lompico
The most common earnings brackets in Lompico are $75,000 to $99,999 for men (72 | 25.9%) and $100,000+ for women (55 | 20.2%).
| Income | Male | Female |
| $2,499 or less | 9 (3.2%) | 51 (18.7%) |
| $2,500 to $4,999 | 0 (0.0%) | 6 (2.2%) |
| $5,000 to $7,499 | 13 (4.7%) | 0 (0.0%) |
| $7,500 to $9,999 | 0 (0.0%) | 9 (3.3%) |
| $10,000 to $12,499 | 0 (0.0%) | 0 (0.0%) |
| $12,500 to $14,999 | 0 (0.0%) | 12 (4.4%) |
| $15,000 to $17,499 | 0 (0.0%) | 0 (0.0%) |
| $17,500 to $19,999 | 0 (0.0%) | 6 (2.2%) |
| $20,000 to $22,499 | 0 (0.0%) | 9 (3.3%) |
| $22,500 to $24,999 | 0 (0.0%) | 6 (2.2%) |
| $25,000 to $29,999 | 0 (0.0%) | 20 (7.3%) |
| $30,000 to $34,999 | 11 (4.0%) | 0 (0.0%) |
| $35,000 to $39,999 | 0 (0.0%) | 11 (4.0%) |
| $40,000 to $44,999 | 0 (0.0%) | 0 (0.0%) |
| $45,000 to $49,999 | 51 (18.3%) | 10 (3.7%) |
| $50,000 to $54,999 | 18 (6.5%) | 17 (6.2%) |
| $55,000 to $64,999 | 30 (10.8%) | 27 (9.9%) |
| $65,000 to $74,999 | 17 (6.1%) | 0 (0.0%) |
| $75,000 to $99,999 | 72 (25.9%) | 34 (12.4%) |
| $100,000+ | 57 (20.5%) | 55 (20.2%) |
| Total | 278 (100.0%) | 273 (100.0%) |
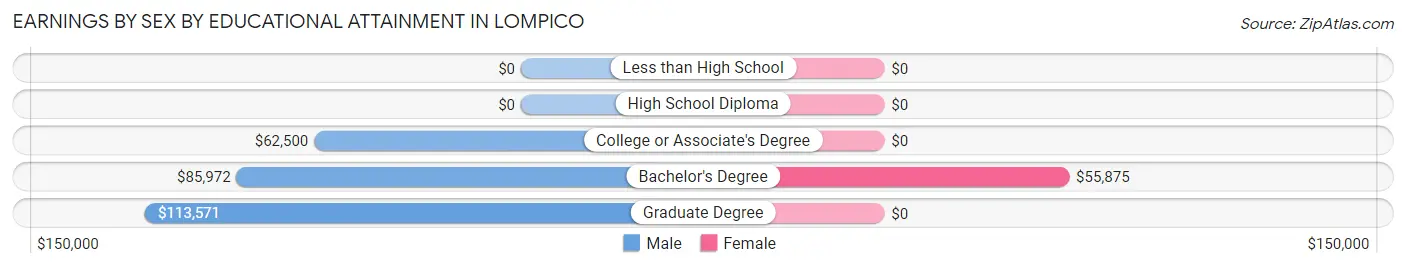
Earnings by Sex by Educational Attainment in Lompico
Average earnings in Lompico are $74,773 for men and $52,868 for women, a difference of 29.3%. Men with an educational attainment of graduate degree enjoy the highest average annual earnings of $113,571, while those with college or associate's degree education earn the least with $62,500. Women with an educational attainment of bachelor's degree earn the most with the average annual earnings of $55,875, while those with bachelor's degree education have the smallest earnings of $55,875.
| Educational Attainment | Male Income | Female Income |
| Less than High School | - | - |
| High School Diploma | - | - |
| College or Associate's Degree | $62,500 | $0 |
| Bachelor's Degree | $85,972 | $55,875 |
| Graduate Degree | $113,571 | $0 |
| Total | $74,773 | $52,868 |
Family Income in Lompico
Family Income Brackets in Lompico
According to the Lompico family income data, there are 72 families falling into the $100,000 to $149,999 income range, which is the most common income bracket and makes up 33.5% of all families.
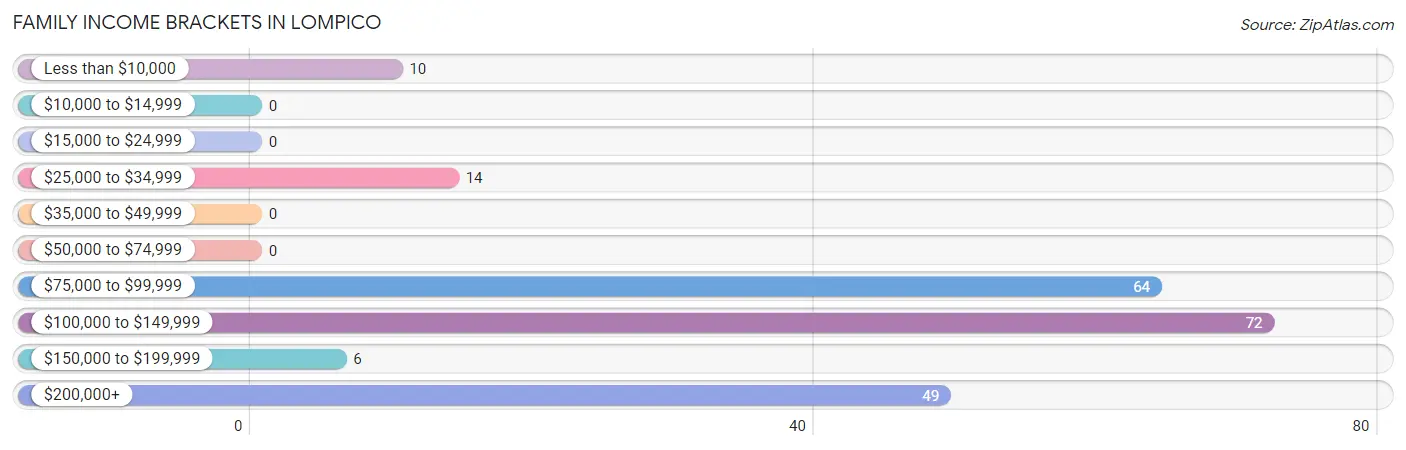
| Income Bracket | # Families | % Families |
| Less than $10,000 | 10 | 4.7% |
| $10,000 to $14,999 | 0 | 0.0% |
| $15,000 to $24,999 | 0 | 0.0% |
| $25,000 to $34,999 | 14 | 6.5% |
| $35,000 to $49,999 | 0 | 0.0% |
| $50,000 to $74,999 | 0 | 0.0% |
| $75,000 to $99,999 | 64 | 29.8% |
| $100,000 to $149,999 | 72 | 33.5% |
| $150,000 to $199,999 | 6 | 2.8% |
| $200,000+ | 49 | 22.8% |
Family Income by Famaliy Size in Lompico
2-person families (121 | 56.3%) account for the highest median family income in Lompico with $114,803 per family, while 2-person families (121 | 56.3%) have the highest median income of $57,402 per family member.
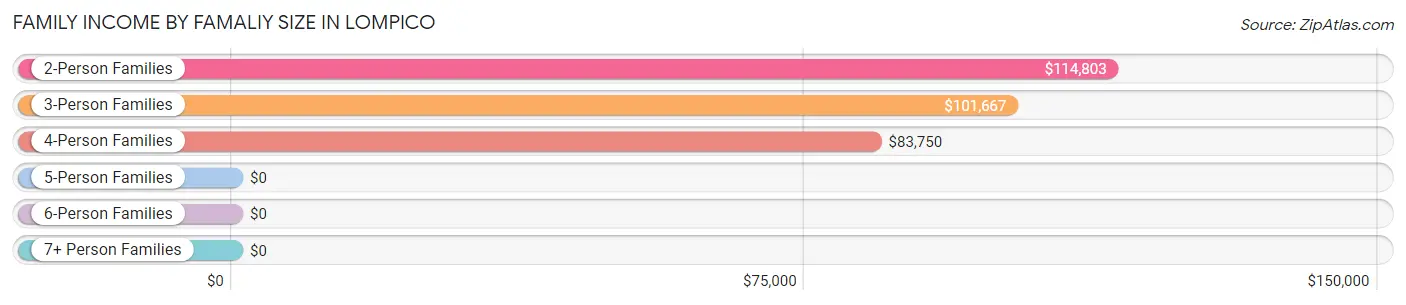
| Income Bracket | # Families | Median Income |
| 2-Person Families | 121 (56.3%) | $114,803 |
| 3-Person Families | 58 (27.0%) | $101,667 |
| 4-Person Families | 36 (16.7%) | $83,750 |
| 5-Person Families | 0 (0.0%) | $0 |
| 6-Person Families | 0 (0.0%) | $0 |
| 7+ Person Families | 0 (0.0%) | $0 |
| Total | 215 (100.0%) | $112,566 |
Family Income by Number of Earners in Lompico
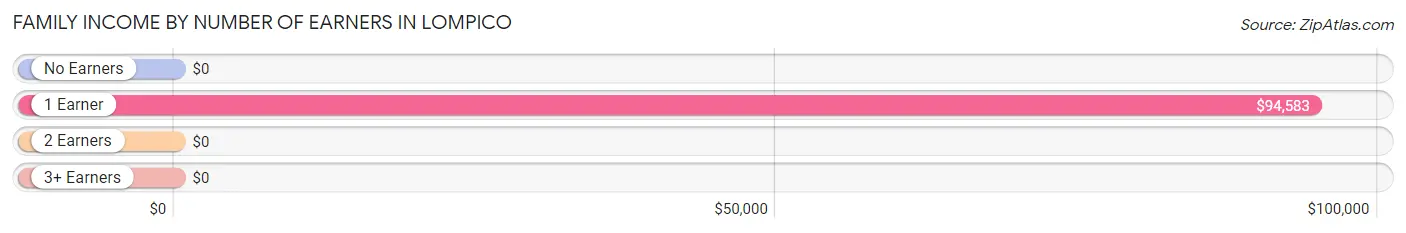
| Number of Earners | # Families | Median Income |
| No Earners | 32 (14.9%) | $0 |
| 1 Earner | 59 (27.4%) | $94,583 |
| 2 Earners | 106 (49.3%) | $0 |
| 3+ Earners | 18 (8.4%) | $0 |
| Total | 215 (100.0%) | $112,566 |
Household Income in Lompico
Household Income Brackets in Lompico
With 105 households falling in the category, the $100,000 to $149,999 income range is the most frequent in Lompico, accounting for 23.0% of all households.
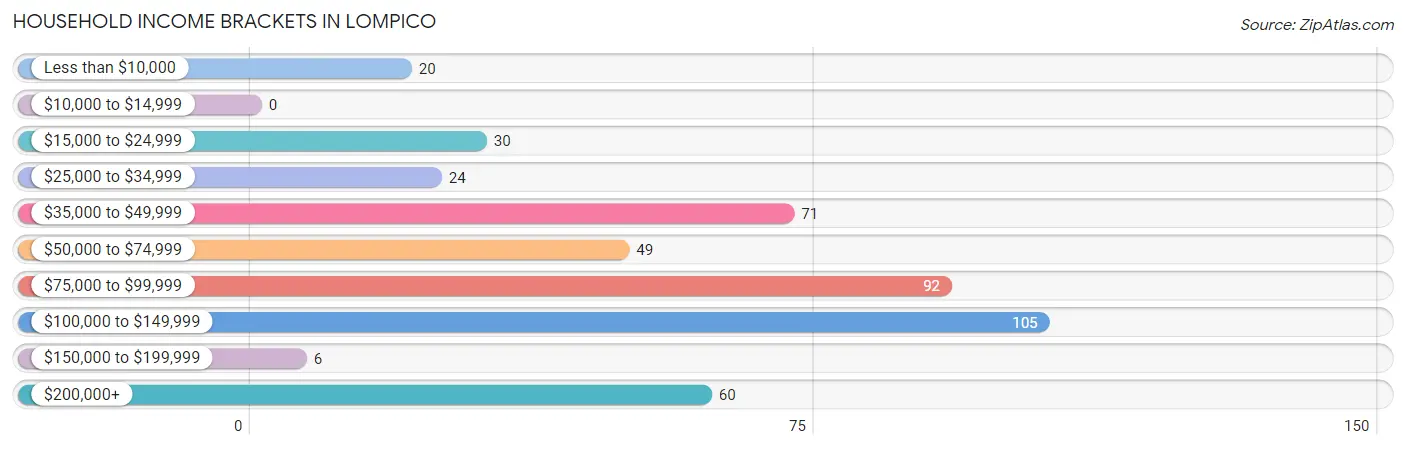
| Income Bracket | # Households | % Households |
| Less than $10,000 | 20 | 4.4% |
| $10,000 to $14,999 | 0 | 0.0% |
| $15,000 to $24,999 | 30 | 6.6% |
| $25,000 to $34,999 | 24 | 5.3% |
| $35,000 to $49,999 | 71 | 15.5% |
| $50,000 to $74,999 | 49 | 10.7% |
| $75,000 to $99,999 | 92 | 20.1% |
| $100,000 to $149,999 | 105 | 23.0% |
| $150,000 to $199,999 | 6 | 1.3% |
| $200,000+ | 60 | 13.1% |
Household Income by Householder Age in Lompico
The median household income in Lompico is $87,545, with the highest median household income of $98,611 found in the 45 to 64 years age bracket for the primary householder. A total of 126 households (27.6%) fall into this category.
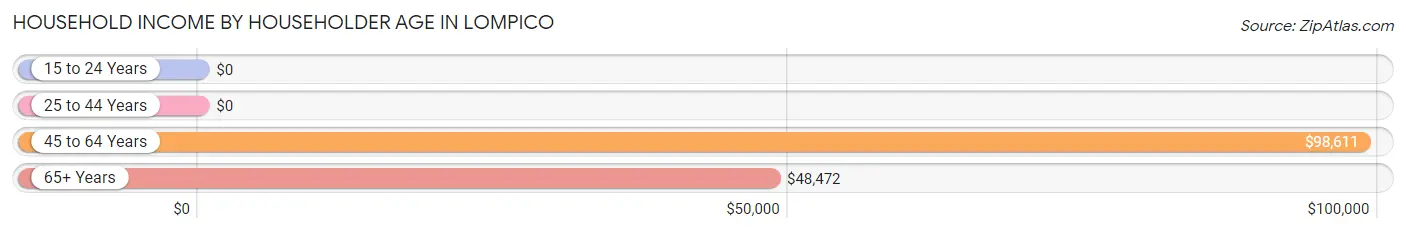
| Income Bracket | # Households | Median Income |
| 15 to 24 Years | 0 (0.0%) | $0 |
| 25 to 44 Years | 138 (30.2%) | $0 |
| 45 to 64 Years | 126 (27.6%) | $98,611 |
| 65+ Years | 193 (42.2%) | $48,472 |
| Total | 457 (100.0%) | $87,545 |
Poverty in Lompico
Income Below Poverty by Sex and Age in Lompico
With 1.2% poverty level for males and 21.2% for females among the residents of Lompico, 45 to 54 year old males and 75 year old and over females are the most vulnerable to poverty, with 6 males (6.5%) and 10 females (66.7%) in their respective age groups living below the poverty level.
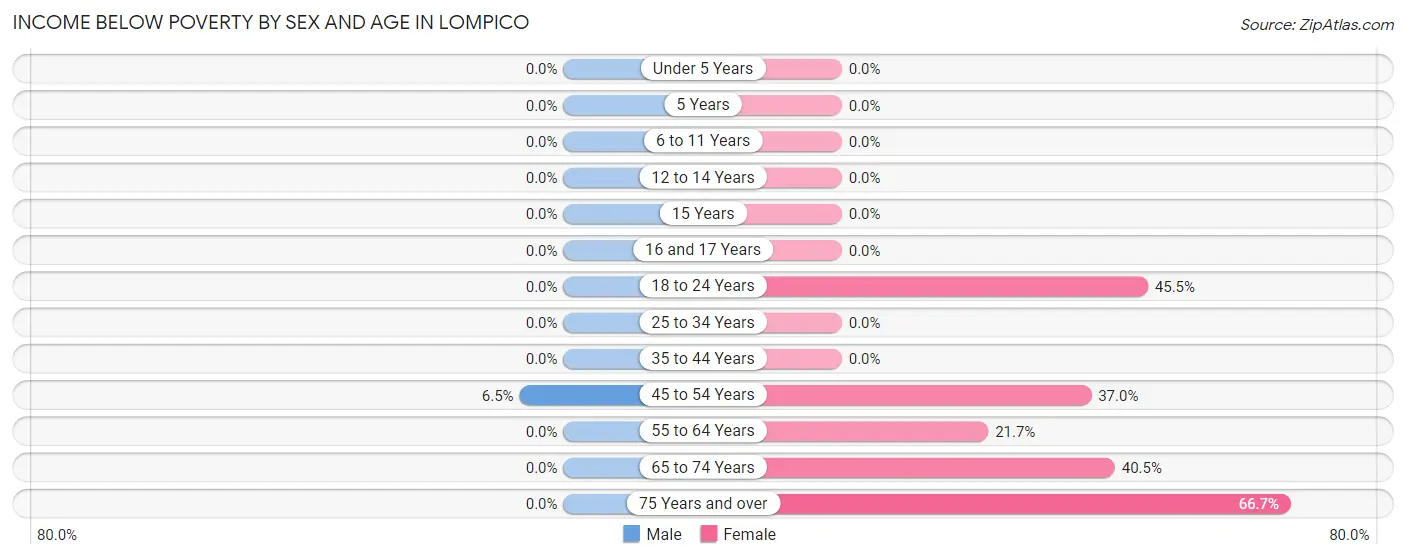
| Age Bracket | Male | Female |
| Under 5 Years | 0 (0.0%) | 0 (0.0%) |
| 5 Years | 0 (0.0%) | 0 (0.0%) |
| 6 to 11 Years | 0 (0.0%) | 0 (0.0%) |
| 12 to 14 Years | 0 (0.0%) | 0 (0.0%) |
| 15 Years | 0 (0.0%) | 0 (0.0%) |
| 16 and 17 Years | 0 (0.0%) | 0 (0.0%) |
| 18 to 24 Years | 0 (0.0%) | 5 (45.5%) |
| 25 to 34 Years | 0 (0.0%) | 0 (0.0%) |
| 35 to 44 Years | 0 (0.0%) | 0 (0.0%) |
| 45 to 54 Years | 6 (6.5%) | 20 (37.0%) |
| 55 to 64 Years | 0 (0.0%) | 10 (21.7%) |
| 65 to 74 Years | 0 (0.0%) | 45 (40.5%) |
| 75 Years and over | 0 (0.0%) | 10 (66.7%) |
| Total | 6 (1.2%) | 90 (21.2%) |
Income Above Poverty by Sex and Age in Lompico
According to the poverty statistics in Lompico, males aged under 5 years and females aged 6 to 11 years are the age groups that are most secure financially, with 100.0% of males and 100.0% of females in these age groups living above the poverty line.
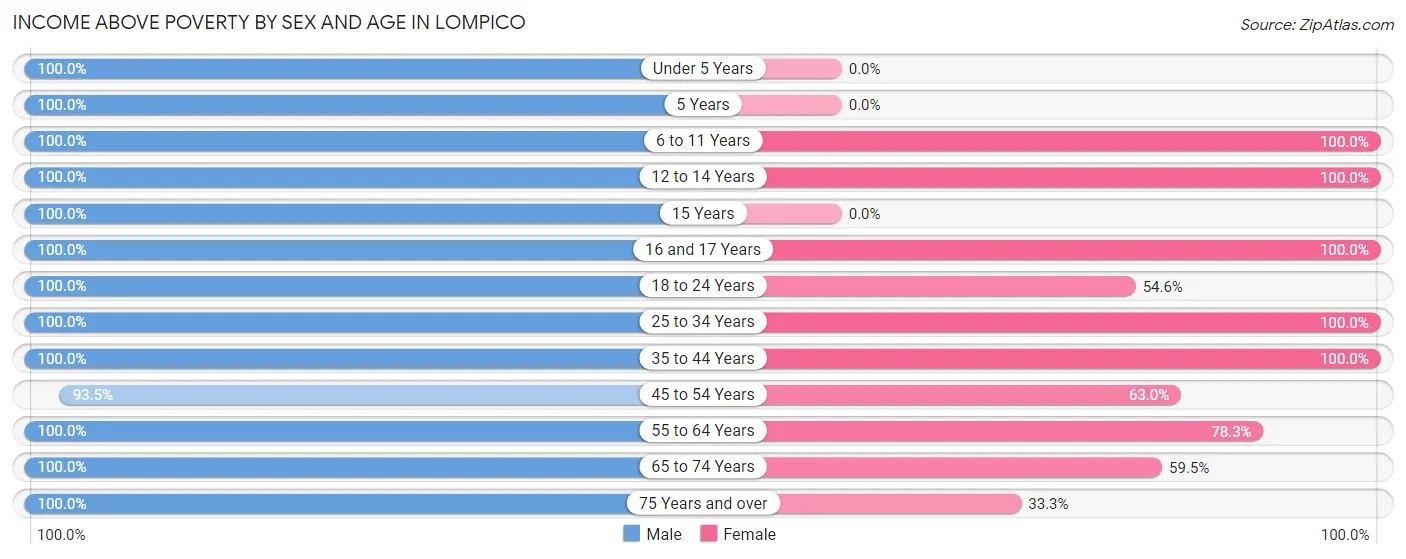
| Age Bracket | Male | Female |
| Under 5 Years | 14 (100.0%) | 0 (0.0%) |
| 5 Years | 7 (100.0%) | 0 (0.0%) |
| 6 to 11 Years | 10 (100.0%) | 40 (100.0%) |
| 12 to 14 Years | 21 (100.0%) | 8 (100.0%) |
| 15 Years | 4 (100.0%) | 0 (0.0%) |
| 16 and 17 Years | 9 (100.0%) | 12 (100.0%) |
| 18 to 24 Years | 9 (100.0%) | 6 (54.5%) |
| 25 to 34 Years | 85 (100.0%) | 64 (100.0%) |
| 35 to 44 Years | 60 (100.0%) | 63 (100.0%) |
| 45 to 54 Years | 86 (93.5%) | 34 (63.0%) |
| 55 to 64 Years | 67 (100.0%) | 36 (78.3%) |
| 65 to 74 Years | 86 (100.0%) | 66 (59.5%) |
| 75 Years and over | 23 (100.0%) | 5 (33.3%) |
| Total | 481 (98.8%) | 334 (78.8%) |
Income Below Poverty Among Married-Couple Families in Lompico
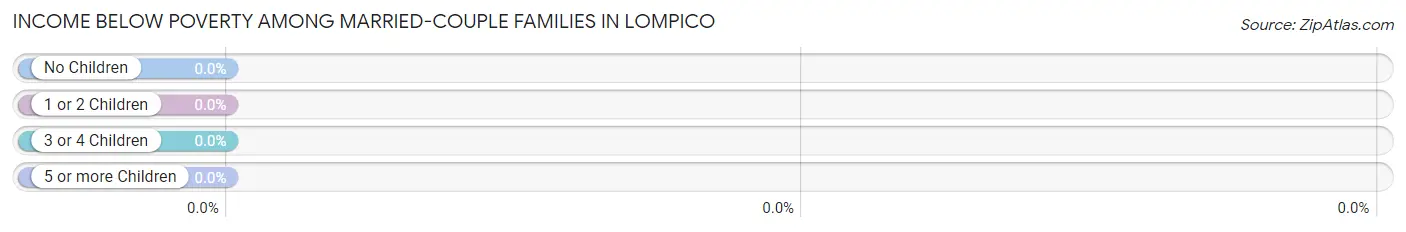
| Children | Above Poverty | Below Poverty |
| No Children | 118 (100.0%) | 0 (0.0%) |
| 1 or 2 Children | 55 (100.0%) | 0 (0.0%) |
| 3 or 4 Children | 0 (0.0%) | 0 (0.0%) |
| 5 or more Children | 0 (0.0%) | 0 (0.0%) |
| Total | 173 (100.0%) | 0 (0.0%) |
Income Below Poverty Among Single-Parent Households in Lompico
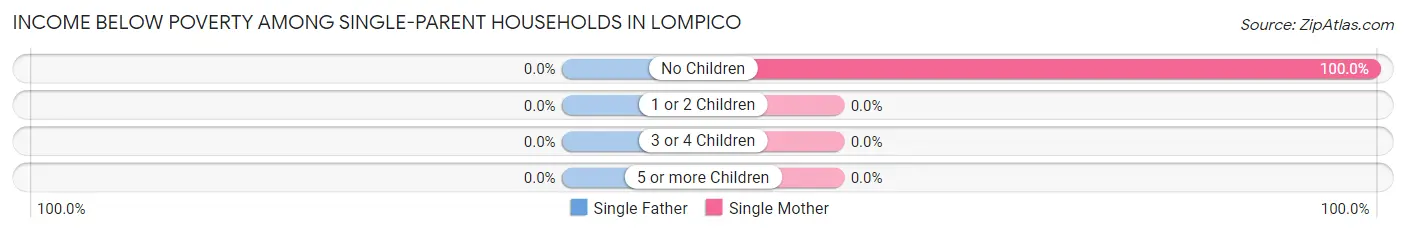
| Children | Single Father | Single Mother |
| No Children | 0 (0.0%) | 10 (100.0%) |
| 1 or 2 Children | 0 (0.0%) | 0 (0.0%) |
| 3 or 4 Children | 0 (0.0%) | 0 (0.0%) |
| 5 or more Children | 0 (0.0%) | 0 (0.0%) |
| Total | 0 (0.0%) | 10 (100.0%) |
Income Below Poverty Among Married-Couple vs Single-Parent Households in Lompico
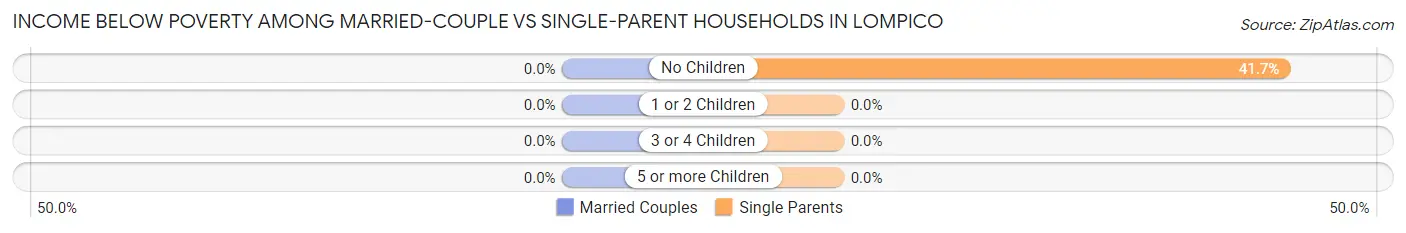
| Children | Married-Couple Families | Single-Parent Households |
| No Children | 0 (0.0%) | 10 (41.7%) |
| 1 or 2 Children | 0 (0.0%) | 0 (0.0%) |
| 3 or 4 Children | 0 (0.0%) | 0 (0.0%) |
| 5 or more Children | 0 (0.0%) | 0 (0.0%) |
| Total | 0 (0.0%) | 10 (23.8%) |
Race in Lompico
The most populous races in Lompico are White / Caucasian (769 | 84.4%), Two or more Races (78 | 8.6%), and Hispanic or Latino (53 | 5.8%).
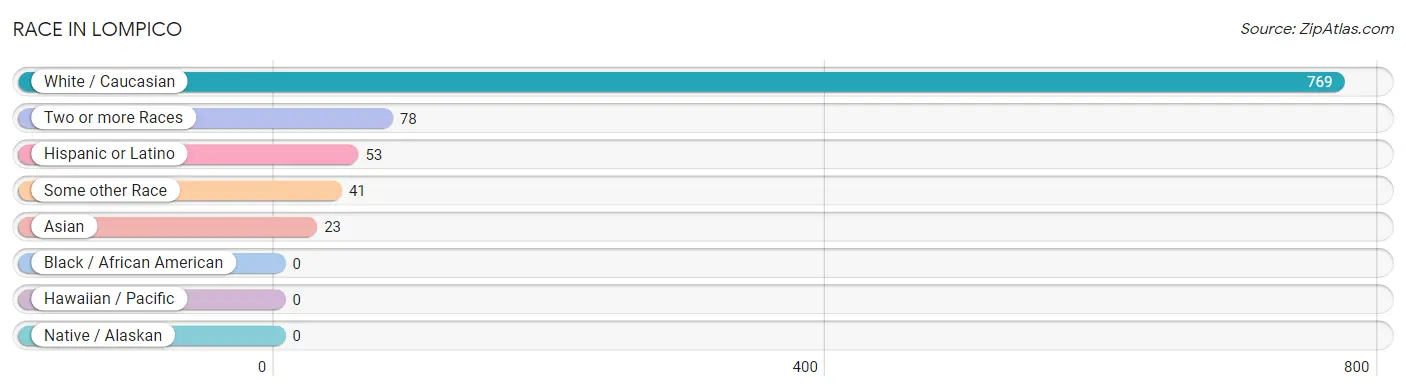
| Race | # Population | % Population |
| Asian | 23 | 2.5% |
| Black / African American | 0 | 0.0% |
| Hawaiian / Pacific | 0 | 0.0% |
| Hispanic or Latino | 53 | 5.8% |
| Native / Alaskan | 0 | 0.0% |
| White / Caucasian | 769 | 84.4% |
| Two or more Races | 78 | 8.6% |
| Some other Race | 41 | 4.5% |
| Total | 911 | 100.0% |
Ancestry in Lompico
The most populous ancestries reported in Lompico are German (190 | 20.9%), English (107 | 11.7%), Irish (97 | 10.6%), American (92 | 10.1%), and Swedish (78 | 8.6%), together accounting for 61.9% of all Lompico residents.
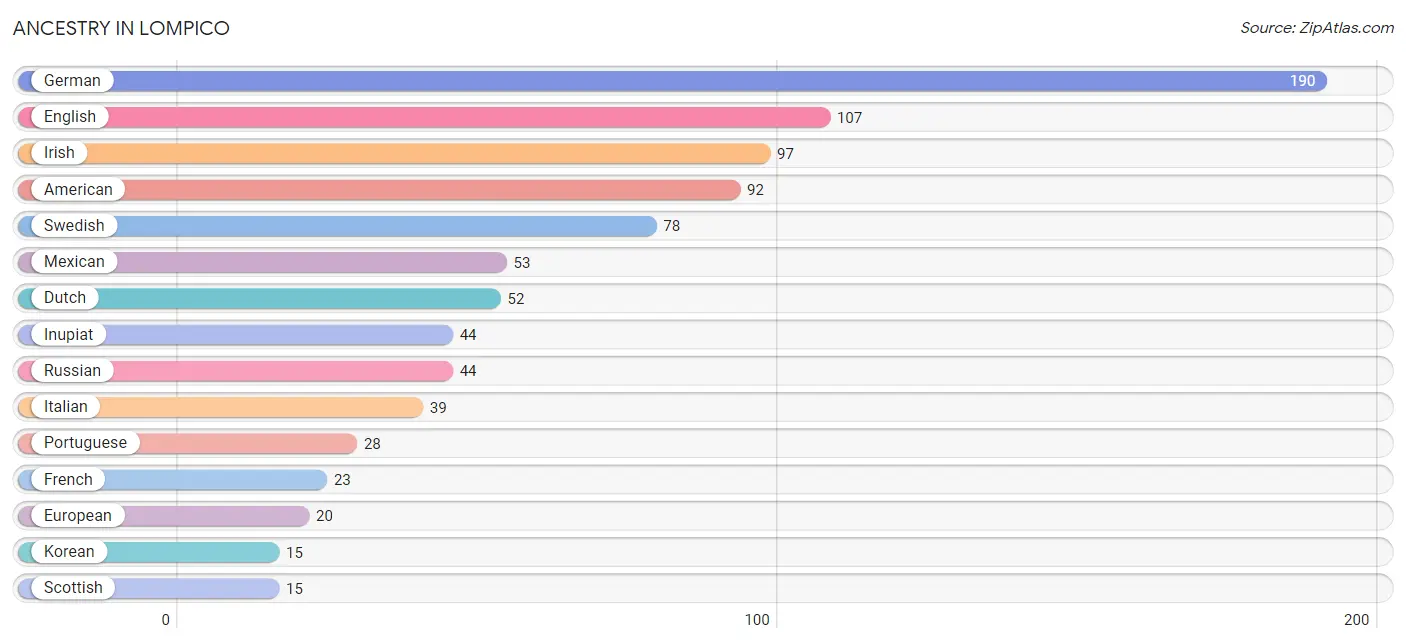
| Ancestry | # Population | % Population |
| American | 92 | 10.1% |
| Bhutanese | 8 | 0.9% |
| British | 8 | 0.9% |
| Canadian | 7 | 0.8% |
| Cherokee | 7 | 0.8% |
| Dutch | 52 | 5.7% |
| English | 107 | 11.7% |
| European | 20 | 2.2% |
| French | 23 | 2.5% |
| French Canadian | 6 | 0.7% |
| German | 190 | 20.9% |
| Greek | 6 | 0.7% |
| Inupiat | 44 | 4.8% |
| Irish | 97 | 10.6% |
| Italian | 39 | 4.3% |
| Korean | 15 | 1.7% |
| Mexican | 53 | 5.8% |
| Northern European | 7 | 0.8% |
| Norwegian | 8 | 0.9% |
| Portuguese | 28 | 3.1% |
| Russian | 44 | 4.8% |
| Scottish | 15 | 1.7% |
| Swedish | 78 | 8.6% |
| Ukrainian | 9 | 1.0% |
| Welsh | 7 | 0.8% |
| Yugoslavian | 12 | 1.3% | View All 26 Rows |
Immigrants in Lompico
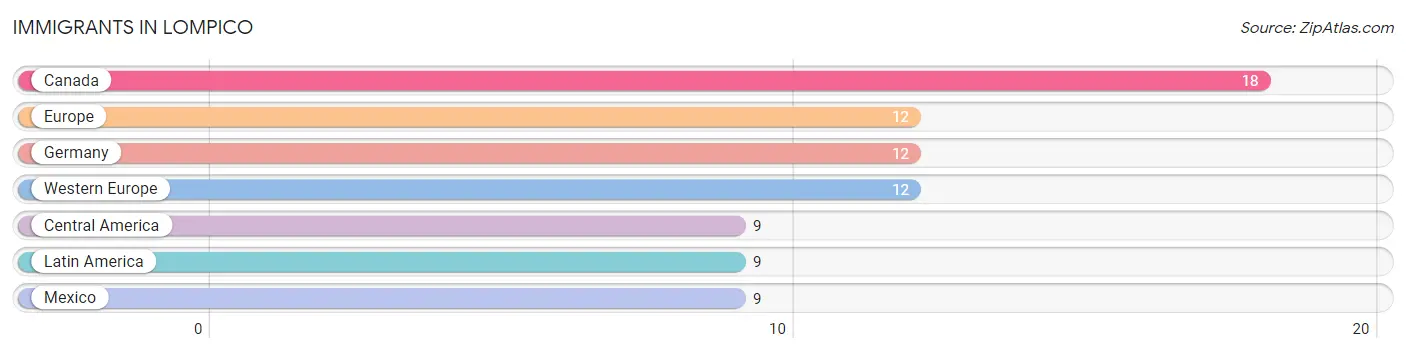
The most numerous immigrant groups reported in Lompico came from Canada (18 | 2.0%), Europe (12 | 1.3%), Germany (12 | 1.3%), Western Europe (12 | 1.3%), and Central America (9 | 1.0%), together accounting for 6.9% of all Lompico residents.
| Immigration Origin | # Population | % Population |
| Canada | 18 | 2.0% |
| Central America | 9 | 1.0% |
| Europe | 12 | 1.3% |
| Germany | 12 | 1.3% |
| Latin America | 9 | 1.0% |
| Mexico | 9 | 1.0% |
| Western Europe | 12 | 1.3% | View All 7 Rows |
Sex and Age in Lompico
Sex and Age in Lompico
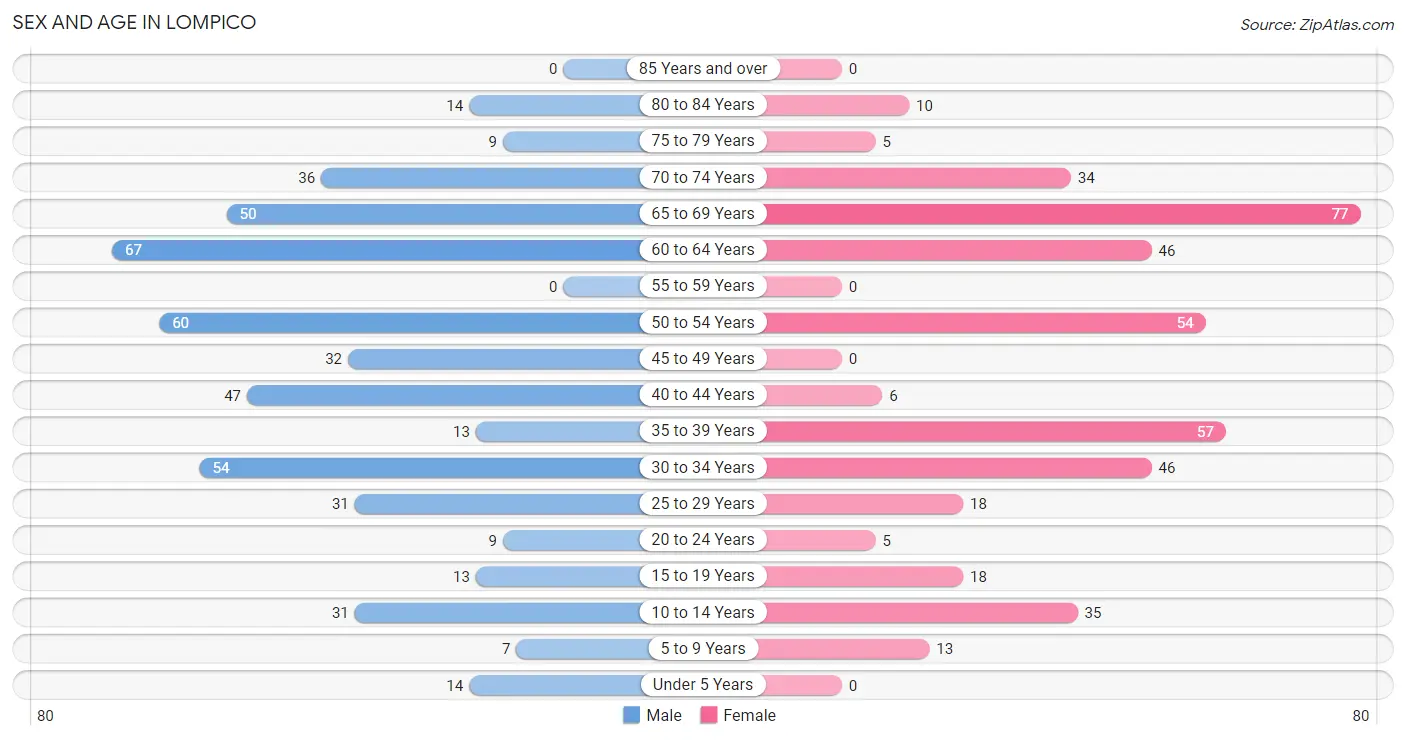
The most populous age groups in Lompico are 60 to 64 Years (67 | 13.8%) for men and 65 to 69 Years (77 | 18.2%) for women.
| Age Bracket | Male | Female |
| Under 5 Years | 14 (2.9%) | 0 (0.0%) |
| 5 to 9 Years | 7 (1.4%) | 13 (3.1%) |
| 10 to 14 Years | 31 (6.4%) | 35 (8.3%) |
| 15 to 19 Years | 13 (2.7%) | 18 (4.3%) |
| 20 to 24 Years | 9 (1.8%) | 5 (1.2%) |
| 25 to 29 Years | 31 (6.4%) | 18 (4.3%) |
| 30 to 34 Years | 54 (11.1%) | 46 (10.8%) |
| 35 to 39 Years | 13 (2.7%) | 57 (13.4%) |
| 40 to 44 Years | 47 (9.7%) | 6 (1.4%) |
| 45 to 49 Years | 32 (6.6%) | 0 (0.0%) |
| 50 to 54 Years | 60 (12.3%) | 54 (12.7%) |
| 55 to 59 Years | 0 (0.0%) | 0 (0.0%) |
| 60 to 64 Years | 67 (13.8%) | 46 (10.8%) |
| 65 to 69 Years | 50 (10.3%) | 77 (18.2%) |
| 70 to 74 Years | 36 (7.4%) | 34 (8.0%) |
| 75 to 79 Years | 9 (1.8%) | 5 (1.2%) |
| 80 to 84 Years | 14 (2.9%) | 10 (2.4%) |
| 85 Years and over | 0 (0.0%) | 0 (0.0%) |
| Total | 487 (100.0%) | 424 (100.0%) |
Families and Households in Lompico
Median Family Size in Lompico
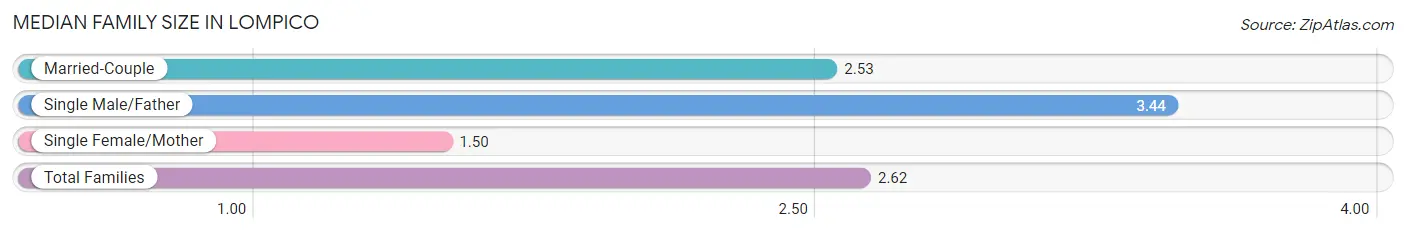
The median family size in Lompico is 2.62 persons per family, with single male/father families (32 | 14.9%) accounting for the largest median family size of 3.44 persons per family. On the other hand, single female/mother families (10 | 4.6%) represent the smallest median family size with 1.50 persons per family.
| Family Type | # Families | Family Size |
| Married-Couple | 173 (80.5%) | 2.53 |
| Single Male/Father | 32 (14.9%) | 3.44 |
| Single Female/Mother | 10 (4.6%) | 1.50 |
| Total Families | 215 (100.0%) | 2.62 |
Median Household Size in Lompico
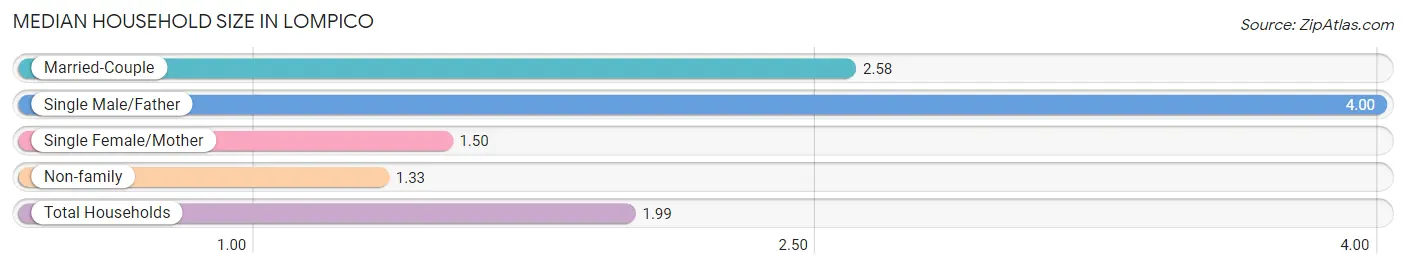
The median household size in Lompico is 1.99 persons per household, with single male/father households (32 | 7.0%) accounting for the largest median household size of 4 persons per household. non-family households (242 | 52.9%) represent the smallest median household size with 1.33 persons per household.
| Household Type | # Households | Household Size |
| Married-Couple | 173 (37.9%) | 2.58 |
| Single Male/Father | 32 (7.0%) | 4.00 |
| Single Female/Mother | 10 (2.2%) | 1.50 |
| Non-family | 242 (52.9%) | 1.33 |
| Total Households | 457 (100.0%) | 1.99 |
Household Size by Marriage Status in Lompico
Out of a total of 457 households in Lompico, 215 (47.0%) are family households, while 242 (52.9%) are nonfamily households. The most numerous type of family households are 2-person households, comprising 121, and the most common type of nonfamily households are 1-person households, comprising 158.
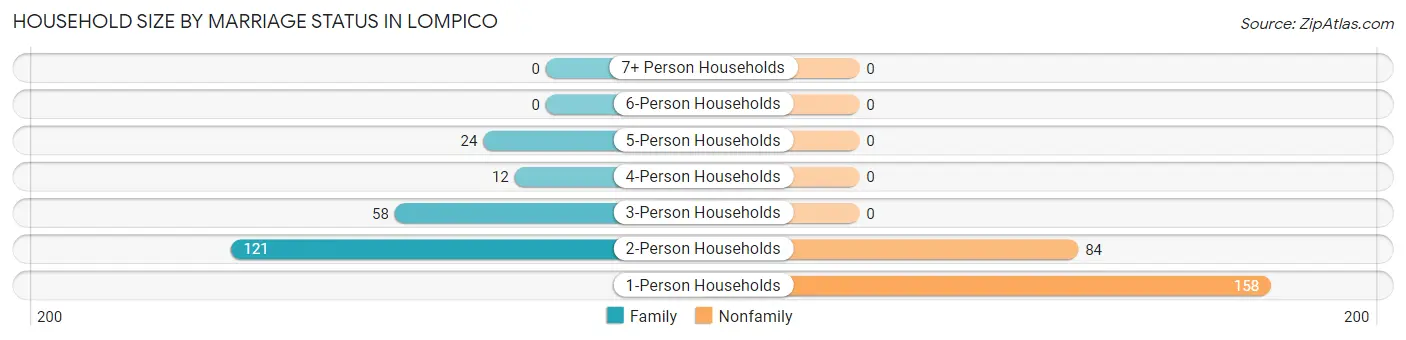
| Household Size | Family Households | Nonfamily Households |
| 1-Person Households | - | 158 (34.6%) |
| 2-Person Households | 121 (26.5%) | 84 (18.4%) |
| 3-Person Households | 58 (12.7%) | 0 (0.0%) |
| 4-Person Households | 12 (2.6%) | 0 (0.0%) |
| 5-Person Households | 24 (5.2%) | 0 (0.0%) |
| 6-Person Households | 0 (0.0%) | 0 (0.0%) |
| 7+ Person Households | 0 (0.0%) | 0 (0.0%) |
| Total | 215 (47.0%) | 242 (52.9%) |
Female Fertility in Lompico
Fertility by Age in Lompico
| Age Bracket | Women with Births | Births / 1,000 Women |
| 15 to 19 years | 0 (0.0%) | 0.0 |
| 20 to 34 years | 0 (0.0%) | 0.0 |
| 35 to 50 years | 0 (0.0%) | 0.0 |
| Total | 0 (0.0%) | 0.0 |
Fertility by Age by Marriage Status in Lompico
| Age Bracket | Married | Unmarried |
| 15 to 19 years | 0 (0.0%) | 0 (0.0%) |
| 20 to 34 years | 0 (0.0%) | 0 (0.0%) |
| 35 to 50 years | 0 (0.0%) | 0 (0.0%) |
| Total | 0 (0.0%) | 0 (0.0%) |
Fertility by Education in Lompico
| Educational Attainment | Women with Births | Births / 1,000 Women |
| Less than High School | 0 (0.0%) | 0.0 |
| High School Diploma | 0 (0.0%) | 0.0 |
| College or Associate's Degree | 0 (0.0%) | 0.0 |
| Bachelor's Degree | 0 (0.0%) | 0.0 |
| Graduate Degree | 0 (0.0%) | 0.0 |
| Total | 0 (0.0%) | 0.0 |
Fertility by Education by Marriage Status in Lompico
| Educational Attainment | Married | Unmarried |
| Less than High School | 0 (0.0%) | 0 (0.0%) |
| High School Diploma | 0 (0.0%) | 0 (0.0%) |
| College or Associate's Degree | 0 (0.0%) | 0 (0.0%) |
| Bachelor's Degree | 0 (0.0%) | 0 (0.0%) |
| Graduate Degree | 0 (0.0%) | 0 (0.0%) |
| Total | 0 (0.0%) | 0 (0.0%) |
Employment Characteristics in Lompico
Employment by Class of Employer in Lompico
Among the 490 employed individuals in Lompico, private company employees (270 | 55.1%), local government employees (104 | 21.2%), and self-employed (not incorporated) (45 | 9.2%) make up the most common classes of employment.
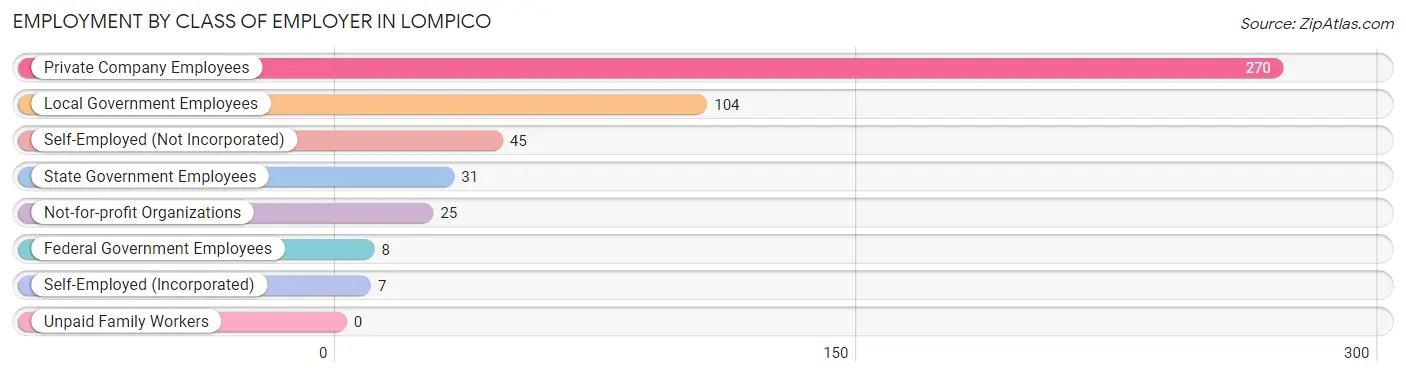
| Employer Class | # Employees | % Employees |
| Private Company Employees | 270 | 55.1% |
| Self-Employed (Incorporated) | 7 | 1.4% |
| Self-Employed (Not Incorporated) | 45 | 9.2% |
| Not-for-profit Organizations | 25 | 5.1% |
| Local Government Employees | 104 | 21.2% |
| State Government Employees | 31 | 6.3% |
| Federal Government Employees | 8 | 1.6% |
| Unpaid Family Workers | 0 | 0.0% |
| Total | 490 | 100.0% |
Employment Status by Age in Lompico
According to the labor force statistics for Lompico, out of the total population over 16 years of age (807), 63.9% or 516 individuals are in the labor force, with 3.3% or 17 of them unemployed. The age group with the highest labor force participation rate is 30 to 34 years, with 100.0% or 100 individuals in the labor force. Within the labor force, the 35 to 44 years age range has the highest percentage of unemployed individuals, with 8.9% or 11 of them being unemployed.
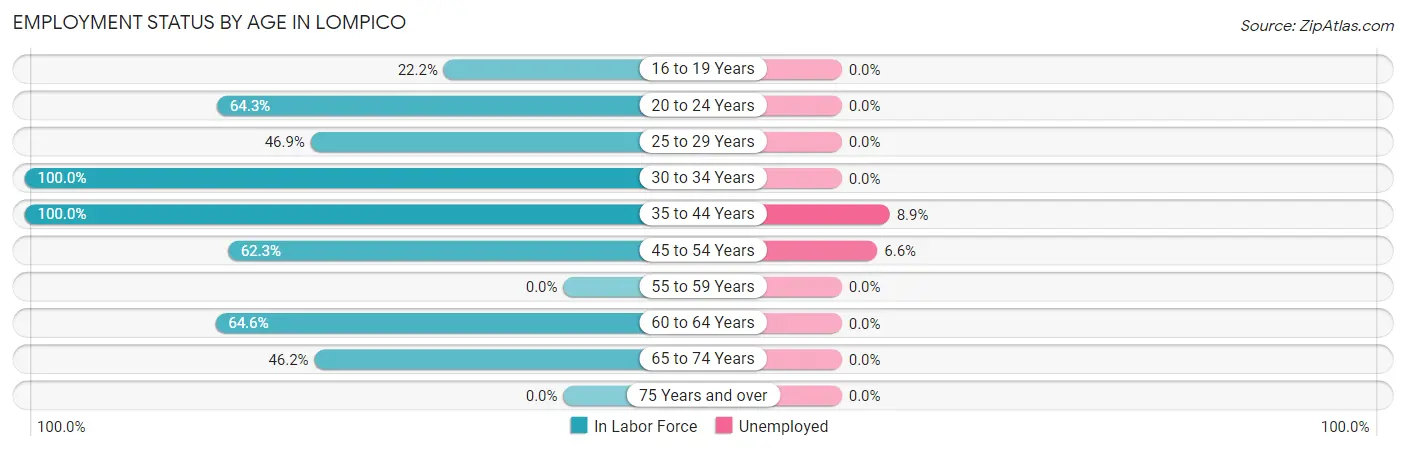
| Age Bracket | In Labor Force | Unemployed |
| 16 to 19 Years | 6 (22.2%) | 0 (0.0%) |
| 20 to 24 Years | 9 (64.3%) | 0 (0.0%) |
| 25 to 29 Years | 23 (46.9%) | 0 (0.0%) |
| 30 to 34 Years | 100 (100.0%) | 0 (0.0%) |
| 35 to 44 Years | 123 (100.0%) | 11 (8.9%) |
| 45 to 54 Years | 91 (62.3%) | 6 (6.6%) |
| 55 to 59 Years | 0 (0.0%) | 0 (0.0%) |
| 60 to 64 Years | 73 (64.6%) | 0 (0.0%) |
| 65 to 74 Years | 91 (46.2%) | 0 (0.0%) |
| 75 Years and over | 0 (0.0%) | 0 (0.0%) |
| Total | 516 (63.9%) | 17 (3.3%) |
Employment Status by Educational Attainment in Lompico
According to labor force statistics for Lompico, 77.2% of individuals (410) out of the total population between 25 and 64 years of age (531) are in the labor force, with 4.1% or 17 of them being unemployed. The group with the highest labor force participation rate are those with the educational attainment of bachelor's degree or higher, with 83.7% or 211 individuals in the labor force. Within the labor force, individuals with high school diploma education have the highest percentage of unemployment, with 19.4% or 6 of them being unemployed.
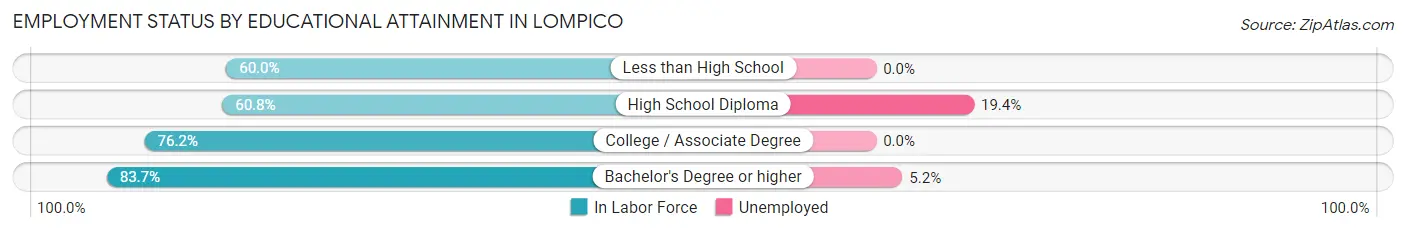
| Educational Attainment | In Labor Force | Unemployed |
| Less than High School | 21 (60.0%) | 0 (0.0%) |
| High School Diploma | 31 (60.8%) | 10 (19.4%) |
| College / Associate Degree | 147 (76.2%) | 0 (0.0%) |
| Bachelor's Degree or higher | 211 (83.7%) | 13 (5.2%) |
| Total | 410 (77.2%) | 22 (4.1%) |
Employment Occupations by Sex in Lompico
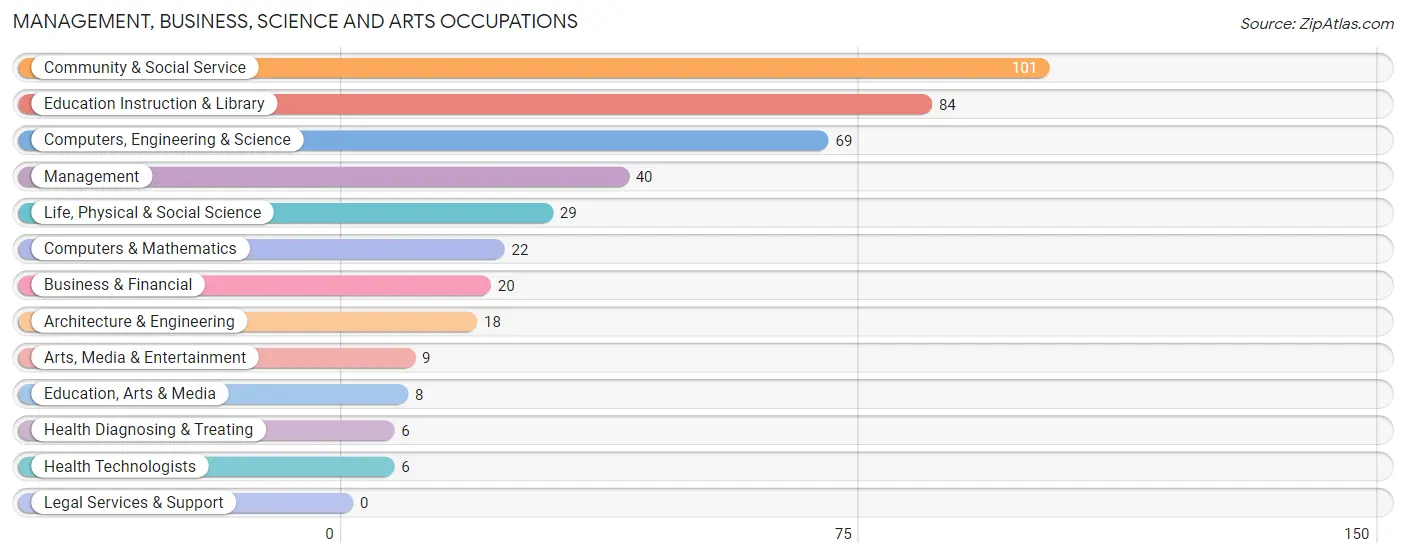
Management, Business, Science and Arts Occupations
The most common Management, Business, Science and Arts occupations in Lompico are Community & Social Service (101 | 20.2%), Education Instruction & Library (84 | 16.8%), Computers, Engineering & Science (69 | 13.8%), Management (40 | 8.0%), and Life, Physical & Social Science (29 | 5.8%).
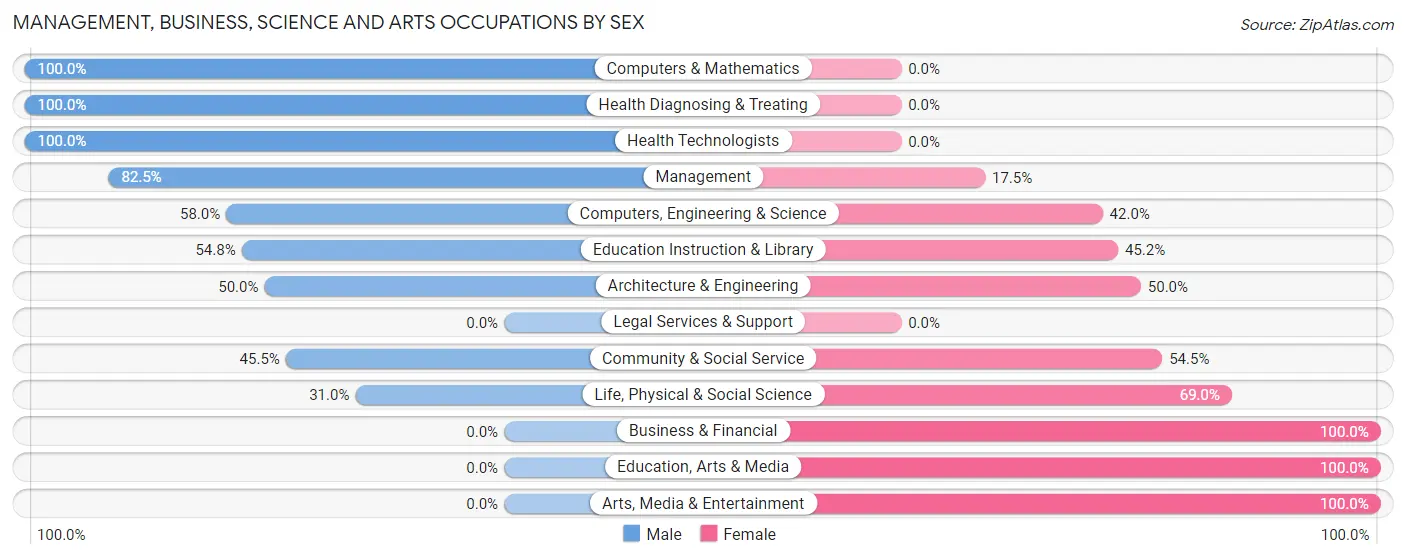
Management, Business, Science and Arts Occupations by Sex
Within the Management, Business, Science and Arts occupations in Lompico, the most male-oriented occupations are Computers & Mathematics (100.0%), Health Diagnosing & Treating (100.0%), and Health Technologists (100.0%), while the most female-oriented occupations are Business & Financial (100.0%), Education, Arts & Media (100.0%), and Arts, Media & Entertainment (100.0%).
| Occupation | Male | Female |
| Management | 33 (82.5%) | 7 (17.5%) |
| Business & Financial | 0 (0.0%) | 20 (100.0%) |
| Computers, Engineering & Science | 40 (58.0%) | 29 (42.0%) |
| Computers & Mathematics | 22 (100.0%) | 0 (0.0%) |
| Architecture & Engineering | 9 (50.0%) | 9 (50.0%) |
| Life, Physical & Social Science | 9 (31.0%) | 20 (69.0%) |
| Community & Social Service | 46 (45.5%) | 55 (54.5%) |
| Education, Arts & Media | 0 (0.0%) | 8 (100.0%) |
| Legal Services & Support | 0 (0.0%) | 0 (0.0%) |
| Education Instruction & Library | 46 (54.8%) | 38 (45.2%) |
| Arts, Media & Entertainment | 0 (0.0%) | 9 (100.0%) |
| Health Diagnosing & Treating | 6 (100.0%) | 0 (0.0%) |
| Health Technologists | 6 (100.0%) | 0 (0.0%) |
| Total (Category) | 125 (53.0%) | 111 (47.0%) |
| Total (Overall) | 260 (52.1%) | 239 (47.9%) |
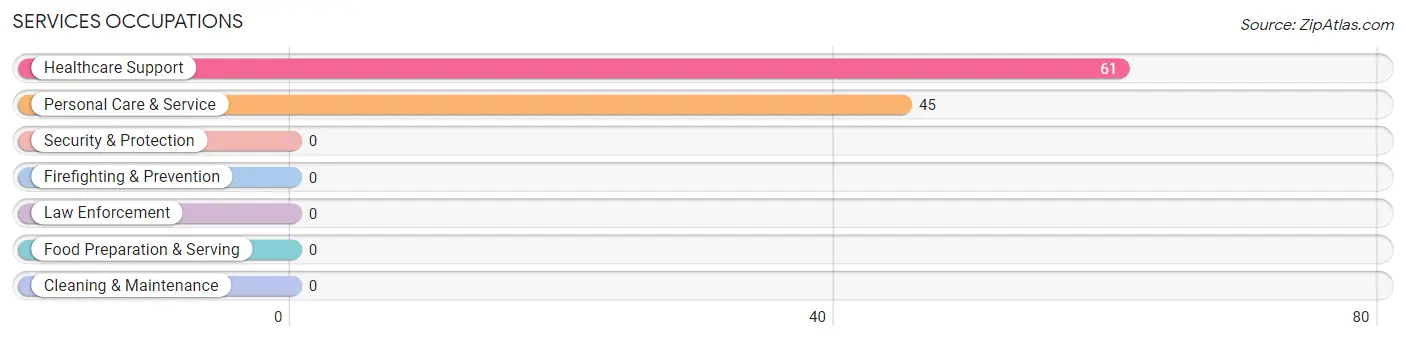
Services Occupations
The most common Services occupations in Lompico are Healthcare Support (61 | 12.2%), and Personal Care & Service (45 | 9.0%).
Services Occupations by Sex
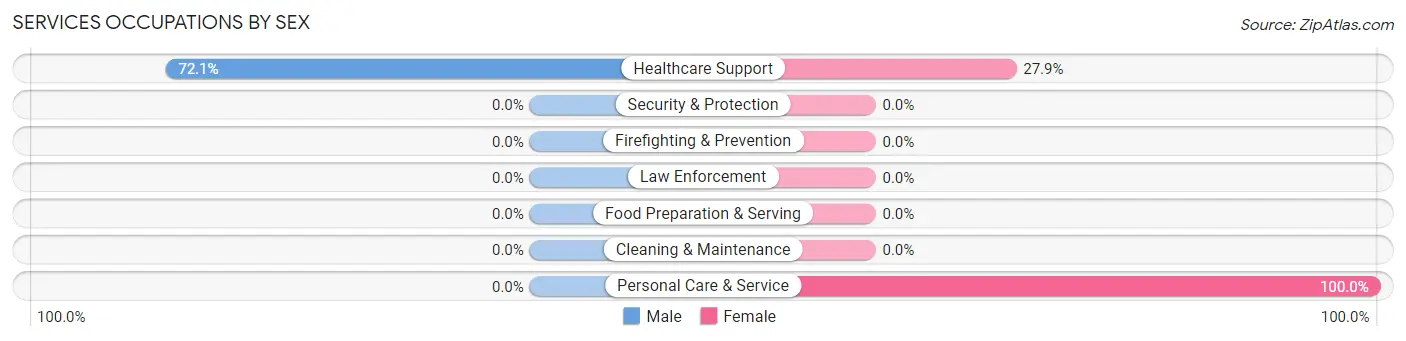
| Occupation | Male | Female |
| Healthcare Support | 44 (72.1%) | 17 (27.9%) |
| Security & Protection | 0 (0.0%) | 0 (0.0%) |
| Firefighting & Prevention | 0 (0.0%) | 0 (0.0%) |
| Law Enforcement | 0 (0.0%) | 0 (0.0%) |
| Food Preparation & Serving | 0 (0.0%) | 0 (0.0%) |
| Cleaning & Maintenance | 0 (0.0%) | 0 (0.0%) |
| Personal Care & Service | 0 (0.0%) | 45 (100.0%) |
| Total (Category) | 44 (41.5%) | 62 (58.5%) |
| Total (Overall) | 260 (52.1%) | 239 (47.9%) |
Sales and Office Occupations
The most common Sales and Office occupations in Lompico are Office & Administration (33 | 6.6%), and Sales & Related (18 | 3.6%).
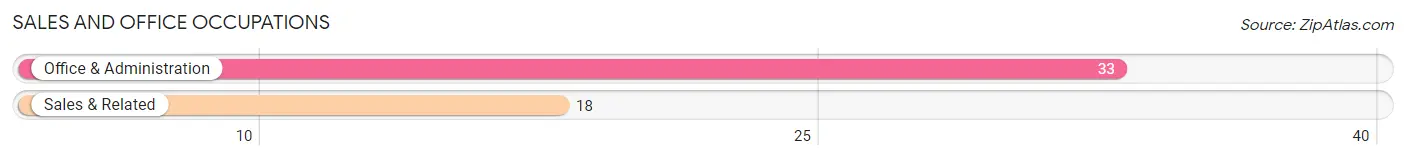
Sales and Office Occupations by Sex
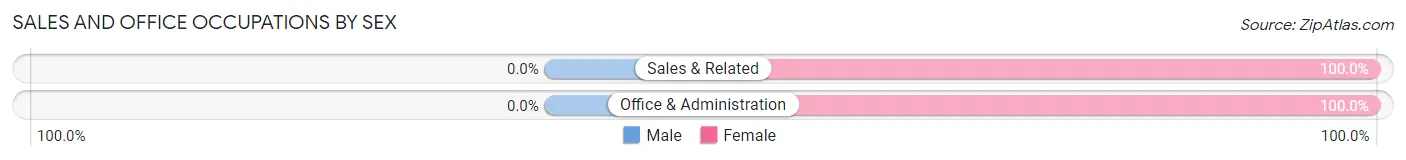
| Occupation | Male | Female |
| Sales & Related | 0 (0.0%) | 18 (100.0%) |
| Office & Administration | 0 (0.0%) | 33 (100.0%) |
| Total (Category) | 0 (0.0%) | 51 (100.0%) |
| Total (Overall) | 260 (52.1%) | 239 (47.9%) |
Natural Resources, Construction and Maintenance Occupations
The most common Natural Resources, Construction and Maintenance occupations in Lompico are Installation, Maintenance & Repair (50 | 10.0%), and Construction & Extraction (28 | 5.6%).
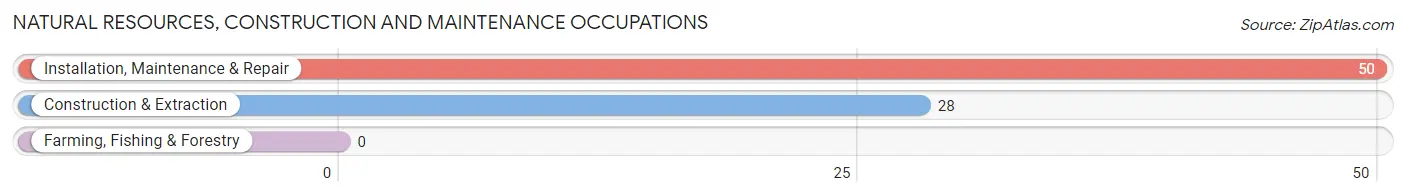
Natural Resources, Construction and Maintenance Occupations by Sex
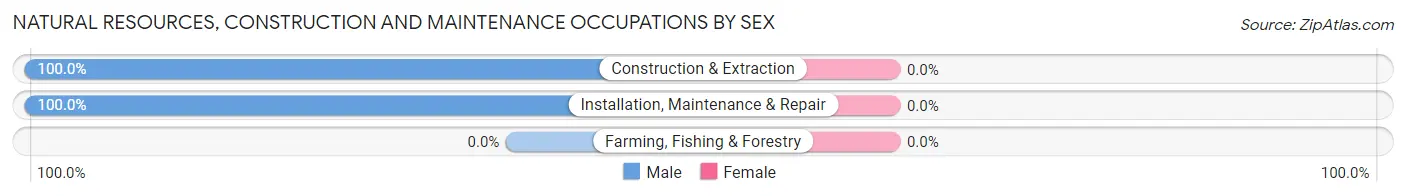
| Occupation | Male | Female |
| Farming, Fishing & Forestry | 0 (0.0%) | 0 (0.0%) |
| Construction & Extraction | 28 (100.0%) | 0 (0.0%) |
| Installation, Maintenance & Repair | 50 (100.0%) | 0 (0.0%) |
| Total (Category) | 78 (100.0%) | 0 (0.0%) |
| Total (Overall) | 260 (52.1%) | 239 (47.9%) |
Production, Transportation and Moving Occupations
The most common Production, Transportation and Moving occupations in Lompico are Material Moving (13 | 2.6%), Transportation (9 | 1.8%), and Production (6 | 1.2%).
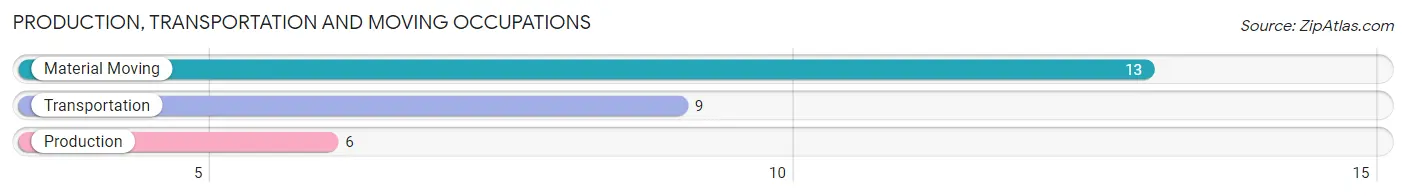
Production, Transportation and Moving Occupations by Sex
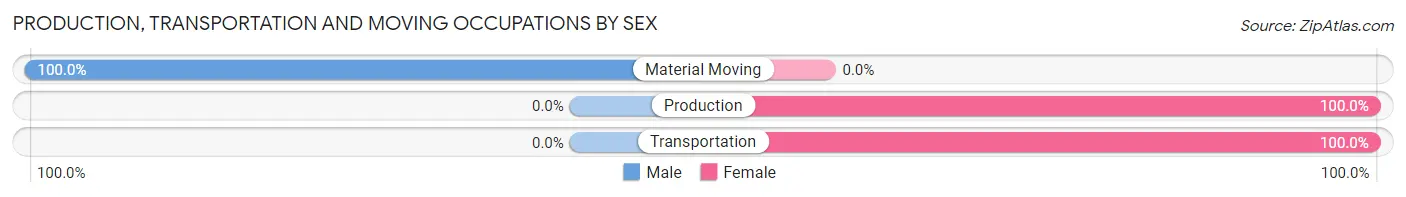
| Occupation | Male | Female |
| Production | 0 (0.0%) | 6 (100.0%) |
| Transportation | 0 (0.0%) | 9 (100.0%) |
| Material Moving | 13 (100.0%) | 0 (0.0%) |
| Total (Category) | 13 (46.4%) | 15 (53.6%) |
| Total (Overall) | 260 (52.1%) | 239 (47.9%) |
Employment Industries by Sex in Lompico
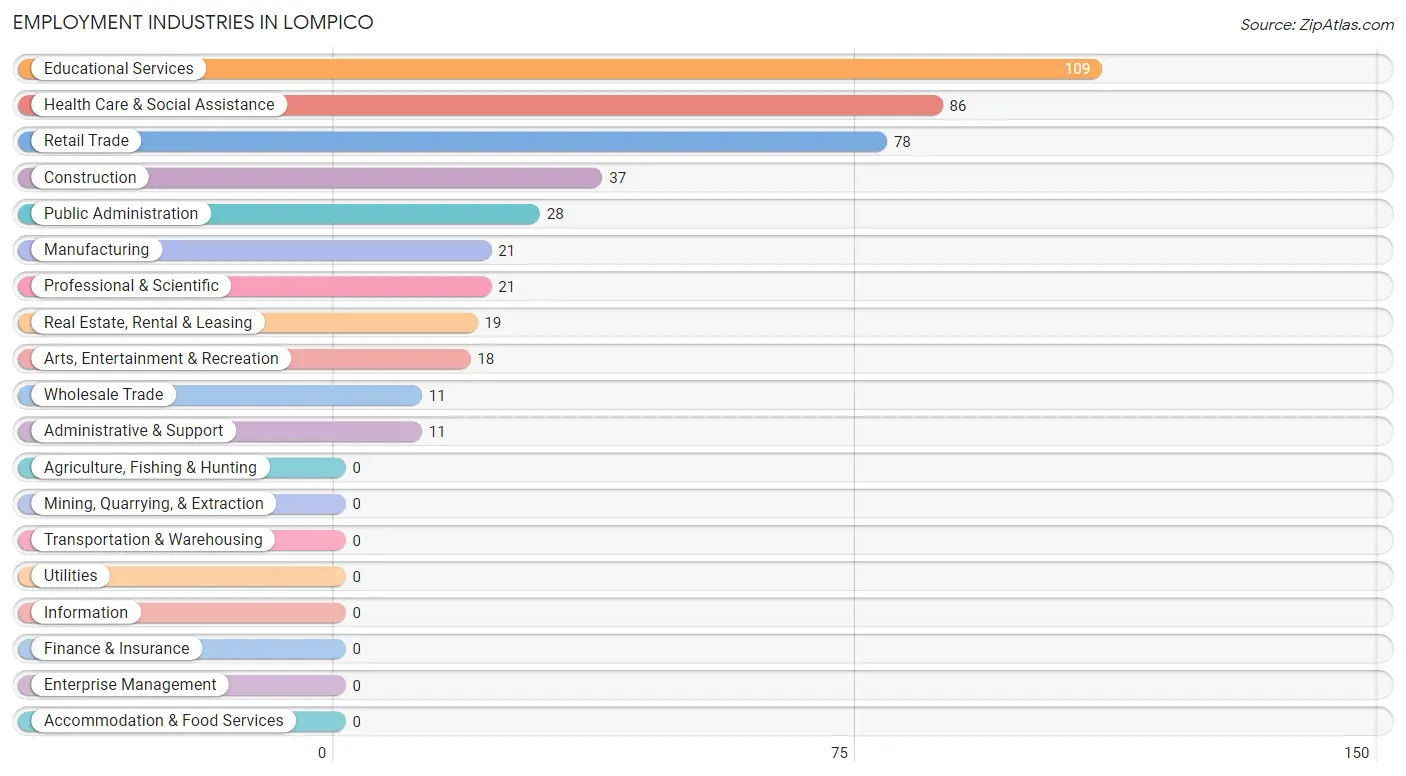
Employment Industries in Lompico
The major employment industries in Lompico include Educational Services (109 | 21.8%), Health Care & Social Assistance (86 | 17.2%), Retail Trade (78 | 15.6%), Construction (37 | 7.4%), and Public Administration (28 | 5.6%).
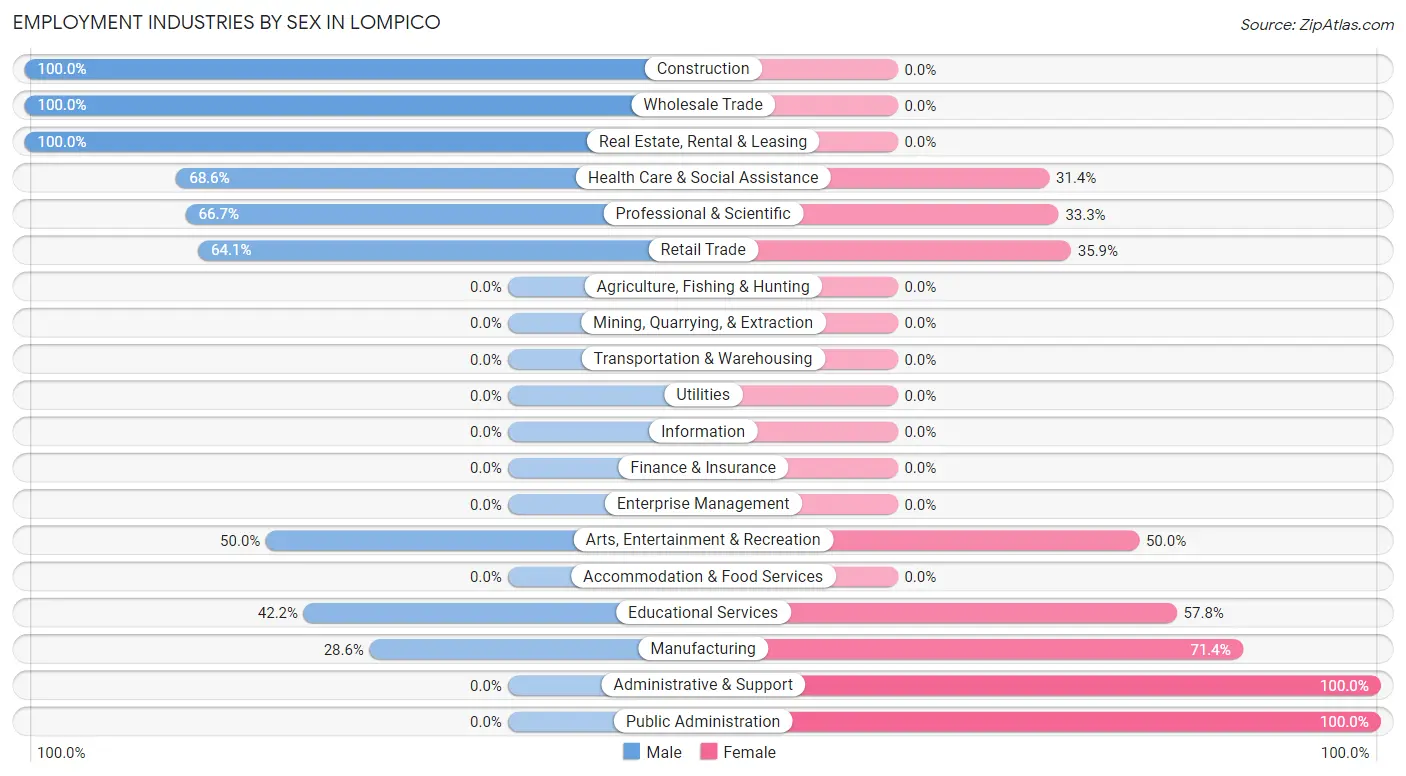
Employment Industries by Sex in Lompico
The Lompico industries that see more men than women are Construction (100.0%), Wholesale Trade (100.0%), and Real Estate, Rental & Leasing (100.0%), whereas the industries that tend to have a higher number of women are Administrative & Support (100.0%), Public Administration (100.0%), and Manufacturing (71.4%).
| Industry | Male | Female |
| Agriculture, Fishing & Hunting | 0 (0.0%) | 0 (0.0%) |
| Mining, Quarrying, & Extraction | 0 (0.0%) | 0 (0.0%) |
| Construction | 37 (100.0%) | 0 (0.0%) |
| Manufacturing | 6 (28.6%) | 15 (71.4%) |
| Wholesale Trade | 11 (100.0%) | 0 (0.0%) |
| Retail Trade | 50 (64.1%) | 28 (35.9%) |
| Transportation & Warehousing | 0 (0.0%) | 0 (0.0%) |
| Utilities | 0 (0.0%) | 0 (0.0%) |
| Information | 0 (0.0%) | 0 (0.0%) |
| Finance & Insurance | 0 (0.0%) | 0 (0.0%) |
| Real Estate, Rental & Leasing | 19 (100.0%) | 0 (0.0%) |
| Professional & Scientific | 14 (66.7%) | 7 (33.3%) |
| Enterprise Management | 0 (0.0%) | 0 (0.0%) |
| Administrative & Support | 0 (0.0%) | 11 (100.0%) |
| Educational Services | 46 (42.2%) | 63 (57.8%) |
| Health Care & Social Assistance | 59 (68.6%) | 27 (31.4%) |
| Arts, Entertainment & Recreation | 9 (50.0%) | 9 (50.0%) |
| Accommodation & Food Services | 0 (0.0%) | 0 (0.0%) |
| Public Administration | 0 (0.0%) | 28 (100.0%) |
| Total | 260 (52.1%) | 239 (47.9%) |
Education in Lompico
School Enrollment in Lompico
The most common levels of schooling among the 164 students in Lompico are middle school (53 | 32.3%), high school (31 | 18.9%), and elementary school (26 | 15.9%).
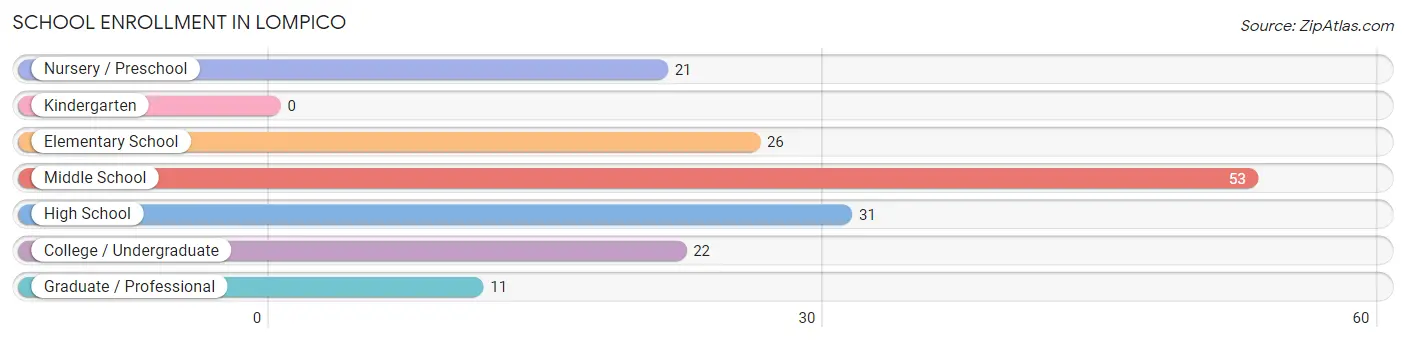
| School Level | # Students | % Students |
| Nursery / Preschool | 21 | 12.8% |
| Kindergarten | 0 | 0.0% |
| Elementary School | 26 | 15.9% |
| Middle School | 53 | 32.3% |
| High School | 31 | 18.9% |
| College / Undergraduate | 22 | 13.4% |
| Graduate / Professional | 11 | 6.7% |
| Total | 164 | 100.0% |
School Enrollment by Age by Funding Source in Lompico
Out of a total of 164 students who are enrolled in schools in Lompico, 29 (17.7%) attend a private institution, while the remaining 135 (82.3%) are enrolled in public schools. The age group of 18 to 19 year olds has the highest likelihood of being enrolled in private schools, with 6 (100.0% in the age bracket) enrolled. Conversely, the age group of 3 to 4 year olds has the lowest likelihood of being enrolled in a private school, with 14 (100.0% in the age bracket) attending a public institution.
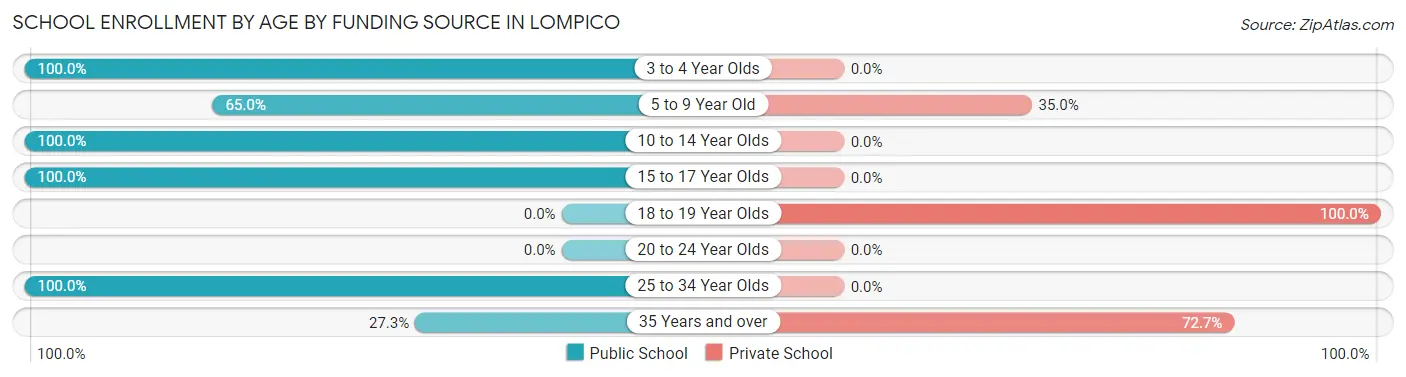
| Age Bracket | Public School | Private School |
| 3 to 4 Year Olds | 14 (100.0%) | 0 (0.0%) |
| 5 to 9 Year Old | 13 (65.0%) | 7 (35.0%) |
| 10 to 14 Year Olds | 66 (100.0%) | 0 (0.0%) |
| 15 to 17 Year Olds | 25 (100.0%) | 0 (0.0%) |
| 18 to 19 Year Olds | 0 (0.0%) | 6 (100.0%) |
| 20 to 24 Year Olds | 0 (0.0%) | 0 (0.0%) |
| 25 to 34 Year Olds | 11 (100.0%) | 0 (0.0%) |
| 35 Years and over | 6 (27.3%) | 16 (72.7%) |
| Total | 135 (82.3%) | 29 (17.7%) |
Educational Attainment by Field of Study in Lompico
Education (65 | 17.2%), psychology (54 | 14.3%), visual & performing arts (46 | 12.2%), computers & mathematics (34 | 9.0%), and arts & humanities (32 | 8.5%) are the most common fields of study among 378 individuals in Lompico who have obtained a bachelor's degree or higher.
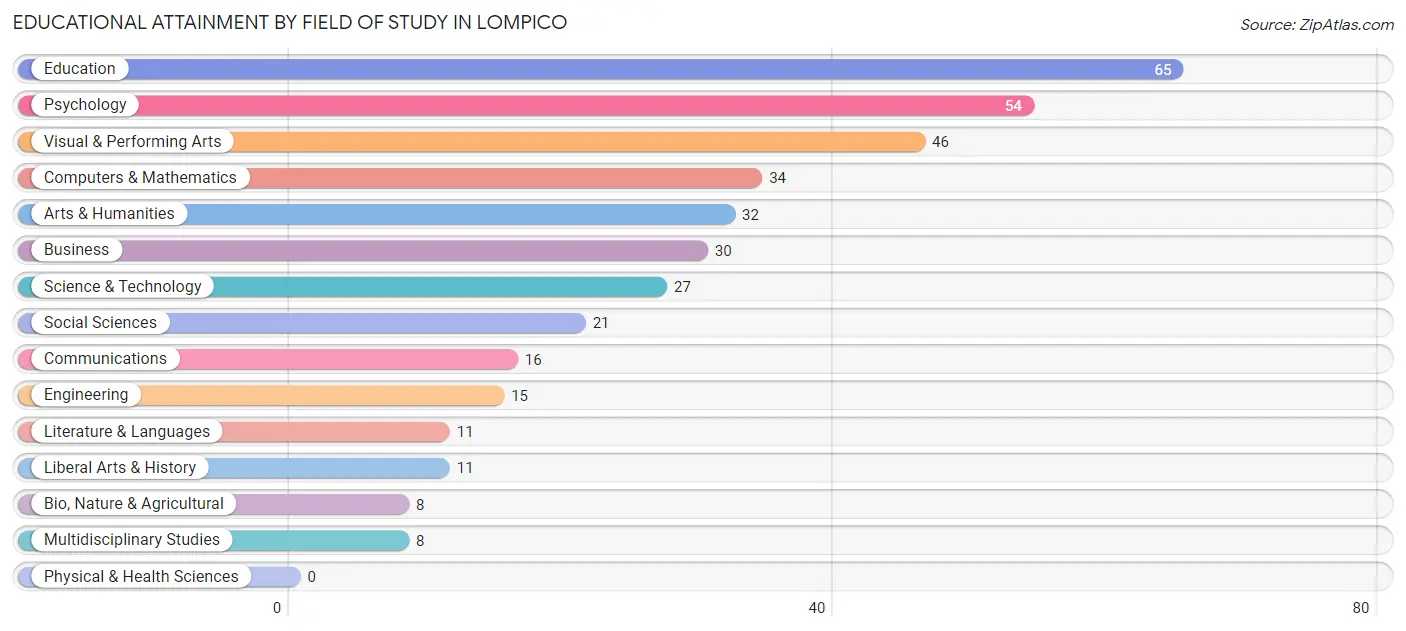
| Field of Study | # Graduates | % Graduates |
| Computers & Mathematics | 34 | 9.0% |
| Bio, Nature & Agricultural | 8 | 2.1% |
| Physical & Health Sciences | 0 | 0.0% |
| Psychology | 54 | 14.3% |
| Social Sciences | 21 | 5.6% |
| Engineering | 15 | 4.0% |
| Multidisciplinary Studies | 8 | 2.1% |
| Science & Technology | 27 | 7.1% |
| Business | 30 | 7.9% |
| Education | 65 | 17.2% |
| Literature & Languages | 11 | 2.9% |
| Liberal Arts & History | 11 | 2.9% |
| Visual & Performing Arts | 46 | 12.2% |
| Communications | 16 | 4.2% |
| Arts & Humanities | 32 | 8.5% |
| Total | 378 | 100.0% |
Transportation & Commute in Lompico
Vehicle Availability by Sex in Lompico
The most prevalent vehicle ownership categories in Lompico are males with 2 vehicles (148, accounting for 56.9%) and females with 2 vehicles (121, making up 64.3%).
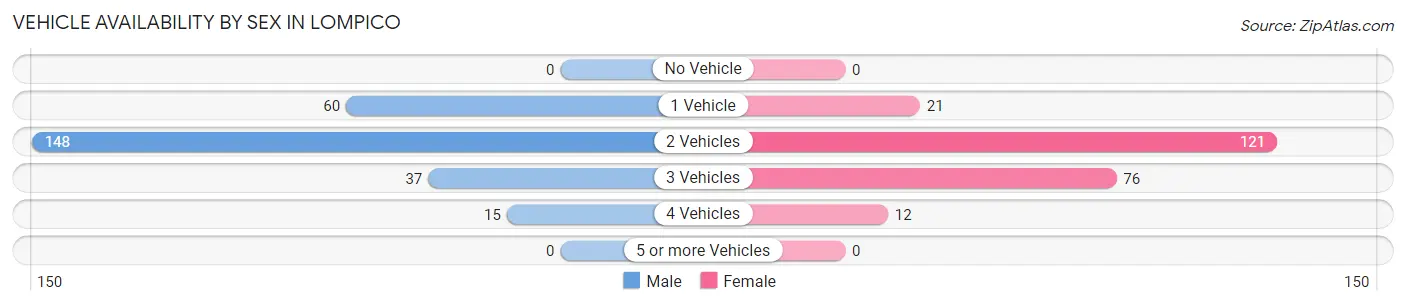
| Vehicles Available | Male | Female |
| No Vehicle | 0 (0.0%) | 0 (0.0%) |
| 1 Vehicle | 60 (23.1%) | 21 (9.1%) |
| 2 Vehicles | 148 (56.9%) | 121 (52.6%) |
| 3 Vehicles | 37 (14.2%) | 76 (33.0%) |
| 4 Vehicles | 15 (5.8%) | 12 (5.2%) |
| 5 or more Vehicles | 0 (0.0%) | 0 (0.0%) |
| Total | 260 (100.0%) | 230 (100.0%) |
Commute Time in Lompico
The most frequently occuring commute durations in Lompico are 60 to 89 minutes (103 commuters, 29.5%), 45 to 59 minutes (59 commuters, 16.9%), and 20 to 24 minutes (51 commuters, 14.6%).
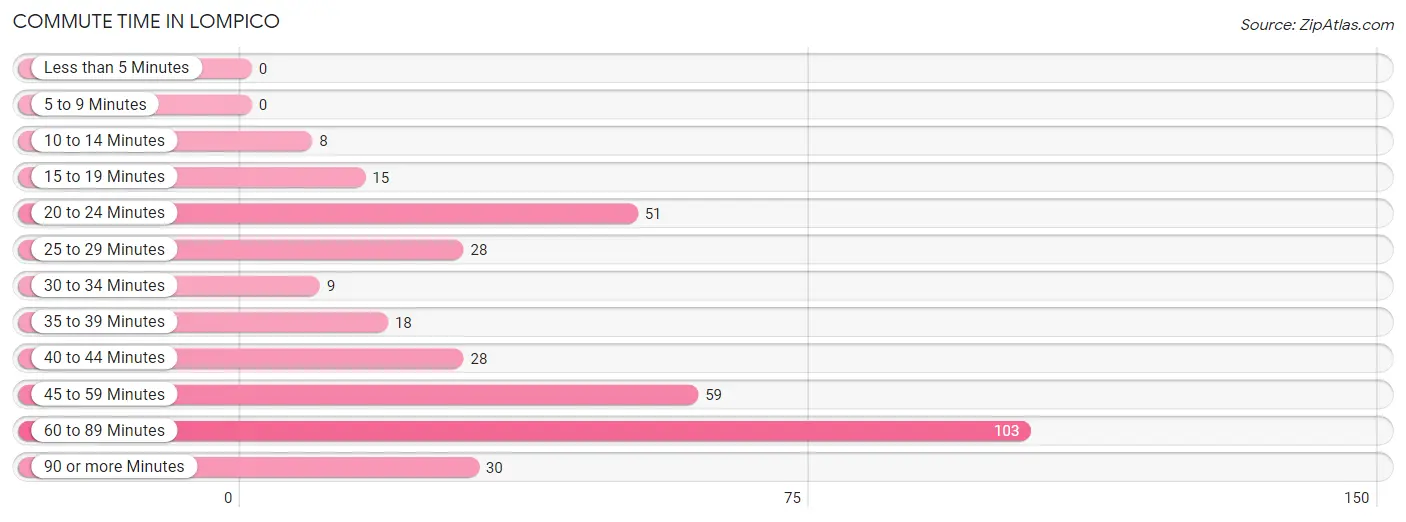
| Commute Time | # Commuters | % Commuters |
| Less than 5 Minutes | 0 | 0.0% |
| 5 to 9 Minutes | 0 | 0.0% |
| 10 to 14 Minutes | 8 | 2.3% |
| 15 to 19 Minutes | 15 | 4.3% |
| 20 to 24 Minutes | 51 | 14.6% |
| 25 to 29 Minutes | 28 | 8.0% |
| 30 to 34 Minutes | 9 | 2.6% |
| 35 to 39 Minutes | 18 | 5.2% |
| 40 to 44 Minutes | 28 | 8.0% |
| 45 to 59 Minutes | 59 | 16.9% |
| 60 to 89 Minutes | 103 | 29.5% |
| 90 or more Minutes | 30 | 8.6% |
Commute Time by Sex in Lompico
The most common commute times in Lompico are 60 to 89 minutes (62 commuters, 29.9%) for males and 60 to 89 minutes (41 commuters, 28.9%) for females.
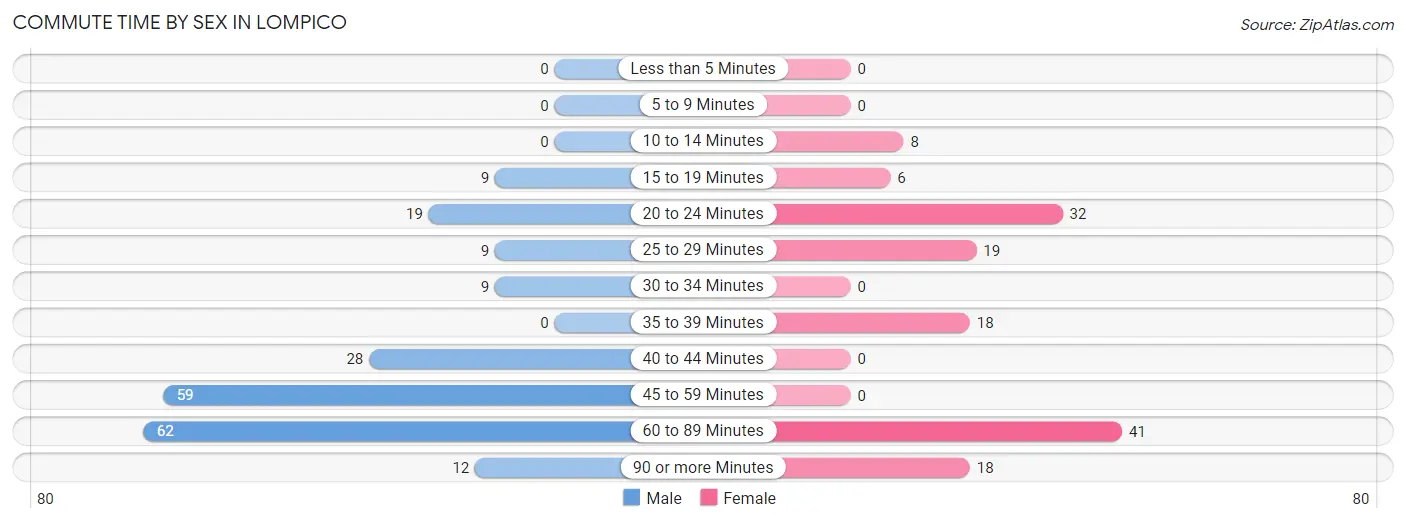
| Commute Time | Male | Female |
| Less than 5 Minutes | 0 (0.0%) | 0 (0.0%) |
| 5 to 9 Minutes | 0 (0.0%) | 0 (0.0%) |
| 10 to 14 Minutes | 0 (0.0%) | 8 (5.6%) |
| 15 to 19 Minutes | 9 (4.3%) | 6 (4.2%) |
| 20 to 24 Minutes | 19 (9.2%) | 32 (22.5%) |
| 25 to 29 Minutes | 9 (4.3%) | 19 (13.4%) |
| 30 to 34 Minutes | 9 (4.3%) | 0 (0.0%) |
| 35 to 39 Minutes | 0 (0.0%) | 18 (12.7%) |
| 40 to 44 Minutes | 28 (13.5%) | 0 (0.0%) |
| 45 to 59 Minutes | 59 (28.5%) | 0 (0.0%) |
| 60 to 89 Minutes | 62 (29.9%) | 41 (28.9%) |
| 90 or more Minutes | 12 (5.8%) | 18 (12.7%) |
Time of Departure to Work by Sex in Lompico
The most frequent times of departure to work in Lompico are 8:00 AM to 8:29 AM (46, 22.2%) for males and 8:30 AM to 8:59 AM (38, 26.8%) for females.
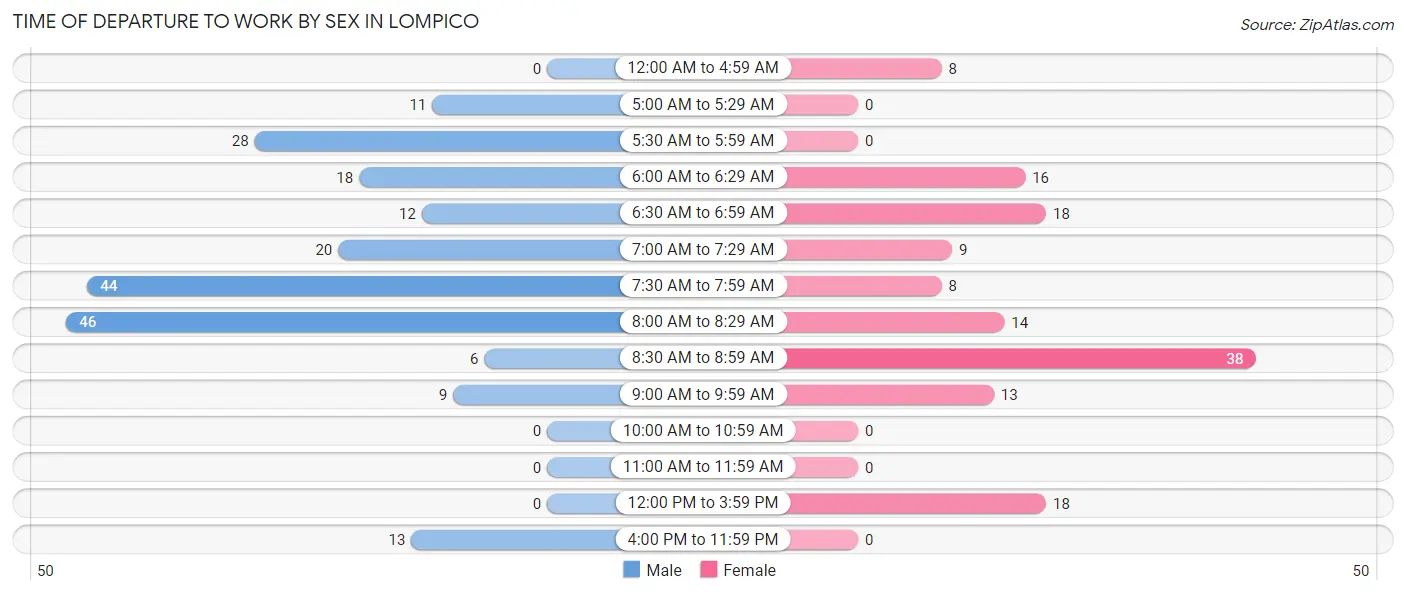
| Time of Departure | Male | Female |
| 12:00 AM to 4:59 AM | 0 (0.0%) | 8 (5.6%) |
| 5:00 AM to 5:29 AM | 11 (5.3%) | 0 (0.0%) |
| 5:30 AM to 5:59 AM | 28 (13.5%) | 0 (0.0%) |
| 6:00 AM to 6:29 AM | 18 (8.7%) | 16 (11.3%) |
| 6:30 AM to 6:59 AM | 12 (5.8%) | 18 (12.7%) |
| 7:00 AM to 7:29 AM | 20 (9.7%) | 9 (6.3%) |
| 7:30 AM to 7:59 AM | 44 (21.3%) | 8 (5.6%) |
| 8:00 AM to 8:29 AM | 46 (22.2%) | 14 (9.9%) |
| 8:30 AM to 8:59 AM | 6 (2.9%) | 38 (26.8%) |
| 9:00 AM to 9:59 AM | 9 (4.3%) | 13 (9.1%) |
| 10:00 AM to 10:59 AM | 0 (0.0%) | 0 (0.0%) |
| 11:00 AM to 11:59 AM | 0 (0.0%) | 0 (0.0%) |
| 12:00 PM to 3:59 PM | 0 (0.0%) | 18 (12.7%) |
| 4:00 PM to 11:59 PM | 13 (6.3%) | 0 (0.0%) |
| Total | 207 (100.0%) | 142 (100.0%) |
Housing Occupancy in Lompico
Occupancy by Ownership in Lompico
Of the total 457 dwellings in Lompico, owner-occupied units account for 403 (88.2%), while renter-occupied units make up 54 (11.8%).
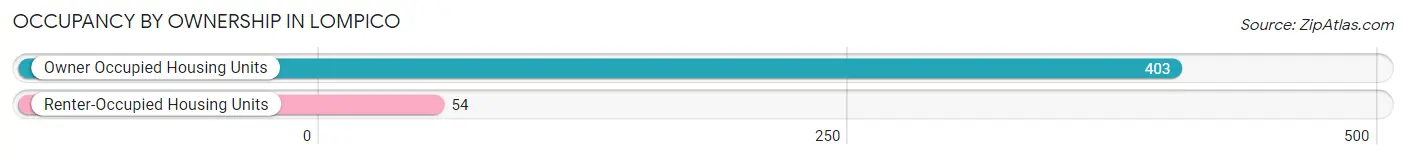
| Occupancy | # Housing Units | % Housing Units |
| Owner Occupied Housing Units | 403 | 88.2% |
| Renter-Occupied Housing Units | 54 | 11.8% |
| Total Occupied Housing Units | 457 | 100.0% |
Occupancy by Household Size in Lompico
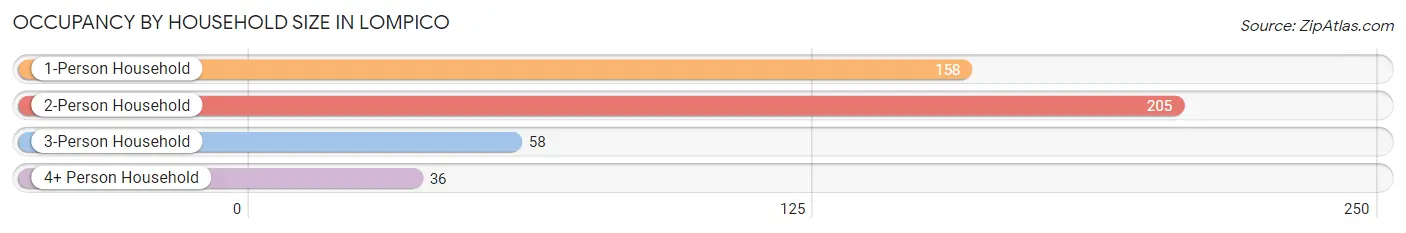
| Household Size | # Housing Units | % Housing Units |
| 1-Person Household | 158 | 34.6% |
| 2-Person Household | 205 | 44.9% |
| 3-Person Household | 58 | 12.7% |
| 4+ Person Household | 36 | 7.9% |
| Total Housing Units | 457 | 100.0% |
Occupancy by Ownership by Household Size in Lompico
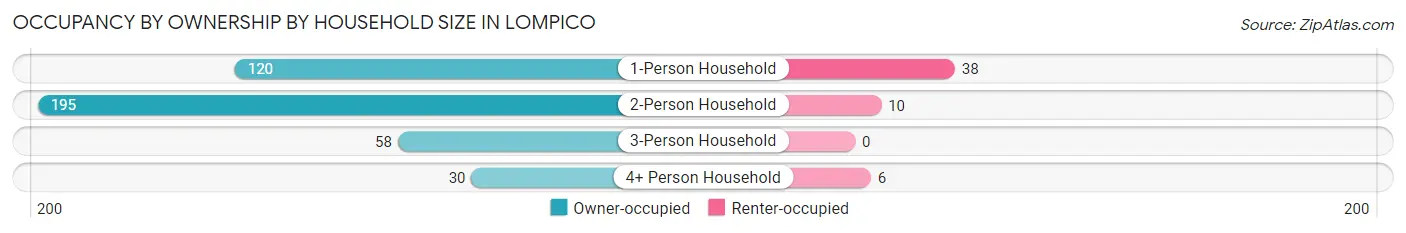
| Household Size | Owner-occupied | Renter-occupied |
| 1-Person Household | 120 (75.9%) | 38 (24.0%) |
| 2-Person Household | 195 (95.1%) | 10 (4.9%) |
| 3-Person Household | 58 (100.0%) | 0 (0.0%) |
| 4+ Person Household | 30 (83.3%) | 6 (16.7%) |
| Total Housing Units | 403 (88.2%) | 54 (11.8%) |
Occupancy by Educational Attainment in Lompico
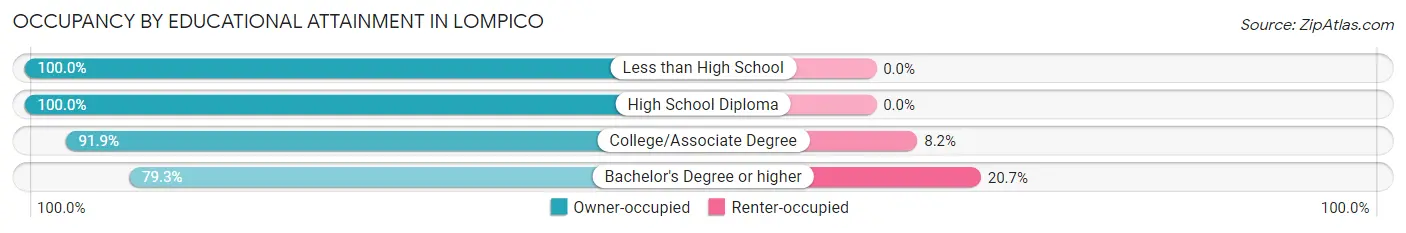
| Household Size | Owner-occupied | Renter-occupied |
| Less than High School | 21 (100.0%) | 0 (0.0%) |
| High School Diploma | 64 (100.0%) | 0 (0.0%) |
| College/Associate Degree | 169 (91.8%) | 15 (8.2%) |
| Bachelor's Degree or higher | 149 (79.3%) | 39 (20.7%) |
Occupancy by Age of Householder in Lompico
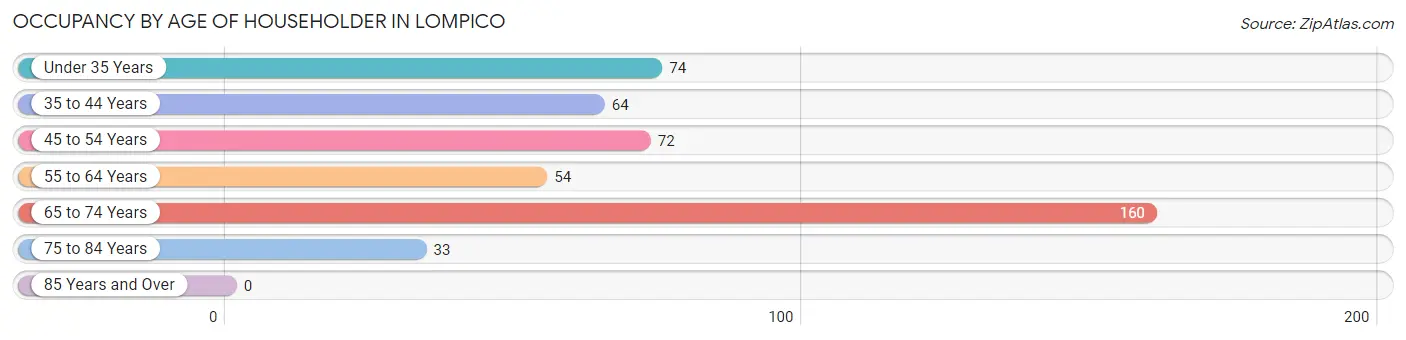
| Age Bracket | # Households | % Households |
| Under 35 Years | 74 | 16.2% |
| 35 to 44 Years | 64 | 14.0% |
| 45 to 54 Years | 72 | 15.8% |
| 55 to 64 Years | 54 | 11.8% |
| 65 to 74 Years | 160 | 35.0% |
| 75 to 84 Years | 33 | 7.2% |
| 85 Years and Over | 0 | 0.0% |
| Total | 457 | 100.0% |
Housing Finances in Lompico
Median Income by Occupancy in Lompico
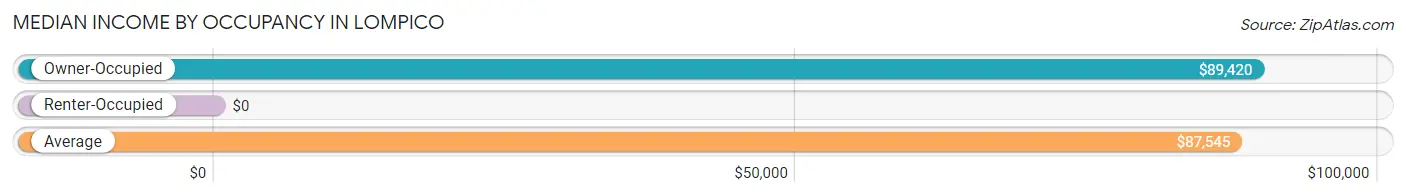
| Occupancy Type | # Households | Median Income |
| Owner-Occupied | 403 (88.2%) | $89,420 |
| Renter-Occupied | 54 (11.8%) | $0 |
| Average | 457 (100.0%) | $87,545 |
Occupancy by Householder Income Bracket in Lompico
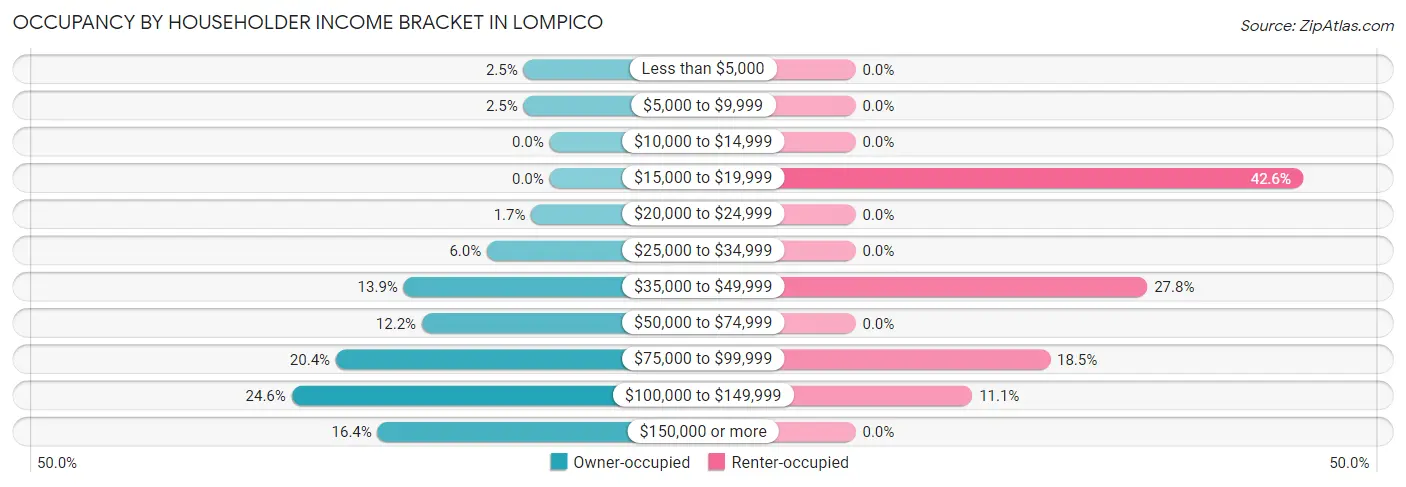
| Income Bracket | Owner-occupied | Renter-occupied |
| Less than $5,000 | 10 (2.5%) | 0 (0.0%) |
| $5,000 to $9,999 | 10 (2.5%) | 0 (0.0%) |
| $10,000 to $14,999 | 0 (0.0%) | 0 (0.0%) |
| $15,000 to $19,999 | 0 (0.0%) | 23 (42.6%) |
| $20,000 to $24,999 | 7 (1.7%) | 0 (0.0%) |
| $25,000 to $34,999 | 24 (6.0%) | 0 (0.0%) |
| $35,000 to $49,999 | 56 (13.9%) | 15 (27.8%) |
| $50,000 to $74,999 | 49 (12.2%) | 0 (0.0%) |
| $75,000 to $99,999 | 82 (20.3%) | 10 (18.5%) |
| $100,000 to $149,999 | 99 (24.6%) | 6 (11.1%) |
| $150,000 or more | 66 (16.4%) | 0 (0.0%) |
| Total | 403 (100.0%) | 54 (100.0%) |
Monthly Housing Cost Tiers in Lompico
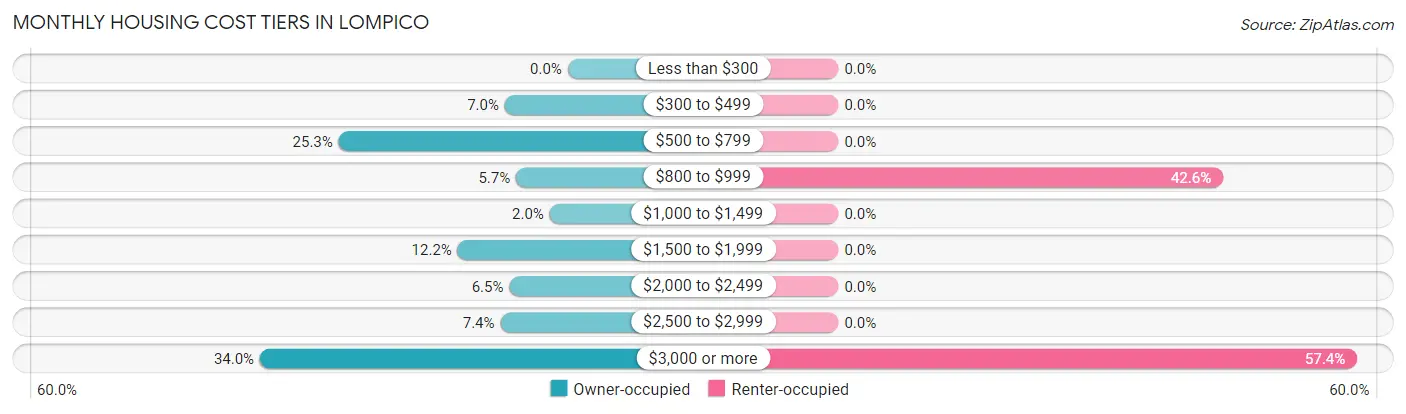
| Monthly Cost | Owner-occupied | Renter-occupied |
| Less than $300 | 0 (0.0%) | 0 (0.0%) |
| $300 to $499 | 28 (7.0%) | 0 (0.0%) |
| $500 to $799 | 102 (25.3%) | 0 (0.0%) |
| $800 to $999 | 23 (5.7%) | 23 (42.6%) |
| $1,000 to $1,499 | 8 (2.0%) | 0 (0.0%) |
| $1,500 to $1,999 | 49 (12.2%) | 0 (0.0%) |
| $2,000 to $2,499 | 26 (6.5%) | 0 (0.0%) |
| $2,500 to $2,999 | 30 (7.4%) | 0 (0.0%) |
| $3,000 or more | 137 (34.0%) | 31 (57.4%) |
| Total | 403 (100.0%) | 54 (100.0%) |
Physical Housing Characteristics in Lompico
Housing Structures in Lompico
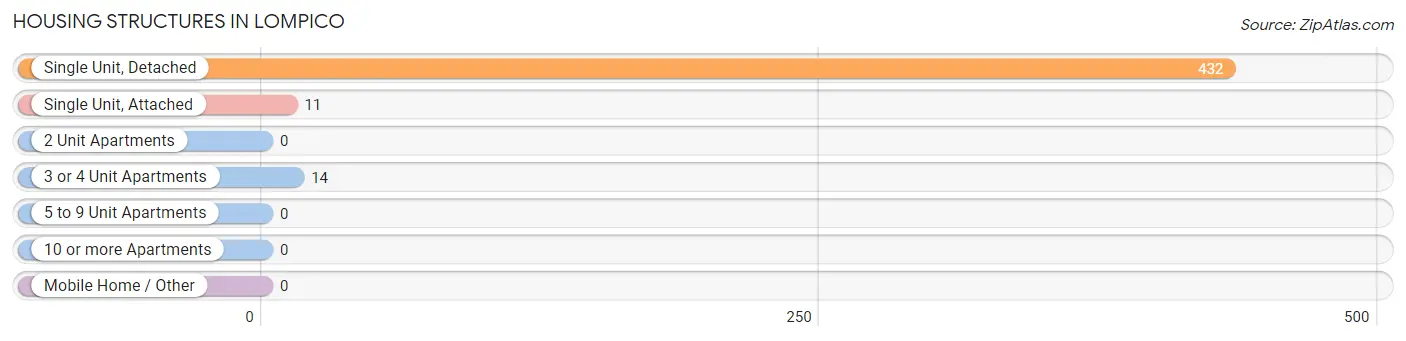
| Structure Type | # Housing Units | % Housing Units |
| Single Unit, Detached | 432 | 94.5% |
| Single Unit, Attached | 11 | 2.4% |
| 2 Unit Apartments | 0 | 0.0% |
| 3 or 4 Unit Apartments | 14 | 3.1% |
| 5 to 9 Unit Apartments | 0 | 0.0% |
| 10 or more Apartments | 0 | 0.0% |
| Mobile Home / Other | 0 | 0.0% |
| Total | 457 | 100.0% |
Housing Structures by Occupancy in Lompico
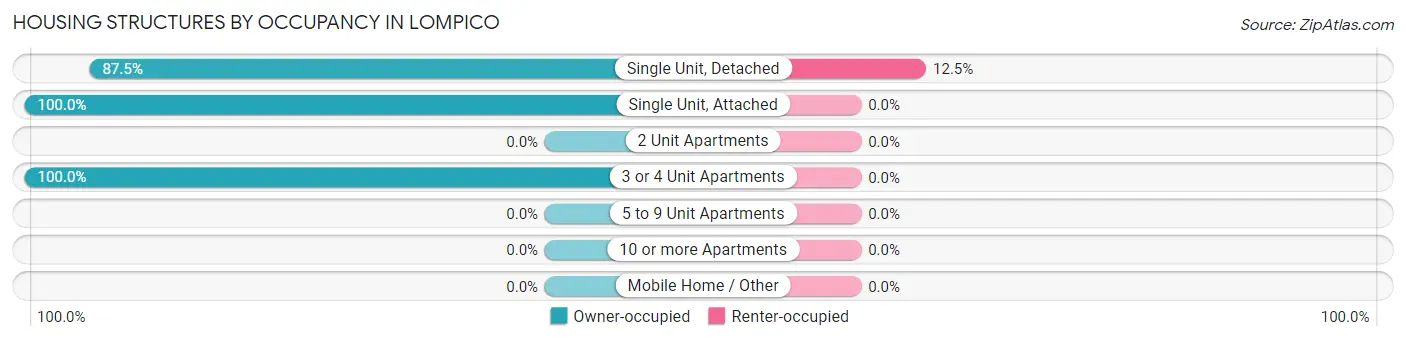
| Structure Type | Owner-occupied | Renter-occupied |
| Single Unit, Detached | 378 (87.5%) | 54 (12.5%) |
| Single Unit, Attached | 11 (100.0%) | 0 (0.0%) |
| 2 Unit Apartments | 0 (0.0%) | 0 (0.0%) |
| 3 or 4 Unit Apartments | 14 (100.0%) | 0 (0.0%) |
| 5 to 9 Unit Apartments | 0 (0.0%) | 0 (0.0%) |
| 10 or more Apartments | 0 (0.0%) | 0 (0.0%) |
| Mobile Home / Other | 0 (0.0%) | 0 (0.0%) |
| Total | 403 (88.2%) | 54 (11.8%) |
Housing Structures by Number of Rooms in Lompico
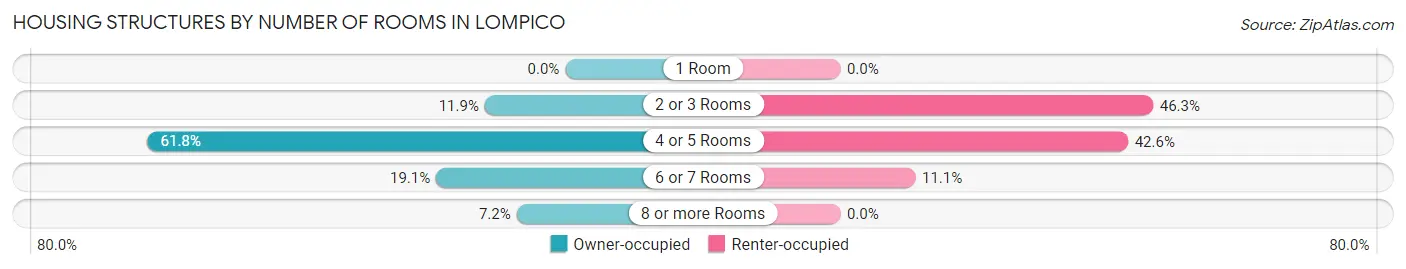
| Number of Rooms | Owner-occupied | Renter-occupied |
| 1 Room | 0 (0.0%) | 0 (0.0%) |
| 2 or 3 Rooms | 48 (11.9%) | 25 (46.3%) |
| 4 or 5 Rooms | 249 (61.8%) | 23 (42.6%) |
| 6 or 7 Rooms | 77 (19.1%) | 6 (11.1%) |
| 8 or more Rooms | 29 (7.2%) | 0 (0.0%) |
| Total | 403 (100.0%) | 54 (100.0%) |
Housing Structure by Heating Type in Lompico
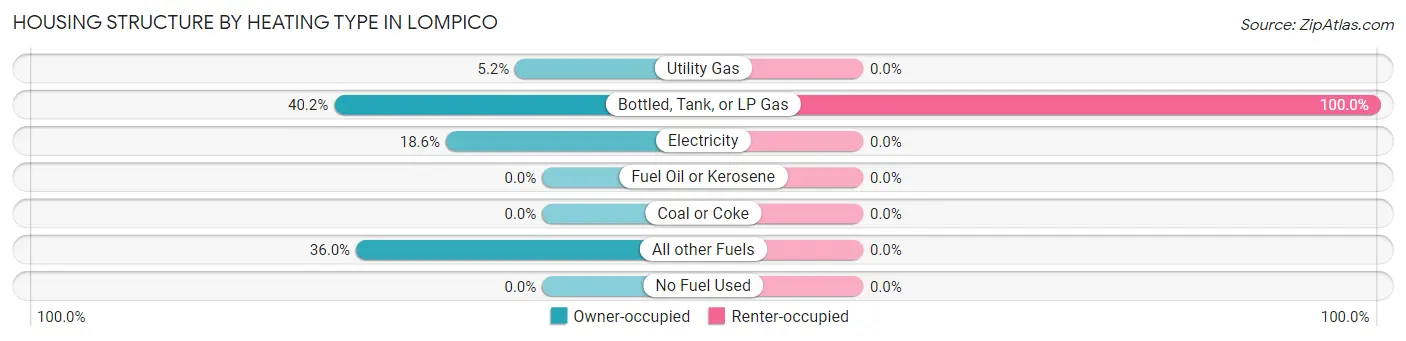
| Heating Type | Owner-occupied | Renter-occupied |
| Utility Gas | 21 (5.2%) | 0 (0.0%) |
| Bottled, Tank, or LP Gas | 162 (40.2%) | 54 (100.0%) |
| Electricity | 75 (18.6%) | 0 (0.0%) |
| Fuel Oil or Kerosene | 0 (0.0%) | 0 (0.0%) |
| Coal or Coke | 0 (0.0%) | 0 (0.0%) |
| All other Fuels | 145 (36.0%) | 0 (0.0%) |
| No Fuel Used | 0 (0.0%) | 0 (0.0%) |
| Total | 403 (100.0%) | 54 (100.0%) |
Household Vehicle Usage in Lompico
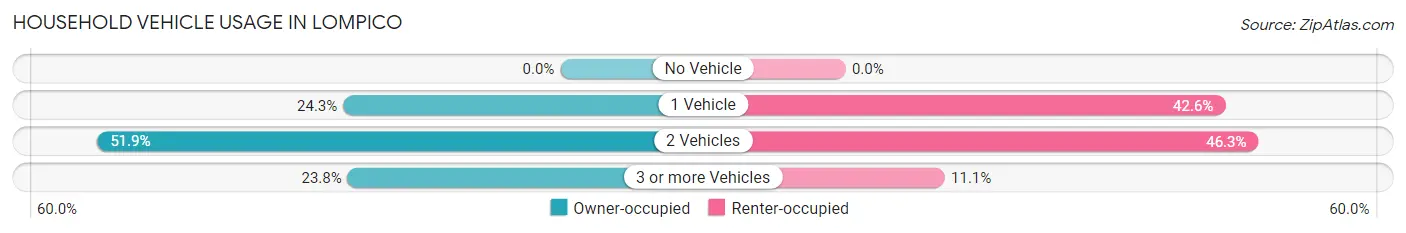
| Vehicles per Household | Owner-occupied | Renter-occupied |
| No Vehicle | 0 (0.0%) | 0 (0.0%) |
| 1 Vehicle | 98 (24.3%) | 23 (42.6%) |
| 2 Vehicles | 209 (51.9%) | 25 (46.3%) |
| 3 or more Vehicles | 96 (23.8%) | 6 (11.1%) |
| Total | 403 (100.0%) | 54 (100.0%) |
Real Estate & Mortgages in Lompico
Real Estate and Mortgage Overview in Lompico
| Characteristic | Without Mortgage | With Mortgage |
| Housing Units | 161 | 242 |
| Median Property Value | $611,200 | $641,000 |
| Median Household Income | $49,694 | $66 |
| Monthly Housing Costs | $640 | $137 |
| Real Estate Taxes | $2,434 | $0 |
Property Value by Mortgage Status in Lompico
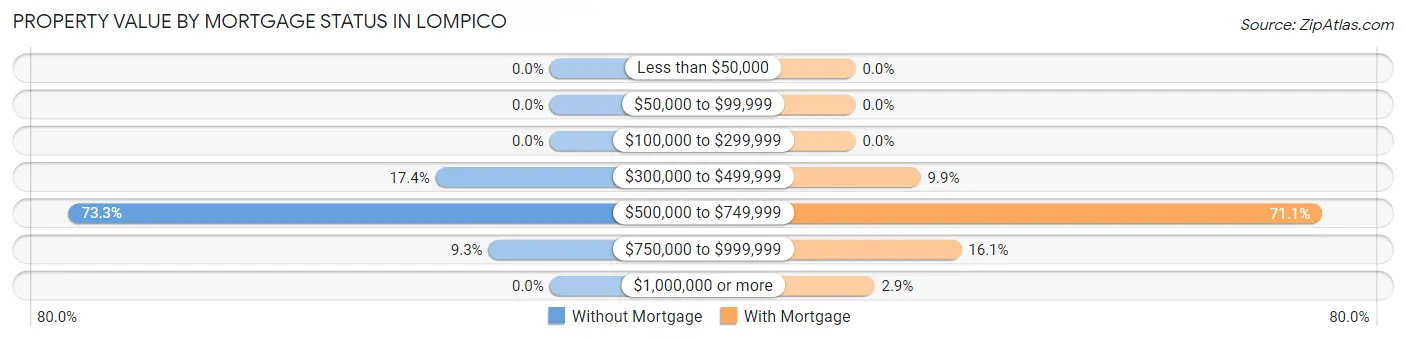
| Property Value | Without Mortgage | With Mortgage |
| Less than $50,000 | 0 (0.0%) | 0 (0.0%) |
| $50,000 to $99,999 | 0 (0.0%) | 0 (0.0%) |
| $100,000 to $299,999 | 0 (0.0%) | 0 (0.0%) |
| $300,000 to $499,999 | 28 (17.4%) | 24 (9.9%) |
| $500,000 to $749,999 | 118 (73.3%) | 172 (71.1%) |
| $750,000 to $999,999 | 15 (9.3%) | 39 (16.1%) |
| $1,000,000 or more | 0 (0.0%) | 7 (2.9%) |
| Total | 161 (100.0%) | 242 (100.0%) |
Household Income by Mortgage Status in Lompico
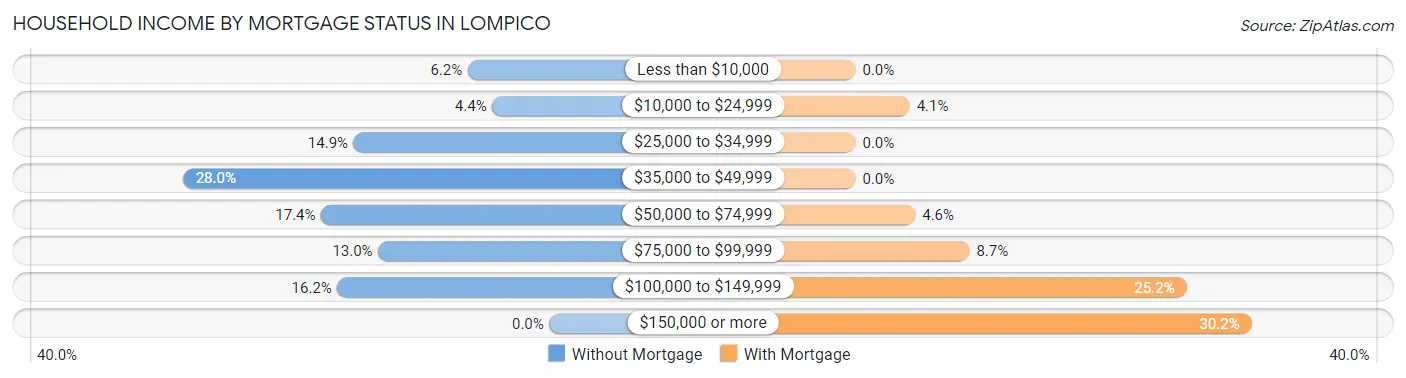
| Household Income | Without Mortgage | With Mortgage |
| Less than $10,000 | 10 (6.2%) | 0 (0.0%) |
| $10,000 to $24,999 | 7 (4.3%) | 10 (4.1%) |
| $25,000 to $34,999 | 24 (14.9%) | 0 (0.0%) |
| $35,000 to $49,999 | 45 (28.0%) | 0 (0.0%) |
| $50,000 to $74,999 | 28 (17.4%) | 11 (4.5%) |
| $75,000 to $99,999 | 21 (13.0%) | 21 (8.7%) |
| $100,000 to $149,999 | 26 (16.2%) | 61 (25.2%) |
| $150,000 or more | 0 (0.0%) | 73 (30.2%) |
| Total | 161 (100.0%) | 242 (100.0%) |
Property Value to Household Income Ratio in Lompico
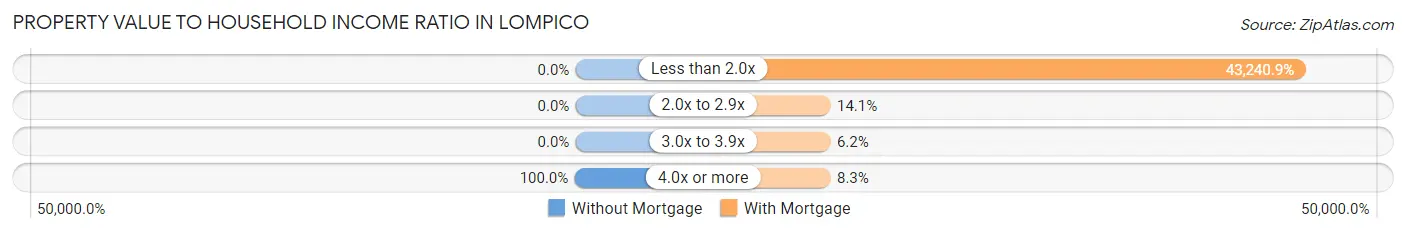
| Value-to-Income Ratio | Without Mortgage | With Mortgage |
| Less than 2.0x | 0 (0.0%) | 104,643 (43,240.9%) |
| 2.0x to 2.9x | 0 (0.0%) | 34 (14.1%) |
| 3.0x to 3.9x | 0 (0.0%) | 15 (6.2%) |
| 4.0x or more | 161 (100.0%) | 20 (8.3%) |
| Total | 161 (100.0%) | 242 (100.0%) |
Real Estate Taxes by Mortgage Status in Lompico
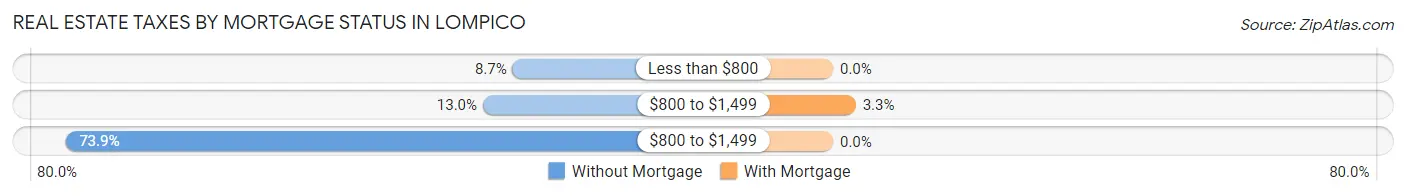
| Property Taxes | Without Mortgage | With Mortgage |
| Less than $800 | 14 (8.7%) | 0 (0.0%) |
| $800 to $1,499 | 21 (13.0%) | 8 (3.3%) |
| $800 to $1,499 | 119 (73.9%) | 0 (0.0%) |
| Total | 161 (100.0%) | 242 (100.0%) |
Health & Disability in Lompico
Health Insurance Coverage by Age in Lompico
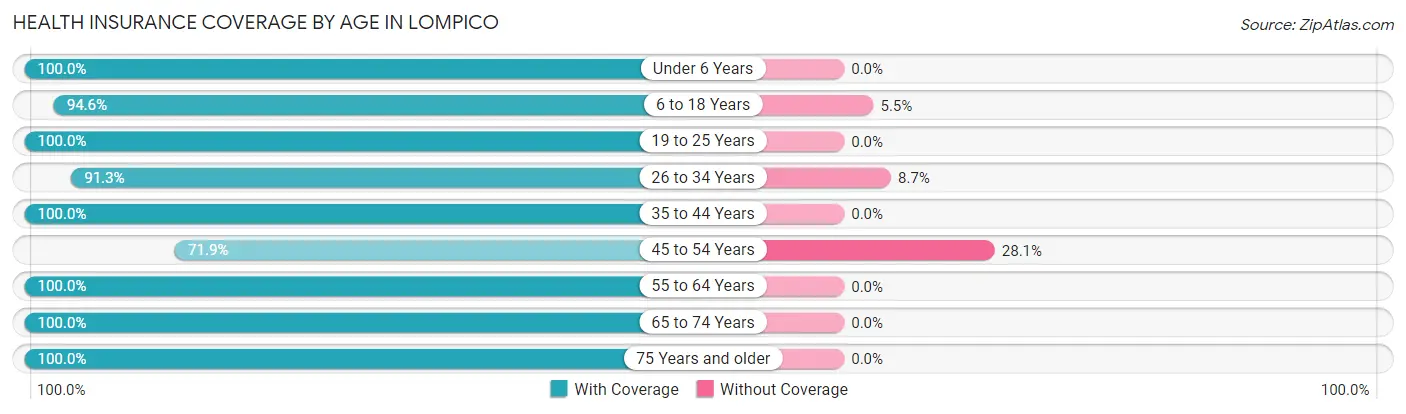
| Age Bracket | With Coverage | Without Coverage |
| Under 6 Years | 21 (100.0%) | 0 (0.0%) |
| 6 to 18 Years | 104 (94.6%) | 6 (5.4%) |
| 19 to 25 Years | 14 (100.0%) | 0 (0.0%) |
| 26 to 34 Years | 136 (91.3%) | 13 (8.7%) |
| 35 to 44 Years | 123 (100.0%) | 0 (0.0%) |
| 45 to 54 Years | 105 (71.9%) | 41 (28.1%) |
| 55 to 64 Years | 113 (100.0%) | 0 (0.0%) |
| 65 to 74 Years | 197 (100.0%) | 0 (0.0%) |
| 75 Years and older | 38 (100.0%) | 0 (0.0%) |
| Total | 851 (93.4%) | 60 (6.6%) |
Health Insurance Coverage by Citizenship Status in Lompico
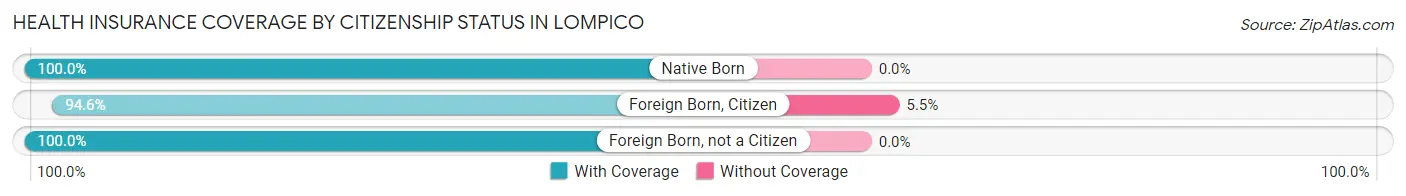
| Citizenship Status | With Coverage | Without Coverage |
| Native Born | 21 (100.0%) | 0 (0.0%) |
| Foreign Born, Citizen | 104 (94.6%) | 6 (5.4%) |
| Foreign Born, not a Citizen | 14 (100.0%) | 0 (0.0%) |
Health Insurance Coverage by Household Income in Lompico
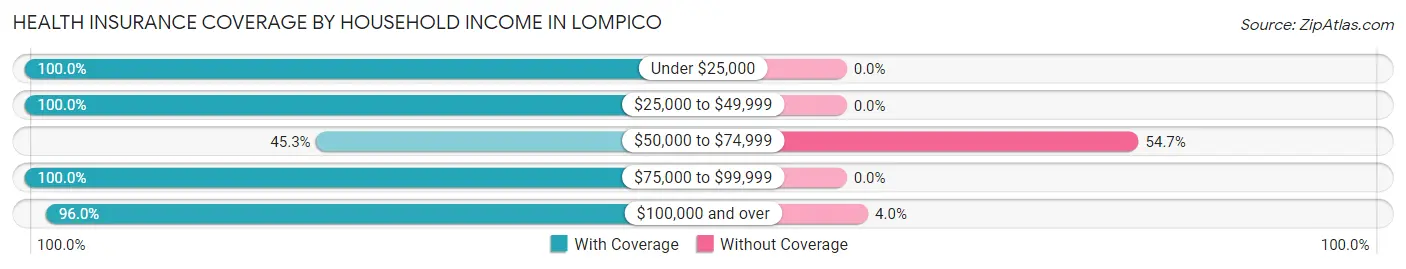
| Household Income | With Coverage | Without Coverage |
| Under $25,000 | 55 (100.0%) | 0 (0.0%) |
| $25,000 to $49,999 | 153 (100.0%) | 0 (0.0%) |
| $50,000 to $74,999 | 34 (45.3%) | 41 (54.7%) |
| $75,000 to $99,999 | 153 (100.0%) | 0 (0.0%) |
| $100,000 and over | 456 (96.0%) | 19 (4.0%) |
Public vs Private Health Insurance Coverage by Age in Lompico
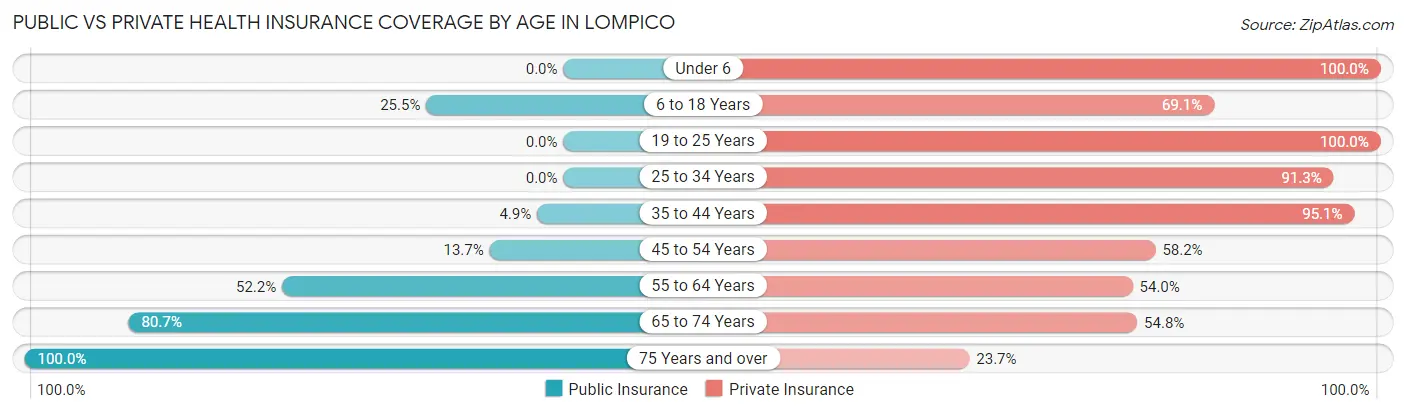
| Age Bracket | Public Insurance | Private Insurance |
| Under 6 | 0 (0.0%) | 21 (100.0%) |
| 6 to 18 Years | 28 (25.5%) | 76 (69.1%) |
| 19 to 25 Years | 0 (0.0%) | 14 (100.0%) |
| 25 to 34 Years | 0 (0.0%) | 136 (91.3%) |
| 35 to 44 Years | 6 (4.9%) | 117 (95.1%) |
| 45 to 54 Years | 20 (13.7%) | 85 (58.2%) |
| 55 to 64 Years | 59 (52.2%) | 61 (54.0%) |
| 65 to 74 Years | 159 (80.7%) | 108 (54.8%) |
| 75 Years and over | 38 (100.0%) | 9 (23.7%) |
| Total | 310 (34.0%) | 627 (68.8%) |
Disability Status by Sex by Age in Lompico
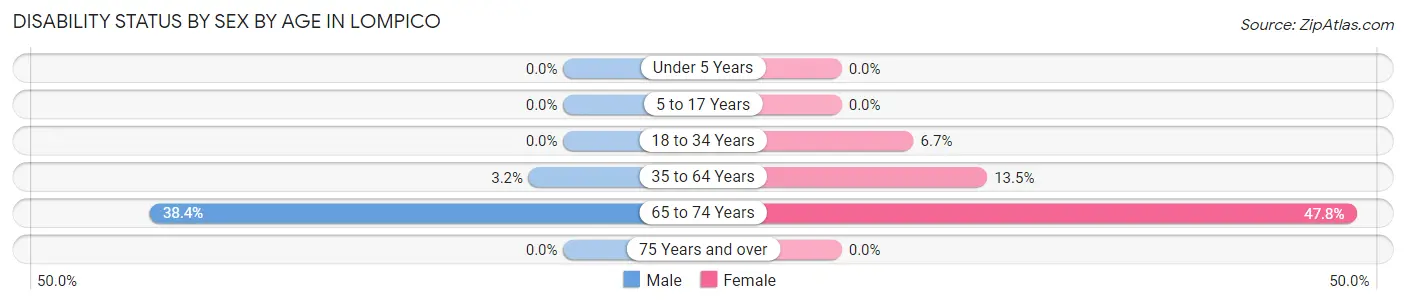
| Age Bracket | Male | Female |
| Under 5 Years | 0 (0.0%) | 0 (0.0%) |
| 5 to 17 Years | 0 (0.0%) | 0 (0.0%) |
| 18 to 34 Years | 0 (0.0%) | 5 (6.7%) |
| 35 to 64 Years | 7 (3.2%) | 22 (13.5%) |
| 65 to 74 Years | 33 (38.4%) | 53 (47.7%) |
| 75 Years and over | 0 (0.0%) | 0 (0.0%) |
Disability Class by Sex by Age in Lompico
Disability Class: Hearing Difficulty
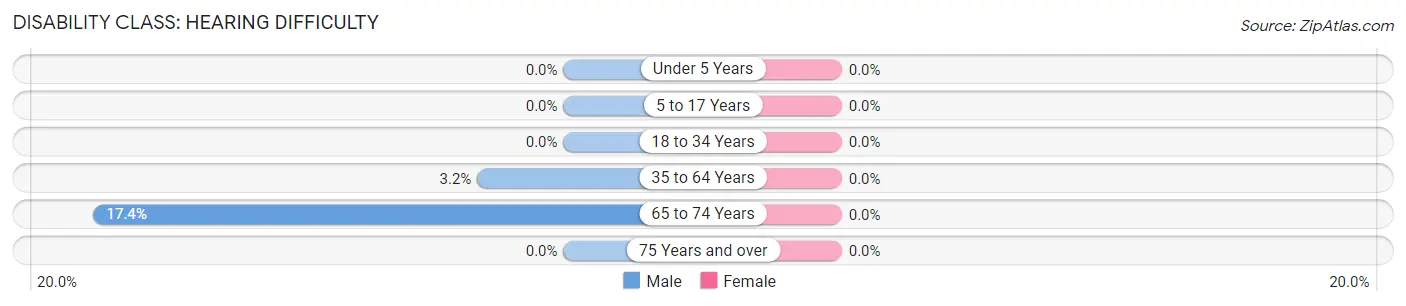
| Age Bracket | Male | Female |
| Under 5 Years | 0 (0.0%) | 0 (0.0%) |
| 5 to 17 Years | 0 (0.0%) | 0 (0.0%) |
| 18 to 34 Years | 0 (0.0%) | 0 (0.0%) |
| 35 to 64 Years | 7 (3.2%) | 0 (0.0%) |
| 65 to 74 Years | 15 (17.4%) | 0 (0.0%) |
| 75 Years and over | 0 (0.0%) | 0 (0.0%) |
Disability Class: Vision Difficulty
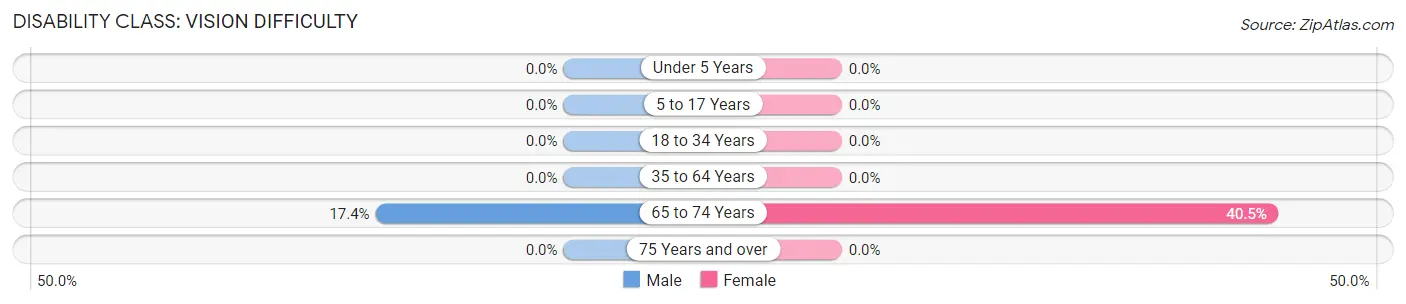
| Age Bracket | Male | Female |
| Under 5 Years | 0 (0.0%) | 0 (0.0%) |
| 5 to 17 Years | 0 (0.0%) | 0 (0.0%) |
| 18 to 34 Years | 0 (0.0%) | 0 (0.0%) |
| 35 to 64 Years | 0 (0.0%) | 0 (0.0%) |
| 65 to 74 Years | 15 (17.4%) | 45 (40.5%) |
| 75 Years and over | 0 (0.0%) | 0 (0.0%) |
Disability Class: Cognitive Difficulty
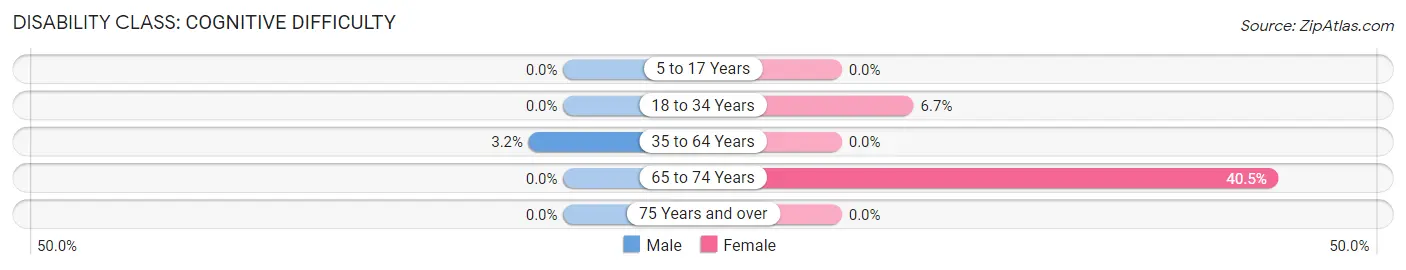
| Age Bracket | Male | Female |
| 5 to 17 Years | 0 (0.0%) | 0 (0.0%) |
| 18 to 34 Years | 0 (0.0%) | 5 (6.7%) |
| 35 to 64 Years | 7 (3.2%) | 0 (0.0%) |
| 65 to 74 Years | 0 (0.0%) | 45 (40.5%) |
| 75 Years and over | 0 (0.0%) | 0 (0.0%) |
Disability Class: Ambulatory Difficulty
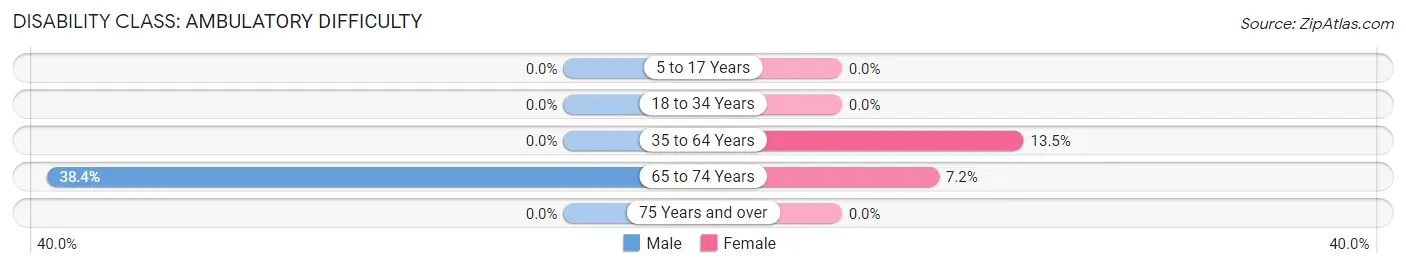
| Age Bracket | Male | Female |
| 5 to 17 Years | 0 (0.0%) | 0 (0.0%) |
| 18 to 34 Years | 0 (0.0%) | 0 (0.0%) |
| 35 to 64 Years | 0 (0.0%) | 22 (13.5%) |
| 65 to 74 Years | 33 (38.4%) | 8 (7.2%) |
| 75 Years and over | 0 (0.0%) | 0 (0.0%) |
Disability Class: Self-Care Difficulty
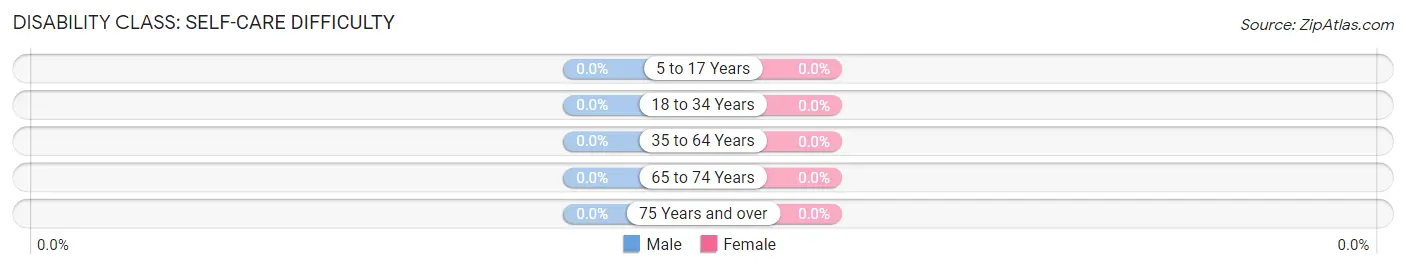
| Age Bracket | Male | Female |
| 5 to 17 Years | 0 (0.0%) | 0 (0.0%) |
| 18 to 34 Years | 0 (0.0%) | 0 (0.0%) |
| 35 to 64 Years | 0 (0.0%) | 0 (0.0%) |
| 65 to 74 Years | 0 (0.0%) | 0 (0.0%) |
| 75 Years and over | 0 (0.0%) | 0 (0.0%) |
Technology Access in Lompico
Computing Device Access in Lompico
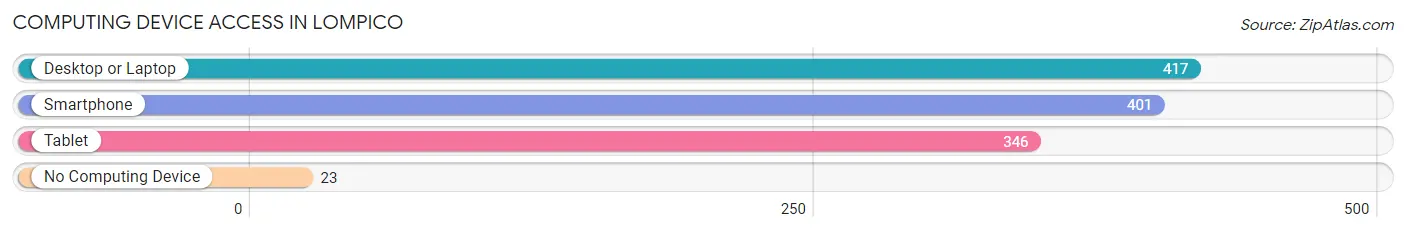
| Device Type | # Households | % Households |
| Desktop or Laptop | 417 | 91.2% |
| Smartphone | 401 | 87.7% |
| Tablet | 346 | 75.7% |
| No Computing Device | 23 | 5.0% |
| Total | 457 | 100.0% |
Internet Access in Lompico
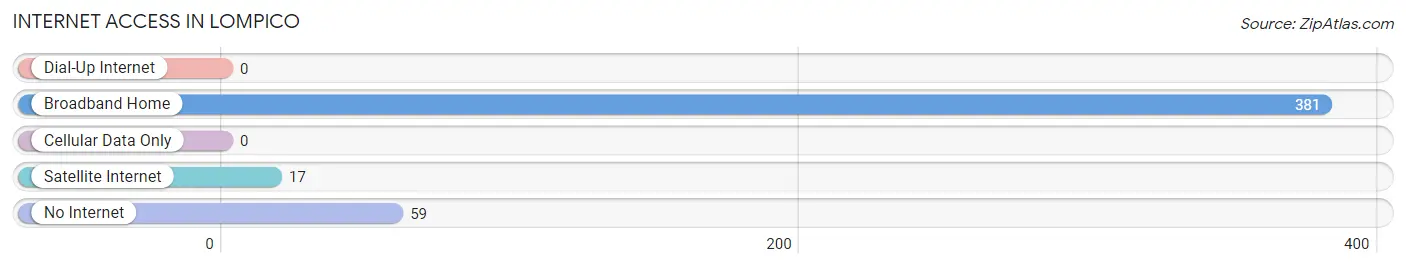
| Internet Type | # Households | % Households |
| Dial-Up Internet | 0 | 0.0% |
| Broadband Home | 381 | 83.4% |
| Cellular Data Only | 0 | 0.0% |
| Satellite Internet | 17 | 3.7% |
| No Internet | 59 | 12.9% |
| Total | 457 | 100.0% |
Lompico Summary
Lompico is an unincorporated community located in Santa Cruz County, California. It is situated in the Santa Cruz Mountains, approximately 8 miles northwest of the city of Santa Cruz. The population of Lompico was estimated to be around 1,000 in 2020.
Geography
Lompico is located in the Santa Cruz Mountains, approximately 8 miles northwest of the city of Santa Cruz. The community is situated at an elevation of 1,400 feet and is surrounded by redwood forests. The area is characterized by steep terrain and is home to several creeks and streams. The climate in Lompico is mild and temperate, with average temperatures ranging from the mid-50s to the mid-70s.
History
Lompico was originally inhabited by the Ohlone people, who lived in the area for thousands of years before the arrival of Europeans. The first European settlers arrived in the area in the mid-1800s, and the community was officially established in 1867. The name “Lompico” is derived from the Spanish word “lompico”, which means “little valley”.
The area was initially used for logging and ranching, and the first post office was established in 1876. In the early 1900s, the area began to be used for farming, and the first school was built in 1910. The community continued to grow throughout the 20th century, and in the 1950s, the area was connected to the rest of Santa Cruz County by a road.
Economy
The economy of Lompico is largely based on agriculture and tourism. The area is home to several farms, which produce a variety of fruits and vegetables, including apples, pears, and strawberries. The area is also popular with tourists, who come to enjoy the scenic beauty of the Santa Cruz Mountains.
Demographics
The population of Lompico was estimated to be around 1,000 in 2020. The racial makeup of the community is predominantly white (90.2%), followed by Hispanic or Latino (4.7%), Asian (2.2%), and African American (1.2%). The median household income in Lompico is $76,000, and the median home value is $735,000.
Conclusion
Lompico is a small unincorporated community located in Santa Cruz County, California. It is situated in the Santa Cruz Mountains, approximately 8 miles northwest of the city of Santa Cruz. The population of Lompico was estimated to be around 1,000 in 2020. The economy of Lompico is largely based on agriculture and tourism, and the area is home to several farms and is popular with tourists. The racial makeup of the community is predominantly white, followed by Hispanic or Latino, Asian, and African American. The median household income in Lompico is $76,000, and the median home value is $735,000.
Common Questions
What is Per Capita Income in Lompico?
Per Capita income in Lompico is $51,961.
What is the Median Family Income in Lompico?
Median Family Income in Lompico is $112,566.
What is the Median Household income in Lompico?
Median Household Income in Lompico is $87,545.
What is Income or Wage Gap in Lompico?
Income or Wage Gap in Lompico is 35.9%.
Women in Lompico earn 64.1 cents for every dollar earned by a man.
What is Inequality or Gini Index in Lompico?
Inequality or Gini Index in Lompico is 0.42.
What is the Total Population of Lompico?
Total Population of Lompico is 911.
What is the Total Male Population of Lompico?
Total Male Population of Lompico is 487.
What is the Total Female Population of Lompico?
Total Female Population of Lompico is 424.
What is the Ratio of Males per 100 Females in Lompico?
There are 114.86 Males per 100 Females in Lompico.
What is the Ratio of Females per 100 Males in Lompico?
There are 87.06 Females per 100 Males in Lompico.
What is the Median Population Age in Lompico?
Median Population Age in Lompico is 50.2 Years.
What is the Average Family Size in Lompico
Average Family Size in Lompico is 2.6 People.
What is the Average Household Size in Lompico
Average Household Size in Lompico is 2.0 People.
How Large is the Labor Force in Lompico?
There are 516 People in the Labor Forcein in Lompico.
What is the Percentage of People in the Labor Force in Lompico?
63.9% of People are in the Labor Force in Lompico.
What is the Unemployment Rate in Lompico?
Unemployment Rate in Lompico is 3.3%.