Live Oak, CA Map & Demographics
Live Oak Map
Live Oak Overview
$24,261
PER CAPITA INCOME
$72,609
AVG FAMILY INCOME
$66,750
AVG HOUSEHOLD INCOME
41.1%
WAGE / INCOME GAP [ % ]
58.9¢/ $1
WAGE / INCOME GAP [ $ ]
$15,048
FAMILY INCOME DEFICIT
0.45
INEQUALITY / GINI INDEX
9,222
TOTAL POPULATION
4,617
MALE POPULATION
4,605
FEMALE POPULATION
100.26
MALES / 100 FEMALES
99.74
FEMALES / 100 MALES
34.7
MEDIAN AGE
3.8
AVG FAMILY SIZE
3.4
AVG HOUSEHOLD SIZE
4,190
LABOR FORCE [ PEOPLE ]
60.6%
PERCENT IN LABOR FORCE
8.0%
UNEMPLOYMENT RATE
Live Oak Zip Codes
Live Oak Area Codes
Income in Live Oak
Income Overview in Live Oak
Per Capita Income in Live Oak is $24,261, while median incomes of families and households are $72,609 and $66,750 respectively.
| Characteristic | Number | Measure |
| Per Capita Income | 9,222 | $24,261 |
| Median Family Income | 2,176 | $72,609 |
| Mean Family Income | 2,176 | $90,083 |
| Median Household Income | 2,695 | $66,750 |
| Mean Household Income | 2,695 | $82,773 |
| Income Deficit | 2,176 | $15,048 |
| Wage / Income Gap (%) | 9,222 | 41.07% |
| Wage / Income Gap ($) | 9,222 | 58.93¢ per $1 |
| Gini / Inequality Index | 9,222 | 0.45 |
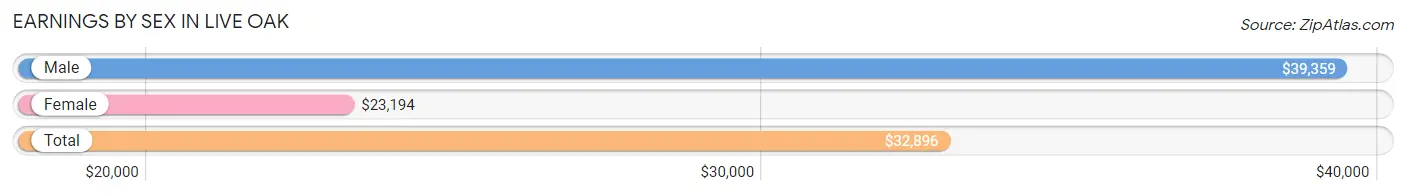
Earnings by Sex in Live Oak
Average Earnings in Live Oak are $32,896, $39,359 for men and $23,194 for women, a difference of 41.1%.
| Sex | Number | Average Earnings |
| Male | 2,536 (58.2%) | $39,359 |
| Female | 1,820 (41.8%) | $23,194 |
| Total | 4,356 (100.0%) | $32,896 |
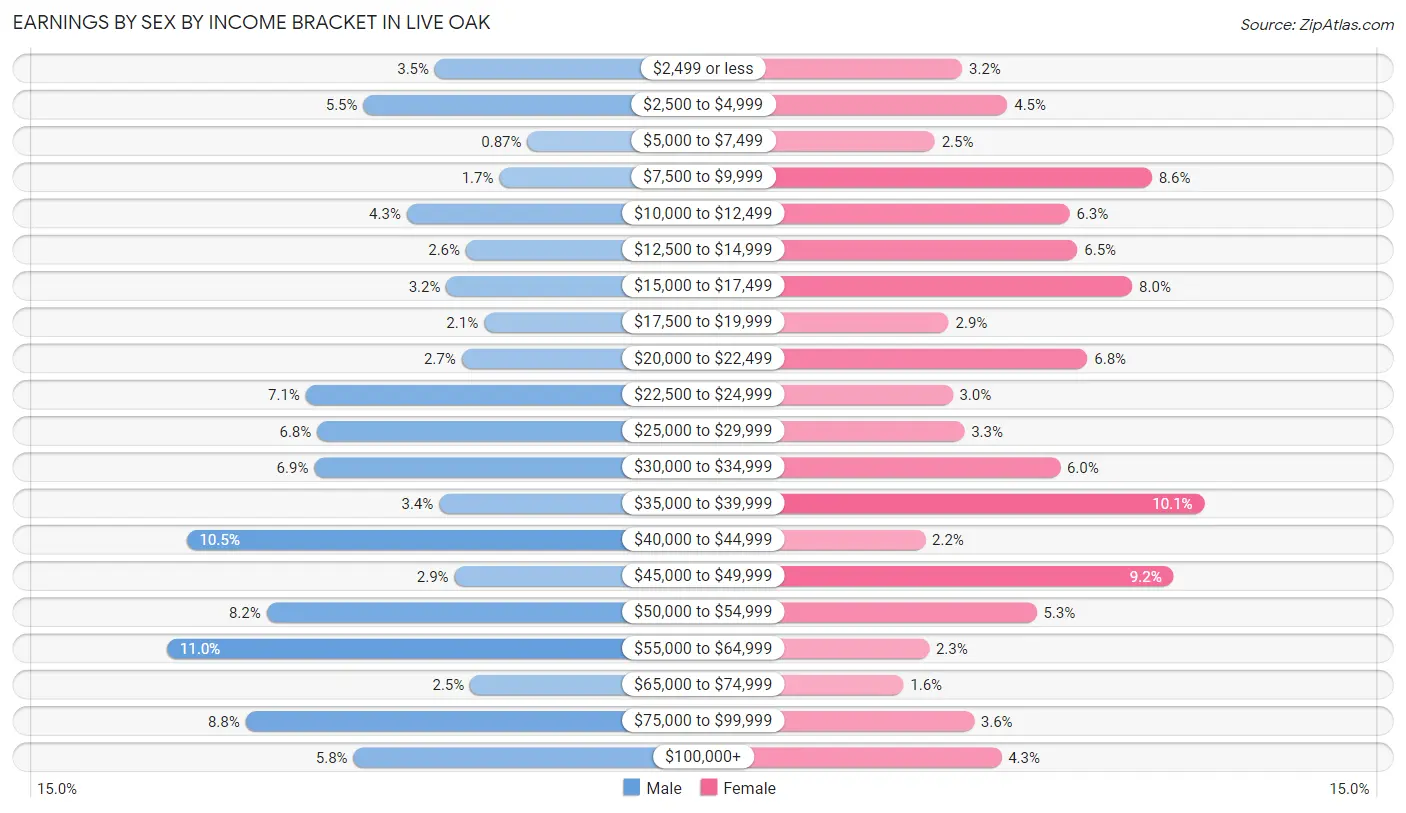
Earnings by Sex by Income Bracket in Live Oak
The most common earnings brackets in Live Oak are $55,000 to $64,999 for men (279 | 11.0%) and $35,000 to $39,999 for women (183 | 10.1%).
| Income | Male | Female |
| $2,499 or less | 88 (3.5%) | 59 (3.2%) |
| $2,500 to $4,999 | 139 (5.5%) | 82 (4.5%) |
| $5,000 to $7,499 | 22 (0.9%) | 45 (2.5%) |
| $7,500 to $9,999 | 42 (1.7%) | 156 (8.6%) |
| $10,000 to $12,499 | 108 (4.3%) | 114 (6.3%) |
| $12,500 to $14,999 | 66 (2.6%) | 118 (6.5%) |
| $15,000 to $17,499 | 80 (3.2%) | 146 (8.0%) |
| $17,500 to $19,999 | 53 (2.1%) | 52 (2.9%) |
| $20,000 to $22,499 | 69 (2.7%) | 123 (6.8%) |
| $22,500 to $24,999 | 180 (7.1%) | 54 (3.0%) |
| $25,000 to $29,999 | 172 (6.8%) | 60 (3.3%) |
| $30,000 to $34,999 | 174 (6.9%) | 109 (6.0%) |
| $35,000 to $39,999 | 85 (3.4%) | 183 (10.1%) |
| $40,000 to $44,999 | 265 (10.4%) | 40 (2.2%) |
| $45,000 to $49,999 | 74 (2.9%) | 167 (9.2%) |
| $50,000 to $54,999 | 208 (8.2%) | 97 (5.3%) |
| $55,000 to $64,999 | 279 (11.0%) | 42 (2.3%) |
| $65,000 to $74,999 | 63 (2.5%) | 29 (1.6%) |
| $75,000 to $99,999 | 223 (8.8%) | 65 (3.6%) |
| $100,000+ | 146 (5.8%) | 79 (4.3%) |
| Total | 2,536 (100.0%) | 1,820 (100.0%) |
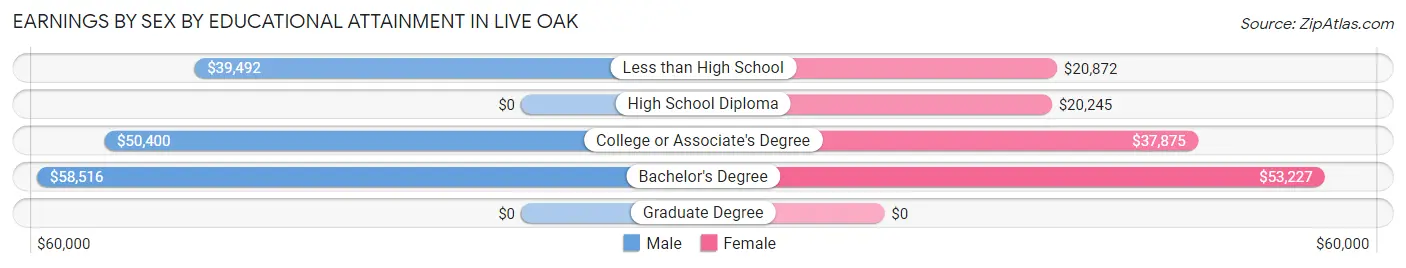
Earnings by Sex by Educational Attainment in Live Oak
Average earnings in Live Oak are $43,434 for men and $30,729 for women, a difference of 29.2%. Men with an educational attainment of bachelor's degree enjoy the highest average annual earnings of $58,516, while those with less than high school education earn the least with $39,492. Women with an educational attainment of bachelor's degree earn the most with the average annual earnings of $53,227, while those with high school diploma education have the smallest earnings of $20,245.
| Educational Attainment | Male Income | Female Income |
| Less than High School | $39,492 | $20,872 |
| High School Diploma | - | - |
| College or Associate's Degree | $50,400 | $37,875 |
| Bachelor's Degree | $58,516 | $53,227 |
| Graduate Degree | - | - |
| Total | $43,434 | $30,729 |
Family Income in Live Oak
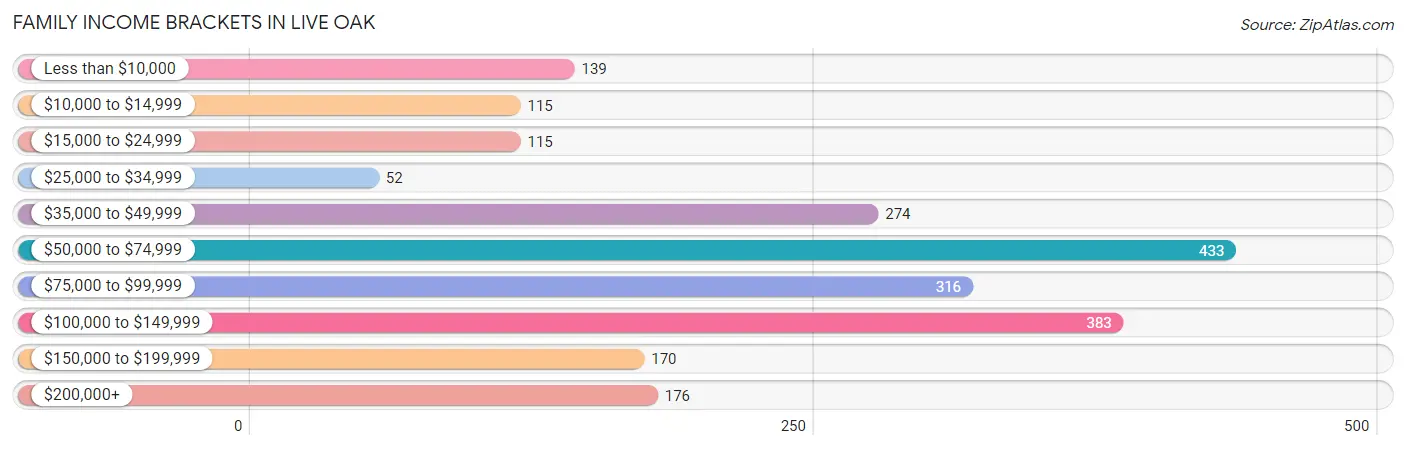
Family Income Brackets in Live Oak
According to the Live Oak family income data, there are 433 families falling into the $50,000 to $74,999 income range, which is the most common income bracket and makes up 19.9% of all families. Conversely, the $25,000 to $34,999 income bracket is the least frequent group with only 52 families (2.4%) belonging to this category.
| Income Bracket | # Families | % Families |
| Less than $10,000 | 139 | 6.4% |
| $10,000 to $14,999 | 115 | 5.3% |
| $15,000 to $24,999 | 115 | 5.3% |
| $25,000 to $34,999 | 52 | 2.4% |
| $35,000 to $49,999 | 274 | 12.6% |
| $50,000 to $74,999 | 433 | 19.9% |
| $75,000 to $99,999 | 316 | 14.5% |
| $100,000 to $149,999 | 383 | 17.6% |
| $150,000 to $199,999 | 170 | 7.8% |
| $200,000+ | 176 | 8.1% |
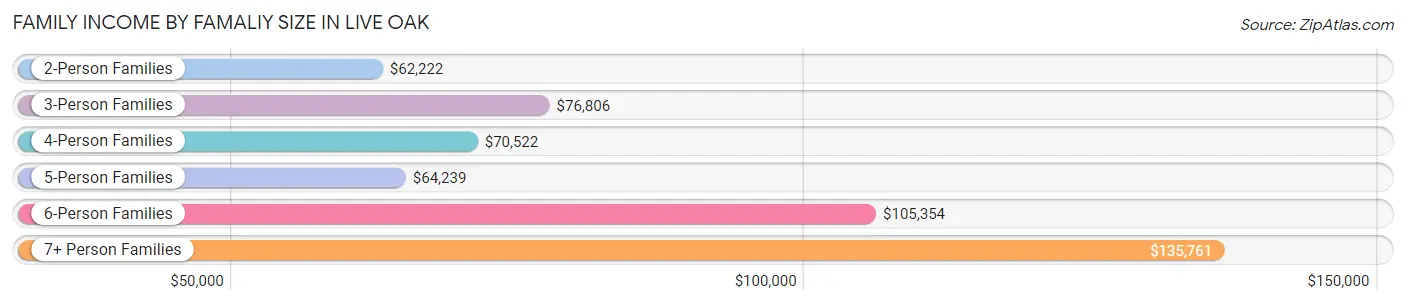
Family Income by Famaliy Size in Live Oak
7+ person families (148 | 6.8%) account for the highest median family income in Live Oak with $135,761 per family, while 2-person families (636 | 29.2%) have the highest median income of $31,111 per family member.
| Income Bracket | # Families | Median Income |
| 2-Person Families | 636 (29.2%) | $62,222 |
| 3-Person Families | 439 (20.2%) | $76,806 |
| 4-Person Families | 582 (26.8%) | $70,522 |
| 5-Person Families | 114 (5.2%) | $64,239 |
| 6-Person Families | 257 (11.8%) | $105,354 |
| 7+ Person Families | 148 (6.8%) | $135,761 |
| Total | 2,176 (100.0%) | $72,609 |
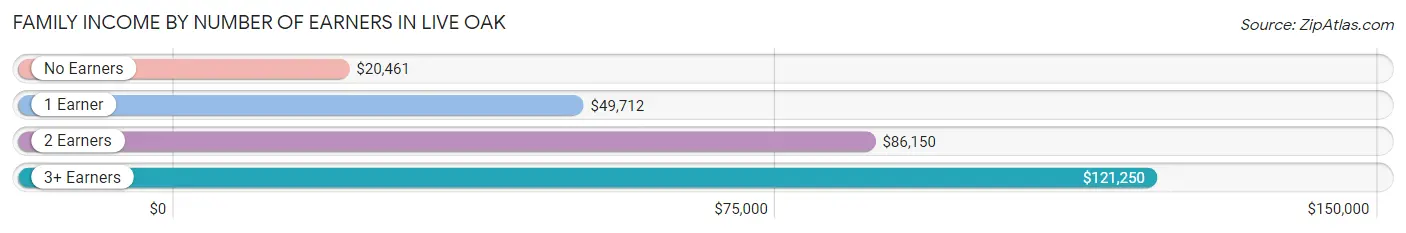
Family Income by Number of Earners in Live Oak
The median family income in Live Oak is $72,609, with families comprising 3+ earners (630) having the highest median family income of $121,250, while families with no earners (421) have the lowest median family income of $20,461, accounting for 28.9% and 19.4% of families, respectively.
| Number of Earners | # Families | Median Income |
| No Earners | 421 (19.4%) | $20,461 |
| 1 Earner | 507 (23.3%) | $49,712 |
| 2 Earners | 618 (28.4%) | $86,150 |
| 3+ Earners | 630 (28.9%) | $121,250 |
| Total | 2,176 (100.0%) | $72,609 |
Household Income in Live Oak
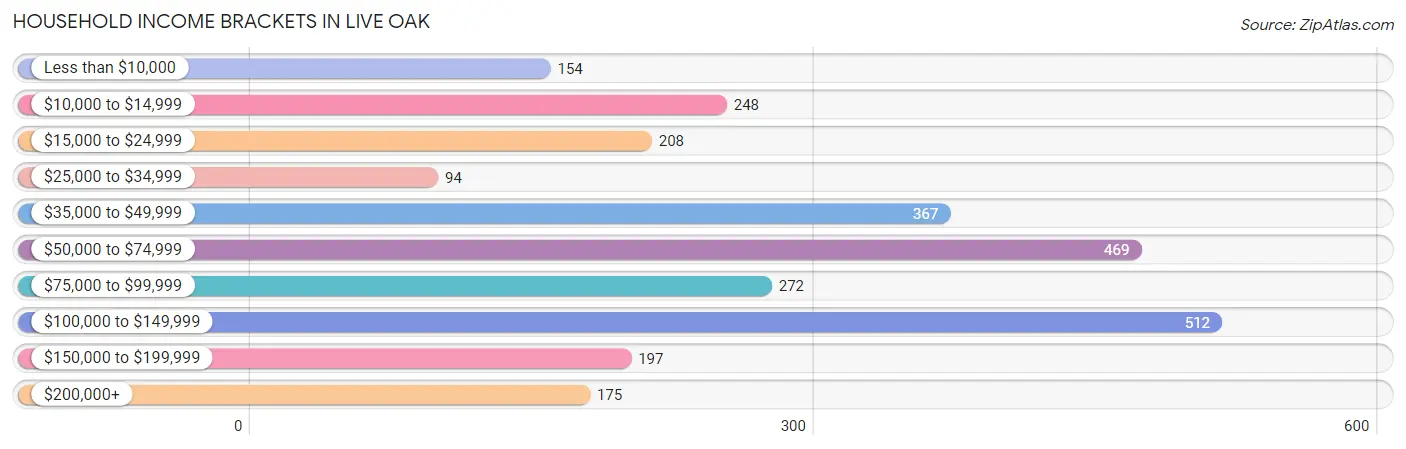
Household Income Brackets in Live Oak
With 512 households falling in the category, the $100,000 to $149,999 income range is the most frequent in Live Oak, accounting for 19.0% of all households. In contrast, only 94 households (3.5%) fall into the $25,000 to $34,999 income bracket, making it the least populous group.
| Income Bracket | # Households | % Households |
| Less than $10,000 | 154 | 5.7% |
| $10,000 to $14,999 | 248 | 9.2% |
| $15,000 to $24,999 | 208 | 7.7% |
| $25,000 to $34,999 | 94 | 3.5% |
| $35,000 to $49,999 | 367 | 13.6% |
| $50,000 to $74,999 | 469 | 17.4% |
| $75,000 to $99,999 | 272 | 10.1% |
| $100,000 to $149,999 | 512 | 19.0% |
| $150,000 to $199,999 | 197 | 7.3% |
| $200,000+ | 175 | 6.5% |
Household Income by Householder Age in Live Oak
The median household income in Live Oak is $66,750, with the highest median household income of $89,238 found in the 25 to 44 years age bracket for the primary householder. A total of 797 households (29.6%) fall into this category. Meanwhile, the 15 to 24 years age bracket for the primary householder has the lowest median household income of $0, with 87 households (3.2%) in this group.
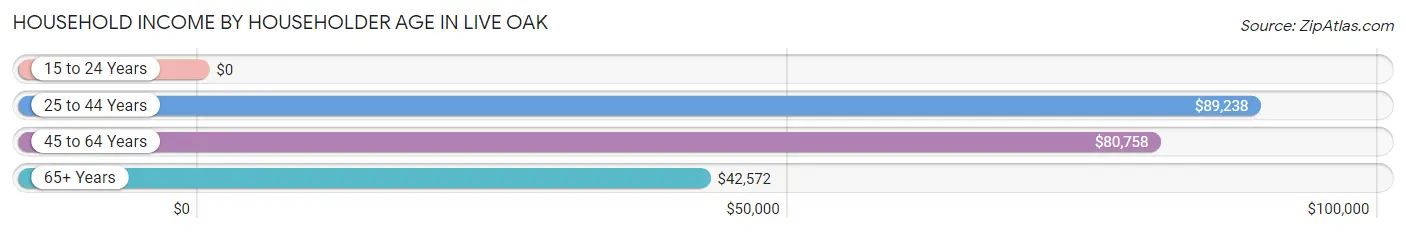
| Income Bracket | # Households | Median Income |
| 15 to 24 Years | 87 (3.2%) | $0 |
| 25 to 44 Years | 797 (29.6%) | $89,238 |
| 45 to 64 Years | 1,066 (39.6%) | $80,758 |
| 65+ Years | 745 (27.6%) | $42,572 |
| Total | 2,695 (100.0%) | $66,750 |
Poverty in Live Oak
Income Below Poverty by Sex and Age in Live Oak
With 13.4% poverty level for males and 19.4% for females among the residents of Live Oak, 15 year old males and under 5 year old females are the most vulnerable to poverty, with 34 males (100.0%) and 110 females (37.2%) in their respective age groups living below the poverty level.
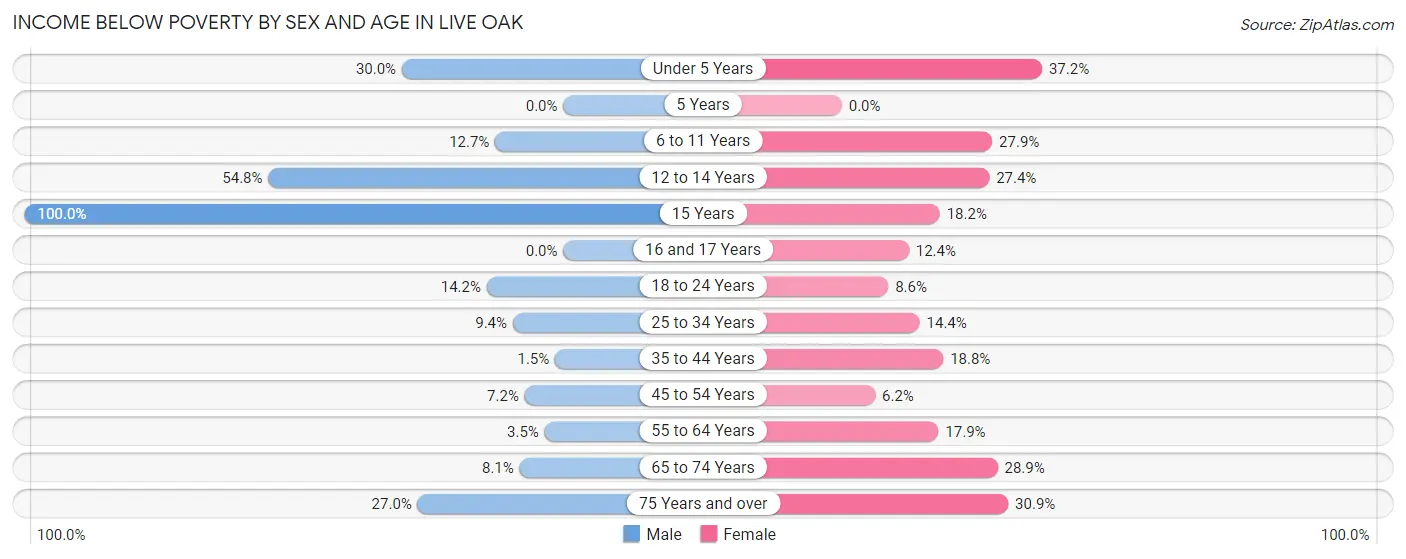
| Age Bracket | Male | Female |
| Under 5 Years | 169 (30.0%) | 110 (37.2%) |
| 5 Years | 0 (0.0%) | 0 (0.0%) |
| 6 to 11 Years | 42 (12.7%) | 115 (27.9%) |
| 12 to 14 Years | 92 (54.8%) | 84 (27.4%) |
| 15 Years | 34 (100.0%) | 16 (18.2%) |
| 16 and 17 Years | 0 (0.0%) | 25 (12.4%) |
| 18 to 24 Years | 52 (14.2%) | 33 (8.6%) |
| 25 to 34 Years | 61 (9.4%) | 80 (14.4%) |
| 35 to 44 Years | 8 (1.5%) | 96 (18.8%) |
| 45 to 54 Years | 44 (7.2%) | 33 (6.2%) |
| 55 to 64 Years | 19 (3.5%) | 97 (17.9%) |
| 65 to 74 Years | 28 (8.1%) | 122 (28.9%) |
| 75 Years and over | 63 (27.0%) | 63 (30.9%) |
| Total | 612 (13.4%) | 874 (19.4%) |
Income Above Poverty by Sex and Age in Live Oak
According to the poverty statistics in Live Oak, males aged 16 and 17 years and females aged 5 years are the age groups that are most secure financially, with 100.0% of males and 100.0% of females in these age groups living above the poverty line.
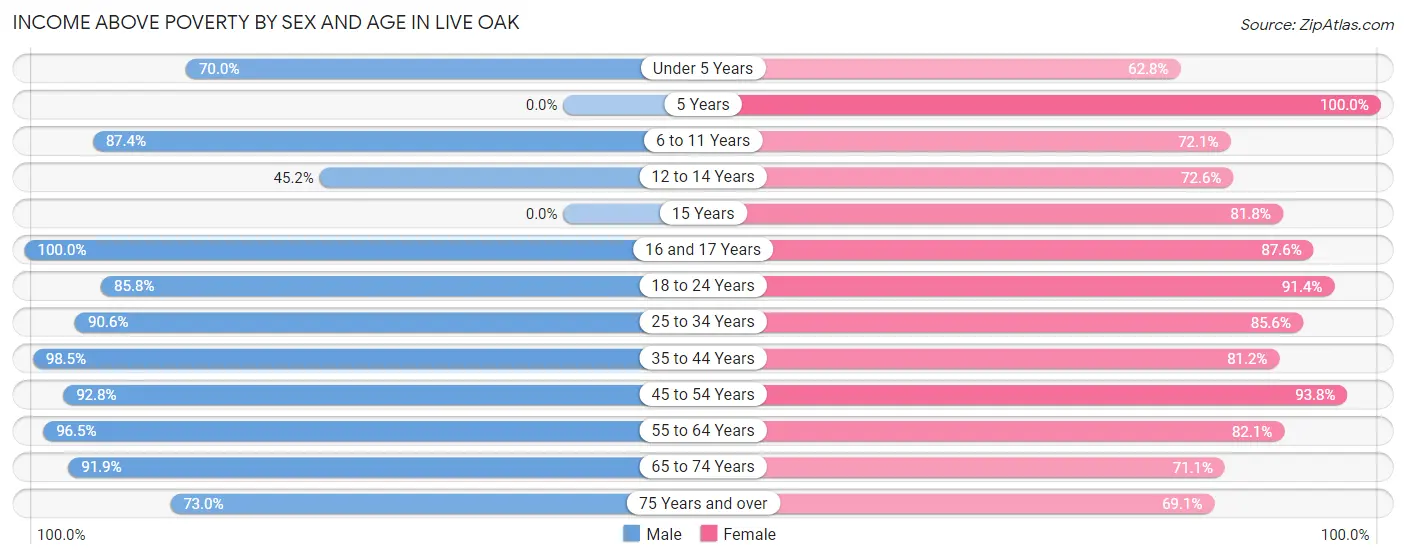
| Age Bracket | Male | Female |
| Under 5 Years | 395 (70.0%) | 186 (62.8%) |
| 5 Years | 0 (0.0%) | 65 (100.0%) |
| 6 to 11 Years | 290 (87.4%) | 297 (72.1%) |
| 12 to 14 Years | 76 (45.2%) | 223 (72.6%) |
| 15 Years | 0 (0.0%) | 72 (81.8%) |
| 16 and 17 Years | 188 (100.0%) | 176 (87.6%) |
| 18 to 24 Years | 314 (85.8%) | 350 (91.4%) |
| 25 to 34 Years | 590 (90.6%) | 474 (85.6%) |
| 35 to 44 Years | 516 (98.5%) | 414 (81.2%) |
| 45 to 54 Years | 570 (92.8%) | 501 (93.8%) |
| 55 to 64 Years | 530 (96.5%) | 444 (82.1%) |
| 65 to 74 Years | 317 (91.9%) | 300 (71.1%) |
| 75 Years and over | 170 (73.0%) | 141 (69.1%) |
| Total | 3,956 (86.6%) | 3,643 (80.6%) |
Income Below Poverty Among Married-Couple Families in Live Oak
The poverty statistics for married-couple families in Live Oak show that 6.7% or 93 of the total 1,381 families live below the poverty line. Families with no children have the highest poverty rate of 10.1%, comprising of 69 families. On the other hand, families with 3 or 4 children have the lowest poverty rate of 0.0%, which includes 0 families.
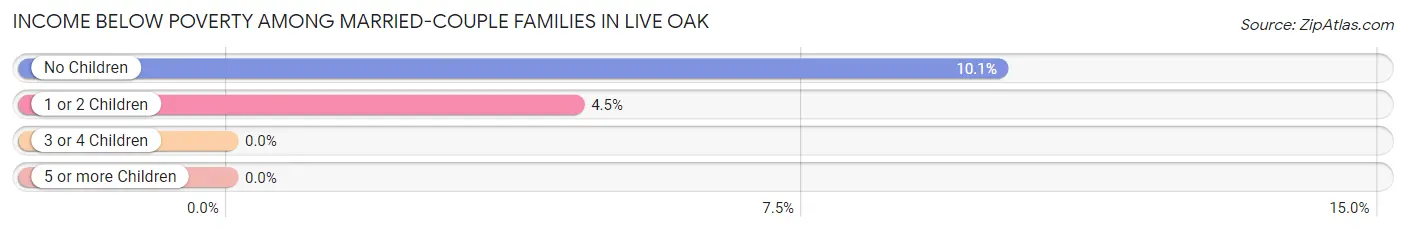
| Children | Above Poverty | Below Poverty |
| No Children | 617 (89.9%) | 69 (10.1%) |
| 1 or 2 Children | 507 (95.5%) | 24 (4.5%) |
| 3 or 4 Children | 121 (100.0%) | 0 (0.0%) |
| 5 or more Children | 43 (100.0%) | 0 (0.0%) |
| Total | 1,288 (93.3%) | 93 (6.7%) |
Income Below Poverty Among Single-Parent Households in Live Oak
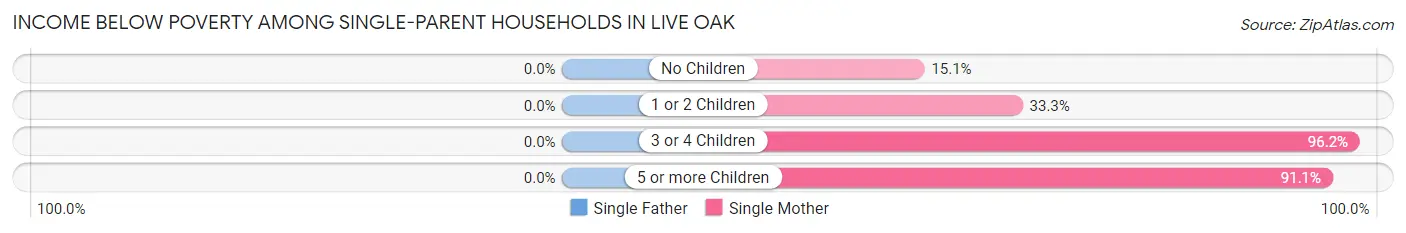
| Children | Single Father | Single Mother |
| No Children | 0 (0.0%) | 31 (15.0%) |
| 1 or 2 Children | 0 (0.0%) | 60 (33.3%) |
| 3 or 4 Children | 0 (0.0%) | 100 (96.2%) |
| 5 or more Children | 0 (0.0%) | 41 (91.1%) |
| Total | 0 (0.0%) | 232 (43.4%) |
Income Below Poverty Among Married-Couple vs Single-Parent Households in Live Oak
The poverty data for Live Oak shows that 93 of the married-couple family households (6.7%) and 232 of the single-parent households (29.2%) are living below the poverty level. Within the married-couple family households, those with no children have the highest poverty rate, with 69 households (10.1%) falling below the poverty line. Among the single-parent households, those with 5 or more children have the highest poverty rate, with 41 household (91.1%) living below poverty.
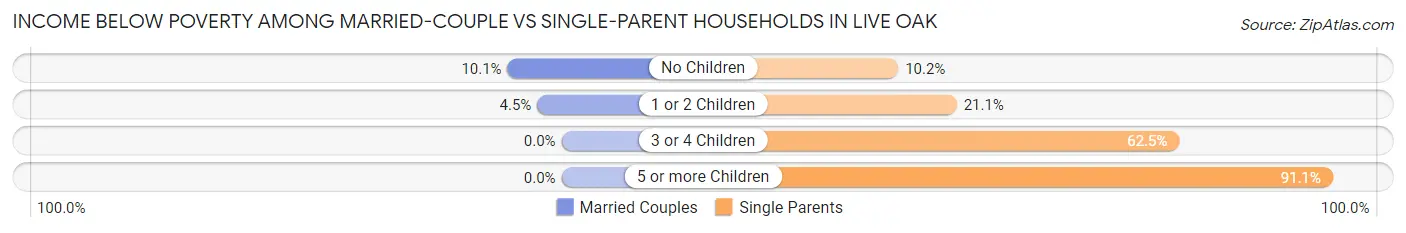
| Children | Married-Couple Families | Single-Parent Households |
| No Children | 69 (10.1%) | 31 (10.2%) |
| 1 or 2 Children | 24 (4.5%) | 60 (21.0%) |
| 3 or 4 Children | 0 (0.0%) | 100 (62.5%) |
| 5 or more Children | 0 (0.0%) | 41 (91.1%) |
| Total | 93 (6.7%) | 232 (29.2%) |
Race in Live Oak
The most populous races in Live Oak are White / Caucasian (4,394 | 47.6%), Hispanic or Latino (4,209 | 45.6%), and Two or more Races (1,588 | 17.2%).
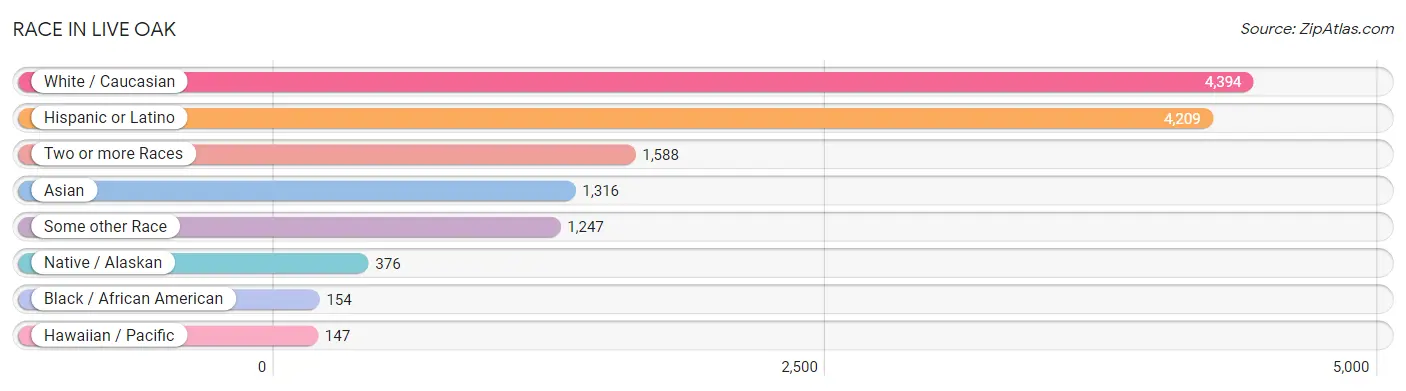
| Race | # Population | % Population |
| Asian | 1,316 | 14.3% |
| Black / African American | 154 | 1.7% |
| Hawaiian / Pacific | 147 | 1.6% |
| Hispanic or Latino | 4,209 | 45.6% |
| Native / Alaskan | 376 | 4.1% |
| White / Caucasian | 4,394 | 47.6% |
| Two or more Races | 1,588 | 17.2% |
| Some other Race | 1,247 | 13.5% |
| Total | 9,222 | 100.0% |
Ancestry in Live Oak
The most populous ancestries reported in Live Oak are Mexican (3,925 | 42.6%), Thai (913 | 9.9%), German (845 | 9.2%), Irish (731 | 7.9%), and English (368 | 4.0%), together accounting for 73.5% of all Live Oak residents.
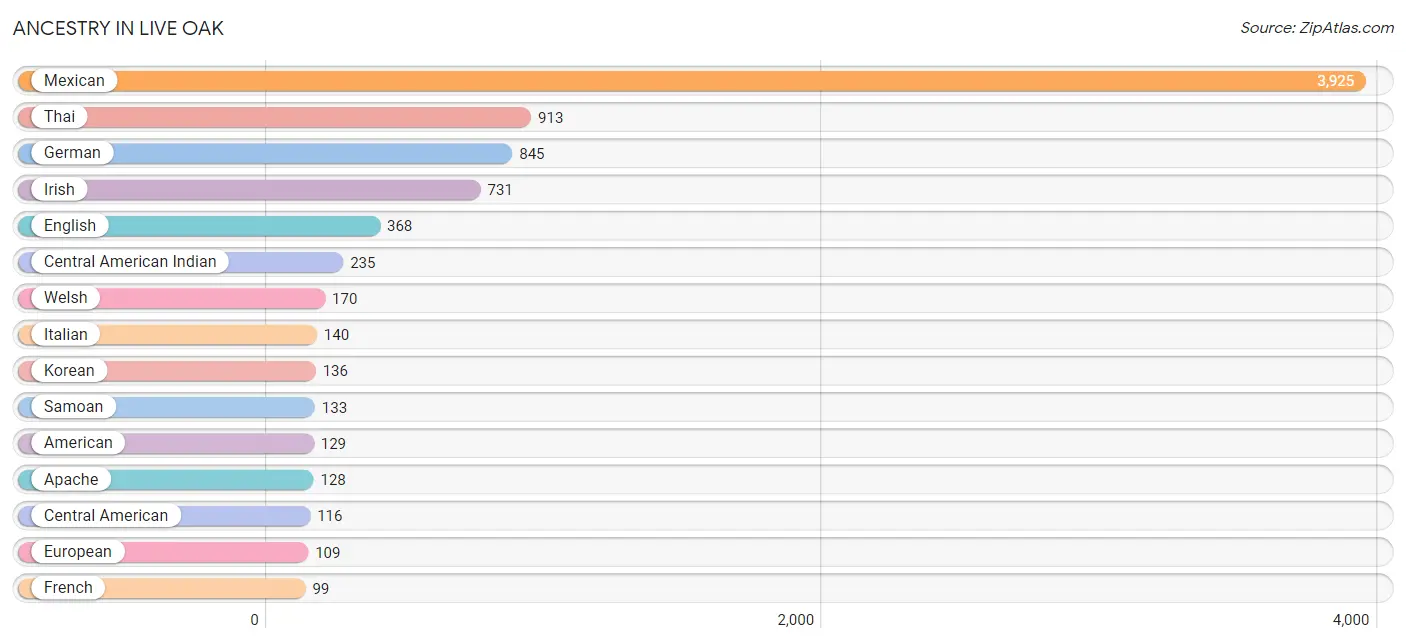
| Ancestry | # Population | % Population |
| American | 129 | 1.4% |
| Apache | 128 | 1.4% |
| Arab | 56 | 0.6% |
| Australian | 10 | 0.1% |
| Bhutanese | 11 | 0.1% |
| Blackfeet | 13 | 0.1% |
| Burmese | 36 | 0.4% |
| Central American | 116 | 1.3% |
| Central American Indian | 235 | 2.5% |
| Cherokee | 75 | 0.8% |
| Comanche | 5 | 0.1% |
| Czech | 11 | 0.1% |
| Czechoslovakian | 8 | 0.1% |
| Danish | 10 | 0.1% |
| English | 368 | 4.0% |
| Ethiopian | 16 | 0.2% |
| European | 109 | 1.2% |
| French | 99 | 1.1% |
| French American Indian | 4 | 0.0% |
| French Canadian | 12 | 0.1% |
| German | 845 | 9.2% |
| Guamanian / Chamorro | 40 | 0.4% |
| Guatemalan | 70 | 0.8% |
| Indian (Asian) | 84 | 0.9% |
| Indonesian | 26 | 0.3% |
| Irish | 731 | 7.9% |
| Italian | 140 | 1.5% |
| Korean | 136 | 1.5% |
| Laotian | 21 | 0.2% |
| Lebanese | 43 | 0.5% |
| Mexican | 3,925 | 42.6% |
| Mexican American Indian | 41 | 0.4% |
| Native Hawaiian | 39 | 0.4% |
| Norwegian | 13 | 0.1% |
| Palestinian | 13 | 0.1% |
| Polish | 49 | 0.5% |
| Portuguese | 25 | 0.3% |
| Puerto Rican | 38 | 0.4% |
| Samoan | 133 | 1.4% |
| Scotch-Irish | 41 | 0.4% |
| Scottish | 65 | 0.7% |
| Spanish American | 7 | 0.1% |
| Subsaharan African | 16 | 0.2% |
| Swedish | 84 | 0.9% |
| Thai | 913 | 9.9% |
| Tongan | 25 | 0.3% |
| Welsh | 170 | 1.8% |
| Yugoslavian | 10 | 0.1% | View All 48 Rows |
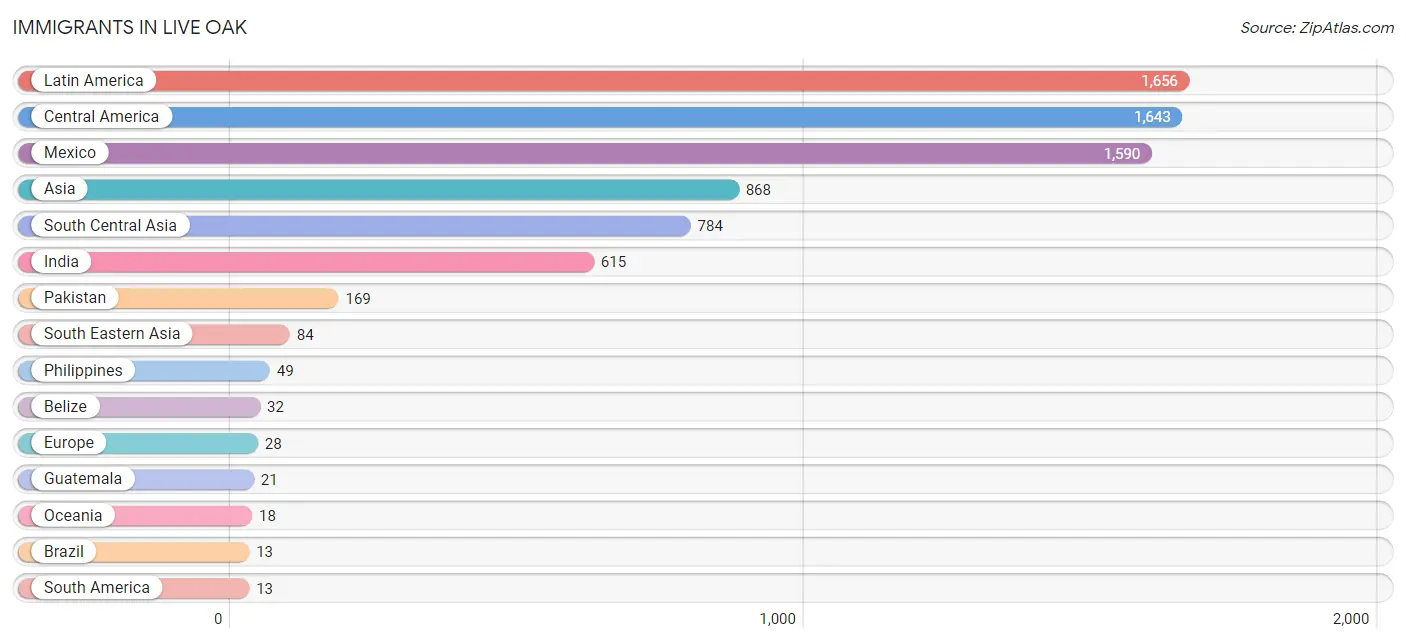
Immigrants in Live Oak
The most numerous immigrant groups reported in Live Oak came from Latin America (1,656 | 18.0%), Central America (1,643 | 17.8%), Mexico (1,590 | 17.2%), Asia (868 | 9.4%), and South Central Asia (784 | 8.5%), together accounting for 70.9% of all Live Oak residents.
| Immigration Origin | # Population | % Population |
| Asia | 868 | 9.4% |
| Belize | 32 | 0.4% |
| Brazil | 13 | 0.1% |
| Central America | 1,643 | 17.8% |
| Eastern Europe | 10 | 0.1% |
| England | 7 | 0.1% |
| Europe | 28 | 0.3% |
| Germany | 11 | 0.1% |
| Guatemala | 21 | 0.2% |
| India | 615 | 6.7% |
| Latin America | 1,656 | 18.0% |
| Mexico | 1,590 | 17.2% |
| Northern Europe | 7 | 0.1% |
| Oceania | 18 | 0.2% |
| Pakistan | 169 | 1.8% |
| Philippines | 49 | 0.5% |
| South America | 13 | 0.1% |
| South Central Asia | 784 | 8.5% |
| South Eastern Asia | 84 | 0.9% |
| Western Europe | 11 | 0.1% | View All 20 Rows |
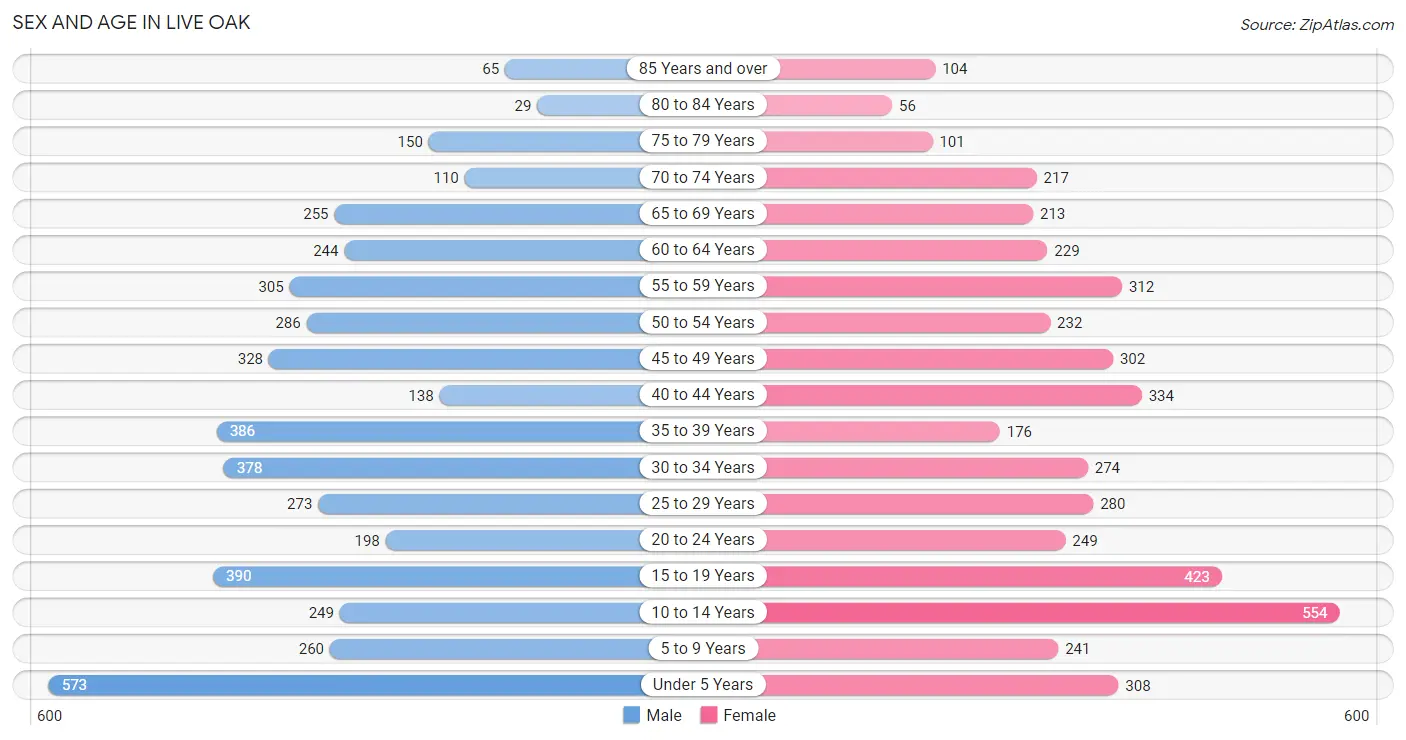
Sex and Age in Live Oak
Sex and Age in Live Oak
The most populous age groups in Live Oak are Under 5 Years (573 | 12.4%) for men and 10 to 14 Years (554 | 12.0%) for women.
| Age Bracket | Male | Female |
| Under 5 Years | 573 (12.4%) | 308 (6.7%) |
| 5 to 9 Years | 260 (5.6%) | 241 (5.2%) |
| 10 to 14 Years | 249 (5.4%) | 554 (12.0%) |
| 15 to 19 Years | 390 (8.5%) | 423 (9.2%) |
| 20 to 24 Years | 198 (4.3%) | 249 (5.4%) |
| 25 to 29 Years | 273 (5.9%) | 280 (6.1%) |
| 30 to 34 Years | 378 (8.2%) | 274 (5.9%) |
| 35 to 39 Years | 386 (8.4%) | 176 (3.8%) |
| 40 to 44 Years | 138 (3.0%) | 334 (7.2%) |
| 45 to 49 Years | 328 (7.1%) | 302 (6.6%) |
| 50 to 54 Years | 286 (6.2%) | 232 (5.0%) |
| 55 to 59 Years | 305 (6.6%) | 312 (6.8%) |
| 60 to 64 Years | 244 (5.3%) | 229 (5.0%) |
| 65 to 69 Years | 255 (5.5%) | 213 (4.6%) |
| 70 to 74 Years | 110 (2.4%) | 217 (4.7%) |
| 75 to 79 Years | 150 (3.3%) | 101 (2.2%) |
| 80 to 84 Years | 29 (0.6%) | 56 (1.2%) |
| 85 Years and over | 65 (1.4%) | 104 (2.3%) |
| Total | 4,617 (100.0%) | 4,605 (100.0%) |
Families and Households in Live Oak
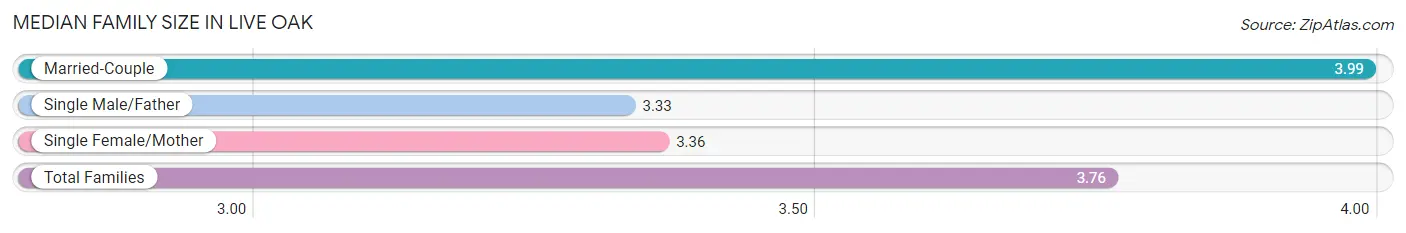
Median Family Size in Live Oak
The median family size in Live Oak is 3.76 persons per family, with married-couple families (1,381 | 63.5%) accounting for the largest median family size of 3.99 persons per family. On the other hand, single male/father families (260 | 11.9%) represent the smallest median family size with 3.33 persons per family.
| Family Type | # Families | Family Size |
| Married-Couple | 1,381 (63.5%) | 3.99 |
| Single Male/Father | 260 (11.9%) | 3.33 |
| Single Female/Mother | 535 (24.6%) | 3.36 |
| Total Families | 2,176 (100.0%) | 3.76 |
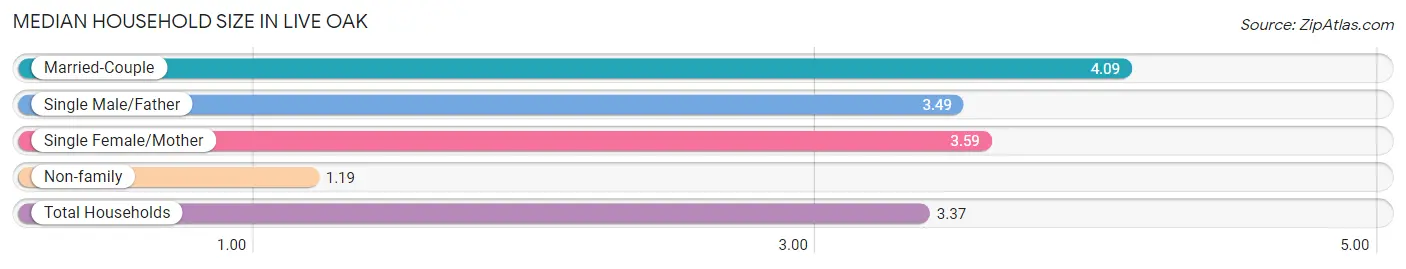
Median Household Size in Live Oak
The median household size in Live Oak is 3.37 persons per household, with married-couple households (1,381 | 51.2%) accounting for the largest median household size of 4.09 persons per household. non-family households (519 | 19.3%) represent the smallest median household size with 1.19 persons per household.
| Household Type | # Households | Household Size |
| Married-Couple | 1,381 (51.2%) | 4.09 |
| Single Male/Father | 260 (9.7%) | 3.49 |
| Single Female/Mother | 535 (19.9%) | 3.59 |
| Non-family | 519 (19.3%) | 1.19 |
| Total Households | 2,695 (100.0%) | 3.37 |
Household Size by Marriage Status in Live Oak
Out of a total of 2,695 households in Live Oak, 2,176 (80.7%) are family households, while 519 (19.3%) are nonfamily households. The most numerous type of family households are 2-person households, comprising 584, and the most common type of nonfamily households are 1-person households, comprising 441.
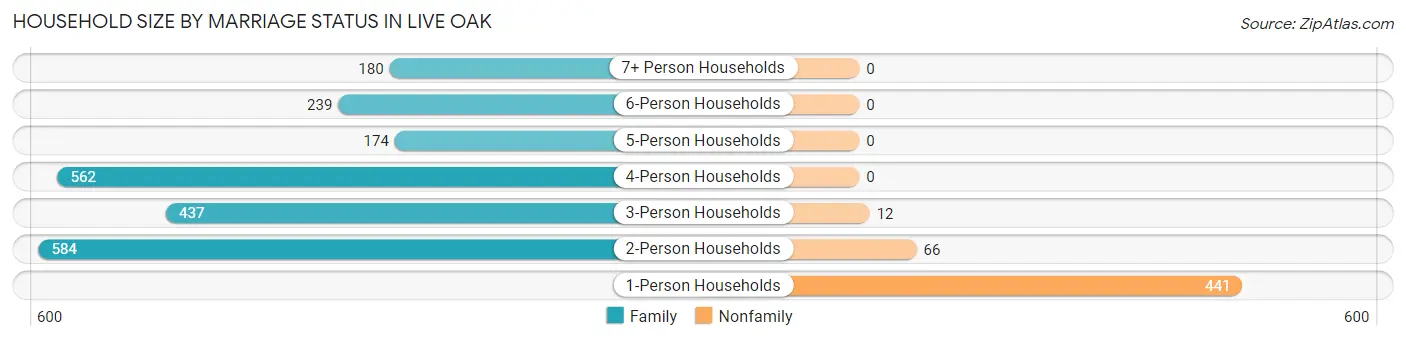
| Household Size | Family Households | Nonfamily Households |
| 1-Person Households | - | 441 (16.4%) |
| 2-Person Households | 584 (21.7%) | 66 (2.5%) |
| 3-Person Households | 437 (16.2%) | 12 (0.4%) |
| 4-Person Households | 562 (20.8%) | 0 (0.0%) |
| 5-Person Households | 174 (6.5%) | 0 (0.0%) |
| 6-Person Households | 239 (8.9%) | 0 (0.0%) |
| 7+ Person Households | 180 (6.7%) | 0 (0.0%) |
| Total | 2,176 (80.7%) | 519 (19.3%) |
Female Fertility in Live Oak
Fertility by Age in Live Oak
Average fertility rate in Live Oak is 94.0 births per 1,000 women. Women in the age bracket of 20 to 34 years have the highest fertility rate with 218.0 births per 1,000 women. Women in the age bracket of 20 to 34 years acount for 89.7% of all women with births.
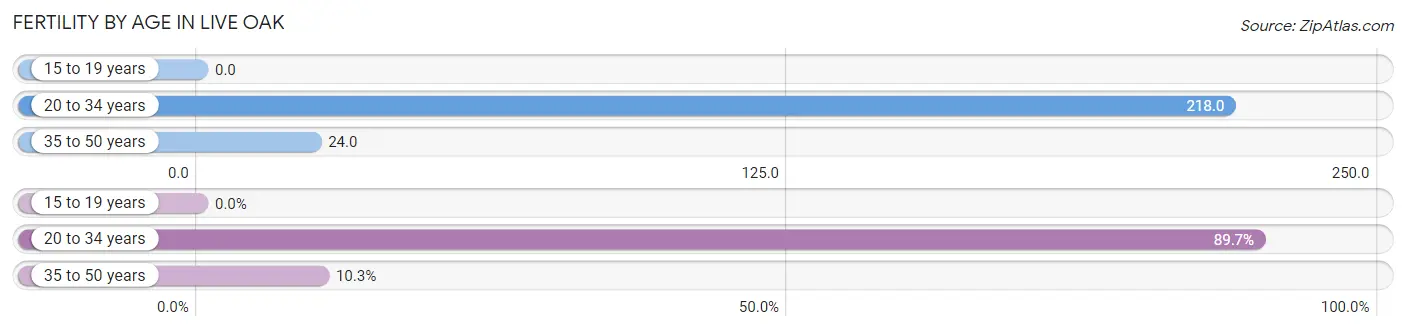
| Age Bracket | Women with Births | Births / 1,000 Women |
| 15 to 19 years | 0 (0.0%) | 0.0 |
| 20 to 34 years | 175 (89.7%) | 218.0 |
| 35 to 50 years | 20 (10.3%) | 24.0 |
| Total | 195 (100.0%) | 94.0 |
Fertility by Age by Marriage Status in Live Oak
59.5% of women with births (195) in Live Oak are married. The highest percentage of unmarried women with births falls into 20 to 34 years age bracket with 45.1% of them unmarried at the time of birth, while the lowest percentage of unmarried women with births belong to 35 to 50 years age bracket with 0.0% of them unmarried.
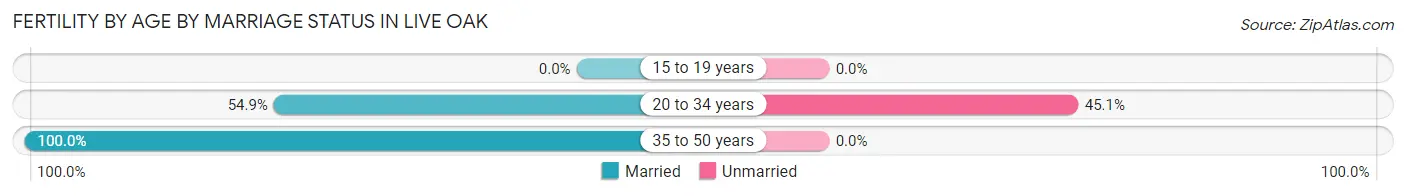
| Age Bracket | Married | Unmarried |
| 15 to 19 years | 0 (0.0%) | 0 (0.0%) |
| 20 to 34 years | 96 (54.9%) | 79 (45.1%) |
| 35 to 50 years | 20 (100.0%) | 0 (0.0%) |
| Total | 116 (59.5%) | 79 (40.5%) |
Fertility by Education in Live Oak
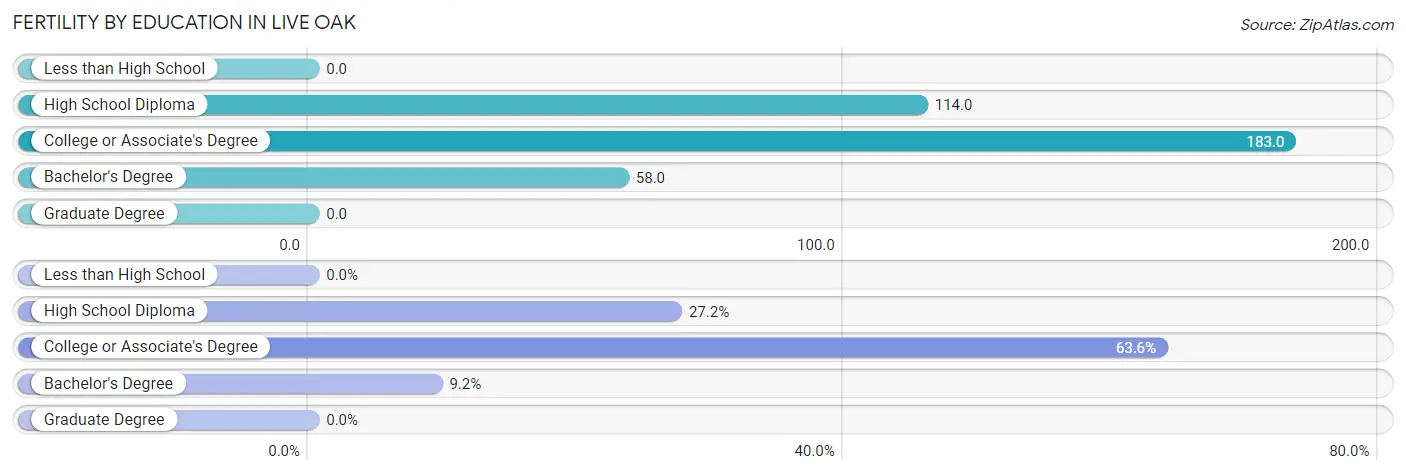
| Educational Attainment | Women with Births | Births / 1,000 Women |
| Less than High School | 0 (0.0%) | 0.0 |
| High School Diploma | 53 (27.2%) | 114.0 |
| College or Associate's Degree | 124 (63.6%) | 183.0 |
| Bachelor's Degree | 18 (9.2%) | 58.0 |
| Graduate Degree | 0 (0.0%) | 0.0 |
| Total | 195 (100.0%) | 94.0 |
Fertility by Education by Marriage Status in Live Oak
40.5% of women with births in Live Oak are unmarried. Women with the educational attainment of high school diploma are most likely to be married with 69.8% of them married at childbirth, while women with the educational attainment of bachelor's degree are least likely to be married with 100.0% of them unmarried at childbirth.
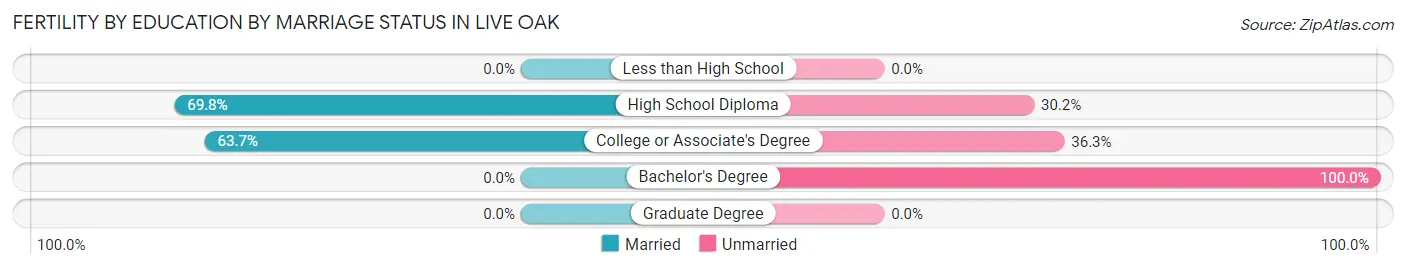
| Educational Attainment | Married | Unmarried |
| Less than High School | 0 (0.0%) | 0 (0.0%) |
| High School Diploma | 37 (69.8%) | 16 (30.2%) |
| College or Associate's Degree | 79 (63.7%) | 45 (36.3%) |
| Bachelor's Degree | 0 (0.0%) | 18 (100.0%) |
| Graduate Degree | 0 (0.0%) | 0 (0.0%) |
| Total | 116 (59.5%) | 79 (40.5%) |
Employment Characteristics in Live Oak
Employment by Class of Employer in Live Oak
Among the 3,799 employed individuals in Live Oak, private company employees (2,882 | 75.9%), self-employed (not incorporated) (318 | 8.4%), and local government employees (257 | 6.8%) make up the most common classes of employment.
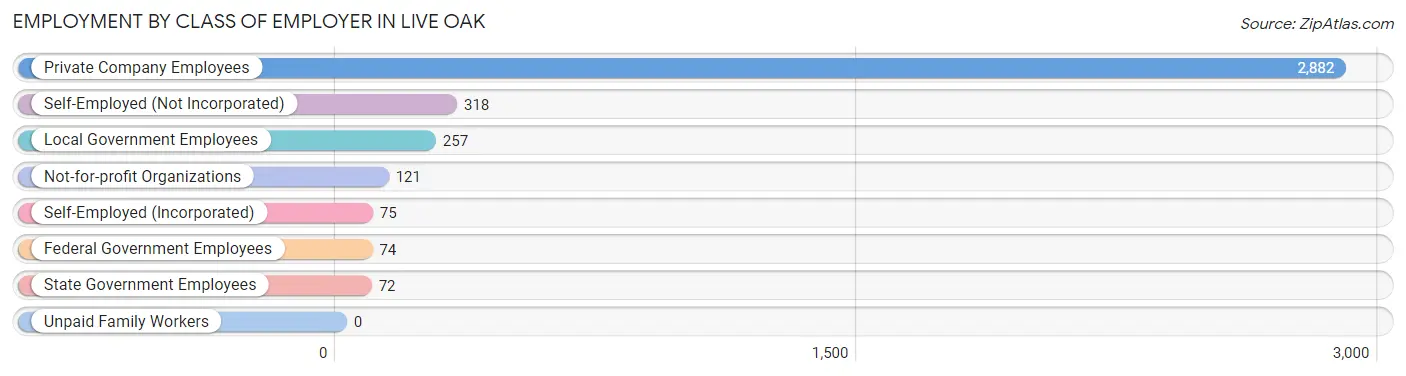
| Employer Class | # Employees | % Employees |
| Private Company Employees | 2,882 | 75.9% |
| Self-Employed (Incorporated) | 75 | 2.0% |
| Self-Employed (Not Incorporated) | 318 | 8.4% |
| Not-for-profit Organizations | 121 | 3.2% |
| Local Government Employees | 257 | 6.8% |
| State Government Employees | 72 | 1.9% |
| Federal Government Employees | 74 | 1.9% |
| Unpaid Family Workers | 0 | 0.0% |
| Total | 3,799 | 100.0% |
Employment Status by Age in Live Oak
According to the labor force statistics for Live Oak, out of the total population over 16 years of age (6,915), 60.6% or 4,190 individuals are in the labor force, with 8.0% or 335 of them unemployed. The age group with the highest labor force participation rate is 45 to 54 years, with 83.8% or 962 individuals in the labor force. Within the labor force, the 25 to 29 years age range has the highest percentage of unemployed individuals, with 20.7% or 83 of them being unemployed.
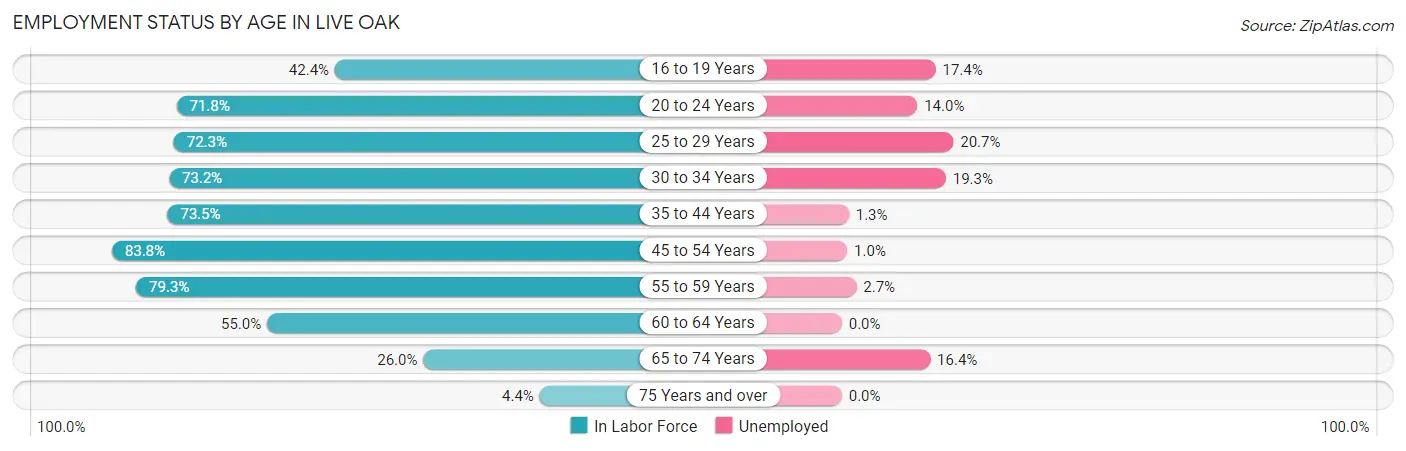
| Age Bracket | In Labor Force | Unemployed |
| 16 to 19 Years | 293 (42.4%) | 51 (17.4%) |
| 20 to 24 Years | 321 (71.8%) | 45 (14.0%) |
| 25 to 29 Years | 400 (72.3%) | 83 (20.7%) |
| 30 to 34 Years | 477 (73.2%) | 92 (19.3%) |
| 35 to 44 Years | 760 (73.5%) | 10 (1.3%) |
| 45 to 54 Years | 962 (83.8%) | 10 (1.0%) |
| 55 to 59 Years | 489 (79.3%) | 13 (2.7%) |
| 60 to 64 Years | 260 (55.0%) | 0 (0.0%) |
| 65 to 74 Years | 207 (26.0%) | 34 (16.4%) |
| 75 Years and over | 22 (4.4%) | 0 (0.0%) |
| Total | 4,190 (60.6%) | 335 (8.0%) |
Employment Status by Educational Attainment in Live Oak
According to labor force statistics for Live Oak, 74.8% of individuals (3,349) out of the total population between 25 and 64 years of age (4,477) are in the labor force, with 6.1% or 204 of them being unemployed. The group with the highest labor force participation rate are those with the educational attainment of less than high school, with 82.3% or 973 individuals in the labor force. Within the labor force, individuals with high school diploma education have the highest percentage of unemployment, with 9.1% or 65 of them being unemployed.
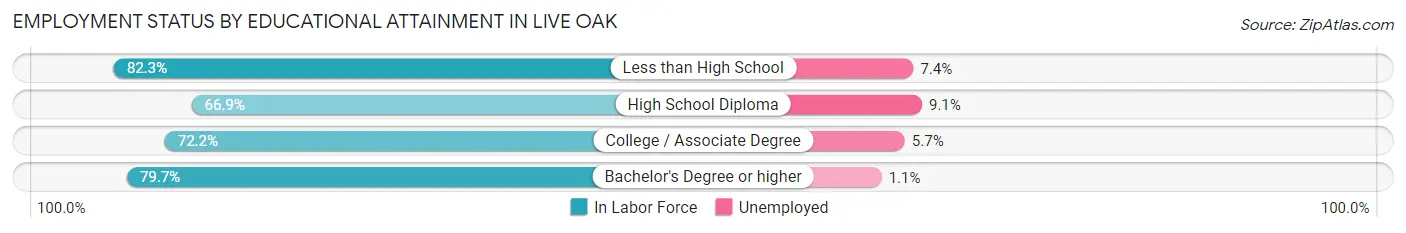
| Educational Attainment | In Labor Force | Unemployed |
| Less than High School | 973 (82.3%) | 87 (7.4%) |
| High School Diploma | 714 (66.9%) | 97 (9.1%) |
| College / Associate Degree | 1,113 (72.2%) | 88 (5.7%) |
| Bachelor's Degree or higher | 547 (79.7%) | 8 (1.1%) |
| Total | 3,349 (74.8%) | 273 (6.1%) |
Employment Occupations by Sex in Live Oak
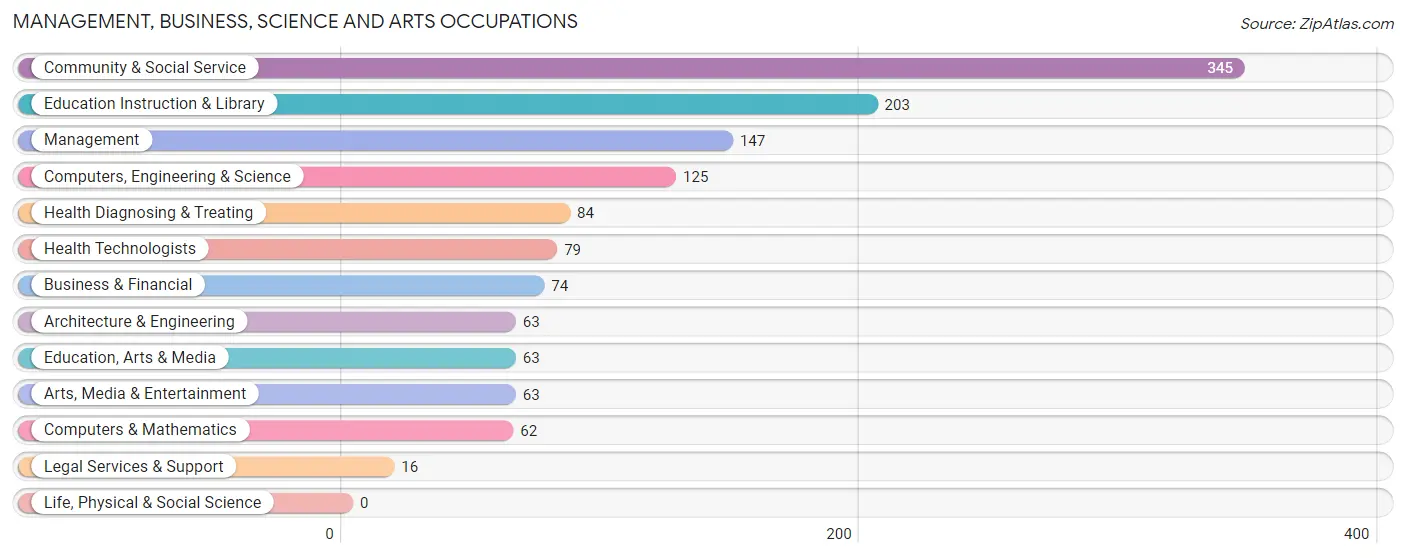
Management, Business, Science and Arts Occupations
The most common Management, Business, Science and Arts occupations in Live Oak are Community & Social Service (345 | 9.0%), Education Instruction & Library (203 | 5.3%), Management (147 | 3.8%), Computers, Engineering & Science (125 | 3.3%), and Health Diagnosing & Treating (84 | 2.2%).
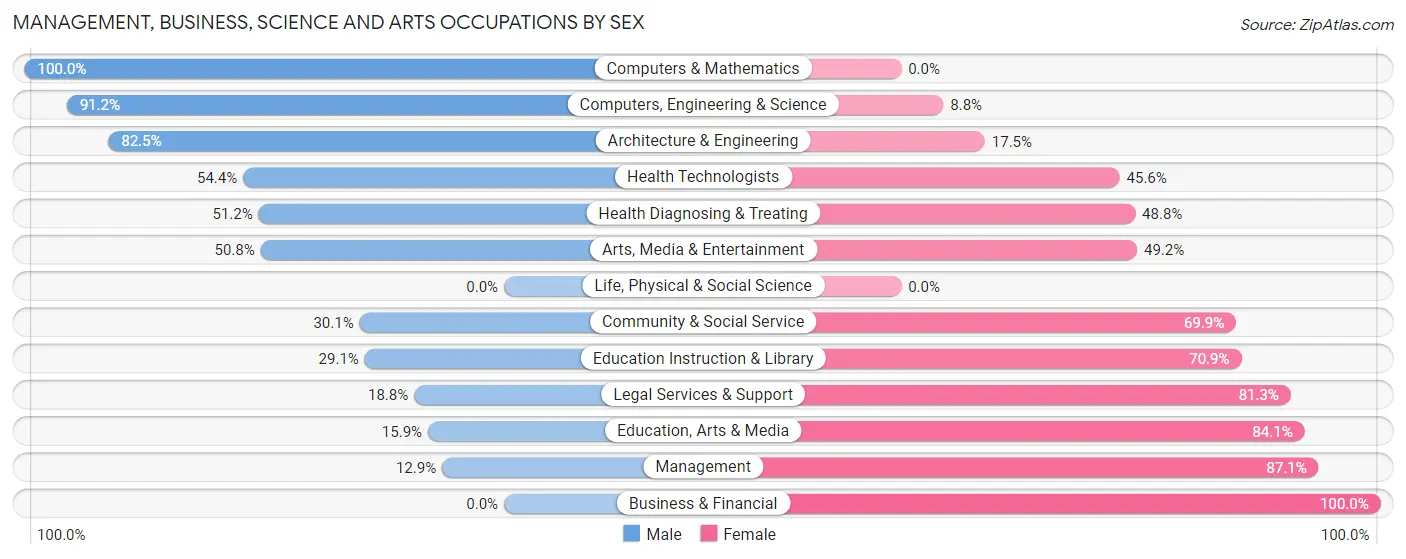
Management, Business, Science and Arts Occupations by Sex
Within the Management, Business, Science and Arts occupations in Live Oak, the most male-oriented occupations are Computers & Mathematics (100.0%), Computers, Engineering & Science (91.2%), and Architecture & Engineering (82.5%), while the most female-oriented occupations are Business & Financial (100.0%), Management (87.1%), and Education, Arts & Media (84.1%).
| Occupation | Male | Female |
| Management | 19 (12.9%) | 128 (87.1%) |
| Business & Financial | 0 (0.0%) | 74 (100.0%) |
| Computers, Engineering & Science | 114 (91.2%) | 11 (8.8%) |
| Computers & Mathematics | 62 (100.0%) | 0 (0.0%) |
| Architecture & Engineering | 52 (82.5%) | 11 (17.5%) |
| Life, Physical & Social Science | 0 (0.0%) | 0 (0.0%) |
| Community & Social Service | 104 (30.1%) | 241 (69.9%) |
| Education, Arts & Media | 10 (15.9%) | 53 (84.1%) |
| Legal Services & Support | 3 (18.8%) | 13 (81.2%) |
| Education Instruction & Library | 59 (29.1%) | 144 (70.9%) |
| Arts, Media & Entertainment | 32 (50.8%) | 31 (49.2%) |
| Health Diagnosing & Treating | 43 (51.2%) | 41 (48.8%) |
| Health Technologists | 43 (54.4%) | 36 (45.6%) |
| Total (Category) | 280 (36.1%) | 495 (63.9%) |
| Total (Overall) | 2,294 (59.7%) | 1,548 (40.3%) |
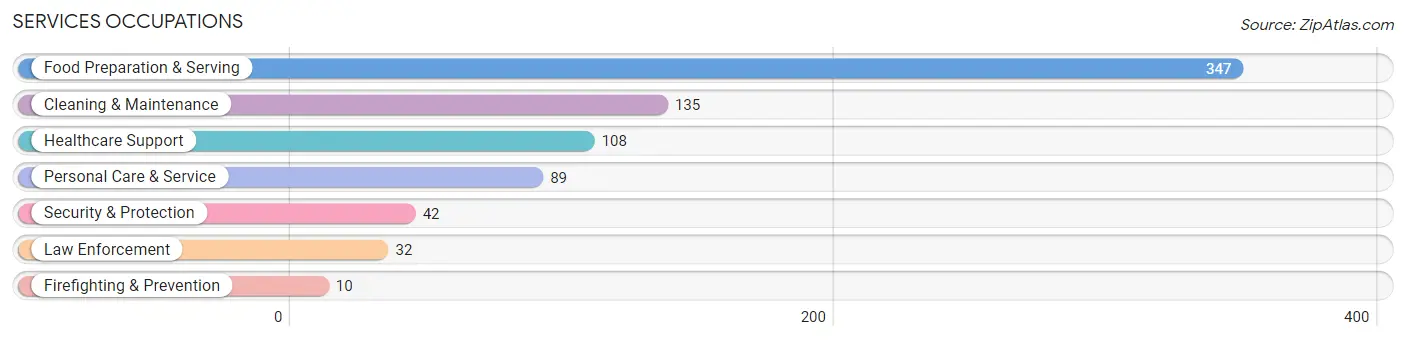
Services Occupations
The most common Services occupations in Live Oak are Food Preparation & Serving (347 | 9.0%), Cleaning & Maintenance (135 | 3.5%), Healthcare Support (108 | 2.8%), Personal Care & Service (89 | 2.3%), and Security & Protection (42 | 1.1%).
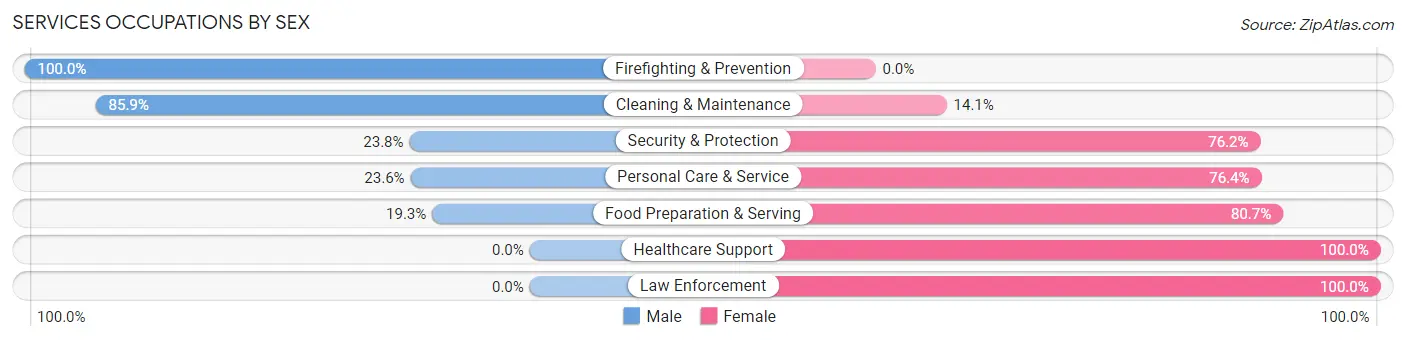
Services Occupations by Sex
Within the Services occupations in Live Oak, the most male-oriented occupations are Firefighting & Prevention (100.0%), Cleaning & Maintenance (85.9%), and Security & Protection (23.8%), while the most female-oriented occupations are Healthcare Support (100.0%), Law Enforcement (100.0%), and Food Preparation & Serving (80.7%).
| Occupation | Male | Female |
| Healthcare Support | 0 (0.0%) | 108 (100.0%) |
| Security & Protection | 10 (23.8%) | 32 (76.2%) |
| Firefighting & Prevention | 10 (100.0%) | 0 (0.0%) |
| Law Enforcement | 0 (0.0%) | 32 (100.0%) |
| Food Preparation & Serving | 67 (19.3%) | 280 (80.7%) |
| Cleaning & Maintenance | 116 (85.9%) | 19 (14.1%) |
| Personal Care & Service | 21 (23.6%) | 68 (76.4%) |
| Total (Category) | 214 (29.7%) | 507 (70.3%) |
| Total (Overall) | 2,294 (59.7%) | 1,548 (40.3%) |
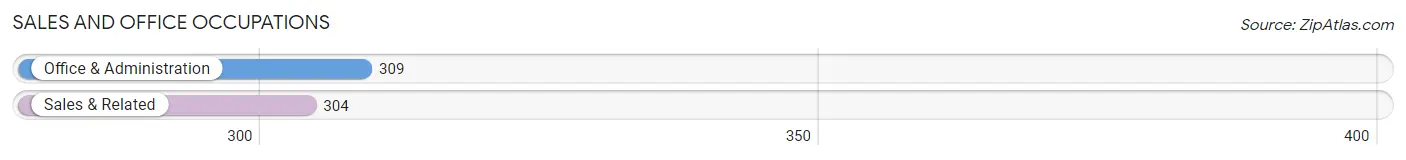
Sales and Office Occupations
The most common Sales and Office occupations in Live Oak are Office & Administration (309 | 8.0%), and Sales & Related (304 | 7.9%).
Sales and Office Occupations by Sex
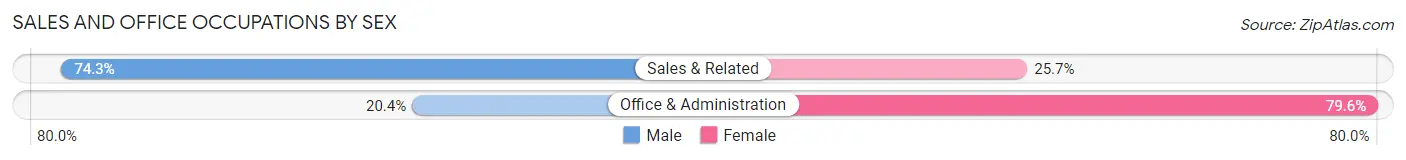
| Occupation | Male | Female |
| Sales & Related | 226 (74.3%) | 78 (25.7%) |
| Office & Administration | 63 (20.4%) | 246 (79.6%) |
| Total (Category) | 289 (47.1%) | 324 (52.8%) |
| Total (Overall) | 2,294 (59.7%) | 1,548 (40.3%) |
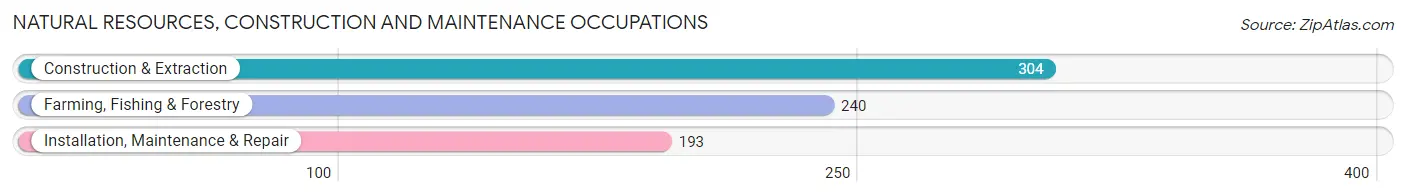
Natural Resources, Construction and Maintenance Occupations
The most common Natural Resources, Construction and Maintenance occupations in Live Oak are Construction & Extraction (304 | 7.9%), Farming, Fishing & Forestry (240 | 6.2%), and Installation, Maintenance & Repair (193 | 5.0%).
Natural Resources, Construction and Maintenance Occupations by Sex
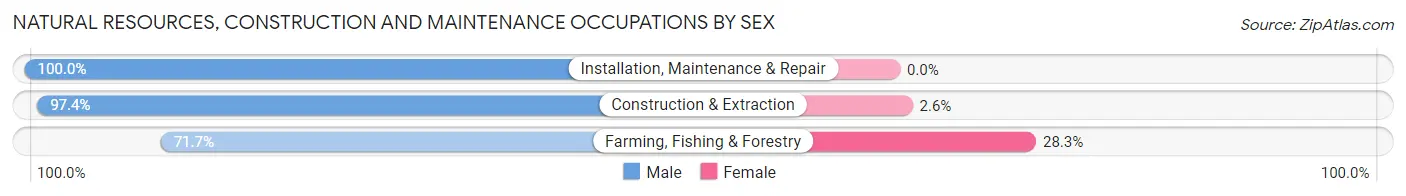
| Occupation | Male | Female |
| Farming, Fishing & Forestry | 172 (71.7%) | 68 (28.3%) |
| Construction & Extraction | 296 (97.4%) | 8 (2.6%) |
| Installation, Maintenance & Repair | 193 (100.0%) | 0 (0.0%) |
| Total (Category) | 661 (89.7%) | 76 (10.3%) |
| Total (Overall) | 2,294 (59.7%) | 1,548 (40.3%) |
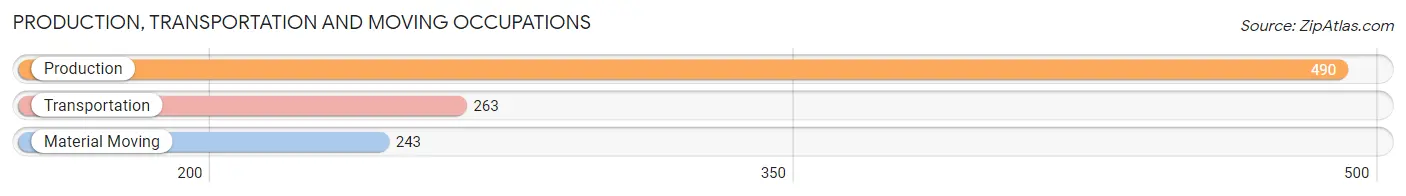
Production, Transportation and Moving Occupations
The most common Production, Transportation and Moving occupations in Live Oak are Production (490 | 12.8%), Transportation (263 | 6.9%), and Material Moving (243 | 6.3%).
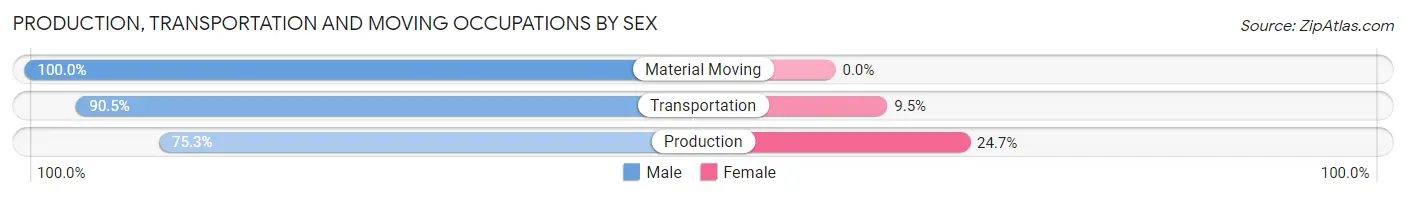
Production, Transportation and Moving Occupations by Sex
| Occupation | Male | Female |
| Production | 369 (75.3%) | 121 (24.7%) |
| Transportation | 238 (90.5%) | 25 (9.5%) |
| Material Moving | 243 (100.0%) | 0 (0.0%) |
| Total (Category) | 850 (85.3%) | 146 (14.7%) |
| Total (Overall) | 2,294 (59.7%) | 1,548 (40.3%) |
Employment Industries by Sex in Live Oak
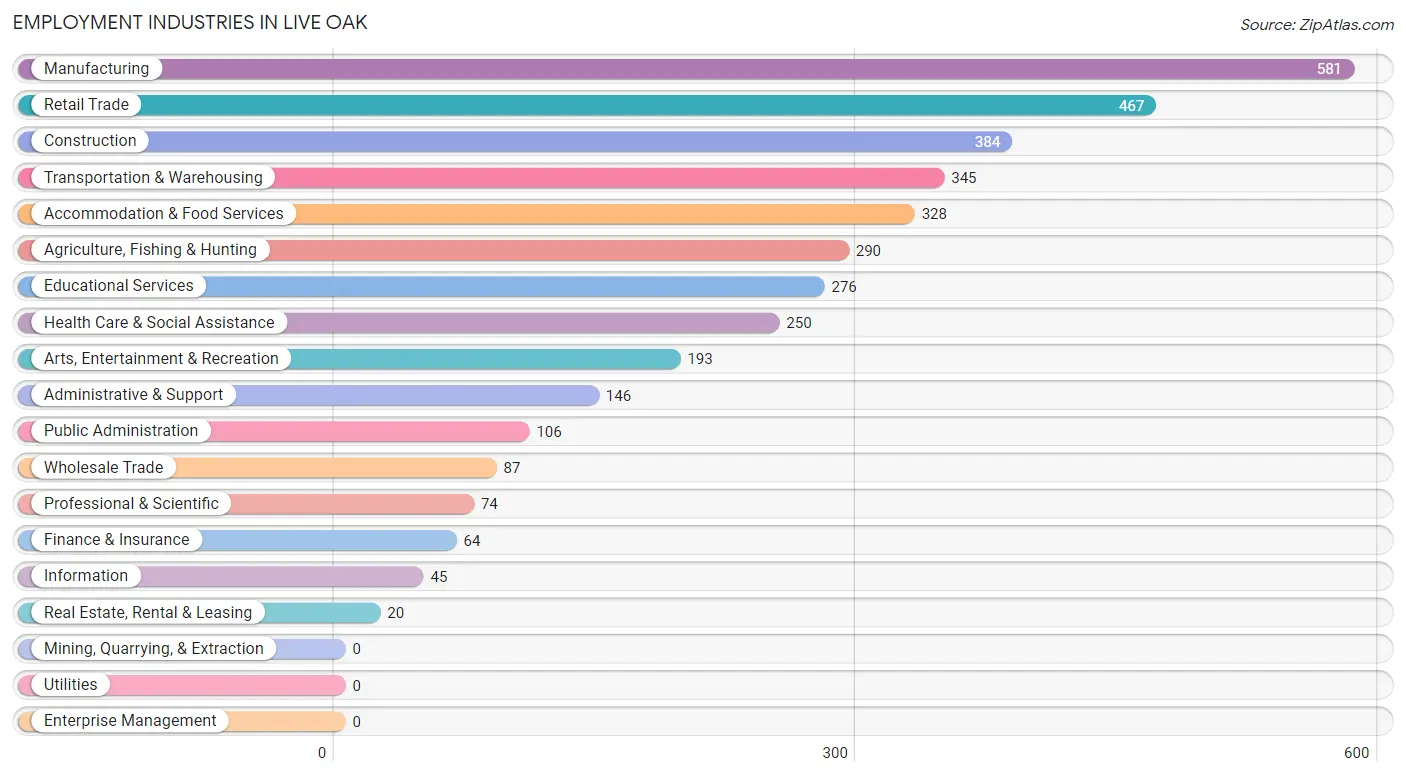
Employment Industries in Live Oak
The major employment industries in Live Oak include Manufacturing (581 | 15.1%), Retail Trade (467 | 12.2%), Construction (384 | 10.0%), Transportation & Warehousing (345 | 9.0%), and Accommodation & Food Services (328 | 8.5%).
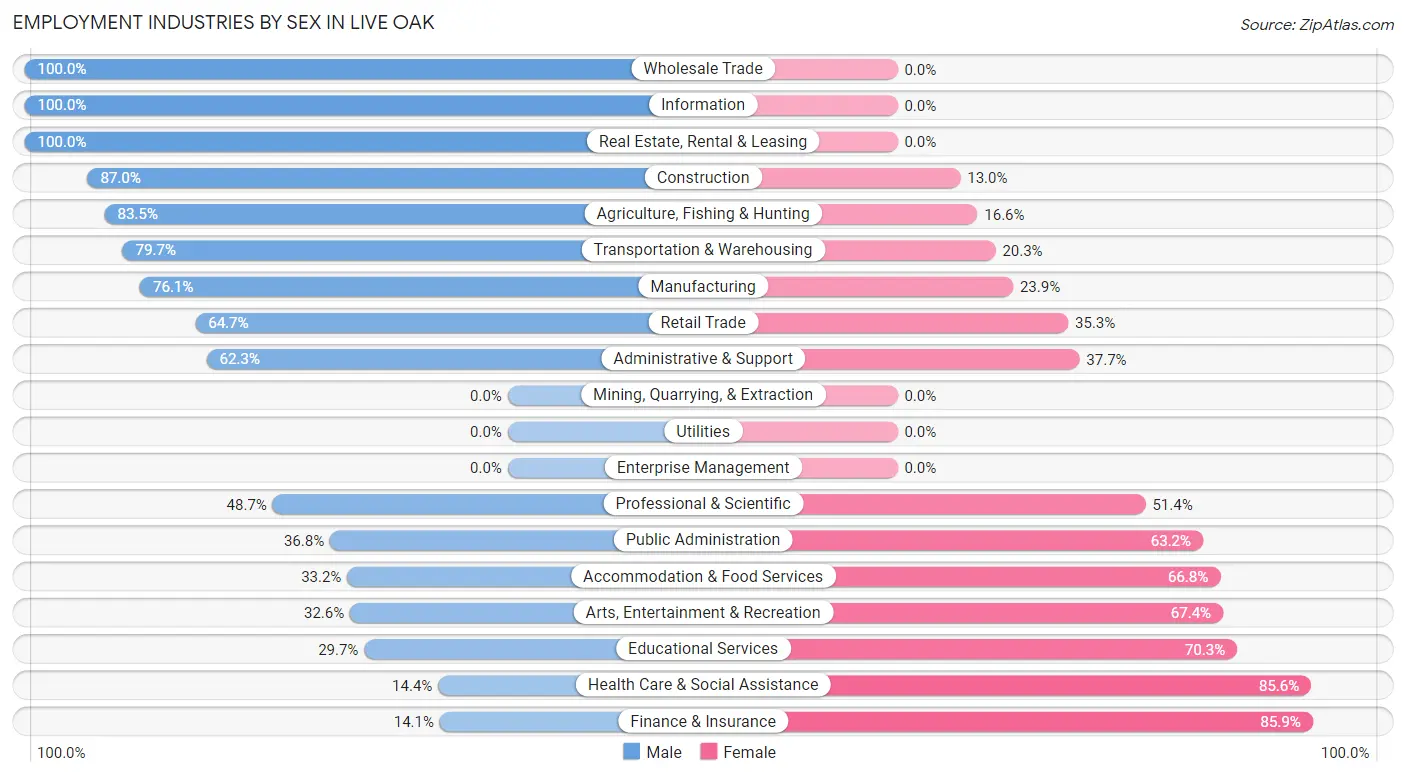
Employment Industries by Sex in Live Oak
The Live Oak industries that see more men than women are Wholesale Trade (100.0%), Information (100.0%), and Real Estate, Rental & Leasing (100.0%), whereas the industries that tend to have a higher number of women are Finance & Insurance (85.9%), Health Care & Social Assistance (85.6%), and Educational Services (70.3%).
| Industry | Male | Female |
| Agriculture, Fishing & Hunting | 242 (83.5%) | 48 (16.6%) |
| Mining, Quarrying, & Extraction | 0 (0.0%) | 0 (0.0%) |
| Construction | 334 (87.0%) | 50 (13.0%) |
| Manufacturing | 442 (76.1%) | 139 (23.9%) |
| Wholesale Trade | 87 (100.0%) | 0 (0.0%) |
| Retail Trade | 302 (64.7%) | 165 (35.3%) |
| Transportation & Warehousing | 275 (79.7%) | 70 (20.3%) |
| Utilities | 0 (0.0%) | 0 (0.0%) |
| Information | 45 (100.0%) | 0 (0.0%) |
| Finance & Insurance | 9 (14.1%) | 55 (85.9%) |
| Real Estate, Rental & Leasing | 20 (100.0%) | 0 (0.0%) |
| Professional & Scientific | 36 (48.6%) | 38 (51.3%) |
| Enterprise Management | 0 (0.0%) | 0 (0.0%) |
| Administrative & Support | 91 (62.3%) | 55 (37.7%) |
| Educational Services | 82 (29.7%) | 194 (70.3%) |
| Health Care & Social Assistance | 36 (14.4%) | 214 (85.6%) |
| Arts, Entertainment & Recreation | 63 (32.6%) | 130 (67.4%) |
| Accommodation & Food Services | 109 (33.2%) | 219 (66.8%) |
| Public Administration | 39 (36.8%) | 67 (63.2%) |
| Total | 2,294 (59.7%) | 1,548 (40.3%) |
Education in Live Oak
School Enrollment in Live Oak
The most common levels of schooling among the 2,400 students in Live Oak are middle school (660 | 27.5%), high school (649 | 27.0%), and college / undergraduate (449 | 18.7%).
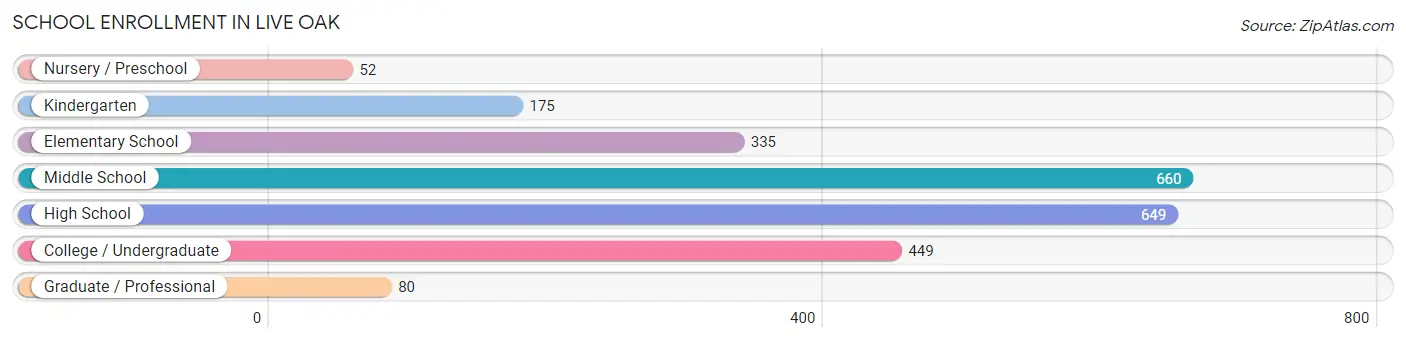
| School Level | # Students | % Students |
| Nursery / Preschool | 52 | 2.2% |
| Kindergarten | 175 | 7.3% |
| Elementary School | 335 | 14.0% |
| Middle School | 660 | 27.5% |
| High School | 649 | 27.0% |
| College / Undergraduate | 449 | 18.7% |
| Graduate / Professional | 80 | 3.3% |
| Total | 2,400 | 100.0% |
School Enrollment by Age by Funding Source in Live Oak
Out of a total of 2,400 students who are enrolled in schools in Live Oak, 211 (8.8%) attend a private institution, while the remaining 2,189 (91.2%) are enrolled in public schools. The age group of 35 years and over has the highest likelihood of being enrolled in private schools, with 23 (100.0% in the age bracket) enrolled. Conversely, the age group of 3 to 4 year olds has the lowest likelihood of being enrolled in a private school, with 52 (100.0% in the age bracket) attending a public institution.
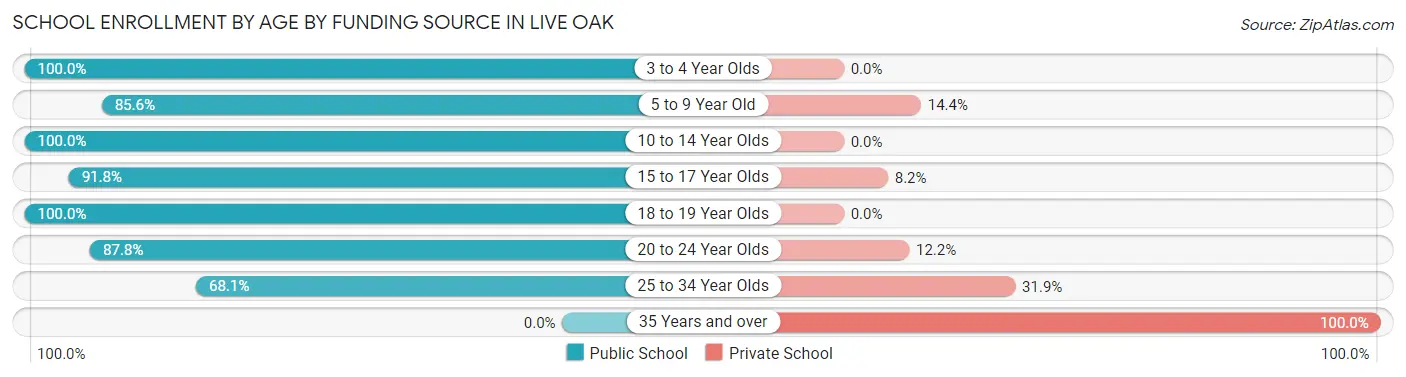
| Age Bracket | Public School | Private School |
| 3 to 4 Year Olds | 52 (100.0%) | 0 (0.0%) |
| 5 to 9 Year Old | 429 (85.6%) | 72 (14.4%) |
| 10 to 14 Year Olds | 789 (100.0%) | 0 (0.0%) |
| 15 to 17 Year Olds | 469 (91.8%) | 42 (8.2%) |
| 18 to 19 Year Olds | 142 (100.0%) | 0 (0.0%) |
| 20 to 24 Year Olds | 209 (87.8%) | 29 (12.2%) |
| 25 to 34 Year Olds | 98 (68.1%) | 46 (31.9%) |
| 35 Years and over | 0 (0.0%) | 23 (100.0%) |
| Total | 2,189 (91.2%) | 211 (8.8%) |
Educational Attainment by Field of Study in Live Oak
Visual & performing arts (139 | 17.3%), bio, nature & agricultural (93 | 11.6%), psychology (92 | 11.5%), business (88 | 11.0%), and engineering (80 | 10.0%) are the most common fields of study among 802 individuals in Live Oak who have obtained a bachelor's degree or higher.
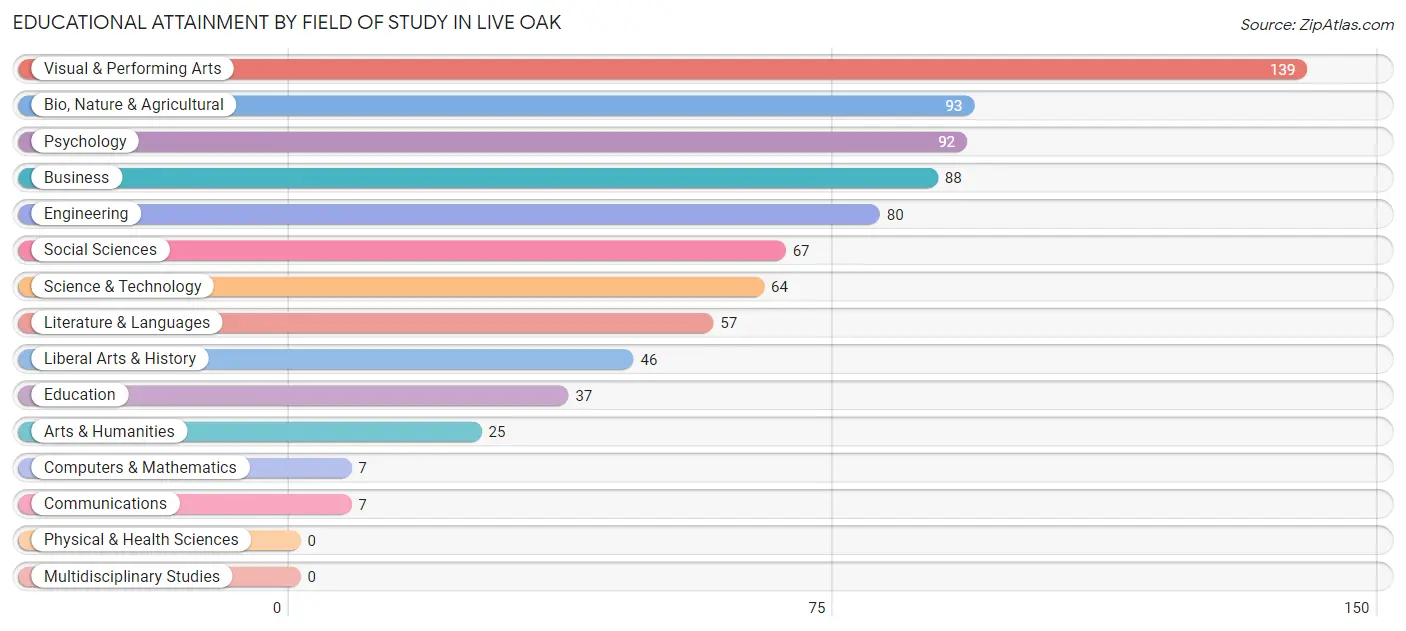
| Field of Study | # Graduates | % Graduates |
| Computers & Mathematics | 7 | 0.9% |
| Bio, Nature & Agricultural | 93 | 11.6% |
| Physical & Health Sciences | 0 | 0.0% |
| Psychology | 92 | 11.5% |
| Social Sciences | 67 | 8.4% |
| Engineering | 80 | 10.0% |
| Multidisciplinary Studies | 0 | 0.0% |
| Science & Technology | 64 | 8.0% |
| Business | 88 | 11.0% |
| Education | 37 | 4.6% |
| Literature & Languages | 57 | 7.1% |
| Liberal Arts & History | 46 | 5.7% |
| Visual & Performing Arts | 139 | 17.3% |
| Communications | 7 | 0.9% |
| Arts & Humanities | 25 | 3.1% |
| Total | 802 | 100.0% |
Transportation & Commute in Live Oak
Vehicle Availability by Sex in Live Oak
The most prevalent vehicle ownership categories in Live Oak are males with 2 vehicles (691, accounting for 30.7%) and females with 2 vehicles (267, making up 44.6%).
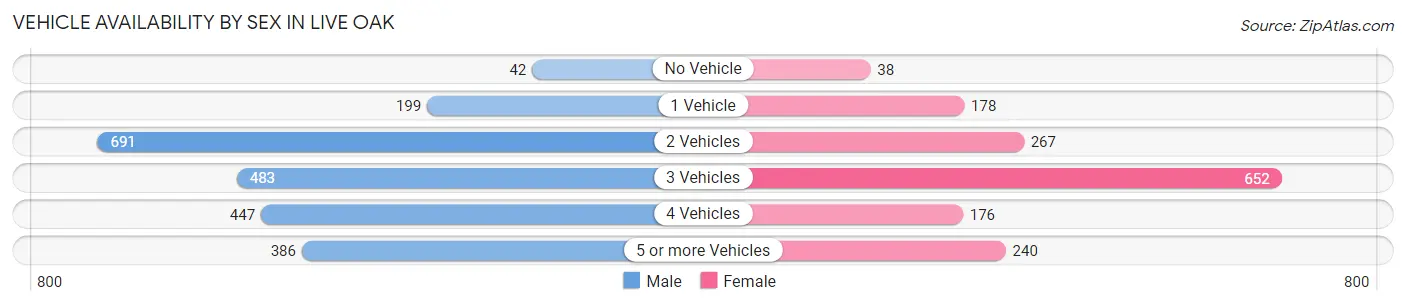
| Vehicles Available | Male | Female |
| No Vehicle | 42 (1.9%) | 38 (2.5%) |
| 1 Vehicle | 199 (8.8%) | 178 (11.5%) |
| 2 Vehicles | 691 (30.7%) | 267 (17.2%) |
| 3 Vehicles | 483 (21.5%) | 652 (42.0%) |
| 4 Vehicles | 447 (19.9%) | 176 (11.4%) |
| 5 or more Vehicles | 386 (17.2%) | 240 (15.5%) |
| Total | 2,248 (100.0%) | 1,551 (100.0%) |
Commute Time in Live Oak
The most frequently occuring commute durations in Live Oak are 15 to 19 minutes (699 commuters, 19.8%), 30 to 34 minutes (677 commuters, 19.1%), and 10 to 14 minutes (424 commuters, 12.0%).
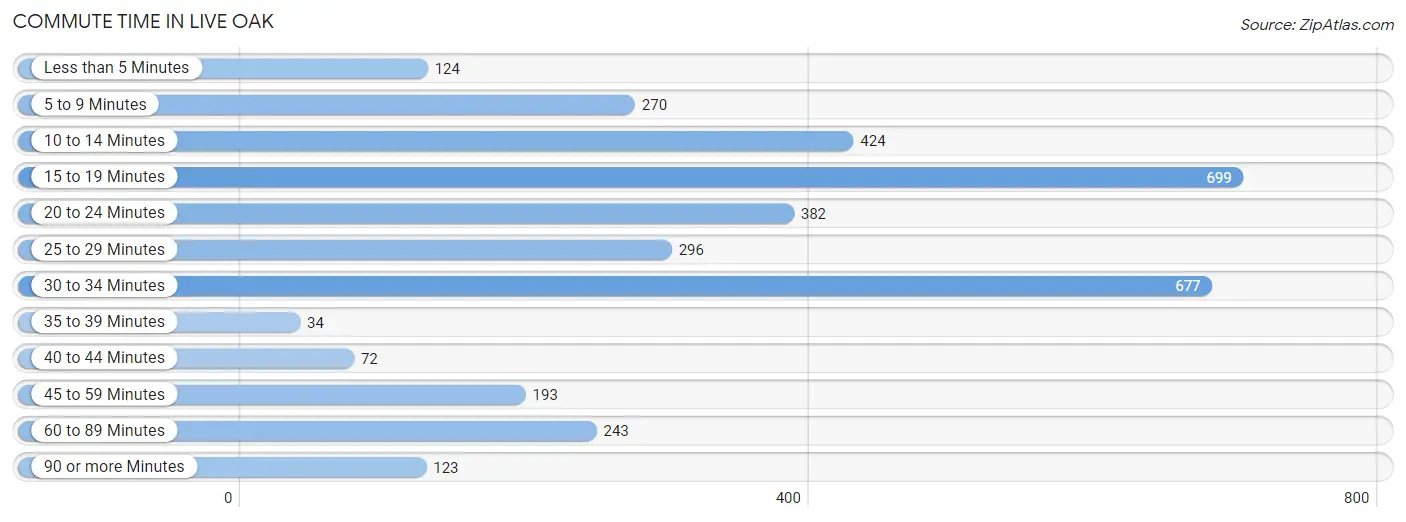
| Commute Time | # Commuters | % Commuters |
| Less than 5 Minutes | 124 | 3.5% |
| 5 to 9 Minutes | 270 | 7.6% |
| 10 to 14 Minutes | 424 | 12.0% |
| 15 to 19 Minutes | 699 | 19.8% |
| 20 to 24 Minutes | 382 | 10.8% |
| 25 to 29 Minutes | 296 | 8.4% |
| 30 to 34 Minutes | 677 | 19.1% |
| 35 to 39 Minutes | 34 | 1.0% |
| 40 to 44 Minutes | 72 | 2.0% |
| 45 to 59 Minutes | 193 | 5.5% |
| 60 to 89 Minutes | 243 | 6.9% |
| 90 or more Minutes | 123 | 3.5% |
Commute Time by Sex in Live Oak
The most common commute times in Live Oak are 15 to 19 minutes (435 commuters, 21.3%) for males and 30 to 34 minutes (430 commuters, 28.7%) for females.
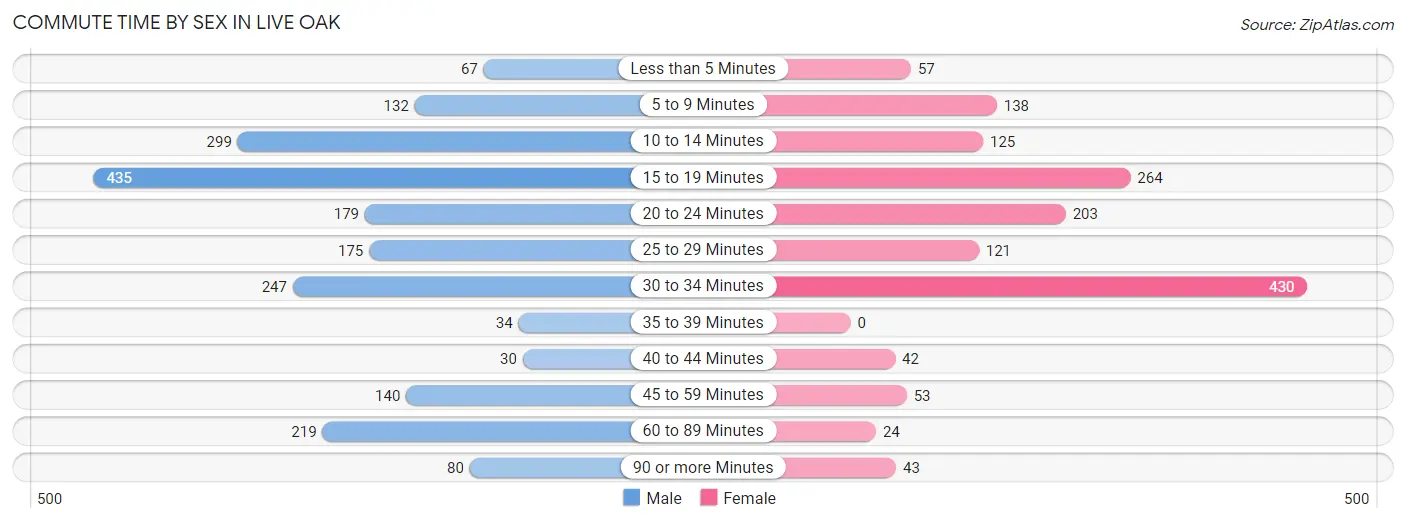
| Commute Time | Male | Female |
| Less than 5 Minutes | 67 (3.3%) | 57 (3.8%) |
| 5 to 9 Minutes | 132 (6.5%) | 138 (9.2%) |
| 10 to 14 Minutes | 299 (14.7%) | 125 (8.3%) |
| 15 to 19 Minutes | 435 (21.3%) | 264 (17.6%) |
| 20 to 24 Minutes | 179 (8.8%) | 203 (13.5%) |
| 25 to 29 Minutes | 175 (8.6%) | 121 (8.1%) |
| 30 to 34 Minutes | 247 (12.1%) | 430 (28.7%) |
| 35 to 39 Minutes | 34 (1.7%) | 0 (0.0%) |
| 40 to 44 Minutes | 30 (1.5%) | 42 (2.8%) |
| 45 to 59 Minutes | 140 (6.9%) | 53 (3.5%) |
| 60 to 89 Minutes | 219 (10.7%) | 24 (1.6%) |
| 90 or more Minutes | 80 (3.9%) | 43 (2.9%) |
Time of Departure to Work by Sex in Live Oak
The most frequent times of departure to work in Live Oak are 6:30 AM to 6:59 AM (379, 18.6%) for males and 7:00 AM to 7:29 AM (259, 17.3%) for females.
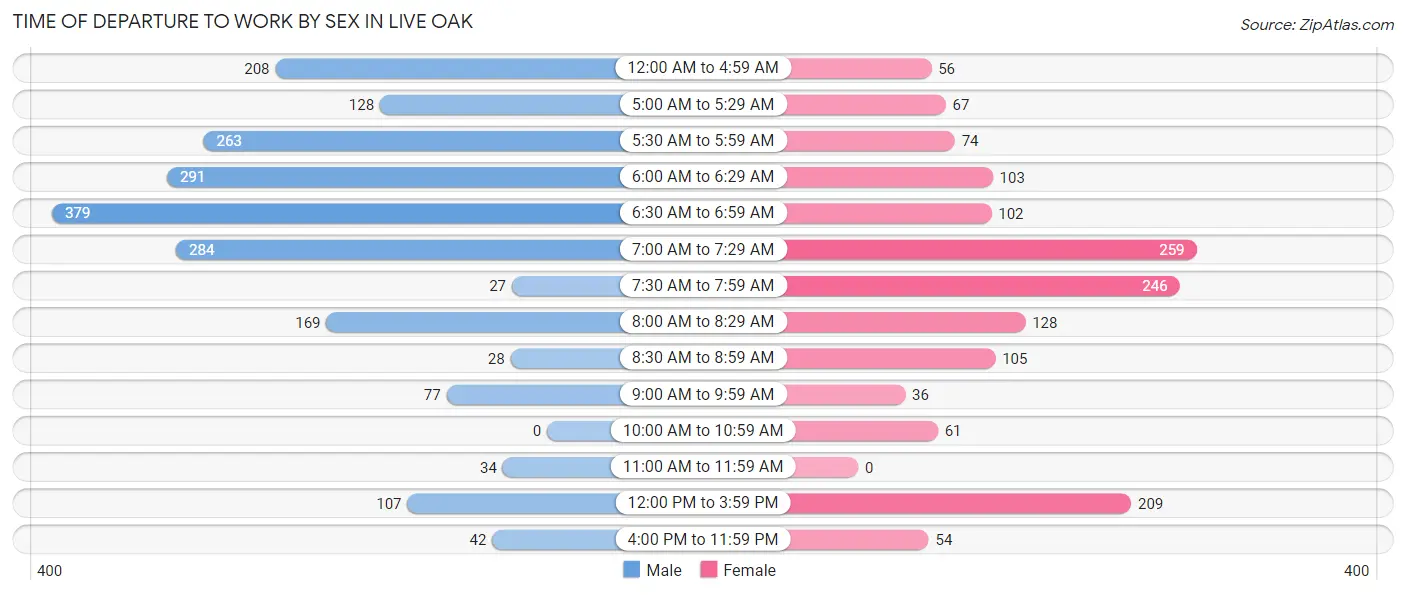
| Time of Departure | Male | Female |
| 12:00 AM to 4:59 AM | 208 (10.2%) | 56 (3.7%) |
| 5:00 AM to 5:29 AM | 128 (6.3%) | 67 (4.5%) |
| 5:30 AM to 5:59 AM | 263 (12.9%) | 74 (4.9%) |
| 6:00 AM to 6:29 AM | 291 (14.3%) | 103 (6.9%) |
| 6:30 AM to 6:59 AM | 379 (18.6%) | 102 (6.8%) |
| 7:00 AM to 7:29 AM | 284 (13.9%) | 259 (17.3%) |
| 7:30 AM to 7:59 AM | 27 (1.3%) | 246 (16.4%) |
| 8:00 AM to 8:29 AM | 169 (8.3%) | 128 (8.5%) |
| 8:30 AM to 8:59 AM | 28 (1.4%) | 105 (7.0%) |
| 9:00 AM to 9:59 AM | 77 (3.8%) | 36 (2.4%) |
| 10:00 AM to 10:59 AM | 0 (0.0%) | 61 (4.1%) |
| 11:00 AM to 11:59 AM | 34 (1.7%) | 0 (0.0%) |
| 12:00 PM to 3:59 PM | 107 (5.2%) | 209 (13.9%) |
| 4:00 PM to 11:59 PM | 42 (2.1%) | 54 (3.6%) |
| Total | 2,037 (100.0%) | 1,500 (100.0%) |
Housing Occupancy in Live Oak
Occupancy by Ownership in Live Oak
Of the total 2,695 dwellings in Live Oak, owner-occupied units account for 1,658 (61.5%), while renter-occupied units make up 1,037 (38.5%).
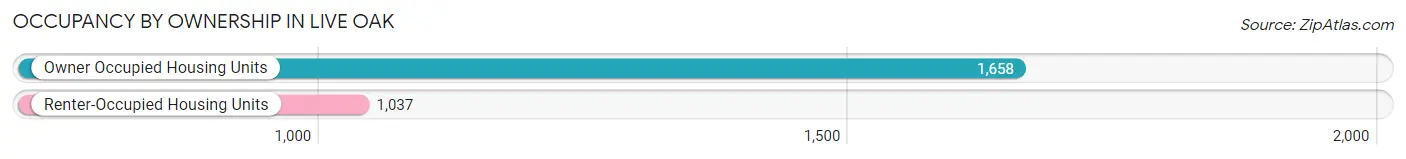
| Occupancy | # Housing Units | % Housing Units |
| Owner Occupied Housing Units | 1,658 | 61.5% |
| Renter-Occupied Housing Units | 1,037 | 38.5% |
| Total Occupied Housing Units | 2,695 | 100.0% |
Occupancy by Household Size in Live Oak
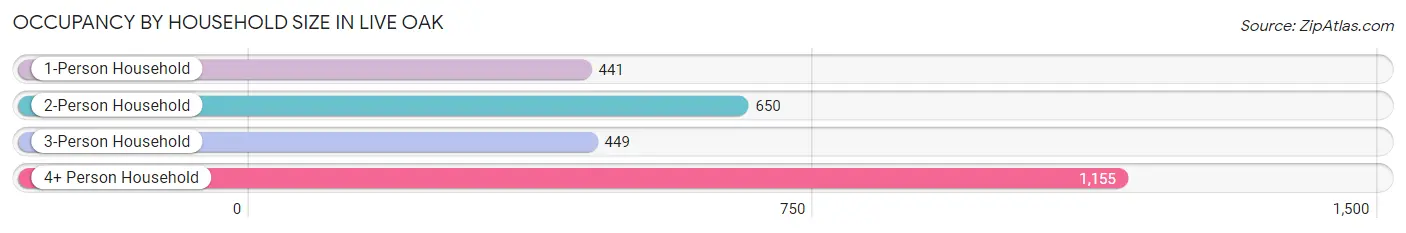
| Household Size | # Housing Units | % Housing Units |
| 1-Person Household | 441 | 16.4% |
| 2-Person Household | 650 | 24.1% |
| 3-Person Household | 449 | 16.7% |
| 4+ Person Household | 1,155 | 42.9% |
| Total Housing Units | 2,695 | 100.0% |
Occupancy by Ownership by Household Size in Live Oak
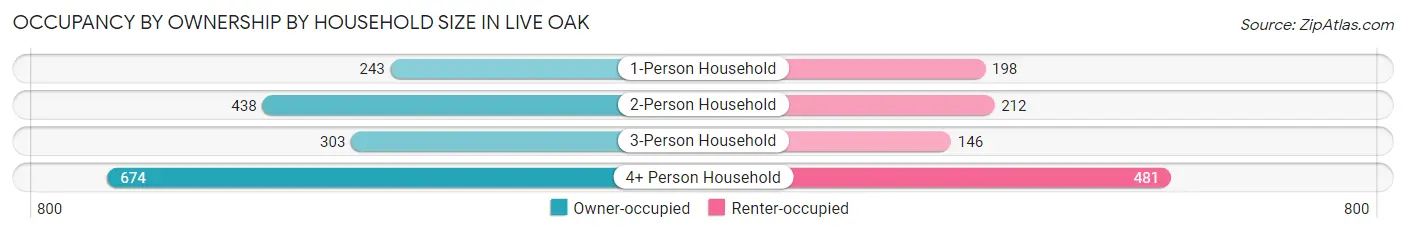
| Household Size | Owner-occupied | Renter-occupied |
| 1-Person Household | 243 (55.1%) | 198 (44.9%) |
| 2-Person Household | 438 (67.4%) | 212 (32.6%) |
| 3-Person Household | 303 (67.5%) | 146 (32.5%) |
| 4+ Person Household | 674 (58.4%) | 481 (41.6%) |
| Total Housing Units | 1,658 (61.5%) | 1,037 (38.5%) |
Occupancy by Educational Attainment in Live Oak
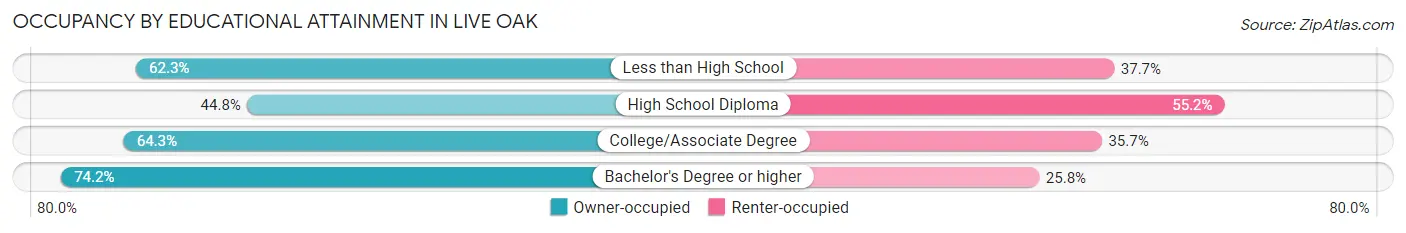
| Household Size | Owner-occupied | Renter-occupied |
| Less than High School | 532 (62.3%) | 322 (37.7%) |
| High School Diploma | 223 (44.8%) | 275 (55.2%) |
| College/Associate Degree | 604 (64.3%) | 336 (35.7%) |
| Bachelor's Degree or higher | 299 (74.2%) | 104 (25.8%) |
Occupancy by Age of Householder in Live Oak
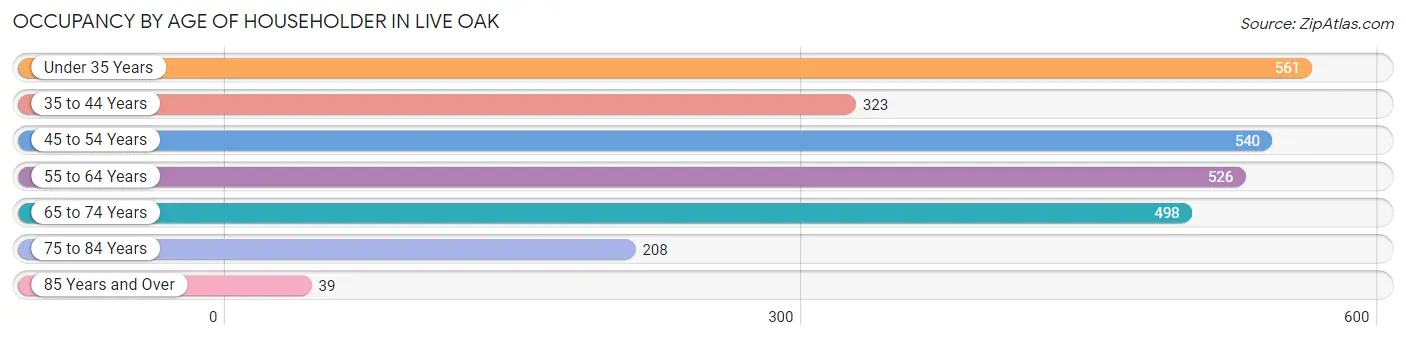
| Age Bracket | # Households | % Households |
| Under 35 Years | 561 | 20.8% |
| 35 to 44 Years | 323 | 12.0% |
| 45 to 54 Years | 540 | 20.0% |
| 55 to 64 Years | 526 | 19.5% |
| 65 to 74 Years | 498 | 18.5% |
| 75 to 84 Years | 208 | 7.7% |
| 85 Years and Over | 39 | 1.5% |
| Total | 2,695 | 100.0% |
Housing Finances in Live Oak
Median Income by Occupancy in Live Oak
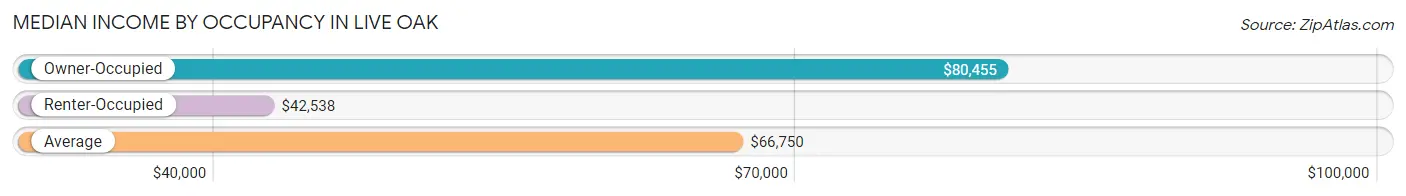
| Occupancy Type | # Households | Median Income |
| Owner-Occupied | 1,658 (61.5%) | $80,455 |
| Renter-Occupied | 1,037 (38.5%) | $42,538 |
| Average | 2,695 (100.0%) | $66,750 |
Occupancy by Householder Income Bracket in Live Oak
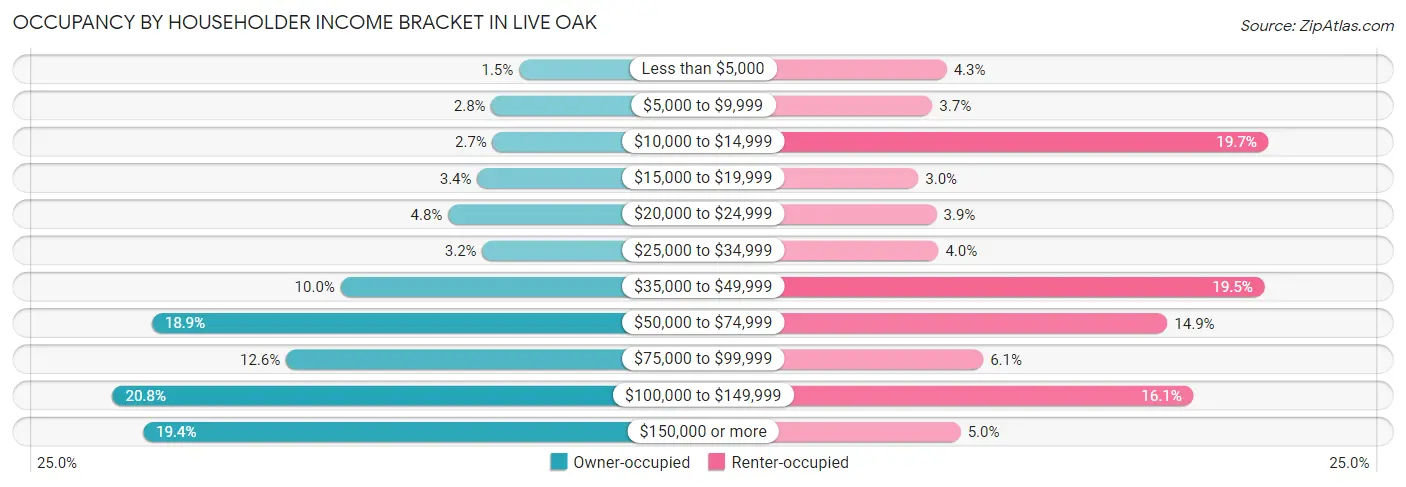
| Income Bracket | Owner-occupied | Renter-occupied |
| Less than $5,000 | 24 (1.5%) | 45 (4.3%) |
| $5,000 to $9,999 | 46 (2.8%) | 38 (3.7%) |
| $10,000 to $14,999 | 45 (2.7%) | 204 (19.7%) |
| $15,000 to $19,999 | 57 (3.4%) | 31 (3.0%) |
| $20,000 to $24,999 | 80 (4.8%) | 40 (3.9%) |
| $25,000 to $34,999 | 53 (3.2%) | 41 (4.0%) |
| $35,000 to $49,999 | 165 (10.0%) | 202 (19.5%) |
| $50,000 to $74,999 | 314 (18.9%) | 154 (14.8%) |
| $75,000 to $99,999 | 208 (12.6%) | 63 (6.1%) |
| $100,000 to $149,999 | 345 (20.8%) | 167 (16.1%) |
| $150,000 or more | 321 (19.4%) | 52 (5.0%) |
| Total | 1,658 (100.0%) | 1,037 (100.0%) |
Monthly Housing Cost Tiers in Live Oak
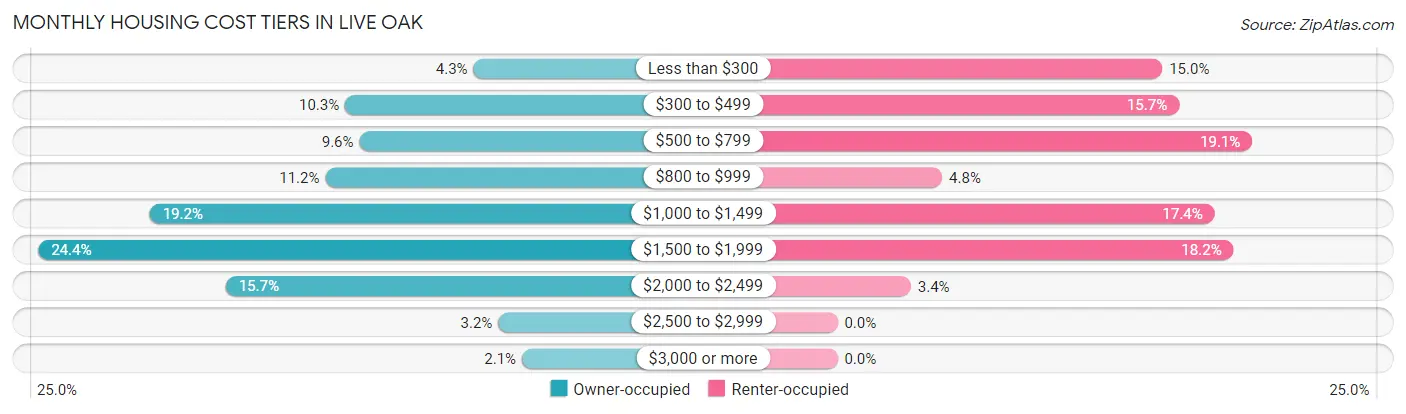
| Monthly Cost | Owner-occupied | Renter-occupied |
| Less than $300 | 72 (4.3%) | 155 (14.9%) |
| $300 to $499 | 170 (10.2%) | 163 (15.7%) |
| $500 to $799 | 159 (9.6%) | 198 (19.1%) |
| $800 to $999 | 185 (11.2%) | 50 (4.8%) |
| $1,000 to $1,499 | 319 (19.2%) | 180 (17.4%) |
| $1,500 to $1,999 | 404 (24.4%) | 189 (18.2%) |
| $2,000 to $2,499 | 261 (15.7%) | 35 (3.4%) |
| $2,500 to $2,999 | 53 (3.2%) | 0 (0.0%) |
| $3,000 or more | 35 (2.1%) | 0 (0.0%) |
| Total | 1,658 (100.0%) | 1,037 (100.0%) |
Physical Housing Characteristics in Live Oak
Housing Structures in Live Oak
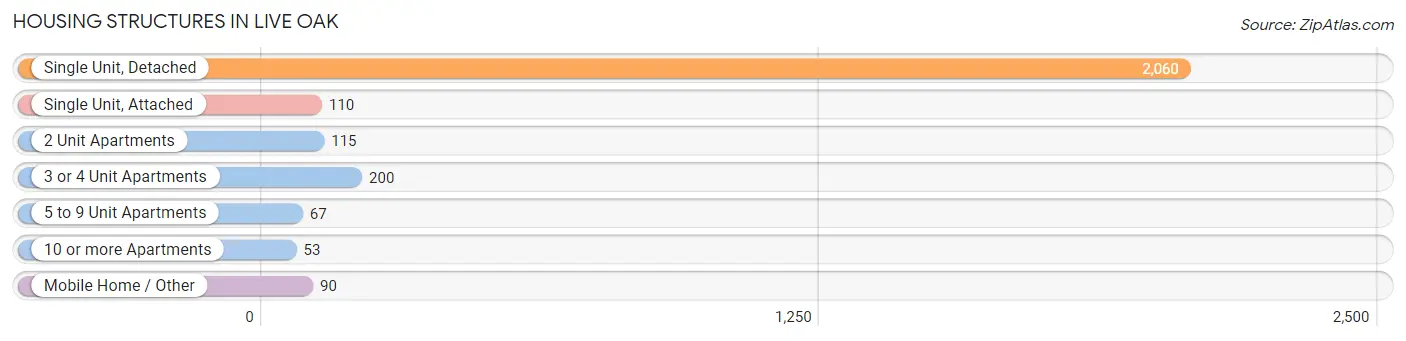
| Structure Type | # Housing Units | % Housing Units |
| Single Unit, Detached | 2,060 | 76.4% |
| Single Unit, Attached | 110 | 4.1% |
| 2 Unit Apartments | 115 | 4.3% |
| 3 or 4 Unit Apartments | 200 | 7.4% |
| 5 to 9 Unit Apartments | 67 | 2.5% |
| 10 or more Apartments | 53 | 2.0% |
| Mobile Home / Other | 90 | 3.3% |
| Total | 2,695 | 100.0% |
Housing Structures by Occupancy in Live Oak
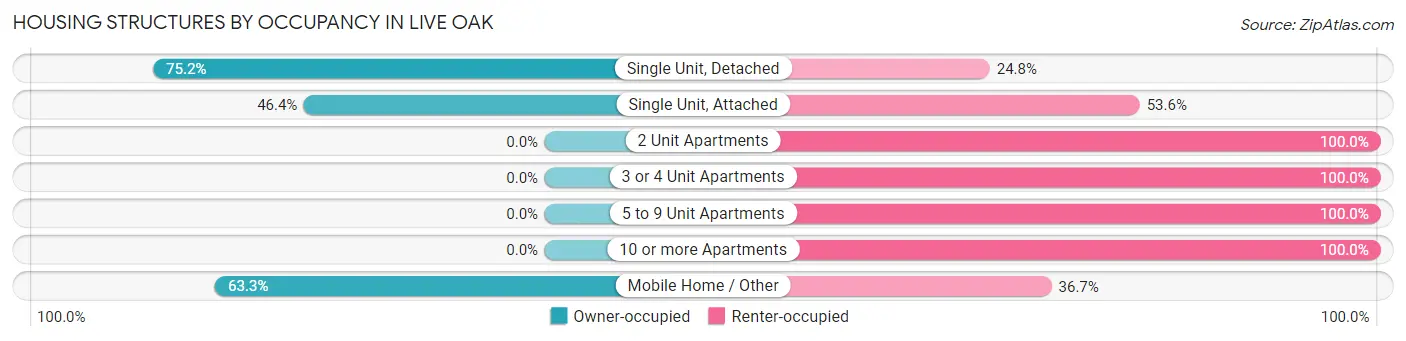
| Structure Type | Owner-occupied | Renter-occupied |
| Single Unit, Detached | 1,550 (75.2%) | 510 (24.8%) |
| Single Unit, Attached | 51 (46.4%) | 59 (53.6%) |
| 2 Unit Apartments | 0 (0.0%) | 115 (100.0%) |
| 3 or 4 Unit Apartments | 0 (0.0%) | 200 (100.0%) |
| 5 to 9 Unit Apartments | 0 (0.0%) | 67 (100.0%) |
| 10 or more Apartments | 0 (0.0%) | 53 (100.0%) |
| Mobile Home / Other | 57 (63.3%) | 33 (36.7%) |
| Total | 1,658 (61.5%) | 1,037 (38.5%) |
Housing Structures by Number of Rooms in Live Oak
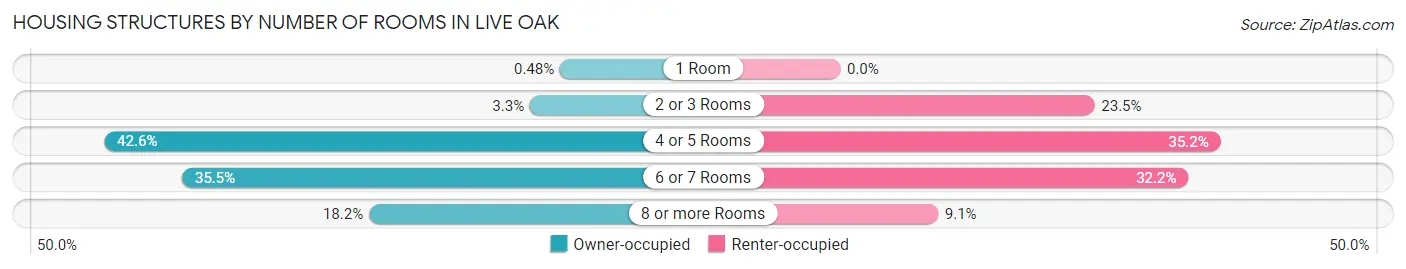
| Number of Rooms | Owner-occupied | Renter-occupied |
| 1 Room | 8 (0.5%) | 0 (0.0%) |
| 2 or 3 Rooms | 54 (3.3%) | 244 (23.5%) |
| 4 or 5 Rooms | 707 (42.6%) | 365 (35.2%) |
| 6 or 7 Rooms | 588 (35.5%) | 334 (32.2%) |
| 8 or more Rooms | 301 (18.1%) | 94 (9.1%) |
| Total | 1,658 (100.0%) | 1,037 (100.0%) |
Housing Structure by Heating Type in Live Oak
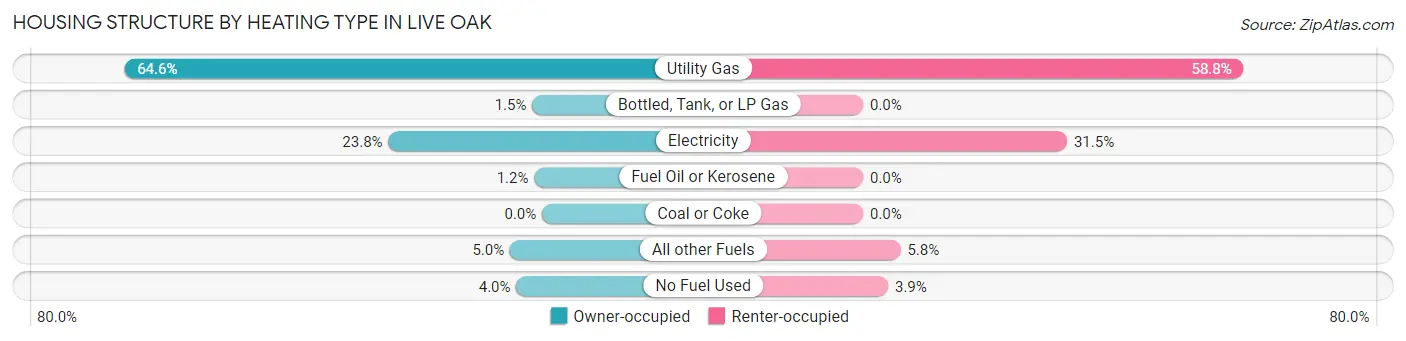
| Heating Type | Owner-occupied | Renter-occupied |
| Utility Gas | 1,071 (64.6%) | 610 (58.8%) |
| Bottled, Tank, or LP Gas | 25 (1.5%) | 0 (0.0%) |
| Electricity | 394 (23.8%) | 327 (31.5%) |
| Fuel Oil or Kerosene | 20 (1.2%) | 0 (0.0%) |
| Coal or Coke | 0 (0.0%) | 0 (0.0%) |
| All other Fuels | 82 (5.0%) | 60 (5.8%) |
| No Fuel Used | 66 (4.0%) | 40 (3.9%) |
| Total | 1,658 (100.0%) | 1,037 (100.0%) |
Household Vehicle Usage in Live Oak
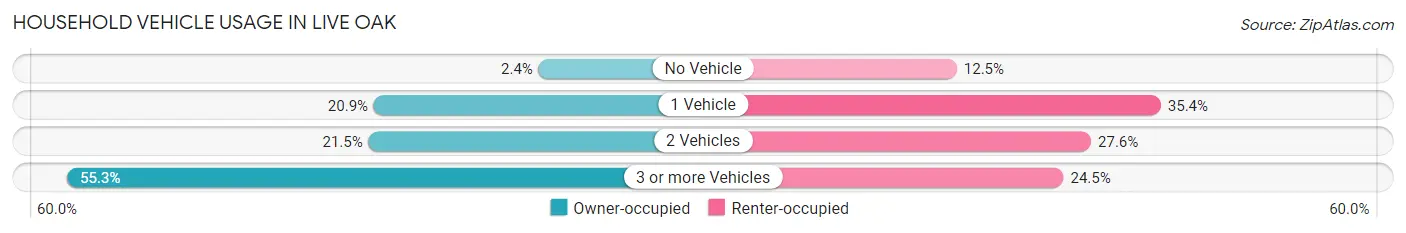
| Vehicles per Household | Owner-occupied | Renter-occupied |
| No Vehicle | 40 (2.4%) | 130 (12.5%) |
| 1 Vehicle | 346 (20.9%) | 367 (35.4%) |
| 2 Vehicles | 356 (21.5%) | 286 (27.6%) |
| 3 or more Vehicles | 916 (55.2%) | 254 (24.5%) |
| Total | 1,658 (100.0%) | 1,037 (100.0%) |
Real Estate & Mortgages in Live Oak
Real Estate and Mortgage Overview in Live Oak
| Characteristic | Without Mortgage | With Mortgage |
| Housing Units | 466 | 1,192 |
| Median Property Value | $279,400 | $304,400 |
| Median Household Income | $43,750 | $257 |
| Monthly Housing Costs | $488 | $35 |
| Real Estate Taxes | $1,629 | $29 |
Property Value by Mortgage Status in Live Oak
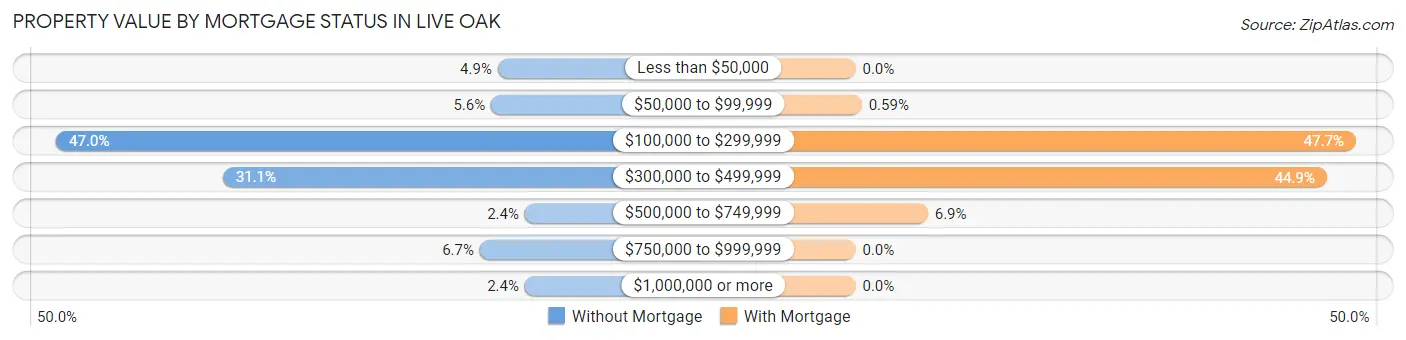
| Property Value | Without Mortgage | With Mortgage |
| Less than $50,000 | 23 (4.9%) | 0 (0.0%) |
| $50,000 to $99,999 | 26 (5.6%) | 7 (0.6%) |
| $100,000 to $299,999 | 219 (47.0%) | 568 (47.6%) |
| $300,000 to $499,999 | 145 (31.1%) | 535 (44.9%) |
| $500,000 to $749,999 | 11 (2.4%) | 82 (6.9%) |
| $750,000 to $999,999 | 31 (6.7%) | 0 (0.0%) |
| $1,000,000 or more | 11 (2.4%) | 0 (0.0%) |
| Total | 466 (100.0%) | 1,192 (100.0%) |
Household Income by Mortgage Status in Live Oak
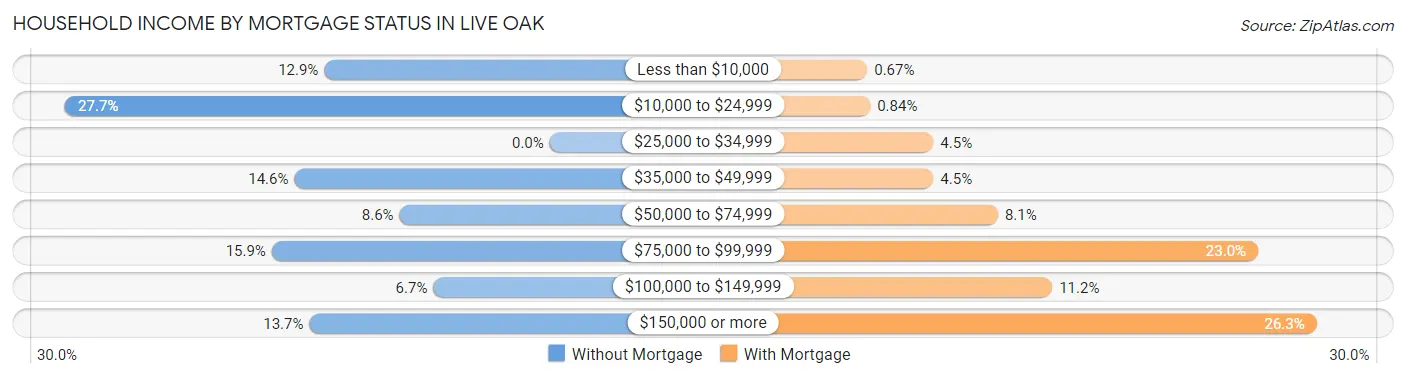
| Household Income | Without Mortgage | With Mortgage |
| Less than $10,000 | 60 (12.9%) | 8 (0.7%) |
| $10,000 to $24,999 | 129 (27.7%) | 10 (0.8%) |
| $25,000 to $34,999 | 0 (0.0%) | 53 (4.4%) |
| $35,000 to $49,999 | 68 (14.6%) | 53 (4.4%) |
| $50,000 to $74,999 | 40 (8.6%) | 97 (8.1%) |
| $75,000 to $99,999 | 74 (15.9%) | 274 (23.0%) |
| $100,000 to $149,999 | 31 (6.7%) | 134 (11.2%) |
| $150,000 or more | 64 (13.7%) | 314 (26.3%) |
| Total | 466 (100.0%) | 1,192 (100.0%) |
Property Value to Household Income Ratio in Live Oak
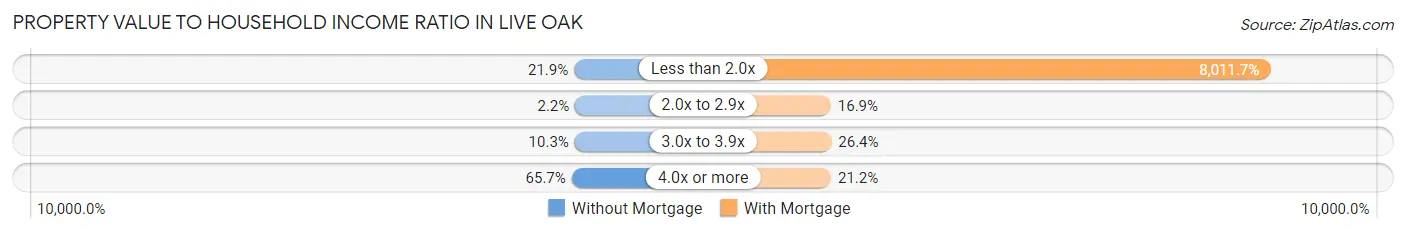
| Value-to-Income Ratio | Without Mortgage | With Mortgage |
| Less than 2.0x | 102 (21.9%) | 95,500 (8,011.7%) |
| 2.0x to 2.9x | 10 (2.1%) | 201 (16.9%) |
| 3.0x to 3.9x | 48 (10.3%) | 315 (26.4%) |
| 4.0x or more | 306 (65.7%) | 253 (21.2%) |
| Total | 466 (100.0%) | 1,192 (100.0%) |
Real Estate Taxes by Mortgage Status in Live Oak
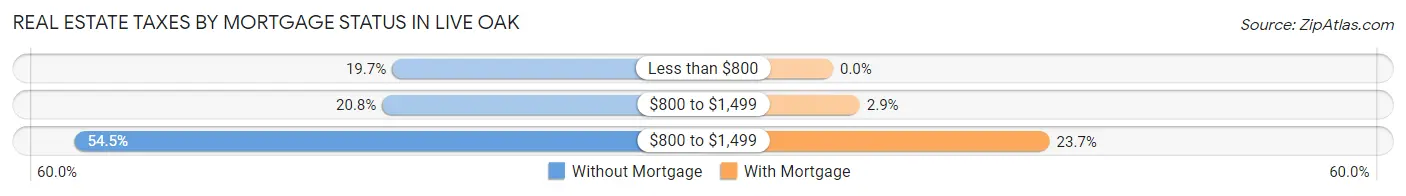
| Property Taxes | Without Mortgage | With Mortgage |
| Less than $800 | 92 (19.7%) | 0 (0.0%) |
| $800 to $1,499 | 97 (20.8%) | 35 (2.9%) |
| $800 to $1,499 | 254 (54.5%) | 283 (23.7%) |
| Total | 466 (100.0%) | 1,192 (100.0%) |
Health & Disability in Live Oak
Health Insurance Coverage by Age in Live Oak
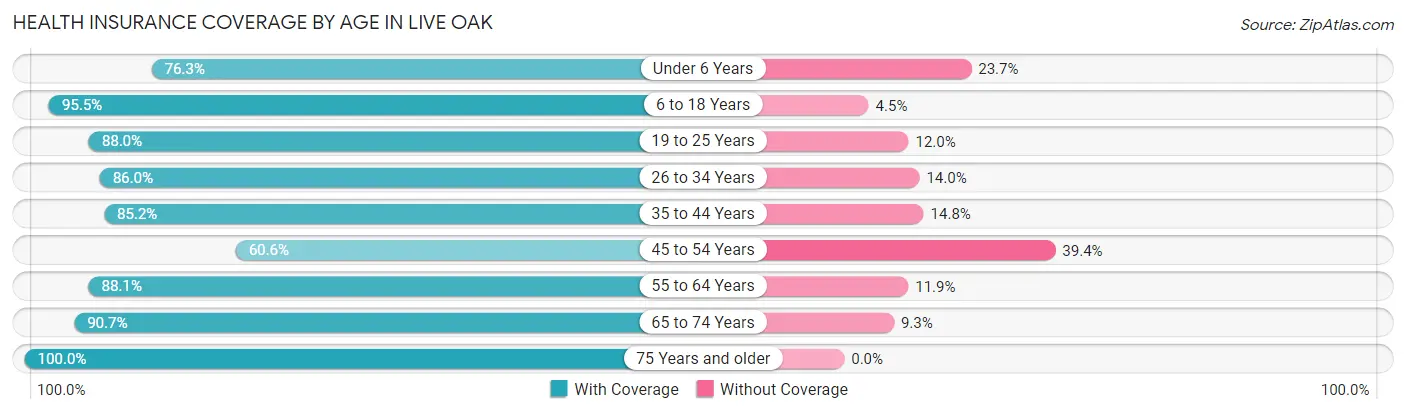
| Age Bracket | With Coverage | Without Coverage |
| Under 6 Years | 722 (76.3%) | 224 (23.7%) |
| 6 to 18 Years | 1,830 (95.5%) | 87 (4.5%) |
| 19 to 25 Years | 631 (88.0%) | 86 (12.0%) |
| 26 to 34 Years | 908 (86.0%) | 148 (14.0%) |
| 35 to 44 Years | 881 (85.2%) | 153 (14.8%) |
| 45 to 54 Years | 696 (60.6%) | 452 (39.4%) |
| 55 to 64 Years | 960 (88.1%) | 130 (11.9%) |
| 65 to 74 Years | 696 (90.7%) | 71 (9.3%) |
| 75 Years and older | 437 (100.0%) | 0 (0.0%) |
| Total | 7,761 (85.2%) | 1,351 (14.8%) |
Health Insurance Coverage by Citizenship Status in Live Oak
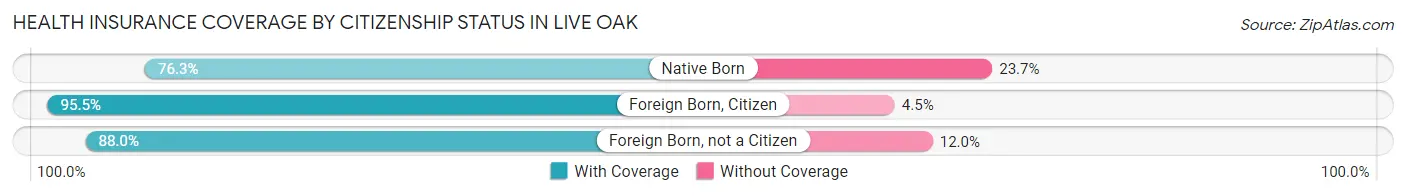
| Citizenship Status | With Coverage | Without Coverage |
| Native Born | 722 (76.3%) | 224 (23.7%) |
| Foreign Born, Citizen | 1,830 (95.5%) | 87 (4.5%) |
| Foreign Born, not a Citizen | 631 (88.0%) | 86 (12.0%) |
Health Insurance Coverage by Household Income in Live Oak
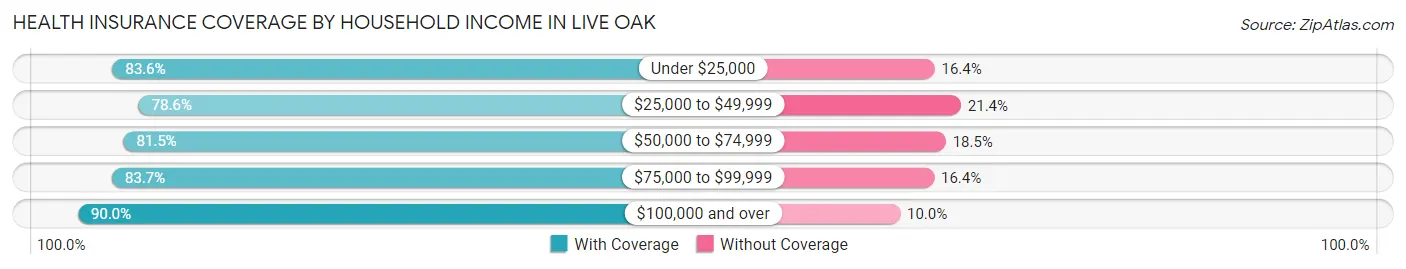
| Household Income | With Coverage | Without Coverage |
| Under $25,000 | 1,240 (83.6%) | 244 (16.4%) |
| $25,000 to $49,999 | 887 (78.6%) | 241 (21.4%) |
| $50,000 to $74,999 | 1,570 (81.5%) | 357 (18.5%) |
| $75,000 to $99,999 | 742 (83.7%) | 145 (16.4%) |
| $100,000 and over | 3,282 (90.0%) | 364 (10.0%) |
Public vs Private Health Insurance Coverage by Age in Live Oak
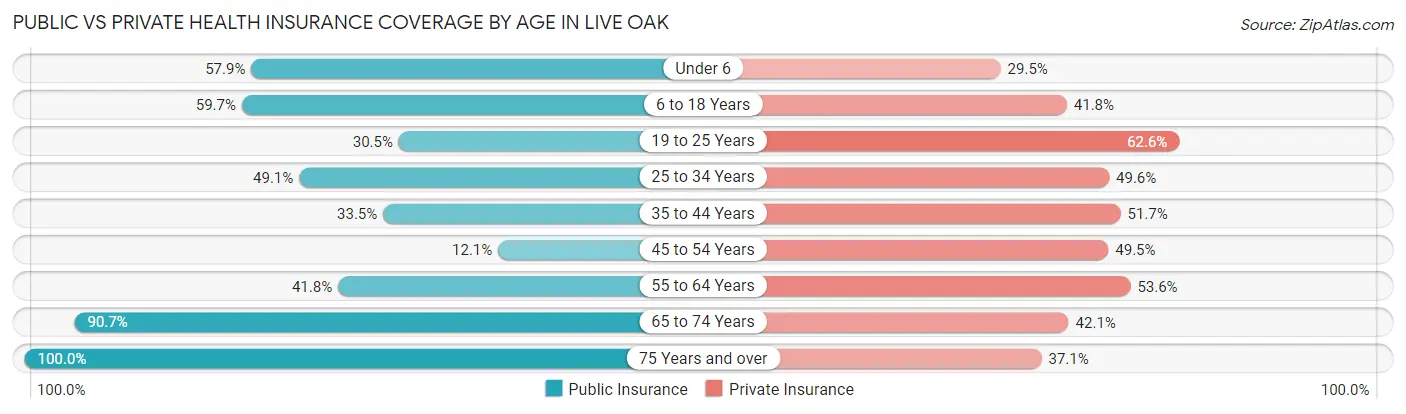
| Age Bracket | Public Insurance | Private Insurance |
| Under 6 | 548 (57.9%) | 279 (29.5%) |
| 6 to 18 Years | 1,144 (59.7%) | 801 (41.8%) |
| 19 to 25 Years | 219 (30.5%) | 449 (62.6%) |
| 25 to 34 Years | 518 (49.0%) | 524 (49.6%) |
| 35 to 44 Years | 346 (33.5%) | 535 (51.7%) |
| 45 to 54 Years | 139 (12.1%) | 568 (49.5%) |
| 55 to 64 Years | 456 (41.8%) | 584 (53.6%) |
| 65 to 74 Years | 696 (90.7%) | 323 (42.1%) |
| 75 Years and over | 437 (100.0%) | 162 (37.1%) |
| Total | 4,503 (49.4%) | 4,225 (46.4%) |
Disability Status by Sex by Age in Live Oak
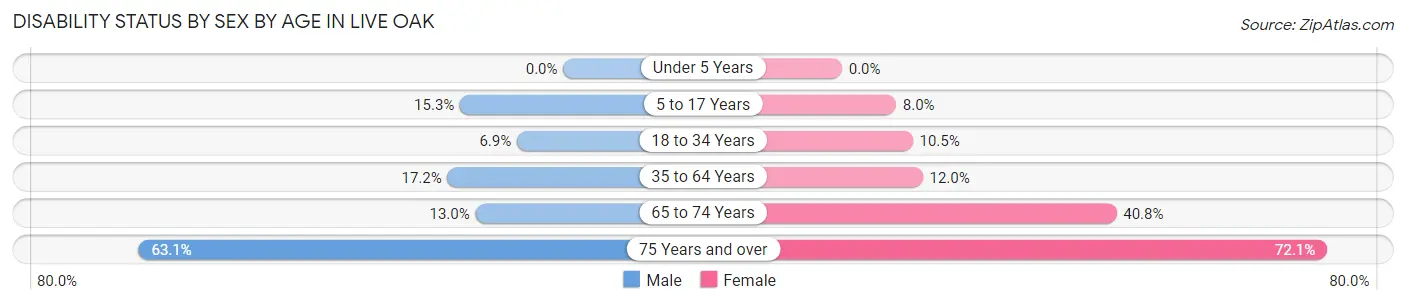
| Age Bracket | Male | Female |
| Under 5 Years | 0 (0.0%) | 0 (0.0%) |
| 5 to 17 Years | 112 (15.3%) | 87 (8.0%) |
| 18 to 34 Years | 70 (6.9%) | 97 (10.5%) |
| 35 to 64 Years | 290 (17.2%) | 190 (12.0%) |
| 65 to 74 Years | 45 (13.0%) | 172 (40.8%) |
| 75 Years and over | 147 (63.1%) | 147 (72.1%) |
Disability Class by Sex by Age in Live Oak
Disability Class: Hearing Difficulty
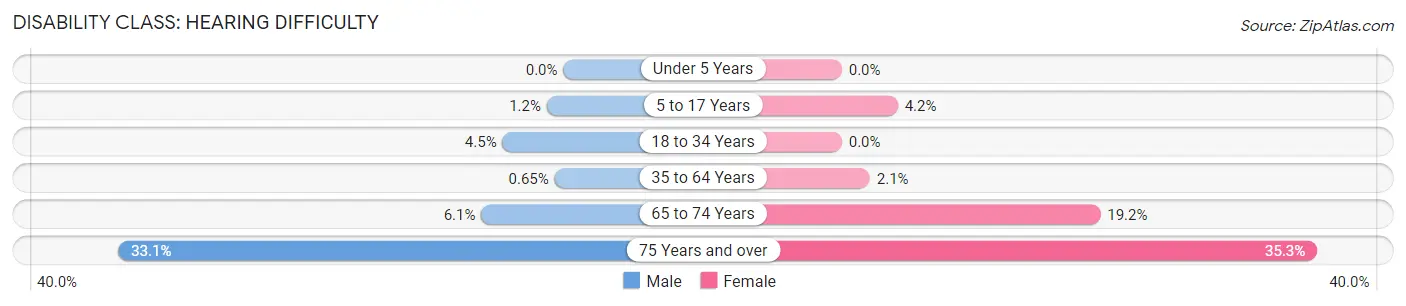
| Age Bracket | Male | Female |
| Under 5 Years | 0 (0.0%) | 0 (0.0%) |
| 5 to 17 Years | 9 (1.2%) | 45 (4.2%) |
| 18 to 34 Years | 46 (4.5%) | 0 (0.0%) |
| 35 to 64 Years | 11 (0.6%) | 33 (2.1%) |
| 65 to 74 Years | 21 (6.1%) | 81 (19.2%) |
| 75 Years and over | 77 (33.1%) | 72 (35.3%) |
Disability Class: Vision Difficulty
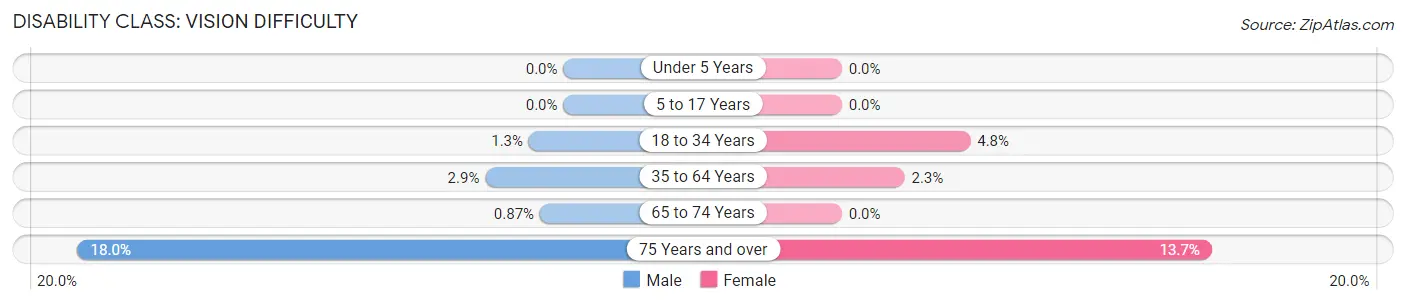
| Age Bracket | Male | Female |
| Under 5 Years | 0 (0.0%) | 0 (0.0%) |
| 5 to 17 Years | 0 (0.0%) | 0 (0.0%) |
| 18 to 34 Years | 13 (1.3%) | 44 (4.8%) |
| 35 to 64 Years | 49 (2.9%) | 37 (2.3%) |
| 65 to 74 Years | 3 (0.9%) | 0 (0.0%) |
| 75 Years and over | 42 (18.0%) | 28 (13.7%) |
Disability Class: Cognitive Difficulty
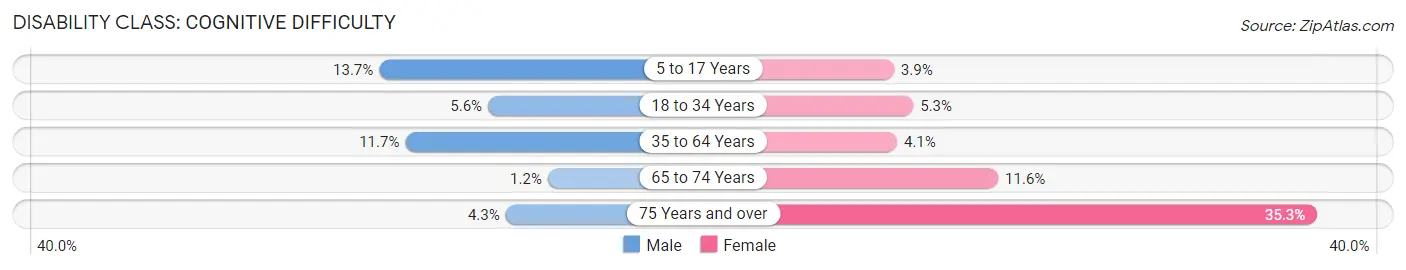
| Age Bracket | Male | Female |
| 5 to 17 Years | 100 (13.7%) | 42 (3.9%) |
| 18 to 34 Years | 57 (5.6%) | 49 (5.3%) |
| 35 to 64 Years | 198 (11.7%) | 65 (4.1%) |
| 65 to 74 Years | 4 (1.2%) | 49 (11.6%) |
| 75 Years and over | 10 (4.3%) | 72 (35.3%) |
Disability Class: Ambulatory Difficulty
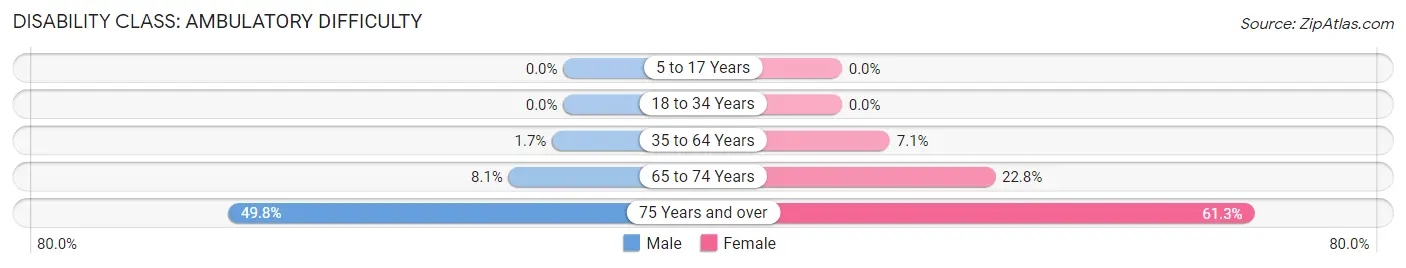
| Age Bracket | Male | Female |
| 5 to 17 Years | 0 (0.0%) | 0 (0.0%) |
| 18 to 34 Years | 0 (0.0%) | 0 (0.0%) |
| 35 to 64 Years | 28 (1.7%) | 113 (7.1%) |
| 65 to 74 Years | 28 (8.1%) | 96 (22.8%) |
| 75 Years and over | 116 (49.8%) | 125 (61.3%) |
Disability Class: Self-Care Difficulty
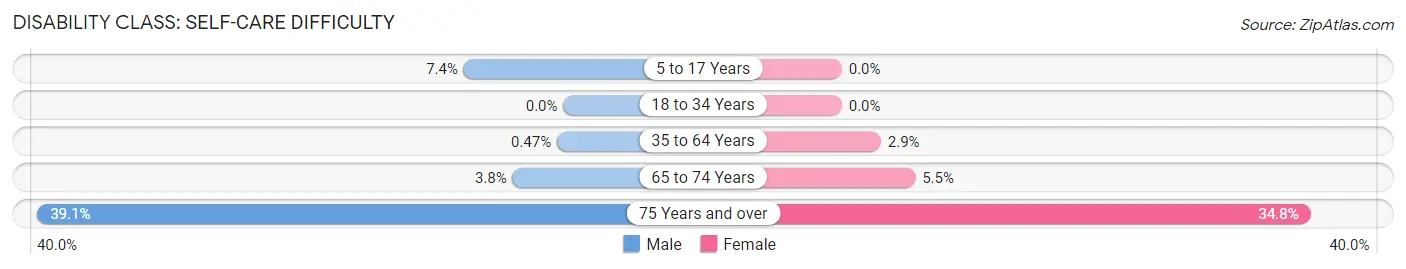
| Age Bracket | Male | Female |
| 5 to 17 Years | 54 (7.4%) | 0 (0.0%) |
| 18 to 34 Years | 0 (0.0%) | 0 (0.0%) |
| 35 to 64 Years | 8 (0.5%) | 46 (2.9%) |
| 65 to 74 Years | 13 (3.8%) | 23 (5.4%) |
| 75 Years and over | 91 (39.1%) | 71 (34.8%) |
Technology Access in Live Oak
Computing Device Access in Live Oak
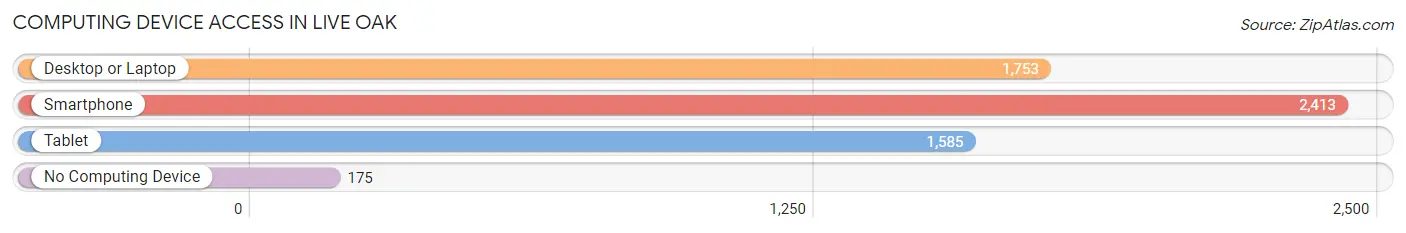
| Device Type | # Households | % Households |
| Desktop or Laptop | 1,753 | 65.0% |
| Smartphone | 2,413 | 89.5% |
| Tablet | 1,585 | 58.8% |
| No Computing Device | 175 | 6.5% |
| Total | 2,695 | 100.0% |
Internet Access in Live Oak
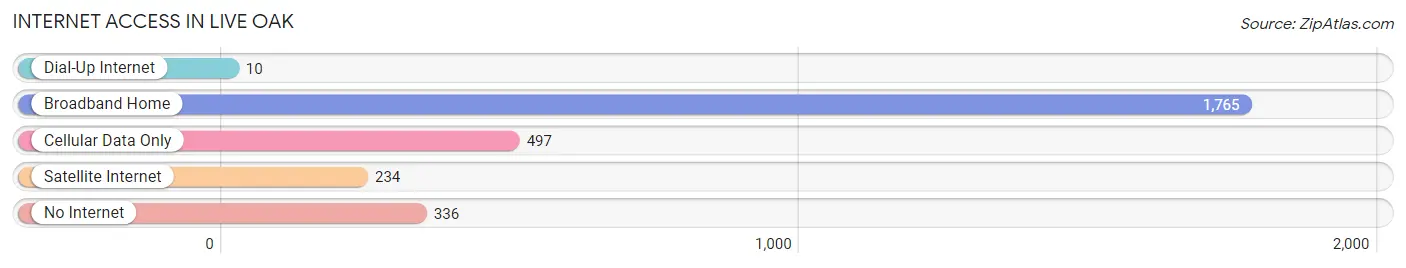
| Internet Type | # Households | % Households |
| Dial-Up Internet | 10 | 0.4% |
| Broadband Home | 1,765 | 65.5% |
| Cellular Data Only | 497 | 18.4% |
| Satellite Internet | 234 | 8.7% |
| No Internet | 336 | 12.5% |
| Total | 2,695 | 100.0% |
Live Oak Summary
History
The small town of Live Oak, California is located in Sutter County, about 10 miles north of the city of Yuba City. The town was founded in 1852 by a group of settlers from the nearby town of Yuba City. The settlers were looking for a place to settle and start a new life, and they chose the area around Live Oak because of its abundance of natural resources. The town was named after the large live oak trees that grew in the area.
The town quickly grew and prospered, and by the late 1800s, it had become a thriving agricultural community. The town was home to a variety of crops, including wheat, barley, oats, and hay. The town also had a thriving lumber industry, and the local sawmill was one of the largest in the area.
In the early 1900s, the town began to experience a decline in population as many of the settlers moved away to find work in larger cities. However, the town was able to remain a viable community due to its strong agricultural base.
In the 1950s, the town experienced a resurgence in population as many people moved to the area to take advantage of the booming agricultural industry. The town also experienced a period of growth and development, with new businesses and homes being built.
Today, Live Oak is a small, rural community with a population of just over 2,000 people. The town is still largely agricultural, with many of the local farms producing a variety of crops, including wheat, barley, oats, and hay. The town also has a few small businesses, including a grocery store, a hardware store, and a few restaurants.
Geography
Live Oak is located in Sutter County, California, about 10 miles north of the city of Yuba City. The town is situated in the foothills of the Sierra Nevada Mountains, and is surrounded by rolling hills and open fields. The town is located on the banks of the Feather River, which provides a source of irrigation for the local farms.
The climate in Live Oak is generally mild, with warm summers and cool winters. The average temperature in the summer is around 80 degrees Fahrenheit, and the average temperature in the winter is around 50 degrees Fahrenheit.
Economy
The economy of Live Oak is largely based on agriculture. The town is home to a variety of farms, which produce a variety of crops, including wheat, barley, oats, and hay. The town also has a few small businesses, including a grocery store, a hardware store, and a few restaurants.
The town is also home to a few small manufacturing companies, which produce a variety of products, including furniture, clothing, and electronics.
Demographics
As of the 2010 census, the population of Live Oak was 2,072. The town is predominantly white, with about 85% of the population being Caucasian. The remaining 15% of the population is made up of African Americans, Hispanics, and Asians.
The median household income in Live Oak is $45,000, and the median home value is $175,000. The town has a low unemployment rate, and the majority of the population is employed in the agricultural industry.
Common Questions
What is Per Capita Income in Live Oak?
Per Capita income in Live Oak is $24,261.
What is the Median Family Income in Live Oak?
Median Family Income in Live Oak is $72,609.
What is the Median Household income in Live Oak?
Median Household Income in Live Oak is $66,750.
What is Income or Wage Gap in Live Oak?
Income or Wage Gap in Live Oak is 41.1%.
Women in Live Oak earn 58.9 cents for every dollar earned by a man.
What is Family Income Deficit in Live Oak?
Family Income Deficit in Live Oak is $15,048.
Families that are below poverty line in Live Oak earn $15,048 less on average than the poverty threshold level.
What is Inequality or Gini Index in Live Oak?
Inequality or Gini Index in Live Oak is 0.45.
What is the Total Population of Live Oak?
Total Population of Live Oak is 9,222.
What is the Total Male Population of Live Oak?
Total Male Population of Live Oak is 4,617.
What is the Total Female Population of Live Oak?
Total Female Population of Live Oak is 4,605.
What is the Ratio of Males per 100 Females in Live Oak?
There are 100.26 Males per 100 Females in Live Oak.
What is the Ratio of Females per 100 Males in Live Oak?
There are 99.74 Females per 100 Males in Live Oak.
What is the Median Population Age in Live Oak?
Median Population Age in Live Oak is 34.7 Years.
What is the Average Family Size in Live Oak
Average Family Size in Live Oak is 3.8 People.
What is the Average Household Size in Live Oak
Average Household Size in Live Oak is 3.4 People.
How Large is the Labor Force in Live Oak?
There are 4,190 People in the Labor Forcein in Live Oak.
What is the Percentage of People in the Labor Force in Live Oak?
60.6% of People are in the Labor Force in Live Oak.
What is the Unemployment Rate in Live Oak?
Unemployment Rate in Live Oak is 8.0%.