Lindsay, CA Map & Demographics
Lindsay Map
Lindsay Overview
$19,059
PER CAPITA INCOME
$51,679
AVG FAMILY INCOME
$44,816
AVG HOUSEHOLD INCOME
12.1%
WAGE / INCOME GAP [ % ]
87.9¢/ $1
WAGE / INCOME GAP [ $ ]
$15,474
FAMILY INCOME DEFICIT
0.52
INEQUALITY / GINI INDEX
12,581
TOTAL POPULATION
6,461
MALE POPULATION
6,120
FEMALE POPULATION
105.57
MALES / 100 FEMALES
94.72
FEMALES / 100 MALES
27.8
MEDIAN AGE
3.9
AVG FAMILY SIZE
3.4
AVG HOUSEHOLD SIZE
5,137
LABOR FORCE [ PEOPLE ]
58.0%
PERCENT IN LABOR FORCE
17.1%
UNEMPLOYMENT RATE
Lindsay Zip Codes
Lindsay Area Codes
Income in Lindsay
Income Overview in Lindsay
Per Capita Income in Lindsay is $19,059, while median incomes of families and households are $51,679 and $44,816 respectively.
| Characteristic | Number | Measure |
| Per Capita Income | 12,581 | $19,059 |
| Median Family Income | 2,833 | $51,679 |
| Mean Family Income | 2,833 | $72,284 |
| Median Household Income | 3,627 | $44,816 |
| Mean Household Income | 3,627 | $64,019 |
| Income Deficit | 2,833 | $15,474 |
| Wage / Income Gap (%) | 12,581 | 12.15% |
| Wage / Income Gap ($) | 12,581 | 87.85¢ per $1 |
| Gini / Inequality Index | 12,581 | 0.52 |
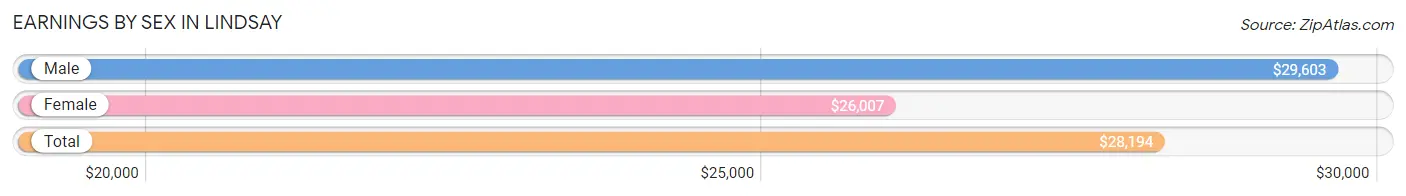
Earnings by Sex in Lindsay
Average Earnings in Lindsay are $28,194, $29,603 for men and $26,007 for women, a difference of 12.1%.
| Sex | Number | Average Earnings |
| Male | 2,888 (60.4%) | $29,603 |
| Female | 1,896 (39.6%) | $26,007 |
| Total | 4,784 (100.0%) | $28,194 |
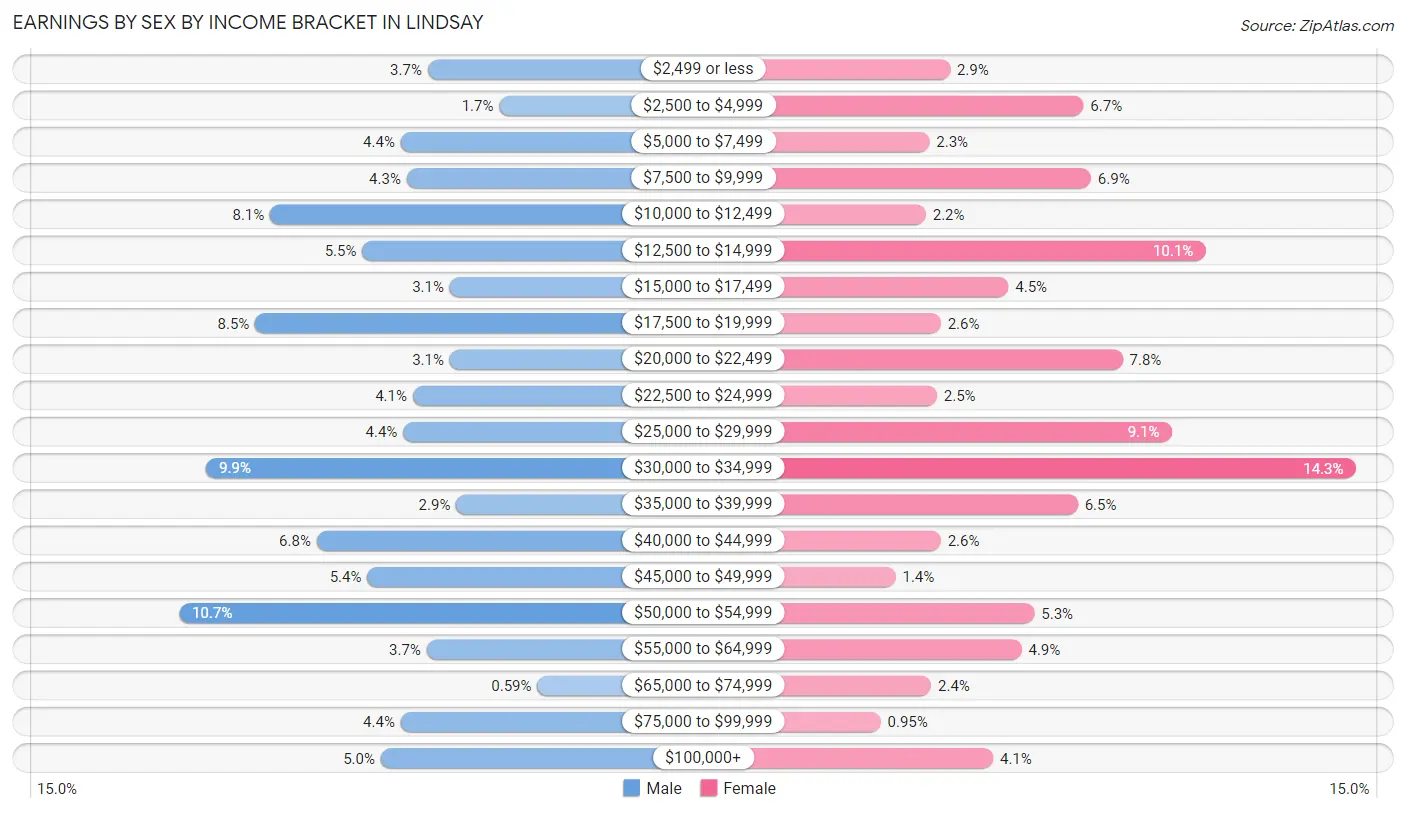
Earnings by Sex by Income Bracket in Lindsay
The most common earnings brackets in Lindsay are $50,000 to $54,999 for men (308 | 10.7%) and $30,000 to $34,999 for women (271 | 14.3%).
| Income | Male | Female |
| $2,499 or less | 106 (3.7%) | 55 (2.9%) |
| $2,500 to $4,999 | 48 (1.7%) | 126 (6.7%) |
| $5,000 to $7,499 | 128 (4.4%) | 44 (2.3%) |
| $7,500 to $9,999 | 123 (4.3%) | 130 (6.9%) |
| $10,000 to $12,499 | 234 (8.1%) | 42 (2.2%) |
| $12,500 to $14,999 | 159 (5.5%) | 191 (10.1%) |
| $15,000 to $17,499 | 88 (3.0%) | 86 (4.5%) |
| $17,500 to $19,999 | 246 (8.5%) | 50 (2.6%) |
| $20,000 to $22,499 | 88 (3.0%) | 147 (7.7%) |
| $22,500 to $24,999 | 118 (4.1%) | 48 (2.5%) |
| $25,000 to $29,999 | 126 (4.4%) | 173 (9.1%) |
| $30,000 to $34,999 | 286 (9.9%) | 271 (14.3%) |
| $35,000 to $39,999 | 83 (2.9%) | 123 (6.5%) |
| $40,000 to $44,999 | 196 (6.8%) | 50 (2.6%) |
| $45,000 to $49,999 | 155 (5.4%) | 26 (1.4%) |
| $50,000 to $54,999 | 308 (10.7%) | 100 (5.3%) |
| $55,000 to $64,999 | 107 (3.7%) | 93 (4.9%) |
| $65,000 to $74,999 | 17 (0.6%) | 45 (2.4%) |
| $75,000 to $99,999 | 128 (4.4%) | 18 (0.9%) |
| $100,000+ | 144 (5.0%) | 78 (4.1%) |
| Total | 2,888 (100.0%) | 1,896 (100.0%) |
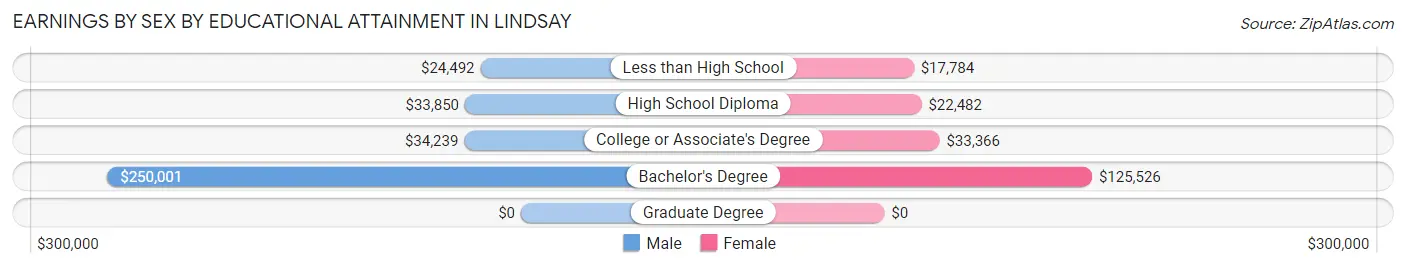
Earnings by Sex by Educational Attainment in Lindsay
Average earnings in Lindsay are $32,290 for men and $27,667 for women, a difference of 14.3%. Men with an educational attainment of bachelor's degree enjoy the highest average annual earnings of $250,001, while those with less than high school education earn the least with $24,492. Women with an educational attainment of bachelor's degree earn the most with the average annual earnings of $125,526, while those with less than high school education have the smallest earnings of $17,784.
| Educational Attainment | Male Income | Female Income |
| Less than High School | $24,492 | $17,784 |
| High School Diploma | $33,850 | $22,482 |
| College or Associate's Degree | $34,239 | $33,366 |
| Bachelor's Degree | $250,001 | $125,526 |
| Graduate Degree | - | - |
| Total | $32,290 | $27,667 |
Family Income in Lindsay
Family Income Brackets in Lindsay
According to the Lindsay family income data, there are 745 families falling into the $50,000 to $74,999 income range, which is the most common income bracket and makes up 26.3% of all families. Conversely, the $200,000+ income bracket is the least frequent group with only 105 families (3.7%) belonging to this category.
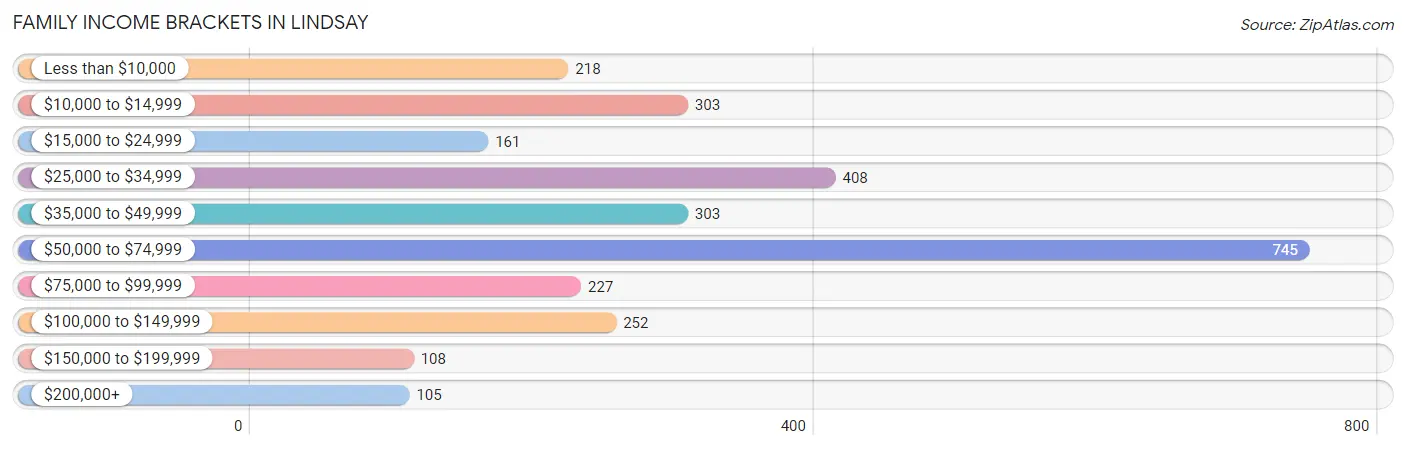
| Income Bracket | # Families | % Families |
| Less than $10,000 | 218 | 7.7% |
| $10,000 to $14,999 | 303 | 10.7% |
| $15,000 to $24,999 | 161 | 5.7% |
| $25,000 to $34,999 | 408 | 14.4% |
| $35,000 to $49,999 | 303 | 10.7% |
| $50,000 to $74,999 | 745 | 26.3% |
| $75,000 to $99,999 | 227 | 8.0% |
| $100,000 to $149,999 | 252 | 8.9% |
| $150,000 to $199,999 | 108 | 3.8% |
| $200,000+ | 105 | 3.7% |
Family Income by Famaliy Size in Lindsay
4-person families (795 | 28.1%) account for the highest median family income in Lindsay with $68,990 per family, while 4-person families (795 | 28.1%) have the highest median income of $17,248 per family member.
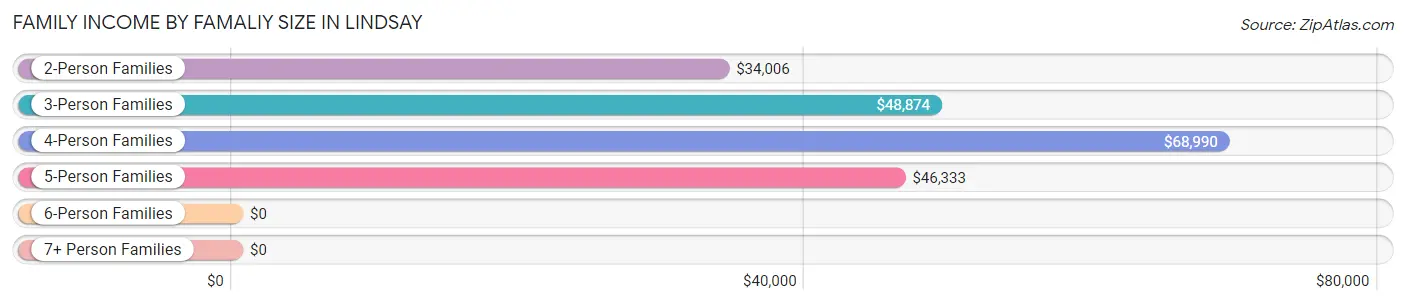
| Income Bracket | # Families | Median Income |
| 2-Person Families | 633 (22.3%) | $34,006 |
| 3-Person Families | 519 (18.3%) | $48,874 |
| 4-Person Families | 795 (28.1%) | $68,990 |
| 5-Person Families | 462 (16.3%) | $46,333 |
| 6-Person Families | 257 (9.1%) | $0 |
| 7+ Person Families | 167 (5.9%) | $0 |
| Total | 2,833 (100.0%) | $51,679 |
Family Income by Number of Earners in Lindsay
The median family income in Lindsay is $51,679, with families comprising 3+ earners (288) having the highest median family income of $127,616, while families with no earners (491) have the lowest median family income of $11,773, accounting for 10.2% and 17.3% of families, respectively.
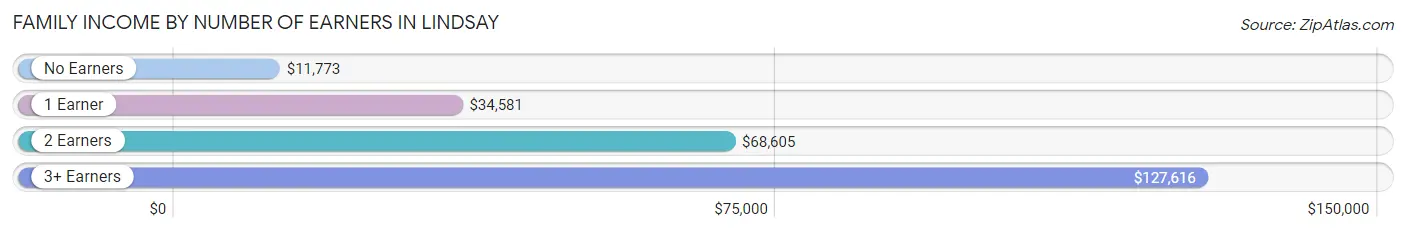
| Number of Earners | # Families | Median Income |
| No Earners | 491 (17.3%) | $11,773 |
| 1 Earner | 996 (35.2%) | $34,581 |
| 2 Earners | 1,058 (37.3%) | $68,605 |
| 3+ Earners | 288 (10.2%) | $127,616 |
| Total | 2,833 (100.0%) | $51,679 |
Household Income in Lindsay
Household Income Brackets in Lindsay
With 812 households falling in the category, the $50,000 to $74,999 income range is the most frequent in Lindsay, accounting for 22.4% of all households. In contrast, only 105 households (2.9%) fall into the $200,000+ income bracket, making it the least populous group.
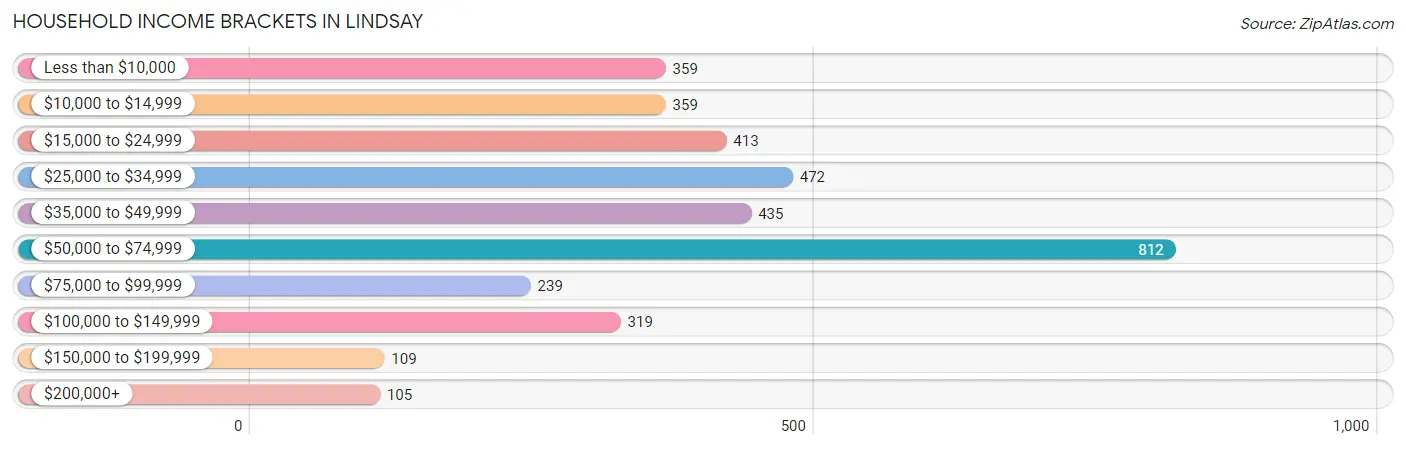
| Income Bracket | # Households | % Households |
| Less than $10,000 | 359 | 9.9% |
| $10,000 to $14,999 | 359 | 9.9% |
| $15,000 to $24,999 | 413 | 11.4% |
| $25,000 to $34,999 | 472 | 13.0% |
| $35,000 to $49,999 | 435 | 12.0% |
| $50,000 to $74,999 | 812 | 22.4% |
| $75,000 to $99,999 | 239 | 6.6% |
| $100,000 to $149,999 | 319 | 8.8% |
| $150,000 to $199,999 | 109 | 3.0% |
| $200,000+ | 105 | 2.9% |
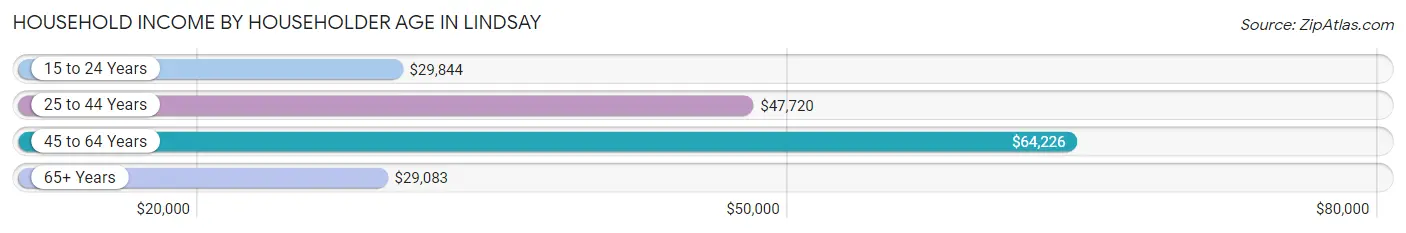
Household Income by Householder Age in Lindsay
The median household income in Lindsay is $44,816, with the highest median household income of $64,226 found in the 45 to 64 years age bracket for the primary householder. A total of 1,495 households (41.2%) fall into this category. Meanwhile, the 65+ years age bracket for the primary householder has the lowest median household income of $29,083, with 681 households (18.8%) in this group.
| Income Bracket | # Households | Median Income |
| 15 to 24 Years | 170 (4.7%) | $29,844 |
| 25 to 44 Years | 1,281 (35.3%) | $47,720 |
| 45 to 64 Years | 1,495 (41.2%) | $64,226 |
| 65+ Years | 681 (18.8%) | $29,083 |
| Total | 3,627 (100.0%) | $44,816 |
Poverty in Lindsay
Income Below Poverty by Sex and Age in Lindsay
With 33.0% poverty level for males and 34.7% for females among the residents of Lindsay, 5 year old males and 6 to 11 year old females are the most vulnerable to poverty, with 163 males (72.4%) and 309 females (70.2%) in their respective age groups living below the poverty level.
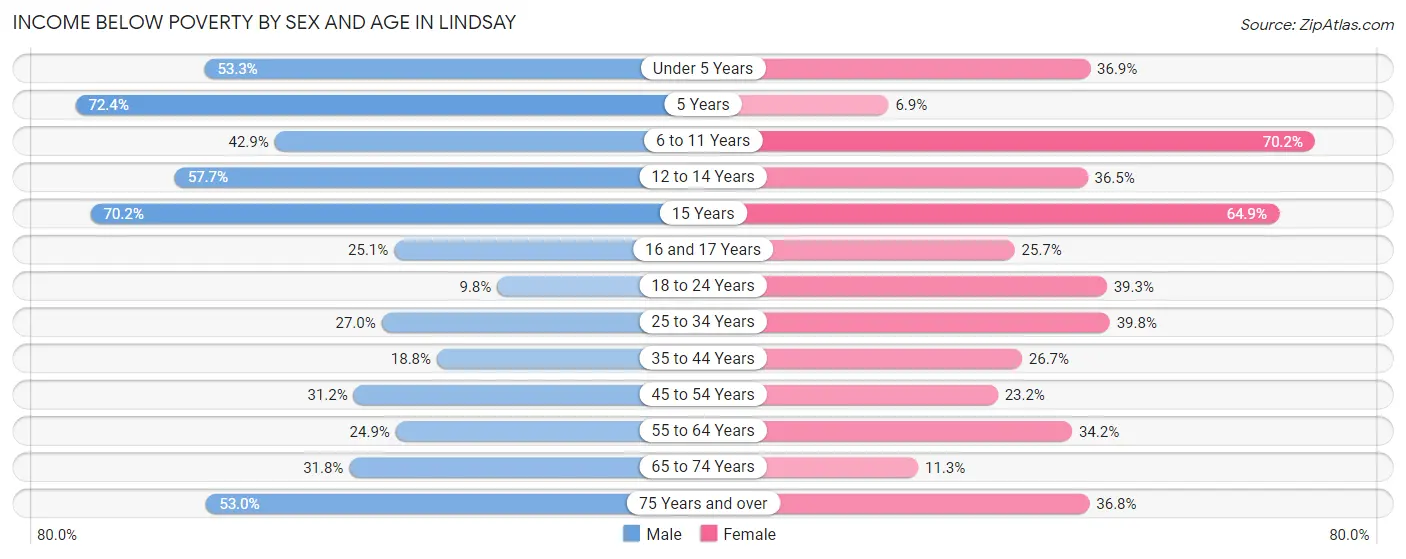
| Age Bracket | Male | Female |
| Under 5 Years | 251 (53.3%) | 125 (36.9%) |
| 5 Years | 163 (72.4%) | 16 (6.9%) |
| 6 to 11 Years | 335 (42.9%) | 309 (70.2%) |
| 12 to 14 Years | 270 (57.7%) | 131 (36.5%) |
| 15 Years | 33 (70.2%) | 183 (64.9%) |
| 16 and 17 Years | 49 (25.1%) | 68 (25.7%) |
| 18 to 24 Years | 87 (9.8%) | 240 (39.3%) |
| 25 to 34 Years | 220 (27.0%) | 335 (39.8%) |
| 35 to 44 Years | 105 (18.8%) | 146 (26.7%) |
| 45 to 54 Years | 253 (31.2%) | 194 (23.2%) |
| 55 to 64 Years | 181 (24.9%) | 162 (34.2%) |
| 65 to 74 Years | 83 (31.8%) | 49 (11.3%) |
| 75 Years and over | 88 (53.0%) | 125 (36.8%) |
| Total | 2,118 (33.0%) | 2,083 (34.7%) |
Income Above Poverty by Sex and Age in Lindsay
According to the poverty statistics in Lindsay, males aged 18 to 24 years and females aged 5 years are the age groups that are most secure financially, with 90.2% of males and 93.1% of females in these age groups living above the poverty line.
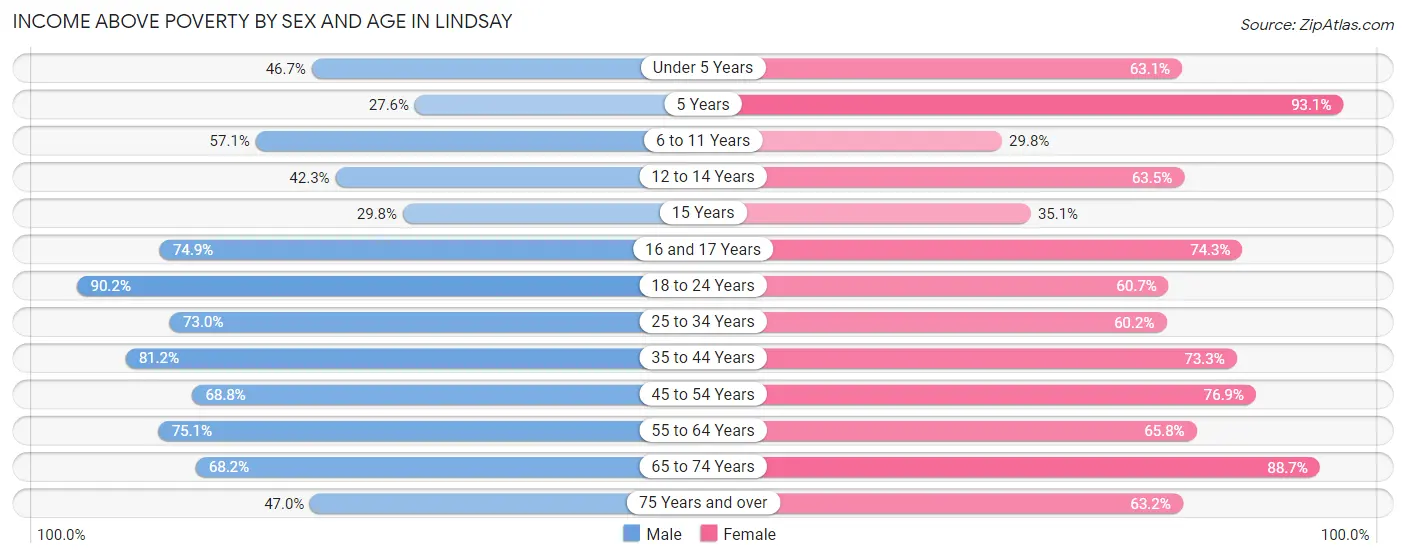
| Age Bracket | Male | Female |
| Under 5 Years | 220 (46.7%) | 214 (63.1%) |
| 5 Years | 62 (27.6%) | 215 (93.1%) |
| 6 to 11 Years | 446 (57.1%) | 131 (29.8%) |
| 12 to 14 Years | 198 (42.3%) | 228 (63.5%) |
| 15 Years | 14 (29.8%) | 99 (35.1%) |
| 16 and 17 Years | 146 (74.9%) | 197 (74.3%) |
| 18 to 24 Years | 797 (90.2%) | 370 (60.7%) |
| 25 to 34 Years | 595 (73.0%) | 507 (60.2%) |
| 35 to 44 Years | 454 (81.2%) | 400 (73.3%) |
| 45 to 54 Years | 559 (68.8%) | 644 (76.8%) |
| 55 to 64 Years | 546 (75.1%) | 312 (65.8%) |
| 65 to 74 Years | 178 (68.2%) | 384 (88.7%) |
| 75 Years and over | 78 (47.0%) | 215 (63.2%) |
| Total | 4,293 (67.0%) | 3,916 (65.3%) |
Income Below Poverty Among Married-Couple Families in Lindsay
The poverty statistics for married-couple families in Lindsay show that 28.9% or 574 of the total 1,989 families live below the poverty line. Families with 5 or more children have the highest poverty rate of 80.9%, comprising of 93 families. On the other hand, families with 1 or 2 children have the lowest poverty rate of 16.2%, which includes 142 families.
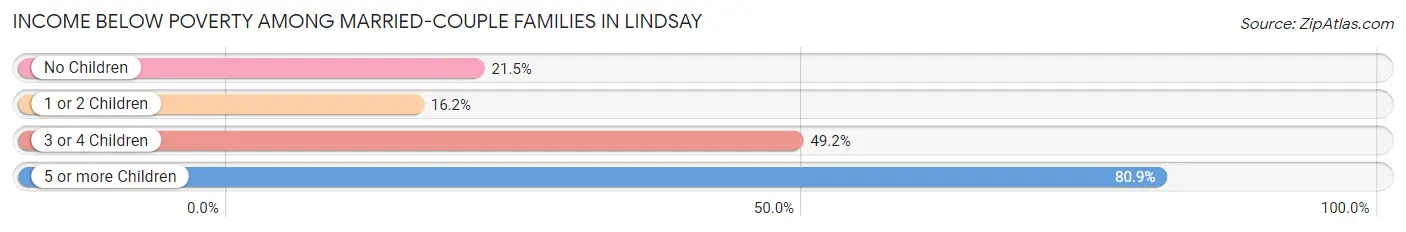
| Children | Above Poverty | Below Poverty |
| No Children | 428 (78.5%) | 117 (21.5%) |
| 1 or 2 Children | 736 (83.8%) | 142 (16.2%) |
| 3 or 4 Children | 229 (50.8%) | 222 (49.2%) |
| 5 or more Children | 22 (19.1%) | 93 (80.9%) |
| Total | 1,415 (71.1%) | 574 (28.9%) |
Income Below Poverty Among Single-Parent Households in Lindsay
According to the poverty data in Lindsay, 25.5% or 75 single-father households and 26.6% or 146 single-mother households are living below the poverty line. Among single-father households, those with 1 or 2 children have the highest poverty rate, with 66 households (37.1%) experiencing poverty. Likewise, among single-mother households, those with 3 or 4 children have the highest poverty rate, with 86 households (100.0%) falling below the poverty line.
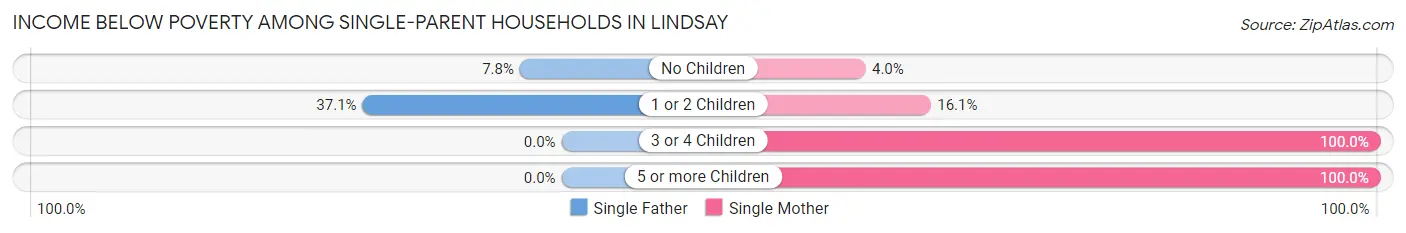
| Children | Single Father | Single Mother |
| No Children | 9 (7.8%) | 9 (4.0%) |
| 1 or 2 Children | 66 (37.1%) | 36 (16.1%) |
| 3 or 4 Children | 0 (0.0%) | 86 (100.0%) |
| 5 or more Children | 0 (0.0%) | 15 (100.0%) |
| Total | 75 (25.5%) | 146 (26.6%) |
Income Below Poverty Among Married-Couple vs Single-Parent Households in Lindsay
The poverty data for Lindsay shows that 574 of the married-couple family households (28.9%) and 221 of the single-parent households (26.2%) are living below the poverty level. Within the married-couple family households, those with 5 or more children have the highest poverty rate, with 93 households (80.9%) falling below the poverty line. Among the single-parent households, those with 3 or 4 children have the highest poverty rate, with 86 household (100.0%) living below poverty.
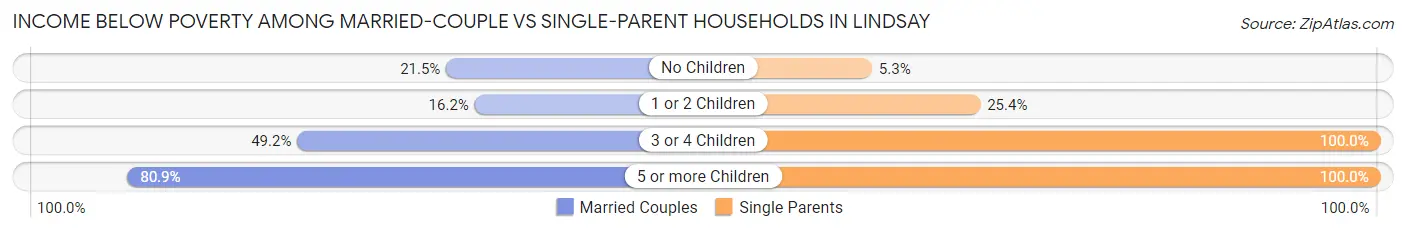
| Children | Married-Couple Families | Single-Parent Households |
| No Children | 117 (21.5%) | 18 (5.3%) |
| 1 or 2 Children | 142 (16.2%) | 102 (25.4%) |
| 3 or 4 Children | 222 (49.2%) | 86 (100.0%) |
| 5 or more Children | 93 (80.9%) | 15 (100.0%) |
| Total | 574 (28.9%) | 221 (26.2%) |
Race in Lindsay
The most populous races in Lindsay are Hispanic or Latino (11,162 | 88.7%), White / Caucasian (5,203 | 41.4%), and Some other Race (3,990 | 31.7%).
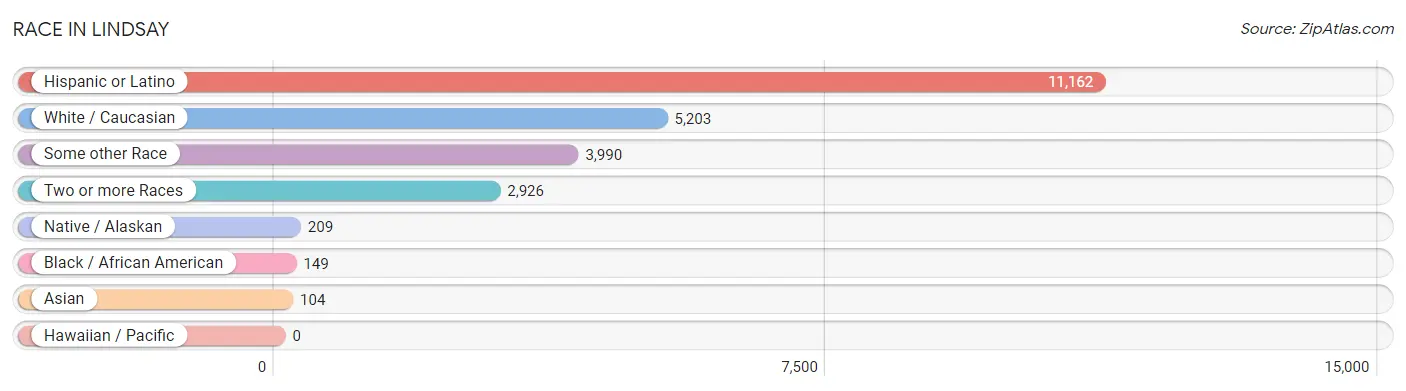
| Race | # Population | % Population |
| Asian | 104 | 0.8% |
| Black / African American | 149 | 1.2% |
| Hawaiian / Pacific | 0 | 0.0% |
| Hispanic or Latino | 11,162 | 88.7% |
| Native / Alaskan | 209 | 1.7% |
| White / Caucasian | 5,203 | 41.4% |
| Two or more Races | 2,926 | 23.3% |
| Some other Race | 3,990 | 31.7% |
| Total | 12,581 | 100.0% |
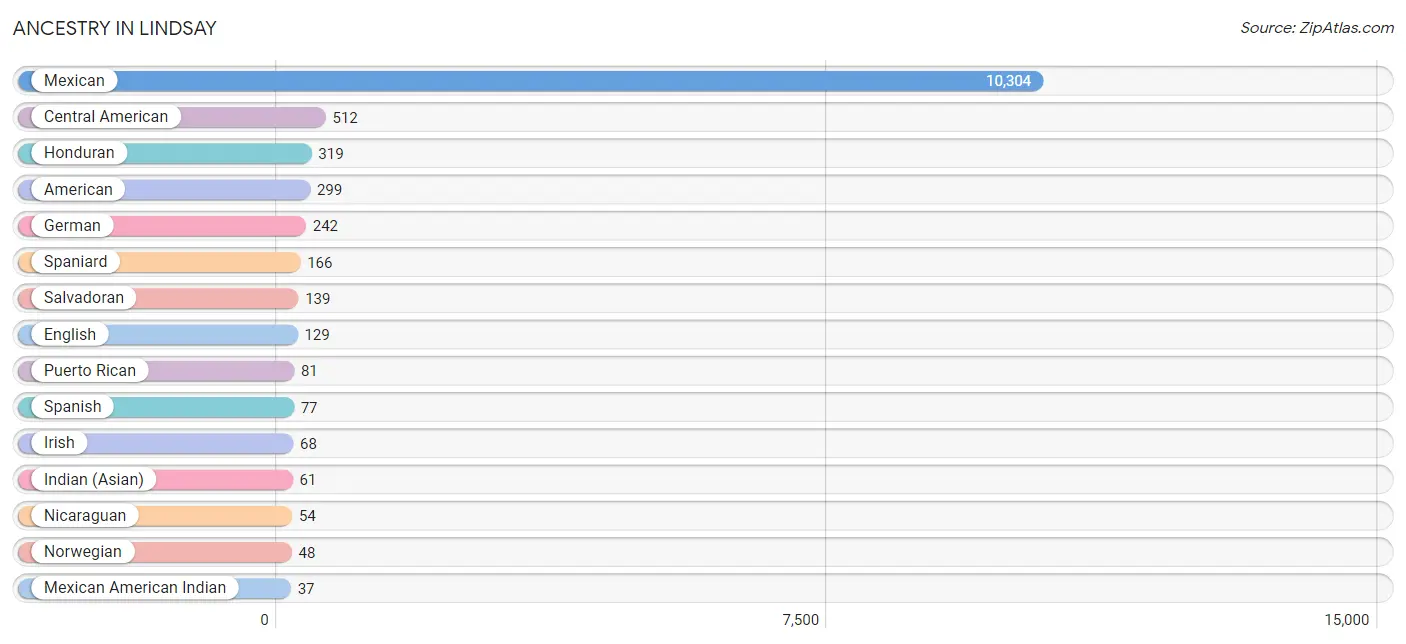
Ancestry in Lindsay
The most populous ancestries reported in Lindsay are Mexican (10,304 | 81.9%), Central American (512 | 4.1%), Honduran (319 | 2.5%), American (299 | 2.4%), and German (242 | 1.9%), together accounting for 92.8% of all Lindsay residents.
| Ancestry | # Population | % Population |
| American | 299 | 2.4% |
| Bhutanese | 4 | 0.0% |
| British | 7 | 0.1% |
| Central American | 512 | 4.1% |
| Cherokee | 9 | 0.1% |
| Danish | 12 | 0.1% |
| Dutch | 7 | 0.1% |
| English | 129 | 1.0% |
| European | 13 | 0.1% |
| French | 16 | 0.1% |
| German | 242 | 1.9% |
| Honduran | 319 | 2.5% |
| Indian (Asian) | 61 | 0.5% |
| Irish | 68 | 0.5% |
| Italian | 27 | 0.2% |
| Jamaican | 17 | 0.1% |
| Malaysian | 34 | 0.3% |
| Mexican | 10,304 | 81.9% |
| Mexican American Indian | 37 | 0.3% |
| Nicaraguan | 54 | 0.4% |
| Norwegian | 48 | 0.4% |
| Peruvian | 22 | 0.2% |
| Portuguese | 12 | 0.1% |
| Puerto Rican | 81 | 0.6% |
| Salvadoran | 139 | 1.1% |
| Scandinavian | 9 | 0.1% |
| Scotch-Irish | 10 | 0.1% |
| Scottish | 15 | 0.1% |
| South American | 22 | 0.2% |
| Spaniard | 166 | 1.3% |
| Spanish | 77 | 0.6% |
| Sri Lankan | 25 | 0.2% |
| Swedish | 11 | 0.1% |
| Welsh | 16 | 0.1% | View All 34 Rows |
Immigrants in Lindsay
The most numerous immigrant groups reported in Lindsay came from Latin America (3,985 | 31.7%), Central America (3,959 | 31.5%), Mexico (3,627 | 28.8%), Honduras (193 | 1.5%), and El Salvador (139 | 1.1%), together accounting for 94.6% of all Lindsay residents.
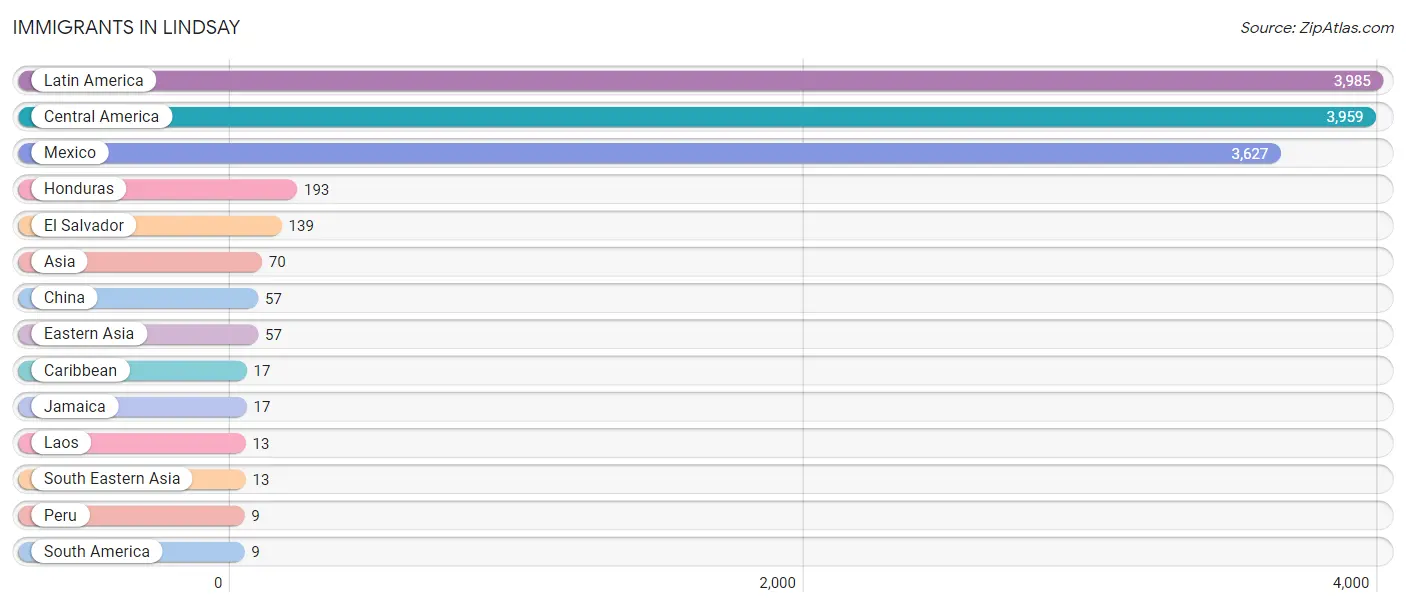
| Immigration Origin | # Population | % Population |
| Asia | 70 | 0.6% |
| Caribbean | 17 | 0.1% |
| Central America | 3,959 | 31.5% |
| China | 57 | 0.4% |
| Eastern Asia | 57 | 0.4% |
| El Salvador | 139 | 1.1% |
| Honduras | 193 | 1.5% |
| Jamaica | 17 | 0.1% |
| Laos | 13 | 0.1% |
| Latin America | 3,985 | 31.7% |
| Mexico | 3,627 | 28.8% |
| Peru | 9 | 0.1% |
| South America | 9 | 0.1% |
| South Eastern Asia | 13 | 0.1% | View All 14 Rows |
Sex and Age in Lindsay
Sex and Age in Lindsay
The most populous age groups in Lindsay are 10 to 14 Years (771 | 11.9%) for men and 15 to 19 Years (721 | 11.8%) for women.
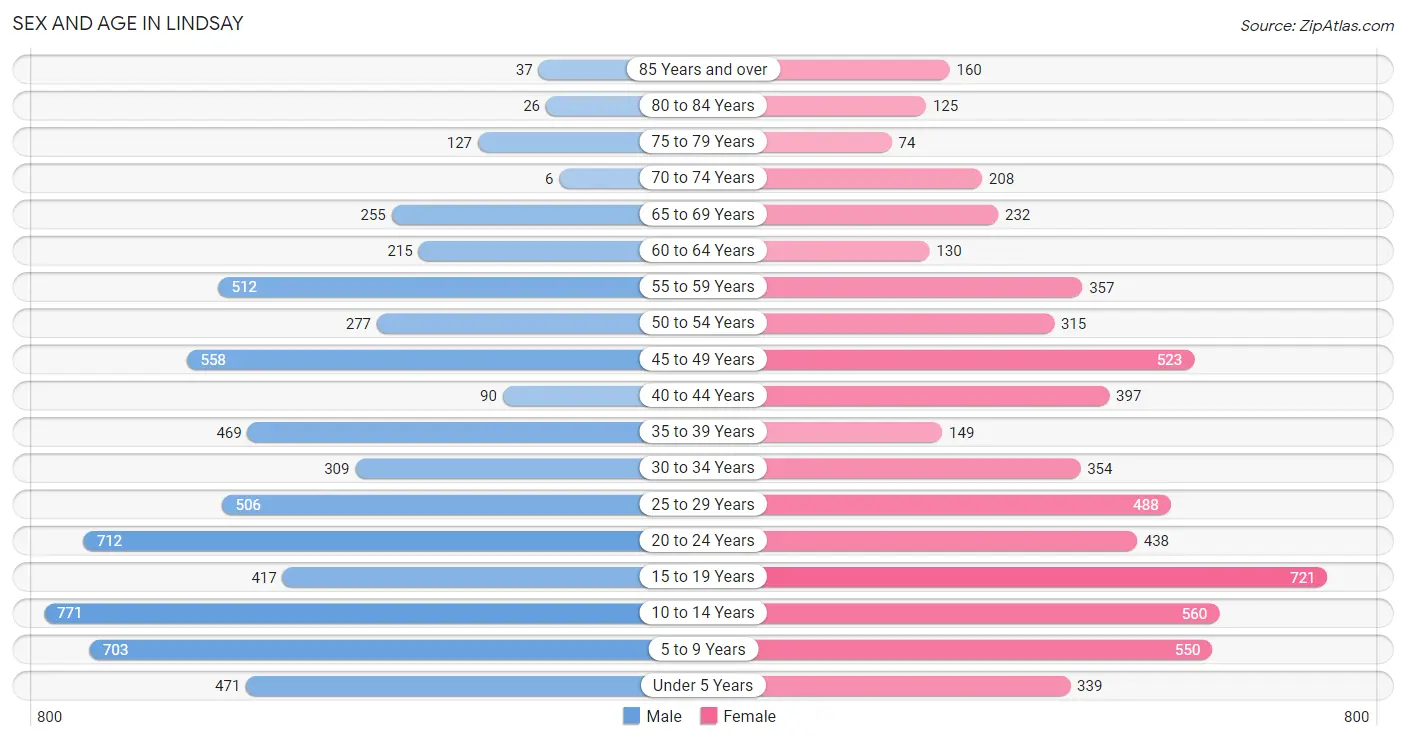
| Age Bracket | Male | Female |
| Under 5 Years | 471 (7.3%) | 339 (5.5%) |
| 5 to 9 Years | 703 (10.9%) | 550 (9.0%) |
| 10 to 14 Years | 771 (11.9%) | 560 (9.1%) |
| 15 to 19 Years | 417 (6.5%) | 721 (11.8%) |
| 20 to 24 Years | 712 (11.0%) | 438 (7.2%) |
| 25 to 29 Years | 506 (7.8%) | 488 (8.0%) |
| 30 to 34 Years | 309 (4.8%) | 354 (5.8%) |
| 35 to 39 Years | 469 (7.3%) | 149 (2.4%) |
| 40 to 44 Years | 90 (1.4%) | 397 (6.5%) |
| 45 to 49 Years | 558 (8.6%) | 523 (8.6%) |
| 50 to 54 Years | 277 (4.3%) | 315 (5.1%) |
| 55 to 59 Years | 512 (7.9%) | 357 (5.8%) |
| 60 to 64 Years | 215 (3.3%) | 130 (2.1%) |
| 65 to 69 Years | 255 (4.0%) | 232 (3.8%) |
| 70 to 74 Years | 6 (0.1%) | 208 (3.4%) |
| 75 to 79 Years | 127 (2.0%) | 74 (1.2%) |
| 80 to 84 Years | 26 (0.4%) | 125 (2.0%) |
| 85 Years and over | 37 (0.6%) | 160 (2.6%) |
| Total | 6,461 (100.0%) | 6,120 (100.0%) |
Families and Households in Lindsay
Median Family Size in Lindsay
The median family size in Lindsay is 3.93 persons per family, with married-couple families (1,989 | 70.2%) accounting for the largest median family size of 4.21 persons per family. On the other hand, single male/father families (294 | 10.4%) represent the smallest median family size with 2.78 persons per family.
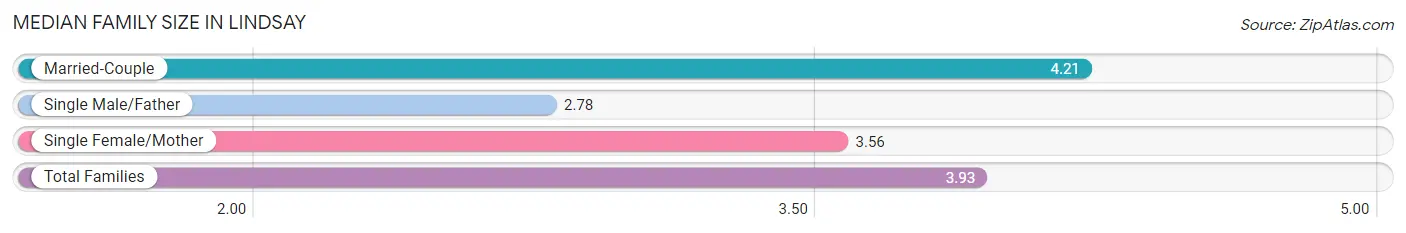
| Family Type | # Families | Family Size |
| Married-Couple | 1,989 (70.2%) | 4.21 |
| Single Male/Father | 294 (10.4%) | 2.78 |
| Single Female/Mother | 550 (19.4%) | 3.56 |
| Total Families | 2,833 (100.0%) | 3.93 |
Median Household Size in Lindsay
The median household size in Lindsay is 3.44 persons per household, with married-couple households (1,989 | 54.8%) accounting for the largest median household size of 4.25 persons per household. non-family households (794 | 21.9%) represent the smallest median household size with 1.26 persons per household.
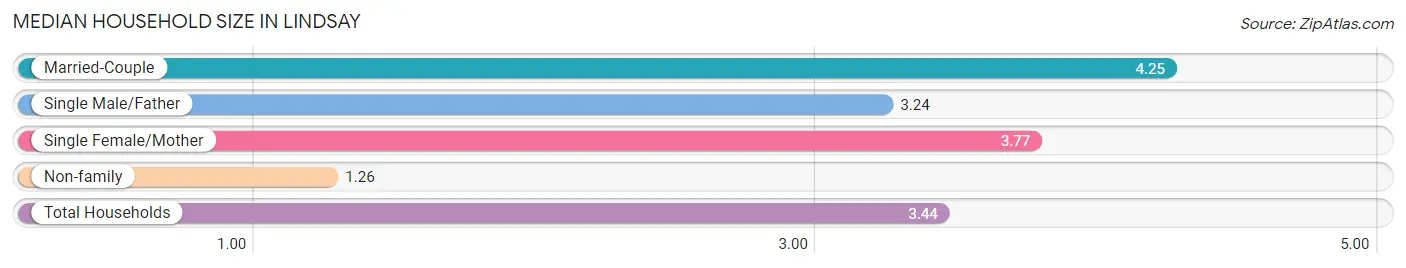
| Household Type | # Households | Household Size |
| Married-Couple | 1,989 (54.8%) | 4.25 |
| Single Male/Father | 294 (8.1%) | 3.24 |
| Single Female/Mother | 550 (15.2%) | 3.77 |
| Non-family | 794 (21.9%) | 1.26 |
| Total Households | 3,627 (100.0%) | 3.44 |
Household Size by Marriage Status in Lindsay
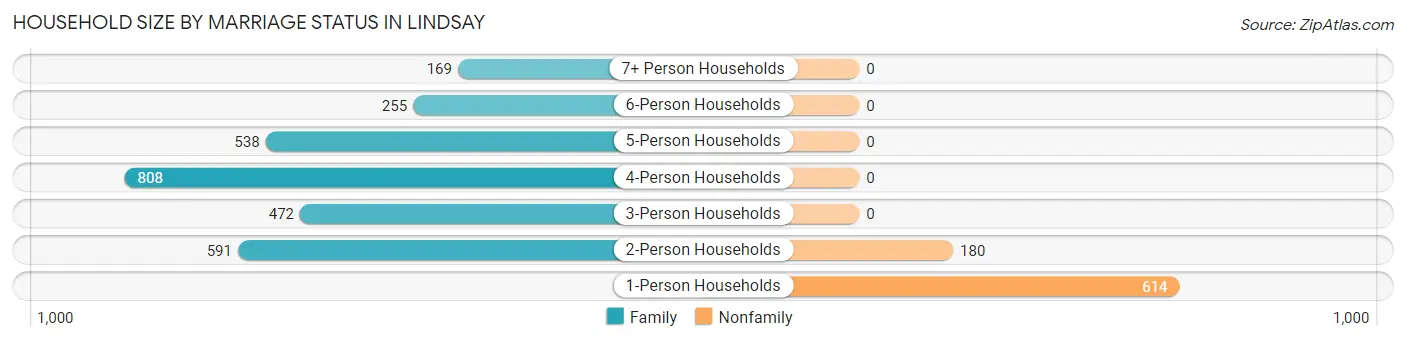
Out of a total of 3,627 households in Lindsay, 2,833 (78.1%) are family households, while 794 (21.9%) are nonfamily households. The most numerous type of family households are 4-person households, comprising 808, and the most common type of nonfamily households are 1-person households, comprising 614.
| Household Size | Family Households | Nonfamily Households |
| 1-Person Households | - | 614 (16.9%) |
| 2-Person Households | 591 (16.3%) | 180 (5.0%) |
| 3-Person Households | 472 (13.0%) | 0 (0.0%) |
| 4-Person Households | 808 (22.3%) | 0 (0.0%) |
| 5-Person Households | 538 (14.8%) | 0 (0.0%) |
| 6-Person Households | 255 (7.0%) | 0 (0.0%) |
| 7+ Person Households | 169 (4.7%) | 0 (0.0%) |
| Total | 2,833 (78.1%) | 794 (21.9%) |
Female Fertility in Lindsay
Fertility by Age in Lindsay
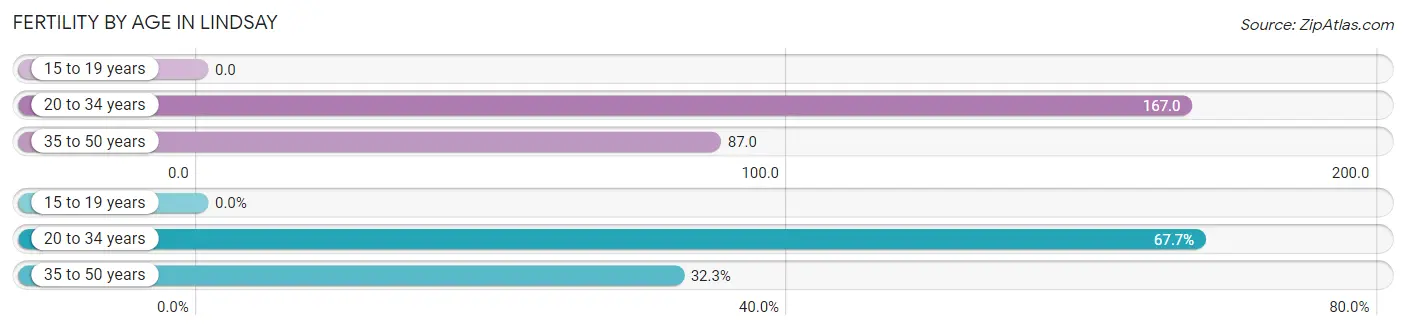
Average fertility rate in Lindsay is 99.0 births per 1,000 women. Women in the age bracket of 20 to 34 years have the highest fertility rate with 167.0 births per 1,000 women. Women in the age bracket of 20 to 34 years acount for 67.7% of all women with births.
| Age Bracket | Women with Births | Births / 1,000 Women |
| 15 to 19 years | 0 (0.0%) | 0.0 |
| 20 to 34 years | 214 (67.7%) | 167.0 |
| 35 to 50 years | 102 (32.3%) | 87.0 |
| Total | 316 (100.0%) | 99.0 |
Fertility by Age by Marriage Status in Lindsay
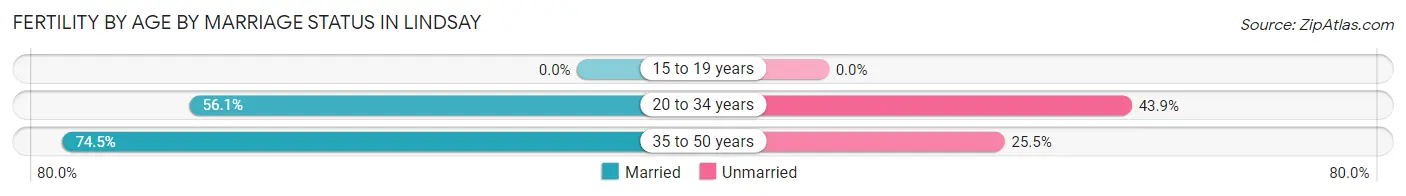
62.0% of women with births (316) in Lindsay are married. The highest percentage of unmarried women with births falls into 20 to 34 years age bracket with 43.9% of them unmarried at the time of birth, while the lowest percentage of unmarried women with births belong to 35 to 50 years age bracket with 25.5% of them unmarried.
| Age Bracket | Married | Unmarried |
| 15 to 19 years | 0 (0.0%) | 0 (0.0%) |
| 20 to 34 years | 120 (56.1%) | 94 (43.9%) |
| 35 to 50 years | 76 (74.5%) | 26 (25.5%) |
| Total | 196 (62.0%) | 120 (38.0%) |
Fertility by Education in Lindsay
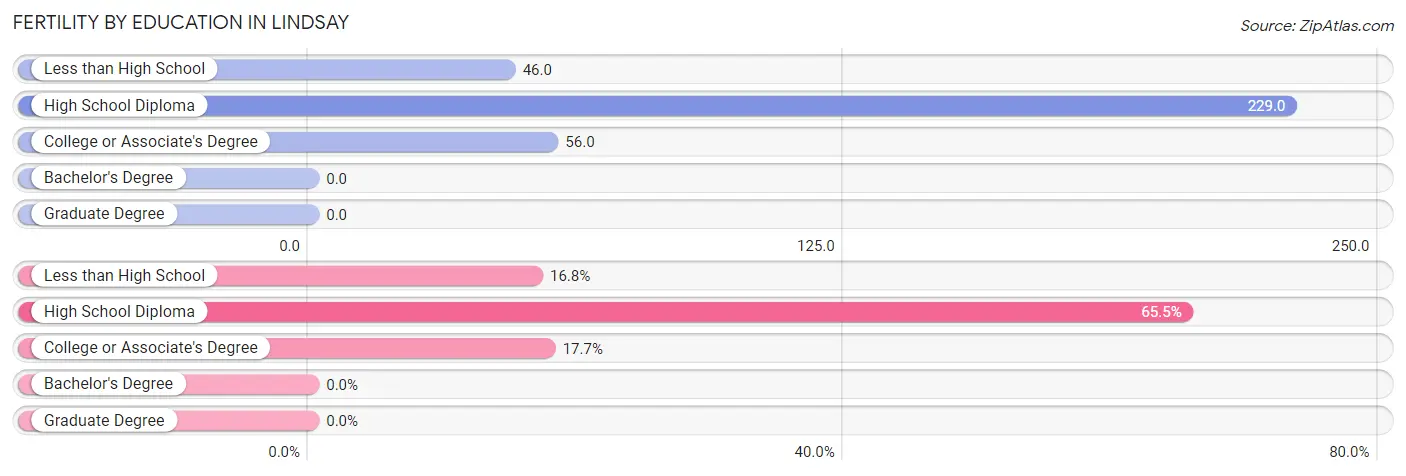
| Educational Attainment | Women with Births | Births / 1,000 Women |
| Less than High School | 53 (16.8%) | 46.0 |
| High School Diploma | 207 (65.5%) | 229.0 |
| College or Associate's Degree | 56 (17.7%) | 56.0 |
| Bachelor's Degree | 0 (0.0%) | 0.0 |
| Graduate Degree | 0 (0.0%) | 0.0 |
| Total | 316 (100.0%) | 99.0 |
Fertility by Education by Marriage Status in Lindsay
38.0% of women with births in Lindsay are unmarried. Women with the educational attainment of college or associate's degree are most likely to be married with 85.7% of them married at childbirth, while women with the educational attainment of high school diploma are least likely to be married with 46.4% of them unmarried at childbirth.
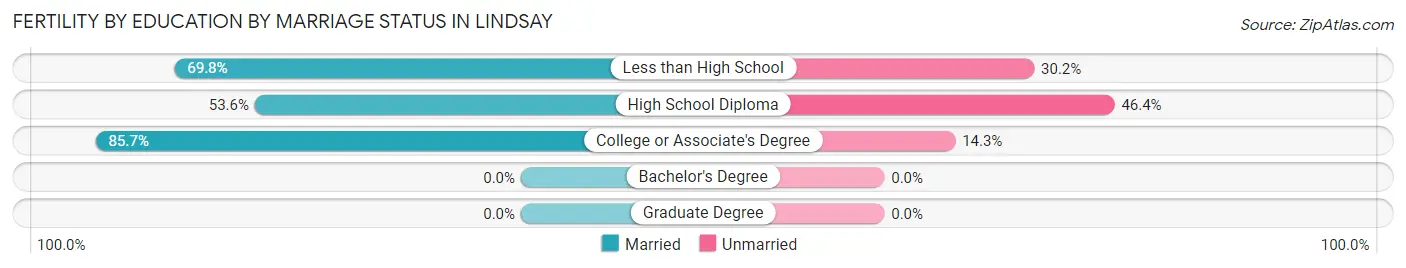
| Educational Attainment | Married | Unmarried |
| Less than High School | 37 (69.8%) | 16 (30.2%) |
| High School Diploma | 111 (53.6%) | 96 (46.4%) |
| College or Associate's Degree | 48 (85.7%) | 8 (14.3%) |
| Bachelor's Degree | 0 (0.0%) | 0 (0.0%) |
| Graduate Degree | 0 (0.0%) | 0 (0.0%) |
| Total | 196 (62.0%) | 120 (38.0%) |
Employment Characteristics in Lindsay
Employment by Class of Employer in Lindsay
Among the 4,047 employed individuals in Lindsay, private company employees (2,552 | 63.1%), local government employees (755 | 18.7%), and state government employees (248 | 6.1%) make up the most common classes of employment.
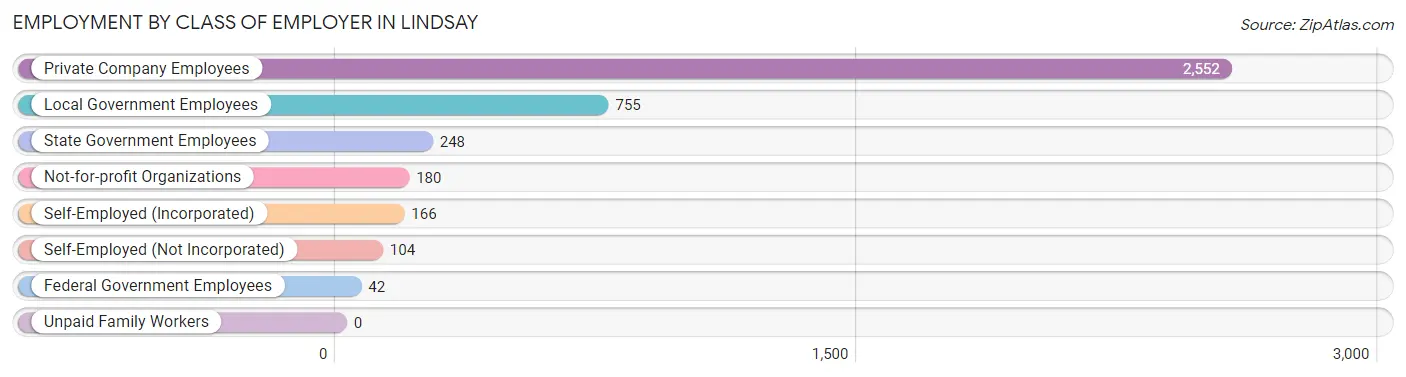
| Employer Class | # Employees | % Employees |
| Private Company Employees | 2,552 | 63.1% |
| Self-Employed (Incorporated) | 166 | 4.1% |
| Self-Employed (Not Incorporated) | 104 | 2.6% |
| Not-for-profit Organizations | 180 | 4.4% |
| Local Government Employees | 755 | 18.7% |
| State Government Employees | 248 | 6.1% |
| Federal Government Employees | 42 | 1.0% |
| Unpaid Family Workers | 0 | 0.0% |
| Total | 4,047 | 100.0% |
Employment Status by Age in Lindsay
According to the labor force statistics for Lindsay, out of the total population over 16 years of age (8,857), 58.0% or 5,137 individuals are in the labor force, with 17.1% or 878 of them unemployed. The age group with the highest labor force participation rate is 35 to 44 years, with 86.7% or 958 individuals in the labor force. Within the labor force, the 75 years and over age range has the highest percentage of unemployed individuals, with 100.0% or 9 of them being unemployed.
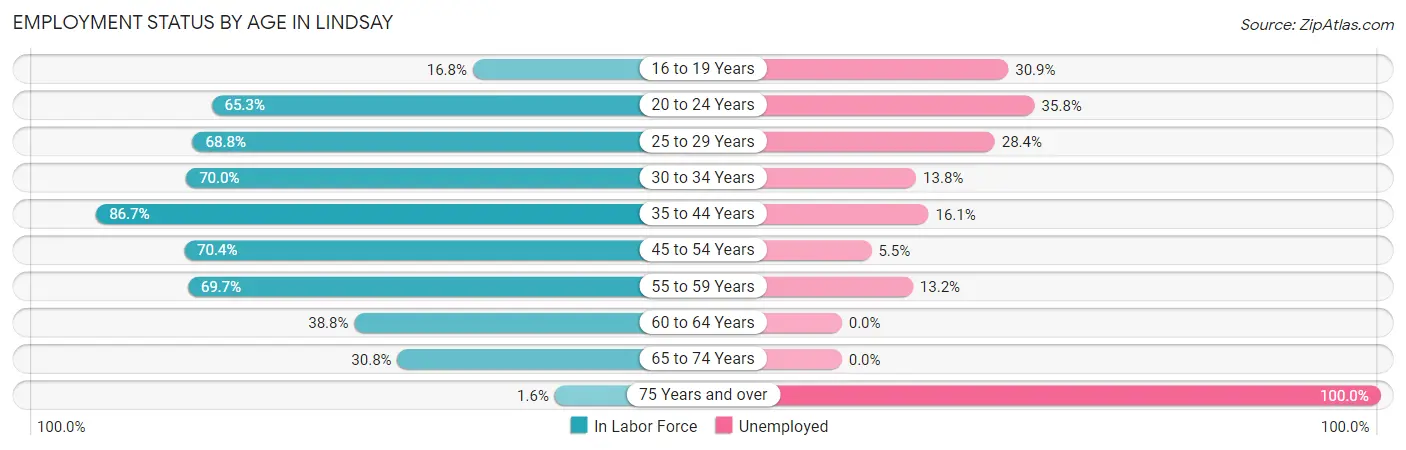
| Age Bracket | In Labor Force | Unemployed |
| 16 to 19 Years | 136 (16.8%) | 42 (30.9%) |
| 20 to 24 Years | 751 (65.3%) | 269 (35.8%) |
| 25 to 29 Years | 684 (68.8%) | 194 (28.4%) |
| 30 to 34 Years | 464 (70.0%) | 64 (13.8%) |
| 35 to 44 Years | 958 (86.7%) | 154 (16.1%) |
| 45 to 54 Years | 1,178 (70.4%) | 65 (5.5%) |
| 55 to 59 Years | 606 (69.7%) | 80 (13.2%) |
| 60 to 64 Years | 134 (38.8%) | 0 (0.0%) |
| 65 to 74 Years | 216 (30.8%) | 0 (0.0%) |
| 75 Years and over | 9 (1.6%) | 9 (100.0%) |
| Total | 5,137 (58.0%) | 878 (17.1%) |
Employment Status by Educational Attainment in Lindsay
According to labor force statistics for Lindsay, 71.2% of individuals (4,022) out of the total population between 25 and 64 years of age (5,649) are in the labor force, with 13.8% or 555 of them being unemployed. The group with the highest labor force participation rate are those with the educational attainment of bachelor's degree or higher, with 88.3% or 219 individuals in the labor force. Within the labor force, individuals with less than high school education have the highest percentage of unemployment, with 18.5% or 268 of them being unemployed.
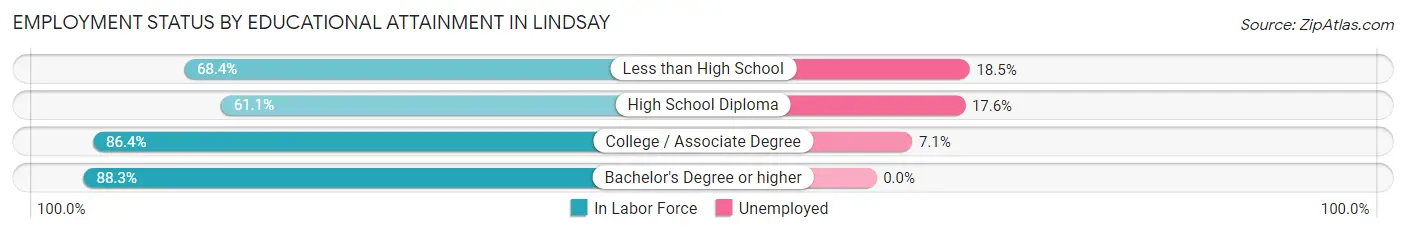
| Educational Attainment | In Labor Force | Unemployed |
| Less than High School | 1,447 (68.4%) | 391 (18.5%) |
| High School Diploma | 1,161 (61.1%) | 334 (17.6%) |
| College / Associate Degree | 1,197 (86.4%) | 98 (7.1%) |
| Bachelor's Degree or higher | 219 (88.3%) | 0 (0.0%) |
| Total | 4,022 (71.2%) | 780 (13.8%) |
Employment Occupations by Sex in Lindsay
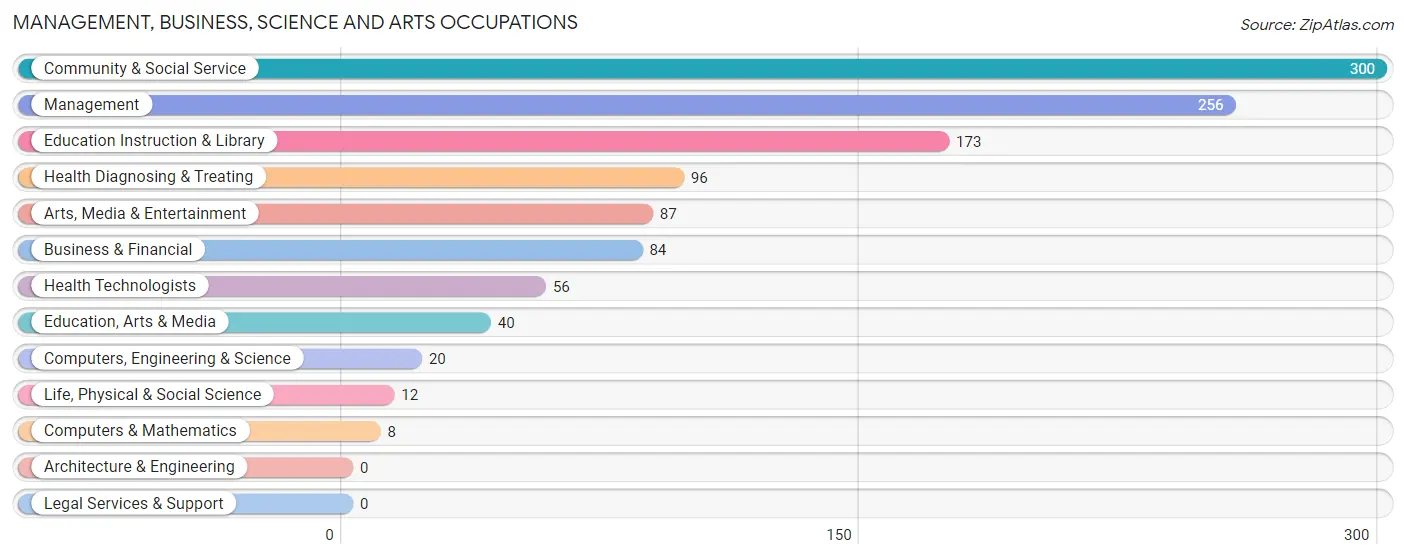
Management, Business, Science and Arts Occupations
The most common Management, Business, Science and Arts occupations in Lindsay are Community & Social Service (300 | 7.0%), Management (256 | 6.0%), Education Instruction & Library (173 | 4.1%), Health Diagnosing & Treating (96 | 2.2%), and Arts, Media & Entertainment (87 | 2.0%).
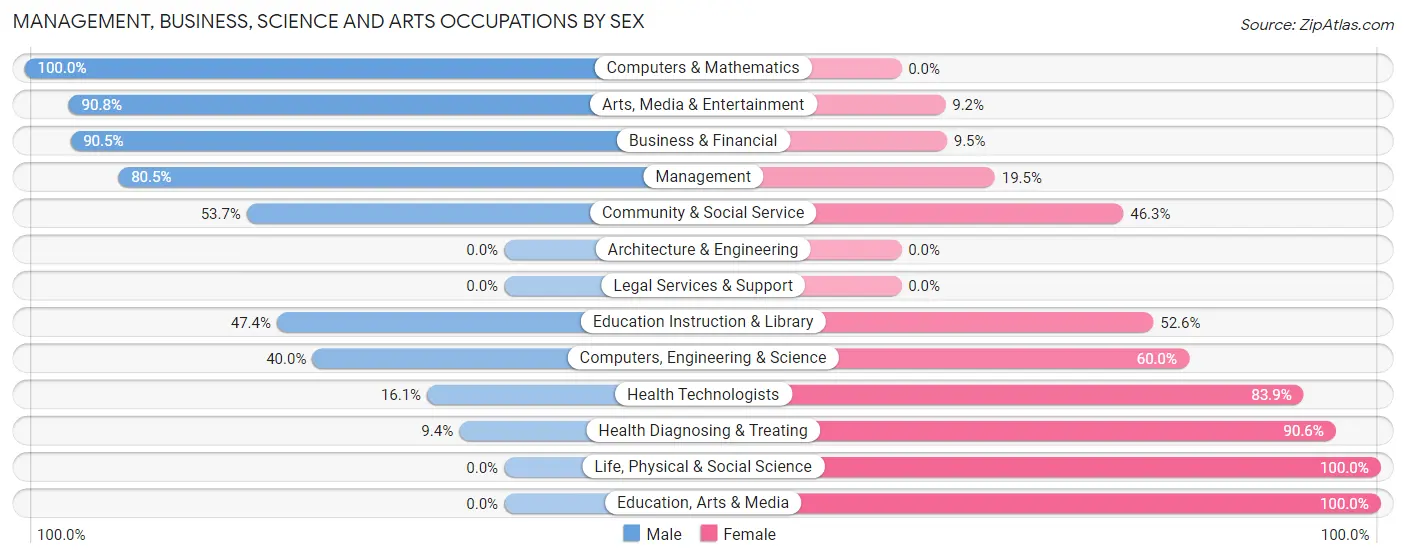
Management, Business, Science and Arts Occupations by Sex
Within the Management, Business, Science and Arts occupations in Lindsay, the most male-oriented occupations are Computers & Mathematics (100.0%), Arts, Media & Entertainment (90.8%), and Business & Financial (90.5%), while the most female-oriented occupations are Life, Physical & Social Science (100.0%), Education, Arts & Media (100.0%), and Health Diagnosing & Treating (90.6%).
| Occupation | Male | Female |
| Management | 206 (80.5%) | 50 (19.5%) |
| Business & Financial | 76 (90.5%) | 8 (9.5%) |
| Computers, Engineering & Science | 8 (40.0%) | 12 (60.0%) |
| Computers & Mathematics | 8 (100.0%) | 0 (0.0%) |
| Architecture & Engineering | 0 (0.0%) | 0 (0.0%) |
| Life, Physical & Social Science | 0 (0.0%) | 12 (100.0%) |
| Community & Social Service | 161 (53.7%) | 139 (46.3%) |
| Education, Arts & Media | 0 (0.0%) | 40 (100.0%) |
| Legal Services & Support | 0 (0.0%) | 0 (0.0%) |
| Education Instruction & Library | 82 (47.4%) | 91 (52.6%) |
| Arts, Media & Entertainment | 79 (90.8%) | 8 (9.2%) |
| Health Diagnosing & Treating | 9 (9.4%) | 87 (90.6%) |
| Health Technologists | 9 (16.1%) | 47 (83.9%) |
| Total (Category) | 460 (60.9%) | 296 (39.2%) |
| Total (Overall) | 2,647 (62.2%) | 1,611 (37.8%) |
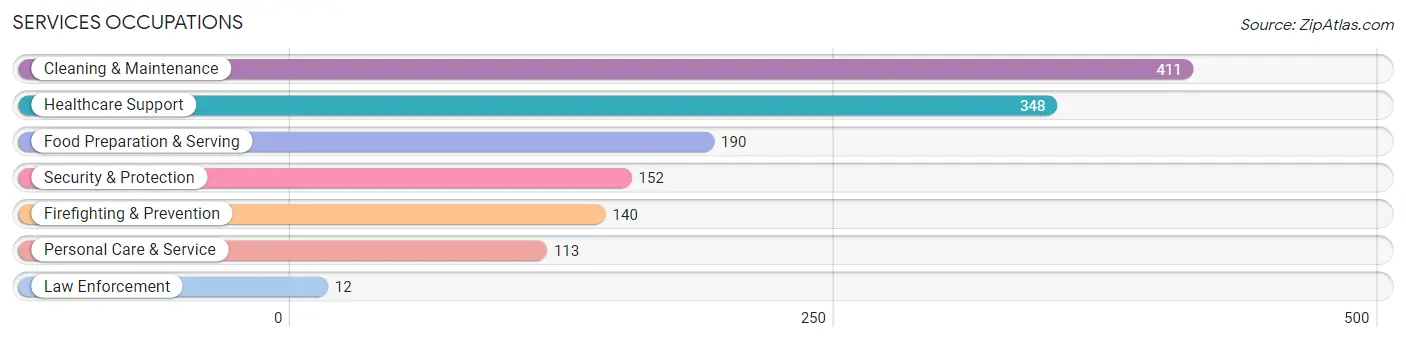
Services Occupations
The most common Services occupations in Lindsay are Cleaning & Maintenance (411 | 9.7%), Healthcare Support (348 | 8.2%), Food Preparation & Serving (190 | 4.5%), Security & Protection (152 | 3.6%), and Firefighting & Prevention (140 | 3.3%).
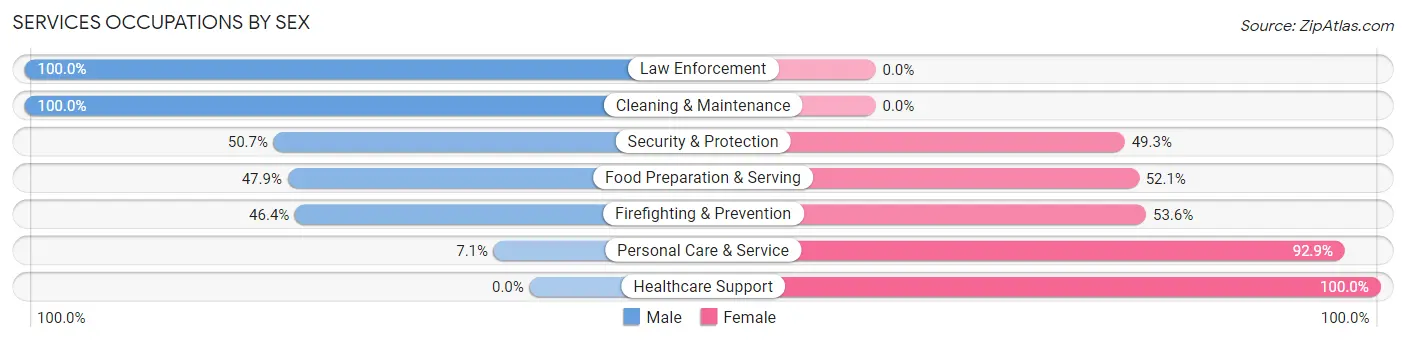
Services Occupations by Sex
Within the Services occupations in Lindsay, the most male-oriented occupations are Law Enforcement (100.0%), Cleaning & Maintenance (100.0%), and Security & Protection (50.7%), while the most female-oriented occupations are Healthcare Support (100.0%), Personal Care & Service (92.9%), and Firefighting & Prevention (53.6%).
| Occupation | Male | Female |
| Healthcare Support | 0 (0.0%) | 348 (100.0%) |
| Security & Protection | 77 (50.7%) | 75 (49.3%) |
| Firefighting & Prevention | 65 (46.4%) | 75 (53.6%) |
| Law Enforcement | 12 (100.0%) | 0 (0.0%) |
| Food Preparation & Serving | 91 (47.9%) | 99 (52.1%) |
| Cleaning & Maintenance | 411 (100.0%) | 0 (0.0%) |
| Personal Care & Service | 8 (7.1%) | 105 (92.9%) |
| Total (Category) | 587 (48.3%) | 627 (51.6%) |
| Total (Overall) | 2,647 (62.2%) | 1,611 (37.8%) |
Sales and Office Occupations
The most common Sales and Office occupations in Lindsay are Office & Administration (437 | 10.3%), and Sales & Related (103 | 2.4%).
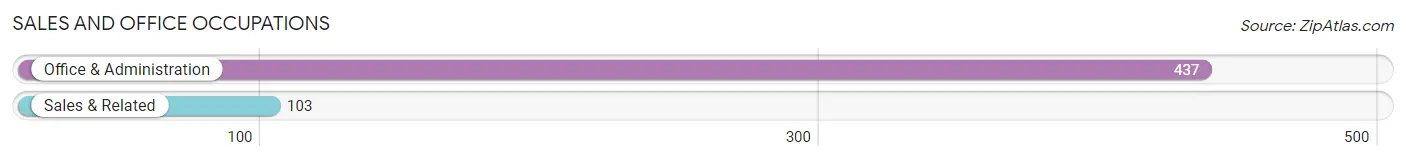
Sales and Office Occupations by Sex
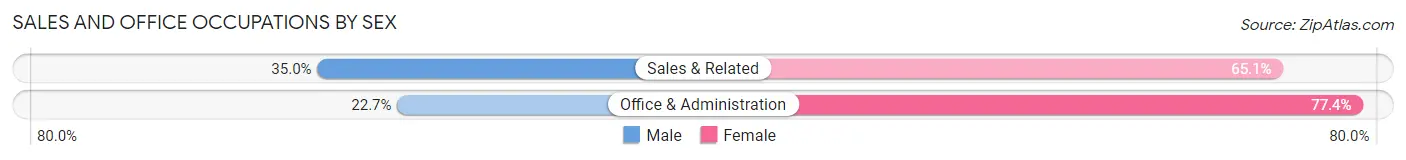
| Occupation | Male | Female |
| Sales & Related | 36 (34.9%) | 67 (65.0%) |
| Office & Administration | 99 (22.7%) | 338 (77.3%) |
| Total (Category) | 135 (25.0%) | 405 (75.0%) |
| Total (Overall) | 2,647 (62.2%) | 1,611 (37.8%) |
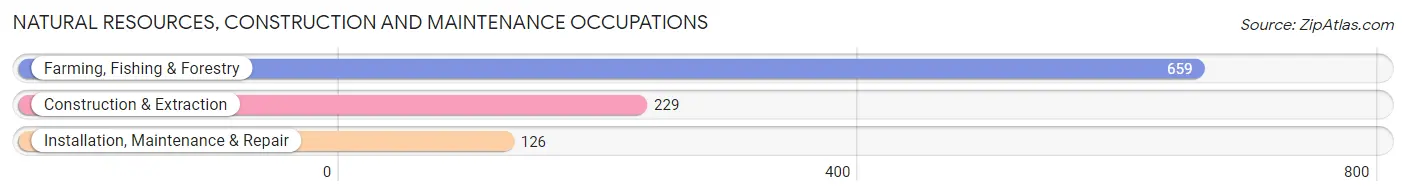
Natural Resources, Construction and Maintenance Occupations
The most common Natural Resources, Construction and Maintenance occupations in Lindsay are Farming, Fishing & Forestry (659 | 15.5%), Construction & Extraction (229 | 5.4%), and Installation, Maintenance & Repair (126 | 3.0%).
Natural Resources, Construction and Maintenance Occupations by Sex
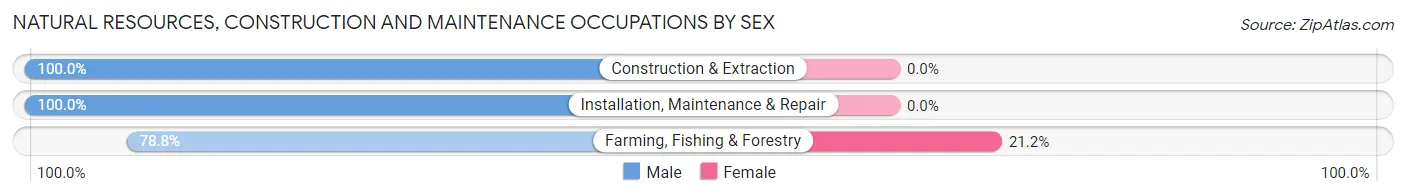
| Occupation | Male | Female |
| Farming, Fishing & Forestry | 519 (78.8%) | 140 (21.2%) |
| Construction & Extraction | 229 (100.0%) | 0 (0.0%) |
| Installation, Maintenance & Repair | 126 (100.0%) | 0 (0.0%) |
| Total (Category) | 874 (86.2%) | 140 (13.8%) |
| Total (Overall) | 2,647 (62.2%) | 1,611 (37.8%) |
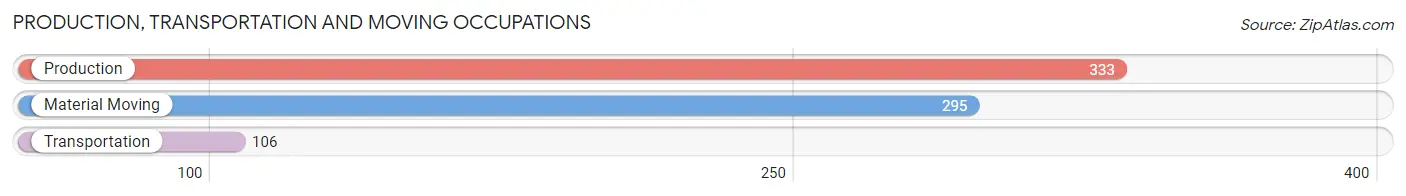
Production, Transportation and Moving Occupations
The most common Production, Transportation and Moving occupations in Lindsay are Production (333 | 7.8%), Material Moving (295 | 6.9%), and Transportation (106 | 2.5%).
Production, Transportation and Moving Occupations by Sex
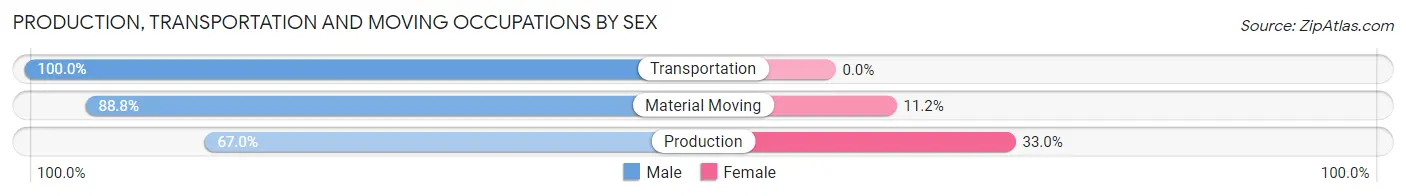
| Occupation | Male | Female |
| Production | 223 (67.0%) | 110 (33.0%) |
| Transportation | 106 (100.0%) | 0 (0.0%) |
| Material Moving | 262 (88.8%) | 33 (11.2%) |
| Total (Category) | 591 (80.5%) | 143 (19.5%) |
| Total (Overall) | 2,647 (62.2%) | 1,611 (37.8%) |
Employment Industries by Sex in Lindsay
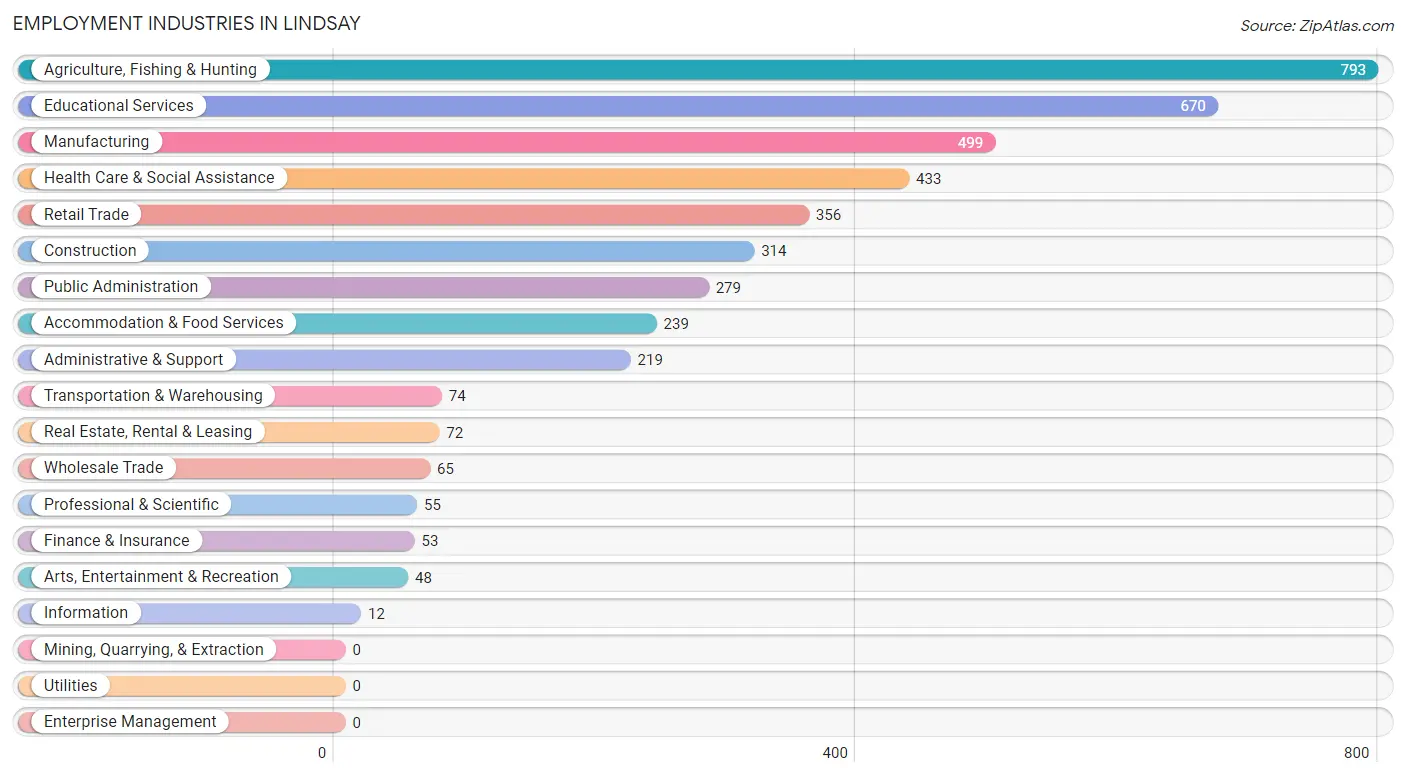
Employment Industries in Lindsay
The major employment industries in Lindsay include Agriculture, Fishing & Hunting (793 | 18.6%), Educational Services (670 | 15.7%), Manufacturing (499 | 11.7%), Health Care & Social Assistance (433 | 10.2%), and Retail Trade (356 | 8.4%).
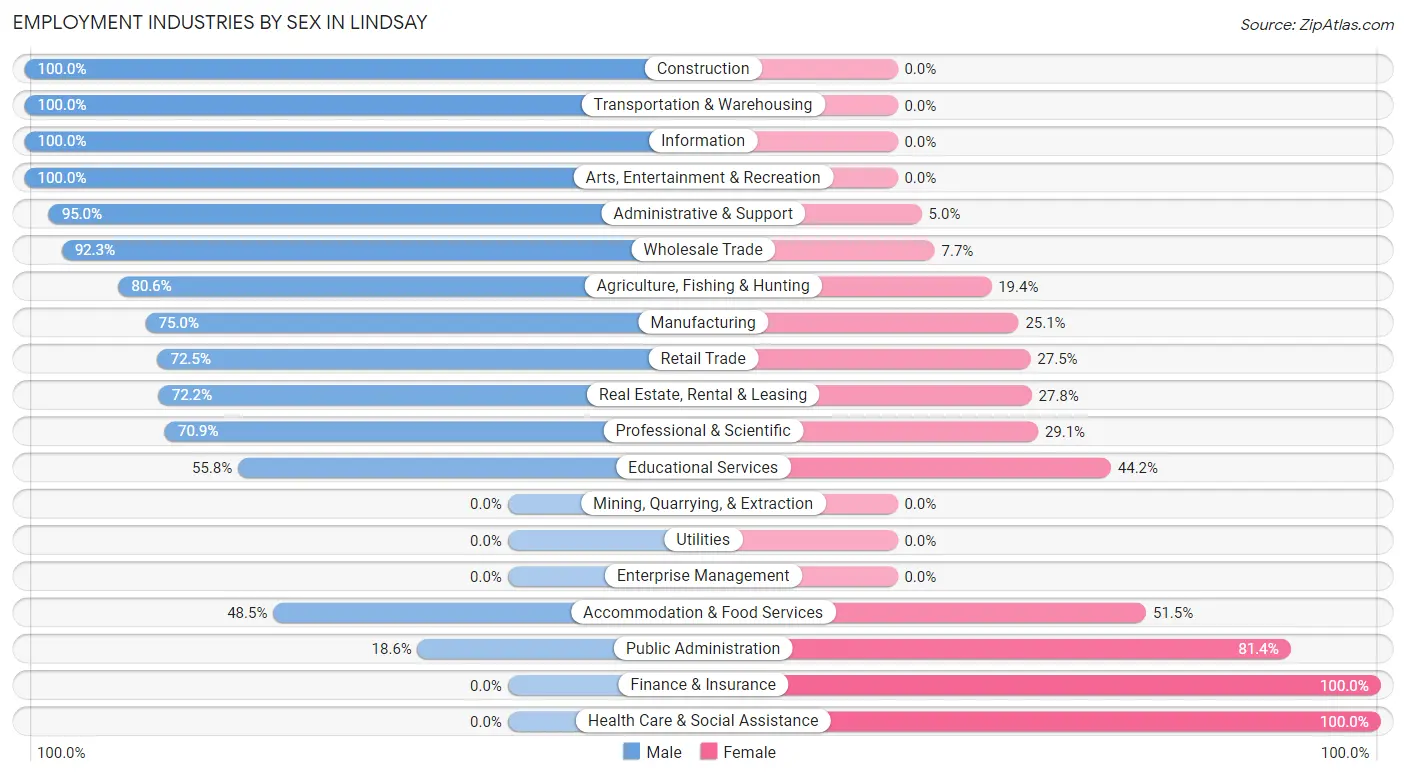
Employment Industries by Sex in Lindsay
The Lindsay industries that see more men than women are Construction (100.0%), Transportation & Warehousing (100.0%), and Information (100.0%), whereas the industries that tend to have a higher number of women are Finance & Insurance (100.0%), Health Care & Social Assistance (100.0%), and Public Administration (81.4%).
| Industry | Male | Female |
| Agriculture, Fishing & Hunting | 639 (80.6%) | 154 (19.4%) |
| Mining, Quarrying, & Extraction | 0 (0.0%) | 0 (0.0%) |
| Construction | 314 (100.0%) | 0 (0.0%) |
| Manufacturing | 374 (75.0%) | 125 (25.1%) |
| Wholesale Trade | 60 (92.3%) | 5 (7.7%) |
| Retail Trade | 258 (72.5%) | 98 (27.5%) |
| Transportation & Warehousing | 74 (100.0%) | 0 (0.0%) |
| Utilities | 0 (0.0%) | 0 (0.0%) |
| Information | 12 (100.0%) | 0 (0.0%) |
| Finance & Insurance | 0 (0.0%) | 53 (100.0%) |
| Real Estate, Rental & Leasing | 52 (72.2%) | 20 (27.8%) |
| Professional & Scientific | 39 (70.9%) | 16 (29.1%) |
| Enterprise Management | 0 (0.0%) | 0 (0.0%) |
| Administrative & Support | 208 (95.0%) | 11 (5.0%) |
| Educational Services | 374 (55.8%) | 296 (44.2%) |
| Health Care & Social Assistance | 0 (0.0%) | 433 (100.0%) |
| Arts, Entertainment & Recreation | 48 (100.0%) | 0 (0.0%) |
| Accommodation & Food Services | 116 (48.5%) | 123 (51.5%) |
| Public Administration | 52 (18.6%) | 227 (81.4%) |
| Total | 2,647 (62.2%) | 1,611 (37.8%) |
Education in Lindsay
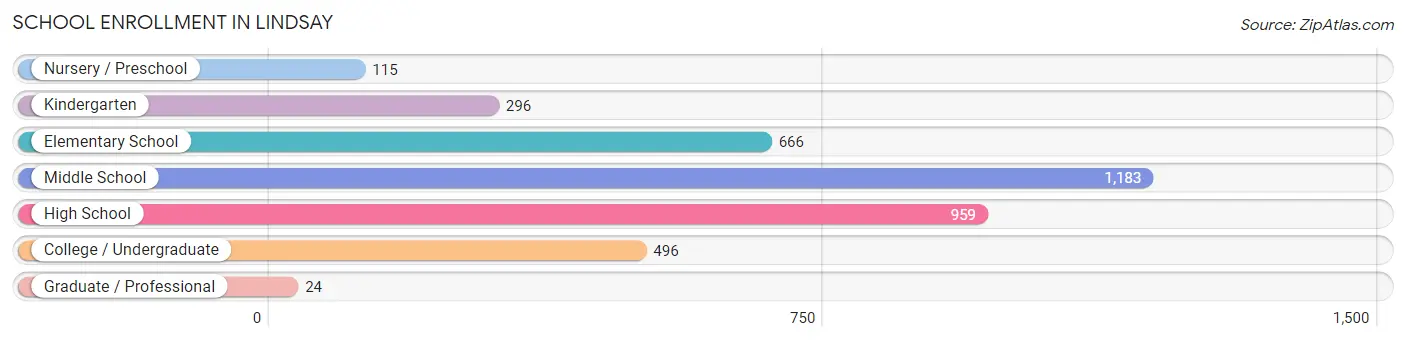
School Enrollment in Lindsay
The most common levels of schooling among the 3,739 students in Lindsay are middle school (1,183 | 31.6%), high school (959 | 25.7%), and elementary school (666 | 17.8%).
| School Level | # Students | % Students |
| Nursery / Preschool | 115 | 3.1% |
| Kindergarten | 296 | 7.9% |
| Elementary School | 666 | 17.8% |
| Middle School | 1,183 | 31.6% |
| High School | 959 | 25.7% |
| College / Undergraduate | 496 | 13.3% |
| Graduate / Professional | 24 | 0.6% |
| Total | 3,739 | 100.0% |
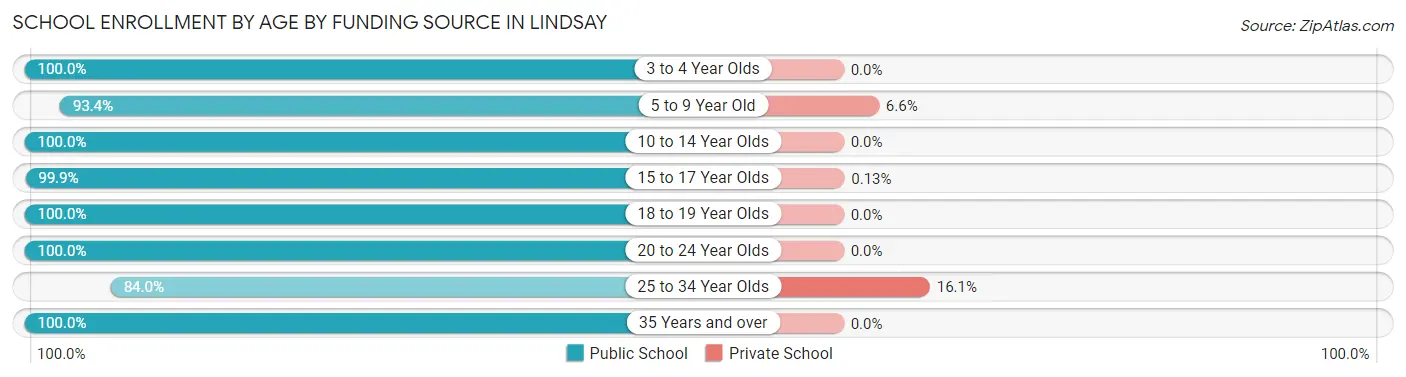
School Enrollment by Age by Funding Source in Lindsay
Out of a total of 3,739 students who are enrolled in schools in Lindsay, 75 (2.0%) attend a private institution, while the remaining 3,664 (98.0%) are enrolled in public schools. The age group of 25 to 34 year olds has the highest likelihood of being enrolled in private schools, with 13 (16.1% in the age bracket) enrolled. Conversely, the age group of 3 to 4 year olds has the lowest likelihood of being enrolled in a private school, with 167 (100.0% in the age bracket) attending a public institution.
| Age Bracket | Public School | Private School |
| 3 to 4 Year Olds | 167 (100.0%) | 0 (0.0%) |
| 5 to 9 Year Old | 855 (93.4%) | 60 (6.6%) |
| 10 to 14 Year Olds | 1,311 (100.0%) | 0 (0.0%) |
| 15 to 17 Year Olds | 767 (99.9%) | 1 (0.1%) |
| 18 to 19 Year Olds | 264 (100.0%) | 0 (0.0%) |
| 20 to 24 Year Olds | 186 (100.0%) | 0 (0.0%) |
| 25 to 34 Year Olds | 68 (84.0%) | 13 (16.1%) |
| 35 Years and over | 47 (100.0%) | 0 (0.0%) |
| Total | 3,664 (98.0%) | 75 (2.0%) |
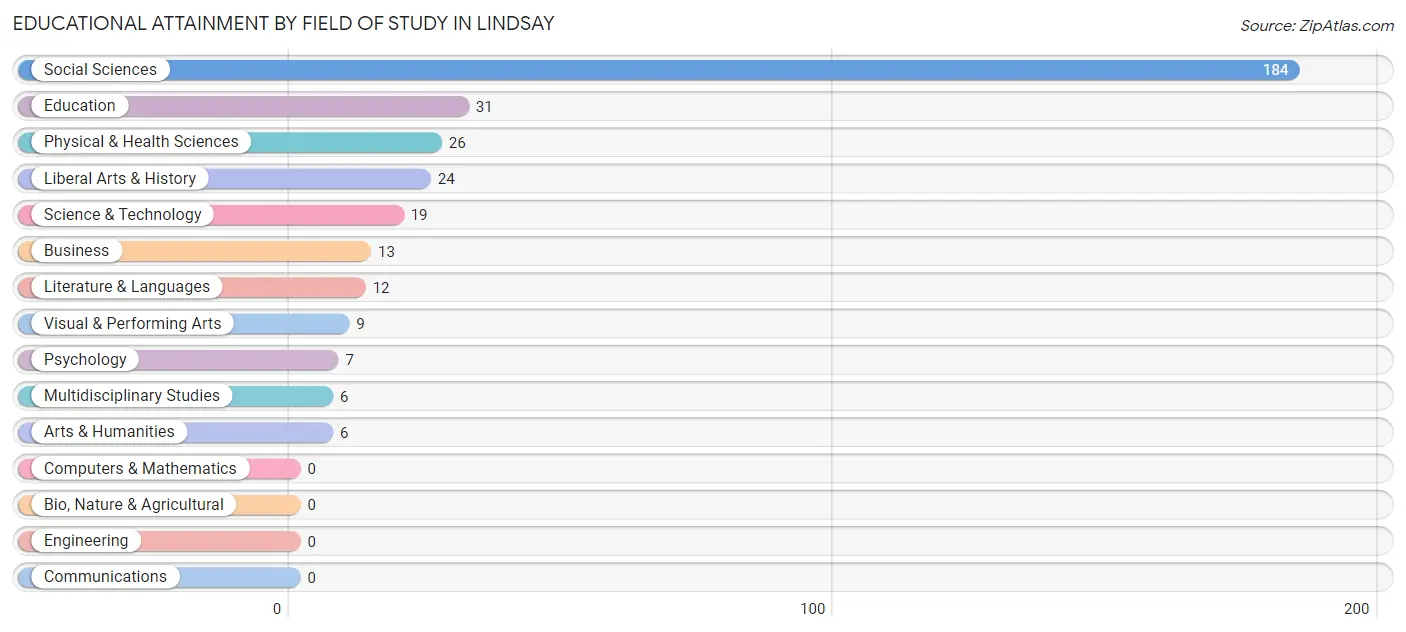
Educational Attainment by Field of Study in Lindsay
Social sciences (184 | 54.6%), education (31 | 9.2%), physical & health sciences (26 | 7.7%), liberal arts & history (24 | 7.1%), and science & technology (19 | 5.6%) are the most common fields of study among 337 individuals in Lindsay who have obtained a bachelor's degree or higher.
| Field of Study | # Graduates | % Graduates |
| Computers & Mathematics | 0 | 0.0% |
| Bio, Nature & Agricultural | 0 | 0.0% |
| Physical & Health Sciences | 26 | 7.7% |
| Psychology | 7 | 2.1% |
| Social Sciences | 184 | 54.6% |
| Engineering | 0 | 0.0% |
| Multidisciplinary Studies | 6 | 1.8% |
| Science & Technology | 19 | 5.6% |
| Business | 13 | 3.9% |
| Education | 31 | 9.2% |
| Literature & Languages | 12 | 3.6% |
| Liberal Arts & History | 24 | 7.1% |
| Visual & Performing Arts | 9 | 2.7% |
| Communications | 0 | 0.0% |
| Arts & Humanities | 6 | 1.8% |
| Total | 337 | 100.0% |
Transportation & Commute in Lindsay
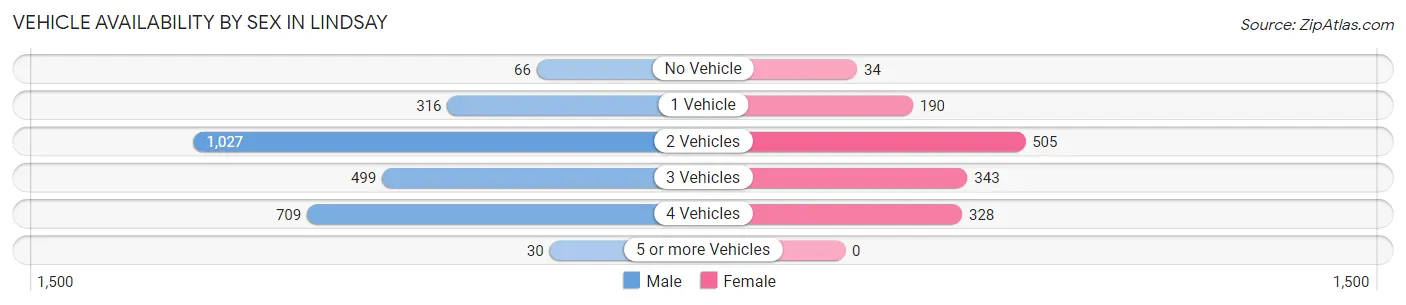
Vehicle Availability by Sex in Lindsay
The most prevalent vehicle ownership categories in Lindsay are males with 2 vehicles (1,027, accounting for 38.8%) and females with 2 vehicles (505, making up 73.4%).
| Vehicles Available | Male | Female |
| No Vehicle | 66 (2.5%) | 34 (2.4%) |
| 1 Vehicle | 316 (11.9%) | 190 (13.6%) |
| 2 Vehicles | 1,027 (38.8%) | 505 (36.1%) |
| 3 Vehicles | 499 (18.9%) | 343 (24.5%) |
| 4 Vehicles | 709 (26.8%) | 328 (23.4%) |
| 5 or more Vehicles | 30 (1.1%) | 0 (0.0%) |
| Total | 2,647 (100.0%) | 1,400 (100.0%) |
Commute Time in Lindsay
The most frequently occuring commute durations in Lindsay are 30 to 34 minutes (1,013 commuters, 26.5%), 15 to 19 minutes (483 commuters, 12.6%), and 20 to 24 minutes (439 commuters, 11.5%).
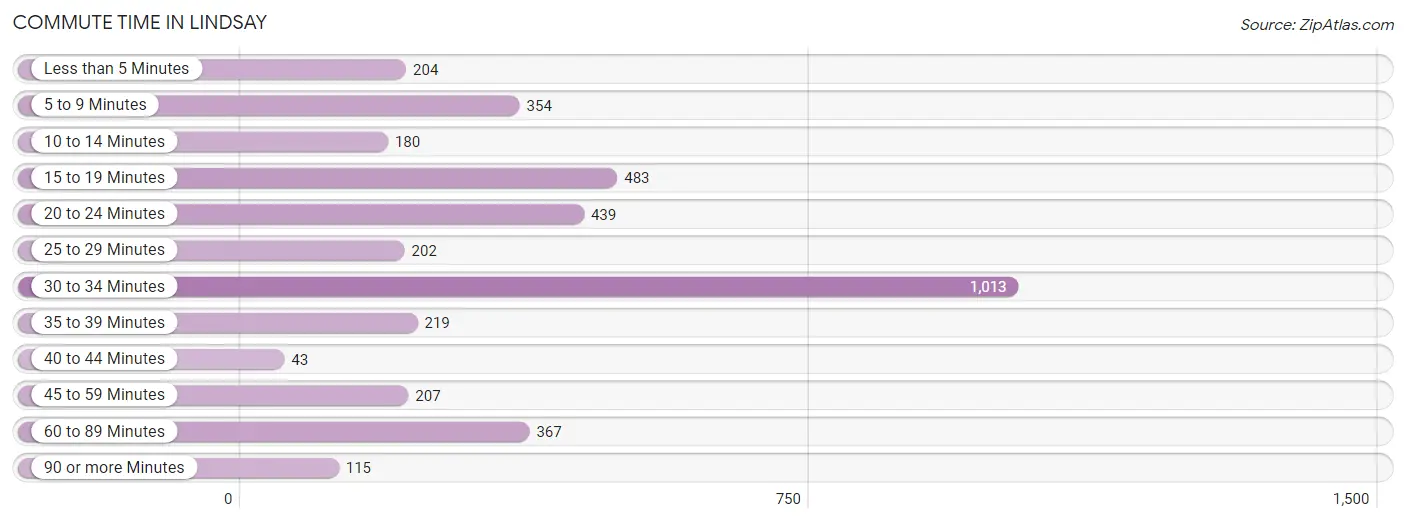
| Commute Time | # Commuters | % Commuters |
| Less than 5 Minutes | 204 | 5.3% |
| 5 to 9 Minutes | 354 | 9.2% |
| 10 to 14 Minutes | 180 | 4.7% |
| 15 to 19 Minutes | 483 | 12.6% |
| 20 to 24 Minutes | 439 | 11.5% |
| 25 to 29 Minutes | 202 | 5.3% |
| 30 to 34 Minutes | 1,013 | 26.5% |
| 35 to 39 Minutes | 219 | 5.7% |
| 40 to 44 Minutes | 43 | 1.1% |
| 45 to 59 Minutes | 207 | 5.4% |
| 60 to 89 Minutes | 367 | 9.6% |
| 90 or more Minutes | 115 | 3.0% |
Commute Time by Sex in Lindsay
The most common commute times in Lindsay are 30 to 34 minutes (811 commuters, 31.8%) for males and 20 to 24 minutes (308 commuters, 24.1%) for females.
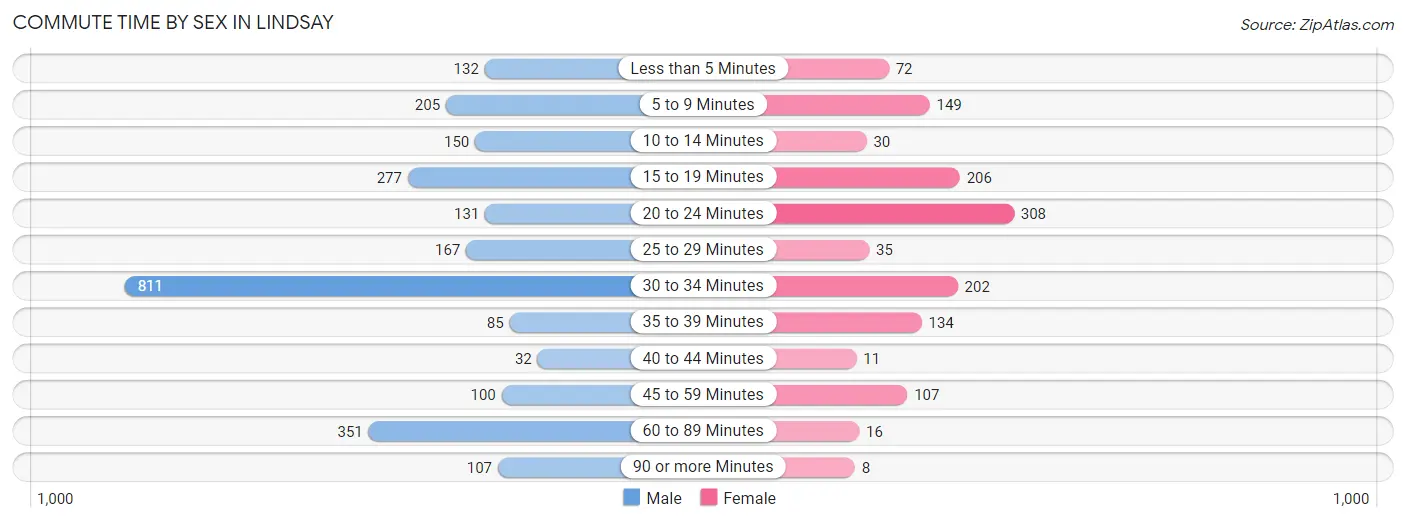
| Commute Time | Male | Female |
| Less than 5 Minutes | 132 (5.2%) | 72 (5.6%) |
| 5 to 9 Minutes | 205 (8.1%) | 149 (11.7%) |
| 10 to 14 Minutes | 150 (5.9%) | 30 (2.4%) |
| 15 to 19 Minutes | 277 (10.9%) | 206 (16.1%) |
| 20 to 24 Minutes | 131 (5.1%) | 308 (24.1%) |
| 25 to 29 Minutes | 167 (6.6%) | 35 (2.7%) |
| 30 to 34 Minutes | 811 (31.8%) | 202 (15.8%) |
| 35 to 39 Minutes | 85 (3.3%) | 134 (10.5%) |
| 40 to 44 Minutes | 32 (1.3%) | 11 (0.9%) |
| 45 to 59 Minutes | 100 (3.9%) | 107 (8.4%) |
| 60 to 89 Minutes | 351 (13.8%) | 16 (1.3%) |
| 90 or more Minutes | 107 (4.2%) | 8 (0.6%) |
Time of Departure to Work by Sex in Lindsay
The most frequent times of departure to work in Lindsay are 12:00 AM to 4:59 AM (540, 21.2%) for males and 7:00 AM to 7:29 AM (314, 24.6%) for females.
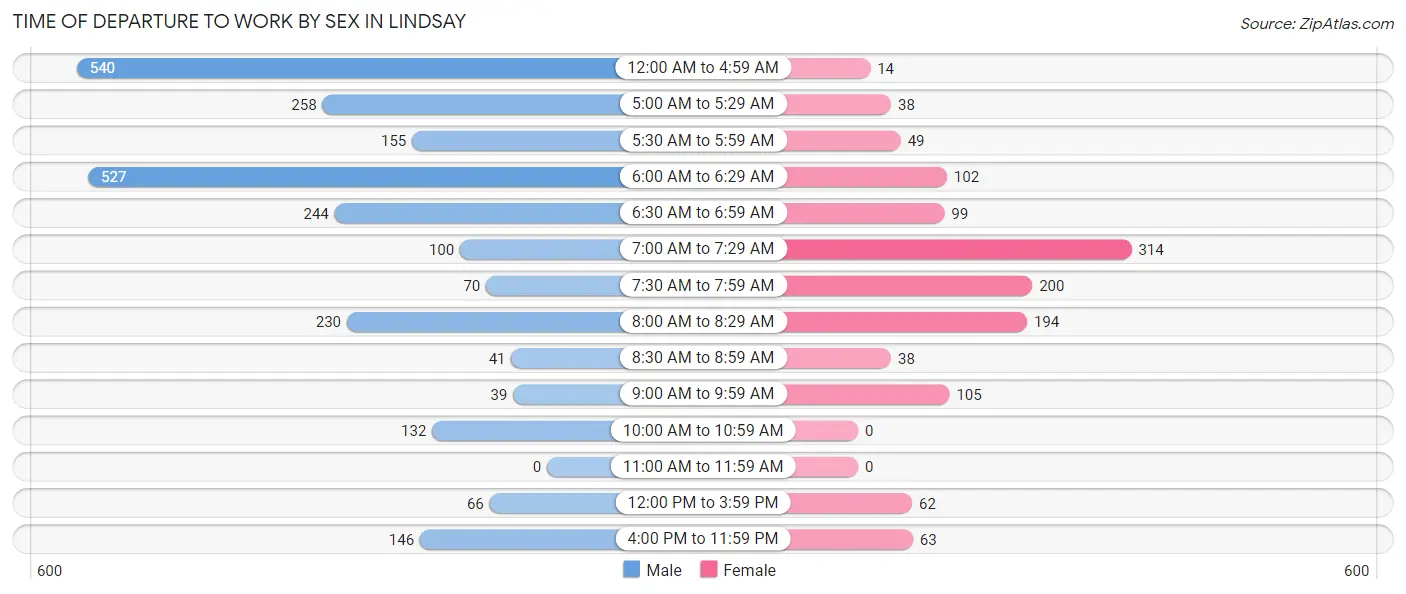
| Time of Departure | Male | Female |
| 12:00 AM to 4:59 AM | 540 (21.2%) | 14 (1.1%) |
| 5:00 AM to 5:29 AM | 258 (10.1%) | 38 (3.0%) |
| 5:30 AM to 5:59 AM | 155 (6.1%) | 49 (3.8%) |
| 6:00 AM to 6:29 AM | 527 (20.7%) | 102 (8.0%) |
| 6:30 AM to 6:59 AM | 244 (9.6%) | 99 (7.7%) |
| 7:00 AM to 7:29 AM | 100 (3.9%) | 314 (24.6%) |
| 7:30 AM to 7:59 AM | 70 (2.8%) | 200 (15.7%) |
| 8:00 AM to 8:29 AM | 230 (9.0%) | 194 (15.2%) |
| 8:30 AM to 8:59 AM | 41 (1.6%) | 38 (3.0%) |
| 9:00 AM to 9:59 AM | 39 (1.5%) | 105 (8.2%) |
| 10:00 AM to 10:59 AM | 132 (5.2%) | 0 (0.0%) |
| 11:00 AM to 11:59 AM | 0 (0.0%) | 0 (0.0%) |
| 12:00 PM to 3:59 PM | 66 (2.6%) | 62 (4.9%) |
| 4:00 PM to 11:59 PM | 146 (5.7%) | 63 (4.9%) |
| Total | 2,548 (100.0%) | 1,278 (100.0%) |
Housing Occupancy in Lindsay
Occupancy by Ownership in Lindsay
Of the total 3,627 dwellings in Lindsay, owner-occupied units account for 1,859 (51.2%), while renter-occupied units make up 1,768 (48.7%).
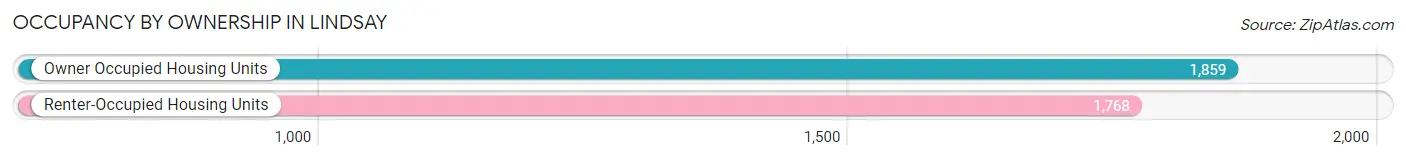
| Occupancy | # Housing Units | % Housing Units |
| Owner Occupied Housing Units | 1,859 | 51.2% |
| Renter-Occupied Housing Units | 1,768 | 48.7% |
| Total Occupied Housing Units | 3,627 | 100.0% |
Occupancy by Household Size in Lindsay
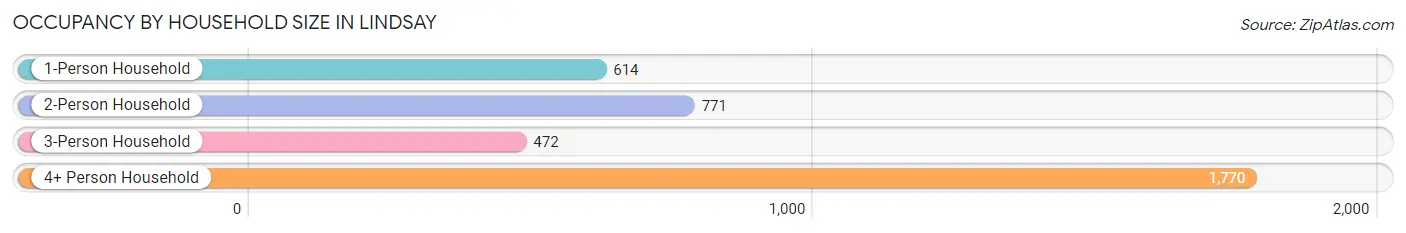
| Household Size | # Housing Units | % Housing Units |
| 1-Person Household | 614 | 16.9% |
| 2-Person Household | 771 | 21.3% |
| 3-Person Household | 472 | 13.0% |
| 4+ Person Household | 1,770 | 48.8% |
| Total Housing Units | 3,627 | 100.0% |
Occupancy by Ownership by Household Size in Lindsay
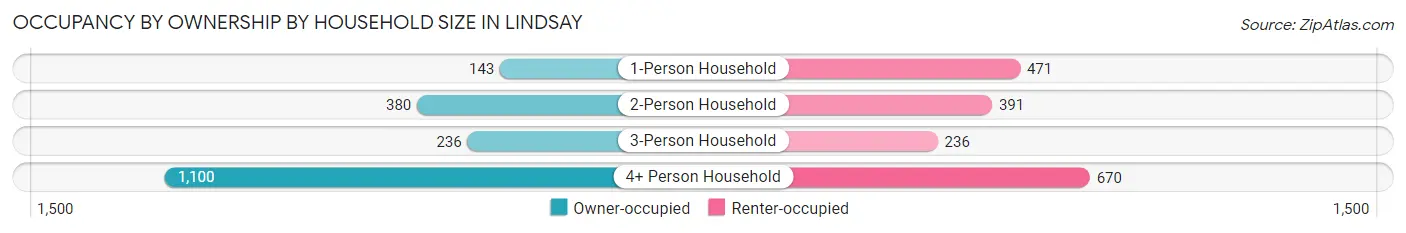
| Household Size | Owner-occupied | Renter-occupied |
| 1-Person Household | 143 (23.3%) | 471 (76.7%) |
| 2-Person Household | 380 (49.3%) | 391 (50.7%) |
| 3-Person Household | 236 (50.0%) | 236 (50.0%) |
| 4+ Person Household | 1,100 (62.2%) | 670 (37.9%) |
| Total Housing Units | 1,859 (51.2%) | 1,768 (48.7%) |
Occupancy by Educational Attainment in Lindsay
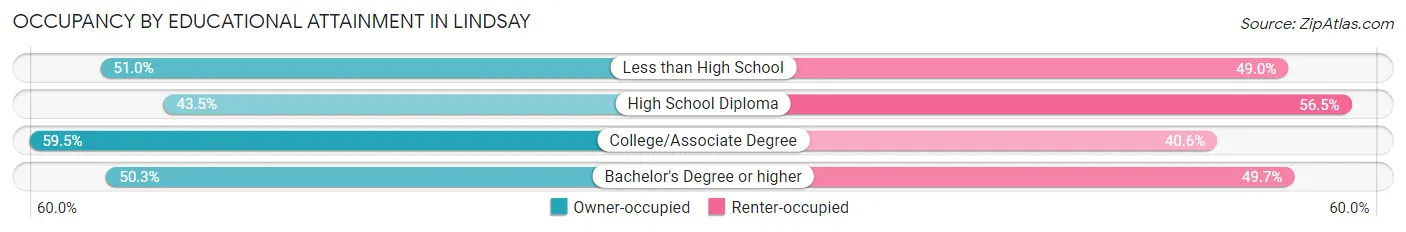
| Household Size | Owner-occupied | Renter-occupied |
| Less than High School | 772 (51.0%) | 742 (49.0%) |
| High School Diploma | 416 (43.5%) | 541 (56.5%) |
| College/Associate Degree | 582 (59.5%) | 397 (40.6%) |
| Bachelor's Degree or higher | 89 (50.3%) | 88 (49.7%) |
Occupancy by Age of Householder in Lindsay
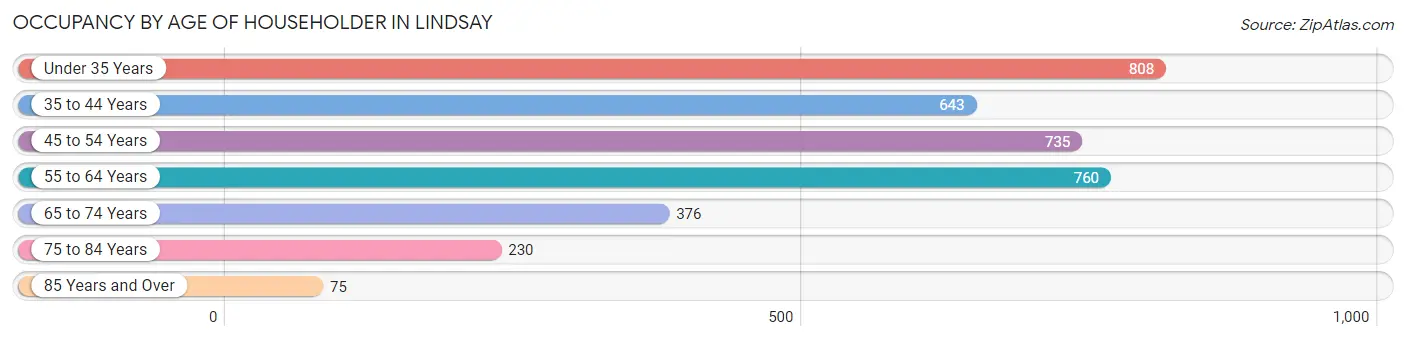
| Age Bracket | # Households | % Households |
| Under 35 Years | 808 | 22.3% |
| 35 to 44 Years | 643 | 17.7% |
| 45 to 54 Years | 735 | 20.3% |
| 55 to 64 Years | 760 | 20.9% |
| 65 to 74 Years | 376 | 10.4% |
| 75 to 84 Years | 230 | 6.3% |
| 85 Years and Over | 75 | 2.1% |
| Total | 3,627 | 100.0% |
Housing Finances in Lindsay
Median Income by Occupancy in Lindsay
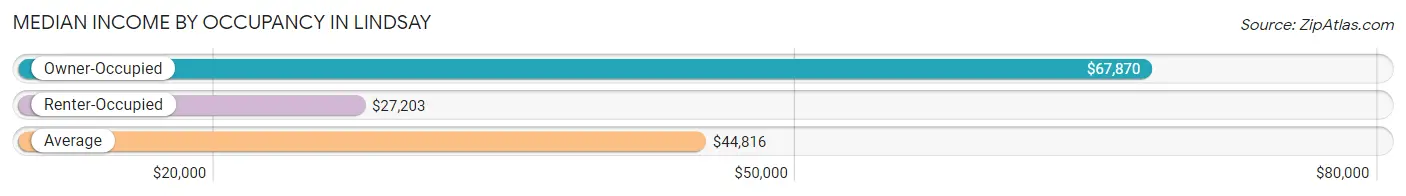
| Occupancy Type | # Households | Median Income |
| Owner-Occupied | 1,859 (51.2%) | $67,870 |
| Renter-Occupied | 1,768 (48.7%) | $27,203 |
| Average | 3,627 (100.0%) | $44,816 |
Occupancy by Householder Income Bracket in Lindsay
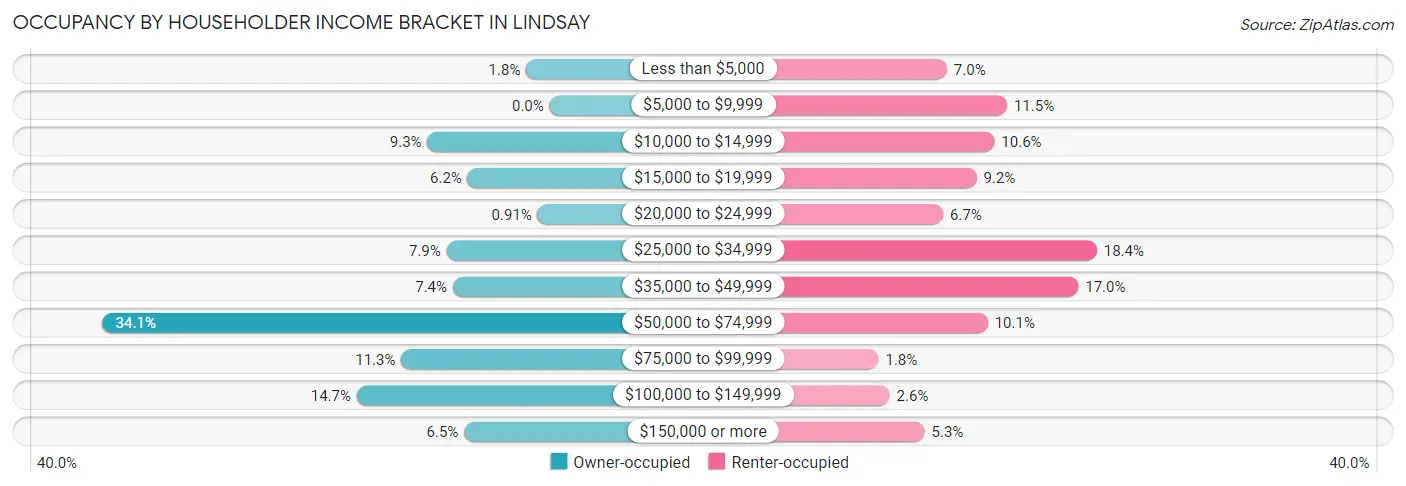
| Income Bracket | Owner-occupied | Renter-occupied |
| Less than $5,000 | 33 (1.8%) | 123 (7.0%) |
| $5,000 to $9,999 | 0 (0.0%) | 204 (11.5%) |
| $10,000 to $14,999 | 173 (9.3%) | 187 (10.6%) |
| $15,000 to $19,999 | 116 (6.2%) | 163 (9.2%) |
| $20,000 to $24,999 | 17 (0.9%) | 118 (6.7%) |
| $25,000 to $34,999 | 146 (7.9%) | 325 (18.4%) |
| $35,000 to $49,999 | 137 (7.4%) | 300 (17.0%) |
| $50,000 to $74,999 | 633 (34.1%) | 178 (10.1%) |
| $75,000 to $99,999 | 210 (11.3%) | 31 (1.8%) |
| $100,000 to $149,999 | 273 (14.7%) | 46 (2.6%) |
| $150,000 or more | 121 (6.5%) | 93 (5.3%) |
| Total | 1,859 (100.0%) | 1,768 (100.0%) |
Monthly Housing Cost Tiers in Lindsay
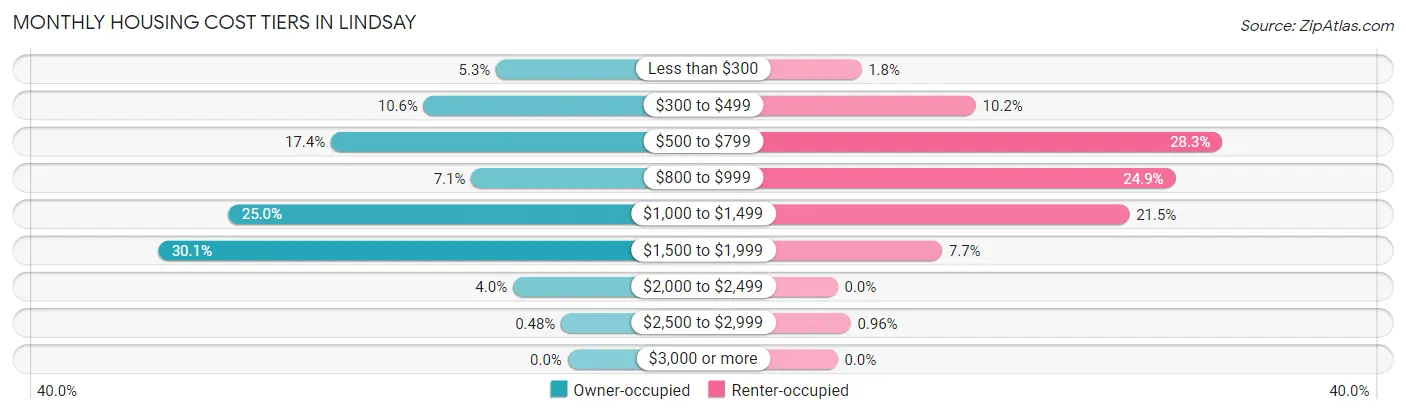
| Monthly Cost | Owner-occupied | Renter-occupied |
| Less than $300 | 98 (5.3%) | 31 (1.8%) |
| $300 to $499 | 197 (10.6%) | 180 (10.2%) |
| $500 to $799 | 324 (17.4%) | 501 (28.3%) |
| $800 to $999 | 132 (7.1%) | 440 (24.9%) |
| $1,000 to $1,499 | 464 (25.0%) | 380 (21.5%) |
| $1,500 to $1,999 | 560 (30.1%) | 136 (7.7%) |
| $2,000 to $2,499 | 75 (4.0%) | 0 (0.0%) |
| $2,500 to $2,999 | 9 (0.5%) | 17 (1.0%) |
| $3,000 or more | 0 (0.0%) | 0 (0.0%) |
| Total | 1,859 (100.0%) | 1,768 (100.0%) |
Physical Housing Characteristics in Lindsay
Housing Structures in Lindsay
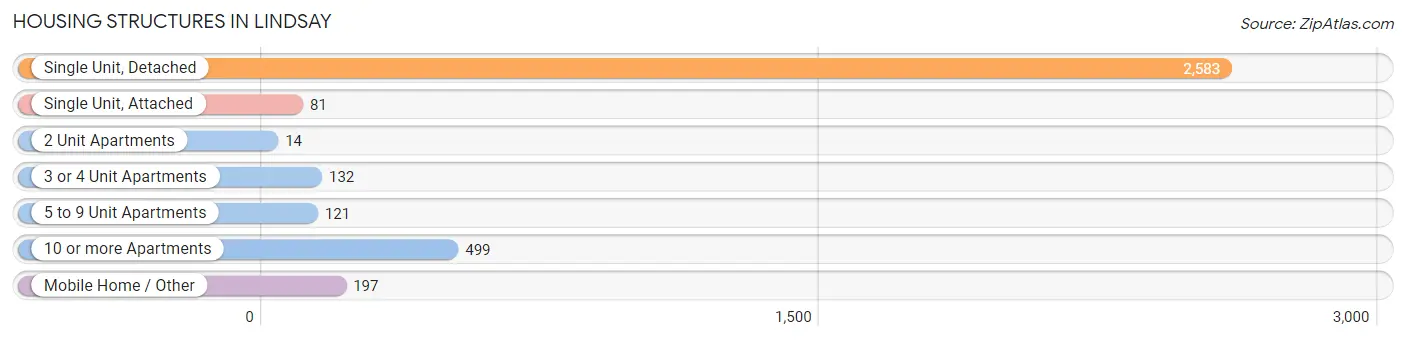
| Structure Type | # Housing Units | % Housing Units |
| Single Unit, Detached | 2,583 | 71.2% |
| Single Unit, Attached | 81 | 2.2% |
| 2 Unit Apartments | 14 | 0.4% |
| 3 or 4 Unit Apartments | 132 | 3.6% |
| 5 to 9 Unit Apartments | 121 | 3.3% |
| 10 or more Apartments | 499 | 13.8% |
| Mobile Home / Other | 197 | 5.4% |
| Total | 3,627 | 100.0% |
Housing Structures by Occupancy in Lindsay
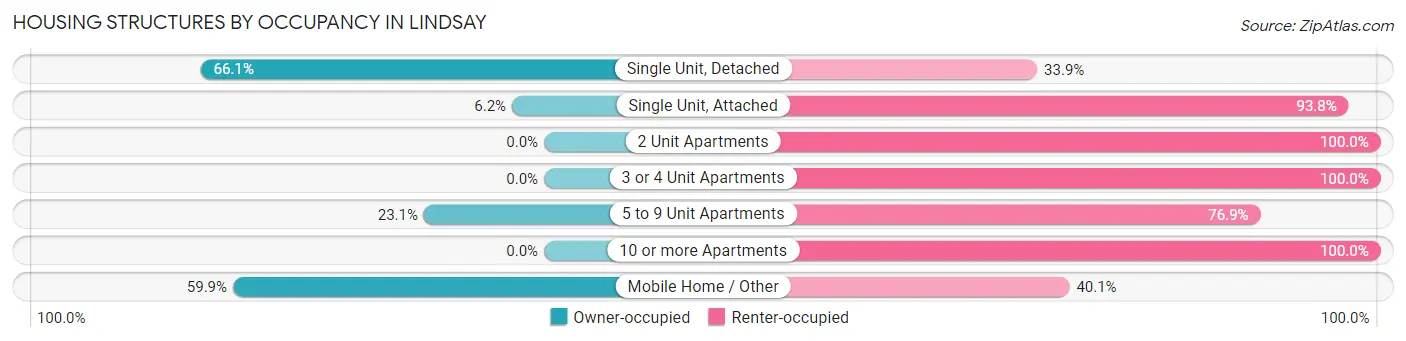
| Structure Type | Owner-occupied | Renter-occupied |
| Single Unit, Detached | 1,708 (66.1%) | 875 (33.9%) |
| Single Unit, Attached | 5 (6.2%) | 76 (93.8%) |
| 2 Unit Apartments | 0 (0.0%) | 14 (100.0%) |
| 3 or 4 Unit Apartments | 0 (0.0%) | 132 (100.0%) |
| 5 to 9 Unit Apartments | 28 (23.1%) | 93 (76.9%) |
| 10 or more Apartments | 0 (0.0%) | 499 (100.0%) |
| Mobile Home / Other | 118 (59.9%) | 79 (40.1%) |
| Total | 1,859 (51.2%) | 1,768 (48.7%) |
Housing Structures by Number of Rooms in Lindsay
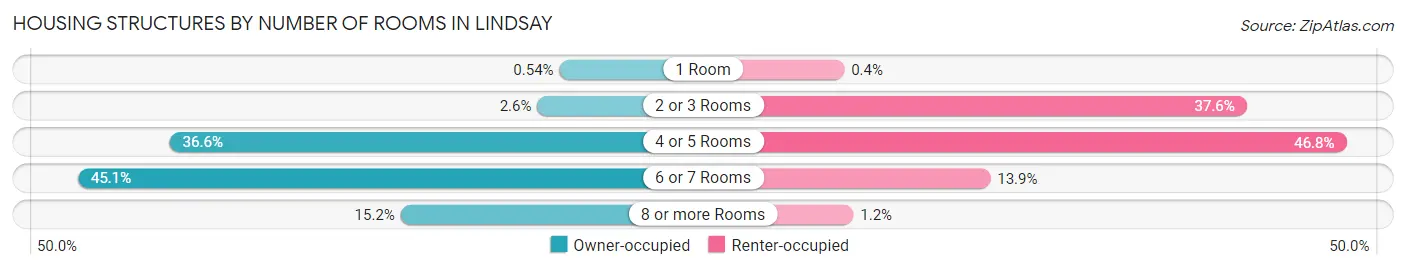
| Number of Rooms | Owner-occupied | Renter-occupied |
| 1 Room | 10 (0.5%) | 7 (0.4%) |
| 2 or 3 Rooms | 48 (2.6%) | 665 (37.6%) |
| 4 or 5 Rooms | 680 (36.6%) | 828 (46.8%) |
| 6 or 7 Rooms | 838 (45.1%) | 246 (13.9%) |
| 8 or more Rooms | 283 (15.2%) | 22 (1.2%) |
| Total | 1,859 (100.0%) | 1,768 (100.0%) |
Housing Structure by Heating Type in Lindsay
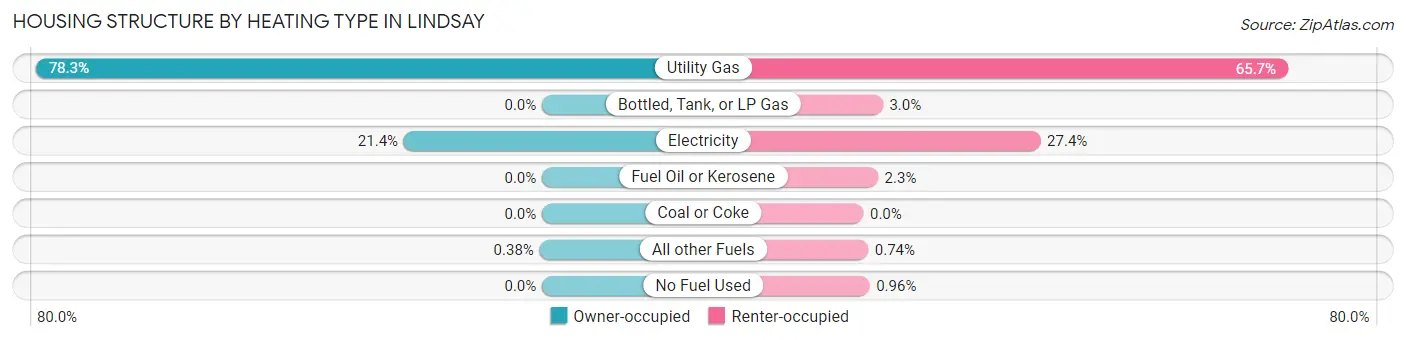
| Heating Type | Owner-occupied | Renter-occupied |
| Utility Gas | 1,455 (78.3%) | 1,161 (65.7%) |
| Bottled, Tank, or LP Gas | 0 (0.0%) | 53 (3.0%) |
| Electricity | 397 (21.4%) | 484 (27.4%) |
| Fuel Oil or Kerosene | 0 (0.0%) | 40 (2.3%) |
| Coal or Coke | 0 (0.0%) | 0 (0.0%) |
| All other Fuels | 7 (0.4%) | 13 (0.7%) |
| No Fuel Used | 0 (0.0%) | 17 (1.0%) |
| Total | 1,859 (100.0%) | 1,768 (100.0%) |
Household Vehicle Usage in Lindsay
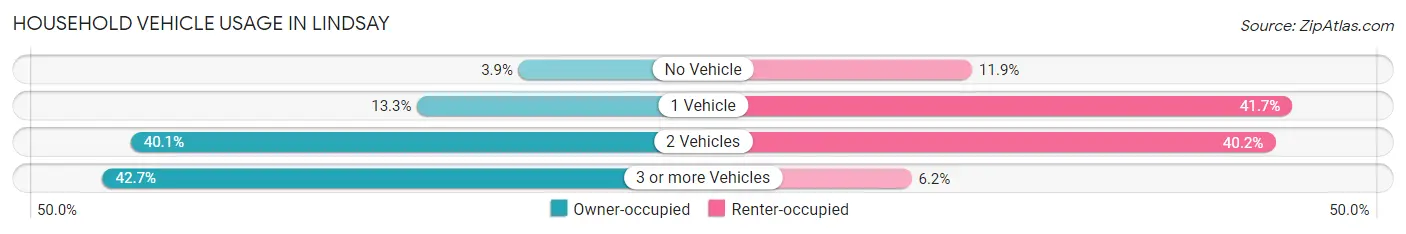
| Vehicles per Household | Owner-occupied | Renter-occupied |
| No Vehicle | 72 (3.9%) | 210 (11.9%) |
| 1 Vehicle | 248 (13.3%) | 738 (41.7%) |
| 2 Vehicles | 745 (40.1%) | 710 (40.2%) |
| 3 or more Vehicles | 794 (42.7%) | 110 (6.2%) |
| Total | 1,859 (100.0%) | 1,768 (100.0%) |
Real Estate & Mortgages in Lindsay
Real Estate and Mortgage Overview in Lindsay
| Characteristic | Without Mortgage | With Mortgage |
| Housing Units | 559 | 1,300 |
| Median Property Value | $235,300 | $266,000 |
| Median Household Income | $56,504 | $89 |
| Monthly Housing Costs | $483 | $0 |
| Real Estate Taxes | $1,207 | $106 |
Property Value by Mortgage Status in Lindsay
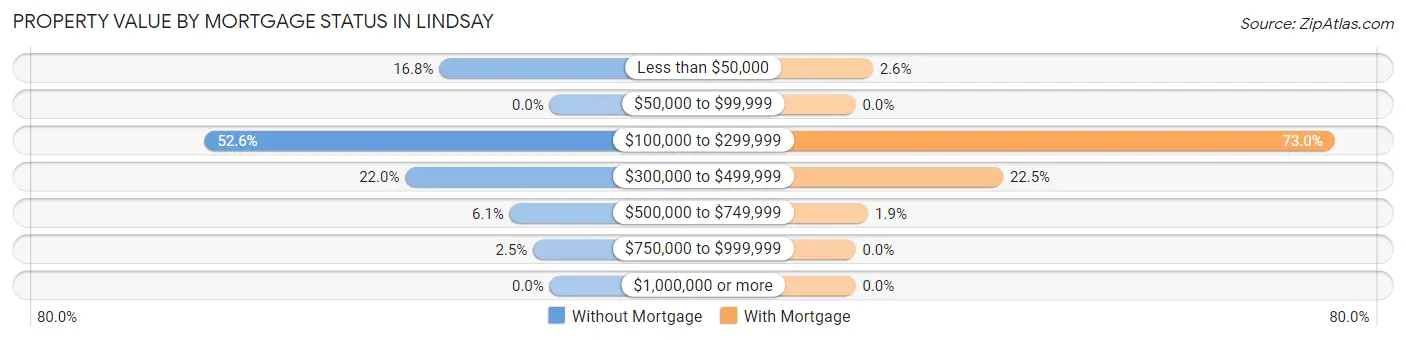
| Property Value | Without Mortgage | With Mortgage |
| Less than $50,000 | 94 (16.8%) | 34 (2.6%) |
| $50,000 to $99,999 | 0 (0.0%) | 0 (0.0%) |
| $100,000 to $299,999 | 294 (52.6%) | 949 (73.0%) |
| $300,000 to $499,999 | 123 (22.0%) | 292 (22.5%) |
| $500,000 to $749,999 | 34 (6.1%) | 25 (1.9%) |
| $750,000 to $999,999 | 14 (2.5%) | 0 (0.0%) |
| $1,000,000 or more | 0 (0.0%) | 0 (0.0%) |
| Total | 559 (100.0%) | 1,300 (100.0%) |
Household Income by Mortgage Status in Lindsay
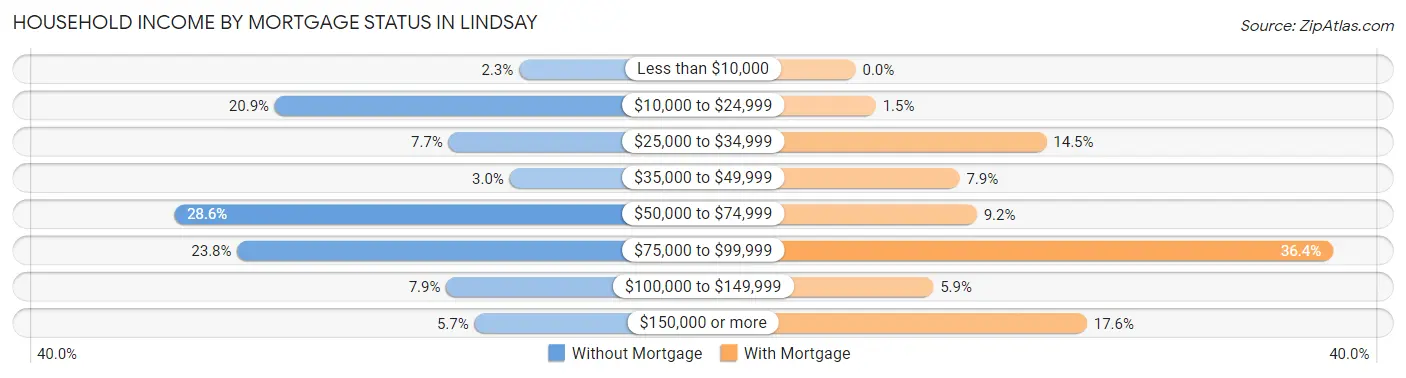
| Household Income | Without Mortgage | With Mortgage |
| Less than $10,000 | 13 (2.3%) | 0 (0.0%) |
| $10,000 to $24,999 | 117 (20.9%) | 20 (1.5%) |
| $25,000 to $34,999 | 43 (7.7%) | 189 (14.5%) |
| $35,000 to $49,999 | 17 (3.0%) | 103 (7.9%) |
| $50,000 to $74,999 | 160 (28.6%) | 120 (9.2%) |
| $75,000 to $99,999 | 133 (23.8%) | 473 (36.4%) |
| $100,000 to $149,999 | 44 (7.9%) | 77 (5.9%) |
| $150,000 or more | 32 (5.7%) | 229 (17.6%) |
| Total | 559 (100.0%) | 1,300 (100.0%) |
Property Value to Household Income Ratio in Lindsay
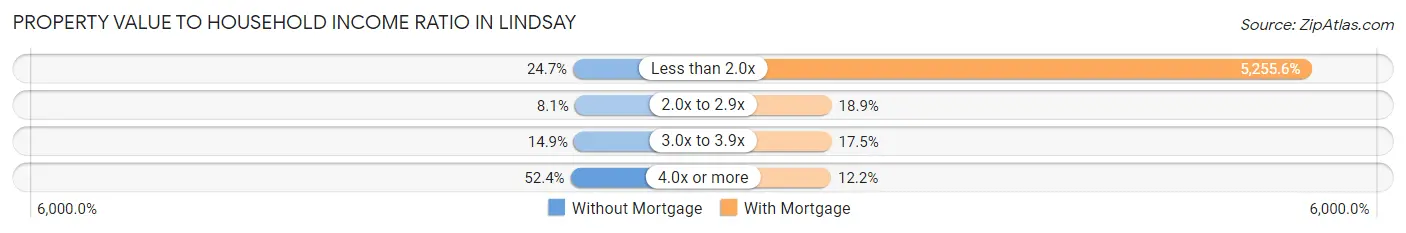
| Value-to-Income Ratio | Without Mortgage | With Mortgage |
| Less than 2.0x | 138 (24.7%) | 68,323 (5,255.6%) |
| 2.0x to 2.9x | 45 (8.1%) | 245 (18.9%) |
| 3.0x to 3.9x | 83 (14.8%) | 227 (17.5%) |
| 4.0x or more | 293 (52.4%) | 158 (12.1%) |
| Total | 559 (100.0%) | 1,300 (100.0%) |
Real Estate Taxes by Mortgage Status in Lindsay
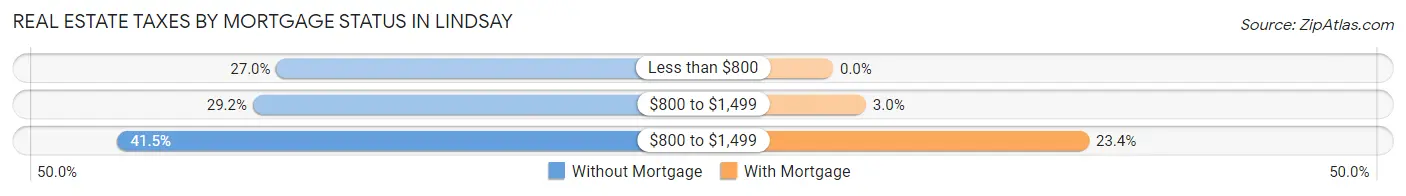
| Property Taxes | Without Mortgage | With Mortgage |
| Less than $800 | 151 (27.0%) | 0 (0.0%) |
| $800 to $1,499 | 163 (29.2%) | 39 (3.0%) |
| $800 to $1,499 | 232 (41.5%) | 304 (23.4%) |
| Total | 559 (100.0%) | 1,300 (100.0%) |
Health & Disability in Lindsay
Health Insurance Coverage by Age in Lindsay
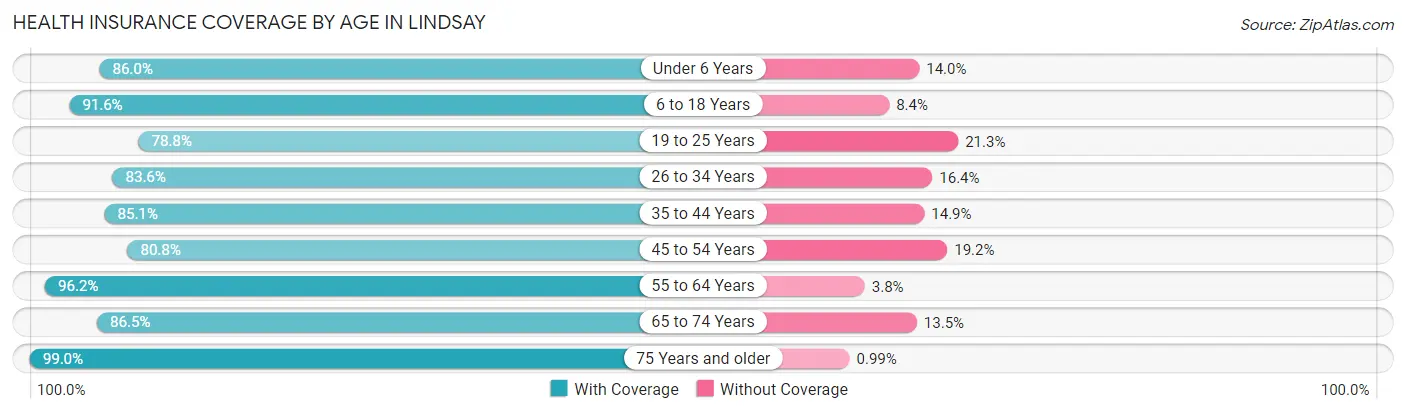
| Age Bracket | With Coverage | Without Coverage |
| Under 6 Years | 1,089 (86.0%) | 177 (14.0%) |
| 6 to 18 Years | 2,823 (91.6%) | 258 (8.4%) |
| 19 to 25 Years | 1,230 (78.7%) | 332 (21.2%) |
| 26 to 34 Years | 1,191 (83.6%) | 234 (16.4%) |
| 35 to 44 Years | 940 (85.1%) | 165 (14.9%) |
| 45 to 54 Years | 1,333 (80.8%) | 317 (19.2%) |
| 55 to 64 Years | 1,155 (96.2%) | 46 (3.8%) |
| 65 to 74 Years | 600 (86.5%) | 94 (13.5%) |
| 75 Years and older | 501 (99.0%) | 5 (1.0%) |
| Total | 10,862 (87.0%) | 1,628 (13.0%) |
Health Insurance Coverage by Citizenship Status in Lindsay
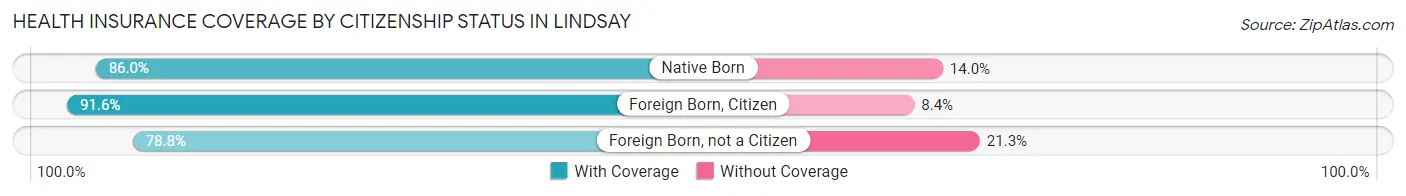
| Citizenship Status | With Coverage | Without Coverage |
| Native Born | 1,089 (86.0%) | 177 (14.0%) |
| Foreign Born, Citizen | 2,823 (91.6%) | 258 (8.4%) |
| Foreign Born, not a Citizen | 1,230 (78.7%) | 332 (21.2%) |
Health Insurance Coverage by Household Income in Lindsay
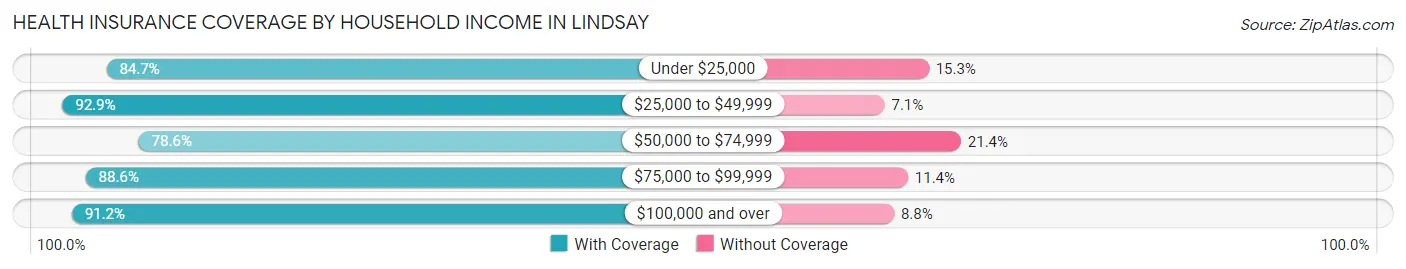
| Household Income | With Coverage | Without Coverage |
| Under $25,000 | 2,720 (84.7%) | 493 (15.3%) |
| $25,000 to $49,999 | 2,890 (92.9%) | 220 (7.1%) |
| $50,000 to $74,999 | 2,212 (78.6%) | 601 (21.4%) |
| $75,000 to $99,999 | 604 (88.6%) | 78 (11.4%) |
| $100,000 and over | 2,436 (91.2%) | 236 (8.8%) |
Public vs Private Health Insurance Coverage by Age in Lindsay
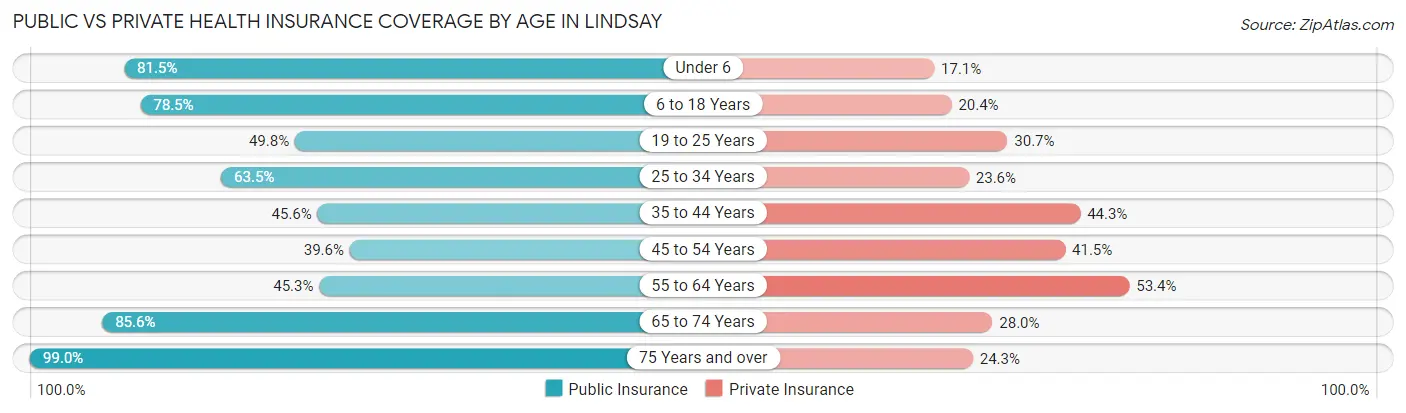
| Age Bracket | Public Insurance | Private Insurance |
| Under 6 | 1,032 (81.5%) | 217 (17.1%) |
| 6 to 18 Years | 2,419 (78.5%) | 627 (20.3%) |
| 19 to 25 Years | 778 (49.8%) | 480 (30.7%) |
| 25 to 34 Years | 905 (63.5%) | 336 (23.6%) |
| 35 to 44 Years | 504 (45.6%) | 489 (44.3%) |
| 45 to 54 Years | 654 (39.6%) | 684 (41.4%) |
| 55 to 64 Years | 544 (45.3%) | 641 (53.4%) |
| 65 to 74 Years | 594 (85.6%) | 194 (28.0%) |
| 75 Years and over | 501 (99.0%) | 123 (24.3%) |
| Total | 7,931 (63.5%) | 3,791 (30.3%) |
Disability Status by Sex by Age in Lindsay
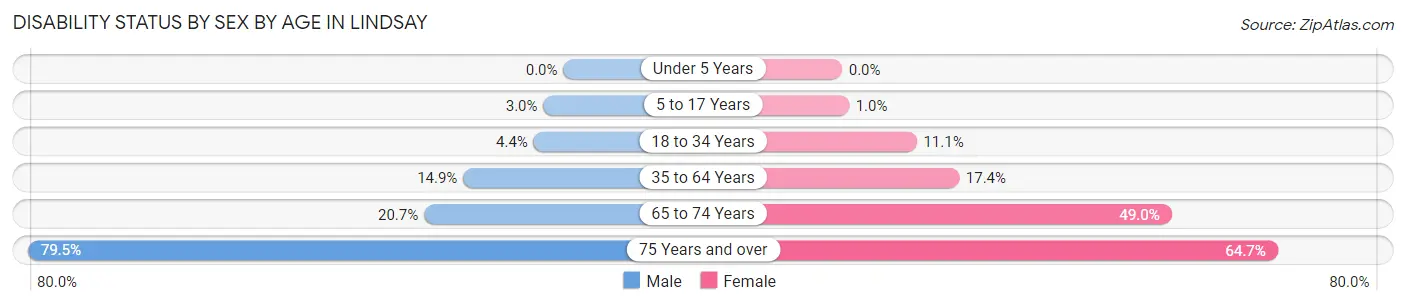
| Age Bracket | Male | Female |
| Under 5 Years | 0 (0.0%) | 0 (0.0%) |
| 5 to 17 Years | 51 (3.0%) | 17 (1.0%) |
| 18 to 34 Years | 75 (4.4%) | 161 (11.1%) |
| 35 to 64 Years | 312 (14.9%) | 323 (17.4%) |
| 65 to 74 Years | 54 (20.7%) | 212 (49.0%) |
| 75 Years and over | 132 (79.5%) | 220 (64.7%) |
Disability Class by Sex by Age in Lindsay
Disability Class: Hearing Difficulty
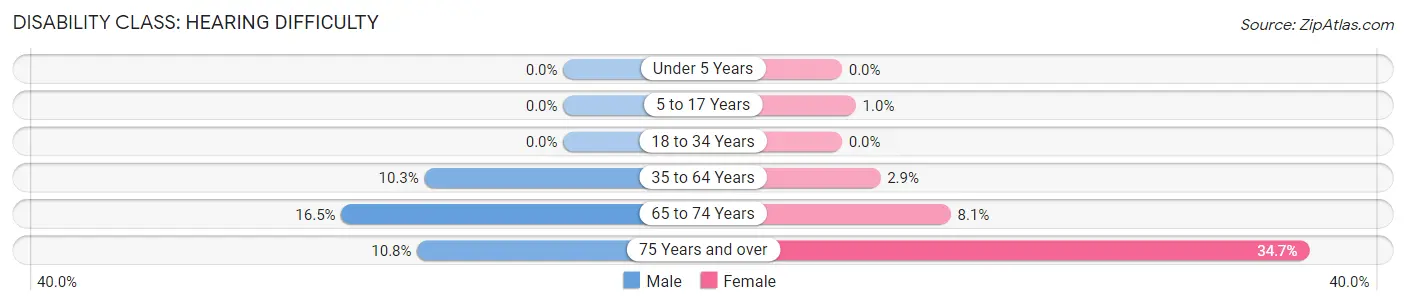
| Age Bracket | Male | Female |
| Under 5 Years | 0 (0.0%) | 0 (0.0%) |
| 5 to 17 Years | 0 (0.0%) | 17 (1.0%) |
| 18 to 34 Years | 0 (0.0%) | 0 (0.0%) |
| 35 to 64 Years | 216 (10.3%) | 53 (2.9%) |
| 65 to 74 Years | 43 (16.5%) | 35 (8.1%) |
| 75 Years and over | 18 (10.8%) | 118 (34.7%) |
Disability Class: Vision Difficulty
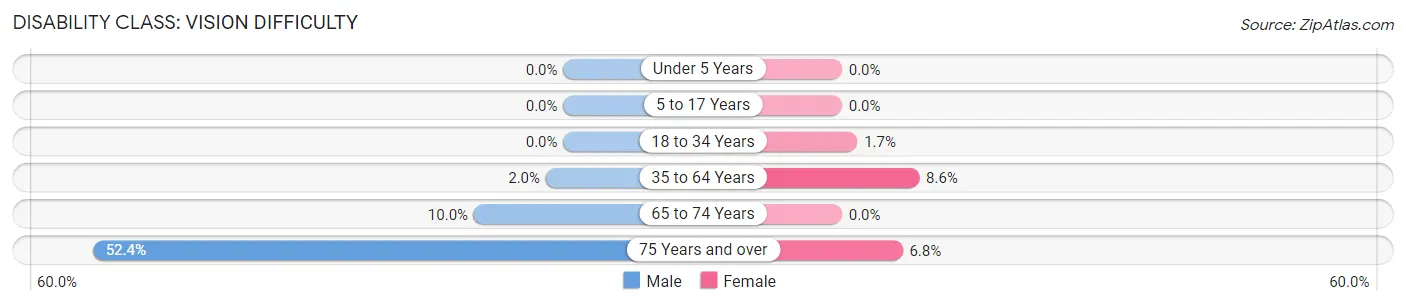
| Age Bracket | Male | Female |
| Under 5 Years | 0 (0.0%) | 0 (0.0%) |
| 5 to 17 Years | 0 (0.0%) | 0 (0.0%) |
| 18 to 34 Years | 0 (0.0%) | 25 (1.7%) |
| 35 to 64 Years | 41 (1.9%) | 160 (8.6%) |
| 65 to 74 Years | 26 (10.0%) | 0 (0.0%) |
| 75 Years and over | 87 (52.4%) | 23 (6.8%) |
Disability Class: Cognitive Difficulty
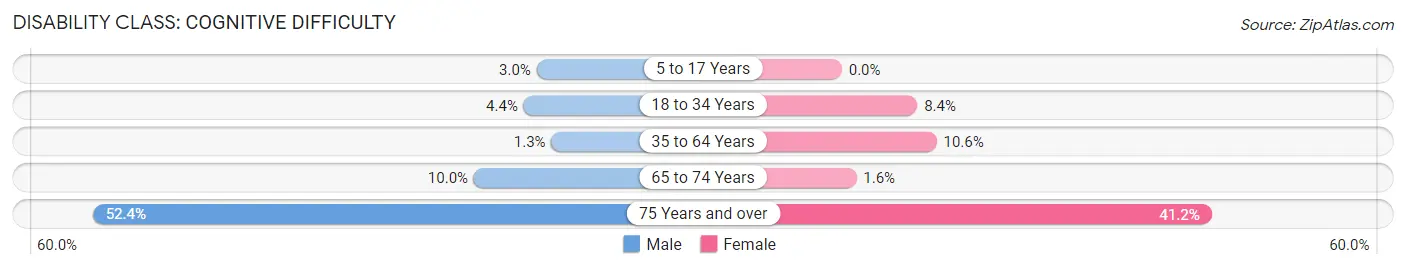
| Age Bracket | Male | Female |
| 5 to 17 Years | 51 (3.0%) | 0 (0.0%) |
| 18 to 34 Years | 75 (4.4%) | 122 (8.4%) |
| 35 to 64 Years | 28 (1.3%) | 196 (10.5%) |
| 65 to 74 Years | 26 (10.0%) | 7 (1.6%) |
| 75 Years and over | 87 (52.4%) | 140 (41.2%) |
Disability Class: Ambulatory Difficulty
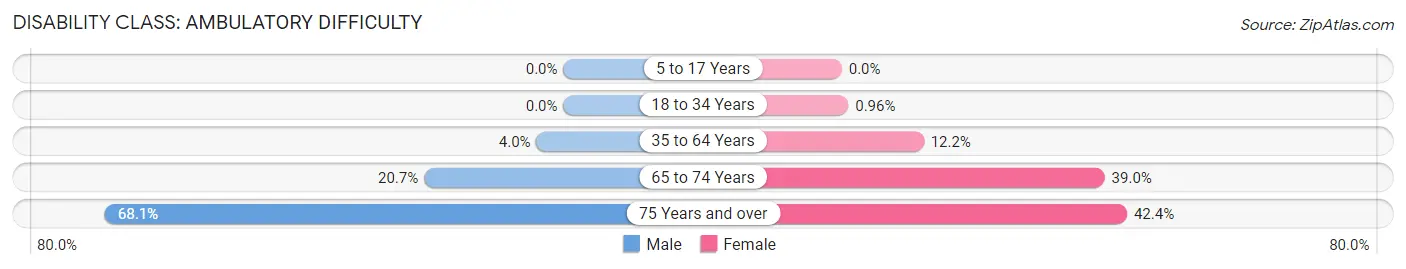
| Age Bracket | Male | Female |
| 5 to 17 Years | 0 (0.0%) | 0 (0.0%) |
| 18 to 34 Years | 0 (0.0%) | 14 (1.0%) |
| 35 to 64 Years | 84 (4.0%) | 226 (12.2%) |
| 65 to 74 Years | 54 (20.7%) | 169 (39.0%) |
| 75 Years and over | 113 (68.1%) | 144 (42.3%) |
Disability Class: Self-Care Difficulty
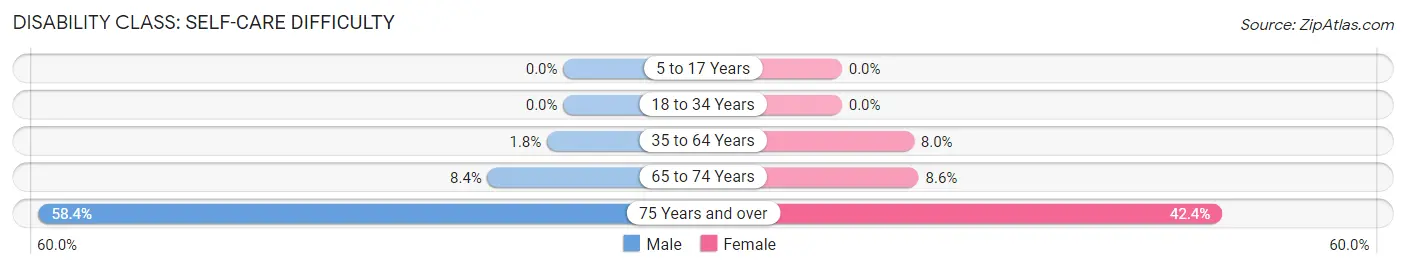
| Age Bracket | Male | Female |
| 5 to 17 Years | 0 (0.0%) | 0 (0.0%) |
| 18 to 34 Years | 0 (0.0%) | 0 (0.0%) |
| 35 to 64 Years | 38 (1.8%) | 149 (8.0%) |
| 65 to 74 Years | 22 (8.4%) | 37 (8.6%) |
| 75 Years and over | 97 (58.4%) | 144 (42.3%) |
Technology Access in Lindsay
Computing Device Access in Lindsay
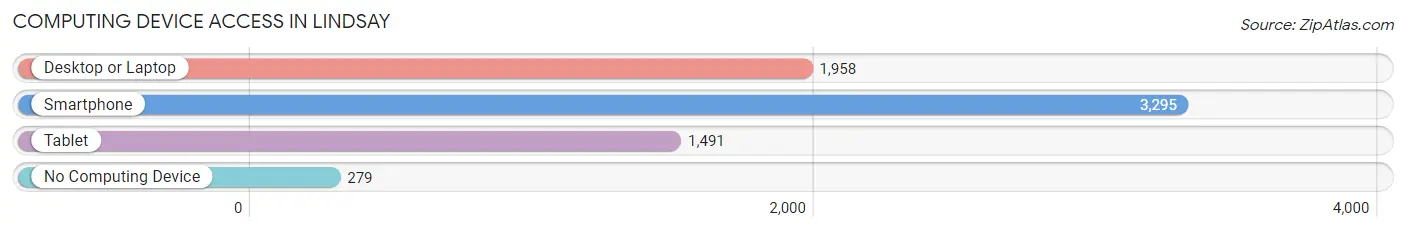
| Device Type | # Households | % Households |
| Desktop or Laptop | 1,958 | 54.0% |
| Smartphone | 3,295 | 90.8% |
| Tablet | 1,491 | 41.1% |
| No Computing Device | 279 | 7.7% |
| Total | 3,627 | 100.0% |
Internet Access in Lindsay
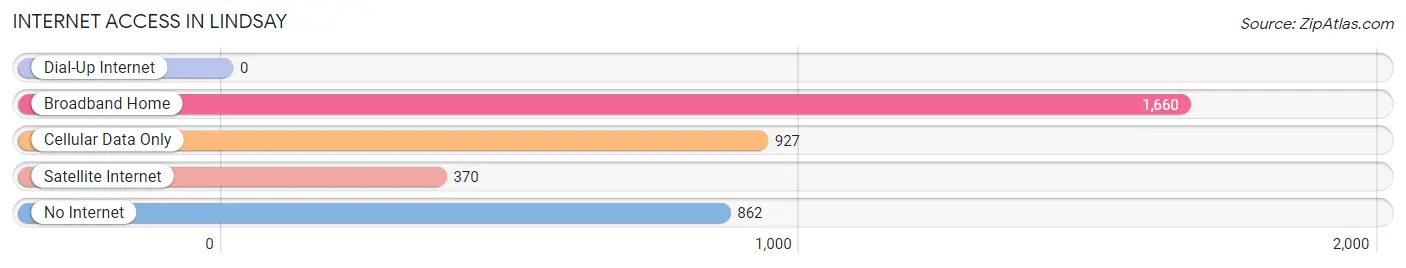
| Internet Type | # Households | % Households |
| Dial-Up Internet | 0 | 0.0% |
| Broadband Home | 1,660 | 45.8% |
| Cellular Data Only | 927 | 25.6% |
| Satellite Internet | 370 | 10.2% |
| No Internet | 862 | 23.8% |
| Total | 3,627 | 100.0% |
Lindsay Summary
Lindsay is a small city located in Tulare County, California, United States. It is situated in the San Joaquin Valley, approximately 8 miles (13 km) south of Visalia and 8 miles (13 km) north of Porterville. The population was 11,768 at the 2010 census.
History
The area that is now Lindsay was originally inhabited by the Yokuts people. The first European settlers arrived in the area in the late 1800s, and the city was officially founded in 1908. The city was named after the railroad engineer, Thomas Lindsay, who was responsible for the construction of the railroad line that ran through the area.
In the early 1900s, the city was a major agricultural center, with many of the local farmers growing cotton, wheat, and other crops. The city was also home to a number of dairies, which provided milk and other dairy products to the local population.
In the 1950s, the city began to experience a population boom, as many people moved to the area to take advantage of the booming agricultural industry. This population growth continued into the 1960s and 1970s, and the city experienced a period of rapid growth and development.
Geography
Lindsay is located at 36°20'17" North, 119°7'17" West (36.338, -119.121). It is situated in the San Joaquin Valley, approximately 8 miles (13 km) south of Visalia and 8 miles (13 km) north of Porterville.
The city has a total area of 4.2 square miles (10.8 km2), all of which is land. The terrain is mostly flat, with some rolling hills in the northern part of the city. The climate is hot and dry, with temperatures ranging from the mid-90s in the summer to the mid-50s in the winter.
Economy
The economy of Lindsay is largely based on agriculture. The city is home to a number of large farms, which produce a variety of crops, including cotton, wheat, and other grains. The city is also home to a number of dairies, which provide milk and other dairy products to the local population.
In addition to agriculture, the city is also home to a number of small businesses, including restaurants, retail stores, and other services. The city is also home to a number of manufacturing companies, which produce a variety of products, including furniture, clothing, and other items.
Demographics
As of the 2010 census, there were 11,768 people, 3,845 households, and 2,845 families residing in the city. The population density was 2,817.3 people per square mile (1,091.2/km2). There were 4,093 housing units at an average density of 983.2 per square mile (380.2/km2). The racial makeup of the city was 63.2% White, 1.2% African American, 1.2% Native American, 0.7% Asian, 0.1% Pacific Islander, 30.3% from other races, and 3.3% from two or more races. Hispanic or Latino of any race were 57.2% of the population.
There were 3,845 households, out of which 39.2% had children under the age of 18 living with them, 51.2% were married couples living together, 15.2% had a female householder with no husband present, and 27.2% were non-families. 22.2% of all households were made up of individuals, and 10.2% had someone living alone who was 65 years of age or older. The average household size was 3.04 and the average family size was 3.56.
In the city, the population was spread out, with 32.2% under the age of 18, 10.2% from 18 to 24, 26.2% from 25 to 44, 19.2% from 45 to 64, and 12.2% who were 65 years of age or older. The median age was 31 years. For every 100 females, there were 95.2 males. For every 100 females age 18 and over, there were 91.2 males.
The median income for a household in the city was $30,938, and the median income for a family was $35,938. Males had a median income of $30,938 versus $21,938 for females. The per capita income for the city was $13,938. About 17.2% of families and 20.2% of the population were below the poverty line, including 28.2% of those under age 18 and 11.2% of those age 65 or over.
Common Questions
What is Per Capita Income in Lindsay?
Per Capita income in Lindsay is $19,059.
What is the Median Family Income in Lindsay?
Median Family Income in Lindsay is $51,679.
What is the Median Household income in Lindsay?
Median Household Income in Lindsay is $44,816.
What is Income or Wage Gap in Lindsay?
Income or Wage Gap in Lindsay is 12.1%.
Women in Lindsay earn 87.9 cents for every dollar earned by a man.
What is Family Income Deficit in Lindsay?
Family Income Deficit in Lindsay is $15,474.
Families that are below poverty line in Lindsay earn $15,474 less on average than the poverty threshold level.
What is Inequality or Gini Index in Lindsay?
Inequality or Gini Index in Lindsay is 0.52.
What is the Total Population of Lindsay?
Total Population of Lindsay is 12,581.
What is the Total Male Population of Lindsay?
Total Male Population of Lindsay is 6,461.
What is the Total Female Population of Lindsay?
Total Female Population of Lindsay is 6,120.
What is the Ratio of Males per 100 Females in Lindsay?
There are 105.57 Males per 100 Females in Lindsay.
What is the Ratio of Females per 100 Males in Lindsay?
There are 94.72 Females per 100 Males in Lindsay.
What is the Median Population Age in Lindsay?
Median Population Age in Lindsay is 27.8 Years.
What is the Average Family Size in Lindsay
Average Family Size in Lindsay is 3.9 People.
What is the Average Household Size in Lindsay
Average Household Size in Lindsay is 3.4 People.
How Large is the Labor Force in Lindsay?
There are 5,137 People in the Labor Forcein in Lindsay.
What is the Percentage of People in the Labor Force in Lindsay?
58.0% of People are in the Labor Force in Lindsay.
What is the Unemployment Rate in Lindsay?
Unemployment Rate in Lindsay is 17.1%.