Leona Valley, CA Map & Demographics
Leona Valley Map
Leona Valley Overview
$50,444
PER CAPITA INCOME
$127,969
AVG FAMILY INCOME
$115,611
AVG HOUSEHOLD INCOME
5.8%
WAGE / INCOME GAP [ % ]
94.2¢/ $1
WAGE / INCOME GAP [ $ ]
0.41
INEQUALITY / GINI INDEX
1,569
TOTAL POPULATION
754
MALE POPULATION
815
FEMALE POPULATION
92.52
MALES / 100 FEMALES
108.09
FEMALES / 100 MALES
59.0
MEDIAN AGE
2.8
AVG FAMILY SIZE
2.6
AVG HOUSEHOLD SIZE
654
LABOR FORCE [ PEOPLE ]
49.4%
PERCENT IN LABOR FORCE
6.0%
UNEMPLOYMENT RATE
Leona Valley Area Codes
Income in Leona Valley
Income Overview in Leona Valley
Per Capita Income in Leona Valley is $50,444, while median incomes of families and households are $127,969 and $115,611 respectively.
| Characteristic | Number | Measure |
| Per Capita Income | 1,569 | $50,444 |
| Median Family Income | 481 | $127,969 |
| Mean Family Income | 481 | $144,349 |
| Median Household Income | 604 | $115,611 |
| Mean Household Income | 604 | $127,852 |
| Income Deficit | 481 | $0 |
| Wage / Income Gap (%) | 1,569 | 5.81% |
| Wage / Income Gap ($) | 1,569 | 94.19¢ per $1 |
| Gini / Inequality Index | 1,569 | 0.41 |
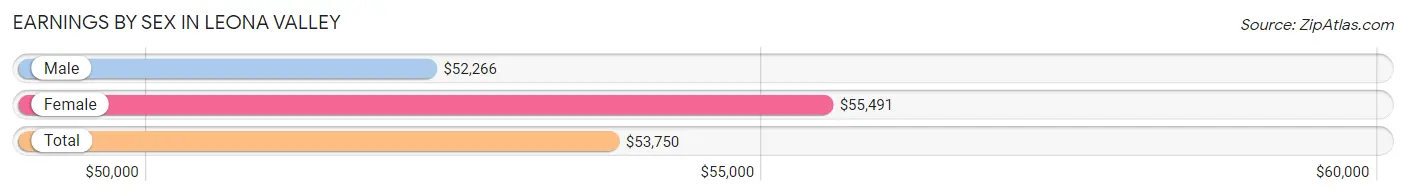
Earnings by Sex in Leona Valley
Average Earnings in Leona Valley are $53,750, $52,266 for men and $55,491 for women, a difference of 5.8%.
| Sex | Number | Average Earnings |
| Male | 396 (57.8%) | $52,266 |
| Female | 289 (42.2%) | $55,491 |
| Total | 685 (100.0%) | $53,750 |
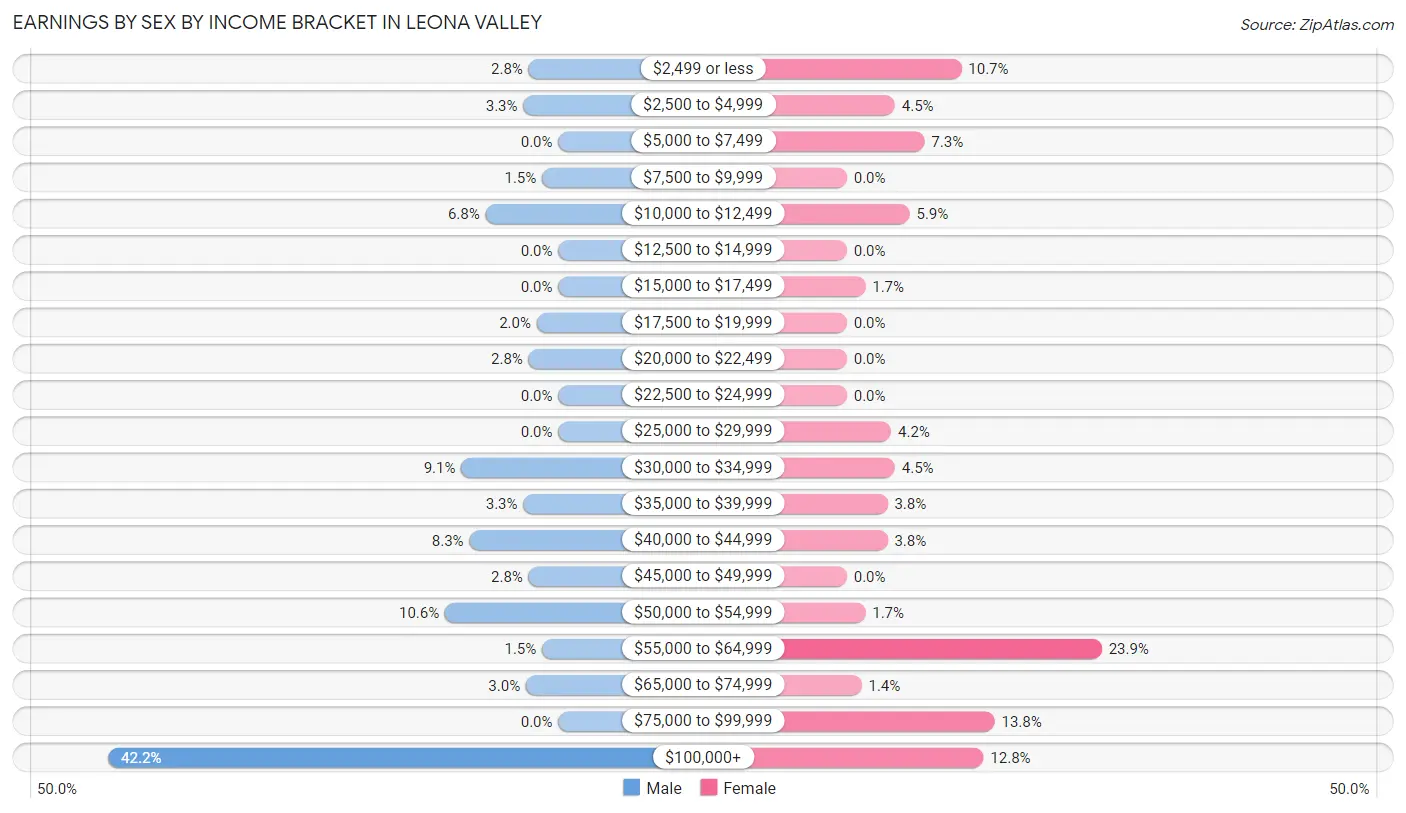
Earnings by Sex by Income Bracket in Leona Valley
The most common earnings brackets in Leona Valley are $100,000+ for men (167 | 42.2%) and $55,000 to $64,999 for women (69 | 23.9%).
| Income | Male | Female |
| $2,499 or less | 11 (2.8%) | 31 (10.7%) |
| $2,500 to $4,999 | 13 (3.3%) | 13 (4.5%) |
| $5,000 to $7,499 | 0 (0.0%) | 21 (7.3%) |
| $7,500 to $9,999 | 6 (1.5%) | 0 (0.0%) |
| $10,000 to $12,499 | 27 (6.8%) | 17 (5.9%) |
| $12,500 to $14,999 | 0 (0.0%) | 0 (0.0%) |
| $15,000 to $17,499 | 0 (0.0%) | 5 (1.7%) |
| $17,500 to $19,999 | 8 (2.0%) | 0 (0.0%) |
| $20,000 to $22,499 | 11 (2.8%) | 0 (0.0%) |
| $22,500 to $24,999 | 0 (0.0%) | 0 (0.0%) |
| $25,000 to $29,999 | 0 (0.0%) | 12 (4.2%) |
| $30,000 to $34,999 | 36 (9.1%) | 13 (4.5%) |
| $35,000 to $39,999 | 13 (3.3%) | 11 (3.8%) |
| $40,000 to $44,999 | 33 (8.3%) | 11 (3.8%) |
| $45,000 to $49,999 | 11 (2.8%) | 0 (0.0%) |
| $50,000 to $54,999 | 42 (10.6%) | 5 (1.7%) |
| $55,000 to $64,999 | 6 (1.5%) | 69 (23.9%) |
| $65,000 to $74,999 | 12 (3.0%) | 4 (1.4%) |
| $75,000 to $99,999 | 0 (0.0%) | 40 (13.8%) |
| $100,000+ | 167 (42.2%) | 37 (12.8%) |
| Total | 396 (100.0%) | 289 (100.0%) |
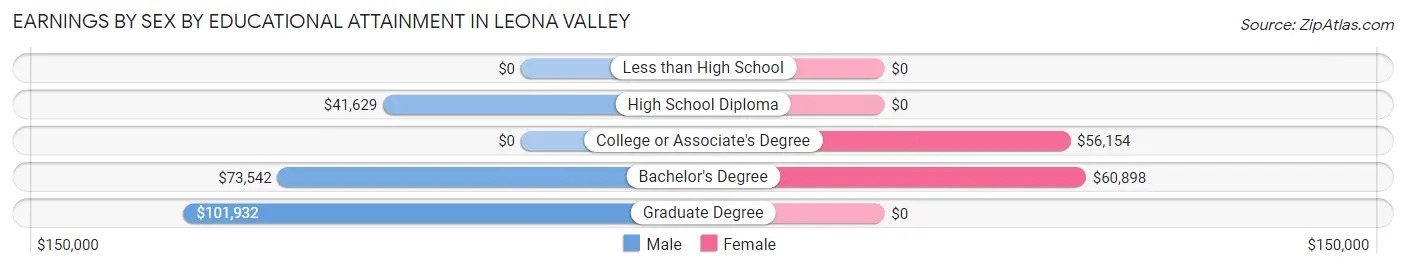
Earnings by Sex by Educational Attainment in Leona Valley
Average earnings in Leona Valley are $52,266 for men and $55,848 for women, a difference of 6.4%. Men with an educational attainment of graduate degree enjoy the highest average annual earnings of $101,932, while those with high school diploma education earn the least with $41,629. Women with an educational attainment of bachelor's degree earn the most with the average annual earnings of $60,898, while those with college or associate's degree education have the smallest earnings of $56,154.
| Educational Attainment | Male Income | Female Income |
| Less than High School | - | - |
| High School Diploma | $41,629 | $0 |
| College or Associate's Degree | - | - |
| Bachelor's Degree | $73,542 | $60,898 |
| Graduate Degree | $101,932 | $0 |
| Total | $52,266 | $55,848 |
Family Income in Leona Valley
Family Income Brackets in Leona Valley
According to the Leona Valley family income data, there are 114 families falling into the $100,000 to $149,999 income range, which is the most common income bracket and makes up 23.7% of all families.
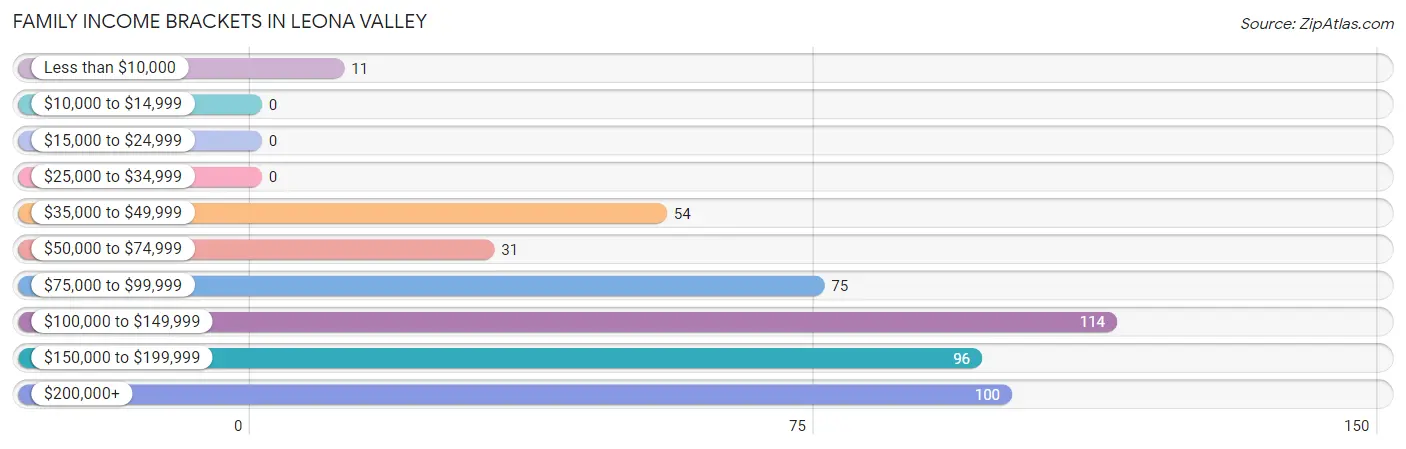
| Income Bracket | # Families | % Families |
| Less than $10,000 | 11 | 2.3% |
| $10,000 to $14,999 | 0 | 0.0% |
| $15,000 to $24,999 | 0 | 0.0% |
| $25,000 to $34,999 | 0 | 0.0% |
| $35,000 to $49,999 | 54 | 11.2% |
| $50,000 to $74,999 | 31 | 6.4% |
| $75,000 to $99,999 | 75 | 15.6% |
| $100,000 to $149,999 | 114 | 23.7% |
| $150,000 to $199,999 | 96 | 20.0% |
| $200,000+ | 100 | 20.8% |
Family Income by Famaliy Size in Leona Valley
3-person families (40 | 8.3%) account for the highest median family income in Leona Valley with $183,182 per family, while 3-person families (40 | 8.3%) have the highest median income of $61,061 per family member.
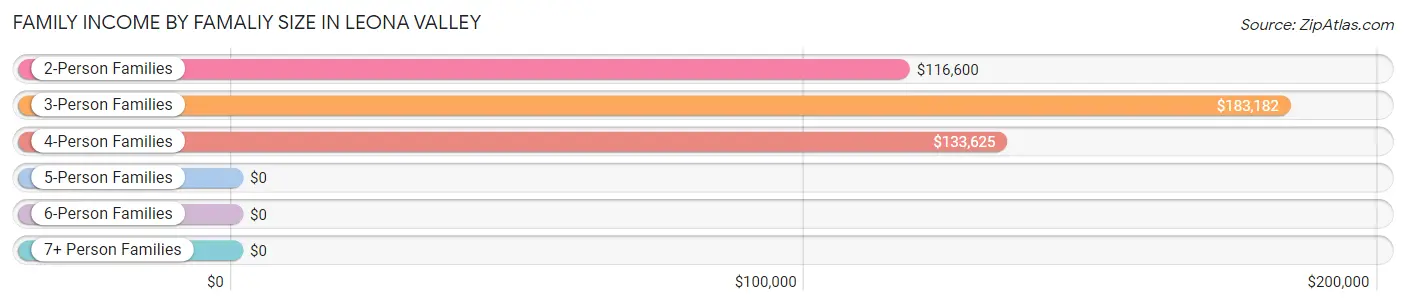
| Income Bracket | # Families | Median Income |
| 2-Person Families | 332 (69.0%) | $116,600 |
| 3-Person Families | 40 (8.3%) | $183,182 |
| 4-Person Families | 91 (18.9%) | $133,625 |
| 5-Person Families | 7 (1.5%) | $0 |
| 6-Person Families | 11 (2.3%) | $0 |
| 7+ Person Families | 0 (0.0%) | $0 |
| Total | 481 (100.0%) | $127,969 |
Family Income by Number of Earners in Leona Valley
The median family income in Leona Valley is $127,969, with families comprising 3+ earners (30) having the highest median family income of $250,001, while families with 1 earner (161) have the lowest median family income of $86,528, accounting for 6.2% and 33.5% of families, respectively.
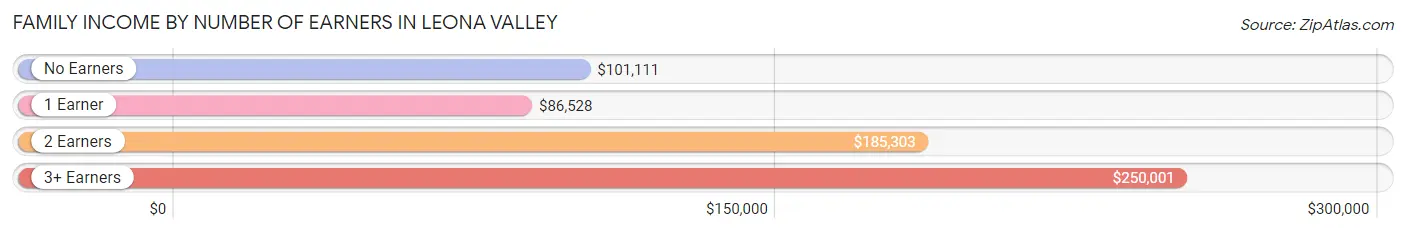
| Number of Earners | # Families | Median Income |
| No Earners | 168 (34.9%) | $101,111 |
| 1 Earner | 161 (33.5%) | $86,528 |
| 2 Earners | 122 (25.4%) | $185,303 |
| 3+ Earners | 30 (6.2%) | $250,001 |
| Total | 481 (100.0%) | $127,969 |
Household Income in Leona Valley
Household Income Brackets in Leona Valley
With 159 households falling in the category, the $100,000 to $149,999 income range is the most frequent in Leona Valley, accounting for 26.3% of all households.
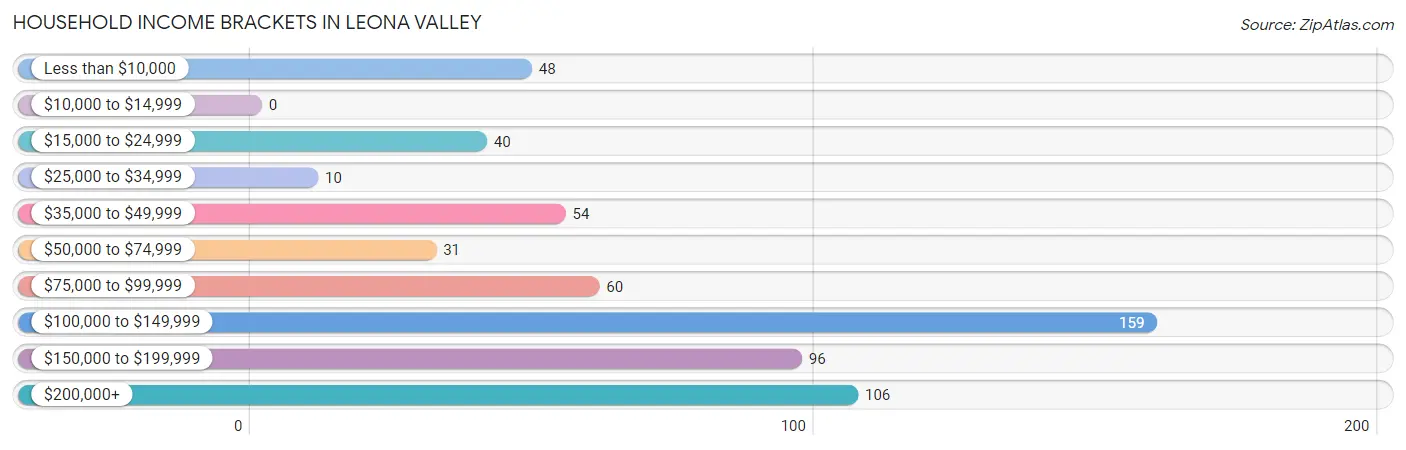
| Income Bracket | # Households | % Households |
| Less than $10,000 | 48 | 7.9% |
| $10,000 to $14,999 | 0 | 0.0% |
| $15,000 to $24,999 | 40 | 6.6% |
| $25,000 to $34,999 | 10 | 1.7% |
| $35,000 to $49,999 | 54 | 8.9% |
| $50,000 to $74,999 | 31 | 5.1% |
| $75,000 to $99,999 | 60 | 9.9% |
| $100,000 to $149,999 | 159 | 26.3% |
| $150,000 to $199,999 | 96 | 15.9% |
| $200,000+ | 106 | 17.5% |
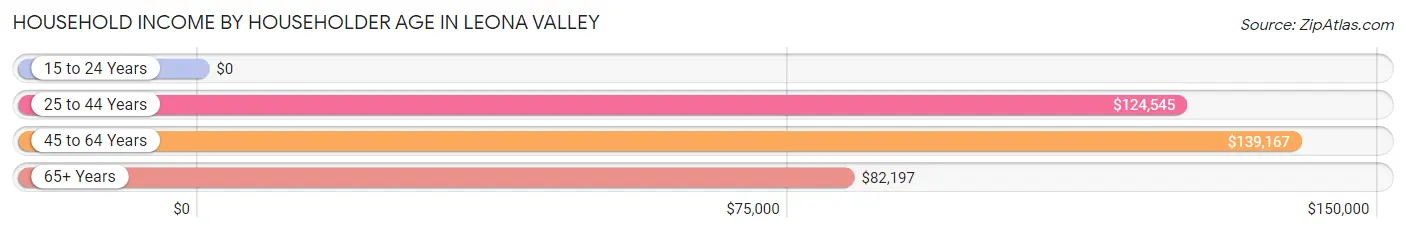
Household Income by Householder Age in Leona Valley
The median household income in Leona Valley is $115,611, with the highest median household income of $139,167 found in the 45 to 64 years age bracket for the primary householder. A total of 270 households (44.7%) fall into this category.
| Income Bracket | # Households | Median Income |
| 15 to 24 Years | 0 (0.0%) | $0 |
| 25 to 44 Years | 70 (11.6%) | $124,545 |
| 45 to 64 Years | 270 (44.7%) | $139,167 |
| 65+ Years | 264 (43.7%) | $82,197 |
| Total | 604 (100.0%) | $115,611 |
Poverty in Leona Valley
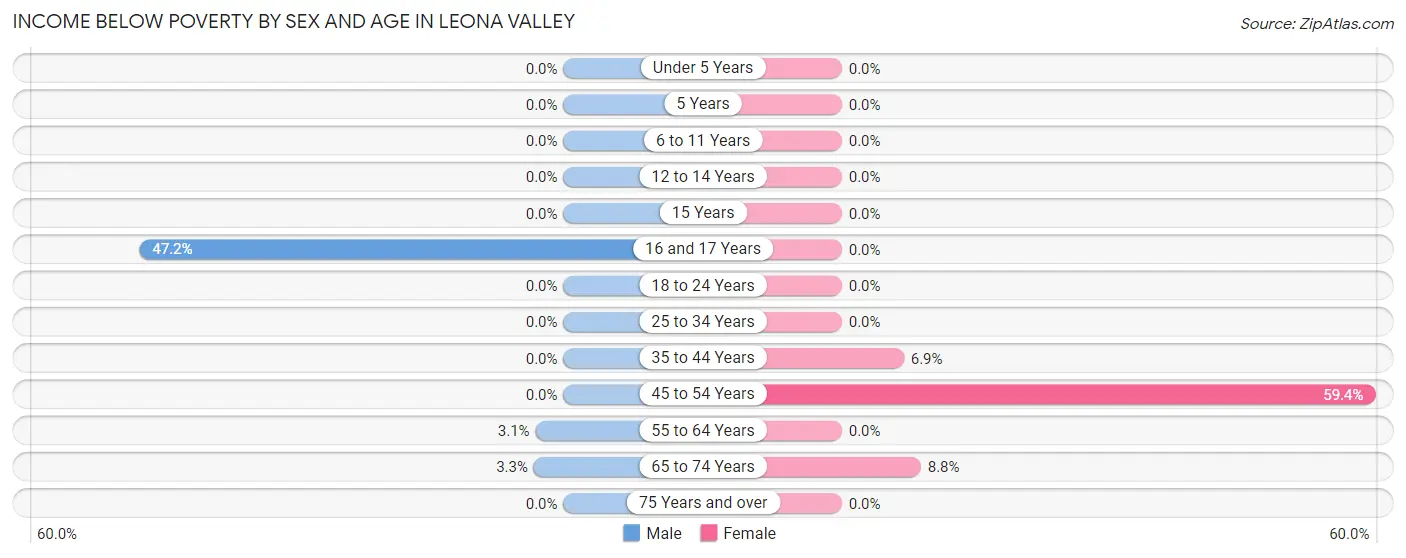
Income Below Poverty by Sex and Age in Leona Valley
With 3.8% poverty level for males and 7.2% for females among the residents of Leona Valley, 16 and 17 year old males and 45 to 54 year old females are the most vulnerable to poverty, with 17 males (47.2%) and 41 females (59.4%) in their respective age groups living below the poverty level.
| Age Bracket | Male | Female |
| Under 5 Years | 0 (0.0%) | 0 (0.0%) |
| 5 Years | 0 (0.0%) | 0 (0.0%) |
| 6 to 11 Years | 0 (0.0%) | 0 (0.0%) |
| 12 to 14 Years | 0 (0.0%) | 0 (0.0%) |
| 15 Years | 0 (0.0%) | 0 (0.0%) |
| 16 and 17 Years | 17 (47.2%) | 0 (0.0%) |
| 18 to 24 Years | 0 (0.0%) | 0 (0.0%) |
| 25 to 34 Years | 0 (0.0%) | 0 (0.0%) |
| 35 to 44 Years | 0 (0.0%) | 6 (6.9%) |
| 45 to 54 Years | 0 (0.0%) | 41 (59.4%) |
| 55 to 64 Years | 6 (3.1%) | 0 (0.0%) |
| 65 to 74 Years | 5 (3.3%) | 11 (8.8%) |
| 75 Years and over | 0 (0.0%) | 0 (0.0%) |
| Total | 28 (3.8%) | 58 (7.2%) |
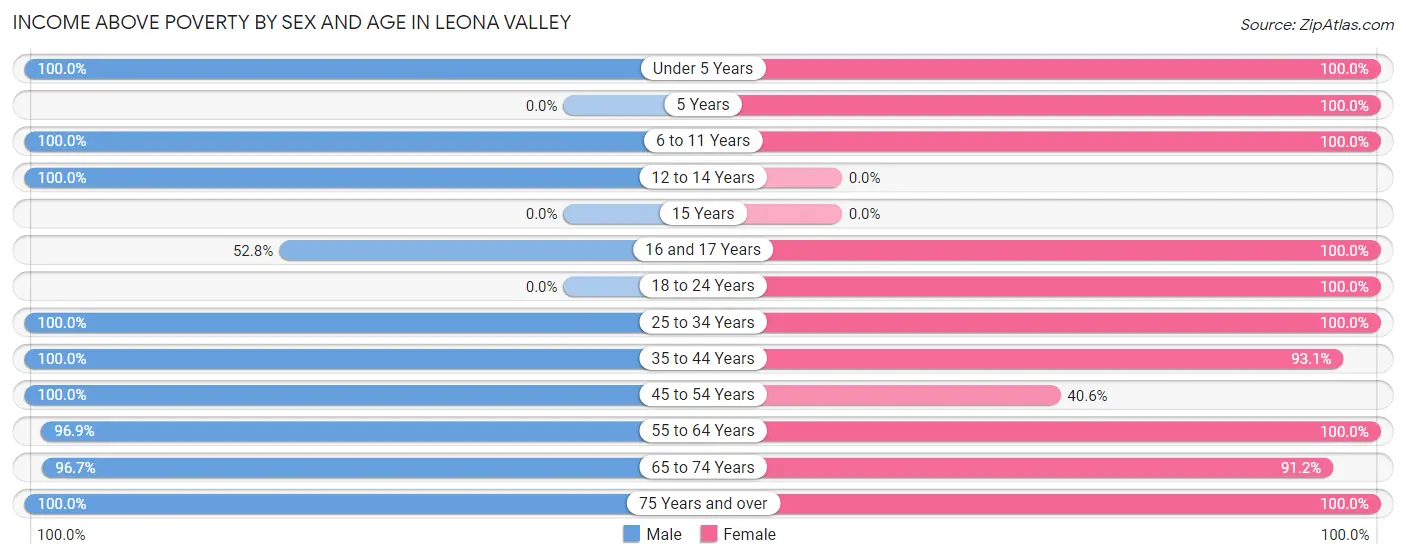
Income Above Poverty by Sex and Age in Leona Valley
According to the poverty statistics in Leona Valley, males aged under 5 years and females aged under 5 years are the age groups that are most secure financially, with 100.0% of males and 100.0% of females in these age groups living above the poverty line.
| Age Bracket | Male | Female |
| Under 5 Years | 37 (100.0%) | 98 (100.0%) |
| 5 Years | 0 (0.0%) | 12 (100.0%) |
| 6 to 11 Years | 31 (100.0%) | 34 (100.0%) |
| 12 to 14 Years | 12 (100.0%) | 0 (0.0%) |
| 15 Years | 0 (0.0%) | 0 (0.0%) |
| 16 and 17 Years | 19 (52.8%) | 22 (100.0%) |
| 18 to 24 Years | 0 (0.0%) | 8 (100.0%) |
| 25 to 34 Years | 48 (100.0%) | 37 (100.0%) |
| 35 to 44 Years | 57 (100.0%) | 81 (93.1%) |
| 45 to 54 Years | 86 (100.0%) | 28 (40.6%) |
| 55 to 64 Years | 187 (96.9%) | 197 (100.0%) |
| 65 to 74 Years | 147 (96.7%) | 114 (91.2%) |
| 75 Years and over | 92 (100.0%) | 115 (100.0%) |
| Total | 716 (96.2%) | 746 (92.8%) |
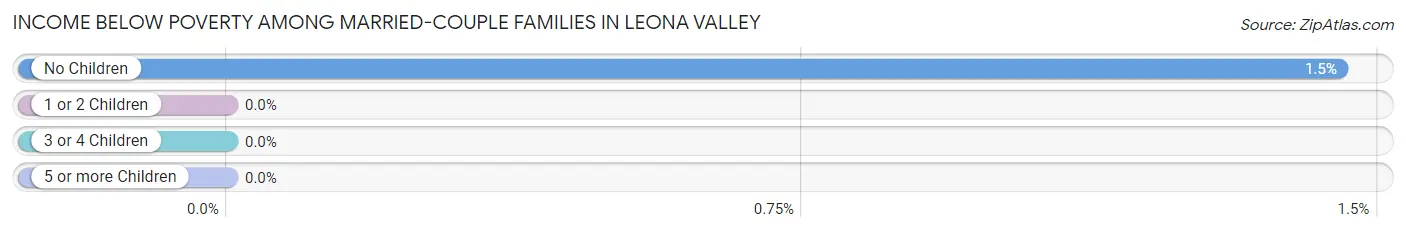
Income Below Poverty Among Married-Couple Families in Leona Valley
The poverty statistics for married-couple families in Leona Valley show that 1.2% or 5 of the total 424 families live below the poverty line. Families with no children have the highest poverty rate of 1.5%, comprising of 5 families. On the other hand, families with 1 or 2 children have the lowest poverty rate of 0.0%, which includes 0 families.
| Children | Above Poverty | Below Poverty |
| No Children | 341 (98.6%) | 5 (1.5%) |
| 1 or 2 Children | 78 (100.0%) | 0 (0.0%) |
| 3 or 4 Children | 0 (0.0%) | 0 (0.0%) |
| 5 or more Children | 0 (0.0%) | 0 (0.0%) |
| Total | 419 (98.8%) | 5 (1.2%) |
Income Below Poverty Among Single-Parent Households in Leona Valley
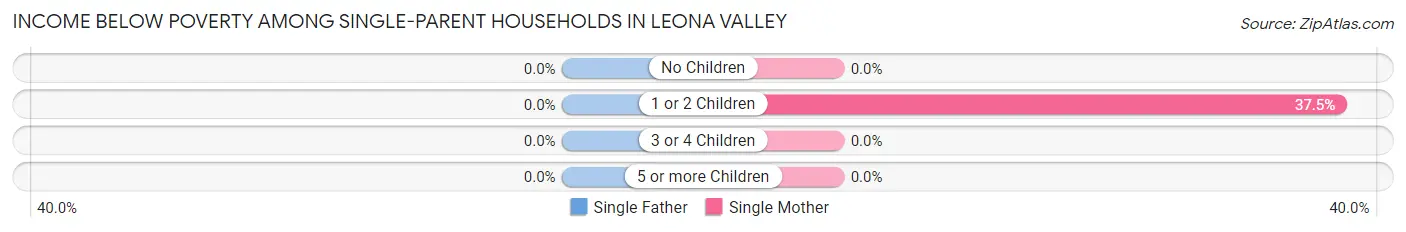
| Children | Single Father | Single Mother |
| No Children | 0 (0.0%) | 0 (0.0%) |
| 1 or 2 Children | 0 (0.0%) | 6 (37.5%) |
| 3 or 4 Children | 0 (0.0%) | 0 (0.0%) |
| 5 or more Children | 0 (0.0%) | 0 (0.0%) |
| Total | 0 (0.0%) | 6 (16.7%) |
Income Below Poverty Among Married-Couple vs Single-Parent Households in Leona Valley
The poverty data for Leona Valley shows that 5 of the married-couple family households (1.2%) and 6 of the single-parent households (10.5%) are living below the poverty level. Within the married-couple family households, those with no children have the highest poverty rate, with 5 households (1.5%) falling below the poverty line. Among the single-parent households, those with 1 or 2 children have the highest poverty rate, with 6 household (22.2%) living below poverty.
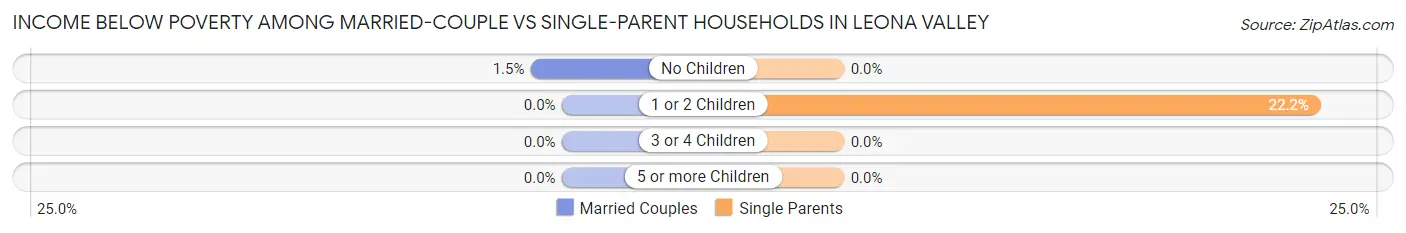
| Children | Married-Couple Families | Single-Parent Households |
| No Children | 5 (1.5%) | 0 (0.0%) |
| 1 or 2 Children | 0 (0.0%) | 6 (22.2%) |
| 3 or 4 Children | 0 (0.0%) | 0 (0.0%) |
| 5 or more Children | 0 (0.0%) | 0 (0.0%) |
| Total | 5 (1.2%) | 6 (10.5%) |
Race in Leona Valley
The most populous races in Leona Valley are White / Caucasian (1,097 | 69.9%), Hispanic or Latino (296 | 18.9%), and Some other Race (238 | 15.2%).
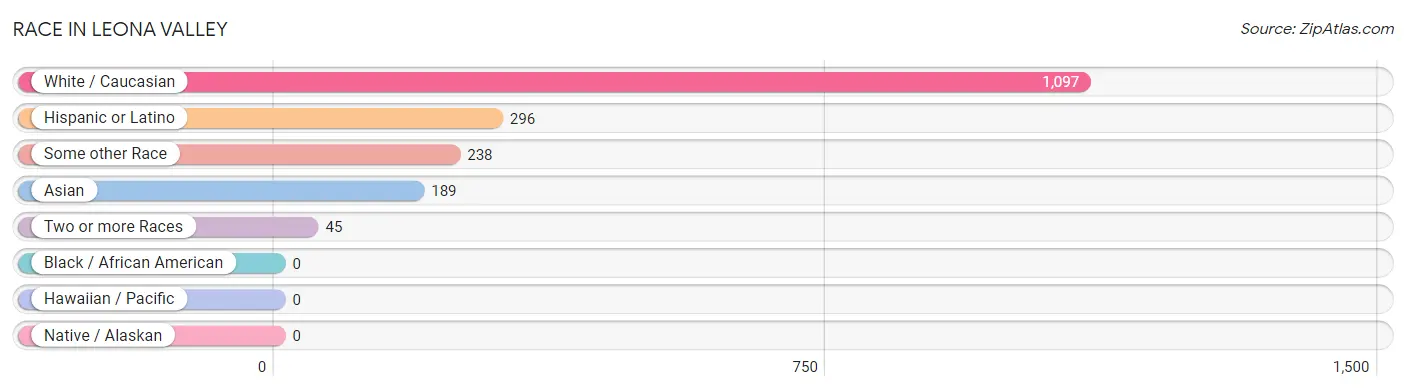
| Race | # Population | % Population |
| Asian | 189 | 12.0% |
| Black / African American | 0 | 0.0% |
| Hawaiian / Pacific | 0 | 0.0% |
| Hispanic or Latino | 296 | 18.9% |
| Native / Alaskan | 0 | 0.0% |
| White / Caucasian | 1,097 | 69.9% |
| Two or more Races | 45 | 2.9% |
| Some other Race | 238 | 15.2% |
| Total | 1,569 | 100.0% |
Ancestry in Leona Valley
The most populous ancestries reported in Leona Valley are German (226 | 14.4%), English (212 | 13.5%), Indian (Asian) (174 | 11.1%), Irish (172 | 11.0%), and Mexican (162 | 10.3%), together accounting for 60.3% of all Leona Valley residents.
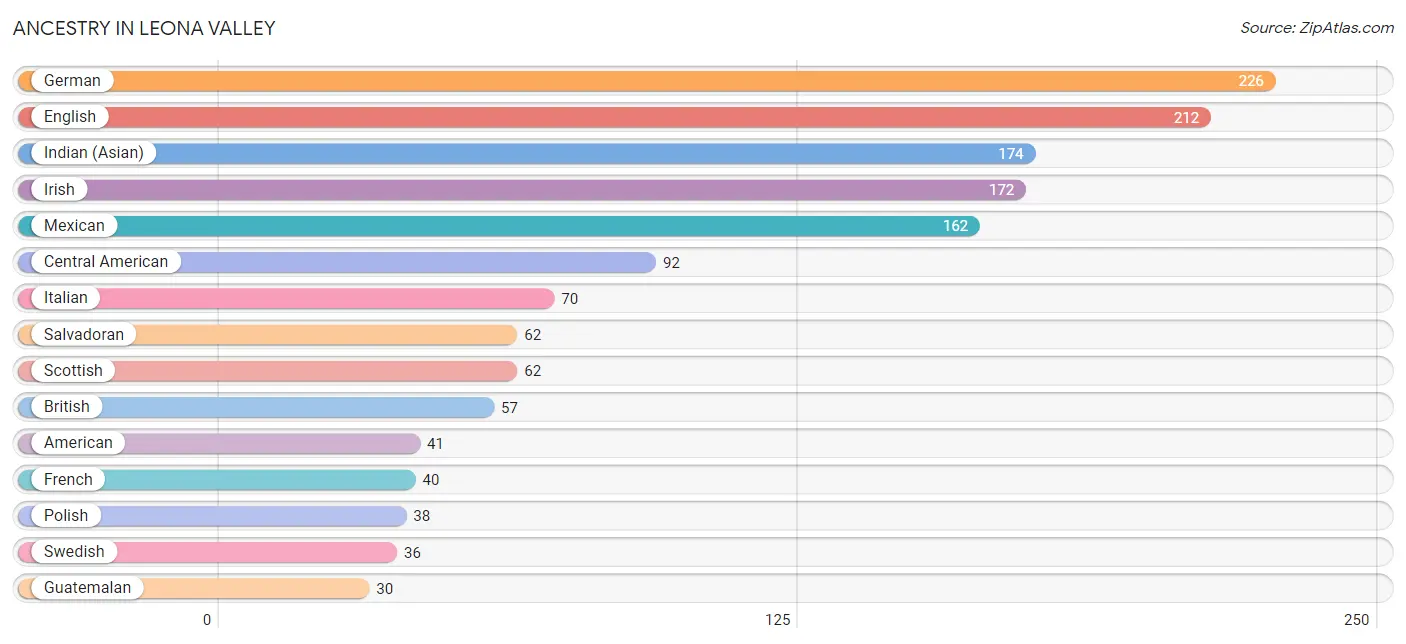
| Ancestry | # Population | % Population |
| American | 41 | 2.6% |
| Apache | 22 | 1.4% |
| Argentinean | 10 | 0.6% |
| Armenian | 9 | 0.6% |
| Bhutanese | 22 | 1.4% |
| British | 57 | 3.6% |
| Canadian | 29 | 1.8% |
| Central American | 92 | 5.9% |
| Dutch | 11 | 0.7% |
| English | 212 | 13.5% |
| European | 24 | 1.5% |
| French | 40 | 2.5% |
| German | 226 | 14.4% |
| Guatemalan | 30 | 1.9% |
| Indian (Asian) | 174 | 11.1% |
| Irish | 172 | 11.0% |
| Italian | 70 | 4.5% |
| Korean | 27 | 1.7% |
| Mexican | 162 | 10.3% |
| Norwegian | 23 | 1.5% |
| Polish | 38 | 2.4% |
| Portuguese | 13 | 0.8% |
| Puerto Rican | 11 | 0.7% |
| Russian | 30 | 1.9% |
| Salvadoran | 62 | 4.0% |
| Scandinavian | 7 | 0.4% |
| Scotch-Irish | 17 | 1.1% |
| Scottish | 62 | 4.0% |
| Slovak | 15 | 1.0% |
| South American | 10 | 0.6% |
| Spanish | 11 | 0.7% |
| Swedish | 36 | 2.3% | View All 32 Rows |
Immigrants in Leona Valley
The most numerous immigrant groups reported in Leona Valley came from Latin America (96 | 6.1%), Central America (75 | 4.8%), Europe (57 | 3.6%), Northern Europe (57 | 3.6%), and Guatemala (40 | 2.5%), together accounting for 20.7% of all Leona Valley residents.
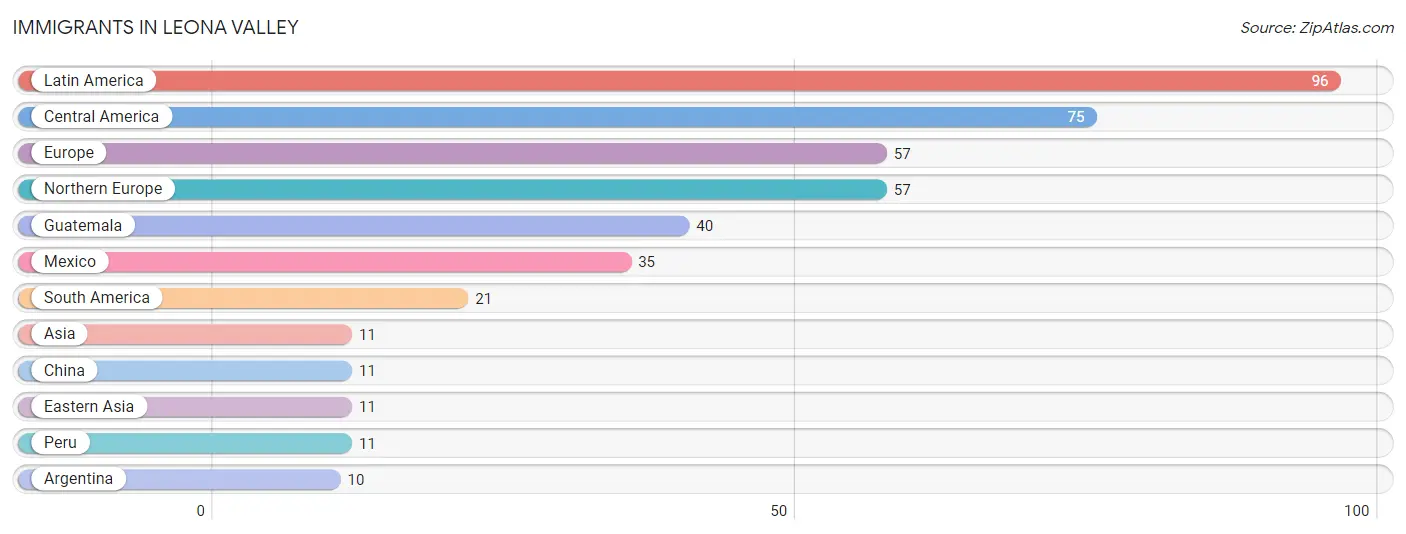
| Immigration Origin | # Population | % Population |
| Argentina | 10 | 0.6% |
| Asia | 11 | 0.7% |
| Central America | 75 | 4.8% |
| China | 11 | 0.7% |
| Eastern Asia | 11 | 0.7% |
| Europe | 57 | 3.6% |
| Guatemala | 40 | 2.5% |
| Latin America | 96 | 6.1% |
| Mexico | 35 | 2.2% |
| Northern Europe | 57 | 3.6% |
| Peru | 11 | 0.7% |
| South America | 21 | 1.3% | View All 12 Rows |
Sex and Age in Leona Valley
Sex and Age in Leona Valley
The most populous age groups in Leona Valley are 65 to 69 Years (113 | 15.0%) for men and 60 to 64 Years (128 | 15.7%) for women.
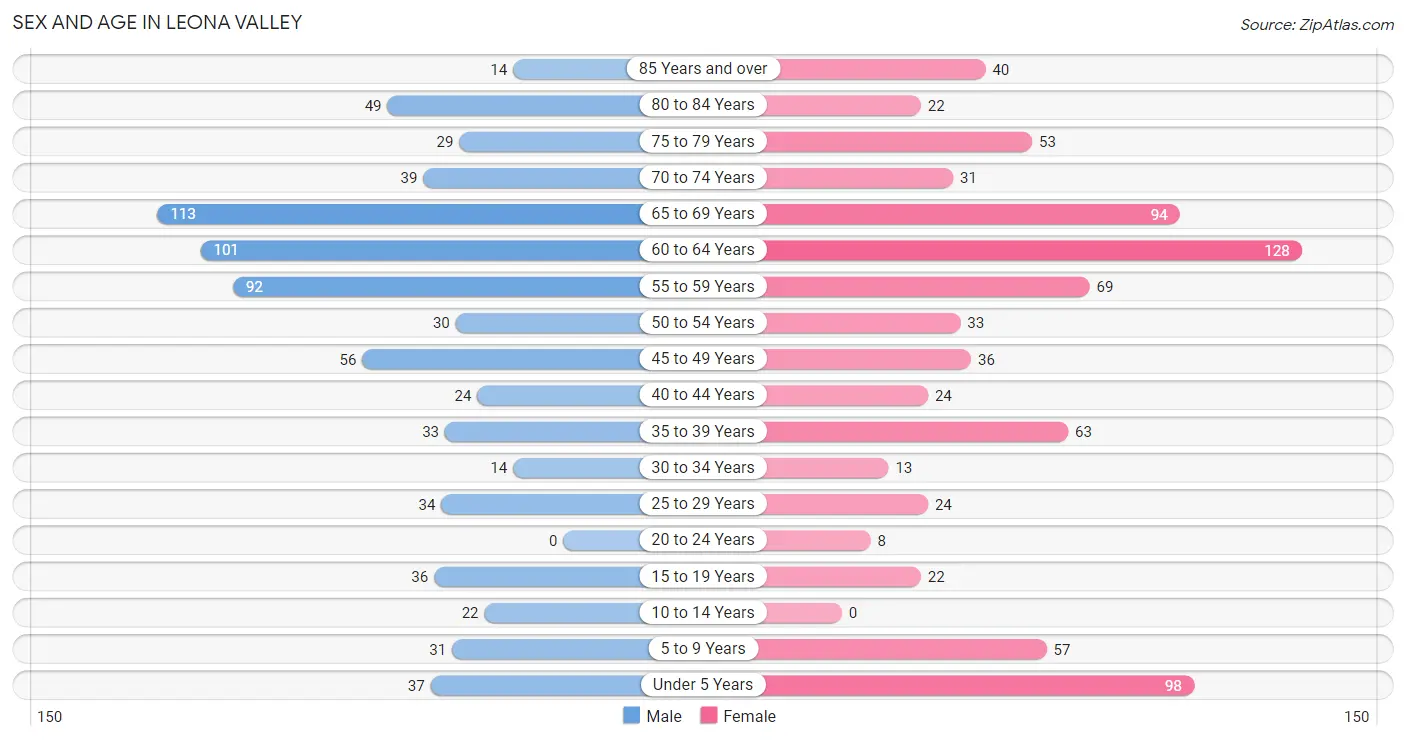
| Age Bracket | Male | Female |
| Under 5 Years | 37 (4.9%) | 98 (12.0%) |
| 5 to 9 Years | 31 (4.1%) | 57 (7.0%) |
| 10 to 14 Years | 22 (2.9%) | 0 (0.0%) |
| 15 to 19 Years | 36 (4.8%) | 22 (2.7%) |
| 20 to 24 Years | 0 (0.0%) | 8 (1.0%) |
| 25 to 29 Years | 34 (4.5%) | 24 (2.9%) |
| 30 to 34 Years | 14 (1.9%) | 13 (1.6%) |
| 35 to 39 Years | 33 (4.4%) | 63 (7.7%) |
| 40 to 44 Years | 24 (3.2%) | 24 (2.9%) |
| 45 to 49 Years | 56 (7.4%) | 36 (4.4%) |
| 50 to 54 Years | 30 (4.0%) | 33 (4.1%) |
| 55 to 59 Years | 92 (12.2%) | 69 (8.5%) |
| 60 to 64 Years | 101 (13.4%) | 128 (15.7%) |
| 65 to 69 Years | 113 (15.0%) | 94 (11.5%) |
| 70 to 74 Years | 39 (5.2%) | 31 (3.8%) |
| 75 to 79 Years | 29 (3.8%) | 53 (6.5%) |
| 80 to 84 Years | 49 (6.5%) | 22 (2.7%) |
| 85 Years and over | 14 (1.9%) | 40 (4.9%) |
| Total | 754 (100.0%) | 815 (100.0%) |
Families and Households in Leona Valley
Median Family Size in Leona Valley
The median family size in Leona Valley is 2.77 persons per family, with single female/mother families (36 | 7.5%) accounting for the largest median family size of 4.14 persons per family. On the other hand, single male/father families (21 | 4.4%) represent the smallest median family size with 2.05 persons per family.
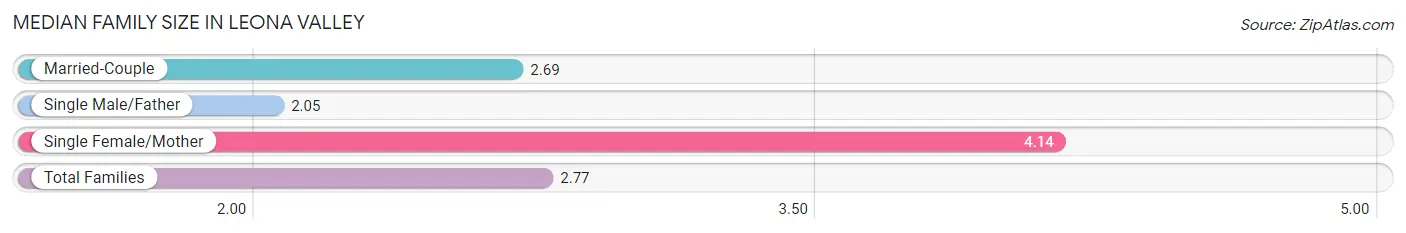
| Family Type | # Families | Family Size |
| Married-Couple | 424 (88.1%) | 2.69 |
| Single Male/Father | 21 (4.4%) | 2.05 |
| Single Female/Mother | 36 (7.5%) | 4.14 |
| Total Families | 481 (100.0%) | 2.77 |
Median Household Size in Leona Valley
The median household size in Leona Valley is 2.60 persons per household, with single female/mother households (36 | 6.0%) accounting for the largest median household size of 4.97 persons per household. non-family households (123 | 20.4%) represent the smallest median household size with 1.23 persons per household.
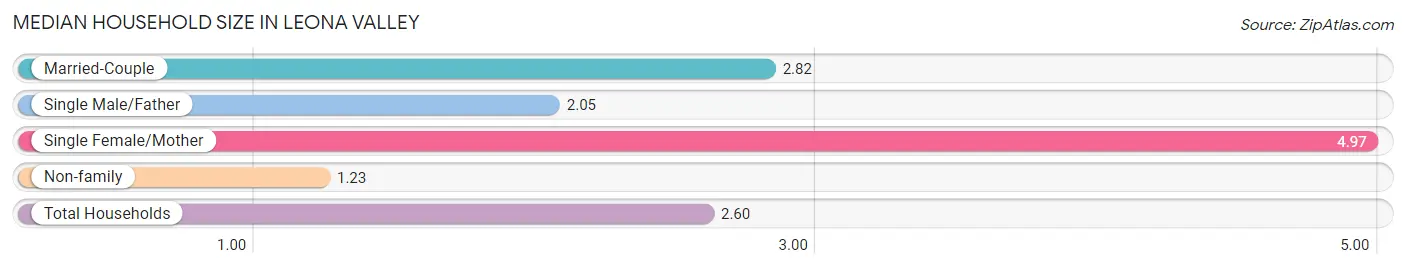
| Household Type | # Households | Household Size |
| Married-Couple | 424 (70.2%) | 2.82 |
| Single Male/Father | 21 (3.5%) | 2.05 |
| Single Female/Mother | 36 (6.0%) | 4.97 |
| Non-family | 123 (20.4%) | 1.23 |
| Total Households | 604 (100.0%) | 2.60 |
Household Size by Marriage Status in Leona Valley
Out of a total of 604 households in Leona Valley, 481 (79.6%) are family households, while 123 (20.4%) are nonfamily households. The most numerous type of family households are 2-person households, comprising 317, and the most common type of nonfamily households are 1-person households, comprising 98.
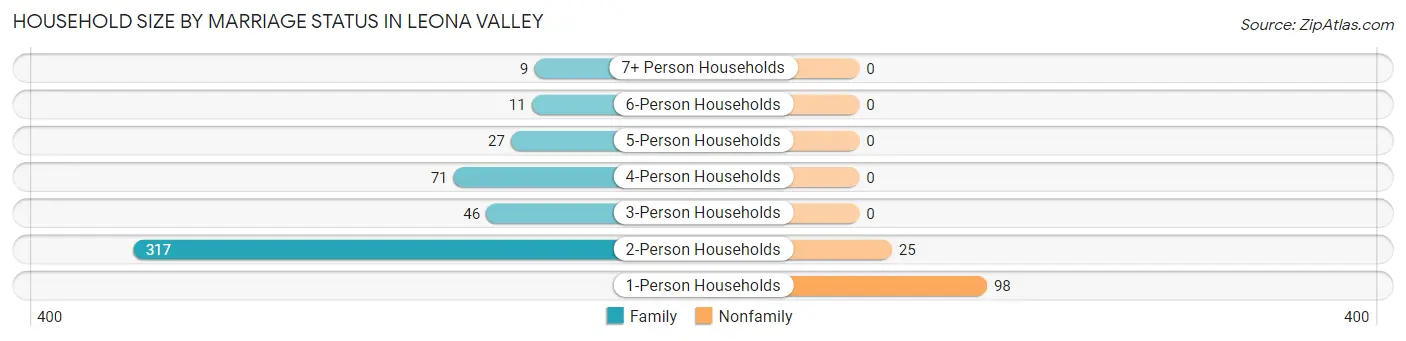
| Household Size | Family Households | Nonfamily Households |
| 1-Person Households | - | 98 (16.2%) |
| 2-Person Households | 317 (52.5%) | 25 (4.1%) |
| 3-Person Households | 46 (7.6%) | 0 (0.0%) |
| 4-Person Households | 71 (11.7%) | 0 (0.0%) |
| 5-Person Households | 27 (4.5%) | 0 (0.0%) |
| 6-Person Households | 11 (1.8%) | 0 (0.0%) |
| 7+ Person Households | 9 (1.5%) | 0 (0.0%) |
| Total | 481 (79.6%) | 123 (20.4%) |
Female Fertility in Leona Valley
Fertility by Age in Leona Valley
Average fertility rate in Leona Valley is 158.0 births per 1,000 women. Women in the age bracket of 35 to 50 years have the highest fertility rate with 237.0 births per 1,000 women. Women in the age bracket of 35 to 50 years acount for 100.0% of all women with births.
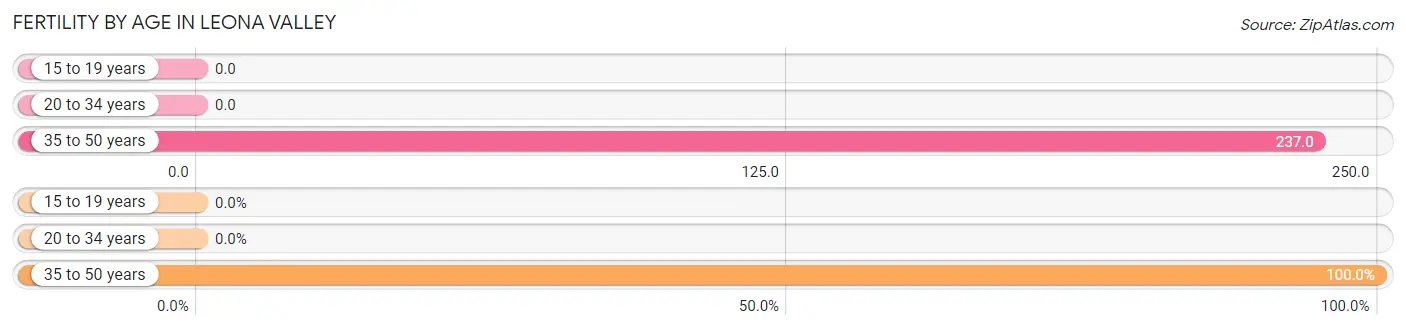
| Age Bracket | Women with Births | Births / 1,000 Women |
| 15 to 19 years | 0 (0.0%) | 0.0 |
| 20 to 34 years | 0 (0.0%) | 0.0 |
| 35 to 50 years | 32 (100.0%) | 237.0 |
| Total | 32 (100.0%) | 158.0 |
Fertility by Age by Marriage Status in Leona Valley
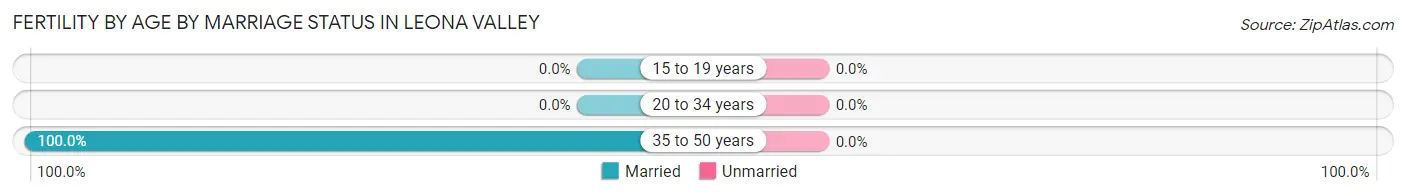
| Age Bracket | Married | Unmarried |
| 15 to 19 years | 0 (0.0%) | 0 (0.0%) |
| 20 to 34 years | 0 (0.0%) | 0 (0.0%) |
| 35 to 50 years | 32 (100.0%) | 0 (0.0%) |
| Total | 32 (100.0%) | 0 (0.0%) |
Fertility by Education in Leona Valley
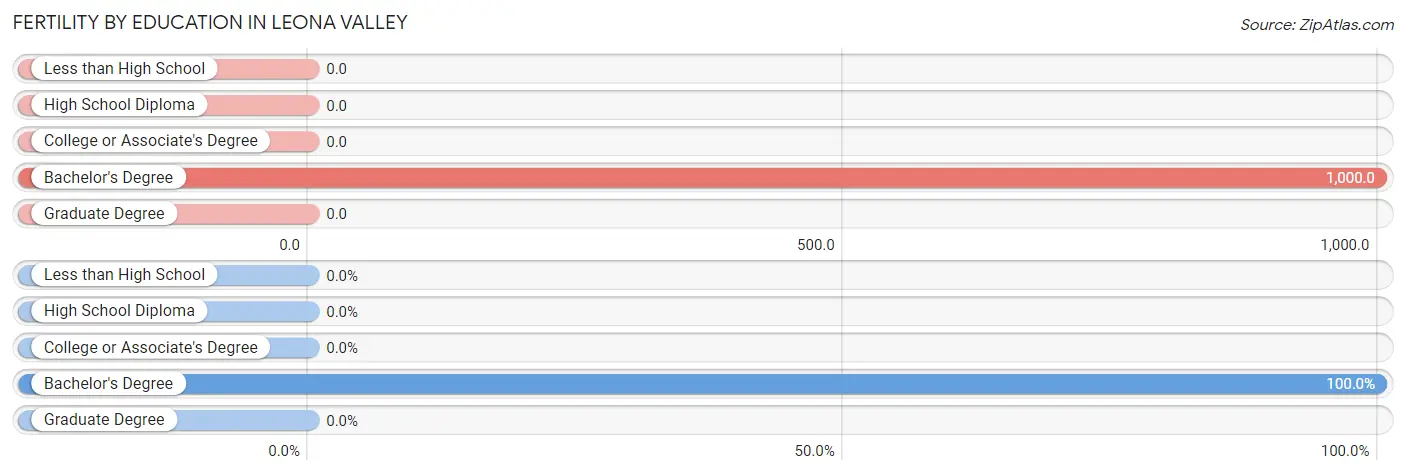
| Educational Attainment | Women with Births | Births / 1,000 Women |
| Less than High School | 0 (0.0%) | 0.0 |
| High School Diploma | 0 (0.0%) | 0.0 |
| College or Associate's Degree | 0 (0.0%) | 0.0 |
| Bachelor's Degree | 32 (100.0%) | 1,000.0 |
| Graduate Degree | 0 (0.0%) | 0.0 |
| Total | 32 (100.0%) | 158.0 |
Fertility by Education by Marriage Status in Leona Valley
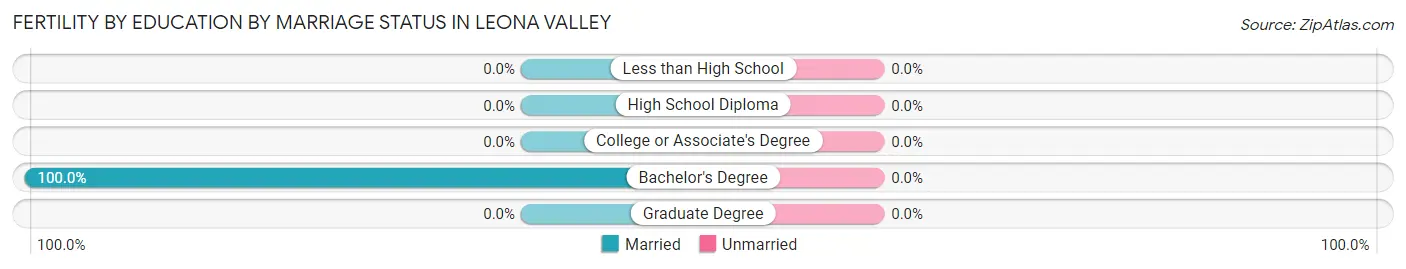
| Educational Attainment | Married | Unmarried |
| Less than High School | 0 (0.0%) | 0 (0.0%) |
| High School Diploma | 0 (0.0%) | 0 (0.0%) |
| College or Associate's Degree | 0 (0.0%) | 0 (0.0%) |
| Bachelor's Degree | 32 (100.0%) | 0 (0.0%) |
| Graduate Degree | 0 (0.0%) | 0 (0.0%) |
| Total | 32 (100.0%) | 0 (0.0%) |
Employment Characteristics in Leona Valley
Employment by Class of Employer in Leona Valley
Among the 549 employed individuals in Leona Valley, private company employees (323 | 58.8%), local government employees (102 | 18.6%), and self-employed (not incorporated) (65 | 11.8%) make up the most common classes of employment.
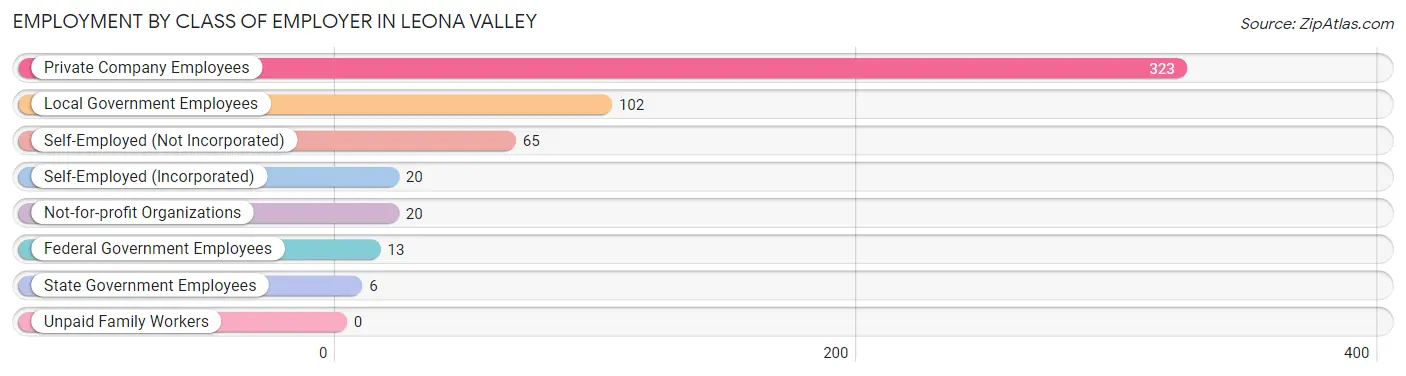
| Employer Class | # Employees | % Employees |
| Private Company Employees | 323 | 58.8% |
| Self-Employed (Incorporated) | 20 | 3.6% |
| Self-Employed (Not Incorporated) | 65 | 11.8% |
| Not-for-profit Organizations | 20 | 3.6% |
| Local Government Employees | 102 | 18.6% |
| State Government Employees | 6 | 1.1% |
| Federal Government Employees | 13 | 2.4% |
| Unpaid Family Workers | 0 | 0.0% |
| Total | 549 | 100.0% |
Employment Status by Age in Leona Valley
According to the labor force statistics for Leona Valley, out of the total population over 16 years of age (1,324), 49.4% or 654 individuals are in the labor force, with 6.0% or 39 of them unemployed. The age group with the highest labor force participation rate is 20 to 24 years, with 100.0% or 8 individuals in the labor force. Within the labor force, the 35 to 44 years age range has the highest percentage of unemployed individuals, with 20.6% or 22 of them being unemployed.
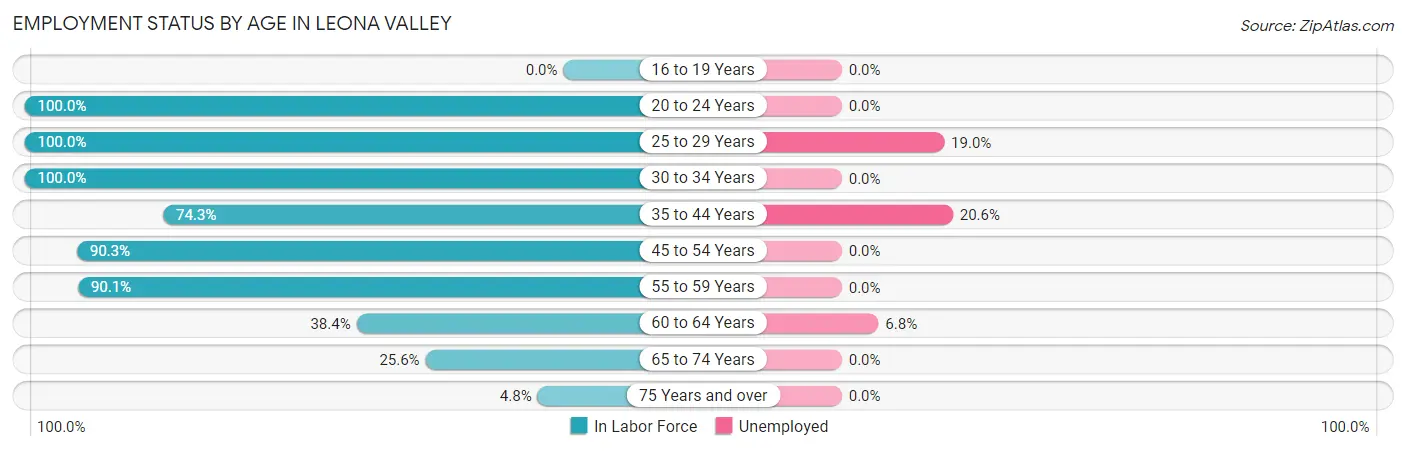
| Age Bracket | In Labor Force | Unemployed |
| 16 to 19 Years | 0 (0.0%) | 0 (0.0%) |
| 20 to 24 Years | 8 (100.0%) | 0 (0.0%) |
| 25 to 29 Years | 58 (100.0%) | 11 (19.0%) |
| 30 to 34 Years | 27 (100.0%) | 0 (0.0%) |
| 35 to 44 Years | 107 (74.3%) | 22 (20.6%) |
| 45 to 54 Years | 140 (90.3%) | 0 (0.0%) |
| 55 to 59 Years | 145 (90.1%) | 0 (0.0%) |
| 60 to 64 Years | 88 (38.4%) | 6 (6.8%) |
| 65 to 74 Years | 71 (25.6%) | 0 (0.0%) |
| 75 Years and over | 10 (4.8%) | 0 (0.0%) |
| Total | 654 (49.4%) | 39 (6.0%) |
Employment Status by Educational Attainment in Leona Valley
According to labor force statistics for Leona Valley, 73.0% of individuals (565) out of the total population between 25 and 64 years of age (774) are in the labor force, with 6.9% or 39 of them being unemployed. The group with the highest labor force participation rate are those with the educational attainment of bachelor's degree or higher, with 89.9% or 232 individuals in the labor force. Within the labor force, individuals with less than high school education have the highest percentage of unemployment, with 21.4% or 6 of them being unemployed.
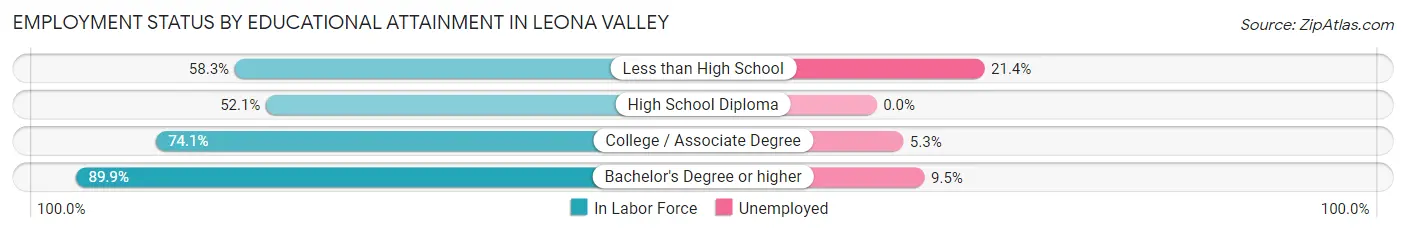
| Educational Attainment | In Labor Force | Unemployed |
| Less than High School | 28 (58.3%) | 10 (21.4%) |
| High School Diploma | 99 (52.1%) | 0 (0.0%) |
| College / Associate Degree | 206 (74.1%) | 15 (5.3%) |
| Bachelor's Degree or higher | 232 (89.9%) | 25 (9.5%) |
| Total | 565 (73.0%) | 53 (6.9%) |
Employment Occupations by Sex in Leona Valley
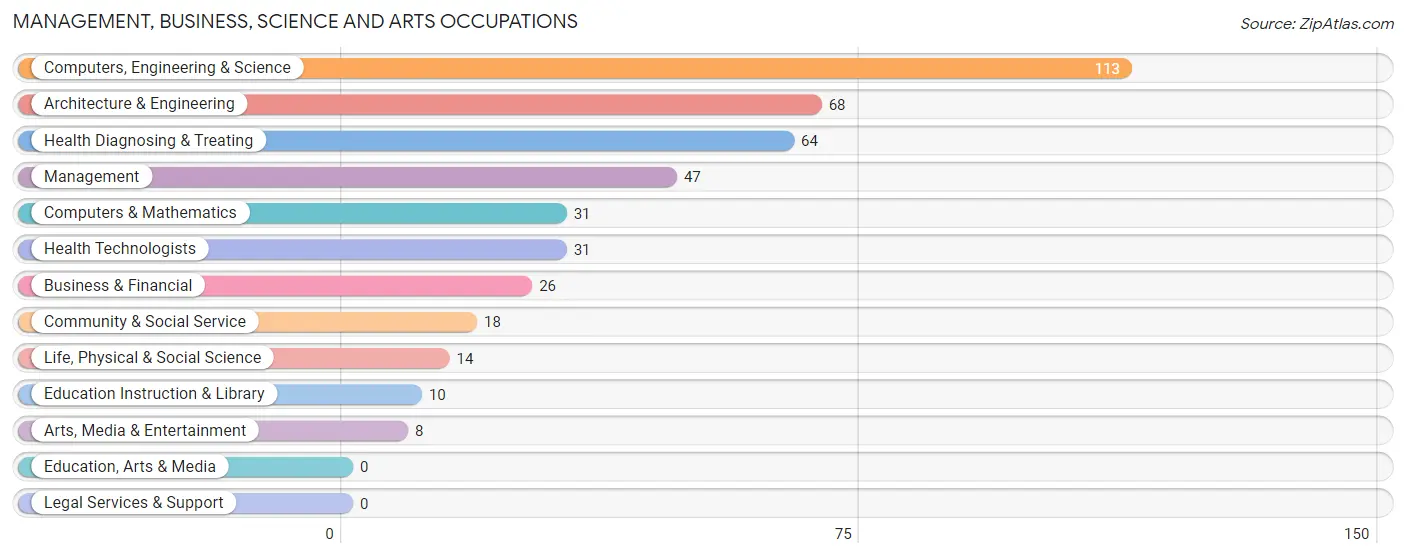
Management, Business, Science and Arts Occupations
The most common Management, Business, Science and Arts occupations in Leona Valley are Computers, Engineering & Science (113 | 18.4%), Architecture & Engineering (68 | 11.1%), Health Diagnosing & Treating (64 | 10.4%), Management (47 | 7.6%), and Computers & Mathematics (31 | 5.0%).
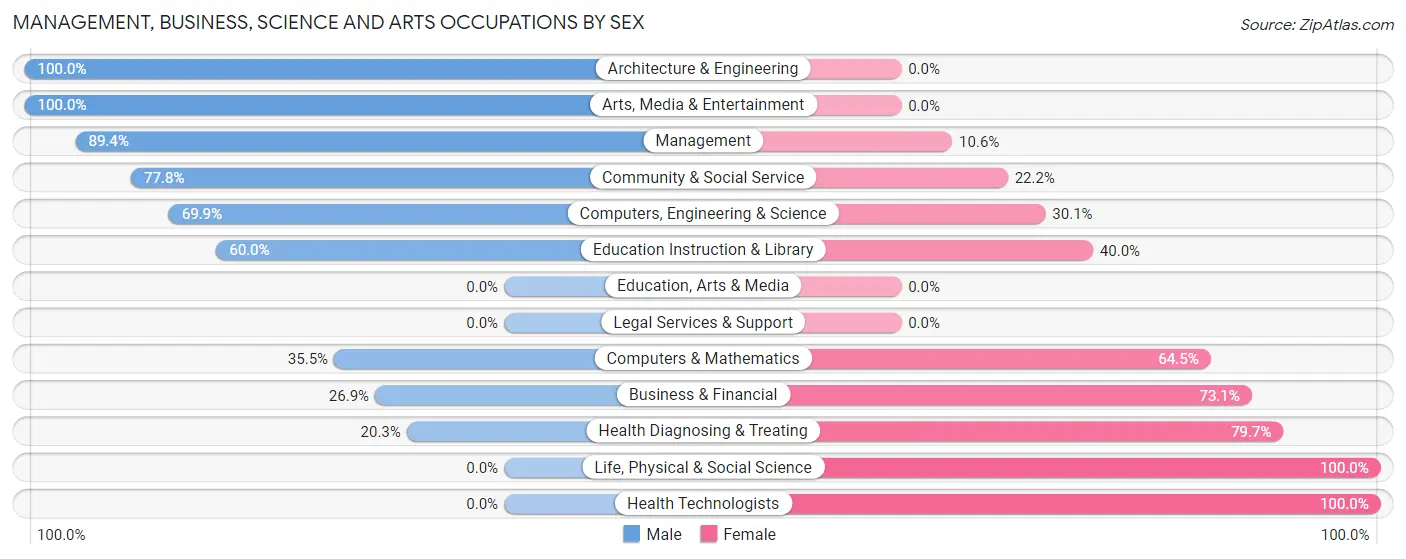
Management, Business, Science and Arts Occupations by Sex
Within the Management, Business, Science and Arts occupations in Leona Valley, the most male-oriented occupations are Architecture & Engineering (100.0%), Arts, Media & Entertainment (100.0%), and Management (89.4%), while the most female-oriented occupations are Life, Physical & Social Science (100.0%), Health Technologists (100.0%), and Health Diagnosing & Treating (79.7%).
| Occupation | Male | Female |
| Management | 42 (89.4%) | 5 (10.6%) |
| Business & Financial | 7 (26.9%) | 19 (73.1%) |
| Computers, Engineering & Science | 79 (69.9%) | 34 (30.1%) |
| Computers & Mathematics | 11 (35.5%) | 20 (64.5%) |
| Architecture & Engineering | 68 (100.0%) | 0 (0.0%) |
| Life, Physical & Social Science | 0 (0.0%) | 14 (100.0%) |
| Community & Social Service | 14 (77.8%) | 4 (22.2%) |
| Education, Arts & Media | 0 (0.0%) | 0 (0.0%) |
| Legal Services & Support | 0 (0.0%) | 0 (0.0%) |
| Education Instruction & Library | 6 (60.0%) | 4 (40.0%) |
| Arts, Media & Entertainment | 8 (100.0%) | 0 (0.0%) |
| Health Diagnosing & Treating | 13 (20.3%) | 51 (79.7%) |
| Health Technologists | 0 (0.0%) | 31 (100.0%) |
| Total (Category) | 155 (57.8%) | 113 (42.2%) |
| Total (Overall) | 373 (60.7%) | 242 (39.4%) |
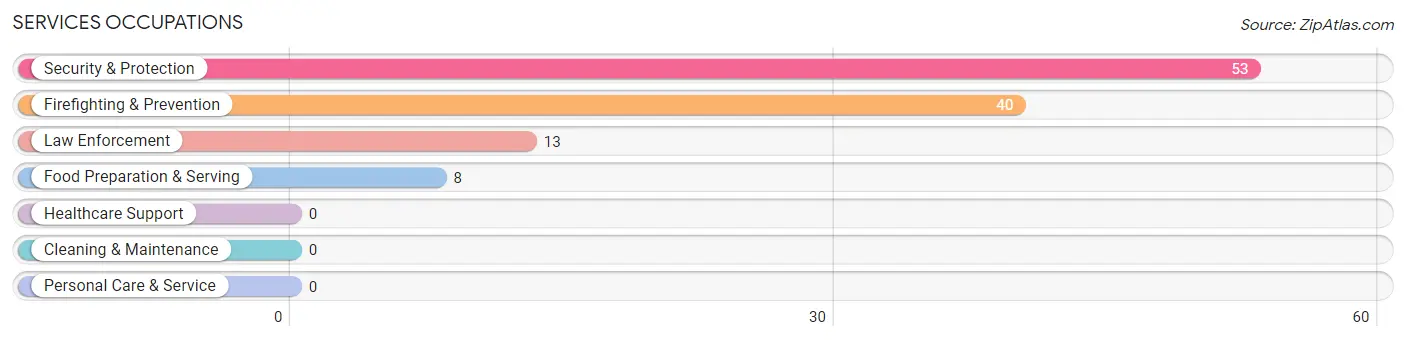
Services Occupations
The most common Services occupations in Leona Valley are Security & Protection (53 | 8.6%), Firefighting & Prevention (40 | 6.5%), Law Enforcement (13 | 2.1%), and Food Preparation & Serving (8 | 1.3%).
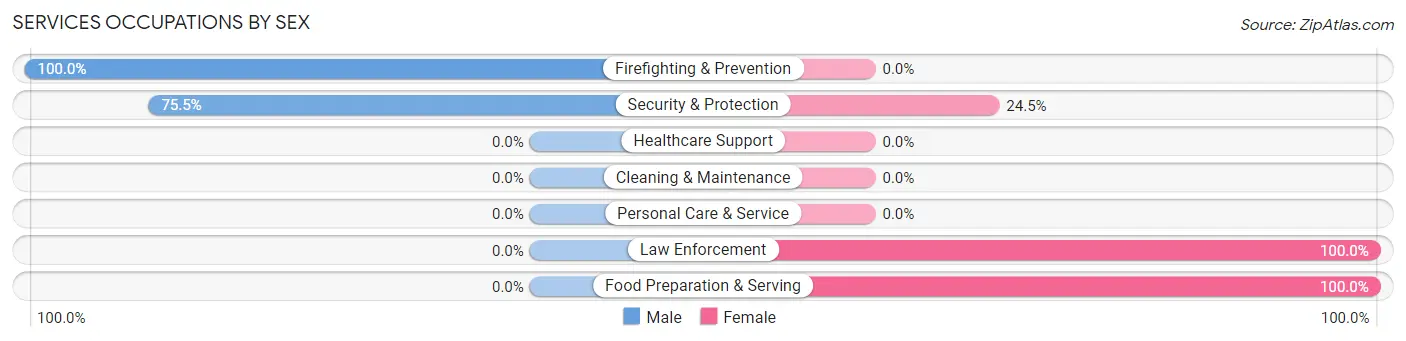
Services Occupations by Sex
Within the Services occupations in Leona Valley, the most male-oriented occupations are Firefighting & Prevention (100.0%), and Security & Protection (75.5%), while the most female-oriented occupations are Law Enforcement (100.0%), Food Preparation & Serving (100.0%), and Security & Protection (24.5%).
| Occupation | Male | Female |
| Healthcare Support | 0 (0.0%) | 0 (0.0%) |
| Security & Protection | 40 (75.5%) | 13 (24.5%) |
| Firefighting & Prevention | 40 (100.0%) | 0 (0.0%) |
| Law Enforcement | 0 (0.0%) | 13 (100.0%) |
| Food Preparation & Serving | 0 (0.0%) | 8 (100.0%) |
| Cleaning & Maintenance | 0 (0.0%) | 0 (0.0%) |
| Personal Care & Service | 0 (0.0%) | 0 (0.0%) |
| Total (Category) | 40 (65.6%) | 21 (34.4%) |
| Total (Overall) | 373 (60.7%) | 242 (39.4%) |
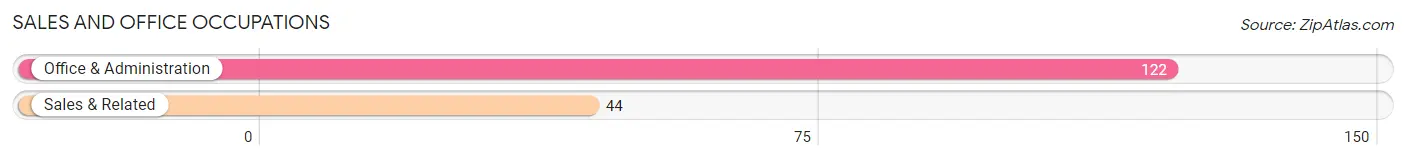
Sales and Office Occupations
The most common Sales and Office occupations in Leona Valley are Office & Administration (122 | 19.8%), and Sales & Related (44 | 7.1%).
Sales and Office Occupations by Sex
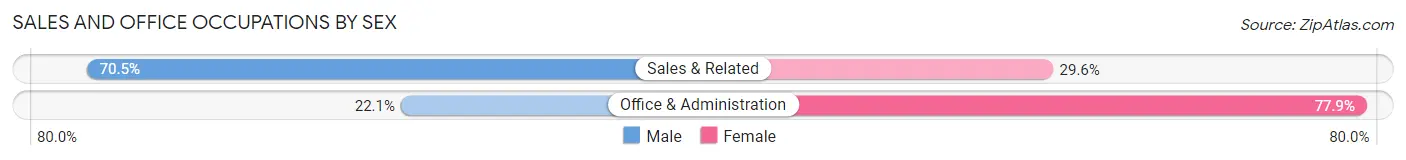
| Occupation | Male | Female |
| Sales & Related | 31 (70.5%) | 13 (29.5%) |
| Office & Administration | 27 (22.1%) | 95 (77.9%) |
| Total (Category) | 58 (34.9%) | 108 (65.1%) |
| Total (Overall) | 373 (60.7%) | 242 (39.4%) |
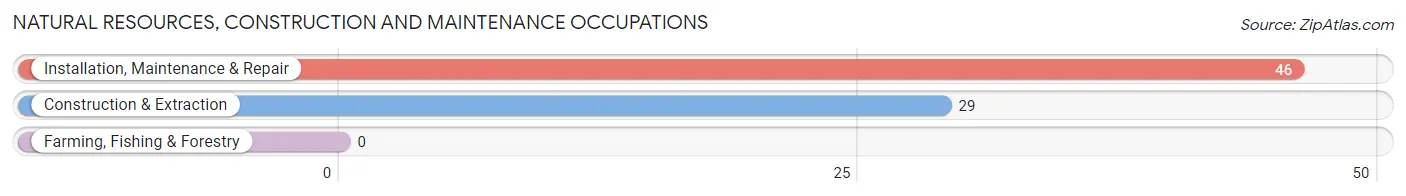
Natural Resources, Construction and Maintenance Occupations
The most common Natural Resources, Construction and Maintenance occupations in Leona Valley are Installation, Maintenance & Repair (46 | 7.5%), and Construction & Extraction (29 | 4.7%).
Natural Resources, Construction and Maintenance Occupations by Sex
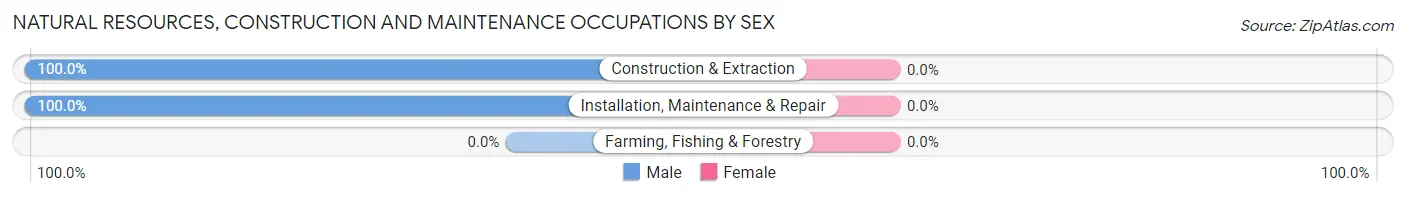
| Occupation | Male | Female |
| Farming, Fishing & Forestry | 0 (0.0%) | 0 (0.0%) |
| Construction & Extraction | 29 (100.0%) | 0 (0.0%) |
| Installation, Maintenance & Repair | 46 (100.0%) | 0 (0.0%) |
| Total (Category) | 75 (100.0%) | 0 (0.0%) |
| Total (Overall) | 373 (60.7%) | 242 (39.4%) |
Production, Transportation and Moving Occupations
The most common Production, Transportation and Moving occupations in Leona Valley are , and Production (45 | 7.3%).
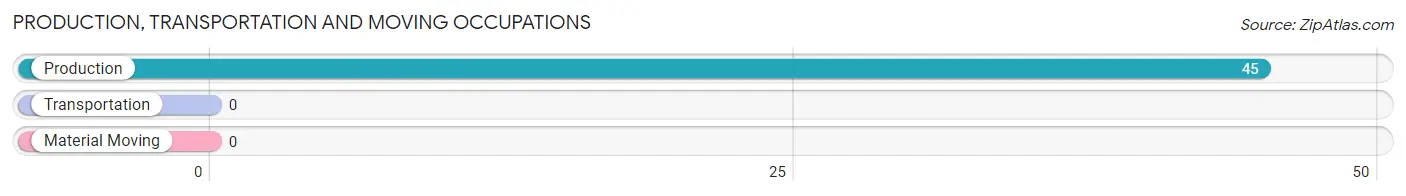
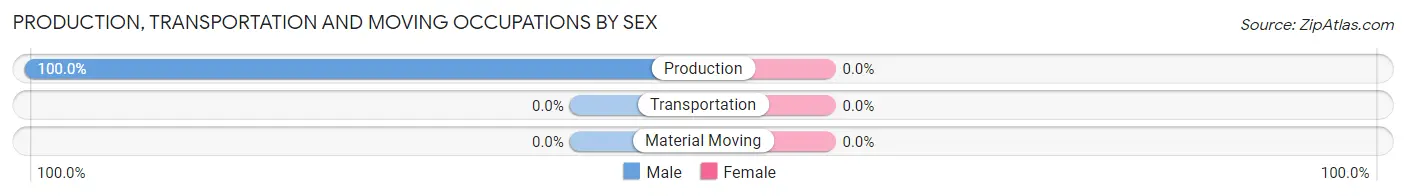
Production, Transportation and Moving Occupations by Sex
| Occupation | Male | Female |
| Production | 45 (100.0%) | 0 (0.0%) |
| Transportation | 0 (0.0%) | 0 (0.0%) |
| Material Moving | 0 (0.0%) | 0 (0.0%) |
| Total (Category) | 45 (100.0%) | 0 (0.0%) |
| Total (Overall) | 373 (60.7%) | 242 (39.4%) |
Employment Industries by Sex in Leona Valley
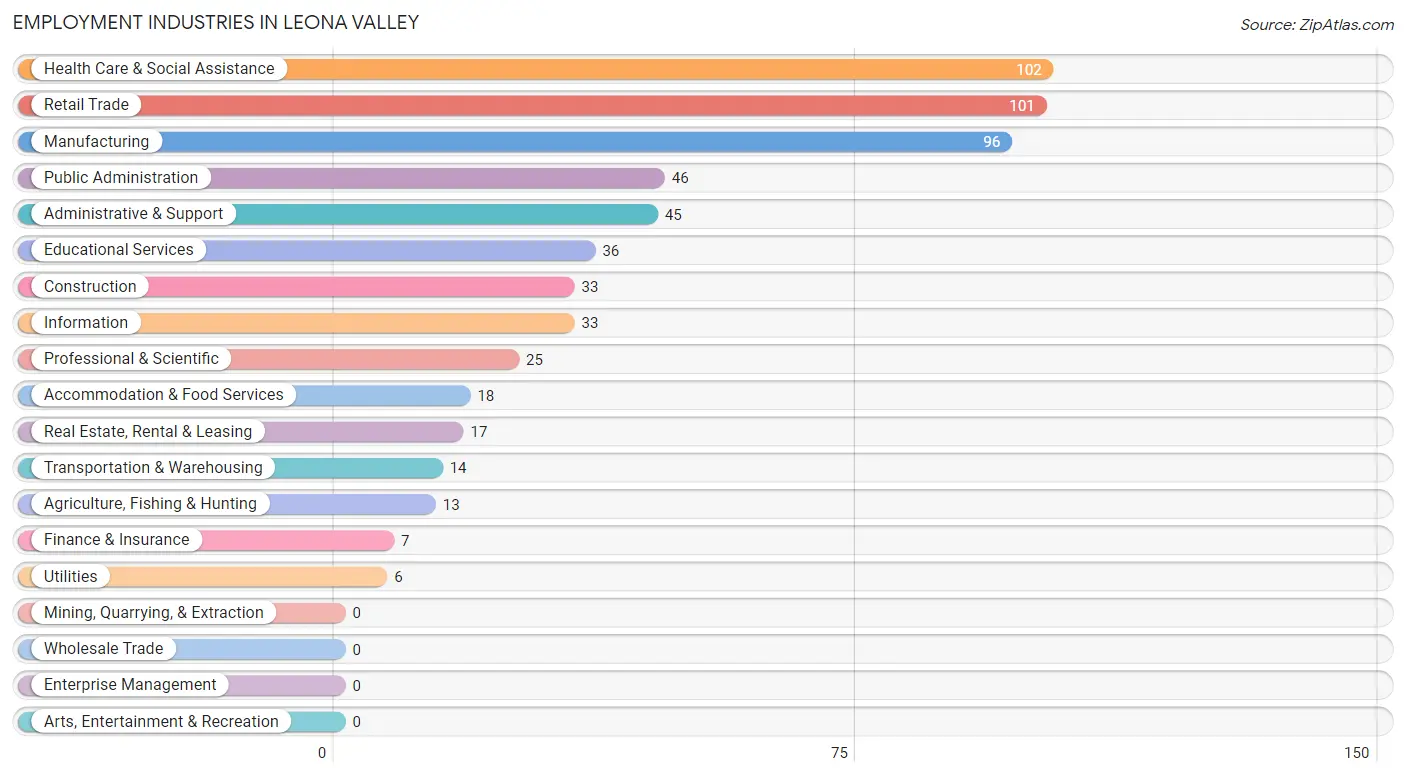
Employment Industries in Leona Valley
The major employment industries in Leona Valley include Health Care & Social Assistance (102 | 16.6%), Retail Trade (101 | 16.4%), Manufacturing (96 | 15.6%), Public Administration (46 | 7.5%), and Administrative & Support (45 | 7.3%).
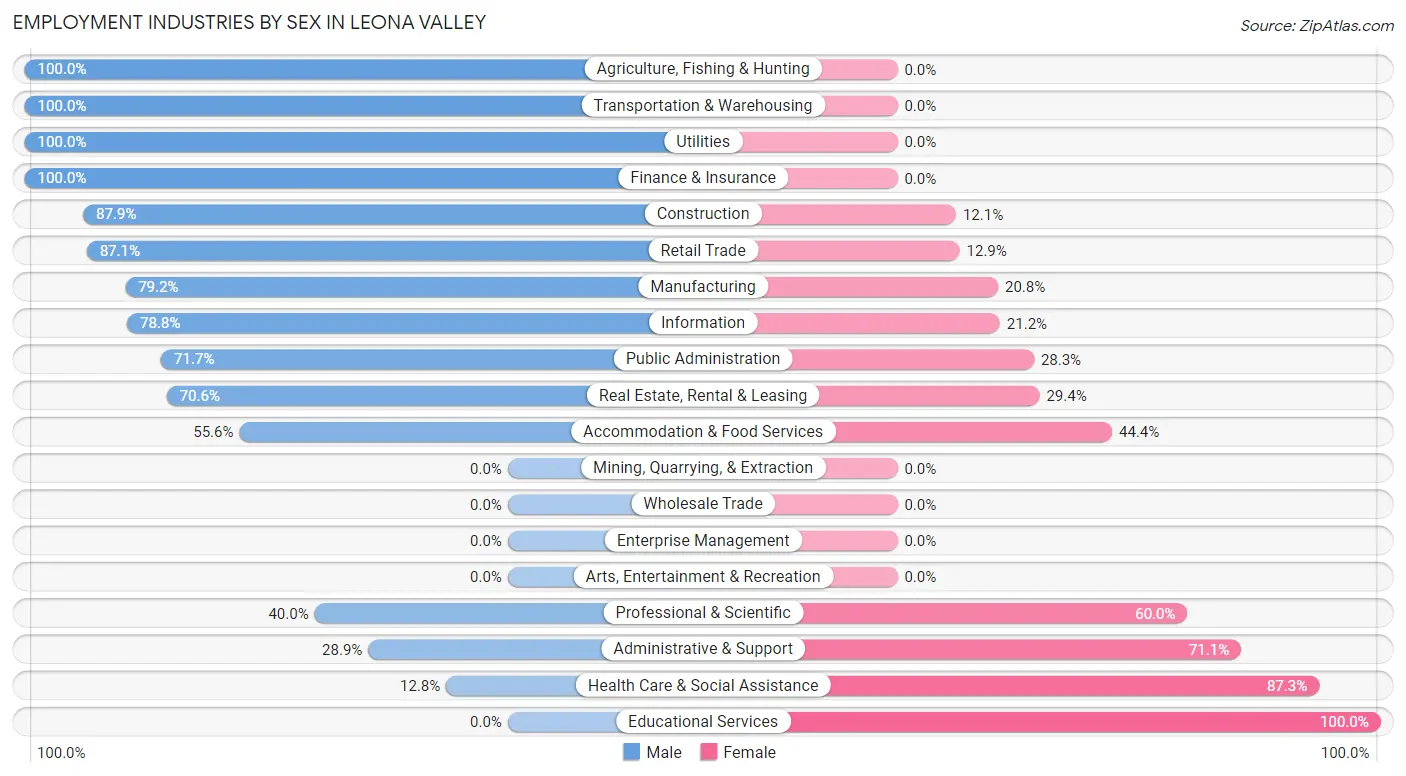
Employment Industries by Sex in Leona Valley
The Leona Valley industries that see more men than women are Agriculture, Fishing & Hunting (100.0%), Transportation & Warehousing (100.0%), and Utilities (100.0%), whereas the industries that tend to have a higher number of women are Educational Services (100.0%), Health Care & Social Assistance (87.3%), and Administrative & Support (71.1%).
| Industry | Male | Female |
| Agriculture, Fishing & Hunting | 13 (100.0%) | 0 (0.0%) |
| Mining, Quarrying, & Extraction | 0 (0.0%) | 0 (0.0%) |
| Construction | 29 (87.9%) | 4 (12.1%) |
| Manufacturing | 76 (79.2%) | 20 (20.8%) |
| Wholesale Trade | 0 (0.0%) | 0 (0.0%) |
| Retail Trade | 88 (87.1%) | 13 (12.9%) |
| Transportation & Warehousing | 14 (100.0%) | 0 (0.0%) |
| Utilities | 6 (100.0%) | 0 (0.0%) |
| Information | 26 (78.8%) | 7 (21.2%) |
| Finance & Insurance | 7 (100.0%) | 0 (0.0%) |
| Real Estate, Rental & Leasing | 12 (70.6%) | 5 (29.4%) |
| Professional & Scientific | 10 (40.0%) | 15 (60.0%) |
| Enterprise Management | 0 (0.0%) | 0 (0.0%) |
| Administrative & Support | 13 (28.9%) | 32 (71.1%) |
| Educational Services | 0 (0.0%) | 36 (100.0%) |
| Health Care & Social Assistance | 13 (12.8%) | 89 (87.3%) |
| Arts, Entertainment & Recreation | 0 (0.0%) | 0 (0.0%) |
| Accommodation & Food Services | 10 (55.6%) | 8 (44.4%) |
| Public Administration | 33 (71.7%) | 13 (28.3%) |
| Total | 373 (60.7%) | 242 (39.4%) |
Education in Leona Valley
School Enrollment in Leona Valley
The most common levels of schooling among the 219 students in Leona Valley are elementary school (65 | 29.7%), high school (58 | 26.5%), and college / undergraduate (26 | 11.9%).
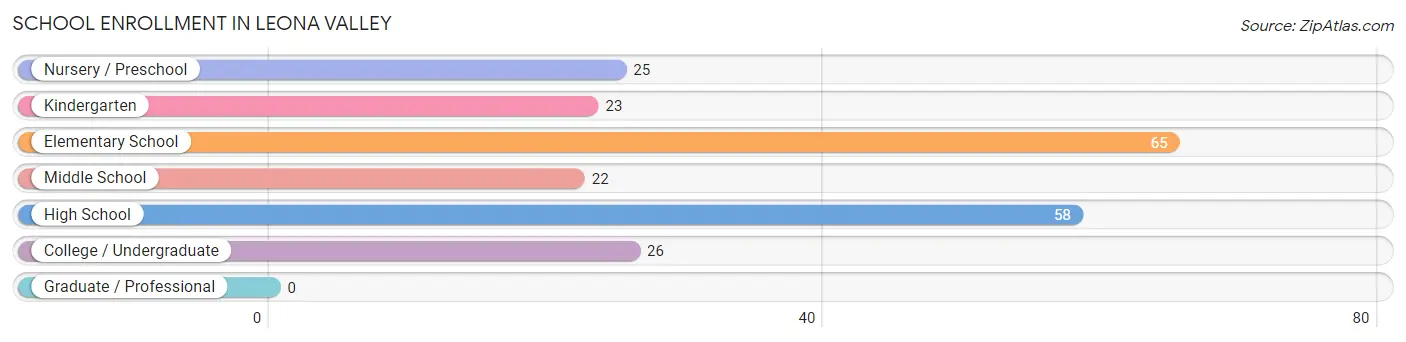
| School Level | # Students | % Students |
| Nursery / Preschool | 25 | 11.4% |
| Kindergarten | 23 | 10.5% |
| Elementary School | 65 | 29.7% |
| Middle School | 22 | 10.1% |
| High School | 58 | 26.5% |
| College / Undergraduate | 26 | 11.9% |
| Graduate / Professional | 0 | 0.0% |
| Total | 219 | 100.0% |
School Enrollment by Age by Funding Source in Leona Valley
Out of a total of 219 students who are enrolled in schools in Leona Valley, 12 (5.5%) attend a private institution, while the remaining 207 (94.5%) are enrolled in public schools. The age group of 5 to 9 year old has the highest likelihood of being enrolled in private schools, with 12 (13.6% in the age bracket) enrolled. Conversely, the age group of 3 to 4 year olds has the lowest likelihood of being enrolled in a private school, with 25 (100.0% in the age bracket) attending a public institution.
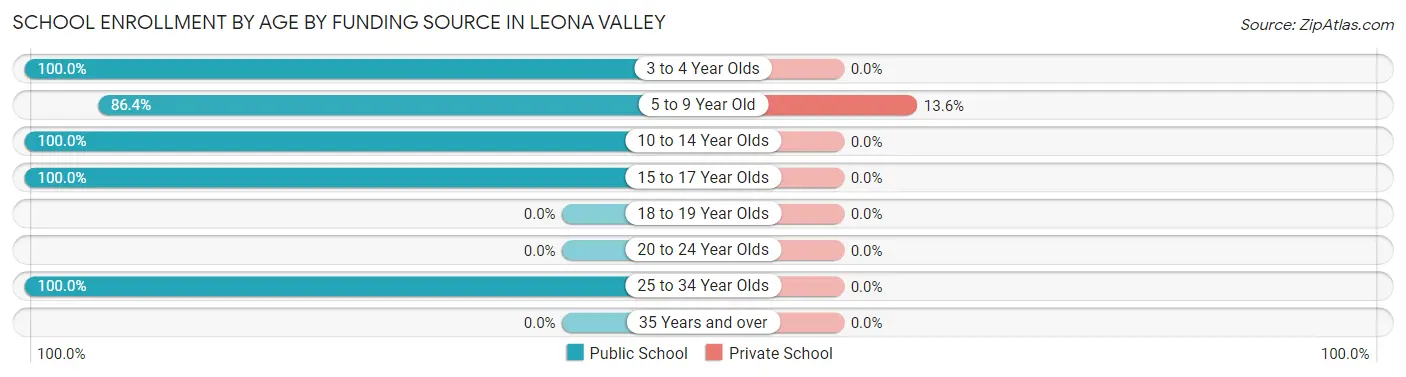
| Age Bracket | Public School | Private School |
| 3 to 4 Year Olds | 25 (100.0%) | 0 (0.0%) |
| 5 to 9 Year Old | 76 (86.4%) | 12 (13.6%) |
| 10 to 14 Year Olds | 22 (100.0%) | 0 (0.0%) |
| 15 to 17 Year Olds | 58 (100.0%) | 0 (0.0%) |
| 18 to 19 Year Olds | 0 (0.0%) | 0 (0.0%) |
| 20 to 24 Year Olds | 0 (0.0%) | 0 (0.0%) |
| 25 to 34 Year Olds | 26 (100.0%) | 0 (0.0%) |
| 35 Years and over | 0 (0.0%) | 0 (0.0%) |
| Total | 207 (94.5%) | 12 (5.5%) |
Educational Attainment by Field of Study in Leona Valley
Bio, nature & agricultural (89 | 18.8%), business (89 | 18.8%), communications (59 | 12.5%), engineering (50 | 10.6%), and science & technology (40 | 8.5%) are the most common fields of study among 473 individuals in Leona Valley who have obtained a bachelor's degree or higher.
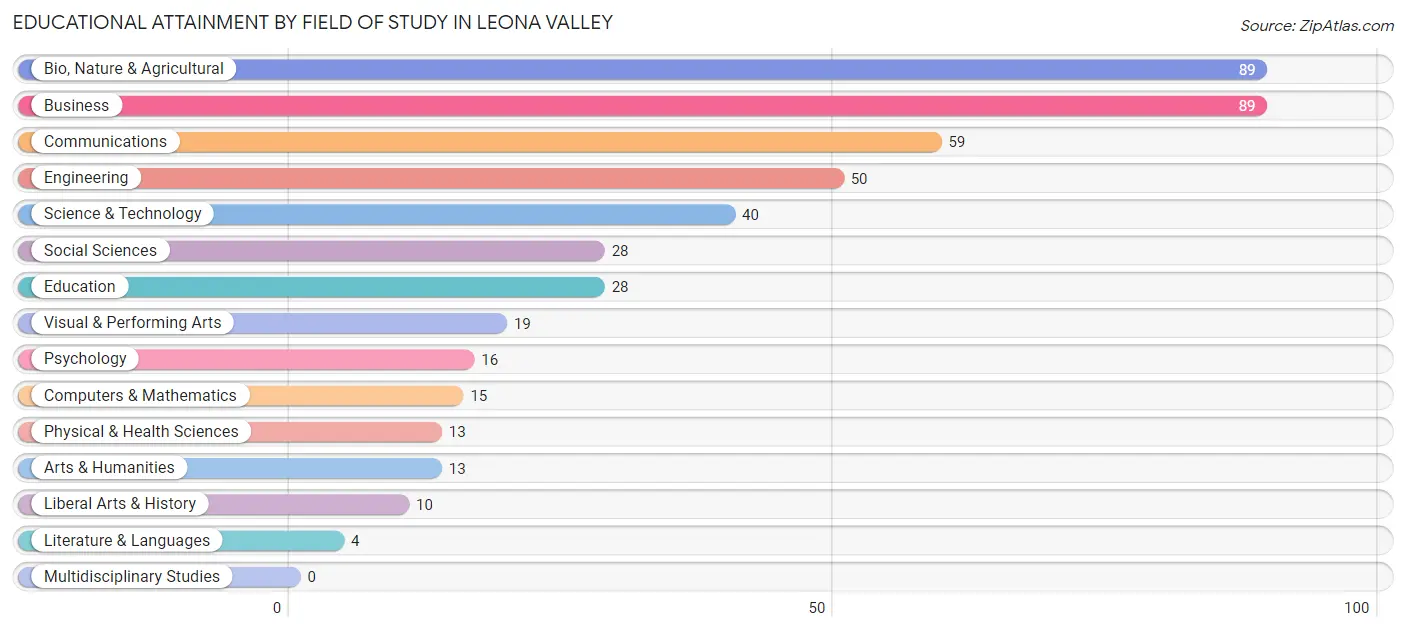
| Field of Study | # Graduates | % Graduates |
| Computers & Mathematics | 15 | 3.2% |
| Bio, Nature & Agricultural | 89 | 18.8% |
| Physical & Health Sciences | 13 | 2.8% |
| Psychology | 16 | 3.4% |
| Social Sciences | 28 | 5.9% |
| Engineering | 50 | 10.6% |
| Multidisciplinary Studies | 0 | 0.0% |
| Science & Technology | 40 | 8.5% |
| Business | 89 | 18.8% |
| Education | 28 | 5.9% |
| Literature & Languages | 4 | 0.9% |
| Liberal Arts & History | 10 | 2.1% |
| Visual & Performing Arts | 19 | 4.0% |
| Communications | 59 | 12.5% |
| Arts & Humanities | 13 | 2.8% |
| Total | 473 | 100.0% |
Transportation & Commute in Leona Valley
Vehicle Availability by Sex in Leona Valley
The most prevalent vehicle ownership categories in Leona Valley are males with 2 vehicles (108, accounting for 31.9%) and females with 2 vehicles (27, making up 51.4%).
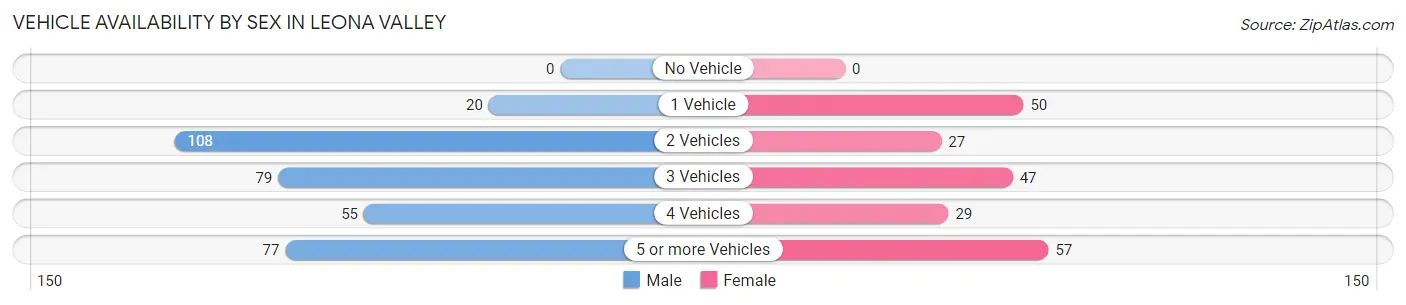
| Vehicles Available | Male | Female |
| No Vehicle | 0 (0.0%) | 0 (0.0%) |
| 1 Vehicle | 20 (5.9%) | 50 (23.8%) |
| 2 Vehicles | 108 (31.9%) | 27 (12.9%) |
| 3 Vehicles | 79 (23.3%) | 47 (22.4%) |
| 4 Vehicles | 55 (16.2%) | 29 (13.8%) |
| 5 or more Vehicles | 77 (22.7%) | 57 (27.1%) |
| Total | 339 (100.0%) | 210 (100.0%) |
Commute Time in Leona Valley
The most frequently occuring commute durations in Leona Valley are 20 to 24 minutes (116 commuters, 24.4%), 15 to 19 minutes (97 commuters, 20.4%), and 45 to 59 minutes (77 commuters, 16.2%).
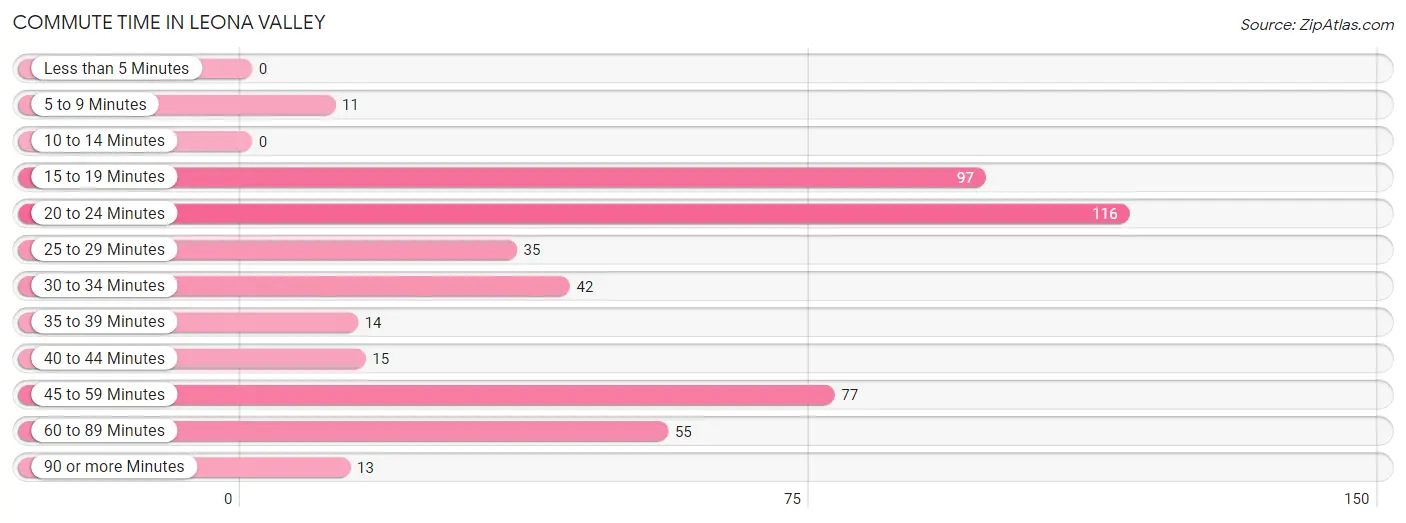
| Commute Time | # Commuters | % Commuters |
| Less than 5 Minutes | 0 | 0.0% |
| 5 to 9 Minutes | 11 | 2.3% |
| 10 to 14 Minutes | 0 | 0.0% |
| 15 to 19 Minutes | 97 | 20.4% |
| 20 to 24 Minutes | 116 | 24.4% |
| 25 to 29 Minutes | 35 | 7.4% |
| 30 to 34 Minutes | 42 | 8.8% |
| 35 to 39 Minutes | 14 | 2.9% |
| 40 to 44 Minutes | 15 | 3.2% |
| 45 to 59 Minutes | 77 | 16.2% |
| 60 to 89 Minutes | 55 | 11.6% |
| 90 or more Minutes | 13 | 2.7% |
Commute Time by Sex in Leona Valley
The most common commute times in Leona Valley are 20 to 24 minutes (55 commuters, 18.1%) for males and 20 to 24 minutes (61 commuters, 35.7%) for females.
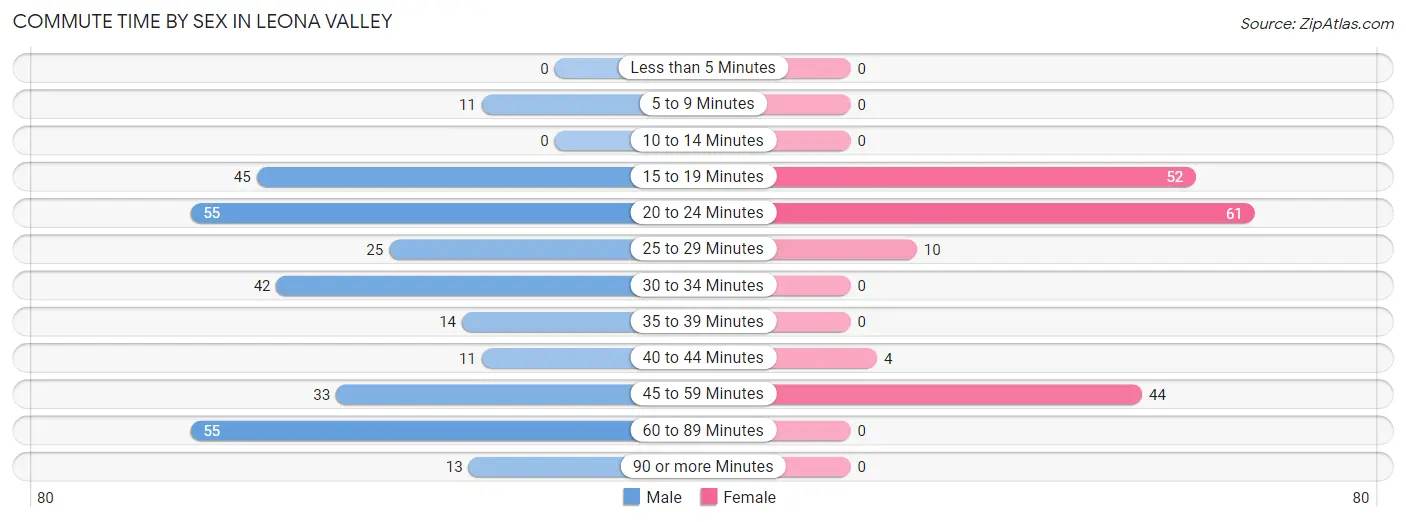
| Commute Time | Male | Female |
| Less than 5 Minutes | 0 (0.0%) | 0 (0.0%) |
| 5 to 9 Minutes | 11 (3.6%) | 0 (0.0%) |
| 10 to 14 Minutes | 0 (0.0%) | 0 (0.0%) |
| 15 to 19 Minutes | 45 (14.8%) | 52 (30.4%) |
| 20 to 24 Minutes | 55 (18.1%) | 61 (35.7%) |
| 25 to 29 Minutes | 25 (8.2%) | 10 (5.9%) |
| 30 to 34 Minutes | 42 (13.8%) | 0 (0.0%) |
| 35 to 39 Minutes | 14 (4.6%) | 0 (0.0%) |
| 40 to 44 Minutes | 11 (3.6%) | 4 (2.3%) |
| 45 to 59 Minutes | 33 (10.9%) | 44 (25.7%) |
| 60 to 89 Minutes | 55 (18.1%) | 0 (0.0%) |
| 90 or more Minutes | 13 (4.3%) | 0 (0.0%) |
Time of Departure to Work by Sex in Leona Valley
The most frequent times of departure to work in Leona Valley are 12:00 AM to 4:59 AM (87, 28.6%) for males and 7:00 AM to 7:29 AM (85, 49.7%) for females.
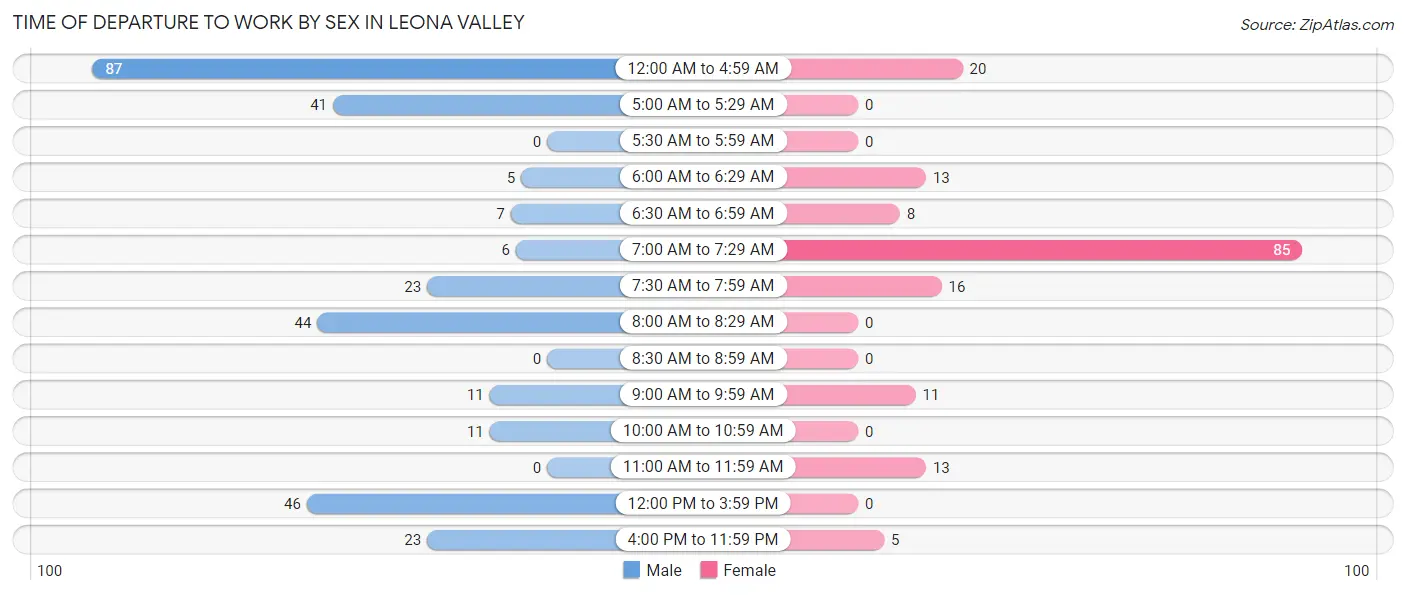
| Time of Departure | Male | Female |
| 12:00 AM to 4:59 AM | 87 (28.6%) | 20 (11.7%) |
| 5:00 AM to 5:29 AM | 41 (13.5%) | 0 (0.0%) |
| 5:30 AM to 5:59 AM | 0 (0.0%) | 0 (0.0%) |
| 6:00 AM to 6:29 AM | 5 (1.6%) | 13 (7.6%) |
| 6:30 AM to 6:59 AM | 7 (2.3%) | 8 (4.7%) |
| 7:00 AM to 7:29 AM | 6 (2.0%) | 85 (49.7%) |
| 7:30 AM to 7:59 AM | 23 (7.6%) | 16 (9.4%) |
| 8:00 AM to 8:29 AM | 44 (14.5%) | 0 (0.0%) |
| 8:30 AM to 8:59 AM | 0 (0.0%) | 0 (0.0%) |
| 9:00 AM to 9:59 AM | 11 (3.6%) | 11 (6.4%) |
| 10:00 AM to 10:59 AM | 11 (3.6%) | 0 (0.0%) |
| 11:00 AM to 11:59 AM | 0 (0.0%) | 13 (7.6%) |
| 12:00 PM to 3:59 PM | 46 (15.1%) | 0 (0.0%) |
| 4:00 PM to 11:59 PM | 23 (7.6%) | 5 (2.9%) |
| Total | 304 (100.0%) | 171 (100.0%) |
Housing Occupancy in Leona Valley
Occupancy by Ownership in Leona Valley
Of the total 604 dwellings in Leona Valley, owner-occupied units account for 583 (96.5%), while renter-occupied units make up 21 (3.5%).
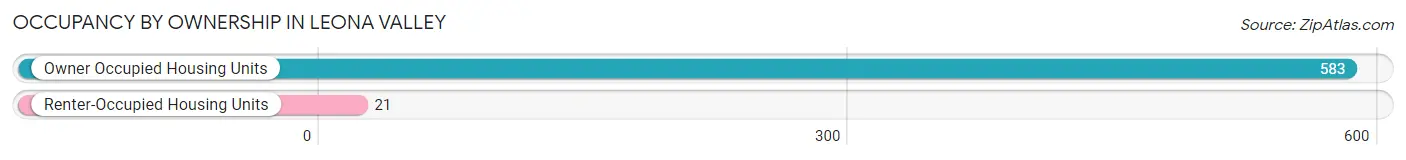
| Occupancy | # Housing Units | % Housing Units |
| Owner Occupied Housing Units | 583 | 96.5% |
| Renter-Occupied Housing Units | 21 | 3.5% |
| Total Occupied Housing Units | 604 | 100.0% |
Occupancy by Household Size in Leona Valley
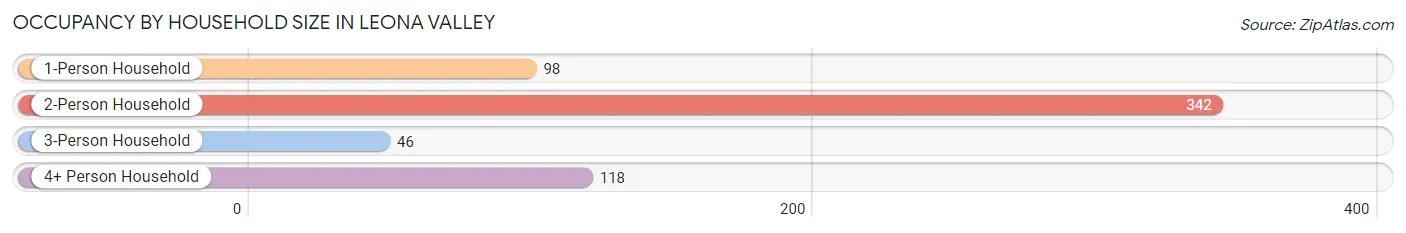
| Household Size | # Housing Units | % Housing Units |
| 1-Person Household | 98 | 16.2% |
| 2-Person Household | 342 | 56.6% |
| 3-Person Household | 46 | 7.6% |
| 4+ Person Household | 118 | 19.5% |
| Total Housing Units | 604 | 100.0% |
Occupancy by Ownership by Household Size in Leona Valley
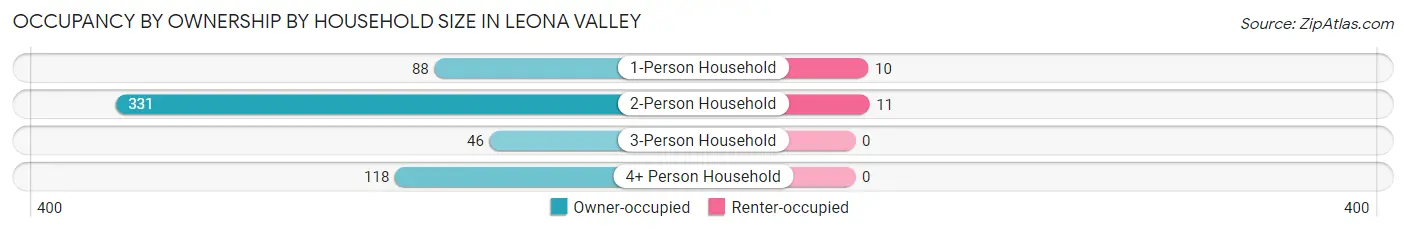
| Household Size | Owner-occupied | Renter-occupied |
| 1-Person Household | 88 (89.8%) | 10 (10.2%) |
| 2-Person Household | 331 (96.8%) | 11 (3.2%) |
| 3-Person Household | 46 (100.0%) | 0 (0.0%) |
| 4+ Person Household | 118 (100.0%) | 0 (0.0%) |
| Total Housing Units | 583 (96.5%) | 21 (3.5%) |
Occupancy by Educational Attainment in Leona Valley
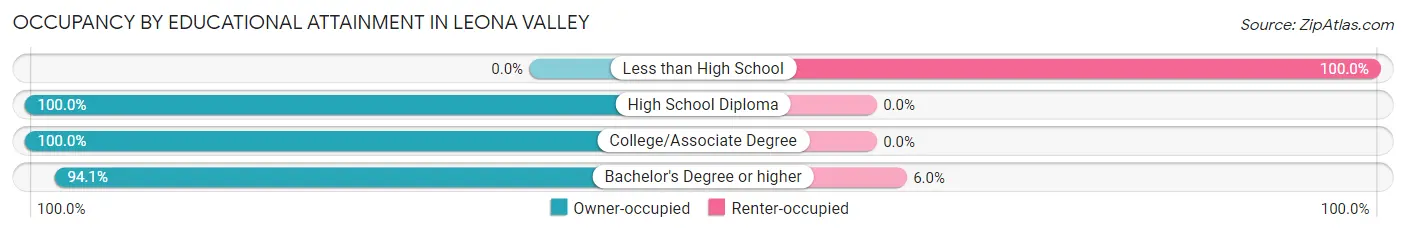
| Household Size | Owner-occupied | Renter-occupied |
| Less than High School | 0 (0.0%) | 6 (100.0%) |
| High School Diploma | 110 (100.0%) | 0 (0.0%) |
| College/Associate Degree | 236 (100.0%) | 0 (0.0%) |
| Bachelor's Degree or higher | 237 (94.1%) | 15 (5.9%) |
Occupancy by Age of Householder in Leona Valley
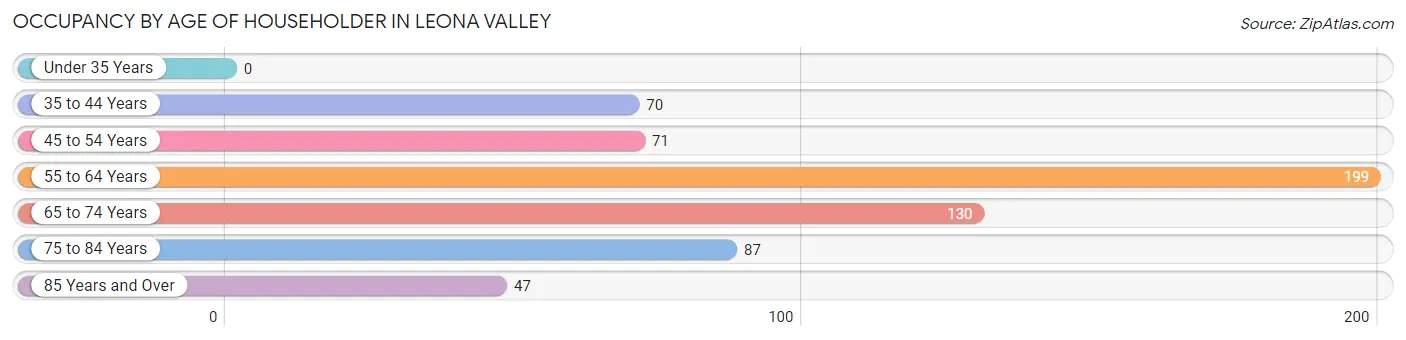
| Age Bracket | # Households | % Households |
| Under 35 Years | 0 | 0.0% |
| 35 to 44 Years | 70 | 11.6% |
| 45 to 54 Years | 71 | 11.7% |
| 55 to 64 Years | 199 | 33.0% |
| 65 to 74 Years | 130 | 21.5% |
| 75 to 84 Years | 87 | 14.4% |
| 85 Years and Over | 47 | 7.8% |
| Total | 604 | 100.0% |
Housing Finances in Leona Valley
Median Income by Occupancy in Leona Valley
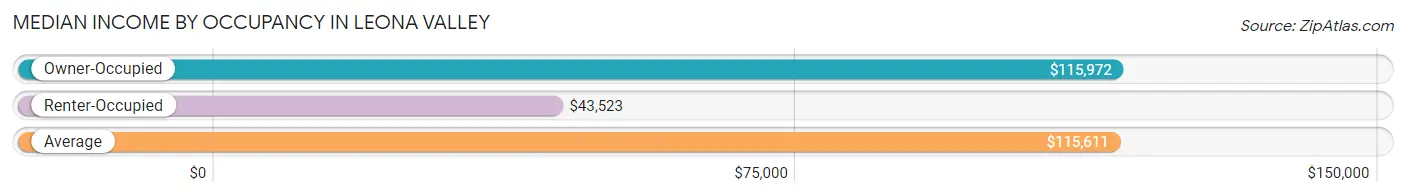
| Occupancy Type | # Households | Median Income |
| Owner-Occupied | 583 (96.5%) | $115,972 |
| Renter-Occupied | 21 (3.5%) | $43,523 |
| Average | 604 (100.0%) | $115,611 |
Occupancy by Householder Income Bracket in Leona Valley
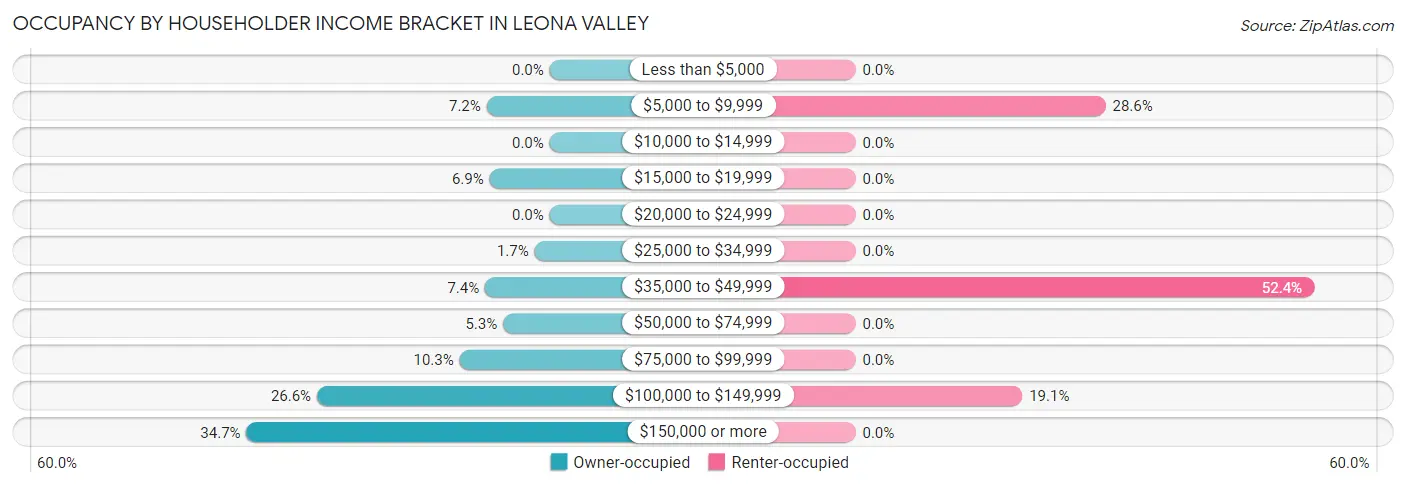
| Income Bracket | Owner-occupied | Renter-occupied |
| Less than $5,000 | 0 (0.0%) | 0 (0.0%) |
| $5,000 to $9,999 | 42 (7.2%) | 6 (28.6%) |
| $10,000 to $14,999 | 0 (0.0%) | 0 (0.0%) |
| $15,000 to $19,999 | 40 (6.9%) | 0 (0.0%) |
| $20,000 to $24,999 | 0 (0.0%) | 0 (0.0%) |
| $25,000 to $34,999 | 10 (1.7%) | 0 (0.0%) |
| $35,000 to $49,999 | 43 (7.4%) | 11 (52.4%) |
| $50,000 to $74,999 | 31 (5.3%) | 0 (0.0%) |
| $75,000 to $99,999 | 60 (10.3%) | 0 (0.0%) |
| $100,000 to $149,999 | 155 (26.6%) | 4 (19.1%) |
| $150,000 or more | 202 (34.6%) | 0 (0.0%) |
| Total | 583 (100.0%) | 21 (100.0%) |
Monthly Housing Cost Tiers in Leona Valley
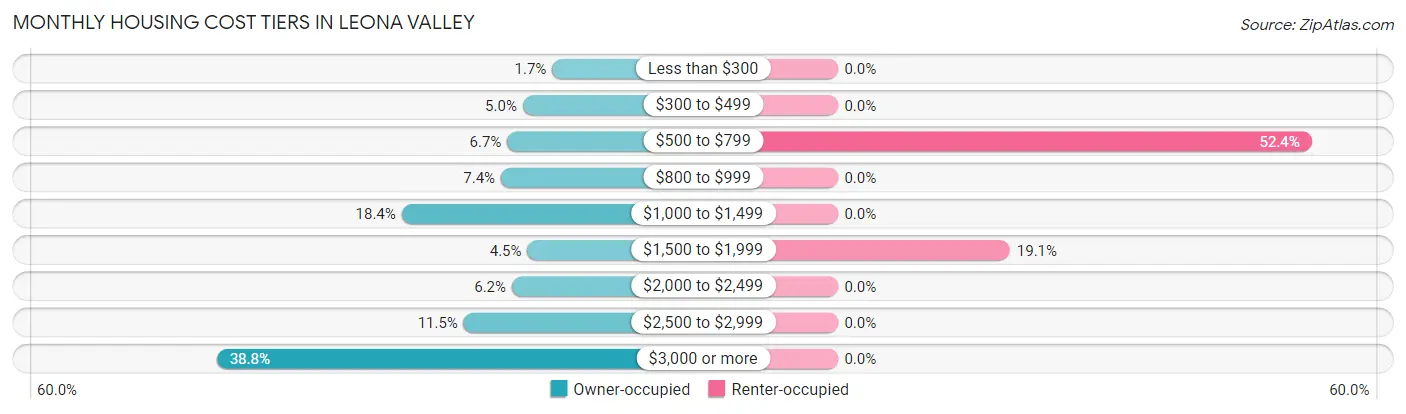
| Monthly Cost | Owner-occupied | Renter-occupied |
| Less than $300 | 10 (1.7%) | 0 (0.0%) |
| $300 to $499 | 29 (5.0%) | 0 (0.0%) |
| $500 to $799 | 39 (6.7%) | 11 (52.4%) |
| $800 to $999 | 43 (7.4%) | 0 (0.0%) |
| $1,000 to $1,499 | 107 (18.3%) | 0 (0.0%) |
| $1,500 to $1,999 | 26 (4.5%) | 4 (19.1%) |
| $2,000 to $2,499 | 36 (6.2%) | 0 (0.0%) |
| $2,500 to $2,999 | 67 (11.5%) | 0 (0.0%) |
| $3,000 or more | 226 (38.8%) | 0 (0.0%) |
| Total | 583 (100.0%) | 21 (100.0%) |
Physical Housing Characteristics in Leona Valley
Housing Structures in Leona Valley
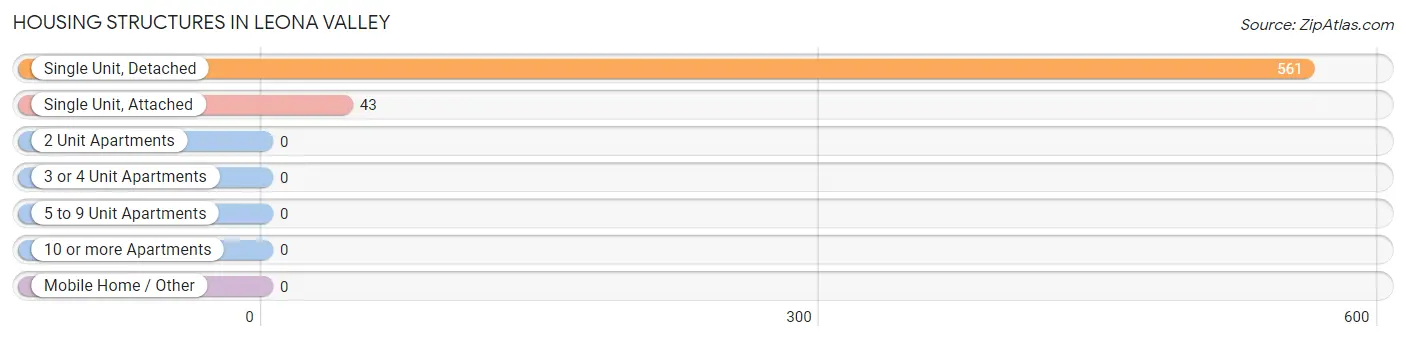
| Structure Type | # Housing Units | % Housing Units |
| Single Unit, Detached | 561 | 92.9% |
| Single Unit, Attached | 43 | 7.1% |
| 2 Unit Apartments | 0 | 0.0% |
| 3 or 4 Unit Apartments | 0 | 0.0% |
| 5 to 9 Unit Apartments | 0 | 0.0% |
| 10 or more Apartments | 0 | 0.0% |
| Mobile Home / Other | 0 | 0.0% |
| Total | 604 | 100.0% |
Housing Structures by Occupancy in Leona Valley
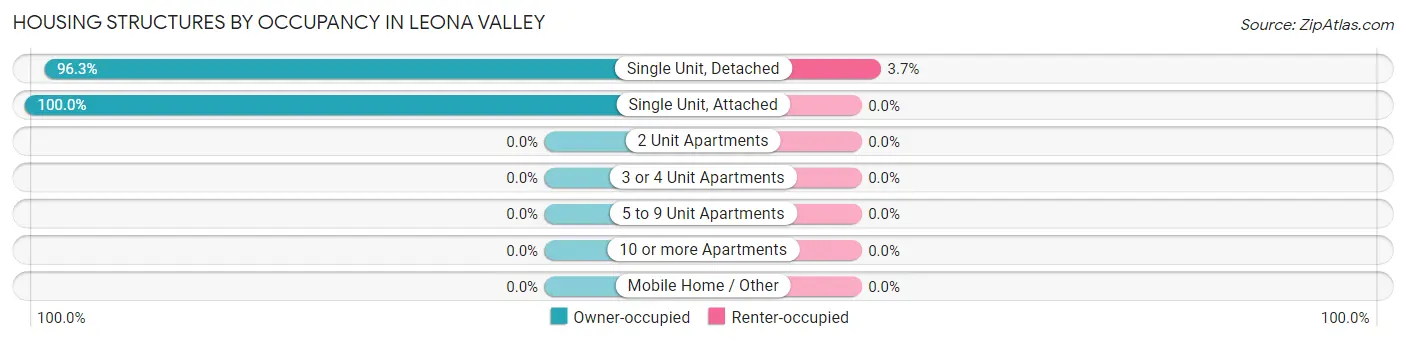
| Structure Type | Owner-occupied | Renter-occupied |
| Single Unit, Detached | 540 (96.3%) | 21 (3.7%) |
| Single Unit, Attached | 43 (100.0%) | 0 (0.0%) |
| 2 Unit Apartments | 0 (0.0%) | 0 (0.0%) |
| 3 or 4 Unit Apartments | 0 (0.0%) | 0 (0.0%) |
| 5 to 9 Unit Apartments | 0 (0.0%) | 0 (0.0%) |
| 10 or more Apartments | 0 (0.0%) | 0 (0.0%) |
| Mobile Home / Other | 0 (0.0%) | 0 (0.0%) |
| Total | 583 (96.5%) | 21 (3.5%) |
Housing Structures by Number of Rooms in Leona Valley
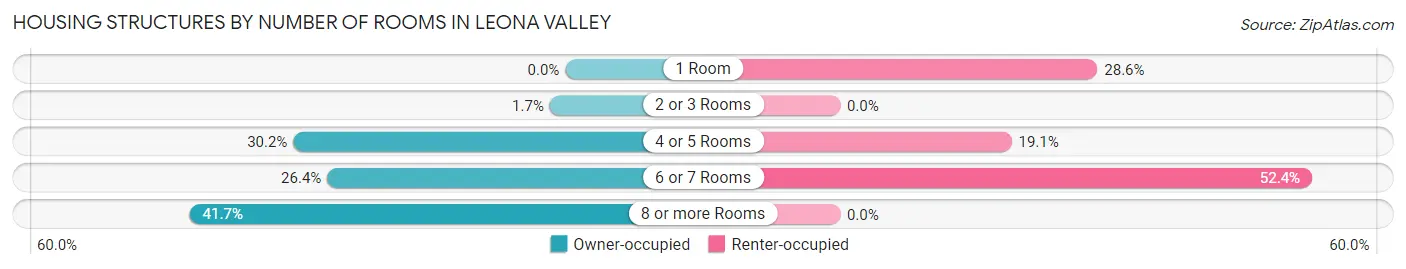
| Number of Rooms | Owner-occupied | Renter-occupied |
| 1 Room | 0 (0.0%) | 6 (28.6%) |
| 2 or 3 Rooms | 10 (1.7%) | 0 (0.0%) |
| 4 or 5 Rooms | 176 (30.2%) | 4 (19.1%) |
| 6 or 7 Rooms | 154 (26.4%) | 11 (52.4%) |
| 8 or more Rooms | 243 (41.7%) | 0 (0.0%) |
| Total | 583 (100.0%) | 21 (100.0%) |
Housing Structure by Heating Type in Leona Valley
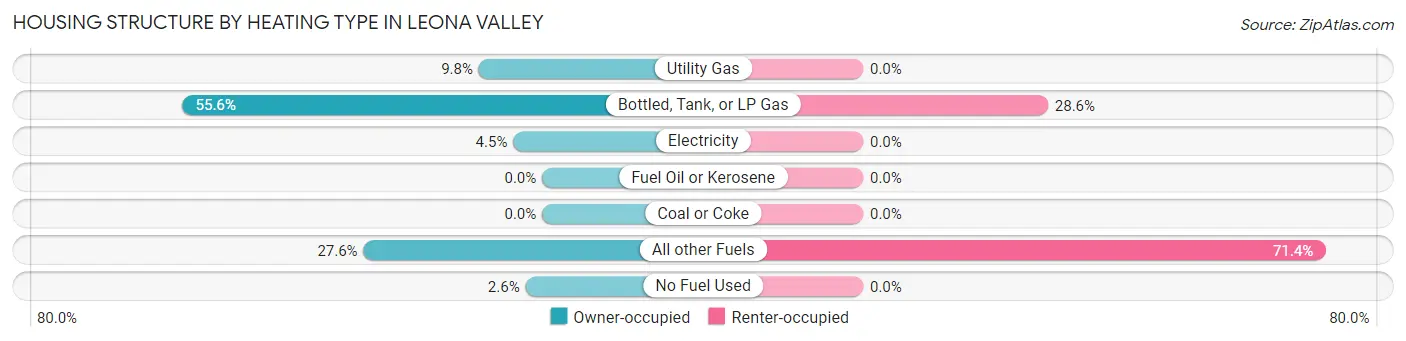
| Heating Type | Owner-occupied | Renter-occupied |
| Utility Gas | 57 (9.8%) | 0 (0.0%) |
| Bottled, Tank, or LP Gas | 324 (55.6%) | 6 (28.6%) |
| Electricity | 26 (4.5%) | 0 (0.0%) |
| Fuel Oil or Kerosene | 0 (0.0%) | 0 (0.0%) |
| Coal or Coke | 0 (0.0%) | 0 (0.0%) |
| All other Fuels | 161 (27.6%) | 15 (71.4%) |
| No Fuel Used | 15 (2.6%) | 0 (0.0%) |
| Total | 583 (100.0%) | 21 (100.0%) |
Household Vehicle Usage in Leona Valley
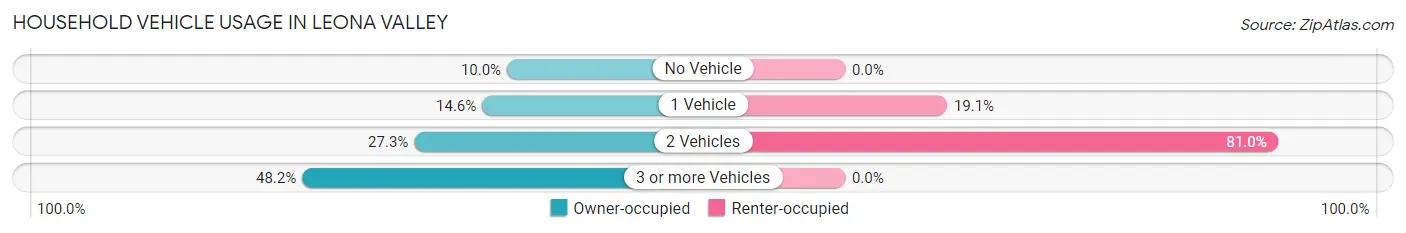
| Vehicles per Household | Owner-occupied | Renter-occupied |
| No Vehicle | 58 (10.0%) | 0 (0.0%) |
| 1 Vehicle | 85 (14.6%) | 4 (19.1%) |
| 2 Vehicles | 159 (27.3%) | 17 (80.9%) |
| 3 or more Vehicles | 281 (48.2%) | 0 (0.0%) |
| Total | 583 (100.0%) | 21 (100.0%) |
Real Estate & Mortgages in Leona Valley
Real Estate and Mortgage Overview in Leona Valley
| Characteristic | Without Mortgage | With Mortgage |
| Housing Units | 199 | 384 |
| Median Property Value | $556,900 | $670,600 |
| Median Household Income | $107,014 | $175 |
| Monthly Housing Costs | $894 | $216 |
| Real Estate Taxes | $4,864 | $0 |
Property Value by Mortgage Status in Leona Valley
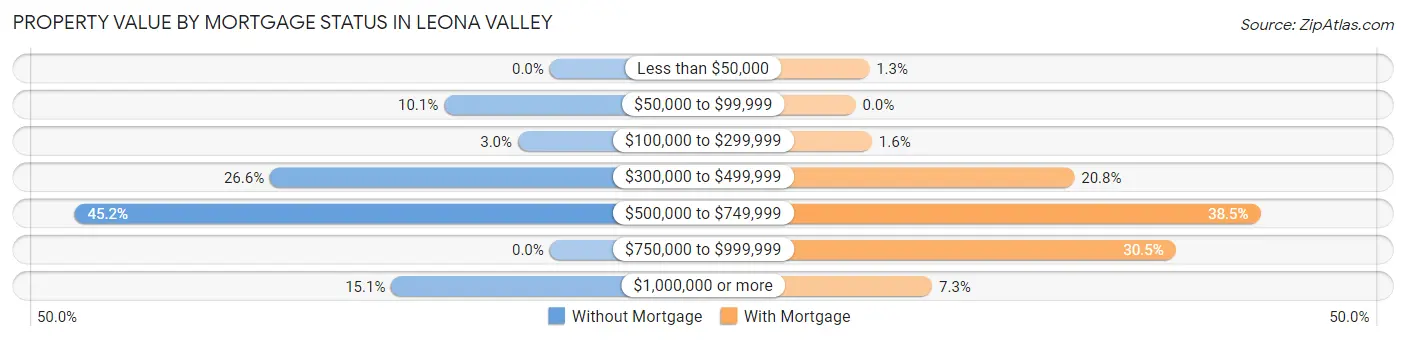
| Property Value | Without Mortgage | With Mortgage |
| Less than $50,000 | 0 (0.0%) | 5 (1.3%) |
| $50,000 to $99,999 | 20 (10.1%) | 0 (0.0%) |
| $100,000 to $299,999 | 6 (3.0%) | 6 (1.6%) |
| $300,000 to $499,999 | 53 (26.6%) | 80 (20.8%) |
| $500,000 to $749,999 | 90 (45.2%) | 148 (38.5%) |
| $750,000 to $999,999 | 0 (0.0%) | 117 (30.5%) |
| $1,000,000 or more | 30 (15.1%) | 28 (7.3%) |
| Total | 199 (100.0%) | 384 (100.0%) |
Household Income by Mortgage Status in Leona Valley
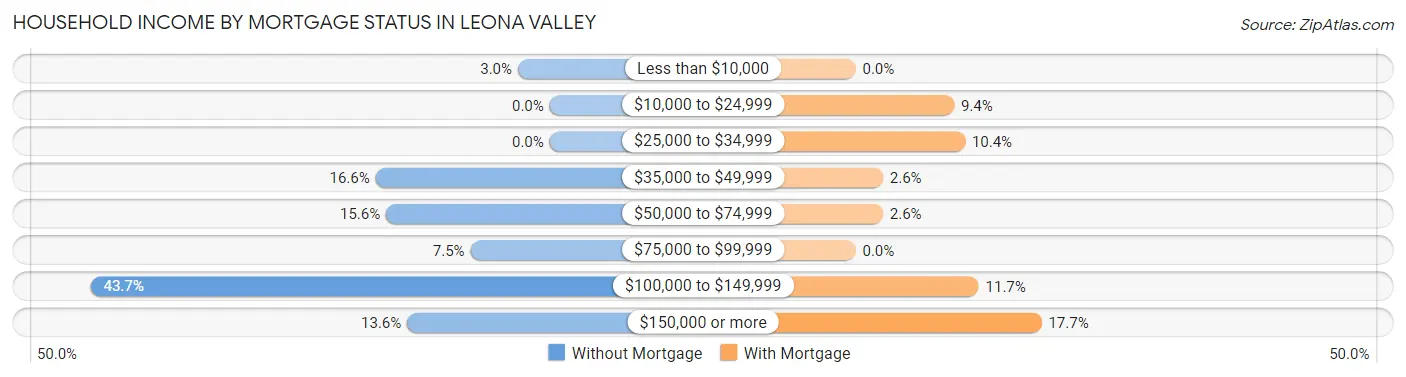
| Household Income | Without Mortgage | With Mortgage |
| Less than $10,000 | 6 (3.0%) | 0 (0.0%) |
| $10,000 to $24,999 | 0 (0.0%) | 36 (9.4%) |
| $25,000 to $34,999 | 0 (0.0%) | 40 (10.4%) |
| $35,000 to $49,999 | 33 (16.6%) | 10 (2.6%) |
| $50,000 to $74,999 | 31 (15.6%) | 10 (2.6%) |
| $75,000 to $99,999 | 15 (7.5%) | 0 (0.0%) |
| $100,000 to $149,999 | 87 (43.7%) | 45 (11.7%) |
| $150,000 or more | 27 (13.6%) | 68 (17.7%) |
| Total | 199 (100.0%) | 384 (100.0%) |
Property Value to Household Income Ratio in Leona Valley
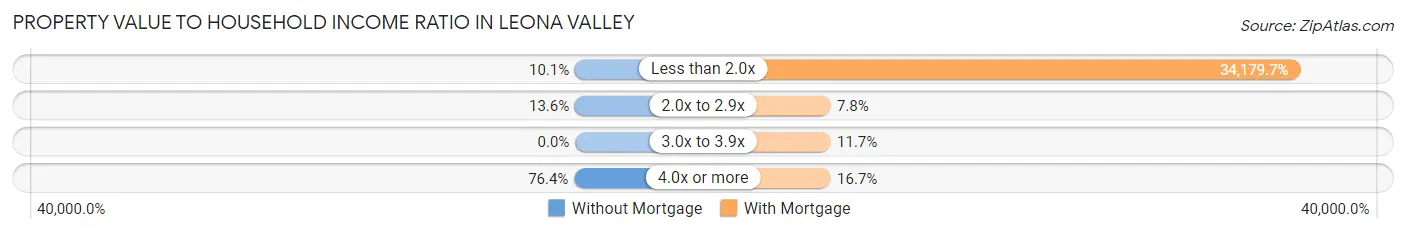
| Value-to-Income Ratio | Without Mortgage | With Mortgage |
| Less than 2.0x | 20 (10.1%) | 131,250 (34,179.7%) |
| 2.0x to 2.9x | 27 (13.6%) | 30 (7.8%) |
| 3.0x to 3.9x | 0 (0.0%) | 45 (11.7%) |
| 4.0x or more | 152 (76.4%) | 64 (16.7%) |
| Total | 199 (100.0%) | 384 (100.0%) |
Real Estate Taxes by Mortgage Status in Leona Valley
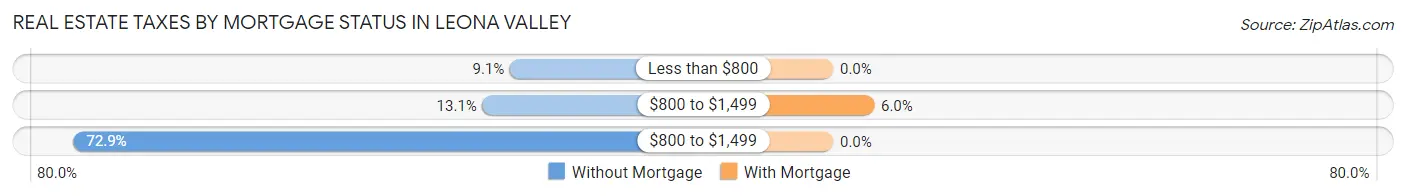
| Property Taxes | Without Mortgage | With Mortgage |
| Less than $800 | 18 (9.0%) | 0 (0.0%) |
| $800 to $1,499 | 26 (13.1%) | 23 (6.0%) |
| $800 to $1,499 | 145 (72.9%) | 0 (0.0%) |
| Total | 199 (100.0%) | 384 (100.0%) |
Health & Disability in Leona Valley
Health Insurance Coverage by Age in Leona Valley
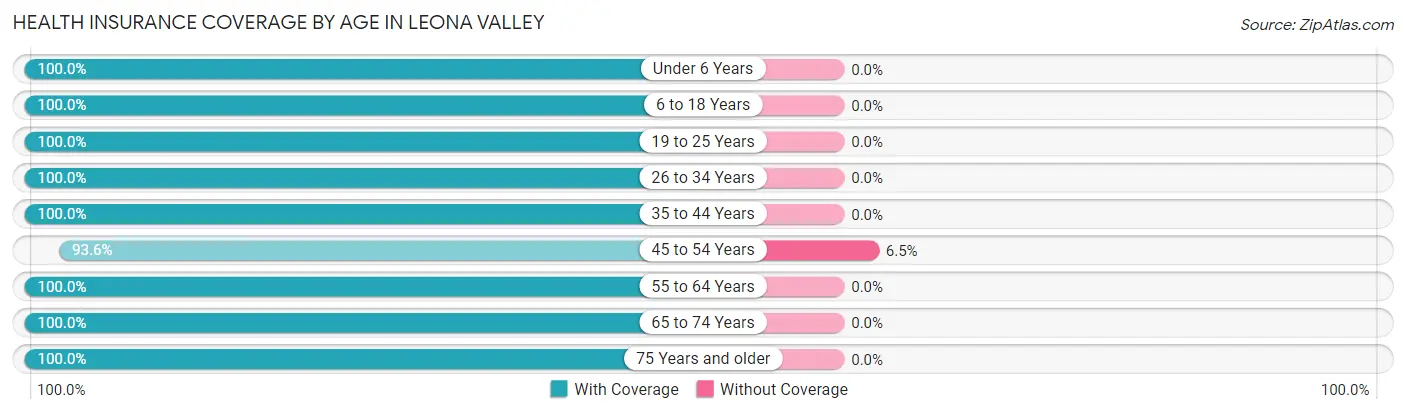
| Age Bracket | With Coverage | Without Coverage |
| Under 6 Years | 147 (100.0%) | 0 (0.0%) |
| 6 to 18 Years | 156 (100.0%) | 0 (0.0%) |
| 19 to 25 Years | 8 (100.0%) | 0 (0.0%) |
| 26 to 34 Years | 85 (100.0%) | 0 (0.0%) |
| 35 to 44 Years | 144 (100.0%) | 0 (0.0%) |
| 45 to 54 Years | 145 (93.5%) | 10 (6.5%) |
| 55 to 64 Years | 390 (100.0%) | 0 (0.0%) |
| 65 to 74 Years | 277 (100.0%) | 0 (0.0%) |
| 75 Years and older | 207 (100.0%) | 0 (0.0%) |
| Total | 1,559 (99.4%) | 10 (0.6%) |
Health Insurance Coverage by Citizenship Status in Leona Valley
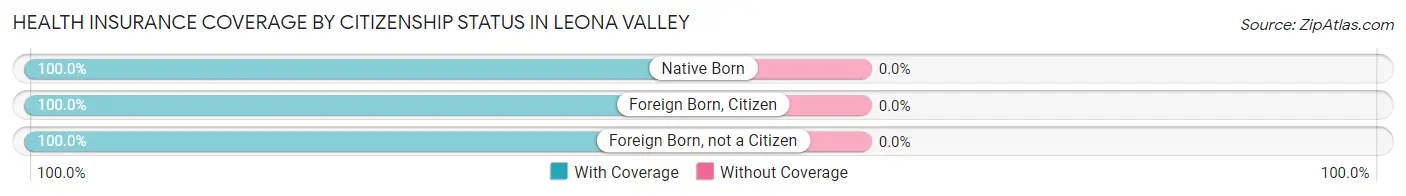
| Citizenship Status | With Coverage | Without Coverage |
| Native Born | 147 (100.0%) | 0 (0.0%) |
| Foreign Born, Citizen | 156 (100.0%) | 0 (0.0%) |
| Foreign Born, not a Citizen | 8 (100.0%) | 0 (0.0%) |
Health Insurance Coverage by Household Income in Leona Valley
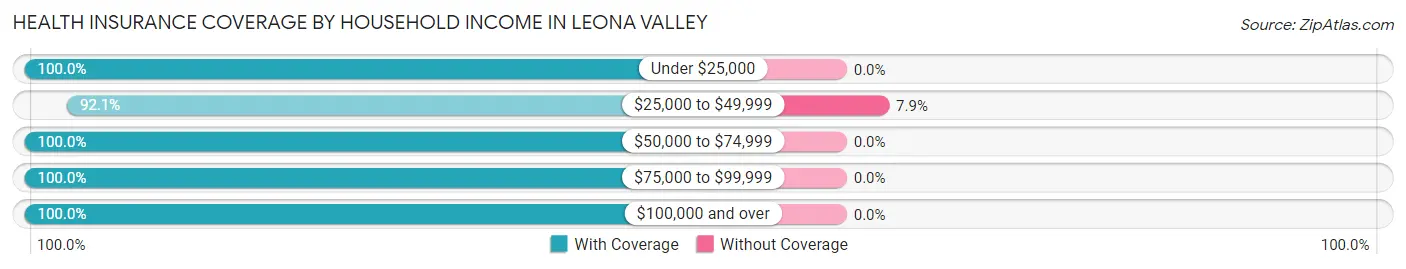
| Household Income | With Coverage | Without Coverage |
| Under $25,000 | 93 (100.0%) | 0 (0.0%) |
| $25,000 to $49,999 | 116 (92.1%) | 10 (7.9%) |
| $50,000 to $74,999 | 101 (100.0%) | 0 (0.0%) |
| $75,000 to $99,999 | 140 (100.0%) | 0 (0.0%) |
| $100,000 and over | 1,109 (100.0%) | 0 (0.0%) |
Public vs Private Health Insurance Coverage by Age in Leona Valley
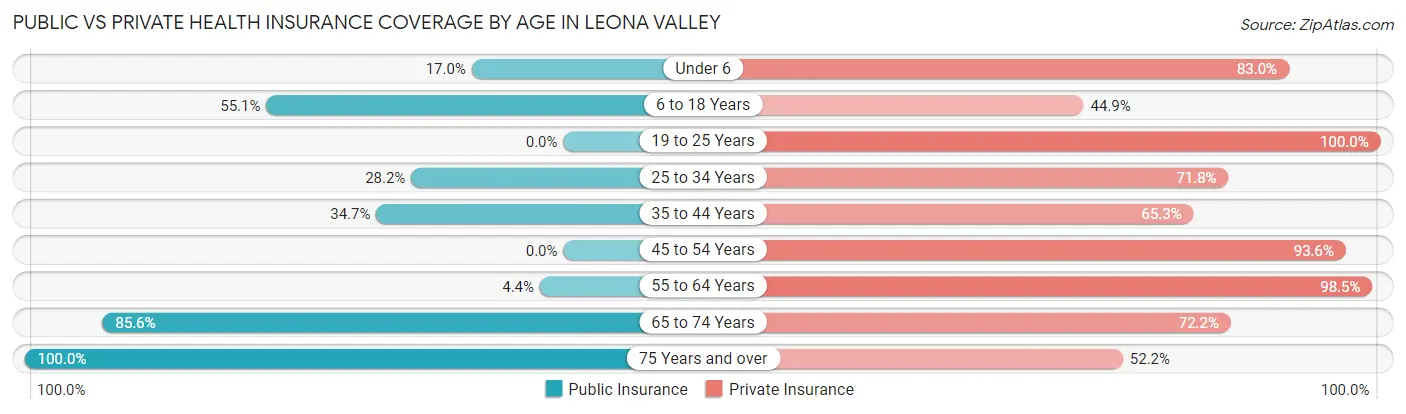
| Age Bracket | Public Insurance | Private Insurance |
| Under 6 | 25 (17.0%) | 122 (83.0%) |
| 6 to 18 Years | 86 (55.1%) | 70 (44.9%) |
| 19 to 25 Years | 0 (0.0%) | 8 (100.0%) |
| 25 to 34 Years | 24 (28.2%) | 61 (71.8%) |
| 35 to 44 Years | 50 (34.7%) | 94 (65.3%) |
| 45 to 54 Years | 0 (0.0%) | 145 (93.5%) |
| 55 to 64 Years | 17 (4.4%) | 384 (98.5%) |
| 65 to 74 Years | 237 (85.6%) | 200 (72.2%) |
| 75 Years and over | 207 (100.0%) | 108 (52.2%) |
| Total | 646 (41.2%) | 1,192 (76.0%) |
Disability Status by Sex by Age in Leona Valley
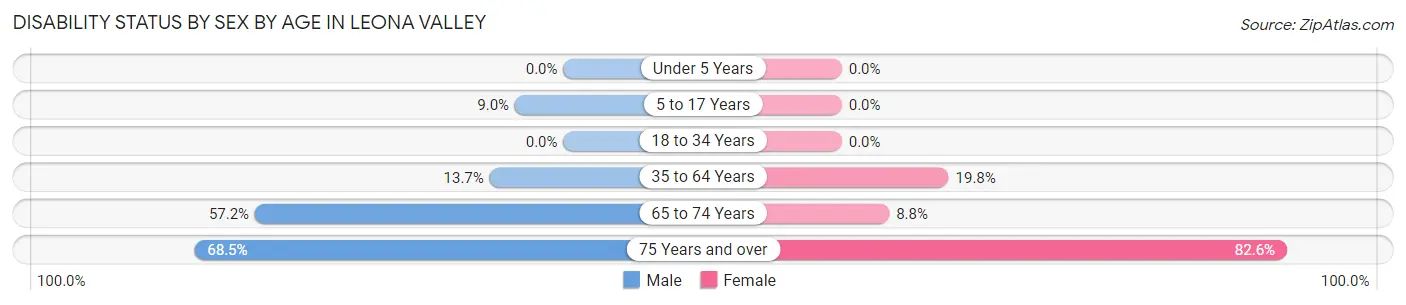
| Age Bracket | Male | Female |
| Under 5 Years | 0 (0.0%) | 0 (0.0%) |
| 5 to 17 Years | 8 (9.0%) | 0 (0.0%) |
| 18 to 34 Years | 0 (0.0%) | 0 (0.0%) |
| 35 to 64 Years | 46 (13.7%) | 70 (19.8%) |
| 65 to 74 Years | 87 (57.2%) | 11 (8.8%) |
| 75 Years and over | 63 (68.5%) | 95 (82.6%) |
Disability Class by Sex by Age in Leona Valley
Disability Class: Hearing Difficulty
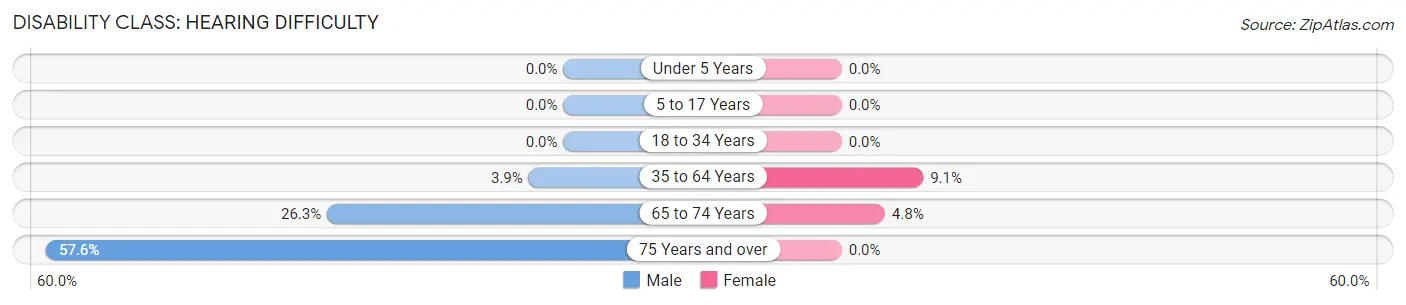
| Age Bracket | Male | Female |
| Under 5 Years | 0 (0.0%) | 0 (0.0%) |
| 5 to 17 Years | 0 (0.0%) | 0 (0.0%) |
| 18 to 34 Years | 0 (0.0%) | 0 (0.0%) |
| 35 to 64 Years | 13 (3.9%) | 32 (9.1%) |
| 65 to 74 Years | 40 (26.3%) | 6 (4.8%) |
| 75 Years and over | 53 (57.6%) | 0 (0.0%) |
Disability Class: Vision Difficulty
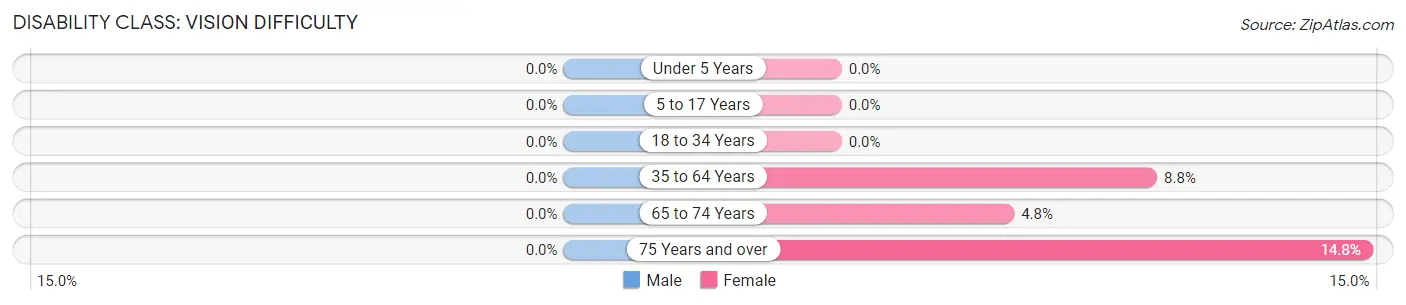
| Age Bracket | Male | Female |
| Under 5 Years | 0 (0.0%) | 0 (0.0%) |
| 5 to 17 Years | 0 (0.0%) | 0 (0.0%) |
| 18 to 34 Years | 0 (0.0%) | 0 (0.0%) |
| 35 to 64 Years | 0 (0.0%) | 31 (8.8%) |
| 65 to 74 Years | 0 (0.0%) | 6 (4.8%) |
| 75 Years and over | 0 (0.0%) | 17 (14.8%) |
Disability Class: Cognitive Difficulty
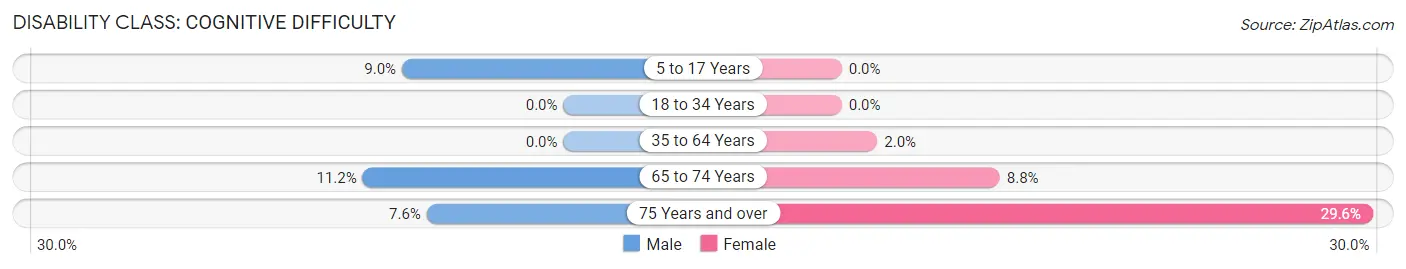
| Age Bracket | Male | Female |
| 5 to 17 Years | 8 (9.0%) | 0 (0.0%) |
| 18 to 34 Years | 0 (0.0%) | 0 (0.0%) |
| 35 to 64 Years | 0 (0.0%) | 7 (2.0%) |
| 65 to 74 Years | 17 (11.2%) | 11 (8.8%) |
| 75 Years and over | 7 (7.6%) | 34 (29.6%) |
Disability Class: Ambulatory Difficulty
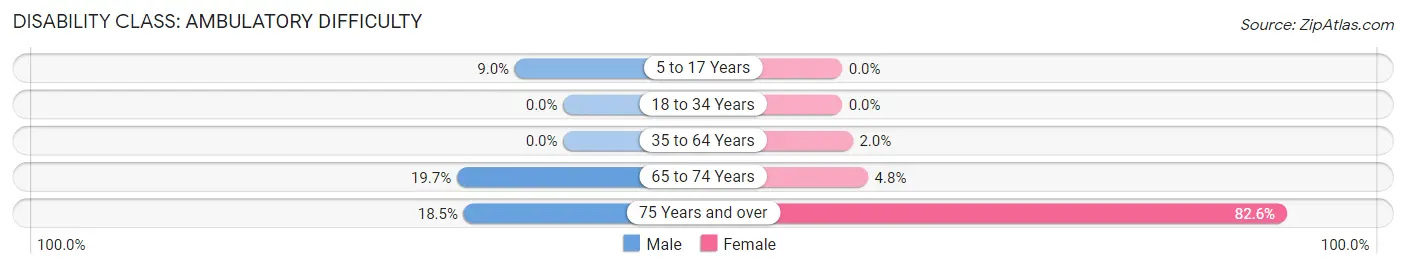
| Age Bracket | Male | Female |
| 5 to 17 Years | 8 (9.0%) | 0 (0.0%) |
| 18 to 34 Years | 0 (0.0%) | 0 (0.0%) |
| 35 to 64 Years | 0 (0.0%) | 7 (2.0%) |
| 65 to 74 Years | 30 (19.7%) | 6 (4.8%) |
| 75 Years and over | 17 (18.5%) | 95 (82.6%) |
Disability Class: Self-Care Difficulty
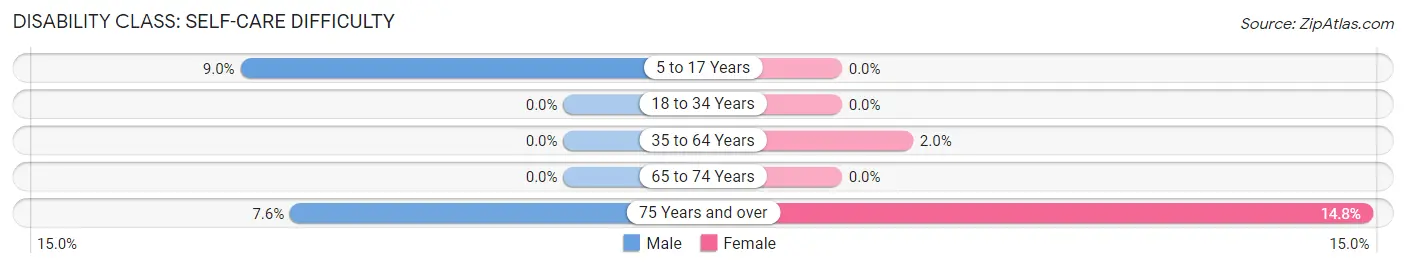
| Age Bracket | Male | Female |
| 5 to 17 Years | 8 (9.0%) | 0 (0.0%) |
| 18 to 34 Years | 0 (0.0%) | 0 (0.0%) |
| 35 to 64 Years | 0 (0.0%) | 7 (2.0%) |
| 65 to 74 Years | 0 (0.0%) | 0 (0.0%) |
| 75 Years and over | 7 (7.6%) | 17 (14.8%) |
Technology Access in Leona Valley
Computing Device Access in Leona Valley
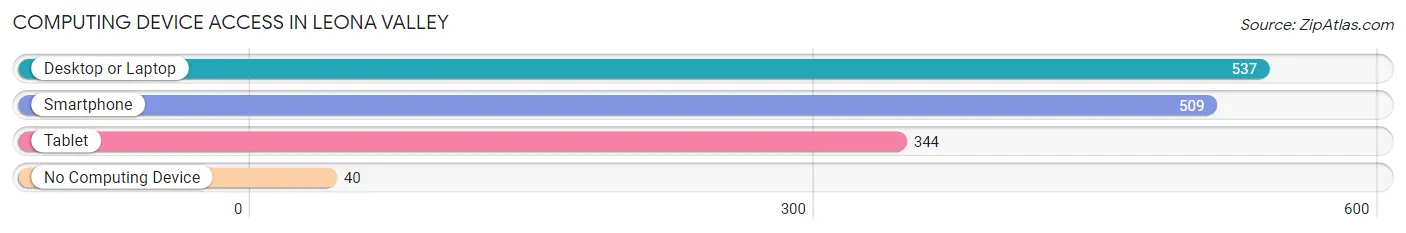
| Device Type | # Households | % Households |
| Desktop or Laptop | 537 | 88.9% |
| Smartphone | 509 | 84.3% |
| Tablet | 344 | 57.0% |
| No Computing Device | 40 | 6.6% |
| Total | 604 | 100.0% |
Internet Access in Leona Valley
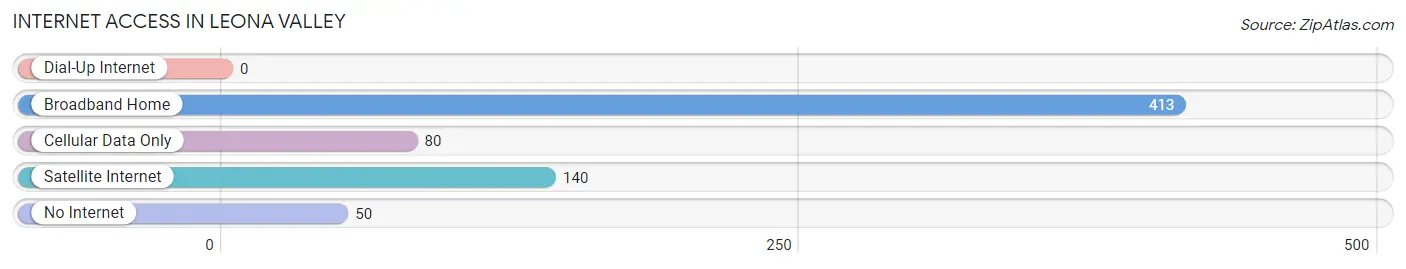
| Internet Type | # Households | % Households |
| Dial-Up Internet | 0 | 0.0% |
| Broadband Home | 413 | 68.4% |
| Cellular Data Only | 80 | 13.3% |
| Satellite Internet | 140 | 23.2% |
| No Internet | 50 | 8.3% |
| Total | 604 | 100.0% |
Leona Valley Summary
Leona Valley is a small unincorporated community located in the Antelope Valley of northern Los Angeles County, California. It is situated in the foothills of the Sierra Pelona Mountains, approximately 10 miles (16 km) west of the city of Palmdale. The population of Leona Valley was estimated to be 1,845 in 2019.
History
Leona Valley was originally inhabited by the Tataviam people, who were a branch of the Tongva people. The Tataviam people lived in the area for thousands of years before the arrival of Europeans. The first Europeans to settle in the area were Spanish missionaries and soldiers in the late 18th century. The area was later settled by ranchers in the 19th century, who established large cattle ranches.
In the early 20th century, the area was developed for agriculture, with the establishment of several small farms. The area was also used for the production of movies and television shows, with several Hollywood studios setting up shop in the area.
Geography
Leona Valley is located in the Antelope Valley of northern Los Angeles County, California. It is situated in the foothills of the Sierra Pelona Mountains, approximately 10 miles (16 km) west of the city of Palmdale. The area is characterized by rolling hills and valleys, with elevations ranging from 1,500 to 3,000 feet (457 to 914 meters).
The climate of Leona Valley is semi-arid, with hot summers and mild winters. The average annual precipitation is approximately 10 inches (25 cm).
Economy
The economy of Leona Valley is largely based on agriculture. The area is known for its production of walnuts, almonds, and other tree nuts. Other crops grown in the area include hay, alfalfa, and vegetables.
The area is also home to several wineries, which produce a variety of wines. The area is also known for its production of honey, with several beekeepers operating in the area.
In addition to agriculture, the area is home to several small businesses, including restaurants, retail stores, and auto repair shops.
Demographics
The population of Leona Valley was estimated to be 1,845 in 2019. The population is predominantly white (83.3%), with smaller percentages of Hispanic (7.7%), African American (3.2%), and Asian (2.2%) residents. The median household income is $68,944, and the median home value is $521,000.
Leona Valley is served by the Antelope Valley Union High School District, which includes several public schools. The area is also home to several private schools, including Leona Valley Christian School and Leona Valley Montessori School.
Common Questions
What is Per Capita Income in Leona Valley?
Per Capita income in Leona Valley is $50,444.
What is the Median Family Income in Leona Valley?
Median Family Income in Leona Valley is $127,969.
What is the Median Household income in Leona Valley?
Median Household Income in Leona Valley is $115,611.
What is Income or Wage Gap in Leona Valley?
Income or Wage Gap in Leona Valley is 5.8%.
Women in Leona Valley earn 94.2 cents for every dollar earned by a man.
What is Inequality or Gini Index in Leona Valley?
Inequality or Gini Index in Leona Valley is 0.41.
What is the Total Population of Leona Valley?
Total Population of Leona Valley is 1,569.
What is the Total Male Population of Leona Valley?
Total Male Population of Leona Valley is 754.
What is the Total Female Population of Leona Valley?
Total Female Population of Leona Valley is 815.
What is the Ratio of Males per 100 Females in Leona Valley?
There are 92.52 Males per 100 Females in Leona Valley.
What is the Ratio of Females per 100 Males in Leona Valley?
There are 108.09 Females per 100 Males in Leona Valley.
What is the Median Population Age in Leona Valley?
Median Population Age in Leona Valley is 59.0 Years.
What is the Average Family Size in Leona Valley
Average Family Size in Leona Valley is 2.8 People.
What is the Average Household Size in Leona Valley
Average Household Size in Leona Valley is 2.6 People.
How Large is the Labor Force in Leona Valley?
There are 654 People in the Labor Forcein in Leona Valley.
What is the Percentage of People in the Labor Force in Leona Valley?
49.4% of People are in the Labor Force in Leona Valley.
What is the Unemployment Rate in Leona Valley?
Unemployment Rate in Leona Valley is 6.0%.