Lemon Cove, CA Map & Demographics
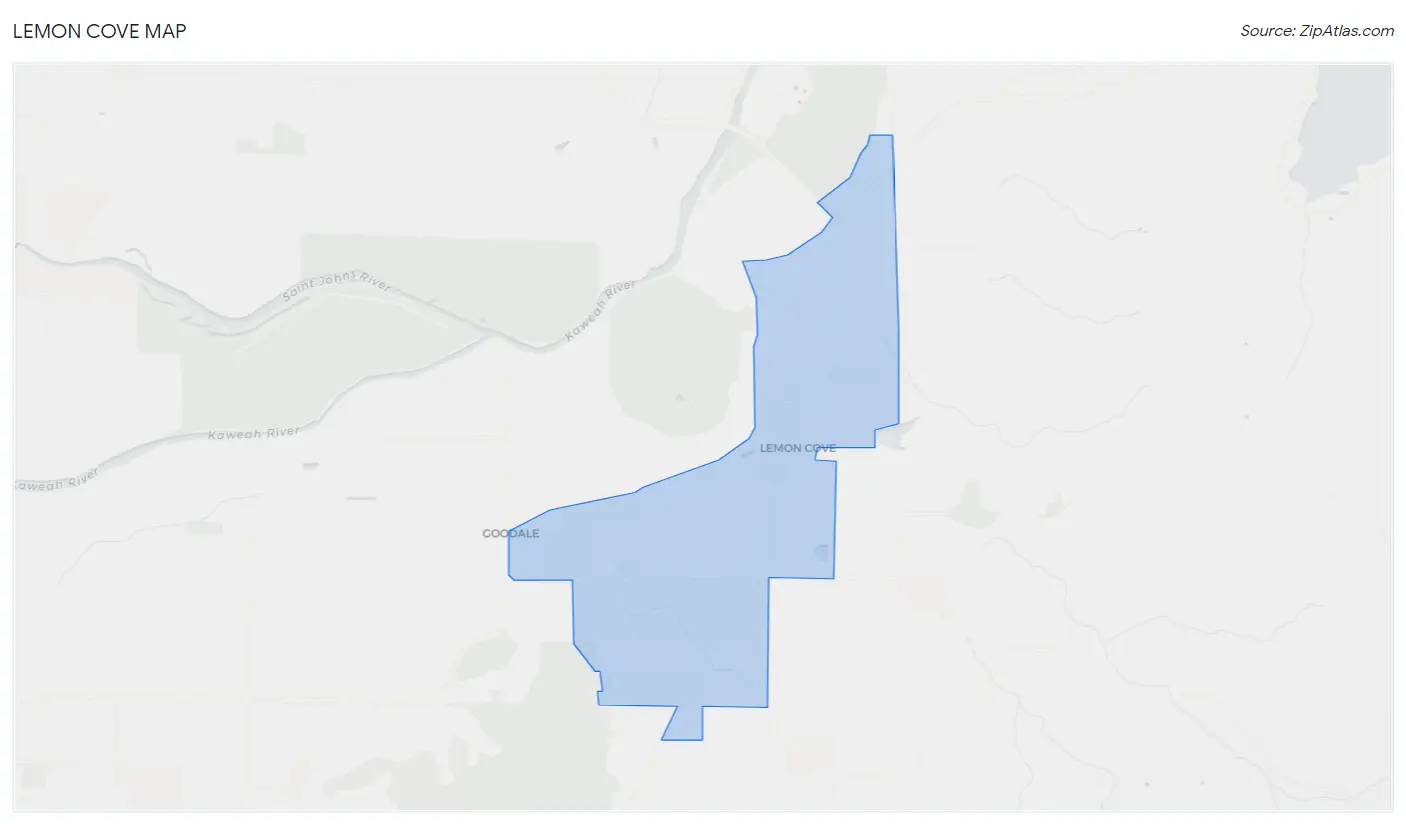
Lemon Cove Map
Lemon Cove Overview
$42,517
PER CAPITA INCOME
49.2%
WAGE / INCOME GAP [ % ]
50.8¢/ $1
WAGE / INCOME GAP [ $ ]
0.55
INEQUALITY / GINI INDEX
498
TOTAL POPULATION
265
MALE POPULATION
233
FEMALE POPULATION
113.73
MALES / 100 FEMALES
87.92
FEMALES / 100 MALES
39.7
MEDIAN AGE
3.8
AVG FAMILY SIZE
3.2
AVG HOUSEHOLD SIZE
151
LABOR FORCE [ PEOPLE ]
47.0%
PERCENT IN LABOR FORCE
5.3%
UNEMPLOYMENT RATE
Lemon Cove Zip Codes
Lemon Cove Area Codes
Income in Lemon Cove
Income Overview in Lemon Cove
| Characteristic | Number | Measure |
| Per Capita Income | 498 | $42,517 |
| Median Family Income | 116 | $0 |
| Mean Family Income | 116 | $160,457 |
| Median Household Income | 155 | $0 |
| Mean Household Income | 155 | $128,243 |
| Income Deficit | 116 | $0 |
| Wage / Income Gap (%) | 498 | 49.24% |
| Wage / Income Gap ($) | 498 | 50.76¢ per $1 |
| Gini / Inequality Index | 498 | 0.55 |
Earnings by Sex in Lemon Cove
Average Earnings in Lemon Cove are $93,750, $73,750 for men and $145,294 for women, a difference of 49.2%.
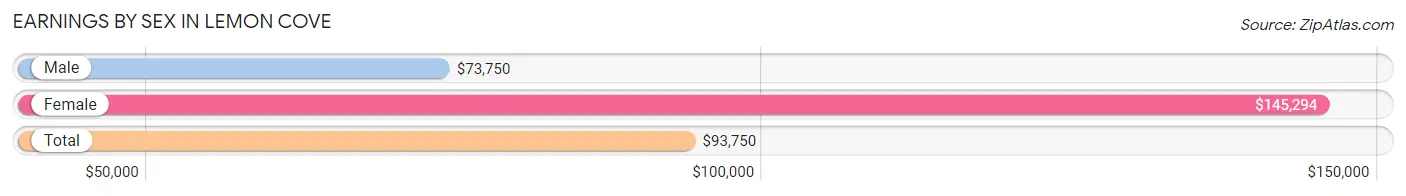
| Sex | Number | Average Earnings |
| Male | 92 (57.5%) | $73,750 |
| Female | 68 (42.5%) | $145,294 |
| Total | 160 (100.0%) | $93,750 |
Earnings by Sex by Income Bracket in Lemon Cove
The most common earnings brackets in Lemon Cove are $100,000+ for men (32 | 34.8%) and $100,000+ for women (48 | 70.6%).
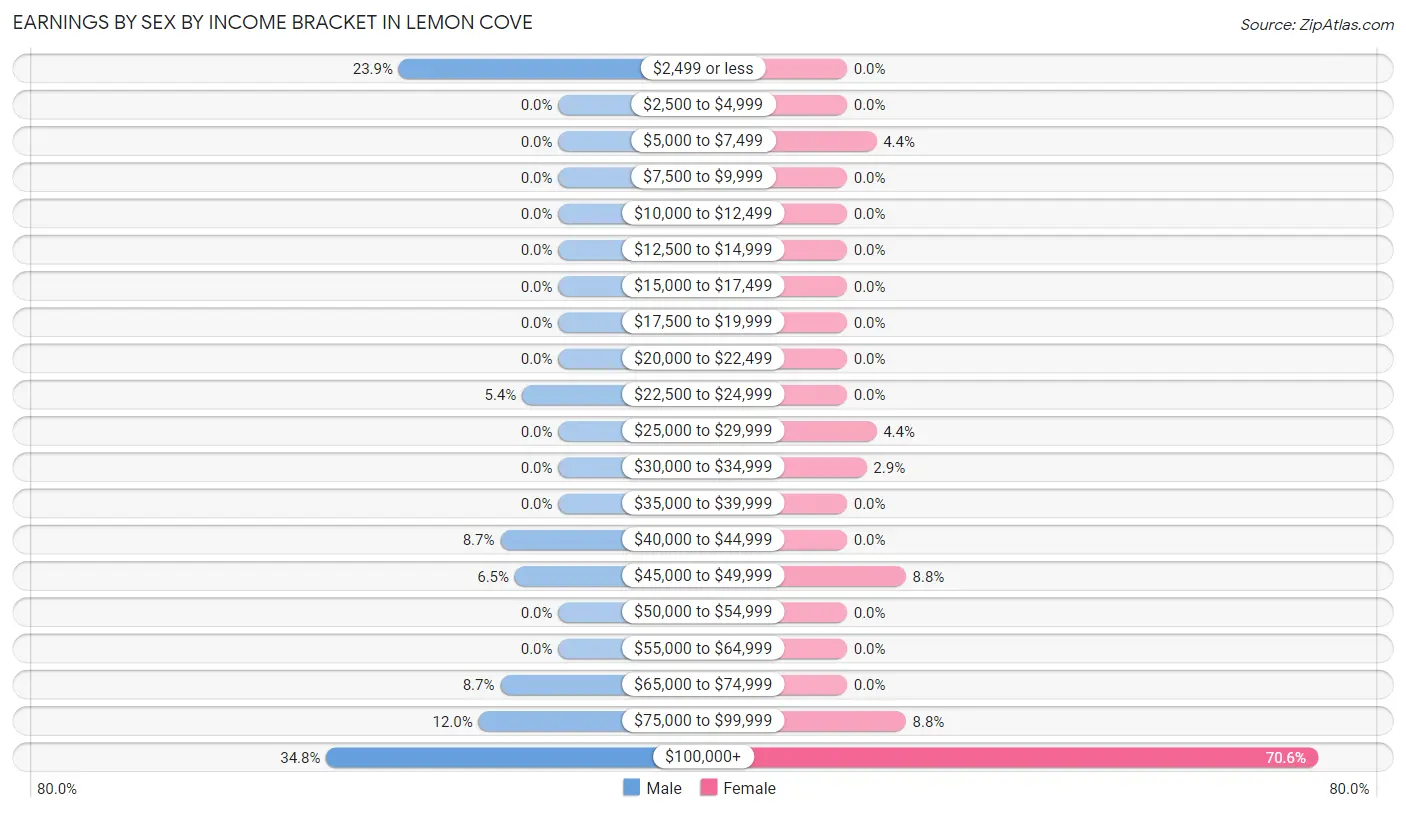
| Income | Male | Female |
| $2,499 or less | 22 (23.9%) | 0 (0.0%) |
| $2,500 to $4,999 | 0 (0.0%) | 0 (0.0%) |
| $5,000 to $7,499 | 0 (0.0%) | 3 (4.4%) |
| $7,500 to $9,999 | 0 (0.0%) | 0 (0.0%) |
| $10,000 to $12,499 | 0 (0.0%) | 0 (0.0%) |
| $12,500 to $14,999 | 0 (0.0%) | 0 (0.0%) |
| $15,000 to $17,499 | 0 (0.0%) | 0 (0.0%) |
| $17,500 to $19,999 | 0 (0.0%) | 0 (0.0%) |
| $20,000 to $22,499 | 0 (0.0%) | 0 (0.0%) |
| $22,500 to $24,999 | 5 (5.4%) | 0 (0.0%) |
| $25,000 to $29,999 | 0 (0.0%) | 3 (4.4%) |
| $30,000 to $34,999 | 0 (0.0%) | 2 (2.9%) |
| $35,000 to $39,999 | 0 (0.0%) | 0 (0.0%) |
| $40,000 to $44,999 | 8 (8.7%) | 0 (0.0%) |
| $45,000 to $49,999 | 6 (6.5%) | 6 (8.8%) |
| $50,000 to $54,999 | 0 (0.0%) | 0 (0.0%) |
| $55,000 to $64,999 | 0 (0.0%) | 0 (0.0%) |
| $65,000 to $74,999 | 8 (8.7%) | 0 (0.0%) |
| $75,000 to $99,999 | 11 (12.0%) | 6 (8.8%) |
| $100,000+ | 32 (34.8%) | 48 (70.6%) |
| Total | 92 (100.0%) | 68 (100.0%) |
Earnings by Sex by Educational Attainment in Lemon Cove
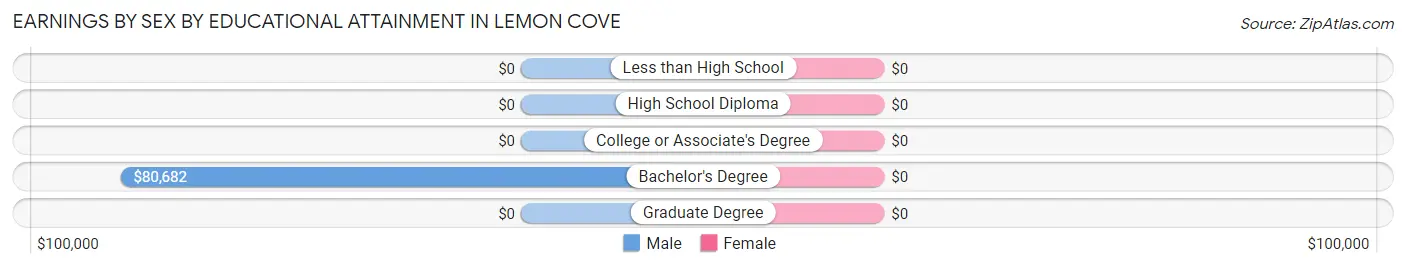
| Educational Attainment | Male Income | Female Income |
| Less than High School | - | - |
| High School Diploma | - | - |
| College or Associate's Degree | - | - |
| Bachelor's Degree | $80,682 | $0 |
| Graduate Degree | - | - |
| Total | $73,750 | $145,515 |
Family Income in Lemon Cove
Family Income Brackets in Lemon Cove
According to the Lemon Cove family income data, there are 36 families falling into the $200,000+ income range, which is the most common income bracket and makes up 31.0% of all families.
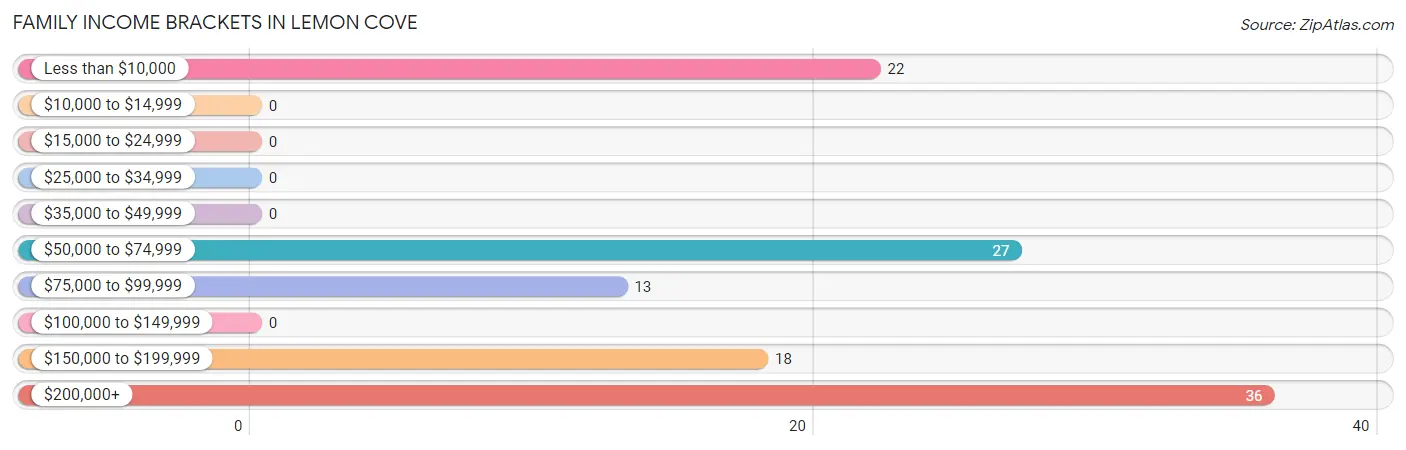
| Income Bracket | # Families | % Families |
| Less than $10,000 | 22 | 19.0% |
| $10,000 to $14,999 | 0 | 0.0% |
| $15,000 to $24,999 | 0 | 0.0% |
| $25,000 to $34,999 | 0 | 0.0% |
| $35,000 to $49,999 | 0 | 0.0% |
| $50,000 to $74,999 | 27 | 23.3% |
| $75,000 to $99,999 | 13 | 11.2% |
| $100,000 to $149,999 | 0 | 0.0% |
| $150,000 to $199,999 | 18 | 15.5% |
| $200,000+ | 36 | 31.0% |
Family Income by Famaliy Size in Lemon Cove
2-person families (73 | 62.9%) account for the highest median family income in Lemon Cove with $187,625 per family, while 2-person families (73 | 62.9%) have the highest median income of $93,812 per family member.
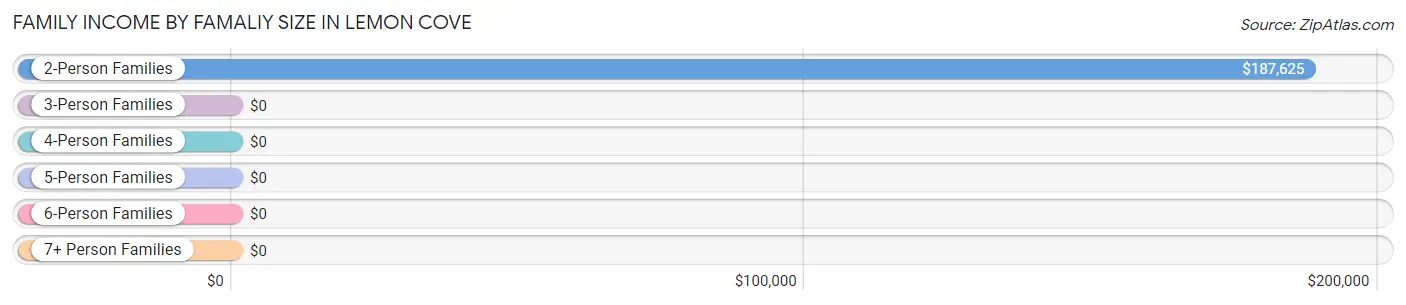
| Income Bracket | # Families | Median Income |
| 2-Person Families | 73 (62.9%) | $187,625 |
| 3-Person Families | 2 (1.7%) | $0 |
| 4-Person Families | 8 (6.9%) | $0 |
| 5-Person Families | 2 (1.7%) | $0 |
| 6-Person Families | 9 (7.8%) | $0 |
| 7+ Person Families | 22 (19.0%) | $0 |
| Total | 116 (100.0%) | $0 |
Family Income by Number of Earners in Lemon Cove
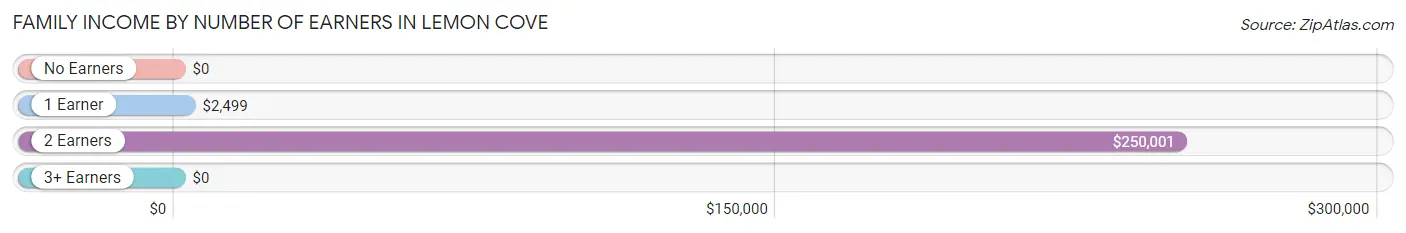
| Number of Earners | # Families | Median Income |
| No Earners | 21 (18.1%) | $0 |
| 1 Earner | 41 (35.3%) | $2,499 |
| 2 Earners | 52 (44.8%) | $250,001 |
| 3+ Earners | 2 (1.7%) | $0 |
| Total | 116 (100.0%) | $0 |
Household Income in Lemon Cove
Household Income Brackets in Lemon Cove
With 36 households falling in the category, the $200,000+ income range is the most frequent in Lemon Cove, accounting for 23.2% of all households.
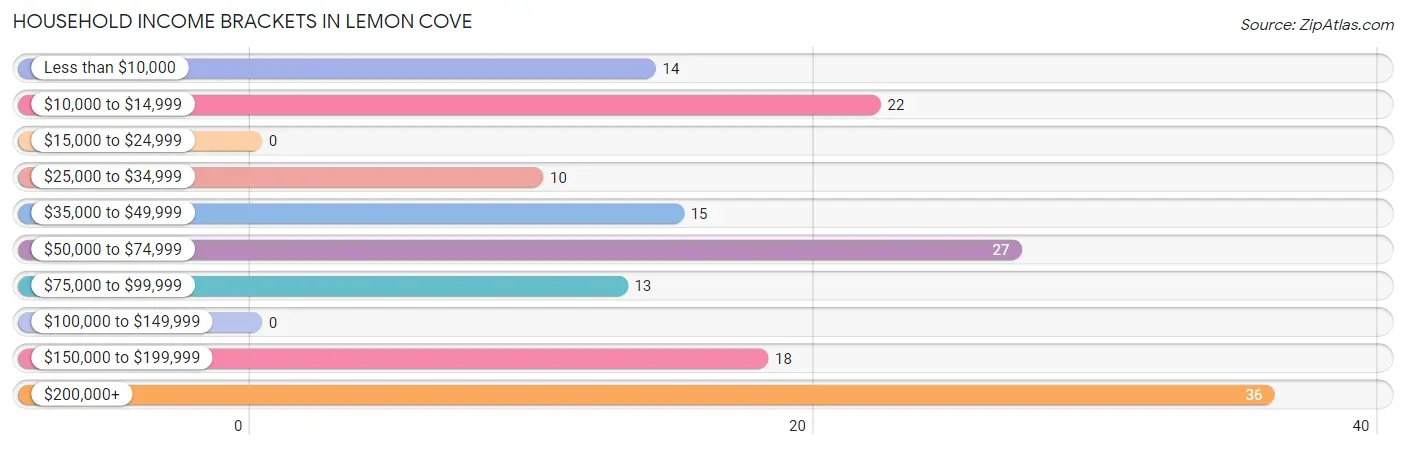
| Income Bracket | # Households | % Households |
| Less than $10,000 | 14 | 9.0% |
| $10,000 to $14,999 | 22 | 14.2% |
| $15,000 to $24,999 | 0 | 0.0% |
| $25,000 to $34,999 | 10 | 6.5% |
| $35,000 to $49,999 | 15 | 9.7% |
| $50,000 to $74,999 | 27 | 17.4% |
| $75,000 to $99,999 | 13 | 8.4% |
| $100,000 to $149,999 | 0 | 0.0% |
| $150,000 to $199,999 | 18 | 11.6% |
| $200,000+ | 36 | 23.2% |
Household Income by Householder Age in Lemon Cove
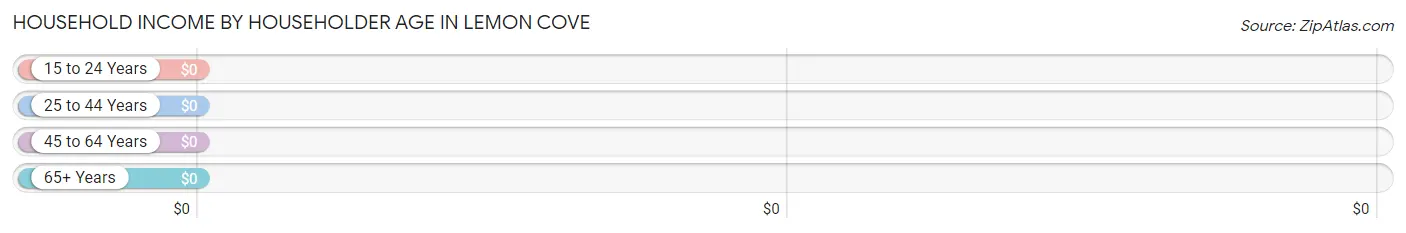
| Income Bracket | # Households | Median Income |
| 15 to 24 Years | 0 (0.0%) | $0 |
| 25 to 44 Years | 30 (19.4%) | $0 |
| 45 to 64 Years | 61 (39.4%) | $0 |
| 65+ Years | 64 (41.3%) | $0 |
| Total | 155 (100.0%) | $0 |
Poverty in Lemon Cove
Income Below Poverty by Sex and Age in Lemon Cove
With 28.7% poverty level for males and 51.9% for females among the residents of Lemon Cove, 25 to 34 year old males and under 5 year old females are the most vulnerable to poverty, with 22 males (100.0%) and 20 females (100.0%) in their respective age groups living below the poverty level.
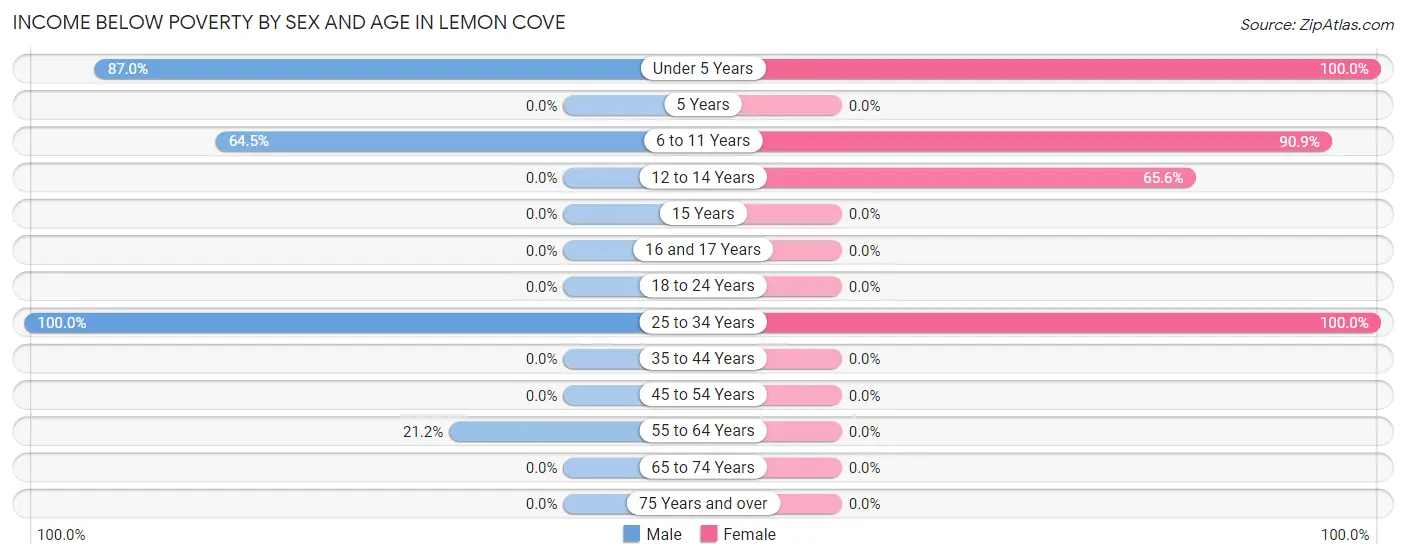
| Age Bracket | Male | Female |
| Under 5 Years | 20 (87.0%) | 20 (100.0%) |
| 5 Years | 0 (0.0%) | 0 (0.0%) |
| 6 to 11 Years | 20 (64.5%) | 60 (90.9%) |
| 12 to 14 Years | 0 (0.0%) | 21 (65.6%) |
| 15 Years | 0 (0.0%) | 0 (0.0%) |
| 16 and 17 Years | 0 (0.0%) | 0 (0.0%) |
| 18 to 24 Years | 0 (0.0%) | 0 (0.0%) |
| 25 to 34 Years | 22 (100.0%) | 20 (100.0%) |
| 35 to 44 Years | 0 (0.0%) | 0 (0.0%) |
| 45 to 54 Years | 0 (0.0%) | 0 (0.0%) |
| 55 to 64 Years | 14 (21.2%) | 0 (0.0%) |
| 65 to 74 Years | 0 (0.0%) | 0 (0.0%) |
| 75 Years and over | 0 (0.0%) | 0 (0.0%) |
| Total | 76 (28.7%) | 121 (51.9%) |
Income Above Poverty by Sex and Age in Lemon Cove
According to the poverty statistics in Lemon Cove, males aged 5 years and females aged 18 to 24 years are the age groups that are most secure financially, with 100.0% of males and 100.0% of females in these age groups living above the poverty line.
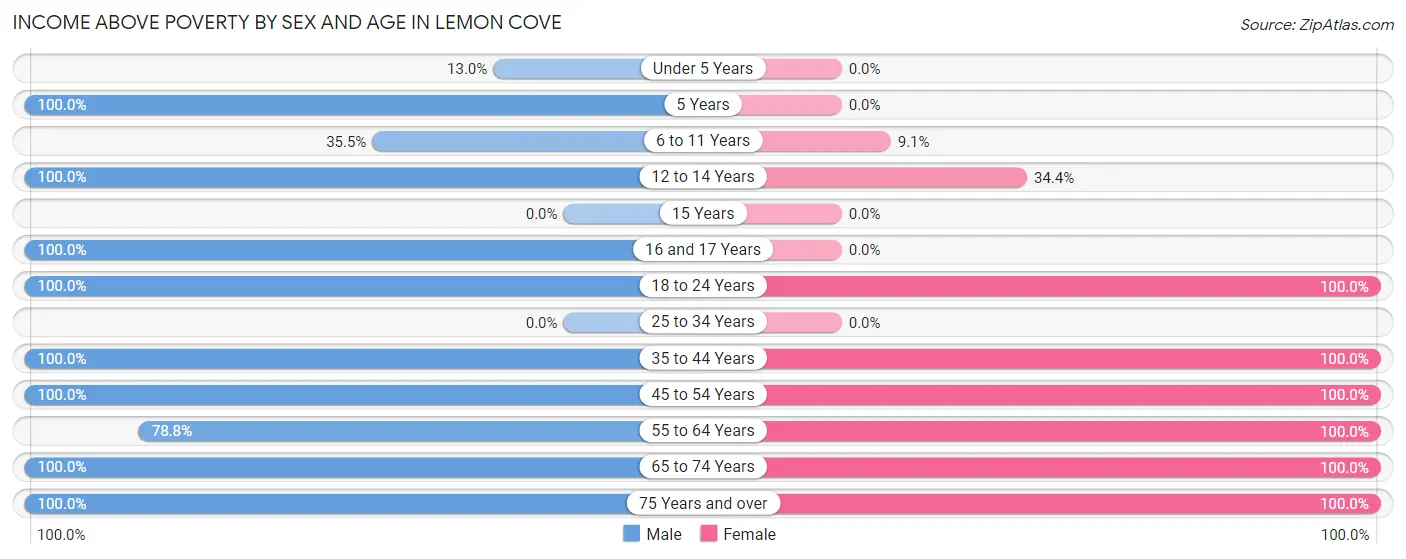
| Age Bracket | Male | Female |
| Under 5 Years | 3 (13.0%) | 0 (0.0%) |
| 5 Years | 3 (100.0%) | 0 (0.0%) |
| 6 to 11 Years | 11 (35.5%) | 6 (9.1%) |
| 12 to 14 Years | 2 (100.0%) | 11 (34.4%) |
| 15 Years | 0 (0.0%) | 0 (0.0%) |
| 16 and 17 Years | 11 (100.0%) | 0 (0.0%) |
| 18 to 24 Years | 2 (100.0%) | 3 (100.0%) |
| 25 to 34 Years | 0 (0.0%) | 0 (0.0%) |
| 35 to 44 Years | 8 (100.0%) | 8 (100.0%) |
| 45 to 54 Years | 21 (100.0%) | 2 (100.0%) |
| 55 to 64 Years | 52 (78.8%) | 36 (100.0%) |
| 65 to 74 Years | 66 (100.0%) | 37 (100.0%) |
| 75 Years and over | 10 (100.0%) | 9 (100.0%) |
| Total | 189 (71.3%) | 112 (48.1%) |
Income Below Poverty Among Married-Couple Families in Lemon Cove
| Children | Above Poverty | Below Poverty |
| No Children | 75 (100.0%) | 0 (0.0%) |
| 1 or 2 Children | 17 (100.0%) | 0 (0.0%) |
| 3 or 4 Children | 2 (100.0%) | 0 (0.0%) |
| 5 or more Children | 0 (0.0%) | 0 (0.0%) |
| Total | 94 (100.0%) | 0 (0.0%) |
Income Below Poverty Among Single-Parent Households in Lemon Cove
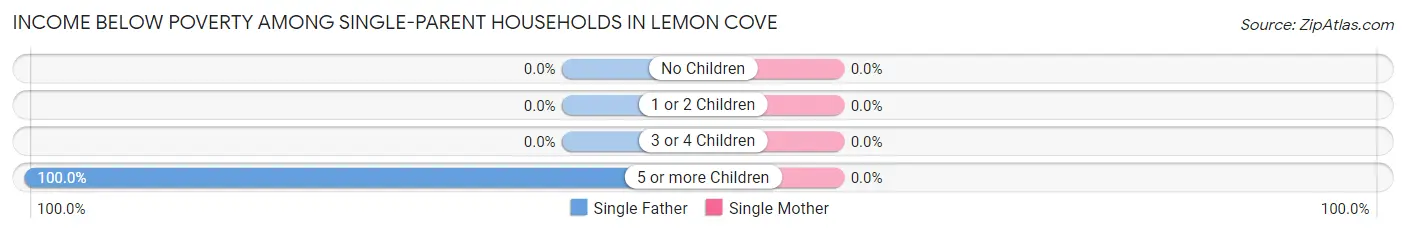
| Children | Single Father | Single Mother |
| No Children | 0 (0.0%) | 0 (0.0%) |
| 1 or 2 Children | 0 (0.0%) | 0 (0.0%) |
| 3 or 4 Children | 0 (0.0%) | 0 (0.0%) |
| 5 or more Children | 22 (100.0%) | 0 (0.0%) |
| Total | 22 (100.0%) | 0 (0.0%) |
Income Below Poverty Among Married-Couple vs Single-Parent Households in Lemon Cove
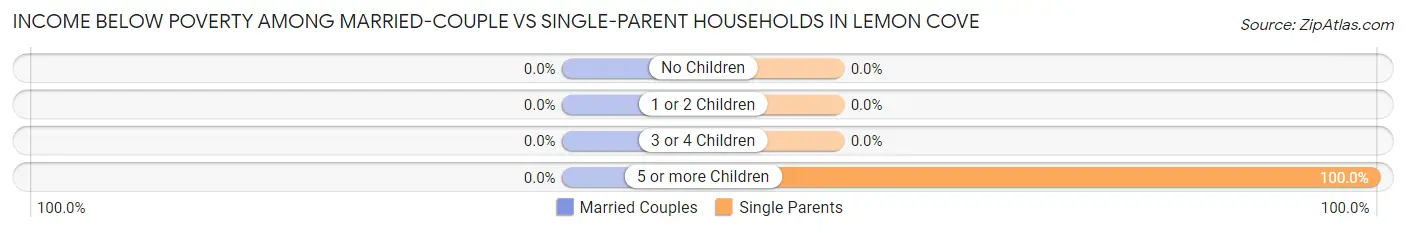
| Children | Married-Couple Families | Single-Parent Households |
| No Children | 0 (0.0%) | 0 (0.0%) |
| 1 or 2 Children | 0 (0.0%) | 0 (0.0%) |
| 3 or 4 Children | 0 (0.0%) | 0 (0.0%) |
| 5 or more Children | 0 (0.0%) | 22 (100.0%) |
| Total | 0 (0.0%) | 22 (100.0%) |
Race in Lemon Cove
The most populous races in Lemon Cove are White / Caucasian (478 | 96.0%), Hispanic or Latino (195 | 39.2%), and Two or more Races (14 | 2.8%).
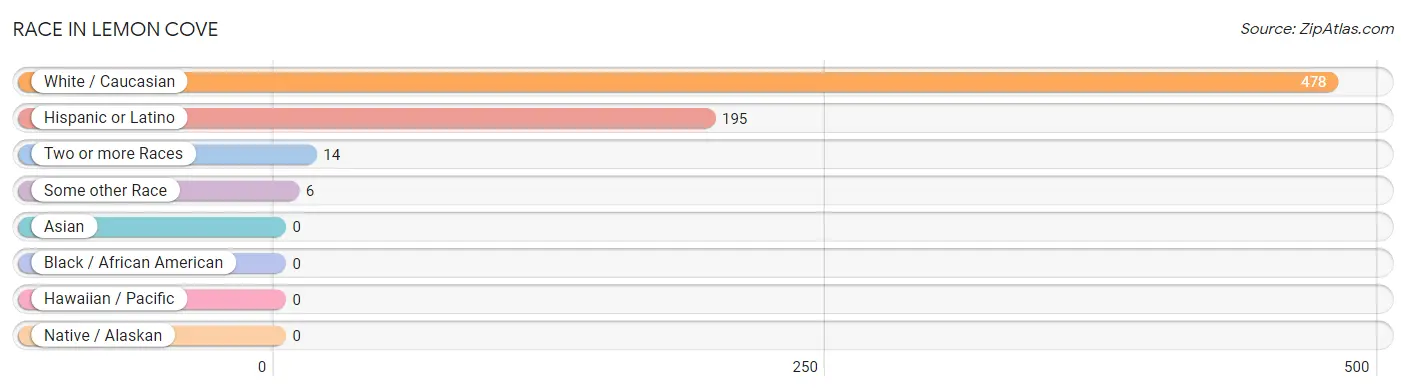
| Race | # Population | % Population |
| Asian | 0 | 0.0% |
| Black / African American | 0 | 0.0% |
| Hawaiian / Pacific | 0 | 0.0% |
| Hispanic or Latino | 195 | 39.2% |
| Native / Alaskan | 0 | 0.0% |
| White / Caucasian | 478 | 96.0% |
| Two or more Races | 14 | 2.8% |
| Some other Race | 6 | 1.2% |
| Total | 498 | 100.0% |
Ancestry in Lemon Cove
The most populous ancestries reported in Lemon Cove are Mexican (195 | 39.2%), Irish (75 | 15.1%), English (69 | 13.9%), German (50 | 10.0%), and Portuguese (33 | 6.6%), together accounting for 84.8% of all Lemon Cove residents.
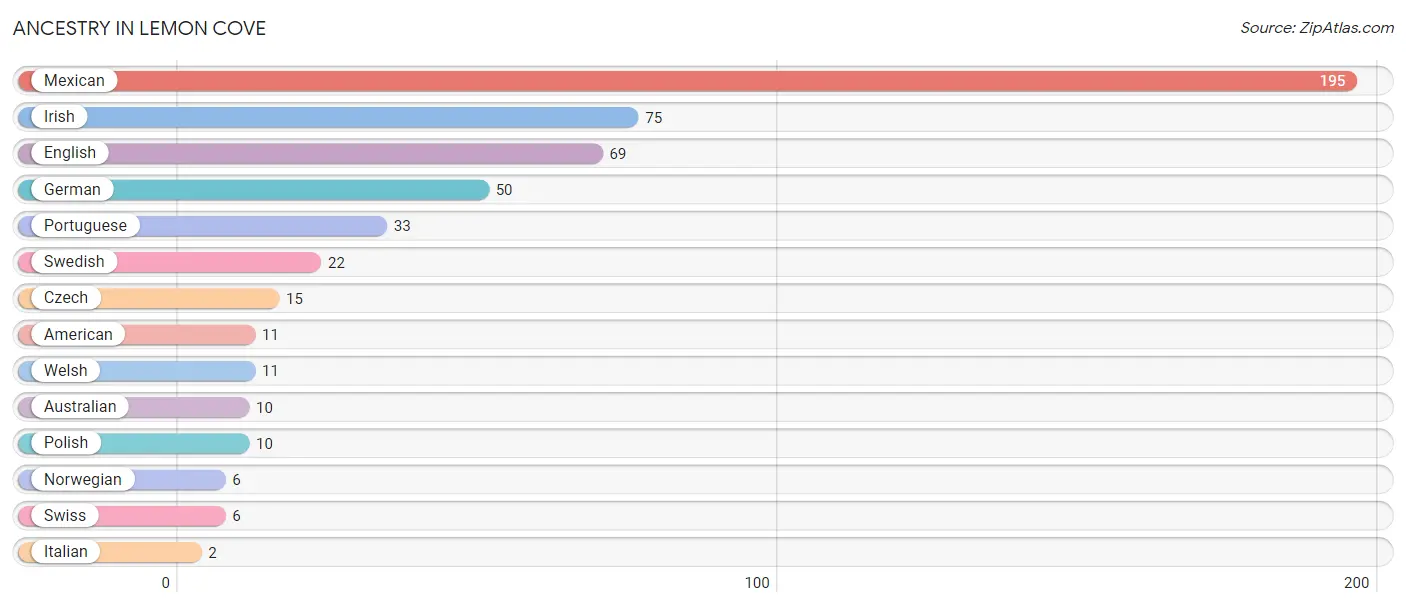
| Ancestry | # Population | % Population |
| American | 11 | 2.2% |
| Australian | 10 | 2.0% |
| Czech | 15 | 3.0% |
| English | 69 | 13.9% |
| German | 50 | 10.0% |
| Irish | 75 | 15.1% |
| Italian | 2 | 0.4% |
| Mexican | 195 | 39.2% |
| Norwegian | 6 | 1.2% |
| Polish | 10 | 2.0% |
| Portuguese | 33 | 6.6% |
| Swedish | 22 | 4.4% |
| Swiss | 6 | 1.2% |
| Welsh | 11 | 2.2% | View All 14 Rows |
Immigrants in Lemon Cove
The most numerous immigrant groups reported in Lemon Cove came from Europe (27 | 5.4%), Portugal (17 | 3.4%), Southern Europe (17 | 3.4%), England (10 | 2.0%), and Northern Europe (10 | 2.0%), together accounting for 16.3% of all Lemon Cove residents.
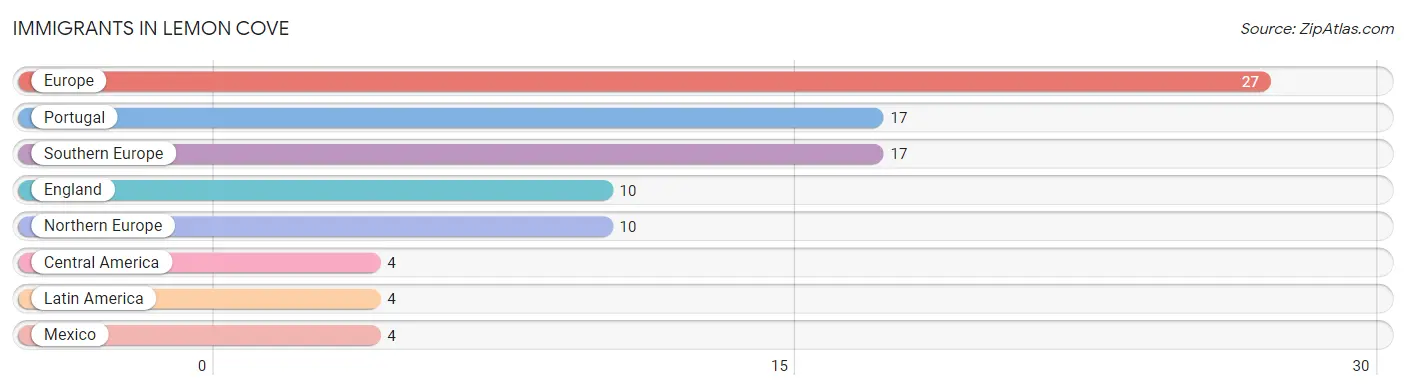
| Immigration Origin | # Population | % Population |
| Central America | 4 | 0.8% |
| England | 10 | 2.0% |
| Europe | 27 | 5.4% |
| Latin America | 4 | 0.8% |
| Mexico | 4 | 0.8% |
| Northern Europe | 10 | 2.0% |
| Portugal | 17 | 3.4% |
| Southern Europe | 17 | 3.4% | View All 8 Rows |
Sex and Age in Lemon Cove
Sex and Age in Lemon Cove
The most populous age groups in Lemon Cove are 60 to 64 Years (36 | 13.6%) for men and 10 to 14 Years (52 | 22.3%) for women.
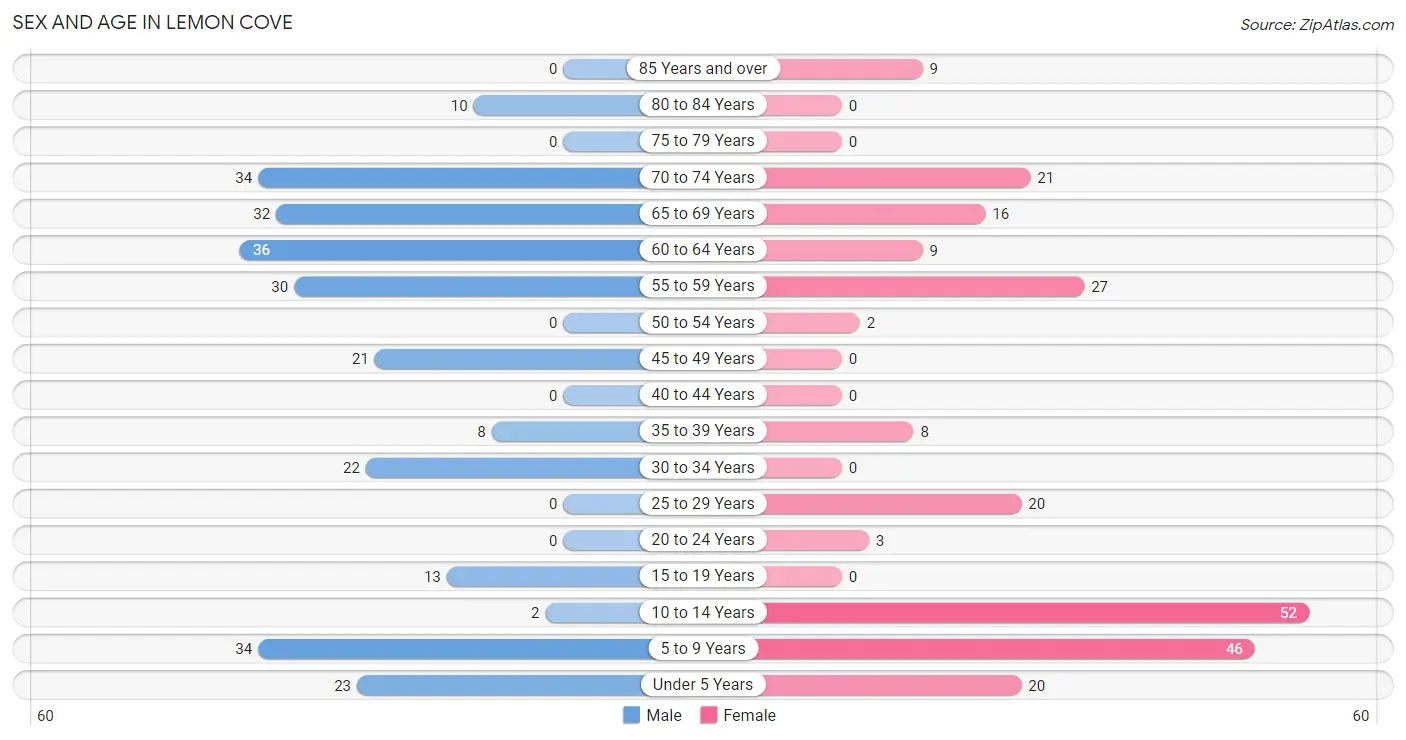
| Age Bracket | Male | Female |
| Under 5 Years | 23 (8.7%) | 20 (8.6%) |
| 5 to 9 Years | 34 (12.8%) | 46 (19.7%) |
| 10 to 14 Years | 2 (0.7%) | 52 (22.3%) |
| 15 to 19 Years | 13 (4.9%) | 0 (0.0%) |
| 20 to 24 Years | 0 (0.0%) | 3 (1.3%) |
| 25 to 29 Years | 0 (0.0%) | 20 (8.6%) |
| 30 to 34 Years | 22 (8.3%) | 0 (0.0%) |
| 35 to 39 Years | 8 (3.0%) | 8 (3.4%) |
| 40 to 44 Years | 0 (0.0%) | 0 (0.0%) |
| 45 to 49 Years | 21 (7.9%) | 0 (0.0%) |
| 50 to 54 Years | 0 (0.0%) | 2 (0.9%) |
| 55 to 59 Years | 30 (11.3%) | 27 (11.6%) |
| 60 to 64 Years | 36 (13.6%) | 9 (3.9%) |
| 65 to 69 Years | 32 (12.1%) | 16 (6.9%) |
| 70 to 74 Years | 34 (12.8%) | 21 (9.0%) |
| 75 to 79 Years | 0 (0.0%) | 0 (0.0%) |
| 80 to 84 Years | 10 (3.8%) | 0 (0.0%) |
| 85 Years and over | 0 (0.0%) | 9 (3.9%) |
| Total | 265 (100.0%) | 233 (100.0%) |
Families and Households in Lemon Cove
Median Family Size in Lemon Cove
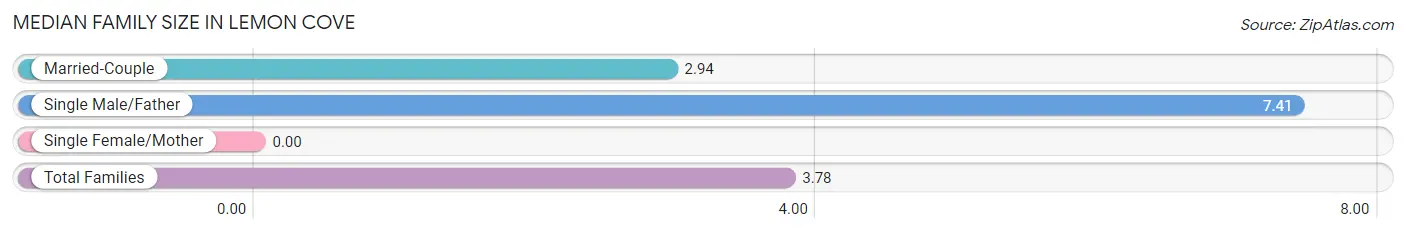
| Family Type | # Families | Family Size |
| Married-Couple | 94 (81.0%) | 2.94 |
| Single Male/Father | 22 (19.0%) | 7.41 |
| Single Female/Mother | 0 (0.0%) | - |
| Total Families | 116 (100.0%) | 3.78 |
Median Household Size in Lemon Cove
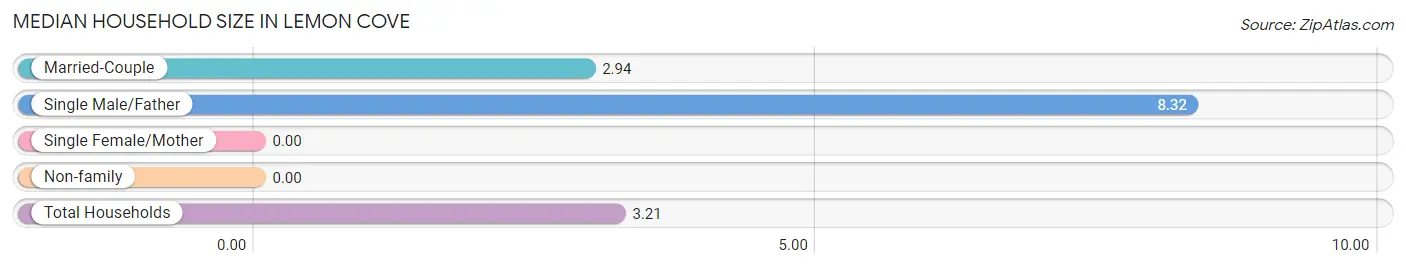
| Household Type | # Households | Household Size |
| Married-Couple | 94 (60.7%) | 2.94 |
| Single Male/Father | 22 (14.2%) | 8.32 |
| Single Female/Mother | 0 (0.0%) | - |
| Non-family | 39 (25.2%) | - |
| Total Households | 155 (100.0%) | 3.21 |
Household Size by Marriage Status in Lemon Cove
Out of a total of 155 households in Lemon Cove, 116 (74.8%) are family households, while 39 (25.2%) are nonfamily households. The most numerous type of family households are 2-person households, comprising 73, and the most common type of nonfamily households are 1-person households, comprising 39.
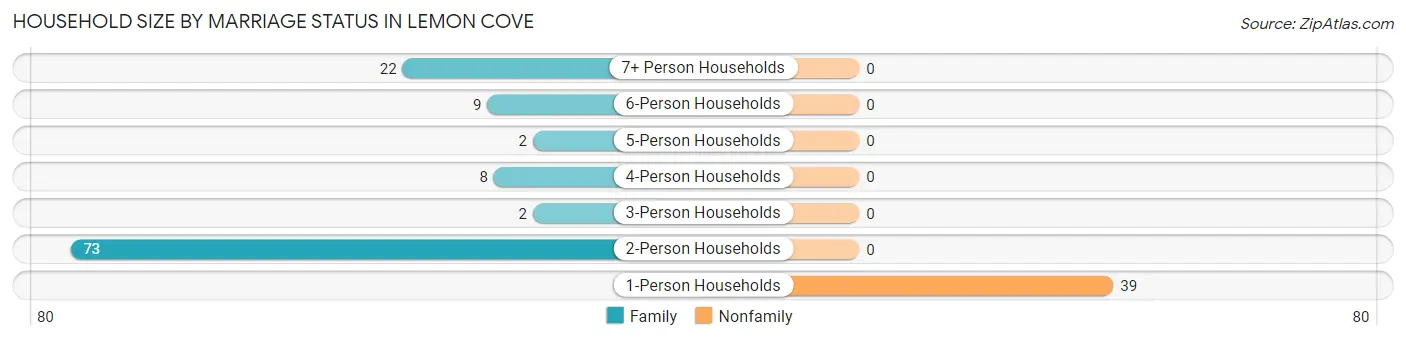
| Household Size | Family Households | Nonfamily Households |
| 1-Person Households | - | 39 (25.2%) |
| 2-Person Households | 73 (47.1%) | 0 (0.0%) |
| 3-Person Households | 2 (1.3%) | 0 (0.0%) |
| 4-Person Households | 8 (5.2%) | 0 (0.0%) |
| 5-Person Households | 2 (1.3%) | 0 (0.0%) |
| 6-Person Households | 9 (5.8%) | 0 (0.0%) |
| 7+ Person Households | 22 (14.2%) | 0 (0.0%) |
| Total | 116 (74.8%) | 39 (25.2%) |
Female Fertility in Lemon Cove
Fertility by Age in Lemon Cove
Average fertility rate in Lemon Cove is 61.0 births per 1,000 women. Women in the age bracket of 35 to 50 years have the highest fertility rate with 200.0 births per 1,000 women. Women in the age bracket of 35 to 50 years acount for 100.0% of all women with births.
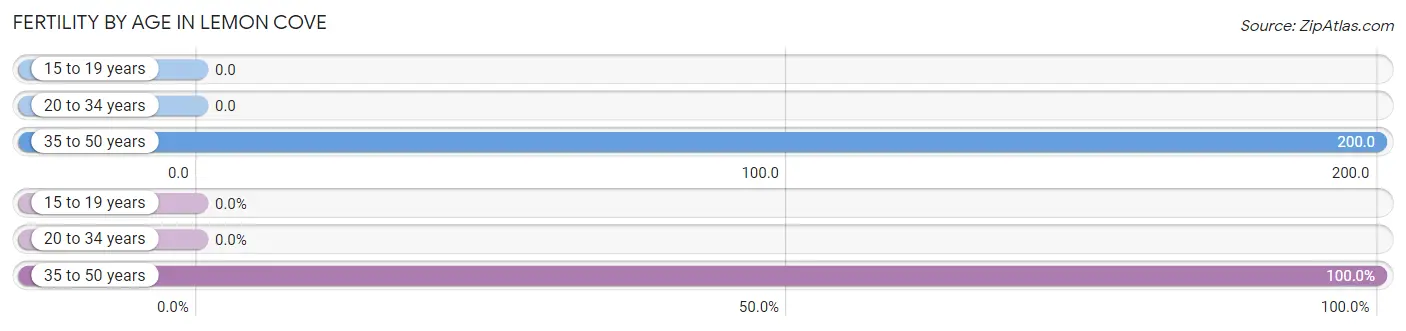
| Age Bracket | Women with Births | Births / 1,000 Women |
| 15 to 19 years | 0 (0.0%) | 0.0 |
| 20 to 34 years | 0 (0.0%) | 0.0 |
| 35 to 50 years | 2 (100.0%) | 200.0 |
| Total | 2 (100.0%) | 61.0 |
Fertility by Age by Marriage Status in Lemon Cove
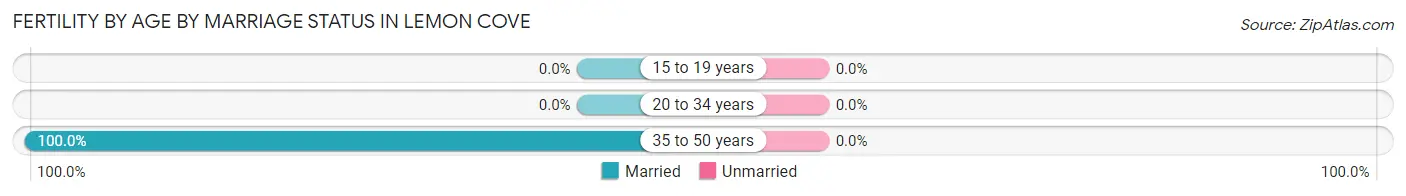
| Age Bracket | Married | Unmarried |
| 15 to 19 years | 0 (0.0%) | 0 (0.0%) |
| 20 to 34 years | 0 (0.0%) | 0 (0.0%) |
| 35 to 50 years | 2 (100.0%) | 0 (0.0%) |
| Total | 2 (100.0%) | 0 (0.0%) |
Fertility by Education in Lemon Cove
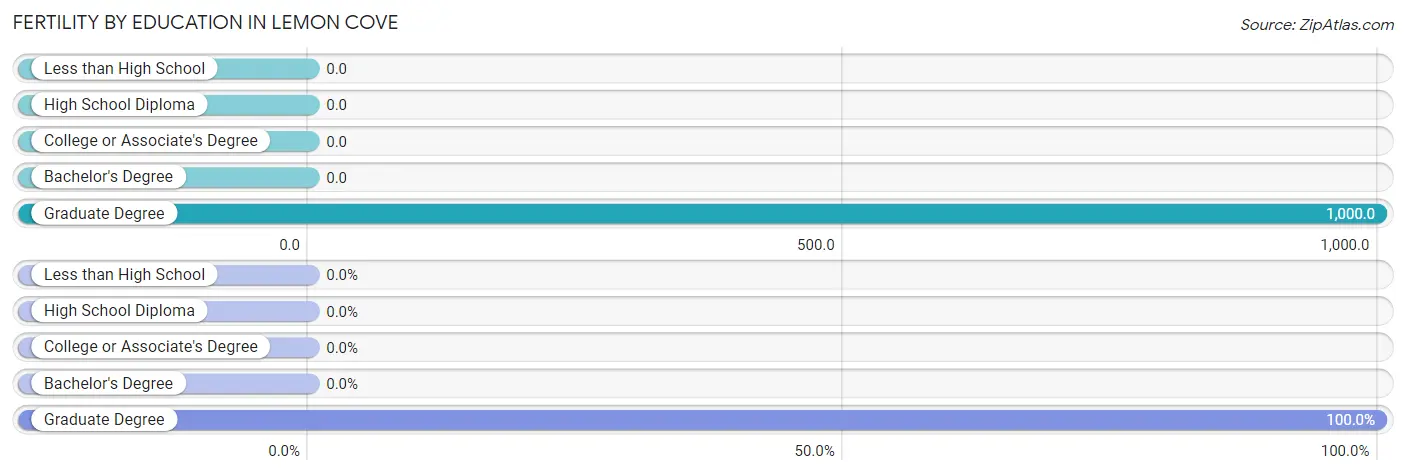
| Educational Attainment | Women with Births | Births / 1,000 Women |
| Less than High School | 0 (0.0%) | 0.0 |
| High School Diploma | 0 (0.0%) | 0.0 |
| College or Associate's Degree | 0 (0.0%) | 0.0 |
| Bachelor's Degree | 0 (0.0%) | 0.0 |
| Graduate Degree | 2 (100.0%) | 1,000.0 |
| Total | 2 (100.0%) | 61.0 |
Fertility by Education by Marriage Status in Lemon Cove
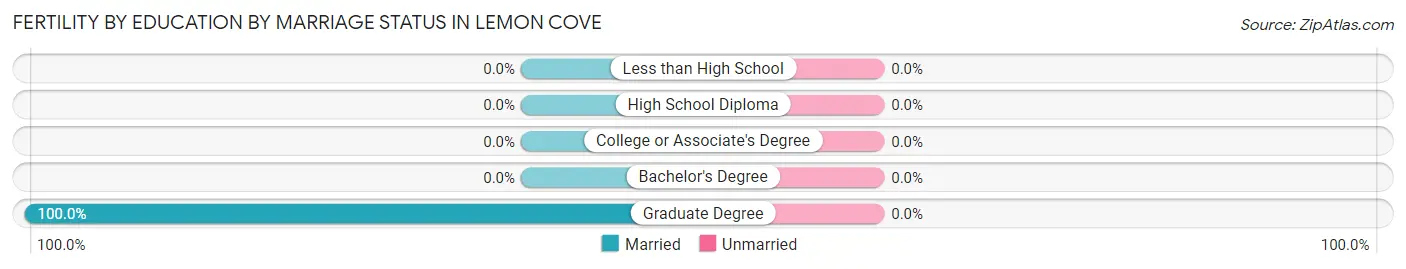
| Educational Attainment | Married | Unmarried |
| Less than High School | 0 (0.0%) | 0 (0.0%) |
| High School Diploma | 0 (0.0%) | 0 (0.0%) |
| College or Associate's Degree | 0 (0.0%) | 0 (0.0%) |
| Bachelor's Degree | 0 (0.0%) | 0 (0.0%) |
| Graduate Degree | 2 (100.0%) | 0 (0.0%) |
| Total | 2 (100.0%) | 0 (0.0%) |
Employment Characteristics in Lemon Cove
Employment by Class of Employer in Lemon Cove
Among the 143 employed individuals in Lemon Cove, private company employees (93 | 65.0%), local government employees (20 | 14.0%), and not-for-profit organizations (19 | 13.3%) make up the most common classes of employment.
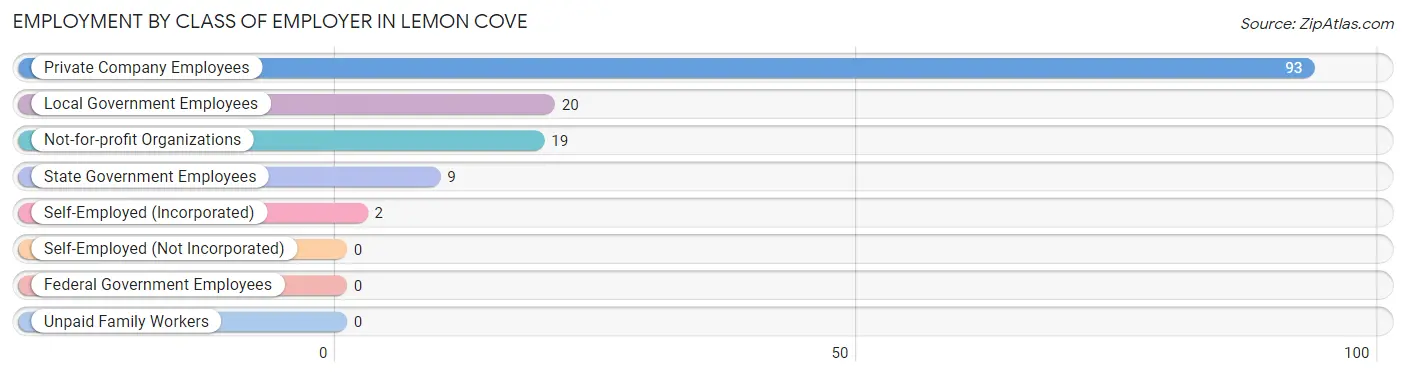
| Employer Class | # Employees | % Employees |
| Private Company Employees | 93 | 65.0% |
| Self-Employed (Incorporated) | 2 | 1.4% |
| Self-Employed (Not Incorporated) | 0 | 0.0% |
| Not-for-profit Organizations | 19 | 13.3% |
| Local Government Employees | 20 | 14.0% |
| State Government Employees | 9 | 6.3% |
| Federal Government Employees | 0 | 0.0% |
| Unpaid Family Workers | 0 | 0.0% |
| Total | 143 | 100.0% |
Employment Status by Age in Lemon Cove
According to the labor force statistics for Lemon Cove, out of the total population over 16 years of age (321), 47.0% or 151 individuals are in the labor force, with 5.3% or 8 of them unemployed. The age group with the highest labor force participation rate is 20 to 24 years, with 100.0% or 3 individuals in the labor force. Within the labor force, the 55 to 59 years age range has the highest percentage of unemployed individuals, with 17.4% or 8 of them being unemployed.
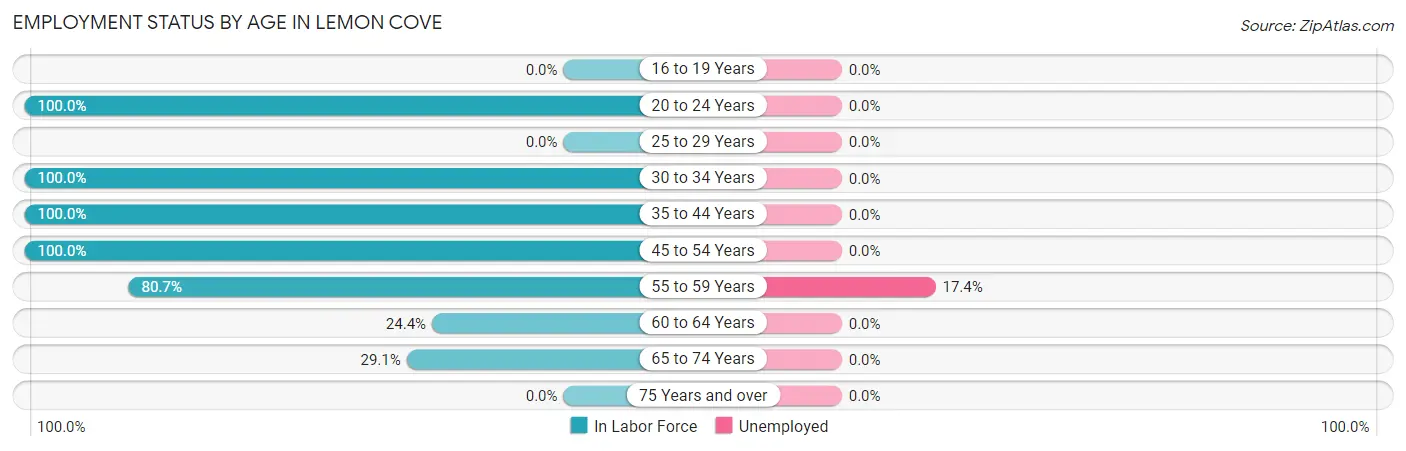
| Age Bracket | In Labor Force | Unemployed |
| 16 to 19 Years | 0 (0.0%) | 0 (0.0%) |
| 20 to 24 Years | 3 (100.0%) | 0 (0.0%) |
| 25 to 29 Years | 0 (0.0%) | 0 (0.0%) |
| 30 to 34 Years | 22 (100.0%) | 0 (0.0%) |
| 35 to 44 Years | 16 (100.0%) | 0 (0.0%) |
| 45 to 54 Years | 23 (100.0%) | 0 (0.0%) |
| 55 to 59 Years | 46 (80.7%) | 8 (17.4%) |
| 60 to 64 Years | 11 (24.4%) | 0 (0.0%) |
| 65 to 74 Years | 30 (29.1%) | 0 (0.0%) |
| 75 Years and over | 0 (0.0%) | 0 (0.0%) |
| Total | 151 (47.0%) | 8 (5.3%) |
Employment Status by Educational Attainment in Lemon Cove
According to labor force statistics for Lemon Cove, 64.5% of individuals (118) out of the total population between 25 and 64 years of age (183) are in the labor force, with 6.8% or 8 of them being unemployed. The group with the highest labor force participation rate are those with the educational attainment of college / associate degree, with 100.0% or 14 individuals in the labor force. Within the labor force, individuals with college / associate degree education have the highest percentage of unemployment, with 42.9% or 6 of them being unemployed.
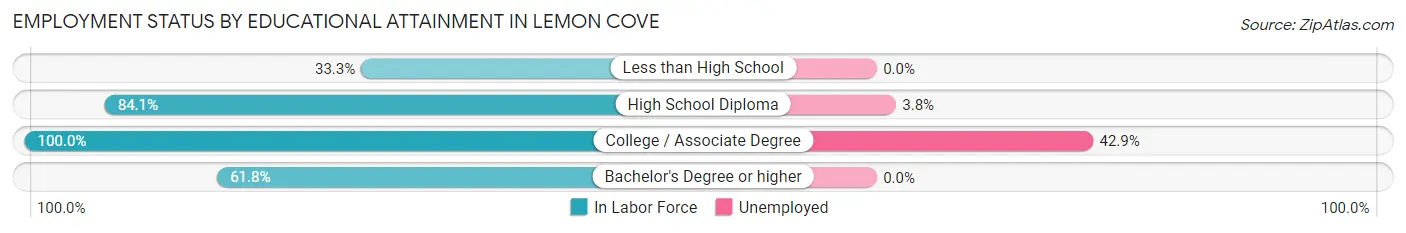
| Educational Attainment | In Labor Force | Unemployed |
| Less than High School | 17 (33.3%) | 0 (0.0%) |
| High School Diploma | 53 (84.1%) | 2 (3.8%) |
| College / Associate Degree | 14 (100.0%) | 6 (42.9%) |
| Bachelor's Degree or higher | 34 (61.8%) | 0 (0.0%) |
| Total | 118 (64.5%) | 12 (6.8%) |
Employment Occupations by Sex in Lemon Cove
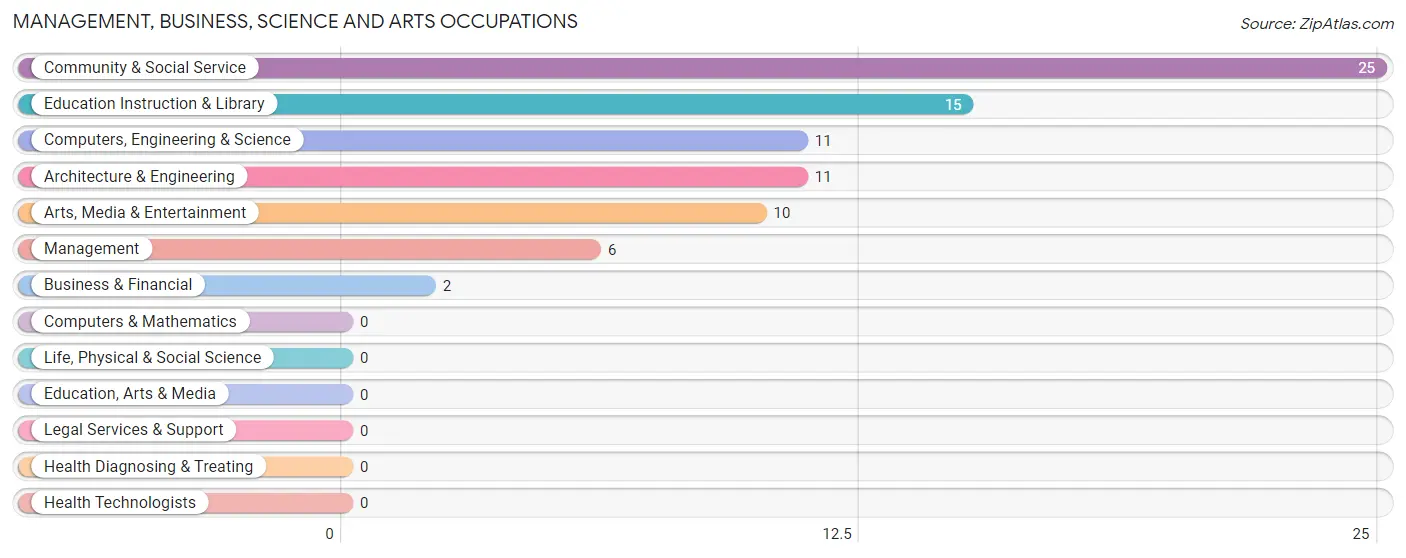
Management, Business, Science and Arts Occupations
The most common Management, Business, Science and Arts occupations in Lemon Cove are Community & Social Service (25 | 17.5%), Education Instruction & Library (15 | 10.5%), Computers, Engineering & Science (11 | 7.7%), Architecture & Engineering (11 | 7.7%), and Arts, Media & Entertainment (10 | 7.0%).
Management, Business, Science and Arts Occupations by Sex
Within the Management, Business, Science and Arts occupations in Lemon Cove, the most male-oriented occupations are Management (100.0%), Business & Financial (100.0%), and Computers, Engineering & Science (100.0%), while the most female-oriented occupations are Community & Social Service (100.0%), Education Instruction & Library (100.0%), and Arts, Media & Entertainment (100.0%).
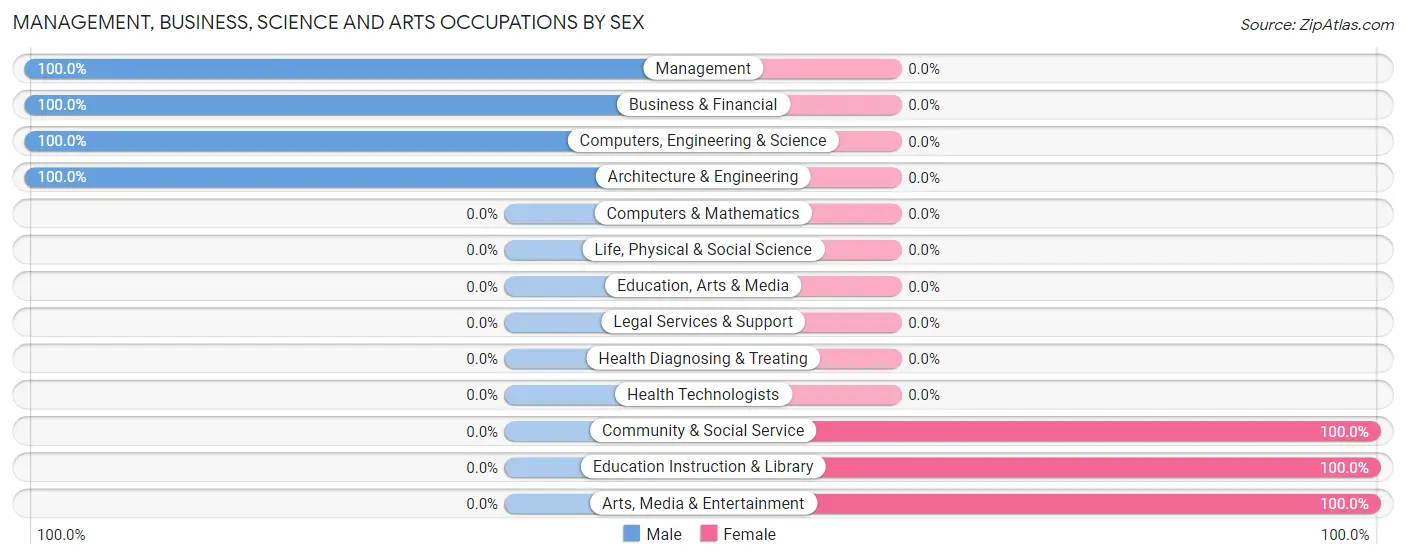
| Occupation | Male | Female |
| Management | 6 (100.0%) | 0 (0.0%) |
| Business & Financial | 2 (100.0%) | 0 (0.0%) |
| Computers, Engineering & Science | 11 (100.0%) | 0 (0.0%) |
| Computers & Mathematics | 0 (0.0%) | 0 (0.0%) |
| Architecture & Engineering | 11 (100.0%) | 0 (0.0%) |
| Life, Physical & Social Science | 0 (0.0%) | 0 (0.0%) |
| Community & Social Service | 0 (0.0%) | 25 (100.0%) |
| Education, Arts & Media | 0 (0.0%) | 0 (0.0%) |
| Legal Services & Support | 0 (0.0%) | 0 (0.0%) |
| Education Instruction & Library | 0 (0.0%) | 15 (100.0%) |
| Arts, Media & Entertainment | 0 (0.0%) | 10 (100.0%) |
| Health Diagnosing & Treating | 0 (0.0%) | 0 (0.0%) |
| Health Technologists | 0 (0.0%) | 0 (0.0%) |
| Total (Category) | 19 (43.2%) | 25 (56.8%) |
| Total (Overall) | 84 (58.7%) | 59 (41.3%) |
Services Occupations
The most common Services occupations in Lemon Cove are , and Cleaning & Maintenance (8 | 5.6%).
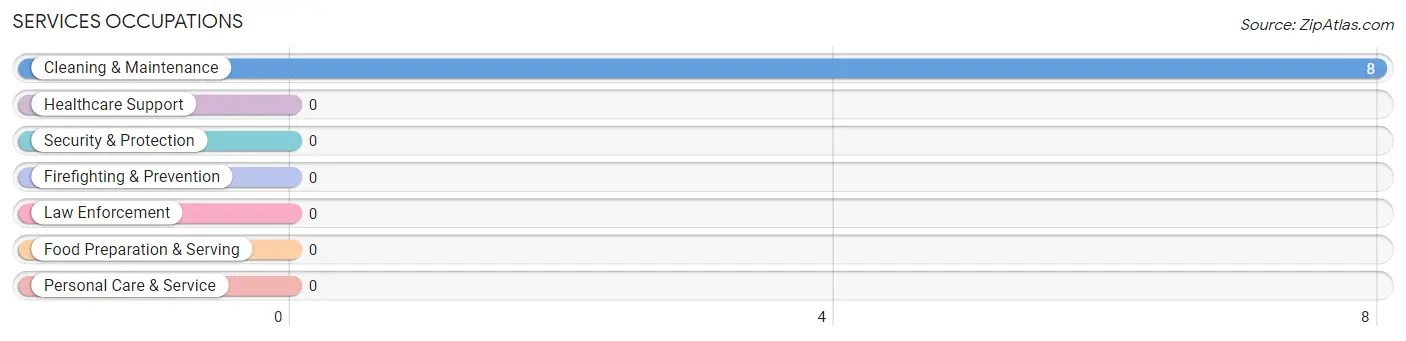
Services Occupations by Sex
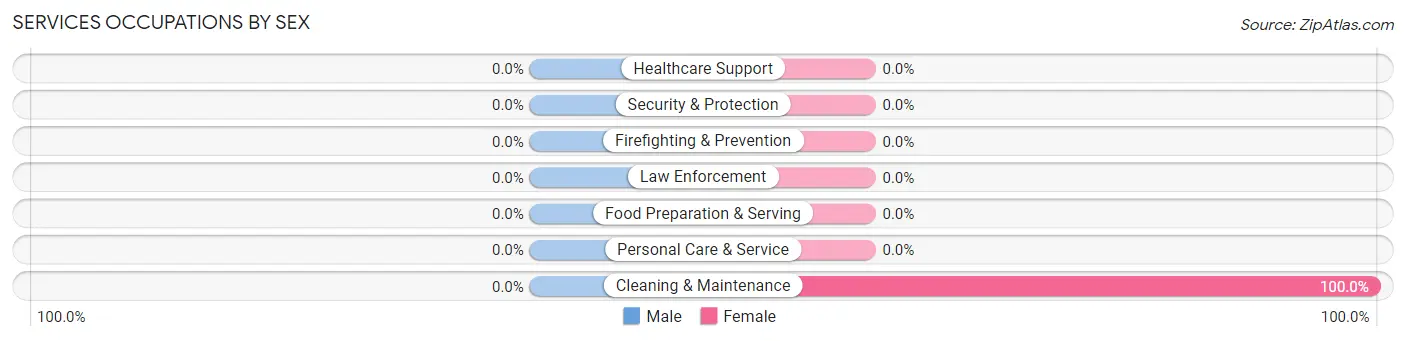
| Occupation | Male | Female |
| Healthcare Support | 0 (0.0%) | 0 (0.0%) |
| Security & Protection | 0 (0.0%) | 0 (0.0%) |
| Firefighting & Prevention | 0 (0.0%) | 0 (0.0%) |
| Law Enforcement | 0 (0.0%) | 0 (0.0%) |
| Food Preparation & Serving | 0 (0.0%) | 0 (0.0%) |
| Cleaning & Maintenance | 0 (0.0%) | 8 (100.0%) |
| Personal Care & Service | 0 (0.0%) | 0 (0.0%) |
| Total (Category) | 0 (0.0%) | 8 (100.0%) |
| Total (Overall) | 84 (58.7%) | 59 (41.3%) |
Sales and Office Occupations
The most common Sales and Office occupations in Lemon Cove are Sales & Related (51 | 35.7%), and Office & Administration (23 | 16.1%).
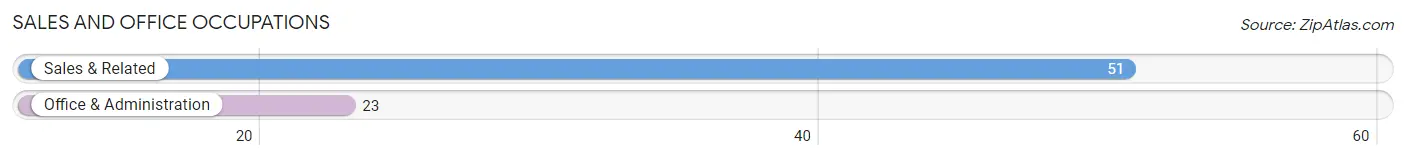
Sales and Office Occupations by Sex
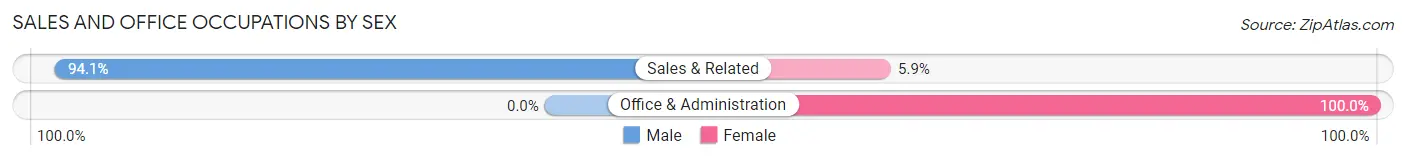
| Occupation | Male | Female |
| Sales & Related | 48 (94.1%) | 3 (5.9%) |
| Office & Administration | 0 (0.0%) | 23 (100.0%) |
| Total (Category) | 48 (64.9%) | 26 (35.1%) |
| Total (Overall) | 84 (58.7%) | 59 (41.3%) |
Natural Resources, Construction and Maintenance Occupations
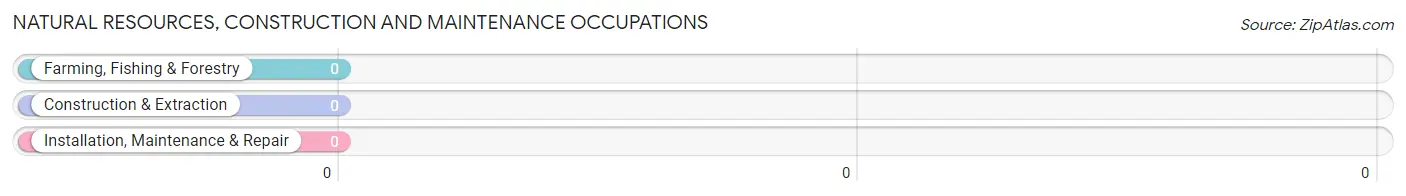
Natural Resources, Construction and Maintenance Occupations by Sex
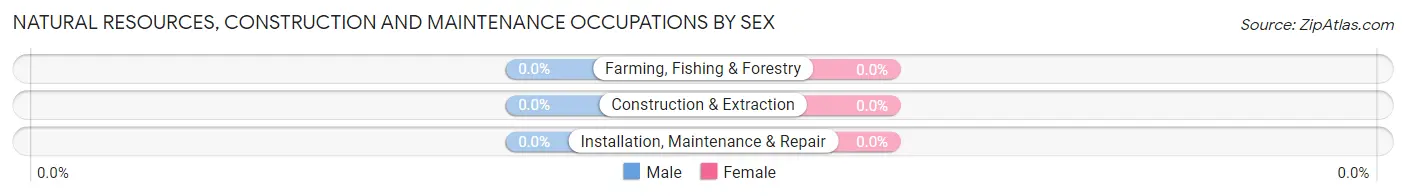
| Occupation | Male | Female |
| Farming, Fishing & Forestry | 0 (0.0%) | 0 (0.0%) |
| Construction & Extraction | 0 (0.0%) | 0 (0.0%) |
| Installation, Maintenance & Repair | 0 (0.0%) | 0 (0.0%) |
| Total (Category) | 0 (0.0%) | 0 (0.0%) |
| Total (Overall) | 84 (58.7%) | 59 (41.3%) |
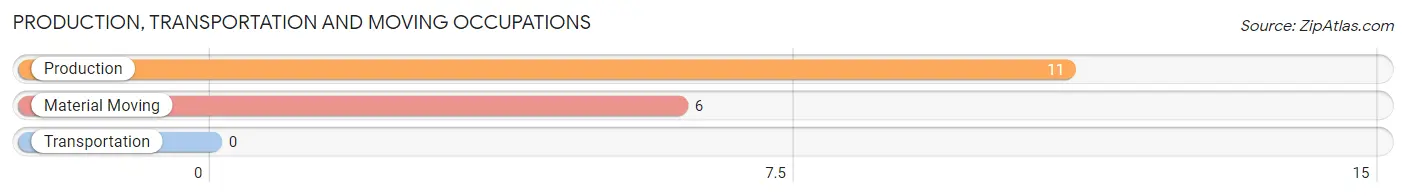
Production, Transportation and Moving Occupations
The most common Production, Transportation and Moving occupations in Lemon Cove are Production (11 | 7.7%), and Material Moving (6 | 4.2%).
Production, Transportation and Moving Occupations by Sex
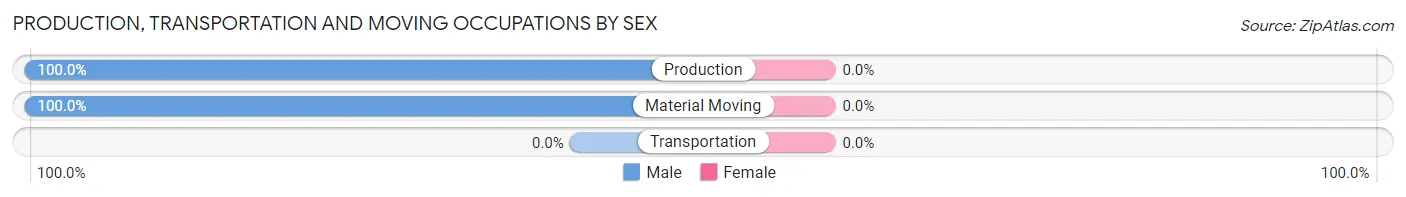
| Occupation | Male | Female |
| Production | 11 (100.0%) | 0 (0.0%) |
| Transportation | 0 (0.0%) | 0 (0.0%) |
| Material Moving | 6 (100.0%) | 0 (0.0%) |
| Total (Category) | 17 (100.0%) | 0 (0.0%) |
| Total (Overall) | 84 (58.7%) | 59 (41.3%) |
Employment Industries by Sex in Lemon Cove
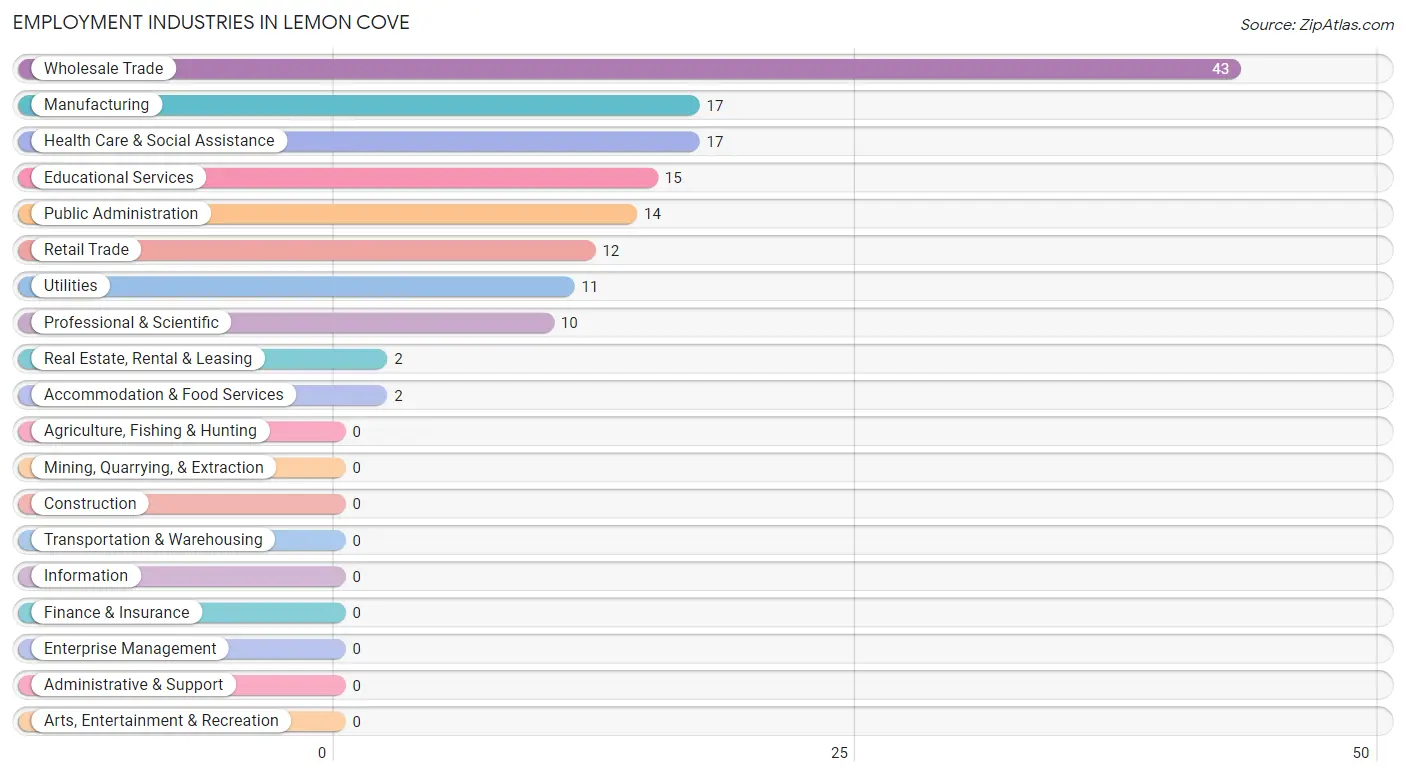
Employment Industries in Lemon Cove
The major employment industries in Lemon Cove include Wholesale Trade (43 | 30.1%), Manufacturing (17 | 11.9%), Health Care & Social Assistance (17 | 11.9%), Educational Services (15 | 10.5%), and Public Administration (14 | 9.8%).
Employment Industries by Sex in Lemon Cove
The Lemon Cove industries that see more men than women are Wholesale Trade (100.0%), Utilities (100.0%), and Real Estate, Rental & Leasing (100.0%), whereas the industries that tend to have a higher number of women are Professional & Scientific (100.0%), Educational Services (100.0%), and Health Care & Social Assistance (100.0%).
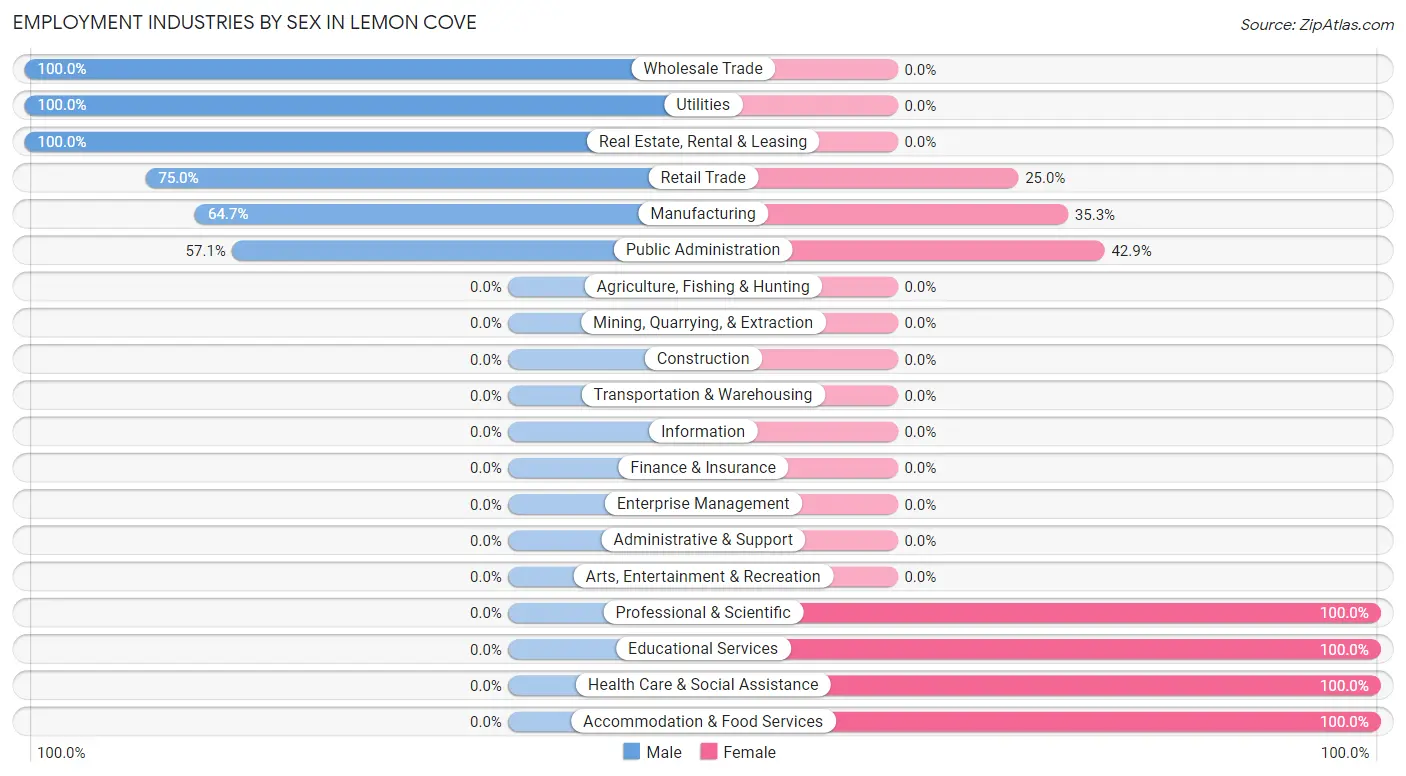
| Industry | Male | Female |
| Agriculture, Fishing & Hunting | 0 (0.0%) | 0 (0.0%) |
| Mining, Quarrying, & Extraction | 0 (0.0%) | 0 (0.0%) |
| Construction | 0 (0.0%) | 0 (0.0%) |
| Manufacturing | 11 (64.7%) | 6 (35.3%) |
| Wholesale Trade | 43 (100.0%) | 0 (0.0%) |
| Retail Trade | 9 (75.0%) | 3 (25.0%) |
| Transportation & Warehousing | 0 (0.0%) | 0 (0.0%) |
| Utilities | 11 (100.0%) | 0 (0.0%) |
| Information | 0 (0.0%) | 0 (0.0%) |
| Finance & Insurance | 0 (0.0%) | 0 (0.0%) |
| Real Estate, Rental & Leasing | 2 (100.0%) | 0 (0.0%) |
| Professional & Scientific | 0 (0.0%) | 10 (100.0%) |
| Enterprise Management | 0 (0.0%) | 0 (0.0%) |
| Administrative & Support | 0 (0.0%) | 0 (0.0%) |
| Educational Services | 0 (0.0%) | 15 (100.0%) |
| Health Care & Social Assistance | 0 (0.0%) | 17 (100.0%) |
| Arts, Entertainment & Recreation | 0 (0.0%) | 0 (0.0%) |
| Accommodation & Food Services | 0 (0.0%) | 2 (100.0%) |
| Public Administration | 8 (57.1%) | 6 (42.9%) |
| Total | 84 (58.7%) | 59 (41.3%) |
Education in Lemon Cove
School Enrollment in Lemon Cove
The most common levels of schooling among the 145 students in Lemon Cove are elementary school (77 | 53.1%), middle school (43 | 29.7%), and high school (11 | 7.6%).
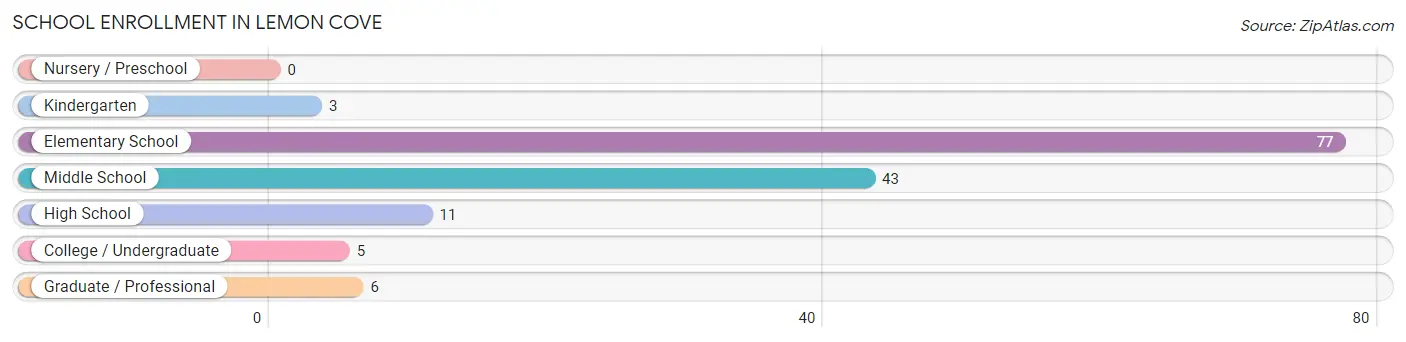
| School Level | # Students | % Students |
| Nursery / Preschool | 0 | 0.0% |
| Kindergarten | 3 | 2.1% |
| Elementary School | 77 | 53.1% |
| Middle School | 43 | 29.7% |
| High School | 11 | 7.6% |
| College / Undergraduate | 5 | 3.5% |
| Graduate / Professional | 6 | 4.1% |
| Total | 145 | 100.0% |
School Enrollment by Age by Funding Source in Lemon Cove
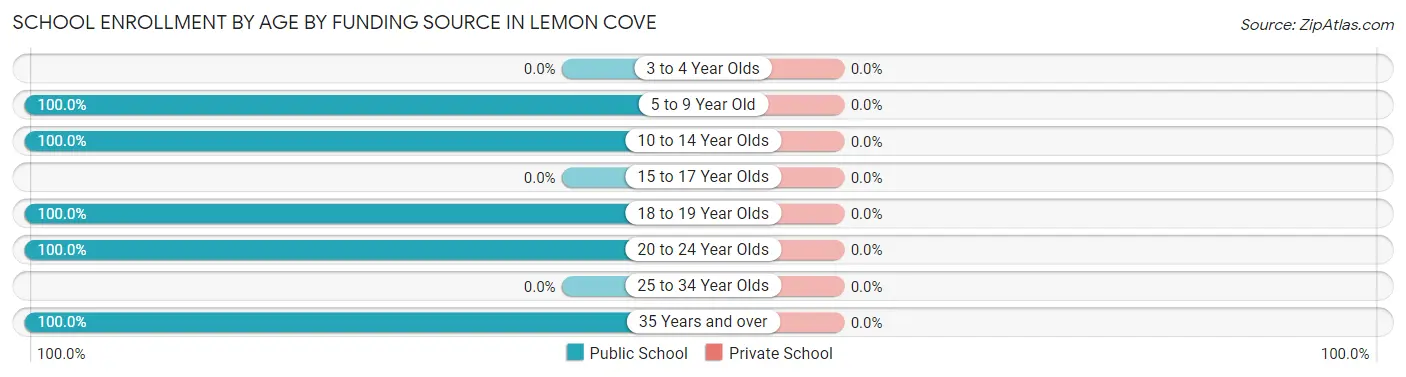
| Age Bracket | Public School | Private School |
| 3 to 4 Year Olds | 0 (0.0%) | 0 (0.0%) |
| 5 to 9 Year Old | 80 (100.0%) | 0 (0.0%) |
| 10 to 14 Year Olds | 54 (100.0%) | 0 (0.0%) |
| 15 to 17 Year Olds | 0 (0.0%) | 0 (0.0%) |
| 18 to 19 Year Olds | 2 (100.0%) | 0 (0.0%) |
| 20 to 24 Year Olds | 3 (100.0%) | 0 (0.0%) |
| 25 to 34 Year Olds | 0 (0.0%) | 0 (0.0%) |
| 35 Years and over | 6 (100.0%) | 0 (0.0%) |
| Total | 145 (100.0%) | 0 (0.0%) |
Educational Attainment by Field of Study in Lemon Cove
Business (25 | 24.0%), social sciences (21 | 20.2%), arts & humanities (14 | 13.5%), engineering (11 | 10.6%), and education (10 | 9.6%) are the most common fields of study among 104 individuals in Lemon Cove who have obtained a bachelor's degree or higher.
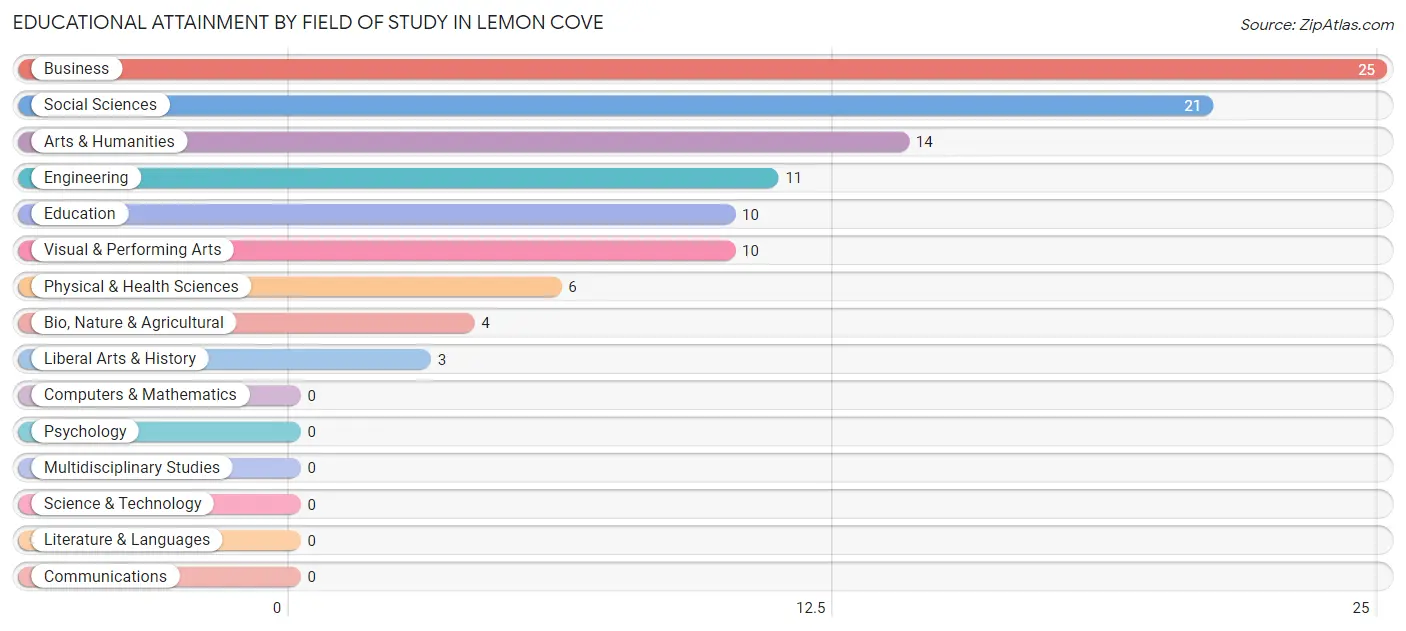
| Field of Study | # Graduates | % Graduates |
| Computers & Mathematics | 0 | 0.0% |
| Bio, Nature & Agricultural | 4 | 3.8% |
| Physical & Health Sciences | 6 | 5.8% |
| Psychology | 0 | 0.0% |
| Social Sciences | 21 | 20.2% |
| Engineering | 11 | 10.6% |
| Multidisciplinary Studies | 0 | 0.0% |
| Science & Technology | 0 | 0.0% |
| Business | 25 | 24.0% |
| Education | 10 | 9.6% |
| Literature & Languages | 0 | 0.0% |
| Liberal Arts & History | 3 | 2.9% |
| Visual & Performing Arts | 10 | 9.6% |
| Communications | 0 | 0.0% |
| Arts & Humanities | 14 | 13.5% |
| Total | 104 | 100.0% |
Transportation & Commute in Lemon Cove
Vehicle Availability by Sex in Lemon Cove
The most prevalent vehicle ownership categories in Lemon Cove are males with 1 vehicle (22, accounting for 26.2%) and females with 1 vehicle (0, making up 37.3%).
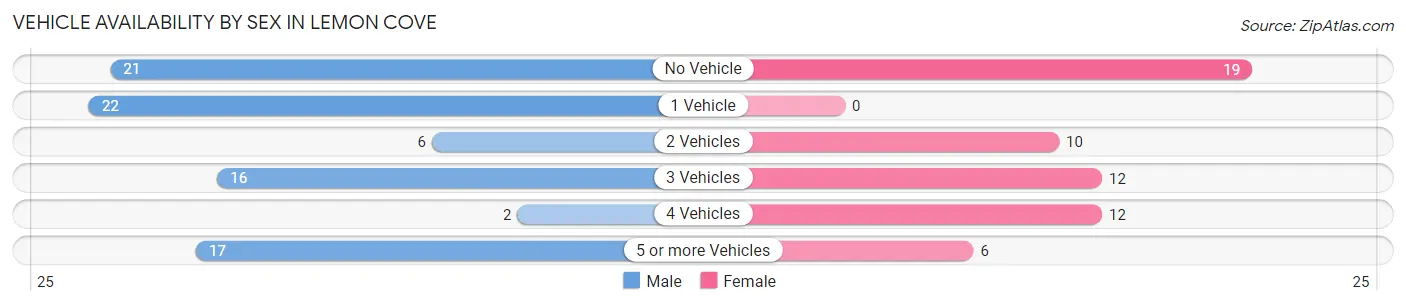
| Vehicles Available | Male | Female |
| No Vehicle | 21 (25.0%) | 19 (32.2%) |
| 1 Vehicle | 22 (26.2%) | 0 (0.0%) |
| 2 Vehicles | 6 (7.1%) | 10 (17.0%) |
| 3 Vehicles | 16 (19.1%) | 12 (20.3%) |
| 4 Vehicles | 2 (2.4%) | 12 (20.3%) |
| 5 or more Vehicles | 17 (20.2%) | 6 (10.2%) |
| Total | 84 (100.0%) | 59 (100.0%) |
Commute Time in Lemon Cove
The most frequently occuring commute durations in Lemon Cove are 30 to 34 minutes (43 commuters, 33.9%), 25 to 29 minutes (31 commuters, 24.4%), and 35 to 39 minutes (21 commuters, 16.5%).
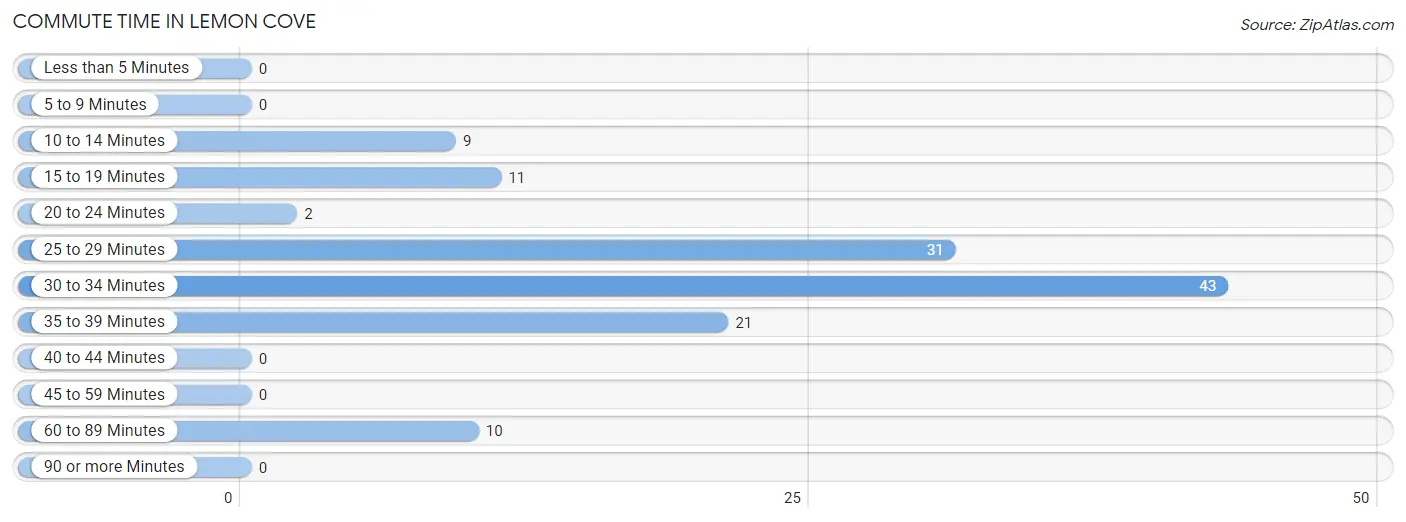
| Commute Time | # Commuters | % Commuters |
| Less than 5 Minutes | 0 | 0.0% |
| 5 to 9 Minutes | 0 | 0.0% |
| 10 to 14 Minutes | 9 | 7.1% |
| 15 to 19 Minutes | 11 | 8.7% |
| 20 to 24 Minutes | 2 | 1.6% |
| 25 to 29 Minutes | 31 | 24.4% |
| 30 to 34 Minutes | 43 | 33.9% |
| 35 to 39 Minutes | 21 | 16.5% |
| 40 to 44 Minutes | 0 | 0.0% |
| 45 to 59 Minutes | 0 | 0.0% |
| 60 to 89 Minutes | 10 | 7.9% |
| 90 or more Minutes | 0 | 0.0% |
Commute Time by Sex in Lemon Cove
The most common commute times in Lemon Cove are 30 to 34 minutes (35 commuters, 41.7%) for males and 25 to 29 minutes (20 commuters, 46.5%) for females.
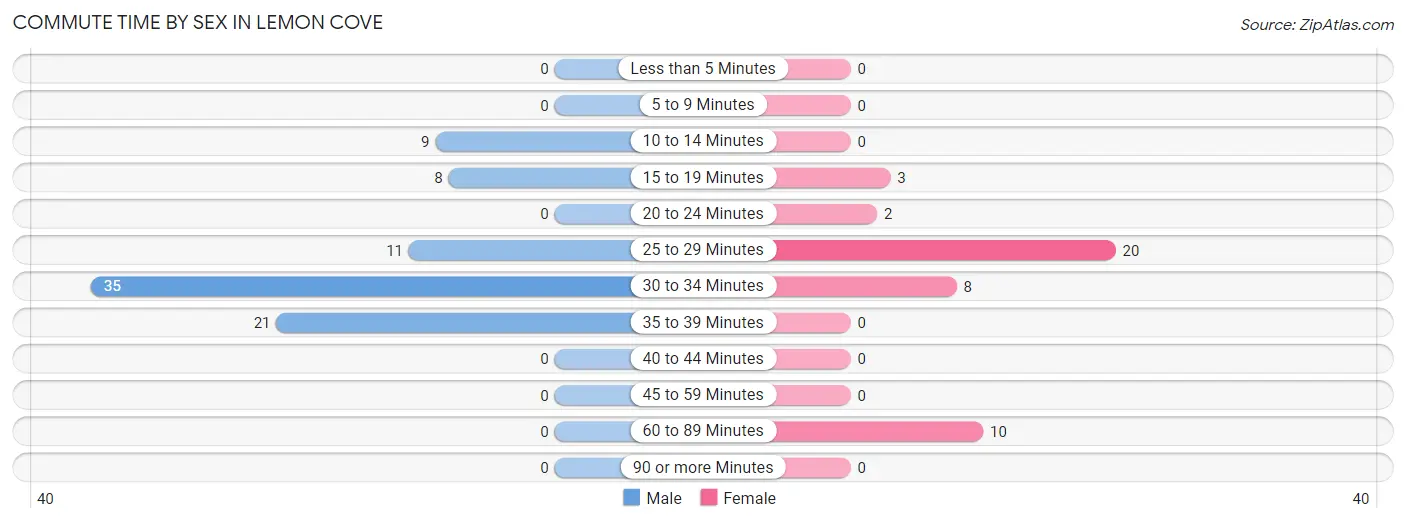
| Commute Time | Male | Female |
| Less than 5 Minutes | 0 (0.0%) | 0 (0.0%) |
| 5 to 9 Minutes | 0 (0.0%) | 0 (0.0%) |
| 10 to 14 Minutes | 9 (10.7%) | 0 (0.0%) |
| 15 to 19 Minutes | 8 (9.5%) | 3 (7.0%) |
| 20 to 24 Minutes | 0 (0.0%) | 2 (4.6%) |
| 25 to 29 Minutes | 11 (13.1%) | 20 (46.5%) |
| 30 to 34 Minutes | 35 (41.7%) | 8 (18.6%) |
| 35 to 39 Minutes | 21 (25.0%) | 0 (0.0%) |
| 40 to 44 Minutes | 0 (0.0%) | 0 (0.0%) |
| 45 to 59 Minutes | 0 (0.0%) | 0 (0.0%) |
| 60 to 89 Minutes | 0 (0.0%) | 10 (23.3%) |
| 90 or more Minutes | 0 (0.0%) | 0 (0.0%) |
Time of Departure to Work by Sex in Lemon Cove
The most frequent times of departure to work in Lemon Cove are 5:30 AM to 5:59 AM (54, 64.3%) for males and 5:30 AM to 5:59 AM (17, 39.5%) for females.
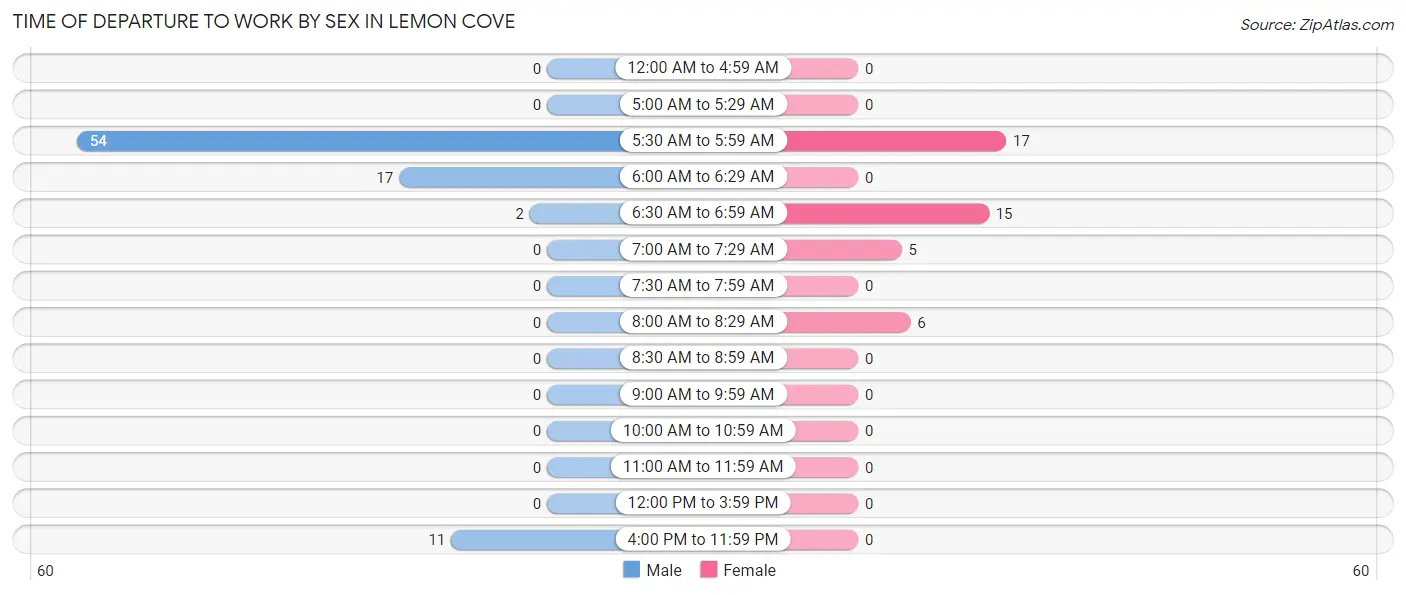
| Time of Departure | Male | Female |
| 12:00 AM to 4:59 AM | 0 (0.0%) | 0 (0.0%) |
| 5:00 AM to 5:29 AM | 0 (0.0%) | 0 (0.0%) |
| 5:30 AM to 5:59 AM | 54 (64.3%) | 17 (39.5%) |
| 6:00 AM to 6:29 AM | 17 (20.2%) | 0 (0.0%) |
| 6:30 AM to 6:59 AM | 2 (2.4%) | 15 (34.9%) |
| 7:00 AM to 7:29 AM | 0 (0.0%) | 5 (11.6%) |
| 7:30 AM to 7:59 AM | 0 (0.0%) | 0 (0.0%) |
| 8:00 AM to 8:29 AM | 0 (0.0%) | 6 (14.0%) |
| 8:30 AM to 8:59 AM | 0 (0.0%) | 0 (0.0%) |
| 9:00 AM to 9:59 AM | 0 (0.0%) | 0 (0.0%) |
| 10:00 AM to 10:59 AM | 0 (0.0%) | 0 (0.0%) |
| 11:00 AM to 11:59 AM | 0 (0.0%) | 0 (0.0%) |
| 12:00 PM to 3:59 PM | 0 (0.0%) | 0 (0.0%) |
| 4:00 PM to 11:59 PM | 11 (13.1%) | 0 (0.0%) |
| Total | 84 (100.0%) | 43 (100.0%) |
Housing Occupancy in Lemon Cove
Occupancy by Ownership in Lemon Cove
Of the total 155 dwellings in Lemon Cove, owner-occupied units account for 117 (75.5%), while renter-occupied units make up 38 (24.5%).
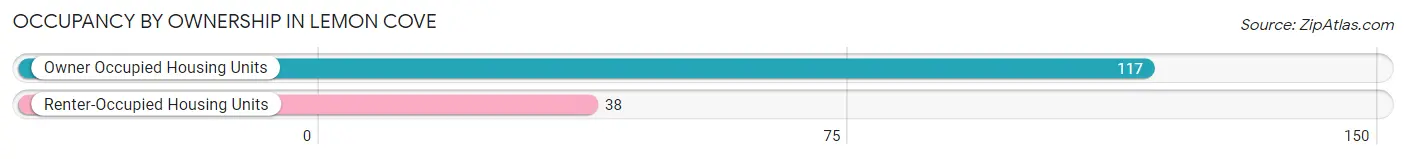
| Occupancy | # Housing Units | % Housing Units |
| Owner Occupied Housing Units | 117 | 75.5% |
| Renter-Occupied Housing Units | 38 | 24.5% |
| Total Occupied Housing Units | 155 | 100.0% |
Occupancy by Household Size in Lemon Cove
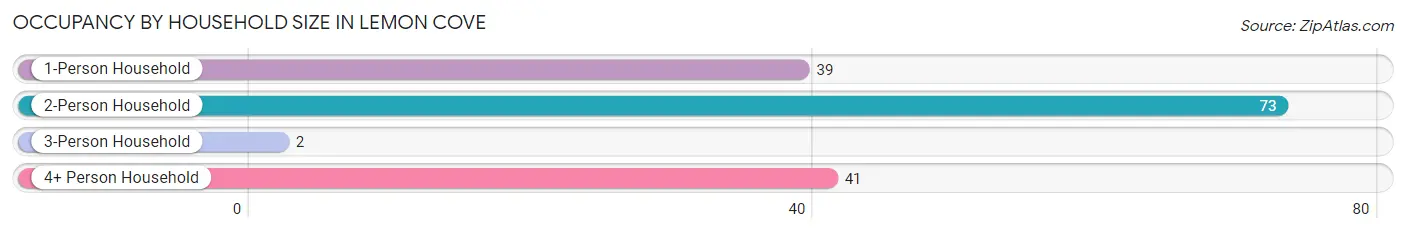
| Household Size | # Housing Units | % Housing Units |
| 1-Person Household | 39 | 25.2% |
| 2-Person Household | 73 | 47.1% |
| 3-Person Household | 2 | 1.3% |
| 4+ Person Household | 41 | 26.5% |
| Total Housing Units | 155 | 100.0% |
Occupancy by Ownership by Household Size in Lemon Cove
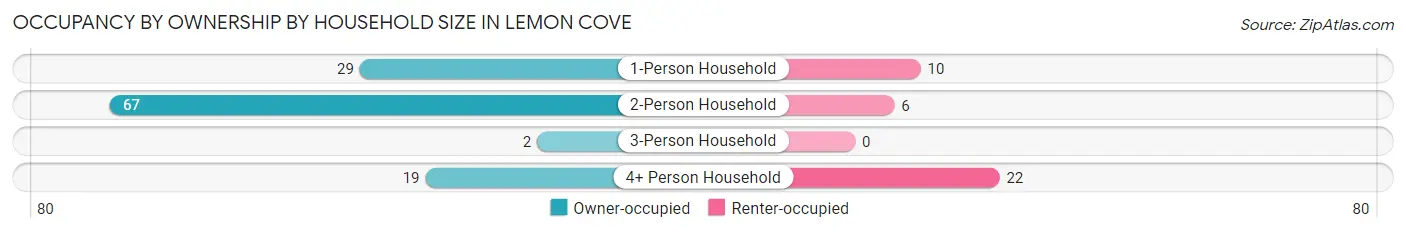
| Household Size | Owner-occupied | Renter-occupied |
| 1-Person Household | 29 (74.4%) | 10 (25.6%) |
| 2-Person Household | 67 (91.8%) | 6 (8.2%) |
| 3-Person Household | 2 (100.0%) | 0 (0.0%) |
| 4+ Person Household | 19 (46.3%) | 22 (53.7%) |
| Total Housing Units | 117 (75.5%) | 38 (24.5%) |
Occupancy by Educational Attainment in Lemon Cove
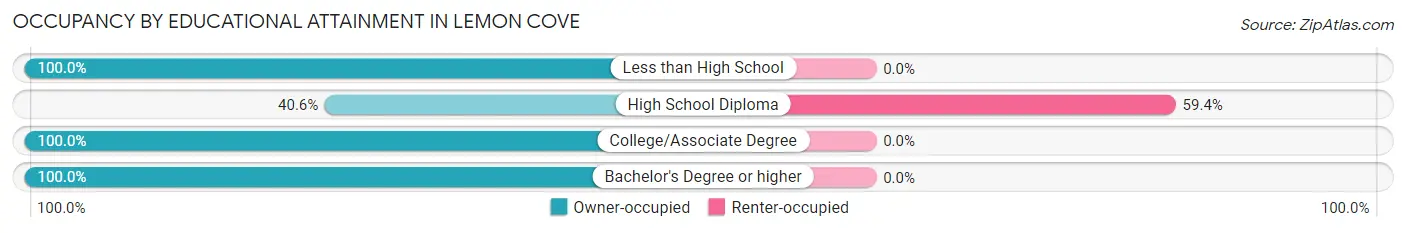
| Household Size | Owner-occupied | Renter-occupied |
| Less than High School | 31 (100.0%) | 0 (0.0%) |
| High School Diploma | 26 (40.6%) | 38 (59.4%) |
| College/Associate Degree | 8 (100.0%) | 0 (0.0%) |
| Bachelor's Degree or higher | 52 (100.0%) | 0 (0.0%) |
Occupancy by Age of Householder in Lemon Cove
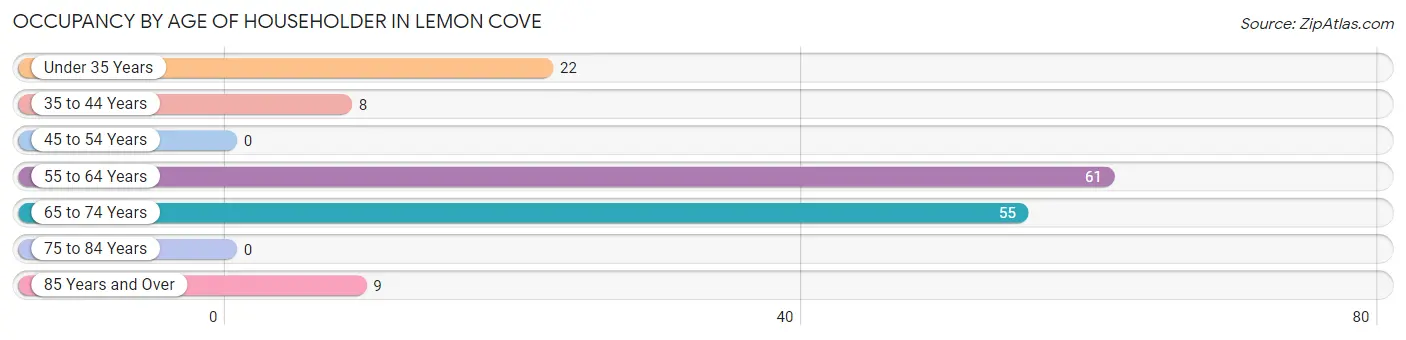
| Age Bracket | # Households | % Households |
| Under 35 Years | 22 | 14.2% |
| 35 to 44 Years | 8 | 5.2% |
| 45 to 54 Years | 0 | 0.0% |
| 55 to 64 Years | 61 | 39.4% |
| 65 to 74 Years | 55 | 35.5% |
| 75 to 84 Years | 0 | 0.0% |
| 85 Years and Over | 9 | 5.8% |
| Total | 155 | 100.0% |
Housing Finances in Lemon Cove
Median Income by Occupancy in Lemon Cove
| Occupancy Type | # Households | Median Income |
| Owner-Occupied | 117 (75.5%) | $0 |
| Renter-Occupied | 38 (24.5%) | $0 |
| Average | 155 (100.0%) | $0 |
Occupancy by Householder Income Bracket in Lemon Cove
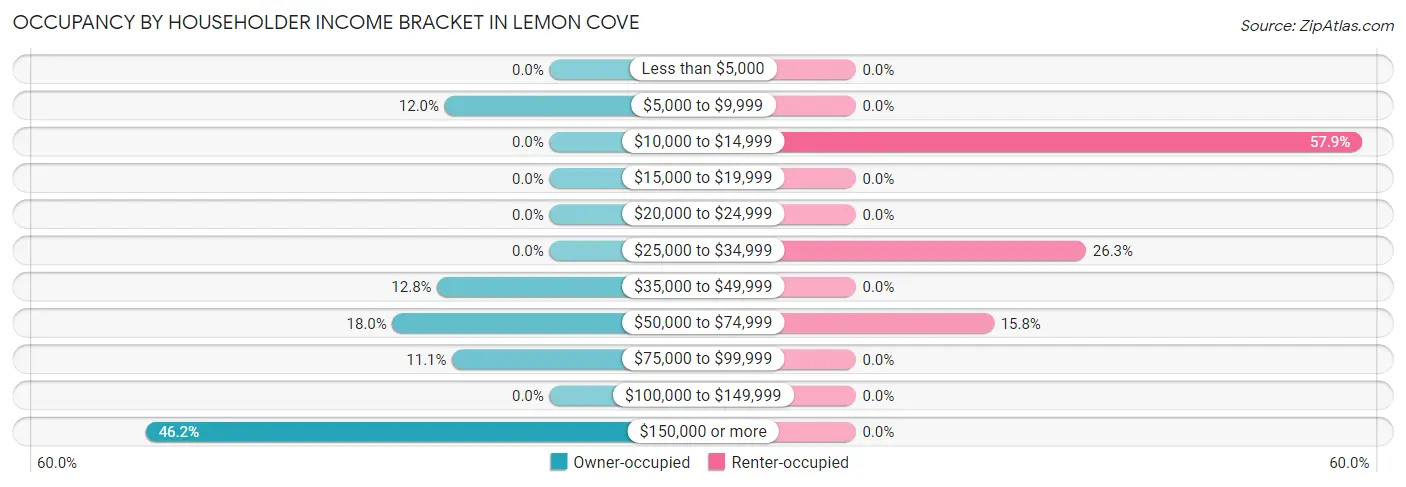
| Income Bracket | Owner-occupied | Renter-occupied |
| Less than $5,000 | 0 (0.0%) | 0 (0.0%) |
| $5,000 to $9,999 | 14 (12.0%) | 0 (0.0%) |
| $10,000 to $14,999 | 0 (0.0%) | 22 (57.9%) |
| $15,000 to $19,999 | 0 (0.0%) | 0 (0.0%) |
| $20,000 to $24,999 | 0 (0.0%) | 0 (0.0%) |
| $25,000 to $34,999 | 0 (0.0%) | 10 (26.3%) |
| $35,000 to $49,999 | 15 (12.8%) | 0 (0.0%) |
| $50,000 to $74,999 | 21 (17.9%) | 6 (15.8%) |
| $75,000 to $99,999 | 13 (11.1%) | 0 (0.0%) |
| $100,000 to $149,999 | 0 (0.0%) | 0 (0.0%) |
| $150,000 or more | 54 (46.2%) | 0 (0.0%) |
| Total | 117 (100.0%) | 38 (100.0%) |
Monthly Housing Cost Tiers in Lemon Cove
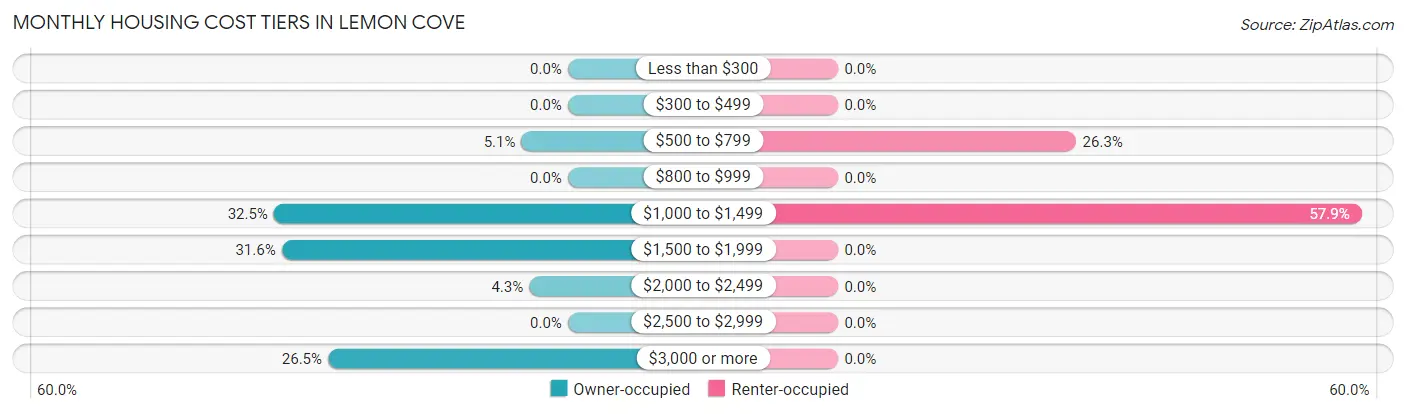
| Monthly Cost | Owner-occupied | Renter-occupied |
| Less than $300 | 0 (0.0%) | 0 (0.0%) |
| $300 to $499 | 0 (0.0%) | 0 (0.0%) |
| $500 to $799 | 6 (5.1%) | 10 (26.3%) |
| $800 to $999 | 0 (0.0%) | 0 (0.0%) |
| $1,000 to $1,499 | 38 (32.5%) | 22 (57.9%) |
| $1,500 to $1,999 | 37 (31.6%) | 0 (0.0%) |
| $2,000 to $2,499 | 5 (4.3%) | 0 (0.0%) |
| $2,500 to $2,999 | 0 (0.0%) | 0 (0.0%) |
| $3,000 or more | 31 (26.5%) | 0 (0.0%) |
| Total | 117 (100.0%) | 38 (100.0%) |
Physical Housing Characteristics in Lemon Cove
Housing Structures in Lemon Cove
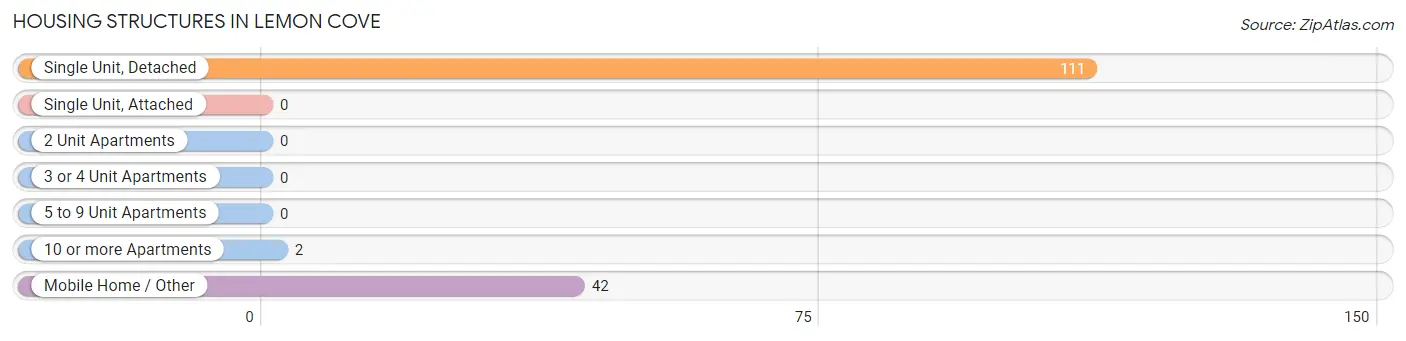
| Structure Type | # Housing Units | % Housing Units |
| Single Unit, Detached | 111 | 71.6% |
| Single Unit, Attached | 0 | 0.0% |
| 2 Unit Apartments | 0 | 0.0% |
| 3 or 4 Unit Apartments | 0 | 0.0% |
| 5 to 9 Unit Apartments | 0 | 0.0% |
| 10 or more Apartments | 2 | 1.3% |
| Mobile Home / Other | 42 | 27.1% |
| Total | 155 | 100.0% |
Housing Structures by Occupancy in Lemon Cove
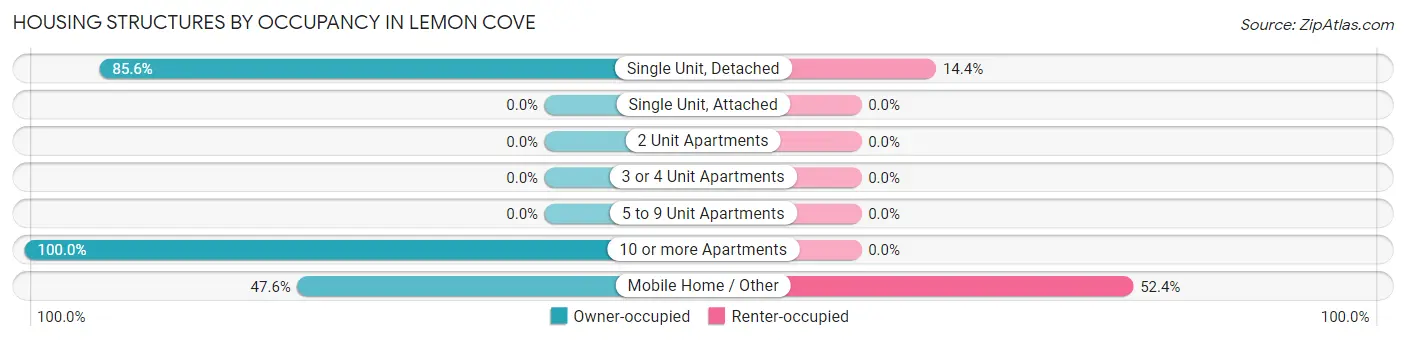
| Structure Type | Owner-occupied | Renter-occupied |
| Single Unit, Detached | 95 (85.6%) | 16 (14.4%) |
| Single Unit, Attached | 0 (0.0%) | 0 (0.0%) |
| 2 Unit Apartments | 0 (0.0%) | 0 (0.0%) |
| 3 or 4 Unit Apartments | 0 (0.0%) | 0 (0.0%) |
| 5 to 9 Unit Apartments | 0 (0.0%) | 0 (0.0%) |
| 10 or more Apartments | 2 (100.0%) | 0 (0.0%) |
| Mobile Home / Other | 20 (47.6%) | 22 (52.4%) |
| Total | 117 (75.5%) | 38 (24.5%) |
Housing Structures by Number of Rooms in Lemon Cove
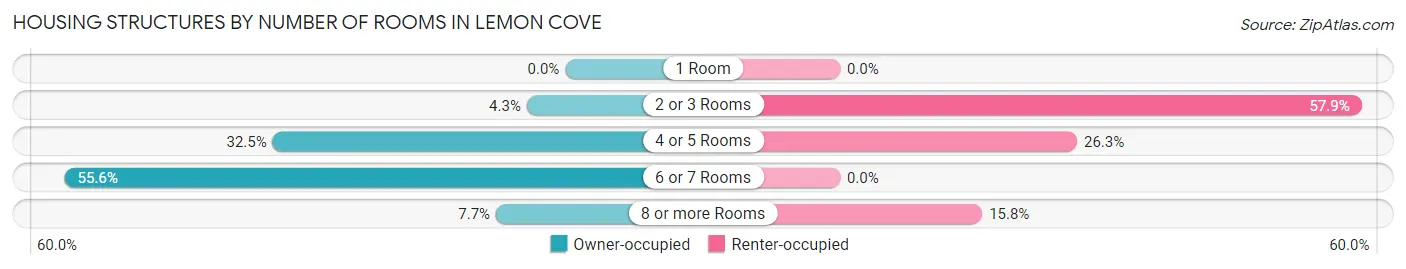
| Number of Rooms | Owner-occupied | Renter-occupied |
| 1 Room | 0 (0.0%) | 0 (0.0%) |
| 2 or 3 Rooms | 5 (4.3%) | 22 (57.9%) |
| 4 or 5 Rooms | 38 (32.5%) | 10 (26.3%) |
| 6 or 7 Rooms | 65 (55.6%) | 0 (0.0%) |
| 8 or more Rooms | 9 (7.7%) | 6 (15.8%) |
| Total | 117 (100.0%) | 38 (100.0%) |
Housing Structure by Heating Type in Lemon Cove
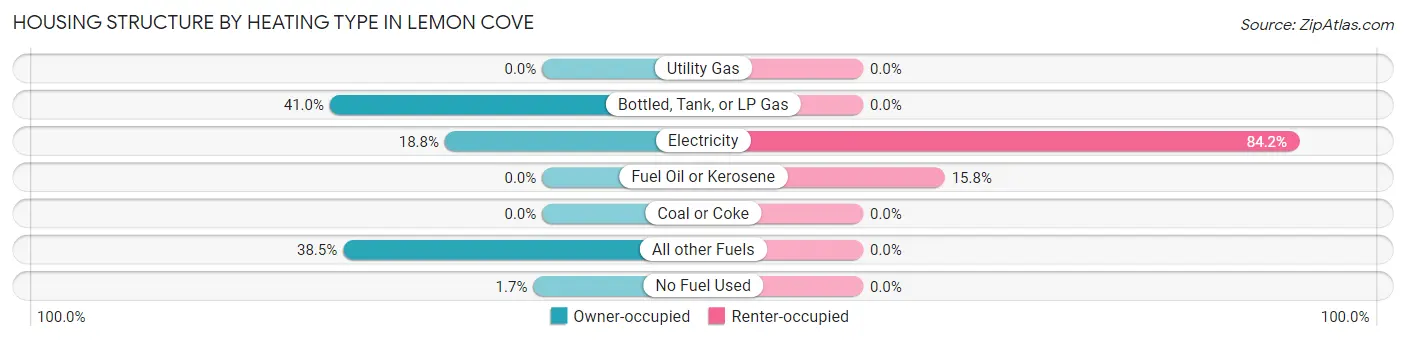
| Heating Type | Owner-occupied | Renter-occupied |
| Utility Gas | 0 (0.0%) | 0 (0.0%) |
| Bottled, Tank, or LP Gas | 48 (41.0%) | 0 (0.0%) |
| Electricity | 22 (18.8%) | 32 (84.2%) |
| Fuel Oil or Kerosene | 0 (0.0%) | 6 (15.8%) |
| Coal or Coke | 0 (0.0%) | 0 (0.0%) |
| All other Fuels | 45 (38.5%) | 0 (0.0%) |
| No Fuel Used | 2 (1.7%) | 0 (0.0%) |
| Total | 117 (100.0%) | 38 (100.0%) |
Household Vehicle Usage in Lemon Cove
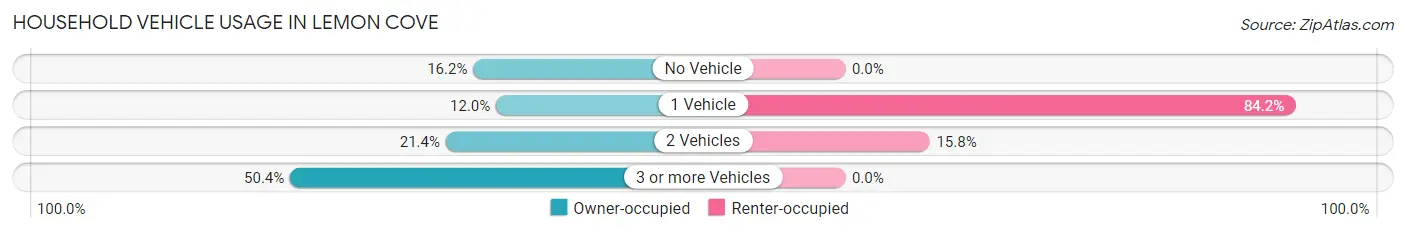
| Vehicles per Household | Owner-occupied | Renter-occupied |
| No Vehicle | 19 (16.2%) | 0 (0.0%) |
| 1 Vehicle | 14 (12.0%) | 32 (84.2%) |
| 2 Vehicles | 25 (21.4%) | 6 (15.8%) |
| 3 or more Vehicles | 59 (50.4%) | 0 (0.0%) |
| Total | 117 (100.0%) | 38 (100.0%) |
Real Estate & Mortgages in Lemon Cove
Real Estate and Mortgage Overview in Lemon Cove
| Characteristic | Without Mortgage | With Mortgage |
| Housing Units | 23 | 94 |
| Median Property Value | - | - |
| Median Household Income | - | - |
| Monthly Housing Costs | - | - |
| Real Estate Taxes | - | - |
Property Value by Mortgage Status in Lemon Cove
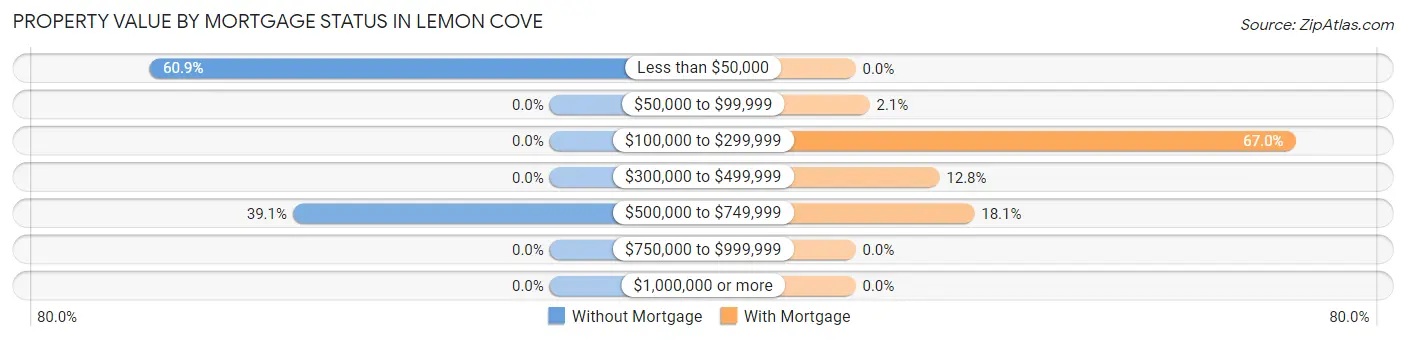
| Property Value | Without Mortgage | With Mortgage |
| Less than $50,000 | 14 (60.9%) | 0 (0.0%) |
| $50,000 to $99,999 | 0 (0.0%) | 2 (2.1%) |
| $100,000 to $299,999 | 0 (0.0%) | 63 (67.0%) |
| $300,000 to $499,999 | 0 (0.0%) | 12 (12.8%) |
| $500,000 to $749,999 | 9 (39.1%) | 17 (18.1%) |
| $750,000 to $999,999 | 0 (0.0%) | 0 (0.0%) |
| $1,000,000 or more | 0 (0.0%) | 0 (0.0%) |
| Total | 23 (100.0%) | 94 (100.0%) |
Household Income by Mortgage Status in Lemon Cove
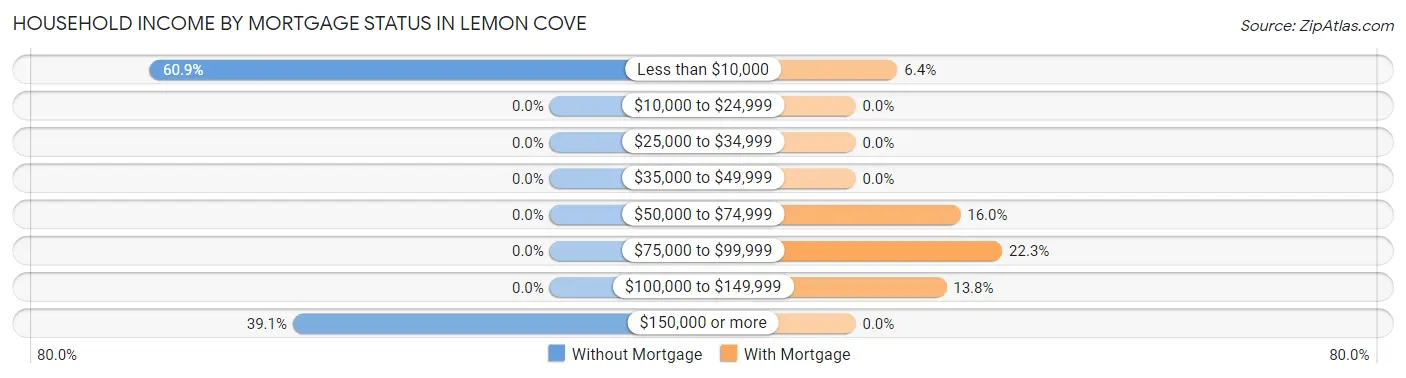
| Household Income | Without Mortgage | With Mortgage |
| Less than $10,000 | 14 (60.9%) | 6 (6.4%) |
| $10,000 to $24,999 | 0 (0.0%) | 0 (0.0%) |
| $25,000 to $34,999 | 0 (0.0%) | 0 (0.0%) |
| $35,000 to $49,999 | 0 (0.0%) | 0 (0.0%) |
| $50,000 to $74,999 | 0 (0.0%) | 15 (16.0%) |
| $75,000 to $99,999 | 0 (0.0%) | 21 (22.3%) |
| $100,000 to $149,999 | 0 (0.0%) | 13 (13.8%) |
| $150,000 or more | 9 (39.1%) | 0 (0.0%) |
| Total | 23 (100.0%) | 94 (100.0%) |
Property Value to Household Income Ratio in Lemon Cove
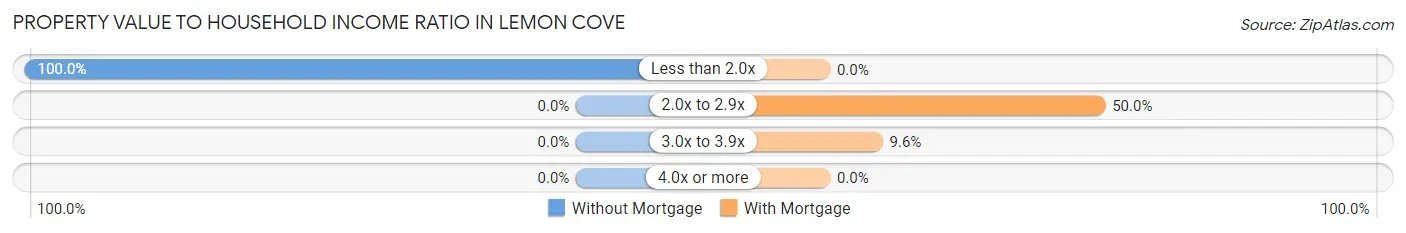
| Value-to-Income Ratio | Without Mortgage | With Mortgage |
| Less than 2.0x | 23 (100.0%) | 0 (0.0%) |
| 2.0x to 2.9x | 0 (0.0%) | 47 (50.0%) |
| 3.0x to 3.9x | 0 (0.0%) | 9 (9.6%) |
| 4.0x or more | 0 (0.0%) | 0 (0.0%) |
| Total | 23 (100.0%) | 94 (100.0%) |
Real Estate Taxes by Mortgage Status in Lemon Cove
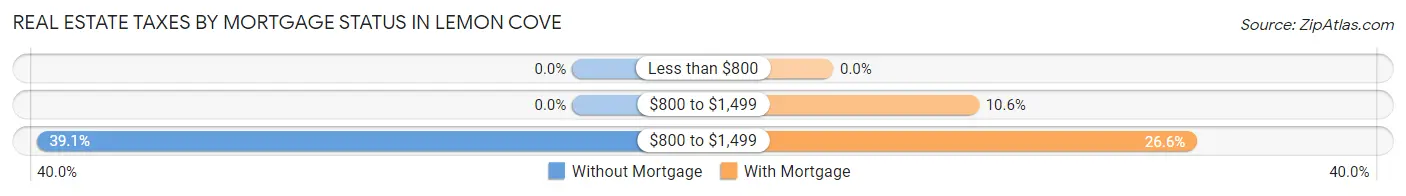
| Property Taxes | Without Mortgage | With Mortgage |
| Less than $800 | 0 (0.0%) | 0 (0.0%) |
| $800 to $1,499 | 0 (0.0%) | 10 (10.6%) |
| $800 to $1,499 | 9 (39.1%) | 25 (26.6%) |
| Total | 23 (100.0%) | 94 (100.0%) |
Health & Disability in Lemon Cove
Health Insurance Coverage by Age in Lemon Cove
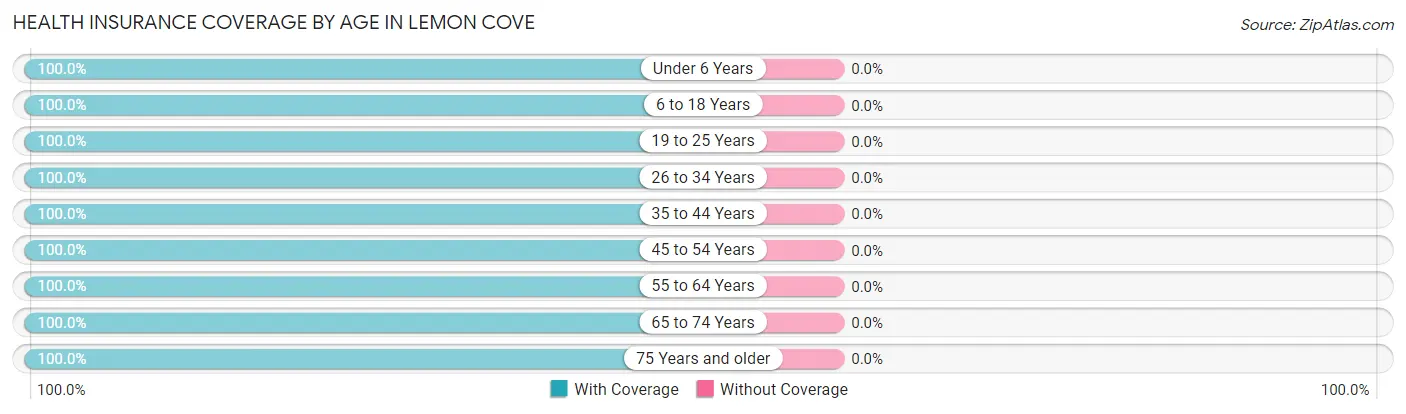
| Age Bracket | With Coverage | Without Coverage |
| Under 6 Years | 46 (100.0%) | 0 (0.0%) |
| 6 to 18 Years | 144 (100.0%) | 0 (0.0%) |
| 19 to 25 Years | 3 (100.0%) | 0 (0.0%) |
| 26 to 34 Years | 42 (100.0%) | 0 (0.0%) |
| 35 to 44 Years | 16 (100.0%) | 0 (0.0%) |
| 45 to 54 Years | 23 (100.0%) | 0 (0.0%) |
| 55 to 64 Years | 102 (100.0%) | 0 (0.0%) |
| 65 to 74 Years | 103 (100.0%) | 0 (0.0%) |
| 75 Years and older | 19 (100.0%) | 0 (0.0%) |
| Total | 498 (100.0%) | 0 (0.0%) |
Health Insurance Coverage by Citizenship Status in Lemon Cove
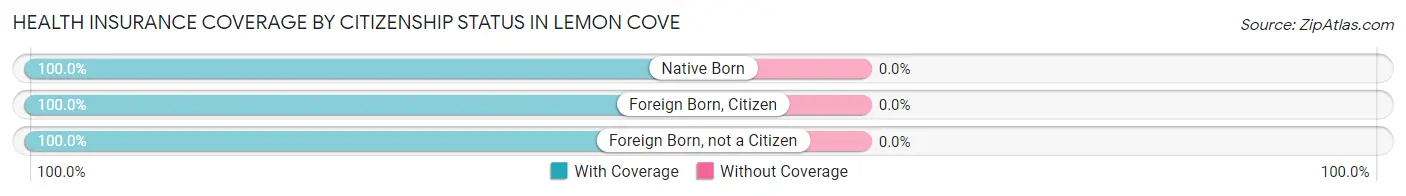
| Citizenship Status | With Coverage | Without Coverage |
| Native Born | 46 (100.0%) | 0 (0.0%) |
| Foreign Born, Citizen | 144 (100.0%) | 0 (0.0%) |
| Foreign Born, not a Citizen | 3 (100.0%) | 0 (0.0%) |
Health Insurance Coverage by Household Income in Lemon Cove
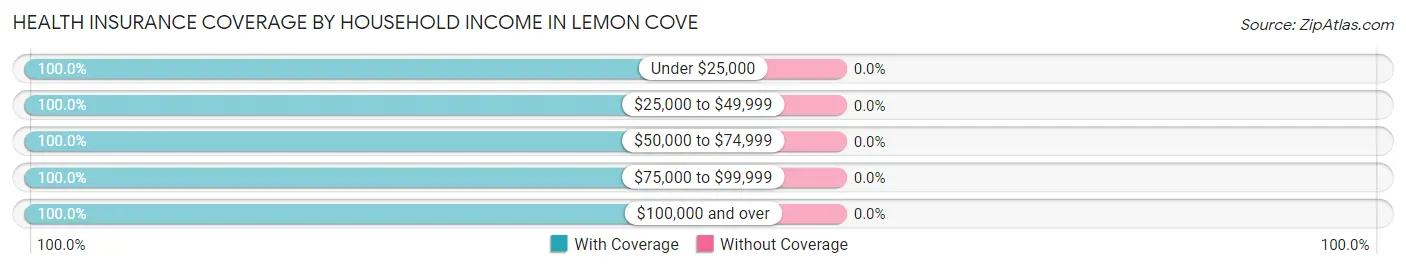
| Household Income | With Coverage | Without Coverage |
| Under $25,000 | 197 (100.0%) | 0 (0.0%) |
| $25,000 to $49,999 | 25 (100.0%) | 0 (0.0%) |
| $50,000 to $74,999 | 60 (100.0%) | 0 (0.0%) |
| $75,000 to $99,999 | 49 (100.0%) | 0 (0.0%) |
| $100,000 and over | 167 (100.0%) | 0 (0.0%) |
Public vs Private Health Insurance Coverage by Age in Lemon Cove
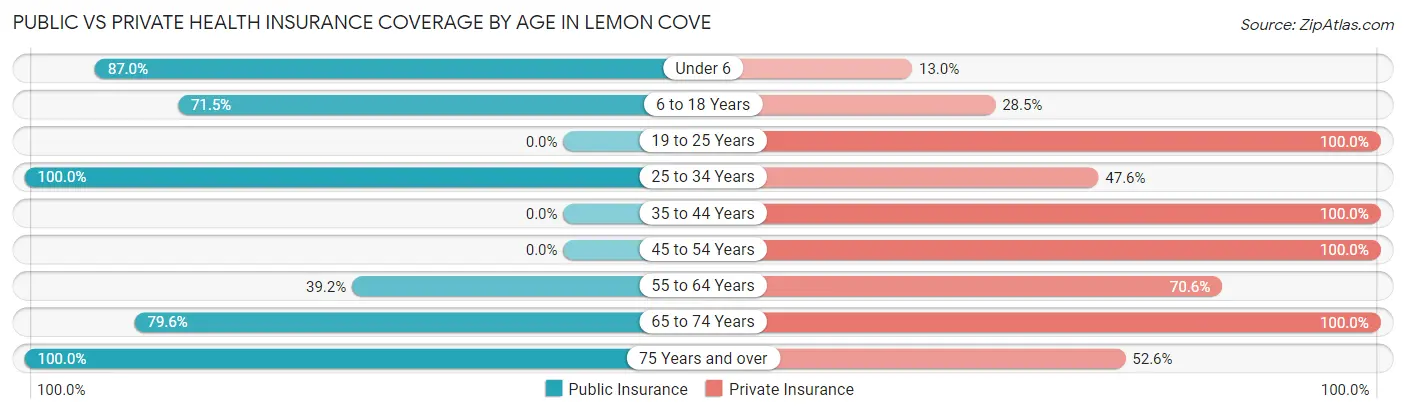
| Age Bracket | Public Insurance | Private Insurance |
| Under 6 | 40 (87.0%) | 6 (13.0%) |
| 6 to 18 Years | 103 (71.5%) | 41 (28.5%) |
| 19 to 25 Years | 0 (0.0%) | 3 (100.0%) |
| 25 to 34 Years | 42 (100.0%) | 20 (47.6%) |
| 35 to 44 Years | 0 (0.0%) | 16 (100.0%) |
| 45 to 54 Years | 0 (0.0%) | 23 (100.0%) |
| 55 to 64 Years | 40 (39.2%) | 72 (70.6%) |
| 65 to 74 Years | 82 (79.6%) | 103 (100.0%) |
| 75 Years and over | 19 (100.0%) | 10 (52.6%) |
| Total | 326 (65.5%) | 294 (59.0%) |
Disability Status by Sex by Age in Lemon Cove
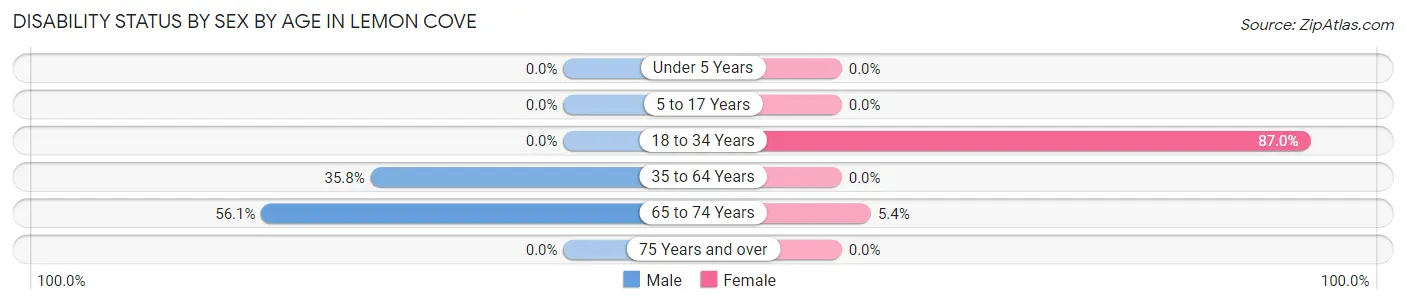
| Age Bracket | Male | Female |
| Under 5 Years | 0 (0.0%) | 0 (0.0%) |
| 5 to 17 Years | 0 (0.0%) | 0 (0.0%) |
| 18 to 34 Years | 0 (0.0%) | 20 (87.0%) |
| 35 to 64 Years | 34 (35.8%) | 0 (0.0%) |
| 65 to 74 Years | 37 (56.1%) | 2 (5.4%) |
| 75 Years and over | 0 (0.0%) | 0 (0.0%) |
Disability Class by Sex by Age in Lemon Cove
Disability Class: Hearing Difficulty
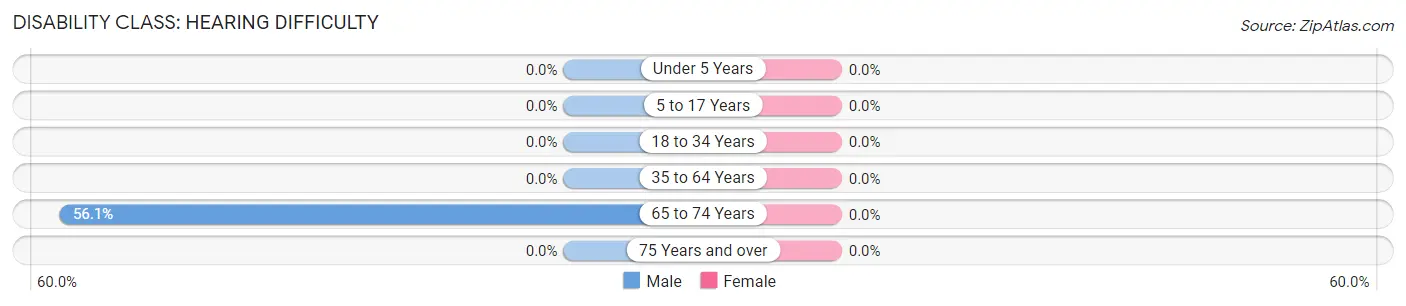
| Age Bracket | Male | Female |
| Under 5 Years | 0 (0.0%) | 0 (0.0%) |
| 5 to 17 Years | 0 (0.0%) | 0 (0.0%) |
| 18 to 34 Years | 0 (0.0%) | 0 (0.0%) |
| 35 to 64 Years | 0 (0.0%) | 0 (0.0%) |
| 65 to 74 Years | 37 (56.1%) | 0 (0.0%) |
| 75 Years and over | 0 (0.0%) | 0 (0.0%) |
Disability Class: Vision Difficulty
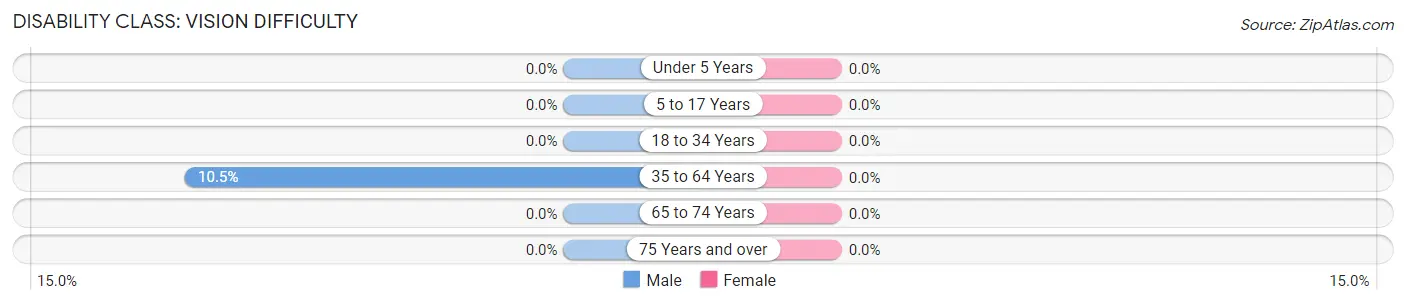
| Age Bracket | Male | Female |
| Under 5 Years | 0 (0.0%) | 0 (0.0%) |
| 5 to 17 Years | 0 (0.0%) | 0 (0.0%) |
| 18 to 34 Years | 0 (0.0%) | 0 (0.0%) |
| 35 to 64 Years | 10 (10.5%) | 0 (0.0%) |
| 65 to 74 Years | 0 (0.0%) | 0 (0.0%) |
| 75 Years and over | 0 (0.0%) | 0 (0.0%) |
Disability Class: Cognitive Difficulty
| Age Bracket | Male | Female |
| 5 to 17 Years | 0 (0.0%) | 0 (0.0%) |
| 18 to 34 Years | 0 (0.0%) | 0 (0.0%) |
| 35 to 64 Years | 0 (0.0%) | 0 (0.0%) |
| 65 to 74 Years | 0 (0.0%) | 0 (0.0%) |
| 75 Years and over | 0 (0.0%) | 0 (0.0%) |
Disability Class: Ambulatory Difficulty
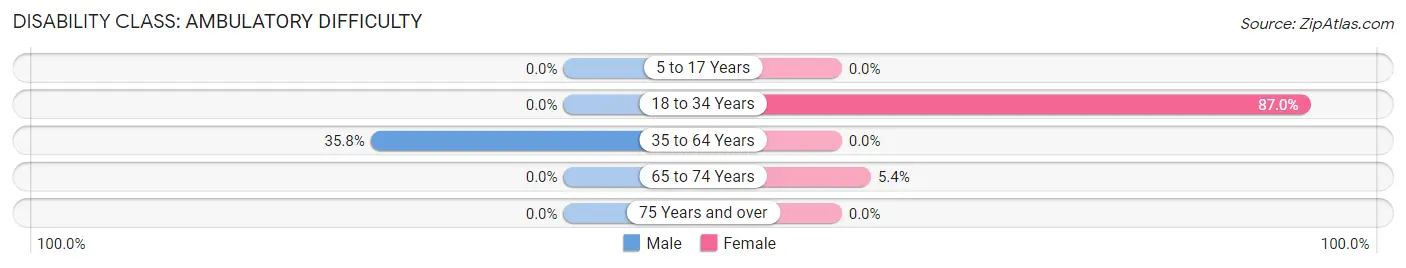
| Age Bracket | Male | Female |
| 5 to 17 Years | 0 (0.0%) | 0 (0.0%) |
| 18 to 34 Years | 0 (0.0%) | 20 (87.0%) |
| 35 to 64 Years | 34 (35.8%) | 0 (0.0%) |
| 65 to 74 Years | 0 (0.0%) | 2 (5.4%) |
| 75 Years and over | 0 (0.0%) | 0 (0.0%) |
Disability Class: Self-Care Difficulty
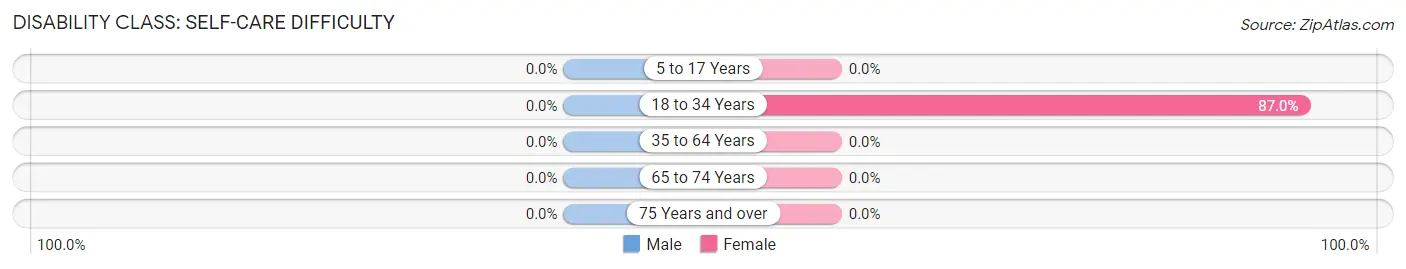
| Age Bracket | Male | Female |
| 5 to 17 Years | 0 (0.0%) | 0 (0.0%) |
| 18 to 34 Years | 0 (0.0%) | 20 (87.0%) |
| 35 to 64 Years | 0 (0.0%) | 0 (0.0%) |
| 65 to 74 Years | 0 (0.0%) | 0 (0.0%) |
| 75 Years and over | 0 (0.0%) | 0 (0.0%) |
Technology Access in Lemon Cove
Computing Device Access in Lemon Cove
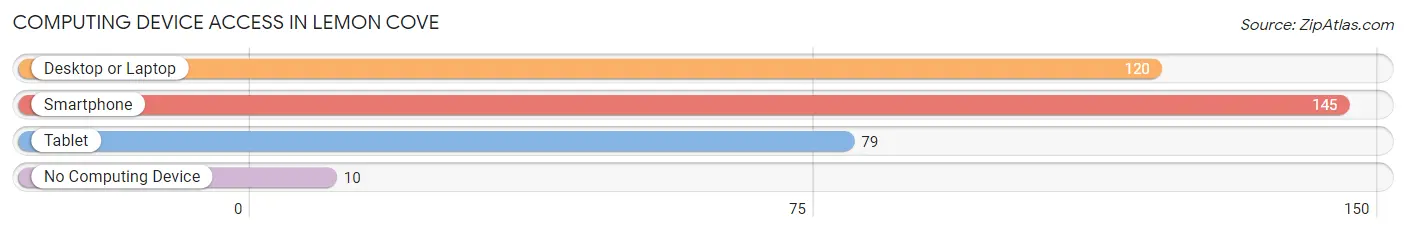
| Device Type | # Households | % Households |
| Desktop or Laptop | 120 | 77.4% |
| Smartphone | 145 | 93.5% |
| Tablet | 79 | 51.0% |
| No Computing Device | 10 | 6.5% |
| Total | 155 | 100.0% |
Internet Access in Lemon Cove
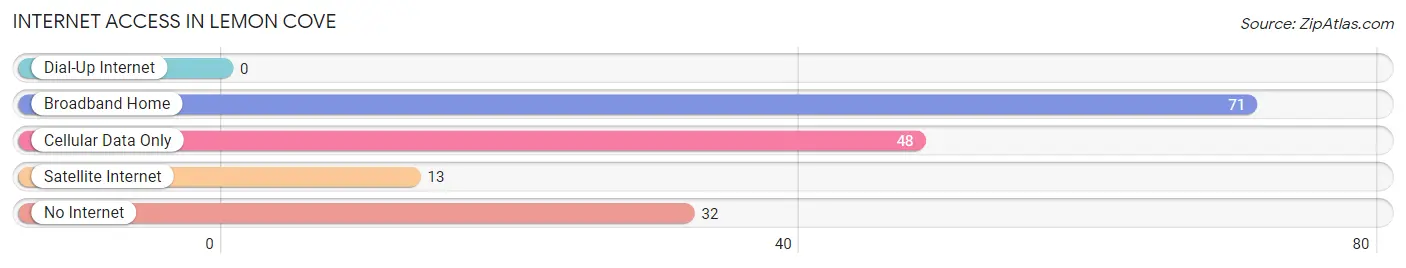
| Internet Type | # Households | % Households |
| Dial-Up Internet | 0 | 0.0% |
| Broadband Home | 71 | 45.8% |
| Cellular Data Only | 48 | 31.0% |
| Satellite Internet | 13 | 8.4% |
| No Internet | 32 | 20.6% |
| Total | 155 | 100.0% |
Lemon Cove Summary
Lemon Cove is a small unincorporated community located in the foothills of the Sierra Nevada Mountains in Tulare County, California. It is situated along the Kings River, approximately 8 miles east of Visalia and 30 miles south of Fresno. The population of Lemon Cove was estimated to be 1,093 in 2019.
History
Lemon Cove was originally inhabited by the Yokuts Indians, who were the first to settle in the area. The Yokuts were a hunter-gatherer tribe that lived in the area for thousands of years before the arrival of Europeans. The first Europeans to settle in the area were Spanish missionaries, who established a mission in the area in 1806. The mission was abandoned in 1834, and the area was later settled by ranchers and farmers.
In 1872, the first post office was established in Lemon Cove, and the town was officially incorporated in 1875. The town was named after the abundance of lemon trees in the area. In the late 19th century, the town was a popular stop for travelers on the stagecoach line between Visalia and Fresno.
Geography
Lemon Cove is located in the foothills of the Sierra Nevada Mountains in Tulare County, California. It is situated along the Kings River, approximately 8 miles east of Visalia and 30 miles south of Fresno. The town is located at an elevation of 845 feet above sea level.
The climate in Lemon Cove is hot and dry in the summer, with temperatures reaching up to 100 degrees Fahrenheit. In the winter, temperatures can drop to as low as 30 degrees Fahrenheit. The area receives an average of 10 inches of rain per year.
Economy
The economy of Lemon Cove is largely based on agriculture. The area is known for its production of citrus fruits, including lemons, oranges, and grapefruits. Other crops grown in the area include almonds, walnuts, and olives.
The town is also home to several small businesses, including restaurants, shops, and a gas station. The town is also home to a small airport, which is used for recreational and private flights.
Demographics
As of 2019, the population of Lemon Cove was estimated to be 1,093. The population is predominantly white (90.2%), with the remaining population being made up of Hispanic (4.7%), African American (2.2%), and Asian (1.7%) residents. The median household income in Lemon Cove is $50,000, and the median age is 40.
Conclusion
Lemon Cove is a small unincorporated community located in the foothills of the Sierra Nevada Mountains in Tulare County, California. It is situated along the Kings River, approximately 8 miles east of Visalia and 30 miles south of Fresno. The population of Lemon Cove was estimated to be 1,093 in 2019. The economy of Lemon Cove is largely based on agriculture, with the area being known for its production of citrus fruits. The population is predominantly white, with the median household income being $50,000 and the median age being 40.
Common Questions
What is Per Capita Income in Lemon Cove?
Per Capita income in Lemon Cove is $42,517.
What is Income or Wage Gap in Lemon Cove?
Income or Wage Gap in Lemon Cove is 49.2%.
Women in Lemon Cove earn 50.8 cents for every dollar earned by a man.
What is Inequality or Gini Index in Lemon Cove?
Inequality or Gini Index in Lemon Cove is 0.55.
What is the Total Population of Lemon Cove?
Total Population of Lemon Cove is 498.
What is the Total Male Population of Lemon Cove?
Total Male Population of Lemon Cove is 265.
What is the Total Female Population of Lemon Cove?
Total Female Population of Lemon Cove is 233.
What is the Ratio of Males per 100 Females in Lemon Cove?
There are 113.73 Males per 100 Females in Lemon Cove.
What is the Ratio of Females per 100 Males in Lemon Cove?
There are 87.92 Females per 100 Males in Lemon Cove.
What is the Median Population Age in Lemon Cove?
Median Population Age in Lemon Cove is 39.7 Years.
What is the Average Family Size in Lemon Cove
Average Family Size in Lemon Cove is 3.8 People.
What is the Average Household Size in Lemon Cove
Average Household Size in Lemon Cove is 3.2 People.
How Large is the Labor Force in Lemon Cove?
There are 151 People in the Labor Forcein in Lemon Cove.
What is the Percentage of People in the Labor Force in Lemon Cove?
47.0% of People are in the Labor Force in Lemon Cove.
What is the Unemployment Rate in Lemon Cove?
Unemployment Rate in Lemon Cove is 5.3%.