Le Grand, CA Map & Demographics
Le Grand Map
Le Grand Overview
$21,505
PER CAPITA INCOME
$65,750
AVG FAMILY INCOME
$56,563
AVG HOUSEHOLD INCOME
30.6%
WAGE / INCOME GAP [ % ]
69.4¢/ $1
WAGE / INCOME GAP [ $ ]
0.40
INEQUALITY / GINI INDEX
1,679
TOTAL POPULATION
924
MALE POPULATION
755
FEMALE POPULATION
122.38
MALES / 100 FEMALES
81.71
FEMALES / 100 MALES
32.2
MEDIAN AGE
3.8
AVG FAMILY SIZE
3.4
AVG HOUSEHOLD SIZE
742
LABOR FORCE [ PEOPLE ]
61.1%
PERCENT IN LABOR FORCE
10.5%
UNEMPLOYMENT RATE
Le Grand Zip Codes
Le Grand Area Codes
Income in Le Grand
Income Overview in Le Grand
Per Capita Income in Le Grand is $21,505, while median incomes of families and households are $65,750 and $56,563 respectively.
| Characteristic | Number | Measure |
| Per Capita Income | 1,679 | $21,505 |
| Median Family Income | 392 | $65,750 |
| Mean Family Income | 392 | $68,956 |
| Median Household Income | 498 | $56,563 |
| Mean Household Income | 498 | $64,674 |
| Income Deficit | 392 | $0 |
| Wage / Income Gap (%) | 1,679 | 30.56% |
| Wage / Income Gap ($) | 1,679 | 69.44¢ per $1 |
| Gini / Inequality Index | 1,679 | 0.40 |
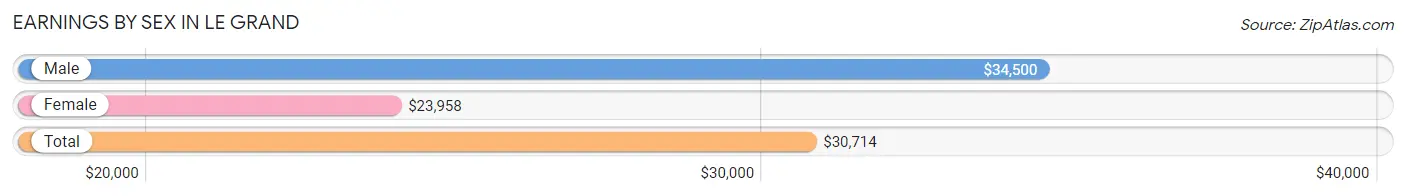
Earnings by Sex in Le Grand
Average Earnings in Le Grand are $30,714, $34,500 for men and $23,958 for women, a difference of 30.6%.
| Sex | Number | Average Earnings |
| Male | 412 (54.9%) | $34,500 |
| Female | 338 (45.1%) | $23,958 |
| Total | 750 (100.0%) | $30,714 |
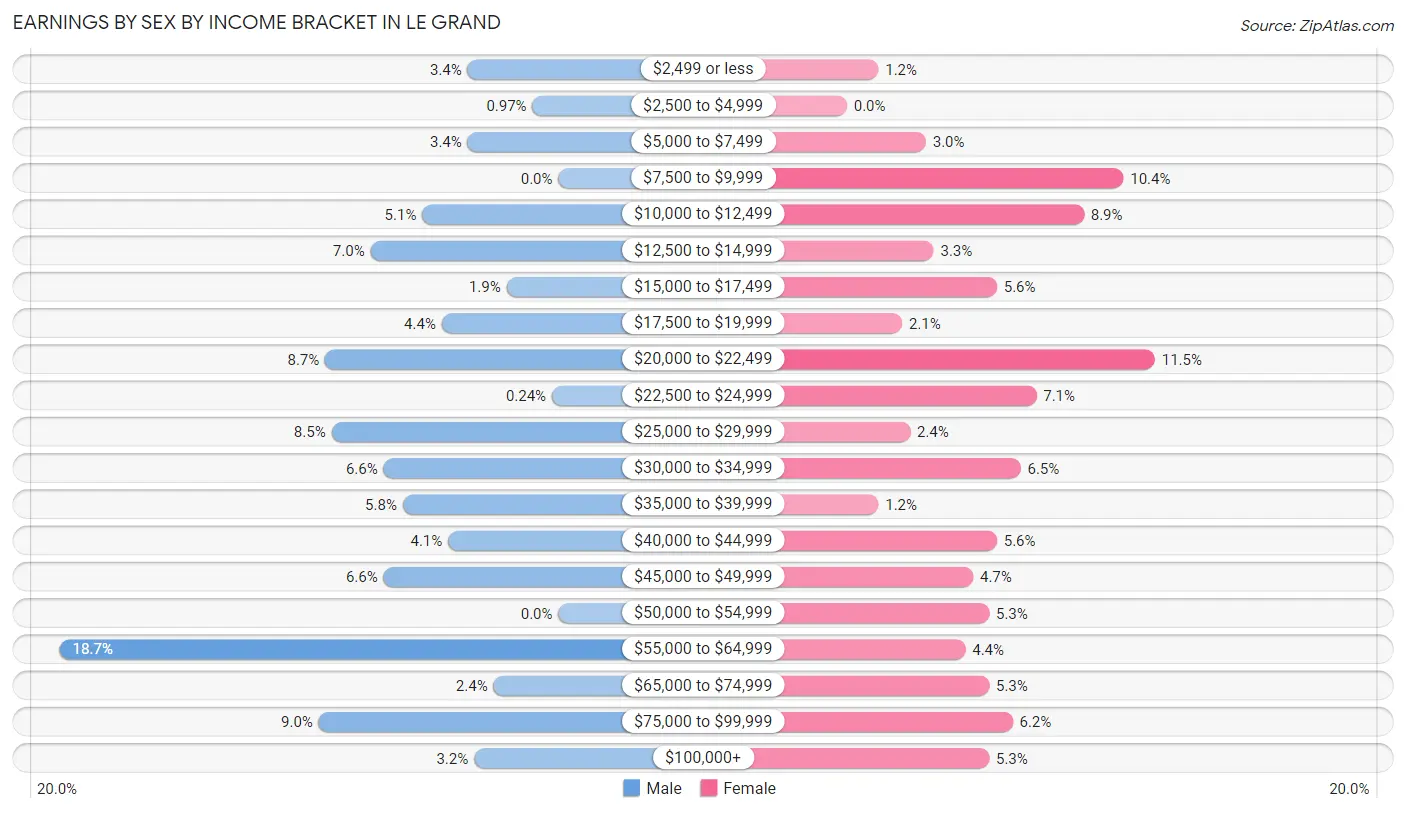
Earnings by Sex by Income Bracket in Le Grand
The most common earnings brackets in Le Grand are $55,000 to $64,999 for men (77 | 18.7%) and $20,000 to $22,499 for women (39 | 11.5%).
| Income | Male | Female |
| $2,499 or less | 14 (3.4%) | 4 (1.2%) |
| $2,500 to $4,999 | 4 (1.0%) | 0 (0.0%) |
| $5,000 to $7,499 | 14 (3.4%) | 10 (3.0%) |
| $7,500 to $9,999 | 0 (0.0%) | 35 (10.4%) |
| $10,000 to $12,499 | 21 (5.1%) | 30 (8.9%) |
| $12,500 to $14,999 | 29 (7.0%) | 11 (3.3%) |
| $15,000 to $17,499 | 8 (1.9%) | 19 (5.6%) |
| $17,500 to $19,999 | 18 (4.4%) | 7 (2.1%) |
| $20,000 to $22,499 | 36 (8.7%) | 39 (11.5%) |
| $22,500 to $24,999 | 1 (0.2%) | 24 (7.1%) |
| $25,000 to $29,999 | 35 (8.5%) | 8 (2.4%) |
| $30,000 to $34,999 | 27 (6.6%) | 22 (6.5%) |
| $35,000 to $39,999 | 24 (5.8%) | 4 (1.2%) |
| $40,000 to $44,999 | 17 (4.1%) | 19 (5.6%) |
| $45,000 to $49,999 | 27 (6.6%) | 16 (4.7%) |
| $50,000 to $54,999 | 0 (0.0%) | 18 (5.3%) |
| $55,000 to $64,999 | 77 (18.7%) | 15 (4.4%) |
| $65,000 to $74,999 | 10 (2.4%) | 18 (5.3%) |
| $75,000 to $99,999 | 37 (9.0%) | 21 (6.2%) |
| $100,000+ | 13 (3.2%) | 18 (5.3%) |
| Total | 412 (100.0%) | 338 (100.0%) |
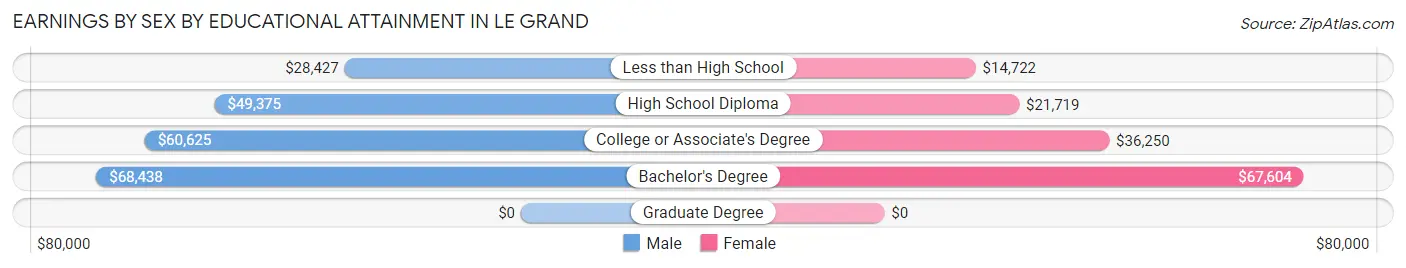
Earnings by Sex by Educational Attainment in Le Grand
Average earnings in Le Grand are $38,977 for men and $24,844 for women, a difference of 36.3%. Men with an educational attainment of bachelor's degree enjoy the highest average annual earnings of $68,438, while those with less than high school education earn the least with $28,427. Women with an educational attainment of bachelor's degree earn the most with the average annual earnings of $67,604, while those with less than high school education have the smallest earnings of $14,722.
| Educational Attainment | Male Income | Female Income |
| Less than High School | $28,427 | $14,722 |
| High School Diploma | $49,375 | $21,719 |
| College or Associate's Degree | $60,625 | $36,250 |
| Bachelor's Degree | $68,438 | $67,604 |
| Graduate Degree | - | - |
| Total | $38,977 | $24,844 |
Family Income in Le Grand
Family Income Brackets in Le Grand
According to the Le Grand family income data, there are 93 families falling into the $75,000 to $99,999 income range, which is the most common income bracket and makes up 23.7% of all families. Conversely, the $200,000+ income bracket is the least frequent group with only 3 families (0.8%) belonging to this category.
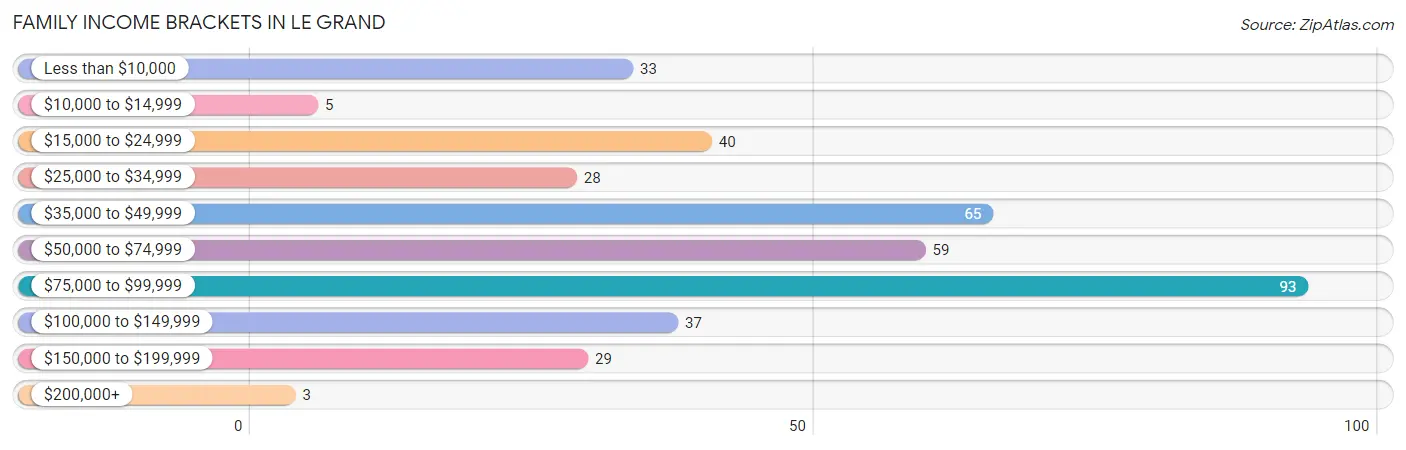
| Income Bracket | # Families | % Families |
| Less than $10,000 | 33 | 8.4% |
| $10,000 to $14,999 | 5 | 1.3% |
| $15,000 to $24,999 | 40 | 10.2% |
| $25,000 to $34,999 | 28 | 7.1% |
| $35,000 to $49,999 | 65 | 16.6% |
| $50,000 to $74,999 | 59 | 15.1% |
| $75,000 to $99,999 | 93 | 23.7% |
| $100,000 to $149,999 | 37 | 9.4% |
| $150,000 to $199,999 | 29 | 7.4% |
| $200,000+ | 3 | 0.8% |
Family Income by Famaliy Size in Le Grand
5-person families (44 | 11.2%) account for the highest median family income in Le Grand with $112,778 per family, while 5-person families (44 | 11.2%) have the highest median income of $22,556 per family member.
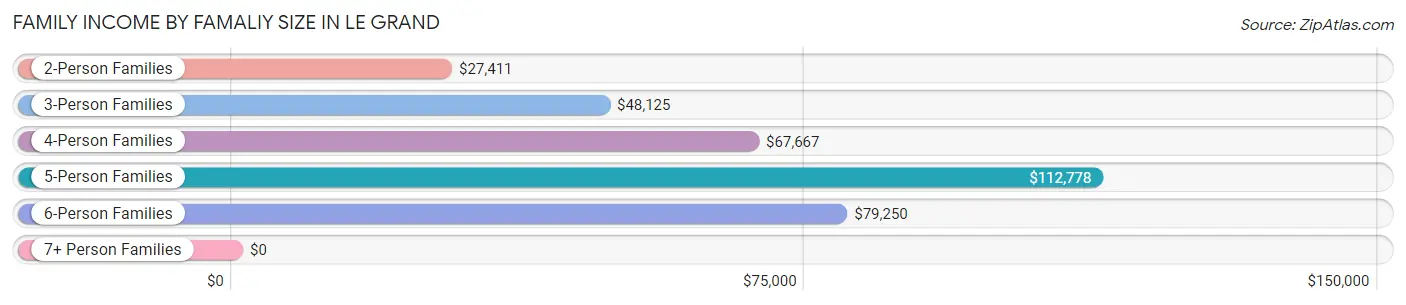
| Income Bracket | # Families | Median Income |
| 2-Person Families | 125 (31.9%) | $27,411 |
| 3-Person Families | 116 (29.6%) | $48,125 |
| 4-Person Families | 66 (16.8%) | $67,667 |
| 5-Person Families | 44 (11.2%) | $112,778 |
| 6-Person Families | 38 (9.7%) | $79,250 |
| 7+ Person Families | 3 (0.8%) | $0 |
| Total | 392 (100.0%) | $65,750 |
Family Income by Number of Earners in Le Grand
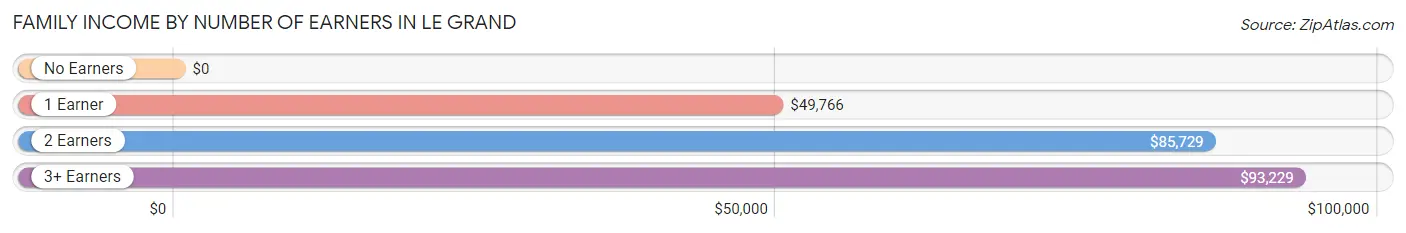
| Number of Earners | # Families | Median Income |
| No Earners | 49 (12.5%) | $0 |
| 1 Earner | 151 (38.5%) | $49,766 |
| 2 Earners | 147 (37.5%) | $85,729 |
| 3+ Earners | 45 (11.5%) | $93,229 |
| Total | 392 (100.0%) | $65,750 |
Household Income in Le Grand
Household Income Brackets in Le Grand
With 97 households falling in the category, the $75,000 to $99,999 income range is the most frequent in Le Grand, accounting for 19.5% of all households. In contrast, only 3 households (0.6%) fall into the $200,000+ income bracket, making it the least populous group.
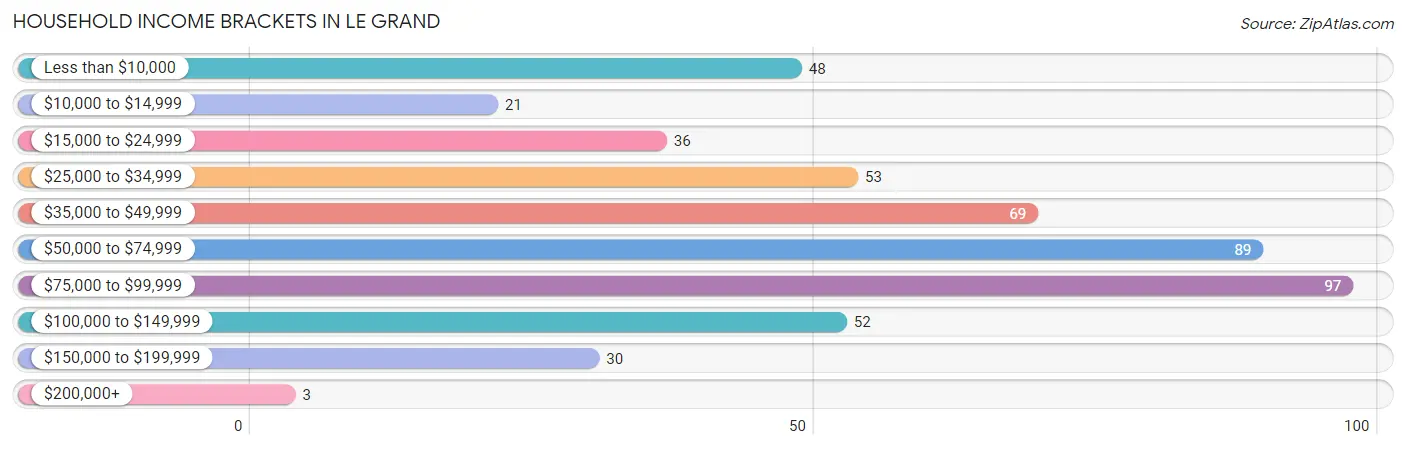
| Income Bracket | # Households | % Households |
| Less than $10,000 | 48 | 9.6% |
| $10,000 to $14,999 | 21 | 4.2% |
| $15,000 to $24,999 | 36 | 7.2% |
| $25,000 to $34,999 | 53 | 10.6% |
| $35,000 to $49,999 | 69 | 13.9% |
| $50,000 to $74,999 | 89 | 17.9% |
| $75,000 to $99,999 | 97 | 19.5% |
| $100,000 to $149,999 | 52 | 10.4% |
| $150,000 to $199,999 | 30 | 6.0% |
| $200,000+ | 3 | 0.6% |
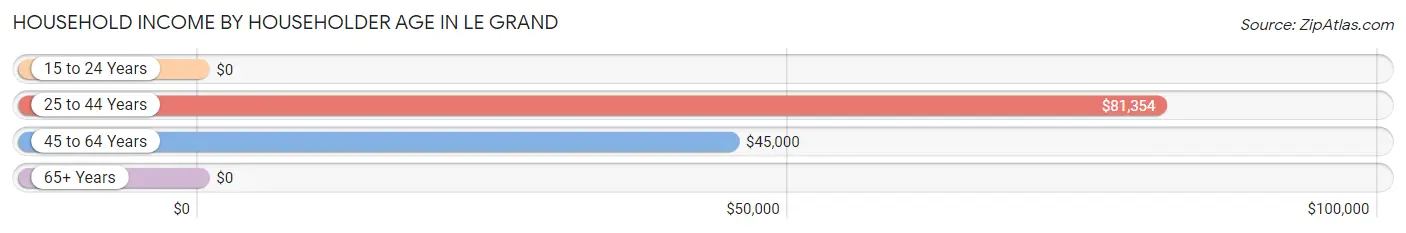
Household Income by Householder Age in Le Grand
The median household income in Le Grand is $56,563, with the highest median household income of $81,354 found in the 25 to 44 years age bracket for the primary householder. A total of 159 households (31.9%) fall into this category. Meanwhile, the 15 to 24 years age bracket for the primary householder has the lowest median household income of $0, with 1 households (0.2%) in this group.
| Income Bracket | # Households | Median Income |
| 15 to 24 Years | 1 (0.2%) | $0 |
| 25 to 44 Years | 159 (31.9%) | $81,354 |
| 45 to 64 Years | 264 (53.0%) | $45,000 |
| 65+ Years | 74 (14.9%) | $0 |
| Total | 498 (100.0%) | $56,563 |
Poverty in Le Grand
Income Below Poverty by Sex and Age in Le Grand
With 11.4% poverty level for males and 12.3% for females among the residents of Le Grand, 15 year old males and 12 to 14 year old females are the most vulnerable to poverty, with 20 males (51.3%) and 18 females (42.9%) in their respective age groups living below the poverty level.
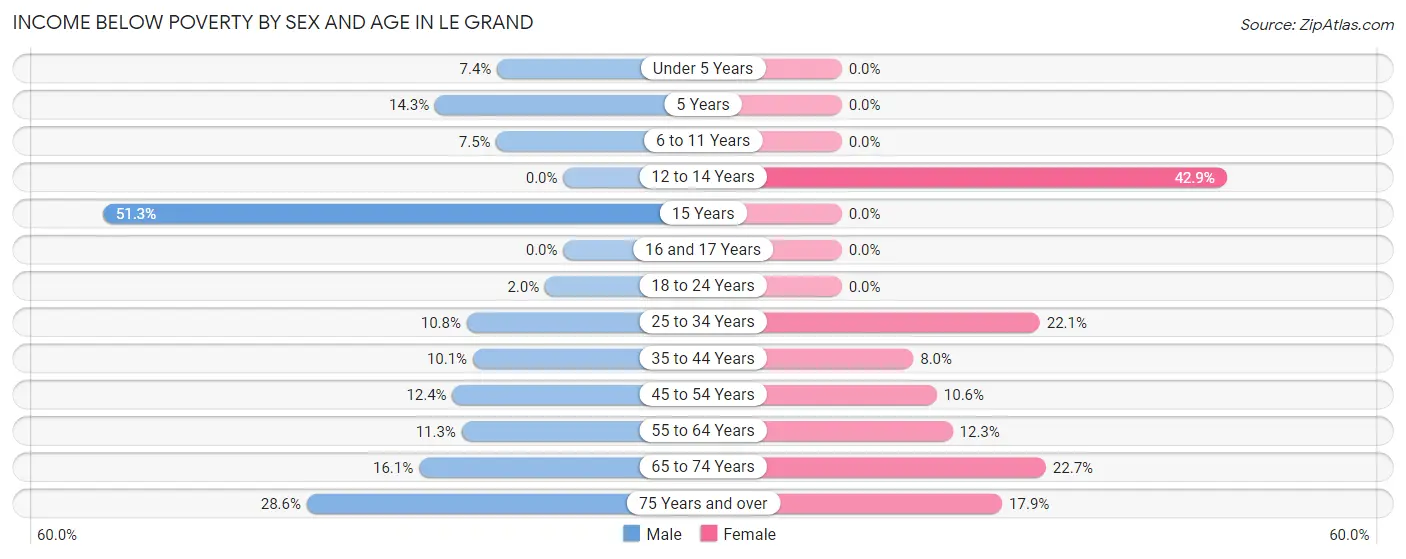
| Age Bracket | Male | Female |
| Under 5 Years | 7 (7.4%) | 0 (0.0%) |
| 5 Years | 5 (14.3%) | 0 (0.0%) |
| 6 to 11 Years | 7 (7.4%) | 0 (0.0%) |
| 12 to 14 Years | 0 (0.0%) | 18 (42.9%) |
| 15 Years | 20 (51.3%) | 0 (0.0%) |
| 16 and 17 Years | 0 (0.0%) | 0 (0.0%) |
| 18 to 24 Years | 2 (2.0%) | 0 (0.0%) |
| 25 to 34 Years | 10 (10.7%) | 28 (22.1%) |
| 35 to 44 Years | 14 (10.1%) | 9 (8.0%) |
| 45 to 54 Years | 10 (12.3%) | 9 (10.6%) |
| 55 to 64 Years | 12 (11.3%) | 19 (12.3%) |
| 65 to 74 Years | 9 (16.1%) | 5 (22.7%) |
| 75 Years and over | 6 (28.6%) | 5 (17.9%) |
| Total | 102 (11.4%) | 93 (12.3%) |
Income Above Poverty by Sex and Age in Le Grand
According to the poverty statistics in Le Grand, males aged 12 to 14 years and females aged under 5 years are the age groups that are most secure financially, with 100.0% of males and 100.0% of females in these age groups living above the poverty line.
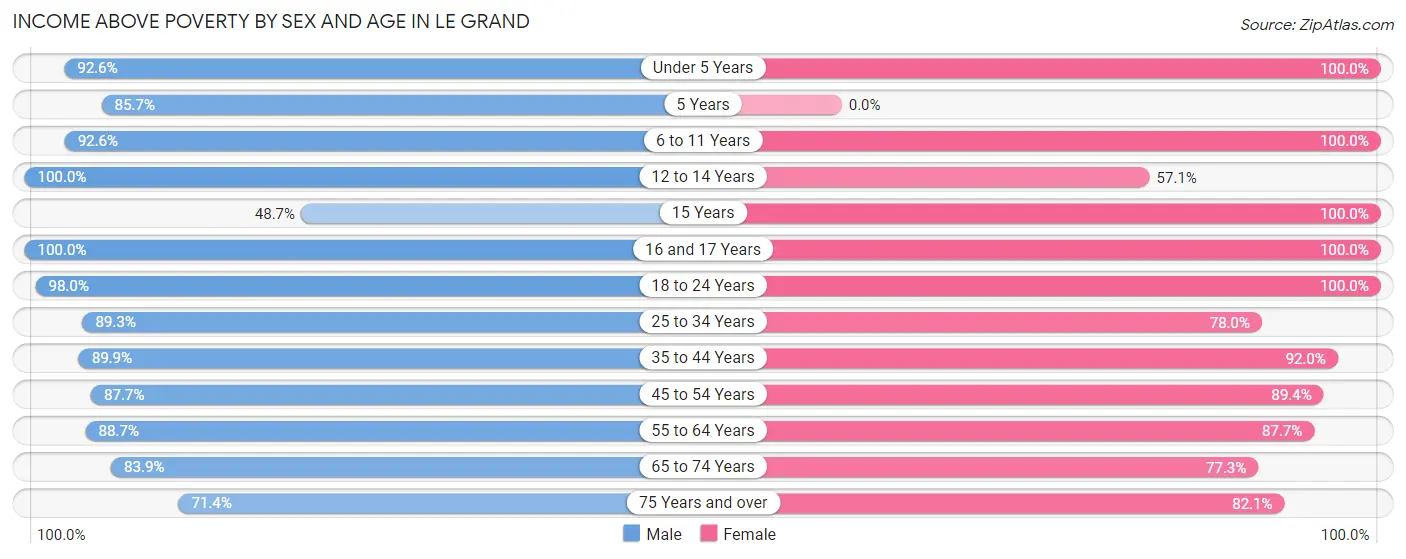
| Age Bracket | Male | Female |
| Under 5 Years | 88 (92.6%) | 31 (100.0%) |
| 5 Years | 30 (85.7%) | 0 (0.0%) |
| 6 to 11 Years | 87 (92.5%) | 54 (100.0%) |
| 12 to 14 Years | 27 (100.0%) | 24 (57.1%) |
| 15 Years | 19 (48.7%) | 21 (100.0%) |
| 16 and 17 Years | 13 (100.0%) | 12 (100.0%) |
| 18 to 24 Years | 96 (98.0%) | 66 (100.0%) |
| 25 to 34 Years | 83 (89.2%) | 99 (77.9%) |
| 35 to 44 Years | 125 (89.9%) | 104 (92.0%) |
| 45 to 54 Years | 71 (87.6%) | 76 (89.4%) |
| 55 to 64 Years | 94 (88.7%) | 135 (87.7%) |
| 65 to 74 Years | 47 (83.9%) | 17 (77.3%) |
| 75 Years and over | 15 (71.4%) | 23 (82.1%) |
| Total | 795 (88.6%) | 662 (87.7%) |
Income Below Poverty Among Married-Couple Families in Le Grand
The poverty statistics for married-couple families in Le Grand show that 1.3% or 3 of the total 232 families live below the poverty line. Families with no children have the highest poverty rate of 2.6%, comprising of 3 families. On the other hand, families with 1 or 2 children have the lowest poverty rate of 0.0%, which includes 0 families.
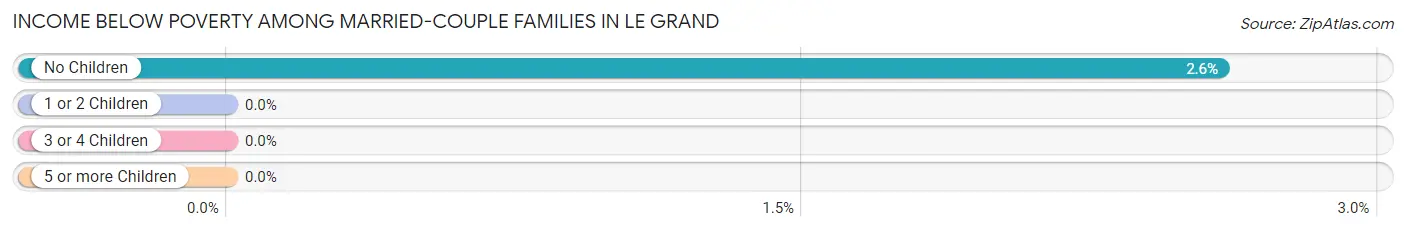
| Children | Above Poverty | Below Poverty |
| No Children | 113 (97.4%) | 3 (2.6%) |
| 1 or 2 Children | 95 (100.0%) | 0 (0.0%) |
| 3 or 4 Children | 21 (100.0%) | 0 (0.0%) |
| 5 or more Children | 0 (0.0%) | 0 (0.0%) |
| Total | 229 (98.7%) | 3 (1.3%) |
Income Below Poverty Among Single-Parent Households in Le Grand
According to the poverty data in Le Grand, 32.7% or 18 single-father households and 24.8% or 26 single-mother households are living below the poverty line. Among single-father households, those with 1 or 2 children have the highest poverty rate, with 10 households (100.0%) experiencing poverty. Likewise, among single-mother households, those with 3 or 4 children have the highest poverty rate, with 4 households (100.0%) falling below the poverty line.
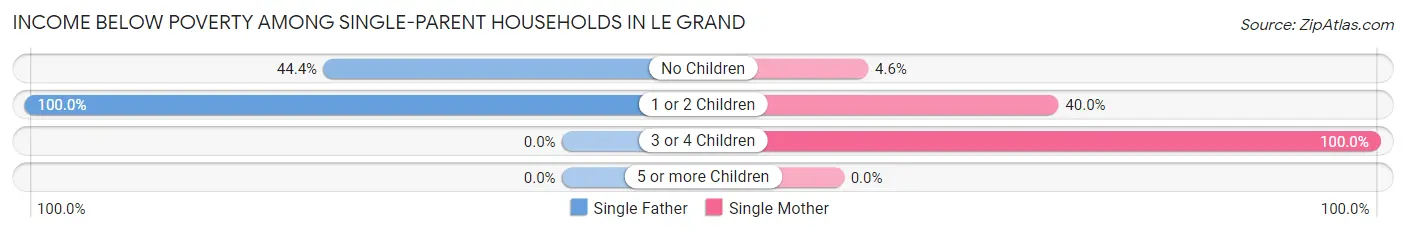
| Children | Single Father | Single Mother |
| No Children | 8 (44.4%) | 2 (4.5%) |
| 1 or 2 Children | 10 (100.0%) | 20 (40.0%) |
| 3 or 4 Children | 0 (0.0%) | 4 (100.0%) |
| 5 or more Children | 0 (0.0%) | 0 (0.0%) |
| Total | 18 (32.7%) | 26 (24.8%) |
Income Below Poverty Among Married-Couple vs Single-Parent Households in Le Grand
The poverty data for Le Grand shows that 3 of the married-couple family households (1.3%) and 44 of the single-parent households (27.5%) are living below the poverty level. Within the married-couple family households, those with no children have the highest poverty rate, with 3 households (2.6%) falling below the poverty line. Among the single-parent households, those with 1 or 2 children have the highest poverty rate, with 30 household (50.0%) living below poverty.
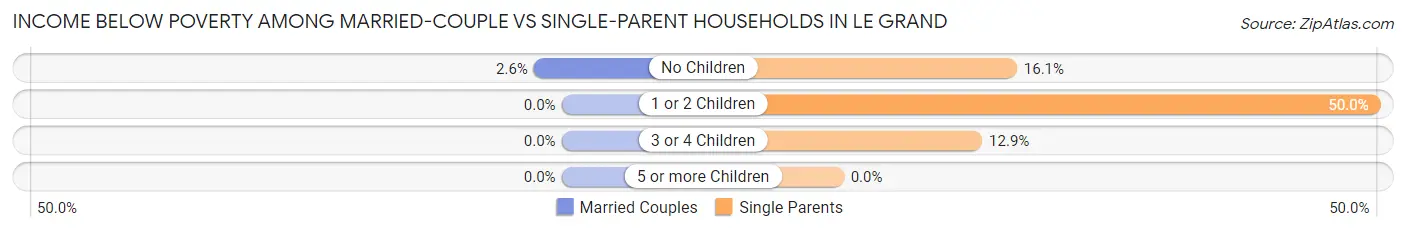
| Children | Married-Couple Families | Single-Parent Households |
| No Children | 3 (2.6%) | 10 (16.1%) |
| 1 or 2 Children | 0 (0.0%) | 30 (50.0%) |
| 3 or 4 Children | 0 (0.0%) | 4 (12.9%) |
| 5 or more Children | 0 (0.0%) | 0 (0.0%) |
| Total | 3 (1.3%) | 44 (27.5%) |
Race in Le Grand
The most populous races in Le Grand are Hispanic or Latino (1,426 | 84.9%), Some other Race (808 | 48.1%), and White / Caucasian (711 | 42.3%).
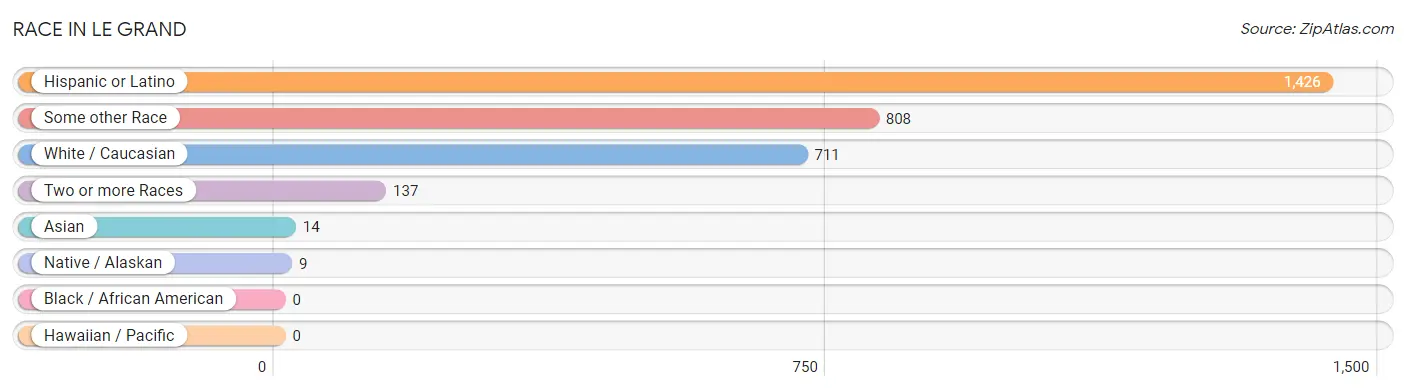
| Race | # Population | % Population |
| Asian | 14 | 0.8% |
| Black / African American | 0 | 0.0% |
| Hawaiian / Pacific | 0 | 0.0% |
| Hispanic or Latino | 1,426 | 84.9% |
| Native / Alaskan | 9 | 0.5% |
| White / Caucasian | 711 | 42.3% |
| Two or more Races | 137 | 8.2% |
| Some other Race | 808 | 48.1% |
| Total | 1,679 | 100.0% |
Ancestry in Le Grand
The most populous ancestries reported in Le Grand are Mexican (1,422 | 84.7%), English (35 | 2.1%), Bangladeshi (25 | 1.5%), Irish (23 | 1.4%), and Portuguese (21 | 1.3%), together accounting for 90.9% of all Le Grand residents.
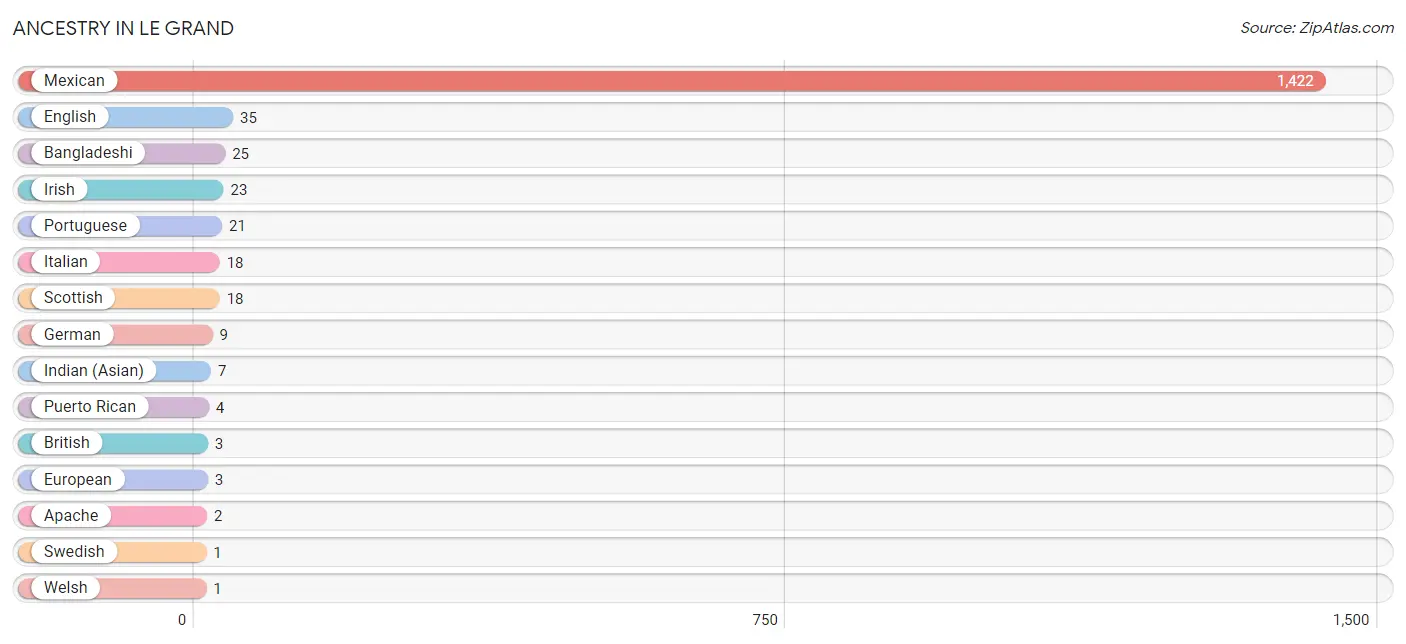
| Ancestry | # Population | % Population |
| Apache | 2 | 0.1% |
| Bangladeshi | 25 | 1.5% |
| British | 3 | 0.2% |
| English | 35 | 2.1% |
| European | 3 | 0.2% |
| German | 9 | 0.5% |
| Indian (Asian) | 7 | 0.4% |
| Irish | 23 | 1.4% |
| Italian | 18 | 1.1% |
| Mexican | 1,422 | 84.7% |
| Portuguese | 21 | 1.3% |
| Puerto Rican | 4 | 0.2% |
| Scottish | 18 | 1.1% |
| Swedish | 1 | 0.1% |
| Welsh | 1 | 0.1% | View All 15 Rows |
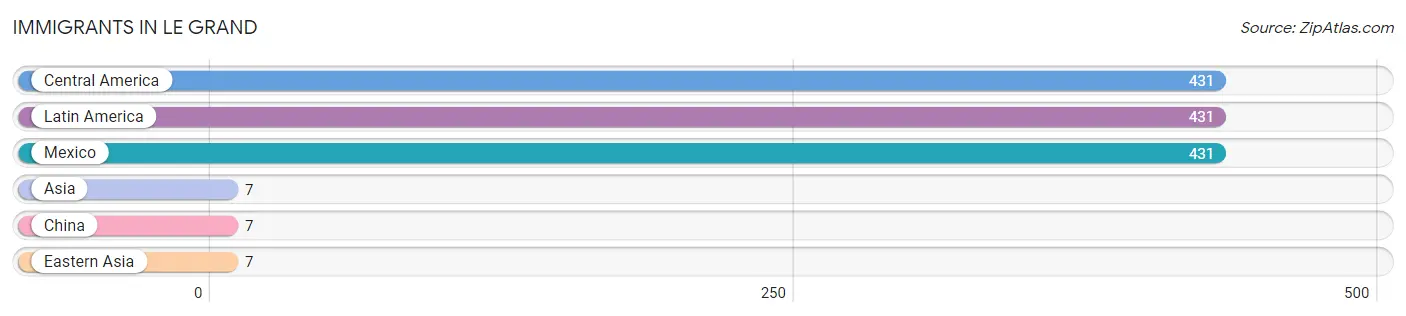
Immigrants in Le Grand
The most numerous immigrant groups reported in Le Grand came from Central America (431 | 25.7%), Latin America (431 | 25.7%), Mexico (431 | 25.7%), Asia (7 | 0.4%), and China (7 | 0.4%), together accounting for 77.8% of all Le Grand residents.
| Immigration Origin | # Population | % Population |
| Asia | 7 | 0.4% |
| Central America | 431 | 25.7% |
| China | 7 | 0.4% |
| Eastern Asia | 7 | 0.4% |
| Latin America | 431 | 25.7% |
| Mexico | 431 | 25.7% | View All 6 Rows |
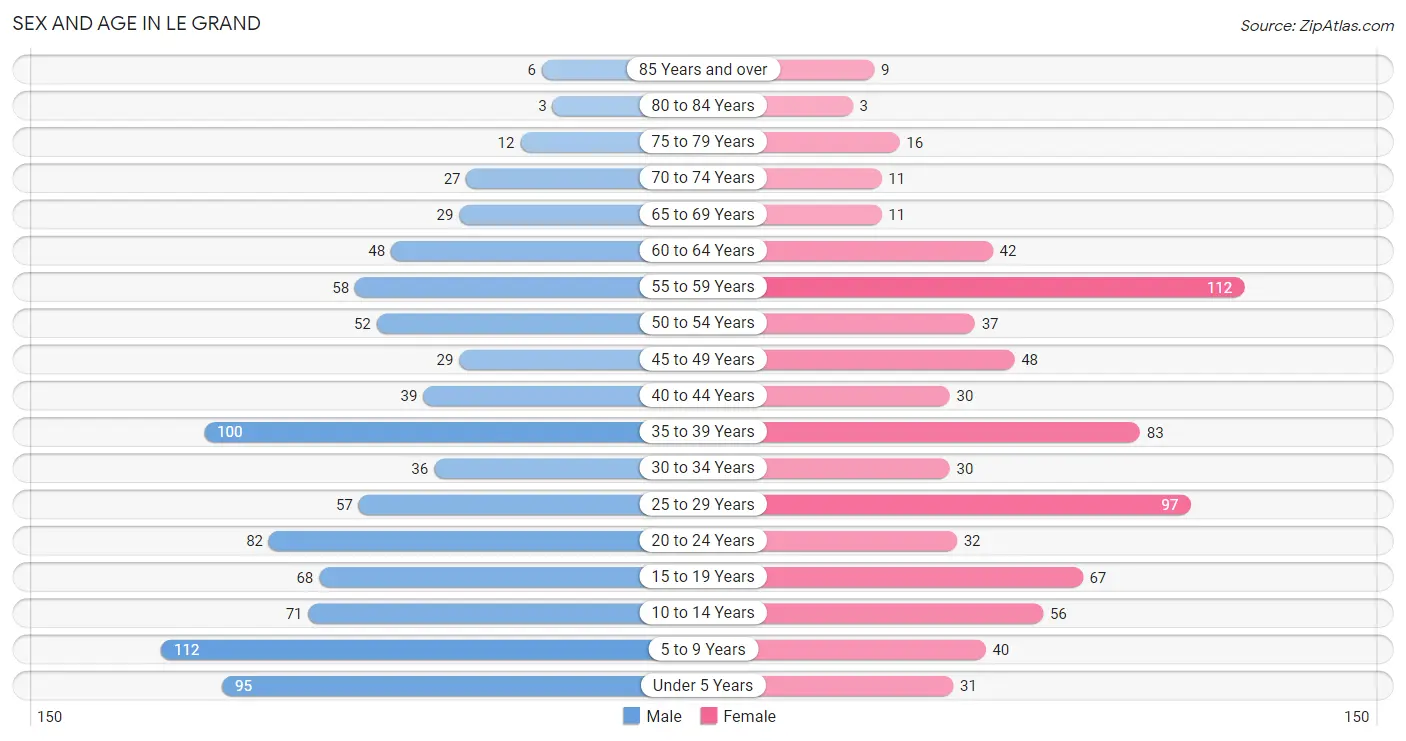
Sex and Age in Le Grand
Sex and Age in Le Grand
The most populous age groups in Le Grand are 5 to 9 Years (112 | 12.1%) for men and 55 to 59 Years (112 | 14.8%) for women.
| Age Bracket | Male | Female |
| Under 5 Years | 95 (10.3%) | 31 (4.1%) |
| 5 to 9 Years | 112 (12.1%) | 40 (5.3%) |
| 10 to 14 Years | 71 (7.7%) | 56 (7.4%) |
| 15 to 19 Years | 68 (7.4%) | 67 (8.9%) |
| 20 to 24 Years | 82 (8.9%) | 32 (4.2%) |
| 25 to 29 Years | 57 (6.2%) | 97 (12.9%) |
| 30 to 34 Years | 36 (3.9%) | 30 (4.0%) |
| 35 to 39 Years | 100 (10.8%) | 83 (11.0%) |
| 40 to 44 Years | 39 (4.2%) | 30 (4.0%) |
| 45 to 49 Years | 29 (3.1%) | 48 (6.4%) |
| 50 to 54 Years | 52 (5.6%) | 37 (4.9%) |
| 55 to 59 Years | 58 (6.3%) | 112 (14.8%) |
| 60 to 64 Years | 48 (5.2%) | 42 (5.6%) |
| 65 to 69 Years | 29 (3.1%) | 11 (1.5%) |
| 70 to 74 Years | 27 (2.9%) | 11 (1.5%) |
| 75 to 79 Years | 12 (1.3%) | 16 (2.1%) |
| 80 to 84 Years | 3 (0.3%) | 3 (0.4%) |
| 85 Years and over | 6 (0.6%) | 9 (1.2%) |
| Total | 924 (100.0%) | 755 (100.0%) |
Families and Households in Le Grand
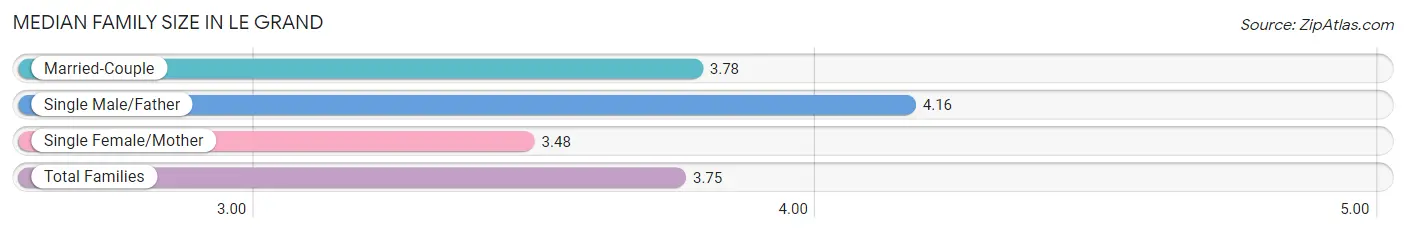
Median Family Size in Le Grand
The median family size in Le Grand is 3.75 persons per family, with single male/father families (55 | 14.0%) accounting for the largest median family size of 4.16 persons per family. On the other hand, single female/mother families (105 | 26.8%) represent the smallest median family size with 3.48 persons per family.
| Family Type | # Families | Family Size |
| Married-Couple | 232 (59.2%) | 3.78 |
| Single Male/Father | 55 (14.0%) | 4.16 |
| Single Female/Mother | 105 (26.8%) | 3.48 |
| Total Families | 392 (100.0%) | 3.75 |
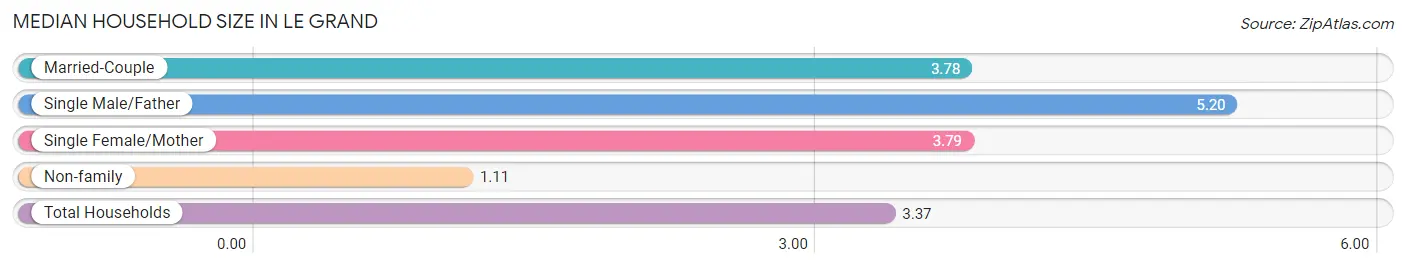
Median Household Size in Le Grand
The median household size in Le Grand is 3.37 persons per household, with single male/father households (55 | 11.0%) accounting for the largest median household size of 5.2 persons per household. non-family households (106 | 21.3%) represent the smallest median household size with 1.11 persons per household.
| Household Type | # Households | Household Size |
| Married-Couple | 232 (46.6%) | 3.78 |
| Single Male/Father | 55 (11.0%) | 5.20 |
| Single Female/Mother | 105 (21.1%) | 3.79 |
| Non-family | 106 (21.3%) | 1.11 |
| Total Households | 498 (100.0%) | 3.37 |
Household Size by Marriage Status in Le Grand
Out of a total of 498 households in Le Grand, 392 (78.7%) are family households, while 106 (21.3%) are nonfamily households. The most numerous type of family households are 3-person households, comprising 116, and the most common type of nonfamily households are 1-person households, comprising 98.
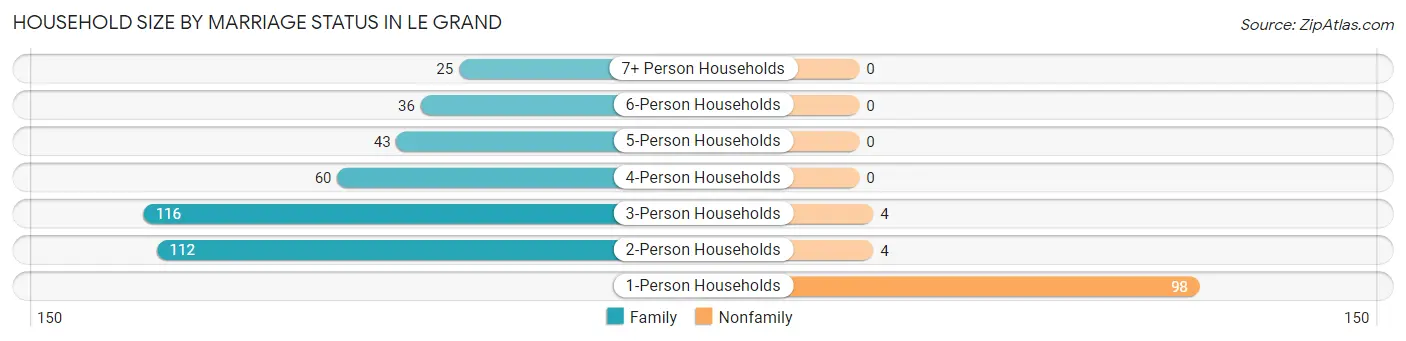
| Household Size | Family Households | Nonfamily Households |
| 1-Person Households | - | 98 (19.7%) |
| 2-Person Households | 112 (22.5%) | 4 (0.8%) |
| 3-Person Households | 116 (23.3%) | 4 (0.8%) |
| 4-Person Households | 60 (12.0%) | 0 (0.0%) |
| 5-Person Households | 43 (8.6%) | 0 (0.0%) |
| 6-Person Households | 36 (7.2%) | 0 (0.0%) |
| 7+ Person Households | 25 (5.0%) | 0 (0.0%) |
| Total | 392 (78.7%) | 106 (21.3%) |
Female Fertility in Le Grand
Fertility by Age in Le Grand
Average fertility rate in Le Grand is 84.0 births per 1,000 women. Women in the age bracket of 20 to 34 years have the highest fertility rate with 170.0 births per 1,000 women. Women in the age bracket of 20 to 34 years acount for 79.4% of all women with births.
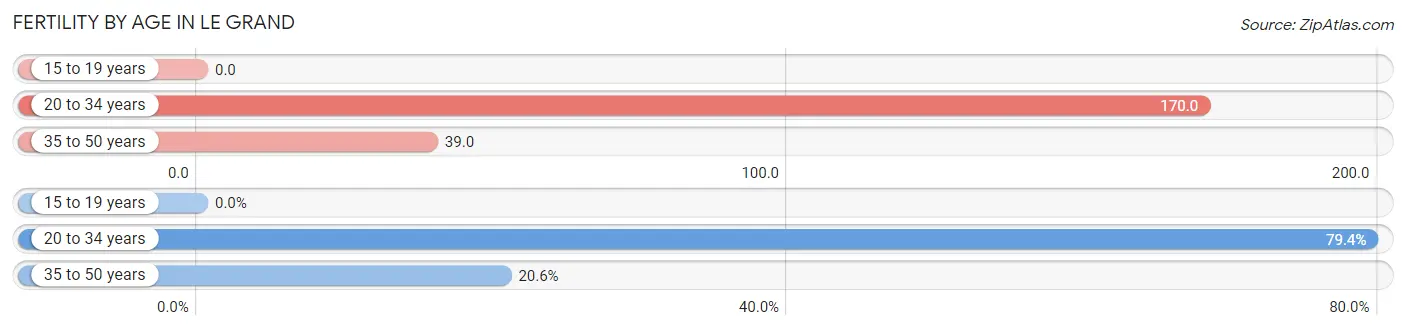
| Age Bracket | Women with Births | Births / 1,000 Women |
| 15 to 19 years | 0 (0.0%) | 0.0 |
| 20 to 34 years | 27 (79.4%) | 170.0 |
| 35 to 50 years | 7 (20.6%) | 39.0 |
| Total | 34 (100.0%) | 84.0 |
Fertility by Age by Marriage Status in Le Grand
41.2% of women with births (34) in Le Grand are married. The highest percentage of unmarried women with births falls into 35 to 50 years age bracket with 100.0% of them unmarried at the time of birth, while the lowest percentage of unmarried women with births belong to 20 to 34 years age bracket with 48.2% of them unmarried.
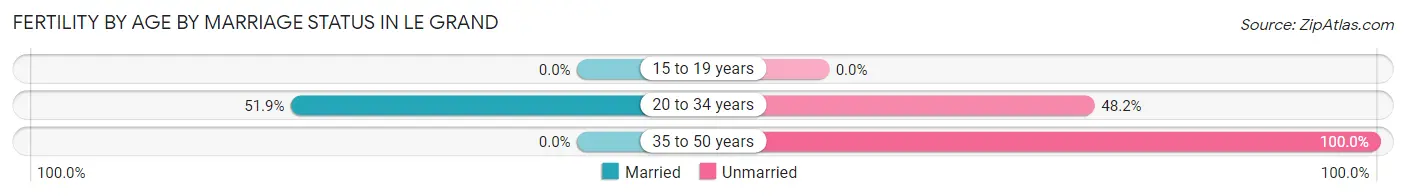
| Age Bracket | Married | Unmarried |
| 15 to 19 years | 0 (0.0%) | 0 (0.0%) |
| 20 to 34 years | 14 (51.8%) | 13 (48.1%) |
| 35 to 50 years | 0 (0.0%) | 7 (100.0%) |
| Total | 14 (41.2%) | 20 (58.8%) |
Fertility by Education in Le Grand
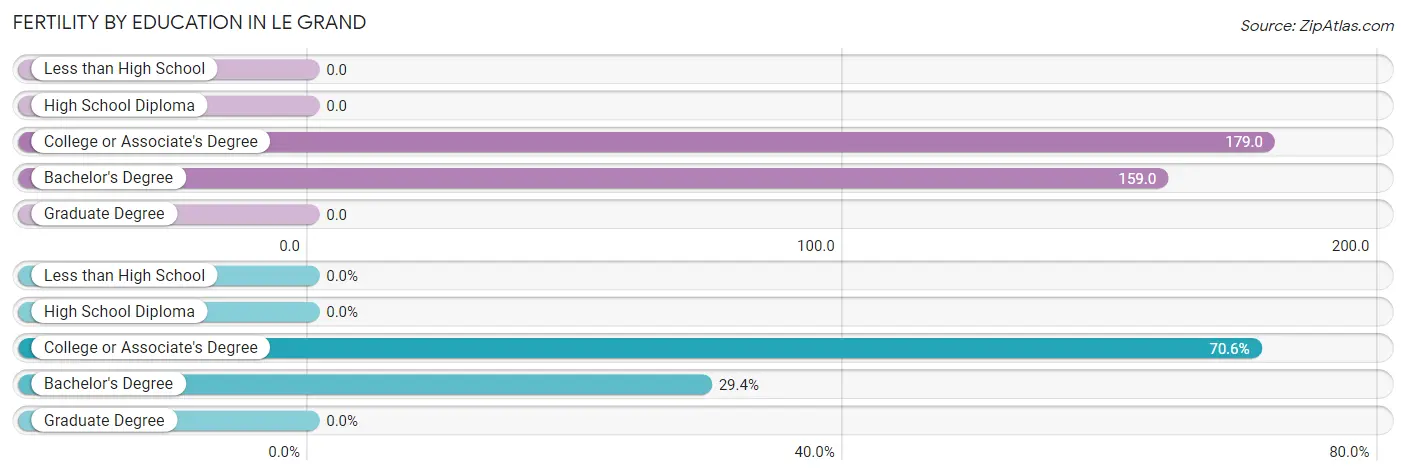
| Educational Attainment | Women with Births | Births / 1,000 Women |
| Less than High School | 0 (0.0%) | 0.0 |
| High School Diploma | 0 (0.0%) | 0.0 |
| College or Associate's Degree | 24 (70.6%) | 179.0 |
| Bachelor's Degree | 10 (29.4%) | 159.0 |
| Graduate Degree | 0 (0.0%) | 0.0 |
| Total | 34 (100.0%) | 84.0 |
Fertility by Education by Marriage Status in Le Grand
58.8% of women with births in Le Grand are unmarried. Women with the educational attainment of bachelor's degree are most likely to be married with 100.0% of them married at childbirth, while women with the educational attainment of college or associate's degree are least likely to be married with 83.3% of them unmarried at childbirth.
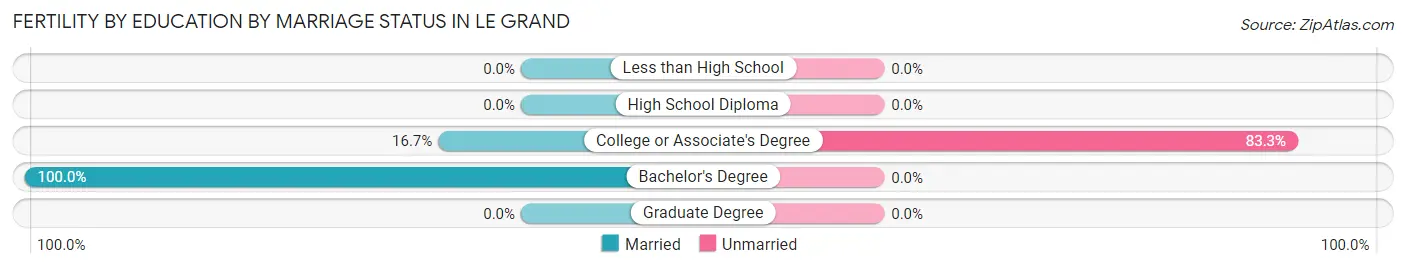
| Educational Attainment | Married | Unmarried |
| Less than High School | 0 (0.0%) | 0 (0.0%) |
| High School Diploma | 0 (0.0%) | 0 (0.0%) |
| College or Associate's Degree | 4 (16.7%) | 20 (83.3%) |
| Bachelor's Degree | 10 (100.0%) | 0 (0.0%) |
| Graduate Degree | 0 (0.0%) | 0 (0.0%) |
| Total | 14 (41.2%) | 20 (58.8%) |
Employment Characteristics in Le Grand
Employment by Class of Employer in Le Grand
Among the 643 employed individuals in Le Grand, private company employees (483 | 75.1%), local government employees (95 | 14.8%), and self-employed (not incorporated) (35 | 5.4%) make up the most common classes of employment.
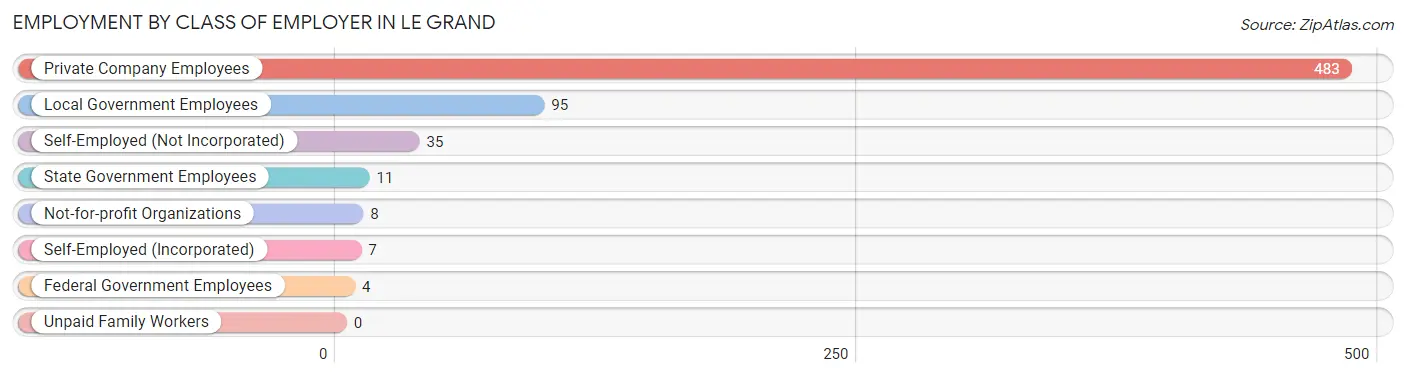
| Employer Class | # Employees | % Employees |
| Private Company Employees | 483 | 75.1% |
| Self-Employed (Incorporated) | 7 | 1.1% |
| Self-Employed (Not Incorporated) | 35 | 5.4% |
| Not-for-profit Organizations | 8 | 1.2% |
| Local Government Employees | 95 | 14.8% |
| State Government Employees | 11 | 1.7% |
| Federal Government Employees | 4 | 0.6% |
| Unpaid Family Workers | 0 | 0.0% |
| Total | 643 | 100.0% |
Employment Status by Age in Le Grand
According to the labor force statistics for Le Grand, out of the total population over 16 years of age (1,214), 61.1% or 742 individuals are in the labor force, with 10.5% or 78 of them unemployed. The age group with the highest labor force participation rate is 45 to 54 years, with 80.7% or 134 individuals in the labor force. Within the labor force, the 16 to 19 years age range has the highest percentage of unemployed individuals, with 71.4% or 5 of them being unemployed.
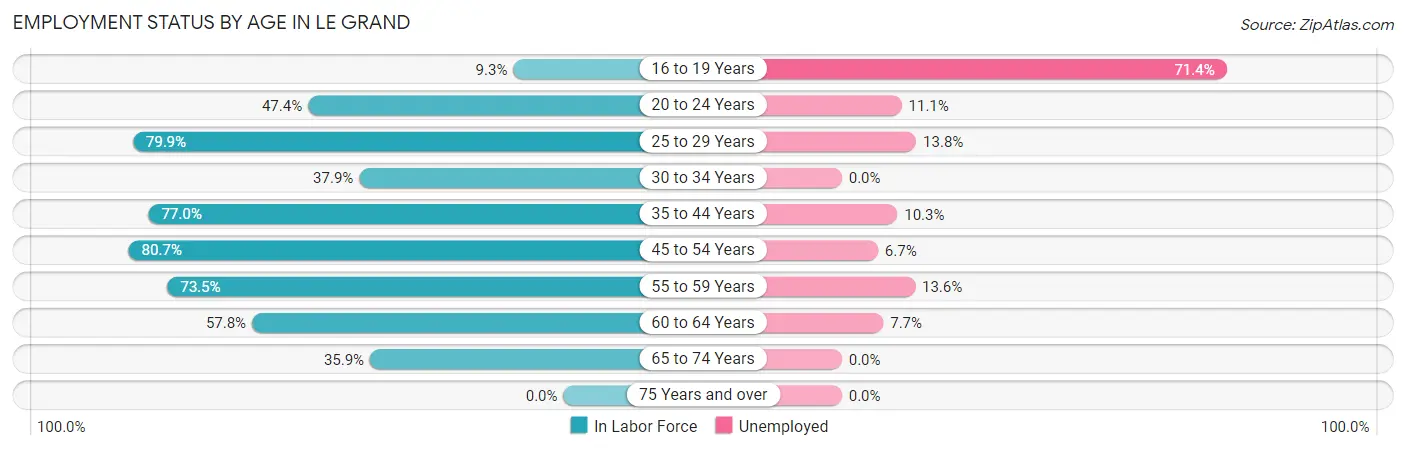
| Age Bracket | In Labor Force | Unemployed |
| 16 to 19 Years | 7 (9.3%) | 5 (71.4%) |
| 20 to 24 Years | 54 (47.4%) | 6 (11.1%) |
| 25 to 29 Years | 123 (79.9%) | 17 (13.8%) |
| 30 to 34 Years | 25 (37.9%) | 0 (0.0%) |
| 35 to 44 Years | 194 (77.0%) | 20 (10.3%) |
| 45 to 54 Years | 134 (80.7%) | 9 (6.7%) |
| 55 to 59 Years | 125 (73.5%) | 17 (13.6%) |
| 60 to 64 Years | 52 (57.8%) | 4 (7.7%) |
| 65 to 74 Years | 28 (35.9%) | 0 (0.0%) |
| 75 Years and over | 0 (0.0%) | 0 (0.0%) |
| Total | 742 (61.1%) | 78 (10.5%) |
Employment Status by Educational Attainment in Le Grand
According to labor force statistics for Le Grand, 72.7% of individuals (653) out of the total population between 25 and 64 years of age (898) are in the labor force, with 10.3% or 67 of them being unemployed. The group with the highest labor force participation rate are those with the educational attainment of bachelor's degree or higher, with 87.7% or 100 individuals in the labor force. Within the labor force, individuals with less than high school education have the highest percentage of unemployment, with 14.7% or 27 of them being unemployed.
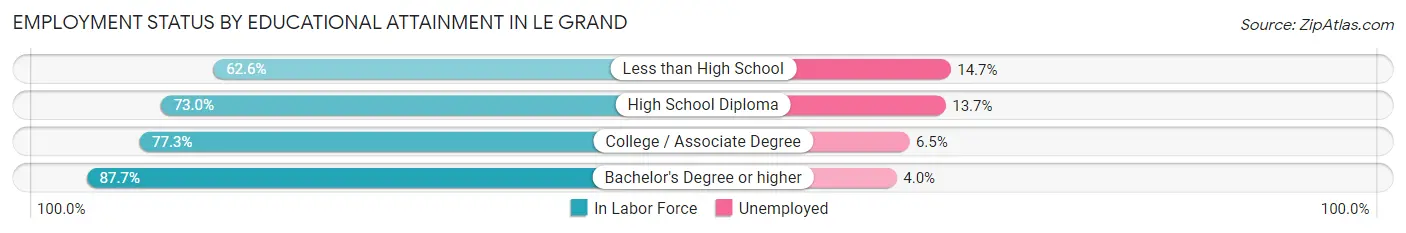
| Educational Attainment | In Labor Force | Unemployed |
| Less than High School | 184 (62.6%) | 43 (14.7%) |
| High School Diploma | 168 (73.0%) | 32 (13.7%) |
| College / Associate Degree | 201 (77.3%) | 17 (6.5%) |
| Bachelor's Degree or higher | 100 (87.7%) | 5 (4.0%) |
| Total | 653 (72.7%) | 92 (10.3%) |
Employment Occupations by Sex in Le Grand
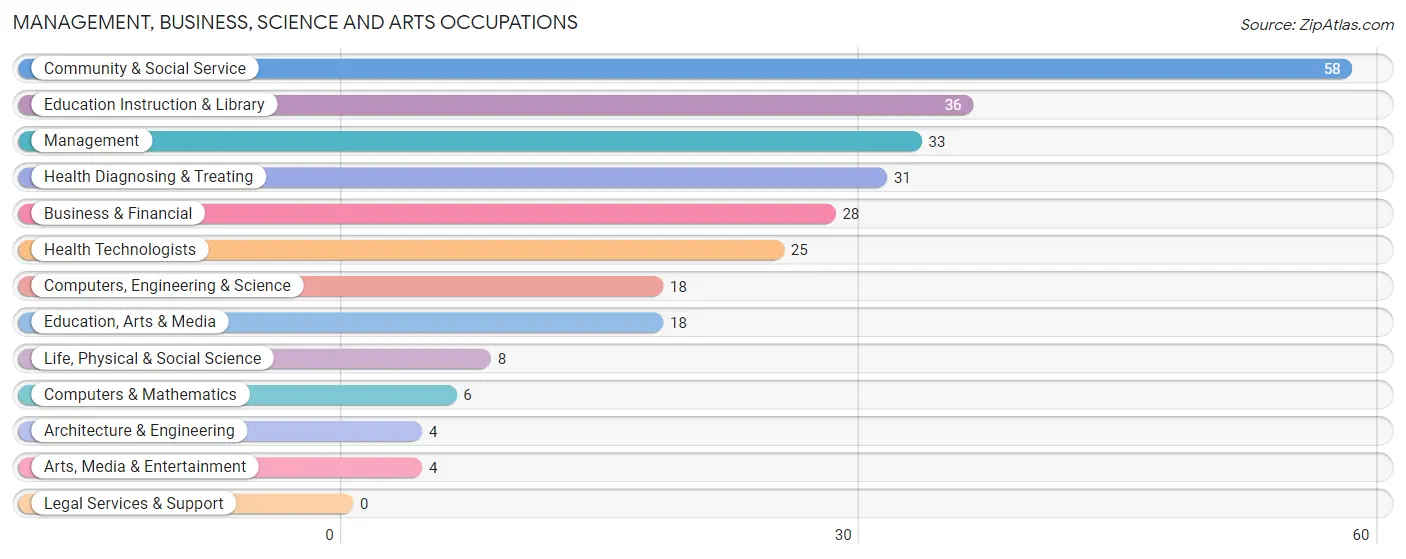
Management, Business, Science and Arts Occupations
The most common Management, Business, Science and Arts occupations in Le Grand are Community & Social Service (58 | 8.7%), Education Instruction & Library (36 | 5.4%), Management (33 | 5.0%), Health Diagnosing & Treating (31 | 4.7%), and Business & Financial (28 | 4.2%).
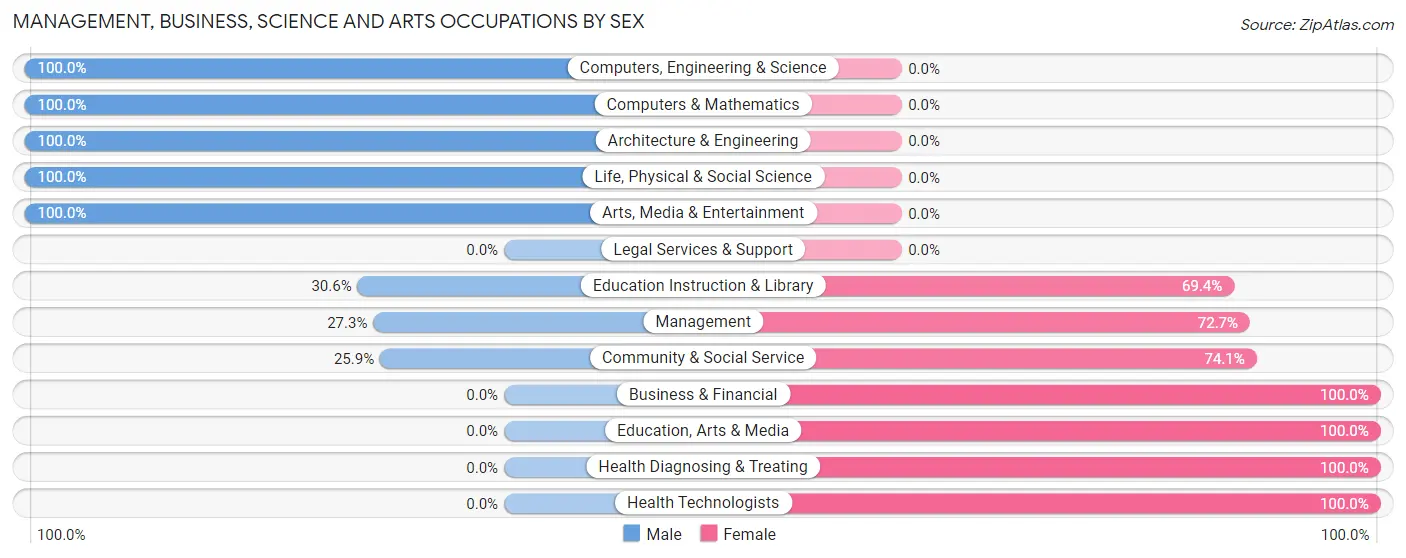
Management, Business, Science and Arts Occupations by Sex
Within the Management, Business, Science and Arts occupations in Le Grand, the most male-oriented occupations are Computers, Engineering & Science (100.0%), Computers & Mathematics (100.0%), and Architecture & Engineering (100.0%), while the most female-oriented occupations are Business & Financial (100.0%), Education, Arts & Media (100.0%), and Health Diagnosing & Treating (100.0%).
| Occupation | Male | Female |
| Management | 9 (27.3%) | 24 (72.7%) |
| Business & Financial | 0 (0.0%) | 28 (100.0%) |
| Computers, Engineering & Science | 18 (100.0%) | 0 (0.0%) |
| Computers & Mathematics | 6 (100.0%) | 0 (0.0%) |
| Architecture & Engineering | 4 (100.0%) | 0 (0.0%) |
| Life, Physical & Social Science | 8 (100.0%) | 0 (0.0%) |
| Community & Social Service | 15 (25.9%) | 43 (74.1%) |
| Education, Arts & Media | 0 (0.0%) | 18 (100.0%) |
| Legal Services & Support | 0 (0.0%) | 0 (0.0%) |
| Education Instruction & Library | 11 (30.6%) | 25 (69.4%) |
| Arts, Media & Entertainment | 4 (100.0%) | 0 (0.0%) |
| Health Diagnosing & Treating | 0 (0.0%) | 31 (100.0%) |
| Health Technologists | 0 (0.0%) | 25 (100.0%) |
| Total (Category) | 42 (25.0%) | 126 (75.0%) |
| Total (Overall) | 361 (54.4%) | 303 (45.6%) |
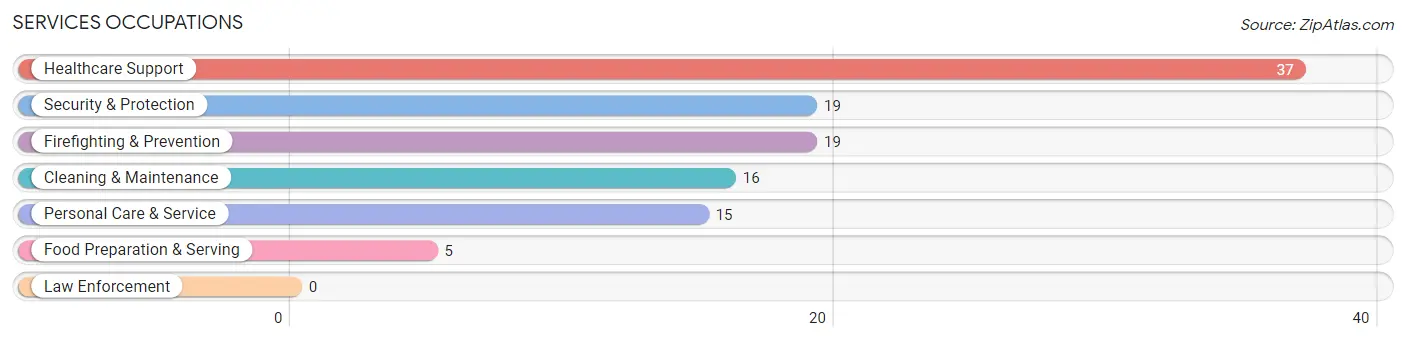
Services Occupations
The most common Services occupations in Le Grand are Healthcare Support (37 | 5.6%), Security & Protection (19 | 2.9%), Firefighting & Prevention (19 | 2.9%), Cleaning & Maintenance (16 | 2.4%), and Personal Care & Service (15 | 2.3%).
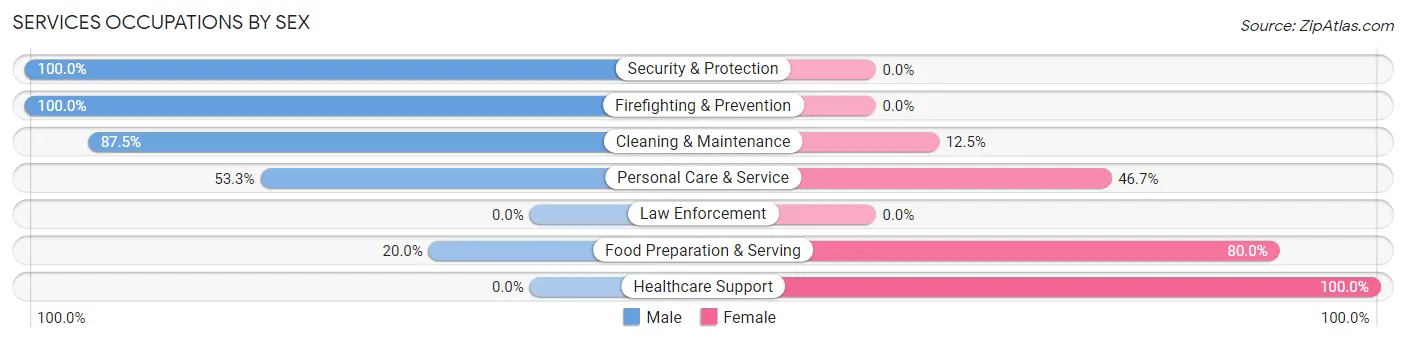
Services Occupations by Sex
Within the Services occupations in Le Grand, the most male-oriented occupations are Security & Protection (100.0%), Firefighting & Prevention (100.0%), and Cleaning & Maintenance (87.5%), while the most female-oriented occupations are Healthcare Support (100.0%), Food Preparation & Serving (80.0%), and Personal Care & Service (46.7%).
| Occupation | Male | Female |
| Healthcare Support | 0 (0.0%) | 37 (100.0%) |
| Security & Protection | 19 (100.0%) | 0 (0.0%) |
| Firefighting & Prevention | 19 (100.0%) | 0 (0.0%) |
| Law Enforcement | 0 (0.0%) | 0 (0.0%) |
| Food Preparation & Serving | 1 (20.0%) | 4 (80.0%) |
| Cleaning & Maintenance | 14 (87.5%) | 2 (12.5%) |
| Personal Care & Service | 8 (53.3%) | 7 (46.7%) |
| Total (Category) | 42 (45.7%) | 50 (54.3%) |
| Total (Overall) | 361 (54.4%) | 303 (45.6%) |
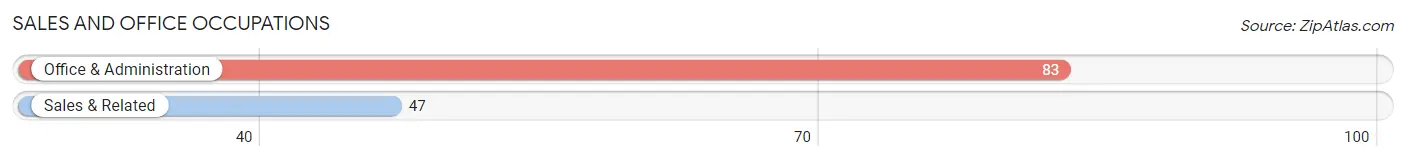
Sales and Office Occupations
The most common Sales and Office occupations in Le Grand are Office & Administration (83 | 12.5%), and Sales & Related (47 | 7.1%).
Sales and Office Occupations by Sex
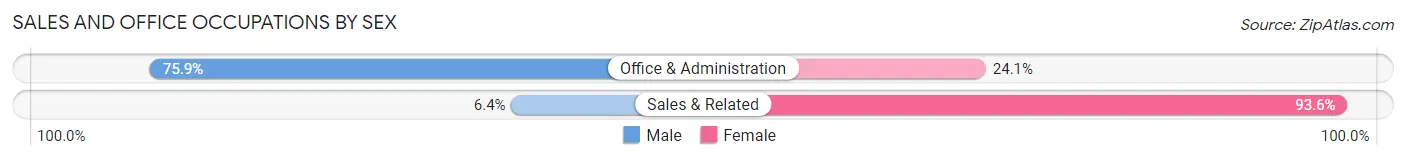
| Occupation | Male | Female |
| Sales & Related | 3 (6.4%) | 44 (93.6%) |
| Office & Administration | 63 (75.9%) | 20 (24.1%) |
| Total (Category) | 66 (50.8%) | 64 (49.2%) |
| Total (Overall) | 361 (54.4%) | 303 (45.6%) |
Natural Resources, Construction and Maintenance Occupations
The most common Natural Resources, Construction and Maintenance occupations in Le Grand are Farming, Fishing & Forestry (104 | 15.7%), Installation, Maintenance & Repair (23 | 3.5%), and Construction & Extraction (5 | 0.7%).

Natural Resources, Construction and Maintenance Occupations by Sex
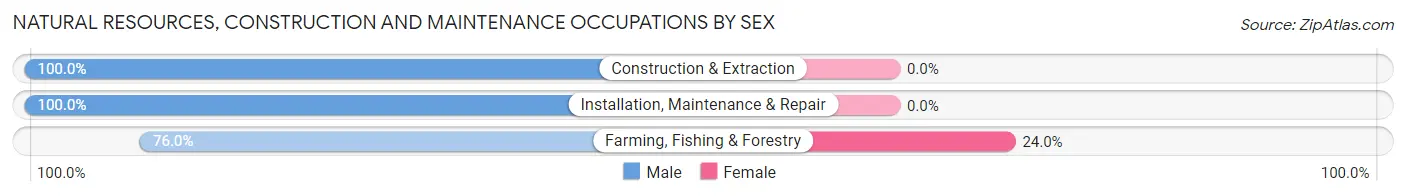
| Occupation | Male | Female |
| Farming, Fishing & Forestry | 79 (76.0%) | 25 (24.0%) |
| Construction & Extraction | 5 (100.0%) | 0 (0.0%) |
| Installation, Maintenance & Repair | 23 (100.0%) | 0 (0.0%) |
| Total (Category) | 107 (81.1%) | 25 (18.9%) |
| Total (Overall) | 361 (54.4%) | 303 (45.6%) |
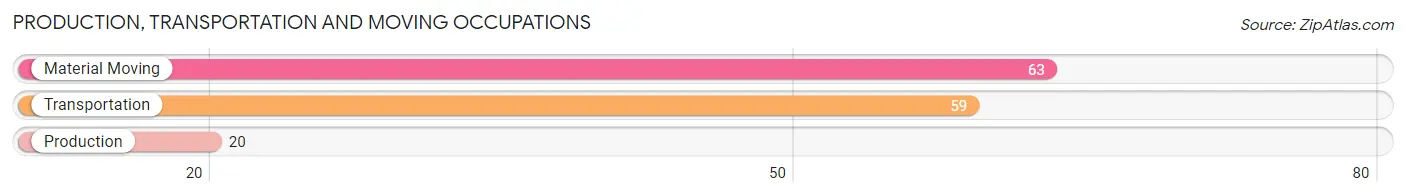
Production, Transportation and Moving Occupations
The most common Production, Transportation and Moving occupations in Le Grand are Material Moving (63 | 9.5%), Transportation (59 | 8.9%), and Production (20 | 3.0%).
Production, Transportation and Moving Occupations by Sex
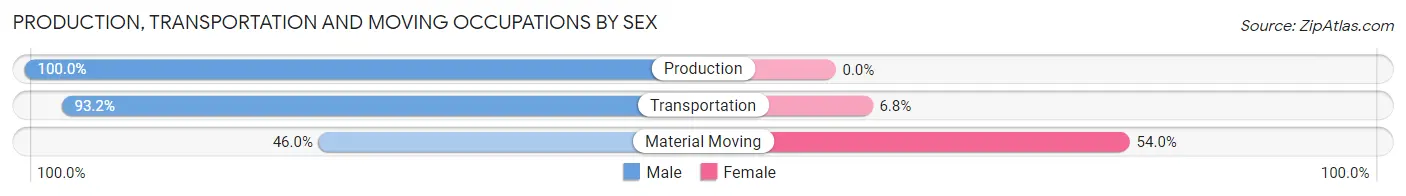
| Occupation | Male | Female |
| Production | 20 (100.0%) | 0 (0.0%) |
| Transportation | 55 (93.2%) | 4 (6.8%) |
| Material Moving | 29 (46.0%) | 34 (54.0%) |
| Total (Category) | 104 (73.2%) | 38 (26.8%) |
| Total (Overall) | 361 (54.4%) | 303 (45.6%) |
Employment Industries by Sex in Le Grand
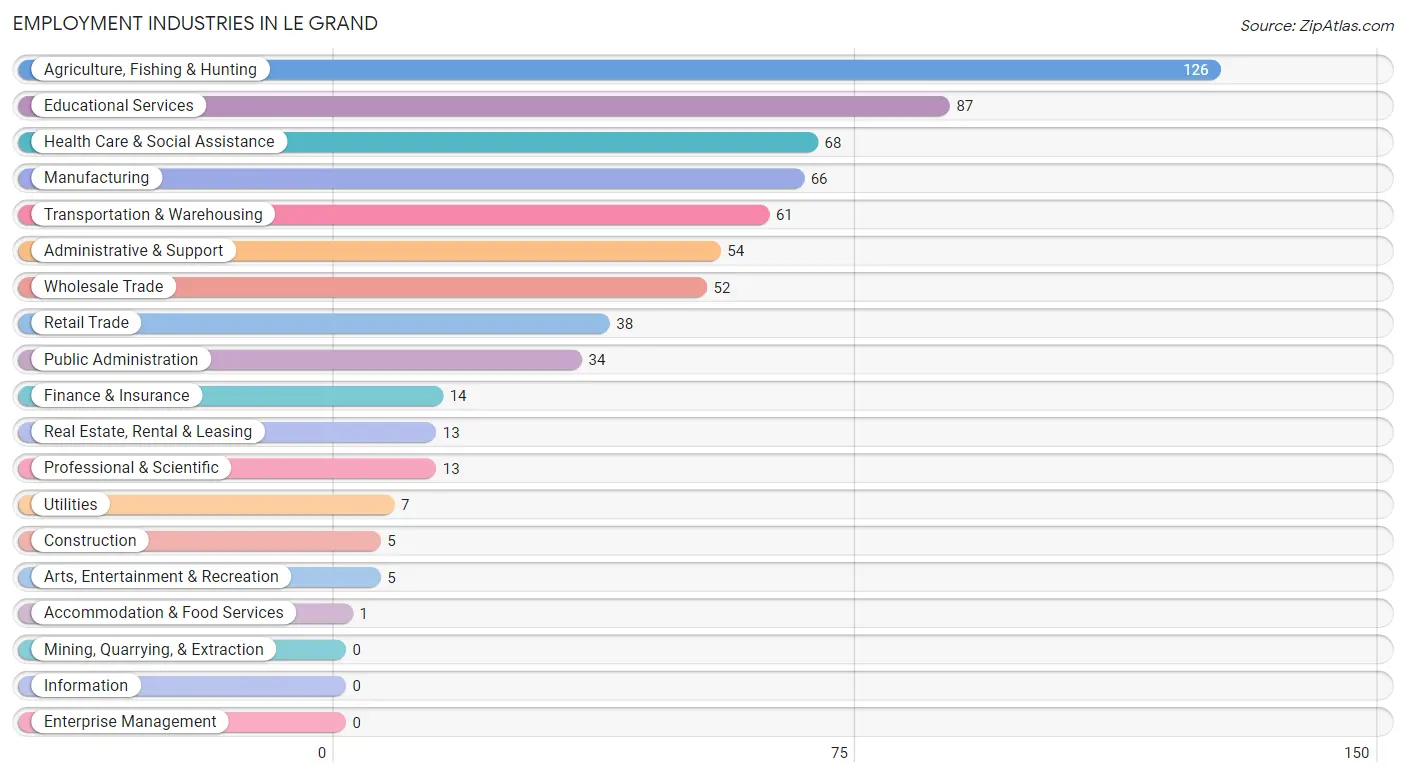
Employment Industries in Le Grand
The major employment industries in Le Grand include Agriculture, Fishing & Hunting (126 | 19.0%), Educational Services (87 | 13.1%), Health Care & Social Assistance (68 | 10.2%), Manufacturing (66 | 9.9%), and Transportation & Warehousing (61 | 9.2%).
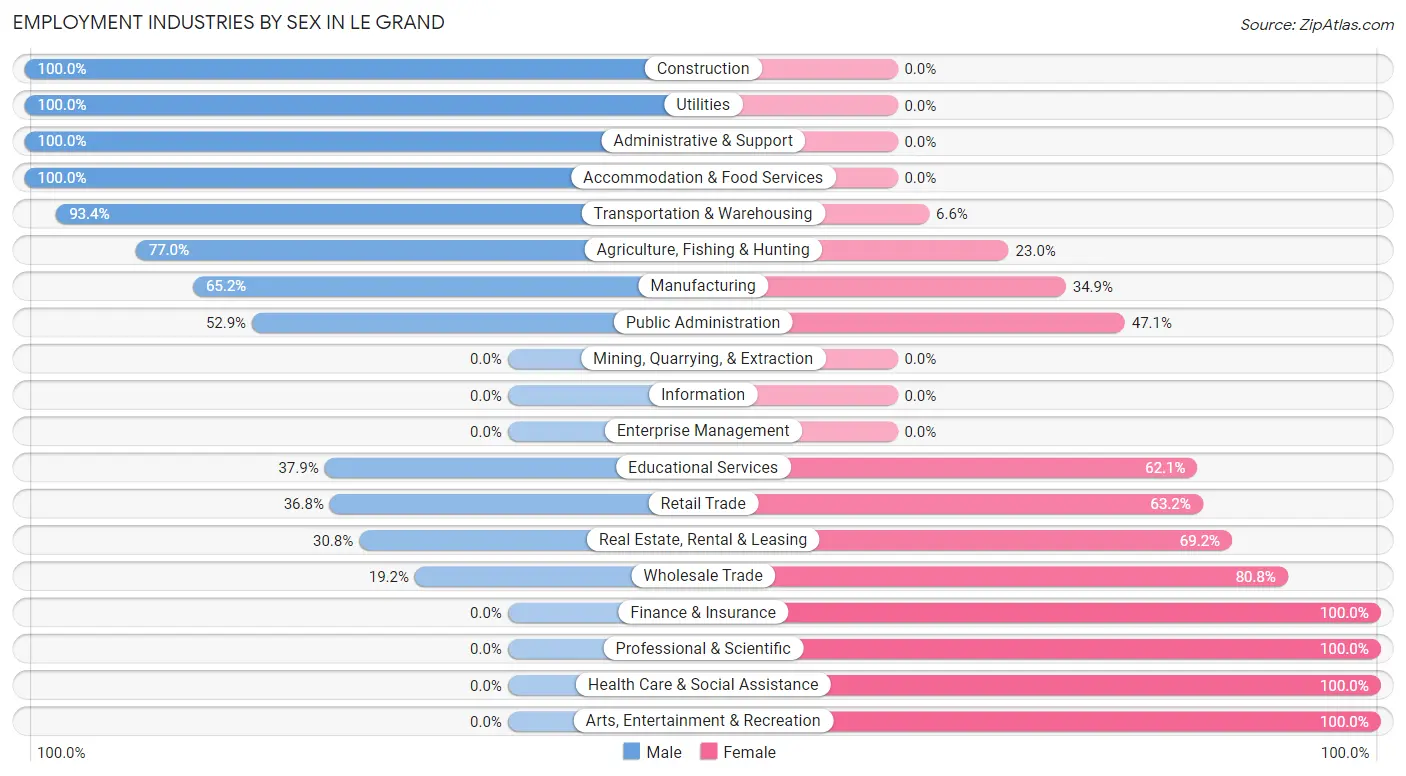
Employment Industries by Sex in Le Grand
The Le Grand industries that see more men than women are Construction (100.0%), Utilities (100.0%), and Administrative & Support (100.0%), whereas the industries that tend to have a higher number of women are Finance & Insurance (100.0%), Professional & Scientific (100.0%), and Health Care & Social Assistance (100.0%).
| Industry | Male | Female |
| Agriculture, Fishing & Hunting | 97 (77.0%) | 29 (23.0%) |
| Mining, Quarrying, & Extraction | 0 (0.0%) | 0 (0.0%) |
| Construction | 5 (100.0%) | 0 (0.0%) |
| Manufacturing | 43 (65.1%) | 23 (34.8%) |
| Wholesale Trade | 10 (19.2%) | 42 (80.8%) |
| Retail Trade | 14 (36.8%) | 24 (63.2%) |
| Transportation & Warehousing | 57 (93.4%) | 4 (6.6%) |
| Utilities | 7 (100.0%) | 0 (0.0%) |
| Information | 0 (0.0%) | 0 (0.0%) |
| Finance & Insurance | 0 (0.0%) | 14 (100.0%) |
| Real Estate, Rental & Leasing | 4 (30.8%) | 9 (69.2%) |
| Professional & Scientific | 0 (0.0%) | 13 (100.0%) |
| Enterprise Management | 0 (0.0%) | 0 (0.0%) |
| Administrative & Support | 54 (100.0%) | 0 (0.0%) |
| Educational Services | 33 (37.9%) | 54 (62.1%) |
| Health Care & Social Assistance | 0 (0.0%) | 68 (100.0%) |
| Arts, Entertainment & Recreation | 0 (0.0%) | 5 (100.0%) |
| Accommodation & Food Services | 1 (100.0%) | 0 (0.0%) |
| Public Administration | 18 (52.9%) | 16 (47.1%) |
| Total | 361 (54.4%) | 303 (45.6%) |
Education in Le Grand
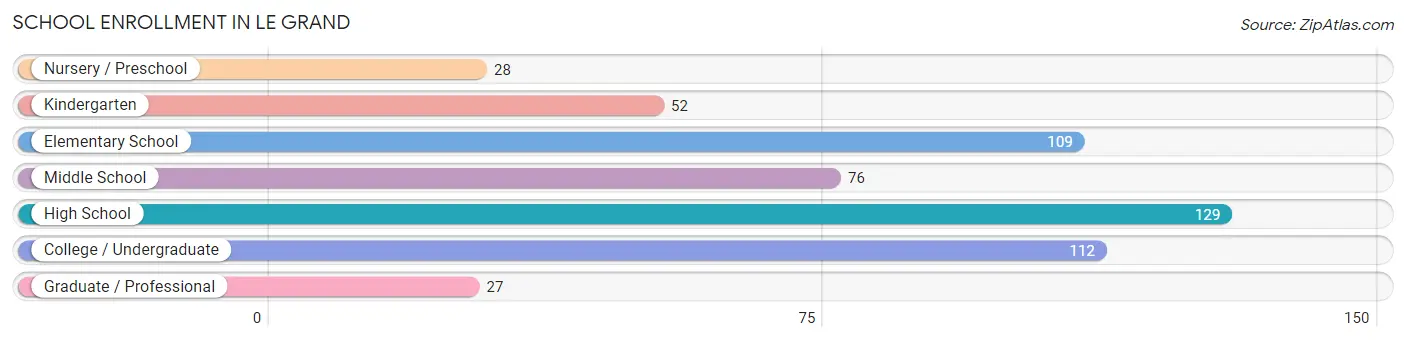
School Enrollment in Le Grand
The most common levels of schooling among the 533 students in Le Grand are high school (129 | 24.2%), college / undergraduate (112 | 21.0%), and elementary school (109 | 20.4%).
| School Level | # Students | % Students |
| Nursery / Preschool | 28 | 5.2% |
| Kindergarten | 52 | 9.8% |
| Elementary School | 109 | 20.4% |
| Middle School | 76 | 14.3% |
| High School | 129 | 24.2% |
| College / Undergraduate | 112 | 21.0% |
| Graduate / Professional | 27 | 5.1% |
| Total | 533 | 100.0% |
School Enrollment by Age by Funding Source in Le Grand
Out of a total of 533 students who are enrolled in schools in Le Grand, 58 (10.9%) attend a private institution, while the remaining 475 (89.1%) are enrolled in public schools. The age group of 35 years and over has the highest likelihood of being enrolled in private schools, with 29 (46.8% in the age bracket) enrolled. Conversely, the age group of 10 to 14 year olds has the lowest likelihood of being enrolled in a private school, with 119 (100.0% in the age bracket) attending a public institution.
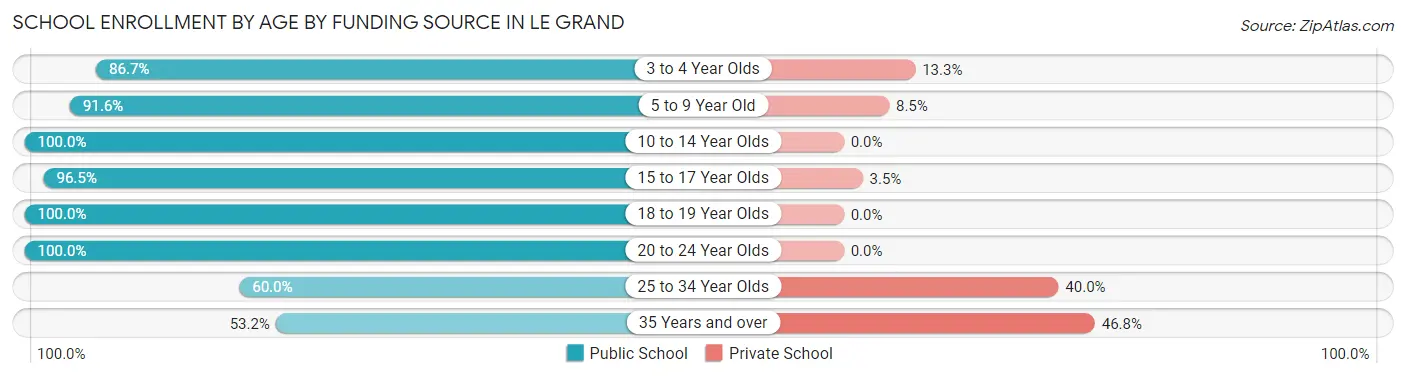
| Age Bracket | Public School | Private School |
| 3 to 4 Year Olds | 26 (86.7%) | 4 (13.3%) |
| 5 to 9 Year Old | 130 (91.5%) | 12 (8.5%) |
| 10 to 14 Year Olds | 119 (100.0%) | 0 (0.0%) |
| 15 to 17 Year Olds | 82 (96.5%) | 3 (3.5%) |
| 18 to 19 Year Olds | 37 (100.0%) | 0 (0.0%) |
| 20 to 24 Year Olds | 33 (100.0%) | 0 (0.0%) |
| 25 to 34 Year Olds | 15 (60.0%) | 10 (40.0%) |
| 35 Years and over | 33 (53.2%) | 29 (46.8%) |
| Total | 475 (89.1%) | 58 (10.9%) |
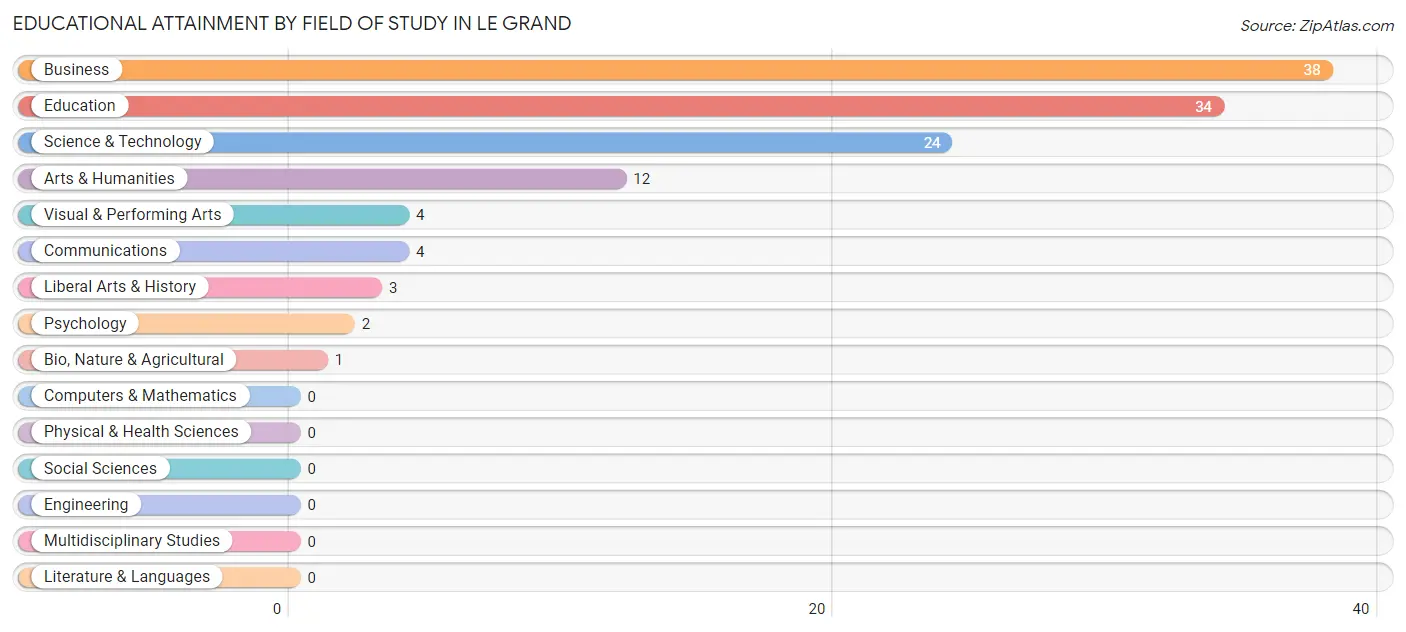
Educational Attainment by Field of Study in Le Grand
Business (38 | 31.1%), education (34 | 27.9%), science & technology (24 | 19.7%), arts & humanities (12 | 9.8%), and visual & performing arts (4 | 3.3%) are the most common fields of study among 122 individuals in Le Grand who have obtained a bachelor's degree or higher.
| Field of Study | # Graduates | % Graduates |
| Computers & Mathematics | 0 | 0.0% |
| Bio, Nature & Agricultural | 1 | 0.8% |
| Physical & Health Sciences | 0 | 0.0% |
| Psychology | 2 | 1.6% |
| Social Sciences | 0 | 0.0% |
| Engineering | 0 | 0.0% |
| Multidisciplinary Studies | 0 | 0.0% |
| Science & Technology | 24 | 19.7% |
| Business | 38 | 31.1% |
| Education | 34 | 27.9% |
| Literature & Languages | 0 | 0.0% |
| Liberal Arts & History | 3 | 2.5% |
| Visual & Performing Arts | 4 | 3.3% |
| Communications | 4 | 3.3% |
| Arts & Humanities | 12 | 9.8% |
| Total | 122 | 100.0% |
Transportation & Commute in Le Grand
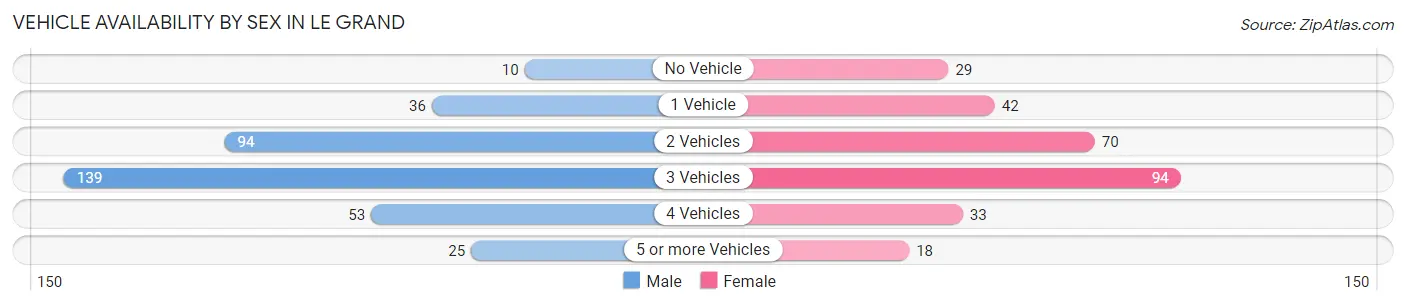
Vehicle Availability by Sex in Le Grand
The most prevalent vehicle ownership categories in Le Grand are males with 3 vehicles (139, accounting for 38.9%) and females with 3 vehicles (94, making up 48.6%).
| Vehicles Available | Male | Female |
| No Vehicle | 10 (2.8%) | 29 (10.1%) |
| 1 Vehicle | 36 (10.1%) | 42 (14.7%) |
| 2 Vehicles | 94 (26.3%) | 70 (24.5%) |
| 3 Vehicles | 139 (38.9%) | 94 (32.9%) |
| 4 Vehicles | 53 (14.8%) | 33 (11.5%) |
| 5 or more Vehicles | 25 (7.0%) | 18 (6.3%) |
| Total | 357 (100.0%) | 286 (100.0%) |
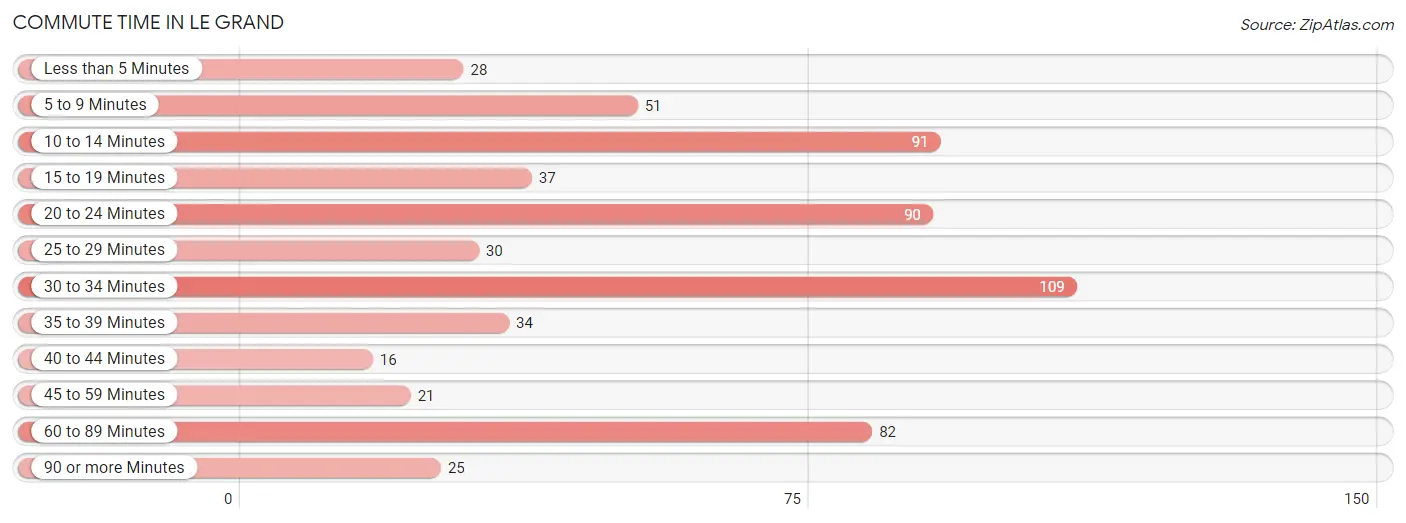
Commute Time in Le Grand
The most frequently occuring commute durations in Le Grand are 30 to 34 minutes (109 commuters, 17.7%), 10 to 14 minutes (91 commuters, 14.8%), and 20 to 24 minutes (90 commuters, 14.7%).
| Commute Time | # Commuters | % Commuters |
| Less than 5 Minutes | 28 | 4.6% |
| 5 to 9 Minutes | 51 | 8.3% |
| 10 to 14 Minutes | 91 | 14.8% |
| 15 to 19 Minutes | 37 | 6.0% |
| 20 to 24 Minutes | 90 | 14.7% |
| 25 to 29 Minutes | 30 | 4.9% |
| 30 to 34 Minutes | 109 | 17.7% |
| 35 to 39 Minutes | 34 | 5.5% |
| 40 to 44 Minutes | 16 | 2.6% |
| 45 to 59 Minutes | 21 | 3.4% |
| 60 to 89 Minutes | 82 | 13.4% |
| 90 or more Minutes | 25 | 4.1% |
Commute Time by Sex in Le Grand
The most common commute times in Le Grand are 30 to 34 minutes (65 commuters, 18.2%) for males and 60 to 89 minutes (45 commuters, 17.5%) for females.
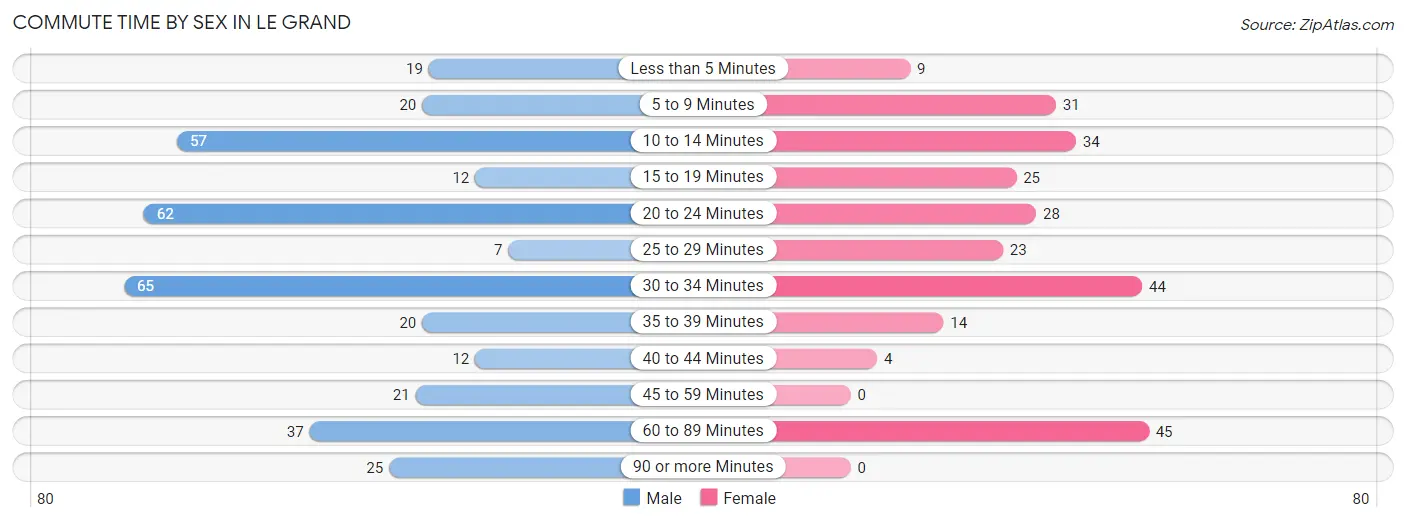
| Commute Time | Male | Female |
| Less than 5 Minutes | 19 (5.3%) | 9 (3.5%) |
| 5 to 9 Minutes | 20 (5.6%) | 31 (12.1%) |
| 10 to 14 Minutes | 57 (16.0%) | 34 (13.2%) |
| 15 to 19 Minutes | 12 (3.4%) | 25 (9.7%) |
| 20 to 24 Minutes | 62 (17.4%) | 28 (10.9%) |
| 25 to 29 Minutes | 7 (2.0%) | 23 (8.9%) |
| 30 to 34 Minutes | 65 (18.2%) | 44 (17.1%) |
| 35 to 39 Minutes | 20 (5.6%) | 14 (5.4%) |
| 40 to 44 Minutes | 12 (3.4%) | 4 (1.6%) |
| 45 to 59 Minutes | 21 (5.9%) | 0 (0.0%) |
| 60 to 89 Minutes | 37 (10.4%) | 45 (17.5%) |
| 90 or more Minutes | 25 (7.0%) | 0 (0.0%) |
Time of Departure to Work by Sex in Le Grand
The most frequent times of departure to work in Le Grand are 5:00 AM to 5:29 AM (63, 17.6%) for males and 7:30 AM to 7:59 AM (72, 28.0%) for females.
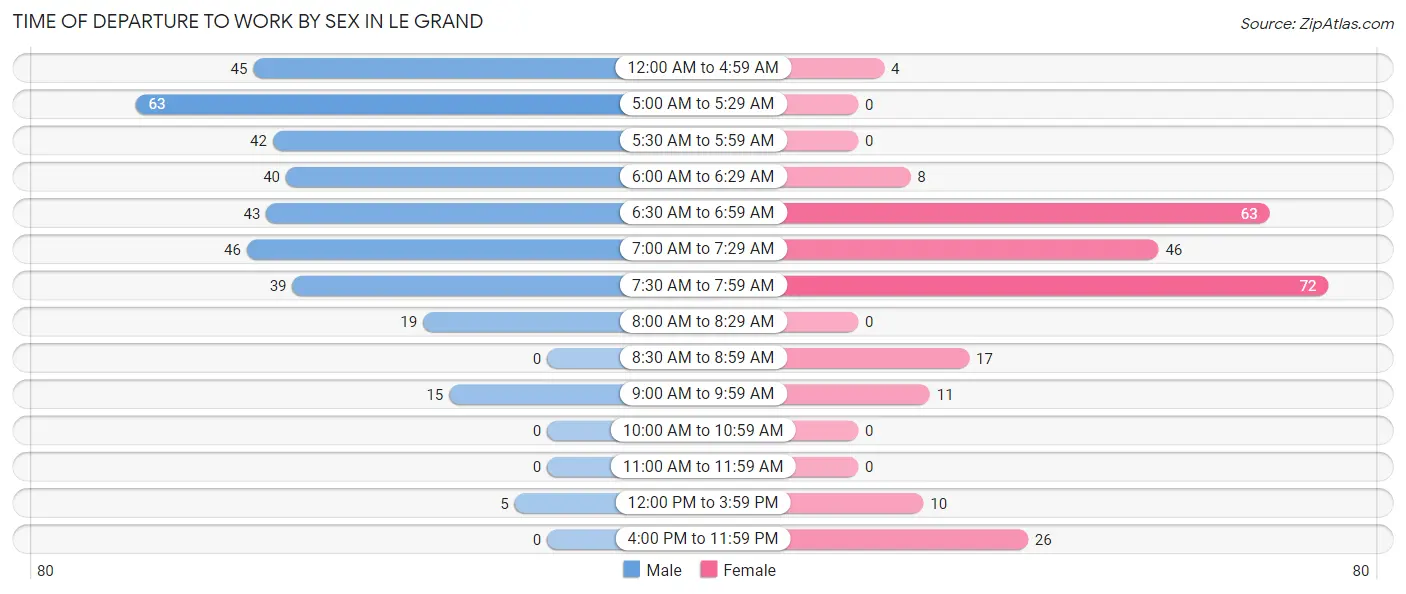
| Time of Departure | Male | Female |
| 12:00 AM to 4:59 AM | 45 (12.6%) | 4 (1.6%) |
| 5:00 AM to 5:29 AM | 63 (17.6%) | 0 (0.0%) |
| 5:30 AM to 5:59 AM | 42 (11.8%) | 0 (0.0%) |
| 6:00 AM to 6:29 AM | 40 (11.2%) | 8 (3.1%) |
| 6:30 AM to 6:59 AM | 43 (12.0%) | 63 (24.5%) |
| 7:00 AM to 7:29 AM | 46 (12.9%) | 46 (17.9%) |
| 7:30 AM to 7:59 AM | 39 (10.9%) | 72 (28.0%) |
| 8:00 AM to 8:29 AM | 19 (5.3%) | 0 (0.0%) |
| 8:30 AM to 8:59 AM | 0 (0.0%) | 17 (6.6%) |
| 9:00 AM to 9:59 AM | 15 (4.2%) | 11 (4.3%) |
| 10:00 AM to 10:59 AM | 0 (0.0%) | 0 (0.0%) |
| 11:00 AM to 11:59 AM | 0 (0.0%) | 0 (0.0%) |
| 12:00 PM to 3:59 PM | 5 (1.4%) | 10 (3.9%) |
| 4:00 PM to 11:59 PM | 0 (0.0%) | 26 (10.1%) |
| Total | 357 (100.0%) | 257 (100.0%) |
Housing Occupancy in Le Grand
Occupancy by Ownership in Le Grand
Of the total 498 dwellings in Le Grand, owner-occupied units account for 318 (63.9%), while renter-occupied units make up 180 (36.1%).
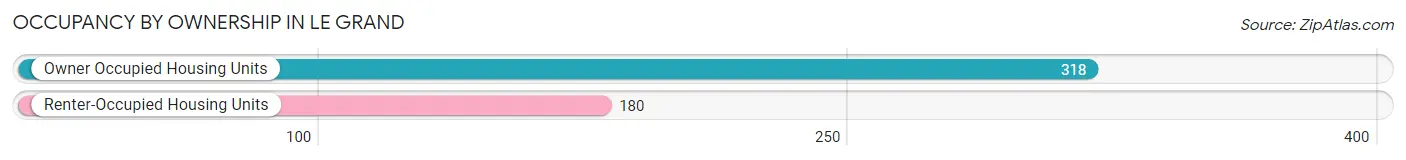
| Occupancy | # Housing Units | % Housing Units |
| Owner Occupied Housing Units | 318 | 63.9% |
| Renter-Occupied Housing Units | 180 | 36.1% |
| Total Occupied Housing Units | 498 | 100.0% |
Occupancy by Household Size in Le Grand
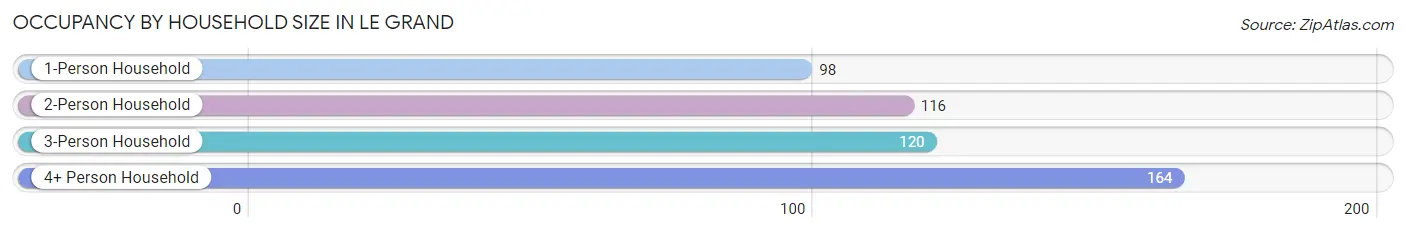
| Household Size | # Housing Units | % Housing Units |
| 1-Person Household | 98 | 19.7% |
| 2-Person Household | 116 | 23.3% |
| 3-Person Household | 120 | 24.1% |
| 4+ Person Household | 164 | 32.9% |
| Total Housing Units | 498 | 100.0% |
Occupancy by Ownership by Household Size in Le Grand
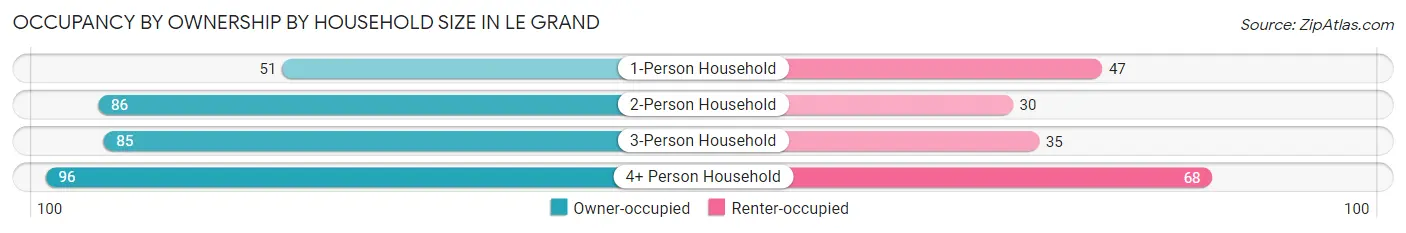
| Household Size | Owner-occupied | Renter-occupied |
| 1-Person Household | 51 (52.0%) | 47 (48.0%) |
| 2-Person Household | 86 (74.1%) | 30 (25.9%) |
| 3-Person Household | 85 (70.8%) | 35 (29.2%) |
| 4+ Person Household | 96 (58.5%) | 68 (41.5%) |
| Total Housing Units | 318 (63.9%) | 180 (36.1%) |
Occupancy by Educational Attainment in Le Grand
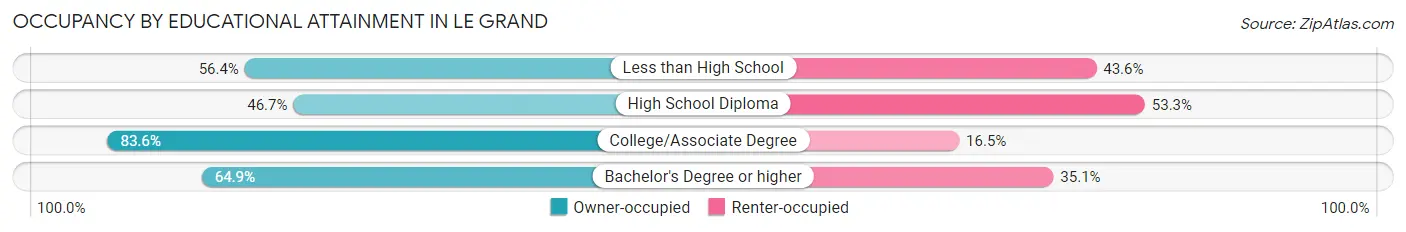
| Household Size | Owner-occupied | Renter-occupied |
| Less than High School | 93 (56.4%) | 72 (43.6%) |
| High School Diploma | 50 (46.7%) | 57 (53.3%) |
| College/Associate Degree | 127 (83.6%) | 25 (16.5%) |
| Bachelor's Degree or higher | 48 (64.9%) | 26 (35.1%) |
Occupancy by Age of Householder in Le Grand
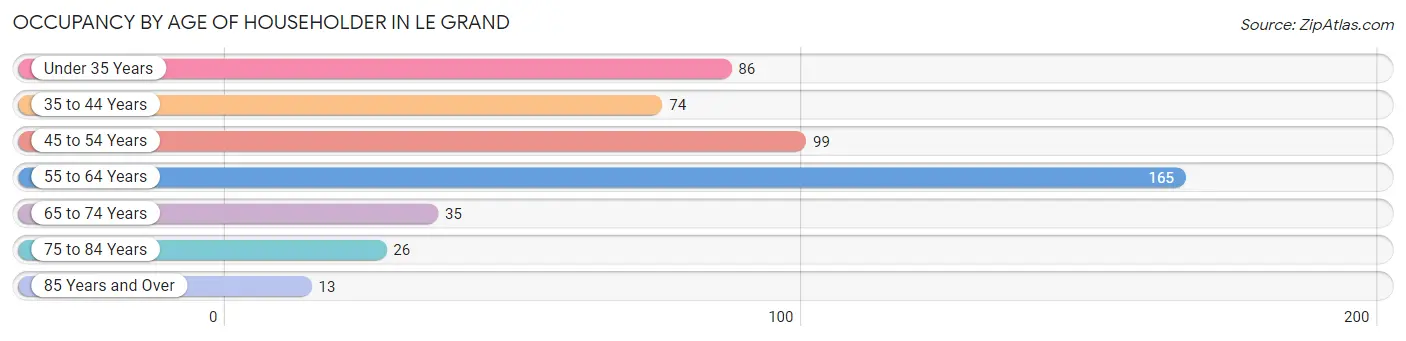
| Age Bracket | # Households | % Households |
| Under 35 Years | 86 | 17.3% |
| 35 to 44 Years | 74 | 14.9% |
| 45 to 54 Years | 99 | 19.9% |
| 55 to 64 Years | 165 | 33.1% |
| 65 to 74 Years | 35 | 7.0% |
| 75 to 84 Years | 26 | 5.2% |
| 85 Years and Over | 13 | 2.6% |
| Total | 498 | 100.0% |
Housing Finances in Le Grand
Median Income by Occupancy in Le Grand
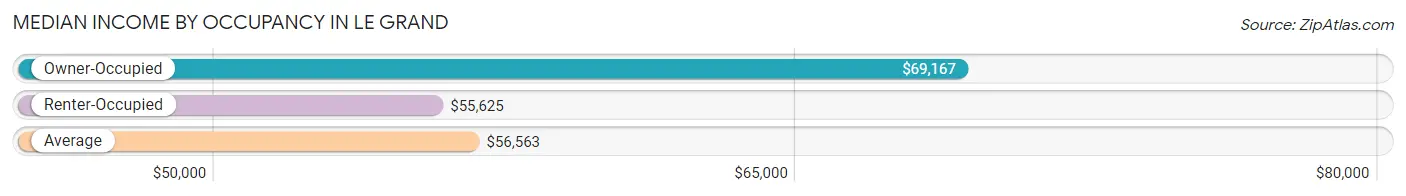
| Occupancy Type | # Households | Median Income |
| Owner-Occupied | 318 (63.9%) | $69,167 |
| Renter-Occupied | 180 (36.1%) | $55,625 |
| Average | 498 (100.0%) | $56,563 |
Occupancy by Householder Income Bracket in Le Grand
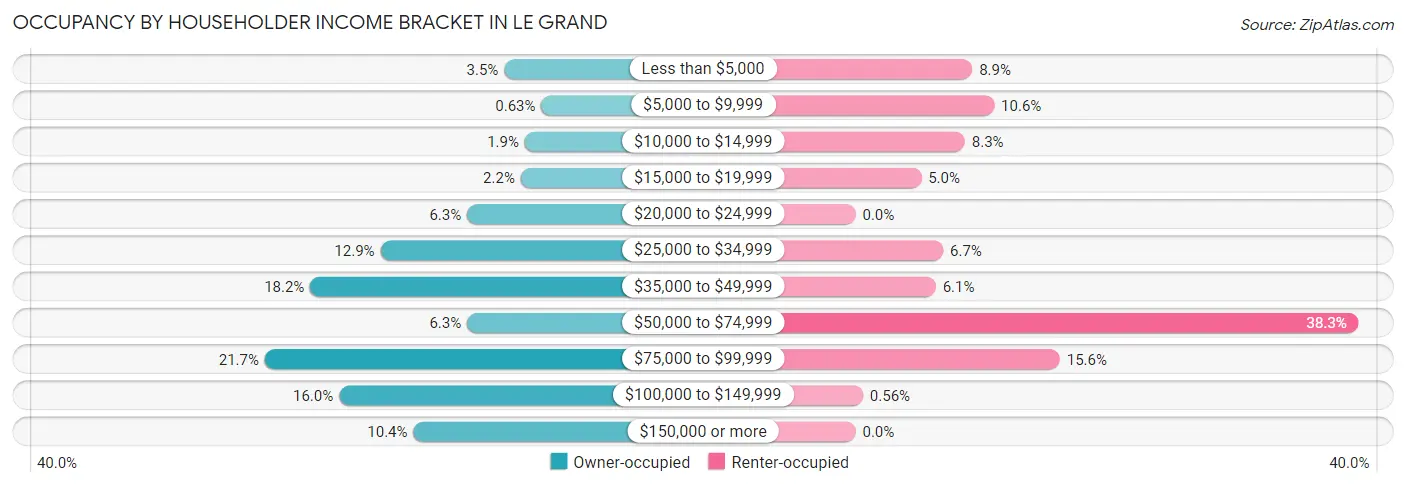
| Income Bracket | Owner-occupied | Renter-occupied |
| Less than $5,000 | 11 (3.5%) | 16 (8.9%) |
| $5,000 to $9,999 | 2 (0.6%) | 19 (10.6%) |
| $10,000 to $14,999 | 6 (1.9%) | 15 (8.3%) |
| $15,000 to $19,999 | 7 (2.2%) | 9 (5.0%) |
| $20,000 to $24,999 | 20 (6.3%) | 0 (0.0%) |
| $25,000 to $34,999 | 41 (12.9%) | 12 (6.7%) |
| $35,000 to $49,999 | 58 (18.2%) | 11 (6.1%) |
| $50,000 to $74,999 | 20 (6.3%) | 69 (38.3%) |
| $75,000 to $99,999 | 69 (21.7%) | 28 (15.6%) |
| $100,000 to $149,999 | 51 (16.0%) | 1 (0.6%) |
| $150,000 or more | 33 (10.4%) | 0 (0.0%) |
| Total | 318 (100.0%) | 180 (100.0%) |
Monthly Housing Cost Tiers in Le Grand
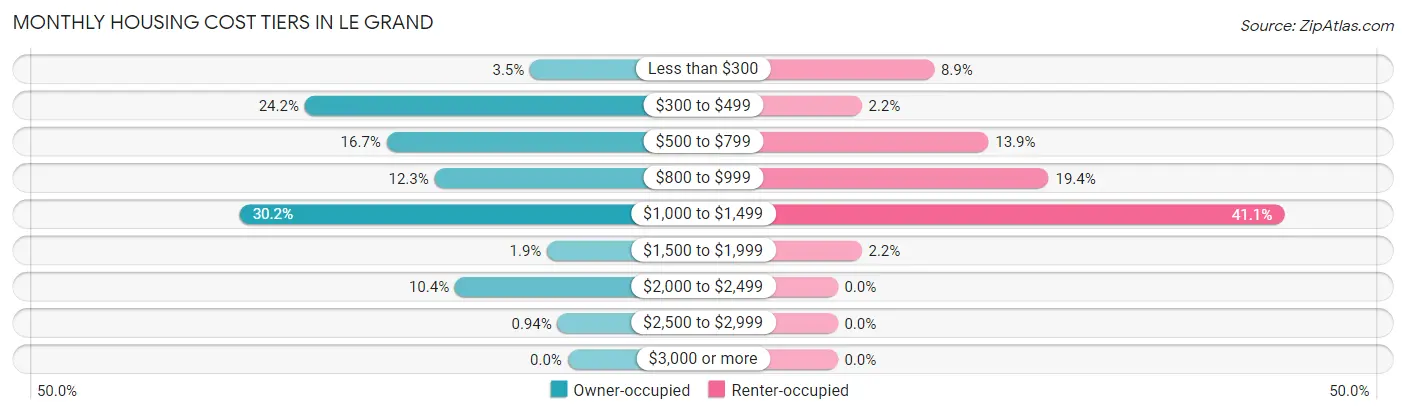
| Monthly Cost | Owner-occupied | Renter-occupied |
| Less than $300 | 11 (3.5%) | 16 (8.9%) |
| $300 to $499 | 77 (24.2%) | 4 (2.2%) |
| $500 to $799 | 53 (16.7%) | 25 (13.9%) |
| $800 to $999 | 39 (12.3%) | 35 (19.4%) |
| $1,000 to $1,499 | 96 (30.2%) | 74 (41.1%) |
| $1,500 to $1,999 | 6 (1.9%) | 4 (2.2%) |
| $2,000 to $2,499 | 33 (10.4%) | 0 (0.0%) |
| $2,500 to $2,999 | 3 (0.9%) | 0 (0.0%) |
| $3,000 or more | 0 (0.0%) | 0 (0.0%) |
| Total | 318 (100.0%) | 180 (100.0%) |
Physical Housing Characteristics in Le Grand
Housing Structures in Le Grand
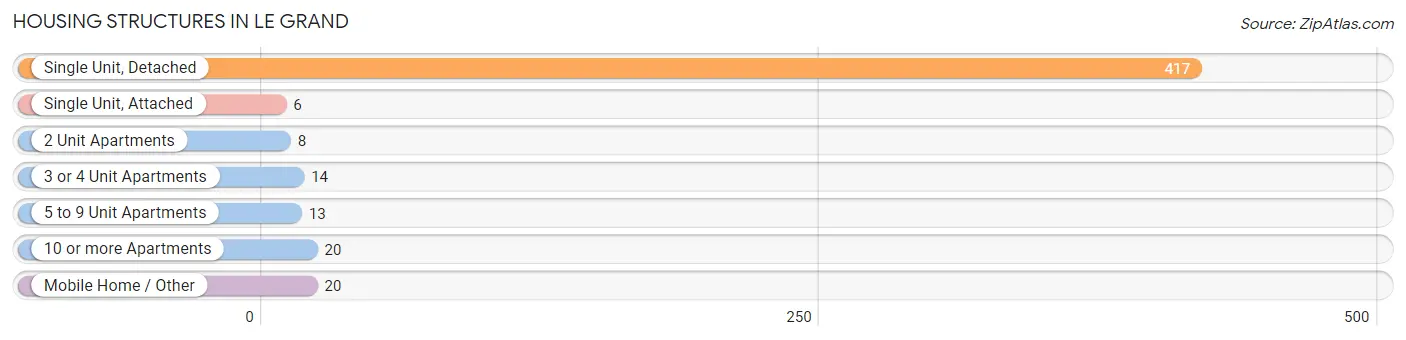
| Structure Type | # Housing Units | % Housing Units |
| Single Unit, Detached | 417 | 83.7% |
| Single Unit, Attached | 6 | 1.2% |
| 2 Unit Apartments | 8 | 1.6% |
| 3 or 4 Unit Apartments | 14 | 2.8% |
| 5 to 9 Unit Apartments | 13 | 2.6% |
| 10 or more Apartments | 20 | 4.0% |
| Mobile Home / Other | 20 | 4.0% |
| Total | 498 | 100.0% |
Housing Structures by Occupancy in Le Grand
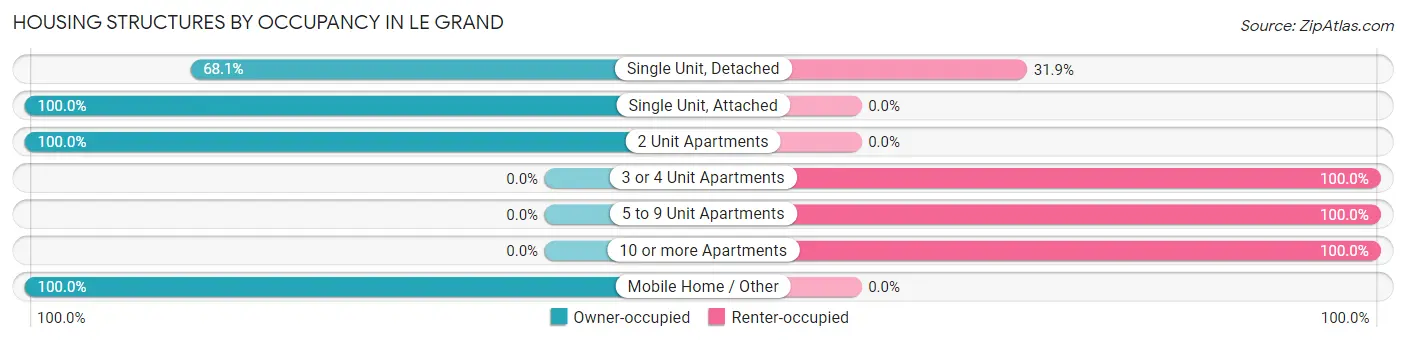
| Structure Type | Owner-occupied | Renter-occupied |
| Single Unit, Detached | 284 (68.1%) | 133 (31.9%) |
| Single Unit, Attached | 6 (100.0%) | 0 (0.0%) |
| 2 Unit Apartments | 8 (100.0%) | 0 (0.0%) |
| 3 or 4 Unit Apartments | 0 (0.0%) | 14 (100.0%) |
| 5 to 9 Unit Apartments | 0 (0.0%) | 13 (100.0%) |
| 10 or more Apartments | 0 (0.0%) | 20 (100.0%) |
| Mobile Home / Other | 20 (100.0%) | 0 (0.0%) |
| Total | 318 (63.9%) | 180 (36.1%) |
Housing Structures by Number of Rooms in Le Grand
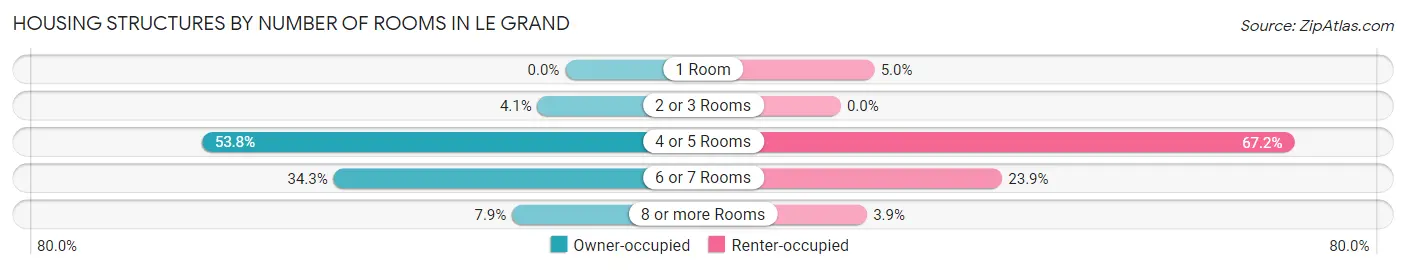
| Number of Rooms | Owner-occupied | Renter-occupied |
| 1 Room | 0 (0.0%) | 9 (5.0%) |
| 2 or 3 Rooms | 13 (4.1%) | 0 (0.0%) |
| 4 or 5 Rooms | 171 (53.8%) | 121 (67.2%) |
| 6 or 7 Rooms | 109 (34.3%) | 43 (23.9%) |
| 8 or more Rooms | 25 (7.9%) | 7 (3.9%) |
| Total | 318 (100.0%) | 180 (100.0%) |
Housing Structure by Heating Type in Le Grand
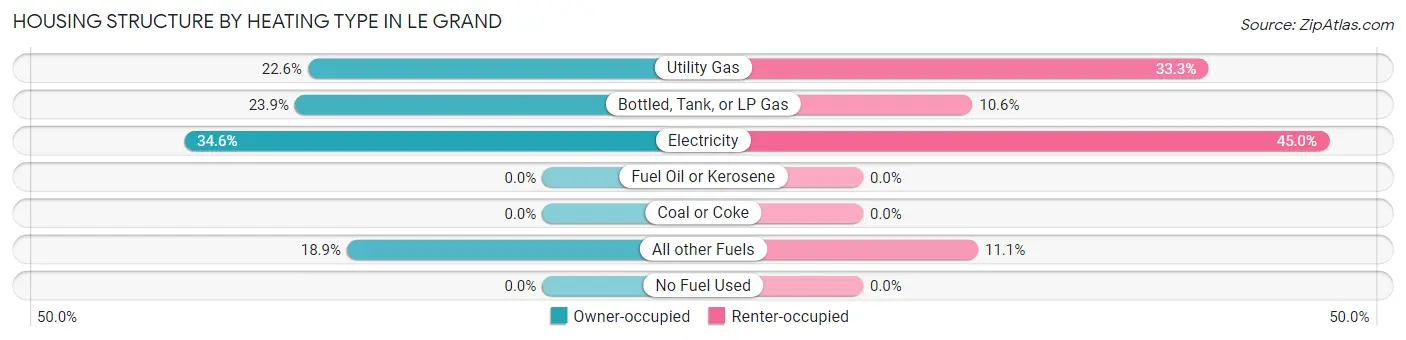
| Heating Type | Owner-occupied | Renter-occupied |
| Utility Gas | 72 (22.6%) | 60 (33.3%) |
| Bottled, Tank, or LP Gas | 76 (23.9%) | 19 (10.6%) |
| Electricity | 110 (34.6%) | 81 (45.0%) |
| Fuel Oil or Kerosene | 0 (0.0%) | 0 (0.0%) |
| Coal or Coke | 0 (0.0%) | 0 (0.0%) |
| All other Fuels | 60 (18.9%) | 20 (11.1%) |
| No Fuel Used | 0 (0.0%) | 0 (0.0%) |
| Total | 318 (100.0%) | 180 (100.0%) |
Household Vehicle Usage in Le Grand
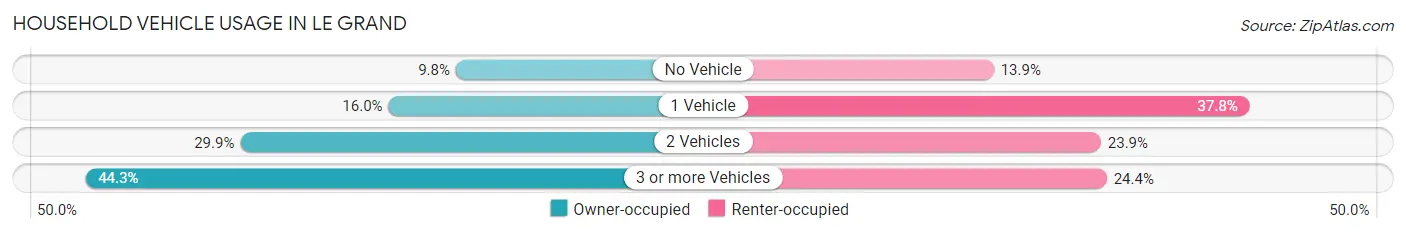
| Vehicles per Household | Owner-occupied | Renter-occupied |
| No Vehicle | 31 (9.8%) | 25 (13.9%) |
| 1 Vehicle | 51 (16.0%) | 68 (37.8%) |
| 2 Vehicles | 95 (29.9%) | 43 (23.9%) |
| 3 or more Vehicles | 141 (44.3%) | 44 (24.4%) |
| Total | 318 (100.0%) | 180 (100.0%) |
Real Estate & Mortgages in Le Grand
Real Estate and Mortgage Overview in Le Grand
| Characteristic | Without Mortgage | With Mortgage |
| Housing Units | 115 | 203 |
| Median Property Value | $226,800 | $246,200 |
| Median Household Income | $69,375 | $18 |
| Monthly Housing Costs | $405 | $0 |
| Real Estate Taxes | $859 | $0 |
Property Value by Mortgage Status in Le Grand
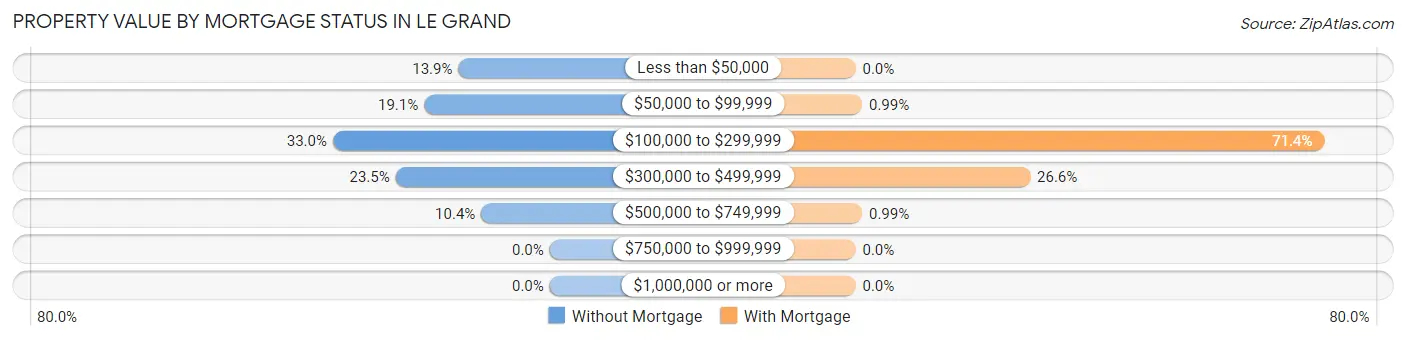
| Property Value | Without Mortgage | With Mortgage |
| Less than $50,000 | 16 (13.9%) | 0 (0.0%) |
| $50,000 to $99,999 | 22 (19.1%) | 2 (1.0%) |
| $100,000 to $299,999 | 38 (33.0%) | 145 (71.4%) |
| $300,000 to $499,999 | 27 (23.5%) | 54 (26.6%) |
| $500,000 to $749,999 | 12 (10.4%) | 2 (1.0%) |
| $750,000 to $999,999 | 0 (0.0%) | 0 (0.0%) |
| $1,000,000 or more | 0 (0.0%) | 0 (0.0%) |
| Total | 115 (100.0%) | 203 (100.0%) |
Household Income by Mortgage Status in Le Grand
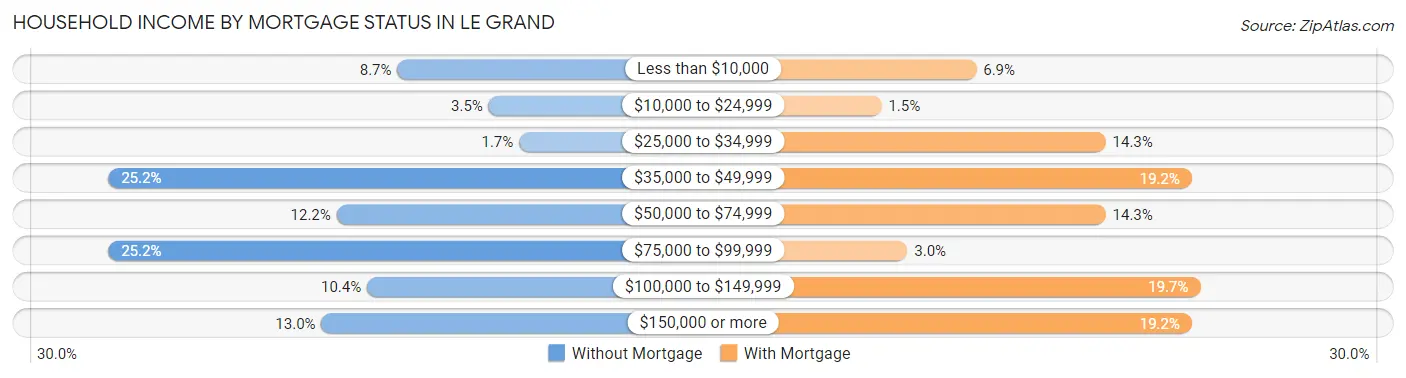
| Household Income | Without Mortgage | With Mortgage |
| Less than $10,000 | 10 (8.7%) | 14 (6.9%) |
| $10,000 to $24,999 | 4 (3.5%) | 3 (1.5%) |
| $25,000 to $34,999 | 2 (1.7%) | 29 (14.3%) |
| $35,000 to $49,999 | 29 (25.2%) | 39 (19.2%) |
| $50,000 to $74,999 | 14 (12.2%) | 29 (14.3%) |
| $75,000 to $99,999 | 29 (25.2%) | 6 (3.0%) |
| $100,000 to $149,999 | 12 (10.4%) | 40 (19.7%) |
| $150,000 or more | 15 (13.0%) | 39 (19.2%) |
| Total | 115 (100.0%) | 203 (100.0%) |
Property Value to Household Income Ratio in Le Grand
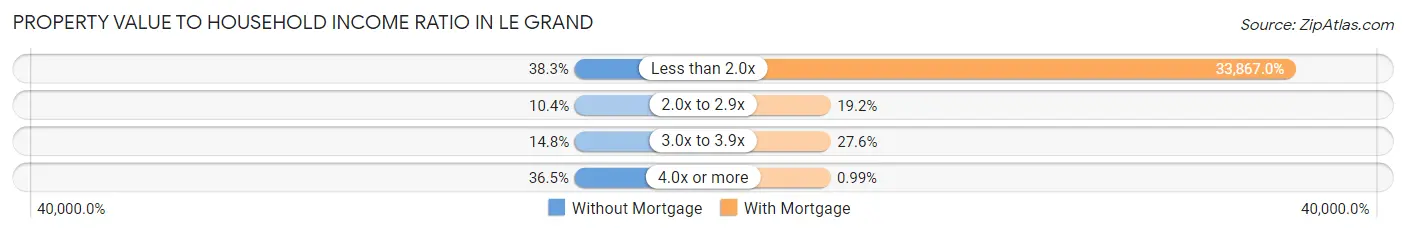
| Value-to-Income Ratio | Without Mortgage | With Mortgage |
| Less than 2.0x | 44 (38.3%) | 68,750 (33,867.0%) |
| 2.0x to 2.9x | 12 (10.4%) | 39 (19.2%) |
| 3.0x to 3.9x | 17 (14.8%) | 56 (27.6%) |
| 4.0x or more | 42 (36.5%) | 2 (1.0%) |
| Total | 115 (100.0%) | 203 (100.0%) |
Real Estate Taxes by Mortgage Status in Le Grand
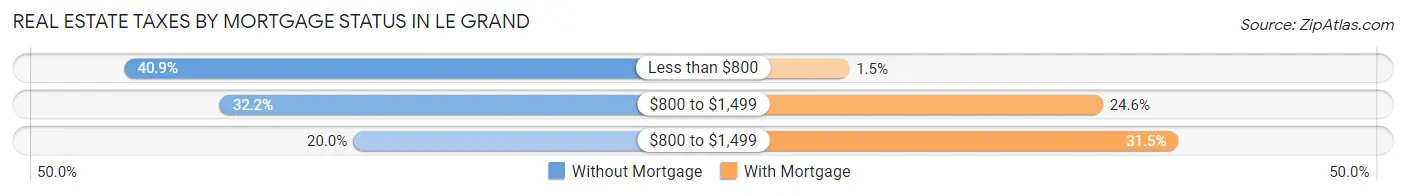
| Property Taxes | Without Mortgage | With Mortgage |
| Less than $800 | 47 (40.9%) | 3 (1.5%) |
| $800 to $1,499 | 37 (32.2%) | 50 (24.6%) |
| $800 to $1,499 | 23 (20.0%) | 64 (31.5%) |
| Total | 115 (100.0%) | 203 (100.0%) |
Health & Disability in Le Grand
Health Insurance Coverage by Age in Le Grand
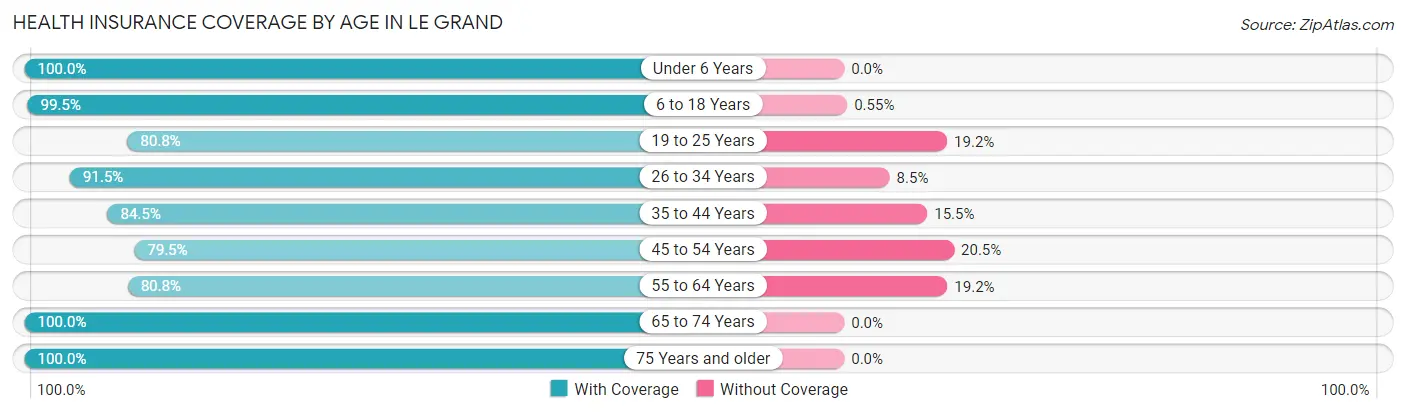
| Age Bracket | With Coverage | Without Coverage |
| Under 6 Years | 161 (100.0%) | 0 (0.0%) |
| 6 to 18 Years | 364 (99.5%) | 2 (0.5%) |
| 19 to 25 Years | 118 (80.8%) | 28 (19.2%) |
| 26 to 34 Years | 184 (91.5%) | 17 (8.5%) |
| 35 to 44 Years | 213 (84.5%) | 39 (15.5%) |
| 45 to 54 Years | 132 (79.5%) | 34 (20.5%) |
| 55 to 64 Years | 210 (80.8%) | 50 (19.2%) |
| 65 to 74 Years | 78 (100.0%) | 0 (0.0%) |
| 75 Years and older | 49 (100.0%) | 0 (0.0%) |
| Total | 1,509 (89.9%) | 170 (10.1%) |
Health Insurance Coverage by Citizenship Status in Le Grand
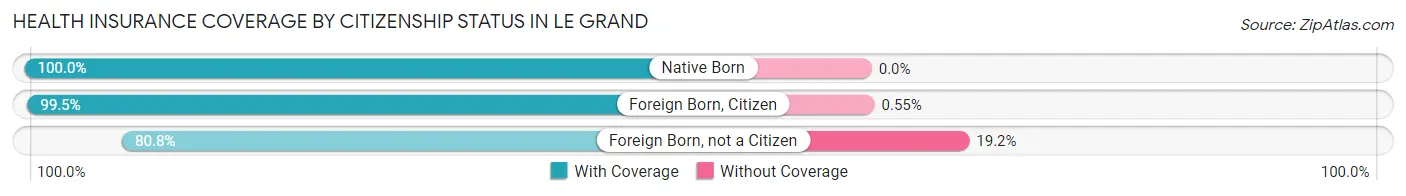
| Citizenship Status | With Coverage | Without Coverage |
| Native Born | 161 (100.0%) | 0 (0.0%) |
| Foreign Born, Citizen | 364 (99.5%) | 2 (0.5%) |
| Foreign Born, not a Citizen | 118 (80.8%) | 28 (19.2%) |
Health Insurance Coverage by Household Income in Le Grand
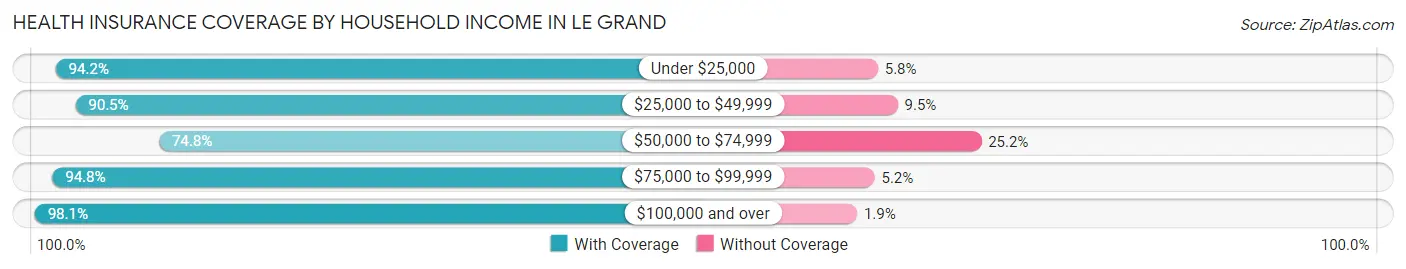
| Household Income | With Coverage | Without Coverage |
| Under $25,000 | 195 (94.2%) | 12 (5.8%) |
| $25,000 to $49,999 | 266 (90.5%) | 28 (9.5%) |
| $50,000 to $74,999 | 309 (74.8%) | 104 (25.2%) |
| $75,000 to $99,999 | 328 (94.8%) | 18 (5.2%) |
| $100,000 and over | 411 (98.1%) | 8 (1.9%) |
Public vs Private Health Insurance Coverage by Age in Le Grand
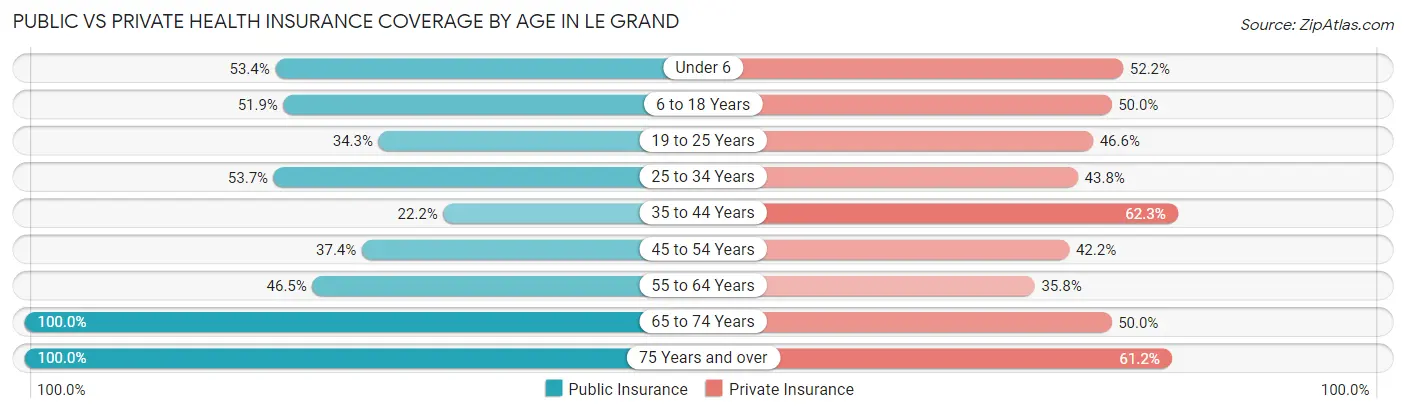
| Age Bracket | Public Insurance | Private Insurance |
| Under 6 | 86 (53.4%) | 84 (52.2%) |
| 6 to 18 Years | 190 (51.9%) | 183 (50.0%) |
| 19 to 25 Years | 50 (34.3%) | 68 (46.6%) |
| 25 to 34 Years | 108 (53.7%) | 88 (43.8%) |
| 35 to 44 Years | 56 (22.2%) | 157 (62.3%) |
| 45 to 54 Years | 62 (37.3%) | 70 (42.2%) |
| 55 to 64 Years | 121 (46.5%) | 93 (35.8%) |
| 65 to 74 Years | 78 (100.0%) | 39 (50.0%) |
| 75 Years and over | 49 (100.0%) | 30 (61.2%) |
| Total | 800 (47.6%) | 812 (48.4%) |
Disability Status by Sex by Age in Le Grand
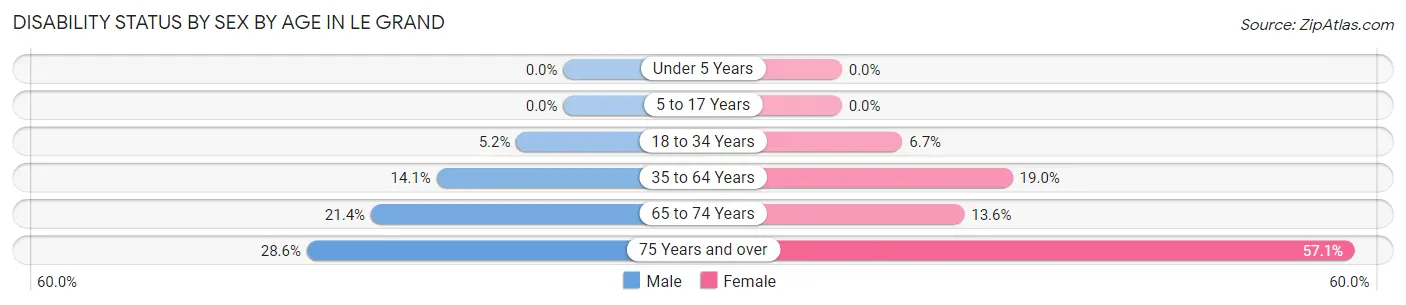
| Age Bracket | Male | Female |
| Under 5 Years | 0 (0.0%) | 0 (0.0%) |
| 5 to 17 Years | 0 (0.0%) | 0 (0.0%) |
| 18 to 34 Years | 10 (5.2%) | 13 (6.7%) |
| 35 to 64 Years | 46 (14.1%) | 67 (19.0%) |
| 65 to 74 Years | 12 (21.4%) | 3 (13.6%) |
| 75 Years and over | 6 (28.6%) | 16 (57.1%) |
Disability Class by Sex by Age in Le Grand
Disability Class: Hearing Difficulty
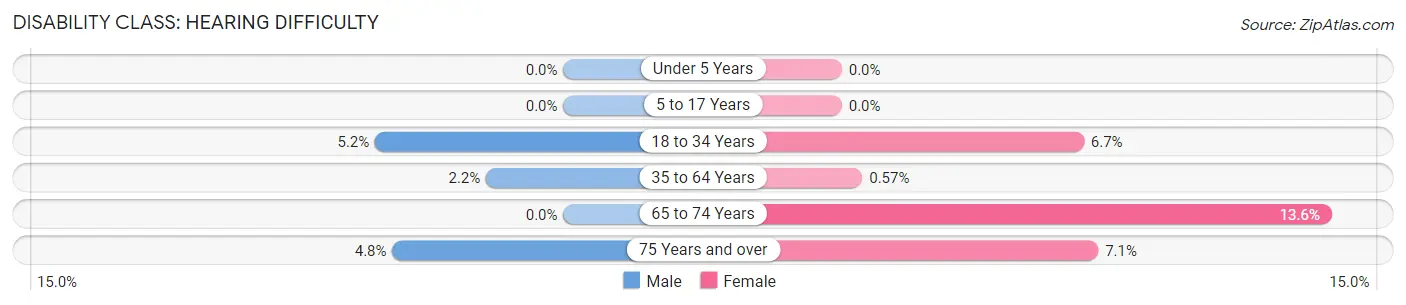
| Age Bracket | Male | Female |
| Under 5 Years | 0 (0.0%) | 0 (0.0%) |
| 5 to 17 Years | 0 (0.0%) | 0 (0.0%) |
| 18 to 34 Years | 10 (5.2%) | 13 (6.7%) |
| 35 to 64 Years | 7 (2.1%) | 2 (0.6%) |
| 65 to 74 Years | 0 (0.0%) | 3 (13.6%) |
| 75 Years and over | 1 (4.8%) | 2 (7.1%) |
Disability Class: Vision Difficulty
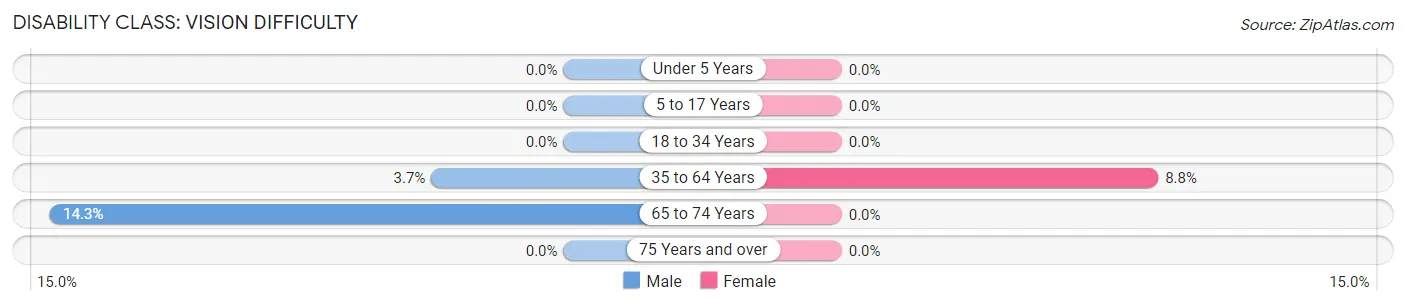
| Age Bracket | Male | Female |
| Under 5 Years | 0 (0.0%) | 0 (0.0%) |
| 5 to 17 Years | 0 (0.0%) | 0 (0.0%) |
| 18 to 34 Years | 0 (0.0%) | 0 (0.0%) |
| 35 to 64 Years | 12 (3.7%) | 31 (8.8%) |
| 65 to 74 Years | 8 (14.3%) | 0 (0.0%) |
| 75 Years and over | 0 (0.0%) | 0 (0.0%) |
Disability Class: Cognitive Difficulty
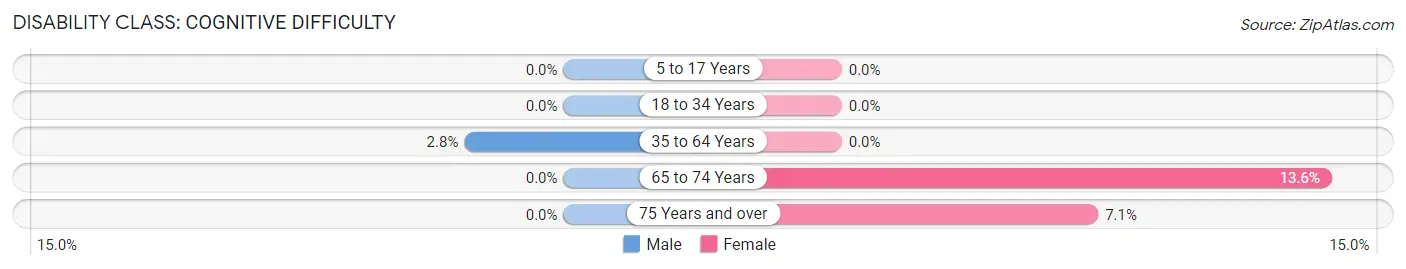
| Age Bracket | Male | Female |
| 5 to 17 Years | 0 (0.0%) | 0 (0.0%) |
| 18 to 34 Years | 0 (0.0%) | 0 (0.0%) |
| 35 to 64 Years | 9 (2.8%) | 0 (0.0%) |
| 65 to 74 Years | 0 (0.0%) | 3 (13.6%) |
| 75 Years and over | 0 (0.0%) | 2 (7.1%) |
Disability Class: Ambulatory Difficulty
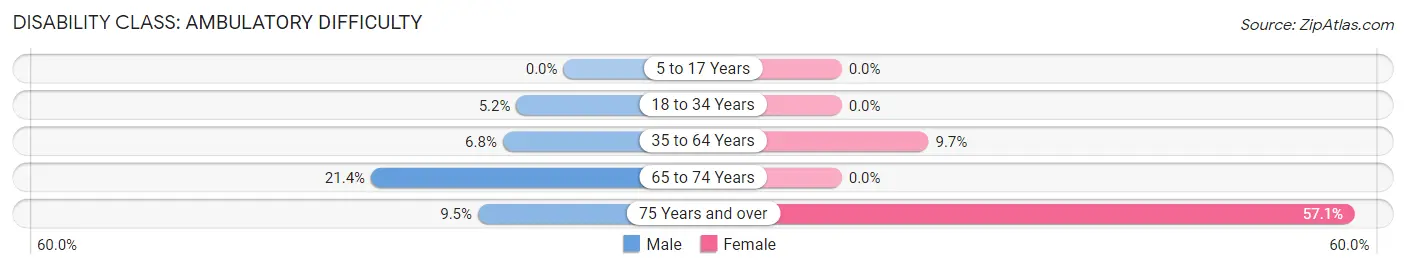
| Age Bracket | Male | Female |
| 5 to 17 Years | 0 (0.0%) | 0 (0.0%) |
| 18 to 34 Years | 10 (5.2%) | 0 (0.0%) |
| 35 to 64 Years | 22 (6.8%) | 34 (9.7%) |
| 65 to 74 Years | 12 (21.4%) | 0 (0.0%) |
| 75 Years and over | 2 (9.5%) | 16 (57.1%) |
Disability Class: Self-Care Difficulty
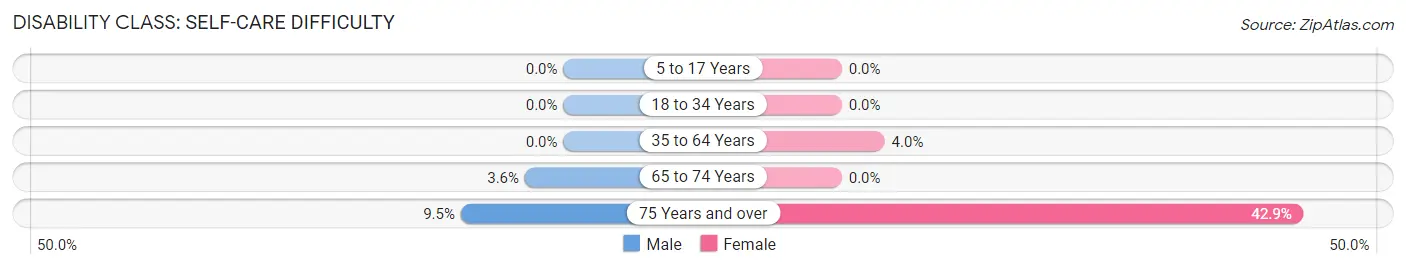
| Age Bracket | Male | Female |
| 5 to 17 Years | 0 (0.0%) | 0 (0.0%) |
| 18 to 34 Years | 0 (0.0%) | 0 (0.0%) |
| 35 to 64 Years | 0 (0.0%) | 14 (4.0%) |
| 65 to 74 Years | 2 (3.6%) | 0 (0.0%) |
| 75 Years and over | 2 (9.5%) | 12 (42.9%) |
Technology Access in Le Grand
Computing Device Access in Le Grand
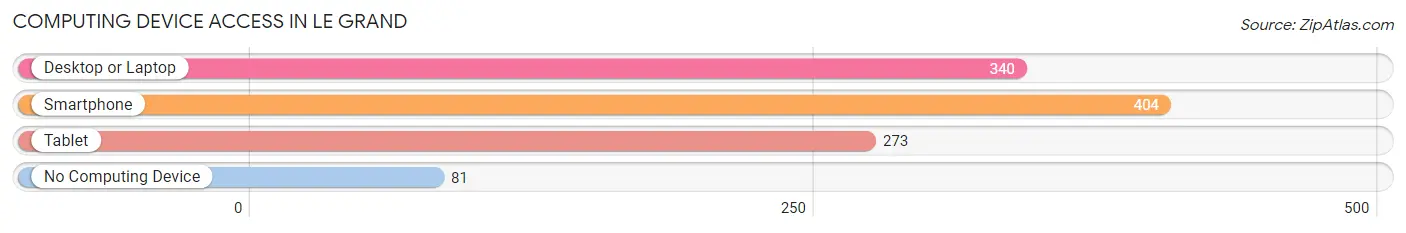
| Device Type | # Households | % Households |
| Desktop or Laptop | 340 | 68.3% |
| Smartphone | 404 | 81.1% |
| Tablet | 273 | 54.8% |
| No Computing Device | 81 | 16.3% |
| Total | 498 | 100.0% |
Internet Access in Le Grand
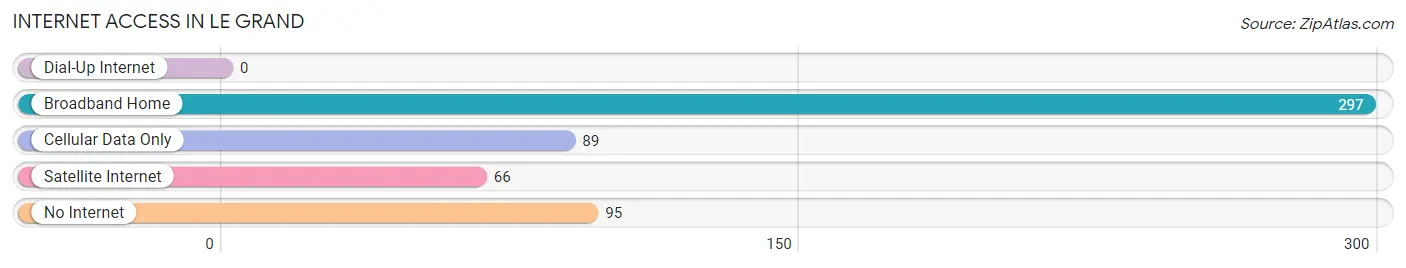
| Internet Type | # Households | % Households |
| Dial-Up Internet | 0 | 0.0% |
| Broadband Home | 297 | 59.6% |
| Cellular Data Only | 89 | 17.9% |
| Satellite Internet | 66 | 13.3% |
| No Internet | 95 | 19.1% |
| Total | 498 | 100.0% |
Le Grand Summary
History
Le Grand is a small unincorporated community located in Merced County, California. It is situated in the San Joaquin Valley, approximately 8 miles east of Merced. The area was first settled in the late 1800s by a group of Basque sheepherders. The town was officially founded in 1891 and was named after the nearby Grand Island.
The town was initially a farming community, with the main crops being wheat, barley, and alfalfa. In the early 1900s, the town began to grow as a result of the construction of the Southern Pacific Railroad. This allowed for the transportation of goods and people to and from the area.
In the 1920s, the town began to experience a population boom as a result of the oil boom in the area. This led to the construction of several oil wells and refineries in the area. The town also experienced a surge in population due to the influx of workers from the nearby cities of Merced and Los Banos.
In the 1950s, the town began to experience a decline in population as a result of the decline in the oil industry. This led to the closure of several of the oil wells and refineries in the area. The town also experienced a decline in population due to the construction of the nearby Interstate 5.
Geography
Le Grand is located in the San Joaquin Valley, approximately 8 miles east of Merced. The town is situated on the banks of the Merced River, which flows through the area. The town is surrounded by rolling hills and is located at an elevation of approximately 200 feet.
The climate in Le Grand is generally warm and dry, with temperatures ranging from the mid-50s in the winter to the mid-90s in the summer. The area receives an average of 10 inches of rain per year.
Economy
The economy of Le Grand is largely based on agriculture. The main crops grown in the area are wheat, barley, and alfalfa. The town also has a small manufacturing sector, with several small businesses located in the area.
The town also has a small tourism industry, with several local attractions such as the Grand Island Wildlife Refuge and the Merced River.
Demographics
As of the 2010 census, the population of Le Grand was 1,845. The racial makeup of the town was 75.3% White, 0.7% African American, 0.7% Native American, 0.7% Asian, 0.2% Pacific Islander, and 21.7% from other races. The median household income in the town was $37,500.
Le Grand is served by the Merced County Unified School District. The town has one elementary school, one middle school, and one high school. The town also has a small library and a post office.
Common Questions
What is Per Capita Income in Le Grand?
Per Capita income in Le Grand is $21,505.
What is the Median Family Income in Le Grand?
Median Family Income in Le Grand is $65,750.
What is the Median Household income in Le Grand?
Median Household Income in Le Grand is $56,563.
What is Income or Wage Gap in Le Grand?
Income or Wage Gap in Le Grand is 30.6%.
Women in Le Grand earn 69.4 cents for every dollar earned by a man.
What is Inequality or Gini Index in Le Grand?
Inequality or Gini Index in Le Grand is 0.40.
What is the Total Population of Le Grand?
Total Population of Le Grand is 1,679.
What is the Total Male Population of Le Grand?
Total Male Population of Le Grand is 924.
What is the Total Female Population of Le Grand?
Total Female Population of Le Grand is 755.
What is the Ratio of Males per 100 Females in Le Grand?
There are 122.38 Males per 100 Females in Le Grand.
What is the Ratio of Females per 100 Males in Le Grand?
There are 81.71 Females per 100 Males in Le Grand.
What is the Median Population Age in Le Grand?
Median Population Age in Le Grand is 32.2 Years.
What is the Average Family Size in Le Grand
Average Family Size in Le Grand is 3.8 People.
What is the Average Household Size in Le Grand
Average Household Size in Le Grand is 3.4 People.
How Large is the Labor Force in Le Grand?
There are 742 People in the Labor Forcein in Le Grand.
What is the Percentage of People in the Labor Force in Le Grand?
61.1% of People are in the Labor Force in Le Grand.
What is the Unemployment Rate in Le Grand?
Unemployment Rate in Le Grand is 10.5%.