Lamont, CA Map & Demographics
Lamont Map
Lamont Overview
$13,737
PER CAPITA INCOME
$36,566
AVG FAMILY INCOME
$37,164
AVG HOUSEHOLD INCOME
31.4%
WAGE / INCOME GAP [ % ]
68.6¢/ $1
WAGE / INCOME GAP [ $ ]
0.40
INEQUALITY / GINI INDEX
13,715
TOTAL POPULATION
7,171
MALE POPULATION
6,544
FEMALE POPULATION
109.58
MALES / 100 FEMALES
91.26
FEMALES / 100 MALES
30.4
MEDIAN AGE
4.0
AVG FAMILY SIZE
3.8
AVG HOUSEHOLD SIZE
5,497
LABOR FORCE [ PEOPLE ]
57.3%
PERCENT IN LABOR FORCE
9.5%
UNEMPLOYMENT RATE
Lamont Zip Codes
Lamont Area Codes
Income in Lamont
Income Overview in Lamont
Per Capita Income in Lamont is $13,737, while median incomes of families and households are $36,566 and $37,164 respectively.
| Characteristic | Number | Measure |
| Per Capita Income | 13,715 | $13,737 |
| Median Family Income | 3,206 | $36,566 |
| Mean Family Income | 3,206 | $48,171 |
| Median Household Income | 3,612 | $37,164 |
| Mean Household Income | 3,612 | $47,807 |
| Income Deficit | 3,206 | $0 |
| Wage / Income Gap (%) | 13,715 | 31.45% |
| Wage / Income Gap ($) | 13,715 | 68.55¢ per $1 |
| Gini / Inequality Index | 13,715 | 0.40 |
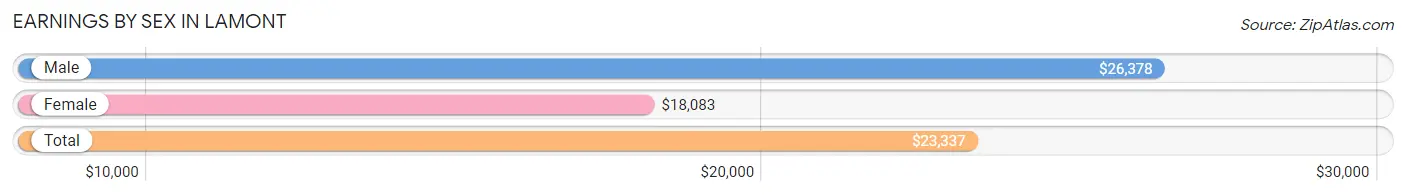
Earnings by Sex in Lamont
Average Earnings in Lamont are $23,337, $26,378 for men and $18,083 for women, a difference of 31.5%.
| Sex | Number | Average Earnings |
| Male | 3,409 (61.8%) | $26,378 |
| Female | 2,111 (38.2%) | $18,083 |
| Total | 5,520 (100.0%) | $23,337 |
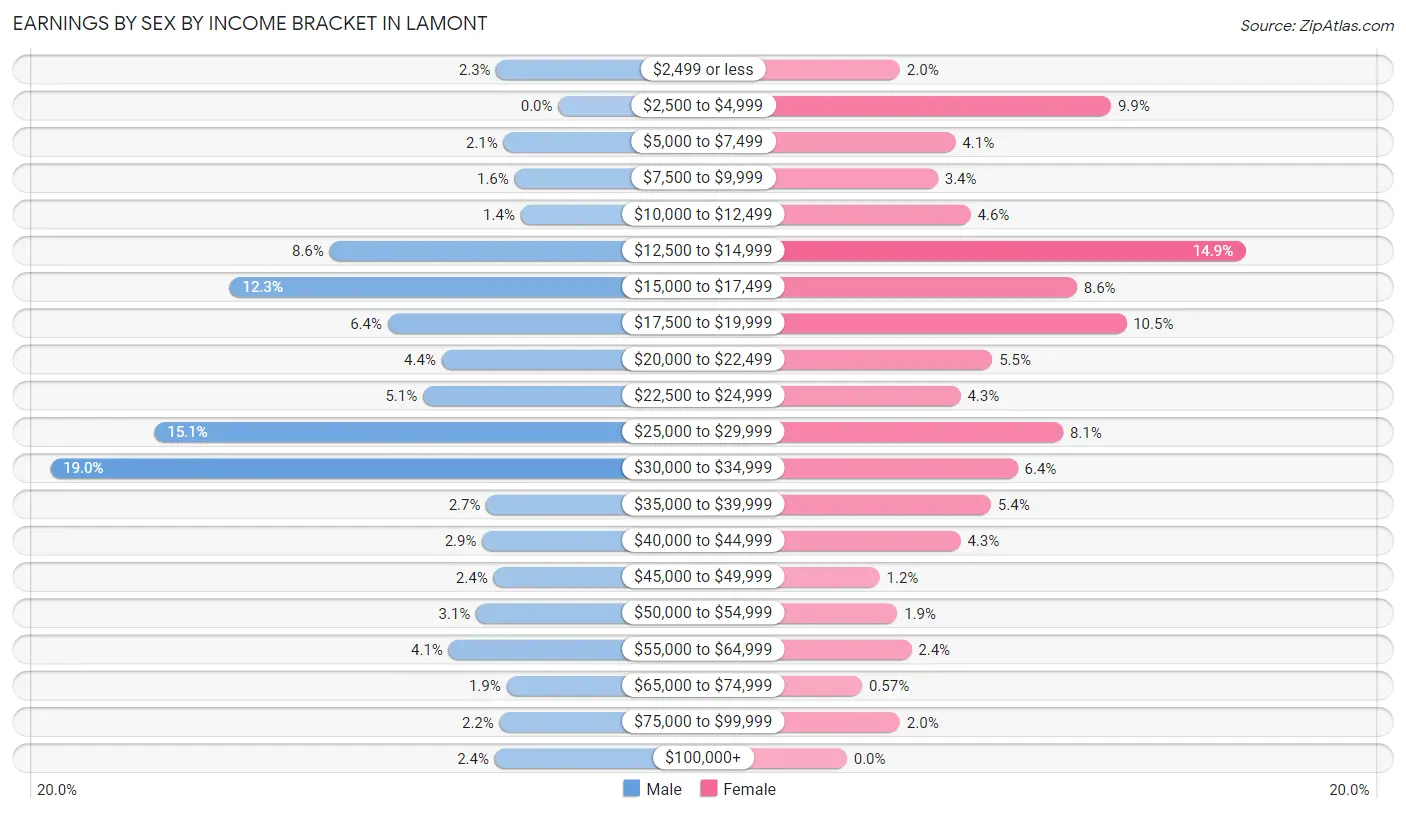
Earnings by Sex by Income Bracket in Lamont
The most common earnings brackets in Lamont are $30,000 to $34,999 for men (649 | 19.0%) and $12,500 to $14,999 for women (315 | 14.9%).
| Income | Male | Female |
| $2,499 or less | 79 (2.3%) | 42 (2.0%) |
| $2,500 to $4,999 | 0 (0.0%) | 209 (9.9%) |
| $5,000 to $7,499 | 70 (2.1%) | 86 (4.1%) |
| $7,500 to $9,999 | 56 (1.6%) | 72 (3.4%) |
| $10,000 to $12,499 | 48 (1.4%) | 98 (4.6%) |
| $12,500 to $14,999 | 292 (8.6%) | 315 (14.9%) |
| $15,000 to $17,499 | 420 (12.3%) | 182 (8.6%) |
| $17,500 to $19,999 | 218 (6.4%) | 221 (10.5%) |
| $20,000 to $22,499 | 149 (4.4%) | 115 (5.4%) |
| $22,500 to $24,999 | 173 (5.1%) | 90 (4.3%) |
| $25,000 to $29,999 | 516 (15.1%) | 171 (8.1%) |
| $30,000 to $34,999 | 649 (19.0%) | 135 (6.4%) |
| $35,000 to $39,999 | 92 (2.7%) | 114 (5.4%) |
| $40,000 to $44,999 | 97 (2.9%) | 90 (4.3%) |
| $45,000 to $49,999 | 83 (2.4%) | 26 (1.2%) |
| $50,000 to $54,999 | 105 (3.1%) | 40 (1.9%) |
| $55,000 to $64,999 | 140 (4.1%) | 51 (2.4%) |
| $65,000 to $74,999 | 66 (1.9%) | 12 (0.6%) |
| $75,000 to $99,999 | 75 (2.2%) | 42 (2.0%) |
| $100,000+ | 81 (2.4%) | 0 (0.0%) |
| Total | 3,409 (100.0%) | 2,111 (100.0%) |
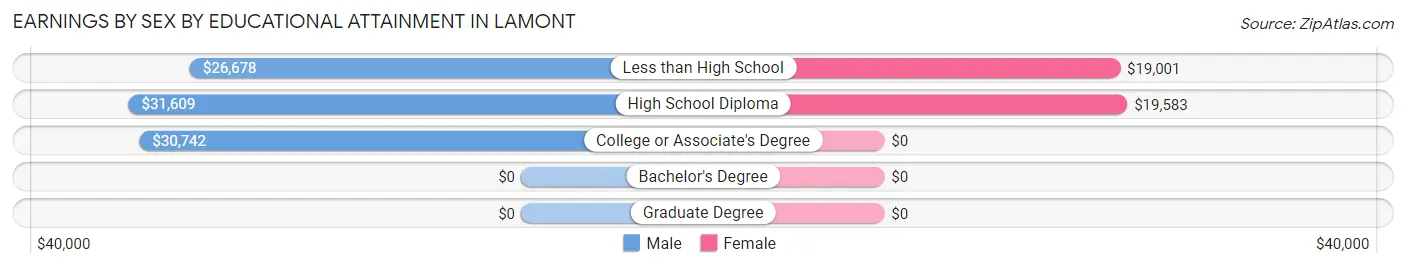
Earnings by Sex by Educational Attainment in Lamont
Average earnings in Lamont are $28,722 for men and $19,146 for women, a difference of 33.3%. Men with an educational attainment of high school diploma enjoy the highest average annual earnings of $31,609, while those with less than high school education earn the least with $26,678. Women with an educational attainment of high school diploma earn the most with the average annual earnings of $19,583, while those with less than high school education have the smallest earnings of $19,001.
| Educational Attainment | Male Income | Female Income |
| Less than High School | $26,678 | $19,001 |
| High School Diploma | $31,609 | $19,583 |
| College or Associate's Degree | $30,742 | $0 |
| Bachelor's Degree | - | - |
| Graduate Degree | - | - |
| Total | $28,722 | $19,146 |
Family Income in Lamont
Family Income Brackets in Lamont
According to the Lamont family income data, there are 657 families falling into the $50,000 to $74,999 income range, which is the most common income bracket and makes up 20.5% of all families. Conversely, the $200,000+ income bracket is the least frequent group with only 22 families (0.7%) belonging to this category.
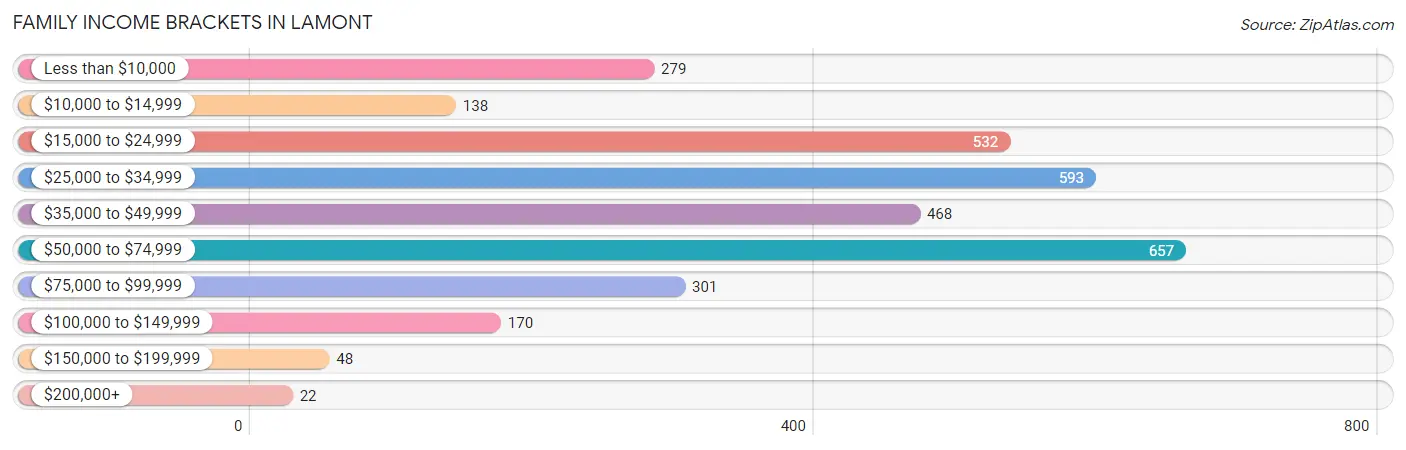
| Income Bracket | # Families | % Families |
| Less than $10,000 | 279 | 8.7% |
| $10,000 to $14,999 | 138 | 4.3% |
| $15,000 to $24,999 | 532 | 16.6% |
| $25,000 to $34,999 | 593 | 18.5% |
| $35,000 to $49,999 | 468 | 14.6% |
| $50,000 to $74,999 | 657 | 20.5% |
| $75,000 to $99,999 | 301 | 9.4% |
| $100,000 to $149,999 | 170 | 5.3% |
| $150,000 to $199,999 | 48 | 1.5% |
| $200,000+ | 22 | 0.7% |
Family Income by Famaliy Size in Lamont
7+ person families (191 | 6.0%) account for the highest median family income in Lamont with $72,042 per family, while 4-person families (657 | 20.5%) have the highest median income of $15,145 per family member.
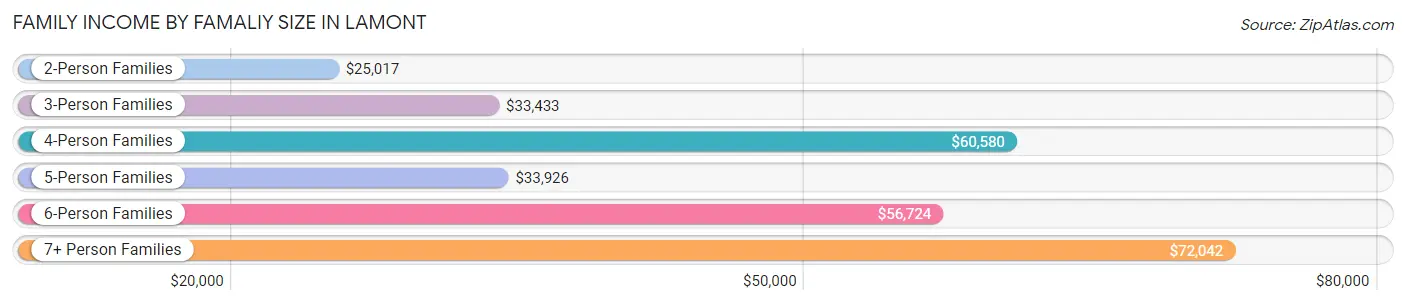
| Income Bracket | # Families | Median Income |
| 2-Person Families | 849 (26.5%) | $25,017 |
| 3-Person Families | 834 (26.0%) | $33,433 |
| 4-Person Families | 657 (20.5%) | $60,580 |
| 5-Person Families | 479 (14.9%) | $33,926 |
| 6-Person Families | 196 (6.1%) | $56,724 |
| 7+ Person Families | 191 (6.0%) | $72,042 |
| Total | 3,206 (100.0%) | $36,566 |
Family Income by Number of Earners in Lamont
The median family income in Lamont is $36,566, with families comprising 3+ earners (600) having the highest median family income of $74,301, while families with no earners (636) have the lowest median family income of $16,123, accounting for 18.7% and 19.8% of families, respectively.
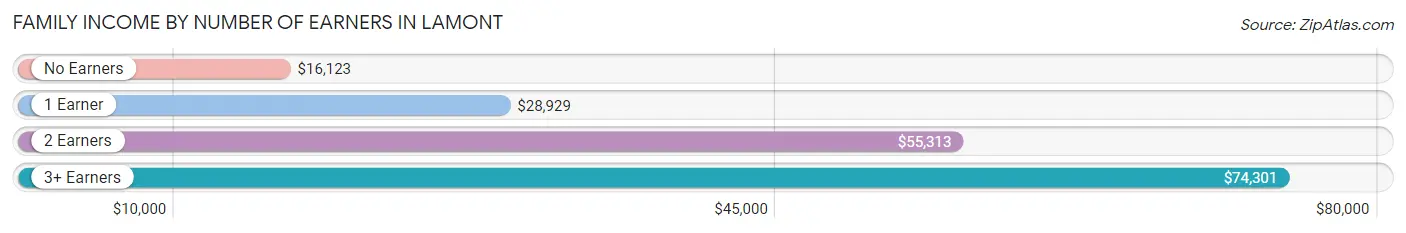
| Number of Earners | # Families | Median Income |
| No Earners | 636 (19.8%) | $16,123 |
| 1 Earner | 1,296 (40.4%) | $28,929 |
| 2 Earners | 674 (21.0%) | $55,313 |
| 3+ Earners | 600 (18.7%) | $74,301 |
| Total | 3,206 (100.0%) | $36,566 |
Household Income in Lamont
Household Income Brackets in Lamont
With 740 households falling in the category, the $50,000 to $74,999 income range is the most frequent in Lamont, accounting for 20.5% of all households. In contrast, only 22 households (0.6%) fall into the $200,000+ income bracket, making it the least populous group.
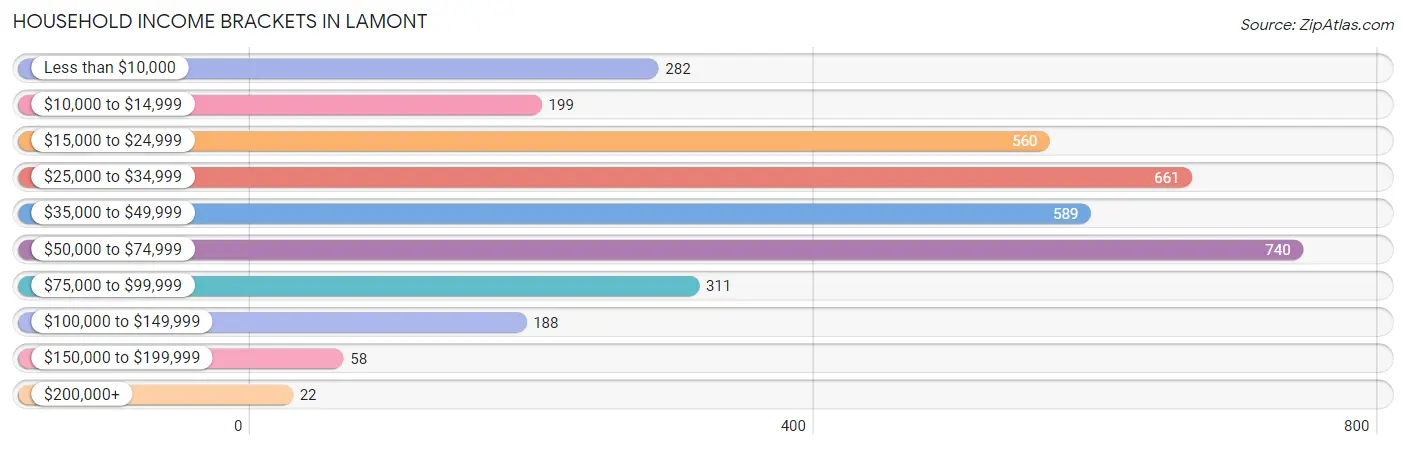
| Income Bracket | # Households | % Households |
| Less than $10,000 | 282 | 7.8% |
| $10,000 to $14,999 | 199 | 5.5% |
| $15,000 to $24,999 | 560 | 15.5% |
| $25,000 to $34,999 | 661 | 18.3% |
| $35,000 to $49,999 | 589 | 16.3% |
| $50,000 to $74,999 | 740 | 20.5% |
| $75,000 to $99,999 | 311 | 8.6% |
| $100,000 to $149,999 | 188 | 5.2% |
| $150,000 to $199,999 | 58 | 1.6% |
| $200,000+ | 22 | 0.6% |
Household Income by Householder Age in Lamont
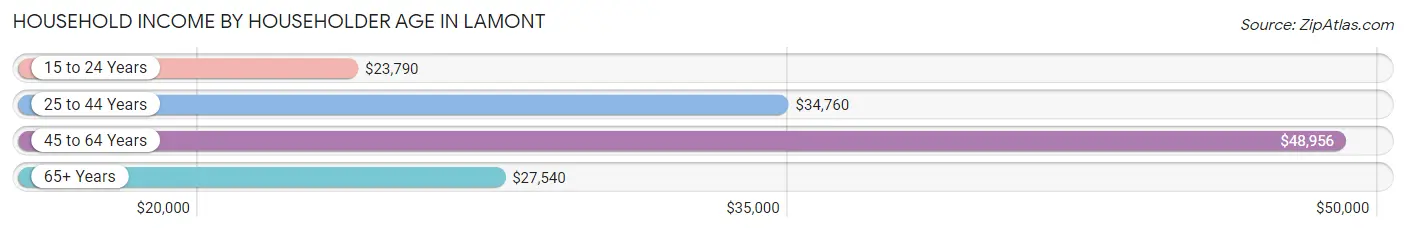
The median household income in Lamont is $37,164, with the highest median household income of $48,956 found in the 45 to 64 years age bracket for the primary householder. A total of 1,529 households (42.3%) fall into this category. Meanwhile, the 15 to 24 years age bracket for the primary householder has the lowest median household income of $23,790, with 221 households (6.1%) in this group.
| Income Bracket | # Households | Median Income |
| 15 to 24 Years | 221 (6.1%) | $23,790 |
| 25 to 44 Years | 1,199 (33.2%) | $34,760 |
| 45 to 64 Years | 1,529 (42.3%) | $48,956 |
| 65+ Years | 663 (18.4%) | $27,540 |
| Total | 3,612 (100.0%) | $37,164 |
Poverty in Lamont
Income Below Poverty by Sex and Age in Lamont
With 29.2% poverty level for males and 35.8% for females among the residents of Lamont, 16 and 17 year old males and 6 to 11 year old females are the most vulnerable to poverty, with 185 males (79.7%) and 422 females (51.3%) in their respective age groups living below the poverty level.
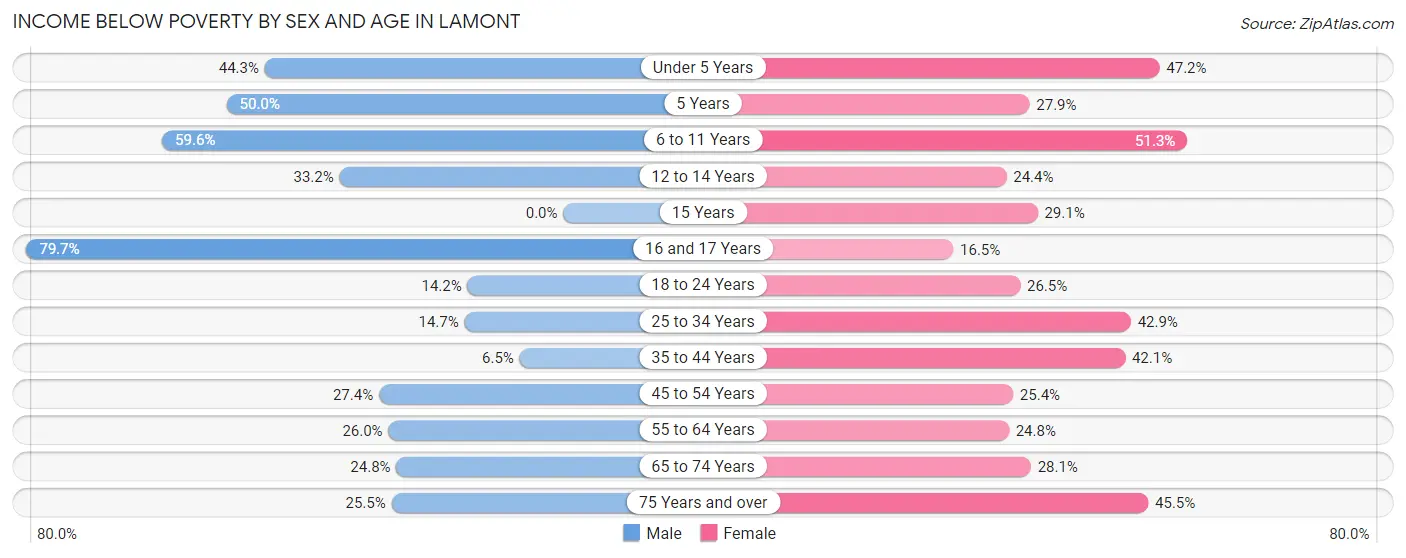
| Age Bracket | Male | Female |
| Under 5 Years | 270 (44.3%) | 241 (47.2%) |
| 5 Years | 44 (50.0%) | 44 (27.9%) |
| 6 to 11 Years | 576 (59.6%) | 422 (51.3%) |
| 12 to 14 Years | 104 (33.2%) | 95 (24.4%) |
| 15 Years | 0 (0.0%) | 34 (29.1%) |
| 16 and 17 Years | 185 (79.7%) | 20 (16.5%) |
| 18 to 24 Years | 145 (14.2%) | 202 (26.5%) |
| 25 to 34 Years | 81 (14.7%) | 387 (42.9%) |
| 35 to 44 Years | 59 (6.5%) | 336 (42.0%) |
| 45 to 54 Years | 224 (27.4%) | 140 (25.4%) |
| 55 to 64 Years | 247 (26.0%) | 173 (24.8%) |
| 65 to 74 Years | 116 (24.8%) | 122 (28.1%) |
| 75 Years and over | 25 (25.5%) | 126 (45.5%) |
| Total | 2,076 (29.2%) | 2,342 (35.8%) |
Income Above Poverty by Sex and Age in Lamont
According to the poverty statistics in Lamont, males aged 15 years and females aged 16 and 17 years are the age groups that are most secure financially, with 100.0% of males and 83.5% of females in these age groups living above the poverty line.
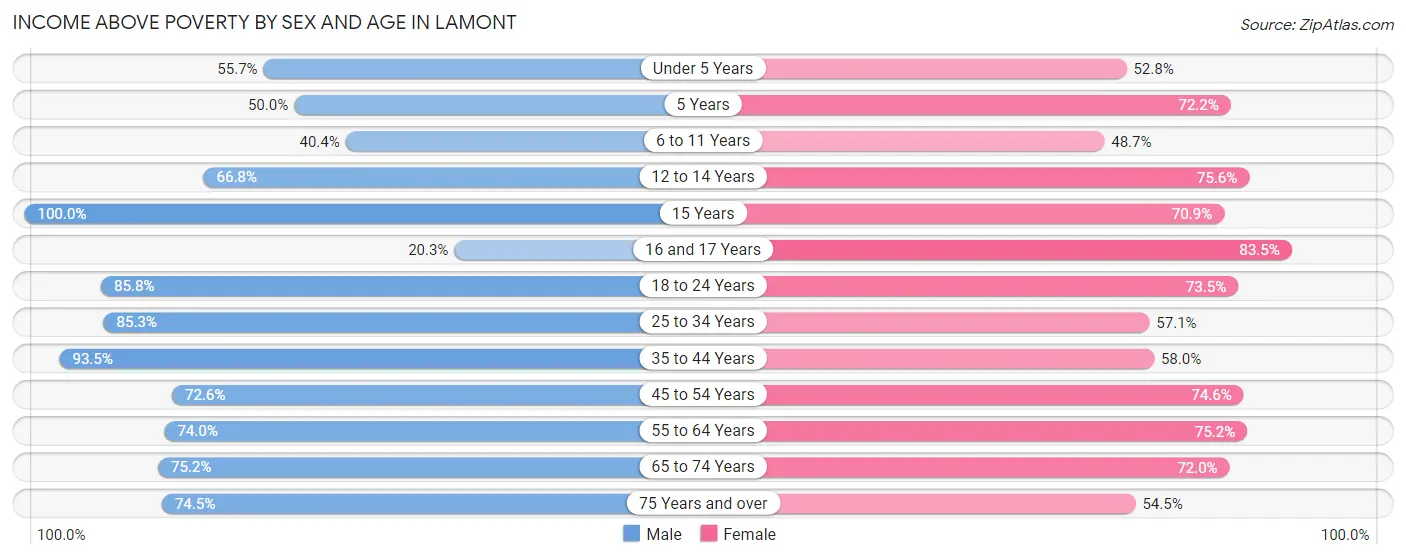
| Age Bracket | Male | Female |
| Under 5 Years | 339 (55.7%) | 270 (52.8%) |
| 5 Years | 44 (50.0%) | 114 (72.2%) |
| 6 to 11 Years | 391 (40.4%) | 401 (48.7%) |
| 12 to 14 Years | 209 (66.8%) | 294 (75.6%) |
| 15 Years | 73 (100.0%) | 83 (70.9%) |
| 16 and 17 Years | 47 (20.3%) | 101 (83.5%) |
| 18 to 24 Years | 875 (85.8%) | 561 (73.5%) |
| 25 to 34 Years | 471 (85.3%) | 515 (57.1%) |
| 35 to 44 Years | 850 (93.5%) | 463 (58.0%) |
| 45 to 54 Years | 594 (72.6%) | 411 (74.6%) |
| 55 to 64 Years | 704 (74.0%) | 525 (75.2%) |
| 65 to 74 Years | 352 (75.2%) | 313 (72.0%) |
| 75 Years and over | 73 (74.5%) | 151 (54.5%) |
| Total | 5,022 (70.8%) | 4,202 (64.2%) |
Income Below Poverty Among Married-Couple Families in Lamont
The poverty statistics for married-couple families in Lamont show that 28.0% or 564 of the total 2,015 families live below the poverty line. Families with 3 or 4 children have the highest poverty rate of 39.0%, comprising of 170 families. On the other hand, families with no children have the lowest poverty rate of 18.9%, which includes 165 families.
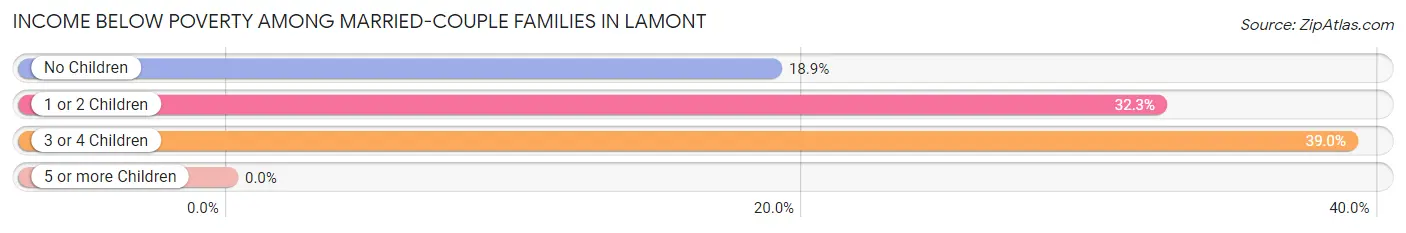
| Children | Above Poverty | Below Poverty |
| No Children | 706 (81.1%) | 165 (18.9%) |
| 1 or 2 Children | 479 (67.7%) | 229 (32.3%) |
| 3 or 4 Children | 266 (61.0%) | 170 (39.0%) |
| 5 or more Children | 0 (0.0%) | 0 (0.0%) |
| Total | 1,451 (72.0%) | 564 (28.0%) |
Income Below Poverty Among Single-Parent Households in Lamont
According to the poverty data in Lamont, 4.1% or 13 single-father households and 52.2% or 457 single-mother households are living below the poverty line. Among single-father households, those with 5 or more children have the highest poverty rate, with 13 households (52.0%) experiencing poverty. Likewise, among single-mother households, those with 5 or more children have the highest poverty rate, with 9 households (100.0%) falling below the poverty line.
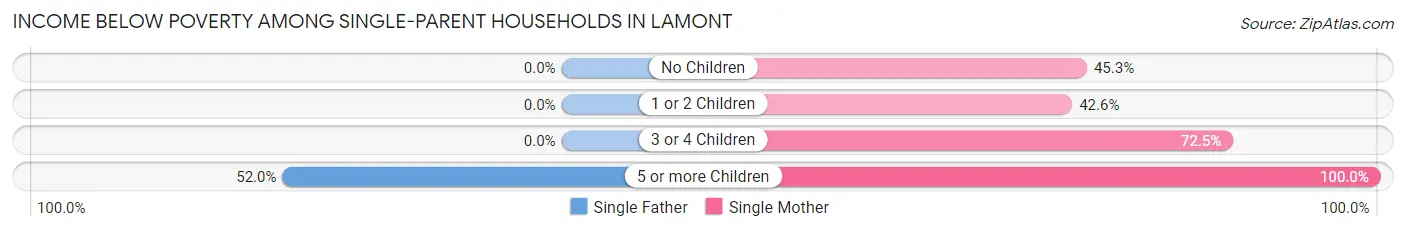
| Children | Single Father | Single Mother |
| No Children | 0 (0.0%) | 150 (45.3%) |
| 1 or 2 Children | 0 (0.0%) | 129 (42.6%) |
| 3 or 4 Children | 0 (0.0%) | 169 (72.5%) |
| 5 or more Children | 13 (52.0%) | 9 (100.0%) |
| Total | 13 (4.1%) | 457 (52.2%) |
Income Below Poverty Among Married-Couple vs Single-Parent Households in Lamont
The poverty data for Lamont shows that 564 of the married-couple family households (28.0%) and 470 of the single-parent households (39.5%) are living below the poverty level. Within the married-couple family households, those with 3 or 4 children have the highest poverty rate, with 170 households (39.0%) falling below the poverty line. Among the single-parent households, those with 3 or 4 children have the highest poverty rate, with 169 household (65.8%) living below poverty.
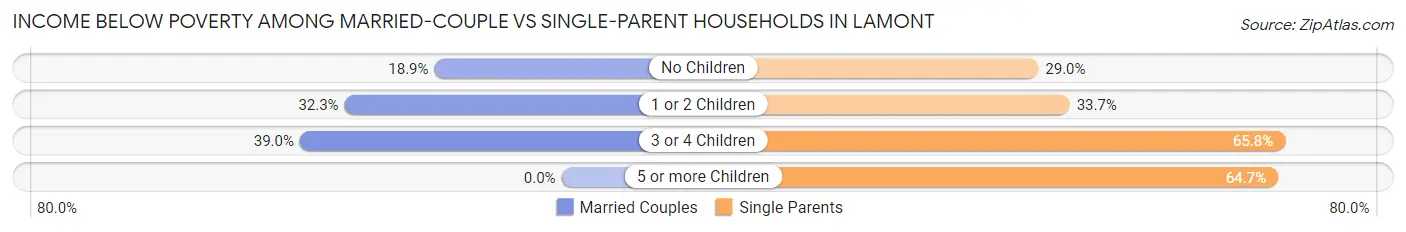
| Children | Married-Couple Families | Single-Parent Households |
| No Children | 165 (18.9%) | 150 (29.0%) |
| 1 or 2 Children | 229 (32.3%) | 129 (33.7%) |
| 3 or 4 Children | 170 (39.0%) | 169 (65.8%) |
| 5 or more Children | 0 (0.0%) | 22 (64.7%) |
| Total | 564 (28.0%) | 470 (39.5%) |
Race in Lamont
The most populous races in Lamont are Hispanic or Latino (12,893 | 94.0%), White / Caucasian (8,542 | 62.3%), and Some other Race (3,000 | 21.9%).
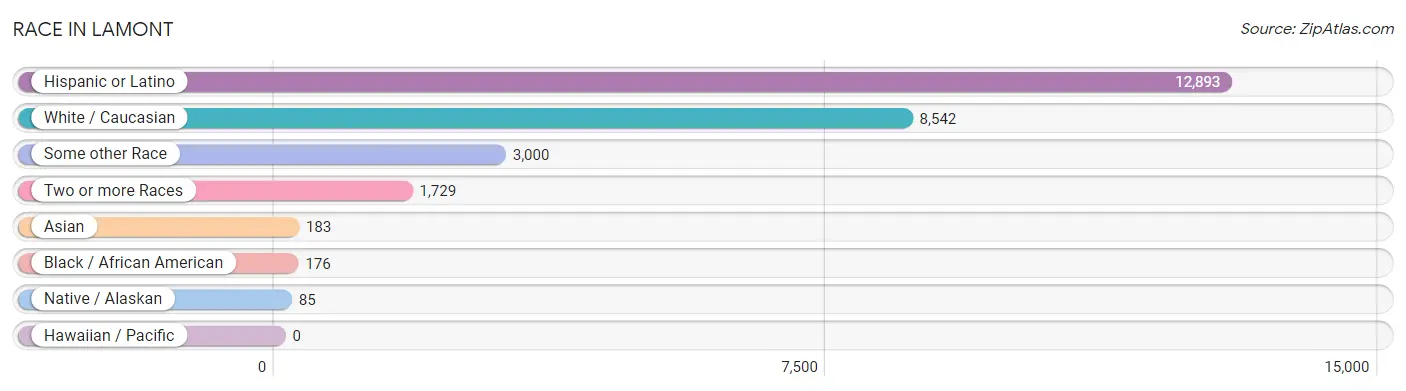
| Race | # Population | % Population |
| Asian | 183 | 1.3% |
| Black / African American | 176 | 1.3% |
| Hawaiian / Pacific | 0 | 0.0% |
| Hispanic or Latino | 12,893 | 94.0% |
| Native / Alaskan | 85 | 0.6% |
| White / Caucasian | 8,542 | 62.3% |
| Two or more Races | 1,729 | 12.6% |
| Some other Race | 3,000 | 21.9% |
| Total | 13,715 | 100.0% |
Ancestry in Lamont
The most populous ancestries reported in Lamont are Mexican (12,018 | 87.6%), Central American (353 | 2.6%), Korean (213 | 1.5%), Spaniard (151 | 1.1%), and Salvadoran (147 | 1.1%), together accounting for 93.9% of all Lamont residents.
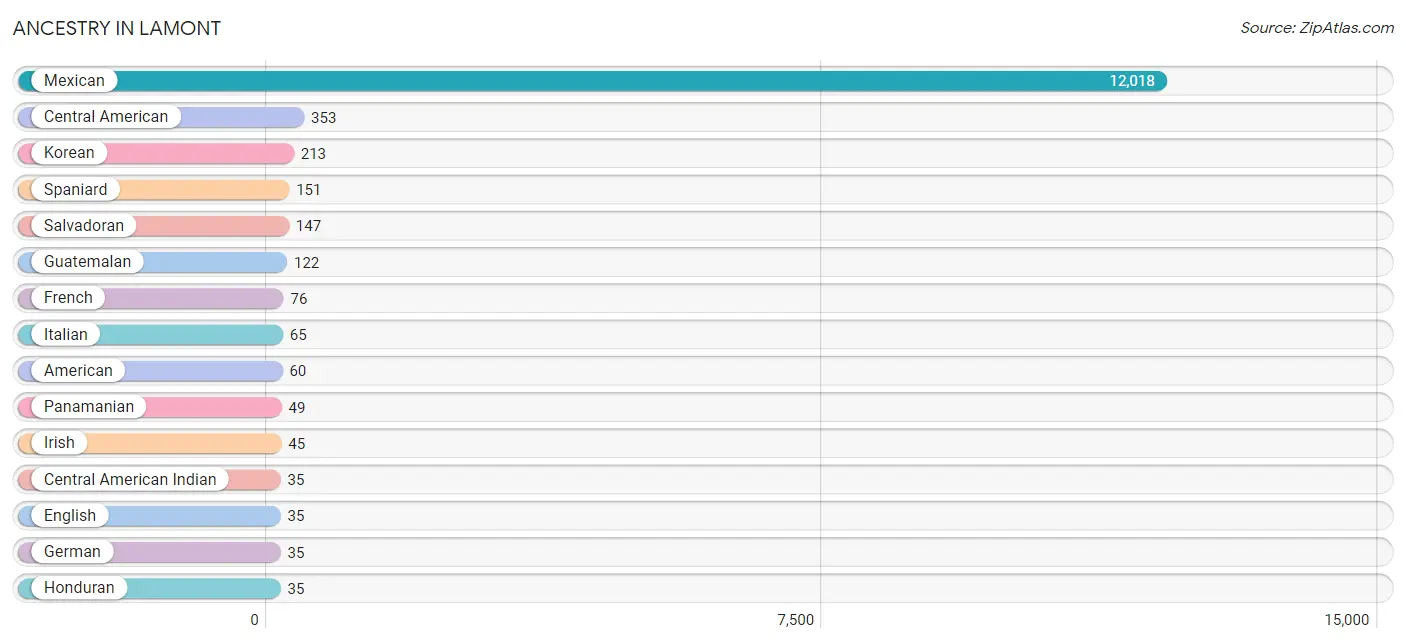
| Ancestry | # Population | % Population |
| American | 60 | 0.4% |
| Central American | 353 | 2.6% |
| Central American Indian | 35 | 0.3% |
| Cherokee | 25 | 0.2% |
| Czech | 5 | 0.0% |
| Danish | 21 | 0.2% |
| English | 35 | 0.3% |
| French | 76 | 0.5% |
| German | 35 | 0.3% |
| Guatemalan | 122 | 0.9% |
| Honduran | 35 | 0.3% |
| Indian (Asian) | 12 | 0.1% |
| Irish | 45 | 0.3% |
| Italian | 65 | 0.5% |
| Korean | 213 | 1.5% |
| Mexican | 12,018 | 87.6% |
| Mexican American Indian | 19 | 0.1% |
| Panamanian | 49 | 0.4% |
| Puerto Rican | 18 | 0.1% |
| Salvadoran | 147 | 1.1% |
| Spaniard | 151 | 1.1% | View All 21 Rows |
Immigrants in Lamont
The most numerous immigrant groups reported in Lamont came from Central America (5,532 | 40.3%), Latin America (5,532 | 40.3%), Mexico (5,280 | 38.5%), El Salvador (159 | 1.2%), and Guatemala (58 | 0.4%), together accounting for 120.8% of all Lamont residents.
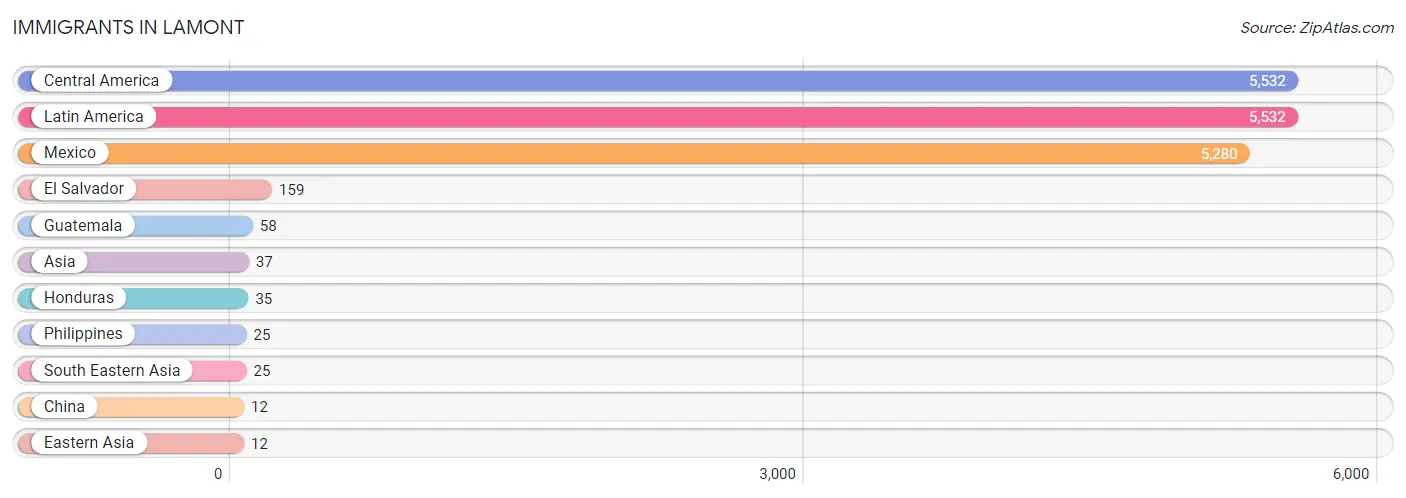
| Immigration Origin | # Population | % Population |
| Asia | 37 | 0.3% |
| Central America | 5,532 | 40.3% |
| China | 12 | 0.1% |
| Eastern Asia | 12 | 0.1% |
| El Salvador | 159 | 1.2% |
| Guatemala | 58 | 0.4% |
| Honduras | 35 | 0.3% |
| Latin America | 5,532 | 40.3% |
| Mexico | 5,280 | 38.5% |
| Philippines | 25 | 0.2% |
| South Eastern Asia | 25 | 0.2% | View All 11 Rows |
Sex and Age in Lamont
Sex and Age in Lamont
The most populous age groups in Lamont are 5 to 9 Years (719 | 10.0%) for men and 5 to 9 Years (695 | 10.6%) for women.
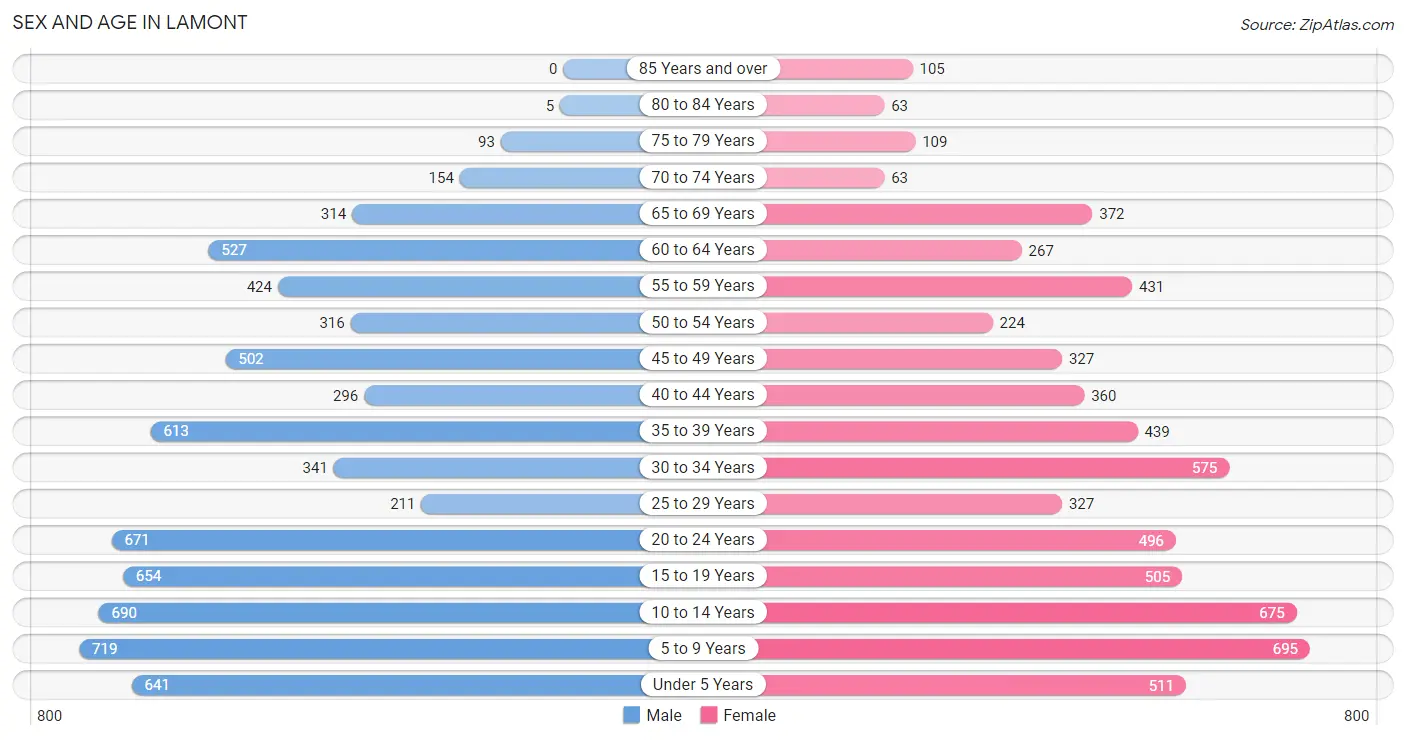
| Age Bracket | Male | Female |
| Under 5 Years | 641 (8.9%) | 511 (7.8%) |
| 5 to 9 Years | 719 (10.0%) | 695 (10.6%) |
| 10 to 14 Years | 690 (9.6%) | 675 (10.3%) |
| 15 to 19 Years | 654 (9.1%) | 505 (7.7%) |
| 20 to 24 Years | 671 (9.4%) | 496 (7.6%) |
| 25 to 29 Years | 211 (2.9%) | 327 (5.0%) |
| 30 to 34 Years | 341 (4.8%) | 575 (8.8%) |
| 35 to 39 Years | 613 (8.6%) | 439 (6.7%) |
| 40 to 44 Years | 296 (4.1%) | 360 (5.5%) |
| 45 to 49 Years | 502 (7.0%) | 327 (5.0%) |
| 50 to 54 Years | 316 (4.4%) | 224 (3.4%) |
| 55 to 59 Years | 424 (5.9%) | 431 (6.6%) |
| 60 to 64 Years | 527 (7.3%) | 267 (4.1%) |
| 65 to 69 Years | 314 (4.4%) | 372 (5.7%) |
| 70 to 74 Years | 154 (2.1%) | 63 (1.0%) |
| 75 to 79 Years | 93 (1.3%) | 109 (1.7%) |
| 80 to 84 Years | 5 (0.1%) | 63 (1.0%) |
| 85 Years and over | 0 (0.0%) | 105 (1.6%) |
| Total | 7,171 (100.0%) | 6,544 (100.0%) |
Families and Households in Lamont
Median Family Size in Lamont
The median family size in Lamont is 3.97 persons per family, with married-couple families (2,015 | 62.8%) accounting for the largest median family size of 4.05 persons per family. On the other hand, single male/father families (315 | 9.8%) represent the smallest median family size with 3.38 persons per family.
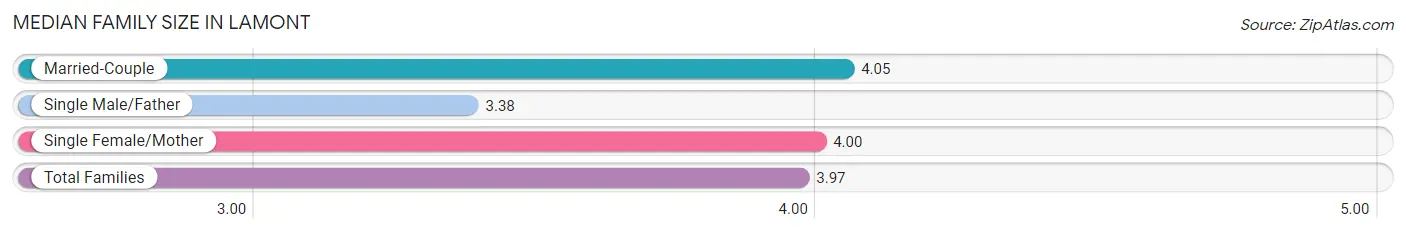
| Family Type | # Families | Family Size |
| Married-Couple | 2,015 (62.8%) | 4.05 |
| Single Male/Father | 315 (9.8%) | 3.38 |
| Single Female/Mother | 876 (27.3%) | 4.00 |
| Total Families | 3,206 (100.0%) | 3.97 |
Median Household Size in Lamont
The median household size in Lamont is 3.80 persons per household, with married-couple households (2,015 | 55.8%) accounting for the largest median household size of 4.12 persons per household. non-family households (406 | 11.2%) represent the smallest median household size with 1.73 persons per household.
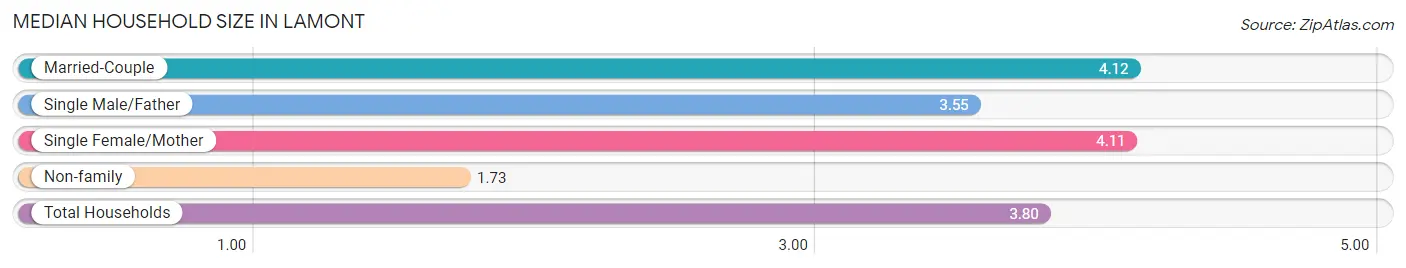
| Household Type | # Households | Household Size |
| Married-Couple | 2,015 (55.8%) | 4.12 |
| Single Male/Father | 315 (8.7%) | 3.55 |
| Single Female/Mother | 876 (24.2%) | 4.11 |
| Non-family | 406 (11.2%) | 1.73 |
| Total Households | 3,612 (100.0%) | 3.80 |
Household Size by Marriage Status in Lamont
Out of a total of 3,612 households in Lamont, 3,206 (88.8%) are family households, while 406 (11.2%) are nonfamily households. The most numerous type of family households are 3-person households, comprising 824, and the most common type of nonfamily households are 1-person households, comprising 292.
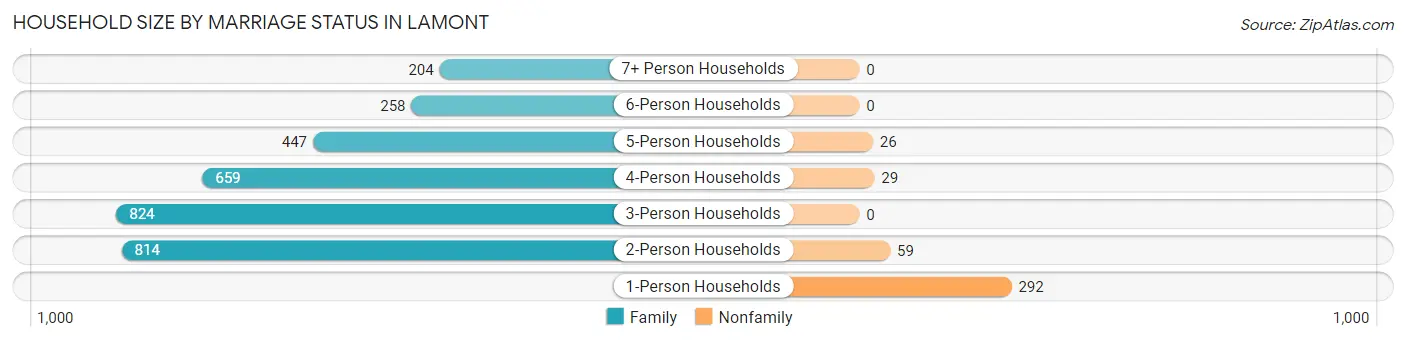
| Household Size | Family Households | Nonfamily Households |
| 1-Person Households | - | 292 (8.1%) |
| 2-Person Households | 814 (22.5%) | 59 (1.6%) |
| 3-Person Households | 824 (22.8%) | 0 (0.0%) |
| 4-Person Households | 659 (18.2%) | 29 (0.8%) |
| 5-Person Households | 447 (12.4%) | 26 (0.7%) |
| 6-Person Households | 258 (7.1%) | 0 (0.0%) |
| 7+ Person Households | 204 (5.7%) | 0 (0.0%) |
| Total | 3,206 (88.8%) | 406 (11.2%) |
Female Fertility in Lamont
Fertility by Age in Lamont
Average fertility rate in Lamont is 55.0 births per 1,000 women. Women in the age bracket of 20 to 34 years have the highest fertility rate with 75.0 births per 1,000 women. Women in the age bracket of 20 to 34 years acount for 62.9% of all women with births.
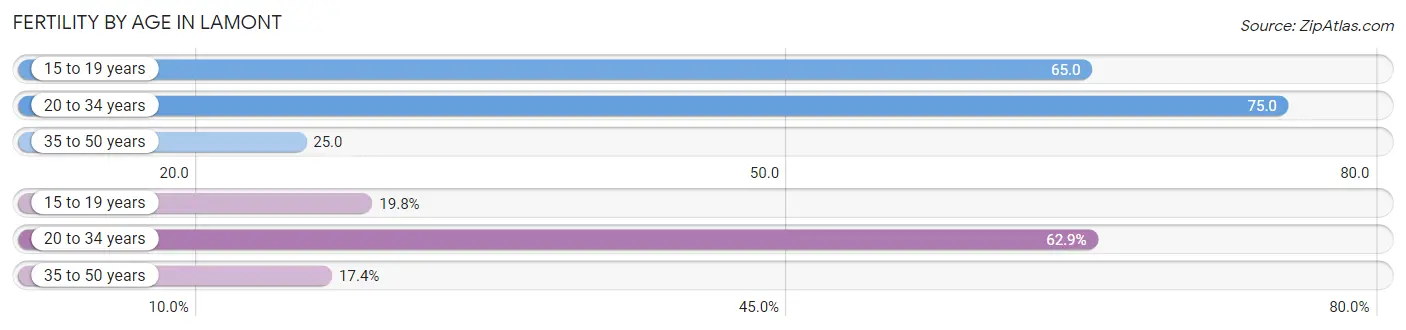
| Age Bracket | Women with Births | Births / 1,000 Women |
| 15 to 19 years | 33 (19.8%) | 65.0 |
| 20 to 34 years | 105 (62.9%) | 75.0 |
| 35 to 50 years | 29 (17.4%) | 25.0 |
| Total | 167 (100.0%) | 55.0 |
Fertility by Age by Marriage Status in Lamont
26.9% of women with births (167) in Lamont are married. The highest percentage of unmarried women with births falls into 15 to 19 years age bracket with 100.0% of them unmarried at the time of birth, while the lowest percentage of unmarried women with births belong to 20 to 34 years age bracket with 57.1% of them unmarried.
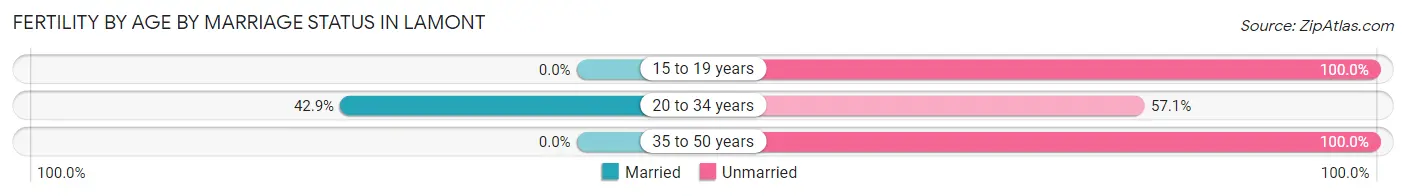
| Age Bracket | Married | Unmarried |
| 15 to 19 years | 0 (0.0%) | 33 (100.0%) |
| 20 to 34 years | 45 (42.9%) | 60 (57.1%) |
| 35 to 50 years | 0 (0.0%) | 29 (100.0%) |
| Total | 45 (27.0%) | 122 (73.1%) |
Fertility by Education in Lamont
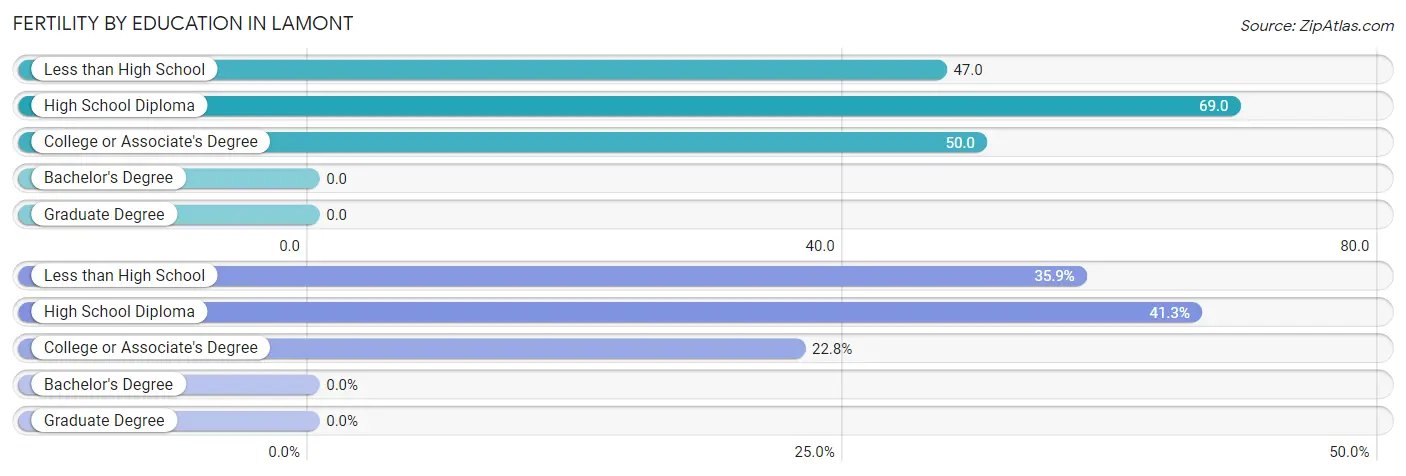
| Educational Attainment | Women with Births | Births / 1,000 Women |
| Less than High School | 60 (35.9%) | 47.0 |
| High School Diploma | 69 (41.3%) | 69.0 |
| College or Associate's Degree | 38 (22.8%) | 50.0 |
| Bachelor's Degree | 0 (0.0%) | 0.0 |
| Graduate Degree | 0 (0.0%) | 0.0 |
| Total | 167 (100.0%) | 55.0 |
Fertility by Education by Marriage Status in Lamont
73.1% of women with births in Lamont are unmarried. Women with the educational attainment of high school diploma are most likely to be married with 58.0% of them married at childbirth, while women with the educational attainment of less than high school are least likely to be married with 100.0% of them unmarried at childbirth.
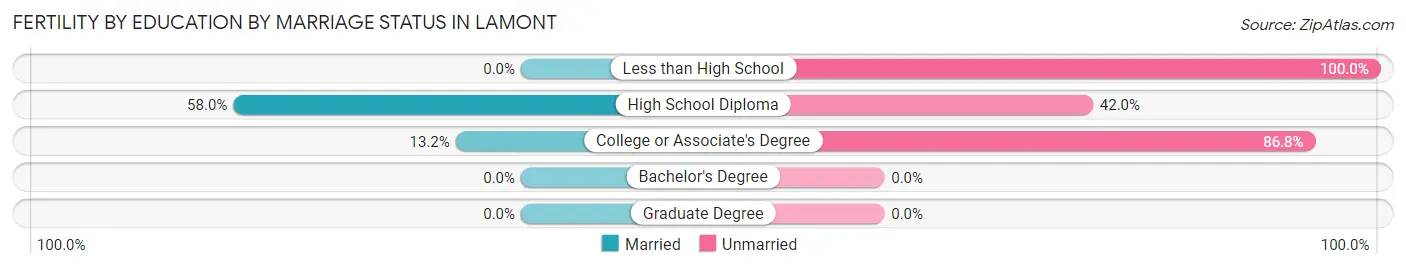
| Educational Attainment | Married | Unmarried |
| Less than High School | 0 (0.0%) | 60 (100.0%) |
| High School Diploma | 40 (58.0%) | 29 (42.0%) |
| College or Associate's Degree | 5 (13.2%) | 33 (86.8%) |
| Bachelor's Degree | 0 (0.0%) | 0 (0.0%) |
| Graduate Degree | 0 (0.0%) | 0 (0.0%) |
| Total | 45 (27.0%) | 122 (73.1%) |
Employment Characteristics in Lamont
Employment by Class of Employer in Lamont
Among the 4,946 employed individuals in Lamont, private company employees (4,047 | 81.8%), self-employed (not incorporated) (321 | 6.5%), and not-for-profit organizations (263 | 5.3%) make up the most common classes of employment.
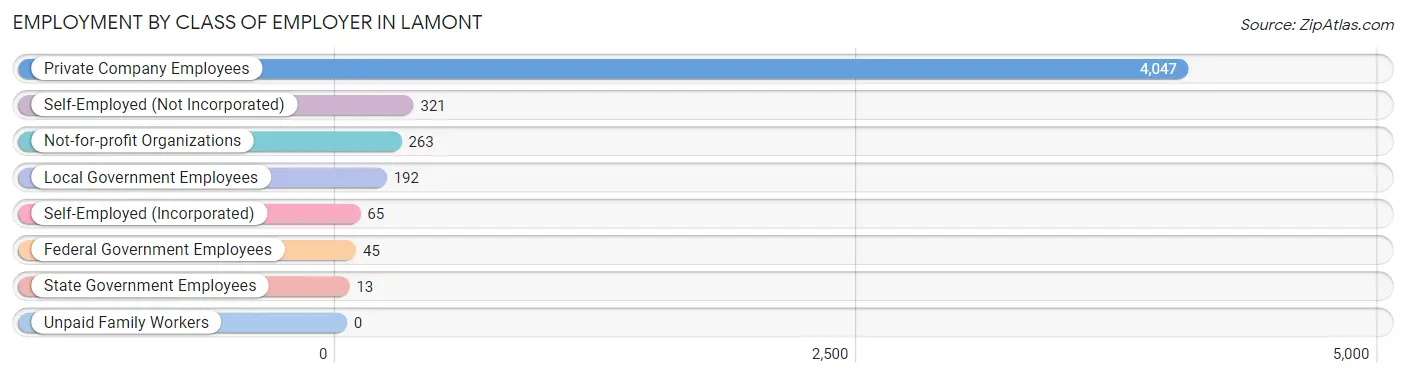
| Employer Class | # Employees | % Employees |
| Private Company Employees | 4,047 | 81.8% |
| Self-Employed (Incorporated) | 65 | 1.3% |
| Self-Employed (Not Incorporated) | 321 | 6.5% |
| Not-for-profit Organizations | 263 | 5.3% |
| Local Government Employees | 192 | 3.9% |
| State Government Employees | 13 | 0.3% |
| Federal Government Employees | 45 | 0.9% |
| Unpaid Family Workers | 0 | 0.0% |
| Total | 4,946 | 100.0% |
Employment Status by Age in Lamont
According to the labor force statistics for Lamont, out of the total population over 16 years of age (9,594), 57.3% or 5,497 individuals are in the labor force, with 9.5% or 522 of them unemployed. The age group with the highest labor force participation rate is 30 to 34 years, with 77.0% or 705 individuals in the labor force. Within the labor force, the 20 to 24 years age range has the highest percentage of unemployed individuals, with 25.1% or 206 of them being unemployed.
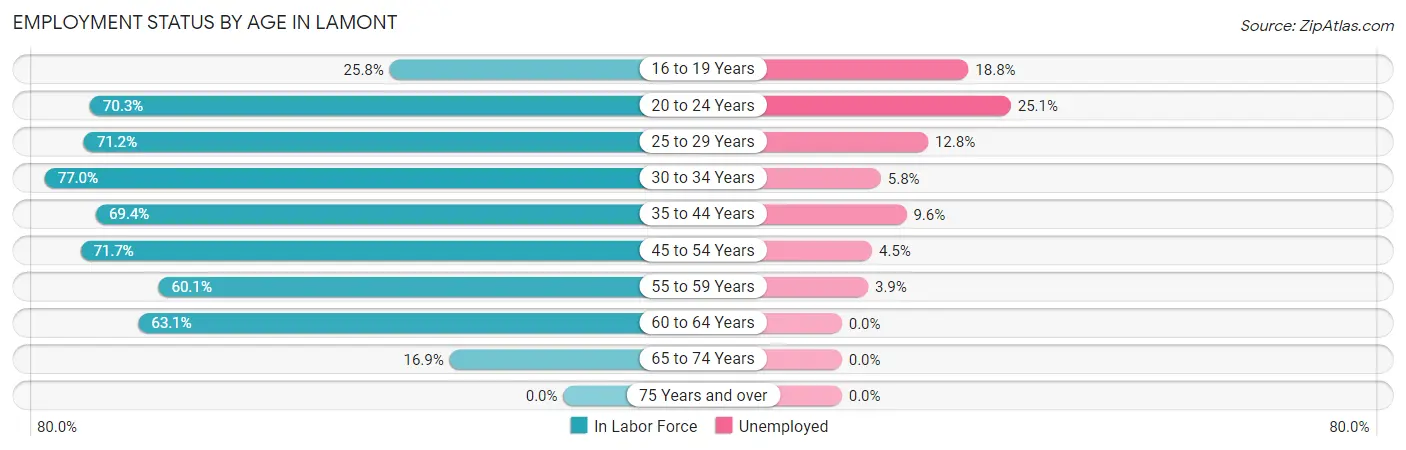
| Age Bracket | In Labor Force | Unemployed |
| 16 to 19 Years | 250 (25.8%) | 47 (18.8%) |
| 20 to 24 Years | 820 (70.3%) | 206 (25.1%) |
| 25 to 29 Years | 383 (71.2%) | 49 (12.8%) |
| 30 to 34 Years | 705 (77.0%) | 41 (5.8%) |
| 35 to 44 Years | 1,185 (69.4%) | 114 (9.6%) |
| 45 to 54 Years | 982 (71.7%) | 44 (4.5%) |
| 55 to 59 Years | 514 (60.1%) | 20 (3.9%) |
| 60 to 64 Years | 501 (63.1%) | 0 (0.0%) |
| 65 to 74 Years | 153 (16.9%) | 0 (0.0%) |
| 75 Years and over | 0 (0.0%) | 0 (0.0%) |
| Total | 5,497 (57.3%) | 522 (9.5%) |
Employment Status by Educational Attainment in Lamont
According to labor force statistics for Lamont, 69.1% of individuals (4,270) out of the total population between 25 and 64 years of age (6,180) are in the labor force, with 6.3% or 269 of them being unemployed. The group with the highest labor force participation rate are those with the educational attainment of college / associate degree, with 83.8% or 749 individuals in the labor force. Within the labor force, individuals with college / associate degree education have the highest percentage of unemployment, with 16.3% or 122 of them being unemployed.
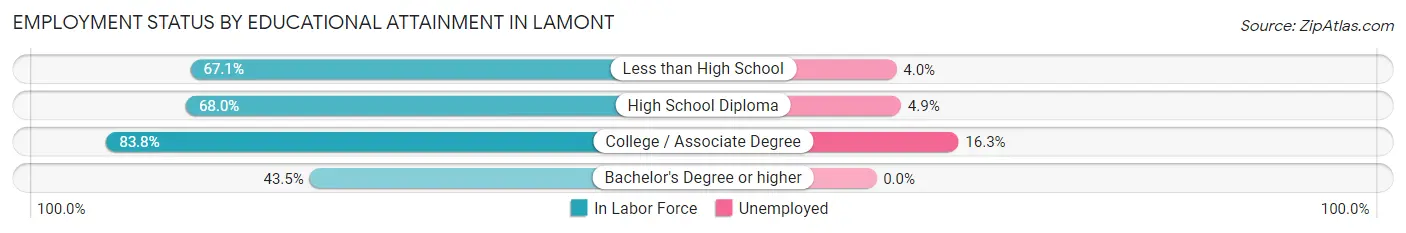
| Educational Attainment | In Labor Force | Unemployed |
| Less than High School | 2,397 (67.1%) | 143 (4.0%) |
| High School Diploma | 1,044 (68.0%) | 75 (4.9%) |
| College / Associate Degree | 749 (83.8%) | 146 (16.3%) |
| Bachelor's Degree or higher | 77 (43.5%) | 0 (0.0%) |
| Total | 4,270 (69.1%) | 389 (6.3%) |
Employment Occupations by Sex in Lamont
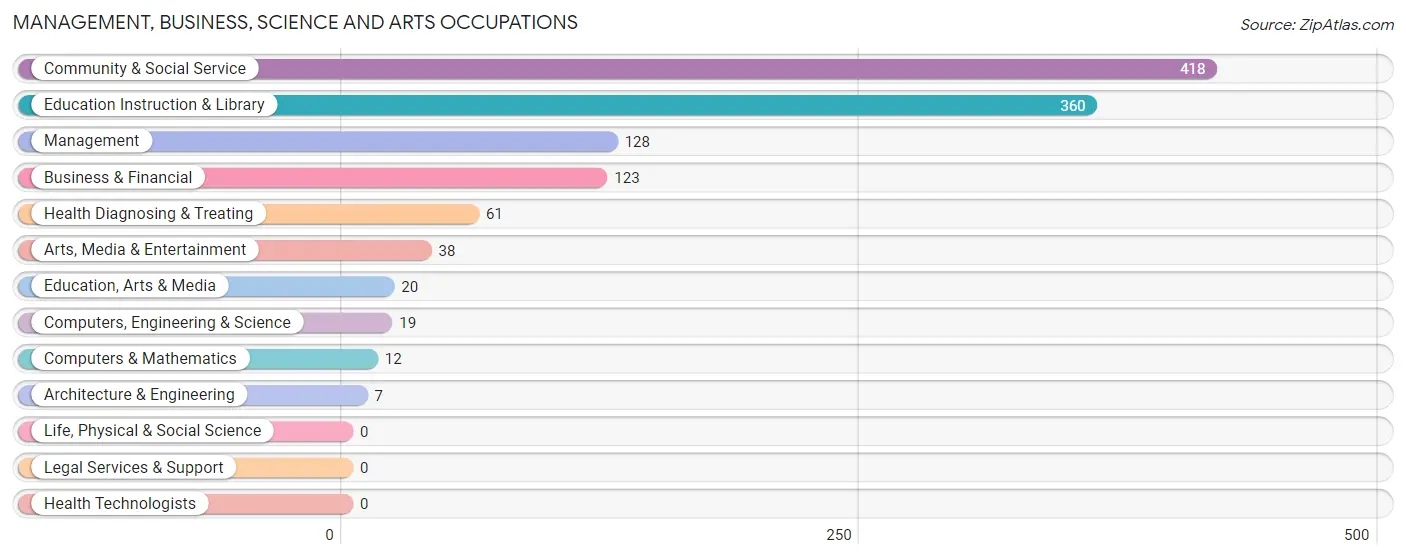
Management, Business, Science and Arts Occupations
The most common Management, Business, Science and Arts occupations in Lamont are Community & Social Service (418 | 8.4%), Education Instruction & Library (360 | 7.2%), Management (128 | 2.6%), Business & Financial (123 | 2.5%), and Health Diagnosing & Treating (61 | 1.2%).
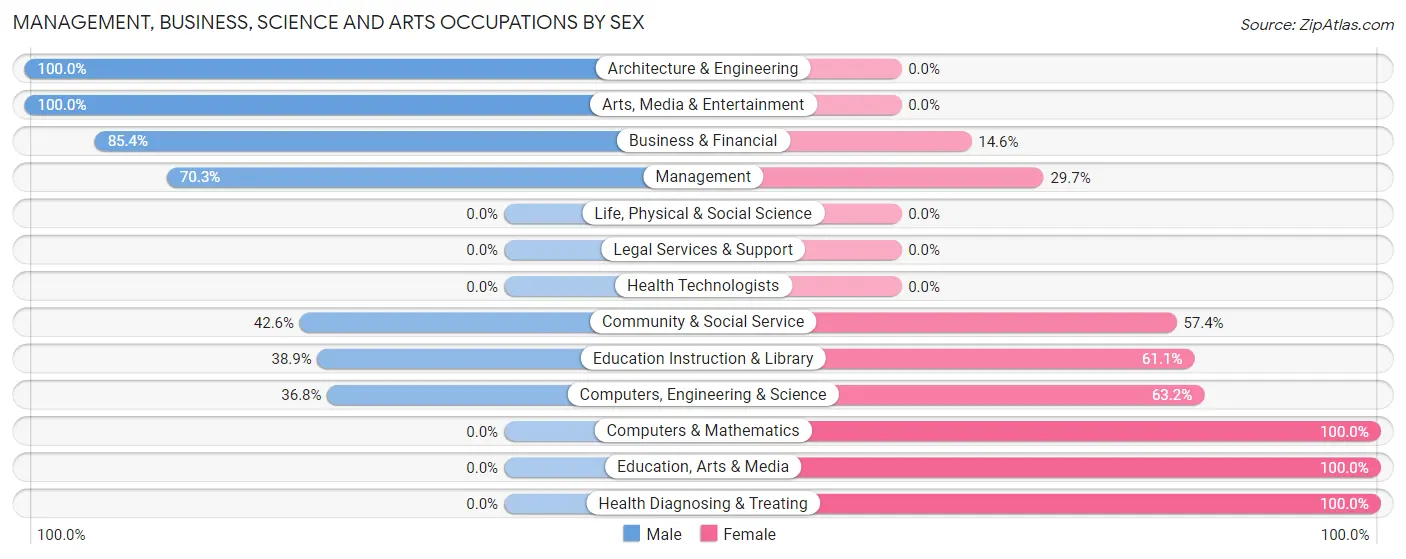
Management, Business, Science and Arts Occupations by Sex
Within the Management, Business, Science and Arts occupations in Lamont, the most male-oriented occupations are Architecture & Engineering (100.0%), Arts, Media & Entertainment (100.0%), and Business & Financial (85.4%), while the most female-oriented occupations are Computers & Mathematics (100.0%), Education, Arts & Media (100.0%), and Health Diagnosing & Treating (100.0%).
| Occupation | Male | Female |
| Management | 90 (70.3%) | 38 (29.7%) |
| Business & Financial | 105 (85.4%) | 18 (14.6%) |
| Computers, Engineering & Science | 7 (36.8%) | 12 (63.2%) |
| Computers & Mathematics | 0 (0.0%) | 12 (100.0%) |
| Architecture & Engineering | 7 (100.0%) | 0 (0.0%) |
| Life, Physical & Social Science | 0 (0.0%) | 0 (0.0%) |
| Community & Social Service | 178 (42.6%) | 240 (57.4%) |
| Education, Arts & Media | 0 (0.0%) | 20 (100.0%) |
| Legal Services & Support | 0 (0.0%) | 0 (0.0%) |
| Education Instruction & Library | 140 (38.9%) | 220 (61.1%) |
| Arts, Media & Entertainment | 38 (100.0%) | 0 (0.0%) |
| Health Diagnosing & Treating | 0 (0.0%) | 61 (100.0%) |
| Health Technologists | 0 (0.0%) | 0 (0.0%) |
| Total (Category) | 380 (50.7%) | 369 (49.3%) |
| Total (Overall) | 3,189 (64.1%) | 1,783 (35.9%) |
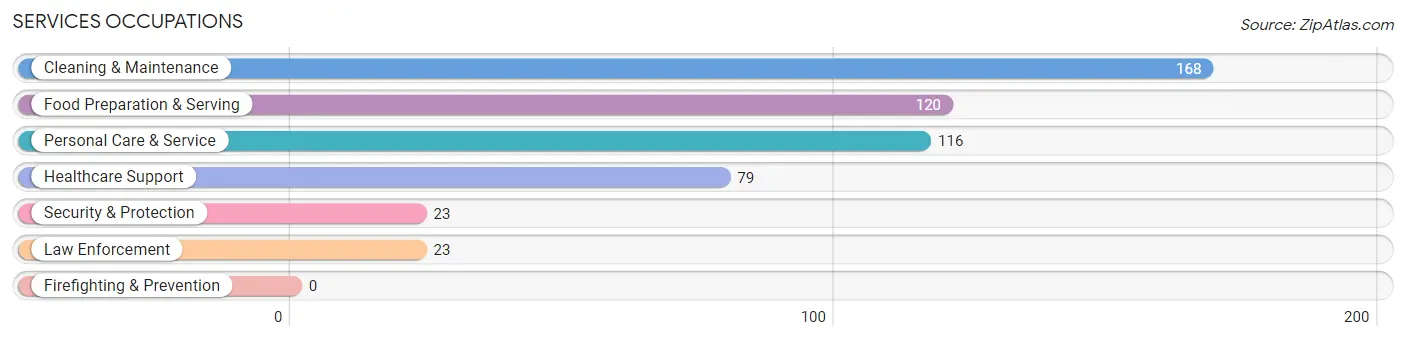
Services Occupations
The most common Services occupations in Lamont are Cleaning & Maintenance (168 | 3.4%), Food Preparation & Serving (120 | 2.4%), Personal Care & Service (116 | 2.3%), Healthcare Support (79 | 1.6%), and Security & Protection (23 | 0.5%).
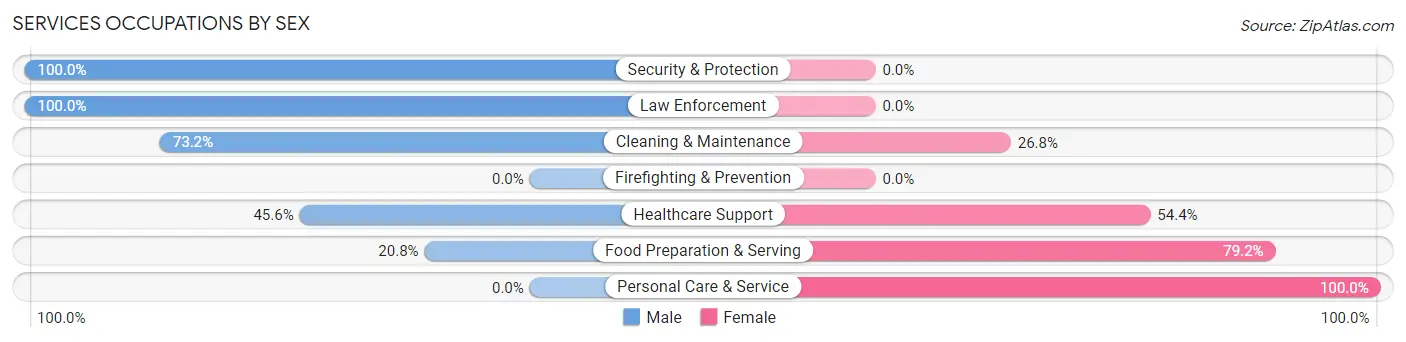
Services Occupations by Sex
Within the Services occupations in Lamont, the most male-oriented occupations are Security & Protection (100.0%), Law Enforcement (100.0%), and Cleaning & Maintenance (73.2%), while the most female-oriented occupations are Personal Care & Service (100.0%), Food Preparation & Serving (79.2%), and Healthcare Support (54.4%).
| Occupation | Male | Female |
| Healthcare Support | 36 (45.6%) | 43 (54.4%) |
| Security & Protection | 23 (100.0%) | 0 (0.0%) |
| Firefighting & Prevention | 0 (0.0%) | 0 (0.0%) |
| Law Enforcement | 23 (100.0%) | 0 (0.0%) |
| Food Preparation & Serving | 25 (20.8%) | 95 (79.2%) |
| Cleaning & Maintenance | 123 (73.2%) | 45 (26.8%) |
| Personal Care & Service | 0 (0.0%) | 116 (100.0%) |
| Total (Category) | 207 (40.9%) | 299 (59.1%) |
| Total (Overall) | 3,189 (64.1%) | 1,783 (35.9%) |
Sales and Office Occupations
The most common Sales and Office occupations in Lamont are Sales & Related (265 | 5.3%), and Office & Administration (145 | 2.9%).

Sales and Office Occupations by Sex

| Occupation | Male | Female |
| Sales & Related | 95 (35.8%) | 170 (64.1%) |
| Office & Administration | 25 (17.2%) | 120 (82.8%) |
| Total (Category) | 120 (29.3%) | 290 (70.7%) |
| Total (Overall) | 3,189 (64.1%) | 1,783 (35.9%) |
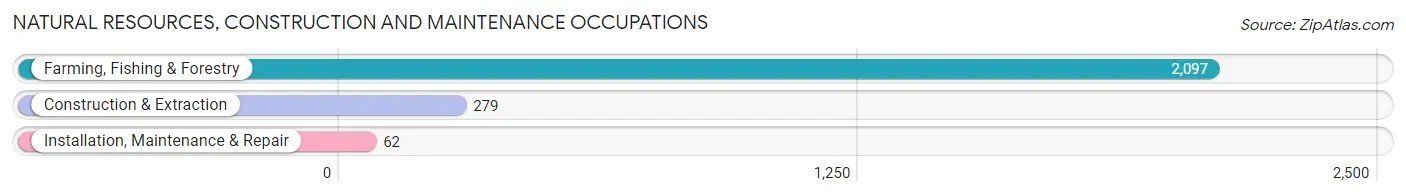
Natural Resources, Construction and Maintenance Occupations
The most common Natural Resources, Construction and Maintenance occupations in Lamont are Farming, Fishing & Forestry (2,097 | 42.2%), Construction & Extraction (279 | 5.6%), and Installation, Maintenance & Repair (62 | 1.3%).
Natural Resources, Construction and Maintenance Occupations by Sex
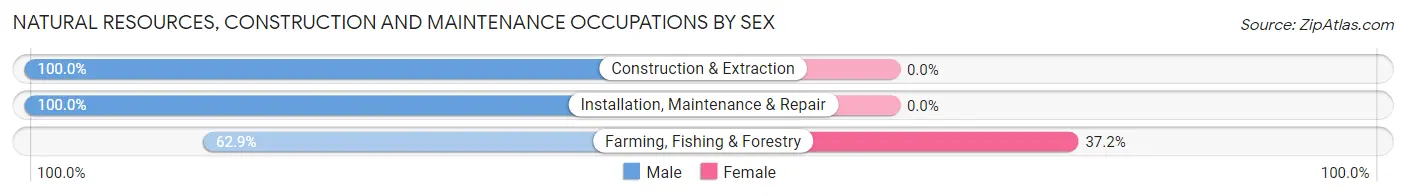
| Occupation | Male | Female |
| Farming, Fishing & Forestry | 1,318 (62.8%) | 779 (37.1%) |
| Construction & Extraction | 279 (100.0%) | 0 (0.0%) |
| Installation, Maintenance & Repair | 62 (100.0%) | 0 (0.0%) |
| Total (Category) | 1,659 (68.0%) | 779 (32.0%) |
| Total (Overall) | 3,189 (64.1%) | 1,783 (35.9%) |
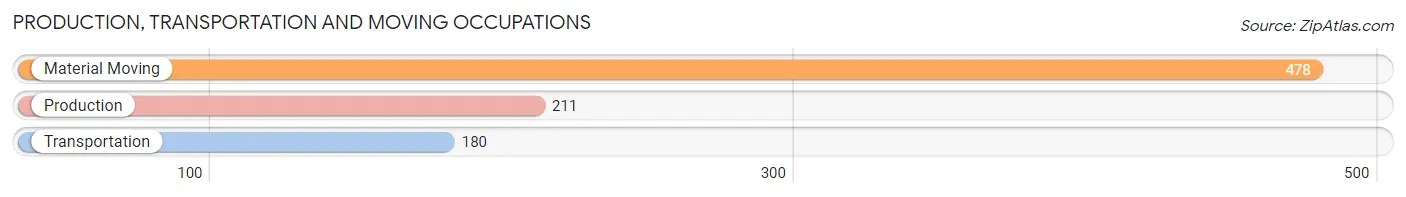
Production, Transportation and Moving Occupations
The most common Production, Transportation and Moving occupations in Lamont are Material Moving (478 | 9.6%), Production (211 | 4.2%), and Transportation (180 | 3.6%).
Production, Transportation and Moving Occupations by Sex
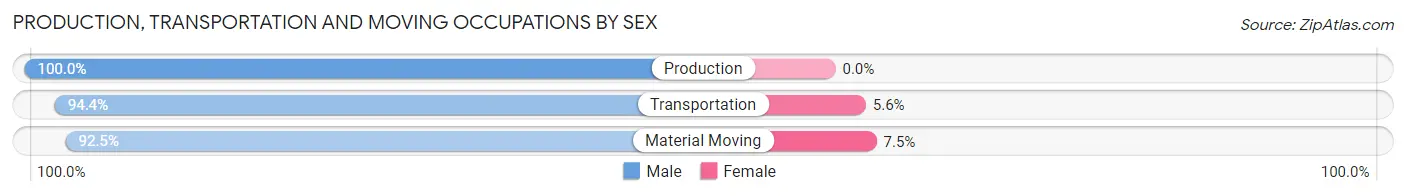
| Occupation | Male | Female |
| Production | 211 (100.0%) | 0 (0.0%) |
| Transportation | 170 (94.4%) | 10 (5.6%) |
| Material Moving | 442 (92.5%) | 36 (7.5%) |
| Total (Category) | 823 (94.7%) | 46 (5.3%) |
| Total (Overall) | 3,189 (64.1%) | 1,783 (35.9%) |
Employment Industries by Sex in Lamont
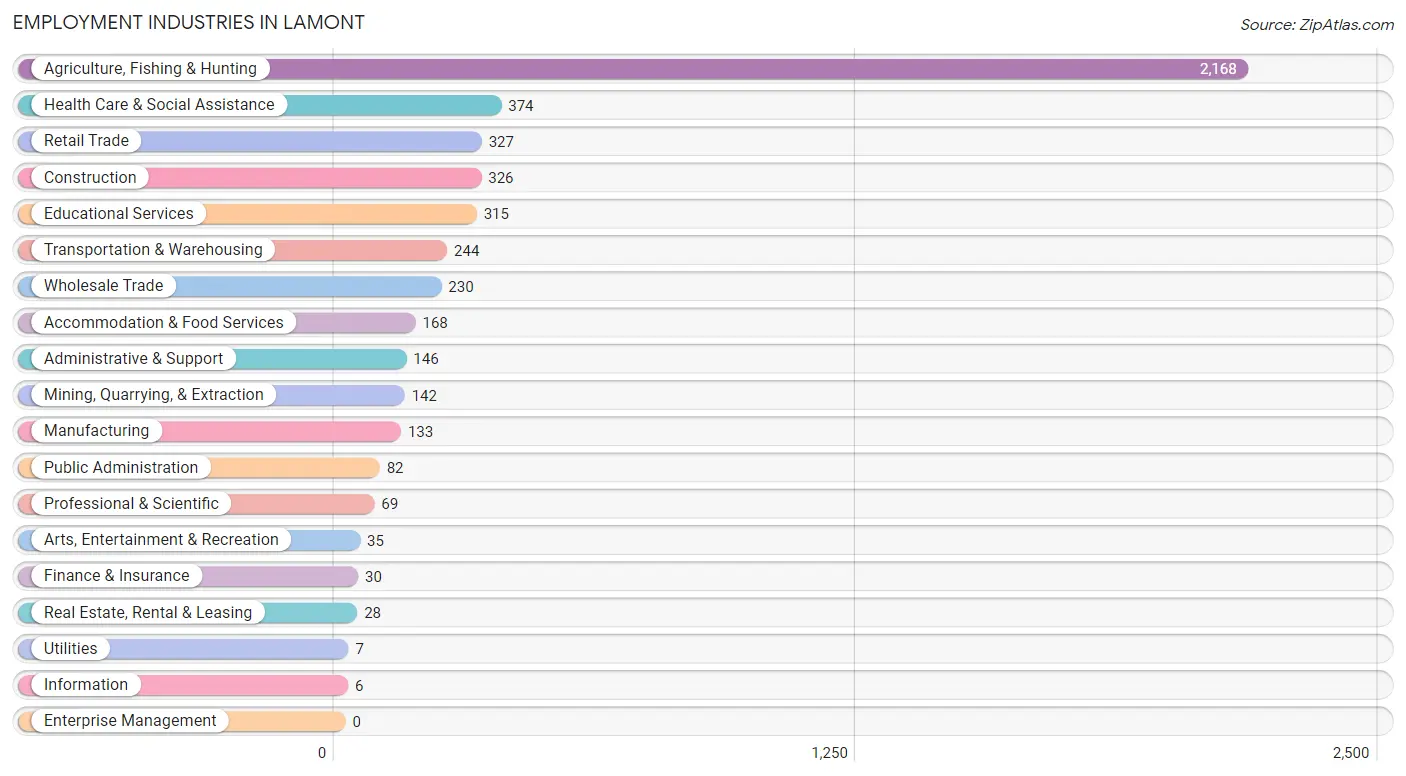
Employment Industries in Lamont
The major employment industries in Lamont include Agriculture, Fishing & Hunting (2,168 | 43.6%), Health Care & Social Assistance (374 | 7.5%), Retail Trade (327 | 6.6%), Construction (326 | 6.6%), and Educational Services (315 | 6.3%).
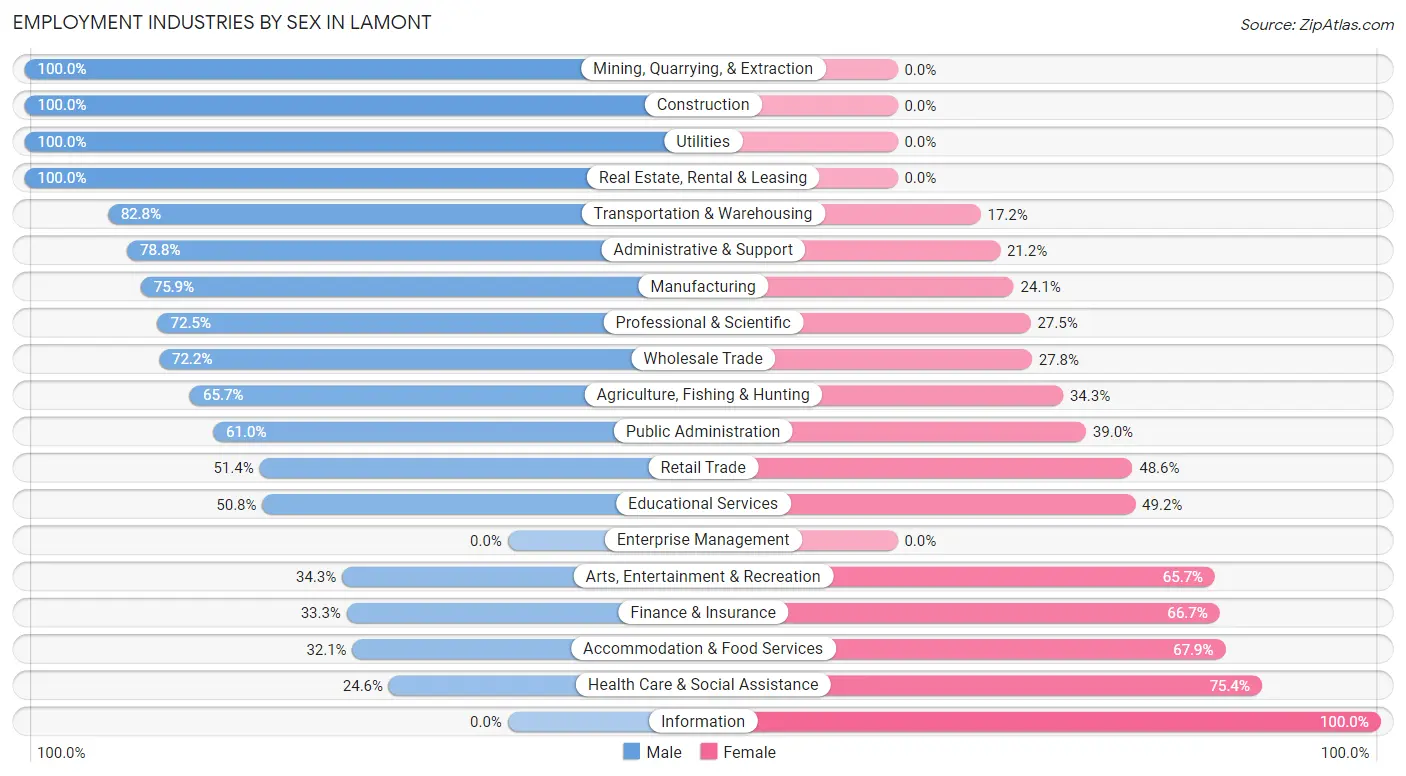
Employment Industries by Sex in Lamont
The Lamont industries that see more men than women are Mining, Quarrying, & Extraction (100.0%), Construction (100.0%), and Utilities (100.0%), whereas the industries that tend to have a higher number of women are Information (100.0%), Health Care & Social Assistance (75.4%), and Accommodation & Food Services (67.9%).
| Industry | Male | Female |
| Agriculture, Fishing & Hunting | 1,425 (65.7%) | 743 (34.3%) |
| Mining, Quarrying, & Extraction | 142 (100.0%) | 0 (0.0%) |
| Construction | 326 (100.0%) | 0 (0.0%) |
| Manufacturing | 101 (75.9%) | 32 (24.1%) |
| Wholesale Trade | 166 (72.2%) | 64 (27.8%) |
| Retail Trade | 168 (51.4%) | 159 (48.6%) |
| Transportation & Warehousing | 202 (82.8%) | 42 (17.2%) |
| Utilities | 7 (100.0%) | 0 (0.0%) |
| Information | 0 (0.0%) | 6 (100.0%) |
| Finance & Insurance | 10 (33.3%) | 20 (66.7%) |
| Real Estate, Rental & Leasing | 28 (100.0%) | 0 (0.0%) |
| Professional & Scientific | 50 (72.5%) | 19 (27.5%) |
| Enterprise Management | 0 (0.0%) | 0 (0.0%) |
| Administrative & Support | 115 (78.8%) | 31 (21.2%) |
| Educational Services | 160 (50.8%) | 155 (49.2%) |
| Health Care & Social Assistance | 92 (24.6%) | 282 (75.4%) |
| Arts, Entertainment & Recreation | 12 (34.3%) | 23 (65.7%) |
| Accommodation & Food Services | 54 (32.1%) | 114 (67.9%) |
| Public Administration | 50 (61.0%) | 32 (39.0%) |
| Total | 3,189 (64.1%) | 1,783 (35.9%) |
Education in Lamont
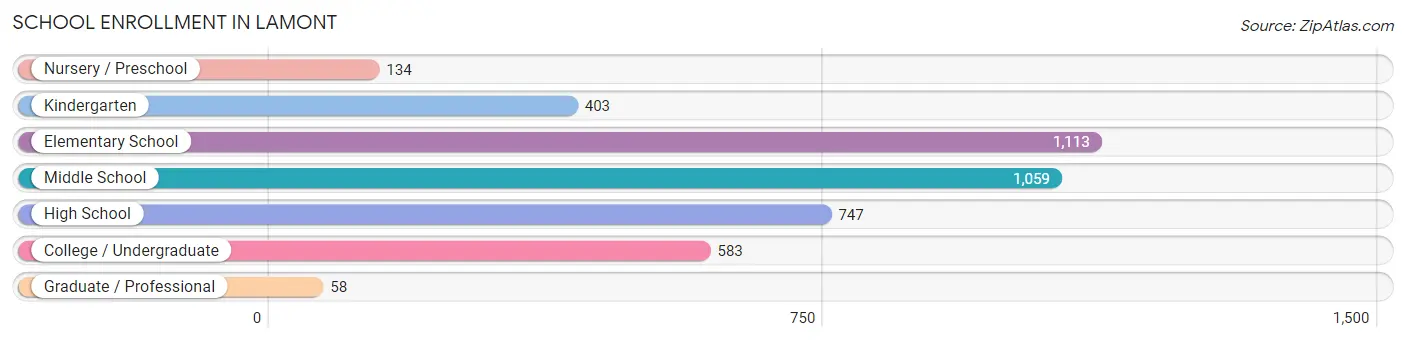
School Enrollment in Lamont
The most common levels of schooling among the 4,097 students in Lamont are elementary school (1,113 | 27.2%), middle school (1,059 | 25.9%), and high school (747 | 18.2%).
| School Level | # Students | % Students |
| Nursery / Preschool | 134 | 3.3% |
| Kindergarten | 403 | 9.8% |
| Elementary School | 1,113 | 27.2% |
| Middle School | 1,059 | 25.9% |
| High School | 747 | 18.2% |
| College / Undergraduate | 583 | 14.2% |
| Graduate / Professional | 58 | 1.4% |
| Total | 4,097 | 100.0% |
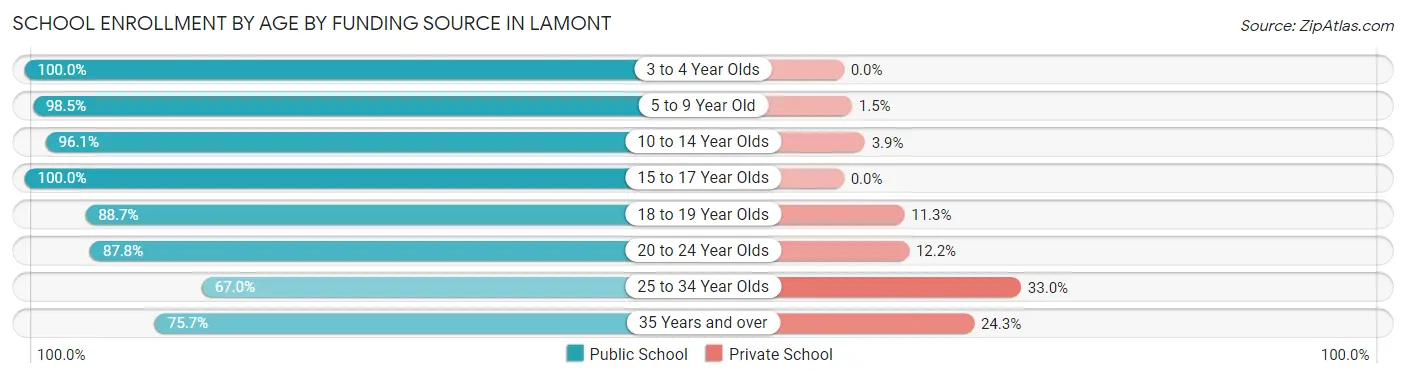
School Enrollment by Age by Funding Source in Lamont
Out of a total of 4,097 students who are enrolled in schools in Lamont, 197 (4.8%) attend a private institution, while the remaining 3,900 (95.2%) are enrolled in public schools. The age group of 25 to 34 year olds has the highest likelihood of being enrolled in private schools, with 34 (33.0% in the age bracket) enrolled. Conversely, the age group of 3 to 4 year olds has the lowest likelihood of being enrolled in a private school, with 157 (100.0% in the age bracket) attending a public institution.
| Age Bracket | Public School | Private School |
| 3 to 4 Year Olds | 157 (100.0%) | 0 (0.0%) |
| 5 to 9 Year Old | 1,300 (98.5%) | 20 (1.5%) |
| 10 to 14 Year Olds | 1,274 (96.1%) | 52 (3.9%) |
| 15 to 17 Year Olds | 532 (100.0%) | 0 (0.0%) |
| 18 to 19 Year Olds | 165 (88.7%) | 21 (11.3%) |
| 20 to 24 Year Olds | 325 (87.8%) | 45 (12.2%) |
| 25 to 34 Year Olds | 69 (67.0%) | 34 (33.0%) |
| 35 Years and over | 78 (75.7%) | 25 (24.3%) |
| Total | 3,900 (95.2%) | 197 (4.8%) |
Educational Attainment by Field of Study in Lamont
Business (84 | 41.8%), education (83 | 41.3%), social sciences (29 | 14.4%), and liberal arts & history (5 | 2.5%) are the most common fields of study among 201 individuals in Lamont who have obtained a bachelor's degree or higher.
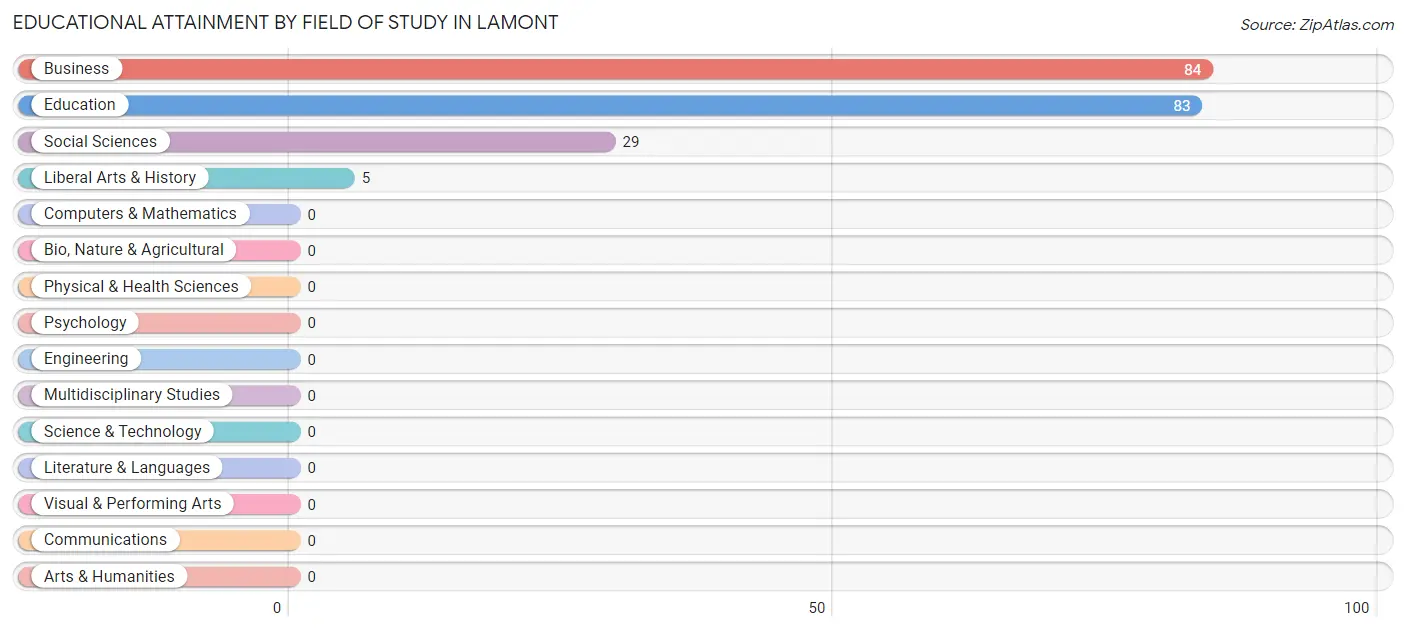
| Field of Study | # Graduates | % Graduates |
| Computers & Mathematics | 0 | 0.0% |
| Bio, Nature & Agricultural | 0 | 0.0% |
| Physical & Health Sciences | 0 | 0.0% |
| Psychology | 0 | 0.0% |
| Social Sciences | 29 | 14.4% |
| Engineering | 0 | 0.0% |
| Multidisciplinary Studies | 0 | 0.0% |
| Science & Technology | 0 | 0.0% |
| Business | 84 | 41.8% |
| Education | 83 | 41.3% |
| Literature & Languages | 0 | 0.0% |
| Liberal Arts & History | 5 | 2.5% |
| Visual & Performing Arts | 0 | 0.0% |
| Communications | 0 | 0.0% |
| Arts & Humanities | 0 | 0.0% |
| Total | 201 | 100.0% |
Transportation & Commute in Lamont
Vehicle Availability by Sex in Lamont
The most prevalent vehicle ownership categories in Lamont are males with 2 vehicles (1,175, accounting for 37.1%) and females with 2 vehicles (478, making up 65.9%).
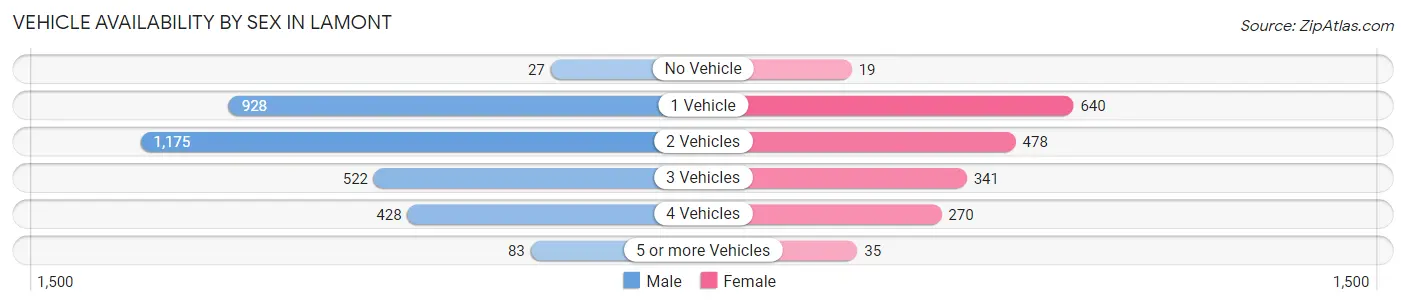
| Vehicles Available | Male | Female |
| No Vehicle | 27 (0.9%) | 19 (1.1%) |
| 1 Vehicle | 928 (29.3%) | 640 (35.9%) |
| 2 Vehicles | 1,175 (37.1%) | 478 (26.8%) |
| 3 Vehicles | 522 (16.5%) | 341 (19.1%) |
| 4 Vehicles | 428 (13.5%) | 270 (15.1%) |
| 5 or more Vehicles | 83 (2.6%) | 35 (2.0%) |
| Total | 3,163 (100.0%) | 1,783 (100.0%) |
Commute Time in Lamont
The most frequently occuring commute durations in Lamont are 20 to 24 minutes (1,226 commuters, 25.8%), 15 to 19 minutes (1,122 commuters, 23.6%), and 30 to 34 minutes (481 commuters, 10.1%).
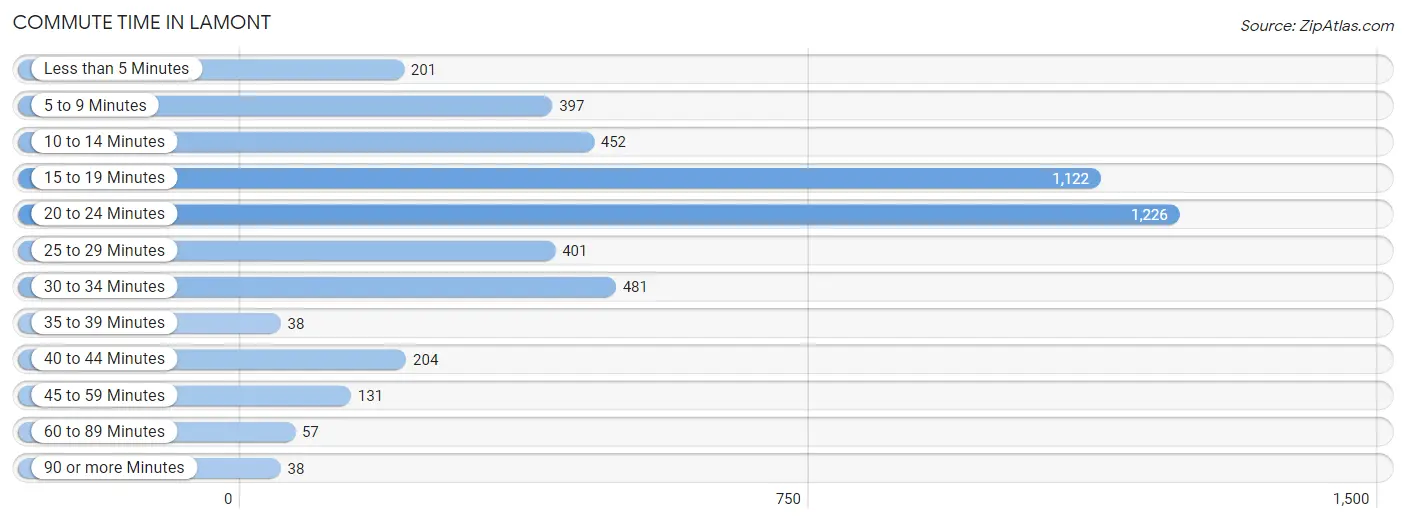
| Commute Time | # Commuters | % Commuters |
| Less than 5 Minutes | 201 | 4.2% |
| 5 to 9 Minutes | 397 | 8.4% |
| 10 to 14 Minutes | 452 | 9.5% |
| 15 to 19 Minutes | 1,122 | 23.6% |
| 20 to 24 Minutes | 1,226 | 25.8% |
| 25 to 29 Minutes | 401 | 8.5% |
| 30 to 34 Minutes | 481 | 10.1% |
| 35 to 39 Minutes | 38 | 0.8% |
| 40 to 44 Minutes | 204 | 4.3% |
| 45 to 59 Minutes | 131 | 2.8% |
| 60 to 89 Minutes | 57 | 1.2% |
| 90 or more Minutes | 38 | 0.8% |
Commute Time by Sex in Lamont
The most common commute times in Lamont are 20 to 24 minutes (727 commuters, 23.9%) for males and 20 to 24 minutes (499 commuters, 29.2%) for females.
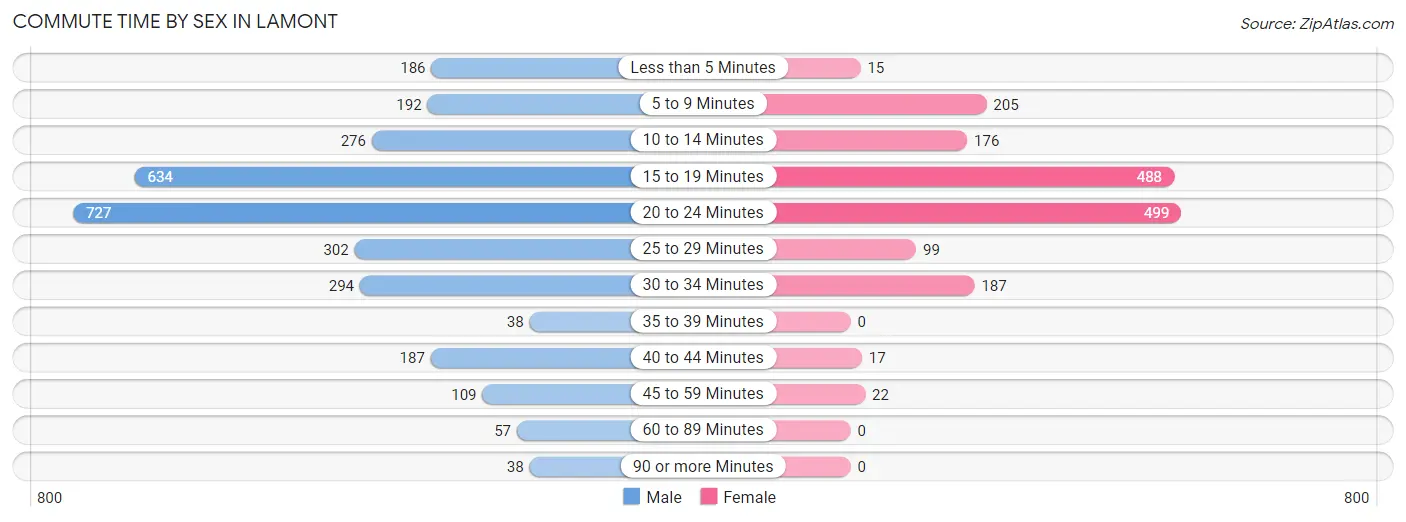
| Commute Time | Male | Female |
| Less than 5 Minutes | 186 (6.1%) | 15 (0.9%) |
| 5 to 9 Minutes | 192 (6.3%) | 205 (12.0%) |
| 10 to 14 Minutes | 276 (9.1%) | 176 (10.3%) |
| 15 to 19 Minutes | 634 (20.9%) | 488 (28.6%) |
| 20 to 24 Minutes | 727 (23.9%) | 499 (29.2%) |
| 25 to 29 Minutes | 302 (9.9%) | 99 (5.8%) |
| 30 to 34 Minutes | 294 (9.7%) | 187 (11.0%) |
| 35 to 39 Minutes | 38 (1.3%) | 0 (0.0%) |
| 40 to 44 Minutes | 187 (6.1%) | 17 (1.0%) |
| 45 to 59 Minutes | 109 (3.6%) | 22 (1.3%) |
| 60 to 89 Minutes | 57 (1.9%) | 0 (0.0%) |
| 90 or more Minutes | 38 (1.3%) | 0 (0.0%) |
Time of Departure to Work by Sex in Lamont
The most frequent times of departure to work in Lamont are 6:00 AM to 6:29 AM (1,064, 35.0%) for males and 6:00 AM to 6:29 AM (588, 34.4%) for females.
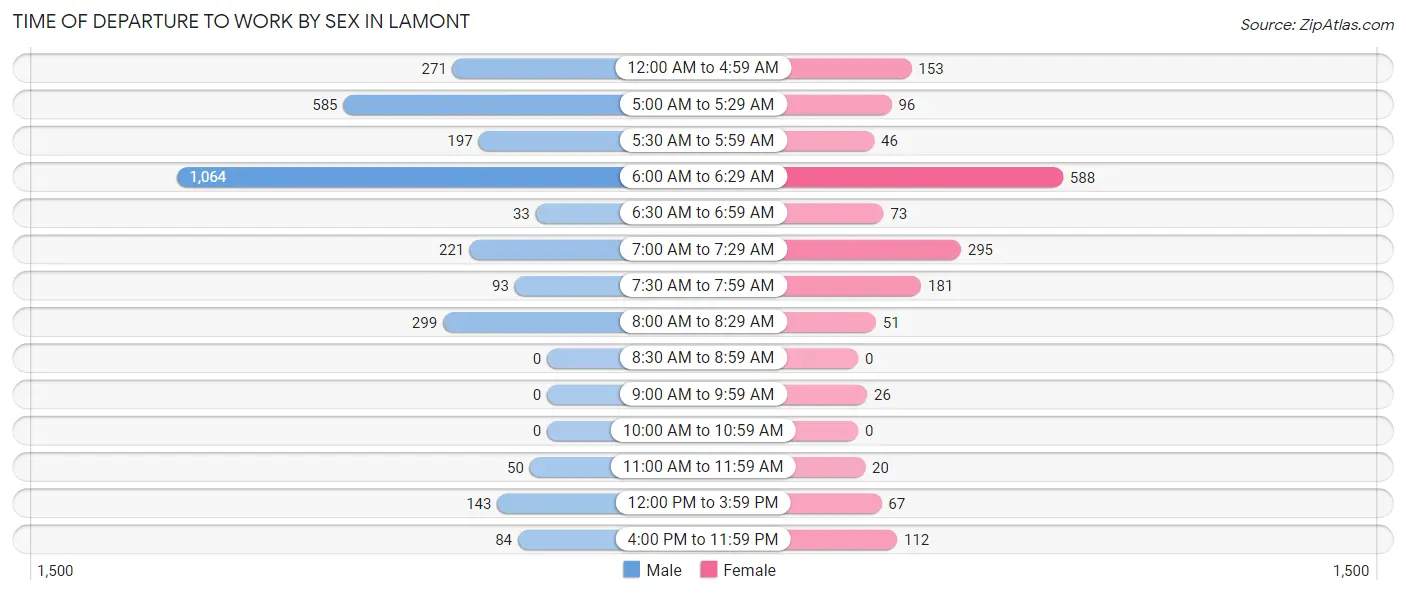
| Time of Departure | Male | Female |
| 12:00 AM to 4:59 AM | 271 (8.9%) | 153 (9.0%) |
| 5:00 AM to 5:29 AM | 585 (19.2%) | 96 (5.6%) |
| 5:30 AM to 5:59 AM | 197 (6.5%) | 46 (2.7%) |
| 6:00 AM to 6:29 AM | 1,064 (35.0%) | 588 (34.4%) |
| 6:30 AM to 6:59 AM | 33 (1.1%) | 73 (4.3%) |
| 7:00 AM to 7:29 AM | 221 (7.3%) | 295 (17.3%) |
| 7:30 AM to 7:59 AM | 93 (3.1%) | 181 (10.6%) |
| 8:00 AM to 8:29 AM | 299 (9.8%) | 51 (3.0%) |
| 8:30 AM to 8:59 AM | 0 (0.0%) | 0 (0.0%) |
| 9:00 AM to 9:59 AM | 0 (0.0%) | 26 (1.5%) |
| 10:00 AM to 10:59 AM | 0 (0.0%) | 0 (0.0%) |
| 11:00 AM to 11:59 AM | 50 (1.6%) | 20 (1.2%) |
| 12:00 PM to 3:59 PM | 143 (4.7%) | 67 (3.9%) |
| 4:00 PM to 11:59 PM | 84 (2.8%) | 112 (6.6%) |
| Total | 3,040 (100.0%) | 1,708 (100.0%) |
Housing Occupancy in Lamont
Occupancy by Ownership in Lamont
Of the total 3,612 dwellings in Lamont, owner-occupied units account for 1,506 (41.7%), while renter-occupied units make up 2,106 (58.3%).
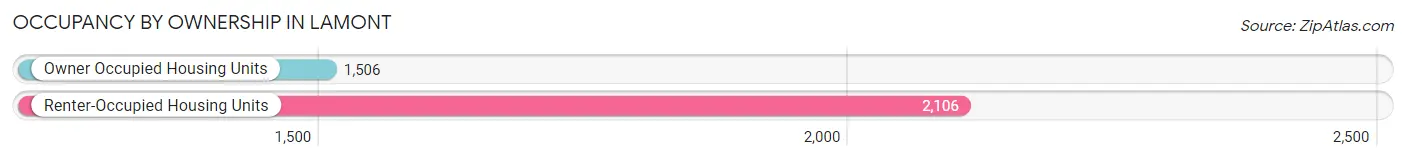
| Occupancy | # Housing Units | % Housing Units |
| Owner Occupied Housing Units | 1,506 | 41.7% |
| Renter-Occupied Housing Units | 2,106 | 58.3% |
| Total Occupied Housing Units | 3,612 | 100.0% |
Occupancy by Household Size in Lamont
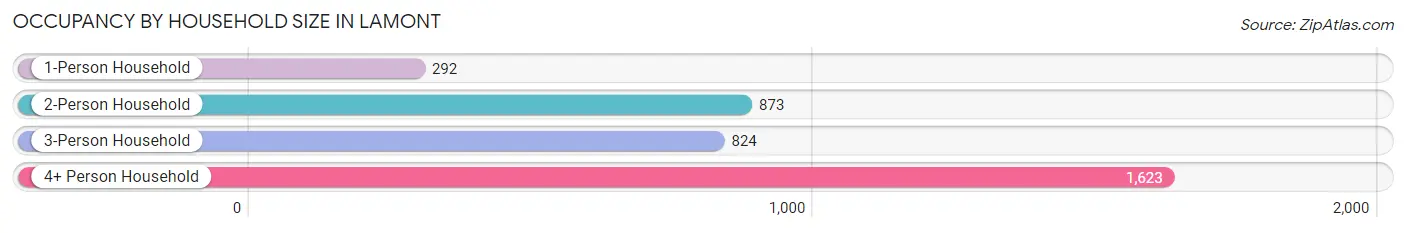
| Household Size | # Housing Units | % Housing Units |
| 1-Person Household | 292 | 8.1% |
| 2-Person Household | 873 | 24.2% |
| 3-Person Household | 824 | 22.8% |
| 4+ Person Household | 1,623 | 44.9% |
| Total Housing Units | 3,612 | 100.0% |
Occupancy by Ownership by Household Size in Lamont
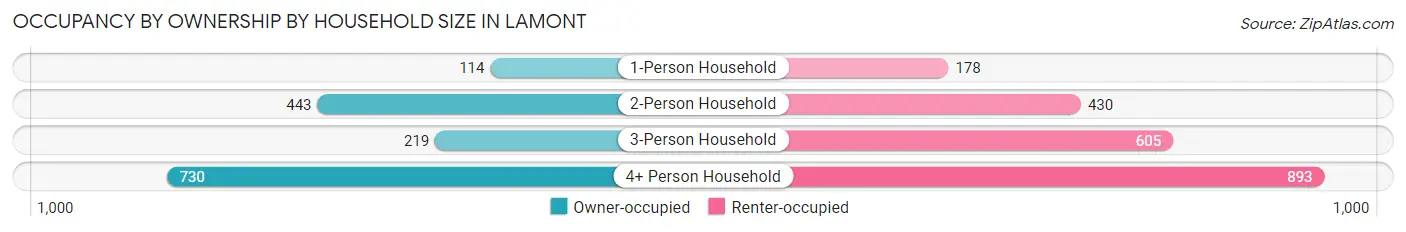
| Household Size | Owner-occupied | Renter-occupied |
| 1-Person Household | 114 (39.0%) | 178 (61.0%) |
| 2-Person Household | 443 (50.7%) | 430 (49.3%) |
| 3-Person Household | 219 (26.6%) | 605 (73.4%) |
| 4+ Person Household | 730 (45.0%) | 893 (55.0%) |
| Total Housing Units | 1,506 (41.7%) | 2,106 (58.3%) |
Occupancy by Educational Attainment in Lamont
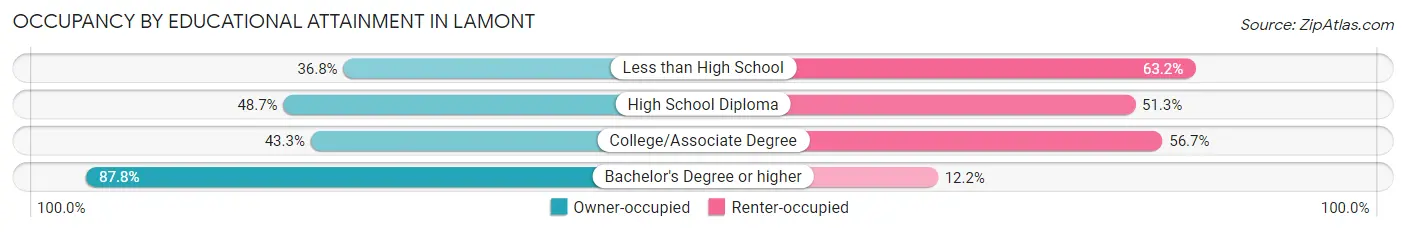
| Household Size | Owner-occupied | Renter-occupied |
| Less than High School | 843 (36.8%) | 1,449 (63.2%) |
| High School Diploma | 333 (48.7%) | 351 (51.3%) |
| College/Associate Degree | 222 (43.3%) | 291 (56.7%) |
| Bachelor's Degree or higher | 108 (87.8%) | 15 (12.2%) |
Occupancy by Age of Householder in Lamont
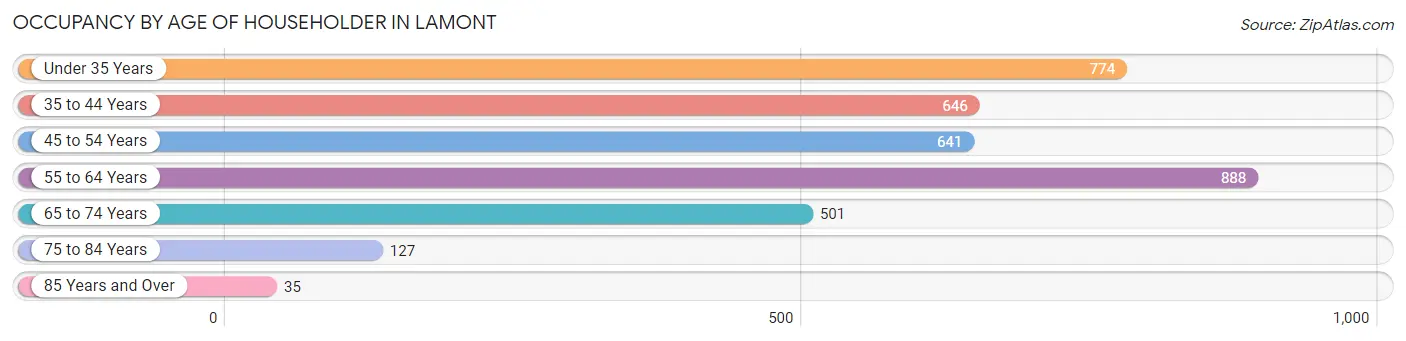
| Age Bracket | # Households | % Households |
| Under 35 Years | 774 | 21.4% |
| 35 to 44 Years | 646 | 17.9% |
| 45 to 54 Years | 641 | 17.7% |
| 55 to 64 Years | 888 | 24.6% |
| 65 to 74 Years | 501 | 13.9% |
| 75 to 84 Years | 127 | 3.5% |
| 85 Years and Over | 35 | 1.0% |
| Total | 3,612 | 100.0% |
Housing Finances in Lamont
Median Income by Occupancy in Lamont
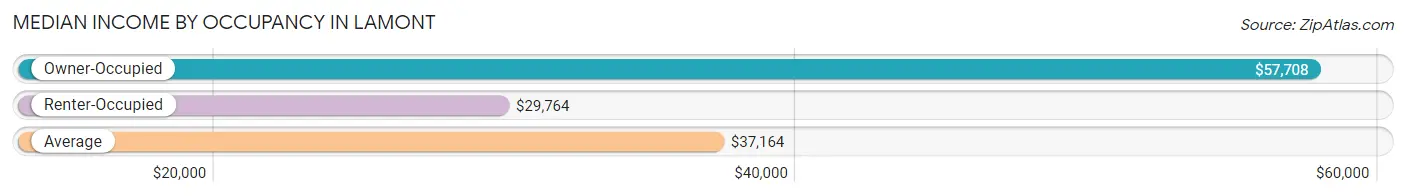
| Occupancy Type | # Households | Median Income |
| Owner-Occupied | 1,506 (41.7%) | $57,708 |
| Renter-Occupied | 2,106 (58.3%) | $29,764 |
| Average | 3,612 (100.0%) | $37,164 |
Occupancy by Householder Income Bracket in Lamont
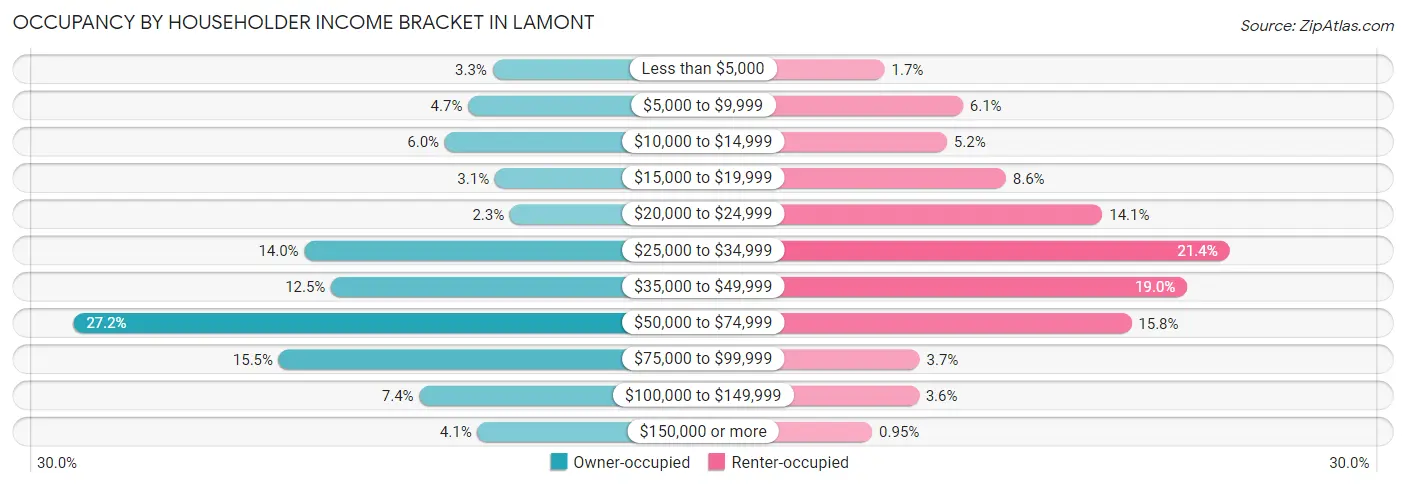
| Income Bracket | Owner-occupied | Renter-occupied |
| Less than $5,000 | 49 (3.3%) | 35 (1.7%) |
| $5,000 to $9,999 | 70 (4.6%) | 129 (6.1%) |
| $10,000 to $14,999 | 90 (6.0%) | 110 (5.2%) |
| $15,000 to $19,999 | 47 (3.1%) | 181 (8.6%) |
| $20,000 to $24,999 | 34 (2.3%) | 297 (14.1%) |
| $25,000 to $34,999 | 211 (14.0%) | 450 (21.4%) |
| $35,000 to $49,999 | 188 (12.5%) | 399 (19.0%) |
| $50,000 to $74,999 | 410 (27.2%) | 332 (15.8%) |
| $75,000 to $99,999 | 233 (15.5%) | 77 (3.7%) |
| $100,000 to $149,999 | 112 (7.4%) | 76 (3.6%) |
| $150,000 or more | 62 (4.1%) | 20 (0.9%) |
| Total | 1,506 (100.0%) | 2,106 (100.0%) |
Monthly Housing Cost Tiers in Lamont
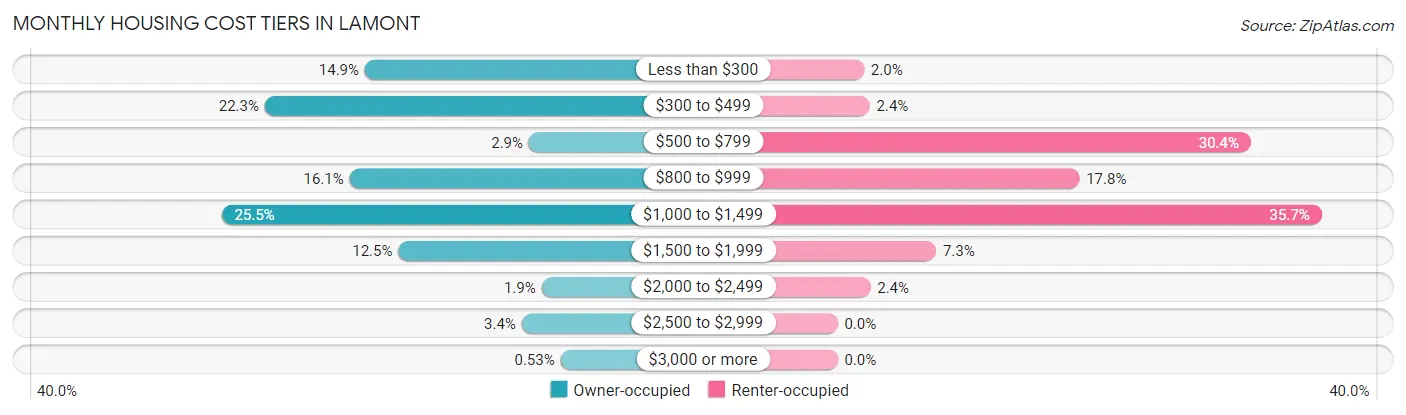
| Monthly Cost | Owner-occupied | Renter-occupied |
| Less than $300 | 225 (14.9%) | 41 (1.9%) |
| $300 to $499 | 336 (22.3%) | 50 (2.4%) |
| $500 to $799 | 43 (2.9%) | 641 (30.4%) |
| $800 to $999 | 242 (16.1%) | 375 (17.8%) |
| $1,000 to $1,499 | 384 (25.5%) | 751 (35.7%) |
| $1,500 to $1,999 | 188 (12.5%) | 153 (7.3%) |
| $2,000 to $2,499 | 29 (1.9%) | 51 (2.4%) |
| $2,500 to $2,999 | 51 (3.4%) | 0 (0.0%) |
| $3,000 or more | 8 (0.5%) | 0 (0.0%) |
| Total | 1,506 (100.0%) | 2,106 (100.0%) |
Physical Housing Characteristics in Lamont
Housing Structures in Lamont
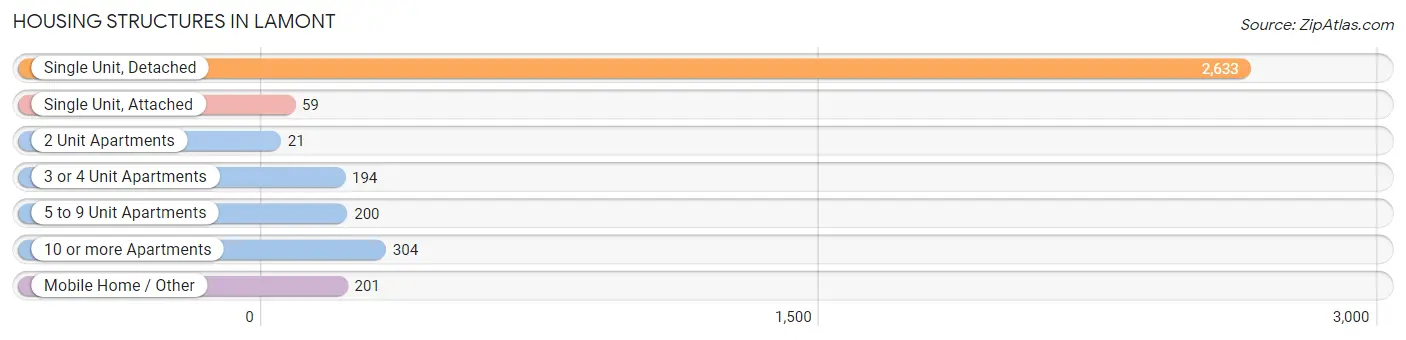
| Structure Type | # Housing Units | % Housing Units |
| Single Unit, Detached | 2,633 | 72.9% |
| Single Unit, Attached | 59 | 1.6% |
| 2 Unit Apartments | 21 | 0.6% |
| 3 or 4 Unit Apartments | 194 | 5.4% |
| 5 to 9 Unit Apartments | 200 | 5.5% |
| 10 or more Apartments | 304 | 8.4% |
| Mobile Home / Other | 201 | 5.6% |
| Total | 3,612 | 100.0% |
Housing Structures by Occupancy in Lamont
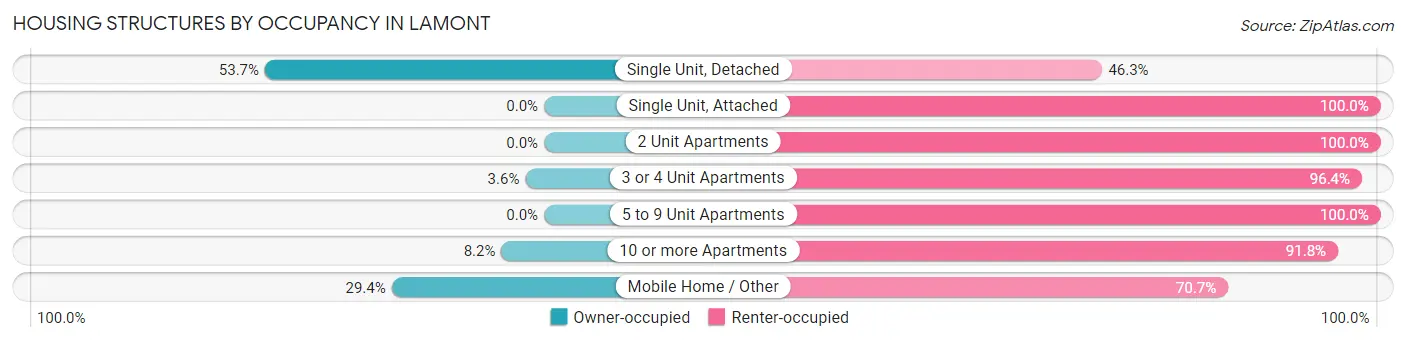
| Structure Type | Owner-occupied | Renter-occupied |
| Single Unit, Detached | 1,415 (53.7%) | 1,218 (46.3%) |
| Single Unit, Attached | 0 (0.0%) | 59 (100.0%) |
| 2 Unit Apartments | 0 (0.0%) | 21 (100.0%) |
| 3 or 4 Unit Apartments | 7 (3.6%) | 187 (96.4%) |
| 5 to 9 Unit Apartments | 0 (0.0%) | 200 (100.0%) |
| 10 or more Apartments | 25 (8.2%) | 279 (91.8%) |
| Mobile Home / Other | 59 (29.3%) | 142 (70.7%) |
| Total | 1,506 (41.7%) | 2,106 (58.3%) |
Housing Structures by Number of Rooms in Lamont
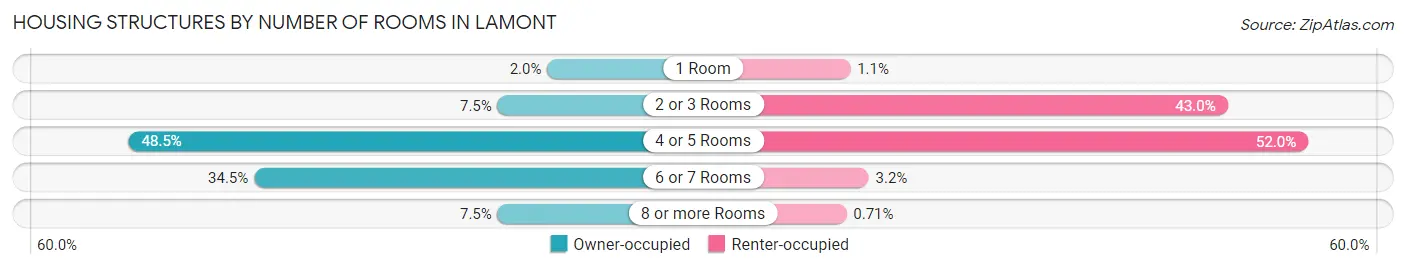
| Number of Rooms | Owner-occupied | Renter-occupied |
| 1 Room | 30 (2.0%) | 24 (1.1%) |
| 2 or 3 Rooms | 113 (7.5%) | 906 (43.0%) |
| 4 or 5 Rooms | 730 (48.5%) | 1,094 (51.9%) |
| 6 or 7 Rooms | 520 (34.5%) | 67 (3.2%) |
| 8 or more Rooms | 113 (7.5%) | 15 (0.7%) |
| Total | 1,506 (100.0%) | 2,106 (100.0%) |
Housing Structure by Heating Type in Lamont
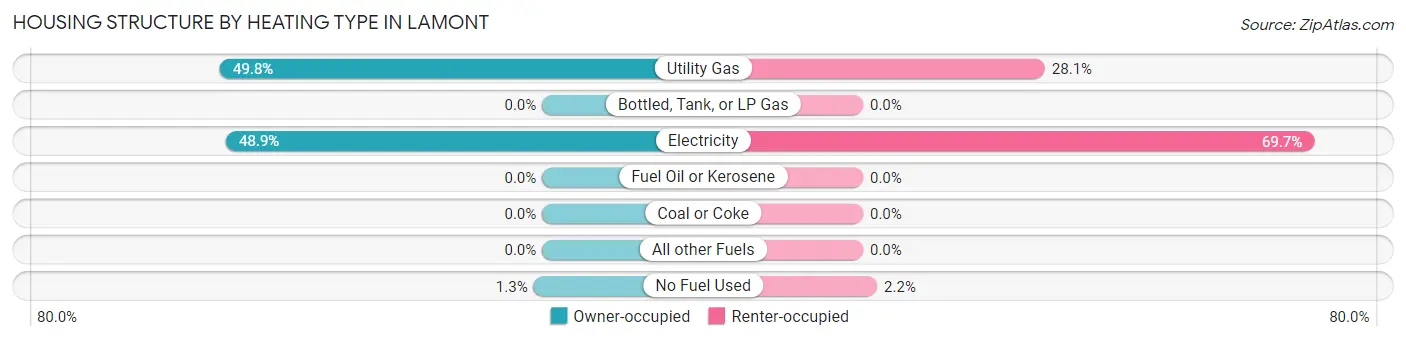
| Heating Type | Owner-occupied | Renter-occupied |
| Utility Gas | 750 (49.8%) | 592 (28.1%) |
| Bottled, Tank, or LP Gas | 0 (0.0%) | 0 (0.0%) |
| Electricity | 736 (48.9%) | 1,468 (69.7%) |
| Fuel Oil or Kerosene | 0 (0.0%) | 0 (0.0%) |
| Coal or Coke | 0 (0.0%) | 0 (0.0%) |
| All other Fuels | 0 (0.0%) | 0 (0.0%) |
| No Fuel Used | 20 (1.3%) | 46 (2.2%) |
| Total | 1,506 (100.0%) | 2,106 (100.0%) |
Household Vehicle Usage in Lamont
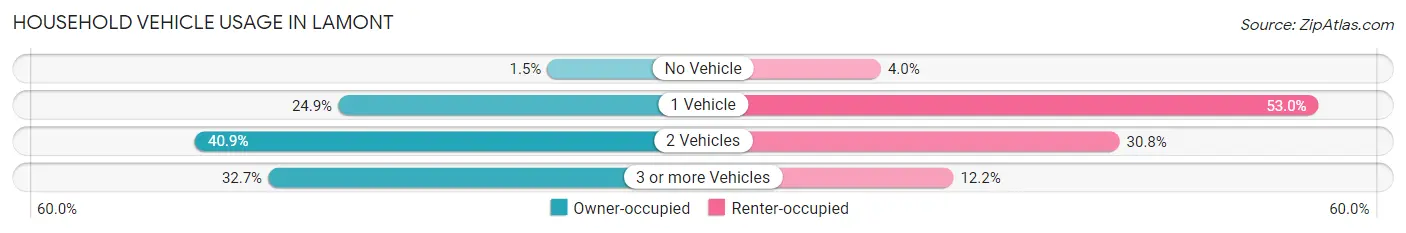
| Vehicles per Household | Owner-occupied | Renter-occupied |
| No Vehicle | 22 (1.5%) | 85 (4.0%) |
| 1 Vehicle | 375 (24.9%) | 1,117 (53.0%) |
| 2 Vehicles | 616 (40.9%) | 648 (30.8%) |
| 3 or more Vehicles | 493 (32.7%) | 256 (12.2%) |
| Total | 1,506 (100.0%) | 2,106 (100.0%) |
Real Estate & Mortgages in Lamont
Real Estate and Mortgage Overview in Lamont
| Characteristic | Without Mortgage | With Mortgage |
| Housing Units | 687 | 819 |
| Median Property Value | $165,900 | $214,300 |
| Median Household Income | $47,266 | $28 |
| Monthly Housing Costs | $372 | $8 |
| Real Estate Taxes | $1,390 | $10 |
Property Value by Mortgage Status in Lamont
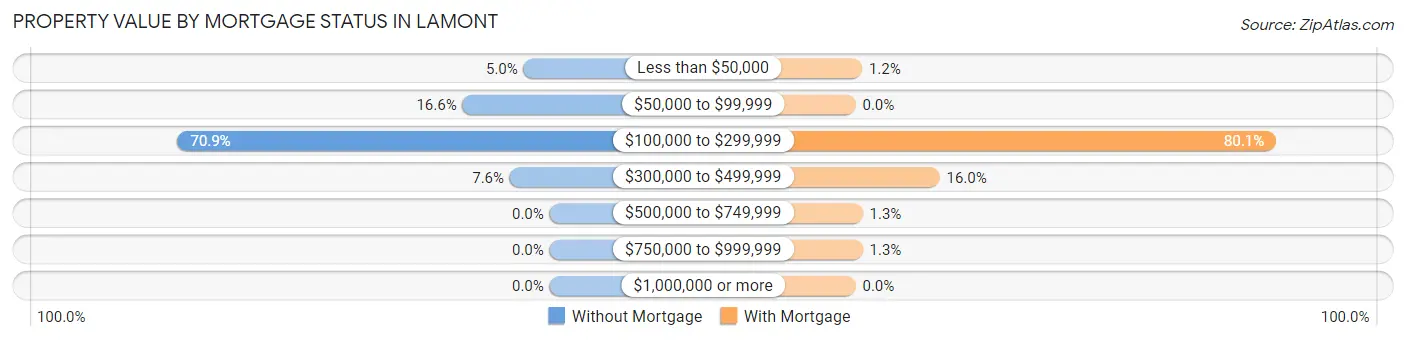
| Property Value | Without Mortgage | With Mortgage |
| Less than $50,000 | 34 (5.0%) | 10 (1.2%) |
| $50,000 to $99,999 | 114 (16.6%) | 0 (0.0%) |
| $100,000 to $299,999 | 487 (70.9%) | 656 (80.1%) |
| $300,000 to $499,999 | 52 (7.6%) | 131 (16.0%) |
| $500,000 to $749,999 | 0 (0.0%) | 11 (1.3%) |
| $750,000 to $999,999 | 0 (0.0%) | 11 (1.3%) |
| $1,000,000 or more | 0 (0.0%) | 0 (0.0%) |
| Total | 687 (100.0%) | 819 (100.0%) |
Household Income by Mortgage Status in Lamont
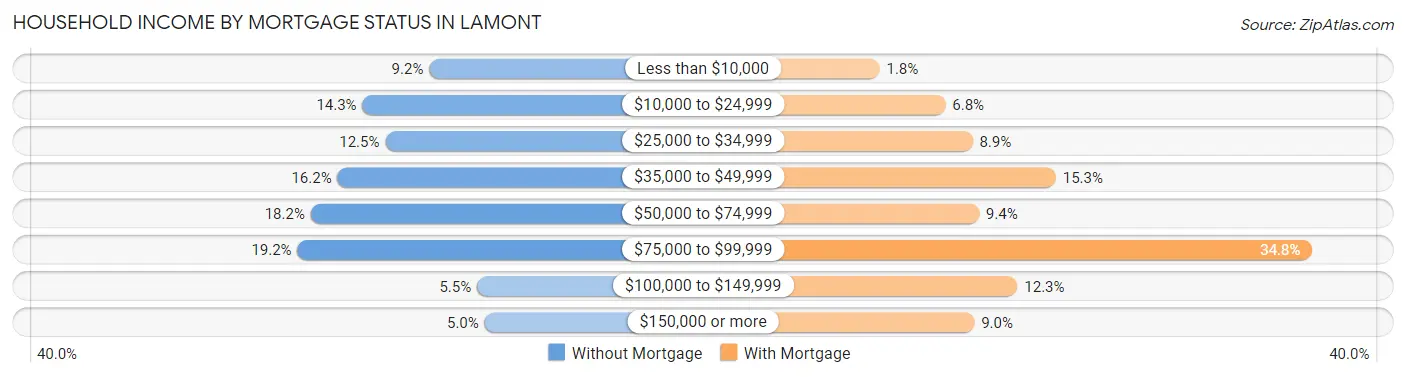
| Household Income | Without Mortgage | With Mortgage |
| Less than $10,000 | 63 (9.2%) | 15 (1.8%) |
| $10,000 to $24,999 | 98 (14.3%) | 56 (6.8%) |
| $25,000 to $34,999 | 86 (12.5%) | 73 (8.9%) |
| $35,000 to $49,999 | 111 (16.2%) | 125 (15.3%) |
| $50,000 to $74,999 | 125 (18.2%) | 77 (9.4%) |
| $75,000 to $99,999 | 132 (19.2%) | 285 (34.8%) |
| $100,000 to $149,999 | 38 (5.5%) | 101 (12.3%) |
| $150,000 or more | 34 (5.0%) | 74 (9.0%) |
| Total | 687 (100.0%) | 819 (100.0%) |
Property Value to Household Income Ratio in Lamont
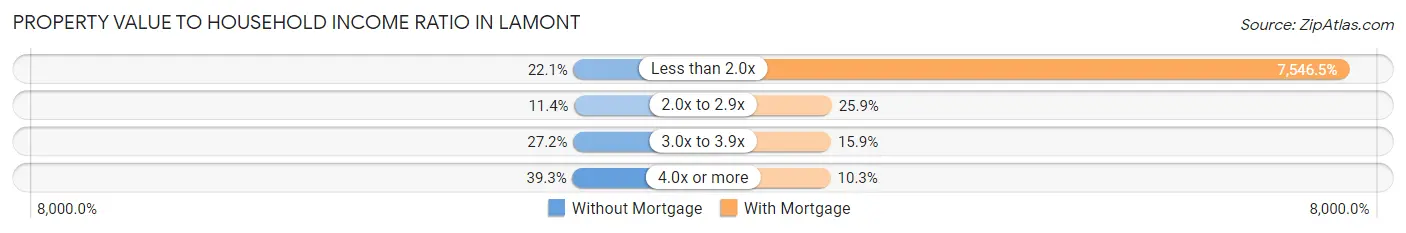
| Value-to-Income Ratio | Without Mortgage | With Mortgage |
| Less than 2.0x | 152 (22.1%) | 61,806 (7,546.5%) |
| 2.0x to 2.9x | 78 (11.4%) | 212 (25.9%) |
| 3.0x to 3.9x | 187 (27.2%) | 130 (15.9%) |
| 4.0x or more | 270 (39.3%) | 84 (10.3%) |
| Total | 687 (100.0%) | 819 (100.0%) |
Real Estate Taxes by Mortgage Status in Lamont
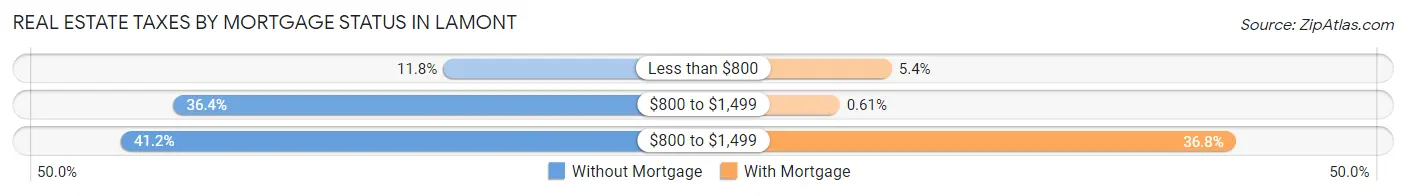
| Property Taxes | Without Mortgage | With Mortgage |
| Less than $800 | 81 (11.8%) | 44 (5.4%) |
| $800 to $1,499 | 250 (36.4%) | 5 (0.6%) |
| $800 to $1,499 | 283 (41.2%) | 301 (36.7%) |
| Total | 687 (100.0%) | 819 (100.0%) |
Health & Disability in Lamont
Health Insurance Coverage by Age in Lamont
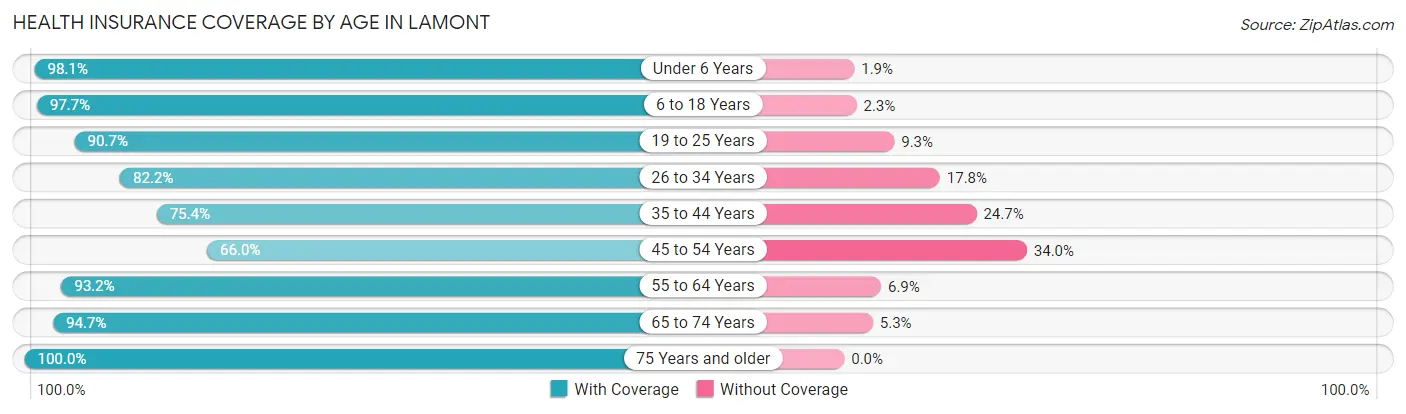
| Age Bracket | With Coverage | Without Coverage |
| Under 6 Years | 1,372 (98.1%) | 26 (1.9%) |
| 6 to 18 Years | 3,336 (97.7%) | 78 (2.3%) |
| 19 to 25 Years | 1,382 (90.7%) | 142 (9.3%) |
| 26 to 34 Years | 1,130 (82.2%) | 245 (17.8%) |
| 35 to 44 Years | 1,287 (75.3%) | 421 (24.6%) |
| 45 to 54 Years | 903 (66.0%) | 466 (34.0%) |
| 55 to 64 Years | 1,536 (93.1%) | 113 (6.9%) |
| 65 to 74 Years | 855 (94.7%) | 48 (5.3%) |
| 75 Years and older | 375 (100.0%) | 0 (0.0%) |
| Total | 12,176 (88.8%) | 1,539 (11.2%) |
Health Insurance Coverage by Citizenship Status in Lamont
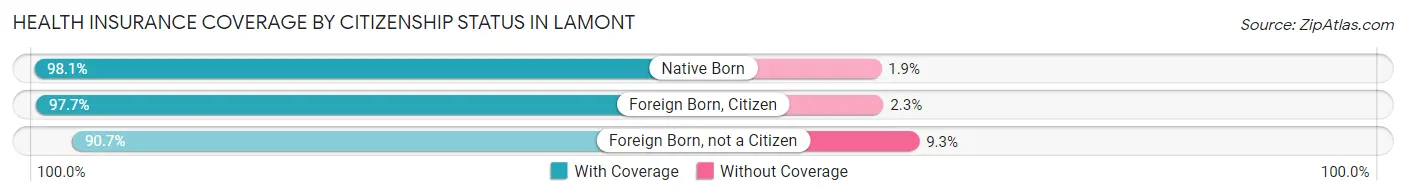
| Citizenship Status | With Coverage | Without Coverage |
| Native Born | 1,372 (98.1%) | 26 (1.9%) |
| Foreign Born, Citizen | 3,336 (97.7%) | 78 (2.3%) |
| Foreign Born, not a Citizen | 1,382 (90.7%) | 142 (9.3%) |
Health Insurance Coverage by Household Income in Lamont
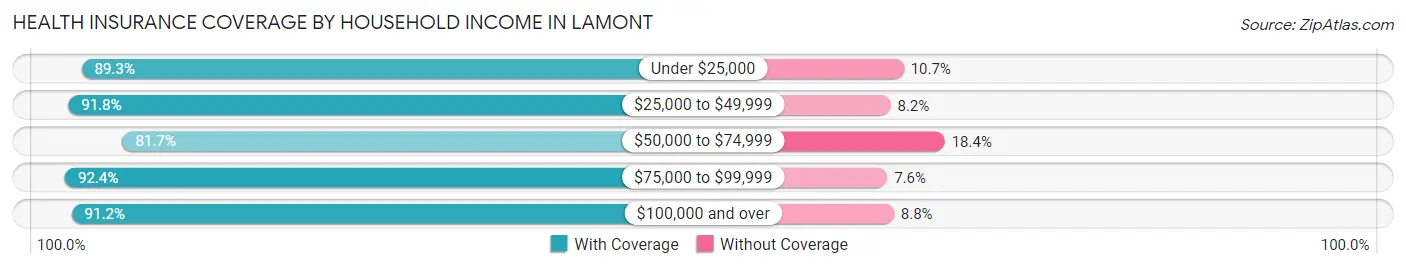
| Household Income | With Coverage | Without Coverage |
| Under $25,000 | 2,683 (89.3%) | 320 (10.7%) |
| $25,000 to $49,999 | 4,092 (91.8%) | 365 (8.2%) |
| $50,000 to $74,999 | 2,746 (81.7%) | 617 (18.3%) |
| $75,000 to $99,999 | 1,353 (92.4%) | 111 (7.6%) |
| $100,000 and over | 1,302 (91.2%) | 126 (8.8%) |
Public vs Private Health Insurance Coverage by Age in Lamont
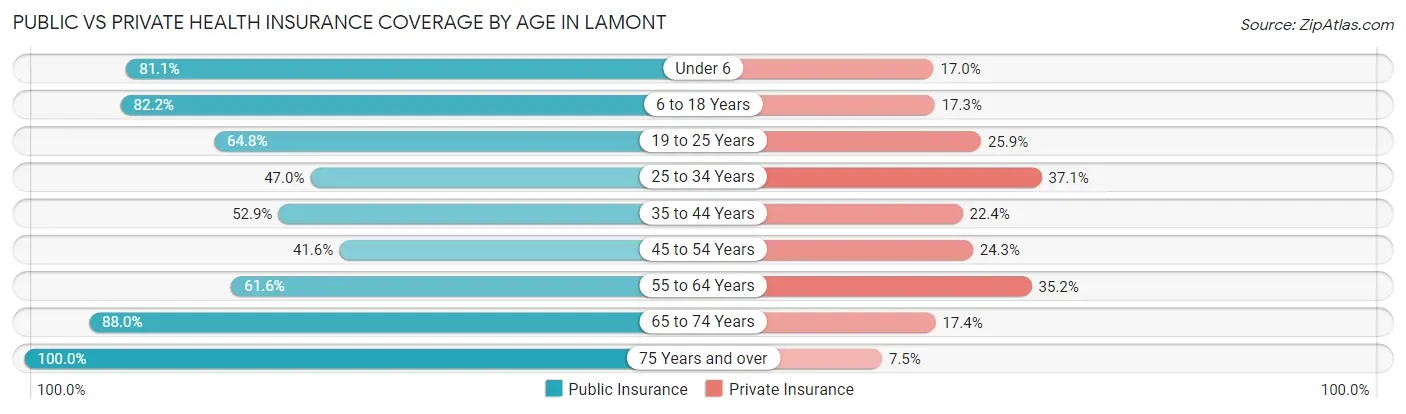
| Age Bracket | Public Insurance | Private Insurance |
| Under 6 | 1,134 (81.1%) | 238 (17.0%) |
| 6 to 18 Years | 2,805 (82.2%) | 589 (17.2%) |
| 19 to 25 Years | 988 (64.8%) | 394 (25.9%) |
| 25 to 34 Years | 646 (47.0%) | 510 (37.1%) |
| 35 to 44 Years | 904 (52.9%) | 383 (22.4%) |
| 45 to 54 Years | 570 (41.6%) | 333 (24.3%) |
| 55 to 64 Years | 1,016 (61.6%) | 581 (35.2%) |
| 65 to 74 Years | 795 (88.0%) | 157 (17.4%) |
| 75 Years and over | 375 (100.0%) | 28 (7.5%) |
| Total | 9,233 (67.3%) | 3,213 (23.4%) |
Disability Status by Sex by Age in Lamont
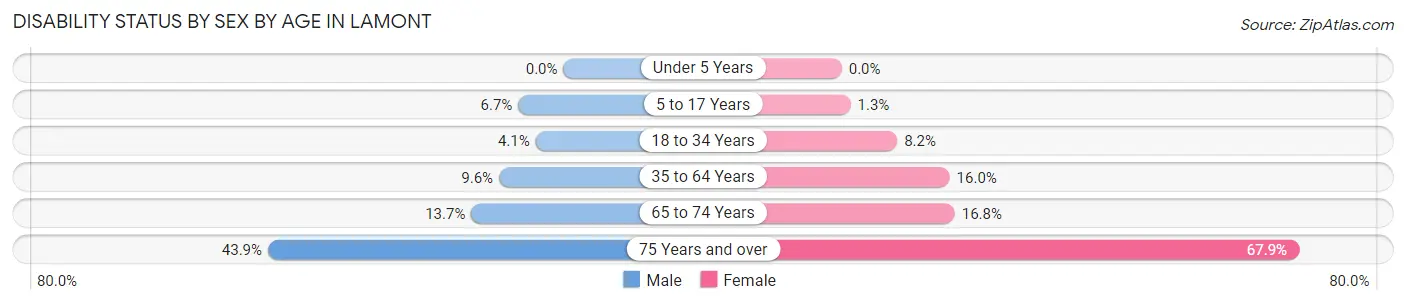
| Age Bracket | Male | Female |
| Under 5 Years | 0 (0.0%) | 0 (0.0%) |
| 5 to 17 Years | 115 (6.7%) | 21 (1.3%) |
| 18 to 34 Years | 65 (4.1%) | 137 (8.2%) |
| 35 to 64 Years | 256 (9.6%) | 328 (16.0%) |
| 65 to 74 Years | 64 (13.7%) | 73 (16.8%) |
| 75 Years and over | 43 (43.9%) | 188 (67.9%) |
Disability Class by Sex by Age in Lamont
Disability Class: Hearing Difficulty
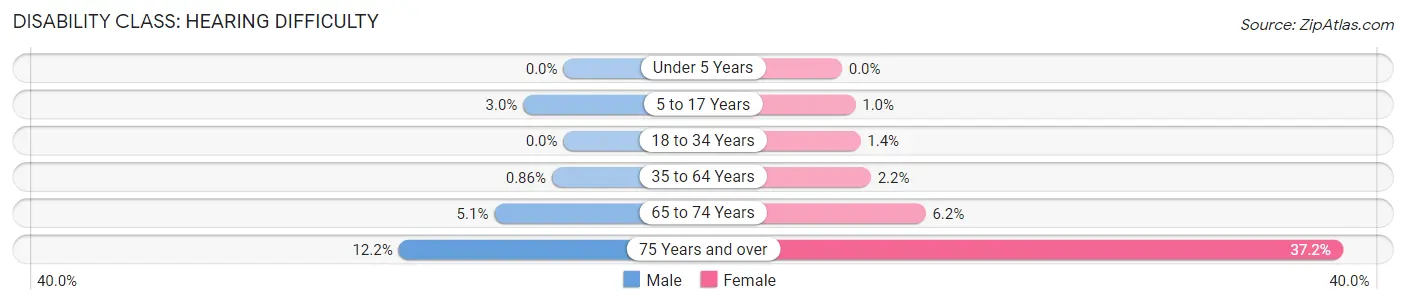
| Age Bracket | Male | Female |
| Under 5 Years | 0 (0.0%) | 0 (0.0%) |
| 5 to 17 Years | 51 (3.0%) | 16 (1.0%) |
| 18 to 34 Years | 0 (0.0%) | 23 (1.4%) |
| 35 to 64 Years | 23 (0.9%) | 44 (2.1%) |
| 65 to 74 Years | 24 (5.1%) | 27 (6.2%) |
| 75 Years and over | 12 (12.2%) | 103 (37.2%) |
Disability Class: Vision Difficulty
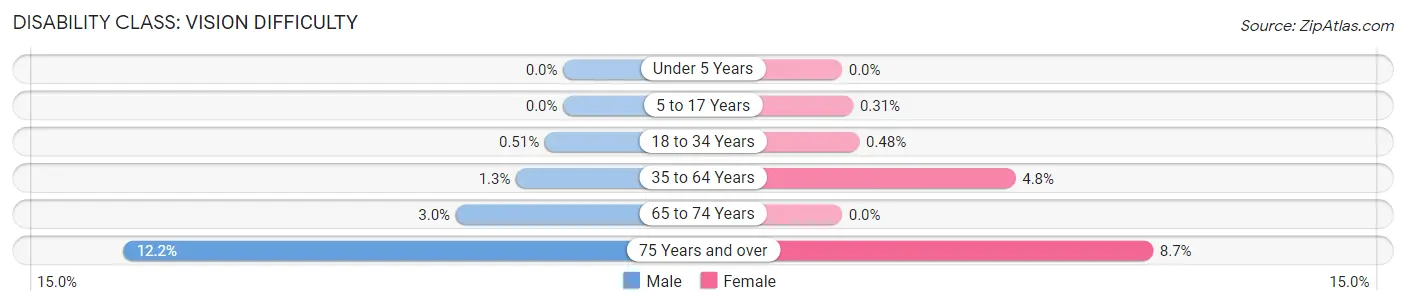
| Age Bracket | Male | Female |
| Under 5 Years | 0 (0.0%) | 0 (0.0%) |
| 5 to 17 Years | 0 (0.0%) | 5 (0.3%) |
| 18 to 34 Years | 8 (0.5%) | 8 (0.5%) |
| 35 to 64 Years | 35 (1.3%) | 99 (4.8%) |
| 65 to 74 Years | 14 (3.0%) | 0 (0.0%) |
| 75 Years and over | 12 (12.2%) | 24 (8.7%) |
Disability Class: Cognitive Difficulty
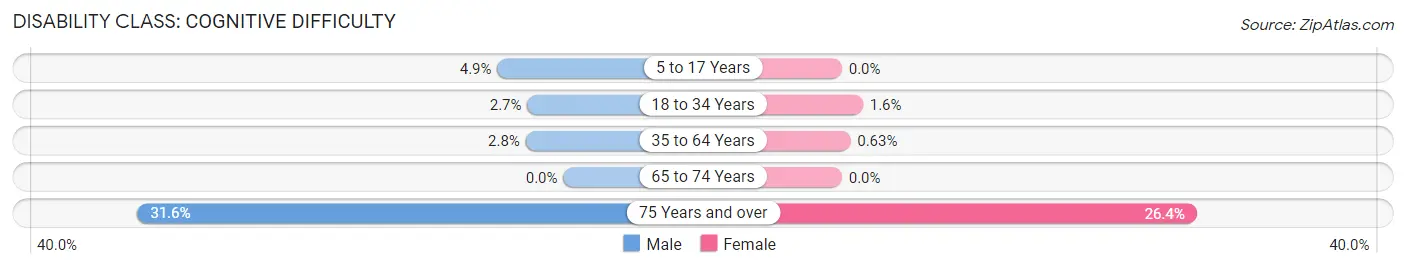
| Age Bracket | Male | Female |
| 5 to 17 Years | 84 (4.9%) | 0 (0.0%) |
| 18 to 34 Years | 42 (2.7%) | 26 (1.6%) |
| 35 to 64 Years | 75 (2.8%) | 13 (0.6%) |
| 65 to 74 Years | 0 (0.0%) | 0 (0.0%) |
| 75 Years and over | 31 (31.6%) | 73 (26.4%) |
Disability Class: Ambulatory Difficulty
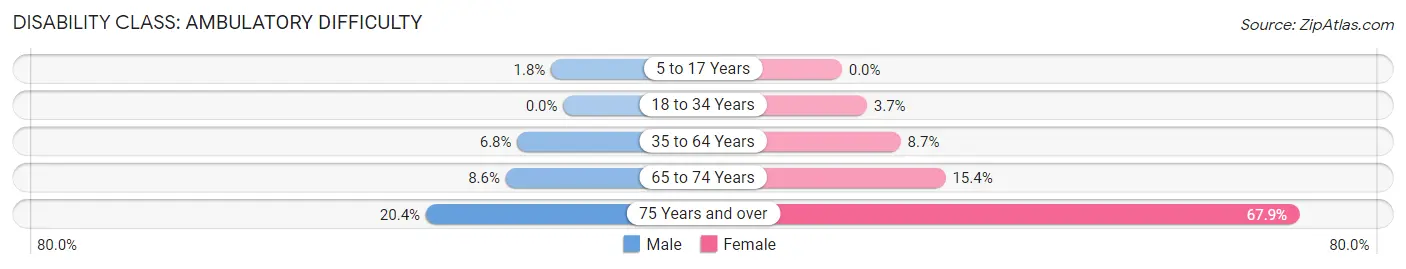
| Age Bracket | Male | Female |
| 5 to 17 Years | 31 (1.8%) | 0 (0.0%) |
| 18 to 34 Years | 0 (0.0%) | 62 (3.7%) |
| 35 to 64 Years | 183 (6.8%) | 179 (8.7%) |
| 65 to 74 Years | 40 (8.6%) | 67 (15.4%) |
| 75 Years and over | 20 (20.4%) | 188 (67.9%) |
Disability Class: Self-Care Difficulty
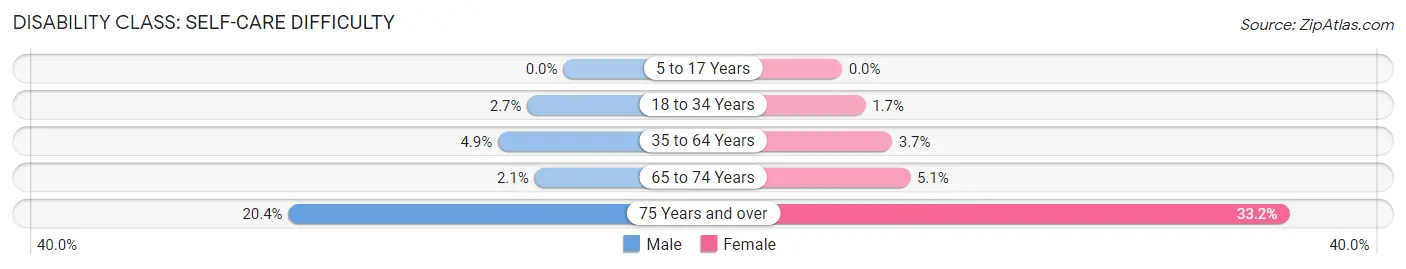
| Age Bracket | Male | Female |
| 5 to 17 Years | 0 (0.0%) | 0 (0.0%) |
| 18 to 34 Years | 42 (2.7%) | 29 (1.7%) |
| 35 to 64 Years | 130 (4.9%) | 76 (3.7%) |
| 65 to 74 Years | 10 (2.1%) | 22 (5.1%) |
| 75 Years and over | 20 (20.4%) | 92 (33.2%) |
Technology Access in Lamont
Computing Device Access in Lamont
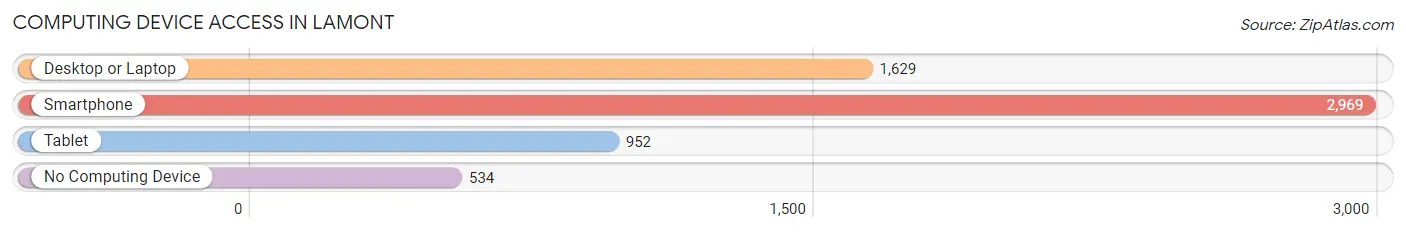
| Device Type | # Households | % Households |
| Desktop or Laptop | 1,629 | 45.1% |
| Smartphone | 2,969 | 82.2% |
| Tablet | 952 | 26.4% |
| No Computing Device | 534 | 14.8% |
| Total | 3,612 | 100.0% |
Internet Access in Lamont
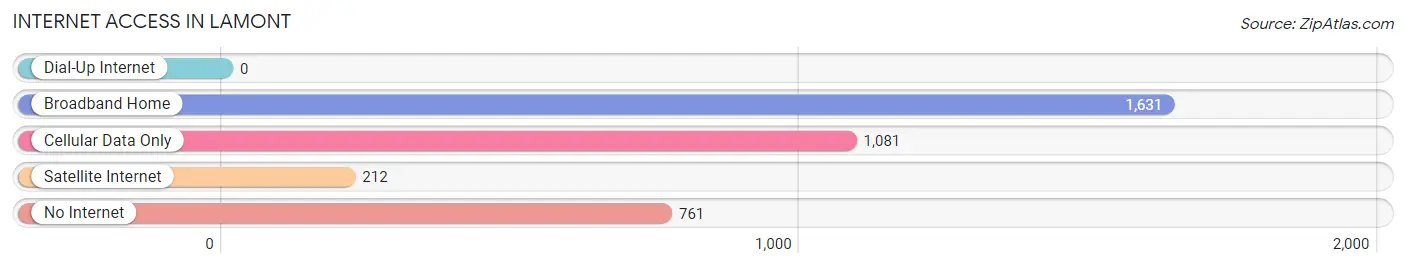
| Internet Type | # Households | % Households |
| Dial-Up Internet | 0 | 0.0% |
| Broadband Home | 1,631 | 45.2% |
| Cellular Data Only | 1,081 | 29.9% |
| Satellite Internet | 212 | 5.9% |
| No Internet | 761 | 21.1% |
| Total | 3,612 | 100.0% |
Lamont Summary
Lamont is a census-designated place located in Kern County, California, United States. It is located in the San Joaquin Valley, about 10 miles (16 km) east of Bakersfield. The population was 8,845 at the 2010 census, up from 6,813 at the 2000 census.
History
Lamont was founded in 1887 by the Lamont family, who were among the first settlers in the area. The town was named after the family's patriarch, William Lamont. The town was originally a farming community, and the Lamont family grew wheat, barley, and alfalfa. The town was also home to a number of small businesses, including a general store, a blacksmith shop, and a post office.
In the early 1900s, the town began to grow as oil was discovered in the area. The town was incorporated in 1911, and the population grew to over 1,000 by the 1920s. The town was home to a number of oil companies, including the Lamont Oil Company, which was founded by William Lamont's son, William Lamont Jr.
In the 1950s, the town began to decline as the oil industry moved away from the area. The population dropped to just over 500 by the 1970s. In the 1980s, the town began to experience a resurgence as new businesses moved into the area. The population has grown steadily since then, and the town now has a population of over 8,000.
Geography
Lamont is located at 35 19 25 North 119 1 25 West 35 323750 119 023750
According to the United States Census Bureau, the CDP has a total area of 4.3 square miles (11.2 km2), all of it land.
Economy
Lamont is primarily a farming community, and the main crops grown in the area are cotton, alfalfa, and wheat. The town is also home to a number of small businesses, including a grocery store, a hardware store, and a gas station.
Demographics
As of the census of 2000, there were 6,813 people, 2,072 households, and 1,717 families residing in the CDP. The population density was 1,569.3 people per square mile (606.2/km2). There were 2,179 housing units at an average density of 507.3 per square mile (195.9/km2). The racial makeup of the CDP was 68.2% White, 0.7% African American, 1.2% Native American, 0.4% Asian, 0.1% Pacific Islander, 25.7% from other races, and 3.7% from two or more races. Hispanic or Latino of any race were 44.2% of the population.
There were 2,072 households, out of which 44.2% had children under the age of 18 living with them, 62.2% were married couples living together, 13.2% had a female householder with no husband present, and 19.2% were non-families. 15.2% of all households were made up of individuals, and 6.2% had someone living alone who was 65 years of age or older. The average household size was 3.30 and the average family size was 3.67.
In the CDP, the population was spread out, with 33.2% under the age of 18, 10.2% from 18 to 24, 28.2% from 25 to 44, 19.2% from 45 to 64, and 9.2% who were 65 years of age or older. The median age was 30 years. For every 100 females, there were 97.2 males. For every 100 females age 18 and over, there were 94.2 males.
The median income for a household in the CDP was $30,938, and the median income for a family was $33,906. Males had a median income of $27,917 versus $20,938 for females. The per capita income for the CDP was $11,845. About 17.2% of families and 20.2% of the population were below the poverty line, including 25.2% of those under age 18 and 10.2% of those age 65 or over.
Common Questions
What is Per Capita Income in Lamont?
Per Capita income in Lamont is $13,737.
What is the Median Family Income in Lamont?
Median Family Income in Lamont is $36,566.
What is the Median Household income in Lamont?
Median Household Income in Lamont is $37,164.
What is Income or Wage Gap in Lamont?
Income or Wage Gap in Lamont is 31.4%.
Women in Lamont earn 68.6 cents for every dollar earned by a man.
What is Inequality or Gini Index in Lamont?
Inequality or Gini Index in Lamont is 0.40.
What is the Total Population of Lamont?
Total Population of Lamont is 13,715.
What is the Total Male Population of Lamont?
Total Male Population of Lamont is 7,171.
What is the Total Female Population of Lamont?
Total Female Population of Lamont is 6,544.
What is the Ratio of Males per 100 Females in Lamont?
There are 109.58 Males per 100 Females in Lamont.
What is the Ratio of Females per 100 Males in Lamont?
There are 91.26 Females per 100 Males in Lamont.
What is the Median Population Age in Lamont?
Median Population Age in Lamont is 30.4 Years.
What is the Average Family Size in Lamont
Average Family Size in Lamont is 4.0 People.
What is the Average Household Size in Lamont
Average Household Size in Lamont is 3.8 People.
How Large is the Labor Force in Lamont?
There are 5,497 People in the Labor Forcein in Lamont.
What is the Percentage of People in the Labor Force in Lamont?
57.3% of People are in the Labor Force in Lamont.
What is the Unemployment Rate in Lamont?
Unemployment Rate in Lamont is 9.5%.