La Habra, CA Map & Demographics
La Habra Map
La Habra Overview
$37,527
PER CAPITA INCOME
$96,699
AVG FAMILY INCOME
$93,801
AVG HOUSEHOLD INCOME
19.5%
WAGE / INCOME GAP [ % ]
80.5¢/ $1
WAGE / INCOME GAP [ $ ]
$10,900
FAMILY INCOME DEFICIT
0.41
INEQUALITY / GINI INDEX
62,904
TOTAL POPULATION
31,681
MALE POPULATION
31,223
FEMALE POPULATION
101.47
MALES / 100 FEMALES
98.55
FEMALES / 100 MALES
37.7
MEDIAN AGE
3.5
AVG FAMILY SIZE
3.1
AVG HOUSEHOLD SIZE
34,703
LABOR FORCE [ PEOPLE ]
68.3%
PERCENT IN LABOR FORCE
7.2%
UNEMPLOYMENT RATE
La Habra Zip Codes
Income in La Habra
Income Overview in La Habra
Per Capita Income in La Habra is $37,527, while median incomes of families and households are $96,699 and $93,801 respectively.
| Characteristic | Number | Measure |
| Per Capita Income | 62,904 | $37,527 |
| Median Family Income | 15,182 | $96,699 |
| Mean Family Income | 15,182 | $119,083 |
| Median Household Income | 20,188 | $93,801 |
| Mean Household Income | 20,188 | $112,878 |
| Income Deficit | 15,182 | $10,900 |
| Wage / Income Gap (%) | 62,904 | 19.50% |
| Wage / Income Gap ($) | 62,904 | 80.50¢ per $1 |
| Gini / Inequality Index | 62,904 | 0.41 |
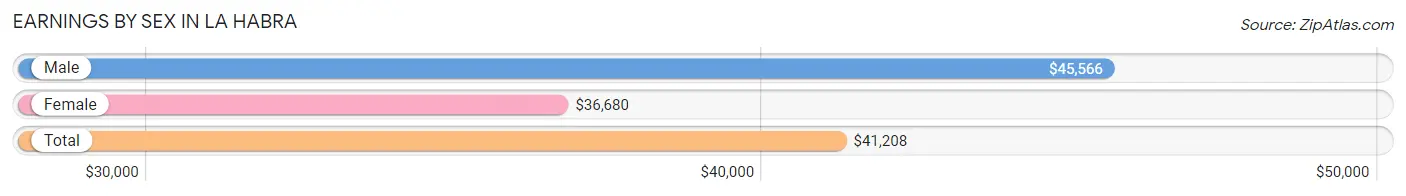
Earnings by Sex in La Habra
Average Earnings in La Habra are $41,208, $45,566 for men and $36,680 for women, a difference of 19.5%.
| Sex | Number | Average Earnings |
| Male | 18,812 (53.5%) | $45,566 |
| Female | 16,346 (46.5%) | $36,680 |
| Total | 35,158 (100.0%) | $41,208 |
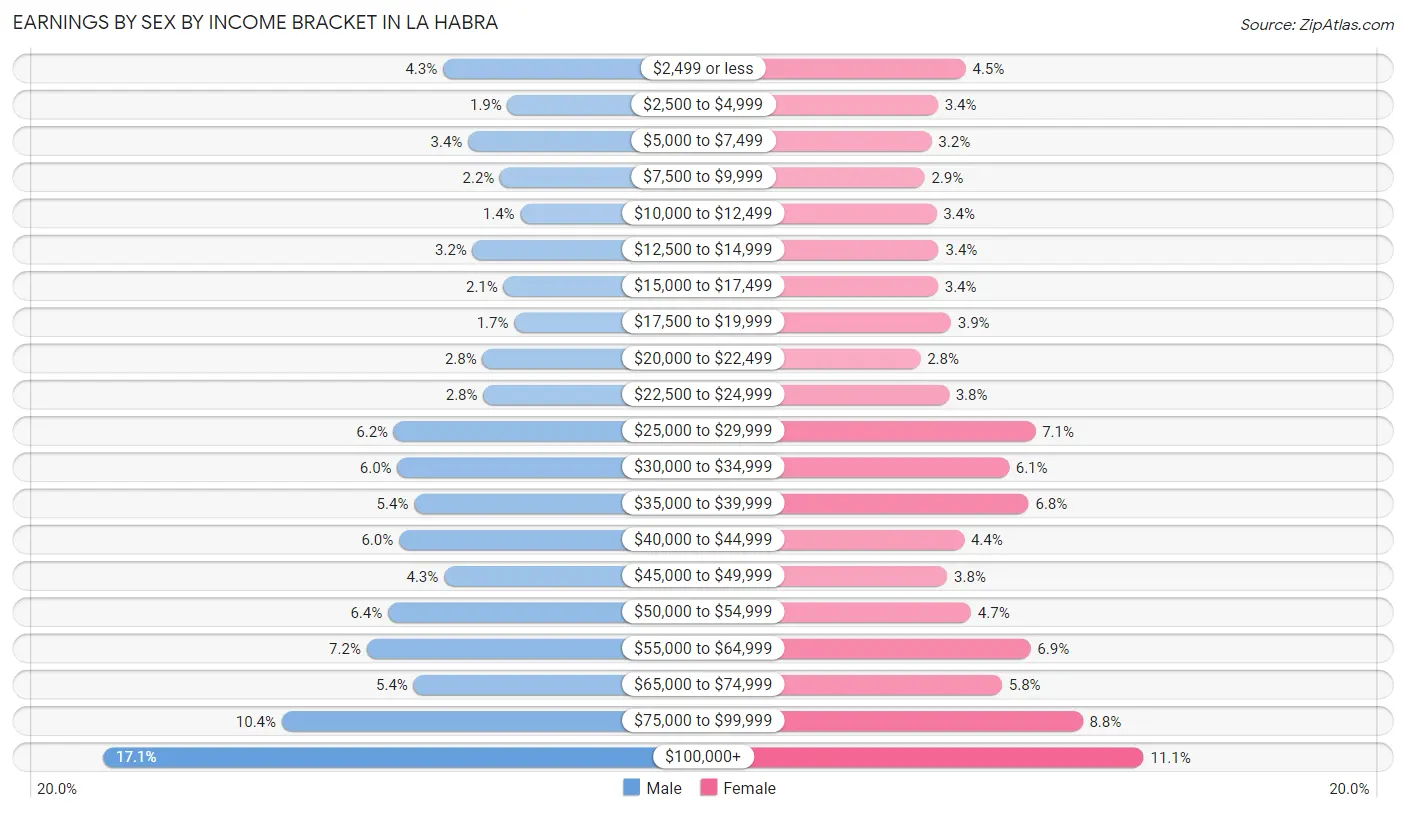
Earnings by Sex by Income Bracket in La Habra
The most common earnings brackets in La Habra are $100,000+ for men (3,210 | 17.1%) and $100,000+ for women (1,818 | 11.1%).
| Income | Male | Female |
| $2,499 or less | 812 (4.3%) | 728 (4.4%) |
| $2,500 to $4,999 | 358 (1.9%) | 557 (3.4%) |
| $5,000 to $7,499 | 635 (3.4%) | 518 (3.2%) |
| $7,500 to $9,999 | 410 (2.2%) | 475 (2.9%) |
| $10,000 to $12,499 | 267 (1.4%) | 548 (3.4%) |
| $12,500 to $14,999 | 604 (3.2%) | 563 (3.4%) |
| $15,000 to $17,499 | 385 (2.1%) | 557 (3.4%) |
| $17,500 to $19,999 | 310 (1.7%) | 637 (3.9%) |
| $20,000 to $22,499 | 534 (2.8%) | 449 (2.8%) |
| $22,500 to $24,999 | 529 (2.8%) | 625 (3.8%) |
| $25,000 to $29,999 | 1,159 (6.2%) | 1,154 (7.1%) |
| $30,000 to $34,999 | 1,135 (6.0%) | 993 (6.1%) |
| $35,000 to $39,999 | 1,015 (5.4%) | 1,113 (6.8%) |
| $40,000 to $44,999 | 1,123 (6.0%) | 718 (4.4%) |
| $45,000 to $49,999 | 806 (4.3%) | 615 (3.8%) |
| $50,000 to $54,999 | 1,201 (6.4%) | 760 (4.6%) |
| $55,000 to $64,999 | 1,351 (7.2%) | 1,124 (6.9%) |
| $65,000 to $74,999 | 1,020 (5.4%) | 950 (5.8%) |
| $75,000 to $99,999 | 1,948 (10.4%) | 1,444 (8.8%) |
| $100,000+ | 3,210 (17.1%) | 1,818 (11.1%) |
| Total | 18,812 (100.0%) | 16,346 (100.0%) |
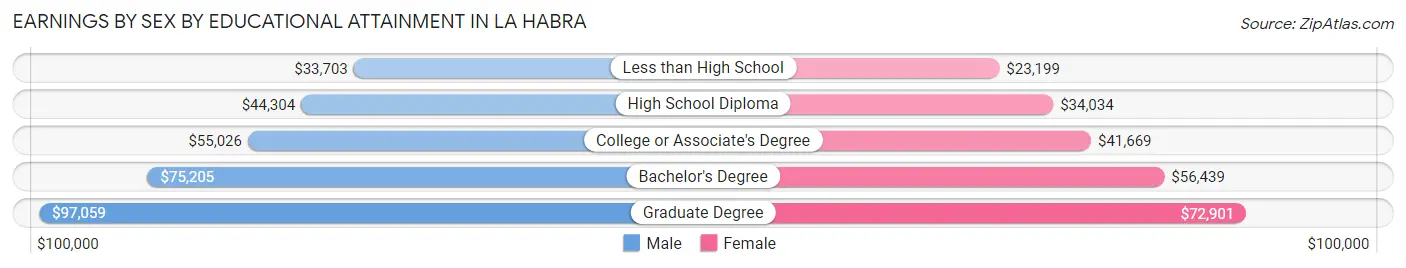
Earnings by Sex by Educational Attainment in La Habra
Average earnings in La Habra are $51,392 for men and $42,089 for women, a difference of 18.1%. Men with an educational attainment of graduate degree enjoy the highest average annual earnings of $97,059, while those with less than high school education earn the least with $33,703. Women with an educational attainment of graduate degree earn the most with the average annual earnings of $72,901, while those with less than high school education have the smallest earnings of $23,199.
| Educational Attainment | Male Income | Female Income |
| Less than High School | $33,703 | $23,199 |
| High School Diploma | $44,304 | $34,034 |
| College or Associate's Degree | $55,026 | $41,669 |
| Bachelor's Degree | $75,205 | $56,439 |
| Graduate Degree | $97,059 | $72,901 |
| Total | $51,392 | $42,089 |
Family Income in La Habra
Family Income Brackets in La Habra
According to the La Habra family income data, there are 3,127 families falling into the $100,000 to $149,999 income range, which is the most common income bracket and makes up 20.6% of all families. Conversely, the $10,000 to $14,999 income bracket is the least frequent group with only 228 families (1.5%) belonging to this category.
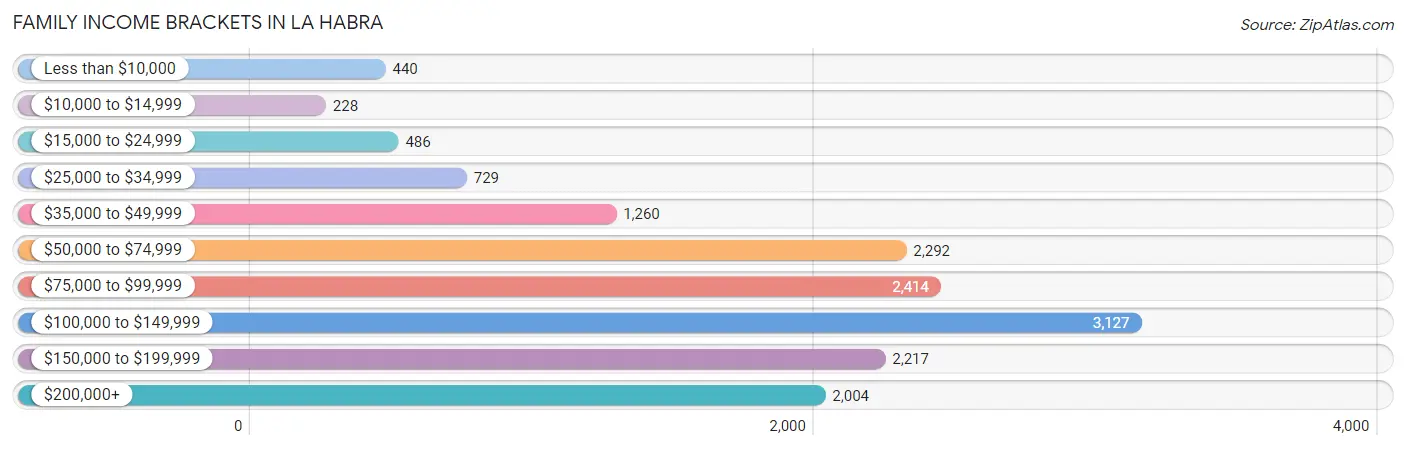
| Income Bracket | # Families | % Families |
| Less than $10,000 | 440 | 2.9% |
| $10,000 to $14,999 | 228 | 1.5% |
| $15,000 to $24,999 | 486 | 3.2% |
| $25,000 to $34,999 | 729 | 4.8% |
| $35,000 to $49,999 | 1,260 | 8.3% |
| $50,000 to $74,999 | 2,292 | 15.1% |
| $75,000 to $99,999 | 2,414 | 15.9% |
| $100,000 to $149,999 | 3,127 | 20.6% |
| $150,000 to $199,999 | 2,217 | 14.6% |
| $200,000+ | 2,004 | 13.2% |
Family Income by Famaliy Size in La Habra
7+ person families (476 | 3.1%) account for the highest median family income in La Habra with $155,739 per family, while 2-person families (5,378 | 35.4%) have the highest median income of $43,354 per family member.
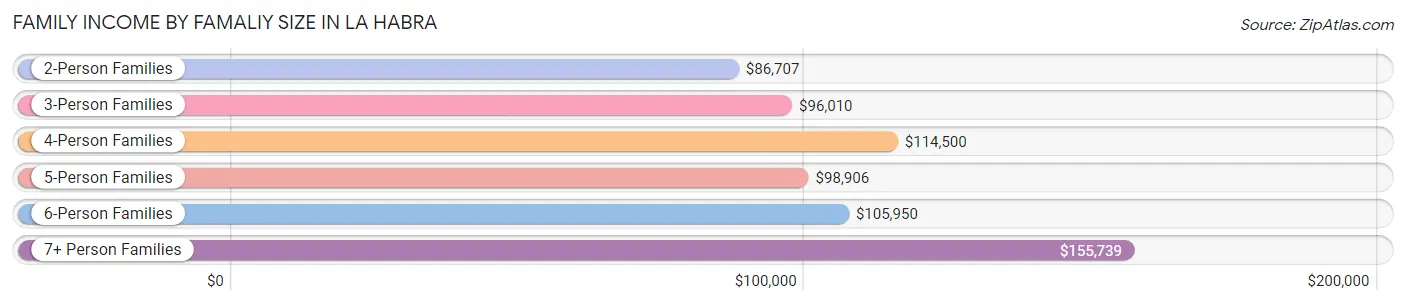
| Income Bracket | # Families | Median Income |
| 2-Person Families | 5,378 (35.4%) | $86,707 |
| 3-Person Families | 3,715 (24.5%) | $96,010 |
| 4-Person Families | 3,524 (23.2%) | $114,500 |
| 5-Person Families | 1,551 (10.2%) | $98,906 |
| 6-Person Families | 538 (3.5%) | $105,950 |
| 7+ Person Families | 476 (3.1%) | $155,739 |
| Total | 15,182 (100.0%) | $96,699 |
Family Income by Number of Earners in La Habra
The median family income in La Habra is $96,699, with families comprising 3+ earners (3,250) having the highest median family income of $141,709, while families with no earners (1,359) have the lowest median family income of $60,625, accounting for 21.4% and 8.9% of families, respectively.
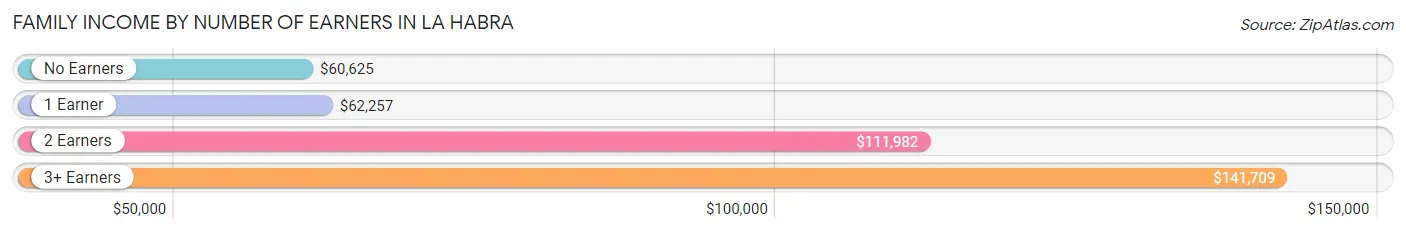
| Number of Earners | # Families | Median Income |
| No Earners | 1,359 (8.9%) | $60,625 |
| 1 Earner | 4,542 (29.9%) | $62,257 |
| 2 Earners | 6,031 (39.7%) | $111,982 |
| 3+ Earners | 3,250 (21.4%) | $141,709 |
| Total | 15,182 (100.0%) | $96,699 |
Household Income in La Habra
Household Income Brackets in La Habra
With 4,401 households falling in the category, the $100,000 to $149,999 income range is the most frequent in La Habra, accounting for 21.8% of all households. In contrast, only 606 households (3.0%) fall into the $10,000 to $14,999 income bracket, making it the least populous group.
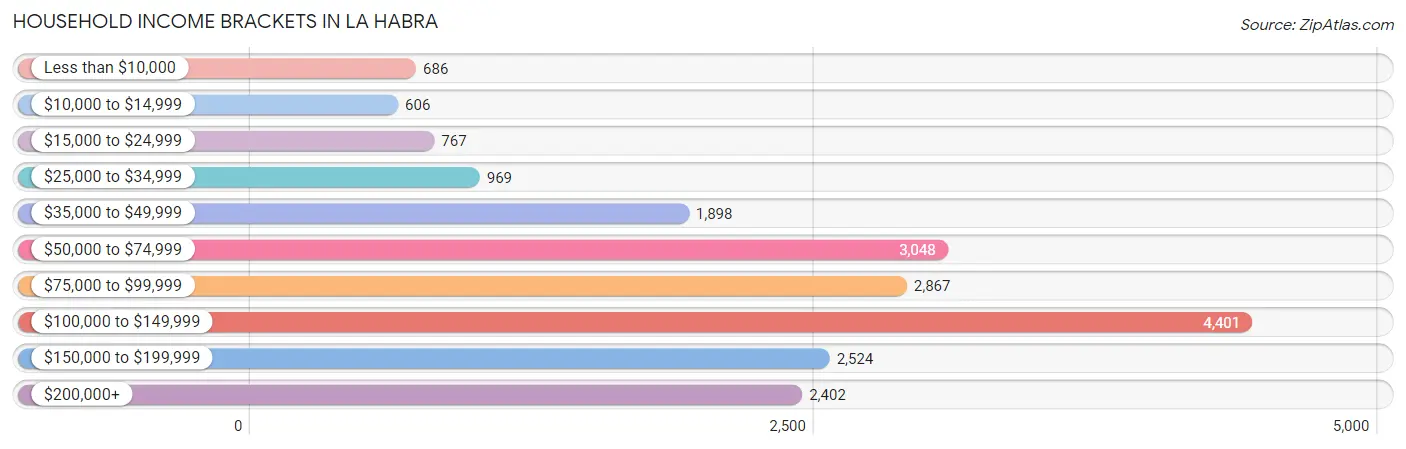
| Income Bracket | # Households | % Households |
| Less than $10,000 | 686 | 3.4% |
| $10,000 to $14,999 | 606 | 3.0% |
| $15,000 to $24,999 | 767 | 3.8% |
| $25,000 to $34,999 | 969 | 4.8% |
| $35,000 to $49,999 | 1,898 | 9.4% |
| $50,000 to $74,999 | 3,048 | 15.1% |
| $75,000 to $99,999 | 2,867 | 14.2% |
| $100,000 to $149,999 | 4,401 | 21.8% |
| $150,000 to $199,999 | 2,524 | 12.5% |
| $200,000+ | 2,402 | 11.9% |
Household Income by Householder Age in La Habra
The median household income in La Habra is $93,801, with the highest median household income of $107,213 found in the 45 to 64 years age bracket for the primary householder. A total of 8,825 households (43.7%) fall into this category. Meanwhile, the 15 to 24 years age bracket for the primary householder has the lowest median household income of $59,236, with 271 households (1.3%) in this group.
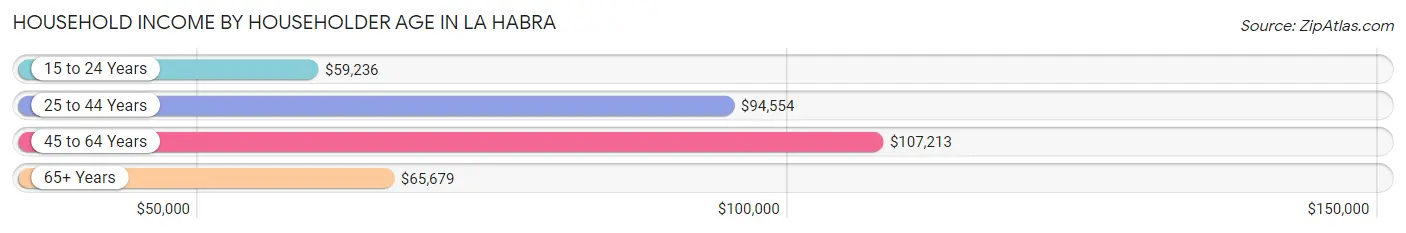
| Income Bracket | # Households | Median Income |
| 15 to 24 Years | 271 (1.3%) | $59,236 |
| 25 to 44 Years | 6,490 (32.2%) | $94,554 |
| 45 to 64 Years | 8,825 (43.7%) | $107,213 |
| 65+ Years | 4,602 (22.8%) | $65,679 |
| Total | 20,188 (100.0%) | $93,801 |
Poverty in La Habra
Income Below Poverty by Sex and Age in La Habra
With 9.6% poverty level for males and 10.0% for females among the residents of La Habra, 75 year old and over males and 6 to 11 year old females are the most vulnerable to poverty, with 219 males (15.8%) and 314 females (15.4%) in their respective age groups living below the poverty level.
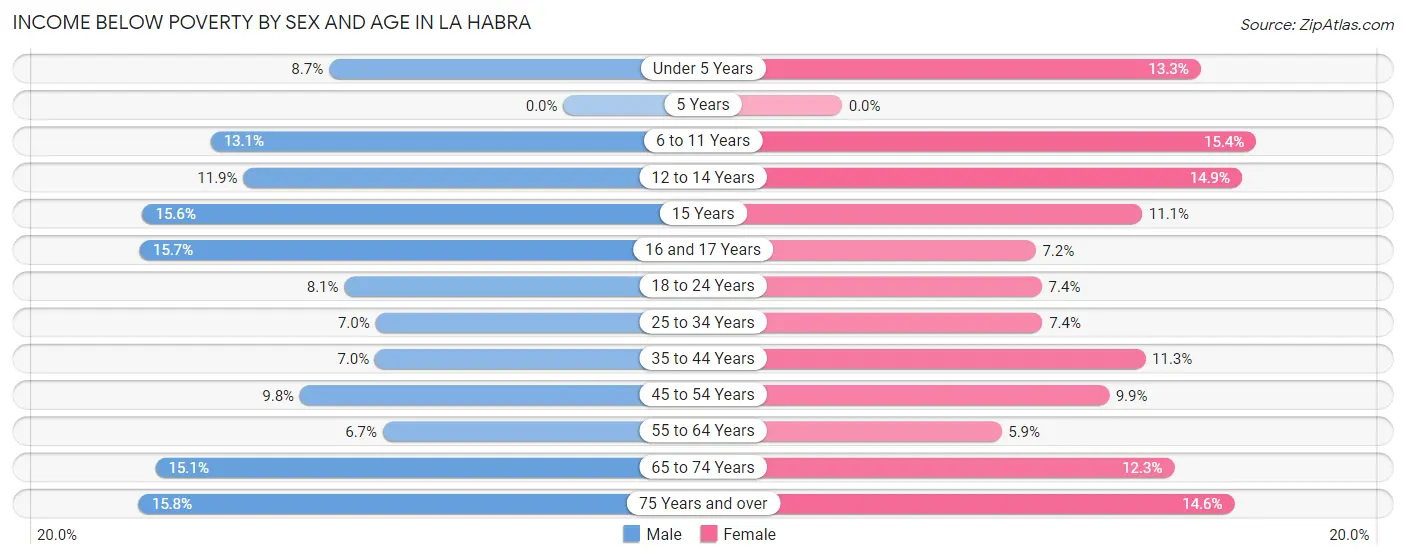
| Age Bracket | Male | Female |
| Under 5 Years | 174 (8.7%) | 197 (13.3%) |
| 5 Years | 0 (0.0%) | 0 (0.0%) |
| 6 to 11 Years | 321 (13.1%) | 314 (15.4%) |
| 12 to 14 Years | 170 (11.9%) | 151 (14.8%) |
| 15 Years | 72 (15.6%) | 51 (11.1%) |
| 16 and 17 Years | 139 (15.7%) | 59 (7.2%) |
| 18 to 24 Years | 252 (8.1%) | 210 (7.4%) |
| 25 to 34 Years | 337 (7.0%) | 358 (7.4%) |
| 35 to 44 Years | 280 (7.0%) | 440 (11.3%) |
| 45 to 54 Years | 432 (9.8%) | 412 (9.9%) |
| 55 to 64 Years | 245 (6.7%) | 268 (5.9%) |
| 65 to 74 Years | 393 (15.1%) | 301 (12.3%) |
| 75 Years and over | 219 (15.8%) | 328 (14.6%) |
| Total | 3,034 (9.6%) | 3,089 (10.0%) |
Income Above Poverty by Sex and Age in La Habra
According to the poverty statistics in La Habra, males aged 5 years and females aged 5 years are the age groups that are most secure financially, with 100.0% of males and 100.0% of females in these age groups living above the poverty line.
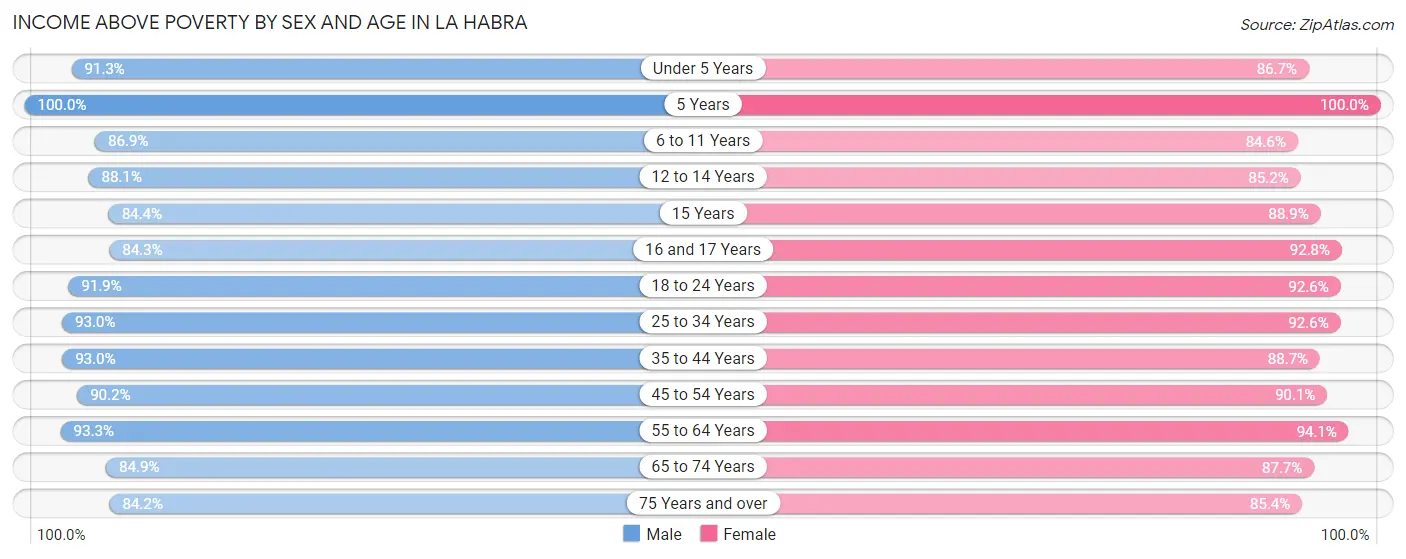
| Age Bracket | Male | Female |
| Under 5 Years | 1,825 (91.3%) | 1,282 (86.7%) |
| 5 Years | 286 (100.0%) | 207 (100.0%) |
| 6 to 11 Years | 2,131 (86.9%) | 1,727 (84.6%) |
| 12 to 14 Years | 1,261 (88.1%) | 866 (85.2%) |
| 15 Years | 389 (84.4%) | 407 (88.9%) |
| 16 and 17 Years | 745 (84.3%) | 762 (92.8%) |
| 18 to 24 Years | 2,846 (91.9%) | 2,620 (92.6%) |
| 25 to 34 Years | 4,499 (93.0%) | 4,453 (92.6%) |
| 35 to 44 Years | 3,728 (93.0%) | 3,468 (88.7%) |
| 45 to 54 Years | 3,983 (90.2%) | 3,746 (90.1%) |
| 55 to 64 Years | 3,413 (93.3%) | 4,261 (94.1%) |
| 65 to 74 Years | 2,203 (84.9%) | 2,138 (87.7%) |
| 75 Years and over | 1,171 (84.2%) | 1,923 (85.4%) |
| Total | 28,480 (90.4%) | 27,860 (90.0%) |
Income Below Poverty Among Married-Couple Families in La Habra
The poverty statistics for married-couple families in La Habra show that 6.0% or 652 of the total 10,776 families live below the poverty line. Families with 3 or 4 children have the highest poverty rate of 12.4%, comprising of 99 families. On the other hand, families with 5 or more children have the lowest poverty rate of 0.0%, which includes 0 families.
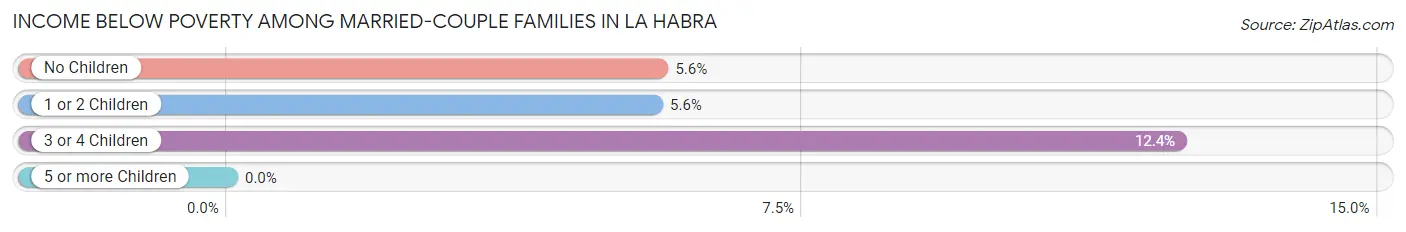
| Children | Above Poverty | Below Poverty |
| No Children | 5,494 (94.4%) | 327 (5.6%) |
| 1 or 2 Children | 3,848 (94.5%) | 226 (5.6%) |
| 3 or 4 Children | 700 (87.6%) | 99 (12.4%) |
| 5 or more Children | 82 (100.0%) | 0 (0.0%) |
| Total | 10,124 (94.0%) | 652 (6.0%) |
Income Below Poverty Among Single-Parent Households in La Habra
According to the poverty data in La Habra, 5.7% or 96 single-father households and 15.4% or 418 single-mother households are living below the poverty line. Among single-father households, those with 1 or 2 children have the highest poverty rate, with 76 households (11.5%) experiencing poverty. Likewise, among single-mother households, those with 3 or 4 children have the highest poverty rate, with 83 households (28.2%) falling below the poverty line.
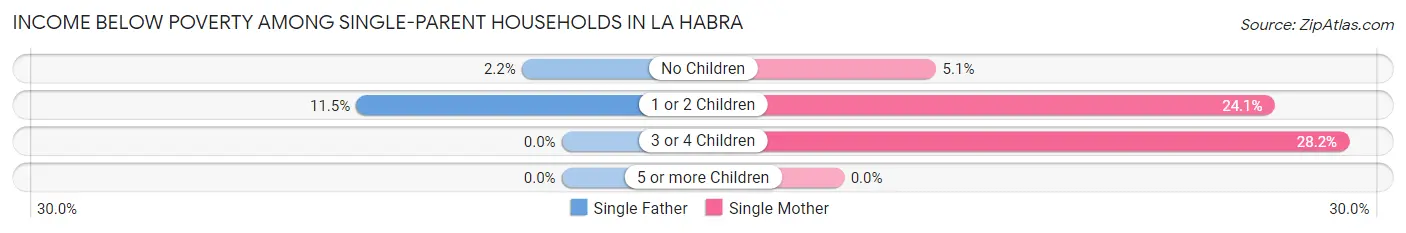
| Children | Single Father | Single Mother |
| No Children | 20 (2.2%) | 65 (5.1%) |
| 1 or 2 Children | 76 (11.5%) | 270 (24.1%) |
| 3 or 4 Children | 0 (0.0%) | 83 (28.2%) |
| 5 or more Children | 0 (0.0%) | 0 (0.0%) |
| Total | 96 (5.7%) | 418 (15.4%) |
Income Below Poverty Among Married-Couple vs Single-Parent Households in La Habra
The poverty data for La Habra shows that 652 of the married-couple family households (6.0%) and 514 of the single-parent households (11.7%) are living below the poverty level. Within the married-couple family households, those with 3 or 4 children have the highest poverty rate, with 99 households (12.4%) falling below the poverty line. Among the single-parent households, those with 1 or 2 children have the highest poverty rate, with 346 household (19.4%) living below poverty.
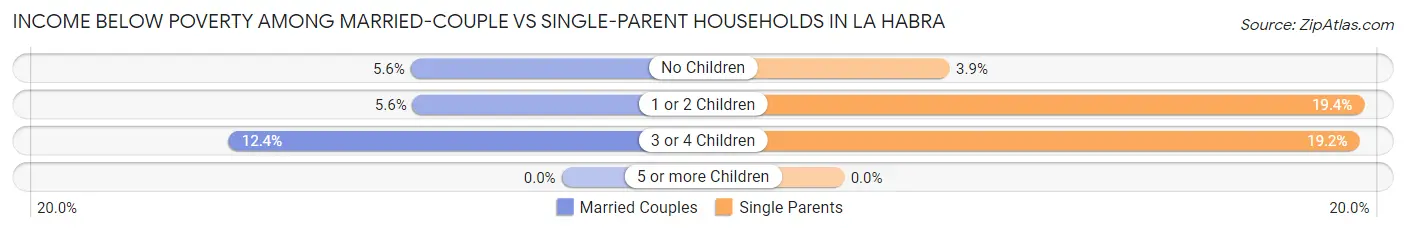
| Children | Married-Couple Families | Single-Parent Households |
| No Children | 327 (5.6%) | 85 (3.9%) |
| 1 or 2 Children | 226 (5.6%) | 346 (19.4%) |
| 3 or 4 Children | 99 (12.4%) | 83 (19.2%) |
| 5 or more Children | 0 (0.0%) | 0 (0.0%) |
| Total | 652 (6.0%) | 514 (11.7%) |
Race in La Habra
The most populous races in La Habra are Hispanic or Latino (37,583 | 59.8%), White / Caucasian (28,205 | 44.8%), and Some other Race (14,465 | 23.0%).
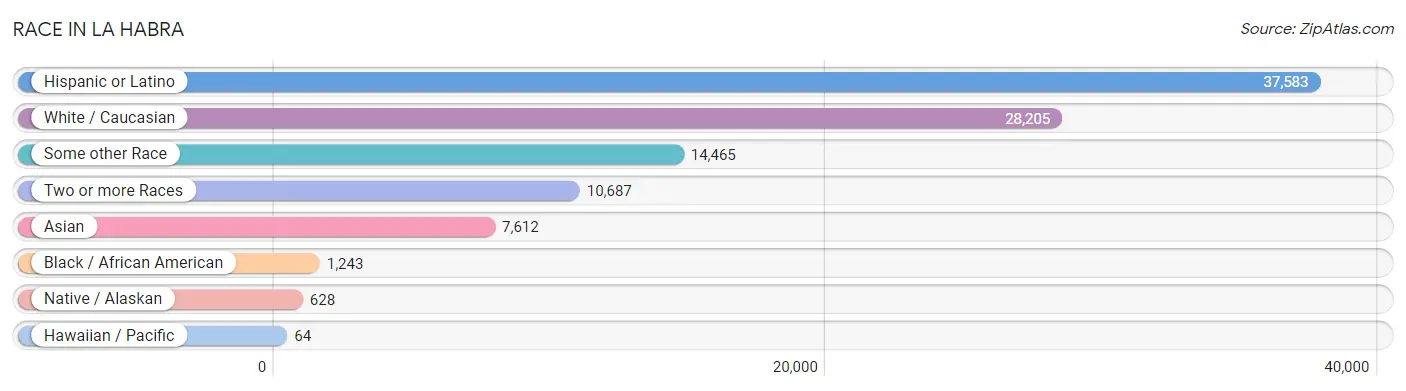
| Race | # Population | % Population |
| Asian | 7,612 | 12.1% |
| Black / African American | 1,243 | 2.0% |
| Hawaiian / Pacific | 64 | 0.1% |
| Hispanic or Latino | 37,583 | 59.8% |
| Native / Alaskan | 628 | 1.0% |
| White / Caucasian | 28,205 | 44.8% |
| Two or more Races | 10,687 | 17.0% |
| Some other Race | 14,465 | 23.0% |
| Total | 62,904 | 100.0% |
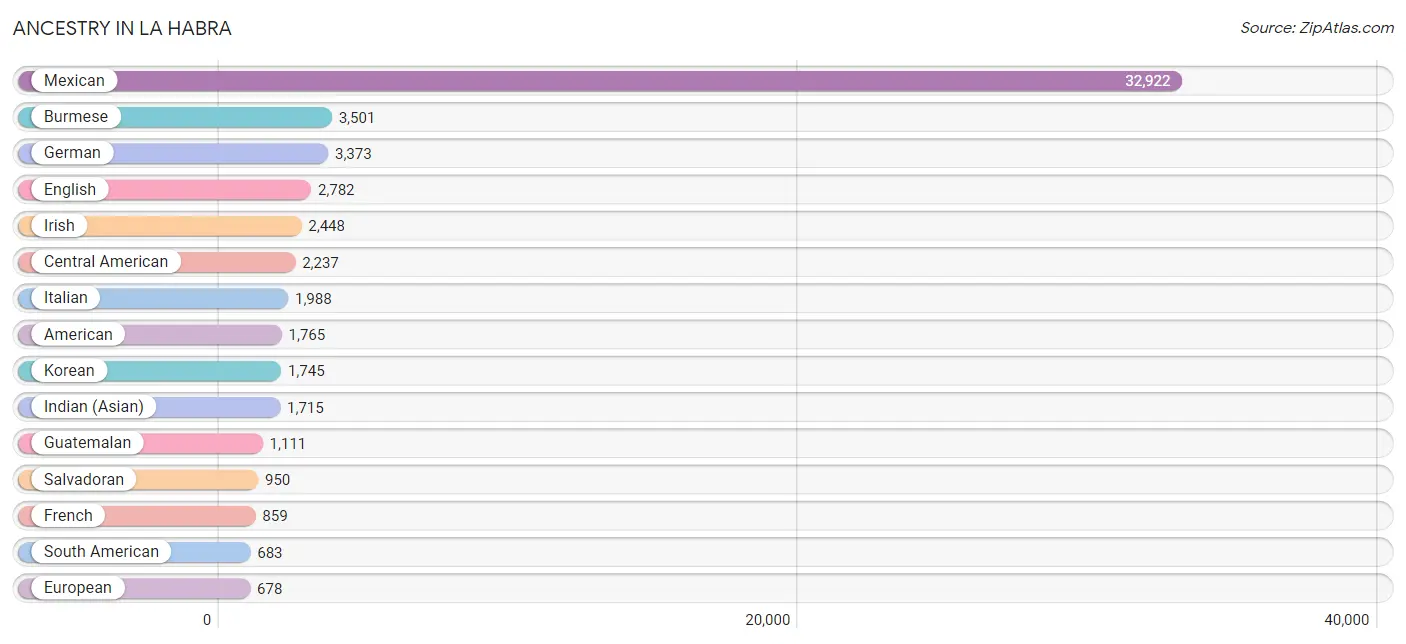
Ancestry in La Habra
The most populous ancestries reported in La Habra are Mexican (32,922 | 52.3%), Burmese (3,501 | 5.6%), German (3,373 | 5.4%), English (2,782 | 4.4%), and Irish (2,448 | 3.9%), together accounting for 71.6% of all La Habra residents.
| Ancestry | # Population | % Population |
| African | 35 | 0.1% |
| American | 1,765 | 2.8% |
| Apache | 97 | 0.2% |
| Arab | 357 | 0.6% |
| Argentinean | 45 | 0.1% |
| Armenian | 62 | 0.1% |
| Austrian | 15 | 0.0% |
| Basque | 22 | 0.0% |
| Belgian | 24 | 0.0% |
| Bhutanese | 487 | 0.8% |
| Blackfeet | 39 | 0.1% |
| Bolivian | 100 | 0.2% |
| British | 145 | 0.2% |
| Burmese | 3,501 | 5.6% |
| Canadian | 168 | 0.3% |
| Central American | 2,237 | 3.6% |
| Central American Indian | 169 | 0.3% |
| Cherokee | 99 | 0.2% |
| Chilean | 21 | 0.0% |
| Colombian | 92 | 0.2% |
| Comanche | 13 | 0.0% |
| Costa Rican | 53 | 0.1% |
| Creek | 20 | 0.0% |
| Croatian | 82 | 0.1% |
| Cuban | 475 | 0.8% |
| Czech | 19 | 0.0% |
| Czechoslovakian | 32 | 0.1% |
| Danish | 172 | 0.3% |
| Dutch | 518 | 0.8% |
| Eastern European | 38 | 0.1% |
| Ecuadorian | 346 | 0.5% |
| Egyptian | 98 | 0.2% |
| English | 2,782 | 4.4% |
| European | 678 | 1.1% |
| Filipino | 109 | 0.2% |
| French | 859 | 1.4% |
| French Canadian | 166 | 0.3% |
| German | 3,373 | 5.4% |
| Greek | 114 | 0.2% |
| Guamanian / Chamorro | 11 | 0.0% |
| Guatemalan | 1,111 | 1.8% |
| Haitian | 110 | 0.2% |
| Honduran | 11 | 0.0% |
| Hungarian | 124 | 0.2% |
| Indian (Asian) | 1,715 | 2.7% |
| Indonesian | 33 | 0.1% |
| Iranian | 92 | 0.2% |
| Irish | 2,448 | 3.9% |
| Israeli | 83 | 0.1% |
| Italian | 1,988 | 3.2% |
| Japanese | 243 | 0.4% |
| Jordanian | 57 | 0.1% |
| Korean | 1,745 | 2.8% |
| Laotian | 241 | 0.4% |
| Latvian | 11 | 0.0% |
| Lebanese | 52 | 0.1% |
| Lithuanian | 15 | 0.0% |
| Luxembourger | 6 | 0.0% |
| Mexican | 32,922 | 52.3% |
| Mexican American Indian | 407 | 0.6% |
| Native Hawaiian | 8 | 0.0% |
| Navajo | 64 | 0.1% |
| Nicaraguan | 103 | 0.2% |
| Northern European | 56 | 0.1% |
| Norwegian | 399 | 0.6% |
| Pakistani | 135 | 0.2% |
| Panamanian | 9 | 0.0% |
| Peruvian | 79 | 0.1% |
| Polish | 339 | 0.5% |
| Portuguese | 241 | 0.4% |
| Puerto Rican | 386 | 0.6% |
| Romanian | 45 | 0.1% |
| Russian | 406 | 0.6% |
| Salvadoran | 950 | 1.5% |
| Samoan | 59 | 0.1% |
| Scandinavian | 62 | 0.1% |
| Scotch-Irish | 243 | 0.4% |
| Scottish | 562 | 0.9% |
| Seminole | 11 | 0.0% |
| Serbian | 50 | 0.1% |
| Slovak | 11 | 0.0% |
| Slovene | 32 | 0.1% |
| South American | 683 | 1.1% |
| Spaniard | 172 | 0.3% |
| Spanish | 186 | 0.3% |
| Sri Lankan | 490 | 0.8% |
| Subsaharan African | 35 | 0.1% |
| Swedish | 642 | 1.0% |
| Swiss | 57 | 0.1% |
| Syrian | 16 | 0.0% |
| Thai | 370 | 0.6% |
| Turkish | 7 | 0.0% |
| Ukrainian | 29 | 0.1% |
| Welsh | 222 | 0.4% |
| Yaqui | 121 | 0.2% |
| Yugoslavian | 19 | 0.0% | View All 96 Rows |
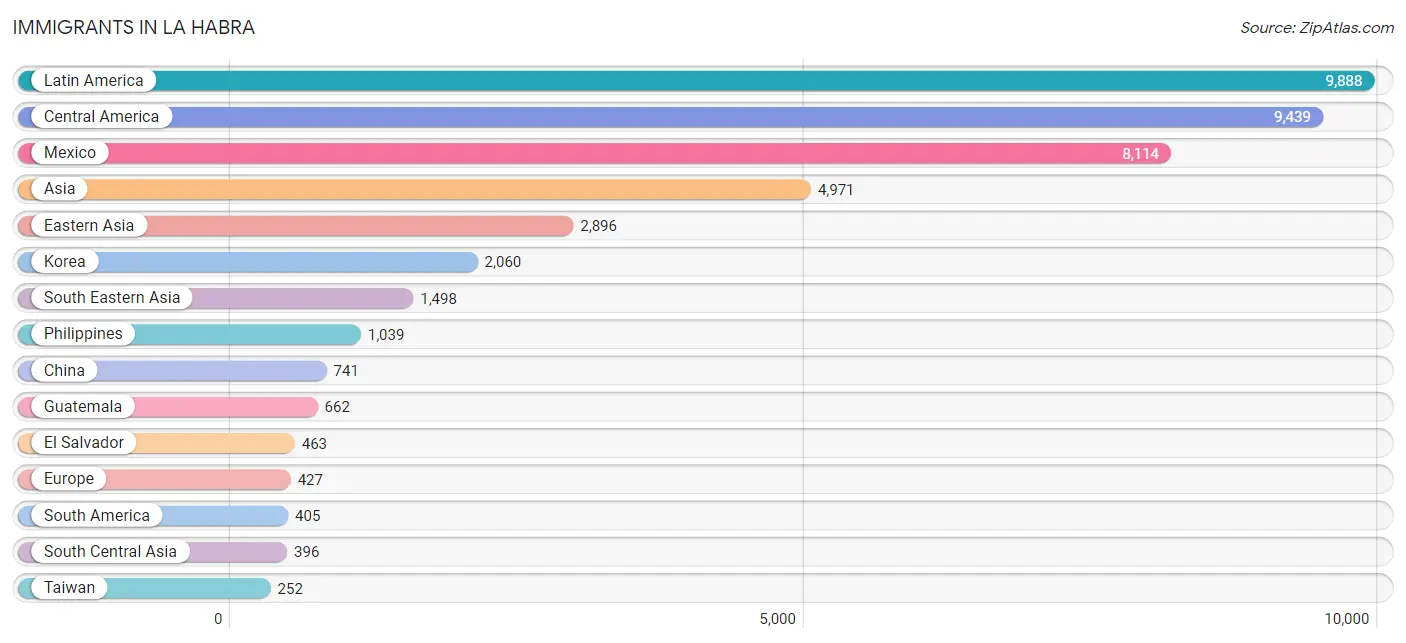
Immigrants in La Habra
The most numerous immigrant groups reported in La Habra came from Latin America (9,888 | 15.7%), Central America (9,439 | 15.0%), Mexico (8,114 | 12.9%), Asia (4,971 | 7.9%), and Eastern Asia (2,896 | 4.6%), together accounting for 56.1% of all La Habra residents.
| Immigration Origin | # Population | % Population |
| Afghanistan | 16 | 0.0% |
| Africa | 79 | 0.1% |
| Argentina | 29 | 0.1% |
| Armenia | 44 | 0.1% |
| Asia | 4,971 | 7.9% |
| Azores | 24 | 0.0% |
| Belarus | 26 | 0.0% |
| Belgium | 24 | 0.0% |
| Belize | 14 | 0.0% |
| Bolivia | 15 | 0.0% |
| Cambodia | 66 | 0.1% |
| Canada | 137 | 0.2% |
| Caribbean | 44 | 0.1% |
| Central America | 9,439 | 15.0% |
| Chile | 35 | 0.1% |
| China | 741 | 1.2% |
| Colombia | 72 | 0.1% |
| Costa Rica | 56 | 0.1% |
| Cuba | 33 | 0.1% |
| Eastern Africa | 4 | 0.0% |
| Eastern Asia | 2,896 | 4.6% |
| Eastern Europe | 167 | 0.3% |
| Ecuador | 147 | 0.2% |
| Egypt | 75 | 0.1% |
| El Salvador | 463 | 0.7% |
| England | 12 | 0.0% |
| Europe | 427 | 0.7% |
| Germany | 23 | 0.0% |
| Guatemala | 662 | 1.1% |
| Honduras | 18 | 0.0% |
| Hong Kong | 30 | 0.1% |
| Hungary | 21 | 0.0% |
| India | 201 | 0.3% |
| Indonesia | 86 | 0.1% |
| Iran | 66 | 0.1% |
| Ireland | 23 | 0.0% |
| Israel | 13 | 0.0% |
| Italy | 30 | 0.1% |
| Japan | 95 | 0.2% |
| Jordan | 12 | 0.0% |
| Kazakhstan | 8 | 0.0% |
| Korea | 2,060 | 3.3% |
| Kuwait | 25 | 0.0% |
| Latin America | 9,888 | 15.7% |
| Lebanon | 84 | 0.1% |
| Mexico | 8,114 | 12.9% |
| Moldova | 6 | 0.0% |
| Nepal | 31 | 0.1% |
| Netherlands | 86 | 0.1% |
| Nicaragua | 56 | 0.1% |
| Northern Africa | 75 | 0.1% |
| Northern Europe | 73 | 0.1% |
| Pakistan | 74 | 0.1% |
| Panama | 56 | 0.1% |
| Peru | 107 | 0.2% |
| Philippines | 1,039 | 1.7% |
| Portugal | 24 | 0.0% |
| Romania | 30 | 0.1% |
| Russia | 45 | 0.1% |
| Singapore | 46 | 0.1% |
| South America | 405 | 0.6% |
| South Central Asia | 396 | 0.6% |
| South Eastern Asia | 1,498 | 2.4% |
| Southern Europe | 54 | 0.1% |
| Sweden | 13 | 0.0% |
| Taiwan | 252 | 0.4% |
| Thailand | 42 | 0.1% |
| Trinidad and Tobago | 11 | 0.0% |
| Turkey | 3 | 0.0% |
| Ukraine | 29 | 0.1% |
| Vietnam | 189 | 0.3% |
| Western Asia | 181 | 0.3% |
| Western Europe | 133 | 0.2% | View All 73 Rows |
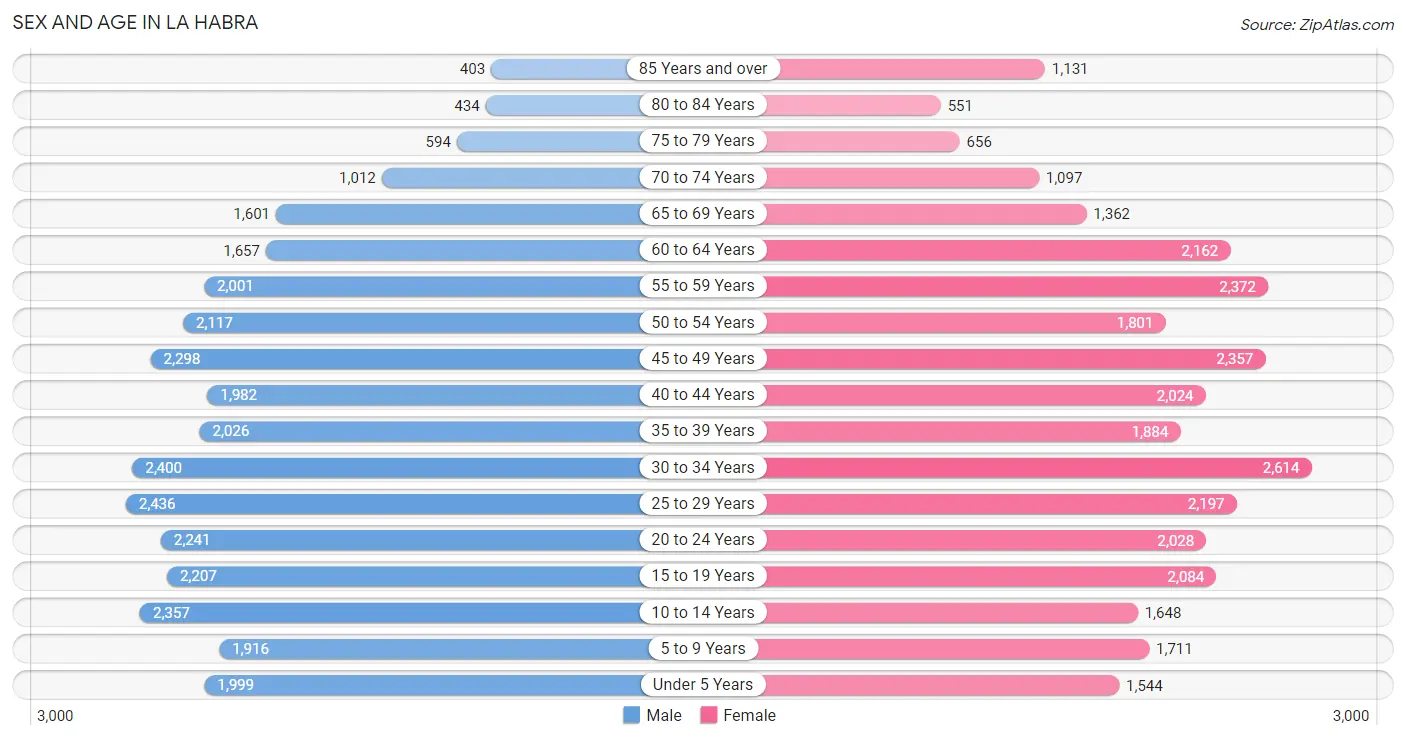
Sex and Age in La Habra
Sex and Age in La Habra
The most populous age groups in La Habra are 25 to 29 Years (2,436 | 7.7%) for men and 30 to 34 Years (2,614 | 8.4%) for women.
| Age Bracket | Male | Female |
| Under 5 Years | 1,999 (6.3%) | 1,544 (5.0%) |
| 5 to 9 Years | 1,916 (6.0%) | 1,711 (5.5%) |
| 10 to 14 Years | 2,357 (7.4%) | 1,648 (5.3%) |
| 15 to 19 Years | 2,207 (7.0%) | 2,084 (6.7%) |
| 20 to 24 Years | 2,241 (7.1%) | 2,028 (6.5%) |
| 25 to 29 Years | 2,436 (7.7%) | 2,197 (7.0%) |
| 30 to 34 Years | 2,400 (7.6%) | 2,614 (8.4%) |
| 35 to 39 Years | 2,026 (6.4%) | 1,884 (6.0%) |
| 40 to 44 Years | 1,982 (6.3%) | 2,024 (6.5%) |
| 45 to 49 Years | 2,298 (7.2%) | 2,357 (7.5%) |
| 50 to 54 Years | 2,117 (6.7%) | 1,801 (5.8%) |
| 55 to 59 Years | 2,001 (6.3%) | 2,372 (7.6%) |
| 60 to 64 Years | 1,657 (5.2%) | 2,162 (6.9%) |
| 65 to 69 Years | 1,601 (5.1%) | 1,362 (4.4%) |
| 70 to 74 Years | 1,012 (3.2%) | 1,097 (3.5%) |
| 75 to 79 Years | 594 (1.9%) | 656 (2.1%) |
| 80 to 84 Years | 434 (1.4%) | 551 (1.8%) |
| 85 Years and over | 403 (1.3%) | 1,131 (3.6%) |
| Total | 31,681 (100.0%) | 31,223 (100.0%) |
Families and Households in La Habra
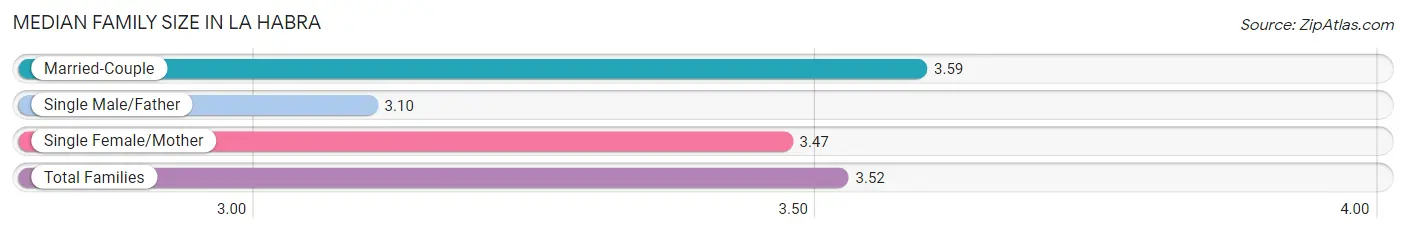
Median Family Size in La Habra
The median family size in La Habra is 3.52 persons per family, with married-couple families (10,776 | 71.0%) accounting for the largest median family size of 3.59 persons per family. On the other hand, single male/father families (1,696 | 11.2%) represent the smallest median family size with 3.10 persons per family.
| Family Type | # Families | Family Size |
| Married-Couple | 10,776 (71.0%) | 3.59 |
| Single Male/Father | 1,696 (11.2%) | 3.10 |
| Single Female/Mother | 2,710 (17.8%) | 3.47 |
| Total Families | 15,182 (100.0%) | 3.52 |
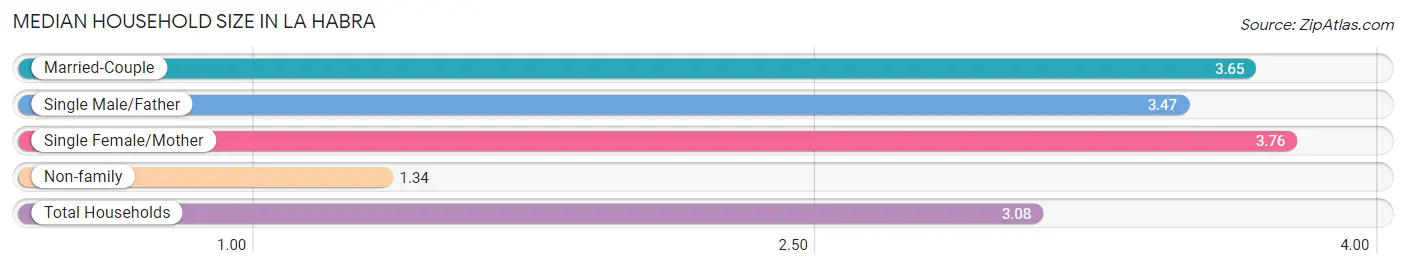
Median Household Size in La Habra
The median household size in La Habra is 3.08 persons per household, with single female/mother households (2,710 | 13.4%) accounting for the largest median household size of 3.76 persons per household. non-family households (5,006 | 24.8%) represent the smallest median household size with 1.34 persons per household.
| Household Type | # Households | Household Size |
| Married-Couple | 10,776 (53.4%) | 3.65 |
| Single Male/Father | 1,696 (8.4%) | 3.47 |
| Single Female/Mother | 2,710 (13.4%) | 3.76 |
| Non-family | 5,006 (24.8%) | 1.34 |
| Total Households | 20,188 (100.0%) | 3.08 |
Household Size by Marriage Status in La Habra
Out of a total of 20,188 households in La Habra, 15,182 (75.2%) are family households, while 5,006 (24.8%) are nonfamily households. The most numerous type of family households are 2-person households, comprising 4,739, and the most common type of nonfamily households are 1-person households, comprising 3,818.
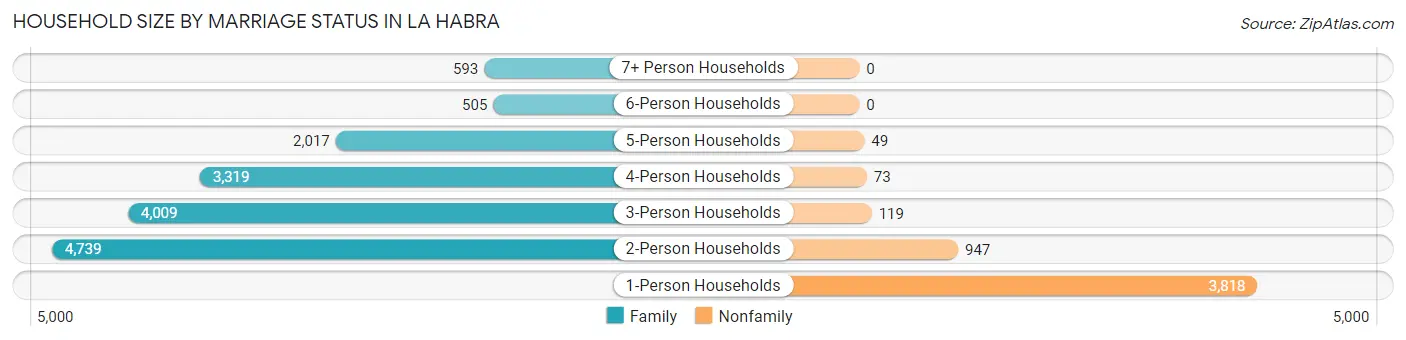
| Household Size | Family Households | Nonfamily Households |
| 1-Person Households | - | 3,818 (18.9%) |
| 2-Person Households | 4,739 (23.5%) | 947 (4.7%) |
| 3-Person Households | 4,009 (19.9%) | 119 (0.6%) |
| 4-Person Households | 3,319 (16.4%) | 73 (0.4%) |
| 5-Person Households | 2,017 (10.0%) | 49 (0.2%) |
| 6-Person Households | 505 (2.5%) | 0 (0.0%) |
| 7+ Person Households | 593 (2.9%) | 0 (0.0%) |
| Total | 15,182 (75.2%) | 5,006 (24.8%) |
Female Fertility in La Habra
Fertility by Age in La Habra
Average fertility rate in La Habra is 38.0 births per 1,000 women. Women in the age bracket of 20 to 34 years have the highest fertility rate with 56.0 births per 1,000 women. Women in the age bracket of 20 to 34 years acount for 64.4% of all women with births.
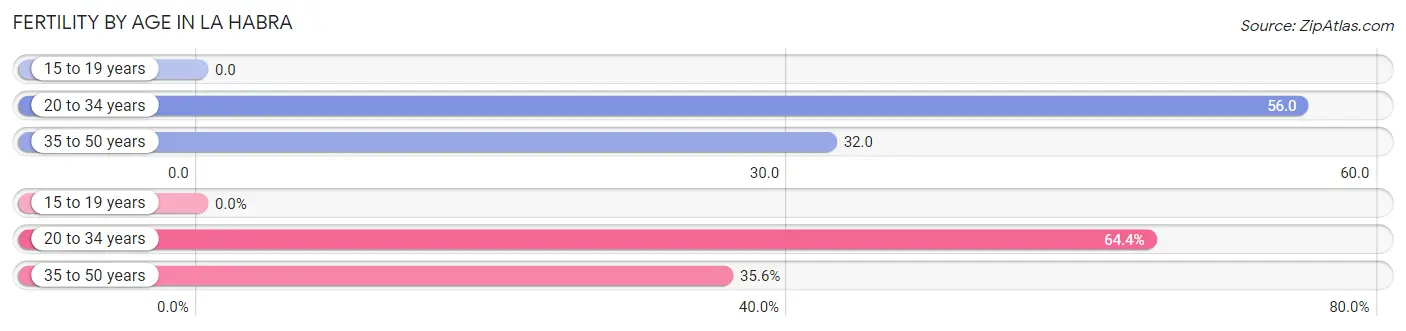
| Age Bracket | Women with Births | Births / 1,000 Women |
| 15 to 19 years | 0 (0.0%) | 0.0 |
| 20 to 34 years | 381 (64.4%) | 56.0 |
| 35 to 50 years | 211 (35.6%) | 32.0 |
| Total | 592 (100.0%) | 38.0 |
Fertility by Age by Marriage Status in La Habra
70.9% of women with births (592) in La Habra are married. The highest percentage of unmarried women with births falls into 20 to 34 years age bracket with 30.2% of them unmarried at the time of birth, while the lowest percentage of unmarried women with births belong to 35 to 50 years age bracket with 27.0% of them unmarried.
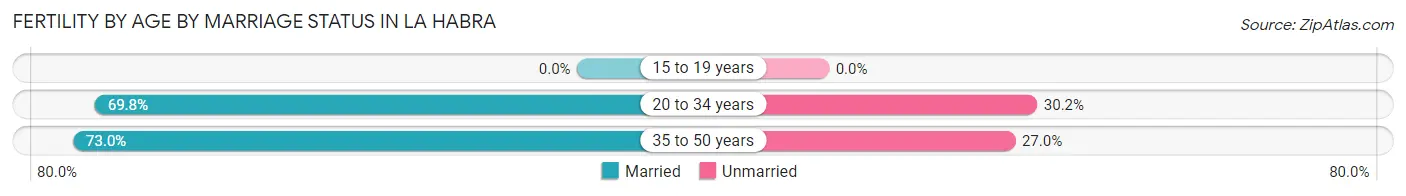
| Age Bracket | Married | Unmarried |
| 15 to 19 years | 0 (0.0%) | 0 (0.0%) |
| 20 to 34 years | 266 (69.8%) | 115 (30.2%) |
| 35 to 50 years | 154 (73.0%) | 57 (27.0%) |
| Total | 420 (71.0%) | 172 (29.0%) |
Fertility by Education in La Habra
Average fertility rate in La Habra is 38.0 births per 1,000 women. Women with the education attainment of graduate degree have the highest fertility rate of 76.0 births per 1,000 women, while women with the education attainment of less than high school have the lowest fertility at 7.0 births per 1,000 women. Women with the education attainment of bachelor's degree represent 37.8% of all women with births.
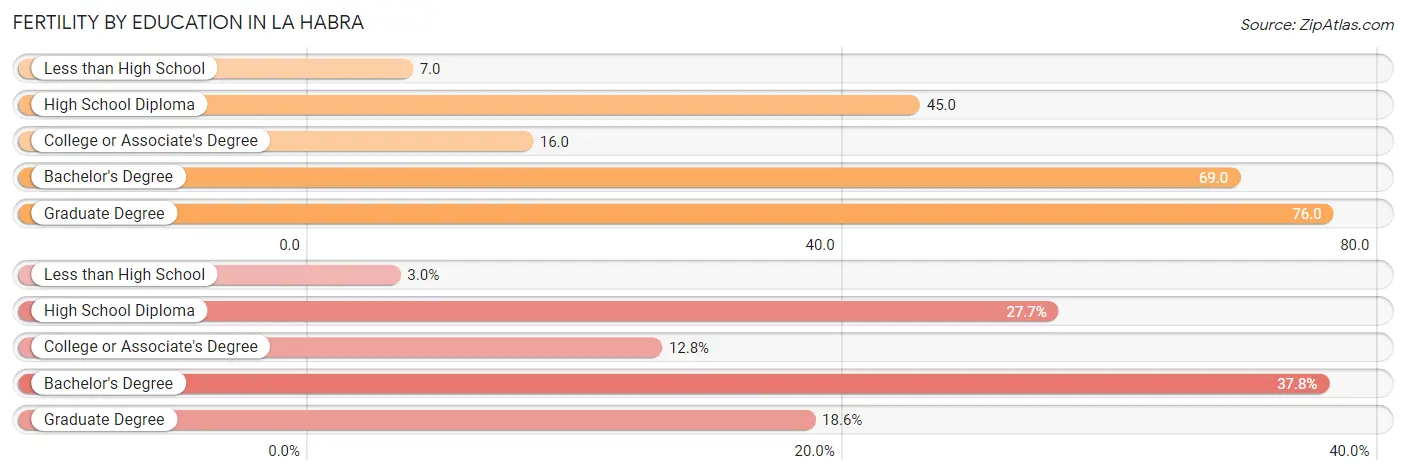
| Educational Attainment | Women with Births | Births / 1,000 Women |
| Less than High School | 18 (3.0%) | 7.0 |
| High School Diploma | 164 (27.7%) | 45.0 |
| College or Associate's Degree | 76 (12.8%) | 16.0 |
| Bachelor's Degree | 224 (37.8%) | 69.0 |
| Graduate Degree | 110 (18.6%) | 76.0 |
| Total | 592 (100.0%) | 38.0 |
Fertility by Education by Marriage Status in La Habra
29.0% of women with births in La Habra are unmarried. Women with the educational attainment of bachelor's degree are most likely to be married with 95.5% of them married at childbirth, while women with the educational attainment of less than high school are least likely to be married with 100.0% of them unmarried at childbirth.
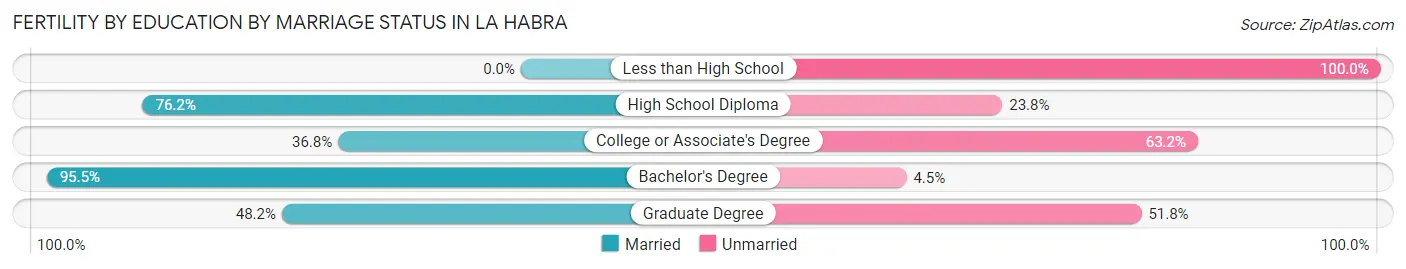
| Educational Attainment | Married | Unmarried |
| Less than High School | 0 (0.0%) | 18 (100.0%) |
| High School Diploma | 125 (76.2%) | 39 (23.8%) |
| College or Associate's Degree | 28 (36.8%) | 48 (63.2%) |
| Bachelor's Degree | 214 (95.5%) | 10 (4.5%) |
| Graduate Degree | 53 (48.2%) | 57 (51.8%) |
| Total | 420 (71.0%) | 172 (29.0%) |
Employment Characteristics in La Habra
Employment by Class of Employer in La Habra
Among the 31,204 employed individuals in La Habra, private company employees (21,427 | 68.7%), local government employees (2,879 | 9.2%), and not-for-profit organizations (2,748 | 8.8%) make up the most common classes of employment.
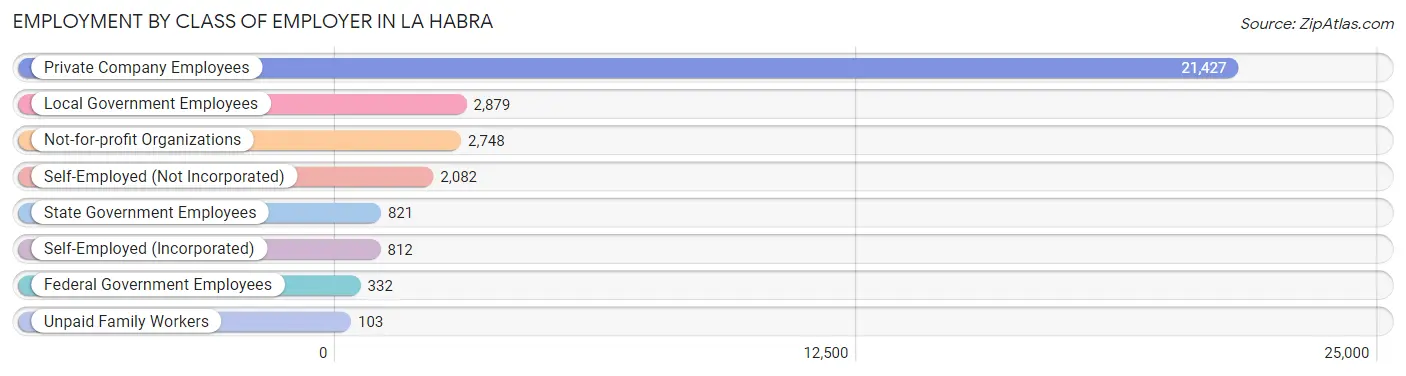
| Employer Class | # Employees | % Employees |
| Private Company Employees | 21,427 | 68.7% |
| Self-Employed (Incorporated) | 812 | 2.6% |
| Self-Employed (Not Incorporated) | 2,082 | 6.7% |
| Not-for-profit Organizations | 2,748 | 8.8% |
| Local Government Employees | 2,879 | 9.2% |
| State Government Employees | 821 | 2.6% |
| Federal Government Employees | 332 | 1.1% |
| Unpaid Family Workers | 103 | 0.3% |
| Total | 31,204 | 100.0% |
Employment Status by Age in La Habra
According to the labor force statistics for La Habra, out of the total population over 16 years of age (50,810), 68.3% or 34,703 individuals are in the labor force, with 7.2% or 2,499 of them unemployed. The age group with the highest labor force participation rate is 25 to 29 years, with 88.6% or 4,105 individuals in the labor force. Within the labor force, the 16 to 19 years age range has the highest percentage of unemployed individuals, with 22.6% or 269 of them being unemployed.
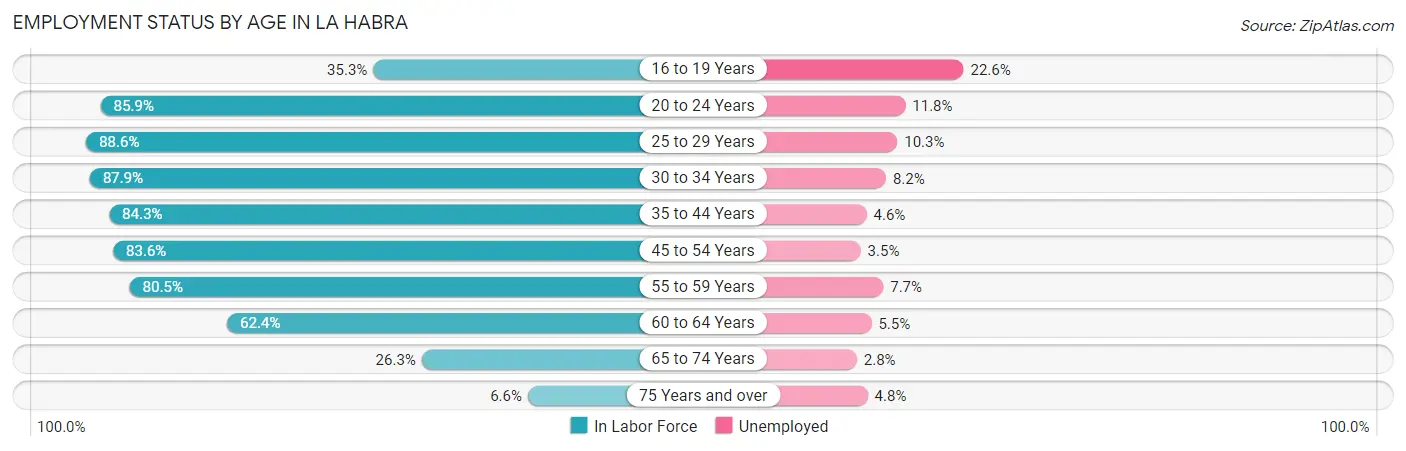
| Age Bracket | In Labor Force | Unemployed |
| 16 to 19 Years | 1,190 (35.3%) | 269 (22.6%) |
| 20 to 24 Years | 3,667 (85.9%) | 433 (11.8%) |
| 25 to 29 Years | 4,105 (88.6%) | 423 (10.3%) |
| 30 to 34 Years | 4,407 (87.9%) | 361 (8.2%) |
| 35 to 44 Years | 6,673 (84.3%) | 307 (4.6%) |
| 45 to 54 Years | 7,167 (83.6%) | 251 (3.5%) |
| 55 to 59 Years | 3,520 (80.5%) | 271 (7.7%) |
| 60 to 64 Years | 2,383 (62.4%) | 131 (5.5%) |
| 65 to 74 Years | 1,334 (26.3%) | 37 (2.8%) |
| 75 Years and over | 249 (6.6%) | 12 (4.8%) |
| Total | 34,703 (68.3%) | 2,499 (7.2%) |
Employment Status by Educational Attainment in La Habra
According to labor force statistics for La Habra, 82.3% of individuals (28,252) out of the total population between 25 and 64 years of age (34,328) are in the labor force, with 6.2% or 1,752 of them being unemployed. The group with the highest labor force participation rate are those with the educational attainment of bachelor's degree or higher, with 87.7% or 8,741 individuals in the labor force. Within the labor force, individuals with college / associate degree education have the highest percentage of unemployment, with 8.7% or 870 of them being unemployed.
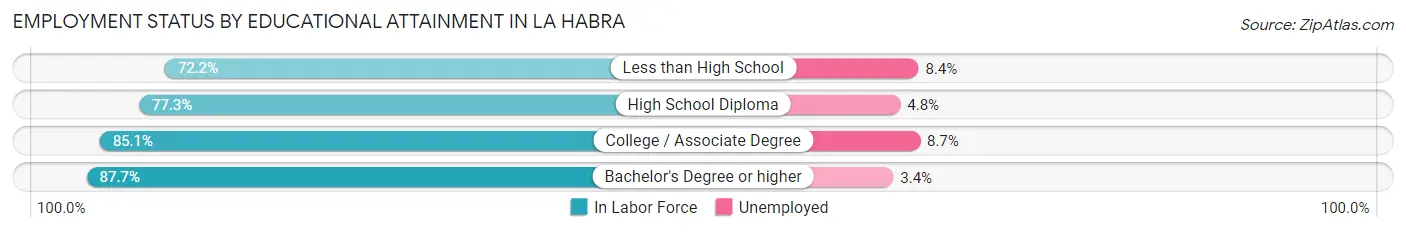
| Educational Attainment | In Labor Force | Unemployed |
| Less than High School | 3,302 (72.2%) | 384 (8.4%) |
| High School Diploma | 6,213 (77.3%) | 386 (4.8%) |
| College / Associate Degree | 9,999 (85.1%) | 1,022 (8.7%) |
| Bachelor's Degree or higher | 8,741 (87.7%) | 339 (3.4%) |
| Total | 28,252 (82.3%) | 2,128 (6.2%) |
Employment Occupations by Sex in La Habra
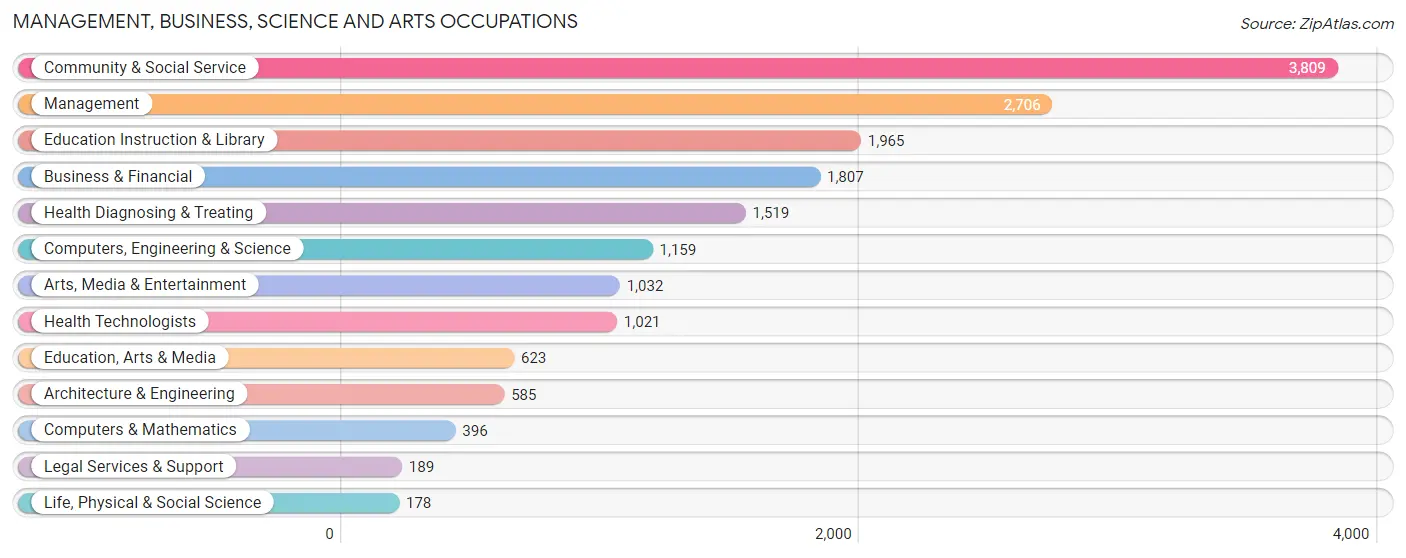
Management, Business, Science and Arts Occupations
The most common Management, Business, Science and Arts occupations in La Habra are Community & Social Service (3,809 | 11.8%), Management (2,706 | 8.4%), Education Instruction & Library (1,965 | 6.1%), Business & Financial (1,807 | 5.6%), and Health Diagnosing & Treating (1,519 | 4.7%).
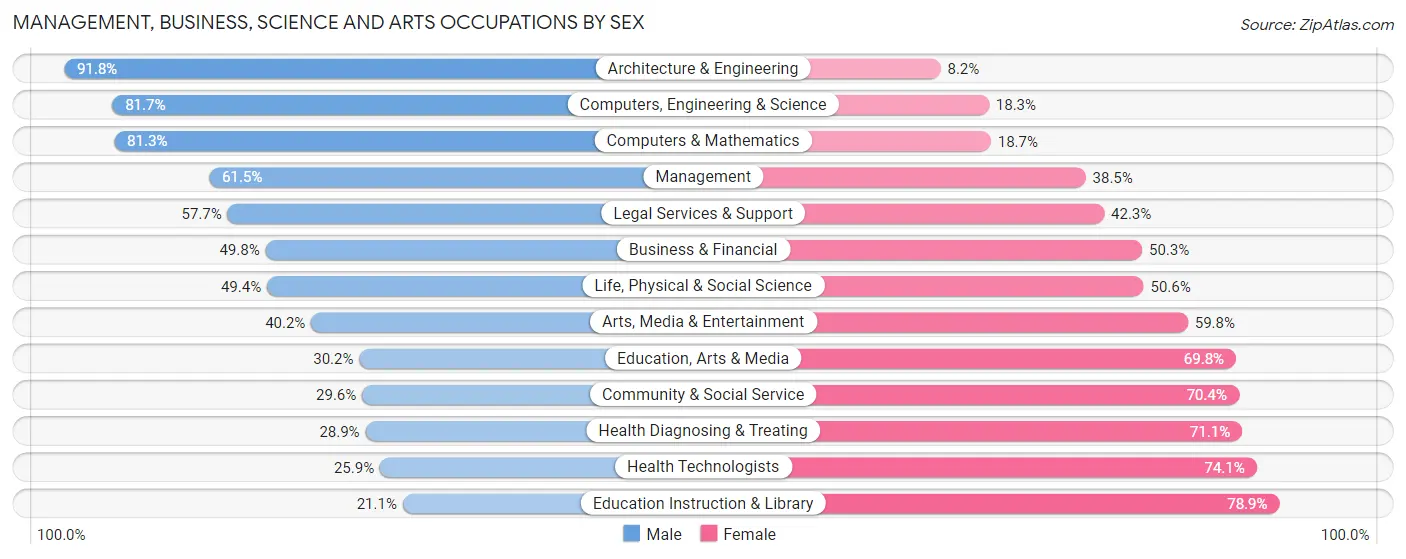
Management, Business, Science and Arts Occupations by Sex
Within the Management, Business, Science and Arts occupations in La Habra, the most male-oriented occupations are Architecture & Engineering (91.8%), Computers, Engineering & Science (81.7%), and Computers & Mathematics (81.3%), while the most female-oriented occupations are Education Instruction & Library (78.9%), Health Technologists (74.1%), and Health Diagnosing & Treating (71.1%).
| Occupation | Male | Female |
| Management | 1,665 (61.5%) | 1,041 (38.5%) |
| Business & Financial | 899 (49.7%) | 908 (50.2%) |
| Computers, Engineering & Science | 947 (81.7%) | 212 (18.3%) |
| Computers & Mathematics | 322 (81.3%) | 74 (18.7%) |
| Architecture & Engineering | 537 (91.8%) | 48 (8.2%) |
| Life, Physical & Social Science | 88 (49.4%) | 90 (50.6%) |
| Community & Social Service | 1,127 (29.6%) | 2,682 (70.4%) |
| Education, Arts & Media | 188 (30.2%) | 435 (69.8%) |
| Legal Services & Support | 109 (57.7%) | 80 (42.3%) |
| Education Instruction & Library | 415 (21.1%) | 1,550 (78.9%) |
| Arts, Media & Entertainment | 415 (40.2%) | 617 (59.8%) |
| Health Diagnosing & Treating | 439 (28.9%) | 1,080 (71.1%) |
| Health Technologists | 264 (25.9%) | 757 (74.1%) |
| Total (Category) | 5,077 (46.2%) | 5,923 (53.8%) |
| Total (Overall) | 17,288 (53.7%) | 14,915 (46.3%) |
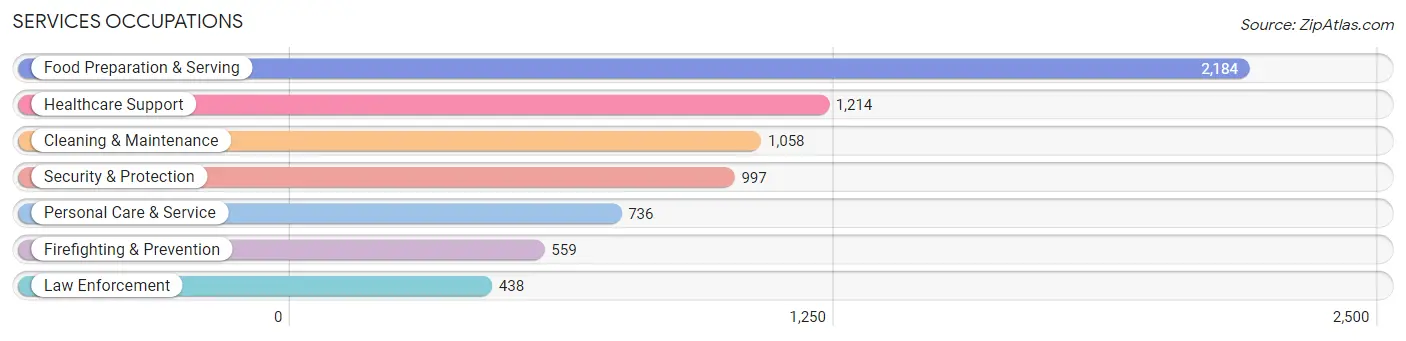
Services Occupations
The most common Services occupations in La Habra are Food Preparation & Serving (2,184 | 6.8%), Healthcare Support (1,214 | 3.8%), Cleaning & Maintenance (1,058 | 3.3%), Security & Protection (997 | 3.1%), and Personal Care & Service (736 | 2.3%).
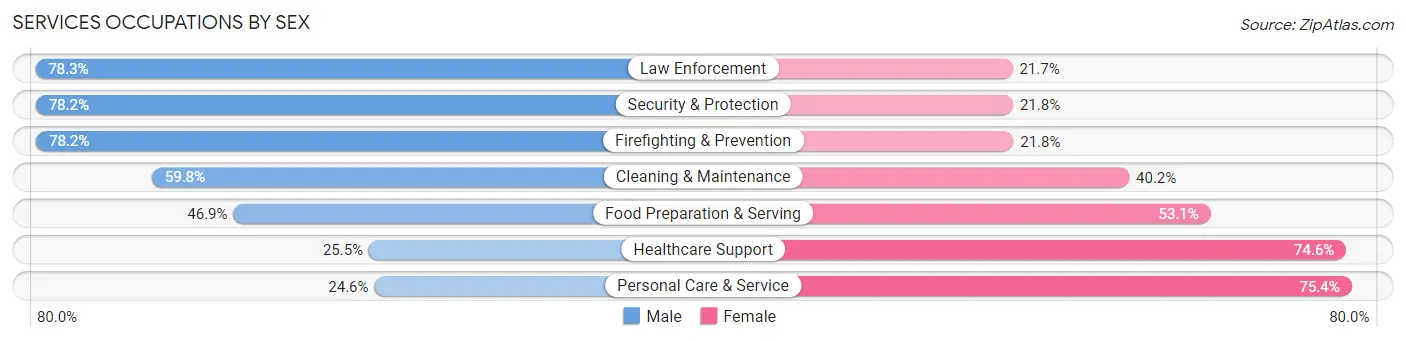
Services Occupations by Sex
Within the Services occupations in La Habra, the most male-oriented occupations are Law Enforcement (78.3%), Security & Protection (78.2%), and Firefighting & Prevention (78.2%), while the most female-oriented occupations are Personal Care & Service (75.4%), Healthcare Support (74.6%), and Food Preparation & Serving (53.1%).
| Occupation | Male | Female |
| Healthcare Support | 309 (25.5%) | 905 (74.6%) |
| Security & Protection | 780 (78.2%) | 217 (21.8%) |
| Firefighting & Prevention | 437 (78.2%) | 122 (21.8%) |
| Law Enforcement | 343 (78.3%) | 95 (21.7%) |
| Food Preparation & Serving | 1,025 (46.9%) | 1,159 (53.1%) |
| Cleaning & Maintenance | 633 (59.8%) | 425 (40.2%) |
| Personal Care & Service | 181 (24.6%) | 555 (75.4%) |
| Total (Category) | 2,928 (47.3%) | 3,261 (52.7%) |
| Total (Overall) | 17,288 (53.7%) | 14,915 (46.3%) |
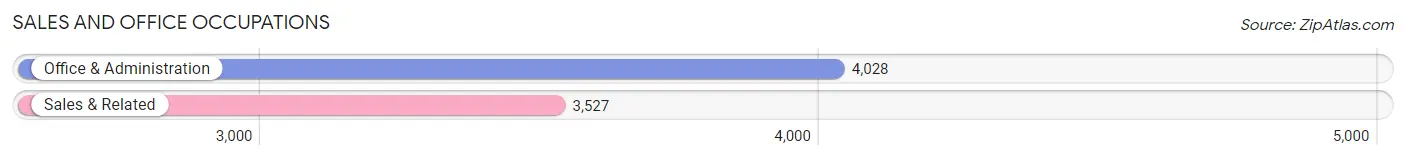
Sales and Office Occupations
The most common Sales and Office occupations in La Habra are Office & Administration (4,028 | 12.5%), and Sales & Related (3,527 | 11.0%).
Sales and Office Occupations by Sex
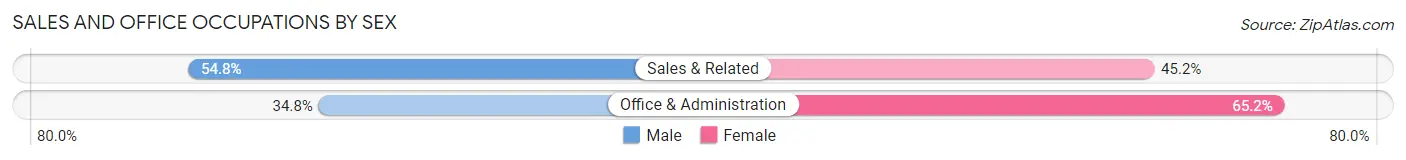
| Occupation | Male | Female |
| Sales & Related | 1,934 (54.8%) | 1,593 (45.2%) |
| Office & Administration | 1,400 (34.8%) | 2,628 (65.2%) |
| Total (Category) | 3,334 (44.1%) | 4,221 (55.9%) |
| Total (Overall) | 17,288 (53.7%) | 14,915 (46.3%) |
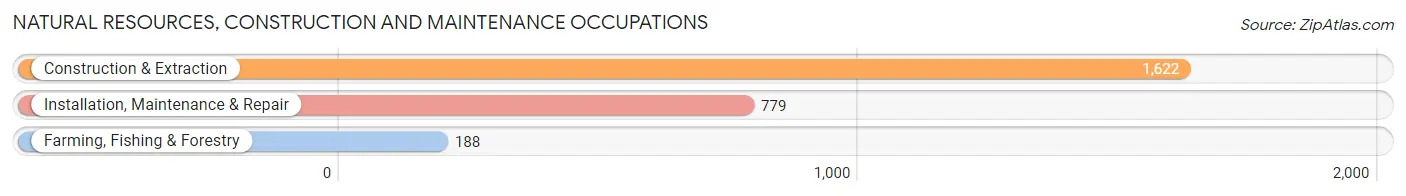
Natural Resources, Construction and Maintenance Occupations
The most common Natural Resources, Construction and Maintenance occupations in La Habra are Construction & Extraction (1,622 | 5.0%), Installation, Maintenance & Repair (779 | 2.4%), and Farming, Fishing & Forestry (188 | 0.6%).
Natural Resources, Construction and Maintenance Occupations by Sex
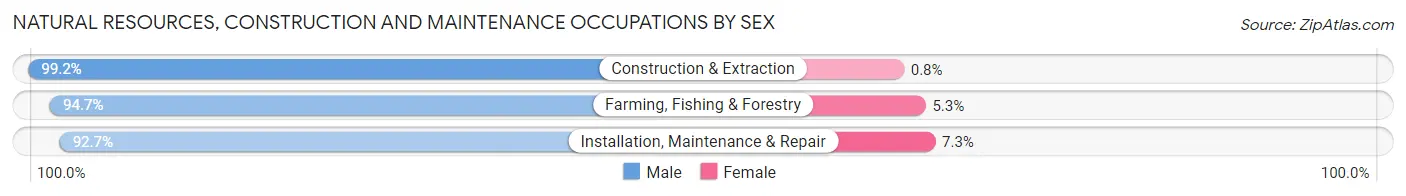
| Occupation | Male | Female |
| Farming, Fishing & Forestry | 178 (94.7%) | 10 (5.3%) |
| Construction & Extraction | 1,609 (99.2%) | 13 (0.8%) |
| Installation, Maintenance & Repair | 722 (92.7%) | 57 (7.3%) |
| Total (Category) | 2,509 (96.9%) | 80 (3.1%) |
| Total (Overall) | 17,288 (53.7%) | 14,915 (46.3%) |
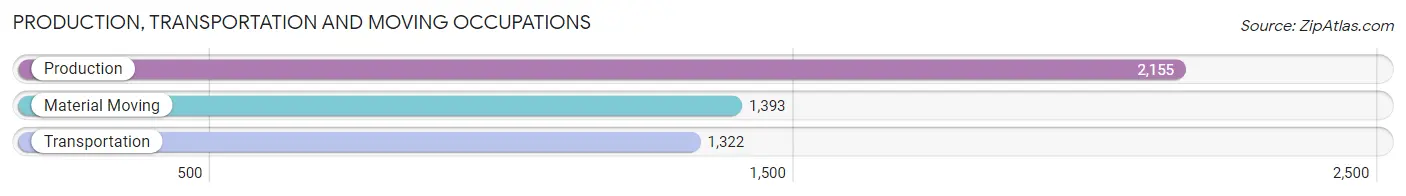
Production, Transportation and Moving Occupations
The most common Production, Transportation and Moving occupations in La Habra are Production (2,155 | 6.7%), Material Moving (1,393 | 4.3%), and Transportation (1,322 | 4.1%).
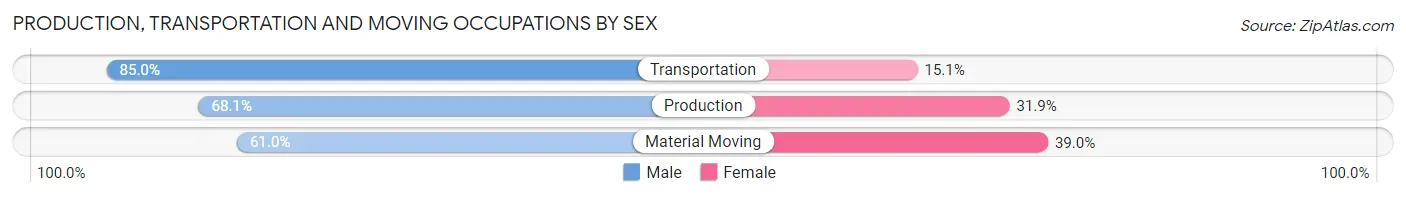
Production, Transportation and Moving Occupations by Sex
| Occupation | Male | Female |
| Production | 1,467 (68.1%) | 688 (31.9%) |
| Transportation | 1,123 (85.0%) | 199 (15.0%) |
| Material Moving | 850 (61.0%) | 543 (39.0%) |
| Total (Category) | 3,440 (70.6%) | 1,430 (29.4%) |
| Total (Overall) | 17,288 (53.7%) | 14,915 (46.3%) |
Employment Industries by Sex in La Habra
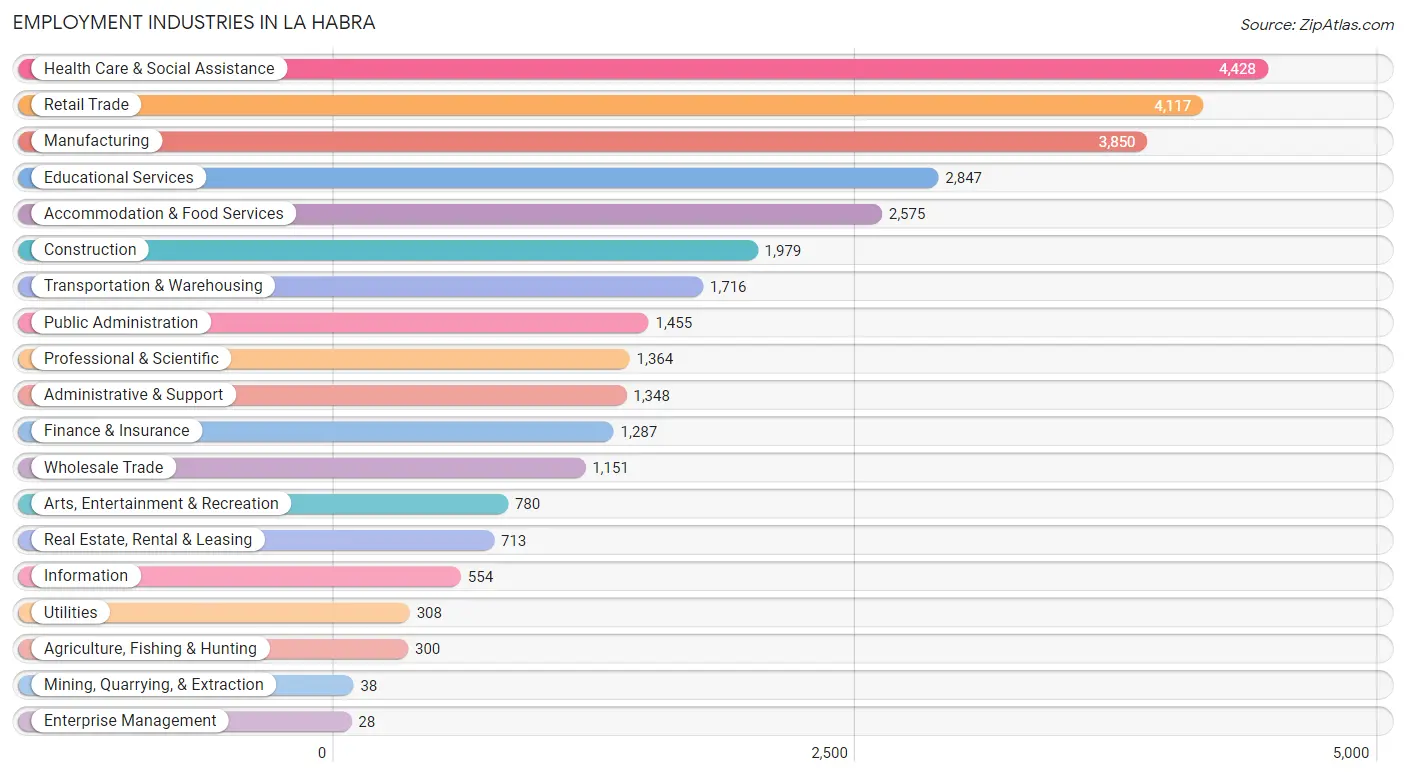
Employment Industries in La Habra
The major employment industries in La Habra include Health Care & Social Assistance (4,428 | 13.8%), Retail Trade (4,117 | 12.8%), Manufacturing (3,850 | 12.0%), Educational Services (2,847 | 8.8%), and Accommodation & Food Services (2,575 | 8.0%).
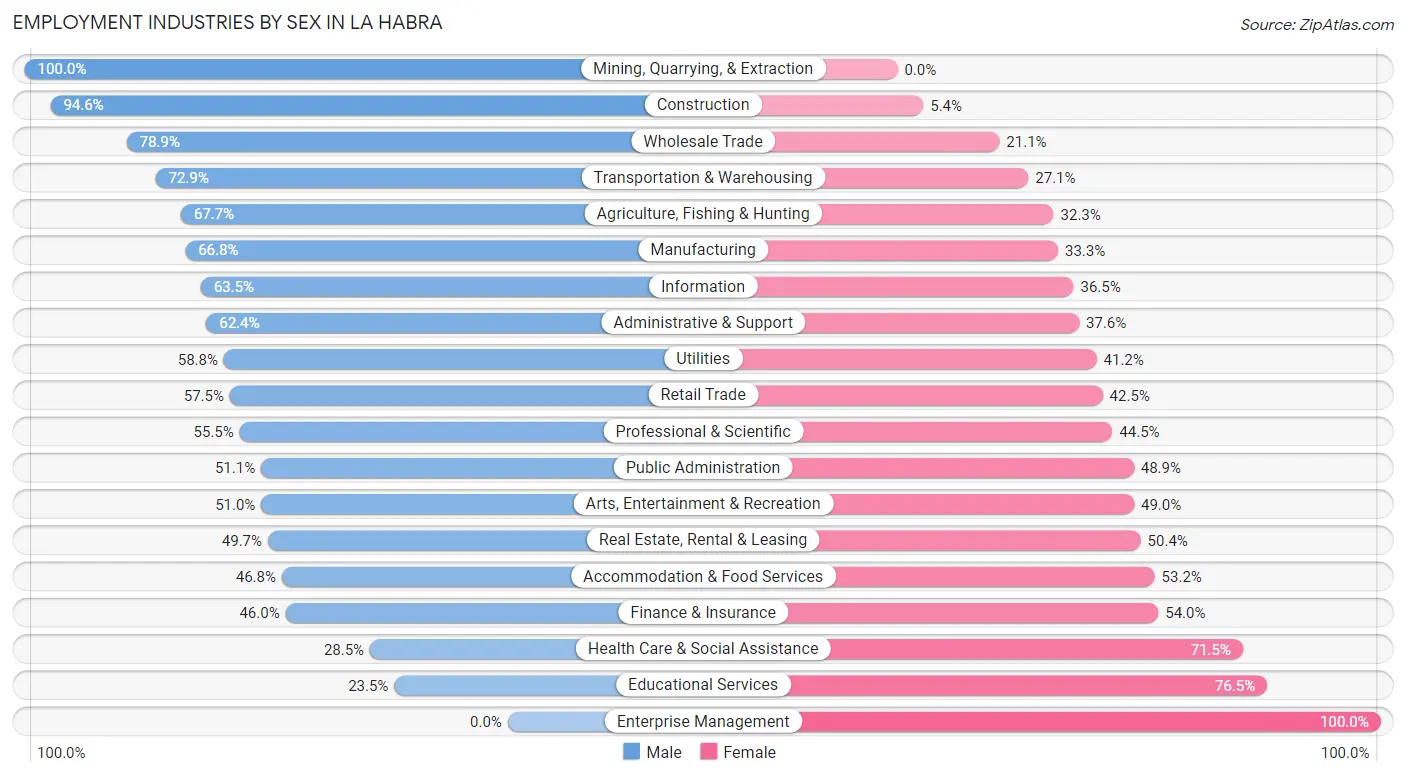
Employment Industries by Sex in La Habra
The La Habra industries that see more men than women are Mining, Quarrying, & Extraction (100.0%), Construction (94.6%), and Wholesale Trade (78.9%), whereas the industries that tend to have a higher number of women are Enterprise Management (100.0%), Educational Services (76.5%), and Health Care & Social Assistance (71.5%).
| Industry | Male | Female |
| Agriculture, Fishing & Hunting | 203 (67.7%) | 97 (32.3%) |
| Mining, Quarrying, & Extraction | 38 (100.0%) | 0 (0.0%) |
| Construction | 1,873 (94.6%) | 106 (5.4%) |
| Manufacturing | 2,570 (66.7%) | 1,280 (33.3%) |
| Wholesale Trade | 908 (78.9%) | 243 (21.1%) |
| Retail Trade | 2,368 (57.5%) | 1,749 (42.5%) |
| Transportation & Warehousing | 1,251 (72.9%) | 465 (27.1%) |
| Utilities | 181 (58.8%) | 127 (41.2%) |
| Information | 352 (63.5%) | 202 (36.5%) |
| Finance & Insurance | 592 (46.0%) | 695 (54.0%) |
| Real Estate, Rental & Leasing | 354 (49.6%) | 359 (50.3%) |
| Professional & Scientific | 757 (55.5%) | 607 (44.5%) |
| Enterprise Management | 0 (0.0%) | 28 (100.0%) |
| Administrative & Support | 841 (62.4%) | 507 (37.6%) |
| Educational Services | 669 (23.5%) | 2,178 (76.5%) |
| Health Care & Social Assistance | 1,263 (28.5%) | 3,165 (71.5%) |
| Arts, Entertainment & Recreation | 398 (51.0%) | 382 (49.0%) |
| Accommodation & Food Services | 1,204 (46.8%) | 1,371 (53.2%) |
| Public Administration | 743 (51.1%) | 712 (48.9%) |
| Total | 17,288 (53.7%) | 14,915 (46.3%) |
Education in La Habra
School Enrollment in La Habra
The most common levels of schooling among the 15,991 students in La Habra are college / undergraduate (4,131 | 25.8%), high school (3,439 | 21.5%), and elementary school (3,208 | 20.1%).
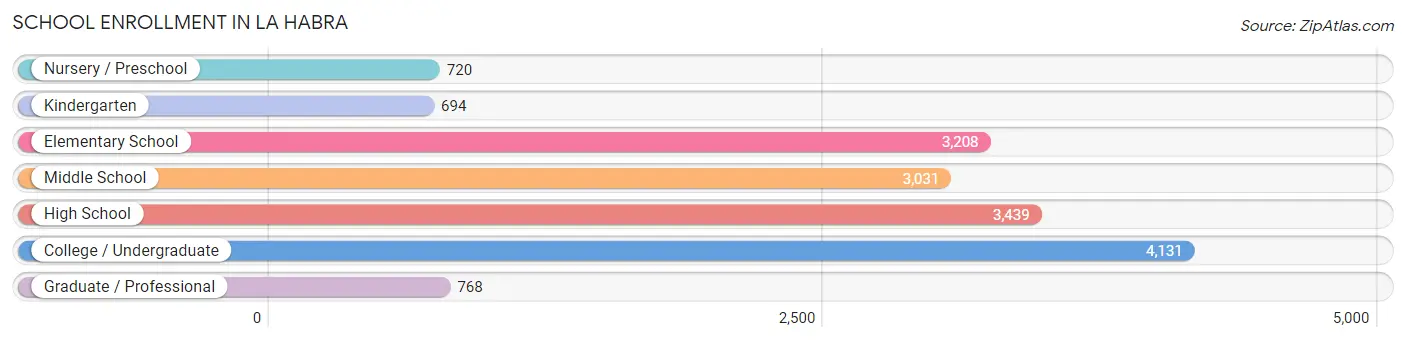
| School Level | # Students | % Students |
| Nursery / Preschool | 720 | 4.5% |
| Kindergarten | 694 | 4.3% |
| Elementary School | 3,208 | 20.1% |
| Middle School | 3,031 | 19.0% |
| High School | 3,439 | 21.5% |
| College / Undergraduate | 4,131 | 25.8% |
| Graduate / Professional | 768 | 4.8% |
| Total | 15,991 | 100.0% |
School Enrollment by Age by Funding Source in La Habra
Out of a total of 15,991 students who are enrolled in schools in La Habra, 2,303 (14.4%) attend a private institution, while the remaining 13,688 (85.6%) are enrolled in public schools. The age group of 3 to 4 year olds has the highest likelihood of being enrolled in private schools, with 301 (41.8% in the age bracket) enrolled. Conversely, the age group of 20 to 24 year olds has the lowest likelihood of being enrolled in a private school, with 1,438 (94.0% in the age bracket) attending a public institution.
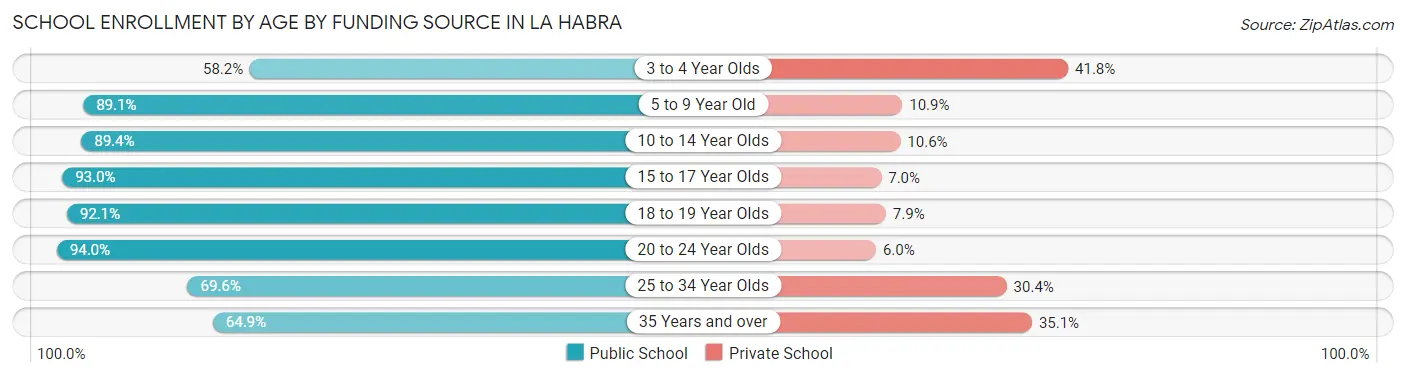
| Age Bracket | Public School | Private School |
| 3 to 4 Year Olds | 419 (58.2%) | 301 (41.8%) |
| 5 to 9 Year Old | 3,124 (89.1%) | 383 (10.9%) |
| 10 to 14 Year Olds | 3,519 (89.4%) | 416 (10.6%) |
| 15 to 17 Year Olds | 2,334 (93.0%) | 176 (7.0%) |
| 18 to 19 Year Olds | 1,066 (92.1%) | 91 (7.9%) |
| 20 to 24 Year Olds | 1,438 (94.0%) | 92 (6.0%) |
| 25 to 34 Year Olds | 1,124 (69.6%) | 490 (30.4%) |
| 35 Years and over | 661 (64.9%) | 357 (35.1%) |
| Total | 13,688 (85.6%) | 2,303 (14.4%) |
Educational Attainment by Field of Study in La Habra
Business (2,021 | 15.3%), social sciences (1,505 | 11.4%), arts & humanities (1,190 | 9.0%), science & technology (1,154 | 8.7%), and engineering (1,090 | 8.3%) are the most common fields of study among 13,216 individuals in La Habra who have obtained a bachelor's degree or higher.
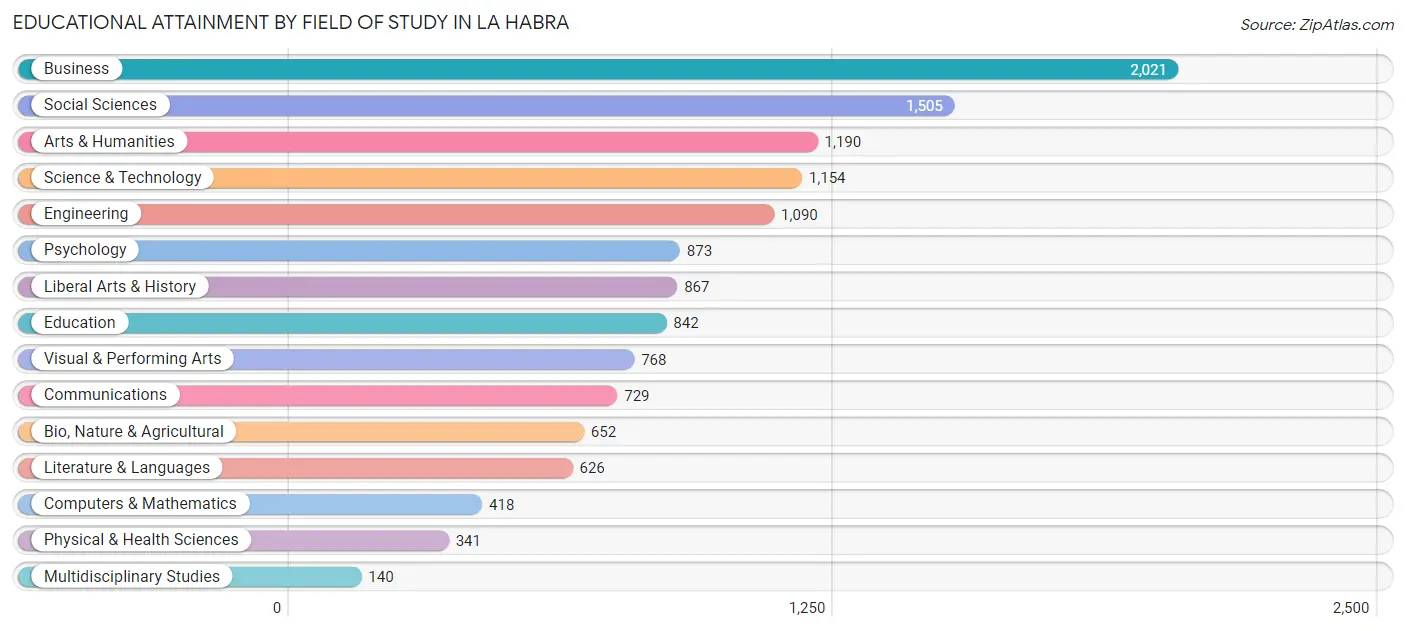
| Field of Study | # Graduates | % Graduates |
| Computers & Mathematics | 418 | 3.2% |
| Bio, Nature & Agricultural | 652 | 4.9% |
| Physical & Health Sciences | 341 | 2.6% |
| Psychology | 873 | 6.6% |
| Social Sciences | 1,505 | 11.4% |
| Engineering | 1,090 | 8.3% |
| Multidisciplinary Studies | 140 | 1.1% |
| Science & Technology | 1,154 | 8.7% |
| Business | 2,021 | 15.3% |
| Education | 842 | 6.4% |
| Literature & Languages | 626 | 4.7% |
| Liberal Arts & History | 867 | 6.6% |
| Visual & Performing Arts | 768 | 5.8% |
| Communications | 729 | 5.5% |
| Arts & Humanities | 1,190 | 9.0% |
| Total | 13,216 | 100.0% |
Transportation & Commute in La Habra
Vehicle Availability by Sex in La Habra
The most prevalent vehicle ownership categories in La Habra are males with 2 vehicles (6,637, accounting for 39.7%) and females with 2 vehicles (5,460, making up 46.1%).
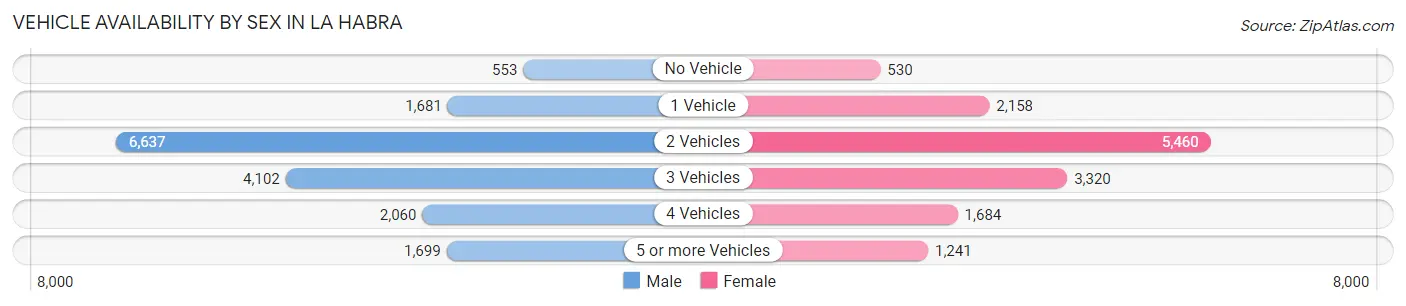
| Vehicles Available | Male | Female |
| No Vehicle | 553 (3.3%) | 530 (3.7%) |
| 1 Vehicle | 1,681 (10.1%) | 2,158 (15.0%) |
| 2 Vehicles | 6,637 (39.7%) | 5,460 (37.9%) |
| 3 Vehicles | 4,102 (24.5%) | 3,320 (23.1%) |
| 4 Vehicles | 2,060 (12.3%) | 1,684 (11.7%) |
| 5 or more Vehicles | 1,699 (10.2%) | 1,241 (8.6%) |
| Total | 16,732 (100.0%) | 14,393 (100.0%) |
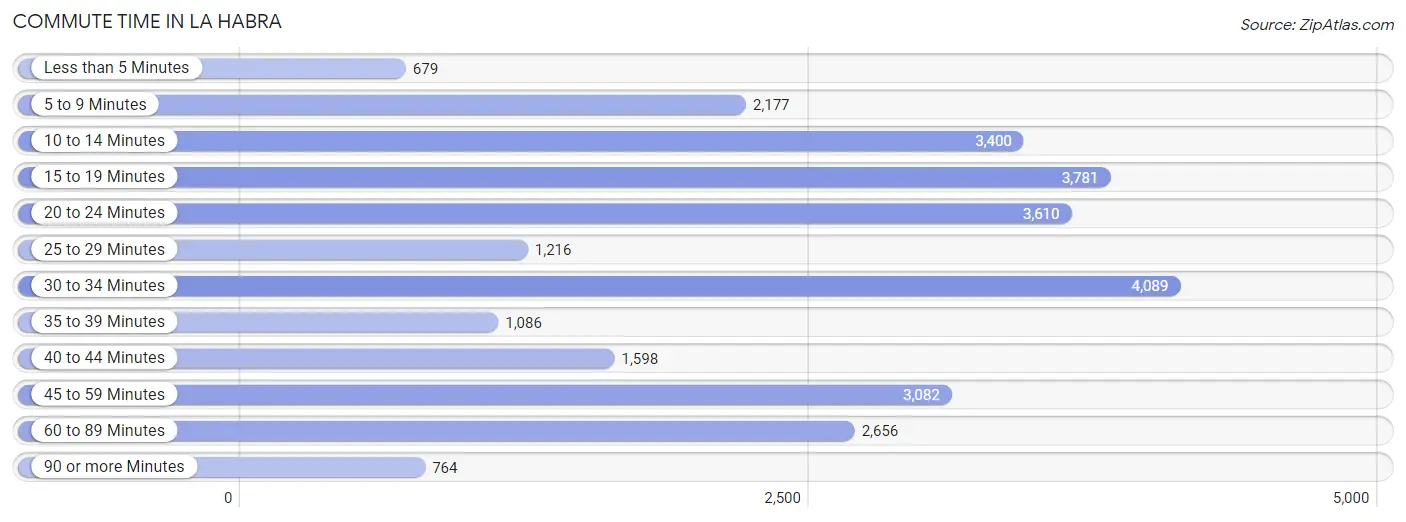
Commute Time in La Habra
The most frequently occuring commute durations in La Habra are 30 to 34 minutes (4,089 commuters, 14.5%), 15 to 19 minutes (3,781 commuters, 13.4%), and 20 to 24 minutes (3,610 commuters, 12.8%).
| Commute Time | # Commuters | % Commuters |
| Less than 5 Minutes | 679 | 2.4% |
| 5 to 9 Minutes | 2,177 | 7.7% |
| 10 to 14 Minutes | 3,400 | 12.1% |
| 15 to 19 Minutes | 3,781 | 13.4% |
| 20 to 24 Minutes | 3,610 | 12.8% |
| 25 to 29 Minutes | 1,216 | 4.3% |
| 30 to 34 Minutes | 4,089 | 14.5% |
| 35 to 39 Minutes | 1,086 | 3.9% |
| 40 to 44 Minutes | 1,598 | 5.7% |
| 45 to 59 Minutes | 3,082 | 11.0% |
| 60 to 89 Minutes | 2,656 | 9.4% |
| 90 or more Minutes | 764 | 2.7% |
Commute Time by Sex in La Habra
The most common commute times in La Habra are 30 to 34 minutes (2,057 commuters, 13.6%) for males and 30 to 34 minutes (2,032 commuters, 15.6%) for females.

| Commute Time | Male | Female |
| Less than 5 Minutes | 317 (2.1%) | 362 (2.8%) |
| 5 to 9 Minutes | 1,119 (7.4%) | 1,058 (8.1%) |
| 10 to 14 Minutes | 1,823 (12.1%) | 1,577 (12.1%) |
| 15 to 19 Minutes | 1,870 (12.4%) | 1,911 (14.7%) |
| 20 to 24 Minutes | 1,999 (13.2%) | 1,611 (12.4%) |
| 25 to 29 Minutes | 691 (4.6%) | 525 (4.0%) |
| 30 to 34 Minutes | 2,057 (13.6%) | 2,032 (15.6%) |
| 35 to 39 Minutes | 566 (3.7%) | 520 (4.0%) |
| 40 to 44 Minutes | 1,011 (6.7%) | 587 (4.5%) |
| 45 to 59 Minutes | 1,543 (10.2%) | 1,539 (11.8%) |
| 60 to 89 Minutes | 1,693 (11.2%) | 963 (7.4%) |
| 90 or more Minutes | 433 (2.9%) | 331 (2.5%) |
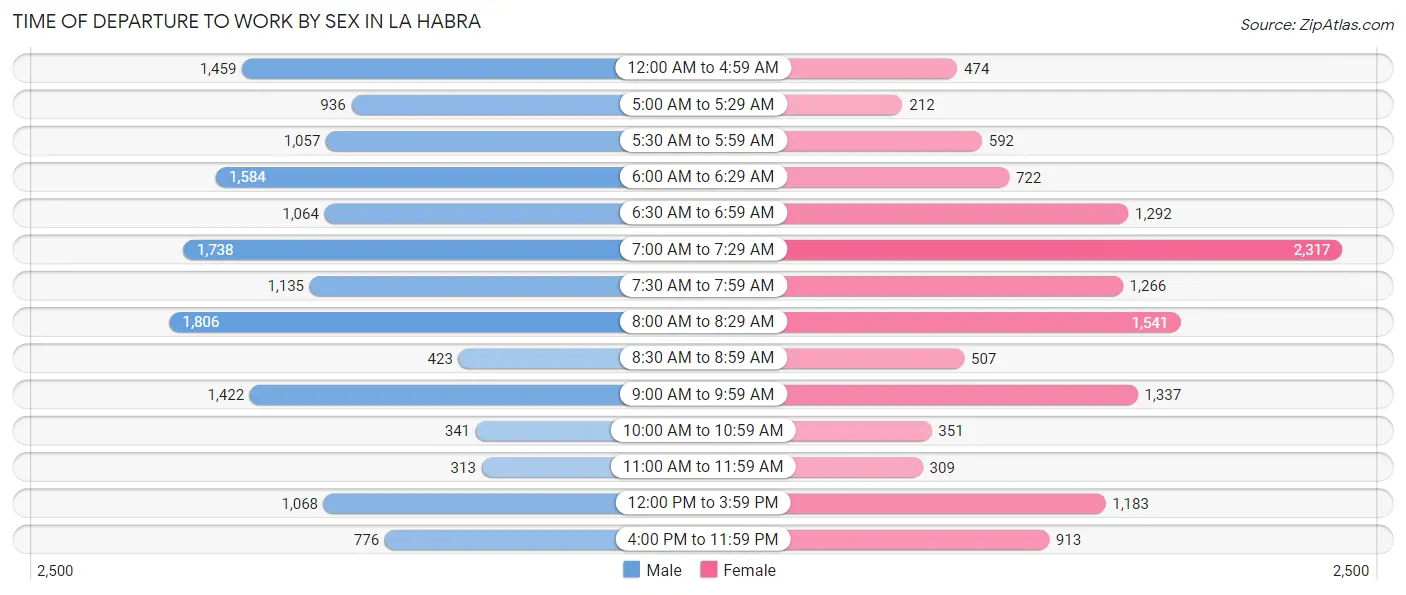
Time of Departure to Work by Sex in La Habra
The most frequent times of departure to work in La Habra are 8:00 AM to 8:29 AM (1,806, 11.9%) for males and 7:00 AM to 7:29 AM (2,317, 17.8%) for females.
| Time of Departure | Male | Female |
| 12:00 AM to 4:59 AM | 1,459 (9.7%) | 474 (3.6%) |
| 5:00 AM to 5:29 AM | 936 (6.2%) | 212 (1.6%) |
| 5:30 AM to 5:59 AM | 1,057 (7.0%) | 592 (4.5%) |
| 6:00 AM to 6:29 AM | 1,584 (10.5%) | 722 (5.6%) |
| 6:30 AM to 6:59 AM | 1,064 (7.0%) | 1,292 (9.9%) |
| 7:00 AM to 7:29 AM | 1,738 (11.5%) | 2,317 (17.8%) |
| 7:30 AM to 7:59 AM | 1,135 (7.5%) | 1,266 (9.7%) |
| 8:00 AM to 8:29 AM | 1,806 (11.9%) | 1,541 (11.8%) |
| 8:30 AM to 8:59 AM | 423 (2.8%) | 507 (3.9%) |
| 9:00 AM to 9:59 AM | 1,422 (9.4%) | 1,337 (10.3%) |
| 10:00 AM to 10:59 AM | 341 (2.2%) | 351 (2.7%) |
| 11:00 AM to 11:59 AM | 313 (2.1%) | 309 (2.4%) |
| 12:00 PM to 3:59 PM | 1,068 (7.1%) | 1,183 (9.1%) |
| 4:00 PM to 11:59 PM | 776 (5.1%) | 913 (7.0%) |
| Total | 15,122 (100.0%) | 13,016 (100.0%) |
Housing Occupancy in La Habra
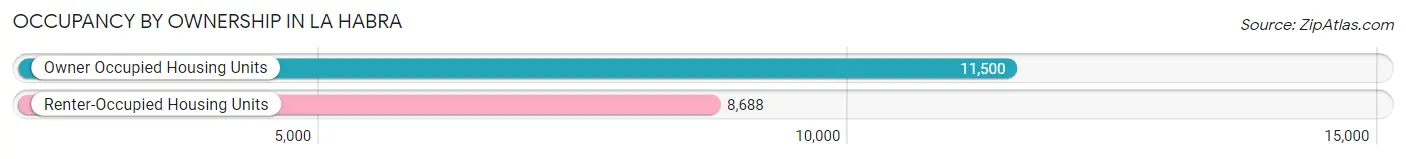
Occupancy by Ownership in La Habra
Of the total 20,188 dwellings in La Habra, owner-occupied units account for 11,500 (57.0%), while renter-occupied units make up 8,688 (43.0%).
| Occupancy | # Housing Units | % Housing Units |
| Owner Occupied Housing Units | 11,500 | 57.0% |
| Renter-Occupied Housing Units | 8,688 | 43.0% |
| Total Occupied Housing Units | 20,188 | 100.0% |
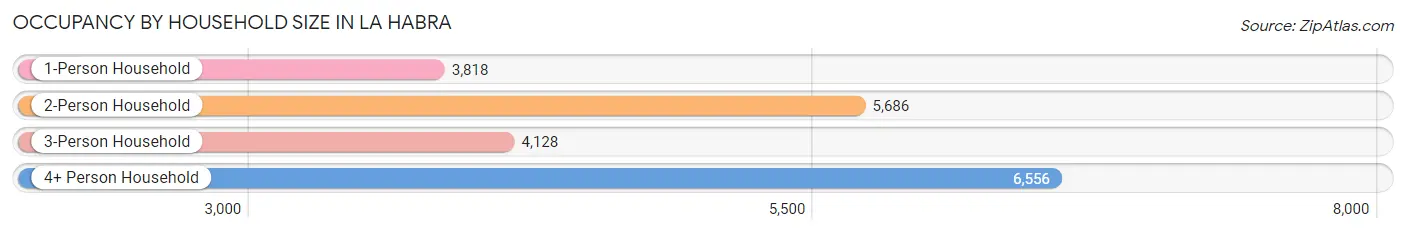
Occupancy by Household Size in La Habra
| Household Size | # Housing Units | % Housing Units |
| 1-Person Household | 3,818 | 18.9% |
| 2-Person Household | 5,686 | 28.2% |
| 3-Person Household | 4,128 | 20.4% |
| 4+ Person Household | 6,556 | 32.5% |
| Total Housing Units | 20,188 | 100.0% |
Occupancy by Ownership by Household Size in La Habra
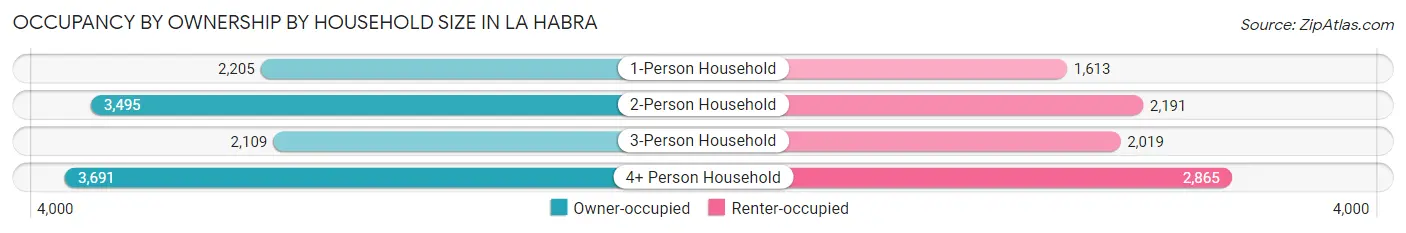
| Household Size | Owner-occupied | Renter-occupied |
| 1-Person Household | 2,205 (57.8%) | 1,613 (42.2%) |
| 2-Person Household | 3,495 (61.5%) | 2,191 (38.5%) |
| 3-Person Household | 2,109 (51.1%) | 2,019 (48.9%) |
| 4+ Person Household | 3,691 (56.3%) | 2,865 (43.7%) |
| Total Housing Units | 11,500 (57.0%) | 8,688 (43.0%) |
Occupancy by Educational Attainment in La Habra
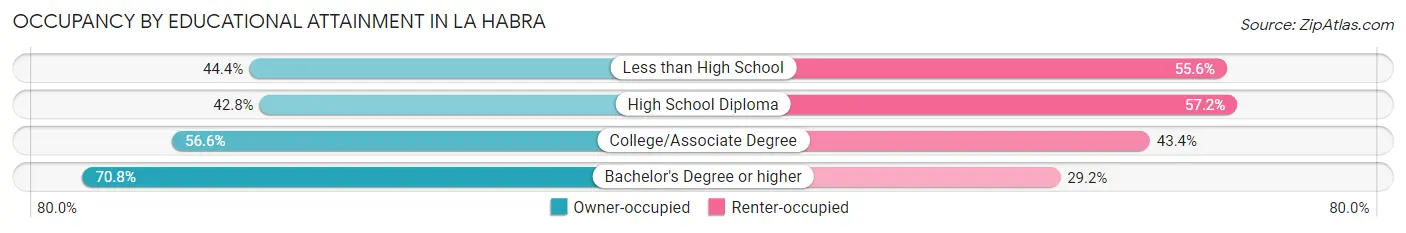
| Household Size | Owner-occupied | Renter-occupied |
| Less than High School | 1,070 (44.4%) | 1,340 (55.6%) |
| High School Diploma | 1,741 (42.8%) | 2,331 (57.2%) |
| College/Associate Degree | 4,043 (56.6%) | 3,102 (43.4%) |
| Bachelor's Degree or higher | 4,646 (70.8%) | 1,915 (29.2%) |
Occupancy by Age of Householder in La Habra
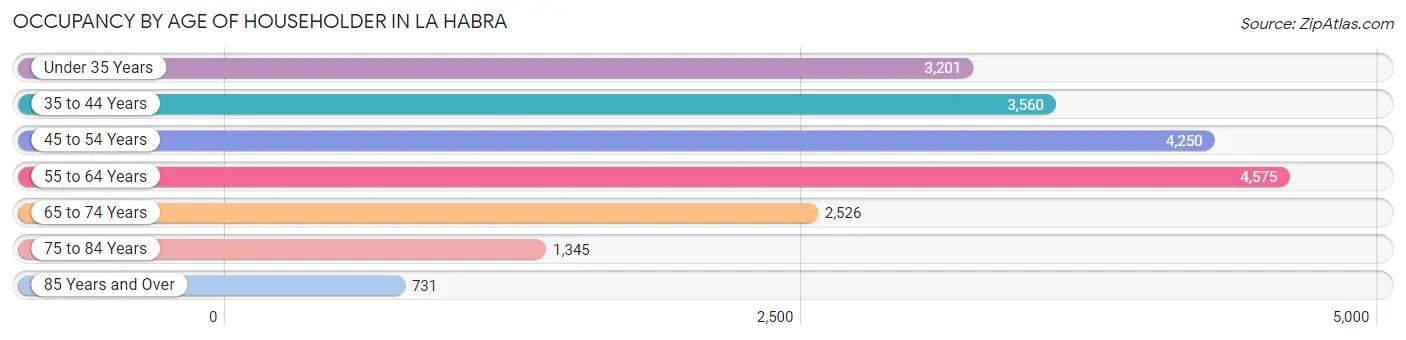
| Age Bracket | # Households | % Households |
| Under 35 Years | 3,201 | 15.9% |
| 35 to 44 Years | 3,560 | 17.6% |
| 45 to 54 Years | 4,250 | 21.0% |
| 55 to 64 Years | 4,575 | 22.7% |
| 65 to 74 Years | 2,526 | 12.5% |
| 75 to 84 Years | 1,345 | 6.7% |
| 85 Years and Over | 731 | 3.6% |
| Total | 20,188 | 100.0% |
Housing Finances in La Habra
Median Income by Occupancy in La Habra
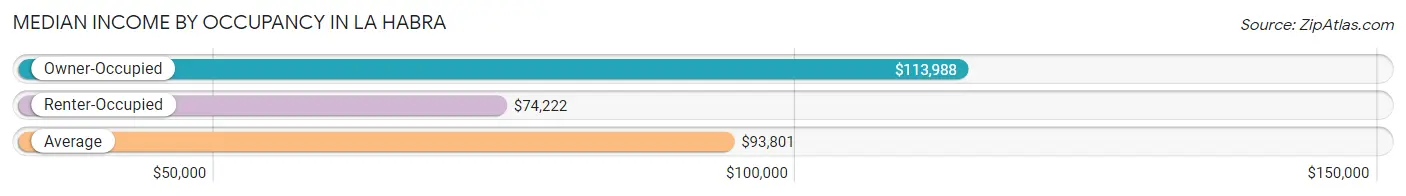
| Occupancy Type | # Households | Median Income |
| Owner-Occupied | 11,500 (57.0%) | $113,988 |
| Renter-Occupied | 8,688 (43.0%) | $74,222 |
| Average | 20,188 (100.0%) | $93,801 |
Occupancy by Householder Income Bracket in La Habra
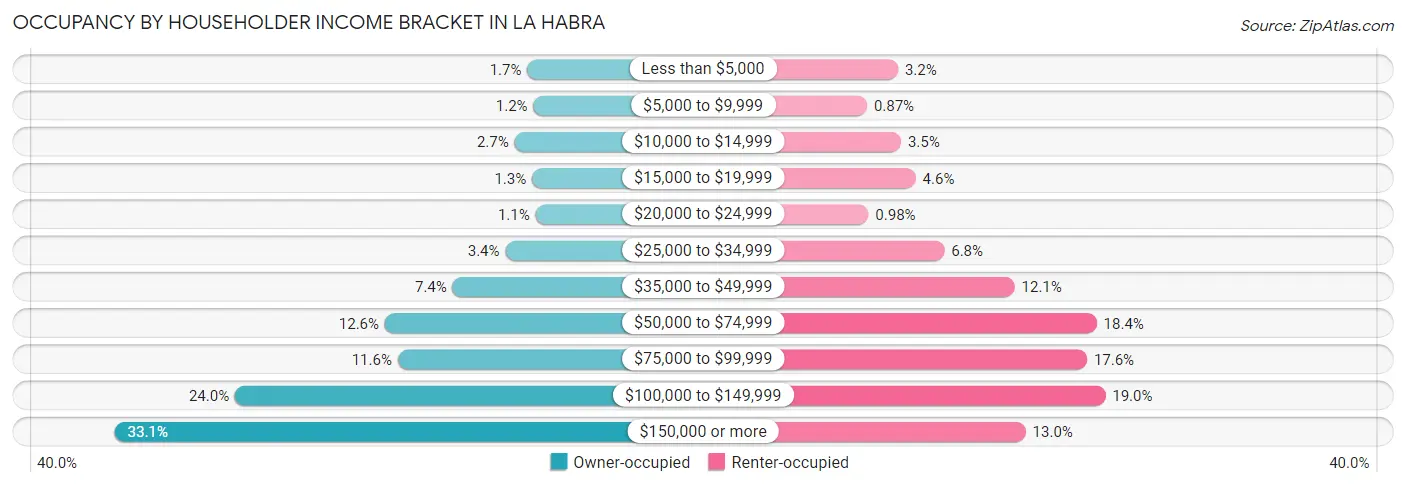
| Income Bracket | Owner-occupied | Renter-occupied |
| Less than $5,000 | 196 (1.7%) | 281 (3.2%) |
| $5,000 to $9,999 | 141 (1.2%) | 76 (0.9%) |
| $10,000 to $14,999 | 307 (2.7%) | 301 (3.5%) |
| $15,000 to $19,999 | 154 (1.3%) | 398 (4.6%) |
| $20,000 to $24,999 | 123 (1.1%) | 85 (1.0%) |
| $25,000 to $34,999 | 388 (3.4%) | 587 (6.8%) |
| $35,000 to $49,999 | 850 (7.4%) | 1,053 (12.1%) |
| $50,000 to $74,999 | 1,443 (12.6%) | 1,596 (18.4%) |
| $75,000 to $99,999 | 1,330 (11.6%) | 1,532 (17.6%) |
| $100,000 to $149,999 | 2,757 (24.0%) | 1,653 (19.0%) |
| $150,000 or more | 3,811 (33.1%) | 1,126 (13.0%) |
| Total | 11,500 (100.0%) | 8,688 (100.0%) |
Monthly Housing Cost Tiers in La Habra
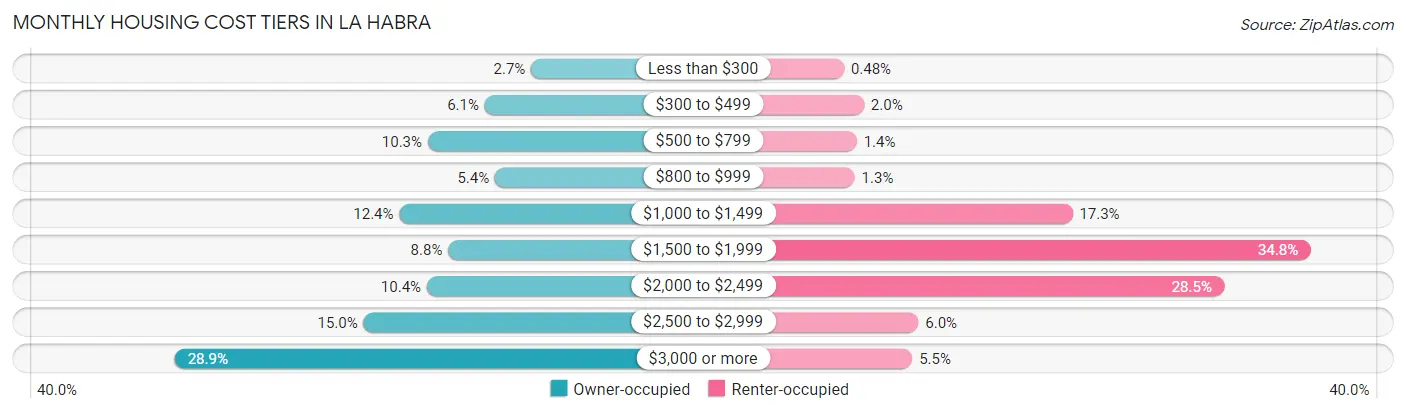
| Monthly Cost | Owner-occupied | Renter-occupied |
| Less than $300 | 309 (2.7%) | 42 (0.5%) |
| $300 to $499 | 703 (6.1%) | 169 (1.9%) |
| $500 to $799 | 1,184 (10.3%) | 123 (1.4%) |
| $800 to $999 | 615 (5.3%) | 110 (1.3%) |
| $1,000 to $1,499 | 1,426 (12.4%) | 1,504 (17.3%) |
| $1,500 to $1,999 | 1,012 (8.8%) | 3,024 (34.8%) |
| $2,000 to $2,499 | 1,193 (10.4%) | 2,472 (28.4%) |
| $2,500 to $2,999 | 1,730 (15.0%) | 518 (6.0%) |
| $3,000 or more | 3,328 (28.9%) | 479 (5.5%) |
| Total | 11,500 (100.0%) | 8,688 (100.0%) |
Physical Housing Characteristics in La Habra
Housing Structures in La Habra
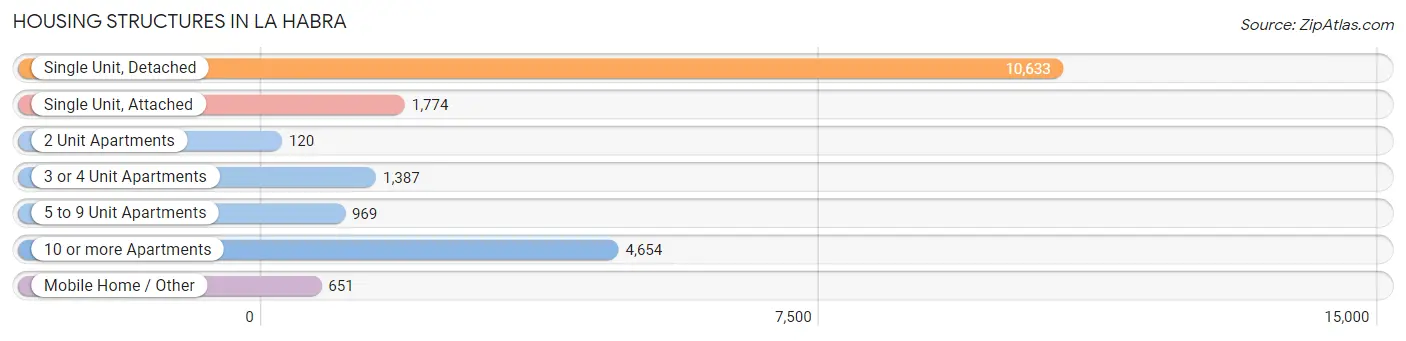
| Structure Type | # Housing Units | % Housing Units |
| Single Unit, Detached | 10,633 | 52.7% |
| Single Unit, Attached | 1,774 | 8.8% |
| 2 Unit Apartments | 120 | 0.6% |
| 3 or 4 Unit Apartments | 1,387 | 6.9% |
| 5 to 9 Unit Apartments | 969 | 4.8% |
| 10 or more Apartments | 4,654 | 23.1% |
| Mobile Home / Other | 651 | 3.2% |
| Total | 20,188 | 100.0% |
Housing Structures by Occupancy in La Habra
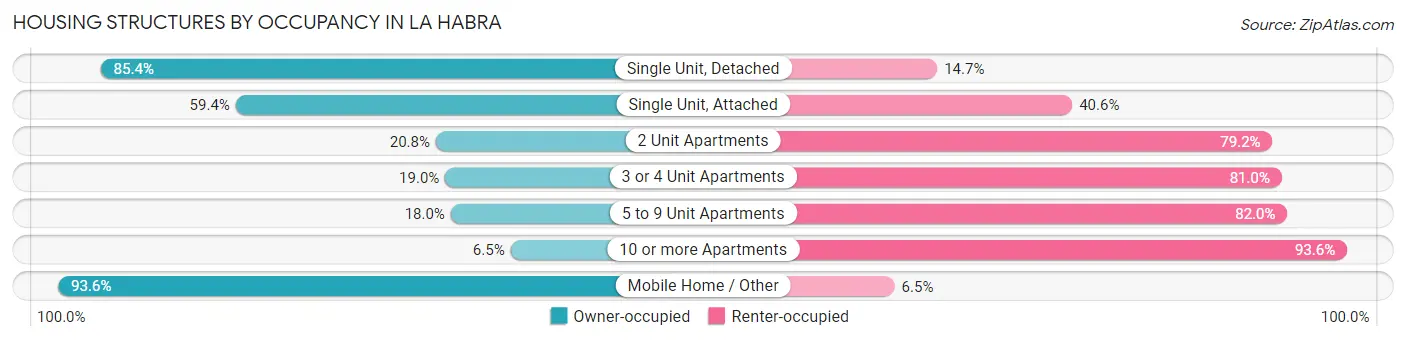
| Structure Type | Owner-occupied | Renter-occupied |
| Single Unit, Detached | 9,075 (85.4%) | 1,558 (14.6%) |
| Single Unit, Attached | 1,053 (59.4%) | 721 (40.6%) |
| 2 Unit Apartments | 25 (20.8%) | 95 (79.2%) |
| 3 or 4 Unit Apartments | 264 (19.0%) | 1,123 (81.0%) |
| 5 to 9 Unit Apartments | 174 (18.0%) | 795 (82.0%) |
| 10 or more Apartments | 300 (6.5%) | 4,354 (93.5%) |
| Mobile Home / Other | 609 (93.5%) | 42 (6.5%) |
| Total | 11,500 (57.0%) | 8,688 (43.0%) |
Housing Structures by Number of Rooms in La Habra
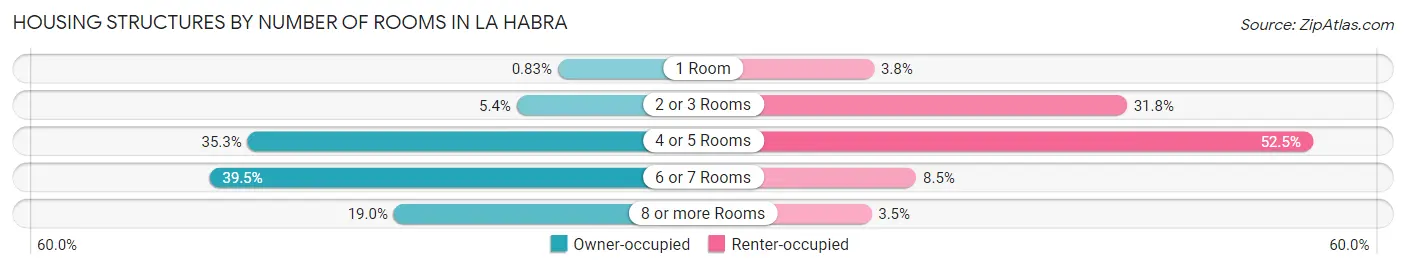
| Number of Rooms | Owner-occupied | Renter-occupied |
| 1 Room | 96 (0.8%) | 328 (3.8%) |
| 2 or 3 Rooms | 620 (5.4%) | 2,765 (31.8%) |
| 4 or 5 Rooms | 4,055 (35.3%) | 4,559 (52.5%) |
| 6 or 7 Rooms | 4,541 (39.5%) | 734 (8.5%) |
| 8 or more Rooms | 2,188 (19.0%) | 302 (3.5%) |
| Total | 11,500 (100.0%) | 8,688 (100.0%) |
Housing Structure by Heating Type in La Habra
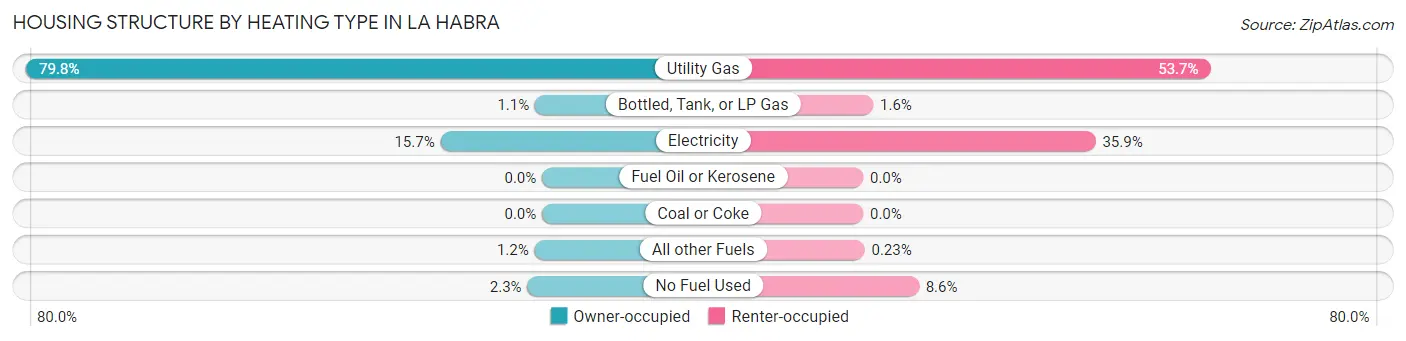
| Heating Type | Owner-occupied | Renter-occupied |
| Utility Gas | 9,173 (79.8%) | 4,663 (53.7%) |
| Bottled, Tank, or LP Gas | 125 (1.1%) | 135 (1.5%) |
| Electricity | 1,807 (15.7%) | 3,122 (35.9%) |
| Fuel Oil or Kerosene | 0 (0.0%) | 0 (0.0%) |
| Coal or Coke | 0 (0.0%) | 0 (0.0%) |
| All other Fuels | 134 (1.2%) | 20 (0.2%) |
| No Fuel Used | 261 (2.3%) | 748 (8.6%) |
| Total | 11,500 (100.0%) | 8,688 (100.0%) |
Household Vehicle Usage in La Habra
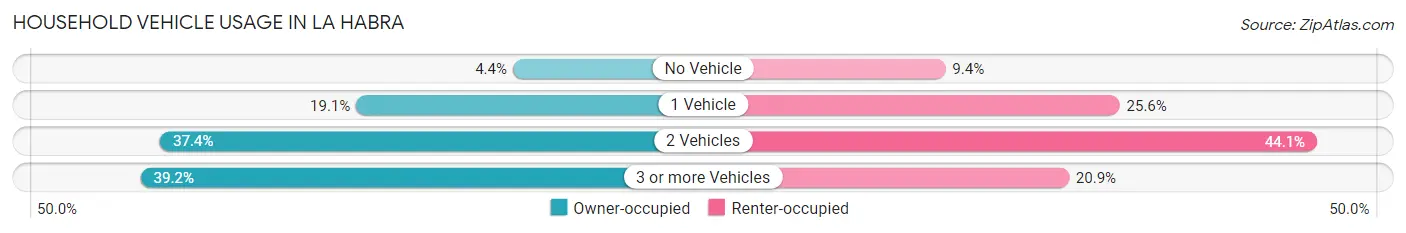
| Vehicles per Household | Owner-occupied | Renter-occupied |
| No Vehicle | 509 (4.4%) | 815 (9.4%) |
| 1 Vehicle | 2,191 (19.1%) | 2,228 (25.6%) |
| 2 Vehicles | 4,295 (37.3%) | 3,828 (44.1%) |
| 3 or more Vehicles | 4,505 (39.2%) | 1,817 (20.9%) |
| Total | 11,500 (100.0%) | 8,688 (100.0%) |
Real Estate & Mortgages in La Habra
Real Estate and Mortgage Overview in La Habra
| Characteristic | Without Mortgage | With Mortgage |
| Housing Units | 3,504 | 7,996 |
| Median Property Value | $644,700 | $692,800 |
| Median Household Income | $77,500 | $3,099 |
| Monthly Housing Costs | $701 | $3,328 |
| Real Estate Taxes | $2,589 | $105 |
Property Value by Mortgage Status in La Habra
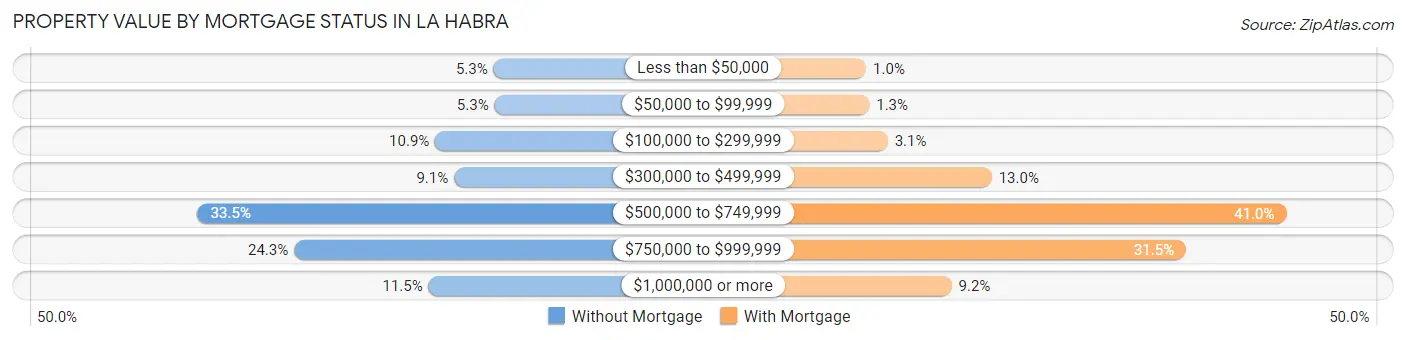
| Property Value | Without Mortgage | With Mortgage |
| Less than $50,000 | 187 (5.3%) | 81 (1.0%) |
| $50,000 to $99,999 | 184 (5.2%) | 105 (1.3%) |
| $100,000 to $299,999 | 382 (10.9%) | 245 (3.1%) |
| $300,000 to $499,999 | 319 (9.1%) | 1,037 (13.0%) |
| $500,000 to $749,999 | 1,175 (33.5%) | 3,280 (41.0%) |
| $750,000 to $999,999 | 853 (24.3%) | 2,516 (31.5%) |
| $1,000,000 or more | 404 (11.5%) | 732 (9.1%) |
| Total | 3,504 (100.0%) | 7,996 (100.0%) |
Household Income by Mortgage Status in La Habra
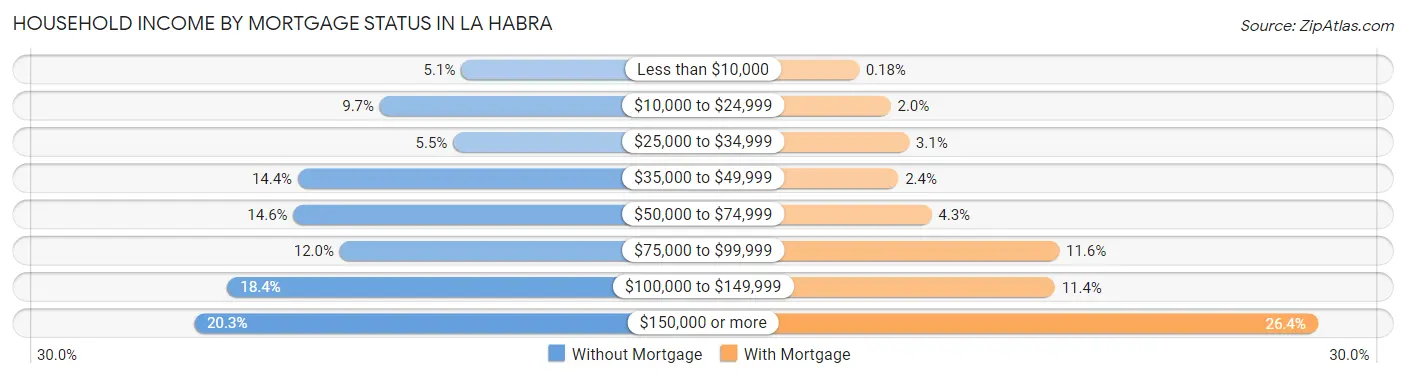
| Household Income | Without Mortgage | With Mortgage |
| Less than $10,000 | 177 (5.1%) | 14 (0.2%) |
| $10,000 to $24,999 | 340 (9.7%) | 160 (2.0%) |
| $25,000 to $34,999 | 193 (5.5%) | 244 (3.0%) |
| $35,000 to $49,999 | 504 (14.4%) | 195 (2.4%) |
| $50,000 to $74,999 | 513 (14.6%) | 346 (4.3%) |
| $75,000 to $99,999 | 420 (12.0%) | 930 (11.6%) |
| $100,000 to $149,999 | 645 (18.4%) | 910 (11.4%) |
| $150,000 or more | 712 (20.3%) | 2,112 (26.4%) |
| Total | 3,504 (100.0%) | 7,996 (100.0%) |
Property Value to Household Income Ratio in La Habra
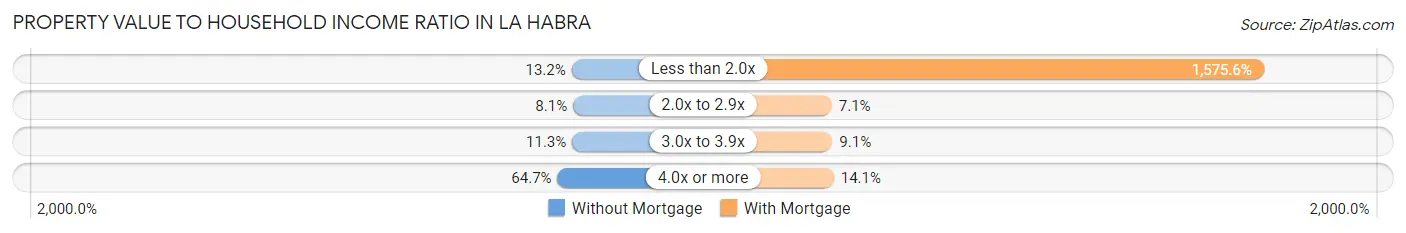
| Value-to-Income Ratio | Without Mortgage | With Mortgage |
| Less than 2.0x | 464 (13.2%) | 125,985 (1,575.6%) |
| 2.0x to 2.9x | 285 (8.1%) | 566 (7.1%) |
| 3.0x to 3.9x | 395 (11.3%) | 725 (9.1%) |
| 4.0x or more | 2,266 (64.7%) | 1,125 (14.1%) |
| Total | 3,504 (100.0%) | 7,996 (100.0%) |
Real Estate Taxes by Mortgage Status in La Habra
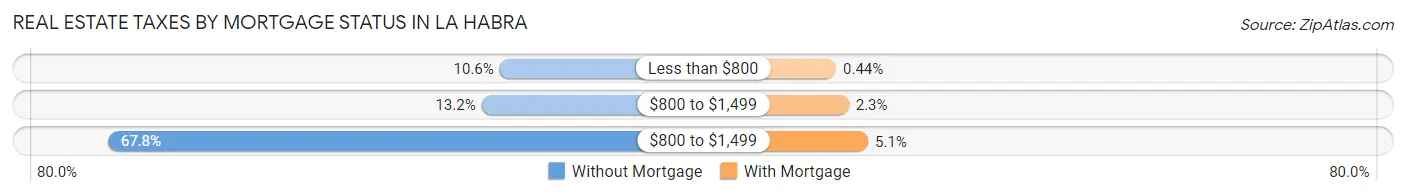
| Property Taxes | Without Mortgage | With Mortgage |
| Less than $800 | 371 (10.6%) | 35 (0.4%) |
| $800 to $1,499 | 464 (13.2%) | 184 (2.3%) |
| $800 to $1,499 | 2,377 (67.8%) | 409 (5.1%) |
| Total | 3,504 (100.0%) | 7,996 (100.0%) |
Health & Disability in La Habra
Health Insurance Coverage by Age in La Habra
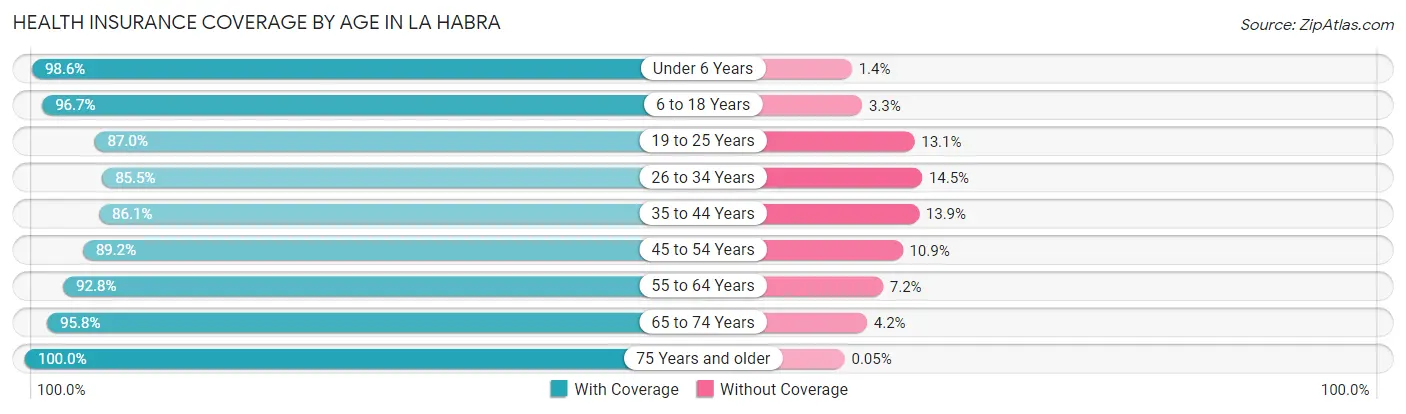
| Age Bracket | With Coverage | Without Coverage |
| Under 6 Years | 4,002 (98.6%) | 56 (1.4%) |
| 6 to 18 Years | 10,112 (96.7%) | 344 (3.3%) |
| 19 to 25 Years | 5,390 (87.0%) | 809 (13.1%) |
| 26 to 34 Years | 7,411 (85.5%) | 1,255 (14.5%) |
| 35 to 44 Years | 6,816 (86.1%) | 1,100 (13.9%) |
| 45 to 54 Years | 7,643 (89.1%) | 930 (10.8%) |
| 55 to 64 Years | 7,598 (92.8%) | 589 (7.2%) |
| 65 to 74 Years | 4,823 (95.8%) | 212 (4.2%) |
| 75 Years and older | 3,639 (100.0%) | 2 (0.1%) |
| Total | 57,434 (91.6%) | 5,297 (8.4%) |
Health Insurance Coverage by Citizenship Status in La Habra
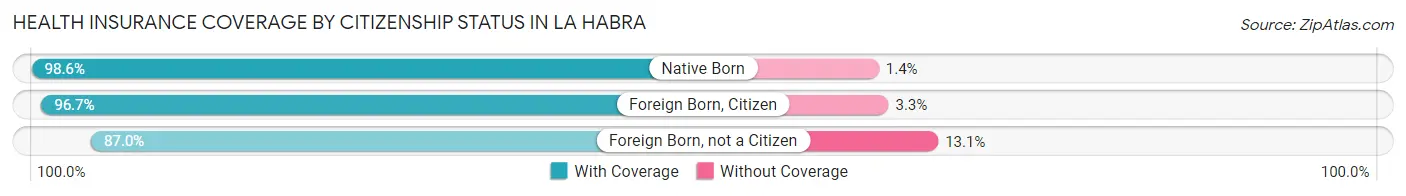
| Citizenship Status | With Coverage | Without Coverage |
| Native Born | 4,002 (98.6%) | 56 (1.4%) |
| Foreign Born, Citizen | 10,112 (96.7%) | 344 (3.3%) |
| Foreign Born, not a Citizen | 5,390 (87.0%) | 809 (13.1%) |
Health Insurance Coverage by Household Income in La Habra
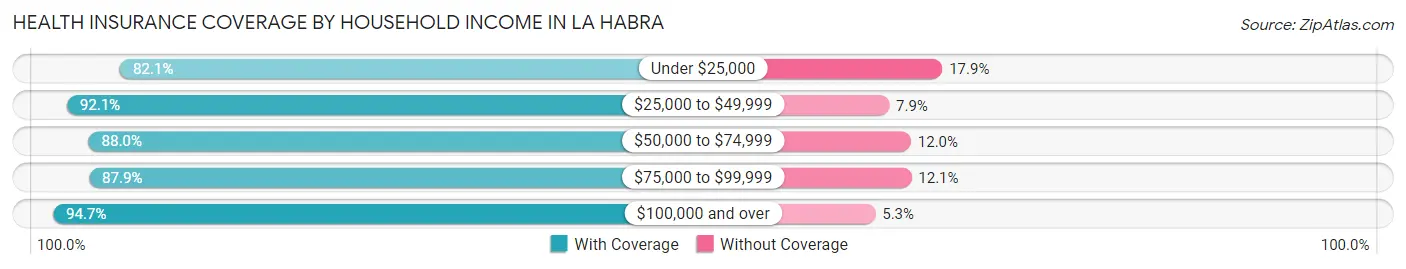
| Household Income | With Coverage | Without Coverage |
| Under $25,000 | 3,432 (82.1%) | 747 (17.9%) |
| $25,000 to $49,999 | 6,940 (92.1%) | 598 (7.9%) |
| $50,000 to $74,999 | 7,710 (88.0%) | 1,051 (12.0%) |
| $75,000 to $99,999 | 8,610 (87.9%) | 1,185 (12.1%) |
| $100,000 and over | 30,164 (94.7%) | 1,702 (5.3%) |
Public vs Private Health Insurance Coverage by Age in La Habra
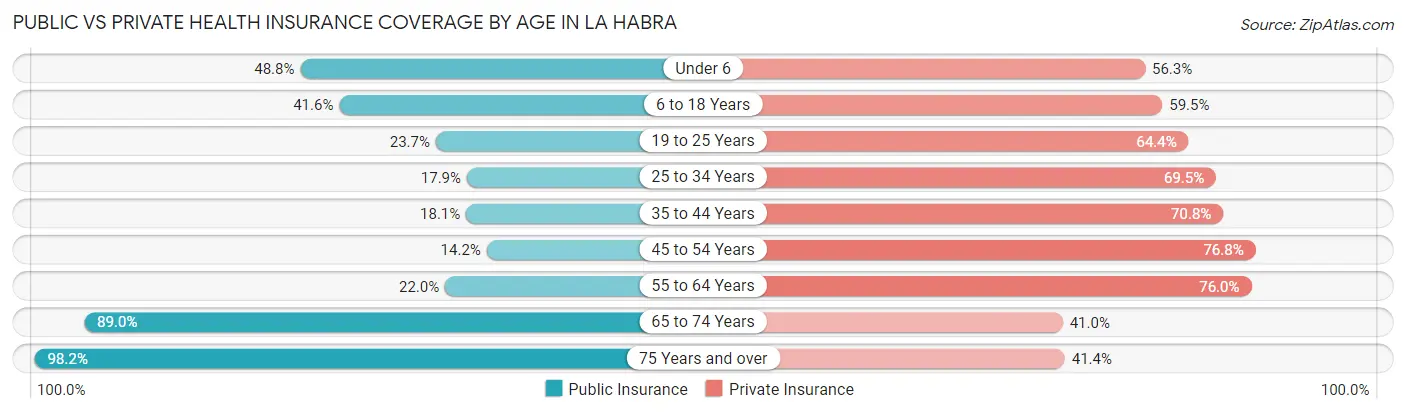
| Age Bracket | Public Insurance | Private Insurance |
| Under 6 | 1,981 (48.8%) | 2,284 (56.3%) |
| 6 to 18 Years | 4,350 (41.6%) | 6,220 (59.5%) |
| 19 to 25 Years | 1,467 (23.7%) | 3,989 (64.3%) |
| 25 to 34 Years | 1,552 (17.9%) | 6,019 (69.5%) |
| 35 to 44 Years | 1,429 (18.0%) | 5,603 (70.8%) |
| 45 to 54 Years | 1,221 (14.2%) | 6,582 (76.8%) |
| 55 to 64 Years | 1,798 (22.0%) | 6,223 (76.0%) |
| 65 to 74 Years | 4,479 (89.0%) | 2,065 (41.0%) |
| 75 Years and over | 3,574 (98.2%) | 1,507 (41.4%) |
| Total | 21,851 (34.8%) | 40,492 (64.5%) |
Disability Status by Sex by Age in La Habra
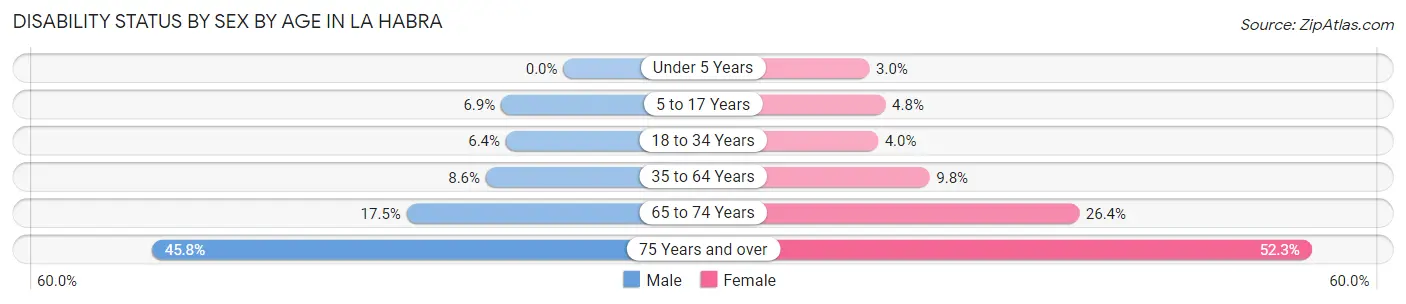
| Age Bracket | Male | Female |
| Under 5 Years | 0 (0.0%) | 47 (3.0%) |
| 5 to 17 Years | 390 (6.9%) | 224 (4.8%) |
| 18 to 34 Years | 508 (6.4%) | 306 (4.0%) |
| 35 to 64 Years | 1,043 (8.6%) | 1,228 (9.8%) |
| 65 to 74 Years | 453 (17.4%) | 644 (26.4%) |
| 75 Years and over | 637 (45.8%) | 1,178 (52.3%) |
Disability Class by Sex by Age in La Habra
Disability Class: Hearing Difficulty
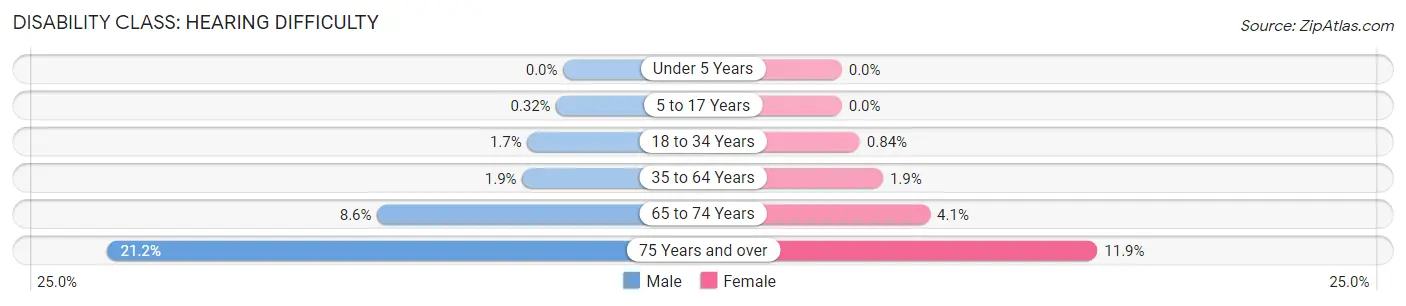
| Age Bracket | Male | Female |
| Under 5 Years | 0 (0.0%) | 0 (0.0%) |
| 5 to 17 Years | 18 (0.3%) | 0 (0.0%) |
| 18 to 34 Years | 132 (1.7%) | 64 (0.8%) |
| 35 to 64 Years | 229 (1.9%) | 241 (1.9%) |
| 65 to 74 Years | 224 (8.6%) | 100 (4.1%) |
| 75 Years and over | 294 (21.1%) | 267 (11.9%) |
Disability Class: Vision Difficulty
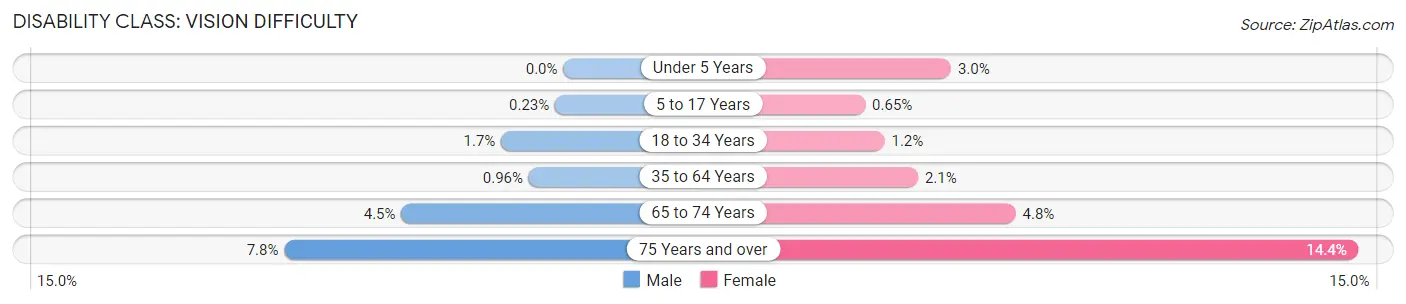
| Age Bracket | Male | Female |
| Under 5 Years | 0 (0.0%) | 47 (3.0%) |
| 5 to 17 Years | 13 (0.2%) | 30 (0.6%) |
| 18 to 34 Years | 137 (1.7%) | 91 (1.2%) |
| 35 to 64 Years | 116 (1.0%) | 267 (2.1%) |
| 65 to 74 Years | 117 (4.5%) | 118 (4.8%) |
| 75 Years and over | 108 (7.8%) | 324 (14.4%) |
Disability Class: Cognitive Difficulty
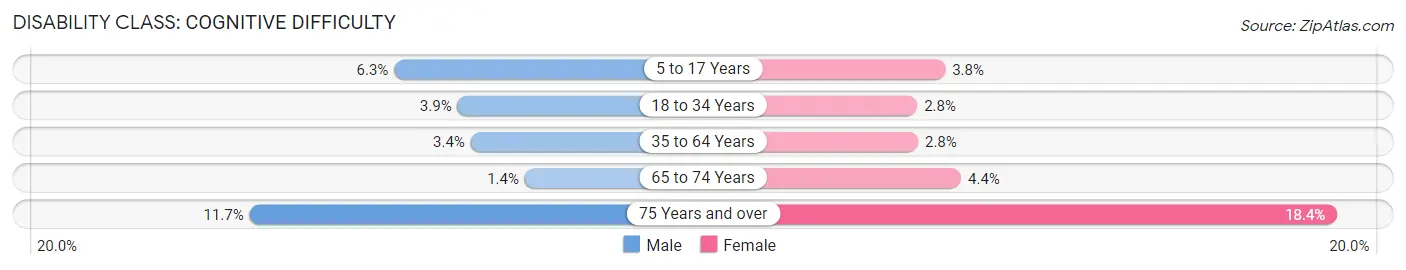
| Age Bracket | Male | Female |
| 5 to 17 Years | 353 (6.3%) | 178 (3.8%) |
| 18 to 34 Years | 312 (3.9%) | 214 (2.8%) |
| 35 to 64 Years | 415 (3.4%) | 357 (2.8%) |
| 65 to 74 Years | 37 (1.4%) | 108 (4.4%) |
| 75 Years and over | 162 (11.7%) | 414 (18.4%) |
Disability Class: Ambulatory Difficulty
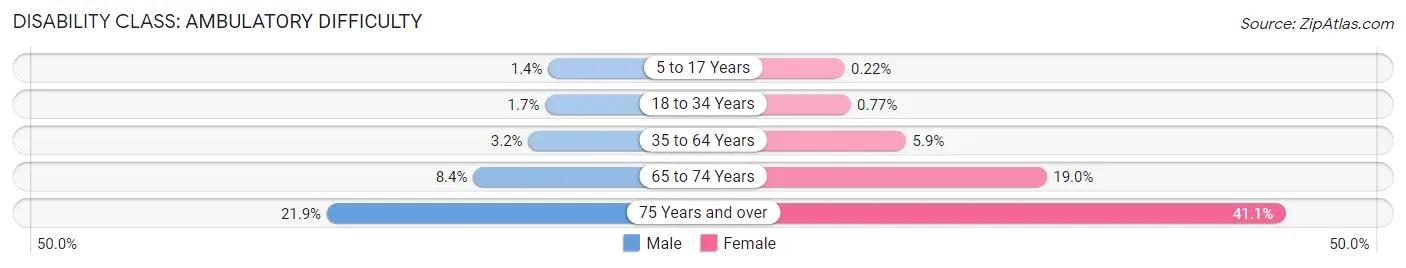
| Age Bracket | Male | Female |
| 5 to 17 Years | 78 (1.4%) | 10 (0.2%) |
| 18 to 34 Years | 133 (1.7%) | 59 (0.8%) |
| 35 to 64 Years | 391 (3.2%) | 746 (5.9%) |
| 65 to 74 Years | 217 (8.4%) | 463 (19.0%) |
| 75 Years and over | 305 (21.9%) | 926 (41.1%) |
Disability Class: Self-Care Difficulty
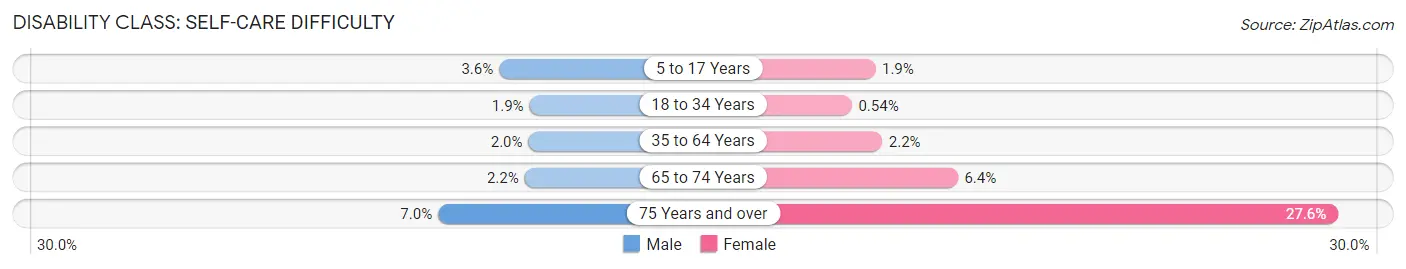
| Age Bracket | Male | Female |
| 5 to 17 Years | 201 (3.6%) | 86 (1.8%) |
| 18 to 34 Years | 150 (1.9%) | 41 (0.5%) |
| 35 to 64 Years | 236 (1.9%) | 281 (2.2%) |
| 65 to 74 Years | 56 (2.2%) | 157 (6.4%) |
| 75 Years and over | 97 (7.0%) | 622 (27.6%) |
Technology Access in La Habra
Computing Device Access in La Habra
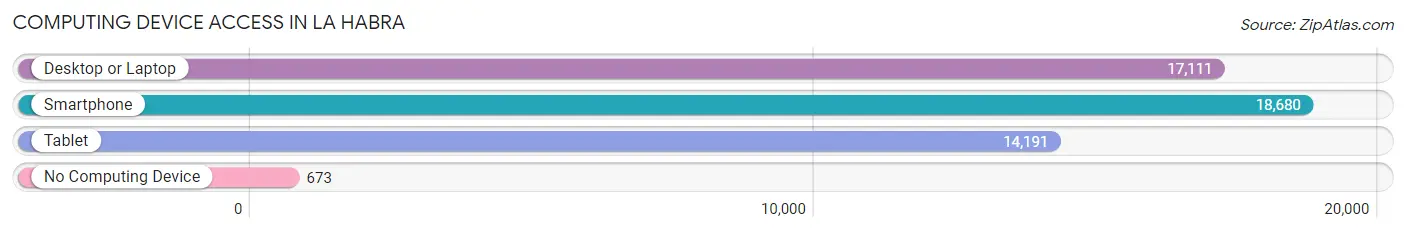
| Device Type | # Households | % Households |
| Desktop or Laptop | 17,111 | 84.8% |
| Smartphone | 18,680 | 92.5% |
| Tablet | 14,191 | 70.3% |
| No Computing Device | 673 | 3.3% |
| Total | 20,188 | 100.0% |
Internet Access in La Habra
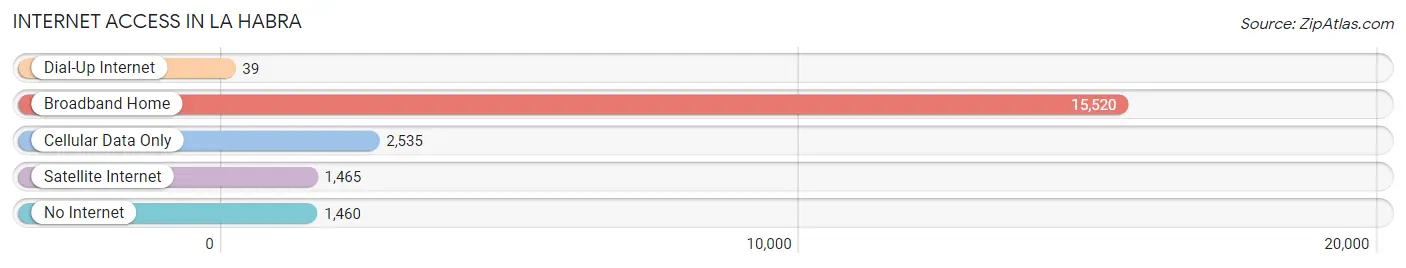
| Internet Type | # Households | % Households |
| Dial-Up Internet | 39 | 0.2% |
| Broadband Home | 15,520 | 76.9% |
| Cellular Data Only | 2,535 | 12.6% |
| Satellite Internet | 1,465 | 7.3% |
| No Internet | 1,460 | 7.2% |
| Total | 20,188 | 100.0% |
La Habra Summary
HISTORY
La Habra is a city located in the northwestern corner of Orange County, California. It is bordered by the cities of Fullerton, Brea, and La Mirada. The city was founded in 1896 by settlers from the nearby city of Fullerton. The city was originally known as the “La Habra Settlement” and was home to a small farming community. The city was officially incorporated in 1925 and has since grown to a population of over 60,000 people.
La Habra has a rich history that dates back to the early days of California. The area was originally inhabited by the Tongva Native Americans, who were the first people to settle in the area. The Tongva were a peaceful people who lived off the land and were known for their basket weaving and pottery. The area was later settled by Spanish missionaries in the late 1700s. The Spanish established several missions in the area, including Mission San Gabriel Arcangel, which is located just a few miles from La Habra.
In the late 1800s, the area was settled by American settlers from the nearby city of Fullerton. These settlers established a small farming community and named it La Habra. The city was officially incorporated in 1925 and has since grown to a population of over 60,000 people.
GEOGRAPHY
La Habra is located in the northwestern corner of Orange County, California. It is bordered by the cities of Fullerton, Brea, and La Mirada. The city is situated on the Santa Ana River, which runs through the city and provides a natural border between La Habra and the neighboring cities. The city is located in the foothills of the Santa Ana Mountains and is surrounded by rolling hills and valleys.
The city has a total area of 8.2 square miles, of which 8.1 square miles is land and 0.1 square miles is water. The city has a warm Mediterranean climate with mild winters and hot, dry summers. The average temperature in the summer is around 80 degrees Fahrenheit and the average temperature in the winter is around 60 degrees Fahrenheit.
ECONOMY
La Habra has a strong and diverse economy. The city is home to a variety of businesses, including manufacturing, retail, and service industries. The city is also home to several large employers, including the La Habra City School District, the La Habra Police Department, and the La Habra Fire Department.
The city is also home to several shopping centers, including the La Habra Marketplace, the La Habra Town Center, and the La Habra Plaza. The city is also home to several restaurants, including Mexican, Italian, and Chinese cuisine.
The city is also home to several parks and recreational areas, including La Habra Heights Park, La Habra Community Park, and La Habra Heights Park. The city is also home to several golf courses, including the La Habra Country Club and the La Habra Golf Course.
DEMOGRAPHICS
As of the 2010 census, the population of La Habra was 60,239. The population is made up of a diverse mix of people, including White (47.2%), Hispanic or Latino (44.2%), Asian (4.2%), African American (2.2%), and other (2.2%). The median age of the population is 33.7 years.
The median household income in La Habra is $63,945 and the median family income is $71,945. The per capita income in La Habra is $25,945. The city has a poverty rate of 11.3%.
The city is served by the La Habra City School District, which includes six elementary schools, two middle schools, and one high school. The city is also home to several private schools, including La Habra Christian School and La Habra Montessori School.
Common Questions
What is Per Capita Income in La Habra?
Per Capita income in La Habra is $37,527.
What is the Median Family Income in La Habra?
Median Family Income in La Habra is $96,699.
What is the Median Household income in La Habra?
Median Household Income in La Habra is $93,801.
What is Income or Wage Gap in La Habra?
Income or Wage Gap in La Habra is 19.5%.
Women in La Habra earn 80.5 cents for every dollar earned by a man.
What is Family Income Deficit in La Habra?
Family Income Deficit in La Habra is $10,900.
Families that are below poverty line in La Habra earn $10,900 less on average than the poverty threshold level.
What is Inequality or Gini Index in La Habra?
Inequality or Gini Index in La Habra is 0.41.
What is the Total Population of La Habra?
Total Population of La Habra is 62,904.
What is the Total Male Population of La Habra?
Total Male Population of La Habra is 31,681.
What is the Total Female Population of La Habra?
Total Female Population of La Habra is 31,223.
What is the Ratio of Males per 100 Females in La Habra?
There are 101.47 Males per 100 Females in La Habra.
What is the Ratio of Females per 100 Males in La Habra?
There are 98.55 Females per 100 Males in La Habra.
What is the Median Population Age in La Habra?
Median Population Age in La Habra is 37.7 Years.
What is the Average Family Size in La Habra
Average Family Size in La Habra is 3.5 People.
What is the Average Household Size in La Habra
Average Household Size in La Habra is 3.1 People.
How Large is the Labor Force in La Habra?
There are 34,703 People in the Labor Forcein in La Habra.
What is the Percentage of People in the Labor Force in La Habra?
68.3% of People are in the Labor Force in La Habra.
What is the Unemployment Rate in La Habra?
Unemployment Rate in La Habra is 7.2%.