King City, CA Map & Demographics
King City Map
King City Overview
$22,288
PER CAPITA INCOME
$54,651
AVG FAMILY INCOME
$70,145
AVG HOUSEHOLD INCOME
28.8%
WAGE / INCOME GAP [ % ]
71.2¢/ $1
WAGE / INCOME GAP [ $ ]
$17,632
FAMILY INCOME DEFICIT
0.42
INEQUALITY / GINI INDEX
13,471
TOTAL POPULATION
6,414
MALE POPULATION
7,057
FEMALE POPULATION
90.89
MALES / 100 FEMALES
110.02
FEMALES / 100 MALES
27.1
MEDIAN AGE
4.1
AVG FAMILY SIZE
4.1
AVG HOUSEHOLD SIZE
5,050
LABOR FORCE [ PEOPLE ]
55.3%
PERCENT IN LABOR FORCE
5.0%
UNEMPLOYMENT RATE
King City Zip Codes
King City Area Codes
Income in King City
Income Overview in King City
Per Capita Income in King City is $22,288, while median incomes of families and households are $54,651 and $70,145 respectively.
| Characteristic | Number | Measure |
| Per Capita Income | 13,471 | $22,288 |
| Median Family Income | 2,839 | $54,651 |
| Mean Family Income | 2,839 | $75,941 |
| Median Household Income | 3,268 | $70,145 |
| Mean Household Income | 3,268 | $88,681 |
| Income Deficit | 2,839 | $17,632 |
| Wage / Income Gap (%) | 13,471 | 28.80% |
| Wage / Income Gap ($) | 13,471 | 71.20¢ per $1 |
| Gini / Inequality Index | 13,471 | 0.42 |
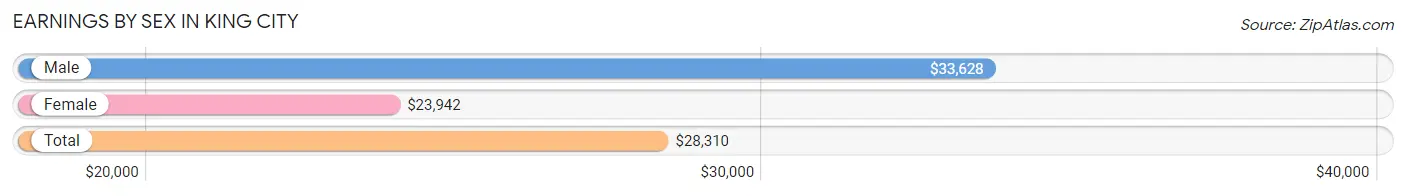
Earnings by Sex in King City
Average Earnings in King City are $28,310, $33,628 for men and $23,942 for women, a difference of 28.8%.
| Sex | Number | Average Earnings |
| Male | 3,233 (57.5%) | $33,628 |
| Female | 2,393 (42.5%) | $23,942 |
| Total | 5,626 (100.0%) | $28,310 |
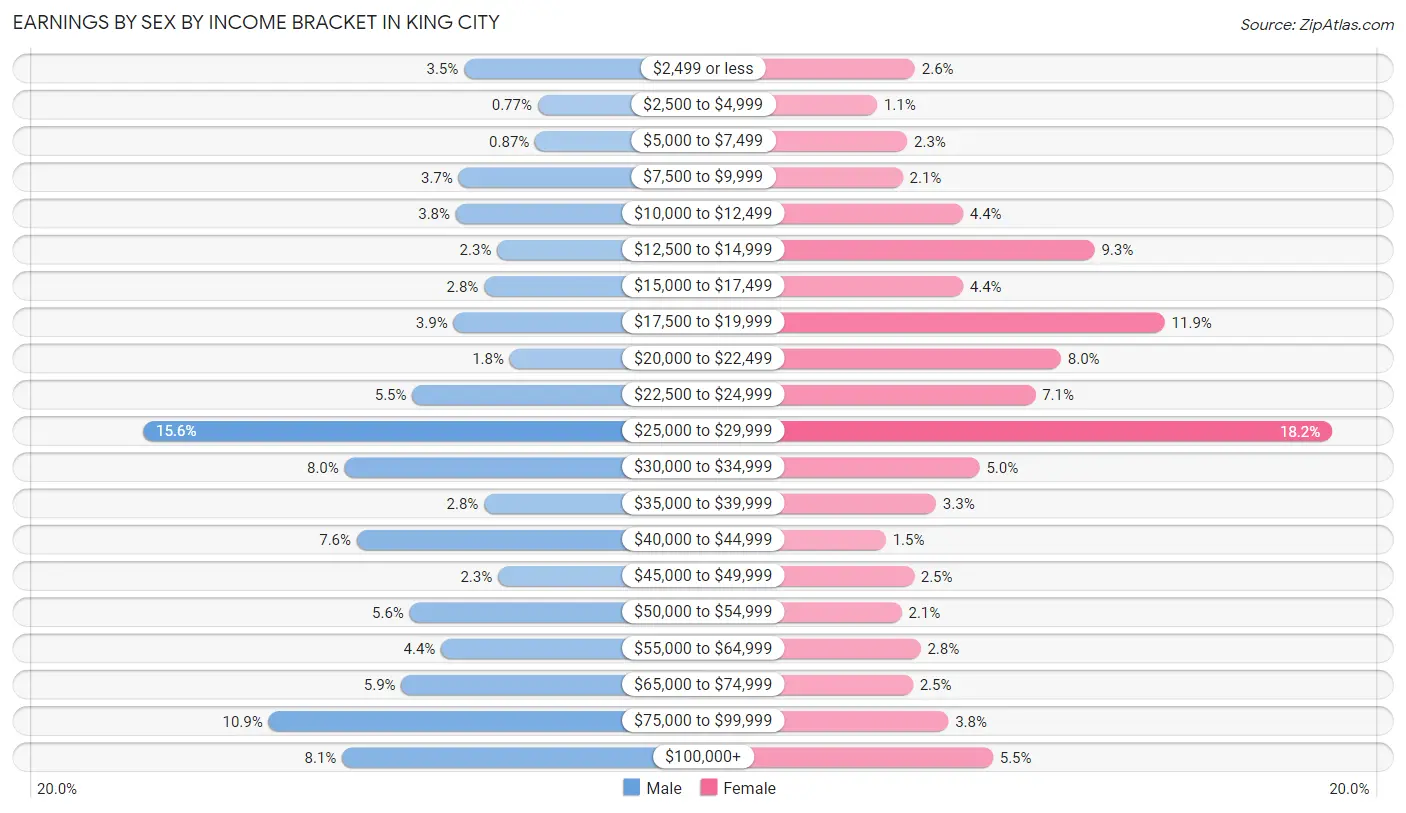
Earnings by Sex by Income Bracket in King City
The most common earnings brackets in King City are $25,000 to $29,999 for men (503 | 15.6%) and $25,000 to $29,999 for women (435 | 18.2%).
| Income | Male | Female |
| $2,499 or less | 114 (3.5%) | 61 (2.5%) |
| $2,500 to $4,999 | 25 (0.8%) | 27 (1.1%) |
| $5,000 to $7,499 | 28 (0.9%) | 54 (2.3%) |
| $7,500 to $9,999 | 121 (3.7%) | 50 (2.1%) |
| $10,000 to $12,499 | 124 (3.8%) | 104 (4.3%) |
| $12,500 to $14,999 | 74 (2.3%) | 222 (9.3%) |
| $15,000 to $17,499 | 90 (2.8%) | 104 (4.3%) |
| $17,500 to $19,999 | 127 (3.9%) | 285 (11.9%) |
| $20,000 to $22,499 | 59 (1.8%) | 192 (8.0%) |
| $22,500 to $24,999 | 177 (5.5%) | 169 (7.1%) |
| $25,000 to $29,999 | 503 (15.6%) | 435 (18.2%) |
| $30,000 to $34,999 | 259 (8.0%) | 119 (5.0%) |
| $35,000 to $39,999 | 90 (2.8%) | 80 (3.3%) |
| $40,000 to $44,999 | 244 (7.5%) | 35 (1.5%) |
| $45,000 to $49,999 | 73 (2.3%) | 60 (2.5%) |
| $50,000 to $54,999 | 180 (5.6%) | 49 (2.1%) |
| $55,000 to $64,999 | 142 (4.4%) | 66 (2.8%) |
| $65,000 to $74,999 | 190 (5.9%) | 59 (2.5%) |
| $75,000 to $99,999 | 351 (10.9%) | 91 (3.8%) |
| $100,000+ | 262 (8.1%) | 131 (5.5%) |
| Total | 3,233 (100.0%) | 2,393 (100.0%) |
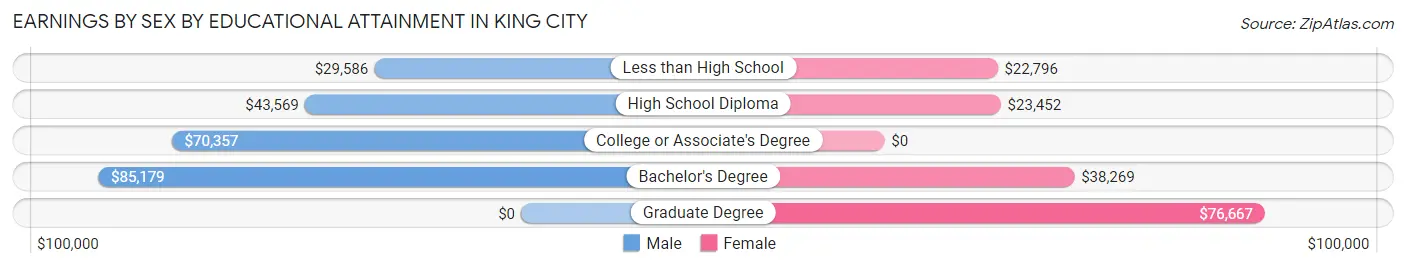
Earnings by Sex by Educational Attainment in King City
Average earnings in King City are $41,875 for men and $25,334 for women, a difference of 39.5%. Men with an educational attainment of bachelor's degree enjoy the highest average annual earnings of $85,179, while those with less than high school education earn the least with $29,586. Women with an educational attainment of graduate degree earn the most with the average annual earnings of $76,667, while those with less than high school education have the smallest earnings of $22,796.
| Educational Attainment | Male Income | Female Income |
| Less than High School | $29,586 | $22,796 |
| High School Diploma | $43,569 | $23,452 |
| College or Associate's Degree | $70,357 | $0 |
| Bachelor's Degree | $85,179 | $38,269 |
| Graduate Degree | - | - |
| Total | $41,875 | $25,334 |
Family Income in King City
Family Income Brackets in King City
According to the King City family income data, there are 585 families falling into the $35,000 to $49,999 income range, which is the most common income bracket and makes up 20.6% of all families. Conversely, the $10,000 to $14,999 income bracket is the least frequent group with only 48 families (1.7%) belonging to this category.
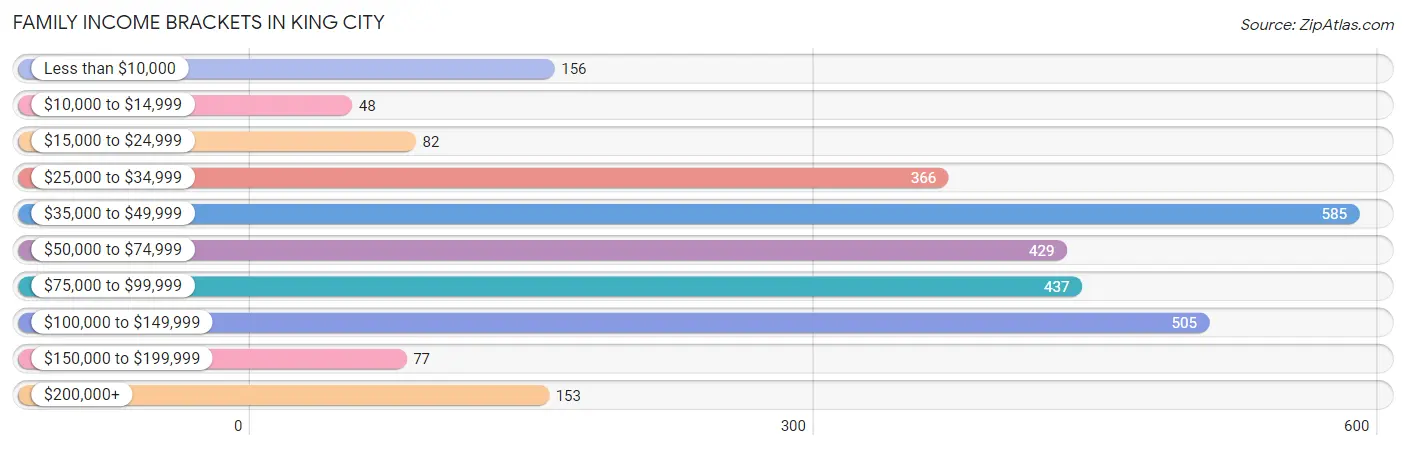
| Income Bracket | # Families | % Families |
| Less than $10,000 | 156 | 5.5% |
| $10,000 to $14,999 | 48 | 1.7% |
| $15,000 to $24,999 | 82 | 2.9% |
| $25,000 to $34,999 | 366 | 12.9% |
| $35,000 to $49,999 | 585 | 20.6% |
| $50,000 to $74,999 | 429 | 15.1% |
| $75,000 to $99,999 | 437 | 15.4% |
| $100,000 to $149,999 | 505 | 17.8% |
| $150,000 to $199,999 | 77 | 2.7% |
| $200,000+ | 153 | 5.4% |
Family Income by Famaliy Size in King City
6-person families (107 | 3.8%) account for the highest median family income in King City with $86,250 per family, while 2-person families (476 | 16.8%) have the highest median income of $33,530 per family member.
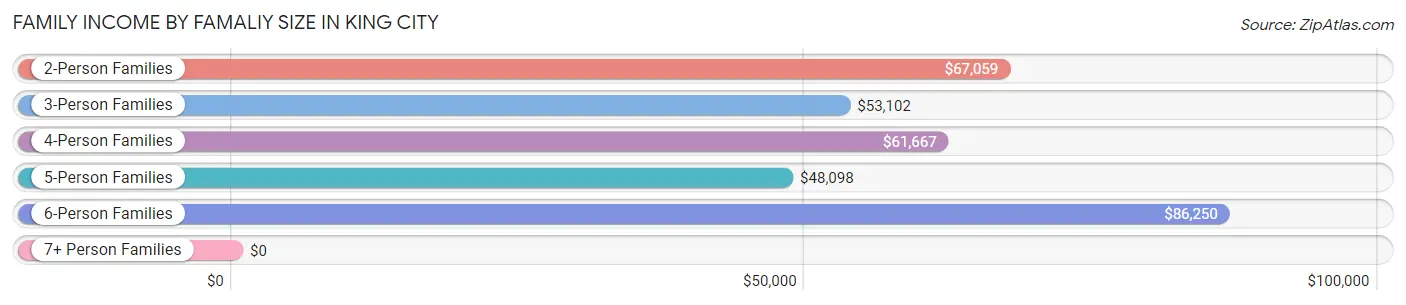
| Income Bracket | # Families | Median Income |
| 2-Person Families | 476 (16.8%) | $67,059 |
| 3-Person Families | 683 (24.1%) | $53,102 |
| 4-Person Families | 822 (28.9%) | $61,667 |
| 5-Person Families | 685 (24.1%) | $48,098 |
| 6-Person Families | 107 (3.8%) | $86,250 |
| 7+ Person Families | 66 (2.3%) | $0 |
| Total | 2,839 (100.0%) | $54,651 |
Family Income by Number of Earners in King City
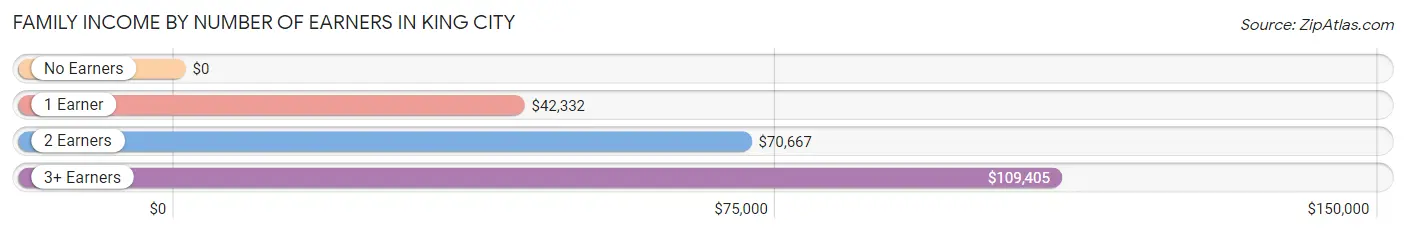
| Number of Earners | # Families | Median Income |
| No Earners | 270 (9.5%) | $0 |
| 1 Earner | 911 (32.1%) | $42,332 |
| 2 Earners | 1,192 (42.0%) | $70,667 |
| 3+ Earners | 466 (16.4%) | $109,405 |
| Total | 2,839 (100.0%) | $54,651 |
Household Income in King City
Household Income Brackets in King City
With 637 households falling in the category, the $50,000 to $74,999 income range is the most frequent in King City, accounting for 19.5% of all households. In contrast, only 26 households (0.8%) fall into the $10,000 to $14,999 income bracket, making it the least populous group.
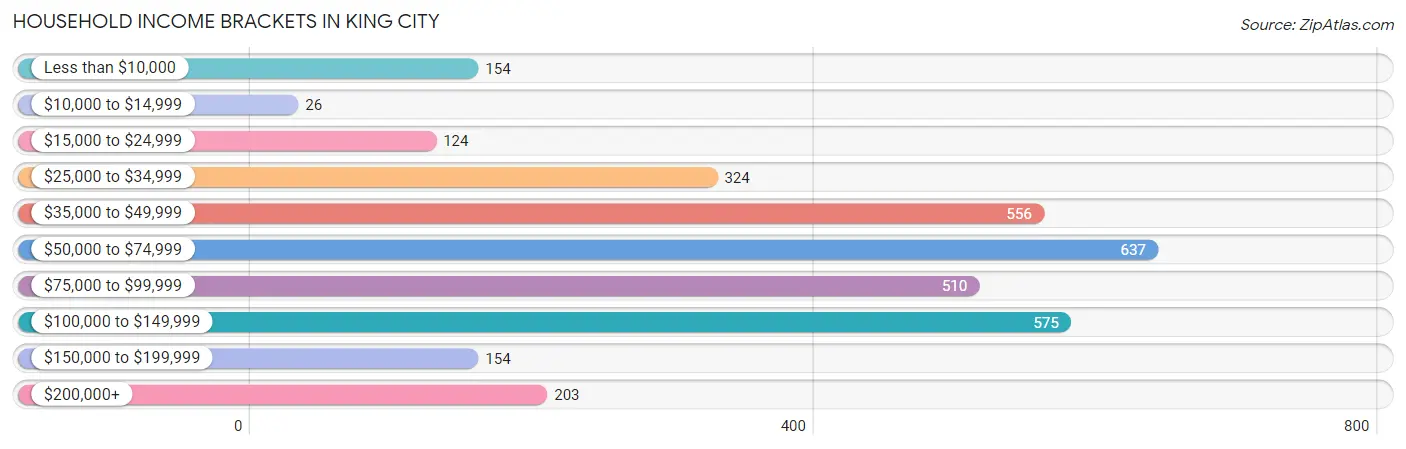
| Income Bracket | # Households | % Households |
| Less than $10,000 | 154 | 4.7% |
| $10,000 to $14,999 | 26 | 0.8% |
| $15,000 to $24,999 | 124 | 3.8% |
| $25,000 to $34,999 | 324 | 9.9% |
| $35,000 to $49,999 | 556 | 17.0% |
| $50,000 to $74,999 | 637 | 19.5% |
| $75,000 to $99,999 | 510 | 15.6% |
| $100,000 to $149,999 | 575 | 17.6% |
| $150,000 to $199,999 | 154 | 4.7% |
| $200,000+ | 203 | 6.2% |
Household Income by Householder Age in King City
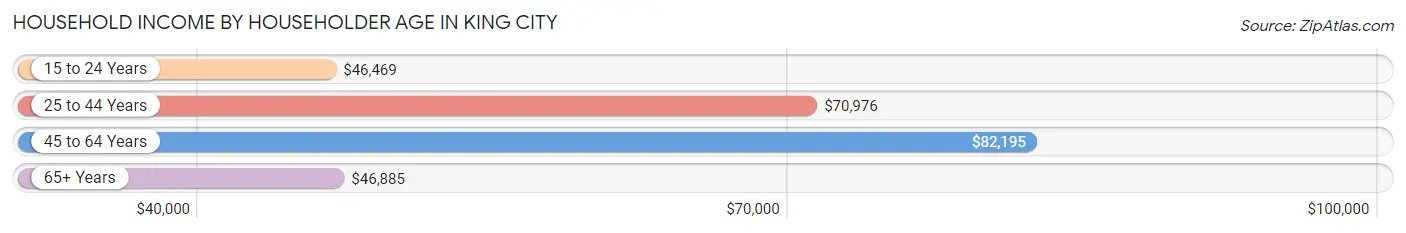
The median household income in King City is $70,145, with the highest median household income of $82,195 found in the 45 to 64 years age bracket for the primary householder. A total of 1,166 households (35.7%) fall into this category. Meanwhile, the 15 to 24 years age bracket for the primary householder has the lowest median household income of $46,469, with 297 households (9.1%) in this group.
| Income Bracket | # Households | Median Income |
| 15 to 24 Years | 297 (9.1%) | $46,469 |
| 25 to 44 Years | 1,318 (40.3%) | $70,976 |
| 45 to 64 Years | 1,166 (35.7%) | $82,195 |
| 65+ Years | 487 (14.9%) | $46,885 |
| Total | 3,268 (100.0%) | $70,145 |
Poverty in King City
Income Below Poverty by Sex and Age in King City
With 15.9% poverty level for males and 22.3% for females among the residents of King City, 15 year old males and 15 year old females are the most vulnerable to poverty, with 24 males (42.9%) and 126 females (57.0%) in their respective age groups living below the poverty level.
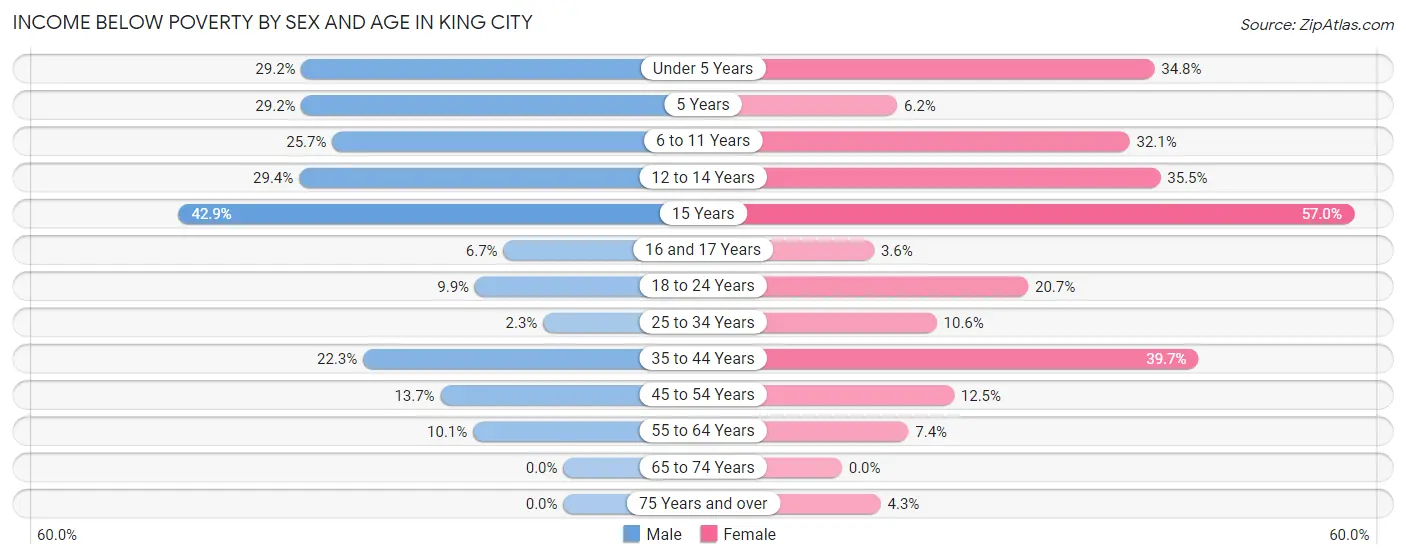
| Age Bracket | Male | Female |
| Under 5 Years | 238 (29.2%) | 189 (34.8%) |
| 5 Years | 14 (29.2%) | 9 (6.2%) |
| 6 to 11 Years | 150 (25.7%) | 308 (32.1%) |
| 12 to 14 Years | 103 (29.4%) | 99 (35.5%) |
| 15 Years | 24 (42.9%) | 126 (57.0%) |
| 16 and 17 Years | 11 (6.7%) | 11 (3.6%) |
| 18 to 24 Years | 70 (9.9%) | 151 (20.7%) |
| 25 to 34 Years | 20 (2.2%) | 100 (10.6%) |
| 35 to 44 Years | 211 (22.3%) | 407 (39.7%) |
| 45 to 54 Years | 101 (13.7%) | 82 (12.5%) |
| 55 to 64 Years | 58 (10.1%) | 24 (7.4%) |
| 65 to 74 Years | 0 (0.0%) | 0 (0.0%) |
| 75 Years and over | 0 (0.0%) | 7 (4.3%) |
| Total | 1,000 (15.9%) | 1,513 (22.3%) |
Income Above Poverty by Sex and Age in King City
According to the poverty statistics in King City, males aged 65 to 74 years and females aged 65 to 74 years are the age groups that are most secure financially, with 100.0% of males and 100.0% of females in these age groups living above the poverty line.
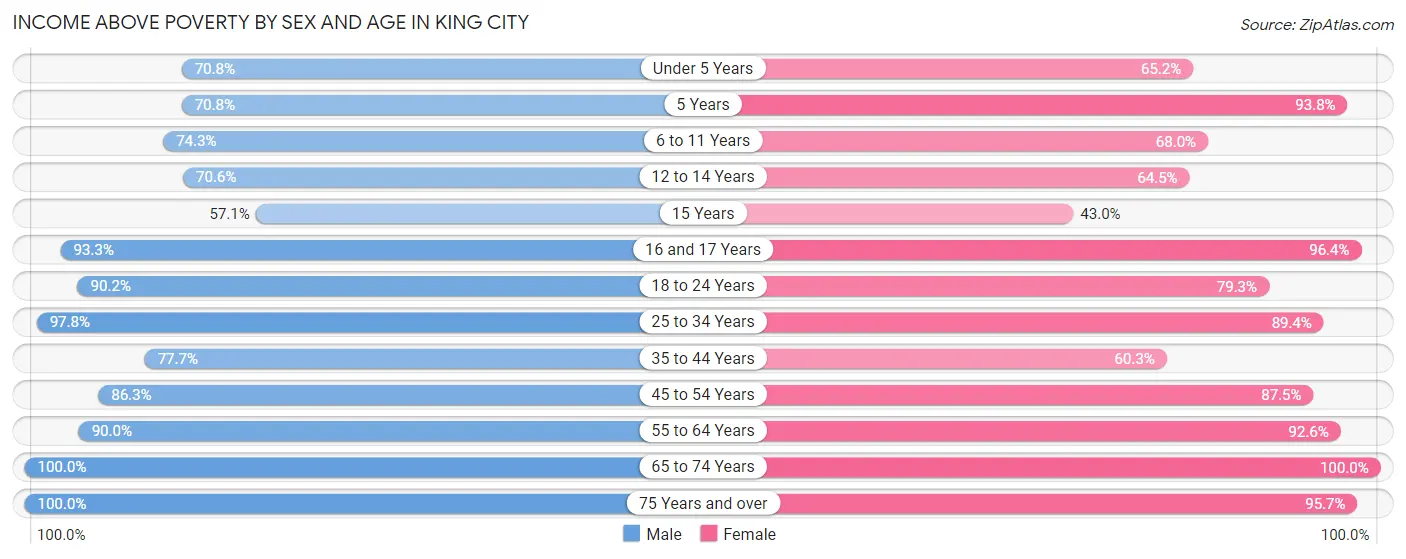
| Age Bracket | Male | Female |
| Under 5 Years | 578 (70.8%) | 354 (65.2%) |
| 5 Years | 34 (70.8%) | 137 (93.8%) |
| 6 to 11 Years | 433 (74.3%) | 653 (67.9%) |
| 12 to 14 Years | 247 (70.6%) | 180 (64.5%) |
| 15 Years | 32 (57.1%) | 95 (43.0%) |
| 16 and 17 Years | 154 (93.3%) | 296 (96.4%) |
| 18 to 24 Years | 641 (90.1%) | 577 (79.3%) |
| 25 to 34 Years | 867 (97.8%) | 847 (89.4%) |
| 35 to 44 Years | 735 (77.7%) | 618 (60.3%) |
| 45 to 54 Years | 637 (86.3%) | 575 (87.5%) |
| 55 to 64 Years | 519 (89.9%) | 300 (92.6%) |
| 65 to 74 Years | 245 (100.0%) | 492 (100.0%) |
| 75 Years and over | 165 (100.0%) | 155 (95.7%) |
| Total | 5,287 (84.1%) | 5,279 (77.7%) |
Income Below Poverty Among Married-Couple Families in King City
The poverty statistics for married-couple families in King City show that 8.2% or 170 of the total 2,064 families live below the poverty line. Families with 3 or 4 children have the highest poverty rate of 40.5%, comprising of 119 families. On the other hand, families with no children have the lowest poverty rate of 0.0%, which includes 0 families.
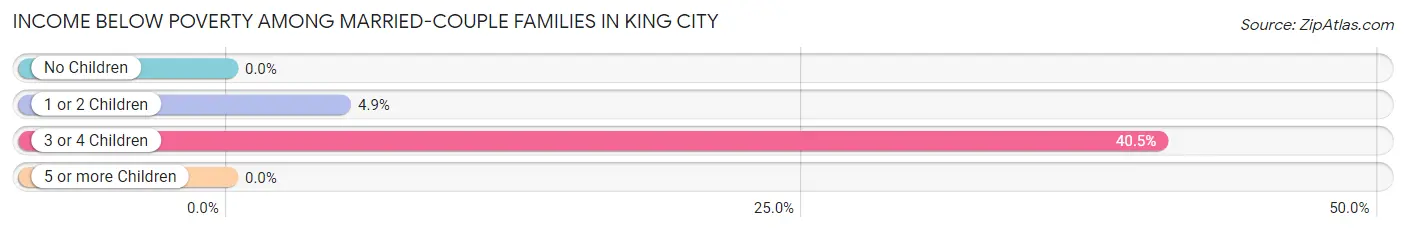
| Children | Above Poverty | Below Poverty |
| No Children | 722 (100.0%) | 0 (0.0%) |
| 1 or 2 Children | 986 (95.1%) | 51 (4.9%) |
| 3 or 4 Children | 175 (59.5%) | 119 (40.5%) |
| 5 or more Children | 11 (100.0%) | 0 (0.0%) |
| Total | 1,894 (91.8%) | 170 (8.2%) |
Income Below Poverty Among Single-Parent Households in King City
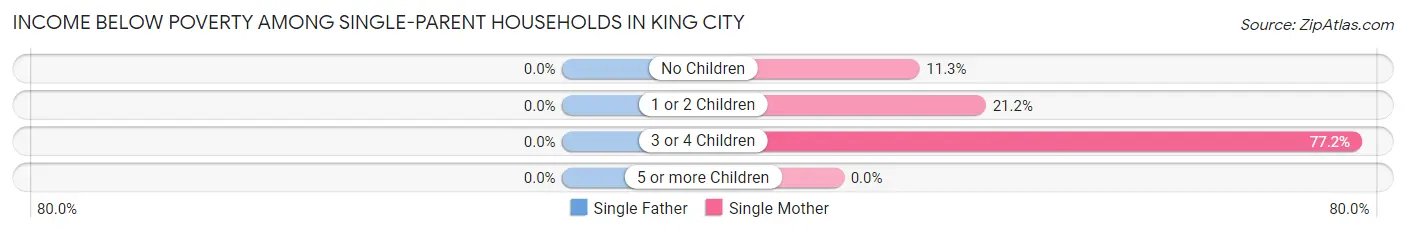
| Children | Single Father | Single Mother |
| No Children | 0 (0.0%) | 22 (11.3%) |
| 1 or 2 Children | 0 (0.0%) | 29 (21.2%) |
| 3 or 4 Children | 0 (0.0%) | 139 (77.2%) |
| 5 or more Children | 0 (0.0%) | 0 (0.0%) |
| Total | 0 (0.0%) | 190 (37.1%) |
Income Below Poverty Among Married-Couple vs Single-Parent Households in King City
The poverty data for King City shows that 170 of the married-couple family households (8.2%) and 190 of the single-parent households (24.5%) are living below the poverty level. Within the married-couple family households, those with 3 or 4 children have the highest poverty rate, with 119 households (40.5%) falling below the poverty line. Among the single-parent households, those with 3 or 4 children have the highest poverty rate, with 139 household (48.4%) living below poverty.
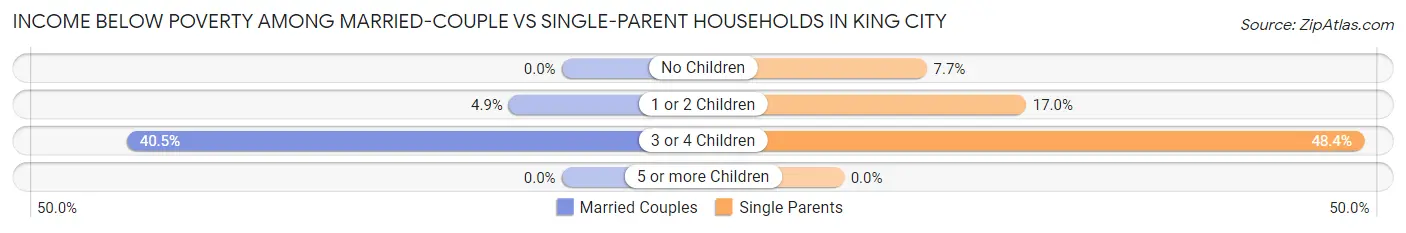
| Children | Married-Couple Families | Single-Parent Households |
| No Children | 0 (0.0%) | 22 (7.7%) |
| 1 or 2 Children | 51 (4.9%) | 29 (17.0%) |
| 3 or 4 Children | 119 (40.5%) | 139 (48.4%) |
| 5 or more Children | 0 (0.0%) | 0 (0.0%) |
| Total | 170 (8.2%) | 190 (24.5%) |
Race in King City
The most populous races in King City are Hispanic or Latino (11,465 | 85.1%), Some other Race (8,362 | 62.1%), and White / Caucasian (3,158 | 23.4%).
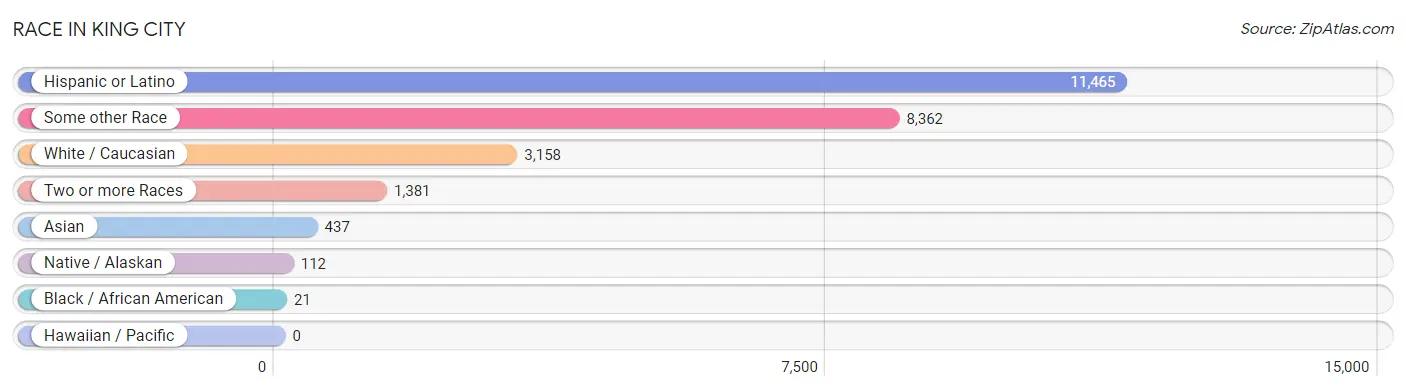
| Race | # Population | % Population |
| Asian | 437 | 3.2% |
| Black / African American | 21 | 0.2% |
| Hawaiian / Pacific | 0 | 0.0% |
| Hispanic or Latino | 11,465 | 85.1% |
| Native / Alaskan | 112 | 0.8% |
| White / Caucasian | 3,158 | 23.4% |
| Two or more Races | 1,381 | 10.2% |
| Some other Race | 8,362 | 62.1% |
| Total | 13,471 | 100.0% |
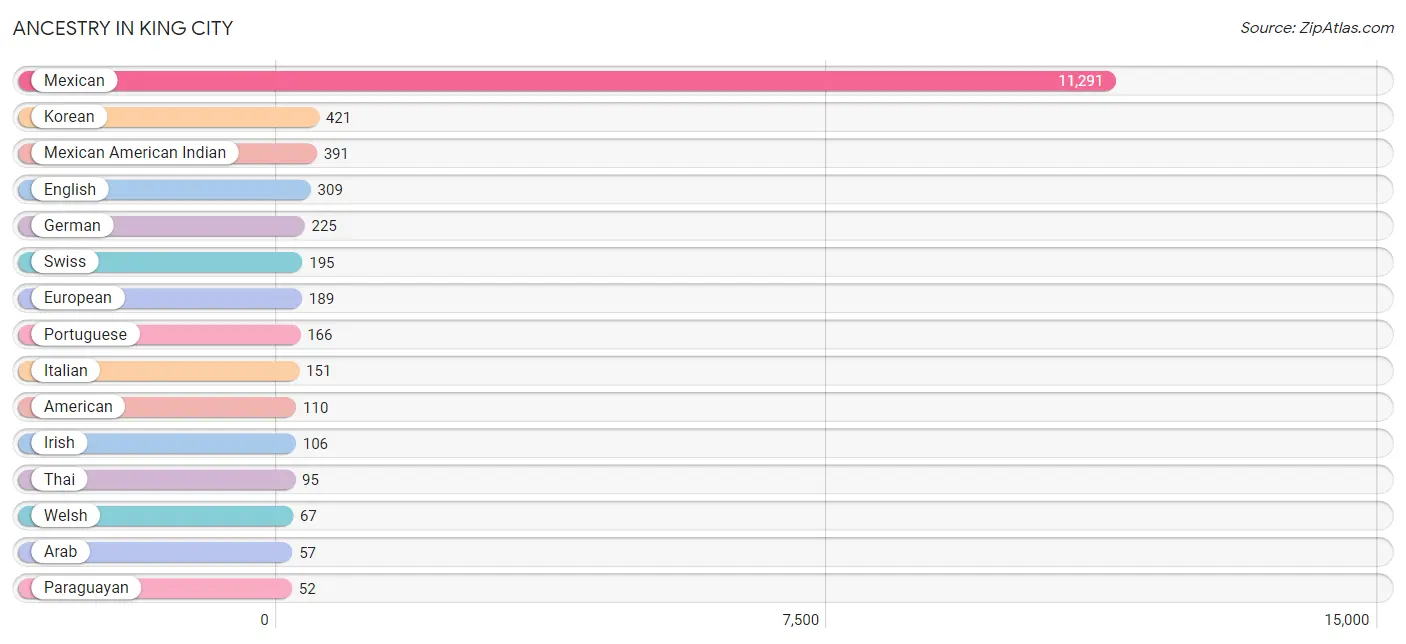
Ancestry in King City
The most populous ancestries reported in King City are Mexican (11,291 | 83.8%), Korean (421 | 3.1%), Mexican American Indian (391 | 2.9%), English (309 | 2.3%), and German (225 | 1.7%), together accounting for 93.8% of all King City residents.
| Ancestry | # Population | % Population |
| African | 8 | 0.1% |
| American | 110 | 0.8% |
| Arab | 57 | 0.4% |
| Blackfeet | 2 | 0.0% |
| Central American | 40 | 0.3% |
| Cherokee | 2 | 0.0% |
| Czech | 21 | 0.2% |
| Dutch | 47 | 0.4% |
| English | 309 | 2.3% |
| European | 189 | 1.4% |
| Finnish | 3 | 0.0% |
| French | 21 | 0.2% |
| German | 225 | 1.7% |
| Iranian | 21 | 0.2% |
| Irish | 106 | 0.8% |
| Italian | 151 | 1.1% |
| Korean | 421 | 3.1% |
| Lebanese | 8 | 0.1% |
| Mexican | 11,291 | 83.8% |
| Mexican American Indian | 391 | 2.9% |
| Norwegian | 11 | 0.1% |
| Paraguayan | 52 | 0.4% |
| Portuguese | 166 | 1.2% |
| Russian | 11 | 0.1% |
| Salvadoran | 40 | 0.3% |
| Scottish | 42 | 0.3% |
| South American | 52 | 0.4% |
| Subsaharan African | 8 | 0.1% |
| Swedish | 13 | 0.1% |
| Swiss | 195 | 1.5% |
| Syrian | 8 | 0.1% |
| Thai | 95 | 0.7% |
| Welsh | 67 | 0.5% | View All 33 Rows |
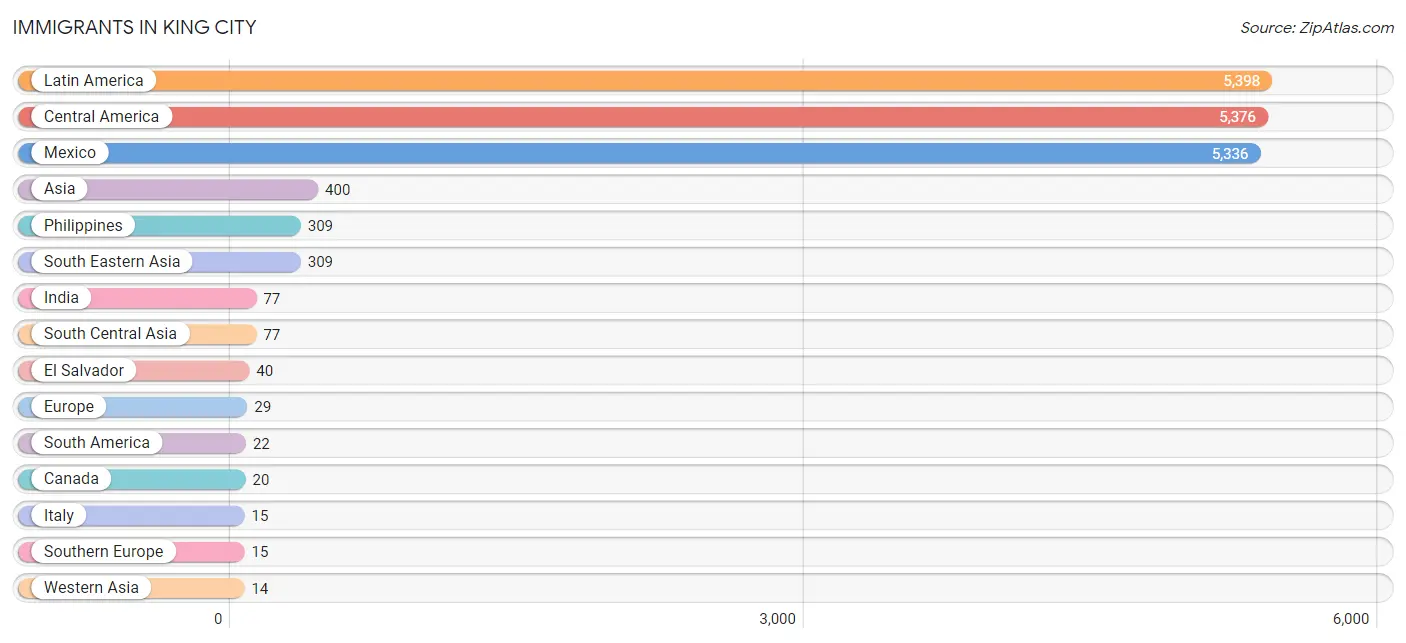
Immigrants in King City
The most numerous immigrant groups reported in King City came from Latin America (5,398 | 40.1%), Central America (5,376 | 39.9%), Mexico (5,336 | 39.6%), Asia (400 | 3.0%), and Philippines (309 | 2.3%), together accounting for 124.8% of all King City residents.
| Immigration Origin | # Population | % Population |
| Asia | 400 | 3.0% |
| Canada | 20 | 0.2% |
| Central America | 5,376 | 39.9% |
| El Salvador | 40 | 0.3% |
| Europe | 29 | 0.2% |
| India | 77 | 0.6% |
| Italy | 15 | 0.1% |
| Latin America | 5,398 | 40.1% |
| Mexico | 5,336 | 39.6% |
| Netherlands | 11 | 0.1% |
| Northern Europe | 3 | 0.0% |
| Philippines | 309 | 2.3% |
| South America | 22 | 0.2% |
| South Central Asia | 77 | 0.6% |
| South Eastern Asia | 309 | 2.3% |
| Southern Europe | 15 | 0.1% |
| Western Asia | 14 | 0.1% |
| Western Europe | 11 | 0.1% |
| Yemen | 14 | 0.1% | View All 19 Rows |
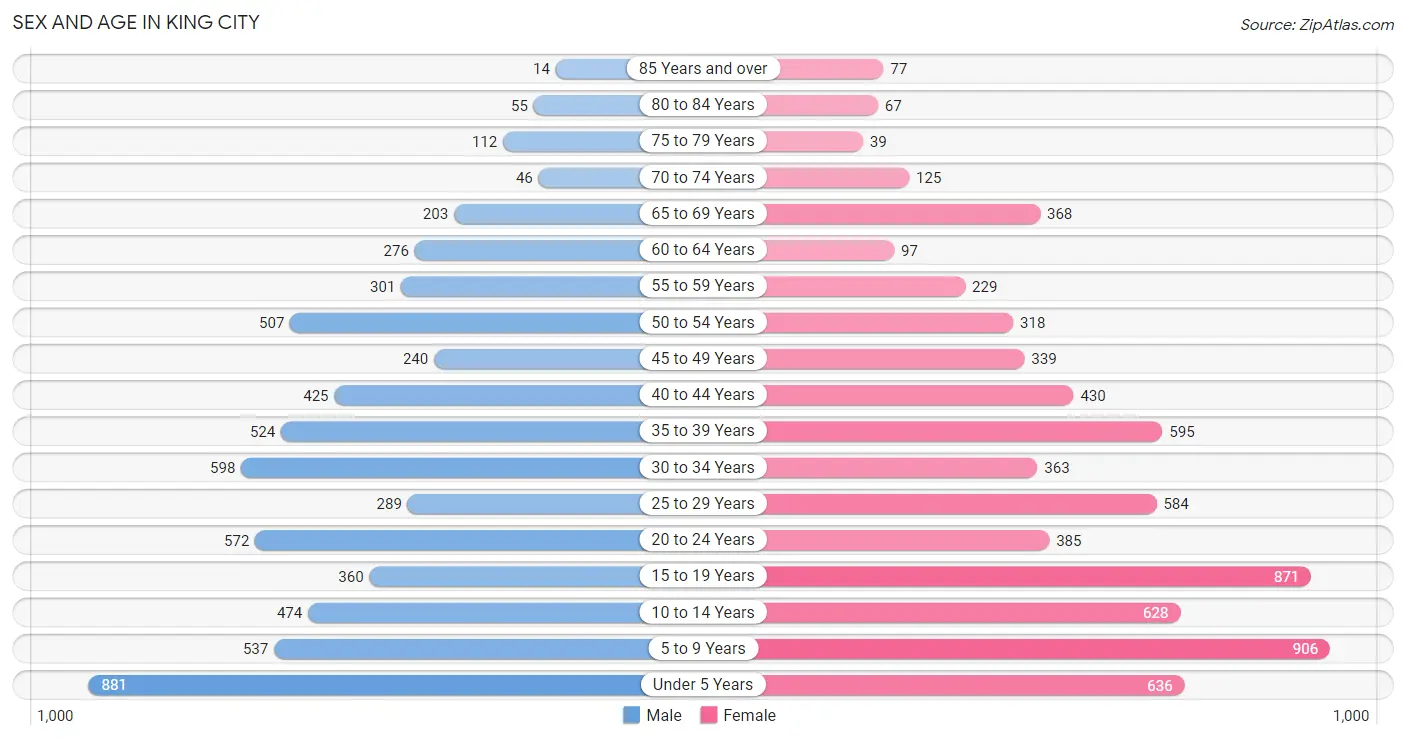
Sex and Age in King City
Sex and Age in King City
The most populous age groups in King City are Under 5 Years (881 | 13.7%) for men and 5 to 9 Years (906 | 12.8%) for women.
| Age Bracket | Male | Female |
| Under 5 Years | 881 (13.7%) | 636 (9.0%) |
| 5 to 9 Years | 537 (8.4%) | 906 (12.8%) |
| 10 to 14 Years | 474 (7.4%) | 628 (8.9%) |
| 15 to 19 Years | 360 (5.6%) | 871 (12.3%) |
| 20 to 24 Years | 572 (8.9%) | 385 (5.5%) |
| 25 to 29 Years | 289 (4.5%) | 584 (8.3%) |
| 30 to 34 Years | 598 (9.3%) | 363 (5.1%) |
| 35 to 39 Years | 524 (8.2%) | 595 (8.4%) |
| 40 to 44 Years | 425 (6.6%) | 430 (6.1%) |
| 45 to 49 Years | 240 (3.7%) | 339 (4.8%) |
| 50 to 54 Years | 507 (7.9%) | 318 (4.5%) |
| 55 to 59 Years | 301 (4.7%) | 229 (3.3%) |
| 60 to 64 Years | 276 (4.3%) | 97 (1.4%) |
| 65 to 69 Years | 203 (3.2%) | 368 (5.2%) |
| 70 to 74 Years | 46 (0.7%) | 125 (1.8%) |
| 75 to 79 Years | 112 (1.8%) | 39 (0.5%) |
| 80 to 84 Years | 55 (0.9%) | 67 (0.9%) |
| 85 Years and over | 14 (0.2%) | 77 (1.1%) |
| Total | 6,414 (100.0%) | 7,057 (100.0%) |
Families and Households in King City
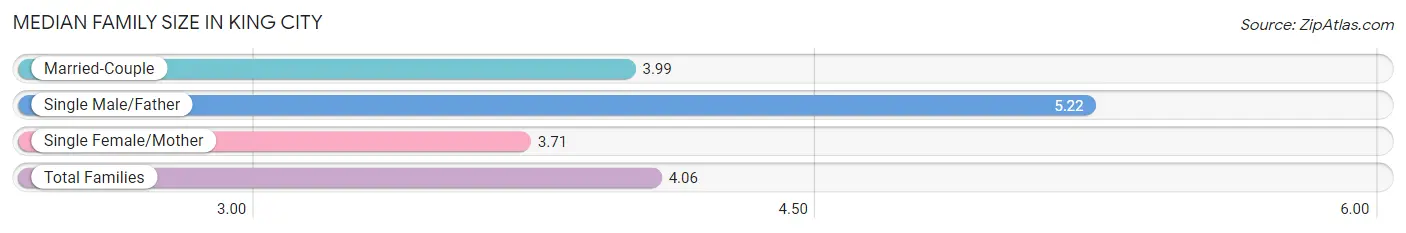
Median Family Size in King City
The median family size in King City is 4.06 persons per family, with single male/father families (263 | 9.3%) accounting for the largest median family size of 5.22 persons per family. On the other hand, single female/mother families (512 | 18.0%) represent the smallest median family size with 3.71 persons per family.
| Family Type | # Families | Family Size |
| Married-Couple | 2,064 (72.7%) | 3.99 |
| Single Male/Father | 263 (9.3%) | 5.22 |
| Single Female/Mother | 512 (18.0%) | 3.71 |
| Total Families | 2,839 (100.0%) | 4.06 |
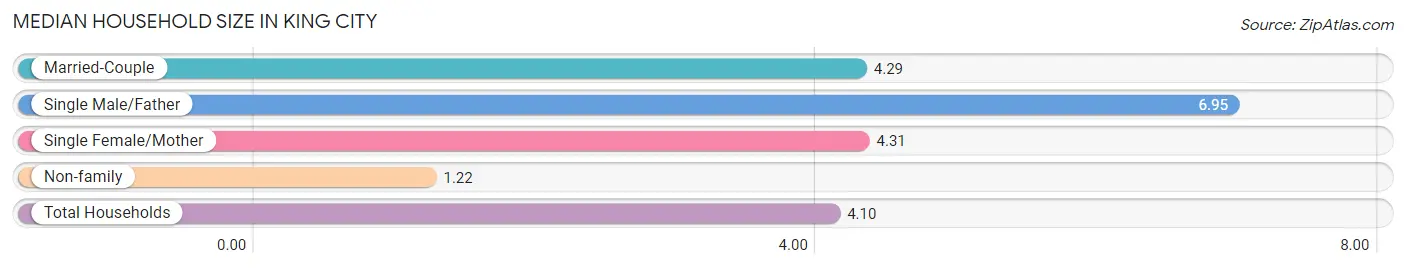
Median Household Size in King City
The median household size in King City is 4.10 persons per household, with single male/father households (263 | 8.1%) accounting for the largest median household size of 6.95 persons per household. non-family households (429 | 13.1%) represent the smallest median household size with 1.22 persons per household.
| Household Type | # Households | Household Size |
| Married-Couple | 2,064 (63.2%) | 4.29 |
| Single Male/Father | 263 (8.1%) | 6.95 |
| Single Female/Mother | 512 (15.7%) | 4.31 |
| Non-family | 429 (13.1%) | 1.22 |
| Total Households | 3,268 (100.0%) | 4.10 |
Household Size by Marriage Status in King City
Out of a total of 3,268 households in King City, 2,839 (86.9%) are family households, while 429 (13.1%) are nonfamily households. The most numerous type of family households are 4-person households, comprising 847, and the most common type of nonfamily households are 1-person households, comprising 370.
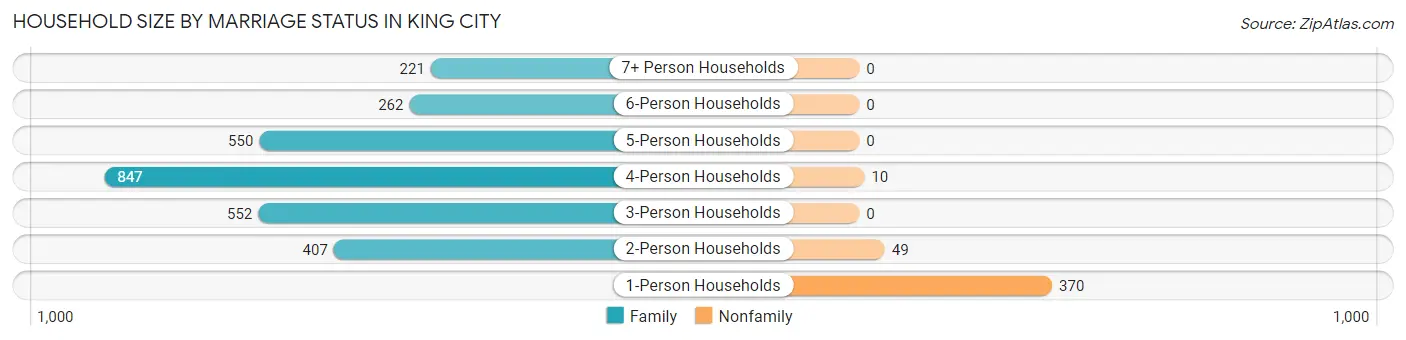
| Household Size | Family Households | Nonfamily Households |
| 1-Person Households | - | 370 (11.3%) |
| 2-Person Households | 407 (12.4%) | 49 (1.5%) |
| 3-Person Households | 552 (16.9%) | 0 (0.0%) |
| 4-Person Households | 847 (25.9%) | 10 (0.3%) |
| 5-Person Households | 550 (16.8%) | 0 (0.0%) |
| 6-Person Households | 262 (8.0%) | 0 (0.0%) |
| 7+ Person Households | 221 (6.8%) | 0 (0.0%) |
| Total | 2,839 (86.9%) | 429 (13.1%) |
Female Fertility in King City
Fertility by Age in King City
Average fertility rate in King City is 37.0 births per 1,000 women. Women in the age bracket of 15 to 19 years have the highest fertility rate with 47.0 births per 1,000 women. Women in the age bracket of 35 to 50 years acount for 35.8% of all women with births.
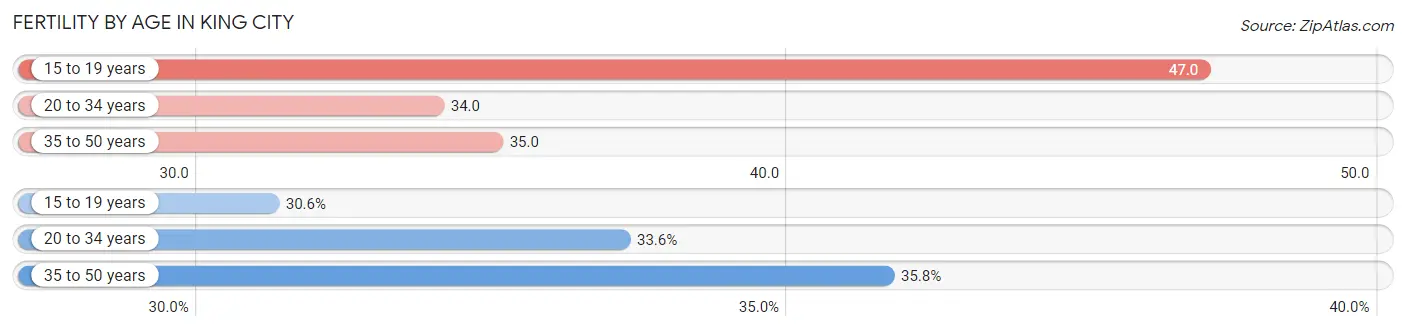
| Age Bracket | Women with Births | Births / 1,000 Women |
| 15 to 19 years | 41 (30.6%) | 47.0 |
| 20 to 34 years | 45 (33.6%) | 34.0 |
| 35 to 50 years | 48 (35.8%) | 35.0 |
| Total | 134 (100.0%) | 37.0 |
Fertility by Age by Marriage Status in King City
61.9% of women with births (134) in King City are married. The highest percentage of unmarried women with births falls into 15 to 19 years age bracket with 100.0% of them unmarried at the time of birth, while the lowest percentage of unmarried women with births belong to 20 to 34 years age bracket with 0.0% of them unmarried.
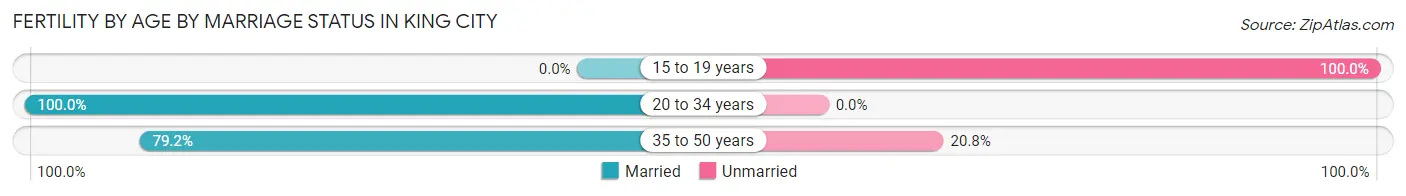
| Age Bracket | Married | Unmarried |
| 15 to 19 years | 0 (0.0%) | 41 (100.0%) |
| 20 to 34 years | 45 (100.0%) | 0 (0.0%) |
| 35 to 50 years | 38 (79.2%) | 10 (20.8%) |
| Total | 83 (61.9%) | 51 (38.1%) |
Fertility by Education in King City
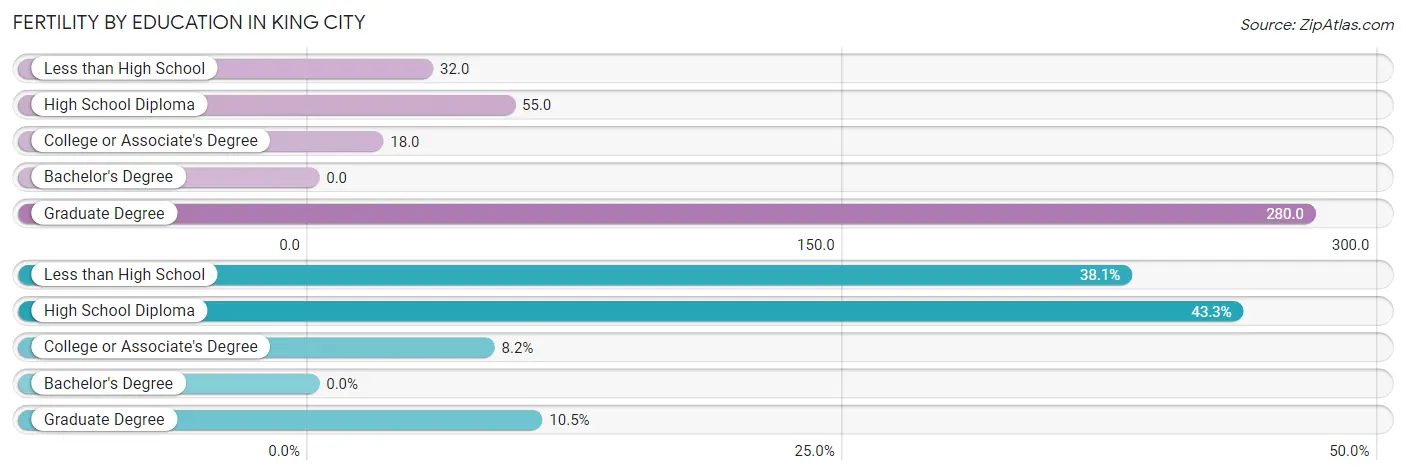
| Educational Attainment | Women with Births | Births / 1,000 Women |
| Less than High School | 51 (38.1%) | 32.0 |
| High School Diploma | 58 (43.3%) | 55.0 |
| College or Associate's Degree | 11 (8.2%) | 18.0 |
| Bachelor's Degree | 0 (0.0%) | 0.0 |
| Graduate Degree | 14 (10.4%) | 280.0 |
| Total | 134 (100.0%) | 37.0 |
Fertility by Education by Marriage Status in King City
38.1% of women with births in King City are unmarried. Women with the educational attainment of high school diploma are most likely to be married with 100.0% of them married at childbirth, while women with the educational attainment of less than high school are least likely to be married with 100.0% of them unmarried at childbirth.
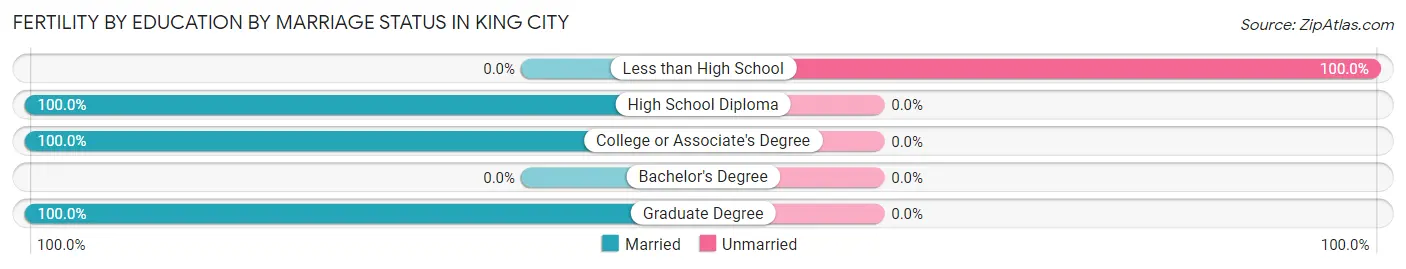
| Educational Attainment | Married | Unmarried |
| Less than High School | 0 (0.0%) | 51 (100.0%) |
| High School Diploma | 58 (100.0%) | 0 (0.0%) |
| College or Associate's Degree | 11 (100.0%) | 0 (0.0%) |
| Bachelor's Degree | 0 (0.0%) | 0 (0.0%) |
| Graduate Degree | 14 (100.0%) | 0 (0.0%) |
| Total | 83 (61.9%) | 51 (38.1%) |
Employment Characteristics in King City
Employment by Class of Employer in King City
Among the 4,703 employed individuals in King City, private company employees (3,605 | 76.6%), local government employees (351 | 7.5%), and state government employees (239 | 5.1%) make up the most common classes of employment.
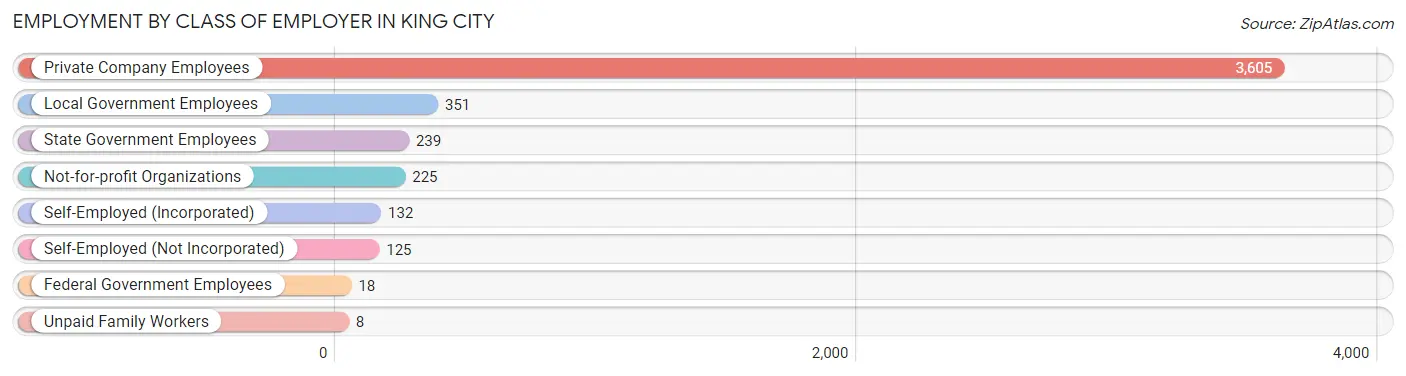
| Employer Class | # Employees | % Employees |
| Private Company Employees | 3,605 | 76.6% |
| Self-Employed (Incorporated) | 132 | 2.8% |
| Self-Employed (Not Incorporated) | 125 | 2.7% |
| Not-for-profit Organizations | 225 | 4.8% |
| Local Government Employees | 351 | 7.5% |
| State Government Employees | 239 | 5.1% |
| Federal Government Employees | 18 | 0.4% |
| Unpaid Family Workers | 8 | 0.2% |
| Total | 4,703 | 100.0% |
Employment Status by Age in King City
According to the labor force statistics for King City, out of the total population over 16 years of age (9,132), 55.3% or 5,050 individuals are in the labor force, with 5.0% or 252 of them unemployed. The age group with the highest labor force participation rate is 20 to 24 years, with 77.8% or 745 individuals in the labor force. Within the labor force, the 16 to 19 years age range has the highest percentage of unemployed individuals, with 17.6% or 49 of them being unemployed.
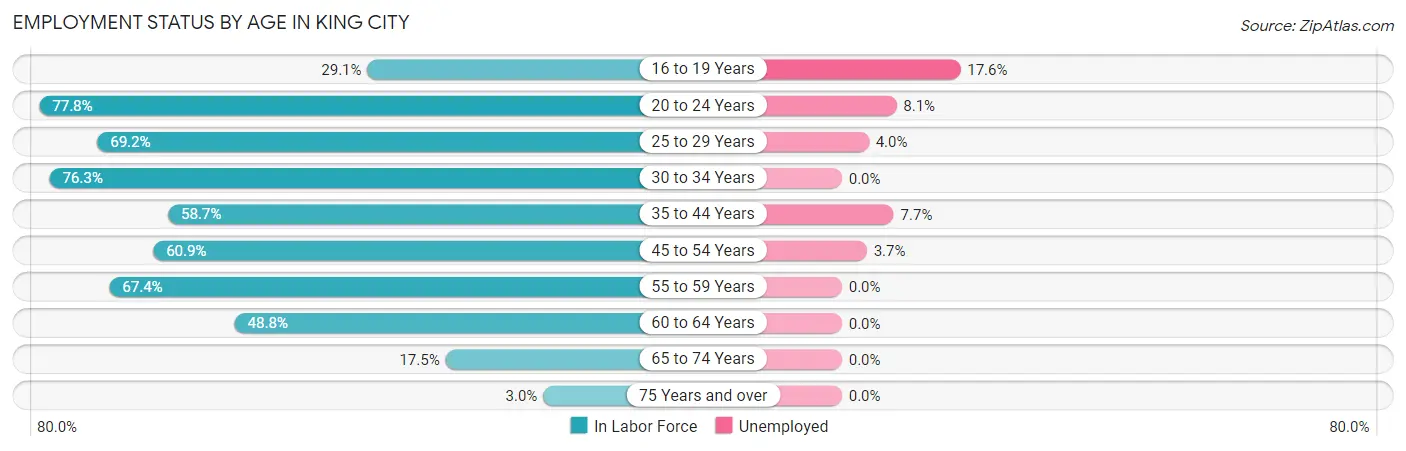
| Age Bracket | In Labor Force | Unemployed |
| 16 to 19 Years | 278 (29.1%) | 49 (17.6%) |
| 20 to 24 Years | 745 (77.8%) | 60 (8.1%) |
| 25 to 29 Years | 604 (69.2%) | 24 (4.0%) |
| 30 to 34 Years | 733 (76.3%) | 0 (0.0%) |
| 35 to 44 Years | 1,159 (58.7%) | 89 (7.7%) |
| 45 to 54 Years | 855 (60.9%) | 32 (3.7%) |
| 55 to 59 Years | 357 (67.4%) | 0 (0.0%) |
| 60 to 64 Years | 182 (48.8%) | 0 (0.0%) |
| 65 to 74 Years | 130 (17.5%) | 0 (0.0%) |
| 75 Years and over | 11 (3.0%) | 0 (0.0%) |
| Total | 5,050 (55.3%) | 252 (5.0%) |
Employment Status by Educational Attainment in King City
According to labor force statistics for King City, 63.6% of individuals (3,889) out of the total population between 25 and 64 years of age (6,115) are in the labor force, with 3.7% or 144 of them being unemployed. The group with the highest labor force participation rate are those with the educational attainment of college / associate degree, with 77.9% or 1,056 individuals in the labor force. Within the labor force, individuals with high school diploma education have the highest percentage of unemployment, with 8.1% or 69 of them being unemployed.
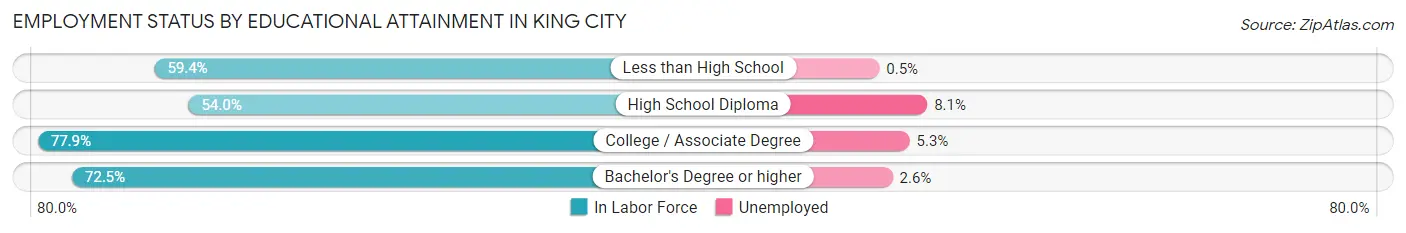
| Educational Attainment | In Labor Force | Unemployed |
| Less than High School | 1,475 (59.4%) | 12 (0.5%) |
| High School Diploma | 850 (54.0%) | 128 (8.1%) |
| College / Associate Degree | 1,056 (77.9%) | 72 (5.3%) |
| Bachelor's Degree or higher | 509 (72.5%) | 18 (2.6%) |
| Total | 3,889 (63.6%) | 226 (3.7%) |
Employment Occupations by Sex in King City
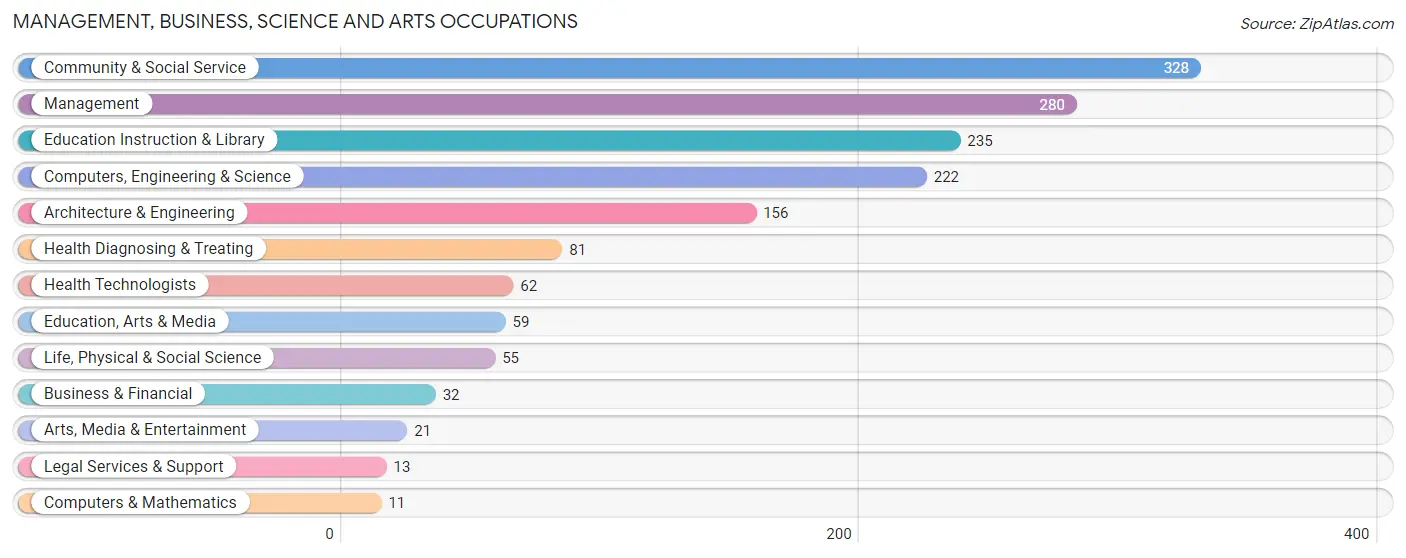
Management, Business, Science and Arts Occupations
The most common Management, Business, Science and Arts occupations in King City are Community & Social Service (328 | 6.8%), Management (280 | 5.8%), Education Instruction & Library (235 | 4.9%), Computers, Engineering & Science (222 | 4.6%), and Architecture & Engineering (156 | 3.3%).
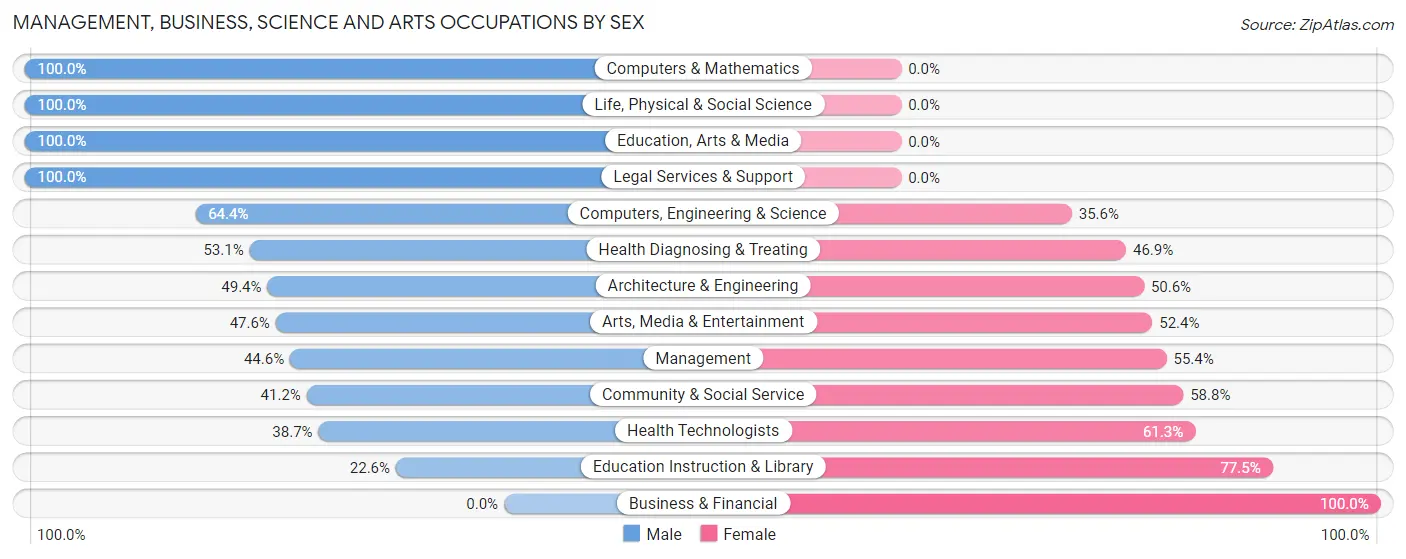
Management, Business, Science and Arts Occupations by Sex
Within the Management, Business, Science and Arts occupations in King City, the most male-oriented occupations are Computers & Mathematics (100.0%), Life, Physical & Social Science (100.0%), and Education, Arts & Media (100.0%), while the most female-oriented occupations are Business & Financial (100.0%), Education Instruction & Library (77.4%), and Health Technologists (61.3%).
| Occupation | Male | Female |
| Management | 125 (44.6%) | 155 (55.4%) |
| Business & Financial | 0 (0.0%) | 32 (100.0%) |
| Computers, Engineering & Science | 143 (64.4%) | 79 (35.6%) |
| Computers & Mathematics | 11 (100.0%) | 0 (0.0%) |
| Architecture & Engineering | 77 (49.4%) | 79 (50.6%) |
| Life, Physical & Social Science | 55 (100.0%) | 0 (0.0%) |
| Community & Social Service | 135 (41.2%) | 193 (58.8%) |
| Education, Arts & Media | 59 (100.0%) | 0 (0.0%) |
| Legal Services & Support | 13 (100.0%) | 0 (0.0%) |
| Education Instruction & Library | 53 (22.6%) | 182 (77.4%) |
| Arts, Media & Entertainment | 10 (47.6%) | 11 (52.4%) |
| Health Diagnosing & Treating | 43 (53.1%) | 38 (46.9%) |
| Health Technologists | 24 (38.7%) | 38 (61.3%) |
| Total (Category) | 446 (47.3%) | 497 (52.7%) |
| Total (Overall) | 2,765 (57.6%) | 2,035 (42.4%) |
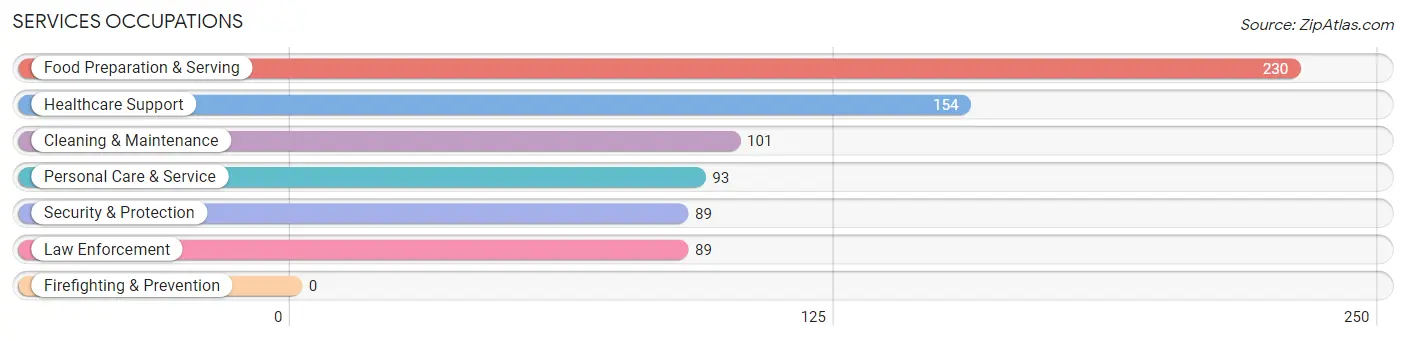
Services Occupations
The most common Services occupations in King City are Food Preparation & Serving (230 | 4.8%), Healthcare Support (154 | 3.2%), Cleaning & Maintenance (101 | 2.1%), Personal Care & Service (93 | 1.9%), and Security & Protection (89 | 1.8%).
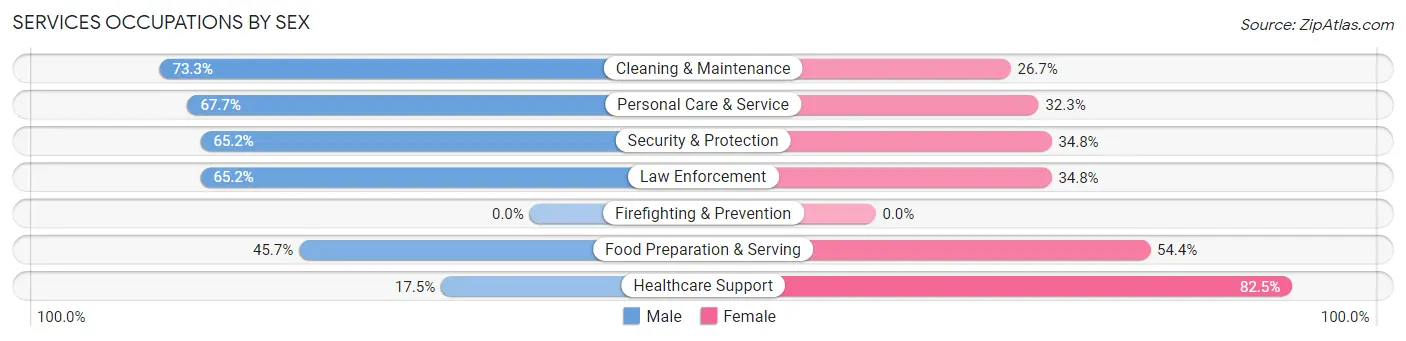
Services Occupations by Sex
Within the Services occupations in King City, the most male-oriented occupations are Cleaning & Maintenance (73.3%), Personal Care & Service (67.7%), and Security & Protection (65.2%), while the most female-oriented occupations are Healthcare Support (82.5%), Food Preparation & Serving (54.3%), and Security & Protection (34.8%).
| Occupation | Male | Female |
| Healthcare Support | 27 (17.5%) | 127 (82.5%) |
| Security & Protection | 58 (65.2%) | 31 (34.8%) |
| Firefighting & Prevention | 0 (0.0%) | 0 (0.0%) |
| Law Enforcement | 58 (65.2%) | 31 (34.8%) |
| Food Preparation & Serving | 105 (45.7%) | 125 (54.3%) |
| Cleaning & Maintenance | 74 (73.3%) | 27 (26.7%) |
| Personal Care & Service | 63 (67.7%) | 30 (32.3%) |
| Total (Category) | 327 (49.0%) | 340 (51.0%) |
| Total (Overall) | 2,765 (57.6%) | 2,035 (42.4%) |
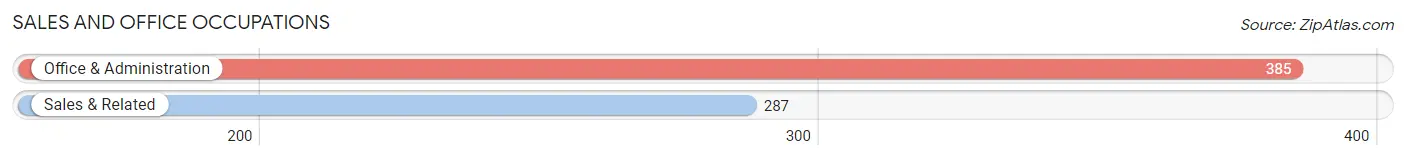
Sales and Office Occupations
The most common Sales and Office occupations in King City are Office & Administration (385 | 8.0%), and Sales & Related (287 | 6.0%).
Sales and Office Occupations by Sex
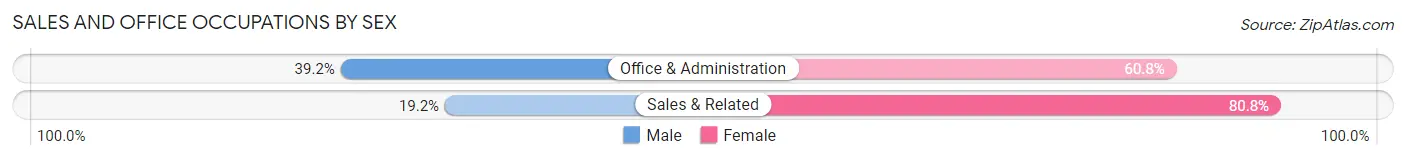
| Occupation | Male | Female |
| Sales & Related | 55 (19.2%) | 232 (80.8%) |
| Office & Administration | 151 (39.2%) | 234 (60.8%) |
| Total (Category) | 206 (30.6%) | 466 (69.4%) |
| Total (Overall) | 2,765 (57.6%) | 2,035 (42.4%) |
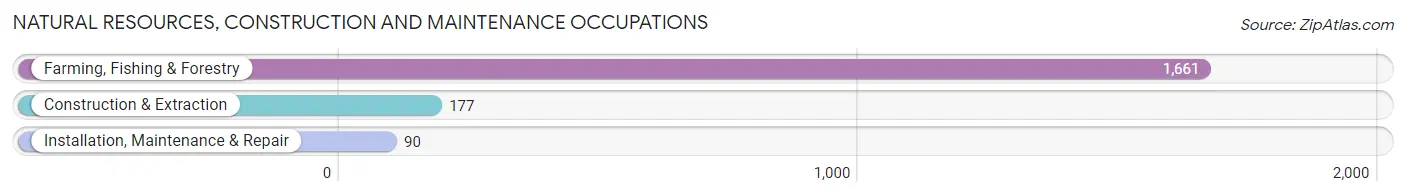
Natural Resources, Construction and Maintenance Occupations
The most common Natural Resources, Construction and Maintenance occupations in King City are Farming, Fishing & Forestry (1,661 | 34.6%), Construction & Extraction (177 | 3.7%), and Installation, Maintenance & Repair (90 | 1.9%).
Natural Resources, Construction and Maintenance Occupations by Sex
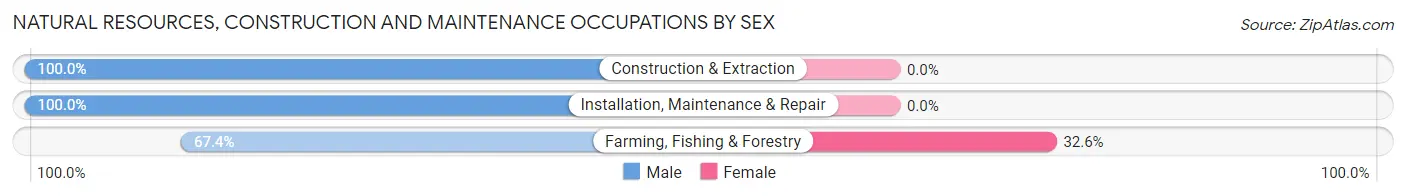
| Occupation | Male | Female |
| Farming, Fishing & Forestry | 1,120 (67.4%) | 541 (32.6%) |
| Construction & Extraction | 177 (100.0%) | 0 (0.0%) |
| Installation, Maintenance & Repair | 90 (100.0%) | 0 (0.0%) |
| Total (Category) | 1,387 (71.9%) | 541 (28.1%) |
| Total (Overall) | 2,765 (57.6%) | 2,035 (42.4%) |
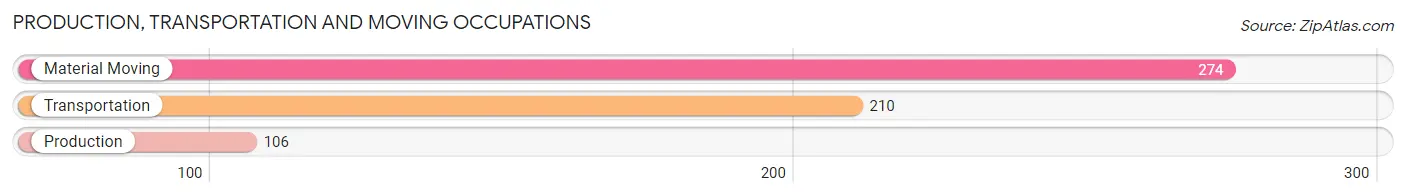
Production, Transportation and Moving Occupations
The most common Production, Transportation and Moving occupations in King City are Material Moving (274 | 5.7%), Transportation (210 | 4.4%), and Production (106 | 2.2%).
Production, Transportation and Moving Occupations by Sex
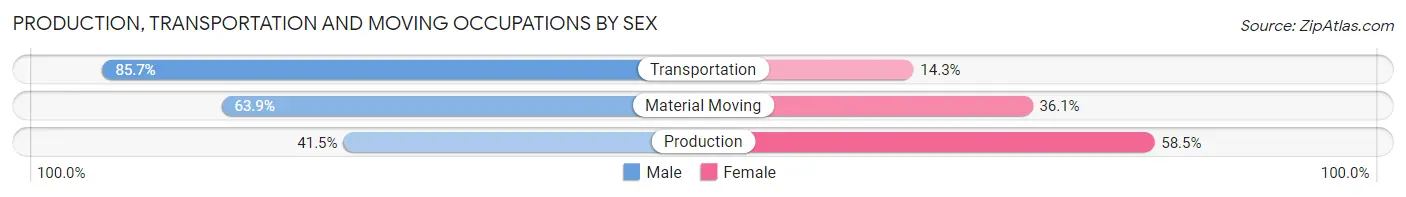
| Occupation | Male | Female |
| Production | 44 (41.5%) | 62 (58.5%) |
| Transportation | 180 (85.7%) | 30 (14.3%) |
| Material Moving | 175 (63.9%) | 99 (36.1%) |
| Total (Category) | 399 (67.6%) | 191 (32.4%) |
| Total (Overall) | 2,765 (57.6%) | 2,035 (42.4%) |
Employment Industries by Sex in King City
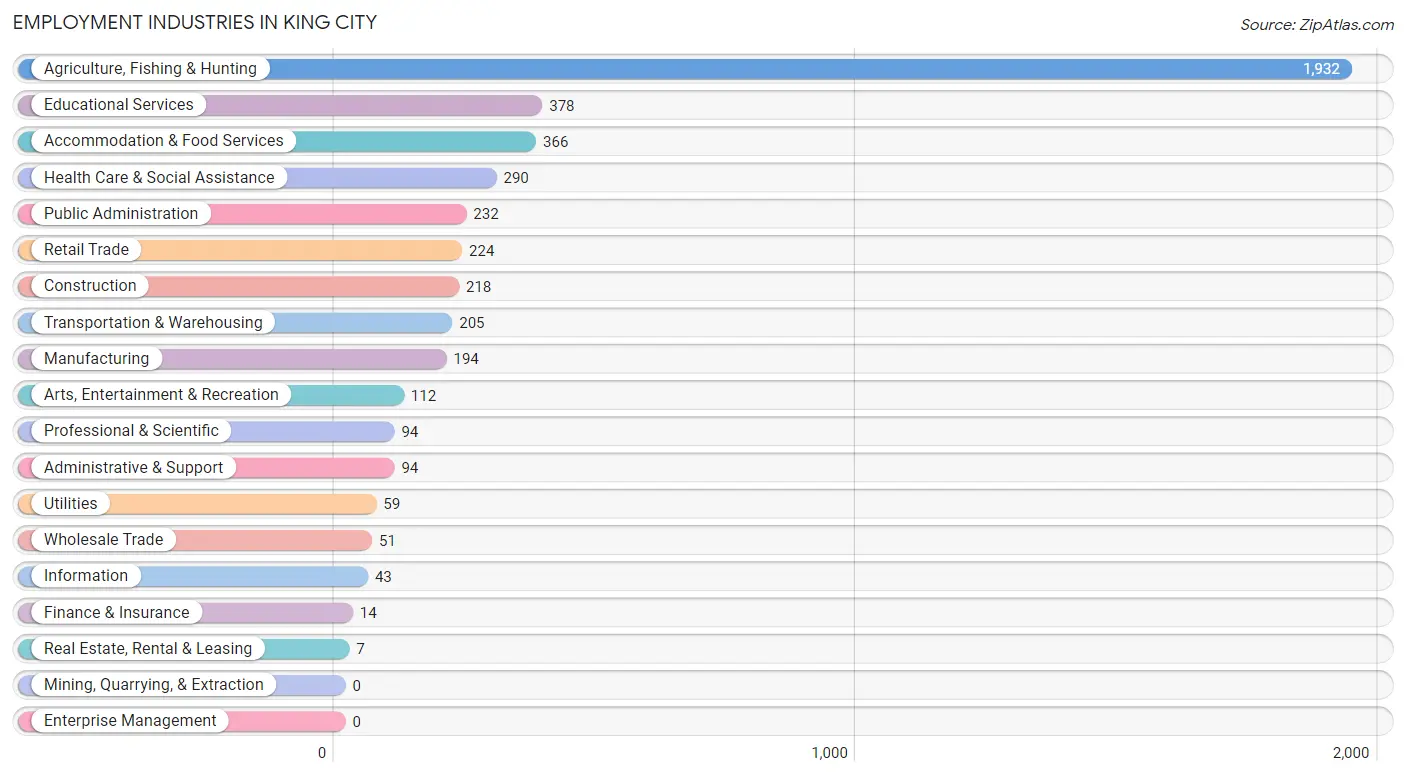
Employment Industries in King City
The major employment industries in King City include Agriculture, Fishing & Hunting (1,932 | 40.3%), Educational Services (378 | 7.9%), Accommodation & Food Services (366 | 7.6%), Health Care & Social Assistance (290 | 6.0%), and Public Administration (232 | 4.8%).
Employment Industries by Sex in King City
The King City industries that see more men than women are Construction (100.0%), Finance & Insurance (100.0%), and Real Estate, Rental & Leasing (100.0%), whereas the industries that tend to have a higher number of women are Wholesale Trade (78.4%), Arts, Entertainment & Recreation (76.8%), and Administrative & Support (69.2%).
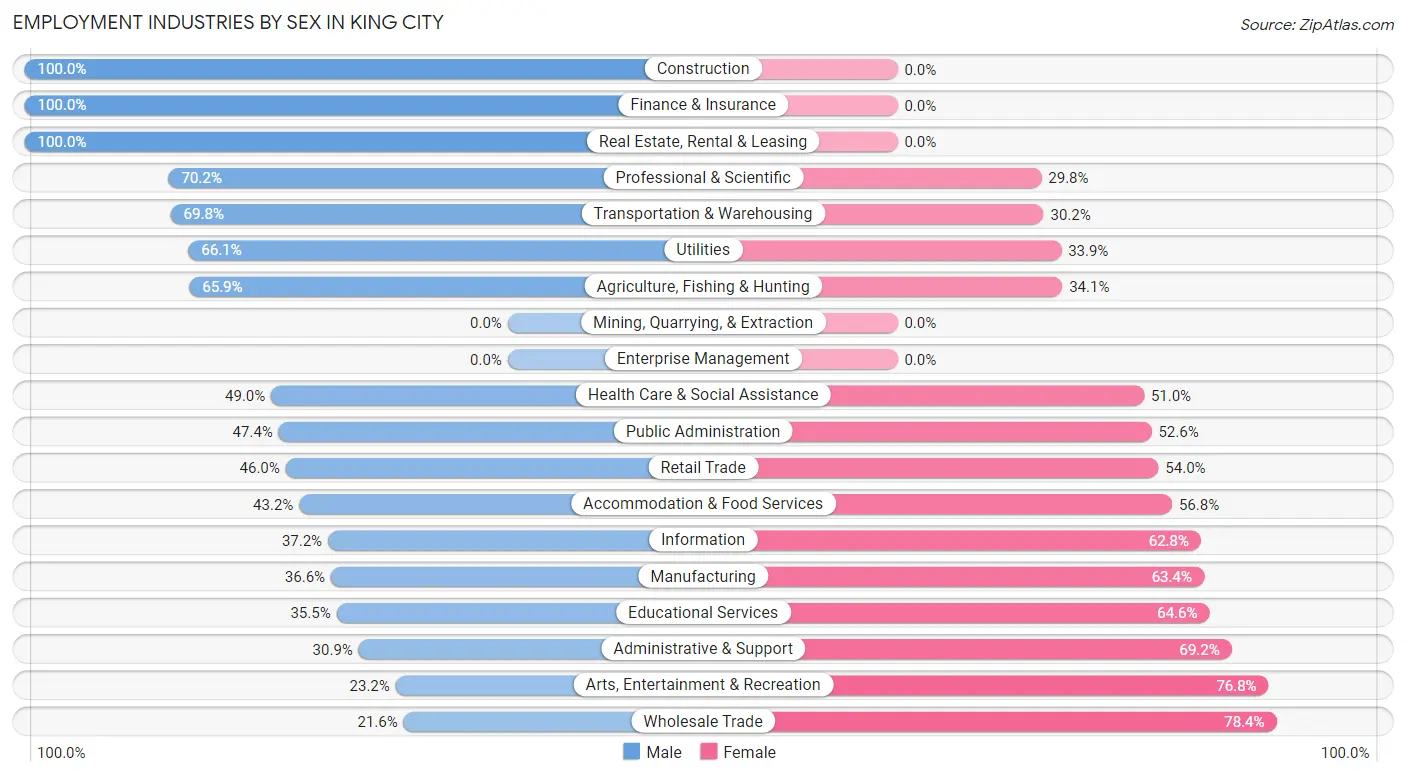
| Industry | Male | Female |
| Agriculture, Fishing & Hunting | 1,273 (65.9%) | 659 (34.1%) |
| Mining, Quarrying, & Extraction | 0 (0.0%) | 0 (0.0%) |
| Construction | 218 (100.0%) | 0 (0.0%) |
| Manufacturing | 71 (36.6%) | 123 (63.4%) |
| Wholesale Trade | 11 (21.6%) | 40 (78.4%) |
| Retail Trade | 103 (46.0%) | 121 (54.0%) |
| Transportation & Warehousing | 143 (69.8%) | 62 (30.2%) |
| Utilities | 39 (66.1%) | 20 (33.9%) |
| Information | 16 (37.2%) | 27 (62.8%) |
| Finance & Insurance | 14 (100.0%) | 0 (0.0%) |
| Real Estate, Rental & Leasing | 7 (100.0%) | 0 (0.0%) |
| Professional & Scientific | 66 (70.2%) | 28 (29.8%) |
| Enterprise Management | 0 (0.0%) | 0 (0.0%) |
| Administrative & Support | 29 (30.8%) | 65 (69.2%) |
| Educational Services | 134 (35.4%) | 244 (64.5%) |
| Health Care & Social Assistance | 142 (49.0%) | 148 (51.0%) |
| Arts, Entertainment & Recreation | 26 (23.2%) | 86 (76.8%) |
| Accommodation & Food Services | 158 (43.2%) | 208 (56.8%) |
| Public Administration | 110 (47.4%) | 122 (52.6%) |
| Total | 2,765 (57.6%) | 2,035 (42.4%) |
Education in King City
School Enrollment in King City
The most common levels of schooling among the 4,183 students in King City are elementary school (1,344 | 32.1%), high school (1,087 | 26.0%), and middle school (656 | 15.7%).
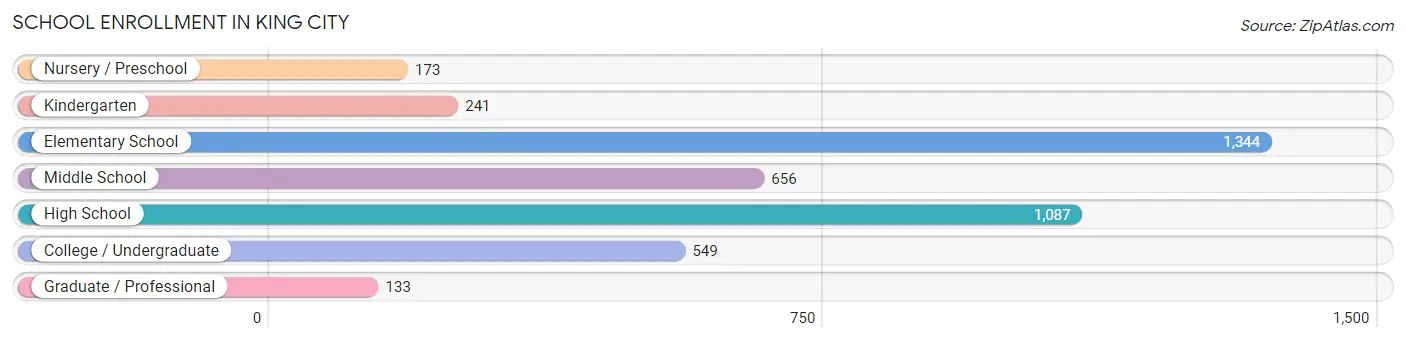
| School Level | # Students | % Students |
| Nursery / Preschool | 173 | 4.1% |
| Kindergarten | 241 | 5.8% |
| Elementary School | 1,344 | 32.1% |
| Middle School | 656 | 15.7% |
| High School | 1,087 | 26.0% |
| College / Undergraduate | 549 | 13.1% |
| Graduate / Professional | 133 | 3.2% |
| Total | 4,183 | 100.0% |
School Enrollment by Age by Funding Source in King City
Out of a total of 4,183 students who are enrolled in schools in King City, 63 (1.5%) attend a private institution, while the remaining 4,120 (98.5%) are enrolled in public schools. The age group of 35 years and over has the highest likelihood of being enrolled in private schools, with 35 (21.2% in the age bracket) enrolled. Conversely, the age group of 3 to 4 year olds has the lowest likelihood of being enrolled in a private school, with 236 (100.0% in the age bracket) attending a public institution.
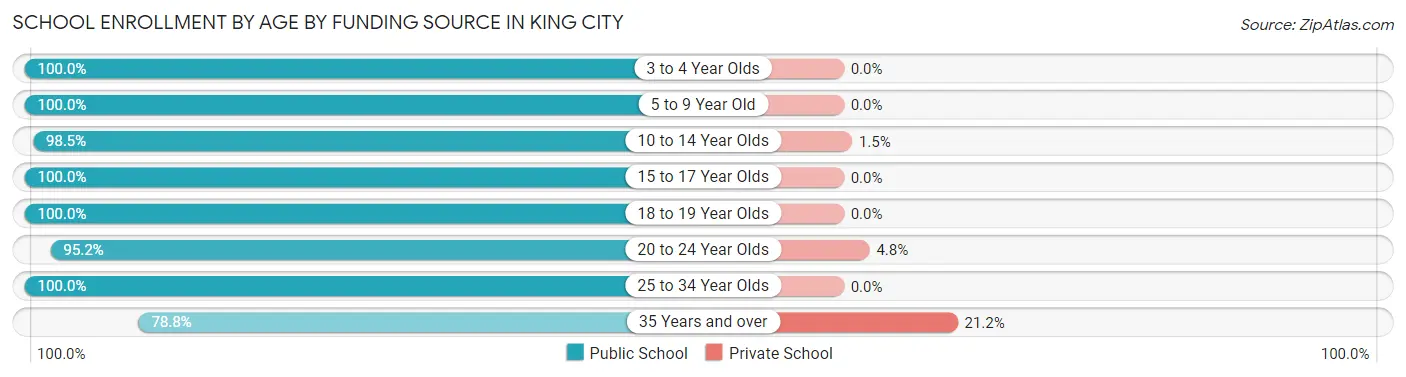
| Age Bracket | Public School | Private School |
| 3 to 4 Year Olds | 236 (100.0%) | 0 (0.0%) |
| 5 to 9 Year Old | 1,381 (100.0%) | 0 (0.0%) |
| 10 to 14 Year Olds | 1,085 (98.5%) | 17 (1.5%) |
| 15 to 17 Year Olds | 704 (100.0%) | 0 (0.0%) |
| 18 to 19 Year Olds | 232 (100.0%) | 0 (0.0%) |
| 20 to 24 Year Olds | 178 (95.2%) | 9 (4.8%) |
| 25 to 34 Year Olds | 176 (100.0%) | 0 (0.0%) |
| 35 Years and over | 130 (78.8%) | 35 (21.2%) |
| Total | 4,120 (98.5%) | 63 (1.5%) |
Educational Attainment by Field of Study in King City
Education (152 | 17.9%), bio, nature & agricultural (110 | 13.0%), arts & humanities (104 | 12.3%), liberal arts & history (92 | 10.8%), and business (74 | 8.7%) are the most common fields of study among 848 individuals in King City who have obtained a bachelor's degree or higher.
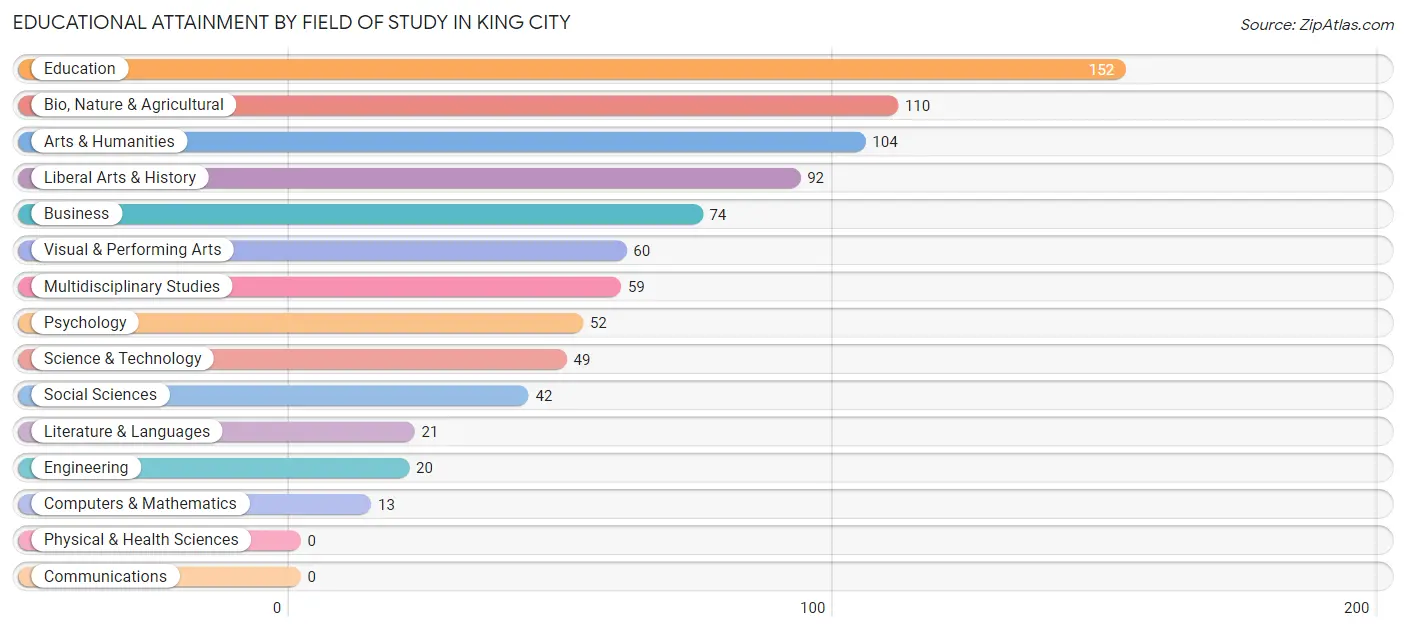
| Field of Study | # Graduates | % Graduates |
| Computers & Mathematics | 13 | 1.5% |
| Bio, Nature & Agricultural | 110 | 13.0% |
| Physical & Health Sciences | 0 | 0.0% |
| Psychology | 52 | 6.1% |
| Social Sciences | 42 | 5.0% |
| Engineering | 20 | 2.4% |
| Multidisciplinary Studies | 59 | 7.0% |
| Science & Technology | 49 | 5.8% |
| Business | 74 | 8.7% |
| Education | 152 | 17.9% |
| Literature & Languages | 21 | 2.5% |
| Liberal Arts & History | 92 | 10.8% |
| Visual & Performing Arts | 60 | 7.1% |
| Communications | 0 | 0.0% |
| Arts & Humanities | 104 | 12.3% |
| Total | 848 | 100.0% |
Transportation & Commute in King City
Vehicle Availability by Sex in King City
The most prevalent vehicle ownership categories in King City are males with 2 vehicles (950, accounting for 34.5%) and females with 2 vehicles (582, making up 48.8%).
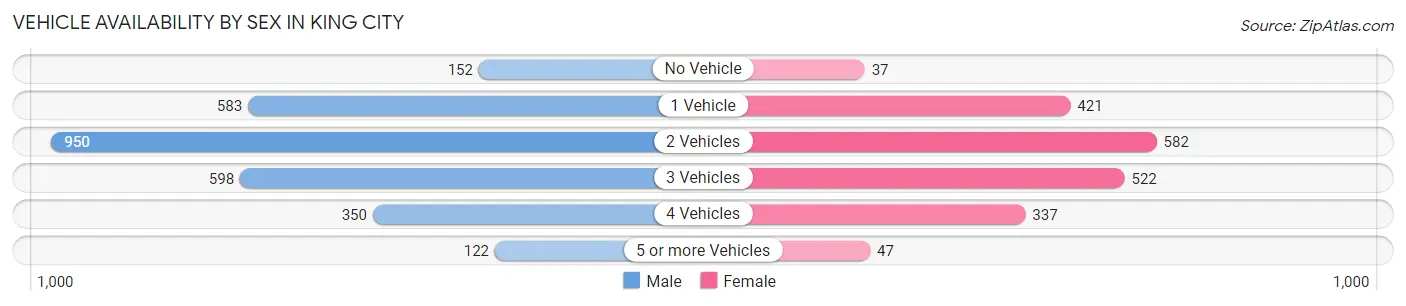
| Vehicles Available | Male | Female |
| No Vehicle | 152 (5.5%) | 37 (1.9%) |
| 1 Vehicle | 583 (21.2%) | 421 (21.6%) |
| 2 Vehicles | 950 (34.5%) | 582 (29.9%) |
| 3 Vehicles | 598 (21.7%) | 522 (26.8%) |
| 4 Vehicles | 350 (12.7%) | 337 (17.3%) |
| 5 or more Vehicles | 122 (4.4%) | 47 (2.4%) |
| Total | 2,755 (100.0%) | 1,946 (100.0%) |
Commute Time in King City
The most frequently occuring commute durations in King City are 20 to 24 minutes (1,326 commuters, 29.2%), 15 to 19 minutes (667 commuters, 14.7%), and 30 to 34 minutes (570 commuters, 12.5%).
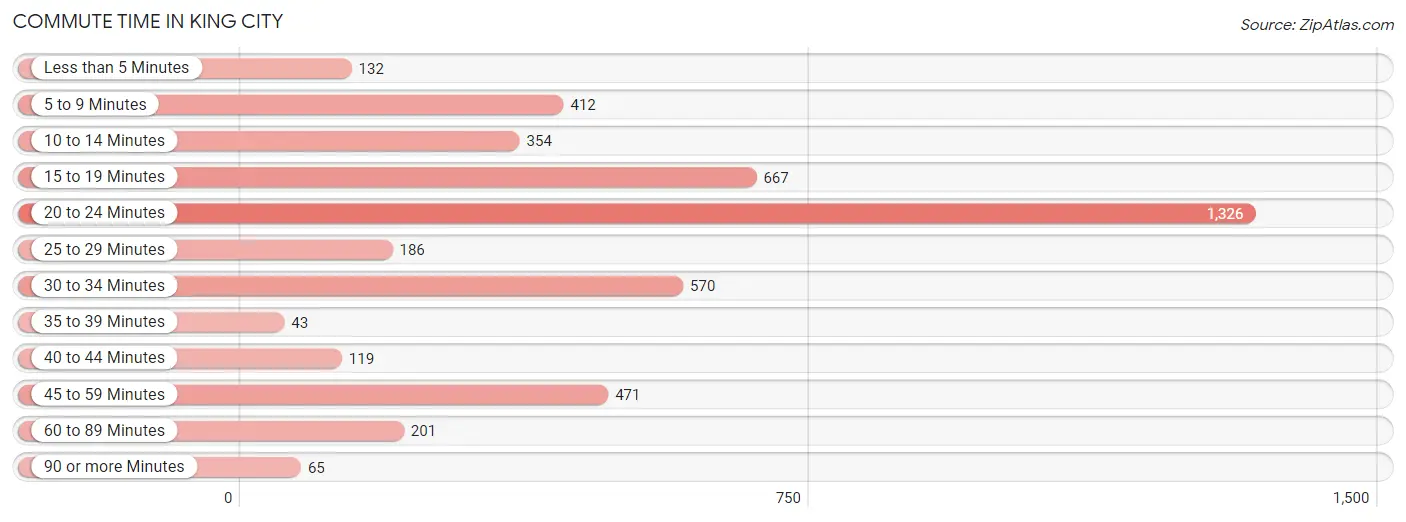
| Commute Time | # Commuters | % Commuters |
| Less than 5 Minutes | 132 | 2.9% |
| 5 to 9 Minutes | 412 | 9.1% |
| 10 to 14 Minutes | 354 | 7.8% |
| 15 to 19 Minutes | 667 | 14.7% |
| 20 to 24 Minutes | 1,326 | 29.2% |
| 25 to 29 Minutes | 186 | 4.1% |
| 30 to 34 Minutes | 570 | 12.5% |
| 35 to 39 Minutes | 43 | 0.9% |
| 40 to 44 Minutes | 119 | 2.6% |
| 45 to 59 Minutes | 471 | 10.4% |
| 60 to 89 Minutes | 201 | 4.4% |
| 90 or more Minutes | 65 | 1.4% |
Commute Time by Sex in King City
The most common commute times in King City are 20 to 24 minutes (649 commuters, 24.4%) for males and 20 to 24 minutes (677 commuters, 35.8%) for females.
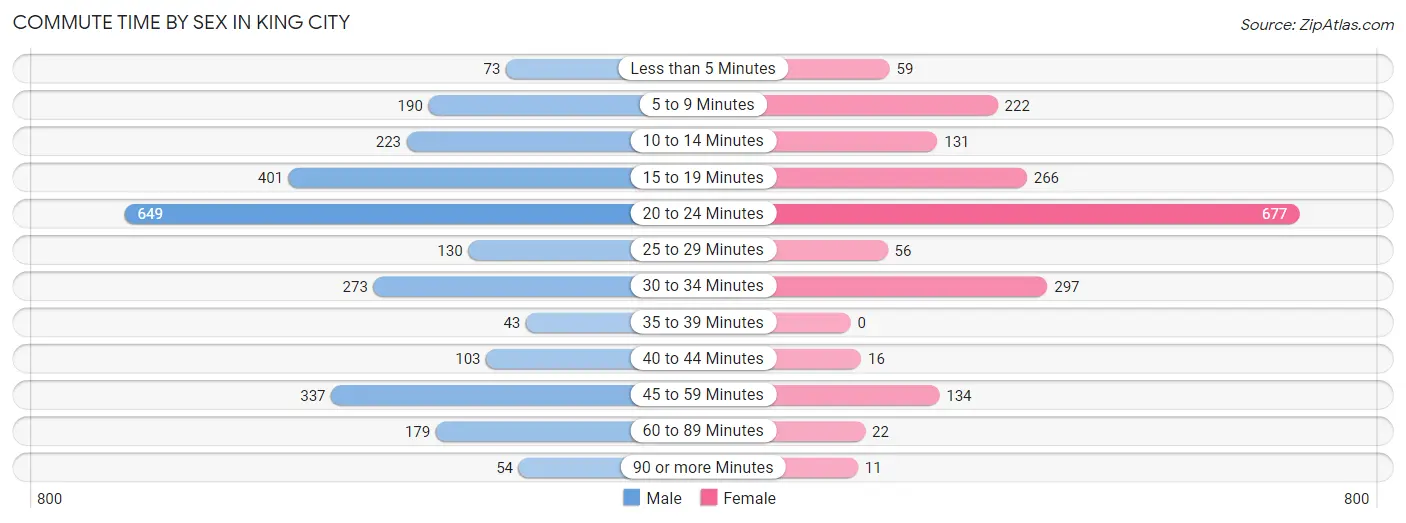
| Commute Time | Male | Female |
| Less than 5 Minutes | 73 (2.8%) | 59 (3.1%) |
| 5 to 9 Minutes | 190 (7.2%) | 222 (11.7%) |
| 10 to 14 Minutes | 223 (8.4%) | 131 (6.9%) |
| 15 to 19 Minutes | 401 (15.1%) | 266 (14.1%) |
| 20 to 24 Minutes | 649 (24.4%) | 677 (35.8%) |
| 25 to 29 Minutes | 130 (4.9%) | 56 (3.0%) |
| 30 to 34 Minutes | 273 (10.3%) | 297 (15.7%) |
| 35 to 39 Minutes | 43 (1.6%) | 0 (0.0%) |
| 40 to 44 Minutes | 103 (3.9%) | 16 (0.9%) |
| 45 to 59 Minutes | 337 (12.7%) | 134 (7.1%) |
| 60 to 89 Minutes | 179 (6.7%) | 22 (1.2%) |
| 90 or more Minutes | 54 (2.0%) | 11 (0.6%) |
Time of Departure to Work by Sex in King City
The most frequent times of departure to work in King City are 6:00 AM to 6:29 AM (863, 32.5%) for males and 6:00 AM to 6:29 AM (488, 25.8%) for females.
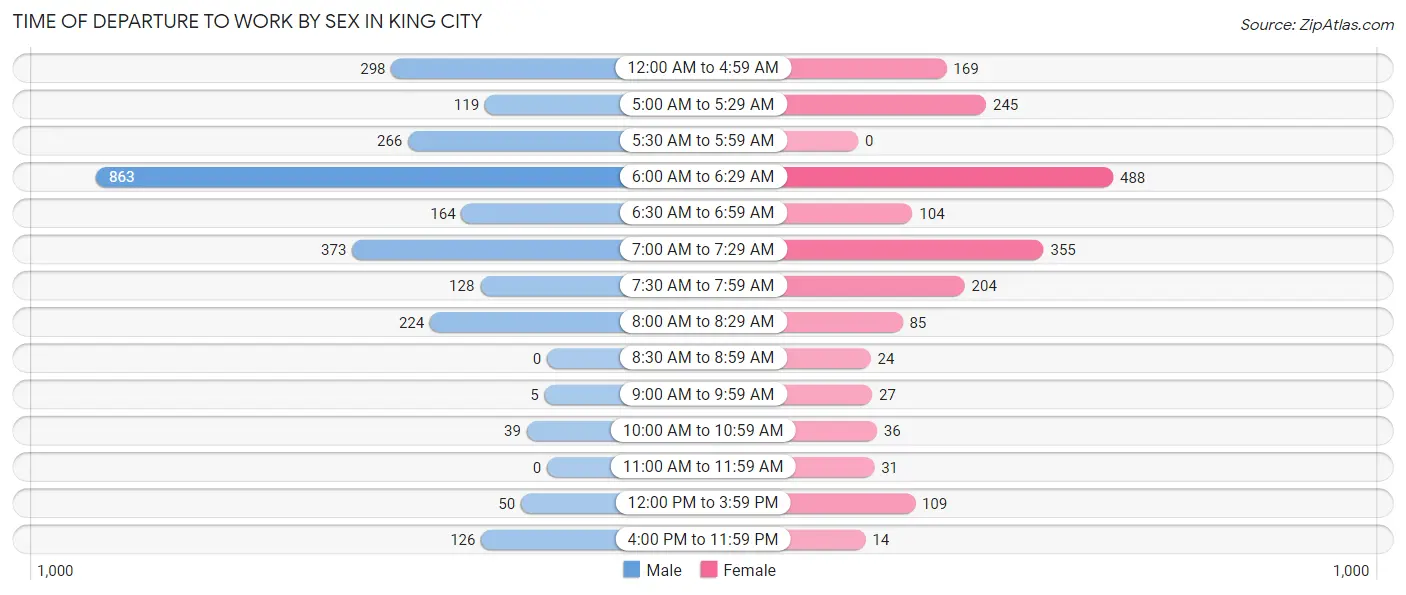
| Time of Departure | Male | Female |
| 12:00 AM to 4:59 AM | 298 (11.2%) | 169 (8.9%) |
| 5:00 AM to 5:29 AM | 119 (4.5%) | 245 (13.0%) |
| 5:30 AM to 5:59 AM | 266 (10.0%) | 0 (0.0%) |
| 6:00 AM to 6:29 AM | 863 (32.5%) | 488 (25.8%) |
| 6:30 AM to 6:59 AM | 164 (6.2%) | 104 (5.5%) |
| 7:00 AM to 7:29 AM | 373 (14.1%) | 355 (18.8%) |
| 7:30 AM to 7:59 AM | 128 (4.8%) | 204 (10.8%) |
| 8:00 AM to 8:29 AM | 224 (8.4%) | 85 (4.5%) |
| 8:30 AM to 8:59 AM | 0 (0.0%) | 24 (1.3%) |
| 9:00 AM to 9:59 AM | 5 (0.2%) | 27 (1.4%) |
| 10:00 AM to 10:59 AM | 39 (1.5%) | 36 (1.9%) |
| 11:00 AM to 11:59 AM | 0 (0.0%) | 31 (1.6%) |
| 12:00 PM to 3:59 PM | 50 (1.9%) | 109 (5.8%) |
| 4:00 PM to 11:59 PM | 126 (4.8%) | 14 (0.7%) |
| Total | 2,655 (100.0%) | 1,891 (100.0%) |
Housing Occupancy in King City
Occupancy by Ownership in King City
Of the total 3,268 dwellings in King City, owner-occupied units account for 1,398 (42.8%), while renter-occupied units make up 1,870 (57.2%).
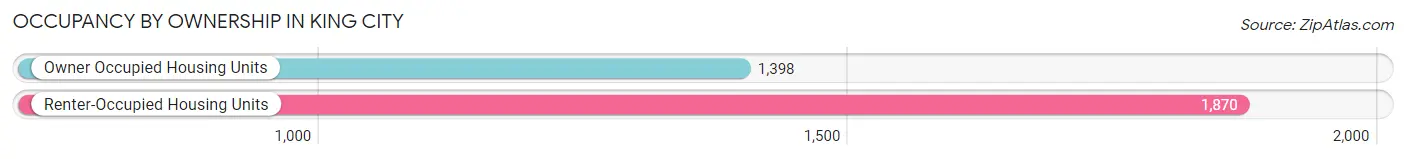
| Occupancy | # Housing Units | % Housing Units |
| Owner Occupied Housing Units | 1,398 | 42.8% |
| Renter-Occupied Housing Units | 1,870 | 57.2% |
| Total Occupied Housing Units | 3,268 | 100.0% |
Occupancy by Household Size in King City
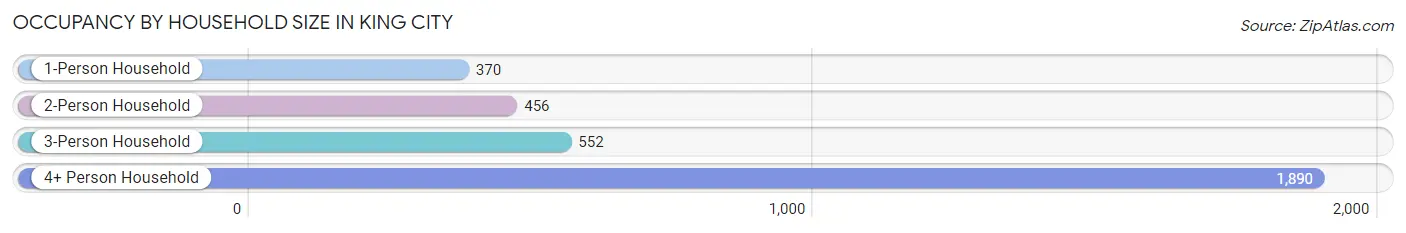
| Household Size | # Housing Units | % Housing Units |
| 1-Person Household | 370 | 11.3% |
| 2-Person Household | 456 | 14.0% |
| 3-Person Household | 552 | 16.9% |
| 4+ Person Household | 1,890 | 57.8% |
| Total Housing Units | 3,268 | 100.0% |
Occupancy by Ownership by Household Size in King City
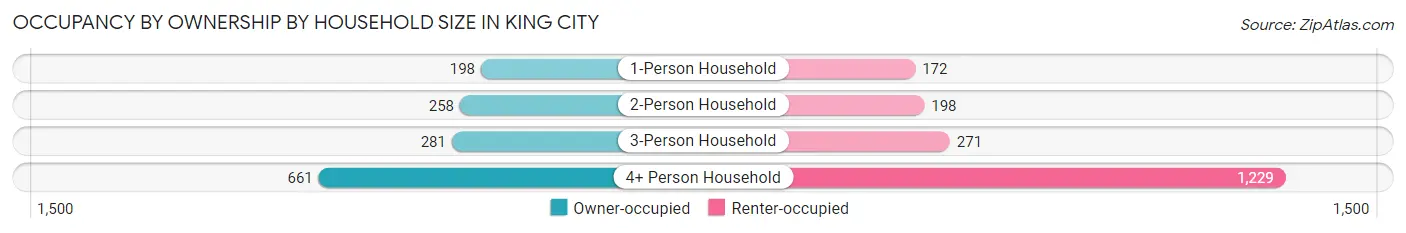
| Household Size | Owner-occupied | Renter-occupied |
| 1-Person Household | 198 (53.5%) | 172 (46.5%) |
| 2-Person Household | 258 (56.6%) | 198 (43.4%) |
| 3-Person Household | 281 (50.9%) | 271 (49.1%) |
| 4+ Person Household | 661 (35.0%) | 1,229 (65.0%) |
| Total Housing Units | 1,398 (42.8%) | 1,870 (57.2%) |
Occupancy by Educational Attainment in King City
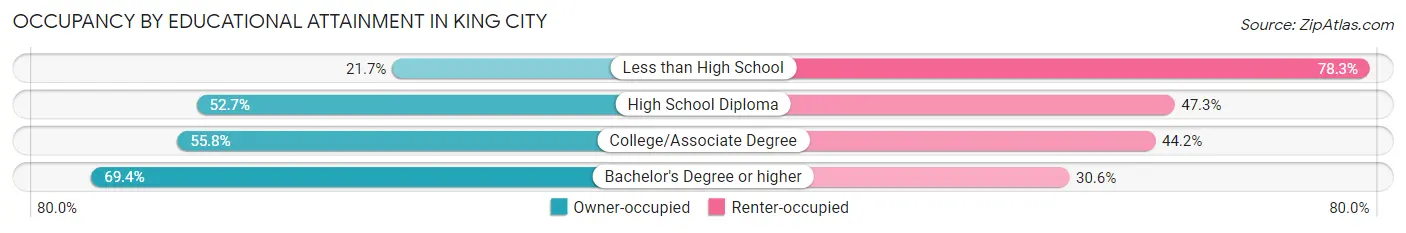
| Household Size | Owner-occupied | Renter-occupied |
| Less than High School | 294 (21.7%) | 1,061 (78.3%) |
| High School Diploma | 389 (52.7%) | 349 (47.3%) |
| College/Associate Degree | 411 (55.8%) | 326 (44.2%) |
| Bachelor's Degree or higher | 304 (69.4%) | 134 (30.6%) |
Occupancy by Age of Householder in King City
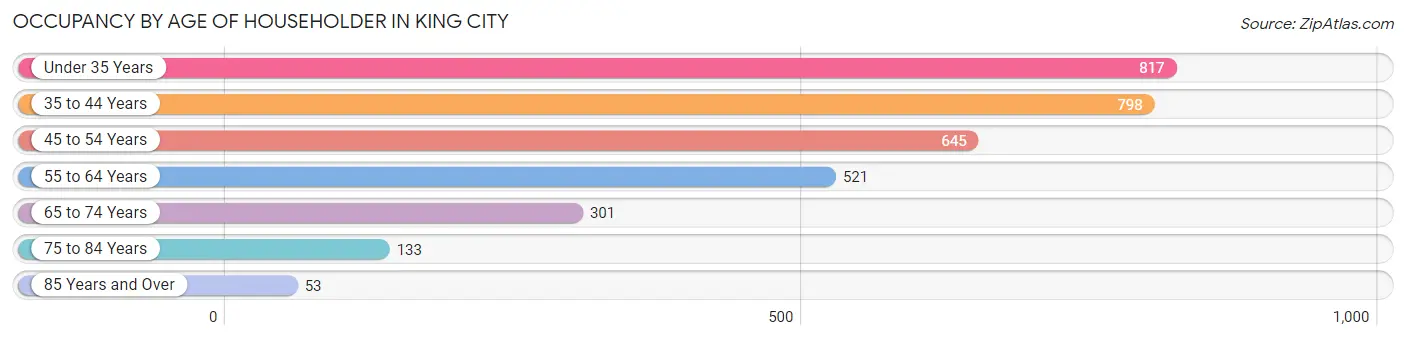
| Age Bracket | # Households | % Households |
| Under 35 Years | 817 | 25.0% |
| 35 to 44 Years | 798 | 24.4% |
| 45 to 54 Years | 645 | 19.7% |
| 55 to 64 Years | 521 | 15.9% |
| 65 to 74 Years | 301 | 9.2% |
| 75 to 84 Years | 133 | 4.1% |
| 85 Years and Over | 53 | 1.6% |
| Total | 3,268 | 100.0% |
Housing Finances in King City
Median Income by Occupancy in King City
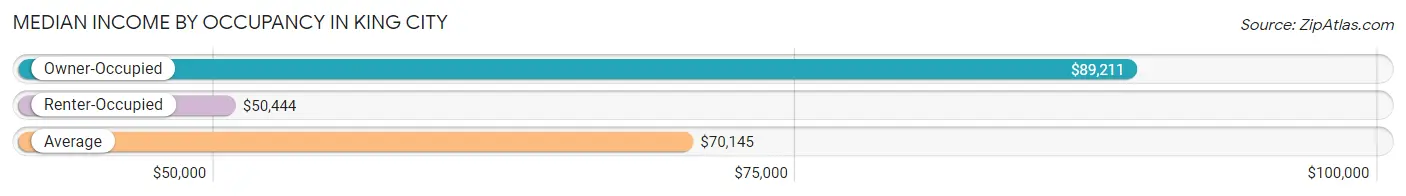
| Occupancy Type | # Households | Median Income |
| Owner-Occupied | 1,398 (42.8%) | $89,211 |
| Renter-Occupied | 1,870 (57.2%) | $50,444 |
| Average | 3,268 (100.0%) | $70,145 |
Occupancy by Householder Income Bracket in King City
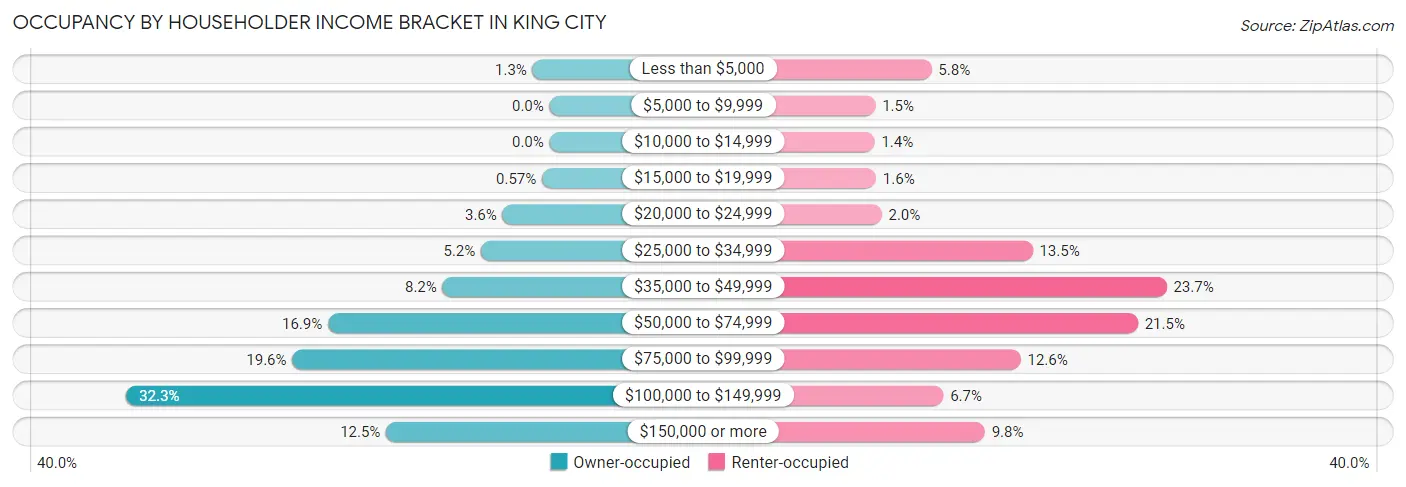
| Income Bracket | Owner-occupied | Renter-occupied |
| Less than $5,000 | 18 (1.3%) | 108 (5.8%) |
| $5,000 to $9,999 | 0 (0.0%) | 28 (1.5%) |
| $10,000 to $14,999 | 0 (0.0%) | 27 (1.4%) |
| $15,000 to $19,999 | 8 (0.6%) | 29 (1.5%) |
| $20,000 to $24,999 | 50 (3.6%) | 37 (2.0%) |
| $25,000 to $34,999 | 73 (5.2%) | 252 (13.5%) |
| $35,000 to $49,999 | 114 (8.2%) | 443 (23.7%) |
| $50,000 to $74,999 | 236 (16.9%) | 402 (21.5%) |
| $75,000 to $99,999 | 274 (19.6%) | 235 (12.6%) |
| $100,000 to $149,999 | 451 (32.3%) | 125 (6.7%) |
| $150,000 or more | 174 (12.4%) | 184 (9.8%) |
| Total | 1,398 (100.0%) | 1,870 (100.0%) |
Monthly Housing Cost Tiers in King City
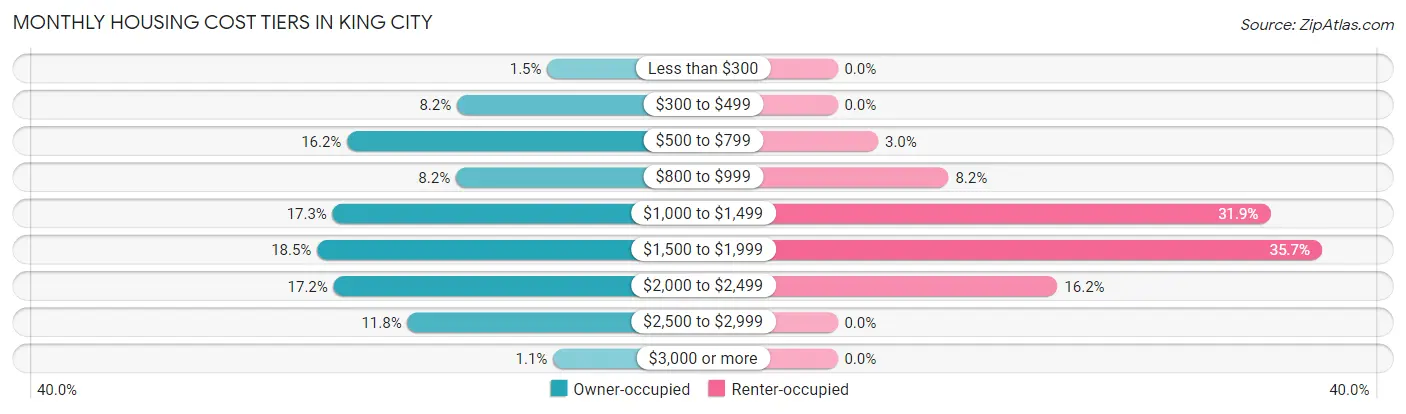
| Monthly Cost | Owner-occupied | Renter-occupied |
| Less than $300 | 21 (1.5%) | 0 (0.0%) |
| $300 to $499 | 114 (8.2%) | 0 (0.0%) |
| $500 to $799 | 227 (16.2%) | 56 (3.0%) |
| $800 to $999 | 115 (8.2%) | 153 (8.2%) |
| $1,000 to $1,499 | 242 (17.3%) | 596 (31.9%) |
| $1,500 to $1,999 | 258 (18.4%) | 667 (35.7%) |
| $2,000 to $2,499 | 241 (17.2%) | 303 (16.2%) |
| $2,500 to $2,999 | 165 (11.8%) | 0 (0.0%) |
| $3,000 or more | 15 (1.1%) | 0 (0.0%) |
| Total | 1,398 (100.0%) | 1,870 (100.0%) |
Physical Housing Characteristics in King City
Housing Structures in King City
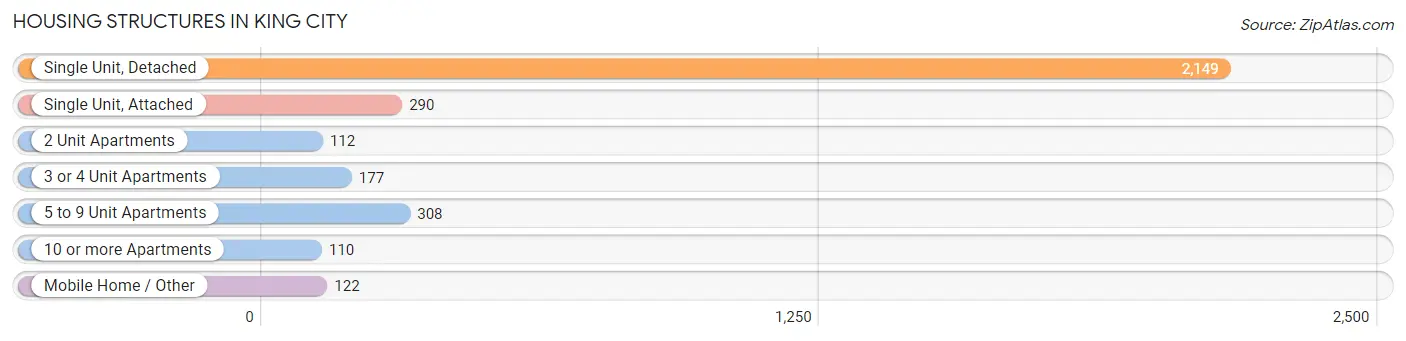
| Structure Type | # Housing Units | % Housing Units |
| Single Unit, Detached | 2,149 | 65.8% |
| Single Unit, Attached | 290 | 8.9% |
| 2 Unit Apartments | 112 | 3.4% |
| 3 or 4 Unit Apartments | 177 | 5.4% |
| 5 to 9 Unit Apartments | 308 | 9.4% |
| 10 or more Apartments | 110 | 3.4% |
| Mobile Home / Other | 122 | 3.7% |
| Total | 3,268 | 100.0% |
Housing Structures by Occupancy in King City
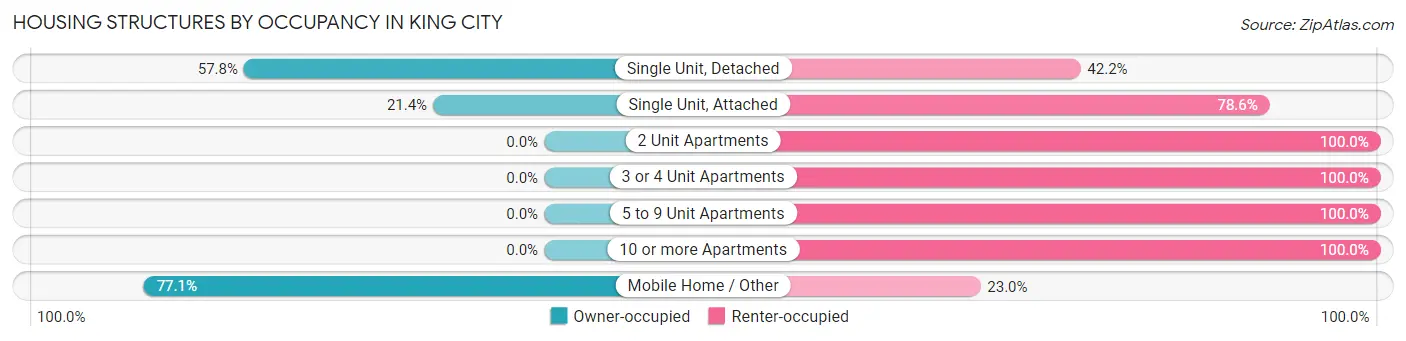
| Structure Type | Owner-occupied | Renter-occupied |
| Single Unit, Detached | 1,242 (57.8%) | 907 (42.2%) |
| Single Unit, Attached | 62 (21.4%) | 228 (78.6%) |
| 2 Unit Apartments | 0 (0.0%) | 112 (100.0%) |
| 3 or 4 Unit Apartments | 0 (0.0%) | 177 (100.0%) |
| 5 to 9 Unit Apartments | 0 (0.0%) | 308 (100.0%) |
| 10 or more Apartments | 0 (0.0%) | 110 (100.0%) |
| Mobile Home / Other | 94 (77.0%) | 28 (23.0%) |
| Total | 1,398 (42.8%) | 1,870 (57.2%) |
Housing Structures by Number of Rooms in King City
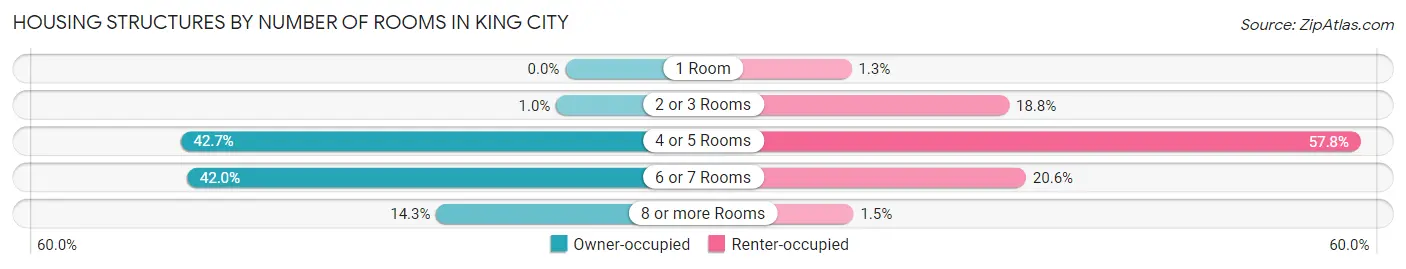
| Number of Rooms | Owner-occupied | Renter-occupied |
| 1 Room | 0 (0.0%) | 24 (1.3%) |
| 2 or 3 Rooms | 14 (1.0%) | 351 (18.8%) |
| 4 or 5 Rooms | 597 (42.7%) | 1,081 (57.8%) |
| 6 or 7 Rooms | 587 (42.0%) | 386 (20.6%) |
| 8 or more Rooms | 200 (14.3%) | 28 (1.5%) |
| Total | 1,398 (100.0%) | 1,870 (100.0%) |
Housing Structure by Heating Type in King City
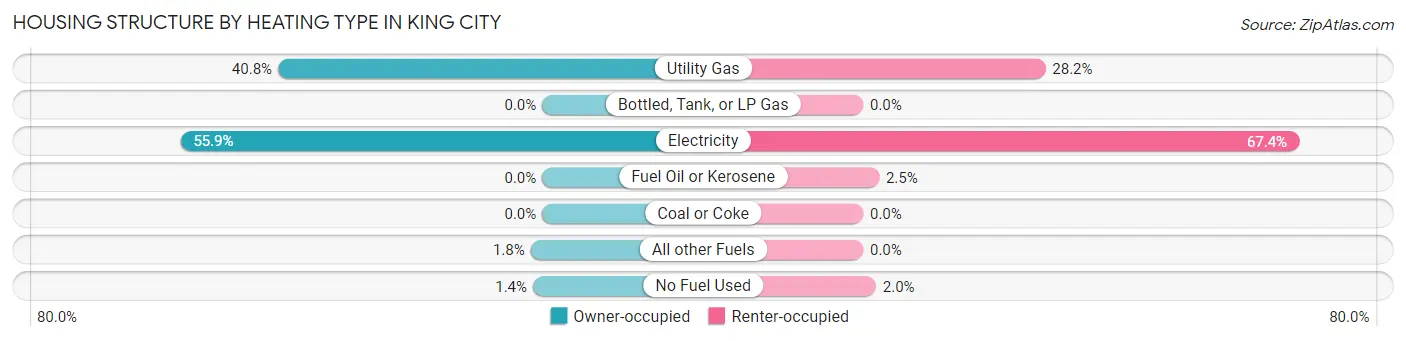
| Heating Type | Owner-occupied | Renter-occupied |
| Utility Gas | 571 (40.8%) | 527 (28.2%) |
| Bottled, Tank, or LP Gas | 0 (0.0%) | 0 (0.0%) |
| Electricity | 782 (55.9%) | 1,260 (67.4%) |
| Fuel Oil or Kerosene | 0 (0.0%) | 46 (2.5%) |
| Coal or Coke | 0 (0.0%) | 0 (0.0%) |
| All other Fuels | 25 (1.8%) | 0 (0.0%) |
| No Fuel Used | 20 (1.4%) | 37 (2.0%) |
| Total | 1,398 (100.0%) | 1,870 (100.0%) |
Household Vehicle Usage in King City
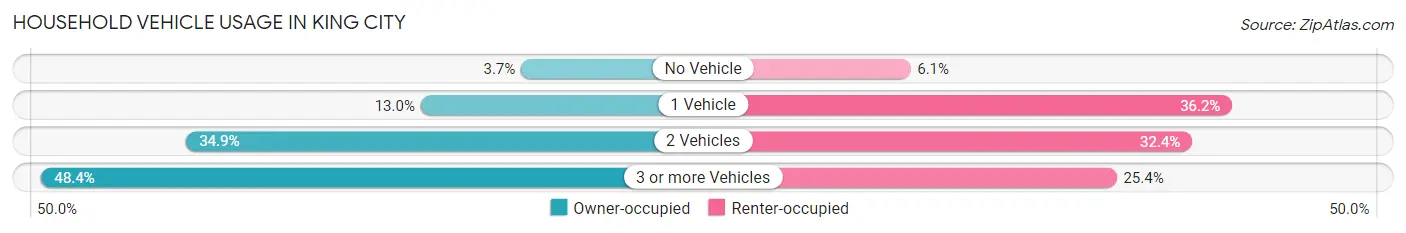
| Vehicles per Household | Owner-occupied | Renter-occupied |
| No Vehicle | 51 (3.6%) | 114 (6.1%) |
| 1 Vehicle | 182 (13.0%) | 676 (36.1%) |
| 2 Vehicles | 488 (34.9%) | 606 (32.4%) |
| 3 or more Vehicles | 677 (48.4%) | 474 (25.4%) |
| Total | 1,398 (100.0%) | 1,870 (100.0%) |
Real Estate & Mortgages in King City
Real Estate and Mortgage Overview in King City
| Characteristic | Without Mortgage | With Mortgage |
| Housing Units | 453 | 945 |
| Median Property Value | $371,900 | $399,400 |
| Median Household Income | $102,760 | $136 |
| Monthly Housing Costs | $596 | $15 |
| Real Estate Taxes | $1,925 | $0 |
Property Value by Mortgage Status in King City
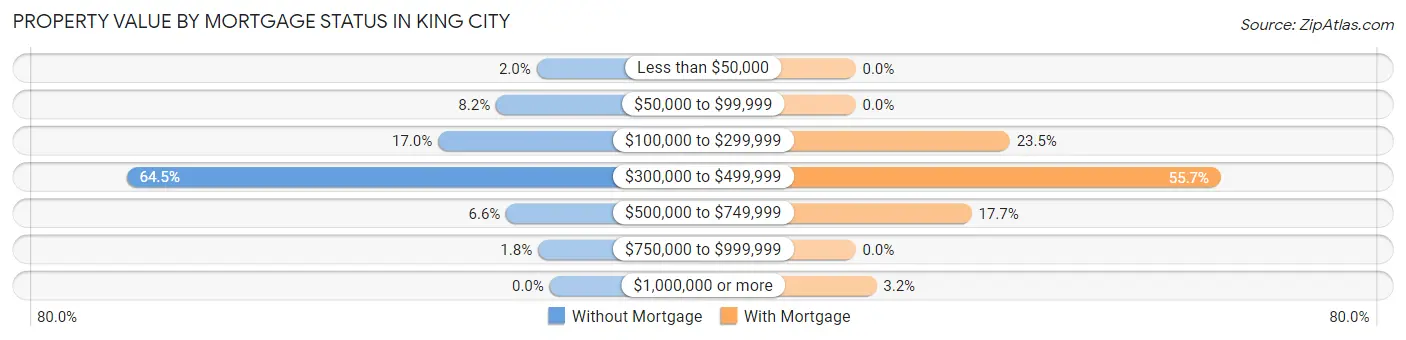
| Property Value | Without Mortgage | With Mortgage |
| Less than $50,000 | 9 (2.0%) | 0 (0.0%) |
| $50,000 to $99,999 | 37 (8.2%) | 0 (0.0%) |
| $100,000 to $299,999 | 77 (17.0%) | 222 (23.5%) |
| $300,000 to $499,999 | 292 (64.5%) | 526 (55.7%) |
| $500,000 to $749,999 | 30 (6.6%) | 167 (17.7%) |
| $750,000 to $999,999 | 8 (1.8%) | 0 (0.0%) |
| $1,000,000 or more | 0 (0.0%) | 30 (3.2%) |
| Total | 453 (100.0%) | 945 (100.0%) |
Household Income by Mortgage Status in King City
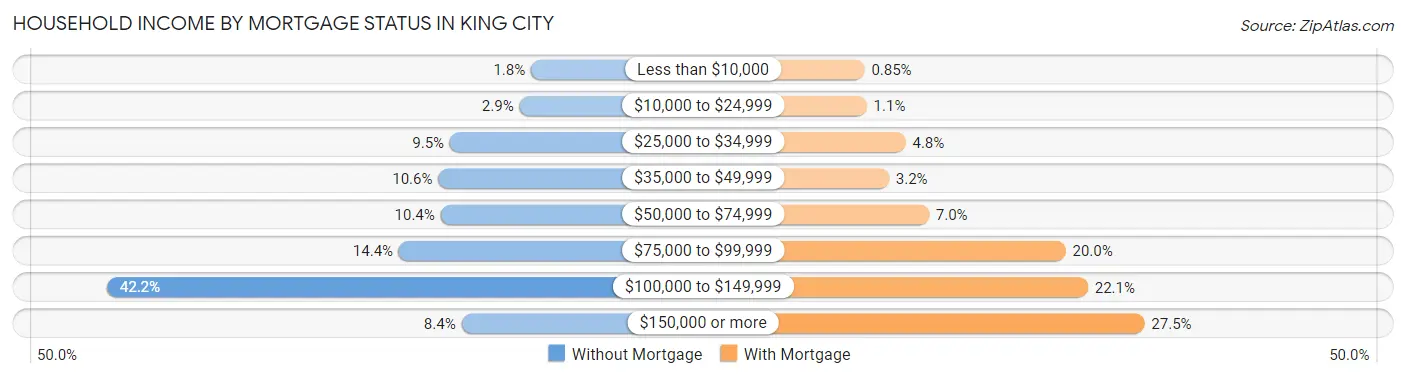
| Household Income | Without Mortgage | With Mortgage |
| Less than $10,000 | 8 (1.8%) | 8 (0.9%) |
| $10,000 to $24,999 | 13 (2.9%) | 10 (1.1%) |
| $25,000 to $34,999 | 43 (9.5%) | 45 (4.8%) |
| $35,000 to $49,999 | 48 (10.6%) | 30 (3.2%) |
| $50,000 to $74,999 | 47 (10.4%) | 66 (7.0%) |
| $75,000 to $99,999 | 65 (14.3%) | 189 (20.0%) |
| $100,000 to $149,999 | 191 (42.2%) | 209 (22.1%) |
| $150,000 or more | 38 (8.4%) | 260 (27.5%) |
| Total | 453 (100.0%) | 945 (100.0%) |
Property Value to Household Income Ratio in King City
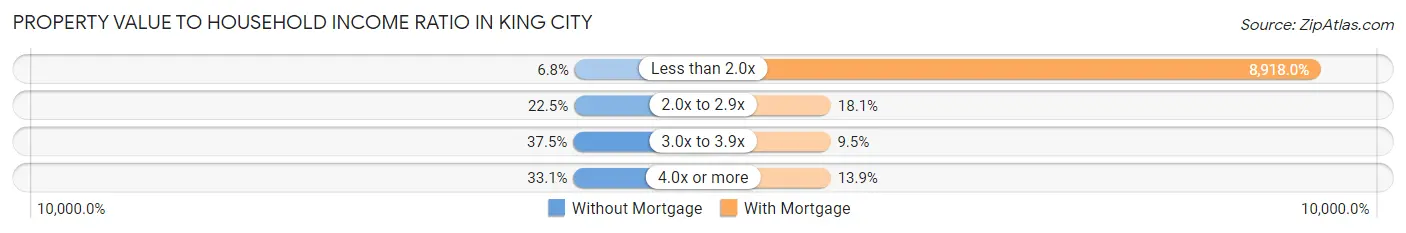
| Value-to-Income Ratio | Without Mortgage | With Mortgage |
| Less than 2.0x | 31 (6.8%) | 84,275 (8,918.0%) |
| 2.0x to 2.9x | 102 (22.5%) | 171 (18.1%) |
| 3.0x to 3.9x | 170 (37.5%) | 90 (9.5%) |
| 4.0x or more | 150 (33.1%) | 131 (13.9%) |
| Total | 453 (100.0%) | 945 (100.0%) |
Real Estate Taxes by Mortgage Status in King City
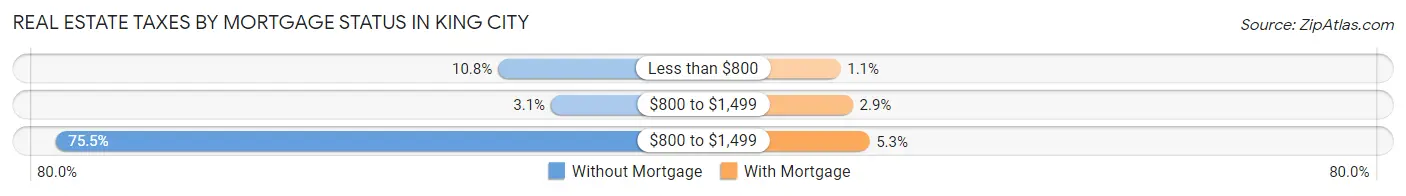
| Property Taxes | Without Mortgage | With Mortgage |
| Less than $800 | 49 (10.8%) | 10 (1.1%) |
| $800 to $1,499 | 14 (3.1%) | 27 (2.9%) |
| $800 to $1,499 | 342 (75.5%) | 50 (5.3%) |
| Total | 453 (100.0%) | 945 (100.0%) |
Health & Disability in King City
Health Insurance Coverage by Age in King City
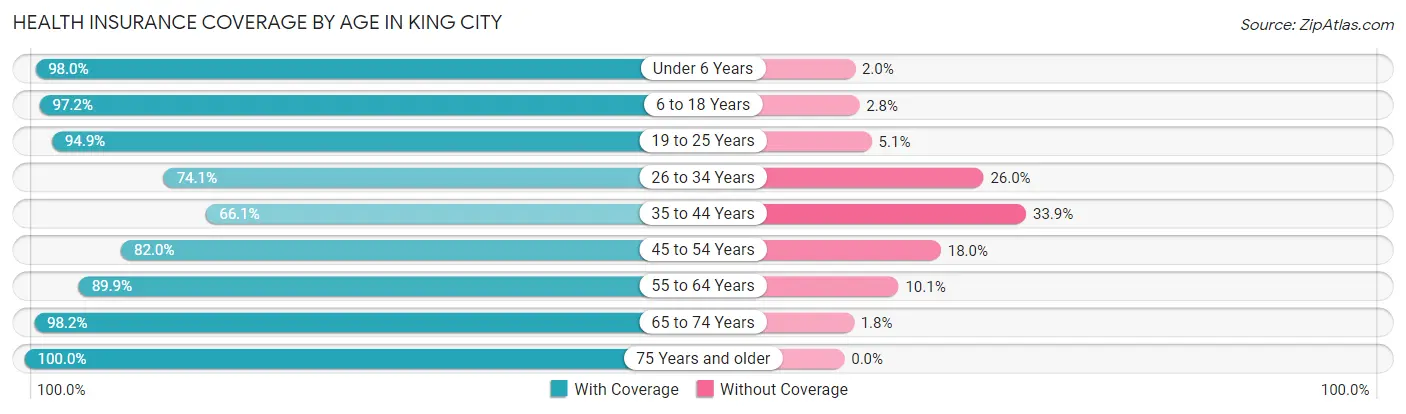
| Age Bracket | With Coverage | Without Coverage |
| Under 6 Years | 1,676 (98.0%) | 34 (2.0%) |
| 6 to 18 Years | 3,139 (97.2%) | 90 (2.8%) |
| 19 to 25 Years | 1,527 (94.9%) | 82 (5.1%) |
| 26 to 34 Years | 1,136 (74.1%) | 398 (26.0%) |
| 35 to 44 Years | 1,303 (66.1%) | 668 (33.9%) |
| 45 to 54 Years | 1,144 (82.0%) | 251 (18.0%) |
| 55 to 64 Years | 810 (89.9%) | 91 (10.1%) |
| 65 to 74 Years | 724 (98.2%) | 13 (1.8%) |
| 75 Years and older | 327 (100.0%) | 0 (0.0%) |
| Total | 11,786 (87.9%) | 1,627 (12.1%) |
Health Insurance Coverage by Citizenship Status in King City
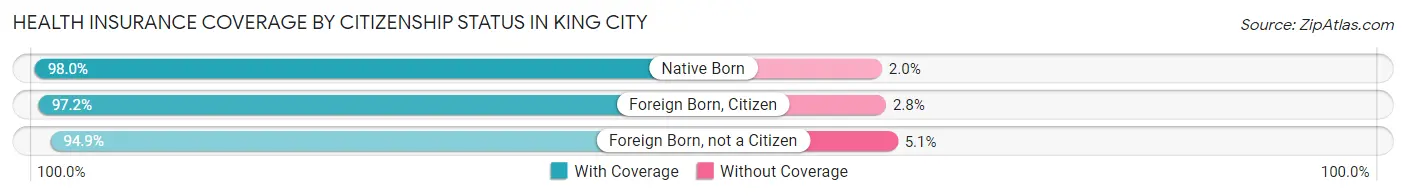
| Citizenship Status | With Coverage | Without Coverage |
| Native Born | 1,676 (98.0%) | 34 (2.0%) |
| Foreign Born, Citizen | 3,139 (97.2%) | 90 (2.8%) |
| Foreign Born, not a Citizen | 1,527 (94.9%) | 82 (5.1%) |
Health Insurance Coverage by Household Income in King City
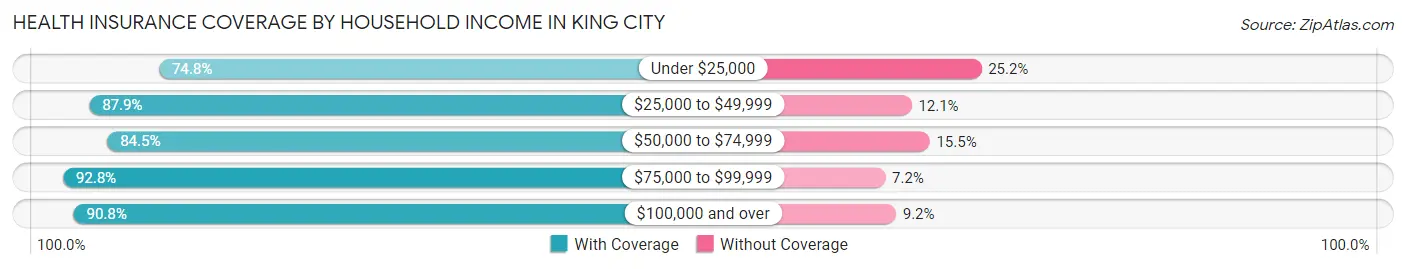
| Household Income | With Coverage | Without Coverage |
| Under $25,000 | 621 (74.8%) | 209 (25.2%) |
| $25,000 to $49,999 | 2,824 (87.9%) | 389 (12.1%) |
| $50,000 to $74,999 | 2,776 (84.5%) | 509 (15.5%) |
| $75,000 to $99,999 | 1,772 (92.8%) | 137 (7.2%) |
| $100,000 and over | 3,788 (90.8%) | 383 (9.2%) |
Public vs Private Health Insurance Coverage by Age in King City
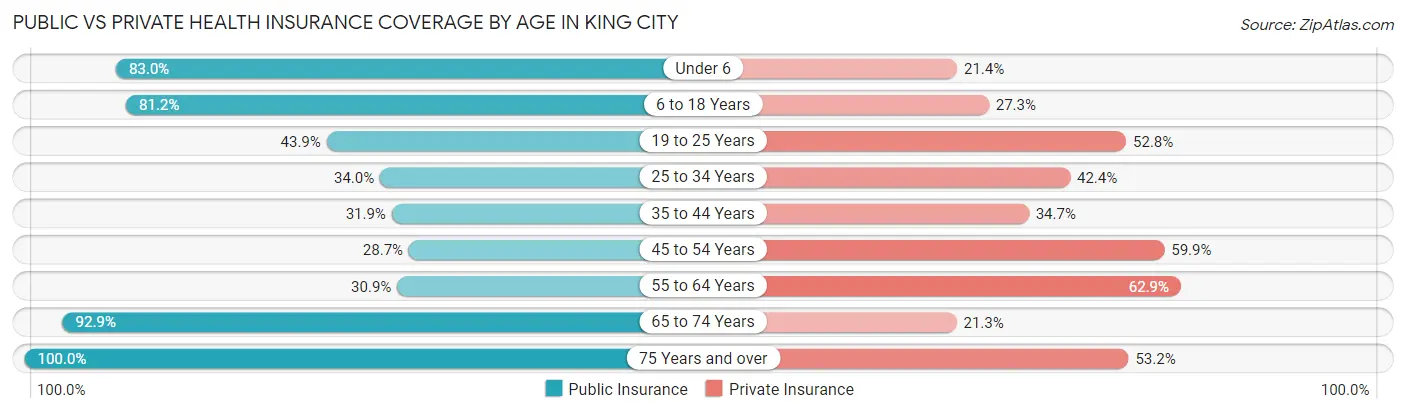
| Age Bracket | Public Insurance | Private Insurance |
| Under 6 | 1,420 (83.0%) | 366 (21.4%) |
| 6 to 18 Years | 2,621 (81.2%) | 881 (27.3%) |
| 19 to 25 Years | 707 (43.9%) | 849 (52.8%) |
| 25 to 34 Years | 522 (34.0%) | 650 (42.4%) |
| 35 to 44 Years | 628 (31.9%) | 684 (34.7%) |
| 45 to 54 Years | 400 (28.7%) | 835 (59.9%) |
| 55 to 64 Years | 278 (30.8%) | 567 (62.9%) |
| 65 to 74 Years | 685 (92.9%) | 157 (21.3%) |
| 75 Years and over | 327 (100.0%) | 174 (53.2%) |
| Total | 7,588 (56.6%) | 5,163 (38.5%) |
Disability Status by Sex by Age in King City
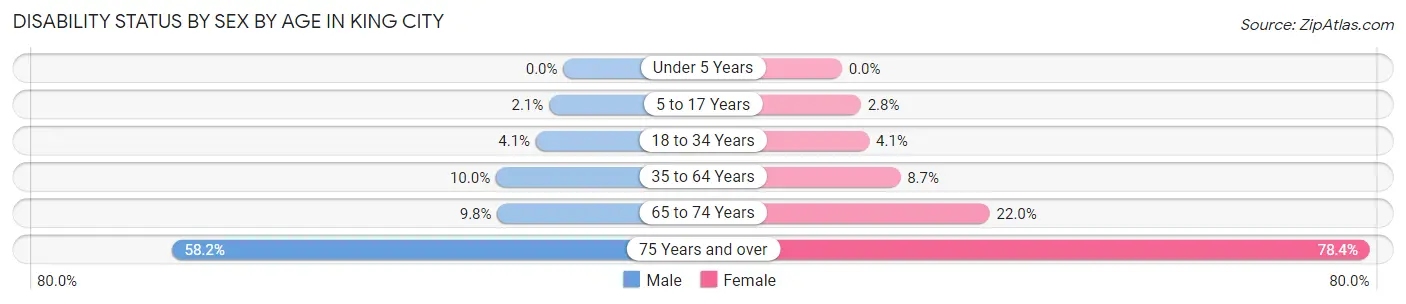
| Age Bracket | Male | Female |
| Under 5 Years | 0 (0.0%) | 0 (0.0%) |
| 5 to 17 Years | 26 (2.1%) | 58 (2.8%) |
| 18 to 34 Years | 65 (4.1%) | 68 (4.1%) |
| 35 to 64 Years | 226 (10.0%) | 174 (8.7%) |
| 65 to 74 Years | 24 (9.8%) | 108 (22.0%) |
| 75 Years and over | 96 (58.2%) | 127 (78.4%) |
Disability Class by Sex by Age in King City
Disability Class: Hearing Difficulty
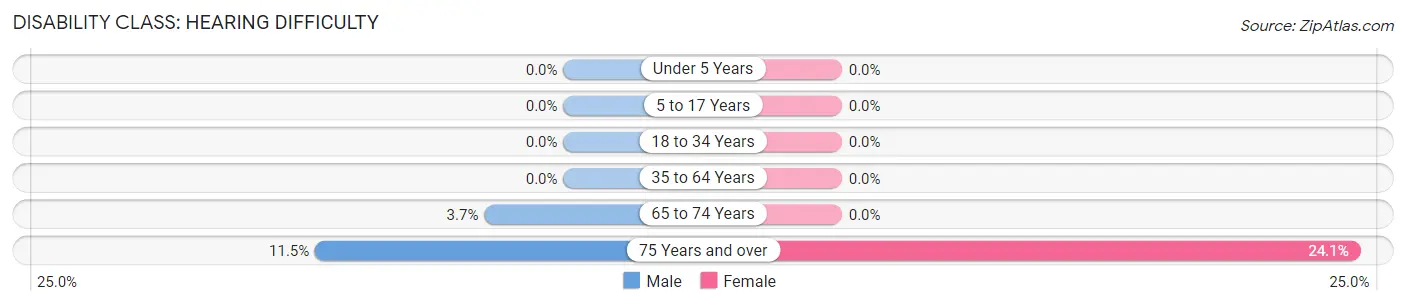
| Age Bracket | Male | Female |
| Under 5 Years | 0 (0.0%) | 0 (0.0%) |
| 5 to 17 Years | 0 (0.0%) | 0 (0.0%) |
| 18 to 34 Years | 0 (0.0%) | 0 (0.0%) |
| 35 to 64 Years | 0 (0.0%) | 0 (0.0%) |
| 65 to 74 Years | 9 (3.7%) | 0 (0.0%) |
| 75 Years and over | 19 (11.5%) | 39 (24.1%) |
Disability Class: Vision Difficulty
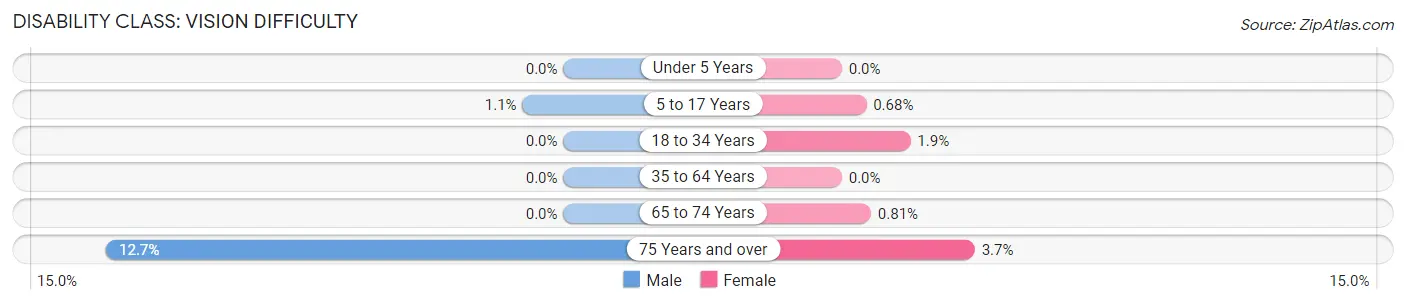
| Age Bracket | Male | Female |
| Under 5 Years | 0 (0.0%) | 0 (0.0%) |
| 5 to 17 Years | 14 (1.1%) | 14 (0.7%) |
| 18 to 34 Years | 0 (0.0%) | 32 (1.9%) |
| 35 to 64 Years | 0 (0.0%) | 0 (0.0%) |
| 65 to 74 Years | 0 (0.0%) | 4 (0.8%) |
| 75 Years and over | 21 (12.7%) | 6 (3.7%) |
Disability Class: Cognitive Difficulty
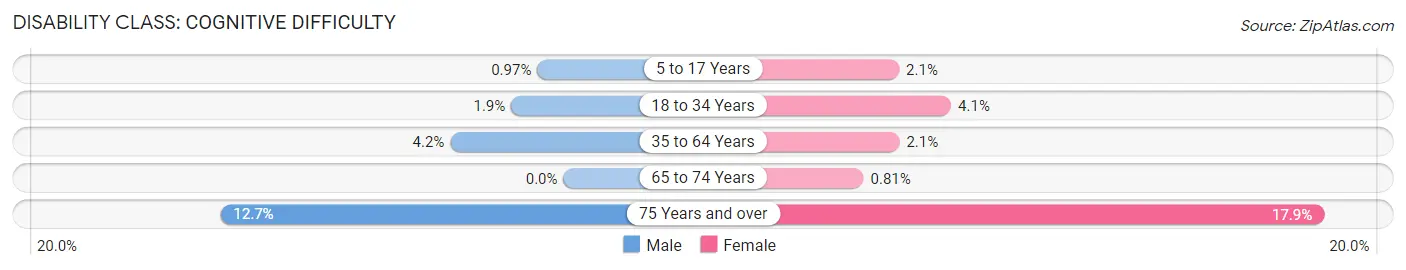
| Age Bracket | Male | Female |
| 5 to 17 Years | 12 (1.0%) | 44 (2.1%) |
| 18 to 34 Years | 31 (1.9%) | 68 (4.1%) |
| 35 to 64 Years | 95 (4.2%) | 43 (2.1%) |
| 65 to 74 Years | 0 (0.0%) | 4 (0.8%) |
| 75 Years and over | 21 (12.7%) | 29 (17.9%) |
Disability Class: Ambulatory Difficulty
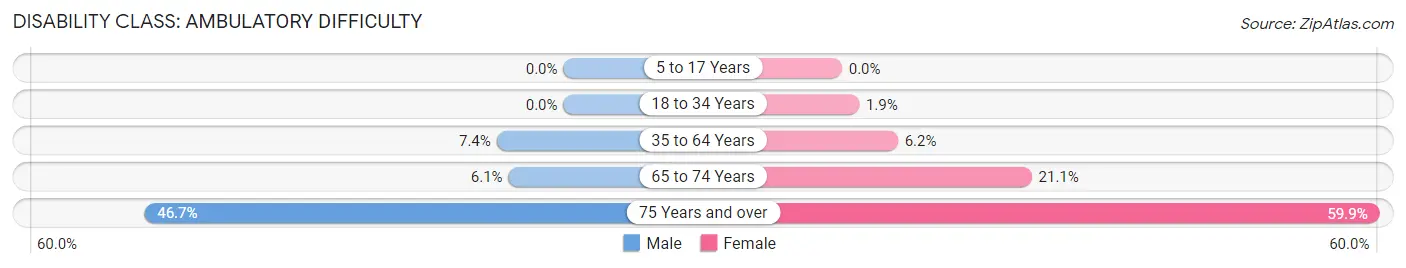
| Age Bracket | Male | Female |
| 5 to 17 Years | 0 (0.0%) | 0 (0.0%) |
| 18 to 34 Years | 0 (0.0%) | 32 (1.9%) |
| 35 to 64 Years | 168 (7.4%) | 125 (6.2%) |
| 65 to 74 Years | 15 (6.1%) | 104 (21.1%) |
| 75 Years and over | 77 (46.7%) | 97 (59.9%) |
Disability Class: Self-Care Difficulty
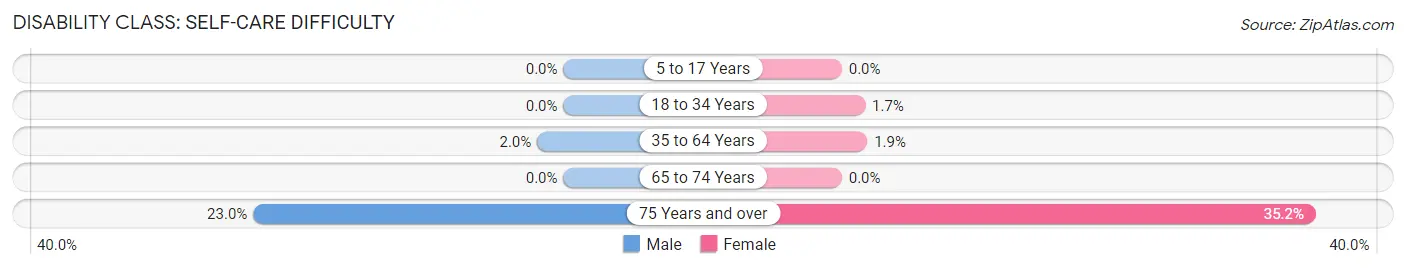
| Age Bracket | Male | Female |
| 5 to 17 Years | 0 (0.0%) | 0 (0.0%) |
| 18 to 34 Years | 0 (0.0%) | 29 (1.7%) |
| 35 to 64 Years | 44 (1.9%) | 38 (1.9%) |
| 65 to 74 Years | 0 (0.0%) | 0 (0.0%) |
| 75 Years and over | 38 (23.0%) | 57 (35.2%) |
Technology Access in King City
Computing Device Access in King City
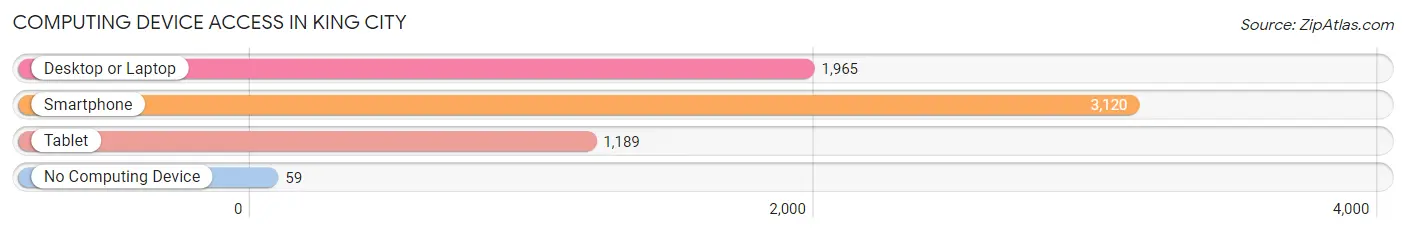
| Device Type | # Households | % Households |
| Desktop or Laptop | 1,965 | 60.1% |
| Smartphone | 3,120 | 95.5% |
| Tablet | 1,189 | 36.4% |
| No Computing Device | 59 | 1.8% |
| Total | 3,268 | 100.0% |
Internet Access in King City
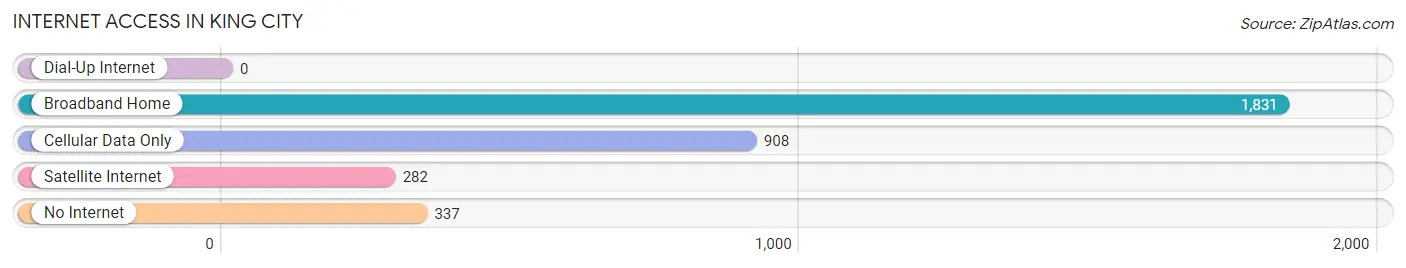
| Internet Type | # Households | % Households |
| Dial-Up Internet | 0 | 0.0% |
| Broadband Home | 1,831 | 56.0% |
| Cellular Data Only | 908 | 27.8% |
| Satellite Internet | 282 | 8.6% |
| No Internet | 337 | 10.3% |
| Total | 3,268 | 100.0% |
King City Summary
King City is a city located in Monterey County, California, United States. It is situated in the Salinas Valley, a major agricultural region in California. The city is located about 120 miles south of San Francisco and about 60 miles north of Paso Robles. As of the 2010 census, the city had a population of 12,874.
History
King City was founded in 1884 by Charles King, a rancher from the Midwest. He purchased a large tract of land in the Salinas Valley and began to develop it into a ranching and farming community. The town was named after him and incorporated in 1911.
In the early 1900s, King City was a major stop on the Southern Pacific Railroad. It was also a major center for the production of wool and other agricultural products. The city was also home to a large number of Japanese-American farmers who grew vegetables and flowers.
During World War II, many of the Japanese-American farmers were sent to internment camps. After the war, the city experienced a period of growth and development. In the 1950s, King City was a major center for the production of lettuce and other vegetables.
Geography
King City is located at 36°13'N 121°6'W (36.2179, -121.0986). It is situated in the Salinas Valley, a major agricultural region in California. The city is located about 120 miles south of San Francisco and about 60 miles north of Paso Robles.
The city has a total area of 4.2 square miles, all of which is land. The climate is mild and temperate, with warm summers and cool winters.
Economy
King City is a major center for agriculture in California. The city is home to a large number of farms and ranches that produce a variety of crops, including lettuce, broccoli, cauliflower, and other vegetables. The city is also home to a number of wineries and vineyards.
The city is also home to a number of manufacturing and industrial businesses. These include a large number of food processing plants, as well as a number of other businesses that produce a variety of products, including furniture, clothing, and electronics.
Demographics
As of the 2010 census, the city had a population of 12,874. The racial makeup of the city was 64.3% White, 0.7% African American, 1.2% Native American, 0.7% Asian, 0.1% Pacific Islander, 28.7% from other races, and 4.3% from two or more races. Hispanic or Latino of any race were 57.2% of the population.
The median income for a household in the city was $37,917, and the median income for a family was $45,917. The per capita income for the city was $17,917. About 17.2% of families and 21.3% of the population were below the poverty line, including 28.3% of those under age 18 and 11.2% of those age 65 or over.
King City is served by the King City Unified School District, which includes four elementary schools, one middle school, and one high school. The city is also home to a number of private schools, including a Catholic school and a Montessori school.
Common Questions
What is Per Capita Income in King City?
Per Capita income in King City is $22,288.
What is the Median Family Income in King City?
Median Family Income in King City is $54,651.
What is the Median Household income in King City?
Median Household Income in King City is $70,145.
What is Income or Wage Gap in King City?
Income or Wage Gap in King City is 28.8%.
Women in King City earn 71.2 cents for every dollar earned by a man.
What is Family Income Deficit in King City?
Family Income Deficit in King City is $17,632.
Families that are below poverty line in King City earn $17,632 less on average than the poverty threshold level.
What is Inequality or Gini Index in King City?
Inequality or Gini Index in King City is 0.42.
What is the Total Population of King City?
Total Population of King City is 13,471.
What is the Total Male Population of King City?
Total Male Population of King City is 6,414.
What is the Total Female Population of King City?
Total Female Population of King City is 7,057.
What is the Ratio of Males per 100 Females in King City?
There are 90.89 Males per 100 Females in King City.
What is the Ratio of Females per 100 Males in King City?
There are 110.02 Females per 100 Males in King City.
What is the Median Population Age in King City?
Median Population Age in King City is 27.1 Years.
What is the Average Family Size in King City
Average Family Size in King City is 4.1 People.
What is the Average Household Size in King City
Average Household Size in King City is 4.1 People.
How Large is the Labor Force in King City?
There are 5,050 People in the Labor Forcein in King City.
What is the Percentage of People in the Labor Force in King City?
55.3% of People are in the Labor Force in King City.
What is the Unemployment Rate in King City?
Unemployment Rate in King City is 5.0%.