Inverness, CA Map & Demographics
Inverness Map
Inverness Overview
$67,928
PER CAPITA INCOME
$149,348
AVG FAMILY INCOME
$75,091
AVG HOUSEHOLD INCOME
33.3%
WAGE / INCOME GAP [ % ]
66.7¢/ $1
WAGE / INCOME GAP [ $ ]
0.48
INEQUALITY / GINI INDEX
1,469
TOTAL POPULATION
632
MALE POPULATION
837
FEMALE POPULATION
75.51
MALES / 100 FEMALES
132.44
FEMALES / 100 MALES
63.5
MEDIAN AGE
2.7
AVG FAMILY SIZE
1.7
AVG HOUSEHOLD SIZE
744
LABOR FORCE [ PEOPLE ]
52.0%
PERCENT IN LABOR FORCE
12.7%
UNEMPLOYMENT RATE
Inverness Zip Codes
Inverness Area Codes
Income in Inverness
Income Overview in Inverness
Per Capita Income in Inverness is $67,928, while median incomes of families and households are $149,348 and $75,091 respectively.
| Characteristic | Number | Measure |
| Per Capita Income | 1,469 | $67,928 |
| Median Family Income | 320 | $149,348 |
| Mean Family Income | 320 | $176,181 |
| Median Household Income | 857 | $75,091 |
| Mean Household Income | 857 | $111,157 |
| Income Deficit | 320 | $0 |
| Wage / Income Gap (%) | 1,469 | 33.31% |
| Wage / Income Gap ($) | 1,469 | 66.69¢ per $1 |
| Gini / Inequality Index | 1,469 | 0.48 |
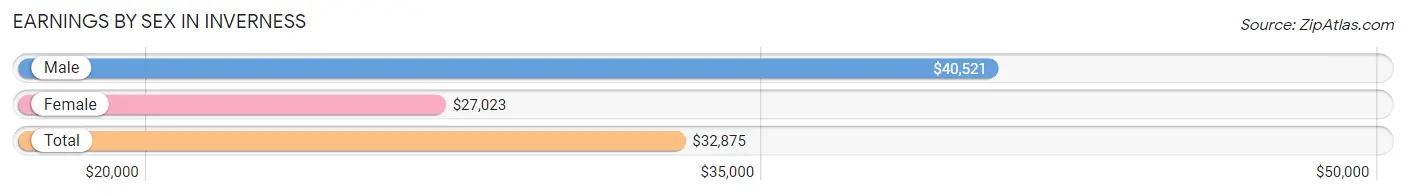
Earnings by Sex in Inverness
Average Earnings in Inverness are $32,875, $40,521 for men and $27,023 for women, a difference of 33.3%.
| Sex | Number | Average Earnings |
| Male | 397 (46.0%) | $40,521 |
| Female | 467 (54.0%) | $27,023 |
| Total | 864 (100.0%) | $32,875 |
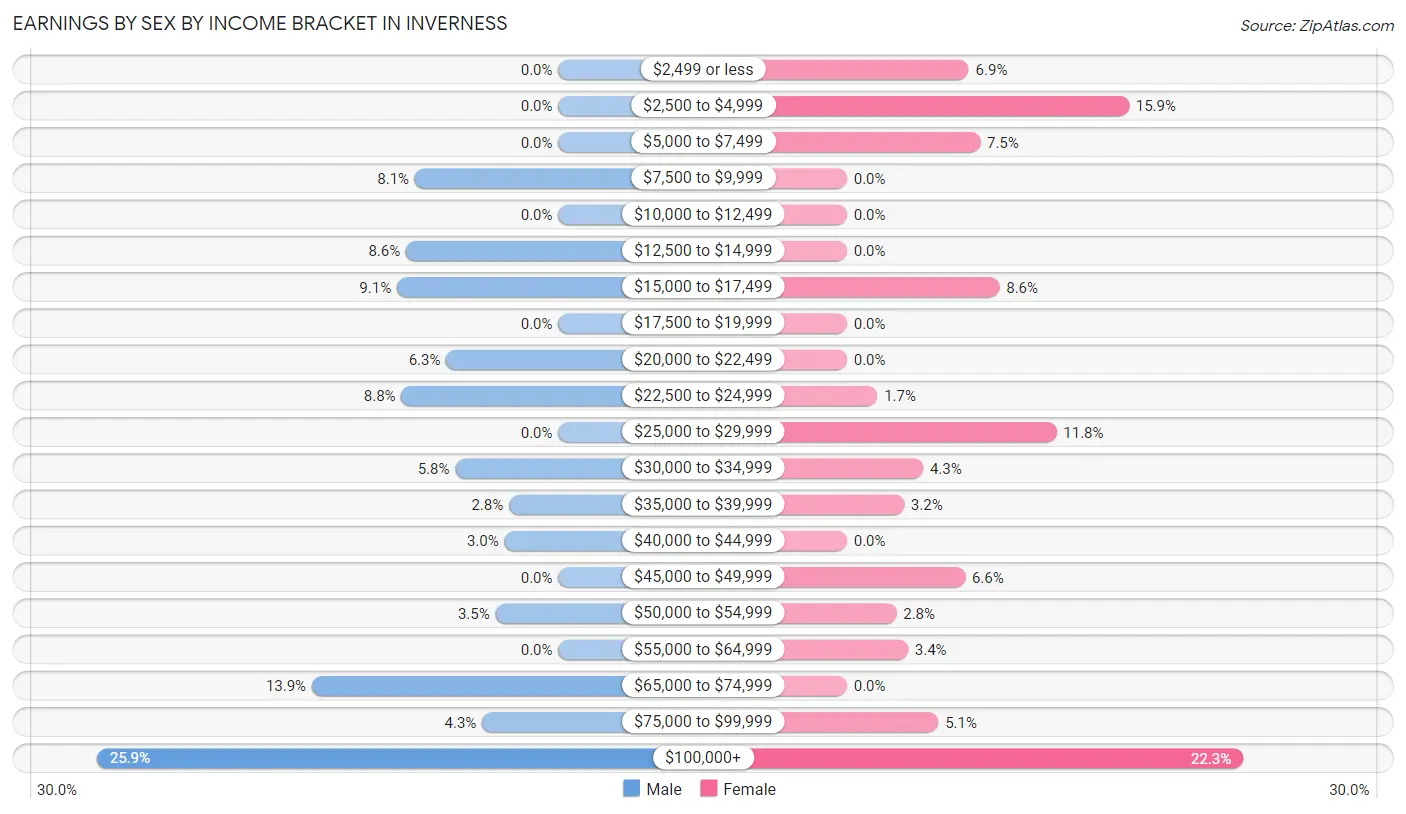
Earnings by Sex by Income Bracket in Inverness
The most common earnings brackets in Inverness are $100,000+ for men (103 | 25.9%) and $100,000+ for women (104 | 22.3%).
| Income | Male | Female |
| $2,499 or less | 0 (0.0%) | 32 (6.9%) |
| $2,500 to $4,999 | 0 (0.0%) | 74 (15.9%) |
| $5,000 to $7,499 | 0 (0.0%) | 35 (7.5%) |
| $7,500 to $9,999 | 32 (8.1%) | 0 (0.0%) |
| $10,000 to $12,499 | 0 (0.0%) | 0 (0.0%) |
| $12,500 to $14,999 | 34 (8.6%) | 0 (0.0%) |
| $15,000 to $17,499 | 36 (9.1%) | 40 (8.6%) |
| $17,500 to $19,999 | 0 (0.0%) | 0 (0.0%) |
| $20,000 to $22,499 | 25 (6.3%) | 0 (0.0%) |
| $22,500 to $24,999 | 35 (8.8%) | 8 (1.7%) |
| $25,000 to $29,999 | 0 (0.0%) | 55 (11.8%) |
| $30,000 to $34,999 | 23 (5.8%) | 20 (4.3%) |
| $35,000 to $39,999 | 11 (2.8%) | 15 (3.2%) |
| $40,000 to $44,999 | 12 (3.0%) | 0 (0.0%) |
| $45,000 to $49,999 | 0 (0.0%) | 31 (6.6%) |
| $50,000 to $54,999 | 14 (3.5%) | 13 (2.8%) |
| $55,000 to $64,999 | 0 (0.0%) | 16 (3.4%) |
| $65,000 to $74,999 | 55 (13.9%) | 0 (0.0%) |
| $75,000 to $99,999 | 17 (4.3%) | 24 (5.1%) |
| $100,000+ | 103 (25.9%) | 104 (22.3%) |
| Total | 397 (100.0%) | 467 (100.0%) |
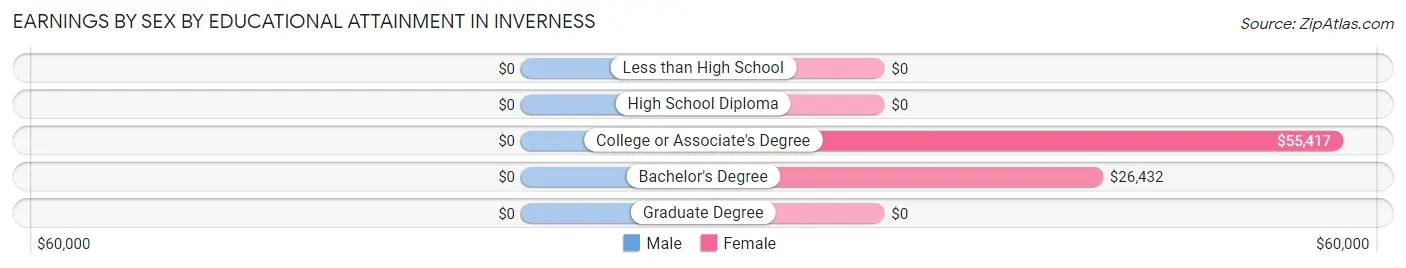
Earnings by Sex by Educational Attainment in Inverness
| Educational Attainment | Male Income | Female Income |
| Less than High School | - | - |
| High School Diploma | - | - |
| College or Associate's Degree | - | - |
| Bachelor's Degree | - | - |
| Graduate Degree | - | - |
| Total | $40,521 | $33,688 |
Family Income in Inverness
Family Income Brackets in Inverness
According to the Inverness family income data, there are 113 families falling into the $200,000+ income range, which is the most common income bracket and makes up 35.3% of all families.
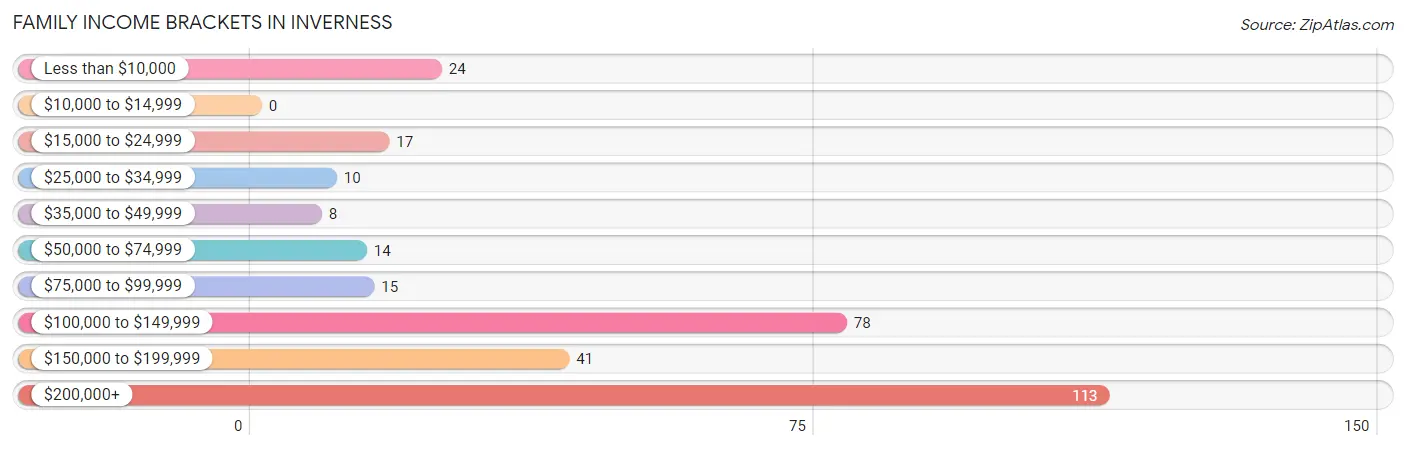
| Income Bracket | # Families | % Families |
| Less than $10,000 | 24 | 7.5% |
| $10,000 to $14,999 | 0 | 0.0% |
| $15,000 to $24,999 | 17 | 5.3% |
| $25,000 to $34,999 | 10 | 3.1% |
| $35,000 to $49,999 | 8 | 2.5% |
| $50,000 to $74,999 | 14 | 4.4% |
| $75,000 to $99,999 | 15 | 4.7% |
| $100,000 to $149,999 | 78 | 24.4% |
| $150,000 to $199,999 | 41 | 12.8% |
| $200,000+ | 113 | 35.3% |
Family Income by Famaliy Size in Inverness
4-person families (71 | 22.2%) account for the highest median family income in Inverness with $200,035 per family, while 2-person families (249 | 77.8%) have the highest median income of $66,992 per family member.
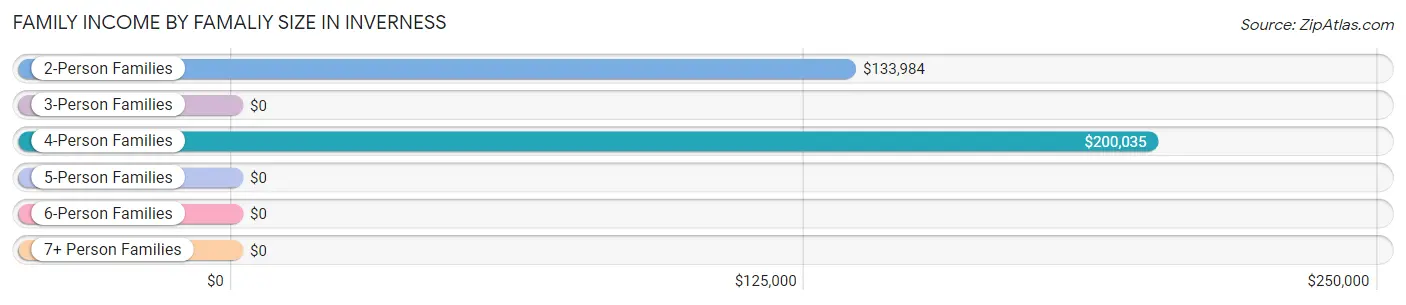
| Income Bracket | # Families | Median Income |
| 2-Person Families | 249 (77.8%) | $133,984 |
| 3-Person Families | 0 (0.0%) | $0 |
| 4-Person Families | 71 (22.2%) | $200,035 |
| 5-Person Families | 0 (0.0%) | $0 |
| 6-Person Families | 0 (0.0%) | $0 |
| 7+ Person Families | 0 (0.0%) | $0 |
| Total | 320 (100.0%) | $149,348 |
Family Income by Number of Earners in Inverness
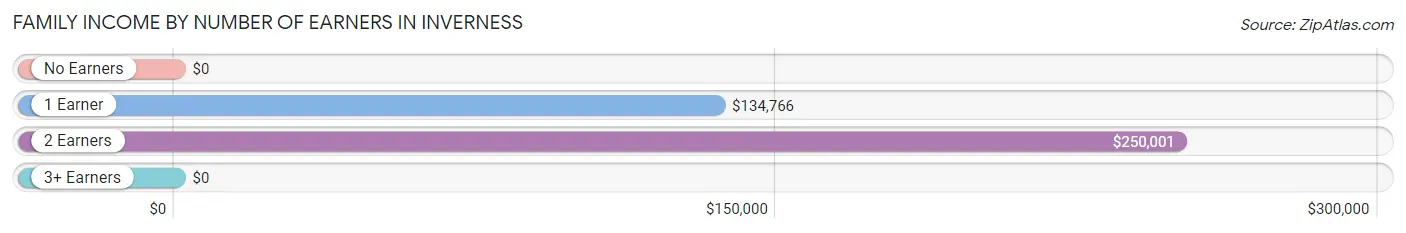
| Number of Earners | # Families | Median Income |
| No Earners | 106 (33.1%) | $0 |
| 1 Earner | 93 (29.1%) | $134,766 |
| 2 Earners | 95 (29.7%) | $250,001 |
| 3+ Earners | 26 (8.1%) | $0 |
| Total | 320 (100.0%) | $149,348 |
Household Income in Inverness
Household Income Brackets in Inverness
With 141 households falling in the category, the $50,000 to $74,999 income range is the most frequent in Inverness, accounting for 16.5% of all households. In contrast, only 22 households (2.6%) fall into the $25,000 to $34,999 income bracket, making it the least populous group.
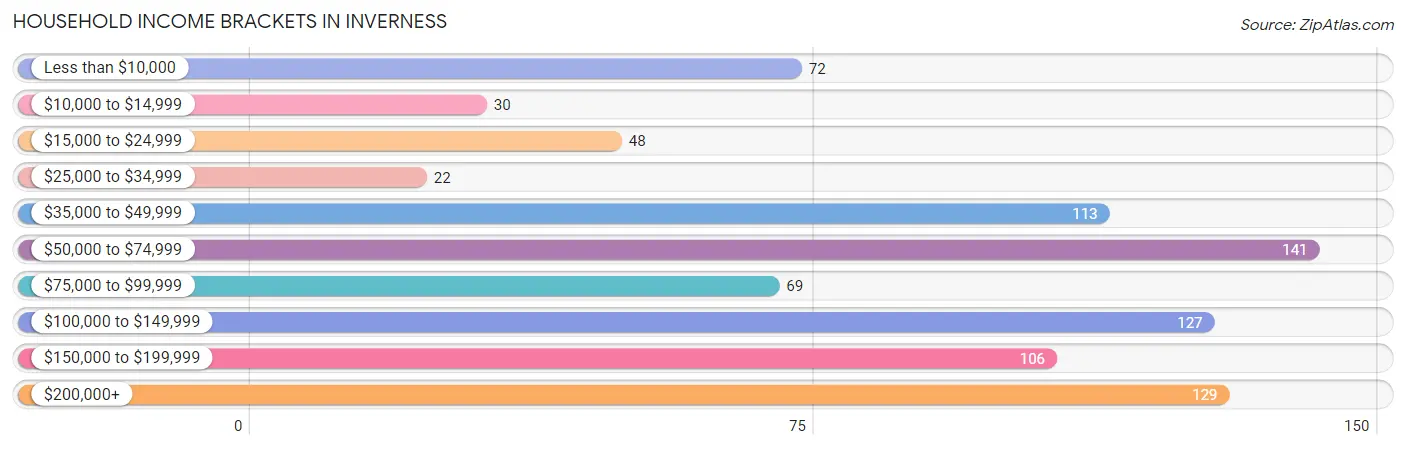
| Income Bracket | # Households | % Households |
| Less than $10,000 | 72 | 8.4% |
| $10,000 to $14,999 | 30 | 3.5% |
| $15,000 to $24,999 | 48 | 5.6% |
| $25,000 to $34,999 | 22 | 2.6% |
| $35,000 to $49,999 | 113 | 13.2% |
| $50,000 to $74,999 | 141 | 16.5% |
| $75,000 to $99,999 | 69 | 8.1% |
| $100,000 to $149,999 | 127 | 14.8% |
| $150,000 to $199,999 | 106 | 12.4% |
| $200,000+ | 129 | 15.1% |
Household Income by Householder Age in Inverness
The median household income in Inverness is $75,091, with the highest median household income of $75,109 found in the 65+ years age bracket for the primary householder. A total of 556 households (64.9%) fall into this category.
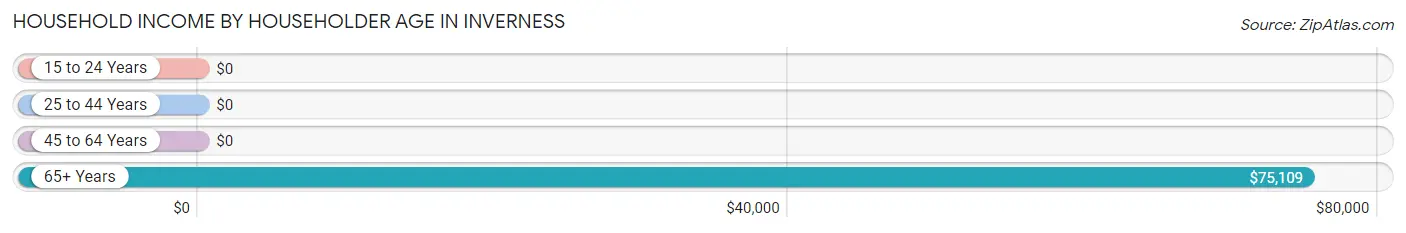
| Income Bracket | # Households | Median Income |
| 15 to 24 Years | 0 (0.0%) | $0 |
| 25 to 44 Years | 43 (5.0%) | $0 |
| 45 to 64 Years | 258 (30.1%) | $0 |
| 65+ Years | 556 (64.9%) | $75,109 |
| Total | 857 (100.0%) | $75,091 |
Poverty in Inverness
Income Below Poverty by Sex and Age in Inverness
With 12.3% poverty level for males and 11.0% for females among the residents of Inverness, 45 to 54 year old males and 45 to 54 year old females are the most vulnerable to poverty, with 48 males (36.4%) and 31 females (28.4%) in their respective age groups living below the poverty level.
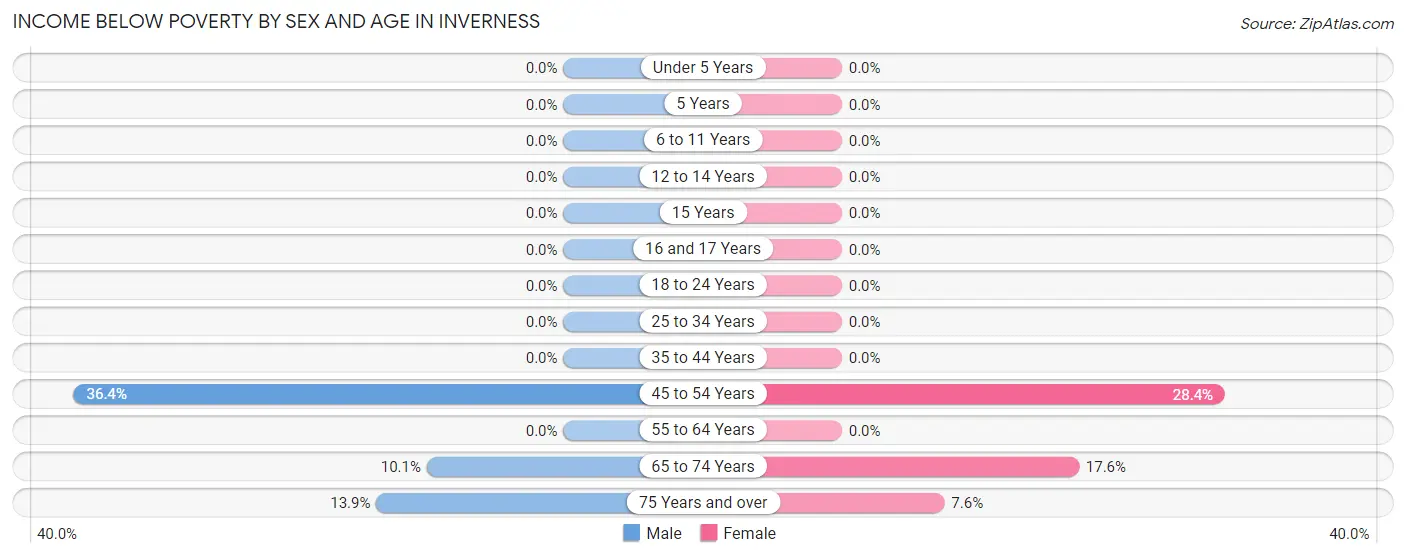
| Age Bracket | Male | Female |
| Under 5 Years | 0 (0.0%) | 0 (0.0%) |
| 5 Years | 0 (0.0%) | 0 (0.0%) |
| 6 to 11 Years | 0 (0.0%) | 0 (0.0%) |
| 12 to 14 Years | 0 (0.0%) | 0 (0.0%) |
| 15 Years | 0 (0.0%) | 0 (0.0%) |
| 16 and 17 Years | 0 (0.0%) | 0 (0.0%) |
| 18 to 24 Years | 0 (0.0%) | 0 (0.0%) |
| 25 to 34 Years | 0 (0.0%) | 0 (0.0%) |
| 35 to 44 Years | 0 (0.0%) | 0 (0.0%) |
| 45 to 54 Years | 48 (36.4%) | 31 (28.4%) |
| 55 to 64 Years | 0 (0.0%) | 0 (0.0%) |
| 65 to 74 Years | 15 (10.1%) | 44 (17.6%) |
| 75 Years and over | 15 (13.9%) | 17 (7.6%) |
| Total | 78 (12.3%) | 92 (11.0%) |
Income Above Poverty by Sex and Age in Inverness
According to the poverty statistics in Inverness, males aged under 5 years and females aged 6 to 11 years are the age groups that are most secure financially, with 100.0% of males and 100.0% of females in these age groups living above the poverty line.
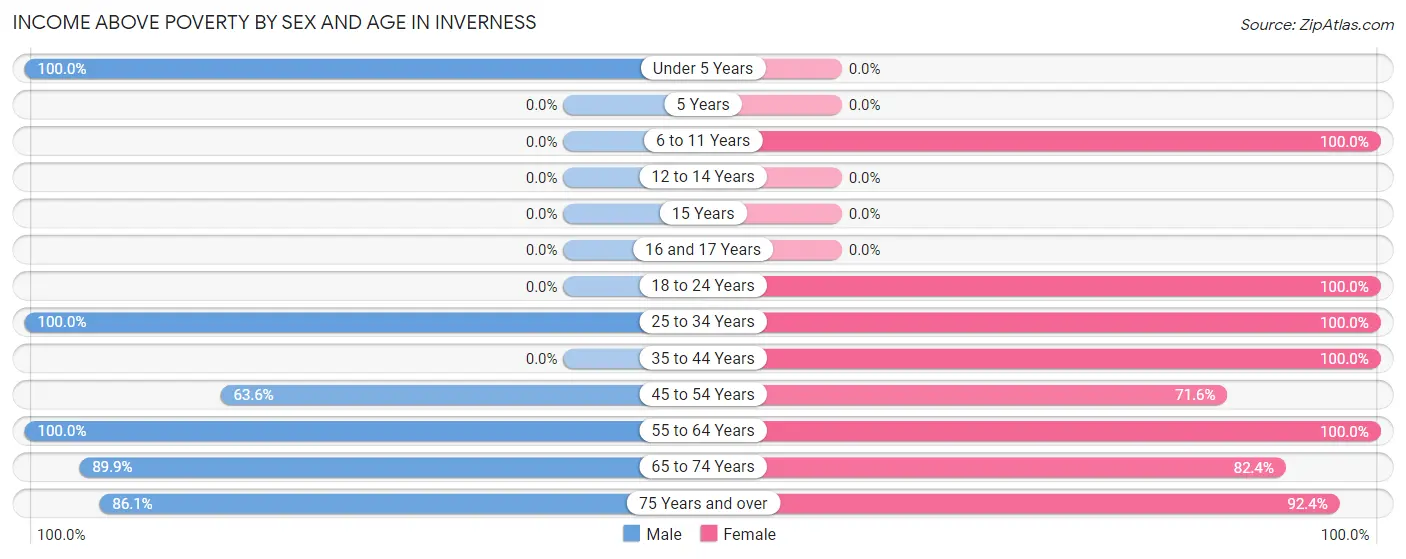
| Age Bracket | Male | Female |
| Under 5 Years | 18 (100.0%) | 0 (0.0%) |
| 5 Years | 0 (0.0%) | 0 (0.0%) |
| 6 to 11 Years | 0 (0.0%) | 21 (100.0%) |
| 12 to 14 Years | 0 (0.0%) | 0 (0.0%) |
| 15 Years | 0 (0.0%) | 0 (0.0%) |
| 16 and 17 Years | 0 (0.0%) | 0 (0.0%) |
| 18 to 24 Years | 0 (0.0%) | 40 (100.0%) |
| 25 to 34 Years | 104 (100.0%) | 12 (100.0%) |
| 35 to 44 Years | 0 (0.0%) | 67 (100.0%) |
| 45 to 54 Years | 84 (63.6%) | 78 (71.6%) |
| 55 to 64 Years | 122 (100.0%) | 115 (100.0%) |
| 65 to 74 Years | 133 (89.9%) | 206 (82.4%) |
| 75 Years and over | 93 (86.1%) | 206 (92.4%) |
| Total | 554 (87.7%) | 745 (89.0%) |
Income Below Poverty Among Married-Couple Families in Inverness
The poverty statistics for married-couple families in Inverness show that 9.6% or 24 of the total 251 families live below the poverty line. Families with no children have the highest poverty rate of 10.5%, comprising of 24 families. On the other hand, families with 1 or 2 children have the lowest poverty rate of 0.0%, which includes 0 families.
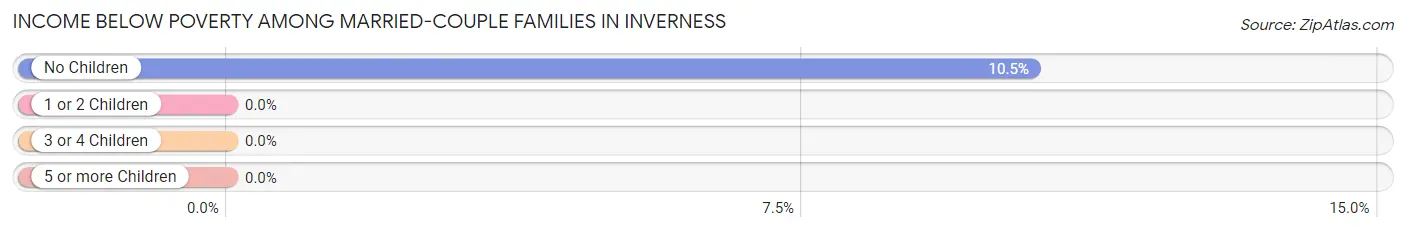
| Children | Above Poverty | Below Poverty |
| No Children | 205 (89.5%) | 24 (10.5%) |
| 1 or 2 Children | 22 (100.0%) | 0 (0.0%) |
| 3 or 4 Children | 0 (0.0%) | 0 (0.0%) |
| 5 or more Children | 0 (0.0%) | 0 (0.0%) |
| Total | 227 (90.4%) | 24 (9.6%) |
Income Below Poverty Among Single-Parent Households in Inverness
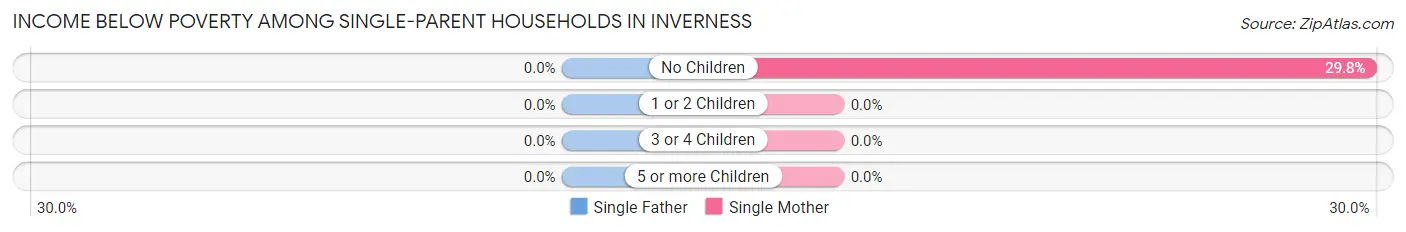
| Children | Single Father | Single Mother |
| No Children | 0 (0.0%) | 17 (29.8%) |
| 1 or 2 Children | 0 (0.0%) | 0 (0.0%) |
| 3 or 4 Children | 0 (0.0%) | 0 (0.0%) |
| 5 or more Children | 0 (0.0%) | 0 (0.0%) |
| Total | 0 (0.0%) | 17 (29.8%) |
Income Below Poverty Among Married-Couple vs Single-Parent Households in Inverness
The poverty data for Inverness shows that 24 of the married-couple family households (9.6%) and 17 of the single-parent households (24.6%) are living below the poverty level. Within the married-couple family households, those with no children have the highest poverty rate, with 24 households (10.5%) falling below the poverty line. Among the single-parent households, those with no children have the highest poverty rate, with 17 household (29.8%) living below poverty.
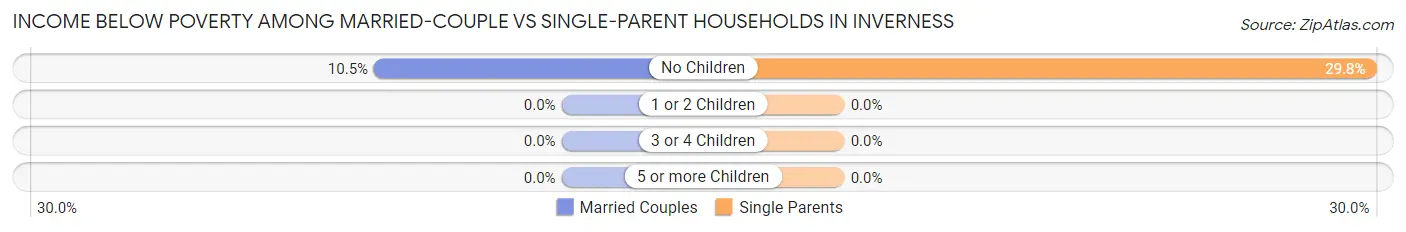
| Children | Married-Couple Families | Single-Parent Households |
| No Children | 24 (10.5%) | 17 (29.8%) |
| 1 or 2 Children | 0 (0.0%) | 0 (0.0%) |
| 3 or 4 Children | 0 (0.0%) | 0 (0.0%) |
| 5 or more Children | 0 (0.0%) | 0 (0.0%) |
| Total | 24 (9.6%) | 17 (24.6%) |
Race in Inverness
The most populous races in Inverness are White / Caucasian (1,342 | 91.3%), Two or more Races (81 | 5.5%), and Hispanic or Latino (63 | 4.3%).
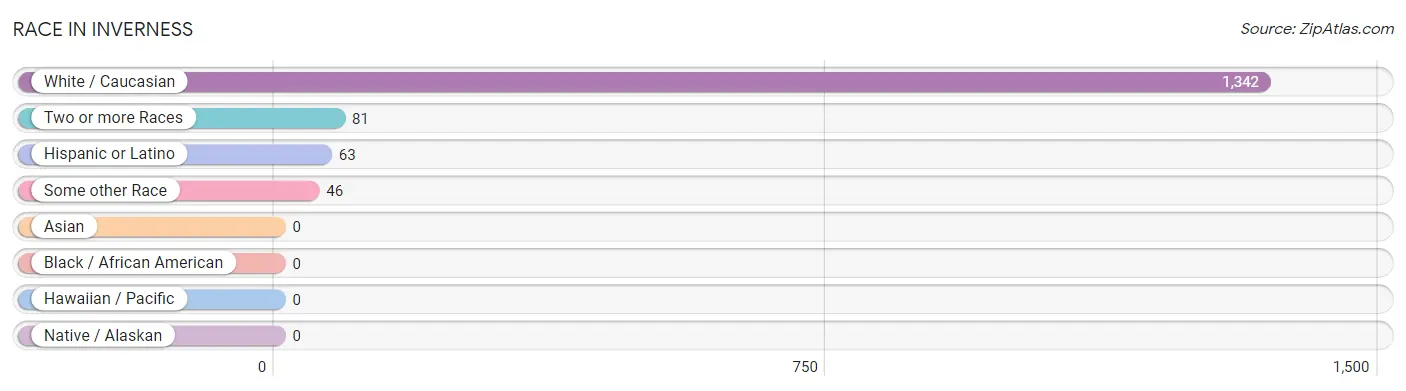
| Race | # Population | % Population |
| Asian | 0 | 0.0% |
| Black / African American | 0 | 0.0% |
| Hawaiian / Pacific | 0 | 0.0% |
| Hispanic or Latino | 63 | 4.3% |
| Native / Alaskan | 0 | 0.0% |
| White / Caucasian | 1,342 | 91.3% |
| Two or more Races | 81 | 5.5% |
| Some other Race | 46 | 3.1% |
| Total | 1,469 | 100.0% |
Ancestry in Inverness
The most populous ancestries reported in Inverness are German (358 | 24.4%), English (295 | 20.1%), Russian (167 | 11.4%), Irish (160 | 10.9%), and Scottish (145 | 9.9%), together accounting for 76.6% of all Inverness residents.
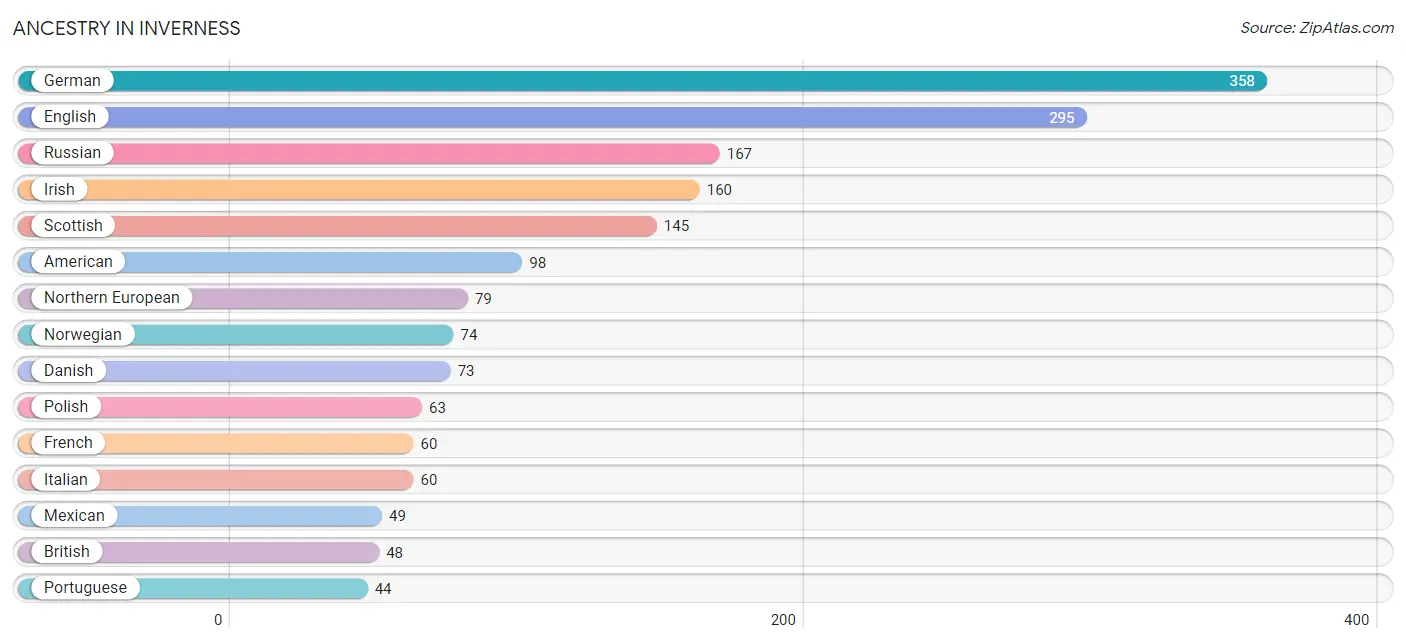
| Ancestry | # Population | % Population |
| American | 98 | 6.7% |
| Blackfeet | 9 | 0.6% |
| British | 48 | 3.3% |
| Central American | 14 | 0.9% |
| Czech | 17 | 1.2% |
| Danish | 73 | 5.0% |
| Eastern European | 25 | 1.7% |
| English | 295 | 20.1% |
| European | 36 | 2.5% |
| French | 60 | 4.1% |
| German | 358 | 24.4% |
| Honduran | 14 | 0.9% |
| Indian (Asian) | 22 | 1.5% |
| Irish | 160 | 10.9% |
| Italian | 60 | 4.1% |
| Mexican | 49 | 3.3% |
| Northern European | 79 | 5.4% |
| Norwegian | 74 | 5.0% |
| Polish | 63 | 4.3% |
| Portuguese | 44 | 3.0% |
| Russian | 167 | 11.4% |
| Scotch-Irish | 31 | 2.1% |
| Scottish | 145 | 9.9% |
| Serbian | 37 | 2.5% |
| Swedish | 13 | 0.9% |
| Welsh | 30 | 2.0% | View All 26 Rows |
Immigrants in Inverness
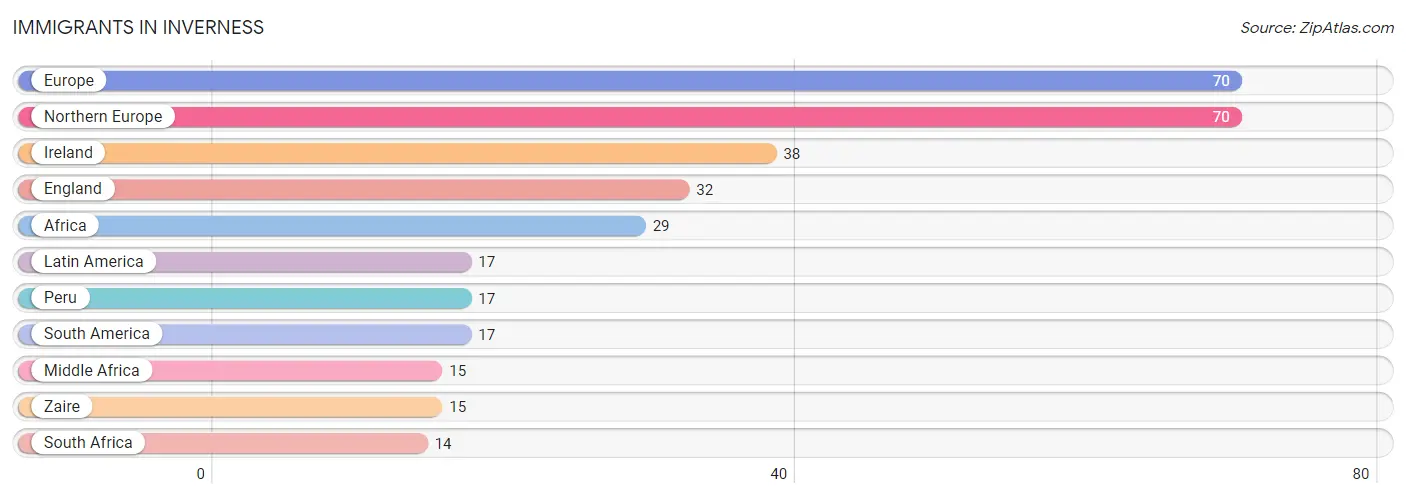
The most numerous immigrant groups reported in Inverness came from Europe (70 | 4.8%), Northern Europe (70 | 4.8%), Ireland (38 | 2.6%), England (32 | 2.2%), and Africa (29 | 2.0%), together accounting for 16.3% of all Inverness residents.
| Immigration Origin | # Population | % Population |
| Africa | 29 | 2.0% |
| England | 32 | 2.2% |
| Europe | 70 | 4.8% |
| Ireland | 38 | 2.6% |
| Latin America | 17 | 1.2% |
| Middle Africa | 15 | 1.0% |
| Northern Europe | 70 | 4.8% |
| Peru | 17 | 1.2% |
| South Africa | 14 | 0.9% |
| South America | 17 | 1.2% |
| Zaire | 15 | 1.0% | View All 11 Rows |
Sex and Age in Inverness
Sex and Age in Inverness
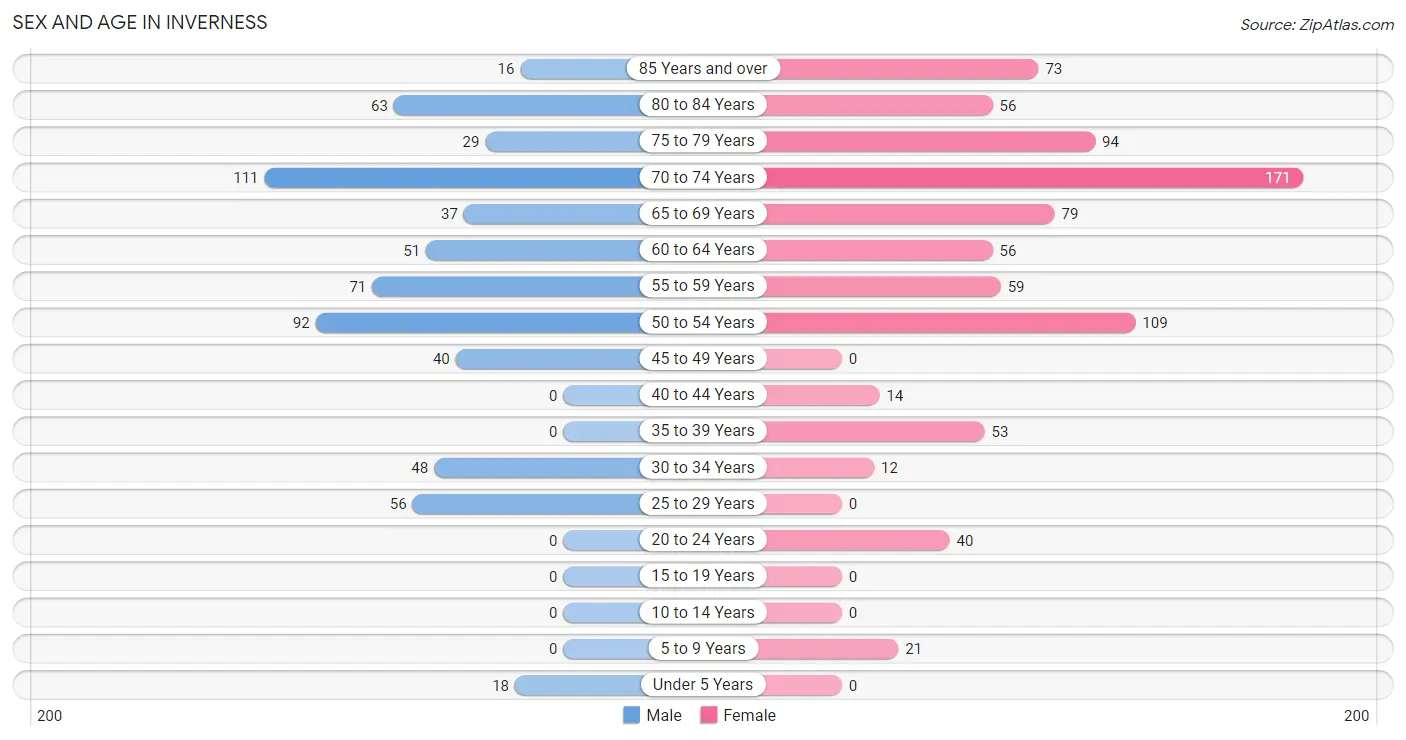
The most populous age groups in Inverness are 70 to 74 Years (111 | 17.6%) for men and 70 to 74 Years (171 | 20.4%) for women.
| Age Bracket | Male | Female |
| Under 5 Years | 18 (2.9%) | 0 (0.0%) |
| 5 to 9 Years | 0 (0.0%) | 21 (2.5%) |
| 10 to 14 Years | 0 (0.0%) | 0 (0.0%) |
| 15 to 19 Years | 0 (0.0%) | 0 (0.0%) |
| 20 to 24 Years | 0 (0.0%) | 40 (4.8%) |
| 25 to 29 Years | 56 (8.9%) | 0 (0.0%) |
| 30 to 34 Years | 48 (7.6%) | 12 (1.4%) |
| 35 to 39 Years | 0 (0.0%) | 53 (6.3%) |
| 40 to 44 Years | 0 (0.0%) | 14 (1.7%) |
| 45 to 49 Years | 40 (6.3%) | 0 (0.0%) |
| 50 to 54 Years | 92 (14.6%) | 109 (13.0%) |
| 55 to 59 Years | 71 (11.2%) | 59 (7.0%) |
| 60 to 64 Years | 51 (8.1%) | 56 (6.7%) |
| 65 to 69 Years | 37 (5.9%) | 79 (9.4%) |
| 70 to 74 Years | 111 (17.6%) | 171 (20.4%) |
| 75 to 79 Years | 29 (4.6%) | 94 (11.2%) |
| 80 to 84 Years | 63 (10.0%) | 56 (6.7%) |
| 85 Years and over | 16 (2.5%) | 73 (8.7%) |
| Total | 632 (100.0%) | 837 (100.0%) |
Families and Households in Inverness
Median Family Size in Inverness
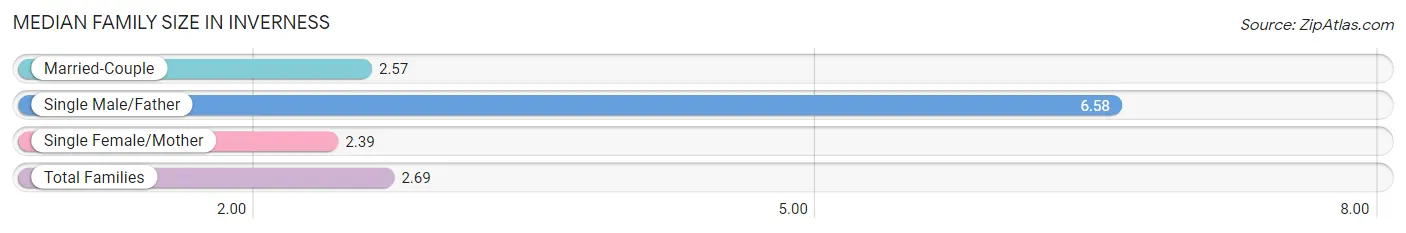
The median family size in Inverness is 2.69 persons per family, with single male/father families (12 | 3.7%) accounting for the largest median family size of 6.58 persons per family. On the other hand, single female/mother families (57 | 17.8%) represent the smallest median family size with 2.39 persons per family.
| Family Type | # Families | Family Size |
| Married-Couple | 251 (78.4%) | 2.57 |
| Single Male/Father | 12 (3.7%) | 6.58 |
| Single Female/Mother | 57 (17.8%) | 2.39 |
| Total Families | 320 (100.0%) | 2.69 |
Median Household Size in Inverness
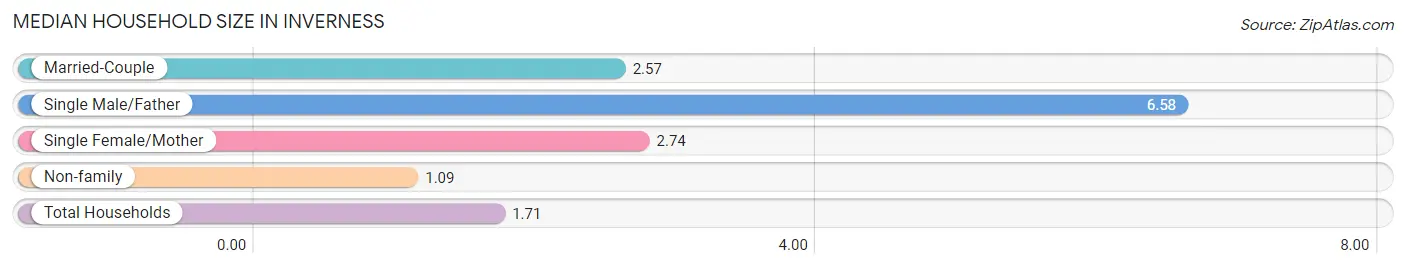
The median household size in Inverness is 1.71 persons per household, with single male/father households (12 | 1.4%) accounting for the largest median household size of 6.58 persons per household. non-family households (537 | 62.7%) represent the smallest median household size with 1.09 persons per household.
| Household Type | # Households | Household Size |
| Married-Couple | 251 (29.3%) | 2.57 |
| Single Male/Father | 12 (1.4%) | 6.58 |
| Single Female/Mother | 57 (6.7%) | 2.74 |
| Non-family | 537 (62.7%) | 1.09 |
| Total Households | 857 (100.0%) | 1.71 |
Household Size by Marriage Status in Inverness
Out of a total of 857 households in Inverness, 320 (37.3%) are family households, while 537 (62.7%) are nonfamily households. The most numerous type of family households are 2-person households, comprising 232, and the most common type of nonfamily households are 1-person households, comprising 489.
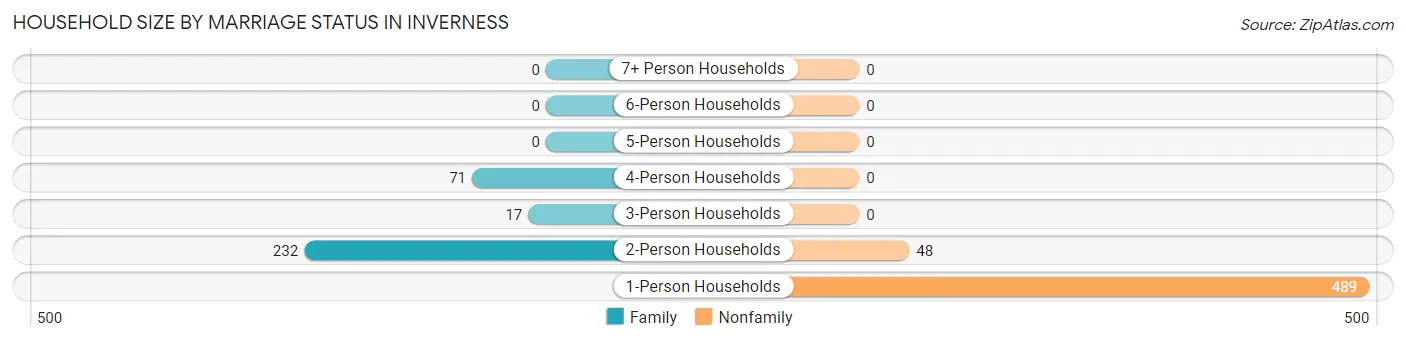
| Household Size | Family Households | Nonfamily Households |
| 1-Person Households | - | 489 (57.1%) |
| 2-Person Households | 232 (27.1%) | 48 (5.6%) |
| 3-Person Households | 17 (2.0%) | 0 (0.0%) |
| 4-Person Households | 71 (8.3%) | 0 (0.0%) |
| 5-Person Households | 0 (0.0%) | 0 (0.0%) |
| 6-Person Households | 0 (0.0%) | 0 (0.0%) |
| 7+ Person Households | 0 (0.0%) | 0 (0.0%) |
| Total | 320 (37.3%) | 537 (62.7%) |
Female Fertility in Inverness
Fertility by Age in Inverness
Average fertility rate in Inverness is 268.0 births per 1,000 women. Women in the age bracket of 35 to 50 years have the highest fertility rate with 422.0 births per 1,000 women. Women in the age bracket of 35 to 50 years acount for 100.0% of all women with births.
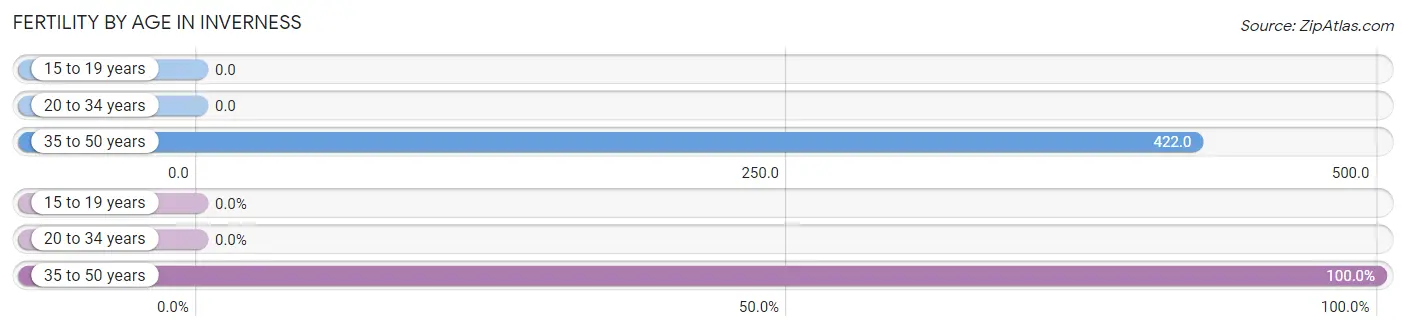
| Age Bracket | Women with Births | Births / 1,000 Women |
| 15 to 19 years | 0 (0.0%) | 0.0 |
| 20 to 34 years | 0 (0.0%) | 0.0 |
| 35 to 50 years | 38 (100.0%) | 422.0 |
| Total | 38 (100.0%) | 268.0 |
Fertility by Age by Marriage Status in Inverness
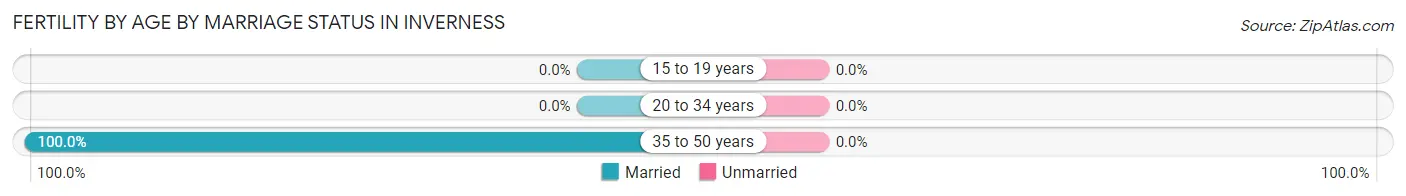
| Age Bracket | Married | Unmarried |
| 15 to 19 years | 0 (0.0%) | 0 (0.0%) |
| 20 to 34 years | 0 (0.0%) | 0 (0.0%) |
| 35 to 50 years | 38 (100.0%) | 0 (0.0%) |
| Total | 38 (100.0%) | 0 (0.0%) |
Fertility by Education in Inverness
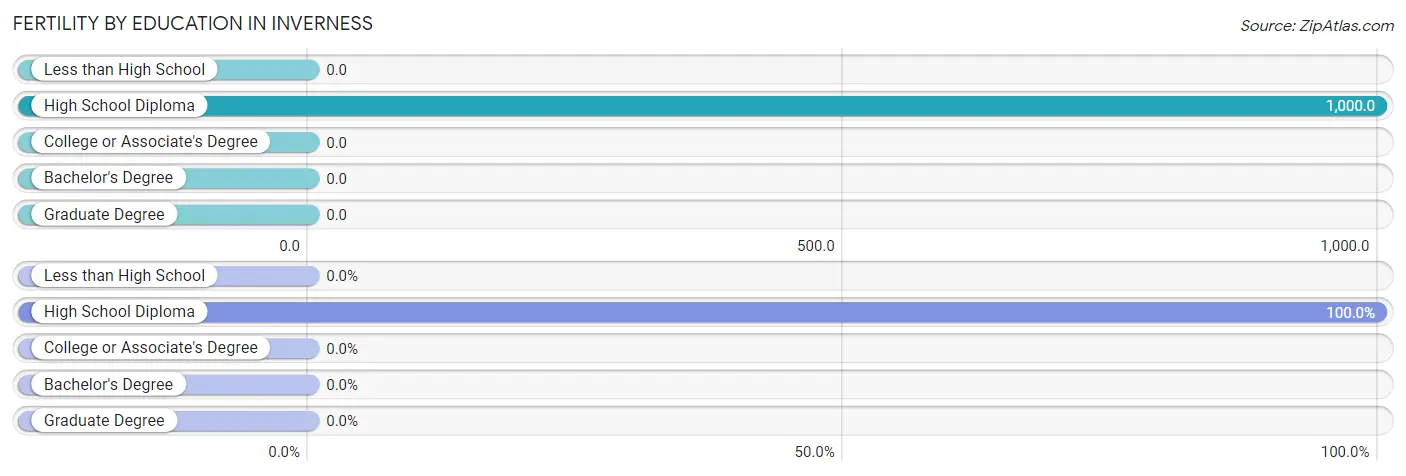
| Educational Attainment | Women with Births | Births / 1,000 Women |
| Less than High School | 0 (0.0%) | 0.0 |
| High School Diploma | 38 (100.0%) | 1,000.0 |
| College or Associate's Degree | 0 (0.0%) | 0.0 |
| Bachelor's Degree | 0 (0.0%) | 0.0 |
| Graduate Degree | 0 (0.0%) | 0.0 |
| Total | 38 (100.0%) | 268.0 |
Fertility by Education by Marriage Status in Inverness
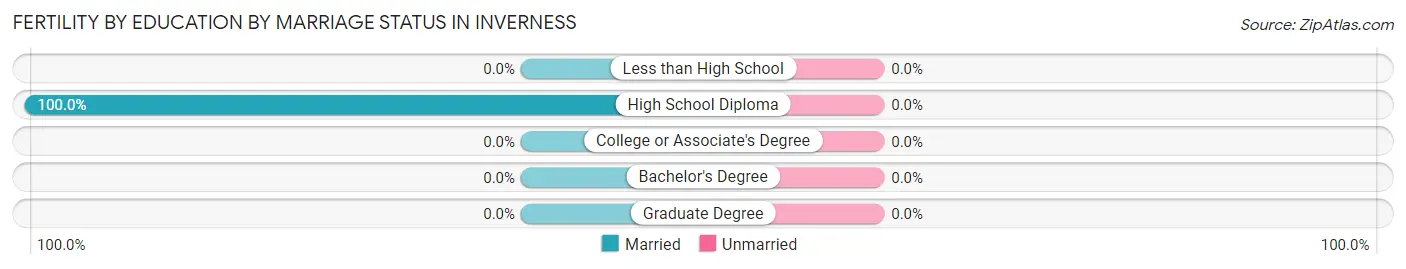
| Educational Attainment | Married | Unmarried |
| Less than High School | 0 (0.0%) | 0 (0.0%) |
| High School Diploma | 38 (100.0%) | 0 (0.0%) |
| College or Associate's Degree | 0 (0.0%) | 0 (0.0%) |
| Bachelor's Degree | 0 (0.0%) | 0 (0.0%) |
| Graduate Degree | 0 (0.0%) | 0 (0.0%) |
| Total | 38 (100.0%) | 0 (0.0%) |
Employment Characteristics in Inverness
Employment by Class of Employer in Inverness
Among the 649 employed individuals in Inverness, private company employees (235 | 36.2%), self-employed (not incorporated) (207 | 31.9%), and local government employees (68 | 10.5%) make up the most common classes of employment.
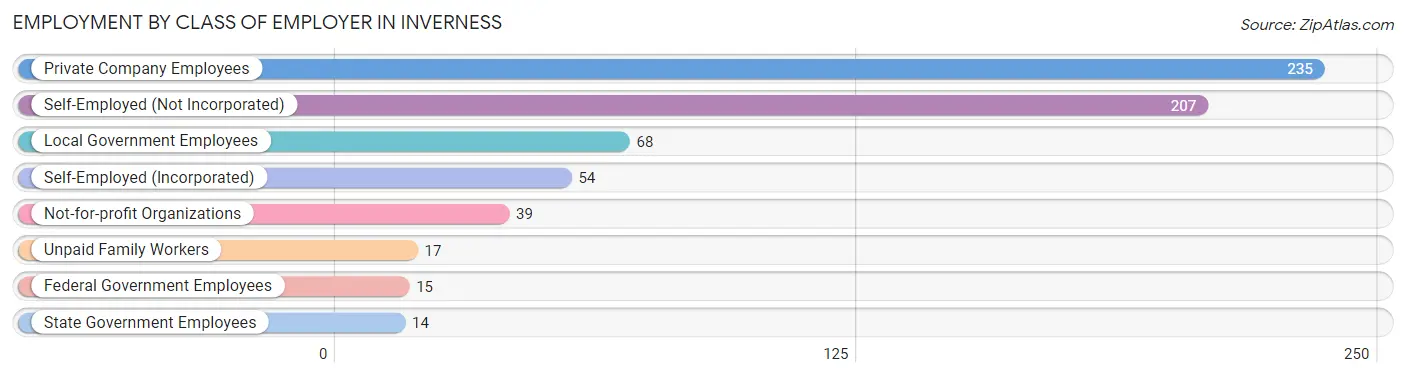
| Employer Class | # Employees | % Employees |
| Private Company Employees | 235 | 36.2% |
| Self-Employed (Incorporated) | 54 | 8.3% |
| Self-Employed (Not Incorporated) | 207 | 31.9% |
| Not-for-profit Organizations | 39 | 6.0% |
| Local Government Employees | 68 | 10.5% |
| State Government Employees | 14 | 2.2% |
| Federal Government Employees | 15 | 2.3% |
| Unpaid Family Workers | 17 | 2.6% |
| Total | 649 | 100.0% |
Employment Status by Age in Inverness
According to the labor force statistics for Inverness, out of the total population over 16 years of age (1,430), 52.0% or 744 individuals are in the labor force, with 12.7% or 94 of them unemployed. The age group with the highest labor force participation rate is 20 to 24 years, with 100.0% or 40 individuals in the labor force. Within the labor force, the 65 to 74 years age range has the highest percentage of unemployed individuals, with 33.5% or 54 of them being unemployed.
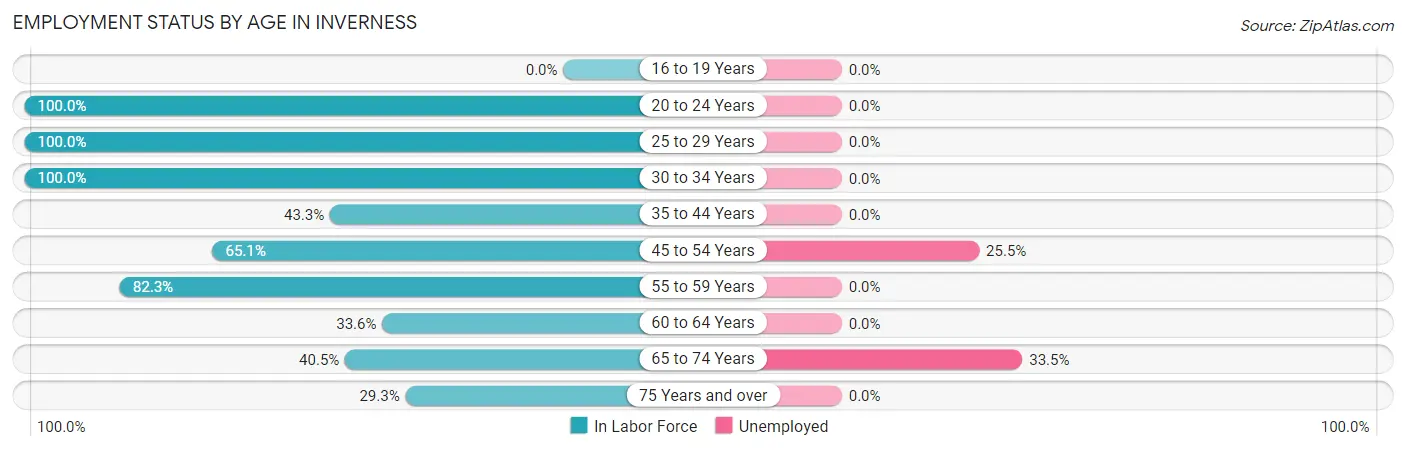
| Age Bracket | In Labor Force | Unemployed |
| 16 to 19 Years | 0 (0.0%) | 0 (0.0%) |
| 20 to 24 Years | 40 (100.0%) | 0 (0.0%) |
| 25 to 29 Years | 56 (100.0%) | 0 (0.0%) |
| 30 to 34 Years | 60 (100.0%) | 0 (0.0%) |
| 35 to 44 Years | 29 (43.3%) | 0 (0.0%) |
| 45 to 54 Years | 157 (65.1%) | 40 (25.5%) |
| 55 to 59 Years | 107 (82.3%) | 0 (0.0%) |
| 60 to 64 Years | 36 (33.6%) | 0 (0.0%) |
| 65 to 74 Years | 161 (40.5%) | 54 (33.5%) |
| 75 Years and over | 97 (29.3%) | 0 (0.0%) |
| Total | 744 (52.0%) | 94 (12.7%) |
Employment Status by Educational Attainment in Inverness
According to labor force statistics for Inverness, 67.3% of individuals (445) out of the total population between 25 and 64 years of age (661) are in the labor force, with 9.0% or 40 of them being unemployed. The group with the highest labor force participation rate are those with the educational attainment of college / associate degree, with 73.9% or 136 individuals in the labor force. Within the labor force, individuals with less than high school education have the highest percentage of unemployment, with 100.0% or 18 of them being unemployed.
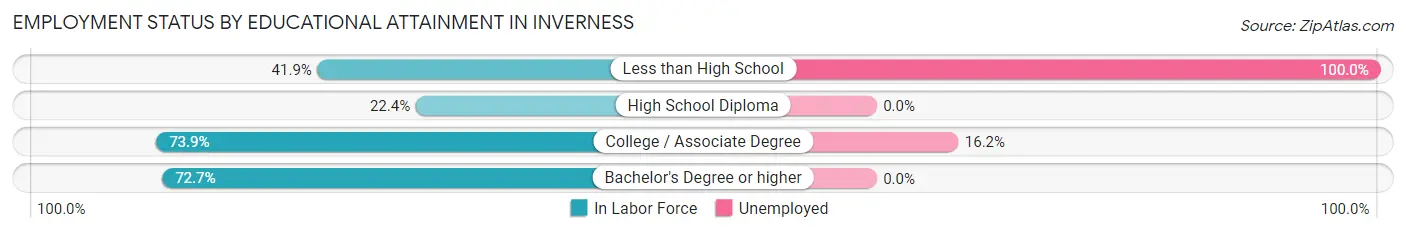
| Educational Attainment | In Labor Force | Unemployed |
| Less than High School | 18 (41.9%) | 43 (100.0%) |
| High School Diploma | 11 (22.4%) | 0 (0.0%) |
| College / Associate Degree | 136 (73.9%) | 30 (16.2%) |
| Bachelor's Degree or higher | 280 (72.7%) | 0 (0.0%) |
| Total | 445 (67.3%) | 59 (9.0%) |
Employment Occupations by Sex in Inverness
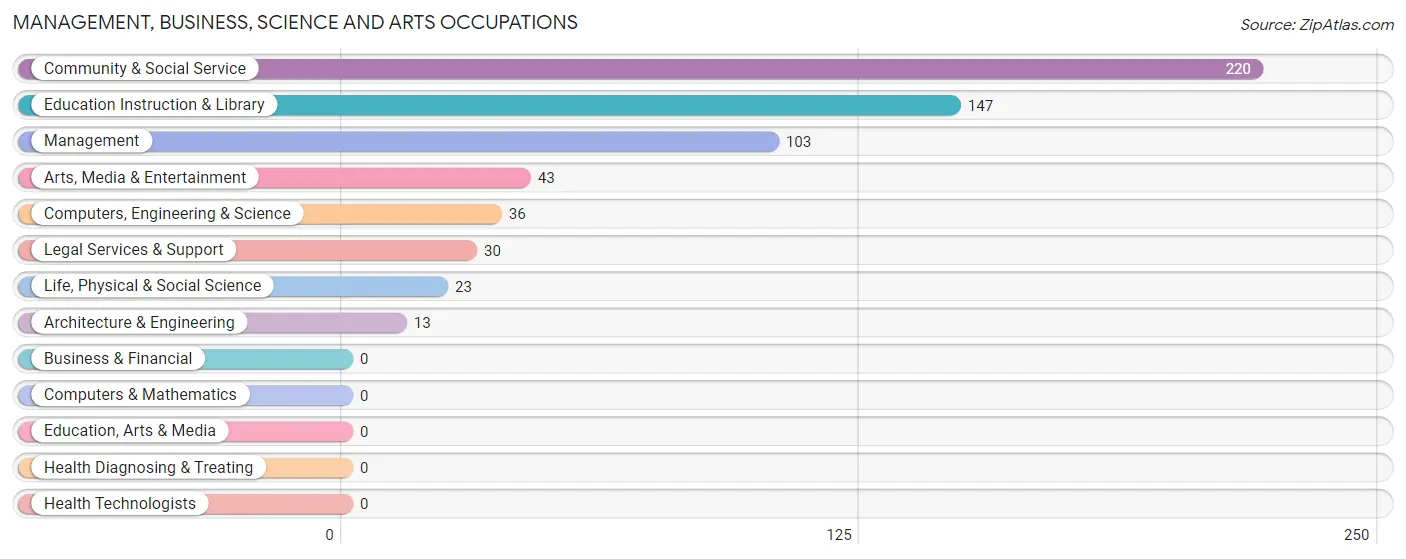
Management, Business, Science and Arts Occupations
The most common Management, Business, Science and Arts occupations in Inverness are Community & Social Service (220 | 33.9%), Education Instruction & Library (147 | 22.7%), Management (103 | 15.9%), Arts, Media & Entertainment (43 | 6.6%), and Computers, Engineering & Science (36 | 5.6%).
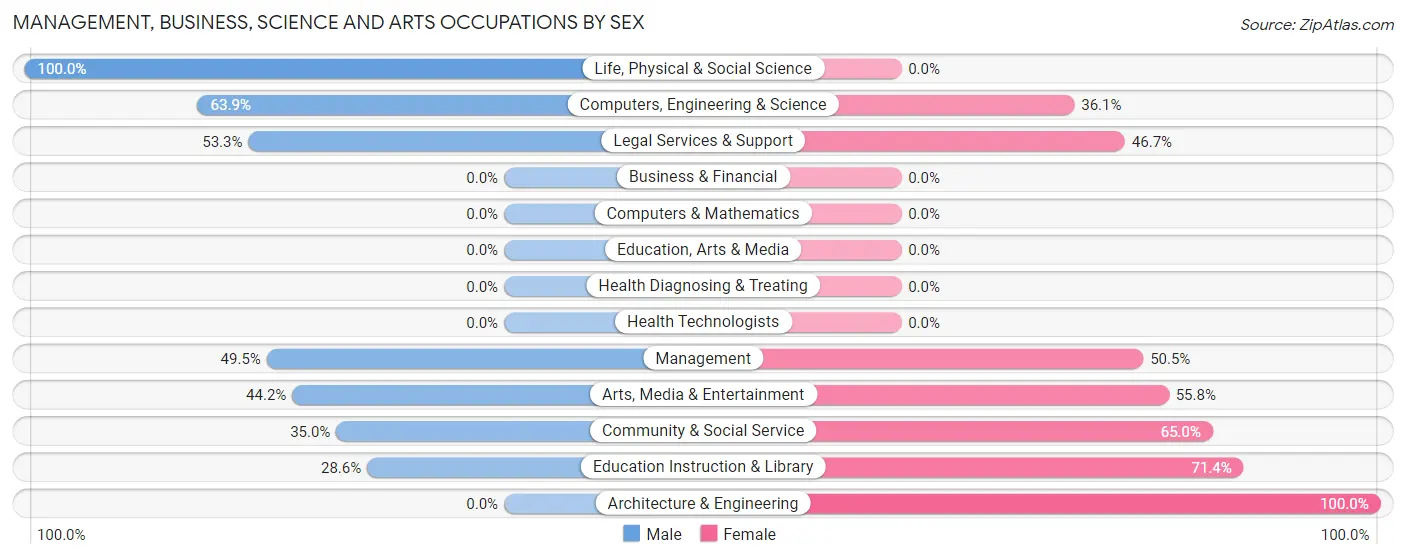
Management, Business, Science and Arts Occupations by Sex
Within the Management, Business, Science and Arts occupations in Inverness, the most male-oriented occupations are Life, Physical & Social Science (100.0%), Computers, Engineering & Science (63.9%), and Legal Services & Support (53.3%), while the most female-oriented occupations are Architecture & Engineering (100.0%), Education Instruction & Library (71.4%), and Community & Social Service (65.0%).
| Occupation | Male | Female |
| Management | 51 (49.5%) | 52 (50.5%) |
| Business & Financial | 0 (0.0%) | 0 (0.0%) |
| Computers, Engineering & Science | 23 (63.9%) | 13 (36.1%) |
| Computers & Mathematics | 0 (0.0%) | 0 (0.0%) |
| Architecture & Engineering | 0 (0.0%) | 13 (100.0%) |
| Life, Physical & Social Science | 23 (100.0%) | 0 (0.0%) |
| Community & Social Service | 77 (35.0%) | 143 (65.0%) |
| Education, Arts & Media | 0 (0.0%) | 0 (0.0%) |
| Legal Services & Support | 16 (53.3%) | 14 (46.7%) |
| Education Instruction & Library | 42 (28.6%) | 105 (71.4%) |
| Arts, Media & Entertainment | 19 (44.2%) | 24 (55.8%) |
| Health Diagnosing & Treating | 0 (0.0%) | 0 (0.0%) |
| Health Technologists | 0 (0.0%) | 0 (0.0%) |
| Total (Category) | 151 (42.1%) | 208 (57.9%) |
| Total (Overall) | 288 (44.4%) | 361 (55.6%) |
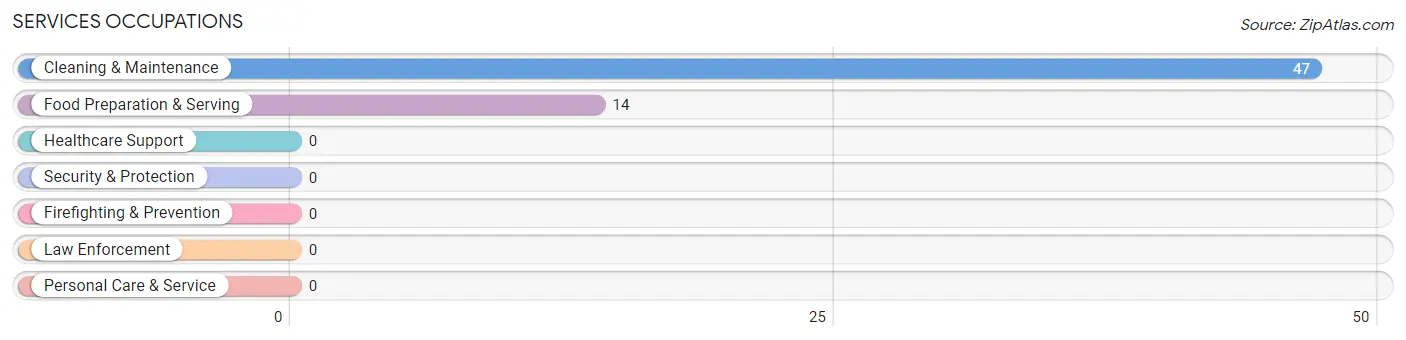
Services Occupations
The most common Services occupations in Inverness are Cleaning & Maintenance (47 | 7.2%), and Food Preparation & Serving (14 | 2.2%).
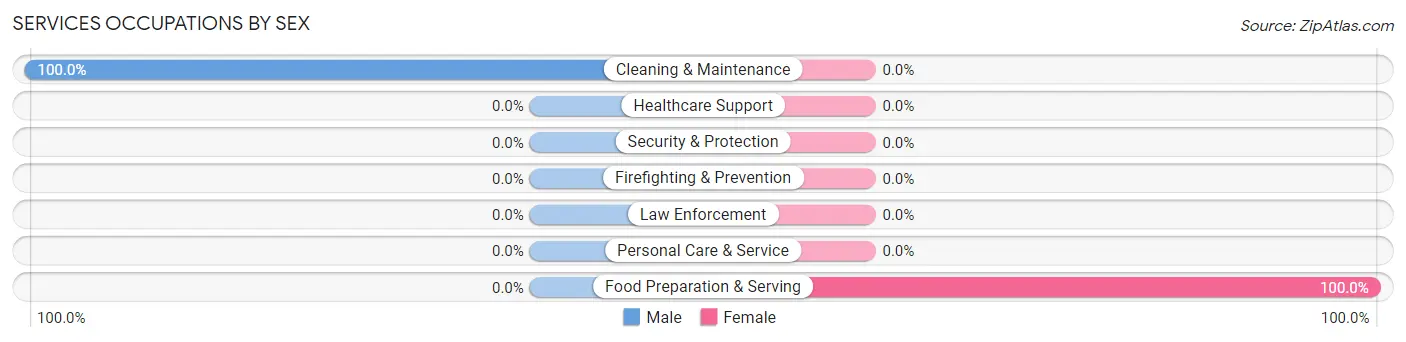
Services Occupations by Sex
| Occupation | Male | Female |
| Healthcare Support | 0 (0.0%) | 0 (0.0%) |
| Security & Protection | 0 (0.0%) | 0 (0.0%) |
| Firefighting & Prevention | 0 (0.0%) | 0 (0.0%) |
| Law Enforcement | 0 (0.0%) | 0 (0.0%) |
| Food Preparation & Serving | 0 (0.0%) | 14 (100.0%) |
| Cleaning & Maintenance | 47 (100.0%) | 0 (0.0%) |
| Personal Care & Service | 0 (0.0%) | 0 (0.0%) |
| Total (Category) | 47 (77.0%) | 14 (23.0%) |
| Total (Overall) | 288 (44.4%) | 361 (55.6%) |
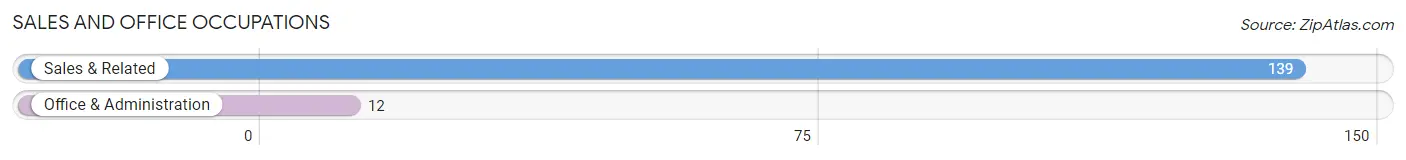
Sales and Office Occupations
The most common Sales and Office occupations in Inverness are Sales & Related (139 | 21.4%), and Office & Administration (12 | 1.8%).
Sales and Office Occupations by Sex
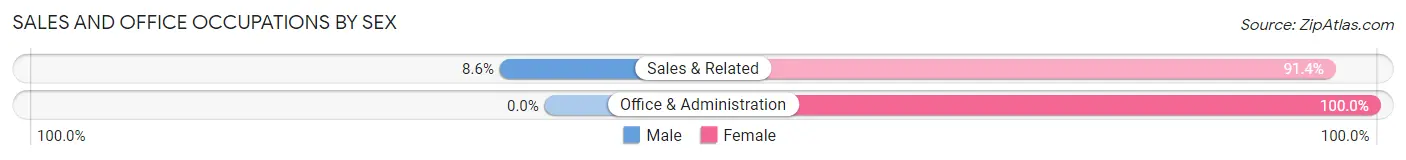
| Occupation | Male | Female |
| Sales & Related | 12 (8.6%) | 127 (91.4%) |
| Office & Administration | 0 (0.0%) | 12 (100.0%) |
| Total (Category) | 12 (8.0%) | 139 (92.0%) |
| Total (Overall) | 288 (44.4%) | 361 (55.6%) |
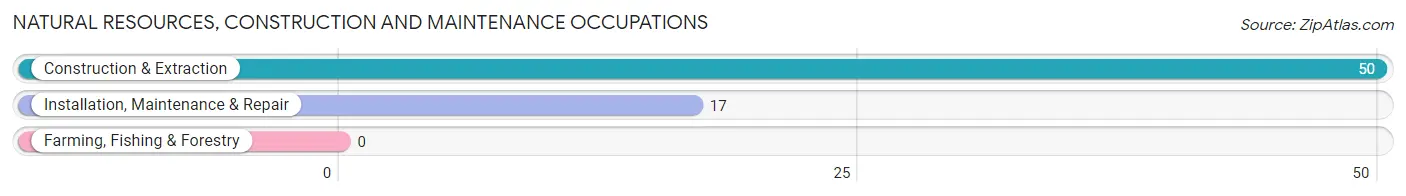
Natural Resources, Construction and Maintenance Occupations
The most common Natural Resources, Construction and Maintenance occupations in Inverness are Construction & Extraction (50 | 7.7%), and Installation, Maintenance & Repair (17 | 2.6%).
Natural Resources, Construction and Maintenance Occupations by Sex
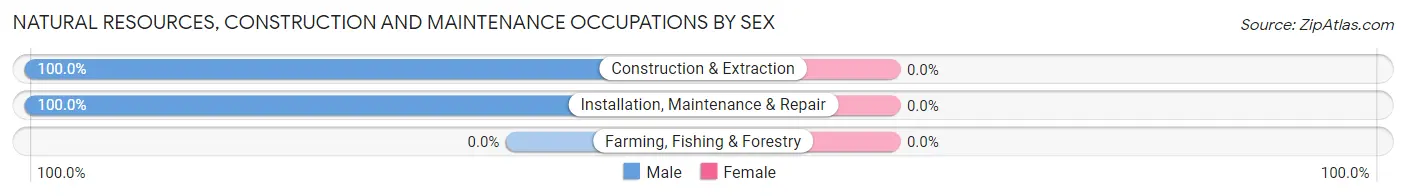
| Occupation | Male | Female |
| Farming, Fishing & Forestry | 0 (0.0%) | 0 (0.0%) |
| Construction & Extraction | 50 (100.0%) | 0 (0.0%) |
| Installation, Maintenance & Repair | 17 (100.0%) | 0 (0.0%) |
| Total (Category) | 67 (100.0%) | 0 (0.0%) |
| Total (Overall) | 288 (44.4%) | 361 (55.6%) |
Production, Transportation and Moving Occupations
The most common Production, Transportation and Moving occupations in Inverness are , and Material Moving (11 | 1.7%).
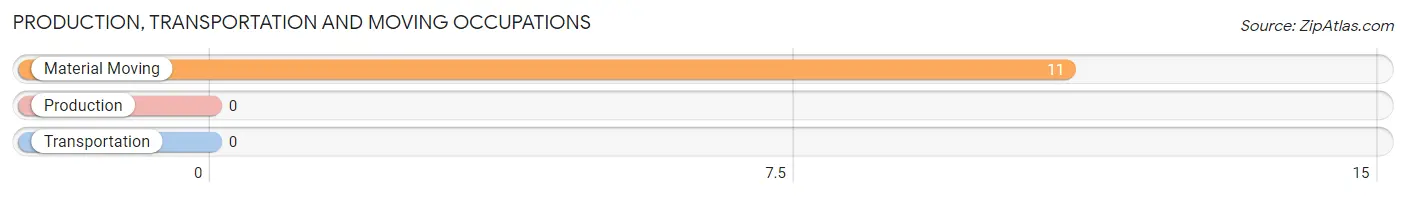
Production, Transportation and Moving Occupations by Sex
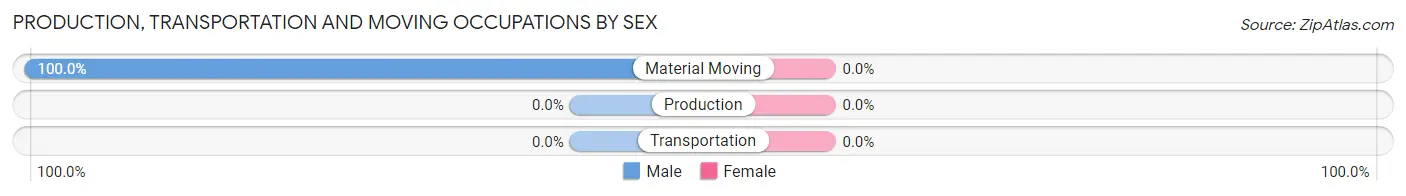
| Occupation | Male | Female |
| Production | 0 (0.0%) | 0 (0.0%) |
| Transportation | 0 (0.0%) | 0 (0.0%) |
| Material Moving | 11 (100.0%) | 0 (0.0%) |
| Total (Category) | 11 (100.0%) | 0 (0.0%) |
| Total (Overall) | 288 (44.4%) | 361 (55.6%) |
Employment Industries by Sex in Inverness
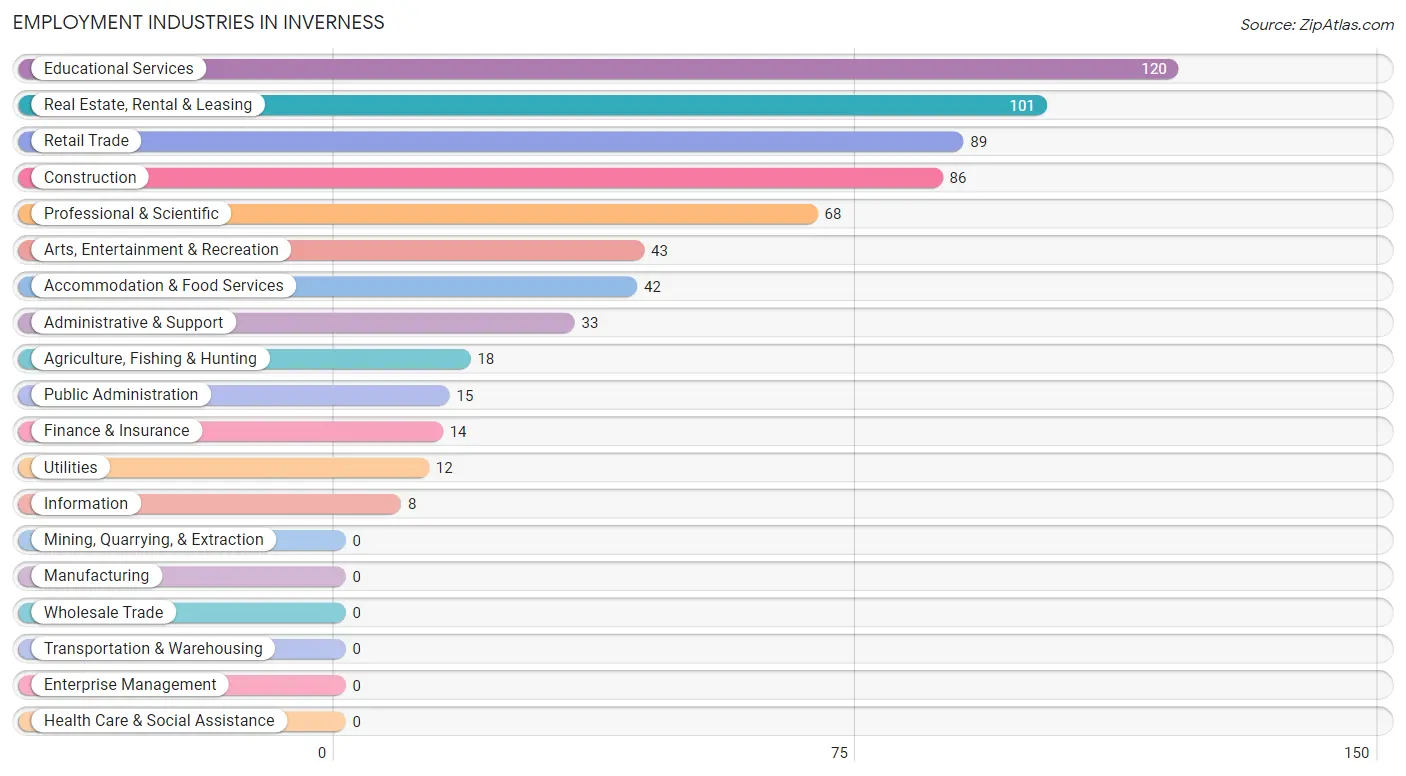
Employment Industries in Inverness
The major employment industries in Inverness include Educational Services (120 | 18.5%), Real Estate, Rental & Leasing (101 | 15.6%), Retail Trade (89 | 13.7%), Construction (86 | 13.3%), and Professional & Scientific (68 | 10.5%).
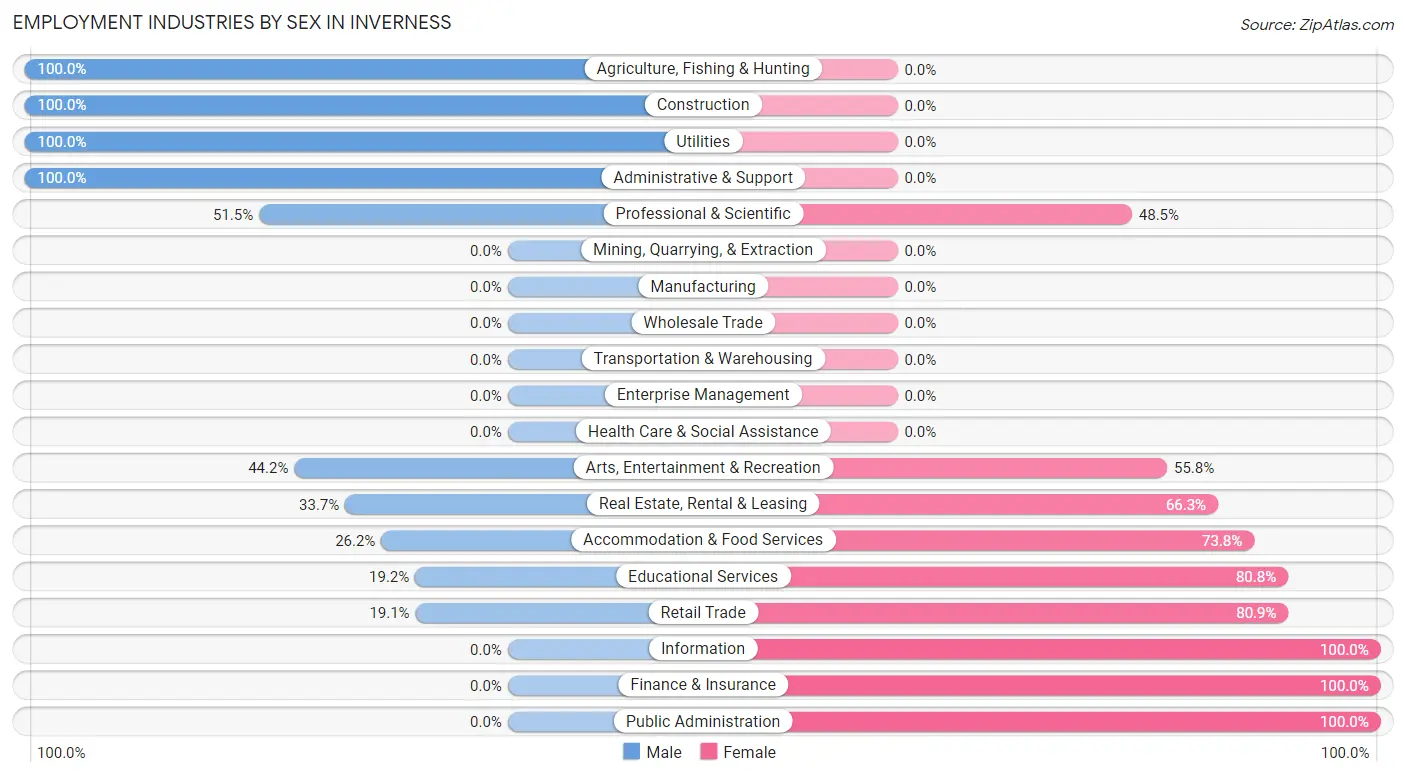
Employment Industries by Sex in Inverness
The Inverness industries that see more men than women are Agriculture, Fishing & Hunting (100.0%), Construction (100.0%), and Utilities (100.0%), whereas the industries that tend to have a higher number of women are Information (100.0%), Finance & Insurance (100.0%), and Public Administration (100.0%).
| Industry | Male | Female |
| Agriculture, Fishing & Hunting | 18 (100.0%) | 0 (0.0%) |
| Mining, Quarrying, & Extraction | 0 (0.0%) | 0 (0.0%) |
| Construction | 86 (100.0%) | 0 (0.0%) |
| Manufacturing | 0 (0.0%) | 0 (0.0%) |
| Wholesale Trade | 0 (0.0%) | 0 (0.0%) |
| Retail Trade | 17 (19.1%) | 72 (80.9%) |
| Transportation & Warehousing | 0 (0.0%) | 0 (0.0%) |
| Utilities | 12 (100.0%) | 0 (0.0%) |
| Information | 0 (0.0%) | 8 (100.0%) |
| Finance & Insurance | 0 (0.0%) | 14 (100.0%) |
| Real Estate, Rental & Leasing | 34 (33.7%) | 67 (66.3%) |
| Professional & Scientific | 35 (51.5%) | 33 (48.5%) |
| Enterprise Management | 0 (0.0%) | 0 (0.0%) |
| Administrative & Support | 33 (100.0%) | 0 (0.0%) |
| Educational Services | 23 (19.2%) | 97 (80.8%) |
| Health Care & Social Assistance | 0 (0.0%) | 0 (0.0%) |
| Arts, Entertainment & Recreation | 19 (44.2%) | 24 (55.8%) |
| Accommodation & Food Services | 11 (26.2%) | 31 (73.8%) |
| Public Administration | 0 (0.0%) | 15 (100.0%) |
| Total | 288 (44.4%) | 361 (55.6%) |
Education in Inverness
School Enrollment in Inverness
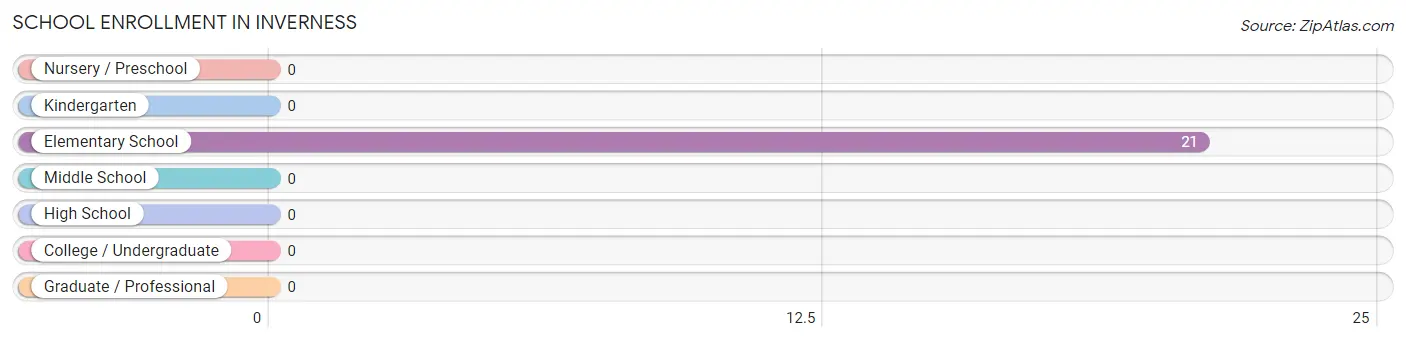
| School Level | # Students | % Students |
| Nursery / Preschool | 0 | 0.0% |
| Kindergarten | 0 | 0.0% |
| Elementary School | 21 | 100.0% |
| Middle School | 0 | 0.0% |
| High School | 0 | 0.0% |
| College / Undergraduate | 0 | 0.0% |
| Graduate / Professional | 0 | 0.0% |
| Total | 21 | 100.0% |
School Enrollment by Age by Funding Source in Inverness
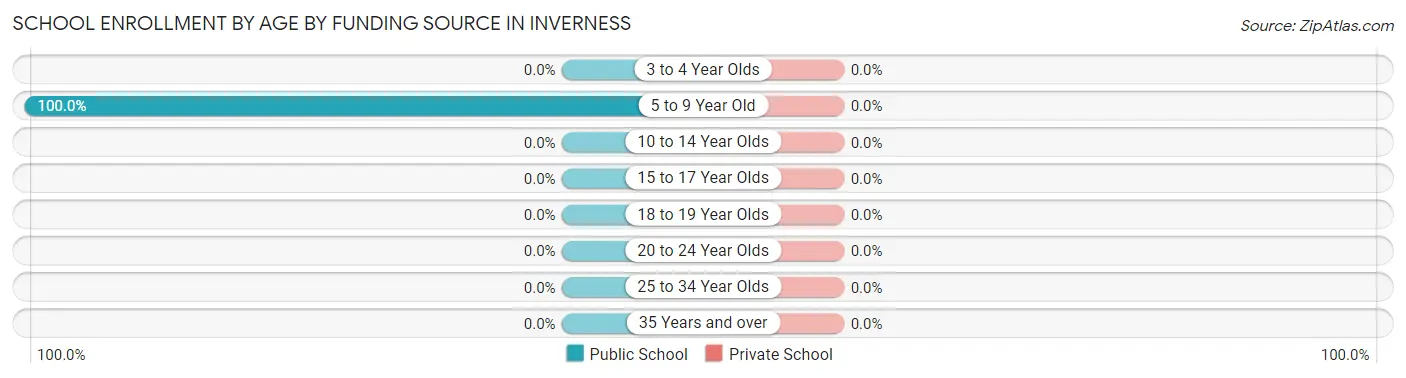
| Age Bracket | Public School | Private School |
| 3 to 4 Year Olds | 0 (0.0%) | 0 (0.0%) |
| 5 to 9 Year Old | 21 (100.0%) | 0 (0.0%) |
| 10 to 14 Year Olds | 0 (0.0%) | 0 (0.0%) |
| 15 to 17 Year Olds | 0 (0.0%) | 0 (0.0%) |
| 18 to 19 Year Olds | 0 (0.0%) | 0 (0.0%) |
| 20 to 24 Year Olds | 0 (0.0%) | 0 (0.0%) |
| 25 to 34 Year Olds | 0 (0.0%) | 0 (0.0%) |
| 35 Years and over | 0 (0.0%) | 0 (0.0%) |
| Total | 21 (100.0%) | 0 (0.0%) |
Educational Attainment by Field of Study in Inverness
Literature & languages (190 | 18.6%), social sciences (153 | 15.0%), visual & performing arts (141 | 13.8%), education (106 | 10.4%), and bio, nature & agricultural (99 | 9.7%) are the most common fields of study among 1,021 individuals in Inverness who have obtained a bachelor's degree or higher.
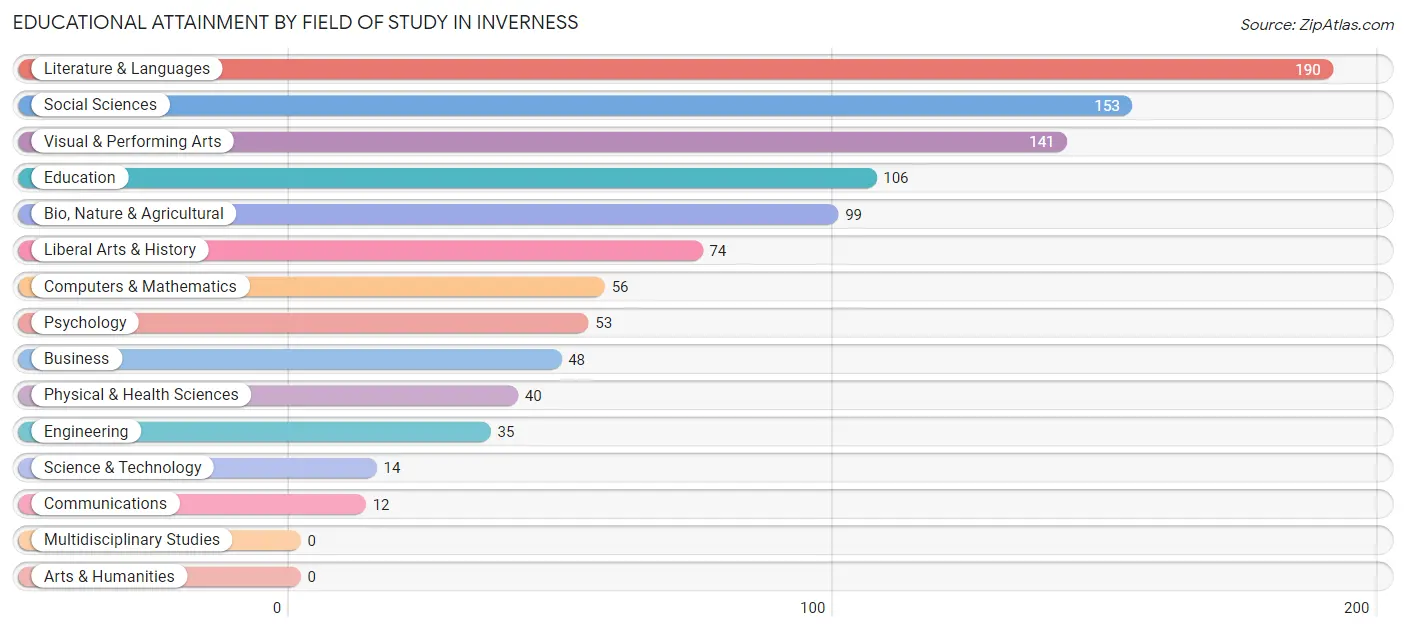
| Field of Study | # Graduates | % Graduates |
| Computers & Mathematics | 56 | 5.5% |
| Bio, Nature & Agricultural | 99 | 9.7% |
| Physical & Health Sciences | 40 | 3.9% |
| Psychology | 53 | 5.2% |
| Social Sciences | 153 | 15.0% |
| Engineering | 35 | 3.4% |
| Multidisciplinary Studies | 0 | 0.0% |
| Science & Technology | 14 | 1.4% |
| Business | 48 | 4.7% |
| Education | 106 | 10.4% |
| Literature & Languages | 190 | 18.6% |
| Liberal Arts & History | 74 | 7.2% |
| Visual & Performing Arts | 141 | 13.8% |
| Communications | 12 | 1.2% |
| Arts & Humanities | 0 | 0.0% |
| Total | 1,021 | 100.0% |
Transportation & Commute in Inverness
Vehicle Availability by Sex in Inverness
The most prevalent vehicle ownership categories in Inverness are males with 4 vehicles (105, accounting for 36.5%) and females with 4 vehicles (25, making up 29.1%).
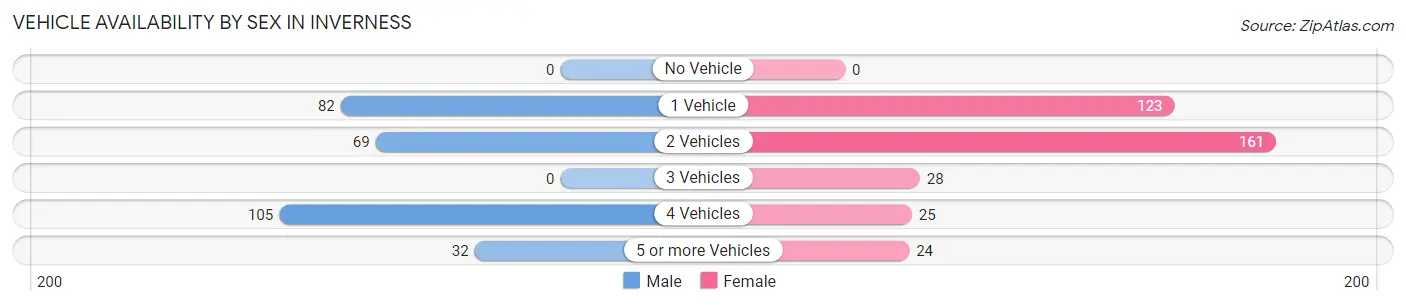
| Vehicles Available | Male | Female |
| No Vehicle | 0 (0.0%) | 0 (0.0%) |
| 1 Vehicle | 82 (28.5%) | 123 (34.1%) |
| 2 Vehicles | 69 (24.0%) | 161 (44.6%) |
| 3 Vehicles | 0 (0.0%) | 28 (7.8%) |
| 4 Vehicles | 105 (36.5%) | 25 (6.9%) |
| 5 or more Vehicles | 32 (11.1%) | 24 (6.7%) |
| Total | 288 (100.0%) | 361 (100.0%) |
Commute Time in Inverness
The most frequently occuring commute durations in Inverness are 60 to 89 minutes (85 commuters, 22.4%), 15 to 19 minutes (70 commuters, 18.4%), and 5 to 9 minutes (44 commuters, 11.6%).
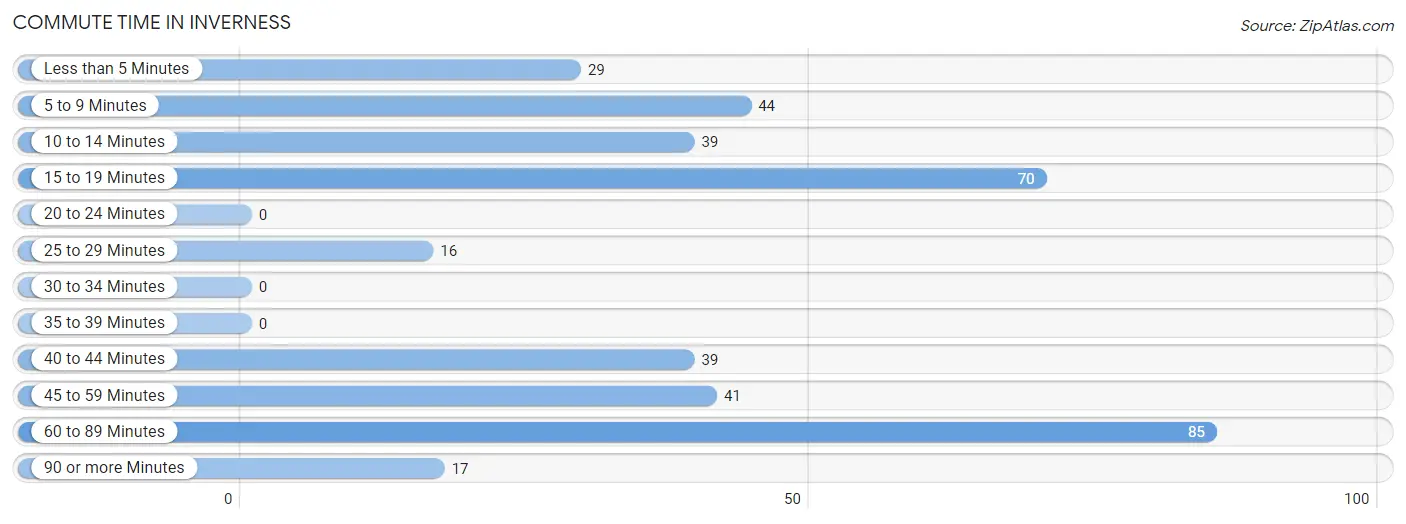
| Commute Time | # Commuters | % Commuters |
| Less than 5 Minutes | 29 | 7.6% |
| 5 to 9 Minutes | 44 | 11.6% |
| 10 to 14 Minutes | 39 | 10.3% |
| 15 to 19 Minutes | 70 | 18.4% |
| 20 to 24 Minutes | 0 | 0.0% |
| 25 to 29 Minutes | 16 | 4.2% |
| 30 to 34 Minutes | 0 | 0.0% |
| 35 to 39 Minutes | 0 | 0.0% |
| 40 to 44 Minutes | 39 | 10.3% |
| 45 to 59 Minutes | 41 | 10.8% |
| 60 to 89 Minutes | 85 | 22.4% |
| 90 or more Minutes | 17 | 4.5% |
Commute Time by Sex in Inverness
The most common commute times in Inverness are 15 to 19 minutes (70 commuters, 39.8%) for males and 60 to 89 minutes (85 commuters, 41.7%) for females.
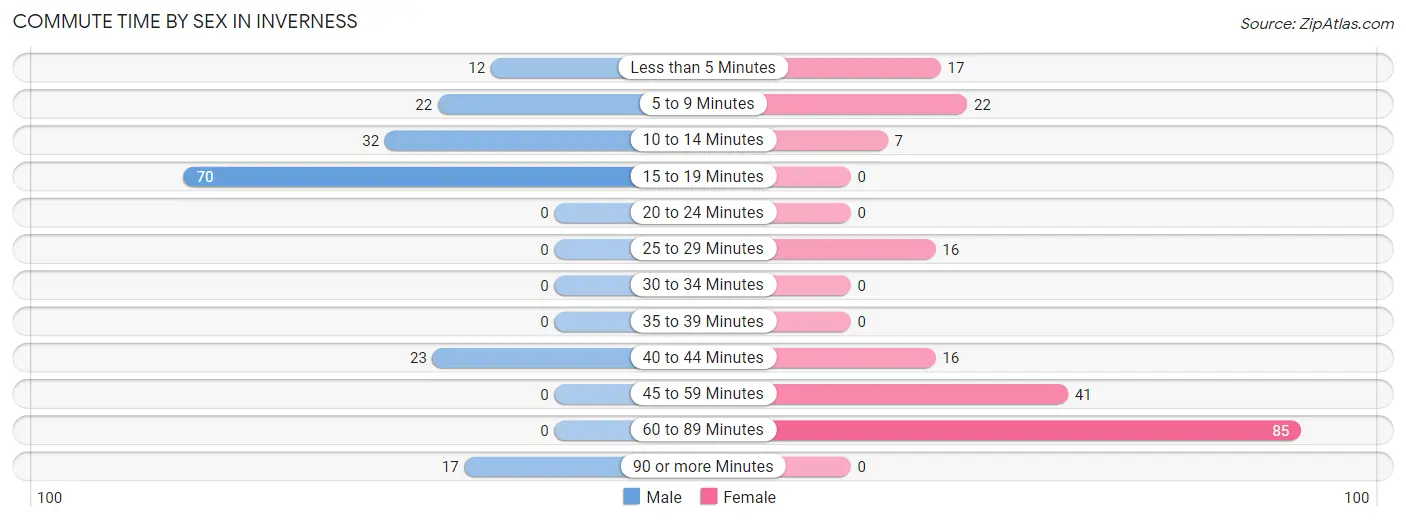
| Commute Time | Male | Female |
| Less than 5 Minutes | 12 (6.8%) | 17 (8.3%) |
| 5 to 9 Minutes | 22 (12.5%) | 22 (10.8%) |
| 10 to 14 Minutes | 32 (18.2%) | 7 (3.4%) |
| 15 to 19 Minutes | 70 (39.8%) | 0 (0.0%) |
| 20 to 24 Minutes | 0 (0.0%) | 0 (0.0%) |
| 25 to 29 Minutes | 0 (0.0%) | 16 (7.8%) |
| 30 to 34 Minutes | 0 (0.0%) | 0 (0.0%) |
| 35 to 39 Minutes | 0 (0.0%) | 0 (0.0%) |
| 40 to 44 Minutes | 23 (13.1%) | 16 (7.8%) |
| 45 to 59 Minutes | 0 (0.0%) | 41 (20.1%) |
| 60 to 89 Minutes | 0 (0.0%) | 85 (41.7%) |
| 90 or more Minutes | 17 (9.7%) | 0 (0.0%) |
Time of Departure to Work by Sex in Inverness
The most frequent times of departure to work in Inverness are 8:30 AM to 8:59 AM (70, 39.8%) for males and 12:00 PM to 3:59 PM (65, 31.9%) for females.
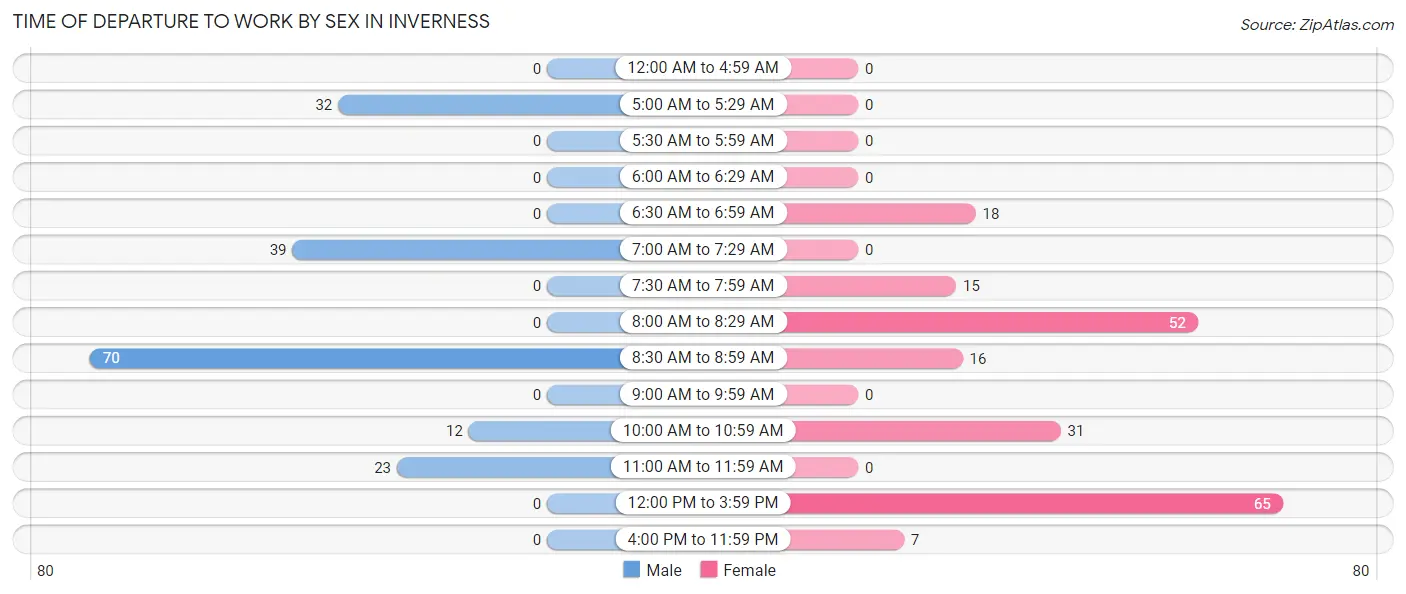
| Time of Departure | Male | Female |
| 12:00 AM to 4:59 AM | 0 (0.0%) | 0 (0.0%) |
| 5:00 AM to 5:29 AM | 32 (18.2%) | 0 (0.0%) |
| 5:30 AM to 5:59 AM | 0 (0.0%) | 0 (0.0%) |
| 6:00 AM to 6:29 AM | 0 (0.0%) | 0 (0.0%) |
| 6:30 AM to 6:59 AM | 0 (0.0%) | 18 (8.8%) |
| 7:00 AM to 7:29 AM | 39 (22.2%) | 0 (0.0%) |
| 7:30 AM to 7:59 AM | 0 (0.0%) | 15 (7.3%) |
| 8:00 AM to 8:29 AM | 0 (0.0%) | 52 (25.5%) |
| 8:30 AM to 8:59 AM | 70 (39.8%) | 16 (7.8%) |
| 9:00 AM to 9:59 AM | 0 (0.0%) | 0 (0.0%) |
| 10:00 AM to 10:59 AM | 12 (6.8%) | 31 (15.2%) |
| 11:00 AM to 11:59 AM | 23 (13.1%) | 0 (0.0%) |
| 12:00 PM to 3:59 PM | 0 (0.0%) | 65 (31.9%) |
| 4:00 PM to 11:59 PM | 0 (0.0%) | 7 (3.4%) |
| Total | 176 (100.0%) | 204 (100.0%) |
Housing Occupancy in Inverness
Occupancy by Ownership in Inverness
Of the total 857 dwellings in Inverness, owner-occupied units account for 698 (81.5%), while renter-occupied units make up 159 (18.5%).
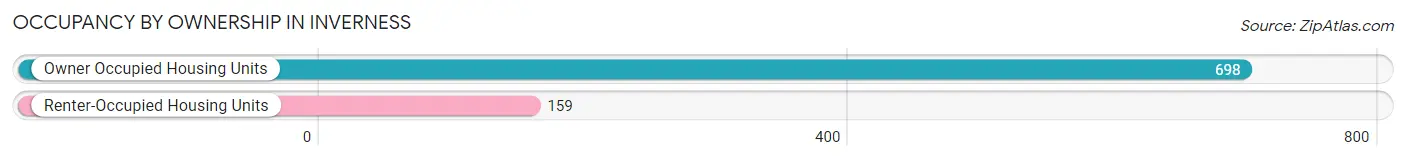
| Occupancy | # Housing Units | % Housing Units |
| Owner Occupied Housing Units | 698 | 81.5% |
| Renter-Occupied Housing Units | 159 | 18.5% |
| Total Occupied Housing Units | 857 | 100.0% |
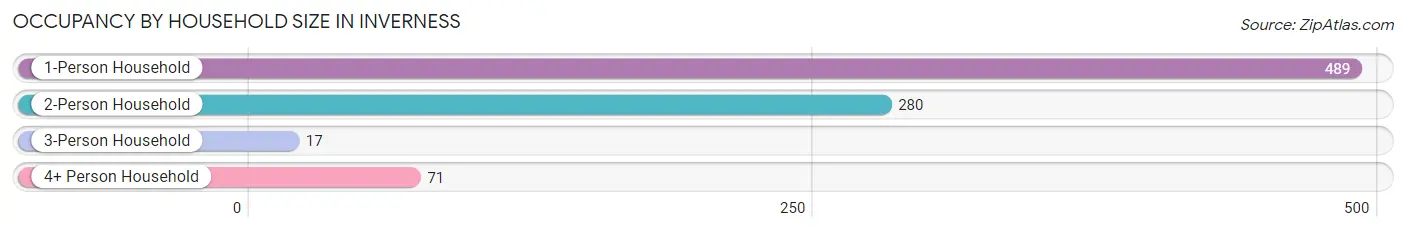
Occupancy by Household Size in Inverness
| Household Size | # Housing Units | % Housing Units |
| 1-Person Household | 489 | 57.1% |
| 2-Person Household | 280 | 32.7% |
| 3-Person Household | 17 | 2.0% |
| 4+ Person Household | 71 | 8.3% |
| Total Housing Units | 857 | 100.0% |
Occupancy by Ownership by Household Size in Inverness
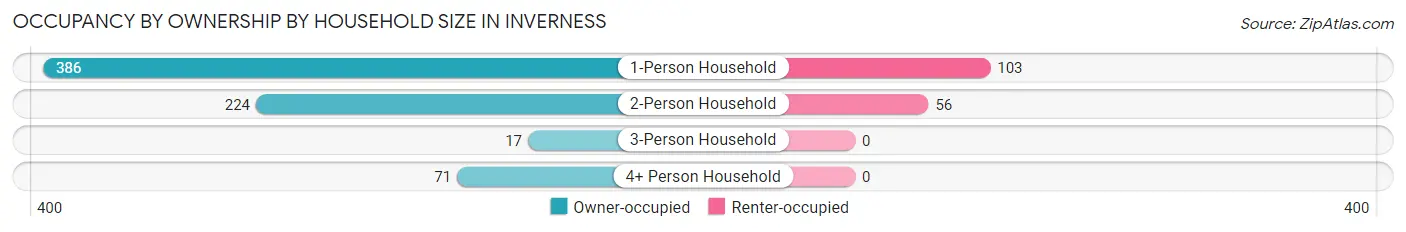
| Household Size | Owner-occupied | Renter-occupied |
| 1-Person Household | 386 (78.9%) | 103 (21.1%) |
| 2-Person Household | 224 (80.0%) | 56 (20.0%) |
| 3-Person Household | 17 (100.0%) | 0 (0.0%) |
| 4+ Person Household | 71 (100.0%) | 0 (0.0%) |
| Total Housing Units | 698 (81.5%) | 159 (18.5%) |
Occupancy by Educational Attainment in Inverness
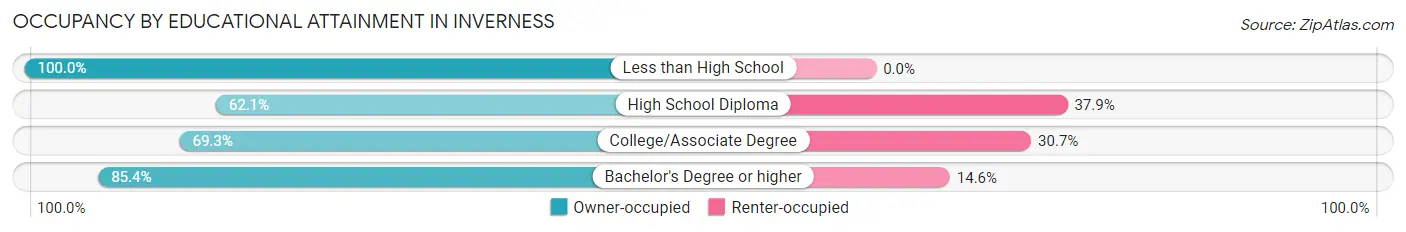
| Household Size | Owner-occupied | Renter-occupied |
| Less than High School | 27 (100.0%) | 0 (0.0%) |
| High School Diploma | 18 (62.1%) | 11 (37.9%) |
| College/Associate Degree | 133 (69.3%) | 59 (30.7%) |
| Bachelor's Degree or higher | 520 (85.4%) | 89 (14.6%) |
Occupancy by Age of Householder in Inverness
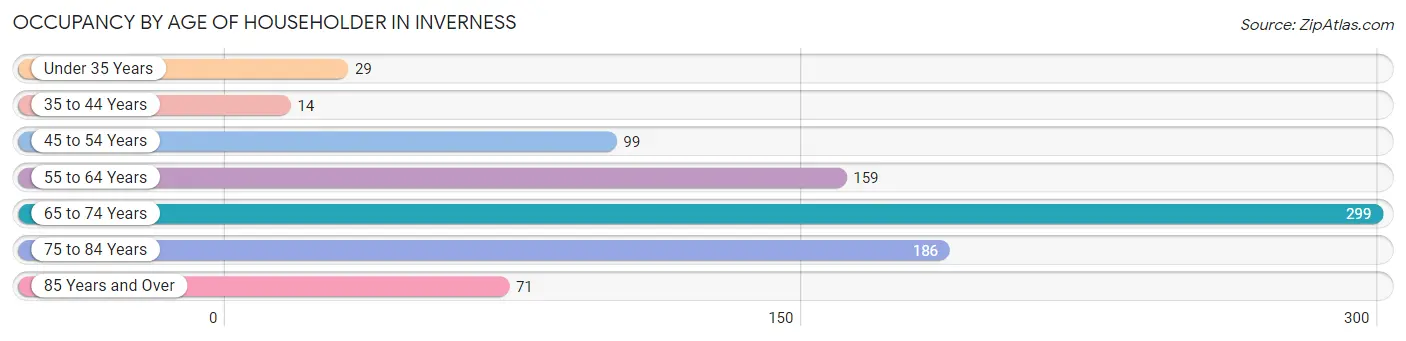
| Age Bracket | # Households | % Households |
| Under 35 Years | 29 | 3.4% |
| 35 to 44 Years | 14 | 1.6% |
| 45 to 54 Years | 99 | 11.6% |
| 55 to 64 Years | 159 | 18.5% |
| 65 to 74 Years | 299 | 34.9% |
| 75 to 84 Years | 186 | 21.7% |
| 85 Years and Over | 71 | 8.3% |
| Total | 857 | 100.0% |
Housing Finances in Inverness
Median Income by Occupancy in Inverness
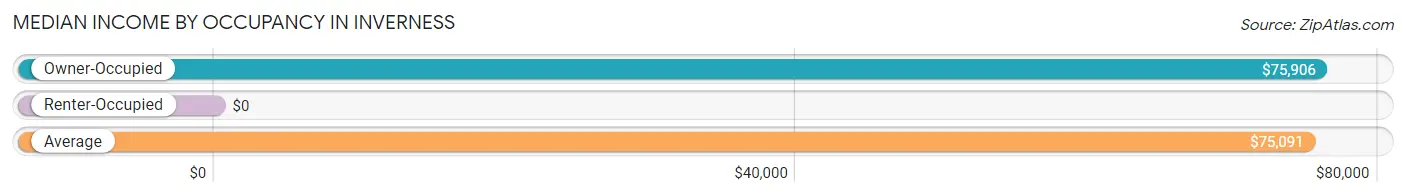
| Occupancy Type | # Households | Median Income |
| Owner-Occupied | 698 (81.5%) | $75,906 |
| Renter-Occupied | 159 (18.5%) | $0 |
| Average | 857 (100.0%) | $75,091 |
Occupancy by Householder Income Bracket in Inverness
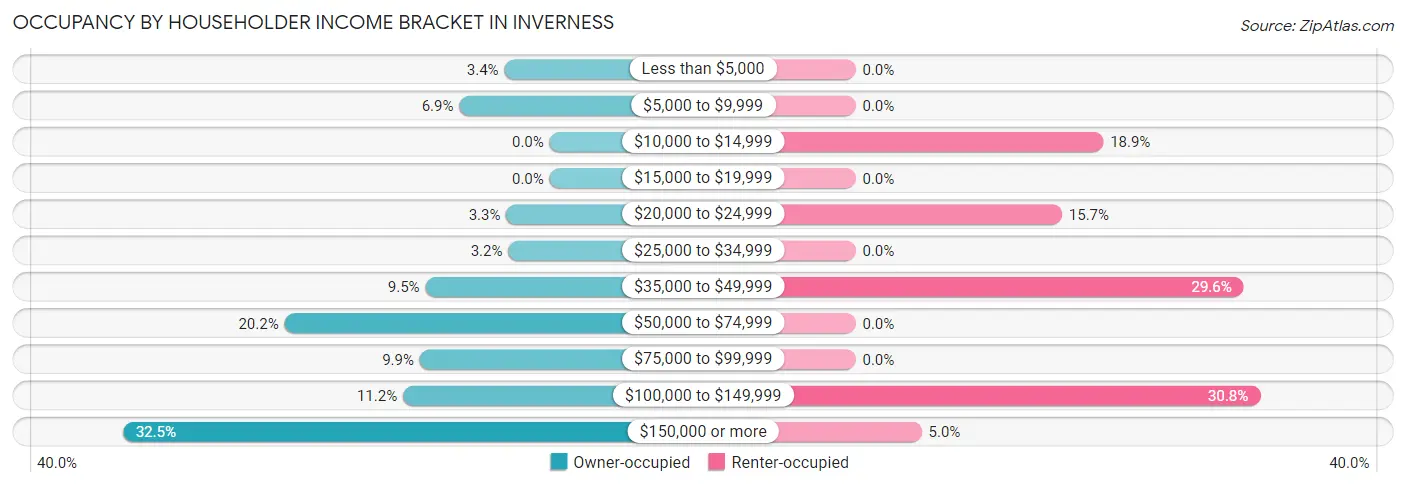
| Income Bracket | Owner-occupied | Renter-occupied |
| Less than $5,000 | 24 (3.4%) | 0 (0.0%) |
| $5,000 to $9,999 | 48 (6.9%) | 0 (0.0%) |
| $10,000 to $14,999 | 0 (0.0%) | 30 (18.9%) |
| $15,000 to $19,999 | 0 (0.0%) | 0 (0.0%) |
| $20,000 to $24,999 | 23 (3.3%) | 25 (15.7%) |
| $25,000 to $34,999 | 22 (3.2%) | 0 (0.0%) |
| $35,000 to $49,999 | 66 (9.5%) | 47 (29.6%) |
| $50,000 to $74,999 | 141 (20.2%) | 0 (0.0%) |
| $75,000 to $99,999 | 69 (9.9%) | 0 (0.0%) |
| $100,000 to $149,999 | 78 (11.2%) | 49 (30.8%) |
| $150,000 or more | 227 (32.5%) | 8 (5.0%) |
| Total | 698 (100.0%) | 159 (100.0%) |
Monthly Housing Cost Tiers in Inverness
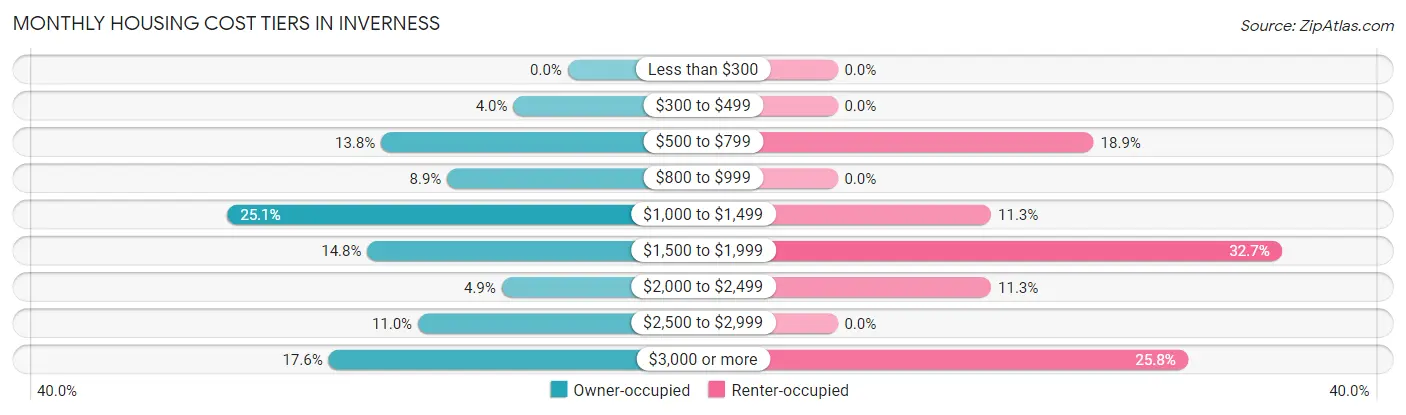
| Monthly Cost | Owner-occupied | Renter-occupied |
| Less than $300 | 0 (0.0%) | 0 (0.0%) |
| $300 to $499 | 28 (4.0%) | 0 (0.0%) |
| $500 to $799 | 96 (13.8%) | 30 (18.9%) |
| $800 to $999 | 62 (8.9%) | 0 (0.0%) |
| $1,000 to $1,499 | 175 (25.1%) | 18 (11.3%) |
| $1,500 to $1,999 | 103 (14.8%) | 52 (32.7%) |
| $2,000 to $2,499 | 34 (4.9%) | 18 (11.3%) |
| $2,500 to $2,999 | 77 (11.0%) | 0 (0.0%) |
| $3,000 or more | 123 (17.6%) | 41 (25.8%) |
| Total | 698 (100.0%) | 159 (100.0%) |
Physical Housing Characteristics in Inverness
Housing Structures in Inverness
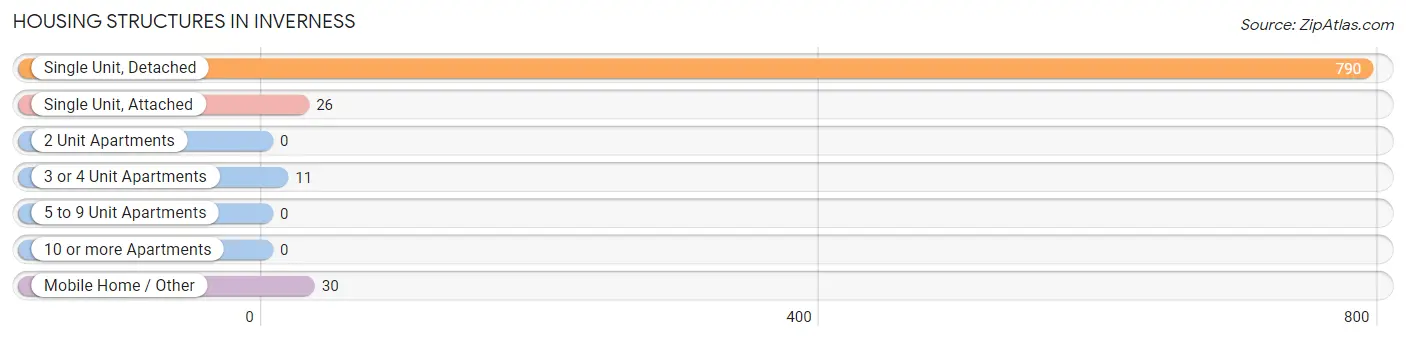
| Structure Type | # Housing Units | % Housing Units |
| Single Unit, Detached | 790 | 92.2% |
| Single Unit, Attached | 26 | 3.0% |
| 2 Unit Apartments | 0 | 0.0% |
| 3 or 4 Unit Apartments | 11 | 1.3% |
| 5 to 9 Unit Apartments | 0 | 0.0% |
| 10 or more Apartments | 0 | 0.0% |
| Mobile Home / Other | 30 | 3.5% |
| Total | 857 | 100.0% |
Housing Structures by Occupancy in Inverness
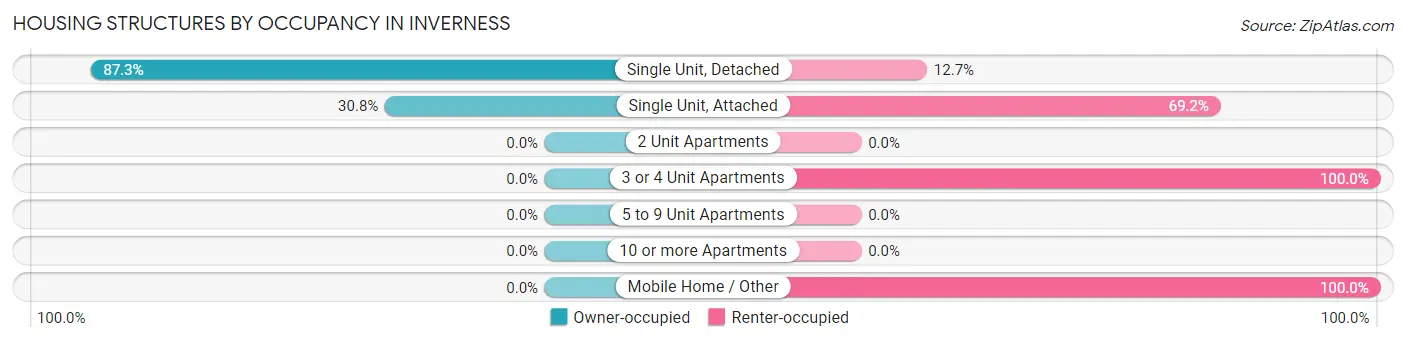
| Structure Type | Owner-occupied | Renter-occupied |
| Single Unit, Detached | 690 (87.3%) | 100 (12.7%) |
| Single Unit, Attached | 8 (30.8%) | 18 (69.2%) |
| 2 Unit Apartments | 0 (0.0%) | 0 (0.0%) |
| 3 or 4 Unit Apartments | 0 (0.0%) | 11 (100.0%) |
| 5 to 9 Unit Apartments | 0 (0.0%) | 0 (0.0%) |
| 10 or more Apartments | 0 (0.0%) | 0 (0.0%) |
| Mobile Home / Other | 0 (0.0%) | 30 (100.0%) |
| Total | 698 (81.5%) | 159 (18.5%) |
Housing Structures by Number of Rooms in Inverness
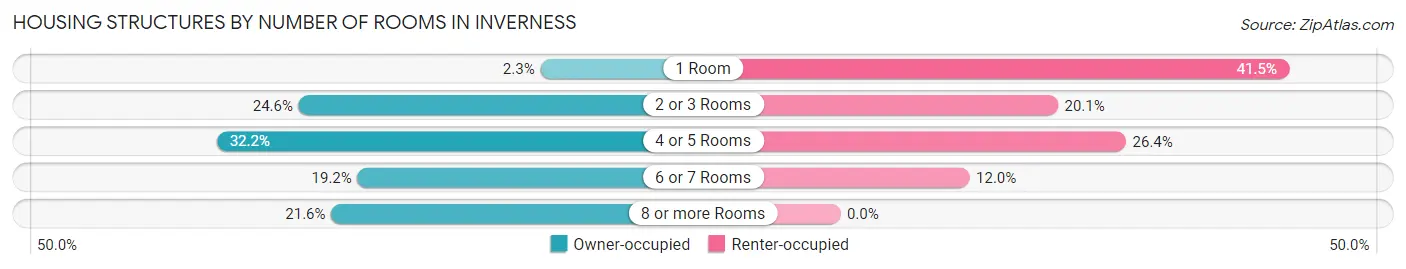
| Number of Rooms | Owner-occupied | Renter-occupied |
| 1 Room | 16 (2.3%) | 66 (41.5%) |
| 2 or 3 Rooms | 172 (24.6%) | 32 (20.1%) |
| 4 or 5 Rooms | 225 (32.2%) | 42 (26.4%) |
| 6 or 7 Rooms | 134 (19.2%) | 19 (11.9%) |
| 8 or more Rooms | 151 (21.6%) | 0 (0.0%) |
| Total | 698 (100.0%) | 159 (100.0%) |
Housing Structure by Heating Type in Inverness
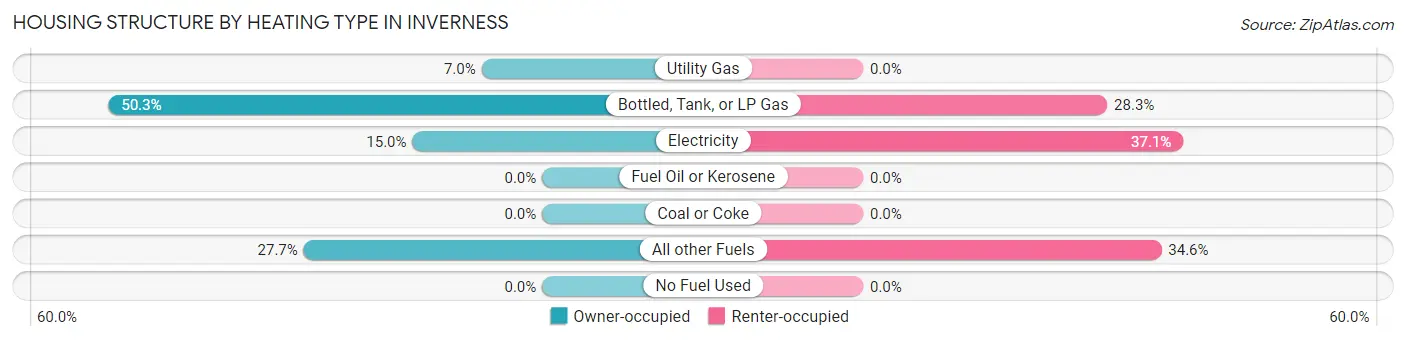
| Heating Type | Owner-occupied | Renter-occupied |
| Utility Gas | 49 (7.0%) | 0 (0.0%) |
| Bottled, Tank, or LP Gas | 351 (50.3%) | 45 (28.3%) |
| Electricity | 105 (15.0%) | 59 (37.1%) |
| Fuel Oil or Kerosene | 0 (0.0%) | 0 (0.0%) |
| Coal or Coke | 0 (0.0%) | 0 (0.0%) |
| All other Fuels | 193 (27.7%) | 55 (34.6%) |
| No Fuel Used | 0 (0.0%) | 0 (0.0%) |
| Total | 698 (100.0%) | 159 (100.0%) |
Household Vehicle Usage in Inverness
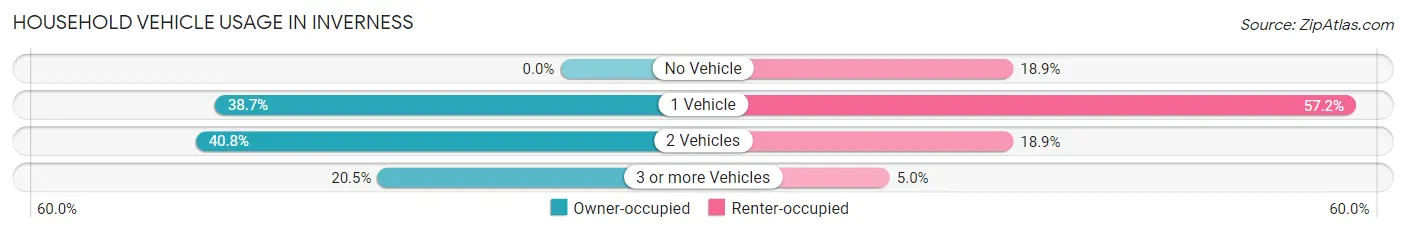
| Vehicles per Household | Owner-occupied | Renter-occupied |
| No Vehicle | 0 (0.0%) | 30 (18.9%) |
| 1 Vehicle | 270 (38.7%) | 91 (57.2%) |
| 2 Vehicles | 285 (40.8%) | 30 (18.9%) |
| 3 or more Vehicles | 143 (20.5%) | 8 (5.0%) |
| Total | 698 (100.0%) | 159 (100.0%) |
Real Estate & Mortgages in Inverness
Real Estate and Mortgage Overview in Inverness
| Characteristic | Without Mortgage | With Mortgage |
| Housing Units | 473 | 225 |
| Median Property Value | $1,573,200 | $1,370,500 |
| Median Household Income | $74,013 | $108 |
| Monthly Housing Costs | $1,057 | $101 |
| Real Estate Taxes | $5,122 | $0 |
Property Value by Mortgage Status in Inverness
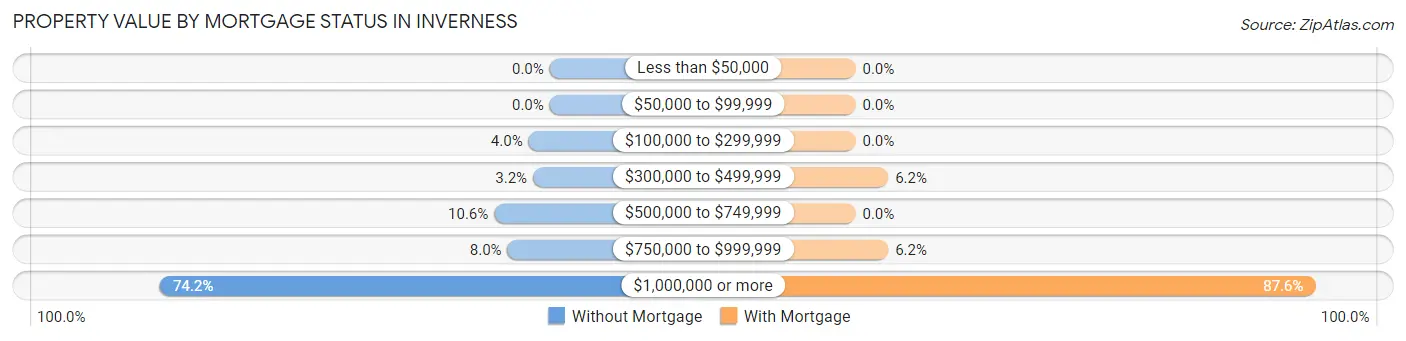
| Property Value | Without Mortgage | With Mortgage |
| Less than $50,000 | 0 (0.0%) | 0 (0.0%) |
| $50,000 to $99,999 | 0 (0.0%) | 0 (0.0%) |
| $100,000 to $299,999 | 19 (4.0%) | 0 (0.0%) |
| $300,000 to $499,999 | 15 (3.2%) | 14 (6.2%) |
| $500,000 to $749,999 | 50 (10.6%) | 0 (0.0%) |
| $750,000 to $999,999 | 38 (8.0%) | 14 (6.2%) |
| $1,000,000 or more | 351 (74.2%) | 197 (87.6%) |
| Total | 473 (100.0%) | 225 (100.0%) |
Household Income by Mortgage Status in Inverness
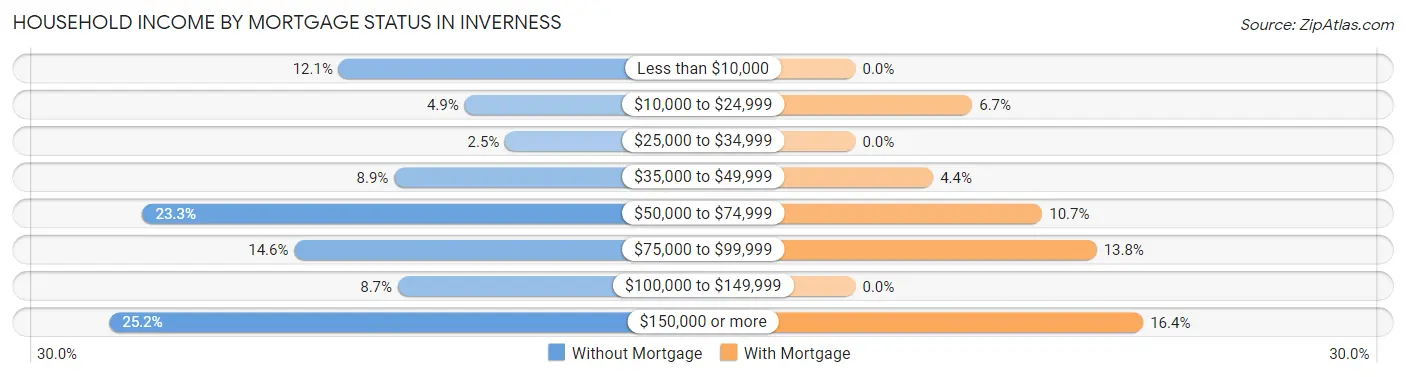
| Household Income | Without Mortgage | With Mortgage |
| Less than $10,000 | 57 (12.0%) | 0 (0.0%) |
| $10,000 to $24,999 | 23 (4.9%) | 15 (6.7%) |
| $25,000 to $34,999 | 12 (2.5%) | 0 (0.0%) |
| $35,000 to $49,999 | 42 (8.9%) | 10 (4.4%) |
| $50,000 to $74,999 | 110 (23.3%) | 24 (10.7%) |
| $75,000 to $99,999 | 69 (14.6%) | 31 (13.8%) |
| $100,000 to $149,999 | 41 (8.7%) | 0 (0.0%) |
| $150,000 or more | 119 (25.2%) | 37 (16.4%) |
| Total | 473 (100.0%) | 225 (100.0%) |
Property Value to Household Income Ratio in Inverness
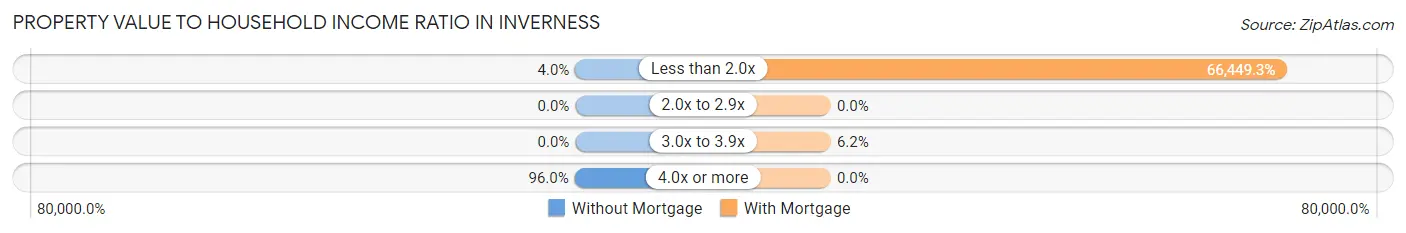
| Value-to-Income Ratio | Without Mortgage | With Mortgage |
| Less than 2.0x | 19 (4.0%) | 149,511 (66,449.3%) |
| 2.0x to 2.9x | 0 (0.0%) | 0 (0.0%) |
| 3.0x to 3.9x | 0 (0.0%) | 14 (6.2%) |
| 4.0x or more | 454 (96.0%) | 0 (0.0%) |
| Total | 473 (100.0%) | 225 (100.0%) |
Real Estate Taxes by Mortgage Status in Inverness
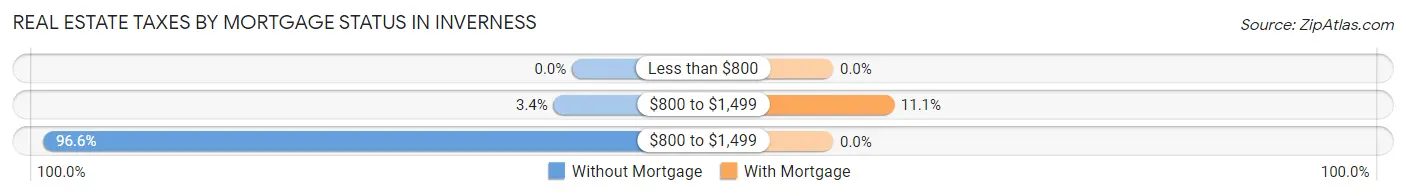
| Property Taxes | Without Mortgage | With Mortgage |
| Less than $800 | 0 (0.0%) | 0 (0.0%) |
| $800 to $1,499 | 16 (3.4%) | 25 (11.1%) |
| $800 to $1,499 | 457 (96.6%) | 0 (0.0%) |
| Total | 473 (100.0%) | 225 (100.0%) |
Health & Disability in Inverness
Health Insurance Coverage by Age in Inverness
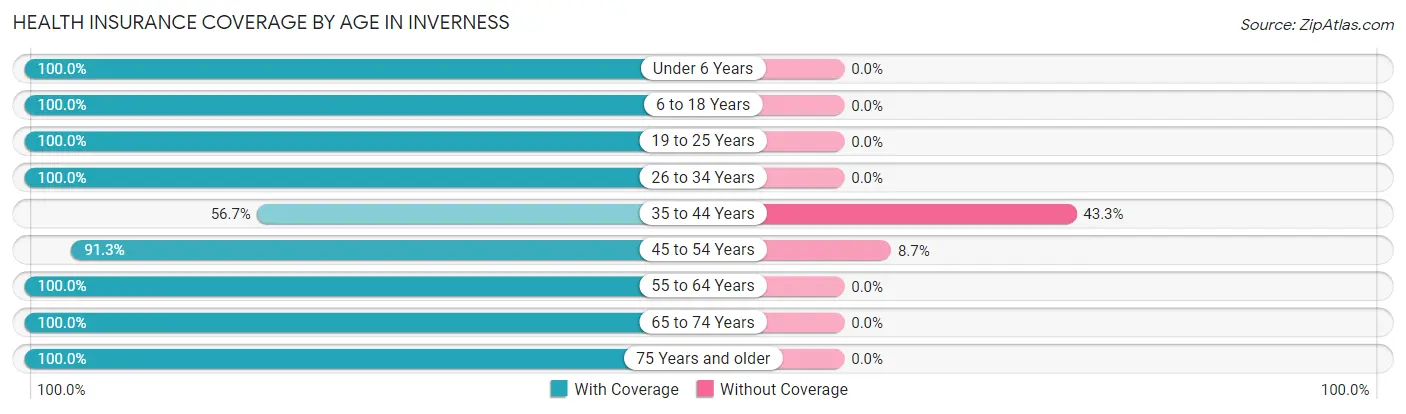
| Age Bracket | With Coverage | Without Coverage |
| Under 6 Years | 18 (100.0%) | 0 (0.0%) |
| 6 to 18 Years | 21 (100.0%) | 0 (0.0%) |
| 19 to 25 Years | 40 (100.0%) | 0 (0.0%) |
| 26 to 34 Years | 116 (100.0%) | 0 (0.0%) |
| 35 to 44 Years | 38 (56.7%) | 29 (43.3%) |
| 45 to 54 Years | 220 (91.3%) | 21 (8.7%) |
| 55 to 64 Years | 237 (100.0%) | 0 (0.0%) |
| 65 to 74 Years | 398 (100.0%) | 0 (0.0%) |
| 75 Years and older | 331 (100.0%) | 0 (0.0%) |
| Total | 1,419 (96.6%) | 50 (3.4%) |
Health Insurance Coverage by Citizenship Status in Inverness
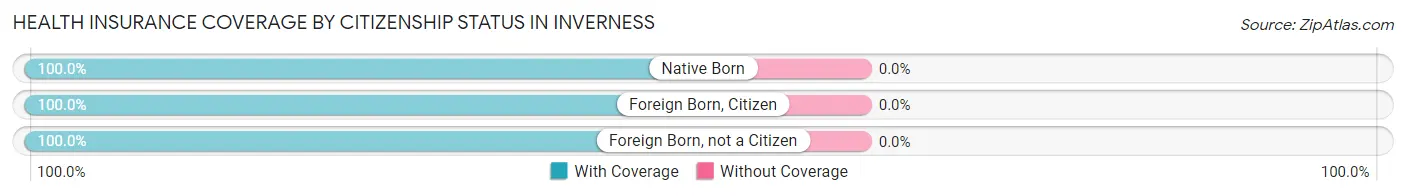
| Citizenship Status | With Coverage | Without Coverage |
| Native Born | 18 (100.0%) | 0 (0.0%) |
| Foreign Born, Citizen | 21 (100.0%) | 0 (0.0%) |
| Foreign Born, not a Citizen | 40 (100.0%) | 0 (0.0%) |
Health Insurance Coverage by Household Income in Inverness
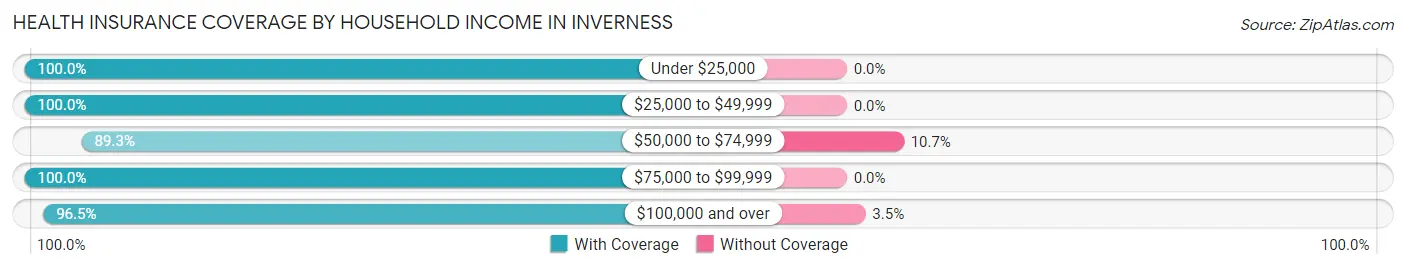
| Household Income | With Coverage | Without Coverage |
| Under $25,000 | 180 (100.0%) | 0 (0.0%) |
| $25,000 to $49,999 | 173 (100.0%) | 0 (0.0%) |
| $50,000 to $74,999 | 176 (89.3%) | 21 (10.7%) |
| $75,000 to $99,999 | 87 (100.0%) | 0 (0.0%) |
| $100,000 and over | 803 (96.5%) | 29 (3.5%) |
Public vs Private Health Insurance Coverage by Age in Inverness
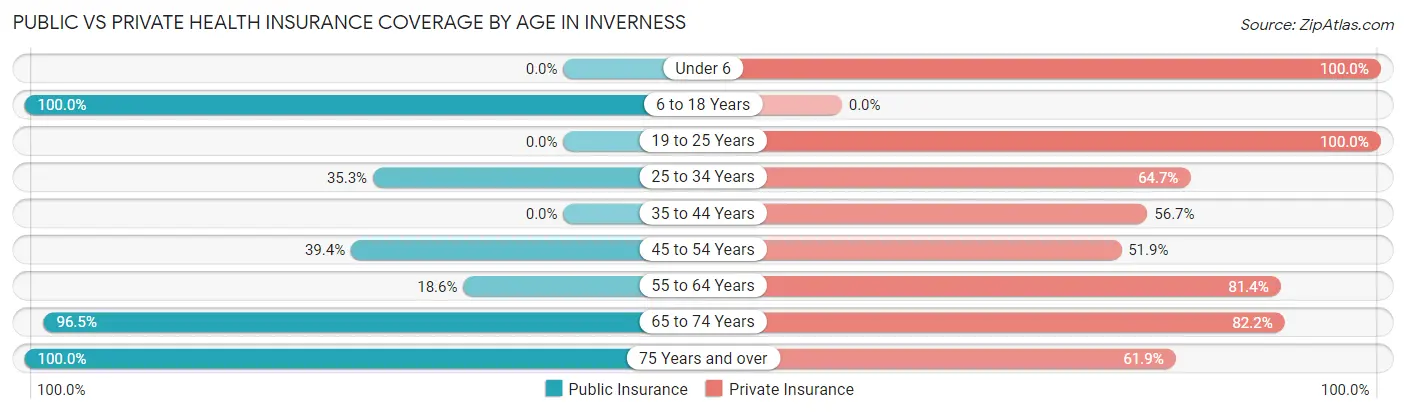
| Age Bracket | Public Insurance | Private Insurance |
| Under 6 | 0 (0.0%) | 18 (100.0%) |
| 6 to 18 Years | 21 (100.0%) | 0 (0.0%) |
| 19 to 25 Years | 0 (0.0%) | 40 (100.0%) |
| 25 to 34 Years | 41 (35.3%) | 75 (64.7%) |
| 35 to 44 Years | 0 (0.0%) | 38 (56.7%) |
| 45 to 54 Years | 95 (39.4%) | 125 (51.9%) |
| 55 to 64 Years | 44 (18.6%) | 193 (81.4%) |
| 65 to 74 Years | 384 (96.5%) | 327 (82.2%) |
| 75 Years and over | 331 (100.0%) | 205 (61.9%) |
| Total | 916 (62.4%) | 1,021 (69.5%) |
Disability Status by Sex by Age in Inverness
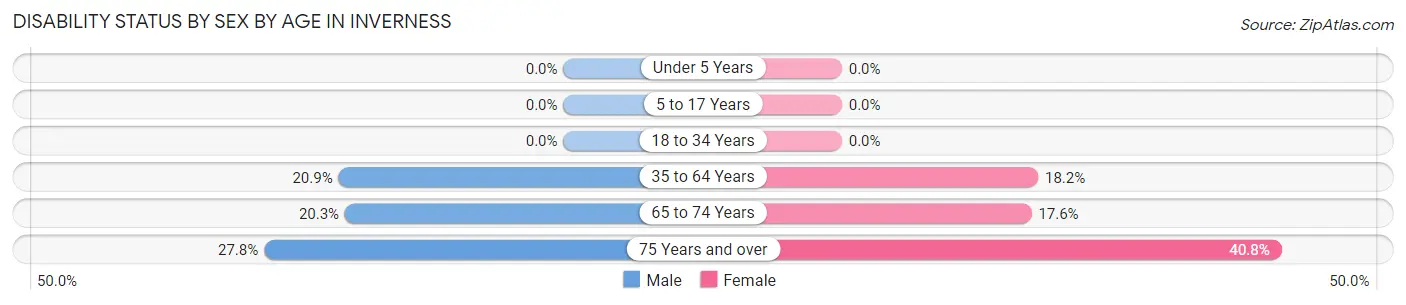
| Age Bracket | Male | Female |
| Under 5 Years | 0 (0.0%) | 0 (0.0%) |
| 5 to 17 Years | 0 (0.0%) | 0 (0.0%) |
| 18 to 34 Years | 0 (0.0%) | 0 (0.0%) |
| 35 to 64 Years | 53 (20.9%) | 53 (18.2%) |
| 65 to 74 Years | 30 (20.3%) | 44 (17.6%) |
| 75 Years and over | 30 (27.8%) | 91 (40.8%) |
Disability Class by Sex by Age in Inverness
Disability Class: Hearing Difficulty
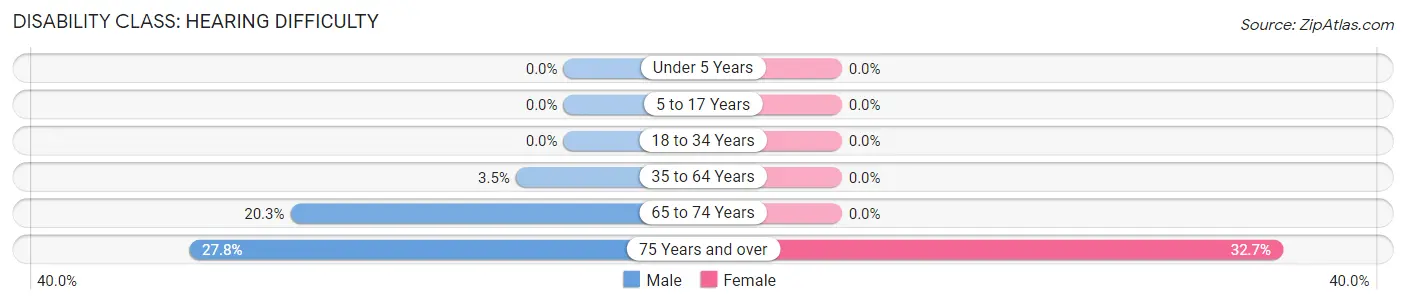
| Age Bracket | Male | Female |
| Under 5 Years | 0 (0.0%) | 0 (0.0%) |
| 5 to 17 Years | 0 (0.0%) | 0 (0.0%) |
| 18 to 34 Years | 0 (0.0%) | 0 (0.0%) |
| 35 to 64 Years | 9 (3.5%) | 0 (0.0%) |
| 65 to 74 Years | 30 (20.3%) | 0 (0.0%) |
| 75 Years and over | 30 (27.8%) | 73 (32.7%) |
Disability Class: Vision Difficulty
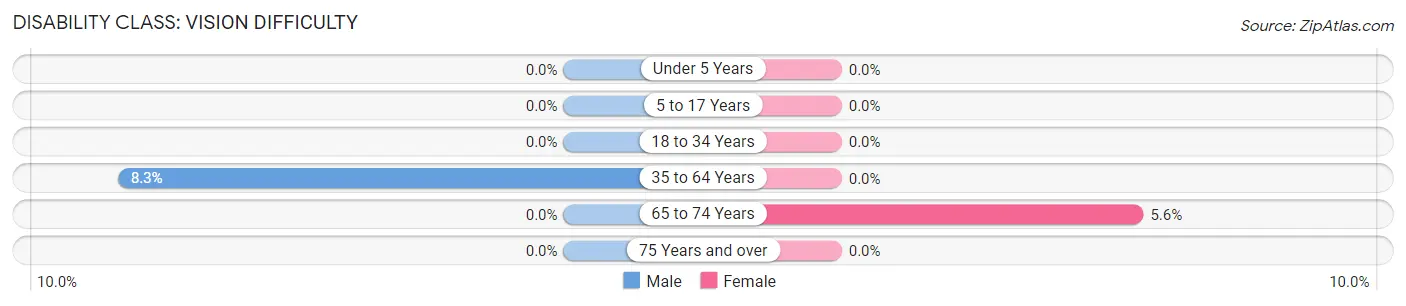
| Age Bracket | Male | Female |
| Under 5 Years | 0 (0.0%) | 0 (0.0%) |
| 5 to 17 Years | 0 (0.0%) | 0 (0.0%) |
| 18 to 34 Years | 0 (0.0%) | 0 (0.0%) |
| 35 to 64 Years | 21 (8.3%) | 0 (0.0%) |
| 65 to 74 Years | 0 (0.0%) | 14 (5.6%) |
| 75 Years and over | 0 (0.0%) | 0 (0.0%) |
Disability Class: Cognitive Difficulty
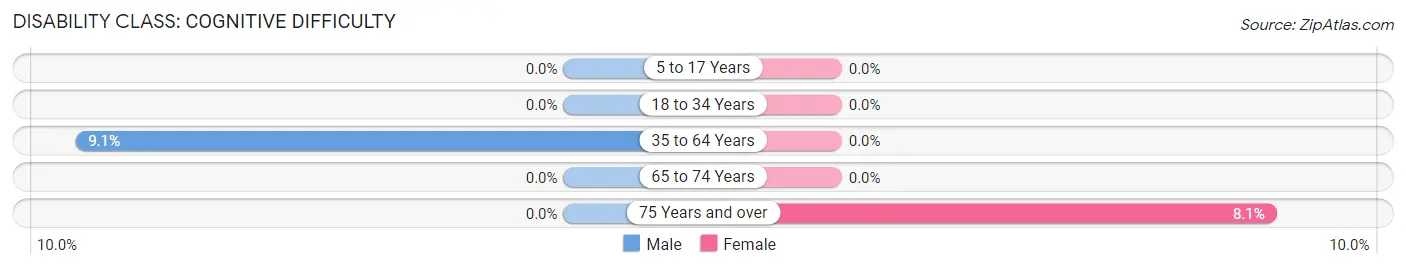
| Age Bracket | Male | Female |
| 5 to 17 Years | 0 (0.0%) | 0 (0.0%) |
| 18 to 34 Years | 0 (0.0%) | 0 (0.0%) |
| 35 to 64 Years | 23 (9.1%) | 0 (0.0%) |
| 65 to 74 Years | 0 (0.0%) | 0 (0.0%) |
| 75 Years and over | 0 (0.0%) | 18 (8.1%) |
Disability Class: Ambulatory Difficulty
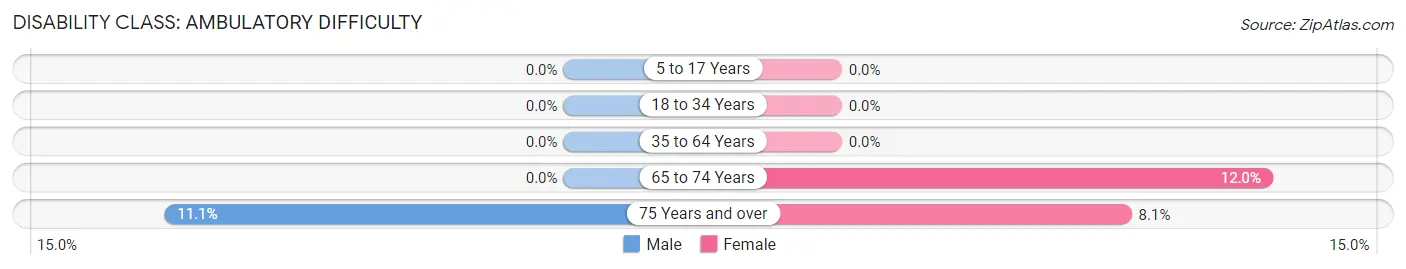
| Age Bracket | Male | Female |
| 5 to 17 Years | 0 (0.0%) | 0 (0.0%) |
| 18 to 34 Years | 0 (0.0%) | 0 (0.0%) |
| 35 to 64 Years | 0 (0.0%) | 0 (0.0%) |
| 65 to 74 Years | 0 (0.0%) | 30 (12.0%) |
| 75 Years and over | 12 (11.1%) | 18 (8.1%) |
Disability Class: Self-Care Difficulty
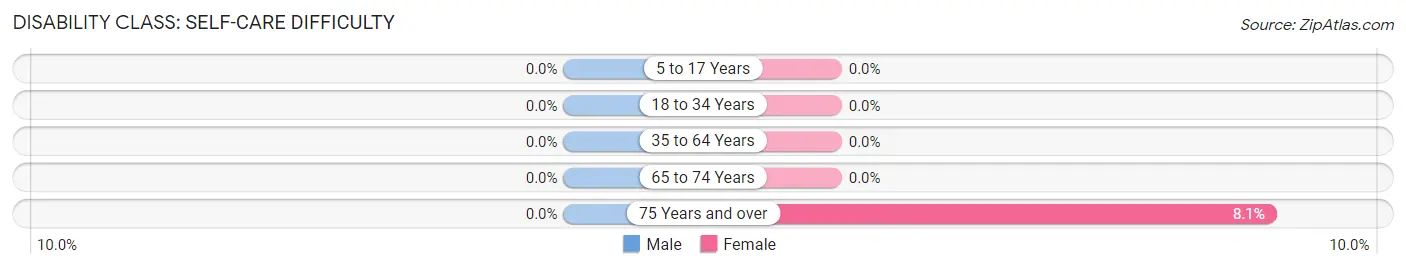
| Age Bracket | Male | Female |
| 5 to 17 Years | 0 (0.0%) | 0 (0.0%) |
| 18 to 34 Years | 0 (0.0%) | 0 (0.0%) |
| 35 to 64 Years | 0 (0.0%) | 0 (0.0%) |
| 65 to 74 Years | 0 (0.0%) | 0 (0.0%) |
| 75 Years and over | 0 (0.0%) | 18 (8.1%) |
Technology Access in Inverness
Computing Device Access in Inverness
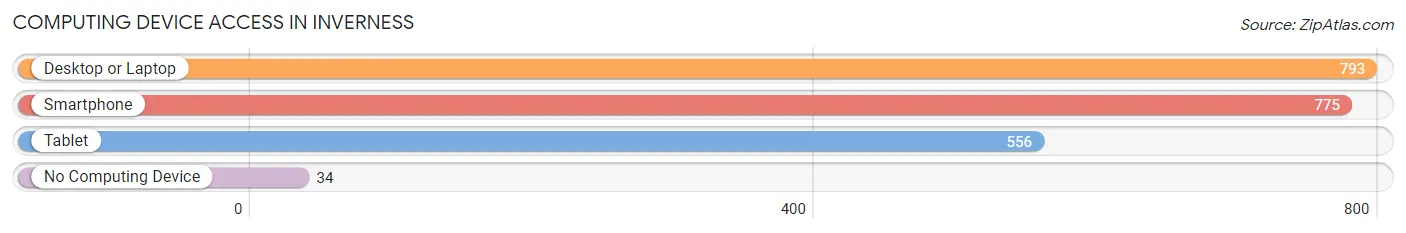
| Device Type | # Households | % Households |
| Desktop or Laptop | 793 | 92.5% |
| Smartphone | 775 | 90.4% |
| Tablet | 556 | 64.9% |
| No Computing Device | 34 | 4.0% |
| Total | 857 | 100.0% |
Internet Access in Inverness
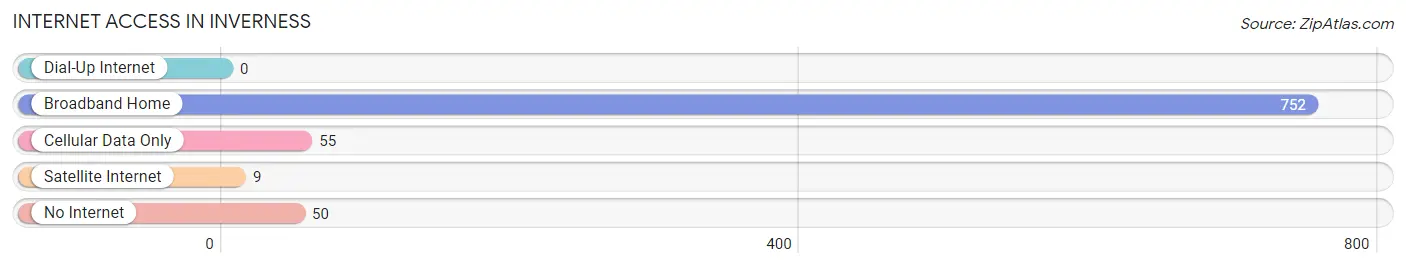
| Internet Type | # Households | % Households |
| Dial-Up Internet | 0 | 0.0% |
| Broadband Home | 752 | 87.7% |
| Cellular Data Only | 55 | 6.4% |
| Satellite Internet | 9 | 1.1% |
| No Internet | 50 | 5.8% |
| Total | 857 | 100.0% |
Inverness Summary
Inverness is a small unincorporated community located in Marin County, California. It is situated on the western shore of Tomales Bay, approximately 15 miles (24 km) southwest of Point Reyes Station and approximately 30 miles (48 km) northwest of San Francisco. The population of Inverness was 1,304 as of the 2010 census.
History
Inverness was originally inhabited by the Coast Miwok Native American tribe. The first European settlers arrived in the area in the late 19th century, and the town was officially founded in 1876. The town was named after Inverness, Scotland, and was originally a fishing and farming community.
In the early 20th century, Inverness began to attract tourists, and the town became a popular destination for weekend getaways. In the 1950s, the town was transformed into a residential community, and many of the original buildings were replaced with modern homes.
Geography
Inverness is located on the western shore of Tomales Bay, approximately 15 miles (24 km) southwest of Point Reyes Station and approximately 30 miles (48 km) northwest of San Francisco. The town is surrounded by rolling hills and is situated on a peninsula that juts out into the bay. The town is bordered by the towns of Point Reyes Station to the north, Marshall to the east, and Tomales to the south.
The climate in Inverness is mild and temperate, with cool, wet winters and warm, dry summers. The average annual temperature is 57°F (14°C), and the average annual precipitation is approximately 24 inches (610 mm).
Economy
Inverness is primarily a residential community, and the majority of the town’s residents are employed in the service sector. The town is also home to a number of small businesses, including restaurants, shops, and galleries.
The town is also a popular tourist destination, and many visitors come to Inverness to enjoy the town’s natural beauty and recreational activities. Popular activities include kayaking, fishing, and hiking.
Demographics
As of the 2010 census, the population of Inverness was 1,304. The racial makeup of the town was 87.3% White, 0.8% African American, 0.3% Native American, 5.2% Asian, 0.1% Pacific Islander, 3.2% from other races, and 3.1% from two or more races. Hispanic or Latino of any race were 8.2% of the population.
The median household income in Inverness was $76,944, and the median family income was $87,813. The per capita income for the town was $41,945. About 4.3% of families and 6.2% of the population were below the poverty line, including 8.2% of those under age 18 and 3.3% of those age 65 or over.
Common Questions
What is Per Capita Income in Inverness?
Per Capita income in Inverness is $67,928.
What is the Median Family Income in Inverness?
Median Family Income in Inverness is $149,348.
What is the Median Household income in Inverness?
Median Household Income in Inverness is $75,091.
What is Income or Wage Gap in Inverness?
Income or Wage Gap in Inverness is 33.3%.
Women in Inverness earn 66.7 cents for every dollar earned by a man.
What is Inequality or Gini Index in Inverness?
Inequality or Gini Index in Inverness is 0.48.
What is the Total Population of Inverness?
Total Population of Inverness is 1,469.
What is the Total Male Population of Inverness?
Total Male Population of Inverness is 632.
What is the Total Female Population of Inverness?
Total Female Population of Inverness is 837.
What is the Ratio of Males per 100 Females in Inverness?
There are 75.51 Males per 100 Females in Inverness.
What is the Ratio of Females per 100 Males in Inverness?
There are 132.44 Females per 100 Males in Inverness.
What is the Median Population Age in Inverness?
Median Population Age in Inverness is 63.5 Years.
What is the Average Family Size in Inverness
Average Family Size in Inverness is 2.7 People.
What is the Average Household Size in Inverness
Average Household Size in Inverness is 1.7 People.
How Large is the Labor Force in Inverness?
There are 744 People in the Labor Forcein in Inverness.
What is the Percentage of People in the Labor Force in Inverness?
52.0% of People are in the Labor Force in Inverness.
What is the Unemployment Rate in Inverness?
Unemployment Rate in Inverness is 12.7%.