Hughson, CA Map & Demographics
Hughson Map
Hughson Overview
$40,898
PER CAPITA INCOME
$111,076
AVG FAMILY INCOME
$99,449
AVG HOUSEHOLD INCOME
43.1%
WAGE / INCOME GAP [ % ]
56.9¢/ $1
WAGE / INCOME GAP [ $ ]
0.38
INEQUALITY / GINI INDEX
7,523
TOTAL POPULATION
3,619
MALE POPULATION
3,904
FEMALE POPULATION
92.70
MALES / 100 FEMALES
107.88
FEMALES / 100 MALES
40.0
MEDIAN AGE
3.3
AVG FAMILY SIZE
2.6
AVG HOUSEHOLD SIZE
3,772
LABOR FORCE [ PEOPLE ]
64.0%
PERCENT IN LABOR FORCE
6.7%
UNEMPLOYMENT RATE
Hughson Zip Codes
Hughson Area Codes
Income in Hughson
Income Overview in Hughson
Per Capita Income in Hughson is $40,898, while median incomes of families and households are $111,076 and $99,449 respectively.
| Characteristic | Number | Measure |
| Per Capita Income | 7,523 | $40,898 |
| Median Family Income | 1,899 | $111,076 |
| Mean Family Income | 1,899 | $122,656 |
| Median Household Income | 2,849 | $99,449 |
| Mean Household Income | 2,849 | $107,206 |
| Income Deficit | 1,899 | $0 |
| Wage / Income Gap (%) | 7,523 | 43.13% |
| Wage / Income Gap ($) | 7,523 | 56.87¢ per $1 |
| Gini / Inequality Index | 7,523 | 0.38 |
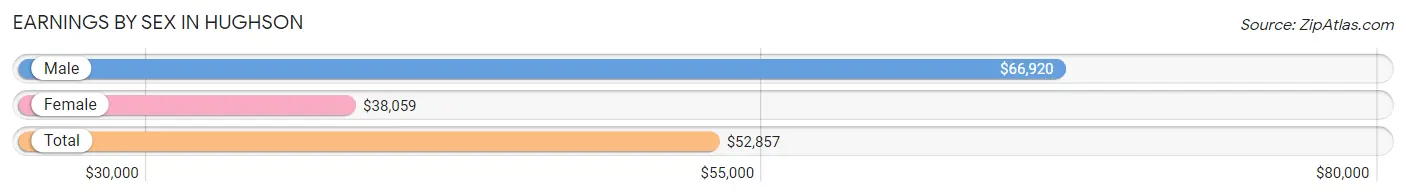
Earnings by Sex in Hughson
Average Earnings in Hughson are $52,857, $66,920 for men and $38,059 for women, a difference of 43.1%.
| Sex | Number | Average Earnings |
| Male | 2,067 (53.4%) | $66,920 |
| Female | 1,803 (46.6%) | $38,059 |
| Total | 3,870 (100.0%) | $52,857 |
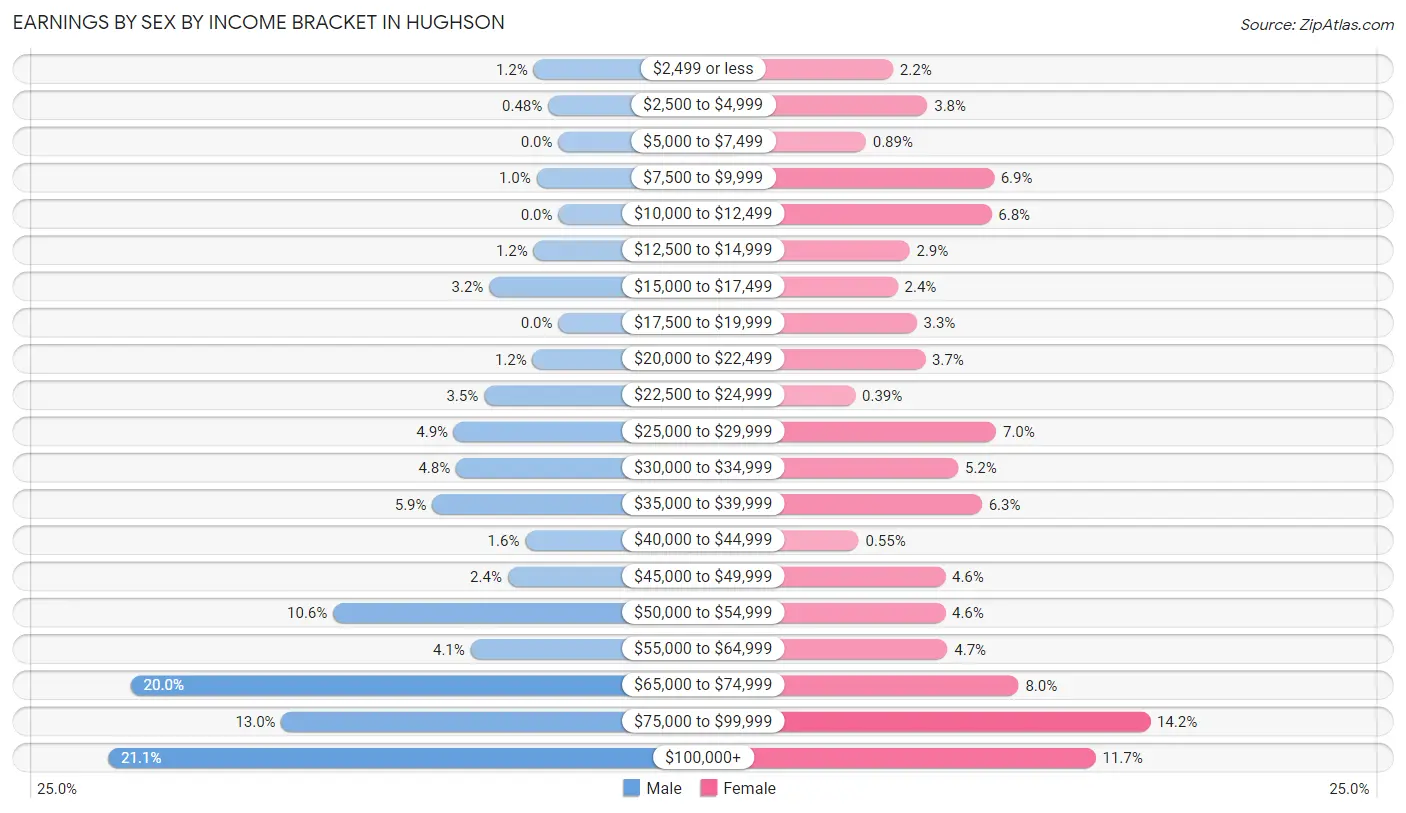
Earnings by Sex by Income Bracket in Hughson
The most common earnings brackets in Hughson are $100,000+ for men (436 | 21.1%) and $75,000 to $99,999 for women (256 | 14.2%).
| Income | Male | Female |
| $2,499 or less | 24 (1.2%) | 39 (2.2%) |
| $2,500 to $4,999 | 10 (0.5%) | 68 (3.8%) |
| $5,000 to $7,499 | 0 (0.0%) | 16 (0.9%) |
| $7,500 to $9,999 | 21 (1.0%) | 124 (6.9%) |
| $10,000 to $12,499 | 0 (0.0%) | 122 (6.8%) |
| $12,500 to $14,999 | 24 (1.2%) | 53 (2.9%) |
| $15,000 to $17,499 | 67 (3.2%) | 43 (2.4%) |
| $17,500 to $19,999 | 0 (0.0%) | 59 (3.3%) |
| $20,000 to $22,499 | 25 (1.2%) | 66 (3.7%) |
| $22,500 to $24,999 | 72 (3.5%) | 7 (0.4%) |
| $25,000 to $29,999 | 101 (4.9%) | 126 (7.0%) |
| $30,000 to $34,999 | 99 (4.8%) | 94 (5.2%) |
| $35,000 to $39,999 | 122 (5.9%) | 114 (6.3%) |
| $40,000 to $44,999 | 32 (1.5%) | 10 (0.5%) |
| $45,000 to $49,999 | 49 (2.4%) | 83 (4.6%) |
| $50,000 to $54,999 | 218 (10.5%) | 83 (4.6%) |
| $55,000 to $64,999 | 85 (4.1%) | 85 (4.7%) |
| $65,000 to $74,999 | 414 (20.0%) | 145 (8.0%) |
| $75,000 to $99,999 | 268 (13.0%) | 256 (14.2%) |
| $100,000+ | 436 (21.1%) | 210 (11.7%) |
| Total | 2,067 (100.0%) | 1,803 (100.0%) |
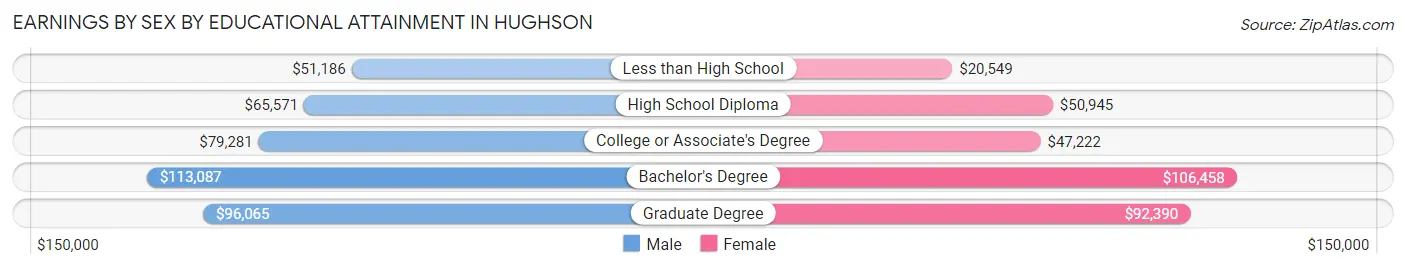
Earnings by Sex by Educational Attainment in Hughson
Average earnings in Hughson are $69,224 for men and $50,396 for women, a difference of 27.2%. Men with an educational attainment of bachelor's degree enjoy the highest average annual earnings of $113,087, while those with less than high school education earn the least with $51,186. Women with an educational attainment of bachelor's degree earn the most with the average annual earnings of $106,458, while those with less than high school education have the smallest earnings of $20,549.
| Educational Attainment | Male Income | Female Income |
| Less than High School | $51,186 | $20,549 |
| High School Diploma | $65,571 | $50,945 |
| College or Associate's Degree | $79,281 | $47,222 |
| Bachelor's Degree | $113,087 | $106,458 |
| Graduate Degree | $96,065 | $92,390 |
| Total | $69,224 | $50,396 |
Family Income in Hughson
Family Income Brackets in Hughson
According to the Hughson family income data, there are 551 families falling into the $100,000 to $149,999 income range, which is the most common income bracket and makes up 29.0% of all families.
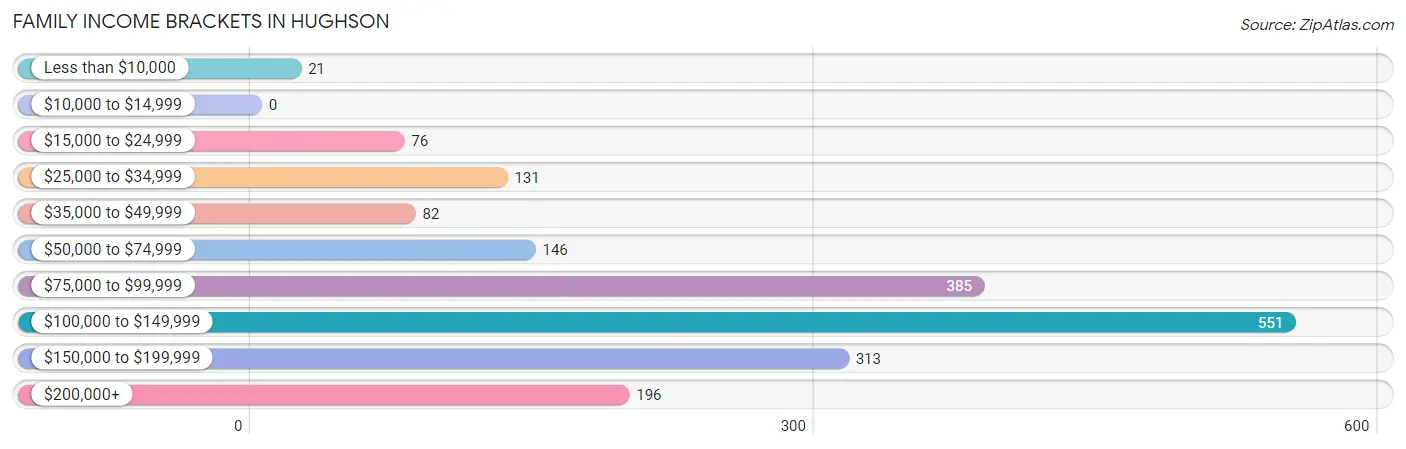
| Income Bracket | # Families | % Families |
| Less than $10,000 | 21 | 1.1% |
| $10,000 to $14,999 | 0 | 0.0% |
| $15,000 to $24,999 | 76 | 4.0% |
| $25,000 to $34,999 | 131 | 6.9% |
| $35,000 to $49,999 | 82 | 4.3% |
| $50,000 to $74,999 | 146 | 7.7% |
| $75,000 to $99,999 | 385 | 20.3% |
| $100,000 to $149,999 | 551 | 29.0% |
| $150,000 to $199,999 | 313 | 16.5% |
| $200,000+ | 196 | 10.3% |
Family Income by Famaliy Size in Hughson
5-person families (226 | 11.9%) account for the highest median family income in Hughson with $173,333 per family, while 2-person families (849 | 44.7%) have the highest median income of $43,262 per family member.
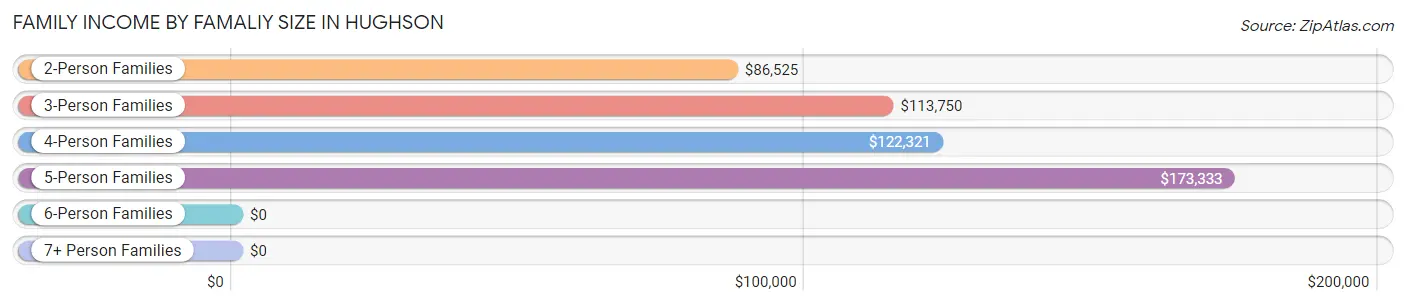
| Income Bracket | # Families | Median Income |
| 2-Person Families | 849 (44.7%) | $86,525 |
| 3-Person Families | 417 (22.0%) | $113,750 |
| 4-Person Families | 295 (15.5%) | $122,321 |
| 5-Person Families | 226 (11.9%) | $173,333 |
| 6-Person Families | 69 (3.6%) | $0 |
| 7+ Person Families | 43 (2.3%) | $0 |
| Total | 1,899 (100.0%) | $111,076 |
Family Income by Number of Earners in Hughson
The median family income in Hughson is $111,076, with families comprising 3+ earners (306) having the highest median family income of $184,100, while families with 1 earner (519) have the lowest median family income of $82,832, accounting for 16.1% and 27.3% of families, respectively.
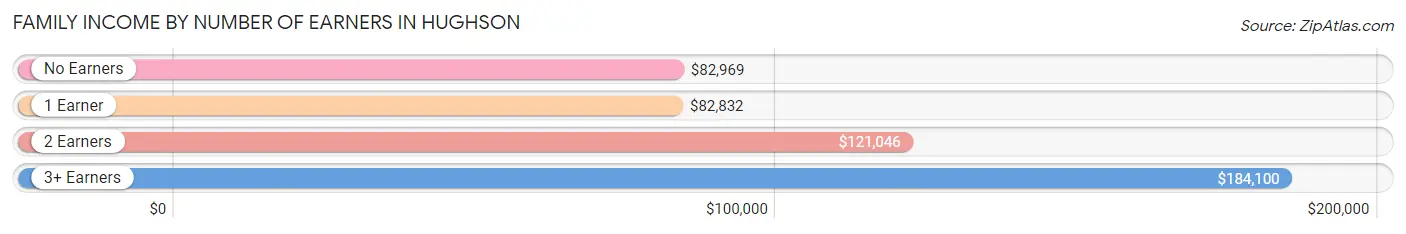
| Number of Earners | # Families | Median Income |
| No Earners | 221 (11.6%) | $82,969 |
| 1 Earner | 519 (27.3%) | $82,832 |
| 2 Earners | 853 (44.9%) | $121,046 |
| 3+ Earners | 306 (16.1%) | $184,100 |
| Total | 1,899 (100.0%) | $111,076 |
Household Income in Hughson
Household Income Brackets in Hughson
With 726 households falling in the category, the $100,000 to $149,999 income range is the most frequent in Hughson, accounting for 25.5% of all households. In contrast, only 23 households (0.8%) fall into the $10,000 to $14,999 income bracket, making it the least populous group.
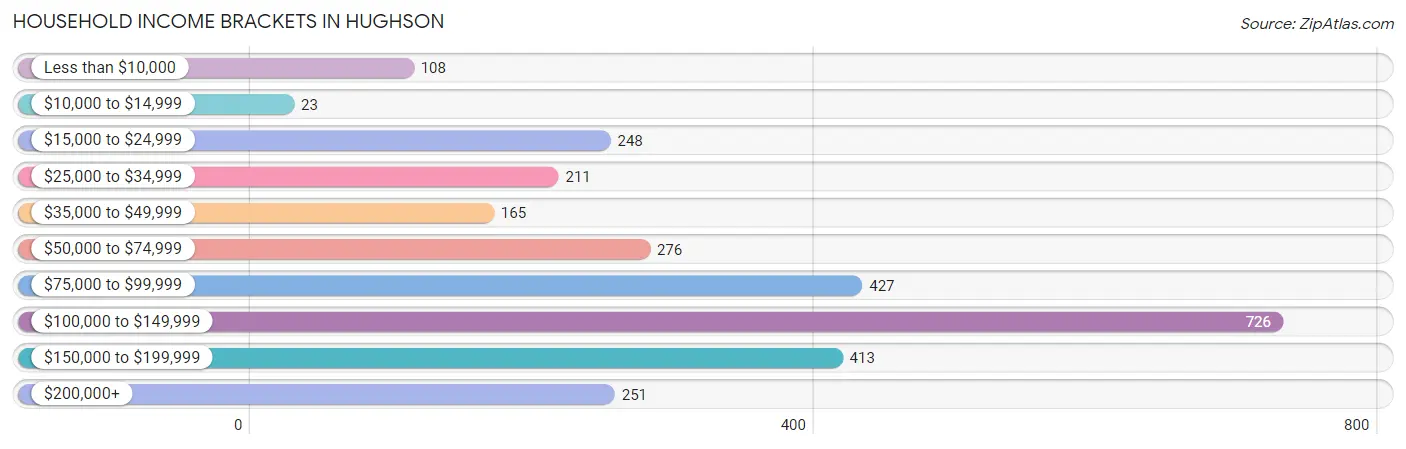
| Income Bracket | # Households | % Households |
| Less than $10,000 | 108 | 3.8% |
| $10,000 to $14,999 | 23 | 0.8% |
| $15,000 to $24,999 | 248 | 8.7% |
| $25,000 to $34,999 | 211 | 7.4% |
| $35,000 to $49,999 | 165 | 5.8% |
| $50,000 to $74,999 | 276 | 9.7% |
| $75,000 to $99,999 | 427 | 15.0% |
| $100,000 to $149,999 | 726 | 25.5% |
| $150,000 to $199,999 | 413 | 14.5% |
| $200,000+ | 251 | 8.8% |
Household Income by Householder Age in Hughson
The median household income in Hughson is $99,449, with the highest median household income of $129,663 found in the 25 to 44 years age bracket for the primary householder. A total of 795 households (27.9%) fall into this category. Meanwhile, the 15 to 24 years age bracket for the primary householder has the lowest median household income of $0, with 63 households (2.2%) in this group.
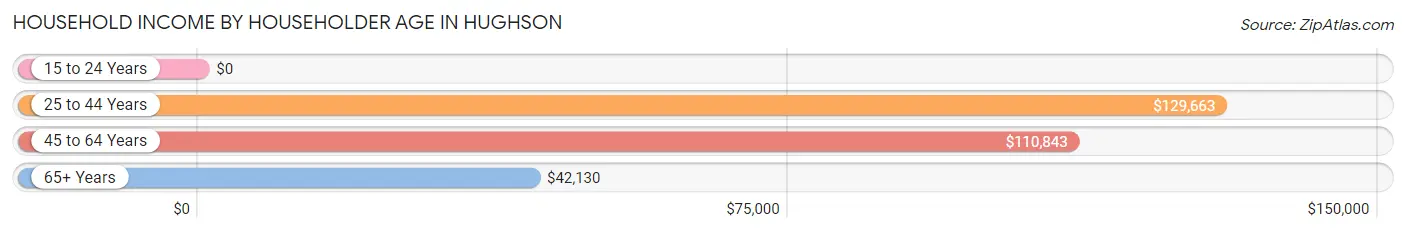
| Income Bracket | # Households | Median Income |
| 15 to 24 Years | 63 (2.2%) | $0 |
| 25 to 44 Years | 795 (27.9%) | $129,663 |
| 45 to 64 Years | 1,037 (36.4%) | $110,843 |
| 65+ Years | 954 (33.5%) | $42,130 |
| Total | 2,849 (100.0%) | $99,449 |
Poverty in Hughson
Income Below Poverty by Sex and Age in Hughson
With 8.3% poverty level for males and 12.1% for females among the residents of Hughson, 15 year old males and 12 to 14 year old females are the most vulnerable to poverty, with 51 males (72.9%) and 122 females (43.6%) in their respective age groups living below the poverty level.
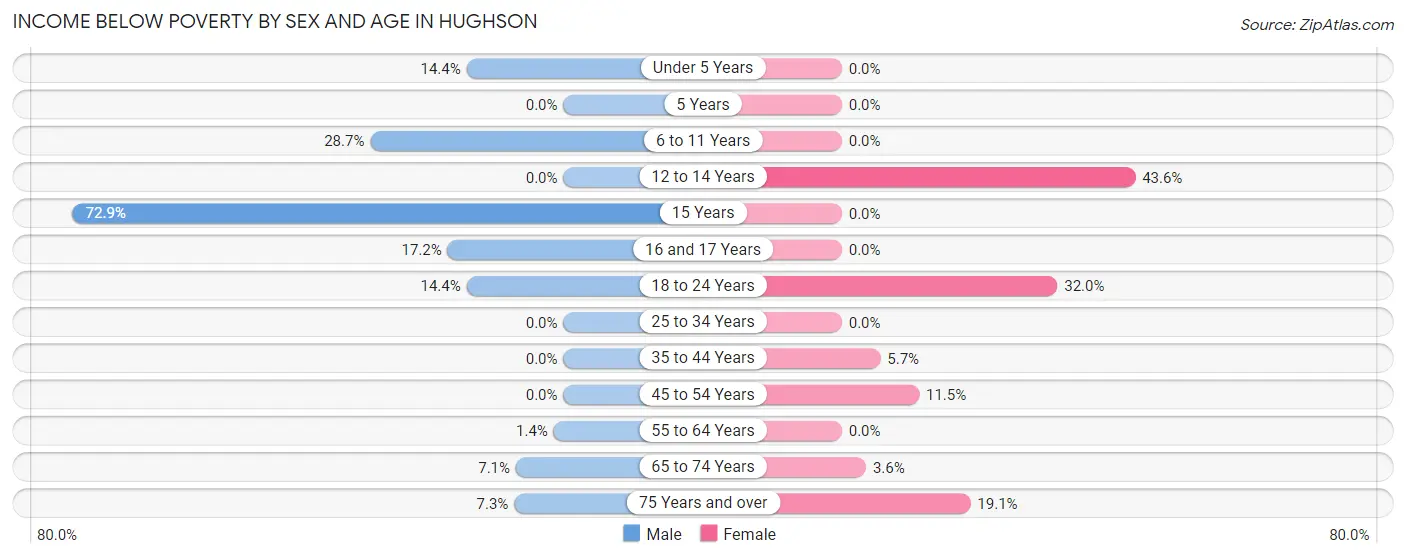
| Age Bracket | Male | Female |
| Under 5 Years | 24 (14.4%) | 0 (0.0%) |
| 5 Years | 0 (0.0%) | 0 (0.0%) |
| 6 to 11 Years | 113 (28.7%) | 0 (0.0%) |
| 12 to 14 Years | 0 (0.0%) | 122 (43.6%) |
| 15 Years | 51 (72.9%) | 0 (0.0%) |
| 16 and 17 Years | 22 (17.2%) | 0 (0.0%) |
| 18 to 24 Years | 49 (14.4%) | 160 (32.0%) |
| 25 to 34 Years | 0 (0.0%) | 0 (0.0%) |
| 35 to 44 Years | 0 (0.0%) | 27 (5.7%) |
| 45 to 54 Years | 0 (0.0%) | 82 (11.5%) |
| 55 to 64 Years | 6 (1.4%) | 0 (0.0%) |
| 65 to 74 Years | 17 (7.0%) | 11 (3.6%) |
| 75 Years and over | 17 (7.3%) | 72 (19.1%) |
| Total | 299 (8.3%) | 474 (12.1%) |
Income Above Poverty by Sex and Age in Hughson
According to the poverty statistics in Hughson, males aged 5 years and females aged under 5 years are the age groups that are most secure financially, with 100.0% of males and 100.0% of females in these age groups living above the poverty line.
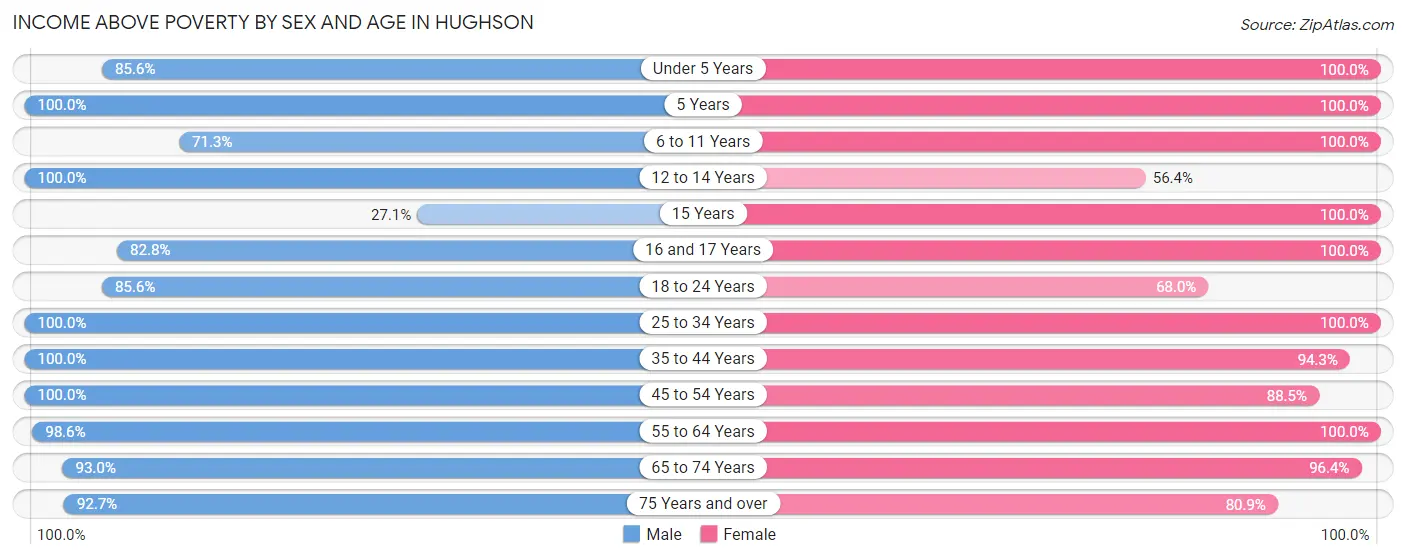
| Age Bracket | Male | Female |
| Under 5 Years | 143 (85.6%) | 168 (100.0%) |
| 5 Years | 40 (100.0%) | 41 (100.0%) |
| 6 to 11 Years | 281 (71.3%) | 190 (100.0%) |
| 12 to 14 Years | 125 (100.0%) | 158 (56.4%) |
| 15 Years | 19 (27.1%) | 133 (100.0%) |
| 16 and 17 Years | 106 (82.8%) | 64 (100.0%) |
| 18 to 24 Years | 292 (85.6%) | 340 (68.0%) |
| 25 to 34 Years | 435 (100.0%) | 294 (100.0%) |
| 35 to 44 Years | 366 (100.0%) | 445 (94.3%) |
| 45 to 54 Years | 640 (100.0%) | 633 (88.5%) |
| 55 to 64 Years | 411 (98.6%) | 364 (100.0%) |
| 65 to 74 Years | 224 (92.9%) | 295 (96.4%) |
| 75 Years and over | 216 (92.7%) | 305 (80.9%) |
| Total | 3,298 (91.7%) | 3,430 (87.9%) |
Income Below Poverty Among Married-Couple Families in Hughson
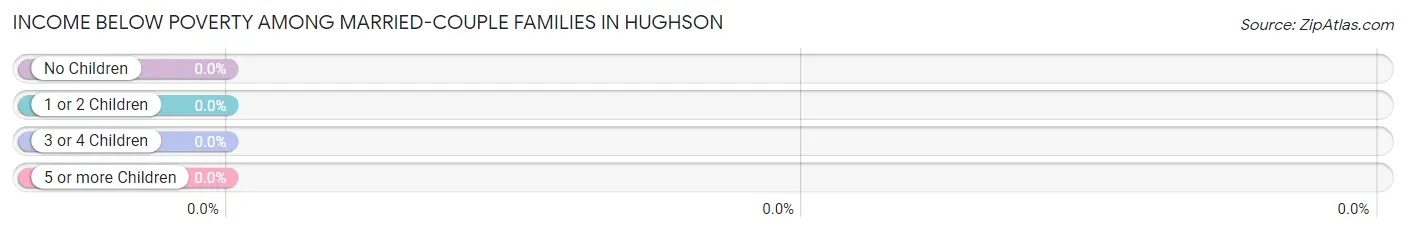
| Children | Above Poverty | Below Poverty |
| No Children | 765 (100.0%) | 0 (0.0%) |
| 1 or 2 Children | 317 (100.0%) | 0 (0.0%) |
| 3 or 4 Children | 109 (100.0%) | 0 (0.0%) |
| 5 or more Children | 23 (100.0%) | 0 (0.0%) |
| Total | 1,214 (100.0%) | 0 (0.0%) |
Income Below Poverty Among Single-Parent Households in Hughson
According to the poverty data in Hughson, 6.5% or 16 single-father households and 18.7% or 82 single-mother households are living below the poverty line. Among single-father households, those with 1 or 2 children have the highest poverty rate, with 16 households (19.1%) experiencing poverty. Likewise, among single-mother households, those with 5 or more children have the highest poverty rate, with 20 households (100.0%) falling below the poverty line.
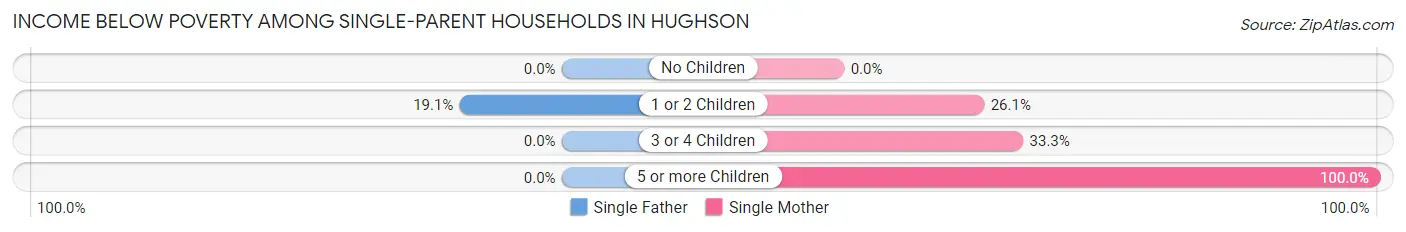
| Children | Single Father | Single Mother |
| No Children | 0 (0.0%) | 0 (0.0%) |
| 1 or 2 Children | 16 (19.1%) | 42 (26.1%) |
| 3 or 4 Children | 0 (0.0%) | 20 (33.3%) |
| 5 or more Children | 0 (0.0%) | 20 (100.0%) |
| Total | 16 (6.5%) | 82 (18.7%) |
Income Below Poverty Among Married-Couple vs Single-Parent Households in Hughson
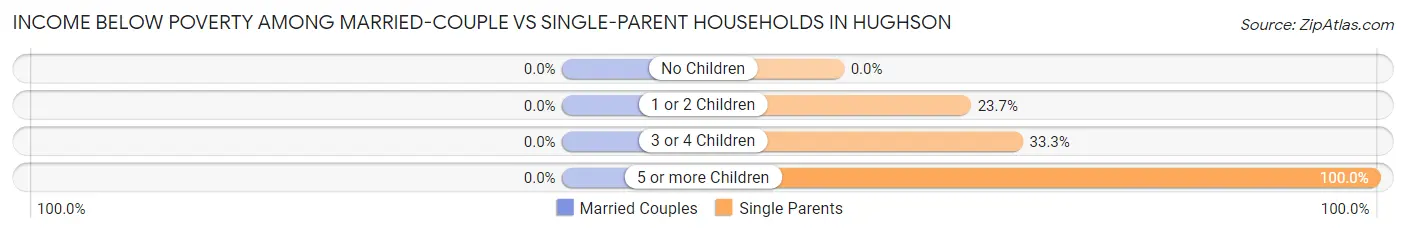
| Children | Married-Couple Families | Single-Parent Households |
| No Children | 0 (0.0%) | 0 (0.0%) |
| 1 or 2 Children | 0 (0.0%) | 58 (23.7%) |
| 3 or 4 Children | 0 (0.0%) | 20 (33.3%) |
| 5 or more Children | 0 (0.0%) | 20 (100.0%) |
| Total | 0 (0.0%) | 98 (14.3%) |
Race in Hughson
The most populous races in Hughson are White / Caucasian (5,331 | 70.9%), Hispanic or Latino (3,037 | 40.4%), and Two or more Races (1,196 | 15.9%).
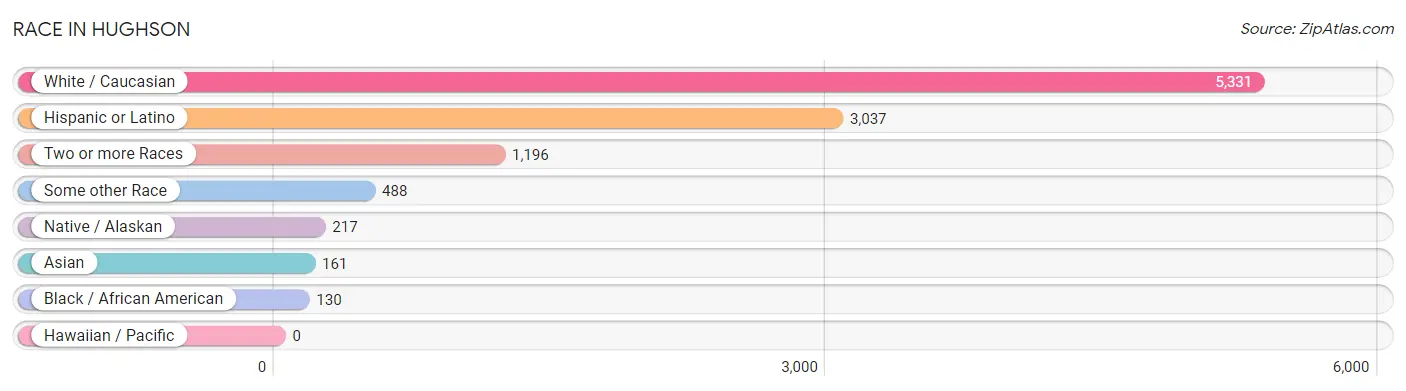
| Race | # Population | % Population |
| Asian | 161 | 2.1% |
| Black / African American | 130 | 1.7% |
| Hawaiian / Pacific | 0 | 0.0% |
| Hispanic or Latino | 3,037 | 40.4% |
| Native / Alaskan | 217 | 2.9% |
| White / Caucasian | 5,331 | 70.9% |
| Two or more Races | 1,196 | 15.9% |
| Some other Race | 488 | 6.5% |
| Total | 7,523 | 100.0% |
Ancestry in Hughson
The most populous ancestries reported in Hughson are Mexican (2,648 | 35.2%), German (871 | 11.6%), Irish (686 | 9.1%), English (680 | 9.0%), and Portuguese (508 | 6.8%), together accounting for 71.7% of all Hughson residents.
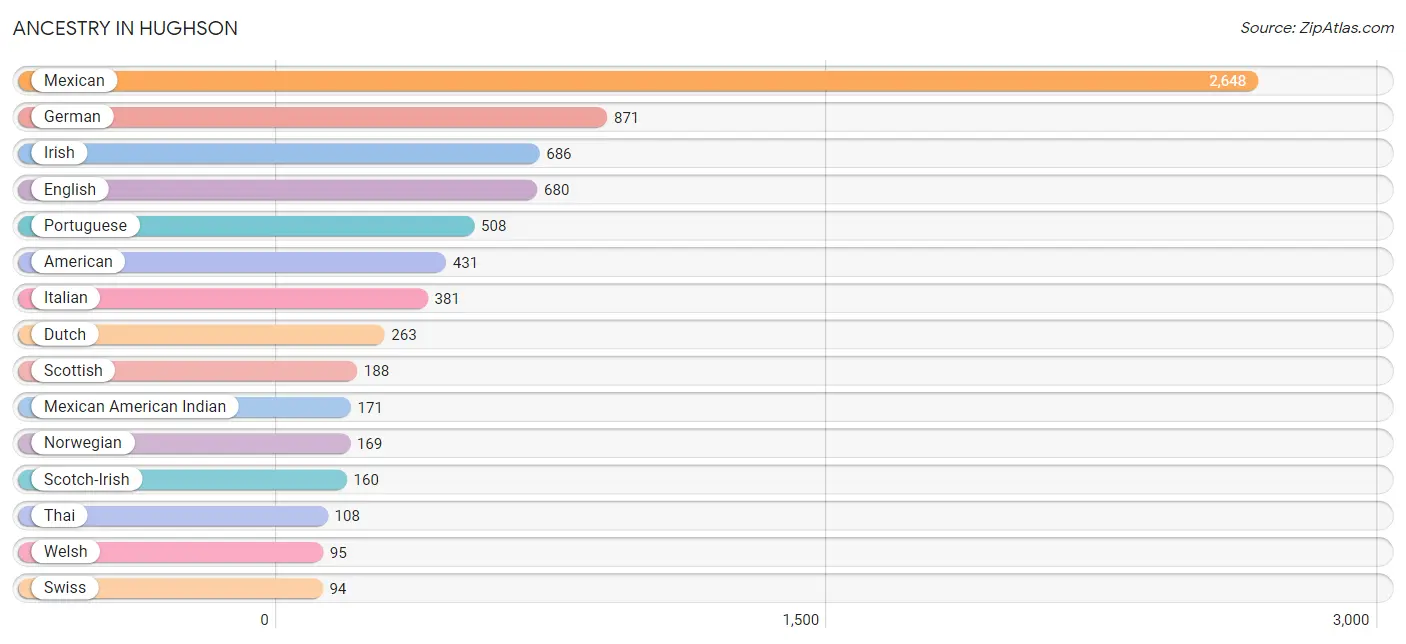
| Ancestry | # Population | % Population |
| American | 431 | 5.7% |
| Australian | 12 | 0.2% |
| Austrian | 67 | 0.9% |
| Bhutanese | 7 | 0.1% |
| British | 20 | 0.3% |
| Cajun | 23 | 0.3% |
| Central American | 15 | 0.2% |
| Cherokee | 55 | 0.7% |
| Croatian | 9 | 0.1% |
| Dutch | 263 | 3.5% |
| English | 680 | 9.0% |
| European | 41 | 0.5% |
| French | 78 | 1.0% |
| French Canadian | 19 | 0.3% |
| German | 871 | 11.6% |
| Hungarian | 15 | 0.2% |
| Irish | 686 | 9.1% |
| Italian | 381 | 5.1% |
| Japanese | 1 | 0.0% |
| Korean | 52 | 0.7% |
| Mexican | 2,648 | 35.2% |
| Mexican American Indian | 171 | 2.3% |
| Norwegian | 169 | 2.2% |
| Panamanian | 15 | 0.2% |
| Peruvian | 9 | 0.1% |
| Polish | 76 | 1.0% |
| Portuguese | 508 | 6.8% |
| Potawatomi | 8 | 0.1% |
| Puerto Rican | 30 | 0.4% |
| Scotch-Irish | 160 | 2.1% |
| Scottish | 188 | 2.5% |
| South American | 9 | 0.1% |
| Swedish | 24 | 0.3% |
| Swiss | 94 | 1.3% |
| Thai | 108 | 1.4% |
| Welsh | 95 | 1.3% |
| Yugoslavian | 11 | 0.2% | View All 37 Rows |
Immigrants in Hughson
The most numerous immigrant groups reported in Hughson came from Central America (1,022 | 13.6%), Latin America (1,022 | 13.6%), Mexico (1,015 | 13.5%), Europe (22 | 0.3%), and Germany (22 | 0.3%), together accounting for 41.2% of all Hughson residents.
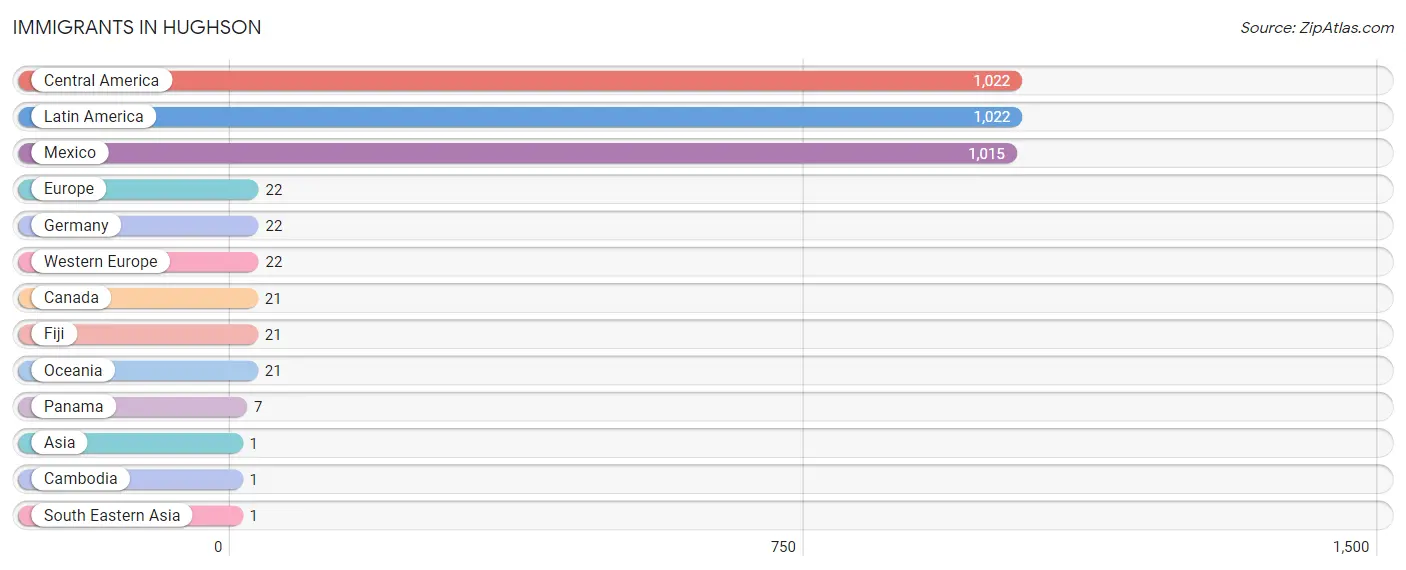
| Immigration Origin | # Population | % Population |
| Asia | 1 | 0.0% |
| Cambodia | 1 | 0.0% |
| Canada | 21 | 0.3% |
| Central America | 1,022 | 13.6% |
| Europe | 22 | 0.3% |
| Fiji | 21 | 0.3% |
| Germany | 22 | 0.3% |
| Latin America | 1,022 | 13.6% |
| Mexico | 1,015 | 13.5% |
| Oceania | 21 | 0.3% |
| Panama | 7 | 0.1% |
| South Eastern Asia | 1 | 0.0% |
| Western Europe | 22 | 0.3% | View All 13 Rows |
Sex and Age in Hughson
Sex and Age in Hughson
The most populous age groups in Hughson are 50 to 54 Years (355 | 9.8%) for men and 15 to 19 Years (409 | 10.5%) for women.
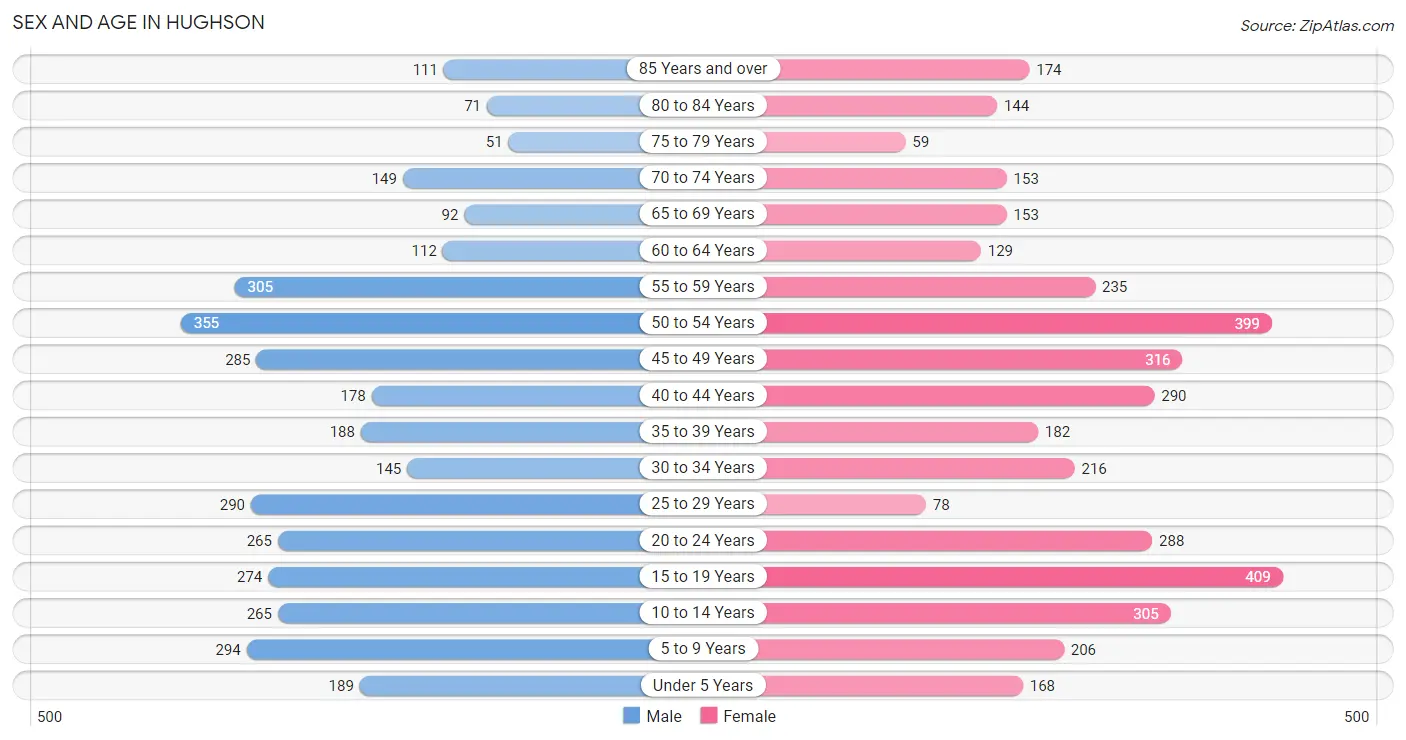
| Age Bracket | Male | Female |
| Under 5 Years | 189 (5.2%) | 168 (4.3%) |
| 5 to 9 Years | 294 (8.1%) | 206 (5.3%) |
| 10 to 14 Years | 265 (7.3%) | 305 (7.8%) |
| 15 to 19 Years | 274 (7.6%) | 409 (10.5%) |
| 20 to 24 Years | 265 (7.3%) | 288 (7.4%) |
| 25 to 29 Years | 290 (8.0%) | 78 (2.0%) |
| 30 to 34 Years | 145 (4.0%) | 216 (5.5%) |
| 35 to 39 Years | 188 (5.2%) | 182 (4.7%) |
| 40 to 44 Years | 178 (4.9%) | 290 (7.4%) |
| 45 to 49 Years | 285 (7.9%) | 316 (8.1%) |
| 50 to 54 Years | 355 (9.8%) | 399 (10.2%) |
| 55 to 59 Years | 305 (8.4%) | 235 (6.0%) |
| 60 to 64 Years | 112 (3.1%) | 129 (3.3%) |
| 65 to 69 Years | 92 (2.5%) | 153 (3.9%) |
| 70 to 74 Years | 149 (4.1%) | 153 (3.9%) |
| 75 to 79 Years | 51 (1.4%) | 59 (1.5%) |
| 80 to 84 Years | 71 (2.0%) | 144 (3.7%) |
| 85 Years and over | 111 (3.1%) | 174 (4.5%) |
| Total | 3,619 (100.0%) | 3,904 (100.0%) |
Families and Households in Hughson
Median Family Size in Hughson
The median family size in Hughson is 3.33 persons per family, with married-couple families (1,214 | 63.9%) accounting for the largest median family size of 3.38 persons per family. On the other hand, single male/father families (247 | 13.0%) represent the smallest median family size with 3.04 persons per family.
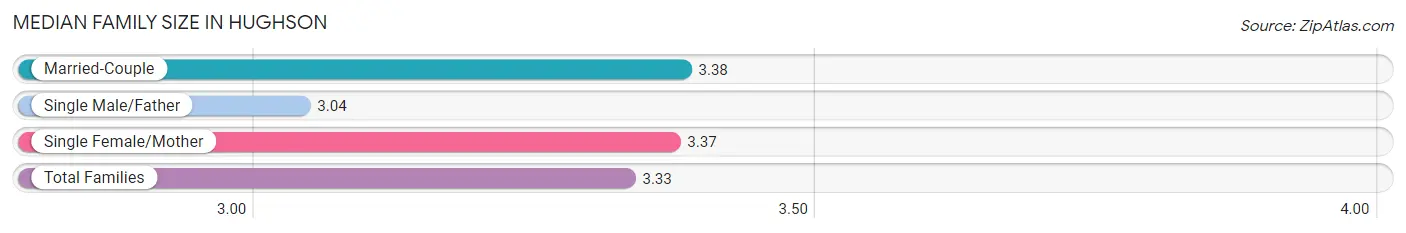
| Family Type | # Families | Family Size |
| Married-Couple | 1,214 (63.9%) | 3.38 |
| Single Male/Father | 247 (13.0%) | 3.04 |
| Single Female/Mother | 438 (23.1%) | 3.37 |
| Total Families | 1,899 (100.0%) | 3.33 |
Median Household Size in Hughson
The median household size in Hughson is 2.64 persons per household, with single female/mother households (438 | 15.4%) accounting for the largest median household size of 3.4 persons per household. non-family households (950 | 33.4%) represent the smallest median household size with 1.19 persons per household.
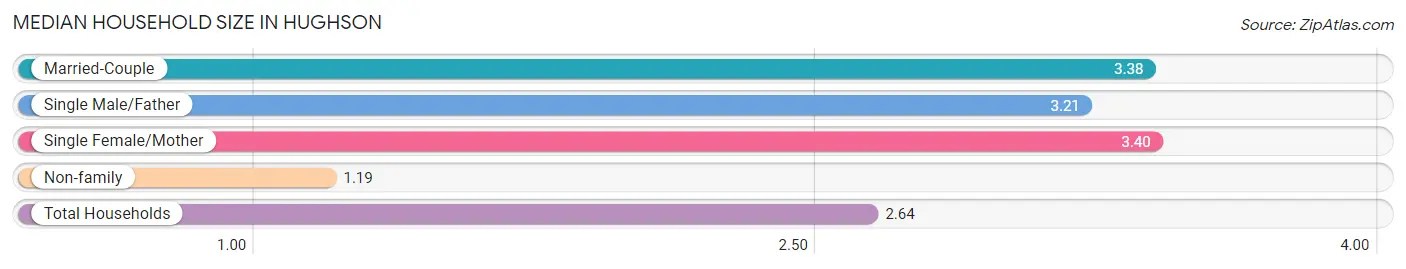
| Household Type | # Households | Household Size |
| Married-Couple | 1,214 (42.6%) | 3.38 |
| Single Male/Father | 247 (8.7%) | 3.21 |
| Single Female/Mother | 438 (15.4%) | 3.40 |
| Non-family | 950 (33.4%) | 1.19 |
| Total Households | 2,849 (100.0%) | 2.64 |
Household Size by Marriage Status in Hughson
Out of a total of 2,849 households in Hughson, 1,899 (66.6%) are family households, while 950 (33.4%) are nonfamily households. The most numerous type of family households are 2-person households, comprising 841, and the most common type of nonfamily households are 1-person households, comprising 762.
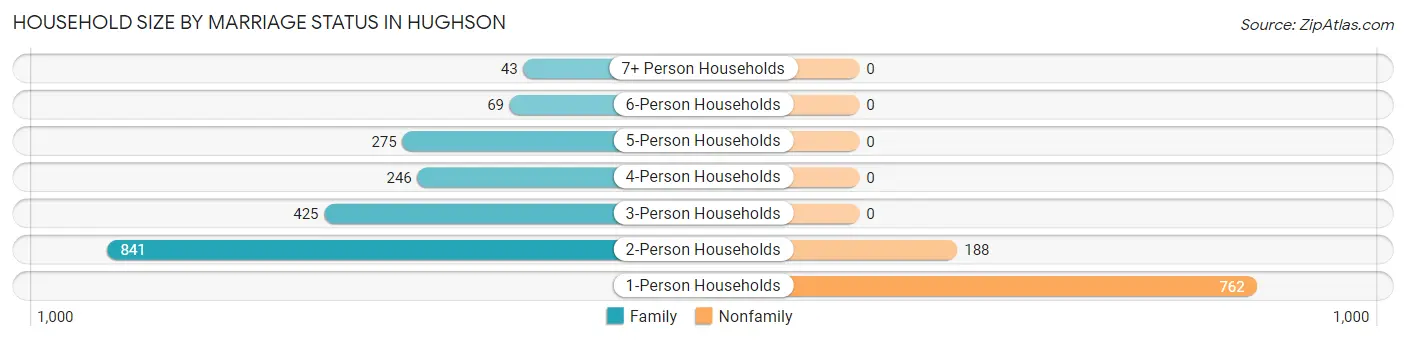
| Household Size | Family Households | Nonfamily Households |
| 1-Person Households | - | 762 (26.8%) |
| 2-Person Households | 841 (29.5%) | 188 (6.6%) |
| 3-Person Households | 425 (14.9%) | 0 (0.0%) |
| 4-Person Households | 246 (8.6%) | 0 (0.0%) |
| 5-Person Households | 275 (9.7%) | 0 (0.0%) |
| 6-Person Households | 69 (2.4%) | 0 (0.0%) |
| 7+ Person Households | 43 (1.5%) | 0 (0.0%) |
| Total | 1,899 (66.6%) | 950 (33.4%) |
Female Fertility in Hughson
Fertility by Age in Hughson
Average fertility rate in Hughson is 40.0 births per 1,000 women. Women in the age bracket of 20 to 34 years have the highest fertility rate with 69.0 births per 1,000 women. Women in the age bracket of 20 to 34 years acount for 54.0% of all women with births.
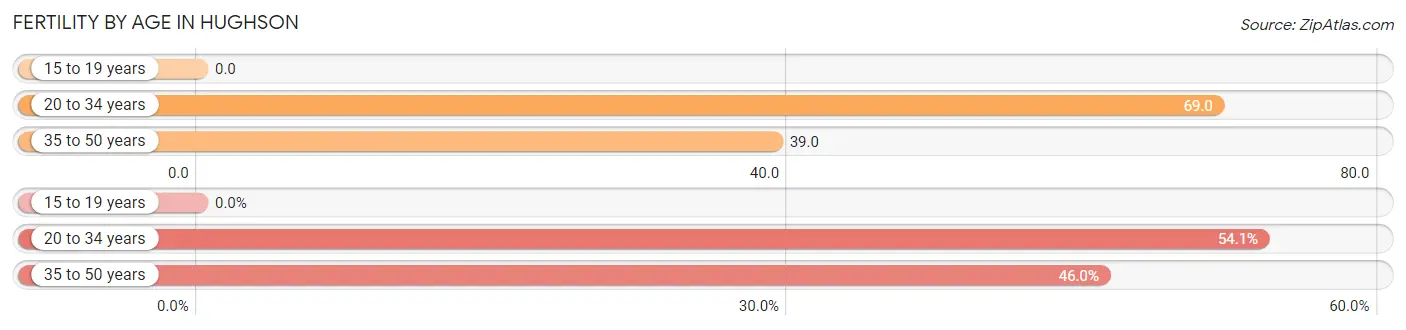
| Age Bracket | Women with Births | Births / 1,000 Women |
| 15 to 19 years | 0 (0.0%) | 0.0 |
| 20 to 34 years | 40 (54.0%) | 69.0 |
| 35 to 50 years | 34 (46.0%) | 39.0 |
| Total | 74 (100.0%) | 40.0 |
Fertility by Age by Marriage Status in Hughson
67.6% of women with births (74) in Hughson are married. The highest percentage of unmarried women with births falls into 20 to 34 years age bracket with 60.0% of them unmarried at the time of birth, while the lowest percentage of unmarried women with births belong to 35 to 50 years age bracket with 0.0% of them unmarried.
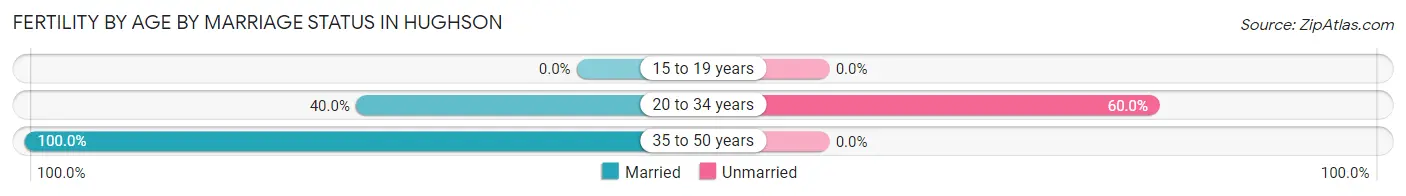
| Age Bracket | Married | Unmarried |
| 15 to 19 years | 0 (0.0%) | 0 (0.0%) |
| 20 to 34 years | 16 (40.0%) | 24 (60.0%) |
| 35 to 50 years | 34 (100.0%) | 0 (0.0%) |
| Total | 50 (67.6%) | 24 (32.4%) |
Fertility by Education in Hughson
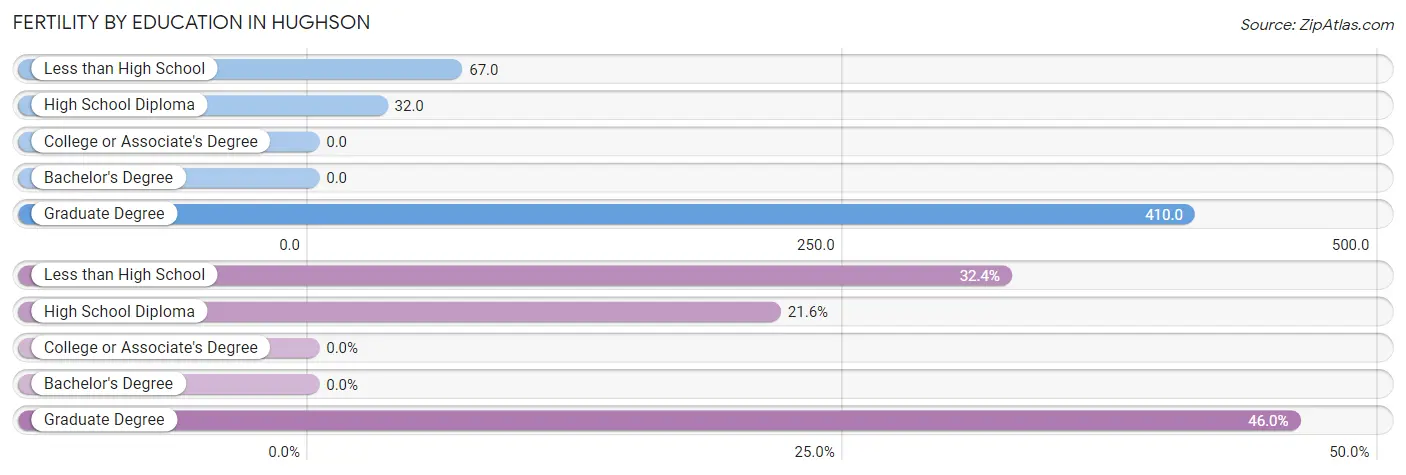
| Educational Attainment | Women with Births | Births / 1,000 Women |
| Less than High School | 24 (32.4%) | 67.0 |
| High School Diploma | 16 (21.6%) | 32.0 |
| College or Associate's Degree | 0 (0.0%) | 0.0 |
| Bachelor's Degree | 0 (0.0%) | 0.0 |
| Graduate Degree | 34 (46.0%) | 410.0 |
| Total | 74 (100.0%) | 40.0 |
Fertility by Education by Marriage Status in Hughson
32.4% of women with births in Hughson are unmarried. Women with the educational attainment of high school diploma are most likely to be married with 100.0% of them married at childbirth, while women with the educational attainment of less than high school are least likely to be married with 100.0% of them unmarried at childbirth.
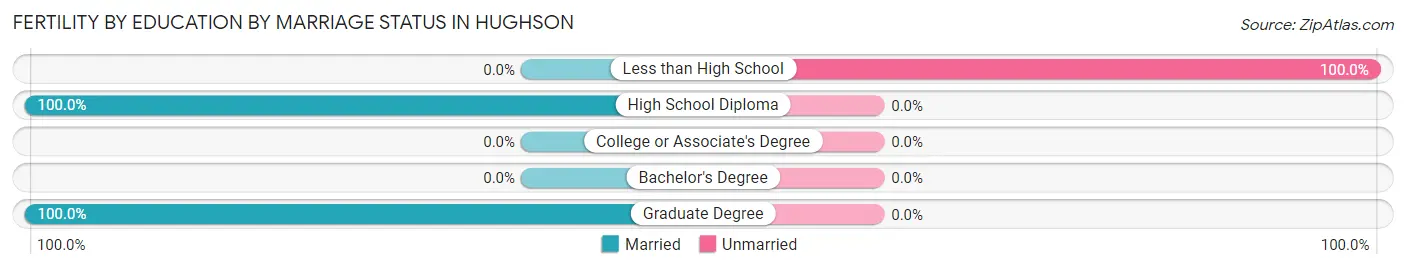
| Educational Attainment | Married | Unmarried |
| Less than High School | 0 (0.0%) | 24 (100.0%) |
| High School Diploma | 16 (100.0%) | 0 (0.0%) |
| College or Associate's Degree | 0 (0.0%) | 0 (0.0%) |
| Bachelor's Degree | 0 (0.0%) | 0 (0.0%) |
| Graduate Degree | 34 (100.0%) | 0 (0.0%) |
| Total | 50 (67.6%) | 24 (32.4%) |
Employment Characteristics in Hughson
Employment by Class of Employer in Hughson
Among the 3,329 employed individuals in Hughson, private company employees (2,400 | 72.1%), local government employees (334 | 10.0%), and not-for-profit organizations (183 | 5.5%) make up the most common classes of employment.
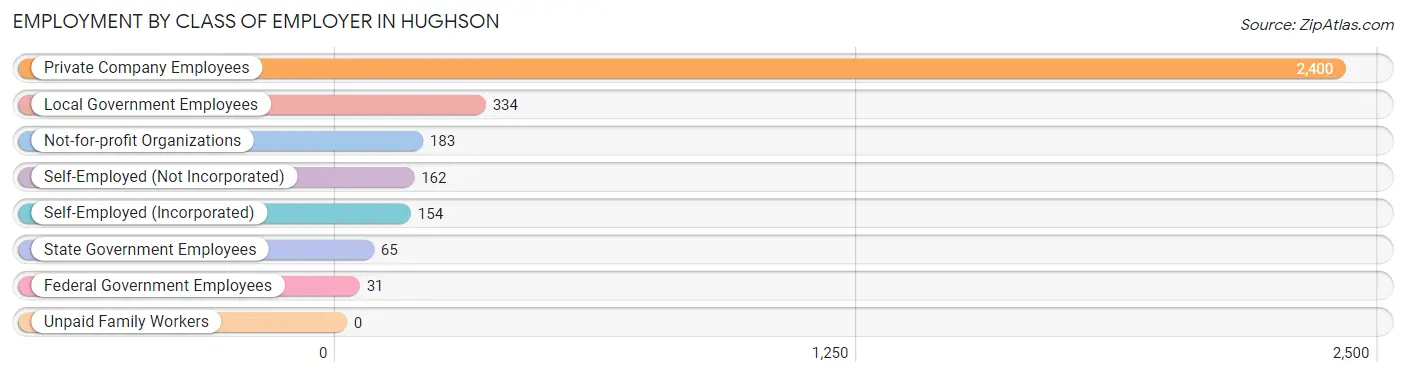
| Employer Class | # Employees | % Employees |
| Private Company Employees | 2,400 | 72.1% |
| Self-Employed (Incorporated) | 154 | 4.6% |
| Self-Employed (Not Incorporated) | 162 | 4.9% |
| Not-for-profit Organizations | 183 | 5.5% |
| Local Government Employees | 334 | 10.0% |
| State Government Employees | 65 | 1.9% |
| Federal Government Employees | 31 | 0.9% |
| Unpaid Family Workers | 0 | 0.0% |
| Total | 3,329 | 100.0% |
Employment Status by Age in Hughson
According to the labor force statistics for Hughson, out of the total population over 16 years of age (5,893), 64.0% or 3,772 individuals are in the labor force, with 6.7% or 253 of them unemployed. The age group with the highest labor force participation rate is 35 to 44 years, with 89.9% or 753 individuals in the labor force. Within the labor force, the 65 to 74 years age range has the highest percentage of unemployed individuals, with 50.0% or 53 of them being unemployed.
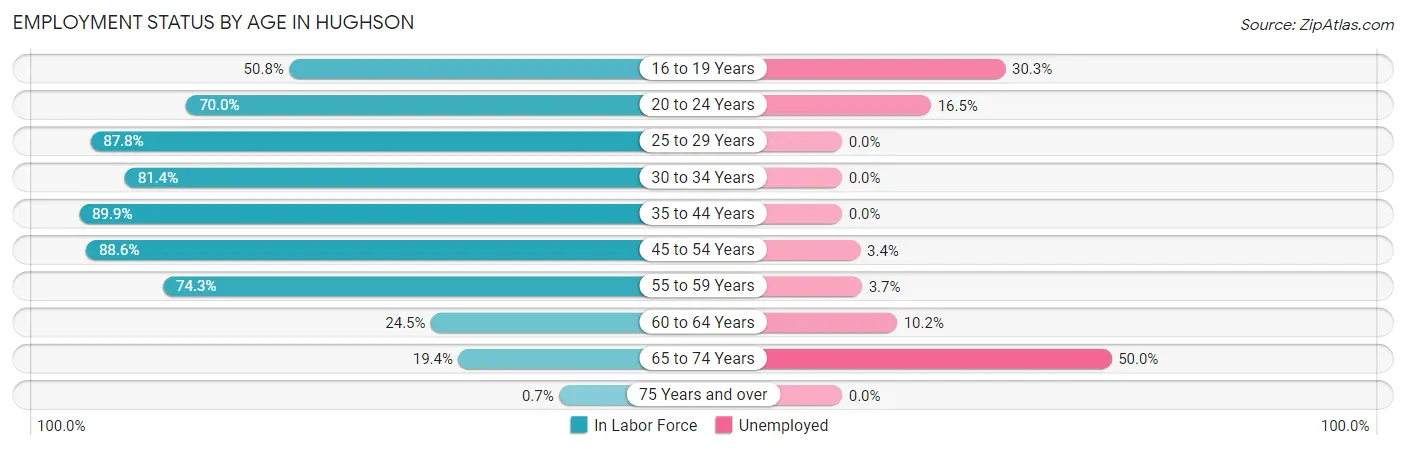
| Age Bracket | In Labor Force | Unemployed |
| 16 to 19 Years | 244 (50.8%) | 74 (30.3%) |
| 20 to 24 Years | 387 (70.0%) | 64 (16.5%) |
| 25 to 29 Years | 323 (87.8%) | 0 (0.0%) |
| 30 to 34 Years | 294 (81.4%) | 0 (0.0%) |
| 35 to 44 Years | 753 (89.9%) | 0 (0.0%) |
| 45 to 54 Years | 1,201 (88.6%) | 41 (3.4%) |
| 55 to 59 Years | 401 (74.3%) | 15 (3.7%) |
| 60 to 64 Years | 59 (24.5%) | 6 (10.2%) |
| 65 to 74 Years | 106 (19.4%) | 53 (50.0%) |
| 75 Years and over | 4 (0.7%) | 0 (0.0%) |
| Total | 3,772 (64.0%) | 253 (6.7%) |
Employment Status by Educational Attainment in Hughson
According to labor force statistics for Hughson, 81.9% of individuals (3,033) out of the total population between 25 and 64 years of age (3,703) are in the labor force, with 2.0% or 61 of them being unemployed. The group with the highest labor force participation rate are those with the educational attainment of bachelor's degree or higher, with 92.1% or 558 individuals in the labor force. Within the labor force, individuals with bachelor's degree or higher education have the highest percentage of unemployment, with 6.3% or 35 of them being unemployed.
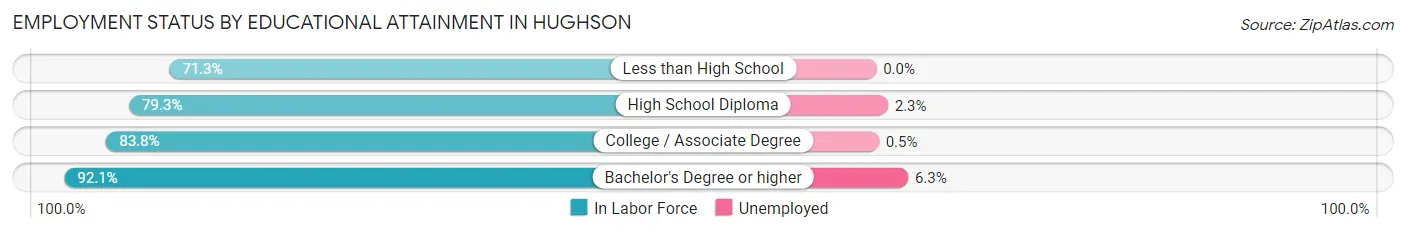
| Educational Attainment | In Labor Force | Unemployed |
| Less than High School | 410 (71.3%) | 0 (0.0%) |
| High School Diploma | 901 (79.3%) | 26 (2.3%) |
| College / Associate Degree | 1,161 (83.8%) | 7 (0.5%) |
| Bachelor's Degree or higher | 558 (92.1%) | 38 (6.3%) |
| Total | 3,033 (81.9%) | 74 (2.0%) |
Employment Occupations by Sex in Hughson
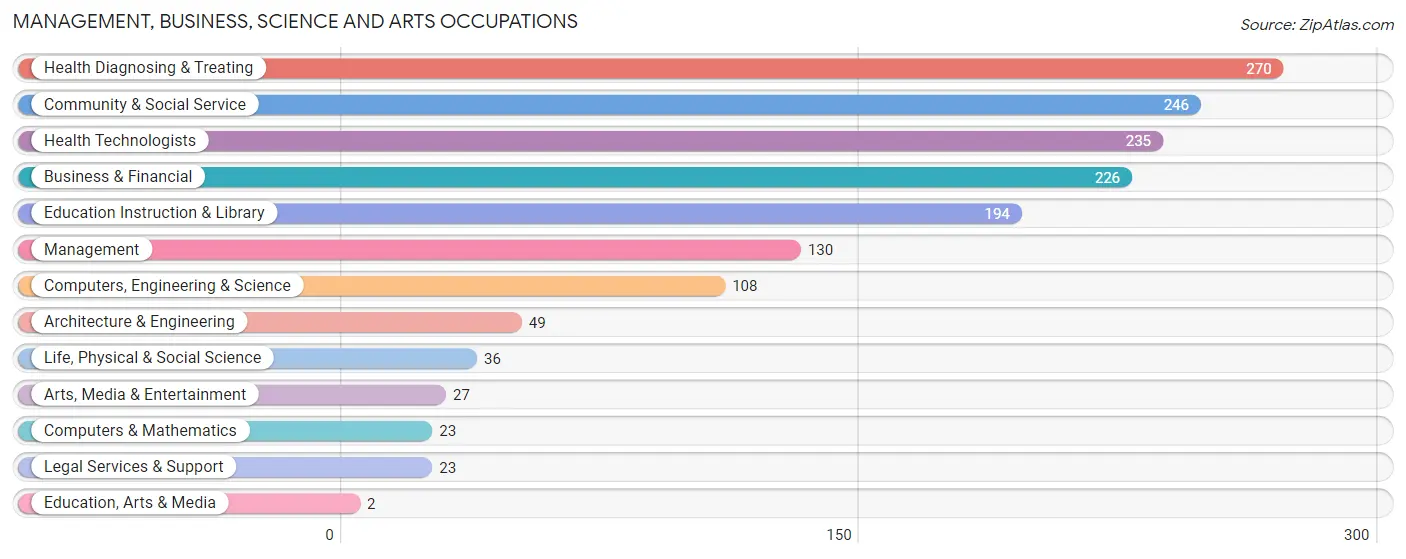
Management, Business, Science and Arts Occupations
The most common Management, Business, Science and Arts occupations in Hughson are Health Diagnosing & Treating (270 | 7.7%), Community & Social Service (246 | 7.0%), Health Technologists (235 | 6.7%), Business & Financial (226 | 6.4%), and Education Instruction & Library (194 | 5.5%).
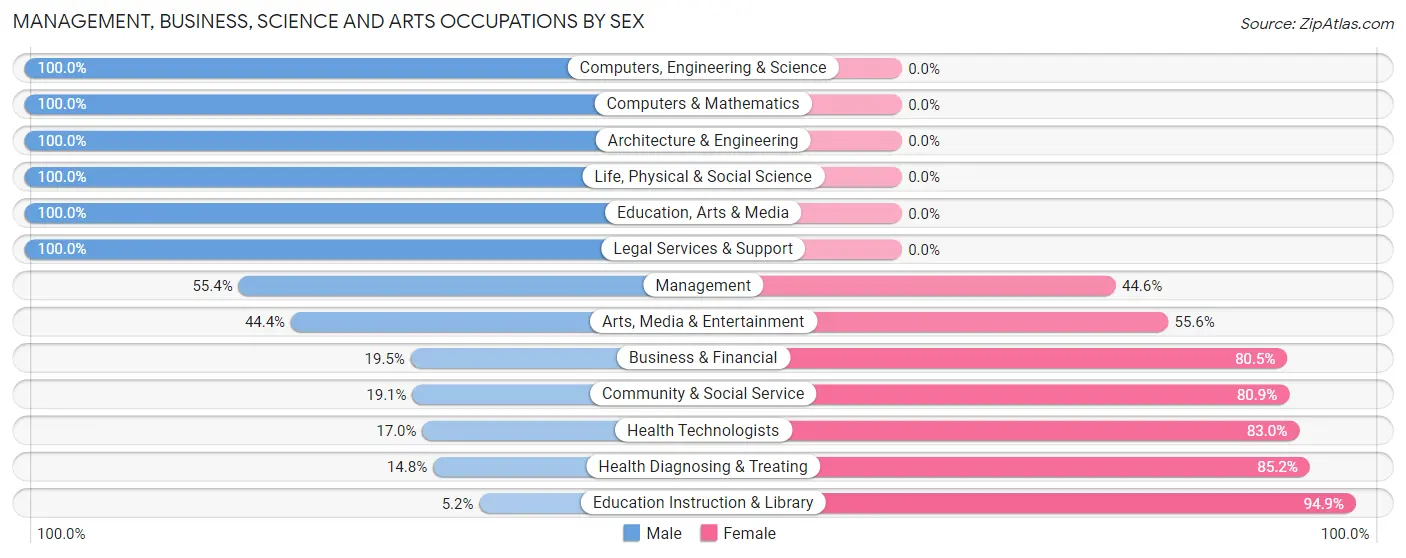
Management, Business, Science and Arts Occupations by Sex
Within the Management, Business, Science and Arts occupations in Hughson, the most male-oriented occupations are Computers, Engineering & Science (100.0%), Computers & Mathematics (100.0%), and Architecture & Engineering (100.0%), while the most female-oriented occupations are Education Instruction & Library (94.9%), Health Diagnosing & Treating (85.2%), and Health Technologists (83.0%).
| Occupation | Male | Female |
| Management | 72 (55.4%) | 58 (44.6%) |
| Business & Financial | 44 (19.5%) | 182 (80.5%) |
| Computers, Engineering & Science | 108 (100.0%) | 0 (0.0%) |
| Computers & Mathematics | 23 (100.0%) | 0 (0.0%) |
| Architecture & Engineering | 49 (100.0%) | 0 (0.0%) |
| Life, Physical & Social Science | 36 (100.0%) | 0 (0.0%) |
| Community & Social Service | 47 (19.1%) | 199 (80.9%) |
| Education, Arts & Media | 2 (100.0%) | 0 (0.0%) |
| Legal Services & Support | 23 (100.0%) | 0 (0.0%) |
| Education Instruction & Library | 10 (5.1%) | 184 (94.9%) |
| Arts, Media & Entertainment | 12 (44.4%) | 15 (55.6%) |
| Health Diagnosing & Treating | 40 (14.8%) | 230 (85.2%) |
| Health Technologists | 40 (17.0%) | 195 (83.0%) |
| Total (Category) | 311 (31.7%) | 669 (68.3%) |
| Total (Overall) | 1,896 (53.9%) | 1,623 (46.1%) |
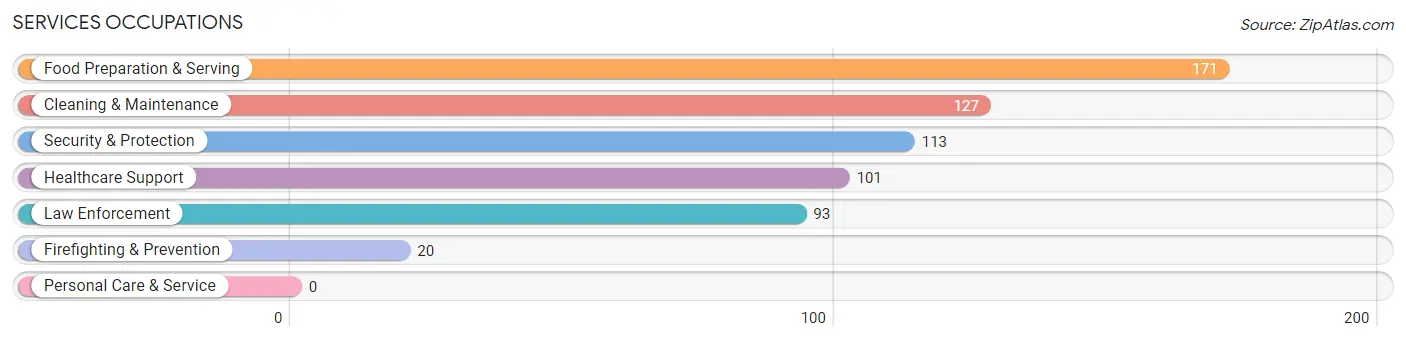
Services Occupations
The most common Services occupations in Hughson are Food Preparation & Serving (171 | 4.9%), Cleaning & Maintenance (127 | 3.6%), Security & Protection (113 | 3.2%), Healthcare Support (101 | 2.9%), and Law Enforcement (93 | 2.6%).
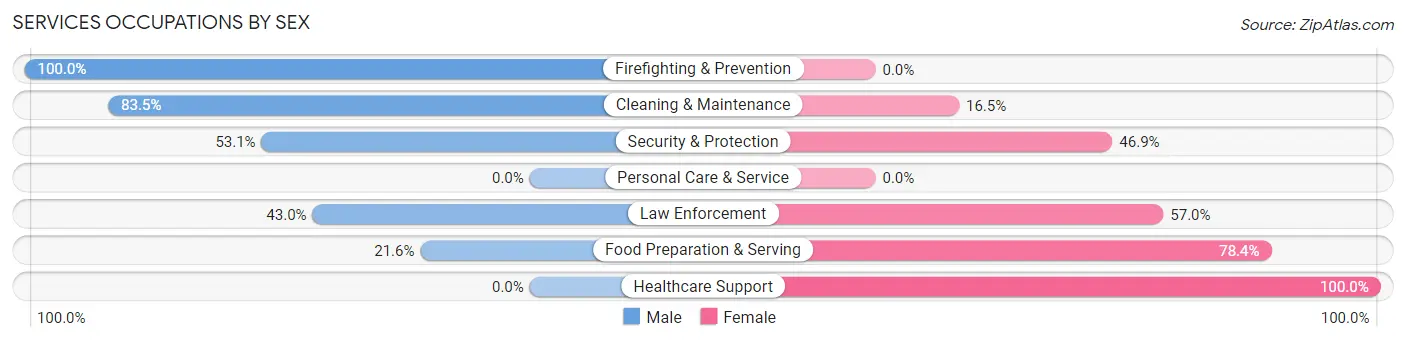
Services Occupations by Sex
Within the Services occupations in Hughson, the most male-oriented occupations are Firefighting & Prevention (100.0%), Cleaning & Maintenance (83.5%), and Security & Protection (53.1%), while the most female-oriented occupations are Healthcare Support (100.0%), Food Preparation & Serving (78.4%), and Law Enforcement (57.0%).
| Occupation | Male | Female |
| Healthcare Support | 0 (0.0%) | 101 (100.0%) |
| Security & Protection | 60 (53.1%) | 53 (46.9%) |
| Firefighting & Prevention | 20 (100.0%) | 0 (0.0%) |
| Law Enforcement | 40 (43.0%) | 53 (57.0%) |
| Food Preparation & Serving | 37 (21.6%) | 134 (78.4%) |
| Cleaning & Maintenance | 106 (83.5%) | 21 (16.5%) |
| Personal Care & Service | 0 (0.0%) | 0 (0.0%) |
| Total (Category) | 203 (39.7%) | 309 (60.4%) |
| Total (Overall) | 1,896 (53.9%) | 1,623 (46.1%) |
Sales and Office Occupations
The most common Sales and Office occupations in Hughson are Office & Administration (423 | 12.0%), and Sales & Related (384 | 10.9%).
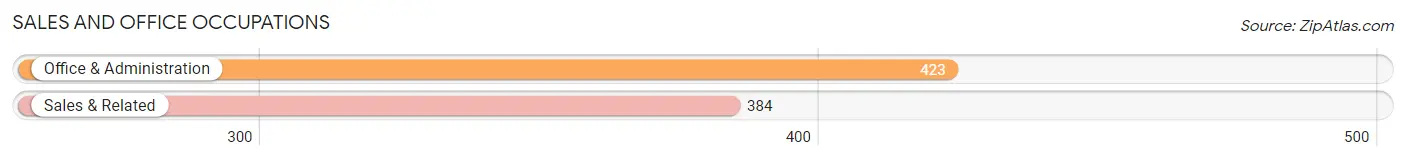
Sales and Office Occupations by Sex
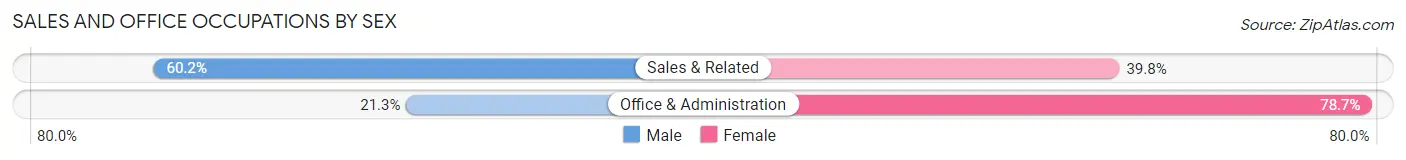
| Occupation | Male | Female |
| Sales & Related | 231 (60.2%) | 153 (39.8%) |
| Office & Administration | 90 (21.3%) | 333 (78.7%) |
| Total (Category) | 321 (39.8%) | 486 (60.2%) |
| Total (Overall) | 1,896 (53.9%) | 1,623 (46.1%) |
Natural Resources, Construction and Maintenance Occupations
The most common Natural Resources, Construction and Maintenance occupations in Hughson are Installation, Maintenance & Repair (185 | 5.3%), Construction & Extraction (161 | 4.6%), and Farming, Fishing & Forestry (111 | 3.2%).
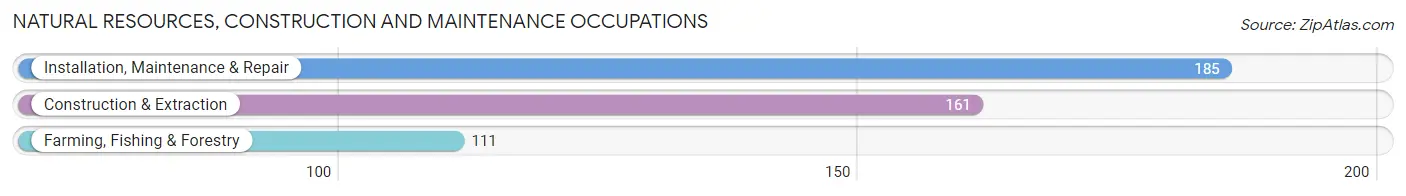
Natural Resources, Construction and Maintenance Occupations by Sex
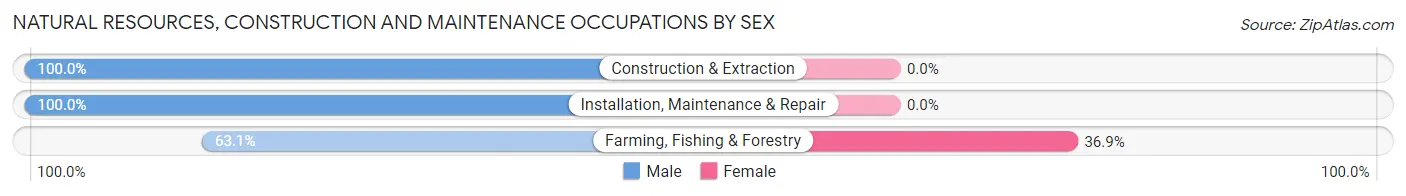
| Occupation | Male | Female |
| Farming, Fishing & Forestry | 70 (63.1%) | 41 (36.9%) |
| Construction & Extraction | 161 (100.0%) | 0 (0.0%) |
| Installation, Maintenance & Repair | 185 (100.0%) | 0 (0.0%) |
| Total (Category) | 416 (91.0%) | 41 (9.0%) |
| Total (Overall) | 1,896 (53.9%) | 1,623 (46.1%) |
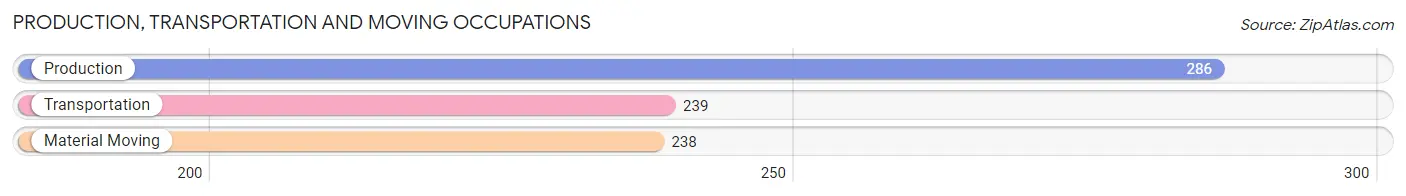
Production, Transportation and Moving Occupations
The most common Production, Transportation and Moving occupations in Hughson are Production (286 | 8.1%), Transportation (239 | 6.8%), and Material Moving (238 | 6.8%).
Production, Transportation and Moving Occupations by Sex
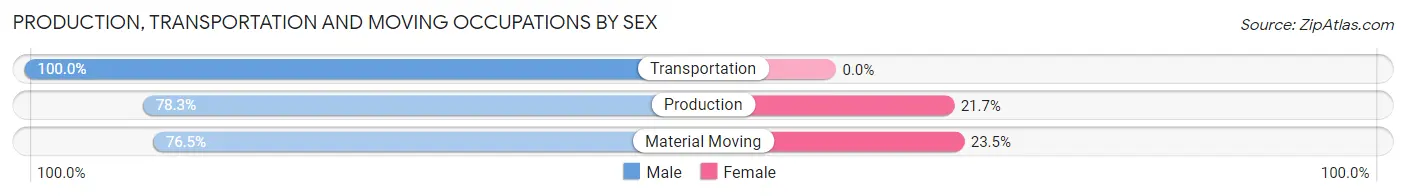
| Occupation | Male | Female |
| Production | 224 (78.3%) | 62 (21.7%) |
| Transportation | 239 (100.0%) | 0 (0.0%) |
| Material Moving | 182 (76.5%) | 56 (23.5%) |
| Total (Category) | 645 (84.5%) | 118 (15.5%) |
| Total (Overall) | 1,896 (53.9%) | 1,623 (46.1%) |
Employment Industries by Sex in Hughson
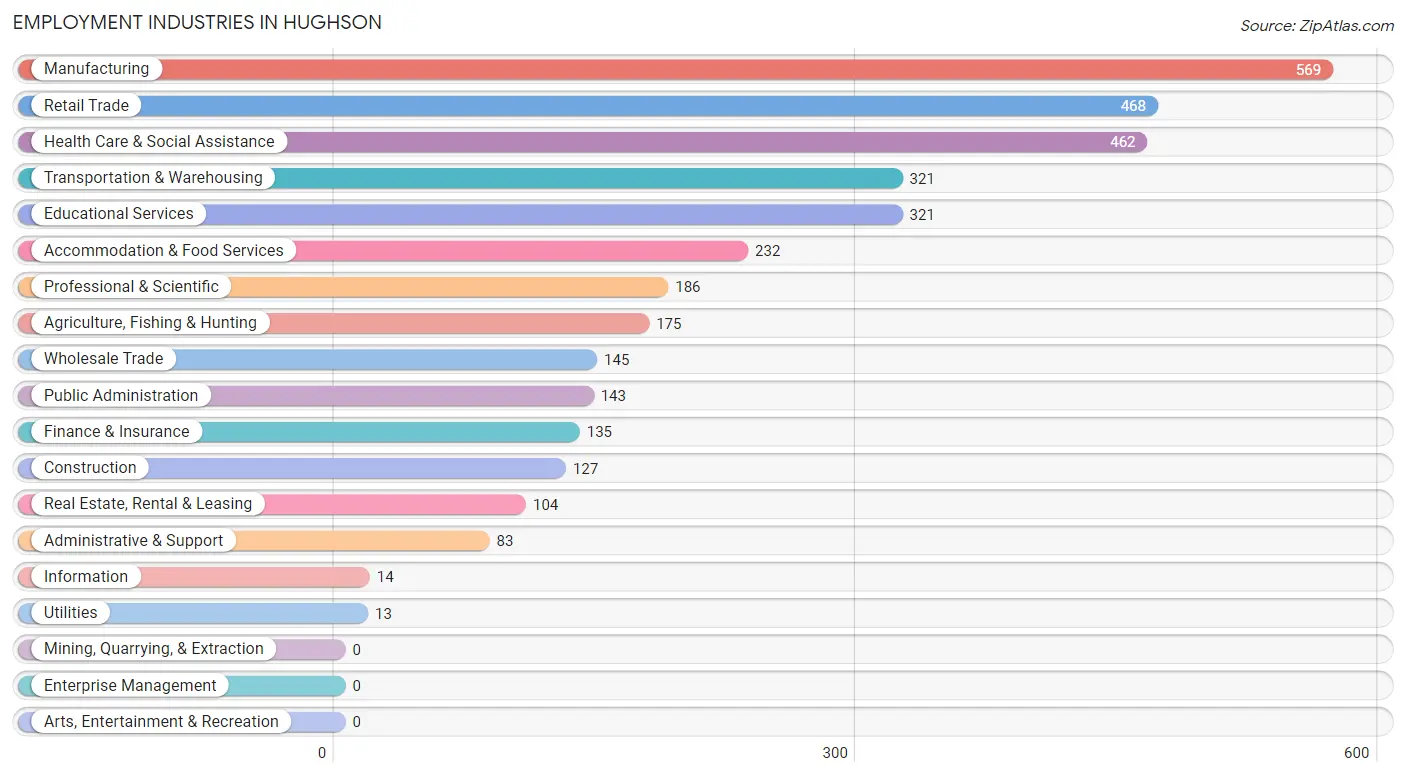
Employment Industries in Hughson
The major employment industries in Hughson include Manufacturing (569 | 16.2%), Retail Trade (468 | 13.3%), Health Care & Social Assistance (462 | 13.1%), Transportation & Warehousing (321 | 9.1%), and Educational Services (321 | 9.1%).
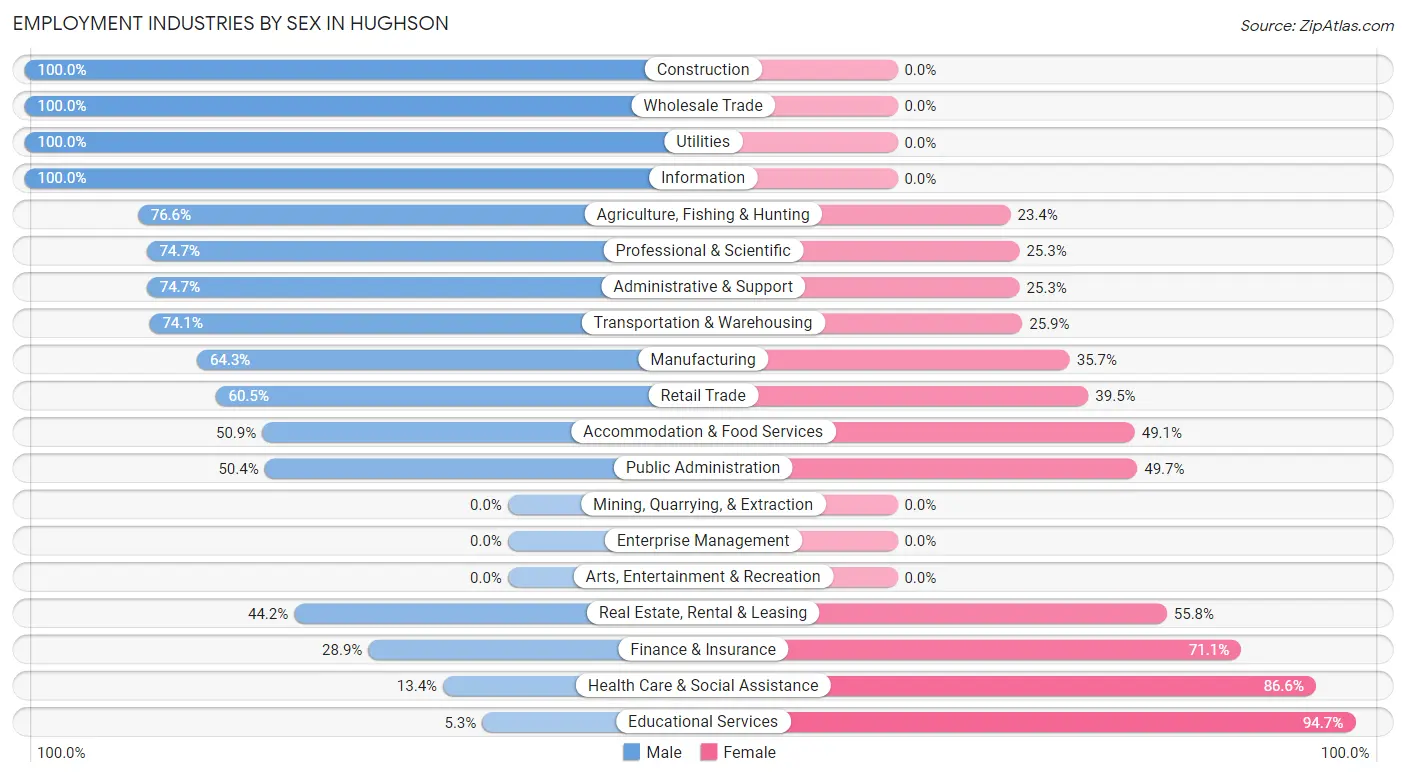
Employment Industries by Sex in Hughson
The Hughson industries that see more men than women are Construction (100.0%), Wholesale Trade (100.0%), and Utilities (100.0%), whereas the industries that tend to have a higher number of women are Educational Services (94.7%), Health Care & Social Assistance (86.6%), and Finance & Insurance (71.1%).
| Industry | Male | Female |
| Agriculture, Fishing & Hunting | 134 (76.6%) | 41 (23.4%) |
| Mining, Quarrying, & Extraction | 0 (0.0%) | 0 (0.0%) |
| Construction | 127 (100.0%) | 0 (0.0%) |
| Manufacturing | 366 (64.3%) | 203 (35.7%) |
| Wholesale Trade | 145 (100.0%) | 0 (0.0%) |
| Retail Trade | 283 (60.5%) | 185 (39.5%) |
| Transportation & Warehousing | 238 (74.1%) | 83 (25.9%) |
| Utilities | 13 (100.0%) | 0 (0.0%) |
| Information | 14 (100.0%) | 0 (0.0%) |
| Finance & Insurance | 39 (28.9%) | 96 (71.1%) |
| Real Estate, Rental & Leasing | 46 (44.2%) | 58 (55.8%) |
| Professional & Scientific | 139 (74.7%) | 47 (25.3%) |
| Enterprise Management | 0 (0.0%) | 0 (0.0%) |
| Administrative & Support | 62 (74.7%) | 21 (25.3%) |
| Educational Services | 17 (5.3%) | 304 (94.7%) |
| Health Care & Social Assistance | 62 (13.4%) | 400 (86.6%) |
| Arts, Entertainment & Recreation | 0 (0.0%) | 0 (0.0%) |
| Accommodation & Food Services | 118 (50.9%) | 114 (49.1%) |
| Public Administration | 72 (50.3%) | 71 (49.6%) |
| Total | 1,896 (53.9%) | 1,623 (46.1%) |
Education in Hughson
School Enrollment in Hughson
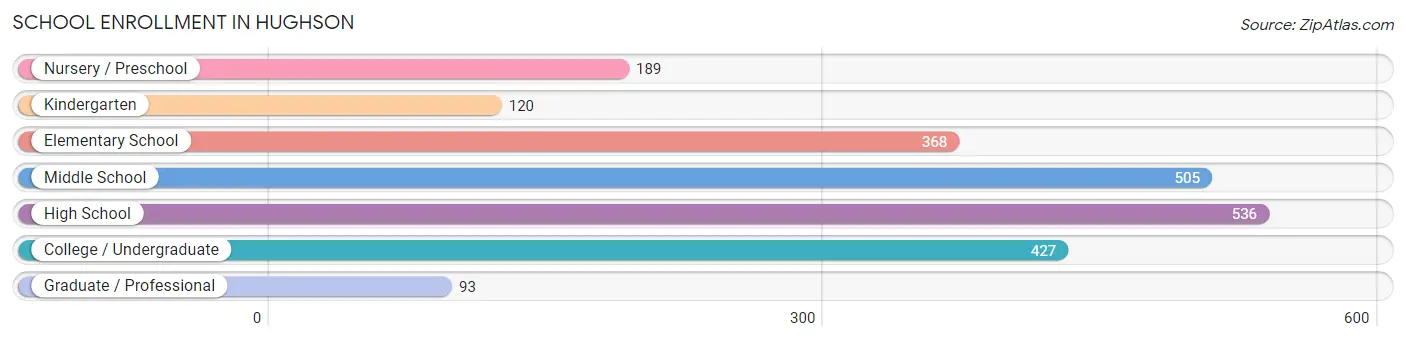
The most common levels of schooling among the 2,238 students in Hughson are high school (536 | 23.9%), middle school (505 | 22.6%), and college / undergraduate (427 | 19.1%).
| School Level | # Students | % Students |
| Nursery / Preschool | 189 | 8.5% |
| Kindergarten | 120 | 5.4% |
| Elementary School | 368 | 16.4% |
| Middle School | 505 | 22.6% |
| High School | 536 | 23.9% |
| College / Undergraduate | 427 | 19.1% |
| Graduate / Professional | 93 | 4.2% |
| Total | 2,238 | 100.0% |
School Enrollment by Age by Funding Source in Hughson
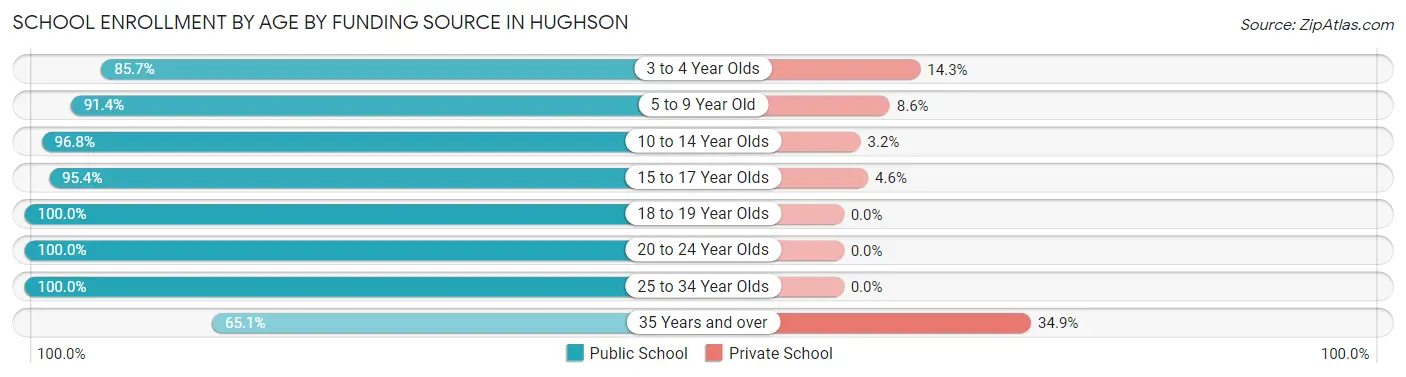
Out of a total of 2,238 students who are enrolled in schools in Hughson, 145 (6.5%) attend a private institution, while the remaining 2,093 (93.5%) are enrolled in public schools. The age group of 35 years and over has the highest likelihood of being enrolled in private schools, with 44 (34.9% in the age bracket) enrolled. Conversely, the age group of 18 to 19 year olds has the lowest likelihood of being enrolled in a private school, with 172 (100.0% in the age bracket) attending a public institution.
| Age Bracket | Public School | Private School |
| 3 to 4 Year Olds | 132 (85.7%) | 22 (14.3%) |
| 5 to 9 Year Old | 457 (91.4%) | 43 (8.6%) |
| 10 to 14 Year Olds | 552 (96.8%) | 18 (3.2%) |
| 15 to 17 Year Olds | 377 (95.4%) | 18 (4.6%) |
| 18 to 19 Year Olds | 172 (100.0%) | 0 (0.0%) |
| 20 to 24 Year Olds | 245 (100.0%) | 0 (0.0%) |
| 25 to 34 Year Olds | 76 (100.0%) | 0 (0.0%) |
| 35 Years and over | 82 (65.1%) | 44 (34.9%) |
| Total | 2,093 (93.5%) | 145 (6.5%) |
Educational Attainment by Field of Study in Hughson
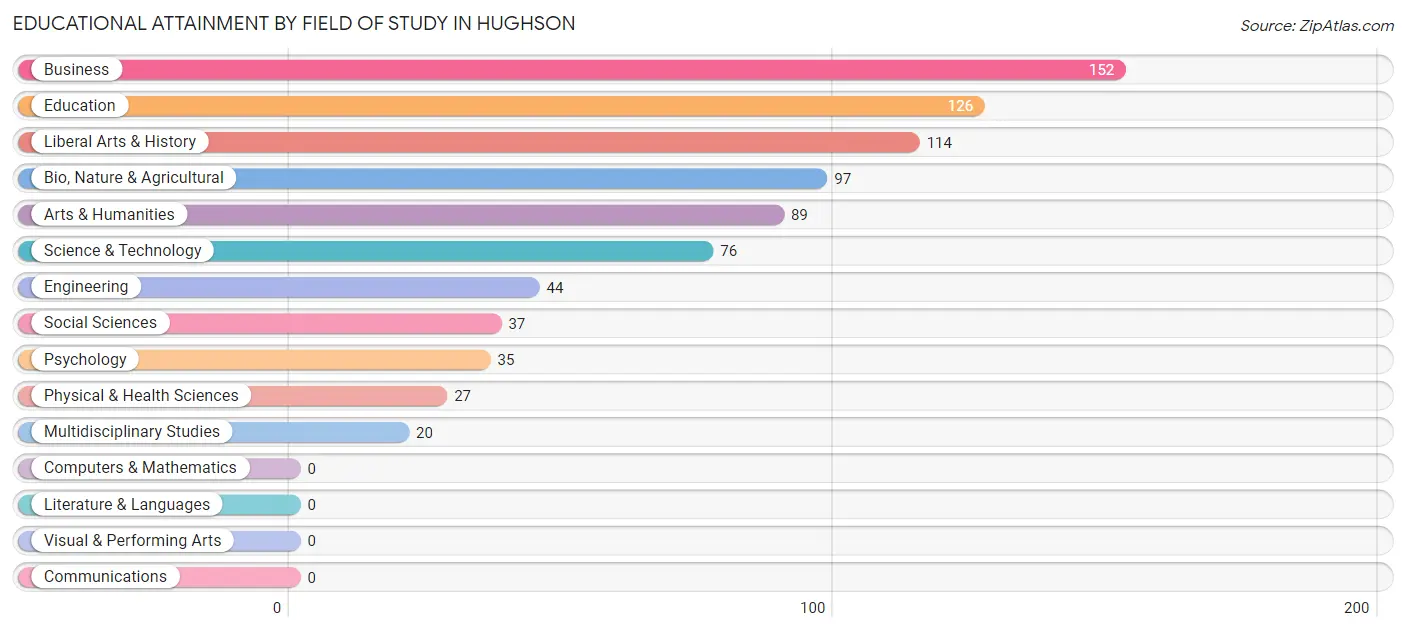
Business (152 | 18.6%), education (126 | 15.4%), liberal arts & history (114 | 14.0%), bio, nature & agricultural (97 | 11.9%), and arts & humanities (89 | 10.9%) are the most common fields of study among 817 individuals in Hughson who have obtained a bachelor's degree or higher.
| Field of Study | # Graduates | % Graduates |
| Computers & Mathematics | 0 | 0.0% |
| Bio, Nature & Agricultural | 97 | 11.9% |
| Physical & Health Sciences | 27 | 3.3% |
| Psychology | 35 | 4.3% |
| Social Sciences | 37 | 4.5% |
| Engineering | 44 | 5.4% |
| Multidisciplinary Studies | 20 | 2.5% |
| Science & Technology | 76 | 9.3% |
| Business | 152 | 18.6% |
| Education | 126 | 15.4% |
| Literature & Languages | 0 | 0.0% |
| Liberal Arts & History | 114 | 14.0% |
| Visual & Performing Arts | 0 | 0.0% |
| Communications | 0 | 0.0% |
| Arts & Humanities | 89 | 10.9% |
| Total | 817 | 100.0% |
Transportation & Commute in Hughson
Vehicle Availability by Sex in Hughson
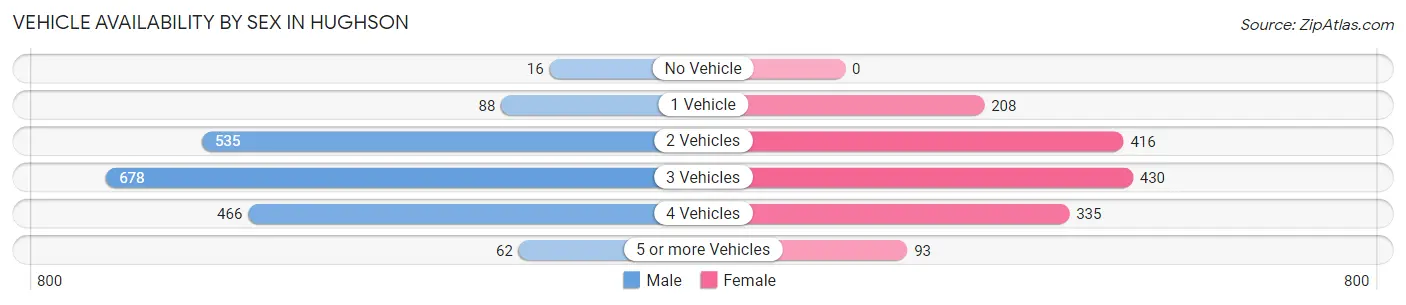
The most prevalent vehicle ownership categories in Hughson are males with 3 vehicles (678, accounting for 36.7%) and females with 3 vehicles (430, making up 45.8%).
| Vehicles Available | Male | Female |
| No Vehicle | 16 (0.9%) | 0 (0.0%) |
| 1 Vehicle | 88 (4.8%) | 208 (14.0%) |
| 2 Vehicles | 535 (29.0%) | 416 (28.1%) |
| 3 Vehicles | 678 (36.7%) | 430 (29.0%) |
| 4 Vehicles | 466 (25.3%) | 335 (22.6%) |
| 5 or more Vehicles | 62 (3.4%) | 93 (6.3%) |
| Total | 1,845 (100.0%) | 1,482 (100.0%) |
Commute Time in Hughson
The most frequently occuring commute durations in Hughson are 20 to 24 minutes (1,005 commuters, 33.8%), 30 to 34 minutes (462 commuters, 15.5%), and 15 to 19 minutes (340 commuters, 11.4%).
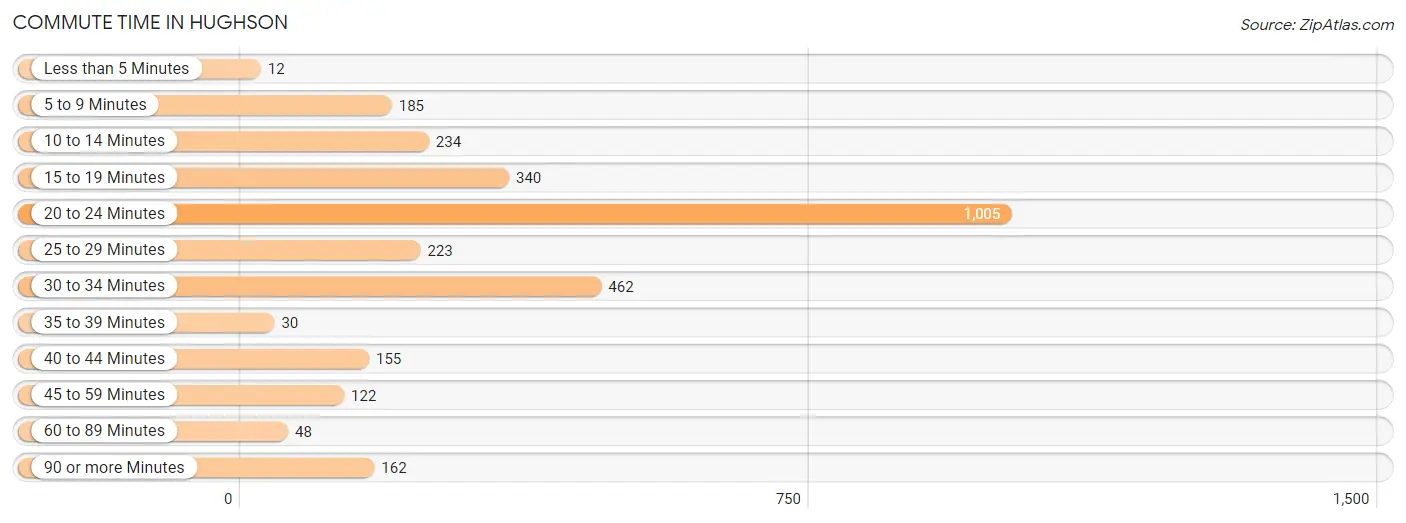
| Commute Time | # Commuters | % Commuters |
| Less than 5 Minutes | 12 | 0.4% |
| 5 to 9 Minutes | 185 | 6.2% |
| 10 to 14 Minutes | 234 | 7.9% |
| 15 to 19 Minutes | 340 | 11.4% |
| 20 to 24 Minutes | 1,005 | 33.8% |
| 25 to 29 Minutes | 223 | 7.5% |
| 30 to 34 Minutes | 462 | 15.5% |
| 35 to 39 Minutes | 30 | 1.0% |
| 40 to 44 Minutes | 155 | 5.2% |
| 45 to 59 Minutes | 122 | 4.1% |
| 60 to 89 Minutes | 48 | 1.6% |
| 90 or more Minutes | 162 | 5.4% |
Commute Time by Sex in Hughson
The most common commute times in Hughson are 20 to 24 minutes (567 commuters, 33.1%) for males and 20 to 24 minutes (438 commuters, 34.6%) for females.
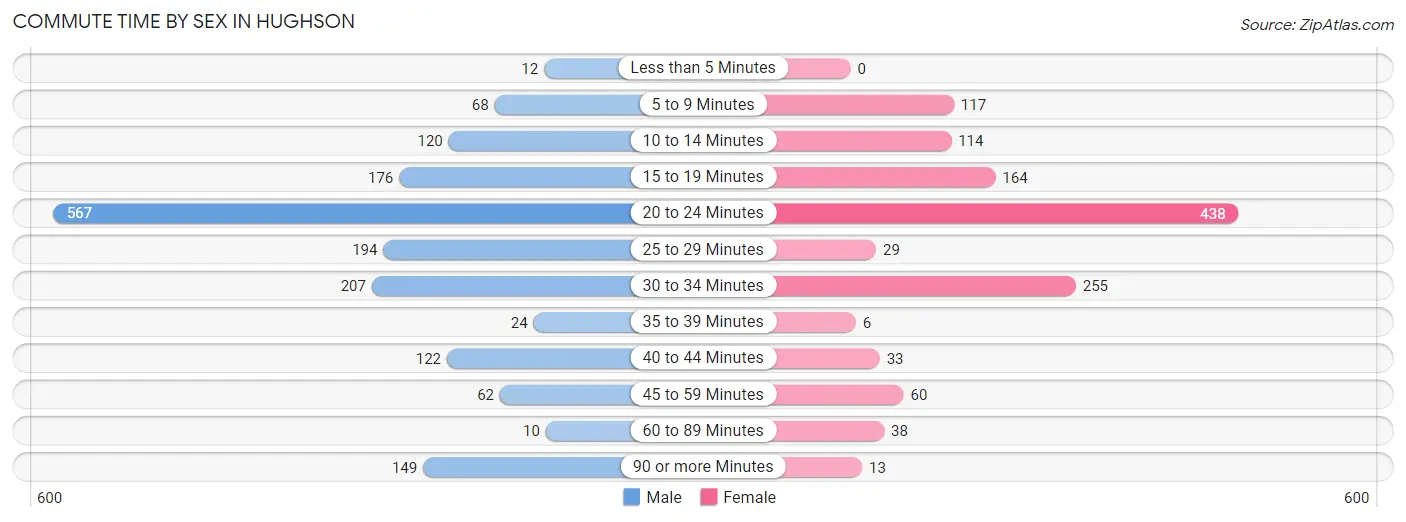
| Commute Time | Male | Female |
| Less than 5 Minutes | 12 (0.7%) | 0 (0.0%) |
| 5 to 9 Minutes | 68 (4.0%) | 117 (9.2%) |
| 10 to 14 Minutes | 120 (7.0%) | 114 (9.0%) |
| 15 to 19 Minutes | 176 (10.3%) | 164 (12.9%) |
| 20 to 24 Minutes | 567 (33.1%) | 438 (34.6%) |
| 25 to 29 Minutes | 194 (11.3%) | 29 (2.3%) |
| 30 to 34 Minutes | 207 (12.1%) | 255 (20.1%) |
| 35 to 39 Minutes | 24 (1.4%) | 6 (0.5%) |
| 40 to 44 Minutes | 122 (7.1%) | 33 (2.6%) |
| 45 to 59 Minutes | 62 (3.6%) | 60 (4.7%) |
| 60 to 89 Minutes | 10 (0.6%) | 38 (3.0%) |
| 90 or more Minutes | 149 (8.7%) | 13 (1.0%) |
Time of Departure to Work by Sex in Hughson
The most frequent times of departure to work in Hughson are 6:00 AM to 6:29 AM (540, 31.6%) for males and 7:00 AM to 7:29 AM (268, 21.1%) for females.
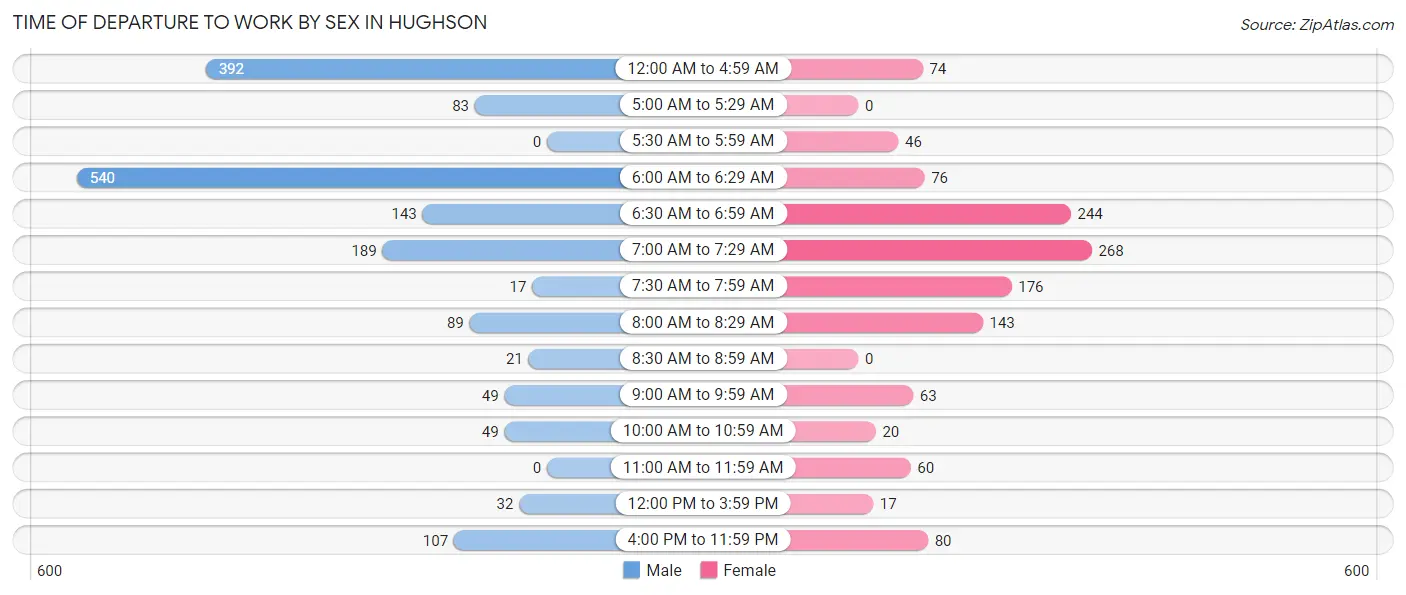
| Time of Departure | Male | Female |
| 12:00 AM to 4:59 AM | 392 (22.9%) | 74 (5.8%) |
| 5:00 AM to 5:29 AM | 83 (4.9%) | 0 (0.0%) |
| 5:30 AM to 5:59 AM | 0 (0.0%) | 46 (3.6%) |
| 6:00 AM to 6:29 AM | 540 (31.6%) | 76 (6.0%) |
| 6:30 AM to 6:59 AM | 143 (8.4%) | 244 (19.3%) |
| 7:00 AM to 7:29 AM | 189 (11.1%) | 268 (21.1%) |
| 7:30 AM to 7:59 AM | 17 (1.0%) | 176 (13.9%) |
| 8:00 AM to 8:29 AM | 89 (5.2%) | 143 (11.3%) |
| 8:30 AM to 8:59 AM | 21 (1.2%) | 0 (0.0%) |
| 9:00 AM to 9:59 AM | 49 (2.9%) | 63 (5.0%) |
| 10:00 AM to 10:59 AM | 49 (2.9%) | 20 (1.6%) |
| 11:00 AM to 11:59 AM | 0 (0.0%) | 60 (4.7%) |
| 12:00 PM to 3:59 PM | 32 (1.9%) | 17 (1.3%) |
| 4:00 PM to 11:59 PM | 107 (6.2%) | 80 (6.3%) |
| Total | 1,711 (100.0%) | 1,267 (100.0%) |
Housing Occupancy in Hughson
Occupancy by Ownership in Hughson
Of the total 2,849 dwellings in Hughson, owner-occupied units account for 1,817 (63.8%), while renter-occupied units make up 1,032 (36.2%).
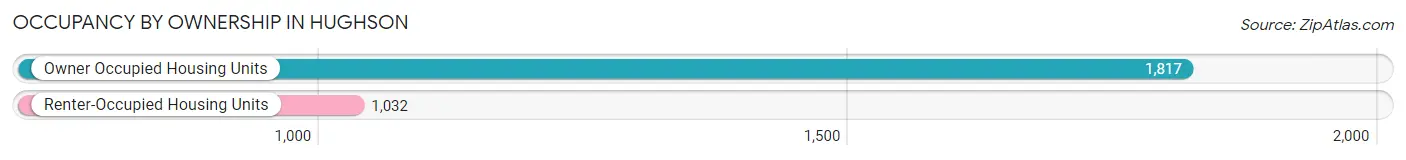
| Occupancy | # Housing Units | % Housing Units |
| Owner Occupied Housing Units | 1,817 | 63.8% |
| Renter-Occupied Housing Units | 1,032 | 36.2% |
| Total Occupied Housing Units | 2,849 | 100.0% |
Occupancy by Household Size in Hughson
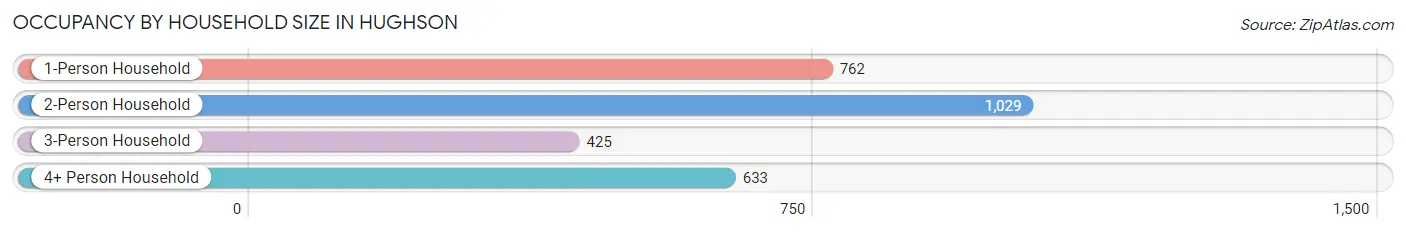
| Household Size | # Housing Units | % Housing Units |
| 1-Person Household | 762 | 26.8% |
| 2-Person Household | 1,029 | 36.1% |
| 3-Person Household | 425 | 14.9% |
| 4+ Person Household | 633 | 22.2% |
| Total Housing Units | 2,849 | 100.0% |
Occupancy by Ownership by Household Size in Hughson
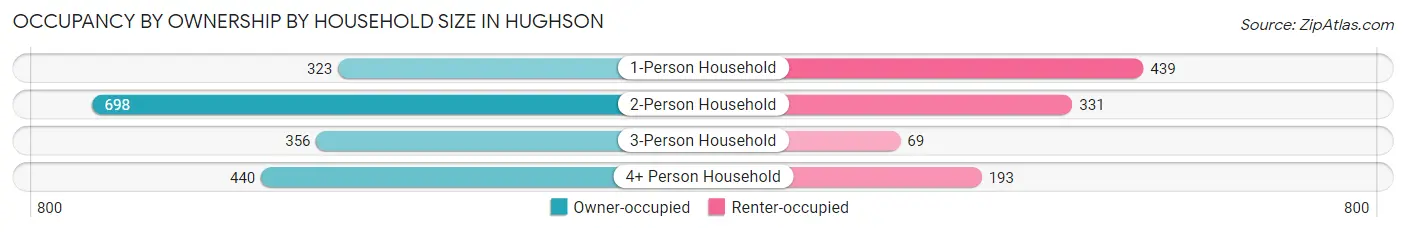
| Household Size | Owner-occupied | Renter-occupied |
| 1-Person Household | 323 (42.4%) | 439 (57.6%) |
| 2-Person Household | 698 (67.8%) | 331 (32.2%) |
| 3-Person Household | 356 (83.8%) | 69 (16.2%) |
| 4+ Person Household | 440 (69.5%) | 193 (30.5%) |
| Total Housing Units | 1,817 (63.8%) | 1,032 (36.2%) |
Occupancy by Educational Attainment in Hughson
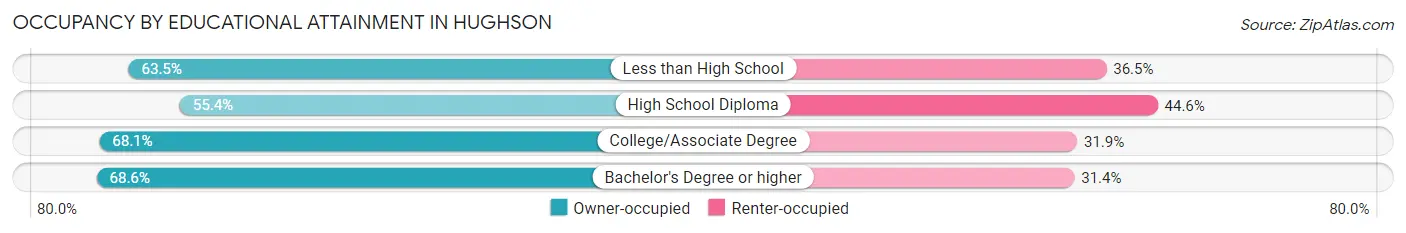
| Household Size | Owner-occupied | Renter-occupied |
| Less than High School | 247 (63.5%) | 142 (36.5%) |
| High School Diploma | 470 (55.4%) | 379 (44.6%) |
| College/Associate Degree | 740 (68.1%) | 346 (31.9%) |
| Bachelor's Degree or higher | 360 (68.6%) | 165 (31.4%) |
Occupancy by Age of Householder in Hughson
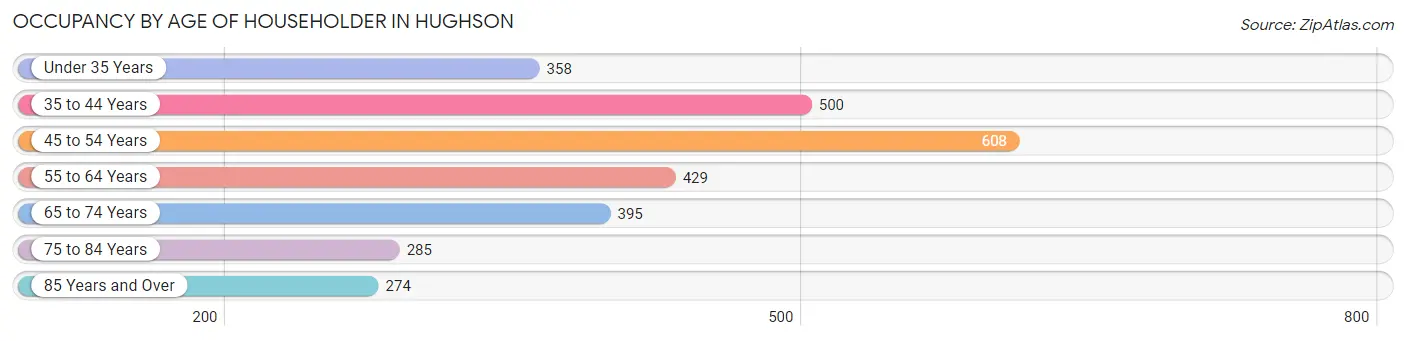
| Age Bracket | # Households | % Households |
| Under 35 Years | 358 | 12.6% |
| 35 to 44 Years | 500 | 17.5% |
| 45 to 54 Years | 608 | 21.3% |
| 55 to 64 Years | 429 | 15.1% |
| 65 to 74 Years | 395 | 13.9% |
| 75 to 84 Years | 285 | 10.0% |
| 85 Years and Over | 274 | 9.6% |
| Total | 2,849 | 100.0% |
Housing Finances in Hughson
Median Income by Occupancy in Hughson
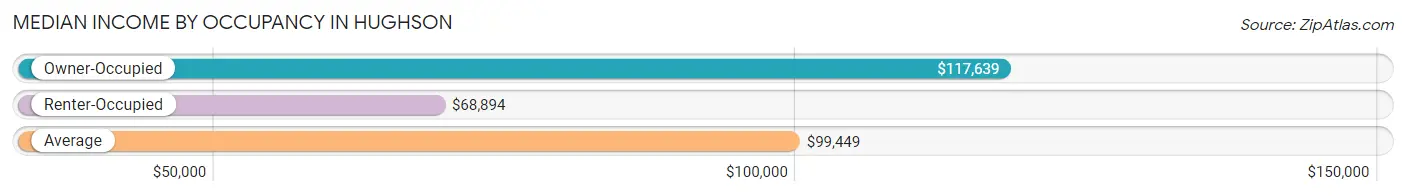
| Occupancy Type | # Households | Median Income |
| Owner-Occupied | 1,817 (63.8%) | $117,639 |
| Renter-Occupied | 1,032 (36.2%) | $68,894 |
| Average | 2,849 (100.0%) | $99,449 |
Occupancy by Householder Income Bracket in Hughson
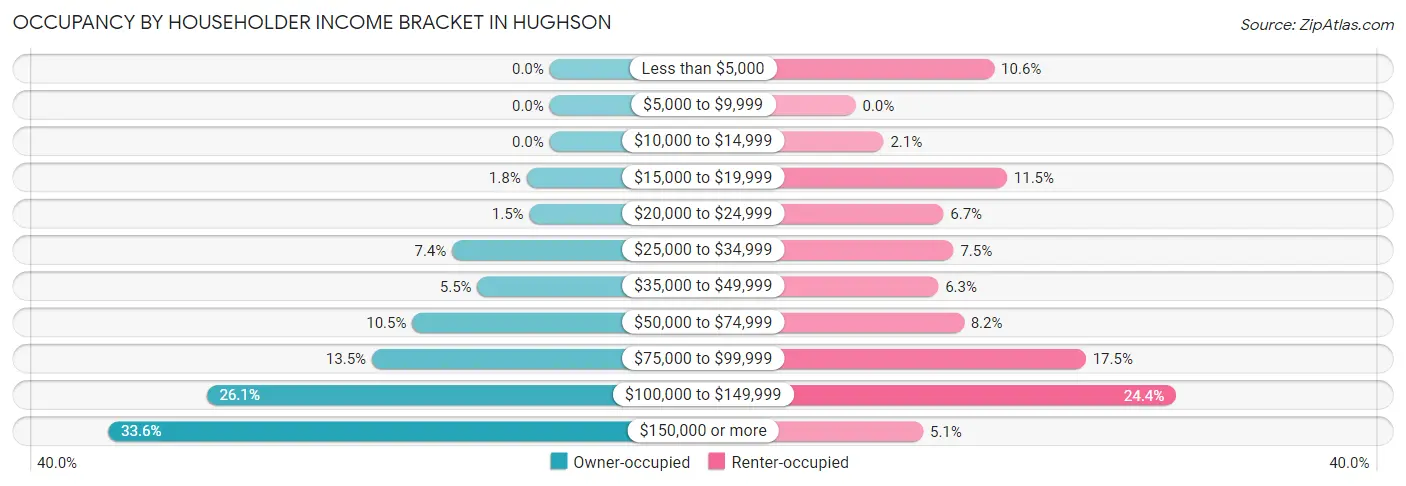
| Income Bracket | Owner-occupied | Renter-occupied |
| Less than $5,000 | 0 (0.0%) | 109 (10.6%) |
| $5,000 to $9,999 | 0 (0.0%) | 0 (0.0%) |
| $10,000 to $14,999 | 0 (0.0%) | 22 (2.1%) |
| $15,000 to $19,999 | 32 (1.8%) | 119 (11.5%) |
| $20,000 to $24,999 | 28 (1.5%) | 69 (6.7%) |
| $25,000 to $34,999 | 135 (7.4%) | 77 (7.5%) |
| $35,000 to $49,999 | 100 (5.5%) | 65 (6.3%) |
| $50,000 to $74,999 | 190 (10.5%) | 85 (8.2%) |
| $75,000 to $99,999 | 246 (13.5%) | 181 (17.5%) |
| $100,000 to $149,999 | 475 (26.1%) | 252 (24.4%) |
| $150,000 or more | 611 (33.6%) | 53 (5.1%) |
| Total | 1,817 (100.0%) | 1,032 (100.0%) |
Monthly Housing Cost Tiers in Hughson
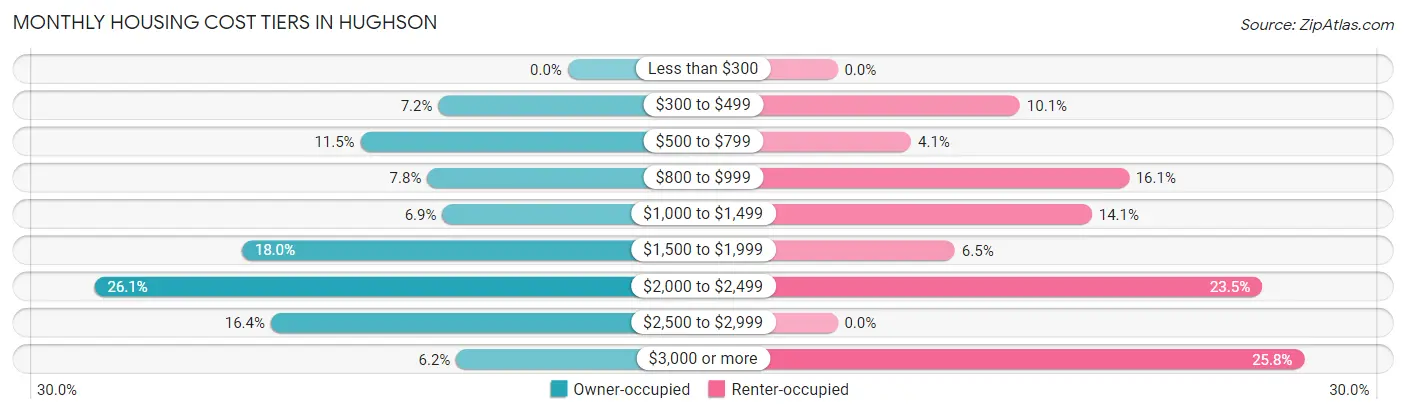
| Monthly Cost | Owner-occupied | Renter-occupied |
| Less than $300 | 0 (0.0%) | 0 (0.0%) |
| $300 to $499 | 130 (7.1%) | 104 (10.1%) |
| $500 to $799 | 208 (11.5%) | 42 (4.1%) |
| $800 to $999 | 141 (7.8%) | 166 (16.1%) |
| $1,000 to $1,499 | 126 (6.9%) | 145 (14.1%) |
| $1,500 to $1,999 | 327 (18.0%) | 67 (6.5%) |
| $2,000 to $2,499 | 475 (26.1%) | 242 (23.4%) |
| $2,500 to $2,999 | 298 (16.4%) | 0 (0.0%) |
| $3,000 or more | 112 (6.2%) | 266 (25.8%) |
| Total | 1,817 (100.0%) | 1,032 (100.0%) |
Physical Housing Characteristics in Hughson
Housing Structures in Hughson
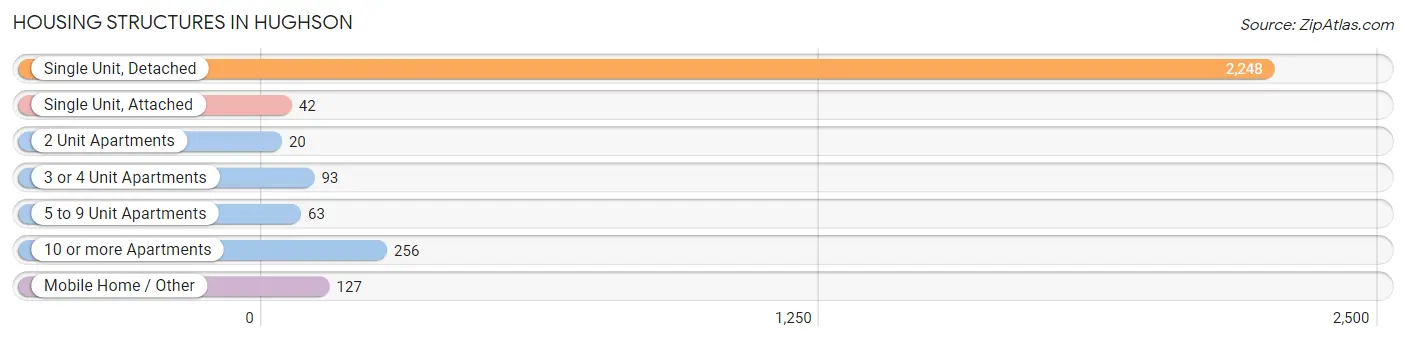
| Structure Type | # Housing Units | % Housing Units |
| Single Unit, Detached | 2,248 | 78.9% |
| Single Unit, Attached | 42 | 1.5% |
| 2 Unit Apartments | 20 | 0.7% |
| 3 or 4 Unit Apartments | 93 | 3.3% |
| 5 to 9 Unit Apartments | 63 | 2.2% |
| 10 or more Apartments | 256 | 9.0% |
| Mobile Home / Other | 127 | 4.5% |
| Total | 2,849 | 100.0% |
Housing Structures by Occupancy in Hughson
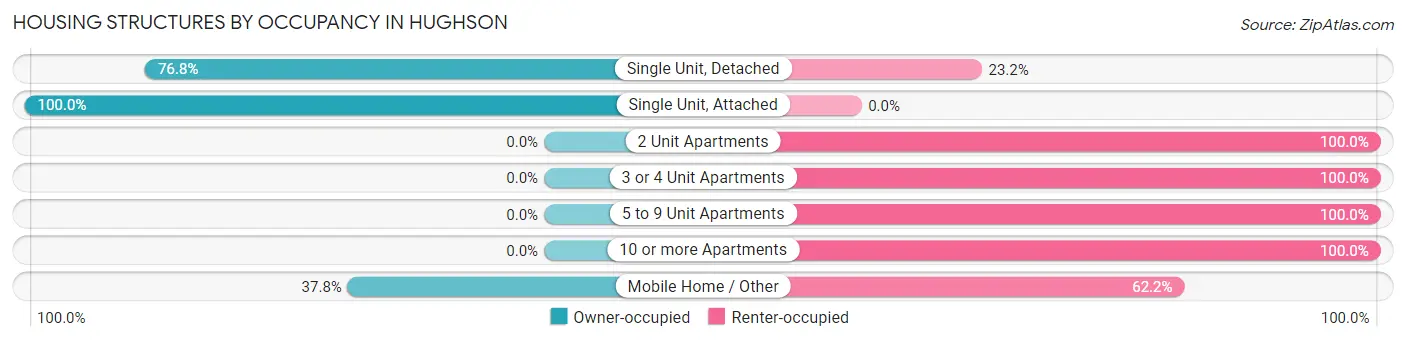
| Structure Type | Owner-occupied | Renter-occupied |
| Single Unit, Detached | 1,727 (76.8%) | 521 (23.2%) |
| Single Unit, Attached | 42 (100.0%) | 0 (0.0%) |
| 2 Unit Apartments | 0 (0.0%) | 20 (100.0%) |
| 3 or 4 Unit Apartments | 0 (0.0%) | 93 (100.0%) |
| 5 to 9 Unit Apartments | 0 (0.0%) | 63 (100.0%) |
| 10 or more Apartments | 0 (0.0%) | 256 (100.0%) |
| Mobile Home / Other | 48 (37.8%) | 79 (62.2%) |
| Total | 1,817 (63.8%) | 1,032 (36.2%) |
Housing Structures by Number of Rooms in Hughson
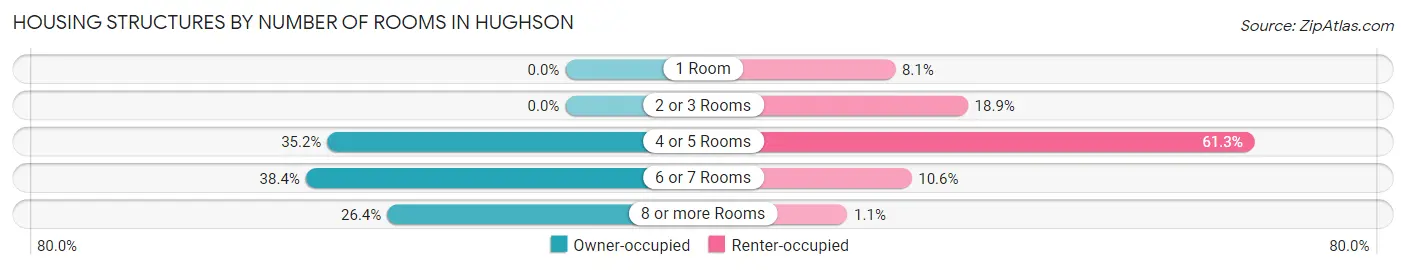
| Number of Rooms | Owner-occupied | Renter-occupied |
| 1 Room | 0 (0.0%) | 84 (8.1%) |
| 2 or 3 Rooms | 0 (0.0%) | 195 (18.9%) |
| 4 or 5 Rooms | 640 (35.2%) | 633 (61.3%) |
| 6 or 7 Rooms | 698 (38.4%) | 109 (10.6%) |
| 8 or more Rooms | 479 (26.4%) | 11 (1.1%) |
| Total | 1,817 (100.0%) | 1,032 (100.0%) |
Housing Structure by Heating Type in Hughson
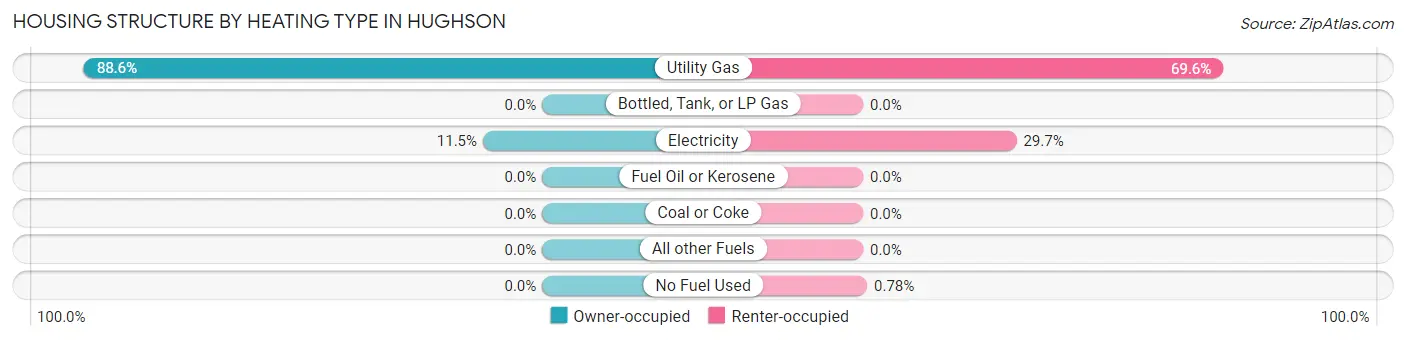
| Heating Type | Owner-occupied | Renter-occupied |
| Utility Gas | 1,609 (88.5%) | 718 (69.6%) |
| Bottled, Tank, or LP Gas | 0 (0.0%) | 0 (0.0%) |
| Electricity | 208 (11.5%) | 306 (29.6%) |
| Fuel Oil or Kerosene | 0 (0.0%) | 0 (0.0%) |
| Coal or Coke | 0 (0.0%) | 0 (0.0%) |
| All other Fuels | 0 (0.0%) | 0 (0.0%) |
| No Fuel Used | 0 (0.0%) | 8 (0.8%) |
| Total | 1,817 (100.0%) | 1,032 (100.0%) |
Household Vehicle Usage in Hughson
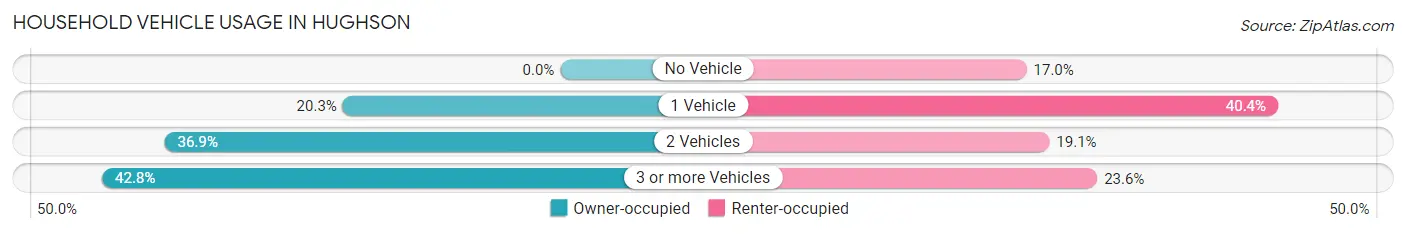
| Vehicles per Household | Owner-occupied | Renter-occupied |
| No Vehicle | 0 (0.0%) | 175 (17.0%) |
| 1 Vehicle | 369 (20.3%) | 417 (40.4%) |
| 2 Vehicles | 671 (36.9%) | 197 (19.1%) |
| 3 or more Vehicles | 777 (42.8%) | 243 (23.5%) |
| Total | 1,817 (100.0%) | 1,032 (100.0%) |
Real Estate & Mortgages in Hughson
Real Estate and Mortgage Overview in Hughson
| Characteristic | Without Mortgage | With Mortgage |
| Housing Units | 485 | 1,332 |
| Median Property Value | $402,100 | $437,300 |
| Median Household Income | $52,202 | $534 |
| Monthly Housing Costs | $584 | $112 |
| Real Estate Taxes | $2,238 | $67 |
Property Value by Mortgage Status in Hughson
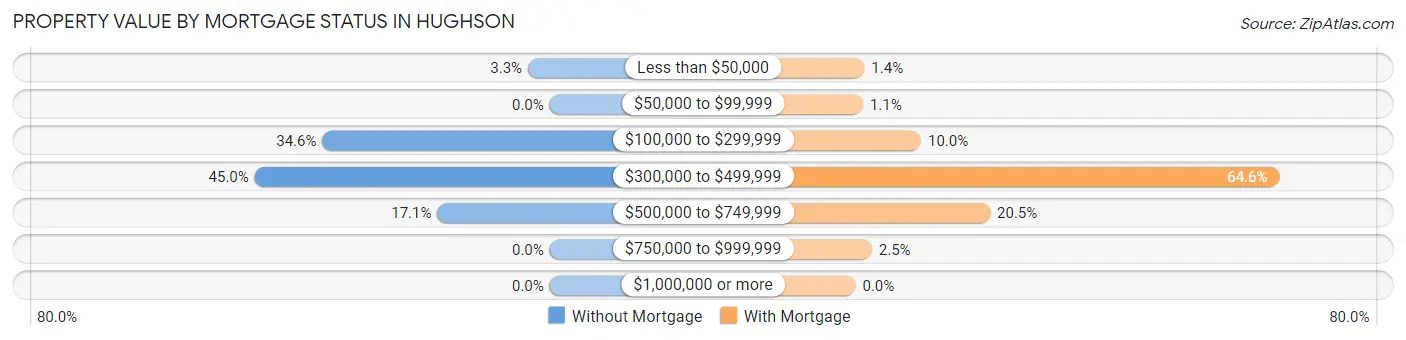
| Property Value | Without Mortgage | With Mortgage |
| Less than $50,000 | 16 (3.3%) | 18 (1.3%) |
| $50,000 to $99,999 | 0 (0.0%) | 15 (1.1%) |
| $100,000 to $299,999 | 168 (34.6%) | 133 (10.0%) |
| $300,000 to $499,999 | 218 (45.0%) | 860 (64.6%) |
| $500,000 to $749,999 | 83 (17.1%) | 273 (20.5%) |
| $750,000 to $999,999 | 0 (0.0%) | 33 (2.5%) |
| $1,000,000 or more | 0 (0.0%) | 0 (0.0%) |
| Total | 485 (100.0%) | 1,332 (100.0%) |
Household Income by Mortgage Status in Hughson
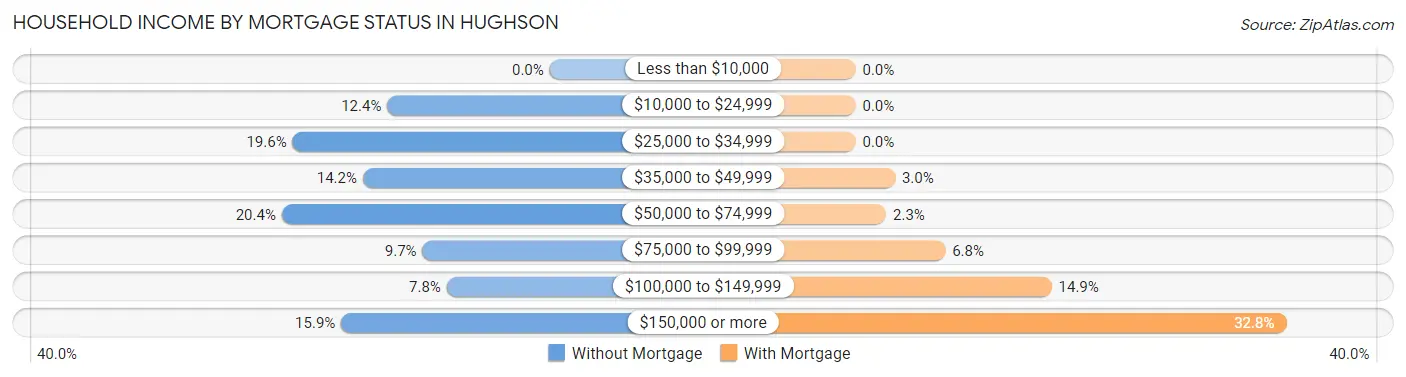
| Household Income | Without Mortgage | With Mortgage |
| Less than $10,000 | 0 (0.0%) | 0 (0.0%) |
| $10,000 to $24,999 | 60 (12.4%) | 0 (0.0%) |
| $25,000 to $34,999 | 95 (19.6%) | 0 (0.0%) |
| $35,000 to $49,999 | 69 (14.2%) | 40 (3.0%) |
| $50,000 to $74,999 | 99 (20.4%) | 31 (2.3%) |
| $75,000 to $99,999 | 47 (9.7%) | 91 (6.8%) |
| $100,000 to $149,999 | 38 (7.8%) | 199 (14.9%) |
| $150,000 or more | 77 (15.9%) | 437 (32.8%) |
| Total | 485 (100.0%) | 1,332 (100.0%) |
Property Value to Household Income Ratio in Hughson
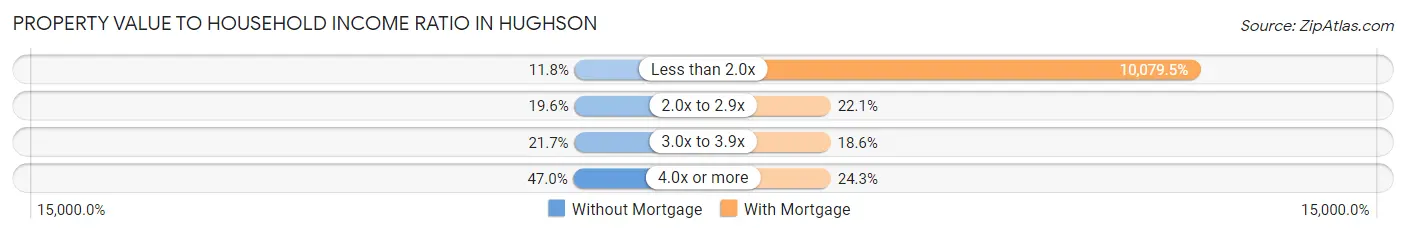
| Value-to-Income Ratio | Without Mortgage | With Mortgage |
| Less than 2.0x | 57 (11.7%) | 134,259 (10,079.5%) |
| 2.0x to 2.9x | 95 (19.6%) | 294 (22.1%) |
| 3.0x to 3.9x | 105 (21.6%) | 248 (18.6%) |
| 4.0x or more | 228 (47.0%) | 324 (24.3%) |
| Total | 485 (100.0%) | 1,332 (100.0%) |
Real Estate Taxes by Mortgage Status in Hughson
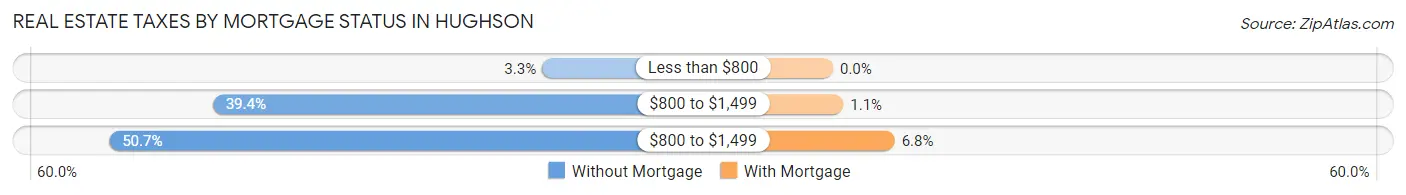
| Property Taxes | Without Mortgage | With Mortgage |
| Less than $800 | 16 (3.3%) | 0 (0.0%) |
| $800 to $1,499 | 191 (39.4%) | 15 (1.1%) |
| $800 to $1,499 | 246 (50.7%) | 90 (6.8%) |
| Total | 485 (100.0%) | 1,332 (100.0%) |
Health & Disability in Hughson
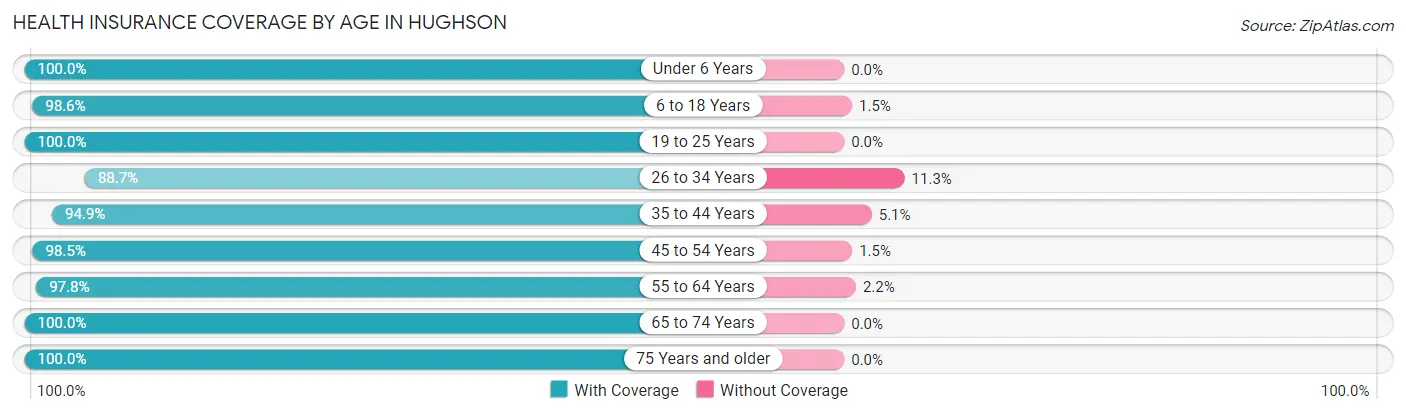
Health Insurance Coverage by Age in Hughson
| Age Bracket | With Coverage | Without Coverage |
| Under 6 Years | 438 (100.0%) | 0 (0.0%) |
| 6 to 18 Years | 1,496 (98.6%) | 22 (1.5%) |
| 19 to 25 Years | 770 (100.0%) | 0 (0.0%) |
| 26 to 34 Years | 591 (88.7%) | 75 (11.3%) |
| 35 to 44 Years | 795 (94.9%) | 43 (5.1%) |
| 45 to 54 Years | 1,335 (98.5%) | 20 (1.5%) |
| 55 to 64 Years | 764 (97.8%) | 17 (2.2%) |
| 65 to 74 Years | 547 (100.0%) | 0 (0.0%) |
| 75 Years and older | 610 (100.0%) | 0 (0.0%) |
| Total | 7,346 (97.7%) | 177 (2.4%) |
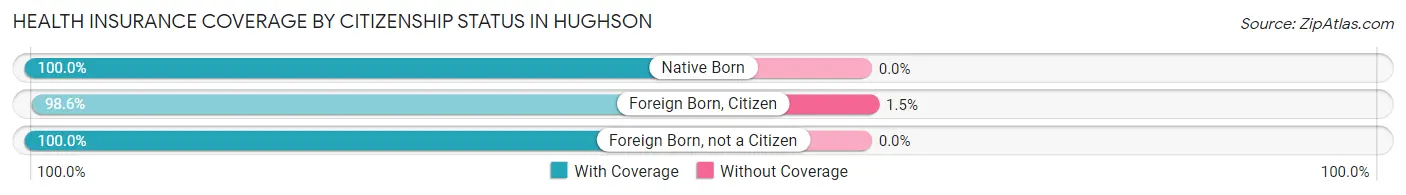
Health Insurance Coverage by Citizenship Status in Hughson
| Citizenship Status | With Coverage | Without Coverage |
| Native Born | 438 (100.0%) | 0 (0.0%) |
| Foreign Born, Citizen | 1,496 (98.6%) | 22 (1.5%) |
| Foreign Born, not a Citizen | 770 (100.0%) | 0 (0.0%) |
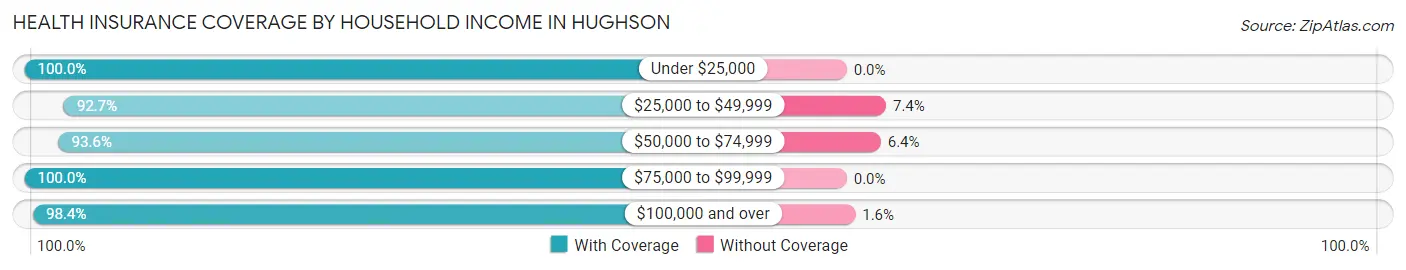
Health Insurance Coverage by Household Income in Hughson
| Household Income | With Coverage | Without Coverage |
| Under $25,000 | 656 (100.0%) | 0 (0.0%) |
| $25,000 to $49,999 | 971 (92.6%) | 77 (7.3%) |
| $50,000 to $74,999 | 485 (93.6%) | 33 (6.4%) |
| $75,000 to $99,999 | 1,141 (100.0%) | 0 (0.0%) |
| $100,000 and over | 4,091 (98.4%) | 66 (1.6%) |
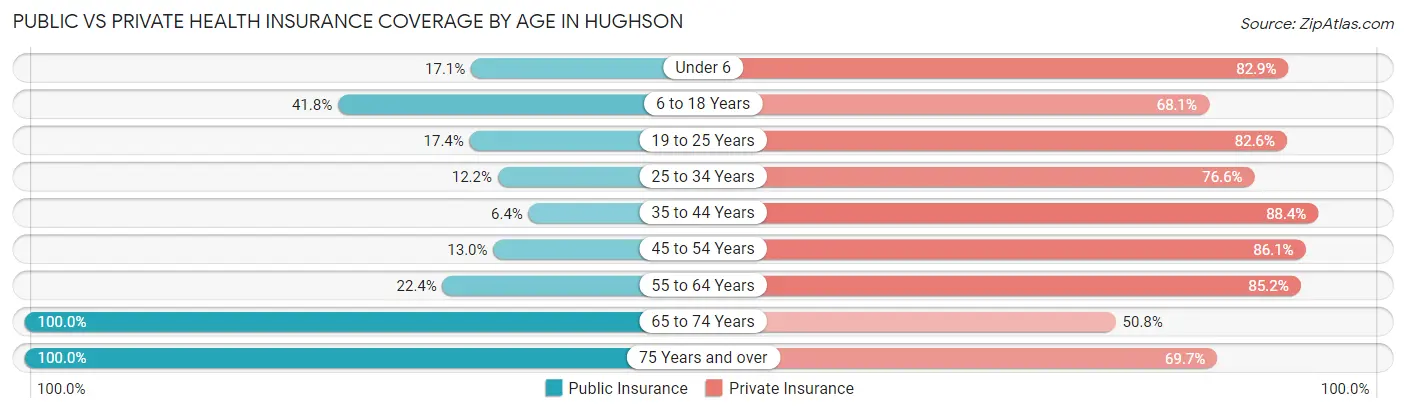
Public vs Private Health Insurance Coverage by Age in Hughson
| Age Bracket | Public Insurance | Private Insurance |
| Under 6 | 75 (17.1%) | 363 (82.9%) |
| 6 to 18 Years | 635 (41.8%) | 1,034 (68.1%) |
| 19 to 25 Years | 134 (17.4%) | 636 (82.6%) |
| 25 to 34 Years | 81 (12.2%) | 510 (76.6%) |
| 35 to 44 Years | 54 (6.4%) | 741 (88.4%) |
| 45 to 54 Years | 176 (13.0%) | 1,166 (86.1%) |
| 55 to 64 Years | 175 (22.4%) | 665 (85.2%) |
| 65 to 74 Years | 547 (100.0%) | 278 (50.8%) |
| 75 Years and over | 610 (100.0%) | 425 (69.7%) |
| Total | 2,487 (33.1%) | 5,818 (77.3%) |
Disability Status by Sex by Age in Hughson
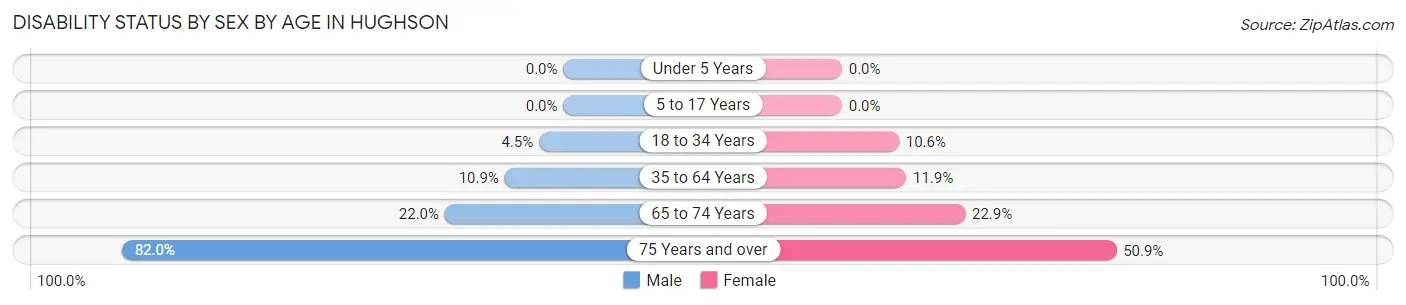
| Age Bracket | Male | Female |
| Under 5 Years | 0 (0.0%) | 0 (0.0%) |
| 5 to 17 Years | 0 (0.0%) | 0 (0.0%) |
| 18 to 34 Years | 35 (4.5%) | 84 (10.6%) |
| 35 to 64 Years | 155 (10.9%) | 185 (11.9%) |
| 65 to 74 Years | 53 (22.0%) | 70 (22.9%) |
| 75 Years and over | 191 (82.0%) | 192 (50.9%) |
Disability Class by Sex by Age in Hughson
Disability Class: Hearing Difficulty
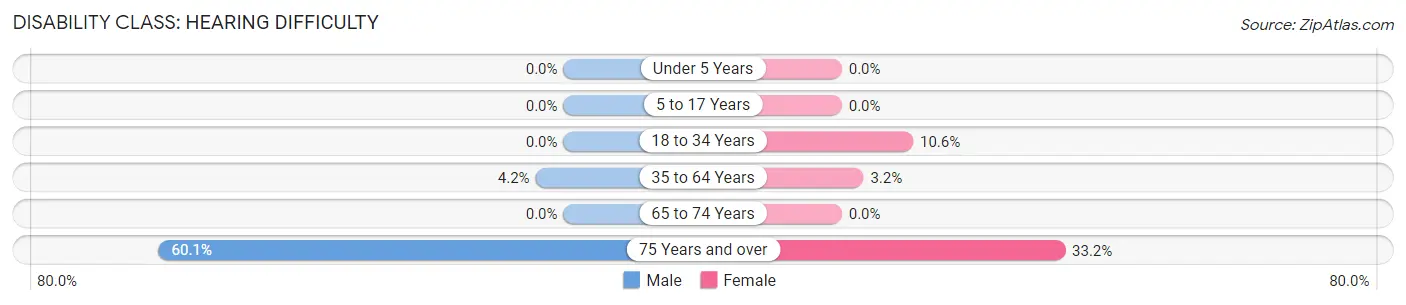
| Age Bracket | Male | Female |
| Under 5 Years | 0 (0.0%) | 0 (0.0%) |
| 5 to 17 Years | 0 (0.0%) | 0 (0.0%) |
| 18 to 34 Years | 0 (0.0%) | 84 (10.6%) |
| 35 to 64 Years | 59 (4.2%) | 50 (3.2%) |
| 65 to 74 Years | 0 (0.0%) | 0 (0.0%) |
| 75 Years and over | 140 (60.1%) | 125 (33.2%) |
Disability Class: Vision Difficulty
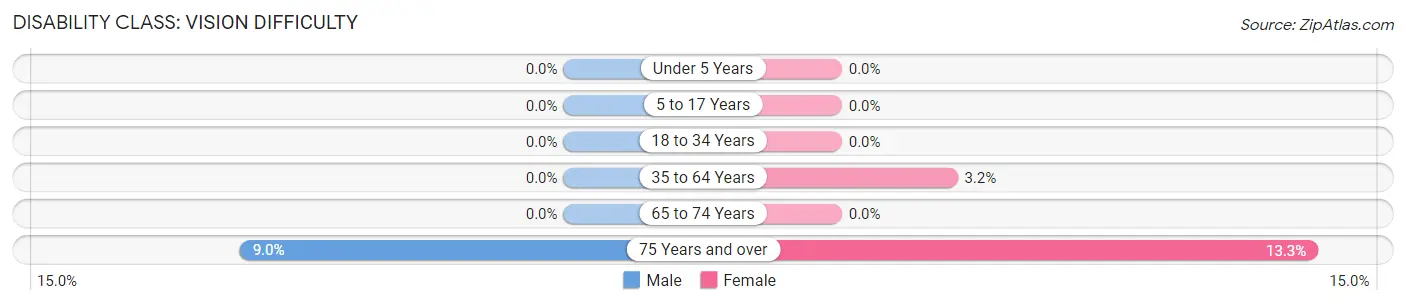
| Age Bracket | Male | Female |
| Under 5 Years | 0 (0.0%) | 0 (0.0%) |
| 5 to 17 Years | 0 (0.0%) | 0 (0.0%) |
| 18 to 34 Years | 0 (0.0%) | 0 (0.0%) |
| 35 to 64 Years | 0 (0.0%) | 50 (3.2%) |
| 65 to 74 Years | 0 (0.0%) | 0 (0.0%) |
| 75 Years and over | 21 (9.0%) | 50 (13.3%) |
Disability Class: Cognitive Difficulty
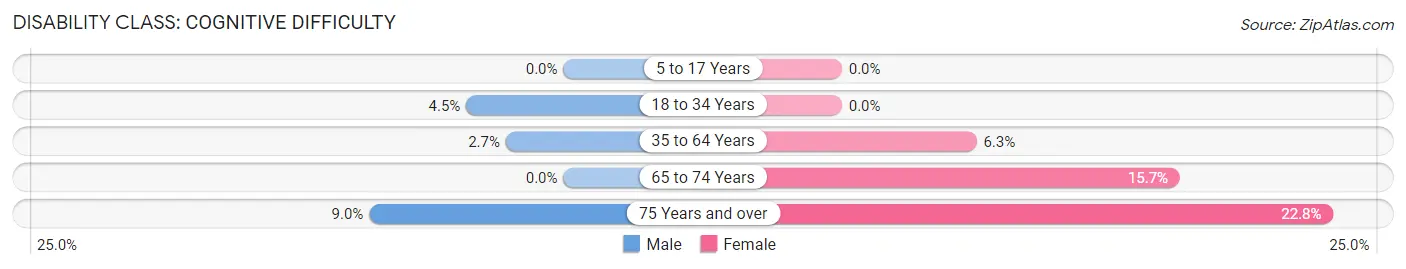
| Age Bracket | Male | Female |
| 5 to 17 Years | 0 (0.0%) | 0 (0.0%) |
| 18 to 34 Years | 35 (4.5%) | 0 (0.0%) |
| 35 to 64 Years | 38 (2.7%) | 97 (6.2%) |
| 65 to 74 Years | 0 (0.0%) | 48 (15.7%) |
| 75 Years and over | 21 (9.0%) | 86 (22.8%) |
Disability Class: Ambulatory Difficulty
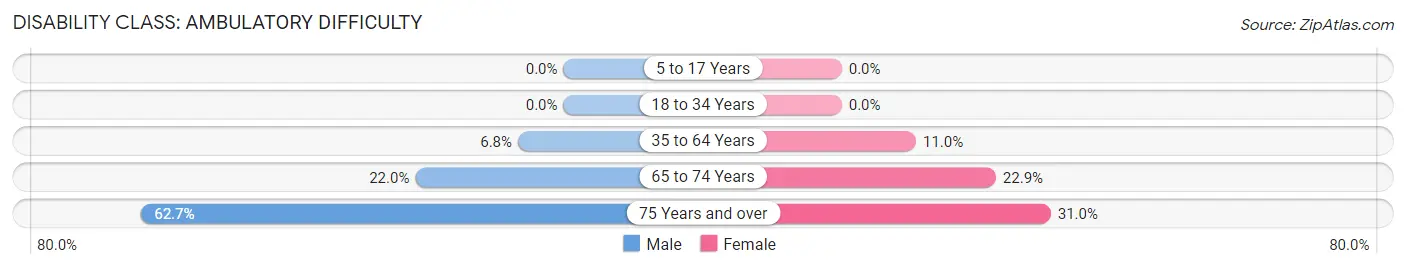
| Age Bracket | Male | Female |
| 5 to 17 Years | 0 (0.0%) | 0 (0.0%) |
| 18 to 34 Years | 0 (0.0%) | 0 (0.0%) |
| 35 to 64 Years | 96 (6.8%) | 171 (11.0%) |
| 65 to 74 Years | 53 (22.0%) | 70 (22.9%) |
| 75 Years and over | 146 (62.7%) | 117 (31.0%) |
Disability Class: Self-Care Difficulty
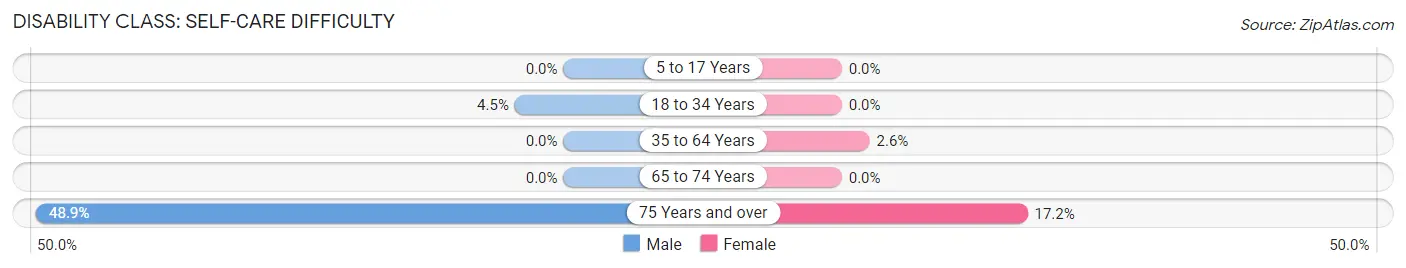
| Age Bracket | Male | Female |
| 5 to 17 Years | 0 (0.0%) | 0 (0.0%) |
| 18 to 34 Years | 35 (4.5%) | 0 (0.0%) |
| 35 to 64 Years | 0 (0.0%) | 40 (2.6%) |
| 65 to 74 Years | 0 (0.0%) | 0 (0.0%) |
| 75 Years and over | 114 (48.9%) | 65 (17.2%) |
Technology Access in Hughson
Computing Device Access in Hughson
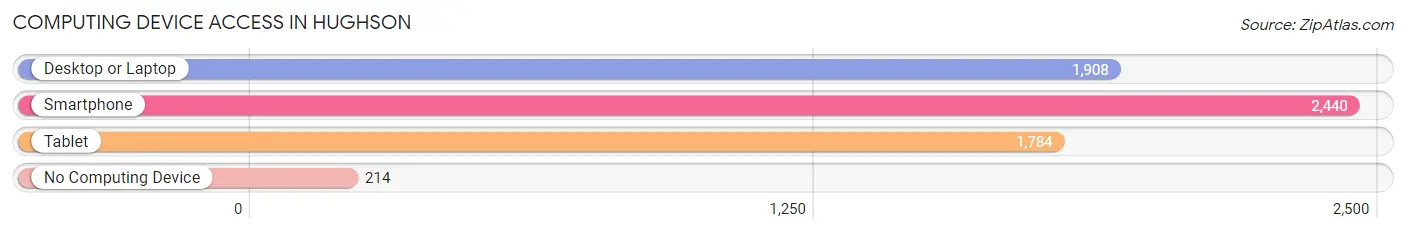
| Device Type | # Households | % Households |
| Desktop or Laptop | 1,908 | 67.0% |
| Smartphone | 2,440 | 85.6% |
| Tablet | 1,784 | 62.6% |
| No Computing Device | 214 | 7.5% |
| Total | 2,849 | 100.0% |
Internet Access in Hughson
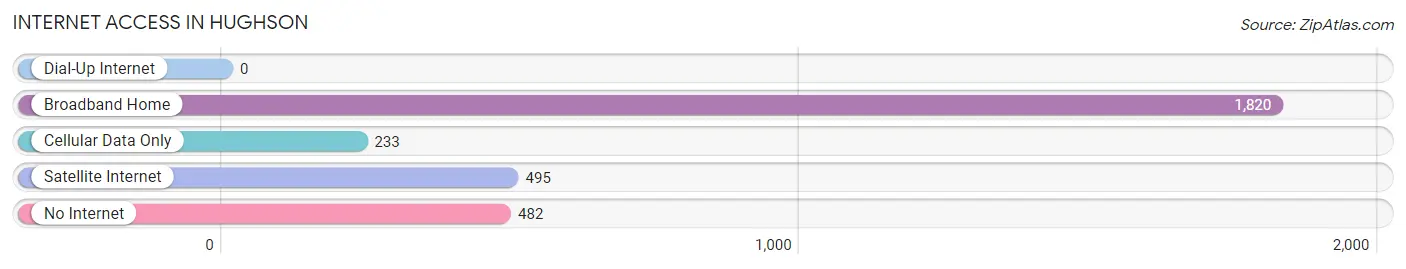
| Internet Type | # Households | % Households |
| Dial-Up Internet | 0 | 0.0% |
| Broadband Home | 1,820 | 63.9% |
| Cellular Data Only | 233 | 8.2% |
| Satellite Internet | 495 | 17.4% |
| No Internet | 482 | 16.9% |
| Total | 2,849 | 100.0% |
Hughson Summary
Hughson is a small city located in Stanislaus County, California, United States. It is situated in the Central Valley, approximately 8 miles south of Modesto. The city was incorporated in 1908 and has a population of approximately 7,000 people.
Geography
Hughson is located at 37°37'25" North, 120°59'17" West (37.623, -120.988). It is situated in the Central Valley, approximately 8 miles south of Modesto. The city is bordered by the Tuolumne River to the east, the Stanislaus River to the south, and the San Joaquin River to the west. The city has a total area of 1.7 square miles, all of which is land.
Climate
Hughson has a Mediterranean climate, with hot, dry summers and mild, wet winters. The average high temperature in the summer is around 95°F, and the average low temperature in the winter is around 40°F. The average annual precipitation is approximately 18 inches.
Demographics
As of the 2010 census, there were 7,156 people, 2,541 households, and 1,845 families residing in the city. The population density was 4,093.3 people per square mile. The racial makeup of the city was 68.2% White, 1.3% African American, 0.7% Native American, 0.9% Asian, 0.1% Pacific Islander, 25.2% from other races, and 3.6% from two or more races. Hispanic or Latino of any race were 44.2% of the population.
Economy
Hughson is primarily an agricultural community, with many of its residents employed in the farming and food processing industries. The city is home to several large agricultural companies, including Foster Farms, Hilmar Cheese Company, and Del Monte Foods. The city also has a thriving retail sector, with several large shopping centers and a variety of restaurants and other businesses.
Education
Hughson is served by the Hughson Unified School District, which includes four elementary schools, one middle school, and one high school. The city is also home to a branch of the Modesto Junior College.
Conclusion
Hughson is a small city located in Stanislaus County, California, United States. It is situated in the Central Valley, approximately 8 miles south of Modesto. The city was incorporated in 1908 and has a population of approximately 7,000 people. Hughson has a Mediterranean climate, with hot, dry summers and mild, wet winters. As of the 2010 census, there were 7,156 people, 2,541 households, and 1,845 families residing in the city. The city is primarily an agricultural community, with many of its residents employed in the farming and food processing industries. The city is served by the Hughson Unified School District, which includes four elementary schools, one middle school, and one high school.
Common Questions
What is Per Capita Income in Hughson?
Per Capita income in Hughson is $40,898.
What is the Median Family Income in Hughson?
Median Family Income in Hughson is $111,076.
What is the Median Household income in Hughson?
Median Household Income in Hughson is $99,449.
What is Income or Wage Gap in Hughson?
Income or Wage Gap in Hughson is 43.1%.
Women in Hughson earn 56.9 cents for every dollar earned by a man.
What is Inequality or Gini Index in Hughson?
Inequality or Gini Index in Hughson is 0.38.
What is the Total Population of Hughson?
Total Population of Hughson is 7,523.
What is the Total Male Population of Hughson?
Total Male Population of Hughson is 3,619.
What is the Total Female Population of Hughson?
Total Female Population of Hughson is 3,904.
What is the Ratio of Males per 100 Females in Hughson?
There are 92.70 Males per 100 Females in Hughson.
What is the Ratio of Females per 100 Males in Hughson?
There are 107.88 Females per 100 Males in Hughson.
What is the Median Population Age in Hughson?
Median Population Age in Hughson is 40.0 Years.
What is the Average Family Size in Hughson
Average Family Size in Hughson is 3.3 People.
What is the Average Household Size in Hughson
Average Household Size in Hughson is 2.6 People.
How Large is the Labor Force in Hughson?
There are 3,772 People in the Labor Forcein in Hughson.
What is the Percentage of People in the Labor Force in Hughson?
64.0% of People are in the Labor Force in Hughson.
What is the Unemployment Rate in Hughson?
Unemployment Rate in Hughson is 6.7%.