Hercules, CA Map & Demographics
Hercules Map
Hercules Overview
$52,818
PER CAPITA INCOME
$140,214
AVG FAMILY INCOME
$125,880
AVG HOUSEHOLD INCOME
28.1%
WAGE / INCOME GAP [ % ]
71.9¢/ $1
WAGE / INCOME GAP [ $ ]
0.41
INEQUALITY / GINI INDEX
26,041
TOTAL POPULATION
12,267
MALE POPULATION
13,774
FEMALE POPULATION
89.06
MALES / 100 FEMALES
112.28
FEMALES / 100 MALES
42.6
MEDIAN AGE
3.5
AVG FAMILY SIZE
2.9
AVG HOUSEHOLD SIZE
14,363
LABOR FORCE [ PEOPLE ]
67.2%
PERCENT IN LABOR FORCE
4.4%
UNEMPLOYMENT RATE
Hercules Zip Codes
Hercules Area Codes
Income in Hercules
Income Overview in Hercules
Per Capita Income in Hercules is $52,818, while median incomes of families and households are $140,214 and $125,880 respectively.
| Characteristic | Number | Measure |
| Per Capita Income | 26,041 | $52,818 |
| Median Family Income | 6,553 | $140,214 |
| Mean Family Income | 6,553 | $165,891 |
| Median Household Income | 8,990 | $125,880 |
| Mean Household Income | 8,990 | $150,083 |
| Income Deficit | 6,553 | $0 |
| Wage / Income Gap (%) | 26,041 | 28.07% |
| Wage / Income Gap ($) | 26,041 | 71.93¢ per $1 |
| Gini / Inequality Index | 26,041 | 0.41 |
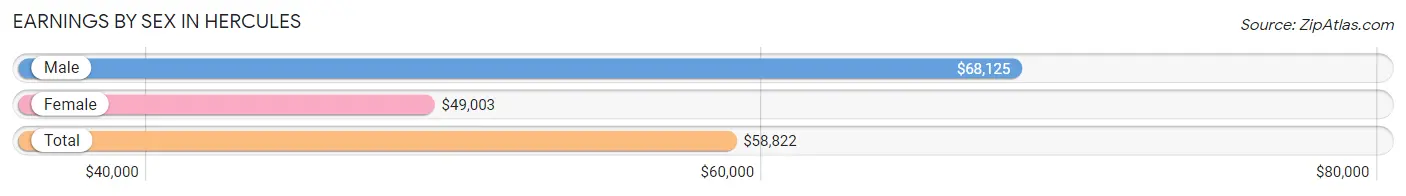
Earnings by Sex in Hercules
Average Earnings in Hercules are $58,822, $68,125 for men and $49,003 for women, a difference of 28.1%.
| Sex | Number | Average Earnings |
| Male | 7,251 (49.8%) | $68,125 |
| Female | 7,322 (50.2%) | $49,003 |
| Total | 14,573 (100.0%) | $58,822 |
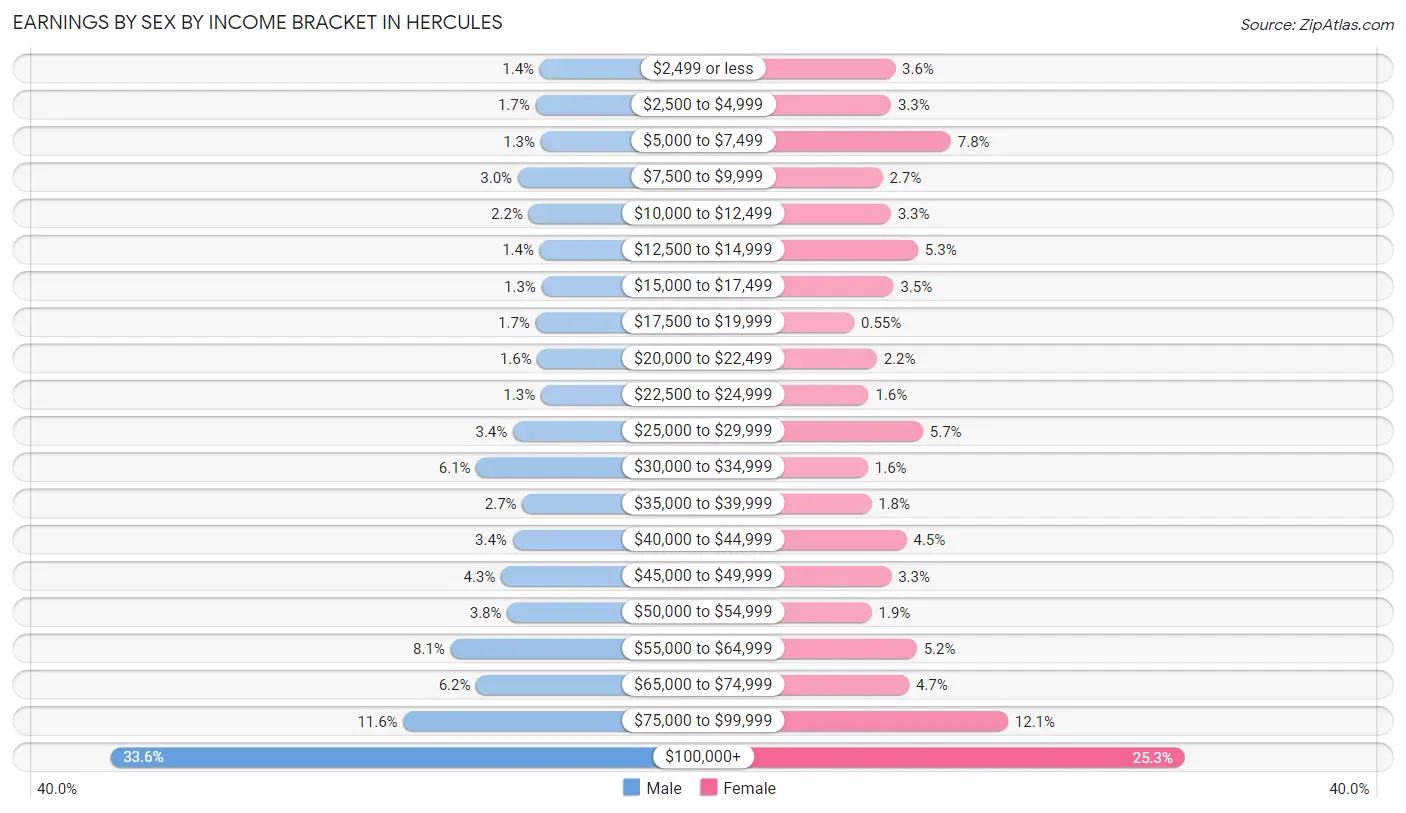
Earnings by Sex by Income Bracket in Hercules
The most common earnings brackets in Hercules are $100,000+ for men (2,435 | 33.6%) and $100,000+ for women (1,855 | 25.3%).
| Income | Male | Female |
| $2,499 or less | 100 (1.4%) | 265 (3.6%) |
| $2,500 to $4,999 | 124 (1.7%) | 242 (3.3%) |
| $5,000 to $7,499 | 95 (1.3%) | 571 (7.8%) |
| $7,500 to $9,999 | 220 (3.0%) | 196 (2.7%) |
| $10,000 to $12,499 | 161 (2.2%) | 241 (3.3%) |
| $12,500 to $14,999 | 101 (1.4%) | 390 (5.3%) |
| $15,000 to $17,499 | 91 (1.3%) | 256 (3.5%) |
| $17,500 to $19,999 | 123 (1.7%) | 40 (0.5%) |
| $20,000 to $22,499 | 113 (1.6%) | 164 (2.2%) |
| $22,500 to $24,999 | 94 (1.3%) | 119 (1.6%) |
| $25,000 to $29,999 | 246 (3.4%) | 417 (5.7%) |
| $30,000 to $34,999 | 445 (6.1%) | 116 (1.6%) |
| $35,000 to $39,999 | 195 (2.7%) | 134 (1.8%) |
| $40,000 to $44,999 | 248 (3.4%) | 327 (4.5%) |
| $45,000 to $49,999 | 310 (4.3%) | 244 (3.3%) |
| $50,000 to $54,999 | 277 (3.8%) | 136 (1.9%) |
| $55,000 to $64,999 | 585 (8.1%) | 384 (5.2%) |
| $65,000 to $74,999 | 446 (6.1%) | 341 (4.7%) |
| $75,000 to $99,999 | 842 (11.6%) | 884 (12.1%) |
| $100,000+ | 2,435 (33.6%) | 1,855 (25.3%) |
| Total | 7,251 (100.0%) | 7,322 (100.0%) |
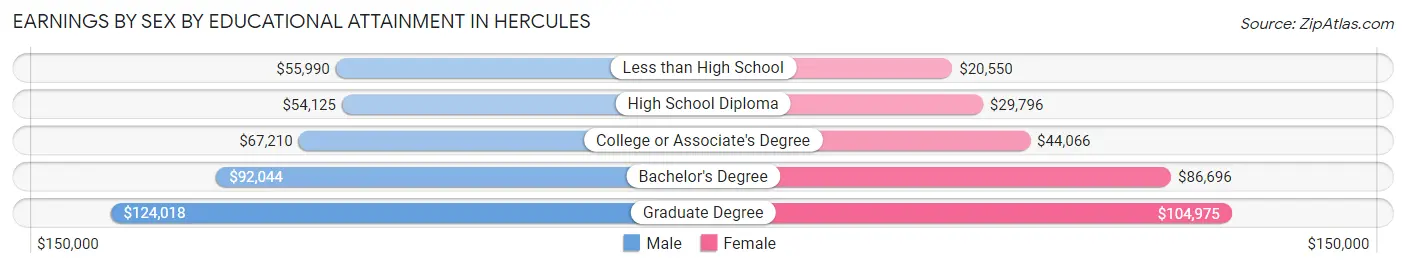
Earnings by Sex by Educational Attainment in Hercules
Average earnings in Hercules are $75,750 for men and $58,927 for women, a difference of 22.2%. Men with an educational attainment of graduate degree enjoy the highest average annual earnings of $124,018, while those with high school diploma education earn the least with $54,125. Women with an educational attainment of graduate degree earn the most with the average annual earnings of $104,975, while those with less than high school education have the smallest earnings of $20,550.
| Educational Attainment | Male Income | Female Income |
| Less than High School | $55,990 | $20,550 |
| High School Diploma | $54,125 | $29,796 |
| College or Associate's Degree | $67,210 | $44,066 |
| Bachelor's Degree | $92,044 | $86,696 |
| Graduate Degree | $124,018 | $104,975 |
| Total | $75,750 | $58,927 |
Family Income in Hercules
Family Income Brackets in Hercules
According to the Hercules family income data, there are 2,130 families falling into the $200,000+ income range, which is the most common income bracket and makes up 32.5% of all families. Conversely, the $10,000 to $14,999 income bracket is the least frequent group with only 33 families (0.5%) belonging to this category.
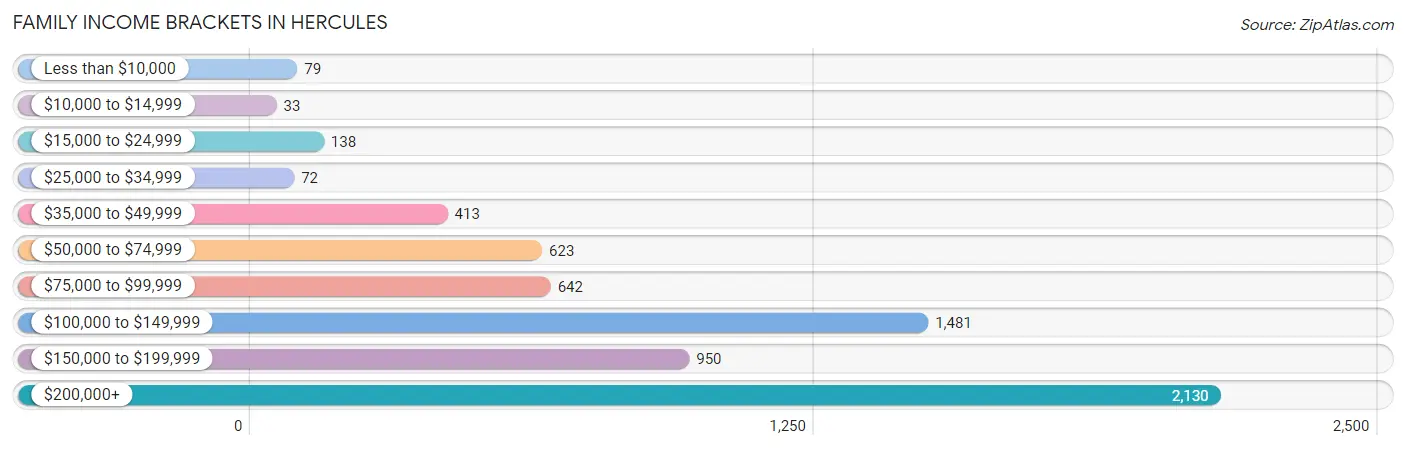
| Income Bracket | # Families | % Families |
| Less than $10,000 | 79 | 1.2% |
| $10,000 to $14,999 | 33 | 0.5% |
| $15,000 to $24,999 | 138 | 2.1% |
| $25,000 to $34,999 | 72 | 1.1% |
| $35,000 to $49,999 | 413 | 6.3% |
| $50,000 to $74,999 | 623 | 9.5% |
| $75,000 to $99,999 | 642 | 9.8% |
| $100,000 to $149,999 | 1,481 | 22.6% |
| $150,000 to $199,999 | 950 | 14.5% |
| $200,000+ | 2,130 | 32.5% |
Family Income by Famaliy Size in Hercules
7+ person families (270 | 4.1%) account for the highest median family income in Hercules with $232,500 per family, while 2-person families (2,411 | 36.8%) have the highest median income of $57,708 per family member.
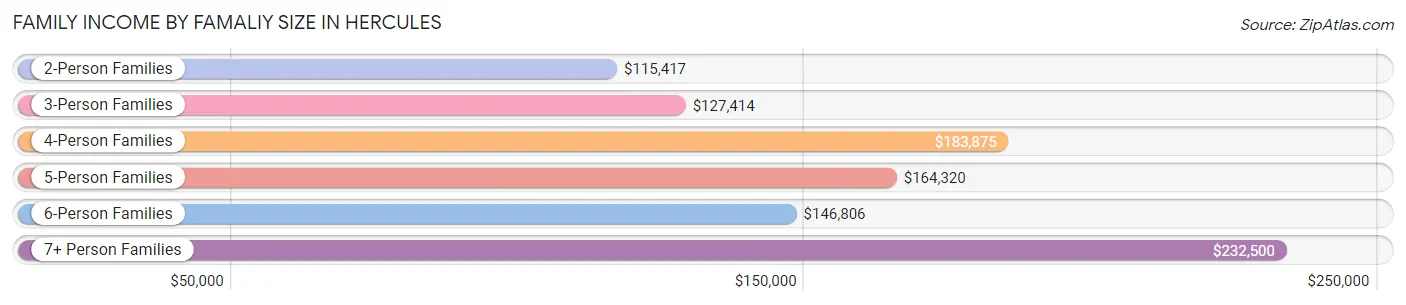
| Income Bracket | # Families | Median Income |
| 2-Person Families | 2,411 (36.8%) | $115,417 |
| 3-Person Families | 1,742 (26.6%) | $127,414 |
| 4-Person Families | 1,132 (17.3%) | $183,875 |
| 5-Person Families | 633 (9.7%) | $164,320 |
| 6-Person Families | 365 (5.6%) | $146,806 |
| 7+ Person Families | 270 (4.1%) | $232,500 |
| Total | 6,553 (100.0%) | $140,214 |
Family Income by Number of Earners in Hercules
The median family income in Hercules is $140,214, with families comprising 3+ earners (1,281) having the highest median family income of $220,478, while families with no earners (648) have the lowest median family income of $94,167, accounting for 19.6% and 9.9% of families, respectively.
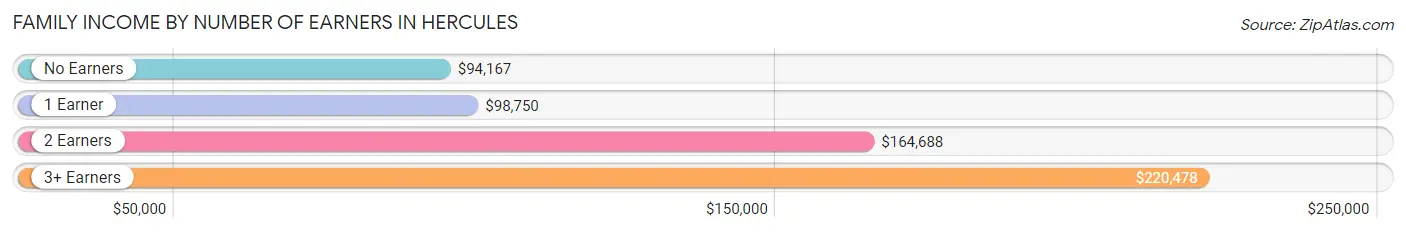
| Number of Earners | # Families | Median Income |
| No Earners | 648 (9.9%) | $94,167 |
| 1 Earner | 1,749 (26.7%) | $98,750 |
| 2 Earners | 2,875 (43.9%) | $164,688 |
| 3+ Earners | 1,281 (19.6%) | $220,478 |
| Total | 6,553 (100.0%) | $140,214 |
Household Income in Hercules
Household Income Brackets in Hercules
With 2,436 households falling in the category, the $200,000+ income range is the most frequent in Hercules, accounting for 27.1% of all households. In contrast, only 153 households (1.7%) fall into the $25,000 to $34,999 income bracket, making it the least populous group.
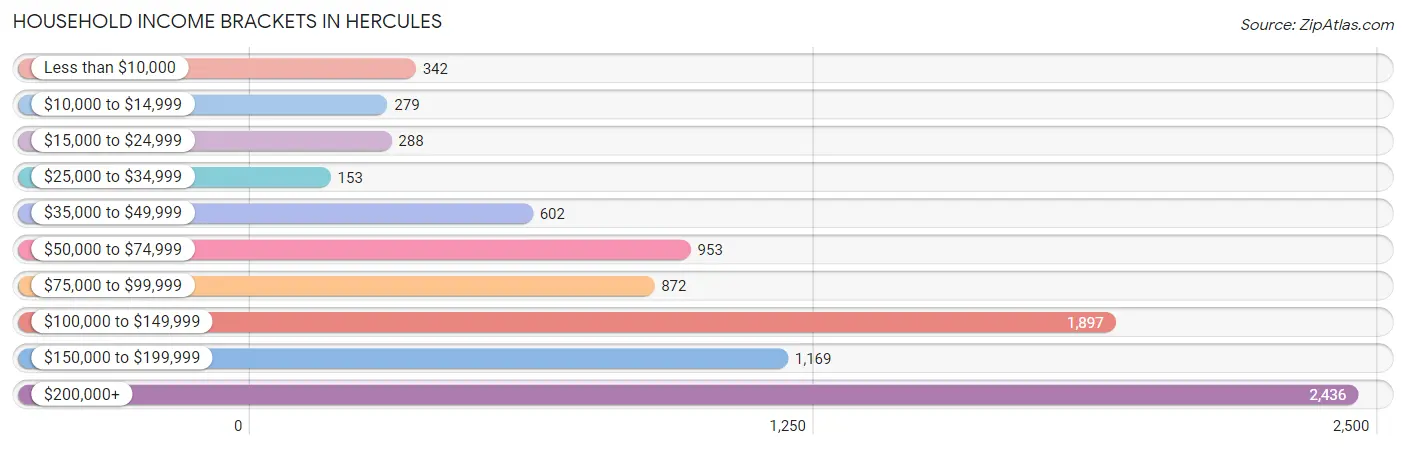
| Income Bracket | # Households | % Households |
| Less than $10,000 | 342 | 3.8% |
| $10,000 to $14,999 | 279 | 3.1% |
| $15,000 to $24,999 | 288 | 3.2% |
| $25,000 to $34,999 | 153 | 1.7% |
| $35,000 to $49,999 | 602 | 6.7% |
| $50,000 to $74,999 | 953 | 10.6% |
| $75,000 to $99,999 | 872 | 9.7% |
| $100,000 to $149,999 | 1,897 | 21.1% |
| $150,000 to $199,999 | 1,169 | 13.0% |
| $200,000+ | 2,436 | 27.1% |
Household Income by Householder Age in Hercules
The median household income in Hercules is $125,880, with the highest median household income of $148,942 found in the 45 to 64 years age bracket for the primary householder. A total of 3,953 households (44.0%) fall into this category. Meanwhile, the 15 to 24 years age bracket for the primary householder has the lowest median household income of $48,571, with 70 households (0.8%) in this group.
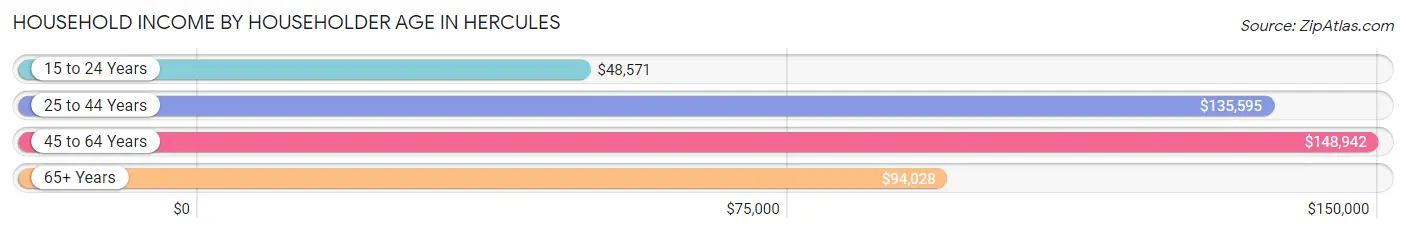
| Income Bracket | # Households | Median Income |
| 15 to 24 Years | 70 (0.8%) | $48,571 |
| 25 to 44 Years | 2,564 (28.5%) | $135,595 |
| 45 to 64 Years | 3,953 (44.0%) | $148,942 |
| 65+ Years | 2,403 (26.7%) | $94,028 |
| Total | 8,990 (100.0%) | $125,880 |
Poverty in Hercules
Income Below Poverty by Sex and Age in Hercules
With 2.4% poverty level for males and 6.7% for females among the residents of Hercules, 75 year old and over males and 55 to 64 year old females are the most vulnerable to poverty, with 53 males (7.5%) and 337 females (14.7%) in their respective age groups living below the poverty level.
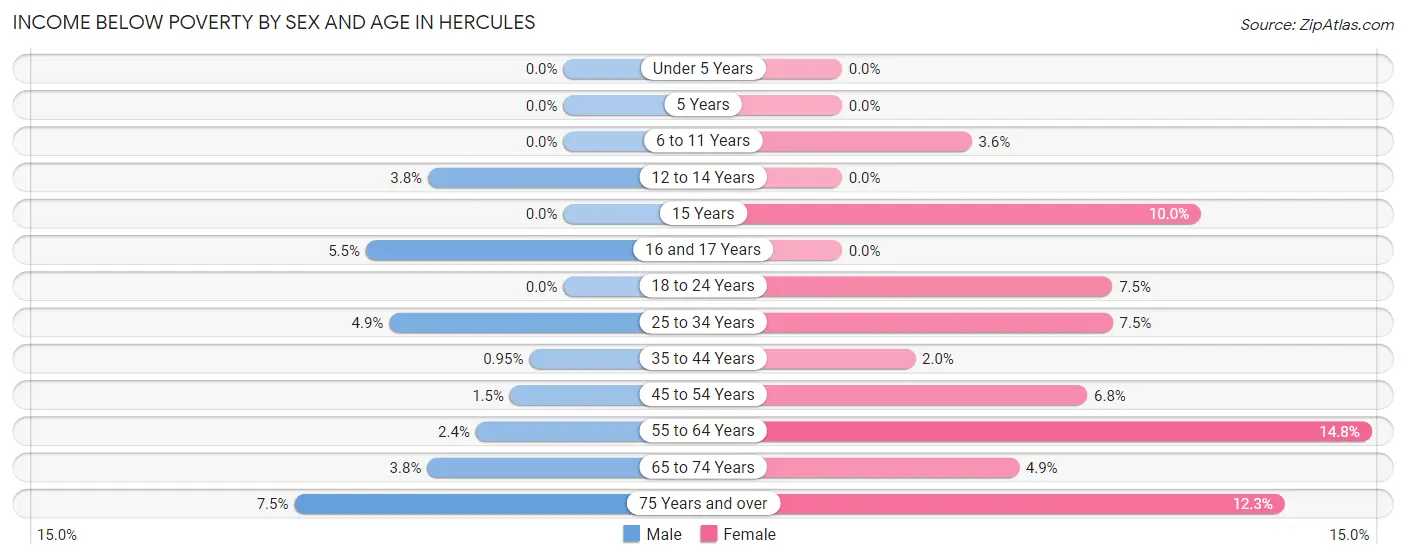
| Age Bracket | Male | Female |
| Under 5 Years | 0 (0.0%) | 0 (0.0%) |
| 5 Years | 0 (0.0%) | 0 (0.0%) |
| 6 to 11 Years | 0 (0.0%) | 38 (3.6%) |
| 12 to 14 Years | 18 (3.8%) | 0 (0.0%) |
| 15 Years | 0 (0.0%) | 8 (10.0%) |
| 16 and 17 Years | 17 (5.5%) | 0 (0.0%) |
| 18 to 24 Years | 0 (0.0%) | 77 (7.5%) |
| 25 to 34 Years | 71 (4.9%) | 120 (7.5%) |
| 35 to 44 Years | 16 (0.9%) | 42 (2.0%) |
| 45 to 54 Years | 25 (1.5%) | 109 (6.8%) |
| 55 to 64 Years | 46 (2.4%) | 337 (14.7%) |
| 65 to 74 Years | 48 (3.8%) | 85 (4.9%) |
| 75 Years and over | 53 (7.5%) | 111 (12.3%) |
| Total | 294 (2.4%) | 927 (6.7%) |
Income Above Poverty by Sex and Age in Hercules
According to the poverty statistics in Hercules, males aged under 5 years and females aged under 5 years are the age groups that are most secure financially, with 100.0% of males and 100.0% of females in these age groups living above the poverty line.
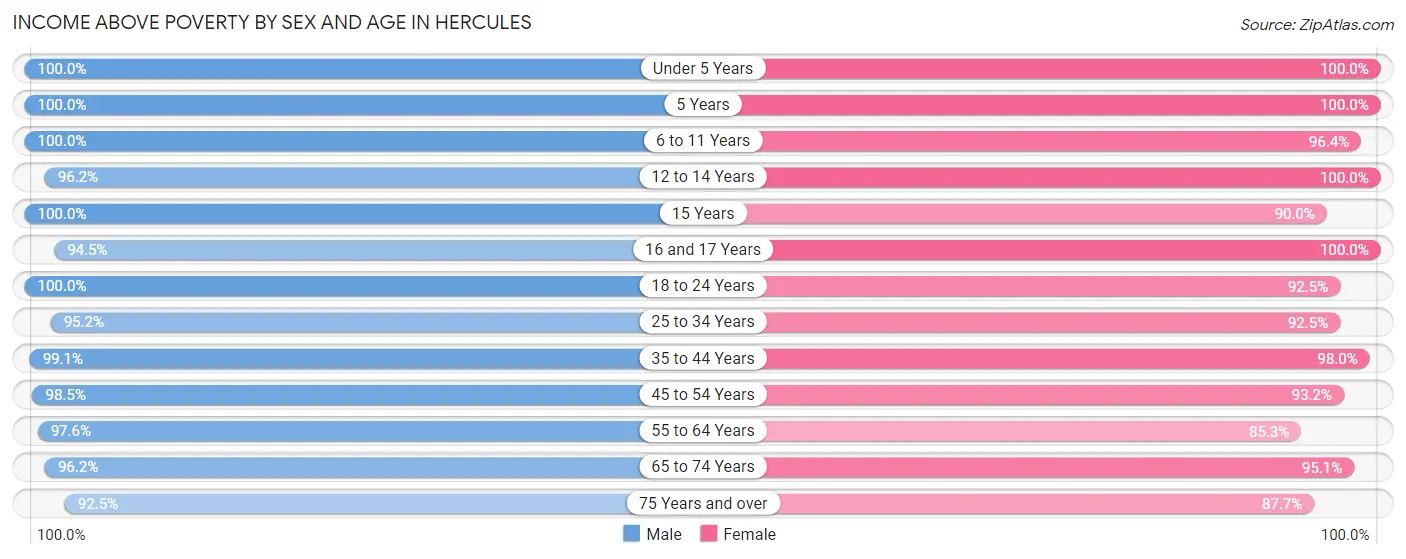
| Age Bracket | Male | Female |
| Under 5 Years | 569 (100.0%) | 539 (100.0%) |
| 5 Years | 168 (100.0%) | 233 (100.0%) |
| 6 to 11 Years | 906 (100.0%) | 1,016 (96.4%) |
| 12 to 14 Years | 460 (96.2%) | 507 (100.0%) |
| 15 Years | 93 (100.0%) | 72 (90.0%) |
| 16 and 17 Years | 292 (94.5%) | 170 (100.0%) |
| 18 to 24 Years | 1,023 (100.0%) | 945 (92.5%) |
| 25 to 34 Years | 1,393 (95.2%) | 1,472 (92.5%) |
| 35 to 44 Years | 1,670 (99.1%) | 2,015 (98.0%) |
| 45 to 54 Years | 1,653 (98.5%) | 1,487 (93.2%) |
| 55 to 64 Years | 1,836 (97.6%) | 1,948 (85.3%) |
| 65 to 74 Years | 1,220 (96.2%) | 1,640 (95.1%) |
| 75 Years and over | 655 (92.5%) | 789 (87.7%) |
| Total | 11,938 (97.6%) | 12,833 (93.3%) |
Income Below Poverty Among Married-Couple Families in Hercules
The poverty statistics for married-couple families in Hercules show that 1.7% or 85 of the total 5,025 families live below the poverty line. Families with 1 or 2 children have the highest poverty rate of 2.0%, comprising of 33 families. On the other hand, families with 3 or 4 children have the lowest poverty rate of 0.0%, which includes 0 families.
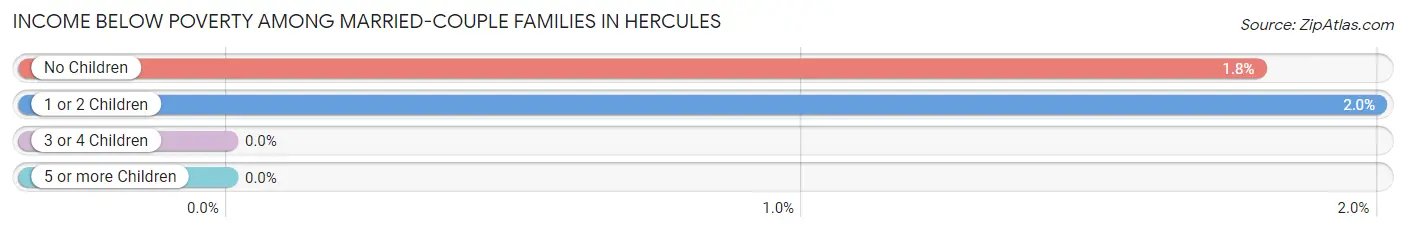
| Children | Above Poverty | Below Poverty |
| No Children | 2,858 (98.2%) | 52 (1.8%) |
| 1 or 2 Children | 1,616 (98.0%) | 33 (2.0%) |
| 3 or 4 Children | 373 (100.0%) | 0 (0.0%) |
| 5 or more Children | 93 (100.0%) | 0 (0.0%) |
| Total | 4,940 (98.3%) | 85 (1.7%) |
Income Below Poverty Among Single-Parent Households in Hercules
According to the poverty data in Hercules, 4.8% or 14 single-father households and 4.3% or 53 single-mother households are living below the poverty line. Among single-father households, those with no children have the highest poverty rate, with 14 households (6.0%) experiencing poverty. Likewise, among single-mother households, those with 1 or 2 children have the highest poverty rate, with 46 households (6.2%) falling below the poverty line.
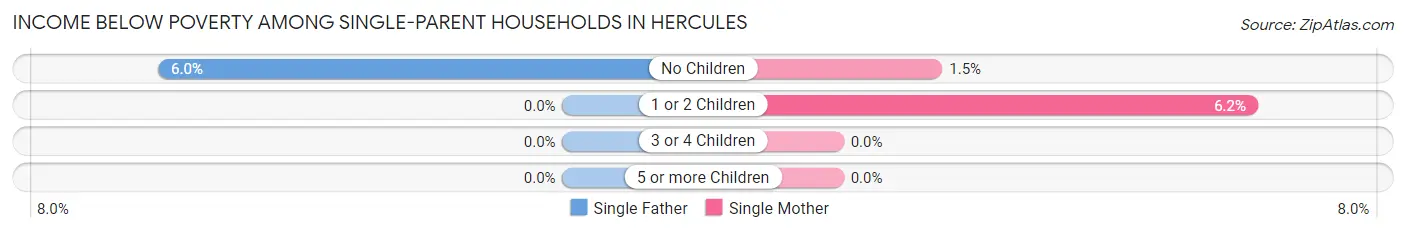
| Children | Single Father | Single Mother |
| No Children | 14 (6.0%) | 7 (1.5%) |
| 1 or 2 Children | 0 (0.0%) | 46 (6.2%) |
| 3 or 4 Children | 0 (0.0%) | 0 (0.0%) |
| 5 or more Children | 0 (0.0%) | 0 (0.0%) |
| Total | 14 (4.8%) | 53 (4.3%) |
Income Below Poverty Among Married-Couple vs Single-Parent Households in Hercules
The poverty data for Hercules shows that 85 of the married-couple family households (1.7%) and 67 of the single-parent households (4.4%) are living below the poverty level. Within the married-couple family households, those with 1 or 2 children have the highest poverty rate, with 33 households (2.0%) falling below the poverty line. Among the single-parent households, those with 1 or 2 children have the highest poverty rate, with 46 household (5.7%) living below poverty.
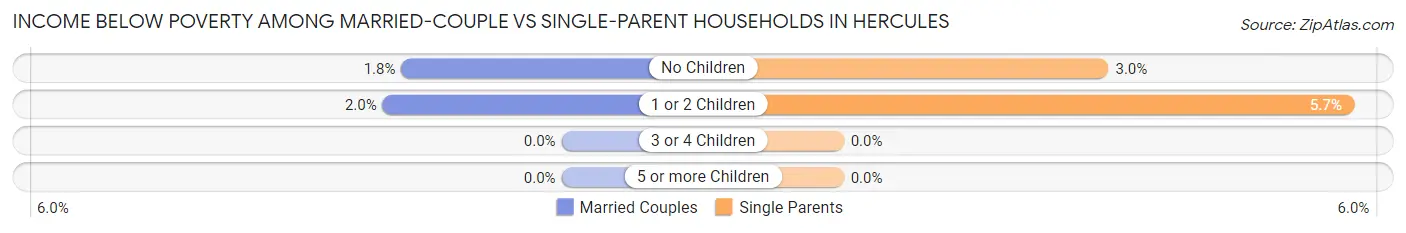
| Children | Married-Couple Families | Single-Parent Households |
| No Children | 52 (1.8%) | 21 (3.0%) |
| 1 or 2 Children | 33 (2.0%) | 46 (5.7%) |
| 3 or 4 Children | 0 (0.0%) | 0 (0.0%) |
| 5 or more Children | 0 (0.0%) | 0 (0.0%) |
| Total | 85 (1.7%) | 67 (4.4%) |
Race in Hercules
The most populous races in Hercules are Asian (10,862 | 41.7%), White / Caucasian (5,833 | 22.4%), and Black / African American (5,084 | 19.5%).
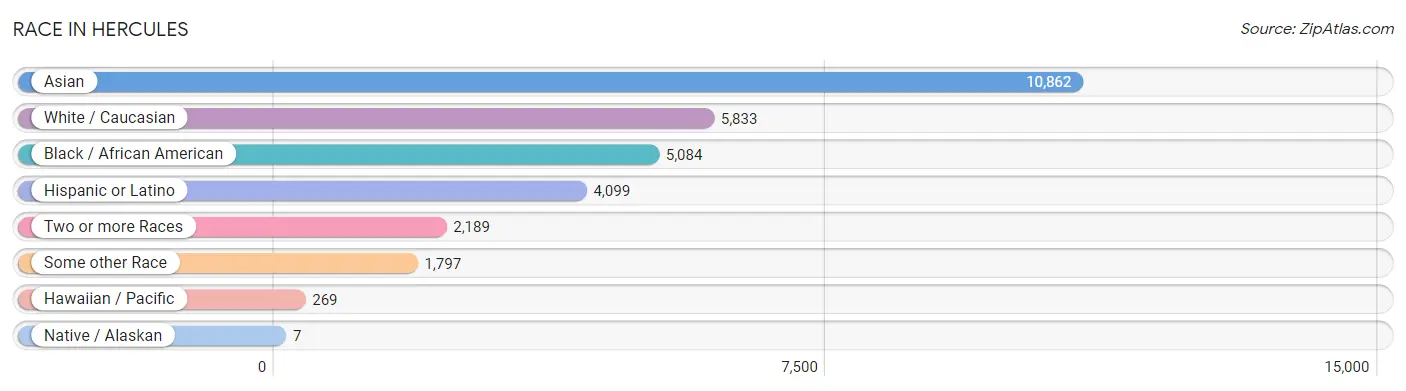
| Race | # Population | % Population |
| Asian | 10,862 | 41.7% |
| Black / African American | 5,084 | 19.5% |
| Hawaiian / Pacific | 269 | 1.0% |
| Hispanic or Latino | 4,099 | 15.7% |
| Native / Alaskan | 7 | 0.0% |
| White / Caucasian | 5,833 | 22.4% |
| Two or more Races | 2,189 | 8.4% |
| Some other Race | 1,797 | 6.9% |
| Total | 26,041 | 100.0% |
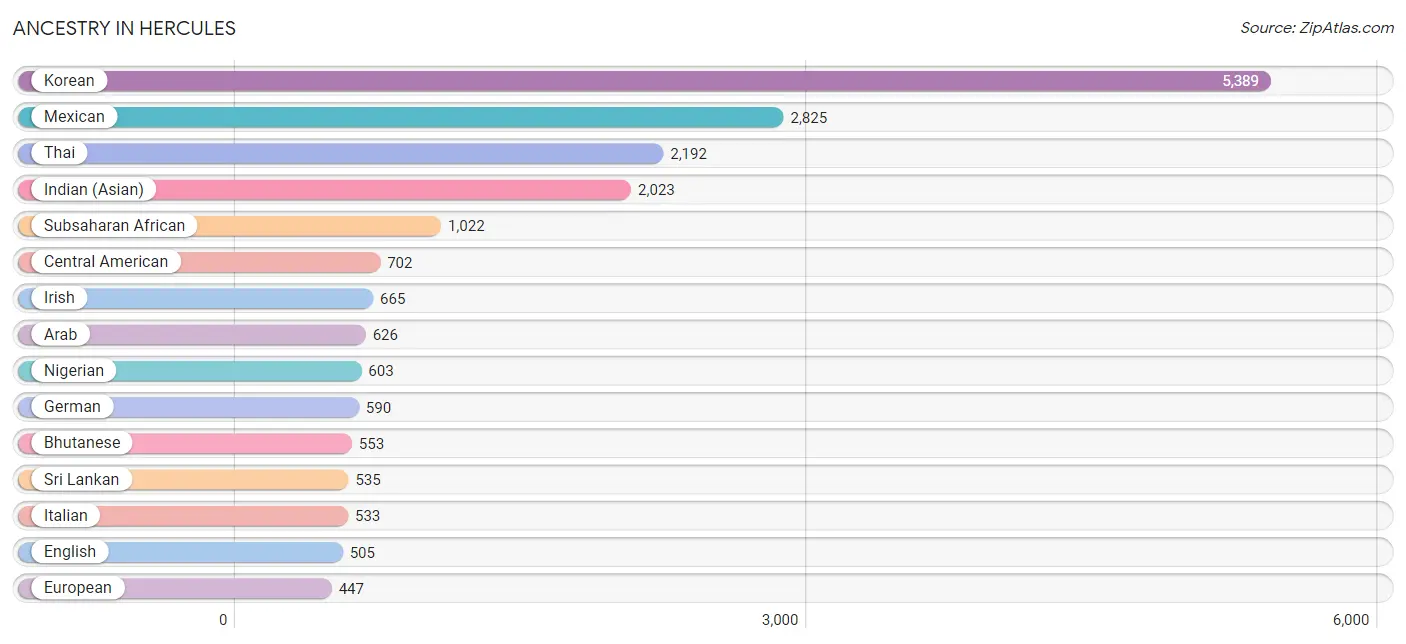
Ancestry in Hercules
The most populous ancestries reported in Hercules are Korean (5,389 | 20.7%), Mexican (2,825 | 10.8%), Thai (2,192 | 8.4%), Indian (Asian) (2,023 | 7.8%), and Subsaharan African (1,022 | 3.9%), together accounting for 51.6% of all Hercules residents.
| Ancestry | # Population | % Population |
| African | 119 | 0.5% |
| American | 377 | 1.5% |
| Apache | 5 | 0.0% |
| Arab | 626 | 2.4% |
| Argentinean | 22 | 0.1% |
| Assyrian / Chaldean / Syriac | 27 | 0.1% |
| Austrian | 25 | 0.1% |
| Bhutanese | 553 | 2.1% |
| Blackfeet | 8 | 0.0% |
| Bolivian | 9 | 0.0% |
| Brazilian | 13 | 0.1% |
| British | 106 | 0.4% |
| Bulgarian | 19 | 0.1% |
| Burmese | 311 | 1.2% |
| Cambodian | 6 | 0.0% |
| Canadian | 9 | 0.0% |
| Central American | 702 | 2.7% |
| Central American Indian | 16 | 0.1% |
| Cherokee | 10 | 0.0% |
| Chilean | 86 | 0.3% |
| Colombian | 18 | 0.1% |
| Costa Rican | 14 | 0.1% |
| Croatian | 21 | 0.1% |
| Cypriot | 11 | 0.0% |
| Danish | 69 | 0.3% |
| Dominican | 40 | 0.2% |
| Dutch | 46 | 0.2% |
| Eastern European | 12 | 0.1% |
| Egyptian | 67 | 0.3% |
| English | 505 | 1.9% |
| Ethiopian | 249 | 1.0% |
| European | 447 | 1.7% |
| Filipino | 15 | 0.1% |
| French | 63 | 0.2% |
| French Canadian | 19 | 0.1% |
| German | 590 | 2.3% |
| Ghanaian | 8 | 0.0% |
| Greek | 13 | 0.1% |
| Guamanian / Chamorro | 105 | 0.4% |
| Guatemalan | 55 | 0.2% |
| Haitian | 15 | 0.1% |
| Honduran | 70 | 0.3% |
| Hungarian | 32 | 0.1% |
| Indian (Asian) | 2,023 | 7.8% |
| Indonesian | 40 | 0.2% |
| Iranian | 191 | 0.7% |
| Irish | 665 | 2.5% |
| Italian | 533 | 2.1% |
| Jamaican | 24 | 0.1% |
| Japanese | 91 | 0.4% |
| Kenyan | 26 | 0.1% |
| Korean | 5,389 | 20.7% |
| Laotian | 5 | 0.0% |
| Lebanese | 10 | 0.0% |
| Lithuanian | 16 | 0.1% |
| Malaysian | 227 | 0.9% |
| Mexican | 2,825 | 10.8% |
| Mexican American Indian | 4 | 0.0% |
| Mongolian | 23 | 0.1% |
| Native Hawaiian | 73 | 0.3% |
| Nepalese | 10 | 0.0% |
| Nicaraguan | 234 | 0.9% |
| Nigerian | 603 | 2.3% |
| Norwegian | 157 | 0.6% |
| Osage | 17 | 0.1% |
| Pakistani | 37 | 0.1% |
| Panamanian | 35 | 0.1% |
| Peruvian | 42 | 0.2% |
| Polish | 250 | 1.0% |
| Portuguese | 140 | 0.5% |
| Puerto Rican | 273 | 1.1% |
| Romanian | 57 | 0.2% |
| Russian | 48 | 0.2% |
| Salvadoran | 294 | 1.1% |
| Samoan | 73 | 0.3% |
| Scandinavian | 6 | 0.0% |
| Scotch-Irish | 112 | 0.4% |
| Scottish | 37 | 0.1% |
| Sioux | 3 | 0.0% |
| Slovak | 90 | 0.4% |
| South American | 177 | 0.7% |
| Spaniard | 25 | 0.1% |
| Spanish | 17 | 0.1% |
| Spanish American Indian | 17 | 0.1% |
| Sri Lankan | 535 | 2.1% |
| Subsaharan African | 1,022 | 3.9% |
| Swedish | 62 | 0.2% |
| Thai | 2,192 | 8.4% |
| Turkish | 428 | 1.6% |
| Ukrainian | 10 | 0.0% |
| Vietnamese | 32 | 0.1% |
| Welsh | 68 | 0.3% |
| West Indian | 17 | 0.1% | View All 93 Rows |
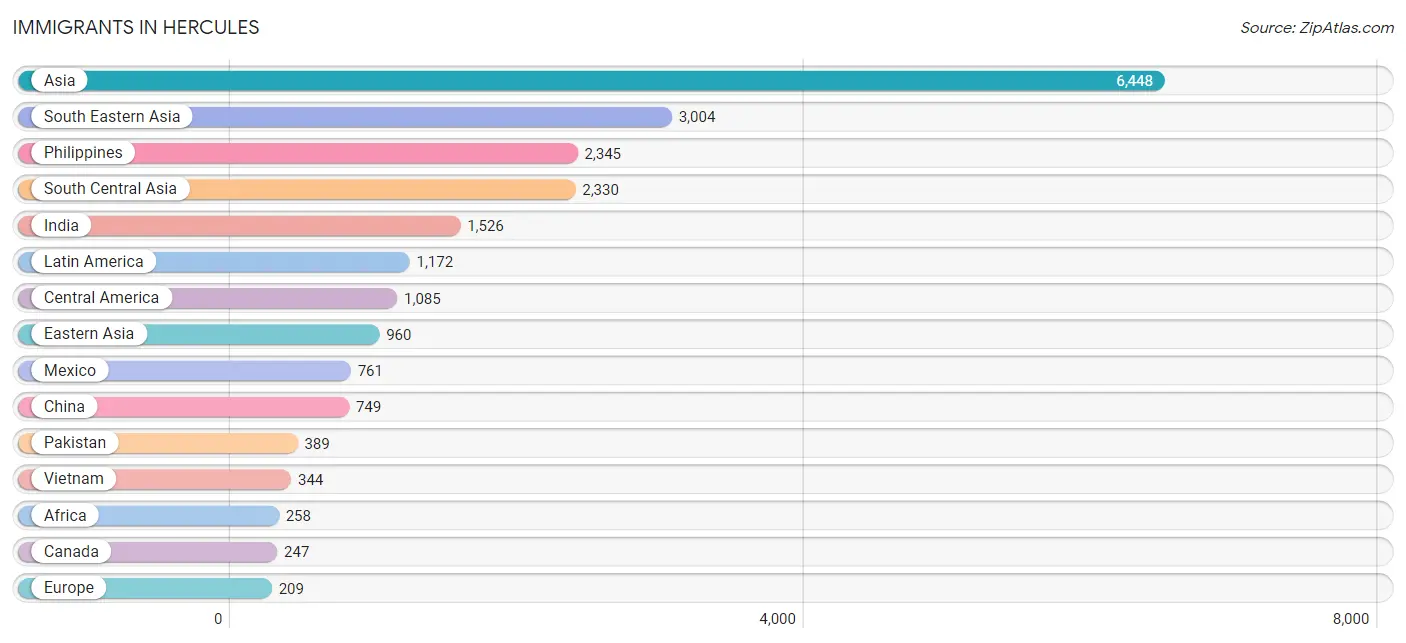
Immigrants in Hercules
The most numerous immigrant groups reported in Hercules came from Asia (6,448 | 24.8%), South Eastern Asia (3,004 | 11.5%), Philippines (2,345 | 9.0%), South Central Asia (2,330 | 8.9%), and India (1,526 | 5.9%), together accounting for 60.1% of all Hercules residents.
| Immigration Origin | # Population | % Population |
| Africa | 258 | 1.0% |
| Asia | 6,448 | 24.8% |
| Bangladesh | 34 | 0.1% |
| Bolivia | 9 | 0.0% |
| Brazil | 27 | 0.1% |
| Bulgaria | 19 | 0.1% |
| Cambodia | 25 | 0.1% |
| Canada | 247 | 0.9% |
| Caribbean | 15 | 0.1% |
| Central America | 1,085 | 4.2% |
| Chile | 23 | 0.1% |
| China | 749 | 2.9% |
| Costa Rica | 4 | 0.0% |
| Eastern Africa | 101 | 0.4% |
| Eastern Asia | 960 | 3.7% |
| Eastern Europe | 127 | 0.5% |
| El Salvador | 151 | 0.6% |
| England | 18 | 0.1% |
| Eritrea | 43 | 0.2% |
| Ethiopia | 49 | 0.2% |
| Europe | 209 | 0.8% |
| Fiji | 46 | 0.2% |
| Germany | 11 | 0.0% |
| Ghana | 8 | 0.0% |
| Guatemala | 16 | 0.1% |
| Haiti | 15 | 0.1% |
| Honduras | 36 | 0.1% |
| Hong Kong | 80 | 0.3% |
| India | 1,526 | 5.9% |
| Indonesia | 36 | 0.1% |
| Iran | 177 | 0.7% |
| Iraq | 57 | 0.2% |
| Ireland | 15 | 0.1% |
| Israel | 8 | 0.0% |
| Japan | 39 | 0.2% |
| Kenya | 9 | 0.0% |
| Korea | 172 | 0.7% |
| Laos | 76 | 0.3% |
| Latin America | 1,172 | 4.5% |
| Malaysia | 36 | 0.1% |
| Mexico | 761 | 2.9% |
| Nepal | 161 | 0.6% |
| Nicaragua | 96 | 0.4% |
| Nigeria | 144 | 0.5% |
| Northern Europe | 65 | 0.3% |
| Oceania | 80 | 0.3% |
| Pakistan | 389 | 1.5% |
| Panama | 21 | 0.1% |
| Peru | 13 | 0.1% |
| Philippines | 2,345 | 9.0% |
| Portugal | 6 | 0.0% |
| Romania | 52 | 0.2% |
| Russia | 26 | 0.1% |
| Scotland | 10 | 0.0% |
| Singapore | 50 | 0.2% |
| South America | 72 | 0.3% |
| South Central Asia | 2,330 | 8.9% |
| South Eastern Asia | 3,004 | 11.5% |
| Southern Europe | 6 | 0.0% |
| Sri Lanka | 43 | 0.2% |
| Sweden | 4 | 0.0% |
| Syria | 20 | 0.1% |
| Taiwan | 46 | 0.2% |
| Thailand | 33 | 0.1% |
| Ukraine | 15 | 0.1% |
| Vietnam | 344 | 1.3% |
| Western Africa | 152 | 0.6% |
| Western Asia | 154 | 0.6% |
| Western Europe | 11 | 0.0% |
| Yemen | 58 | 0.2% | View All 70 Rows |
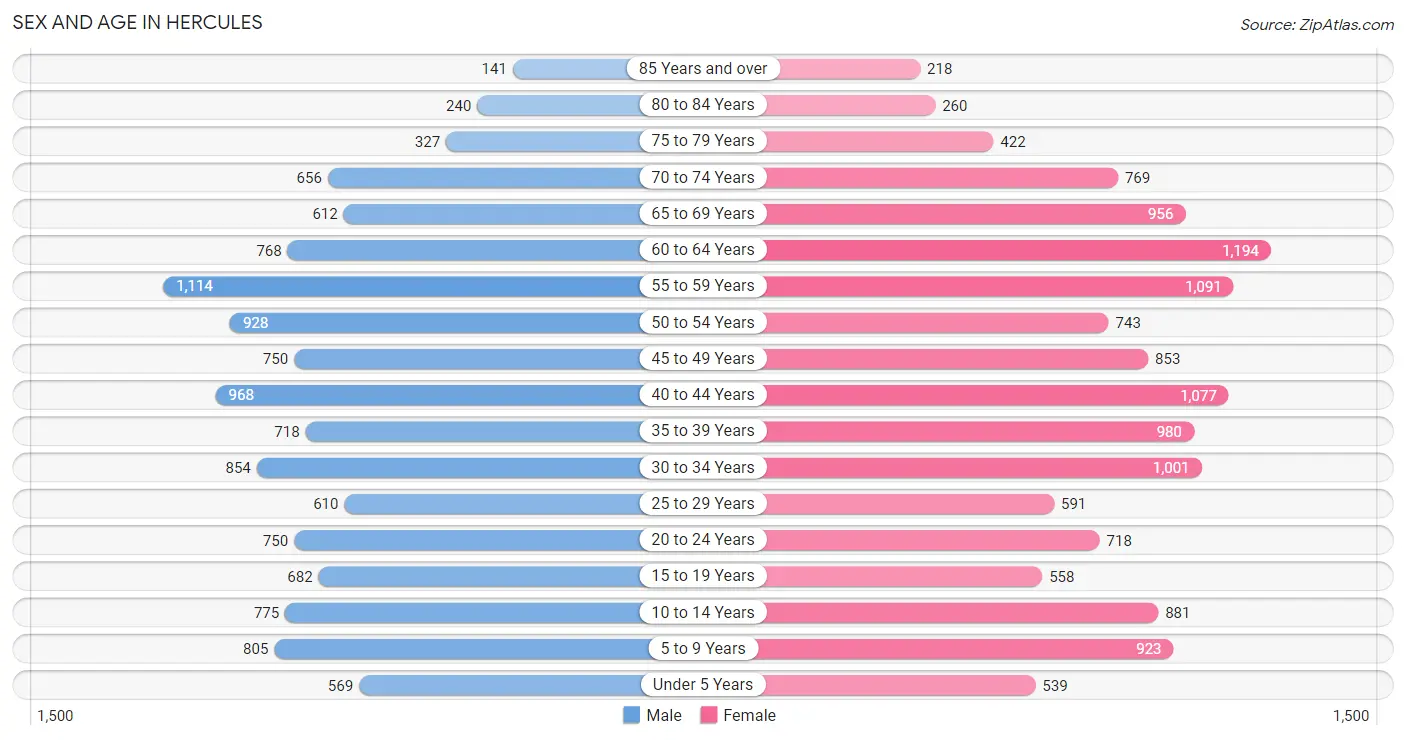
Sex and Age in Hercules
Sex and Age in Hercules
The most populous age groups in Hercules are 55 to 59 Years (1,114 | 9.1%) for men and 60 to 64 Years (1,194 | 8.7%) for women.
| Age Bracket | Male | Female |
| Under 5 Years | 569 (4.6%) | 539 (3.9%) |
| 5 to 9 Years | 805 (6.6%) | 923 (6.7%) |
| 10 to 14 Years | 775 (6.3%) | 881 (6.4%) |
| 15 to 19 Years | 682 (5.6%) | 558 (4.1%) |
| 20 to 24 Years | 750 (6.1%) | 718 (5.2%) |
| 25 to 29 Years | 610 (5.0%) | 591 (4.3%) |
| 30 to 34 Years | 854 (7.0%) | 1,001 (7.3%) |
| 35 to 39 Years | 718 (5.9%) | 980 (7.1%) |
| 40 to 44 Years | 968 (7.9%) | 1,077 (7.8%) |
| 45 to 49 Years | 750 (6.1%) | 853 (6.2%) |
| 50 to 54 Years | 928 (7.6%) | 743 (5.4%) |
| 55 to 59 Years | 1,114 (9.1%) | 1,091 (7.9%) |
| 60 to 64 Years | 768 (6.3%) | 1,194 (8.7%) |
| 65 to 69 Years | 612 (5.0%) | 956 (6.9%) |
| 70 to 74 Years | 656 (5.3%) | 769 (5.6%) |
| 75 to 79 Years | 327 (2.7%) | 422 (3.1%) |
| 80 to 84 Years | 240 (2.0%) | 260 (1.9%) |
| 85 Years and over | 141 (1.1%) | 218 (1.6%) |
| Total | 12,267 (100.0%) | 13,774 (100.0%) |
Families and Households in Hercules
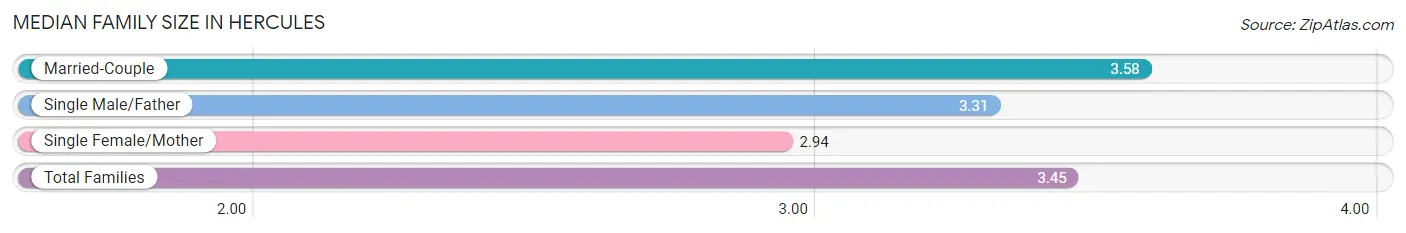
Median Family Size in Hercules
The median family size in Hercules is 3.45 persons per family, with married-couple families (5,025 | 76.7%) accounting for the largest median family size of 3.58 persons per family. On the other hand, single female/mother families (1,234 | 18.8%) represent the smallest median family size with 2.94 persons per family.
| Family Type | # Families | Family Size |
| Married-Couple | 5,025 (76.7%) | 3.58 |
| Single Male/Father | 294 (4.5%) | 3.31 |
| Single Female/Mother | 1,234 (18.8%) | 2.94 |
| Total Families | 6,553 (100.0%) | 3.45 |
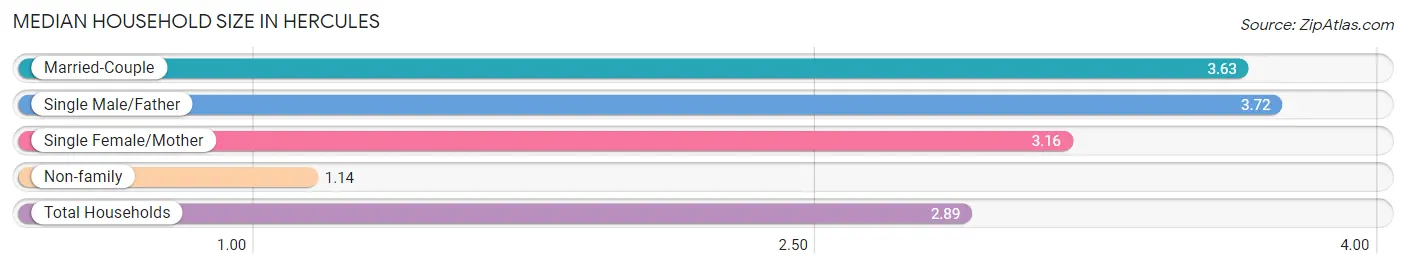
Median Household Size in Hercules
The median household size in Hercules is 2.89 persons per household, with single male/father households (294 | 3.3%) accounting for the largest median household size of 3.72 persons per household. non-family households (2,437 | 27.1%) represent the smallest median household size with 1.14 persons per household.
| Household Type | # Households | Household Size |
| Married-Couple | 5,025 (55.9%) | 3.63 |
| Single Male/Father | 294 (3.3%) | 3.72 |
| Single Female/Mother | 1,234 (13.7%) | 3.16 |
| Non-family | 2,437 (27.1%) | 1.14 |
| Total Households | 8,990 (100.0%) | 2.89 |
Household Size by Marriage Status in Hercules
Out of a total of 8,990 households in Hercules, 6,553 (72.9%) are family households, while 2,437 (27.1%) are nonfamily households. The most numerous type of family households are 2-person households, comprising 2,252, and the most common type of nonfamily households are 1-person households, comprising 2,148.
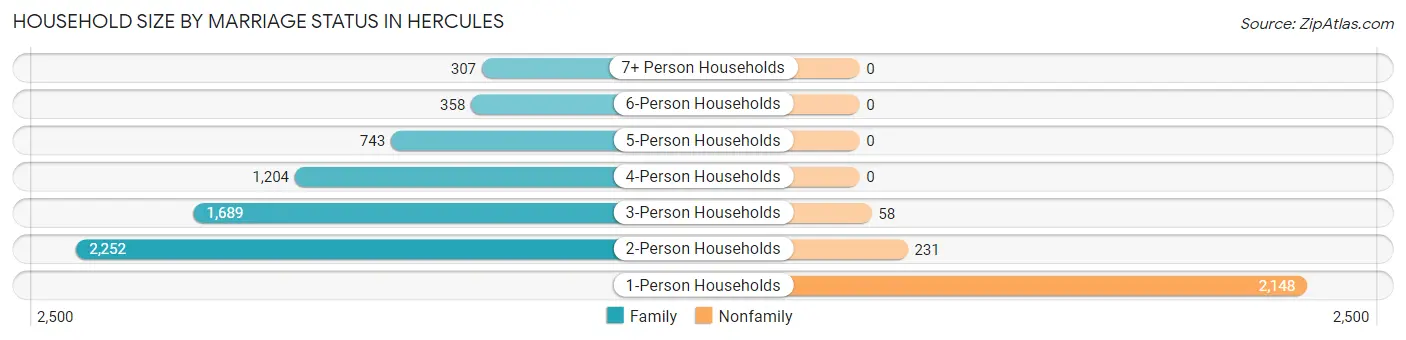
| Household Size | Family Households | Nonfamily Households |
| 1-Person Households | - | 2,148 (23.9%) |
| 2-Person Households | 2,252 (25.1%) | 231 (2.6%) |
| 3-Person Households | 1,689 (18.8%) | 58 (0.6%) |
| 4-Person Households | 1,204 (13.4%) | 0 (0.0%) |
| 5-Person Households | 743 (8.3%) | 0 (0.0%) |
| 6-Person Households | 358 (4.0%) | 0 (0.0%) |
| 7+ Person Households | 307 (3.4%) | 0 (0.0%) |
| Total | 6,553 (72.9%) | 2,437 (27.1%) |
Female Fertility in Hercules
Fertility by Age in Hercules
Average fertility rate in Hercules is 37.0 births per 1,000 women. Women in the age bracket of 20 to 34 years have the highest fertility rate with 42.0 births per 1,000 women. Women in the age bracket of 35 to 50 years acount for 56.4% of all women with births.
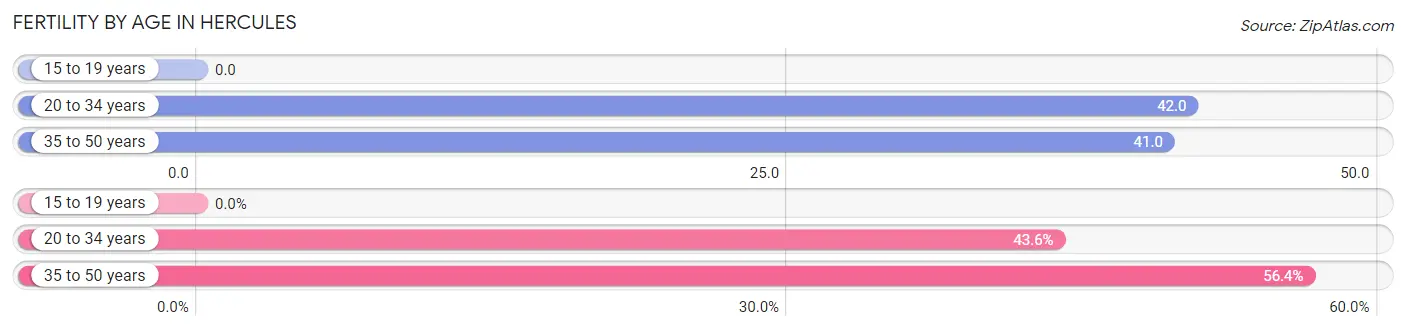
| Age Bracket | Women with Births | Births / 1,000 Women |
| 15 to 19 years | 0 (0.0%) | 0.0 |
| 20 to 34 years | 96 (43.6%) | 42.0 |
| 35 to 50 years | 124 (56.4%) | 41.0 |
| Total | 220 (100.0%) | 37.0 |
Fertility by Age by Marriage Status in Hercules
68.2% of women with births (220) in Hercules are married. The highest percentage of unmarried women with births falls into 20 to 34 years age bracket with 60.4% of them unmarried at the time of birth, while the lowest percentage of unmarried women with births belong to 35 to 50 years age bracket with 9.7% of them unmarried.
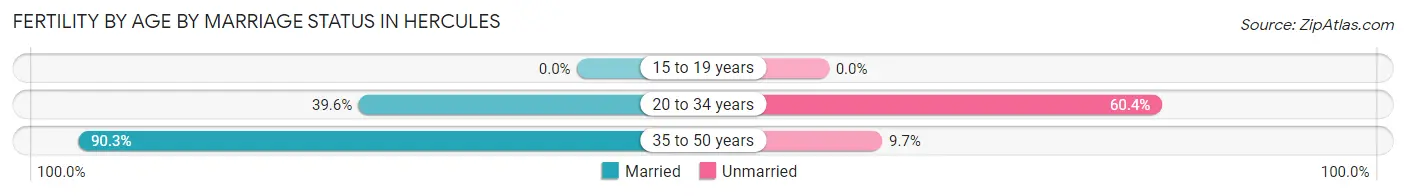
| Age Bracket | Married | Unmarried |
| 15 to 19 years | 0 (0.0%) | 0 (0.0%) |
| 20 to 34 years | 38 (39.6%) | 58 (60.4%) |
| 35 to 50 years | 112 (90.3%) | 12 (9.7%) |
| Total | 150 (68.2%) | 70 (31.8%) |
Fertility by Education in Hercules
Average fertility rate in Hercules is 37.0 births per 1,000 women. Women with the education attainment of high school diploma have the highest fertility rate of 68.0 births per 1,000 women, while women with the education attainment of less than high school have the lowest fertility at 19.0 births per 1,000 women. Women with the education attainment of college or associate's degree represent 25.9% of all women with births.
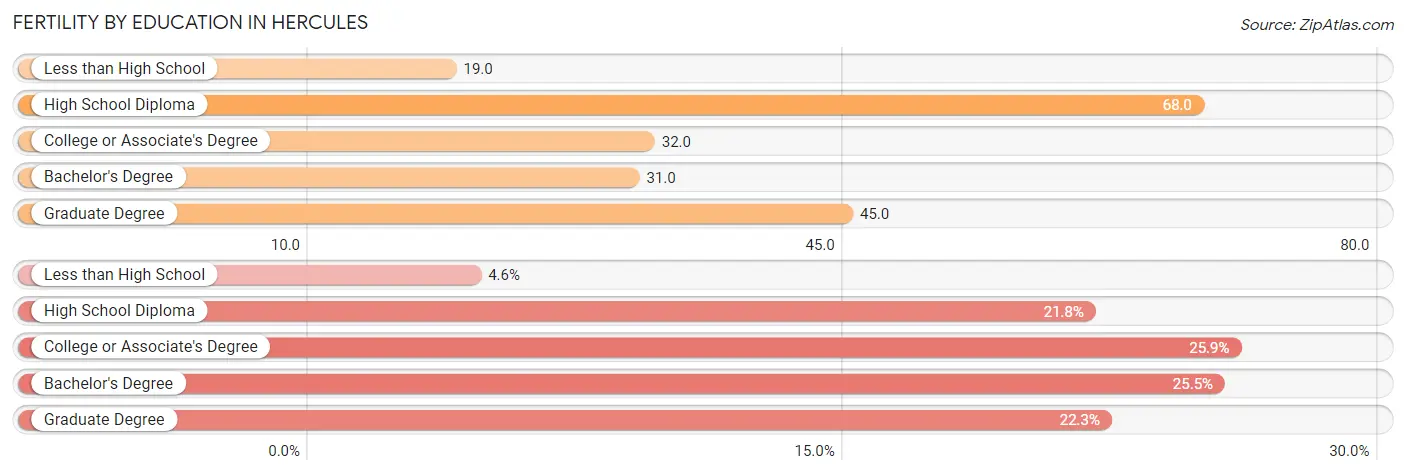
| Educational Attainment | Women with Births | Births / 1,000 Women |
| Less than High School | 10 (4.5%) | 19.0 |
| High School Diploma | 48 (21.8%) | 68.0 |
| College or Associate's Degree | 57 (25.9%) | 32.0 |
| Bachelor's Degree | 56 (25.5%) | 31.0 |
| Graduate Degree | 49 (22.3%) | 45.0 |
| Total | 220 (100.0%) | 37.0 |
Fertility by Education by Marriage Status in Hercules
31.8% of women with births in Hercules are unmarried. Women with the educational attainment of less than high school are most likely to be married with 100.0% of them married at childbirth, while women with the educational attainment of college or associate's degree are least likely to be married with 89.5% of them unmarried at childbirth.
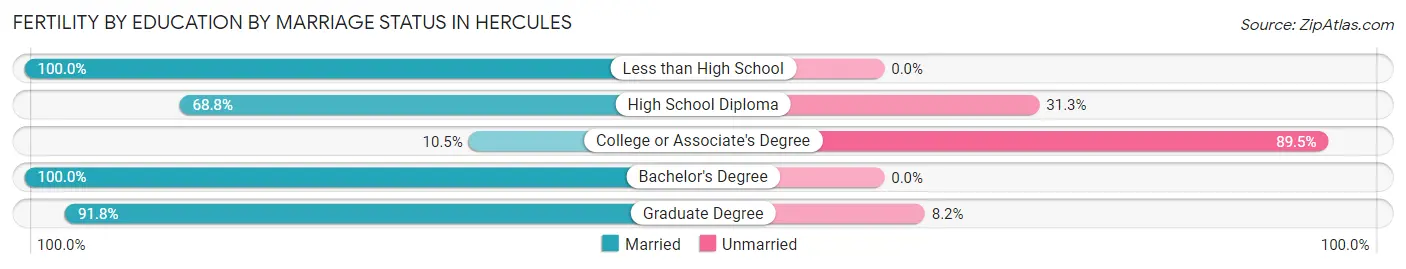
| Educational Attainment | Married | Unmarried |
| Less than High School | 10 (100.0%) | 0 (0.0%) |
| High School Diploma | 33 (68.8%) | 15 (31.2%) |
| College or Associate's Degree | 6 (10.5%) | 51 (89.5%) |
| Bachelor's Degree | 56 (100.0%) | 0 (0.0%) |
| Graduate Degree | 45 (91.8%) | 4 (8.2%) |
| Total | 150 (68.2%) | 70 (31.8%) |
Employment Characteristics in Hercules
Employment by Class of Employer in Hercules
Among the 13,437 employed individuals in Hercules, private company employees (8,197 | 61.0%), local government employees (1,461 | 10.9%), and not-for-profit organizations (1,454 | 10.8%) make up the most common classes of employment.
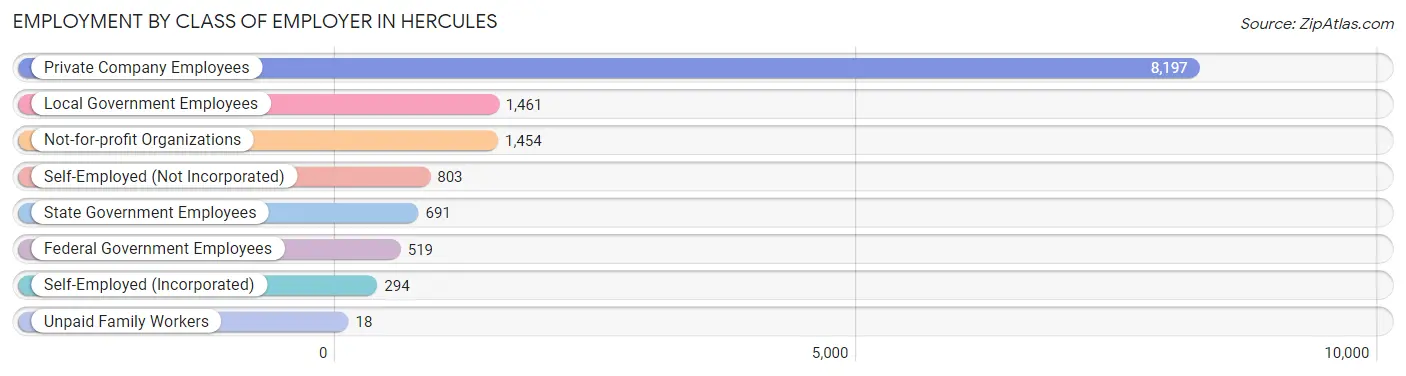
| Employer Class | # Employees | % Employees |
| Private Company Employees | 8,197 | 61.0% |
| Self-Employed (Incorporated) | 294 | 2.2% |
| Self-Employed (Not Incorporated) | 803 | 6.0% |
| Not-for-profit Organizations | 1,454 | 10.8% |
| Local Government Employees | 1,461 | 10.9% |
| State Government Employees | 691 | 5.1% |
| Federal Government Employees | 519 | 3.9% |
| Unpaid Family Workers | 18 | 0.1% |
| Total | 13,437 | 100.0% |
Employment Status by Age in Hercules
According to the labor force statistics for Hercules, out of the total population over 16 years of age (21,374), 67.2% or 14,363 individuals are in the labor force, with 4.4% or 632 of them unemployed. The age group with the highest labor force participation rate is 25 to 29 years, with 89.1% or 1,070 individuals in the labor force. Within the labor force, the 16 to 19 years age range has the highest percentage of unemployed individuals, with 12.8% or 58 of them being unemployed.
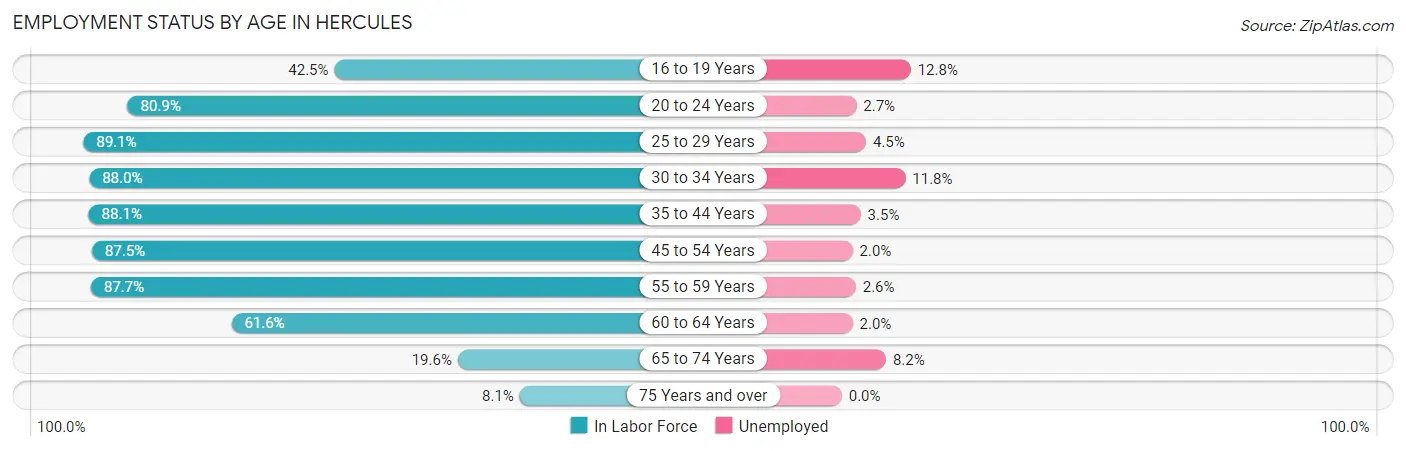
| Age Bracket | In Labor Force | Unemployed |
| 16 to 19 Years | 453 (42.5%) | 58 (12.8%) |
| 20 to 24 Years | 1,188 (80.9%) | 32 (2.7%) |
| 25 to 29 Years | 1,070 (89.1%) | 48 (4.5%) |
| 30 to 34 Years | 1,632 (88.0%) | 193 (11.8%) |
| 35 to 44 Years | 3,298 (88.1%) | 115 (3.5%) |
| 45 to 54 Years | 2,865 (87.5%) | 57 (2.0%) |
| 55 to 59 Years | 1,934 (87.7%) | 50 (2.6%) |
| 60 to 64 Years | 1,209 (61.6%) | 24 (2.0%) |
| 65 to 74 Years | 587 (19.6%) | 48 (8.2%) |
| 75 Years and over | 130 (8.1%) | 0 (0.0%) |
| Total | 14,363 (67.2%) | 632 (4.4%) |
Employment Status by Educational Attainment in Hercules
According to labor force statistics for Hercules, 84.3% of individuals (12,004) out of the total population between 25 and 64 years of age (14,240) are in the labor force, with 4.1% or 492 of them being unemployed. The group with the highest labor force participation rate are those with the educational attainment of bachelor's degree or higher, with 89.8% or 5,915 individuals in the labor force. Within the labor force, individuals with less than high school education have the highest percentage of unemployment, with 7.1% or 47 of them being unemployed.
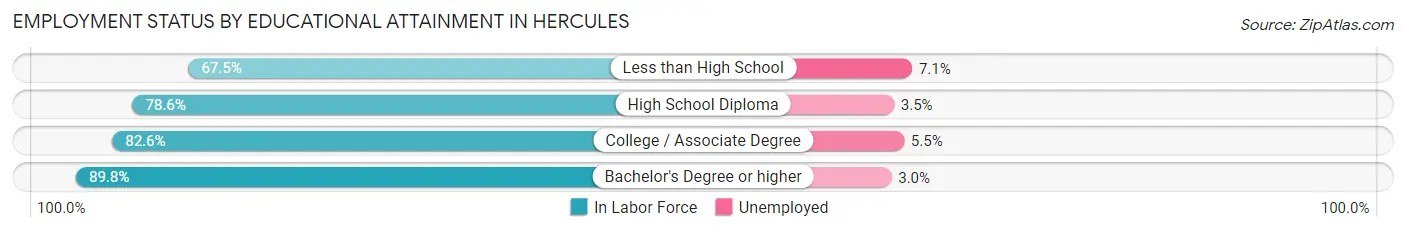
| Educational Attainment | In Labor Force | Unemployed |
| Less than High School | 665 (67.5%) | 70 (7.1%) |
| High School Diploma | 1,640 (78.6%) | 73 (3.5%) |
| College / Associate Degree | 3,784 (82.6%) | 252 (5.5%) |
| Bachelor's Degree or higher | 5,915 (89.8%) | 198 (3.0%) |
| Total | 12,004 (84.3%) | 584 (4.1%) |
Employment Occupations by Sex in Hercules
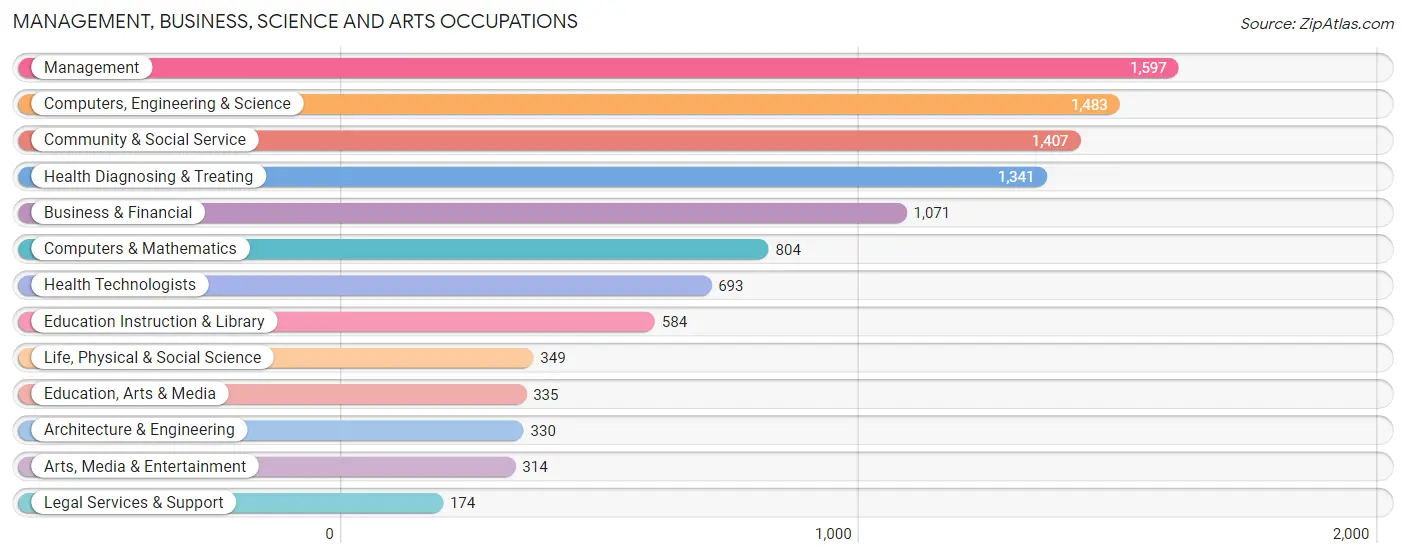
Management, Business, Science and Arts Occupations
The most common Management, Business, Science and Arts occupations in Hercules are Management (1,597 | 11.6%), Computers, Engineering & Science (1,483 | 10.8%), Community & Social Service (1,407 | 10.2%), Health Diagnosing & Treating (1,341 | 9.8%), and Business & Financial (1,071 | 7.8%).
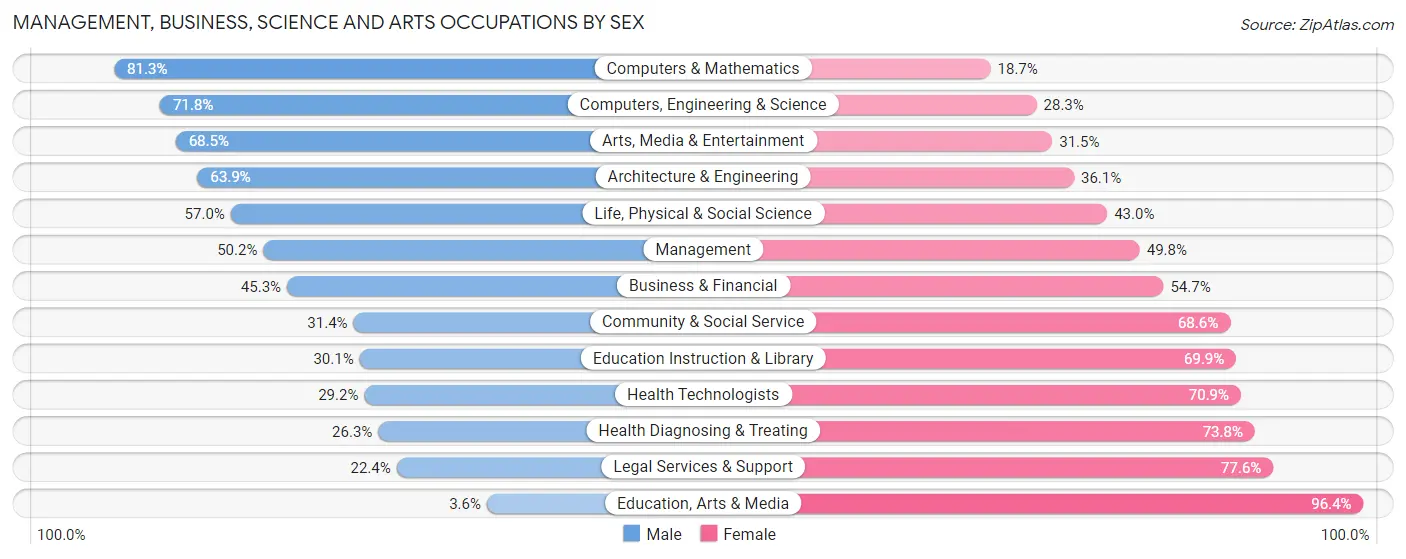
Management, Business, Science and Arts Occupations by Sex
Within the Management, Business, Science and Arts occupations in Hercules, the most male-oriented occupations are Computers & Mathematics (81.3%), Computers, Engineering & Science (71.8%), and Arts, Media & Entertainment (68.5%), while the most female-oriented occupations are Education, Arts & Media (96.4%), Legal Services & Support (77.6%), and Health Diagnosing & Treating (73.8%).
| Occupation | Male | Female |
| Management | 802 (50.2%) | 795 (49.8%) |
| Business & Financial | 485 (45.3%) | 586 (54.7%) |
| Computers, Engineering & Science | 1,064 (71.8%) | 419 (28.2%) |
| Computers & Mathematics | 654 (81.3%) | 150 (18.7%) |
| Architecture & Engineering | 211 (63.9%) | 119 (36.1%) |
| Life, Physical & Social Science | 199 (57.0%) | 150 (43.0%) |
| Community & Social Service | 442 (31.4%) | 965 (68.6%) |
| Education, Arts & Media | 12 (3.6%) | 323 (96.4%) |
| Legal Services & Support | 39 (22.4%) | 135 (77.6%) |
| Education Instruction & Library | 176 (30.1%) | 408 (69.9%) |
| Arts, Media & Entertainment | 215 (68.5%) | 99 (31.5%) |
| Health Diagnosing & Treating | 352 (26.3%) | 989 (73.8%) |
| Health Technologists | 202 (29.1%) | 491 (70.9%) |
| Total (Category) | 3,145 (45.6%) | 3,754 (54.4%) |
| Total (Overall) | 6,894 (50.2%) | 6,833 (49.8%) |
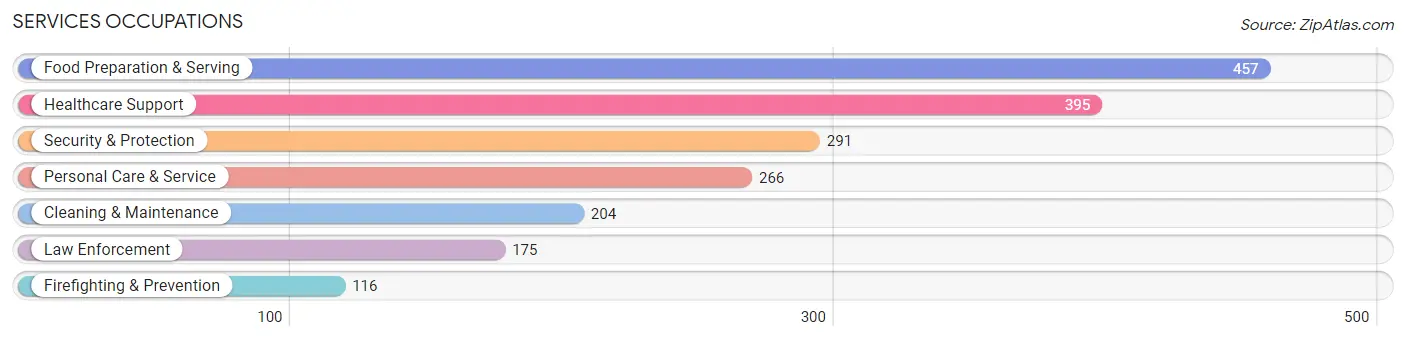
Services Occupations
The most common Services occupations in Hercules are Food Preparation & Serving (457 | 3.3%), Healthcare Support (395 | 2.9%), Security & Protection (291 | 2.1%), Personal Care & Service (266 | 1.9%), and Cleaning & Maintenance (204 | 1.5%).
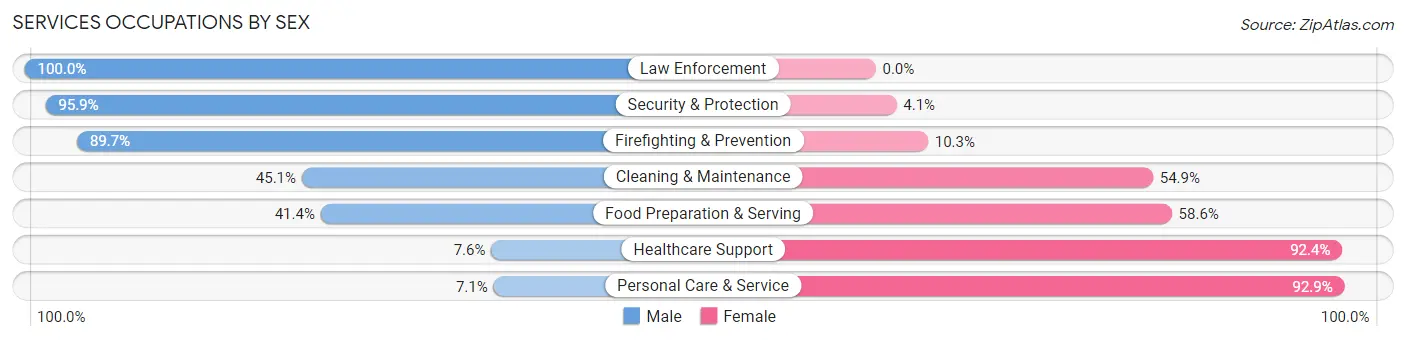
Services Occupations by Sex
Within the Services occupations in Hercules, the most male-oriented occupations are Law Enforcement (100.0%), Security & Protection (95.9%), and Firefighting & Prevention (89.7%), while the most female-oriented occupations are Personal Care & Service (92.9%), Healthcare Support (92.4%), and Food Preparation & Serving (58.6%).
| Occupation | Male | Female |
| Healthcare Support | 30 (7.6%) | 365 (92.4%) |
| Security & Protection | 279 (95.9%) | 12 (4.1%) |
| Firefighting & Prevention | 104 (89.7%) | 12 (10.3%) |
| Law Enforcement | 175 (100.0%) | 0 (0.0%) |
| Food Preparation & Serving | 189 (41.4%) | 268 (58.6%) |
| Cleaning & Maintenance | 92 (45.1%) | 112 (54.9%) |
| Personal Care & Service | 19 (7.1%) | 247 (92.9%) |
| Total (Category) | 609 (37.8%) | 1,004 (62.2%) |
| Total (Overall) | 6,894 (50.2%) | 6,833 (49.8%) |
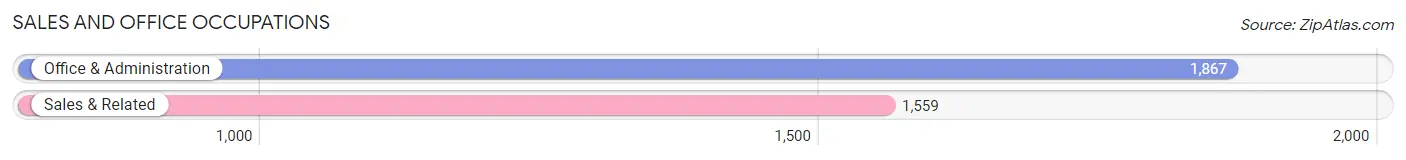
Sales and Office Occupations
The most common Sales and Office occupations in Hercules are Office & Administration (1,867 | 13.6%), and Sales & Related (1,559 | 11.4%).
Sales and Office Occupations by Sex
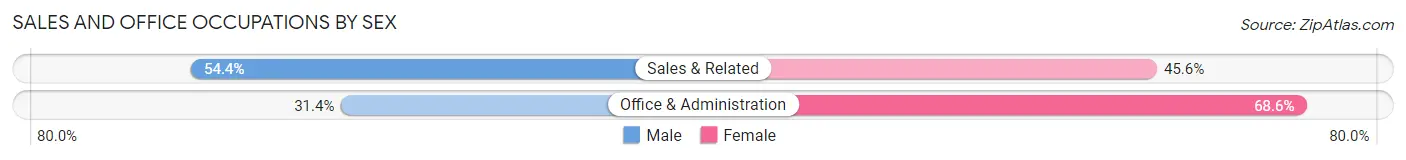
| Occupation | Male | Female |
| Sales & Related | 848 (54.4%) | 711 (45.6%) |
| Office & Administration | 587 (31.4%) | 1,280 (68.6%) |
| Total (Category) | 1,435 (41.9%) | 1,991 (58.1%) |
| Total (Overall) | 6,894 (50.2%) | 6,833 (49.8%) |
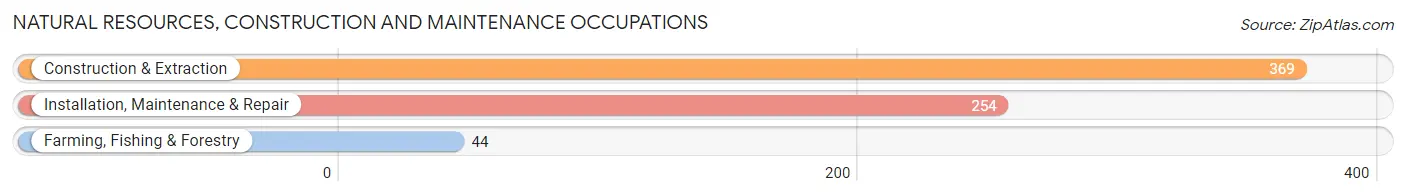
Natural Resources, Construction and Maintenance Occupations
The most common Natural Resources, Construction and Maintenance occupations in Hercules are Construction & Extraction (369 | 2.7%), Installation, Maintenance & Repair (254 | 1.8%), and Farming, Fishing & Forestry (44 | 0.3%).
Natural Resources, Construction and Maintenance Occupations by Sex
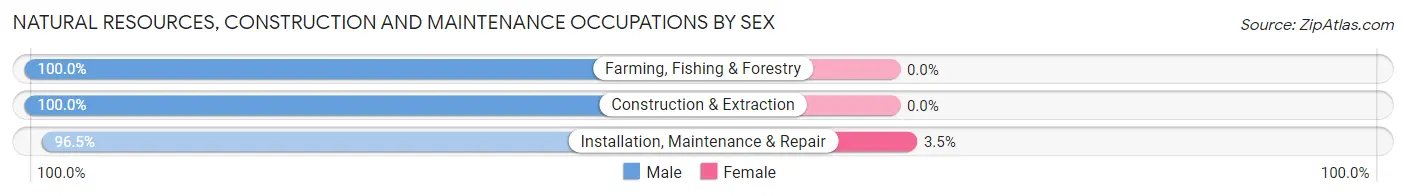
| Occupation | Male | Female |
| Farming, Fishing & Forestry | 44 (100.0%) | 0 (0.0%) |
| Construction & Extraction | 369 (100.0%) | 0 (0.0%) |
| Installation, Maintenance & Repair | 245 (96.5%) | 9 (3.5%) |
| Total (Category) | 658 (98.7%) | 9 (1.3%) |
| Total (Overall) | 6,894 (50.2%) | 6,833 (49.8%) |
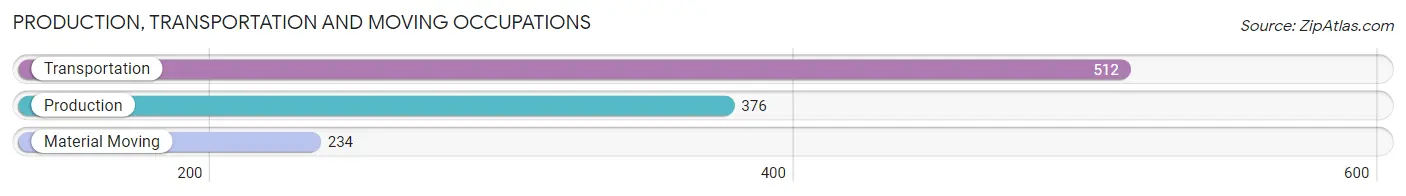
Production, Transportation and Moving Occupations
The most common Production, Transportation and Moving occupations in Hercules are Transportation (512 | 3.7%), Production (376 | 2.7%), and Material Moving (234 | 1.7%).
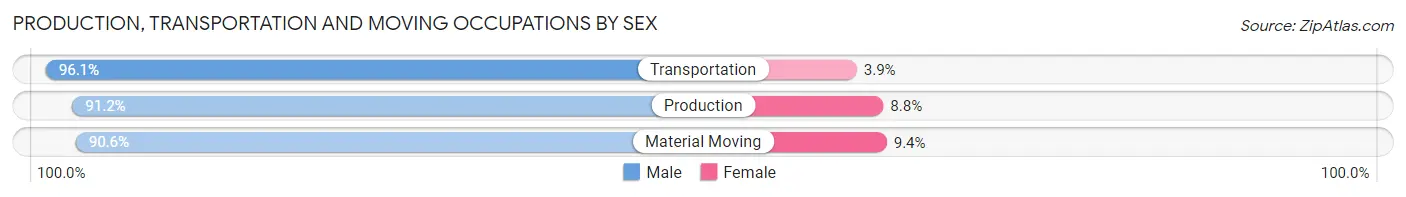
Production, Transportation and Moving Occupations by Sex
| Occupation | Male | Female |
| Production | 343 (91.2%) | 33 (8.8%) |
| Transportation | 492 (96.1%) | 20 (3.9%) |
| Material Moving | 212 (90.6%) | 22 (9.4%) |
| Total (Category) | 1,047 (93.3%) | 75 (6.7%) |
| Total (Overall) | 6,894 (50.2%) | 6,833 (49.8%) |
Employment Industries by Sex in Hercules
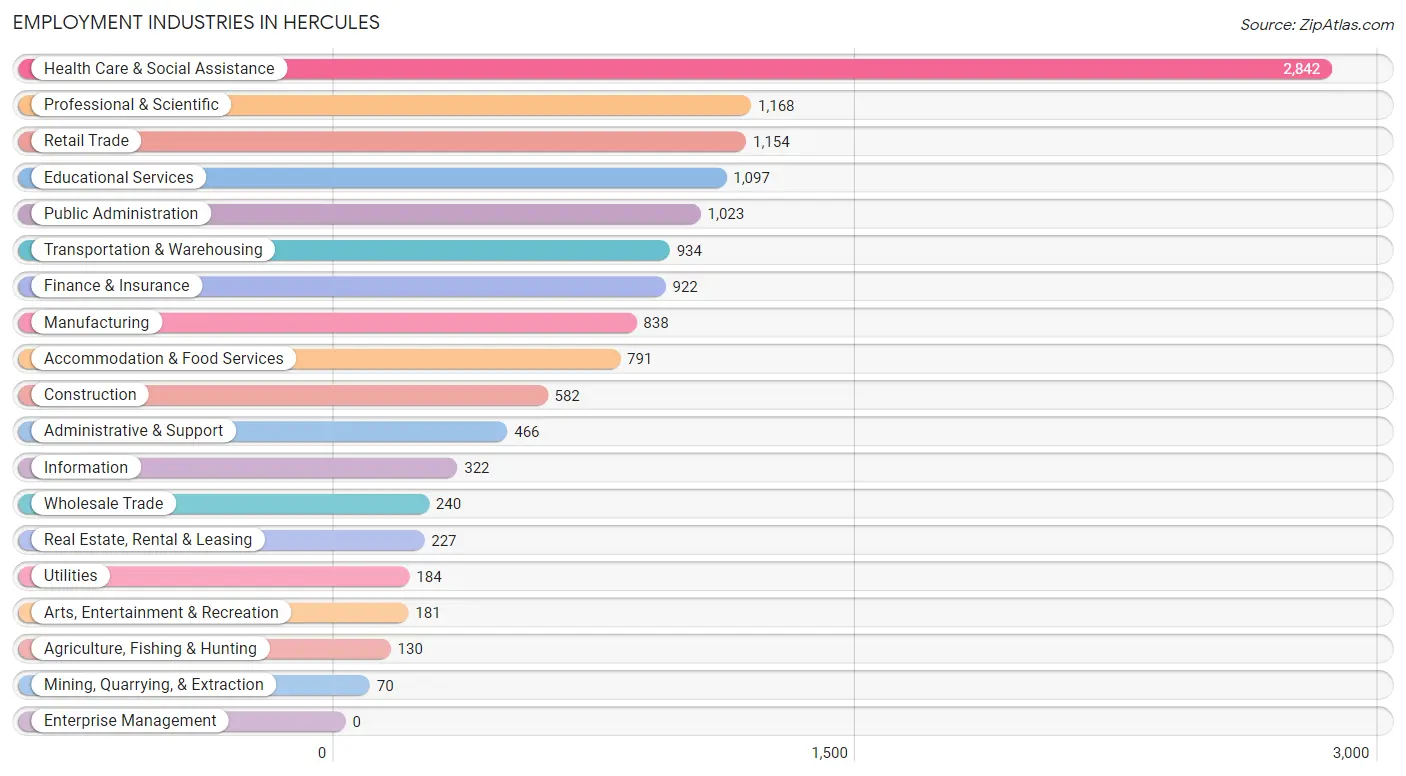
Employment Industries in Hercules
The major employment industries in Hercules include Health Care & Social Assistance (2,842 | 20.7%), Professional & Scientific (1,168 | 8.5%), Retail Trade (1,154 | 8.4%), Educational Services (1,097 | 8.0%), and Public Administration (1,023 | 7.4%).
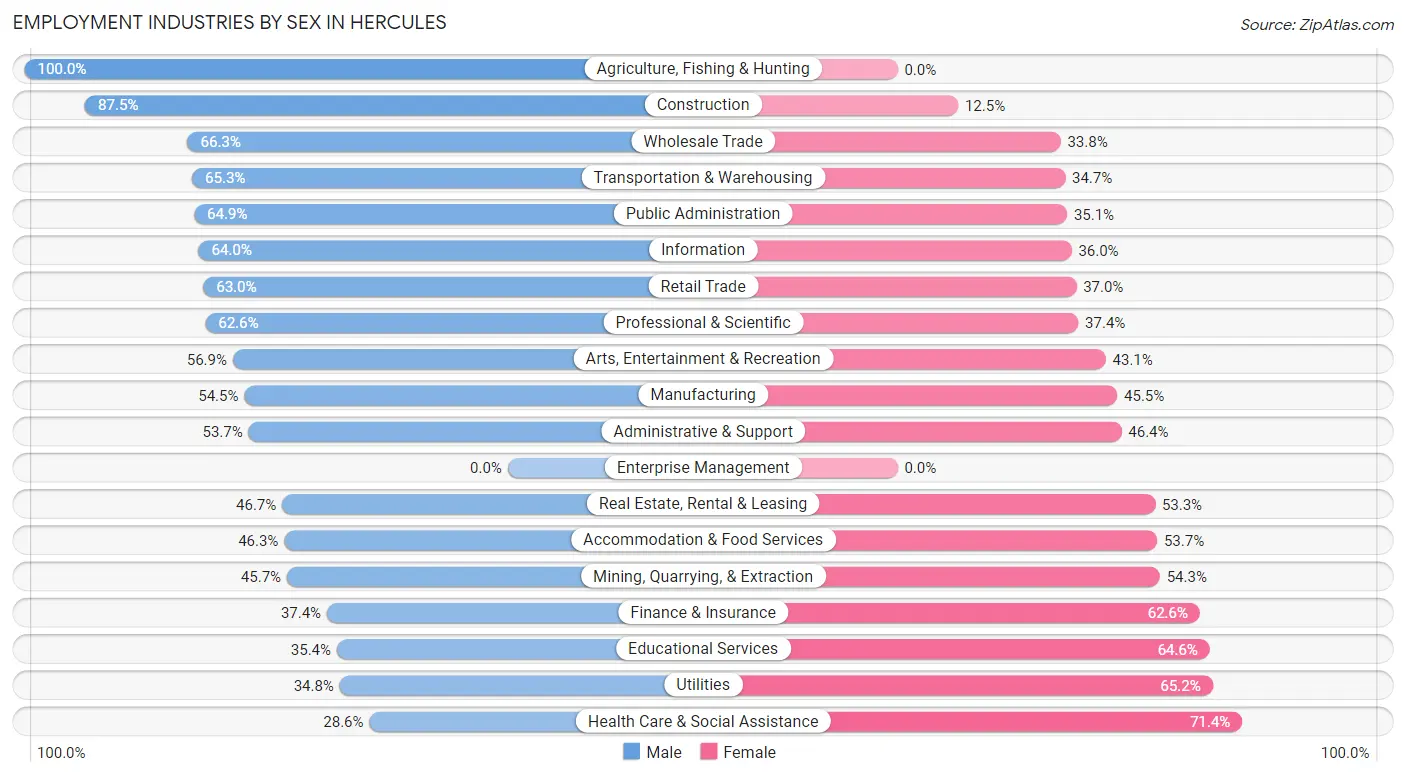
Employment Industries by Sex in Hercules
The Hercules industries that see more men than women are Agriculture, Fishing & Hunting (100.0%), Construction (87.5%), and Wholesale Trade (66.2%), whereas the industries that tend to have a higher number of women are Health Care & Social Assistance (71.4%), Utilities (65.2%), and Educational Services (64.6%).
| Industry | Male | Female |
| Agriculture, Fishing & Hunting | 130 (100.0%) | 0 (0.0%) |
| Mining, Quarrying, & Extraction | 32 (45.7%) | 38 (54.3%) |
| Construction | 509 (87.5%) | 73 (12.5%) |
| Manufacturing | 457 (54.5%) | 381 (45.5%) |
| Wholesale Trade | 159 (66.2%) | 81 (33.8%) |
| Retail Trade | 727 (63.0%) | 427 (37.0%) |
| Transportation & Warehousing | 610 (65.3%) | 324 (34.7%) |
| Utilities | 64 (34.8%) | 120 (65.2%) |
| Information | 206 (64.0%) | 116 (36.0%) |
| Finance & Insurance | 345 (37.4%) | 577 (62.6%) |
| Real Estate, Rental & Leasing | 106 (46.7%) | 121 (53.3%) |
| Professional & Scientific | 731 (62.6%) | 437 (37.4%) |
| Enterprise Management | 0 (0.0%) | 0 (0.0%) |
| Administrative & Support | 250 (53.6%) | 216 (46.4%) |
| Educational Services | 388 (35.4%) | 709 (64.6%) |
| Health Care & Social Assistance | 814 (28.6%) | 2,028 (71.4%) |
| Arts, Entertainment & Recreation | 103 (56.9%) | 78 (43.1%) |
| Accommodation & Food Services | 366 (46.3%) | 425 (53.7%) |
| Public Administration | 664 (64.9%) | 359 (35.1%) |
| Total | 6,894 (50.2%) | 6,833 (49.8%) |
Education in Hercules
School Enrollment in Hercules
The most common levels of schooling among the 6,308 students in Hercules are college / undergraduate (1,689 | 26.8%), elementary school (1,351 | 21.4%), and middle school (1,189 | 18.9%).
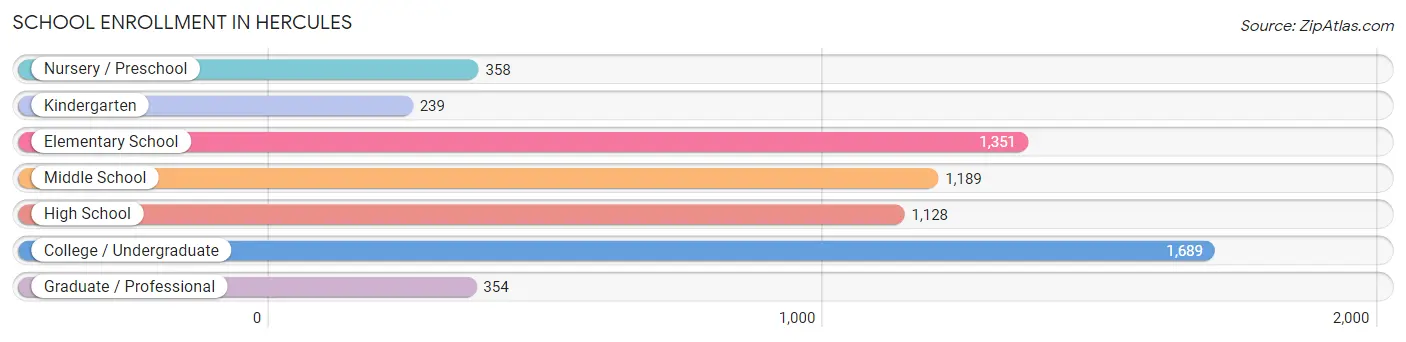
| School Level | # Students | % Students |
| Nursery / Preschool | 358 | 5.7% |
| Kindergarten | 239 | 3.8% |
| Elementary School | 1,351 | 21.4% |
| Middle School | 1,189 | 18.9% |
| High School | 1,128 | 17.9% |
| College / Undergraduate | 1,689 | 26.8% |
| Graduate / Professional | 354 | 5.6% |
| Total | 6,308 | 100.0% |
School Enrollment by Age by Funding Source in Hercules
Out of a total of 6,308 students who are enrolled in schools in Hercules, 1,394 (22.1%) attend a private institution, while the remaining 4,914 (77.9%) are enrolled in public schools. The age group of 3 to 4 year olds has the highest likelihood of being enrolled in private schools, with 124 (70.1% in the age bracket) enrolled. Conversely, the age group of 18 to 19 year olds has the lowest likelihood of being enrolled in a private school, with 490 (97.2% in the age bracket) attending a public institution.
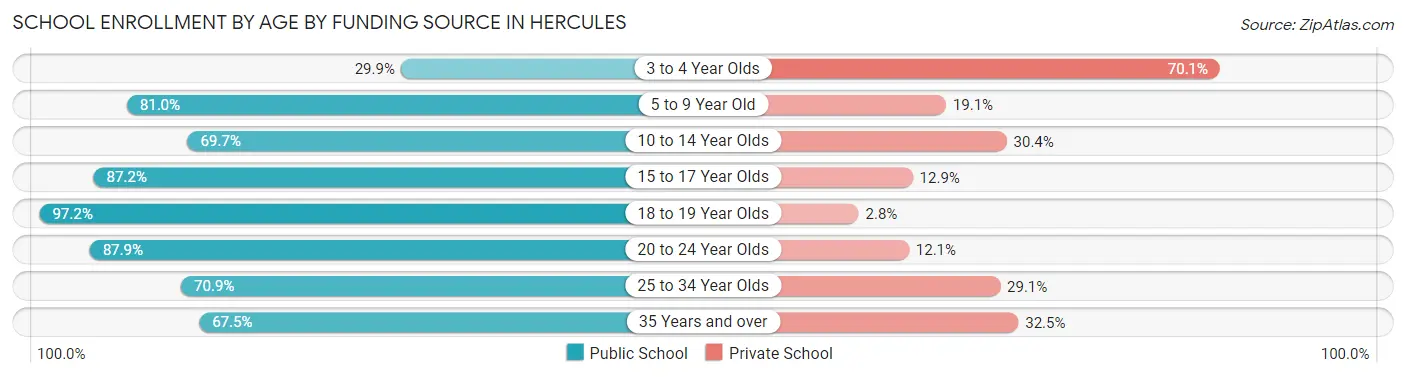
| Age Bracket | Public School | Private School |
| 3 to 4 Year Olds | 53 (29.9%) | 124 (70.1%) |
| 5 to 9 Year Old | 1,300 (80.9%) | 306 (19.1%) |
| 10 to 14 Year Olds | 1,145 (69.7%) | 499 (30.3%) |
| 15 to 17 Year Olds | 536 (87.2%) | 79 (12.9%) |
| 18 to 19 Year Olds | 490 (97.2%) | 14 (2.8%) |
| 20 to 24 Year Olds | 803 (87.9%) | 111 (12.1%) |
| 25 to 34 Year Olds | 248 (70.9%) | 102 (29.1%) |
| 35 Years and over | 336 (67.5%) | 162 (32.5%) |
| Total | 4,914 (77.9%) | 1,394 (22.1%) |
Educational Attainment by Field of Study in Hercules
Business (1,641 | 18.4%), science & technology (1,111 | 12.4%), social sciences (1,013 | 11.3%), engineering (926 | 10.4%), and bio, nature & agricultural (783 | 8.8%) are the most common fields of study among 8,934 individuals in Hercules who have obtained a bachelor's degree or higher.
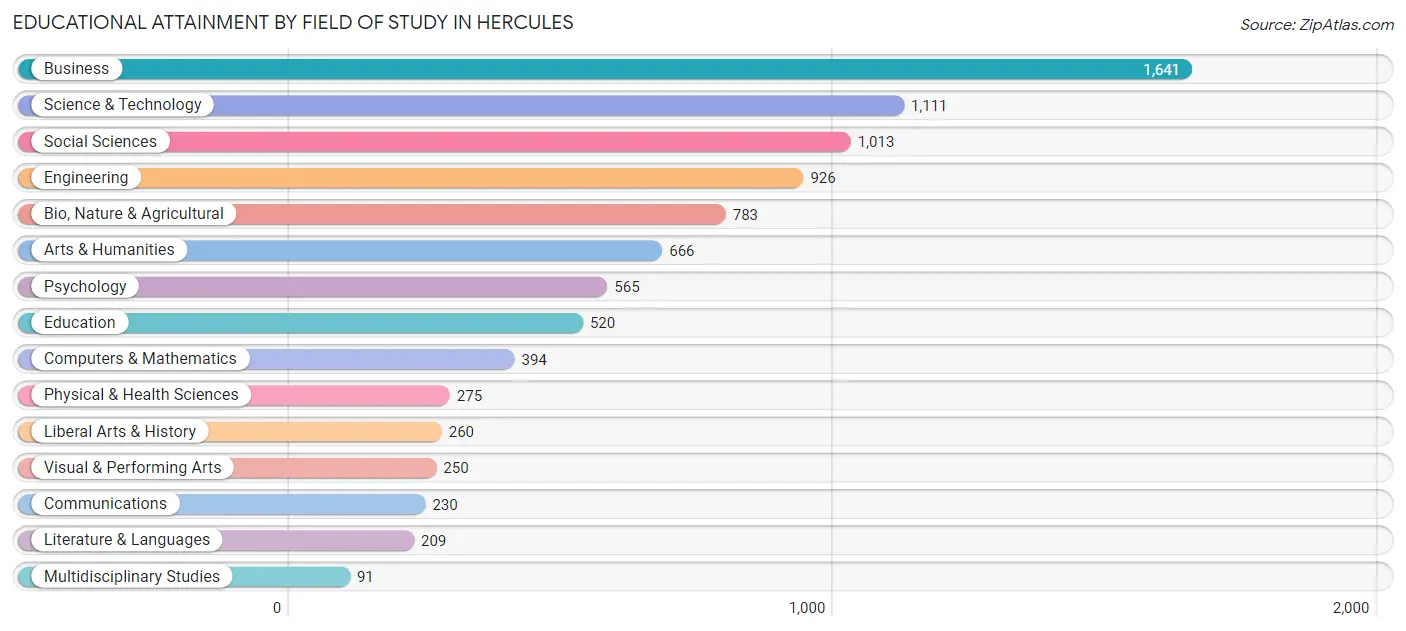
| Field of Study | # Graduates | % Graduates |
| Computers & Mathematics | 394 | 4.4% |
| Bio, Nature & Agricultural | 783 | 8.8% |
| Physical & Health Sciences | 275 | 3.1% |
| Psychology | 565 | 6.3% |
| Social Sciences | 1,013 | 11.3% |
| Engineering | 926 | 10.4% |
| Multidisciplinary Studies | 91 | 1.0% |
| Science & Technology | 1,111 | 12.4% |
| Business | 1,641 | 18.4% |
| Education | 520 | 5.8% |
| Literature & Languages | 209 | 2.3% |
| Liberal Arts & History | 260 | 2.9% |
| Visual & Performing Arts | 250 | 2.8% |
| Communications | 230 | 2.6% |
| Arts & Humanities | 666 | 7.4% |
| Total | 8,934 | 100.0% |
Transportation & Commute in Hercules
Vehicle Availability by Sex in Hercules
The most prevalent vehicle ownership categories in Hercules are males with 2 vehicles (2,244, accounting for 33.1%) and females with 2 vehicles (2,113, making up 33.7%).
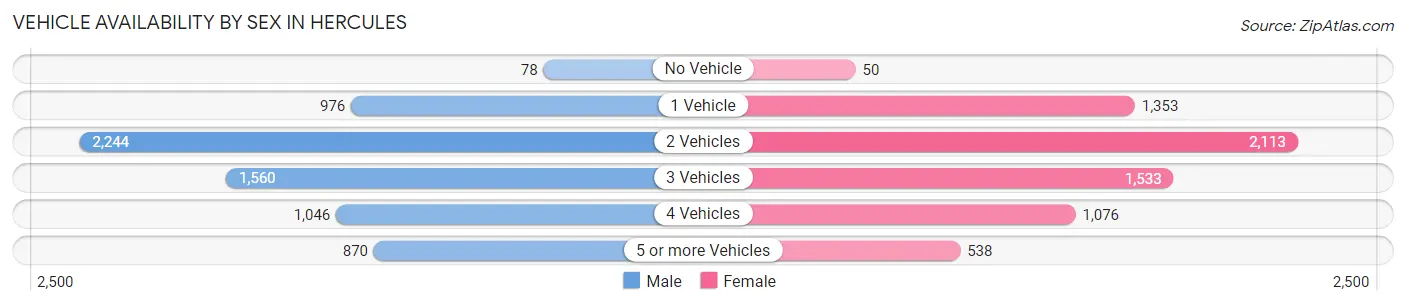
| Vehicles Available | Male | Female |
| No Vehicle | 78 (1.1%) | 50 (0.7%) |
| 1 Vehicle | 976 (14.4%) | 1,353 (20.3%) |
| 2 Vehicles | 2,244 (33.1%) | 2,113 (31.7%) |
| 3 Vehicles | 1,560 (23.0%) | 1,533 (23.0%) |
| 4 Vehicles | 1,046 (15.4%) | 1,076 (16.2%) |
| 5 or more Vehicles | 870 (12.8%) | 538 (8.1%) |
| Total | 6,774 (100.0%) | 6,663 (100.0%) |
Commute Time in Hercules
The most frequently occuring commute durations in Hercules are 60 to 89 minutes (2,343 commuters, 20.6%), 45 to 59 minutes (1,613 commuters, 14.2%), and 30 to 34 minutes (1,328 commuters, 11.7%).
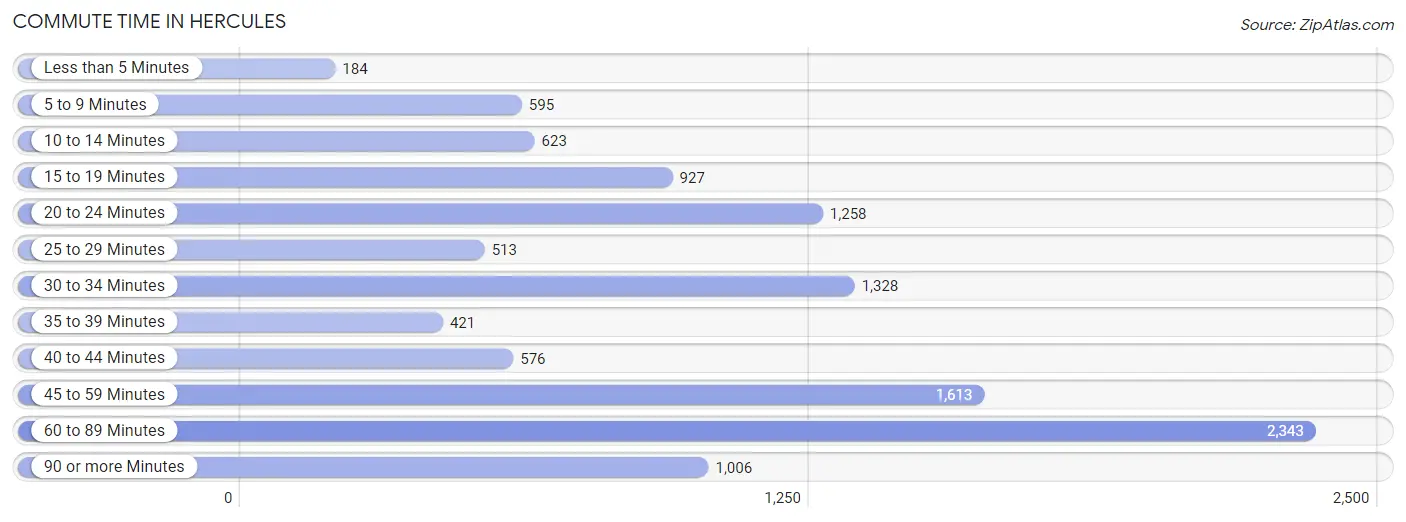
| Commute Time | # Commuters | % Commuters |
| Less than 5 Minutes | 184 | 1.6% |
| 5 to 9 Minutes | 595 | 5.2% |
| 10 to 14 Minutes | 623 | 5.5% |
| 15 to 19 Minutes | 927 | 8.1% |
| 20 to 24 Minutes | 1,258 | 11.1% |
| 25 to 29 Minutes | 513 | 4.5% |
| 30 to 34 Minutes | 1,328 | 11.7% |
| 35 to 39 Minutes | 421 | 3.7% |
| 40 to 44 Minutes | 576 | 5.1% |
| 45 to 59 Minutes | 1,613 | 14.2% |
| 60 to 89 Minutes | 2,343 | 20.6% |
| 90 or more Minutes | 1,006 | 8.8% |
Commute Time by Sex in Hercules
The most common commute times in Hercules are 60 to 89 minutes (1,210 commuters, 20.7%) for males and 60 to 89 minutes (1,133 commuters, 20.4%) for females.
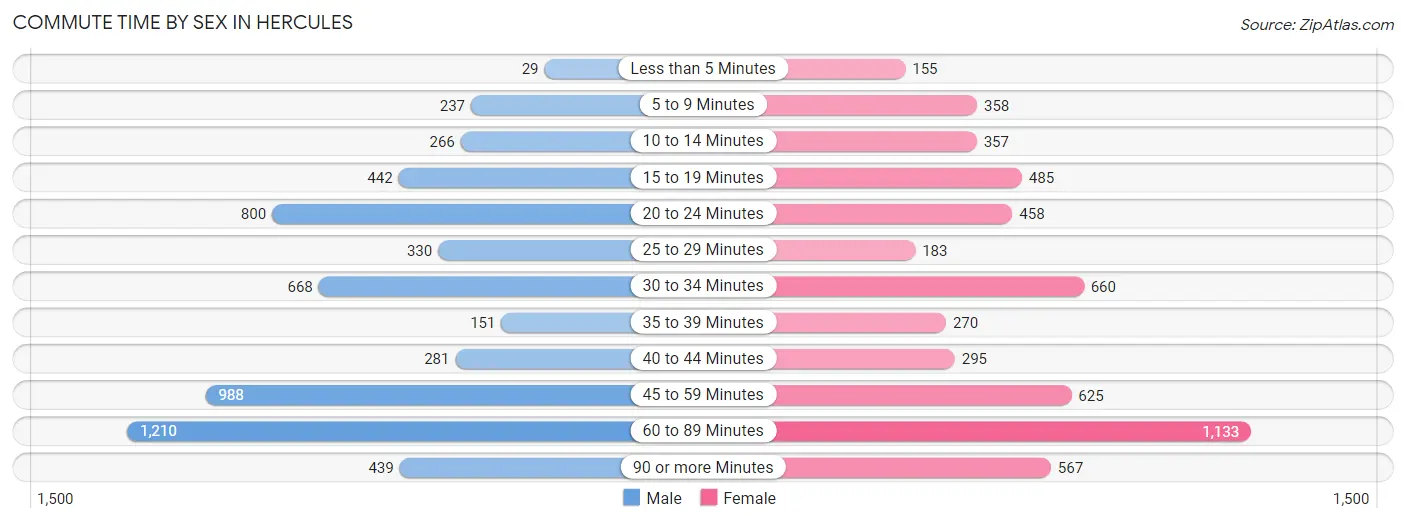
| Commute Time | Male | Female |
| Less than 5 Minutes | 29 (0.5%) | 155 (2.8%) |
| 5 to 9 Minutes | 237 (4.1%) | 358 (6.5%) |
| 10 to 14 Minutes | 266 (4.5%) | 357 (6.4%) |
| 15 to 19 Minutes | 442 (7.6%) | 485 (8.7%) |
| 20 to 24 Minutes | 800 (13.7%) | 458 (8.3%) |
| 25 to 29 Minutes | 330 (5.7%) | 183 (3.3%) |
| 30 to 34 Minutes | 668 (11.4%) | 660 (11.9%) |
| 35 to 39 Minutes | 151 (2.6%) | 270 (4.9%) |
| 40 to 44 Minutes | 281 (4.8%) | 295 (5.3%) |
| 45 to 59 Minutes | 988 (16.9%) | 625 (11.3%) |
| 60 to 89 Minutes | 1,210 (20.7%) | 1,133 (20.4%) |
| 90 or more Minutes | 439 (7.5%) | 567 (10.2%) |
Time of Departure to Work by Sex in Hercules
The most frequent times of departure to work in Hercules are 6:00 AM to 6:29 AM (738, 12.6%) for males and 8:00 AM to 8:29 AM (802, 14.5%) for females.
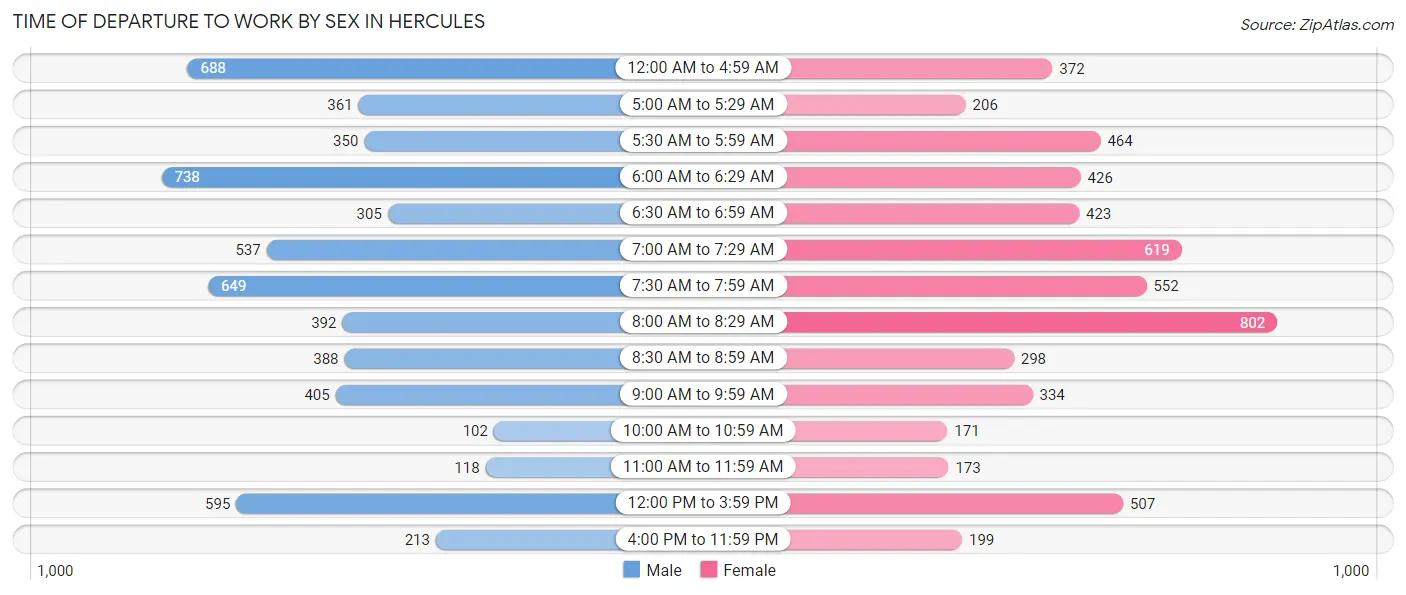
| Time of Departure | Male | Female |
| 12:00 AM to 4:59 AM | 688 (11.8%) | 372 (6.7%) |
| 5:00 AM to 5:29 AM | 361 (6.2%) | 206 (3.7%) |
| 5:30 AM to 5:59 AM | 350 (6.0%) | 464 (8.4%) |
| 6:00 AM to 6:29 AM | 738 (12.6%) | 426 (7.7%) |
| 6:30 AM to 6:59 AM | 305 (5.2%) | 423 (7.6%) |
| 7:00 AM to 7:29 AM | 537 (9.2%) | 619 (11.2%) |
| 7:30 AM to 7:59 AM | 649 (11.1%) | 552 (10.0%) |
| 8:00 AM to 8:29 AM | 392 (6.7%) | 802 (14.5%) |
| 8:30 AM to 8:59 AM | 388 (6.6%) | 298 (5.4%) |
| 9:00 AM to 9:59 AM | 405 (6.9%) | 334 (6.0%) |
| 10:00 AM to 10:59 AM | 102 (1.8%) | 171 (3.1%) |
| 11:00 AM to 11:59 AM | 118 (2.0%) | 173 (3.1%) |
| 12:00 PM to 3:59 PM | 595 (10.2%) | 507 (9.1%) |
| 4:00 PM to 11:59 PM | 213 (3.6%) | 199 (3.6%) |
| Total | 5,841 (100.0%) | 5,546 (100.0%) |
Housing Occupancy in Hercules
Occupancy by Ownership in Hercules
Of the total 8,990 dwellings in Hercules, owner-occupied units account for 7,193 (80.0%), while renter-occupied units make up 1,797 (20.0%).
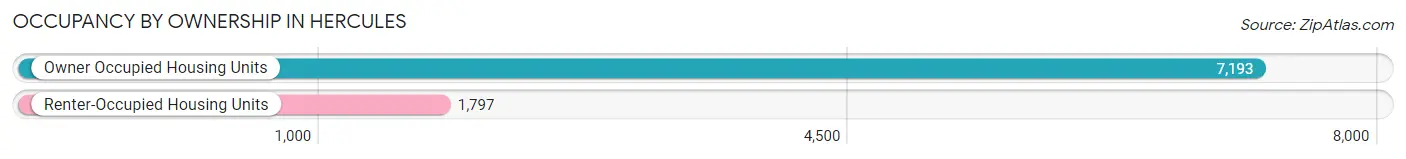
| Occupancy | # Housing Units | % Housing Units |
| Owner Occupied Housing Units | 7,193 | 80.0% |
| Renter-Occupied Housing Units | 1,797 | 20.0% |
| Total Occupied Housing Units | 8,990 | 100.0% |
Occupancy by Household Size in Hercules
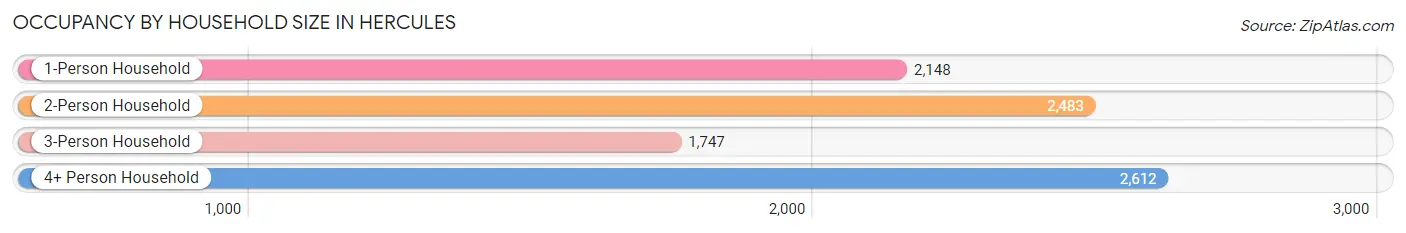
| Household Size | # Housing Units | % Housing Units |
| 1-Person Household | 2,148 | 23.9% |
| 2-Person Household | 2,483 | 27.6% |
| 3-Person Household | 1,747 | 19.4% |
| 4+ Person Household | 2,612 | 29.0% |
| Total Housing Units | 8,990 | 100.0% |
Occupancy by Ownership by Household Size in Hercules
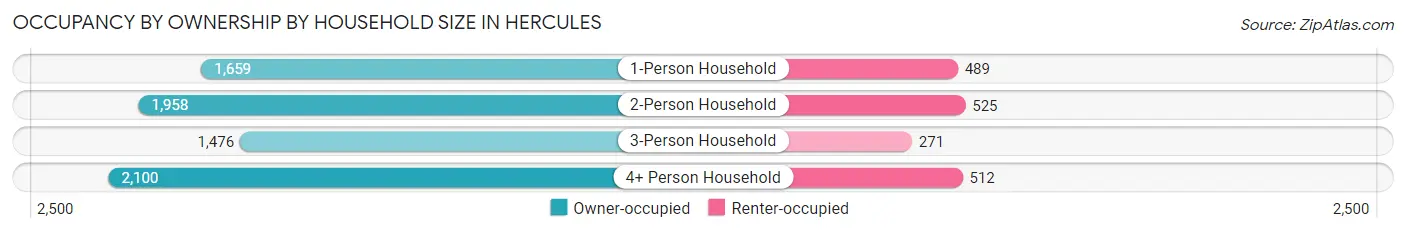
| Household Size | Owner-occupied | Renter-occupied |
| 1-Person Household | 1,659 (77.2%) | 489 (22.8%) |
| 2-Person Household | 1,958 (78.9%) | 525 (21.1%) |
| 3-Person Household | 1,476 (84.5%) | 271 (15.5%) |
| 4+ Person Household | 2,100 (80.4%) | 512 (19.6%) |
| Total Housing Units | 7,193 (80.0%) | 1,797 (20.0%) |
Occupancy by Educational Attainment in Hercules
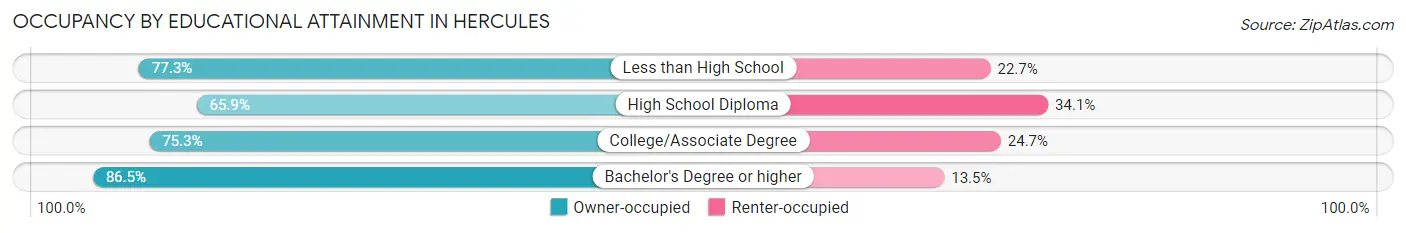
| Household Size | Owner-occupied | Renter-occupied |
| Less than High School | 348 (77.3%) | 102 (22.7%) |
| High School Diploma | 659 (65.9%) | 341 (34.1%) |
| College/Associate Degree | 2,250 (75.3%) | 739 (24.7%) |
| Bachelor's Degree or higher | 3,936 (86.5%) | 615 (13.5%) |
Occupancy by Age of Householder in Hercules
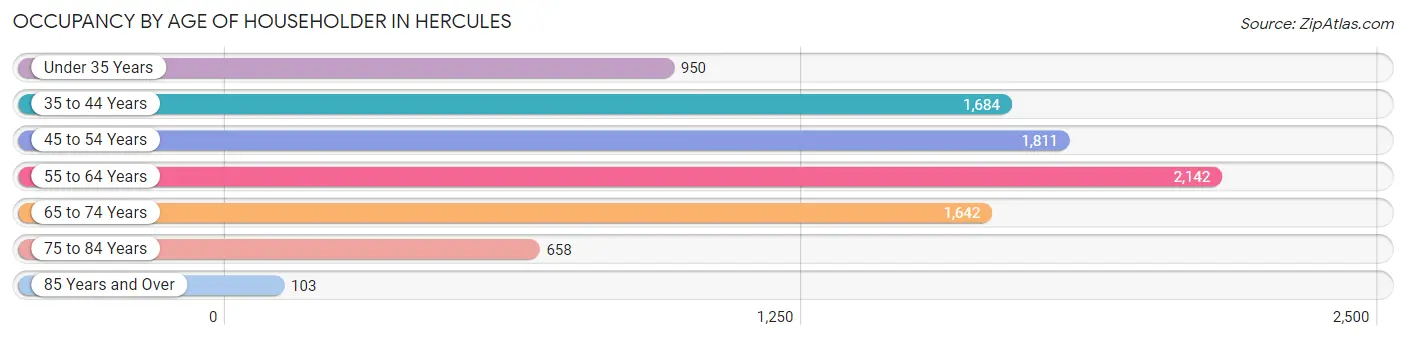
| Age Bracket | # Households | % Households |
| Under 35 Years | 950 | 10.6% |
| 35 to 44 Years | 1,684 | 18.7% |
| 45 to 54 Years | 1,811 | 20.1% |
| 55 to 64 Years | 2,142 | 23.8% |
| 65 to 74 Years | 1,642 | 18.3% |
| 75 to 84 Years | 658 | 7.3% |
| 85 Years and Over | 103 | 1.1% |
| Total | 8,990 | 100.0% |
Housing Finances in Hercules
Median Income by Occupancy in Hercules
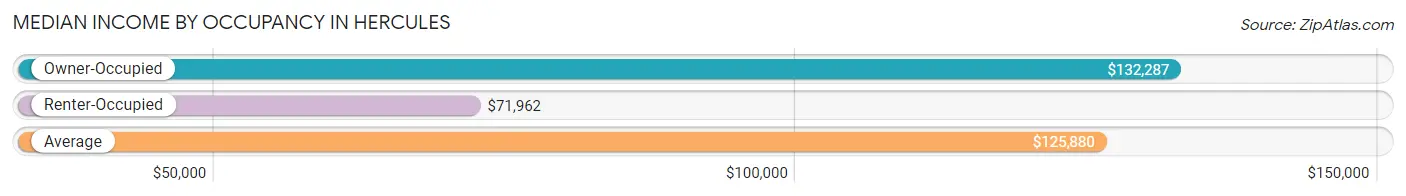
| Occupancy Type | # Households | Median Income |
| Owner-Occupied | 7,193 (80.0%) | $132,287 |
| Renter-Occupied | 1,797 (20.0%) | $71,962 |
| Average | 8,990 (100.0%) | $125,880 |
Occupancy by Householder Income Bracket in Hercules
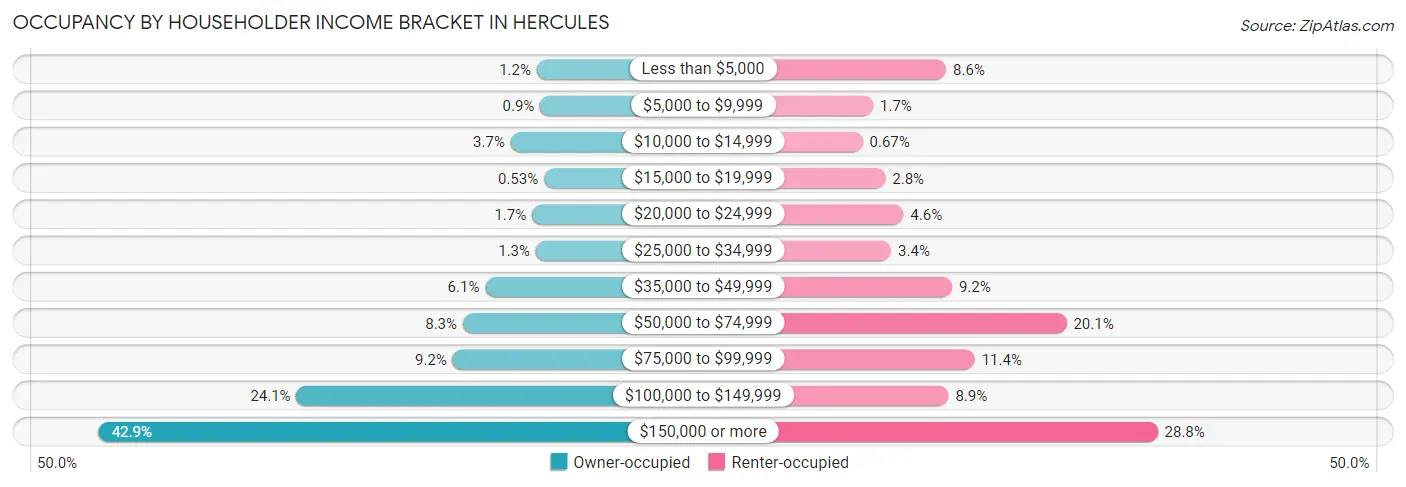
| Income Bracket | Owner-occupied | Renter-occupied |
| Less than $5,000 | 88 (1.2%) | 155 (8.6%) |
| $5,000 to $9,999 | 65 (0.9%) | 30 (1.7%) |
| $10,000 to $14,999 | 266 (3.7%) | 12 (0.7%) |
| $15,000 to $19,999 | 38 (0.5%) | 51 (2.8%) |
| $20,000 to $24,999 | 120 (1.7%) | 82 (4.6%) |
| $25,000 to $34,999 | 94 (1.3%) | 61 (3.4%) |
| $35,000 to $49,999 | 441 (6.1%) | 165 (9.2%) |
| $50,000 to $74,999 | 594 (8.3%) | 361 (20.1%) |
| $75,000 to $99,999 | 664 (9.2%) | 204 (11.4%) |
| $100,000 to $149,999 | 1,734 (24.1%) | 159 (8.8%) |
| $150,000 or more | 3,089 (42.9%) | 517 (28.8%) |
| Total | 7,193 (100.0%) | 1,797 (100.0%) |
Monthly Housing Cost Tiers in Hercules
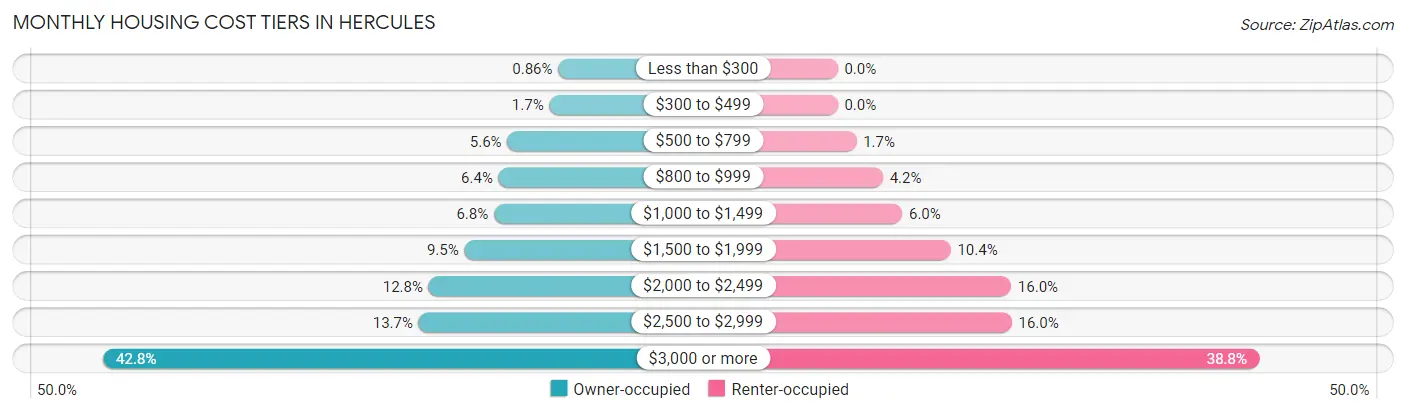
| Monthly Cost | Owner-occupied | Renter-occupied |
| Less than $300 | 62 (0.9%) | 0 (0.0%) |
| $300 to $499 | 121 (1.7%) | 0 (0.0%) |
| $500 to $799 | 399 (5.6%) | 31 (1.7%) |
| $800 to $999 | 457 (6.4%) | 75 (4.2%) |
| $1,000 to $1,499 | 488 (6.8%) | 107 (5.9%) |
| $1,500 to $1,999 | 683 (9.5%) | 187 (10.4%) |
| $2,000 to $2,499 | 920 (12.8%) | 287 (16.0%) |
| $2,500 to $2,999 | 986 (13.7%) | 288 (16.0%) |
| $3,000 or more | 3,077 (42.8%) | 697 (38.8%) |
| Total | 7,193 (100.0%) | 1,797 (100.0%) |
Physical Housing Characteristics in Hercules
Housing Structures in Hercules
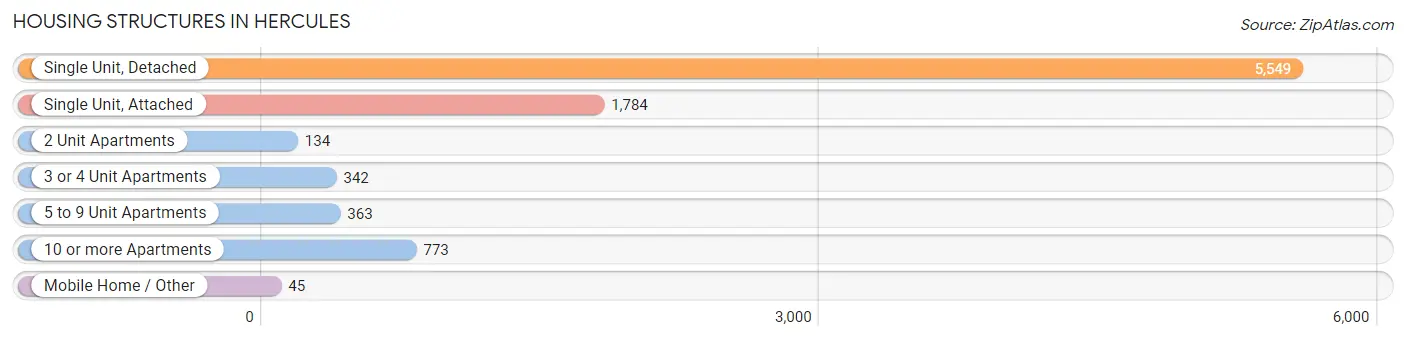
| Structure Type | # Housing Units | % Housing Units |
| Single Unit, Detached | 5,549 | 61.7% |
| Single Unit, Attached | 1,784 | 19.8% |
| 2 Unit Apartments | 134 | 1.5% |
| 3 or 4 Unit Apartments | 342 | 3.8% |
| 5 to 9 Unit Apartments | 363 | 4.0% |
| 10 or more Apartments | 773 | 8.6% |
| Mobile Home / Other | 45 | 0.5% |
| Total | 8,990 | 100.0% |
Housing Structures by Occupancy in Hercules
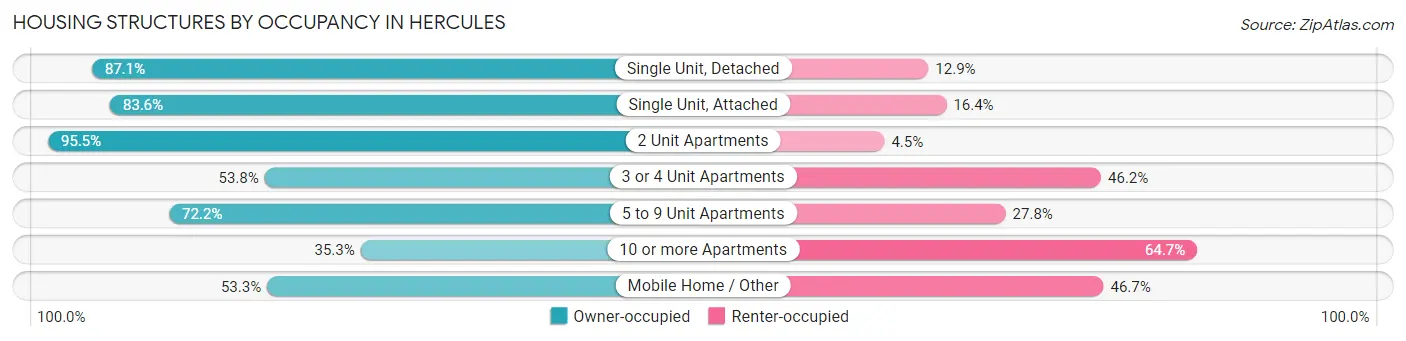
| Structure Type | Owner-occupied | Renter-occupied |
| Single Unit, Detached | 4,831 (87.1%) | 718 (12.9%) |
| Single Unit, Attached | 1,491 (83.6%) | 293 (16.4%) |
| 2 Unit Apartments | 128 (95.5%) | 6 (4.5%) |
| 3 or 4 Unit Apartments | 184 (53.8%) | 158 (46.2%) |
| 5 to 9 Unit Apartments | 262 (72.2%) | 101 (27.8%) |
| 10 or more Apartments | 273 (35.3%) | 500 (64.7%) |
| Mobile Home / Other | 24 (53.3%) | 21 (46.7%) |
| Total | 7,193 (80.0%) | 1,797 (20.0%) |
Housing Structures by Number of Rooms in Hercules
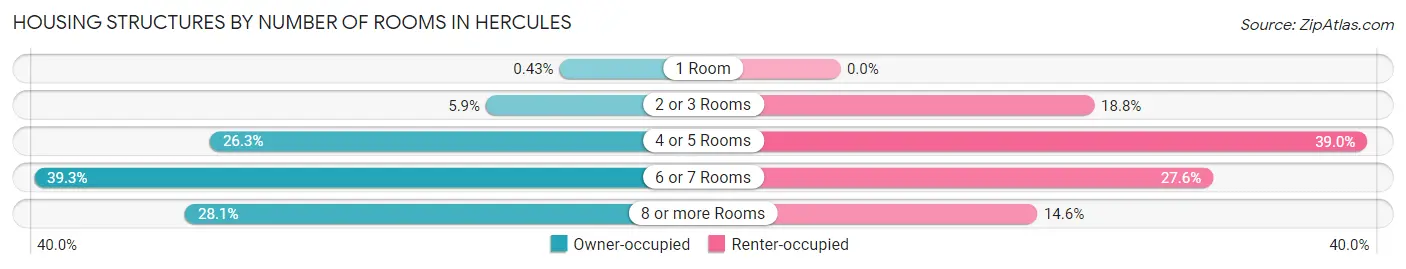
| Number of Rooms | Owner-occupied | Renter-occupied |
| 1 Room | 31 (0.4%) | 0 (0.0%) |
| 2 or 3 Rooms | 422 (5.9%) | 338 (18.8%) |
| 4 or 5 Rooms | 1,890 (26.3%) | 701 (39.0%) |
| 6 or 7 Rooms | 2,827 (39.3%) | 496 (27.6%) |
| 8 or more Rooms | 2,023 (28.1%) | 262 (14.6%) |
| Total | 7,193 (100.0%) | 1,797 (100.0%) |
Housing Structure by Heating Type in Hercules
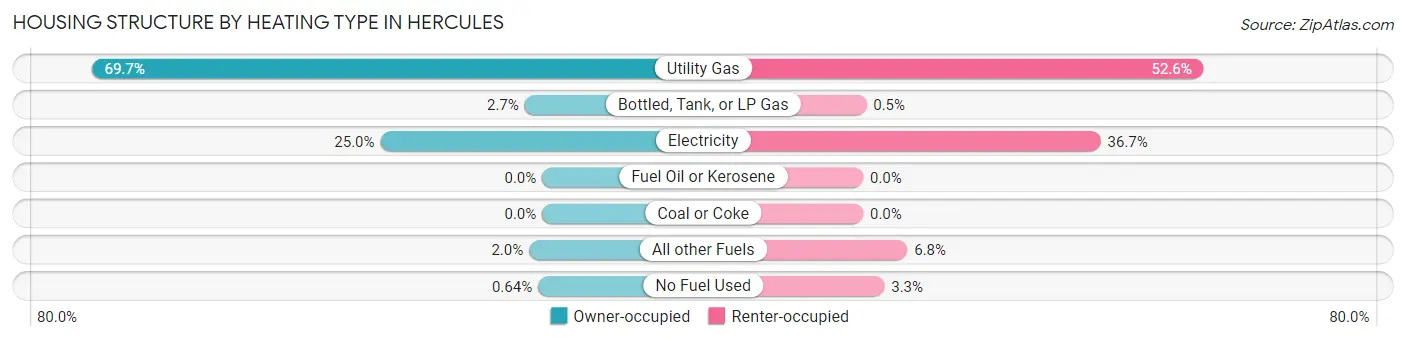
| Heating Type | Owner-occupied | Renter-occupied |
| Utility Gas | 5,010 (69.7%) | 946 (52.6%) |
| Bottled, Tank, or LP Gas | 194 (2.7%) | 9 (0.5%) |
| Electricity | 1,798 (25.0%) | 660 (36.7%) |
| Fuel Oil or Kerosene | 0 (0.0%) | 0 (0.0%) |
| Coal or Coke | 0 (0.0%) | 0 (0.0%) |
| All other Fuels | 145 (2.0%) | 123 (6.8%) |
| No Fuel Used | 46 (0.6%) | 59 (3.3%) |
| Total | 7,193 (100.0%) | 1,797 (100.0%) |
Household Vehicle Usage in Hercules
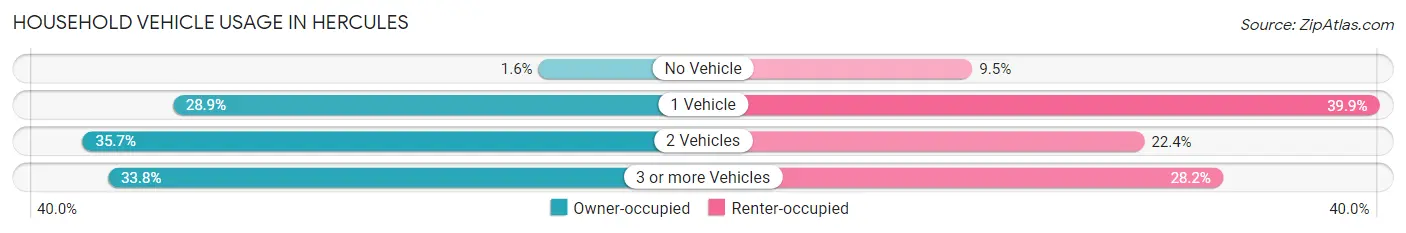
| Vehicles per Household | Owner-occupied | Renter-occupied |
| No Vehicle | 117 (1.6%) | 171 (9.5%) |
| 1 Vehicle | 2,081 (28.9%) | 717 (39.9%) |
| 2 Vehicles | 2,566 (35.7%) | 402 (22.4%) |
| 3 or more Vehicles | 2,429 (33.8%) | 507 (28.2%) |
| Total | 7,193 (100.0%) | 1,797 (100.0%) |
Real Estate & Mortgages in Hercules
Real Estate and Mortgage Overview in Hercules
| Characteristic | Without Mortgage | With Mortgage |
| Housing Units | 1,431 | 5,762 |
| Median Property Value | $716,800 | $683,800 |
| Median Household Income | $105,807 | $2,694 |
| Monthly Housing Costs | $917 | $3,072 |
| Real Estate Taxes | $5,659 | $76 |
Property Value by Mortgage Status in Hercules
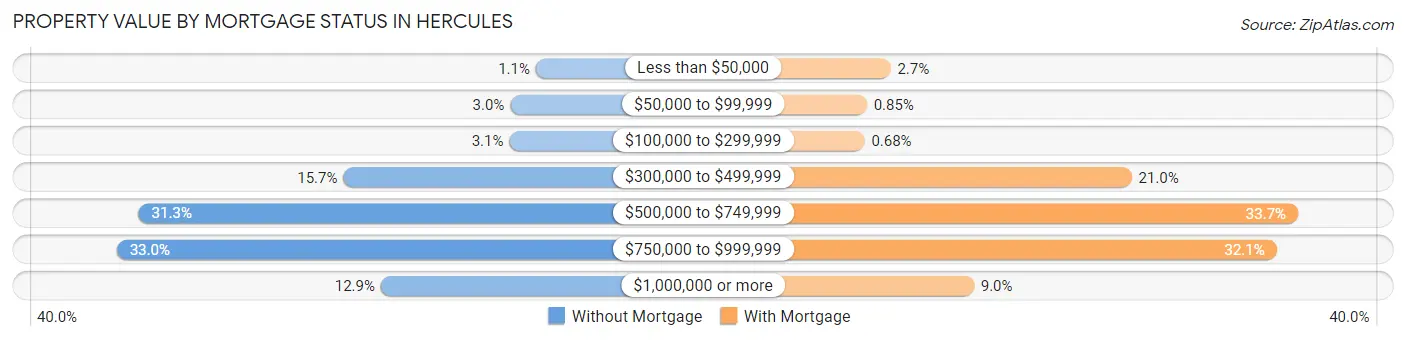
| Property Value | Without Mortgage | With Mortgage |
| Less than $50,000 | 15 (1.1%) | 153 (2.7%) |
| $50,000 to $99,999 | 43 (3.0%) | 49 (0.9%) |
| $100,000 to $299,999 | 44 (3.1%) | 39 (0.7%) |
| $300,000 to $499,999 | 225 (15.7%) | 1,212 (21.0%) |
| $500,000 to $749,999 | 448 (31.3%) | 1,942 (33.7%) |
| $750,000 to $999,999 | 472 (33.0%) | 1,848 (32.1%) |
| $1,000,000 or more | 184 (12.9%) | 519 (9.0%) |
| Total | 1,431 (100.0%) | 5,762 (100.0%) |
Household Income by Mortgage Status in Hercules
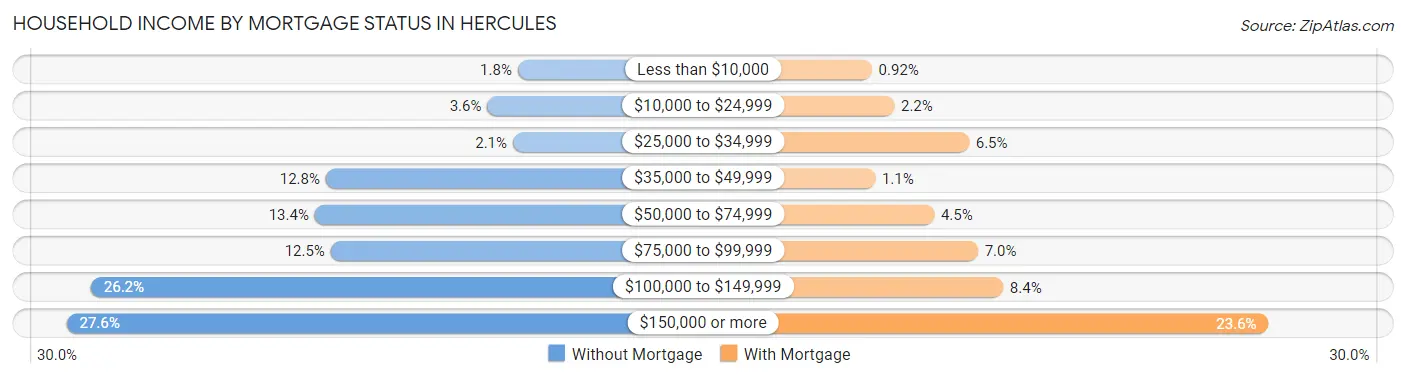
| Household Income | Without Mortgage | With Mortgage |
| Less than $10,000 | 26 (1.8%) | 53 (0.9%) |
| $10,000 to $24,999 | 51 (3.6%) | 127 (2.2%) |
| $25,000 to $34,999 | 30 (2.1%) | 373 (6.5%) |
| $35,000 to $49,999 | 183 (12.8%) | 64 (1.1%) |
| $50,000 to $74,999 | 192 (13.4%) | 258 (4.5%) |
| $75,000 to $99,999 | 179 (12.5%) | 402 (7.0%) |
| $100,000 to $149,999 | 375 (26.2%) | 485 (8.4%) |
| $150,000 or more | 395 (27.6%) | 1,359 (23.6%) |
| Total | 1,431 (100.0%) | 5,762 (100.0%) |
Property Value to Household Income Ratio in Hercules
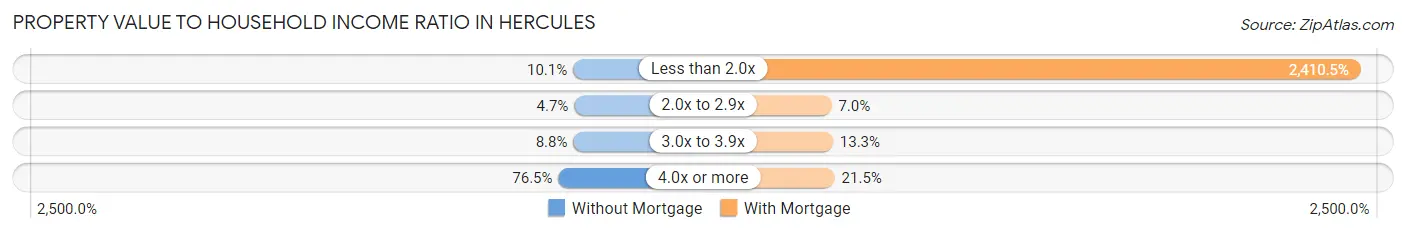
| Value-to-Income Ratio | Without Mortgage | With Mortgage |
| Less than 2.0x | 144 (10.1%) | 138,894 (2,410.5%) |
| 2.0x to 2.9x | 67 (4.7%) | 403 (7.0%) |
| 3.0x to 3.9x | 126 (8.8%) | 768 (13.3%) |
| 4.0x or more | 1,094 (76.4%) | 1,237 (21.5%) |
| Total | 1,431 (100.0%) | 5,762 (100.0%) |
Real Estate Taxes by Mortgage Status in Hercules
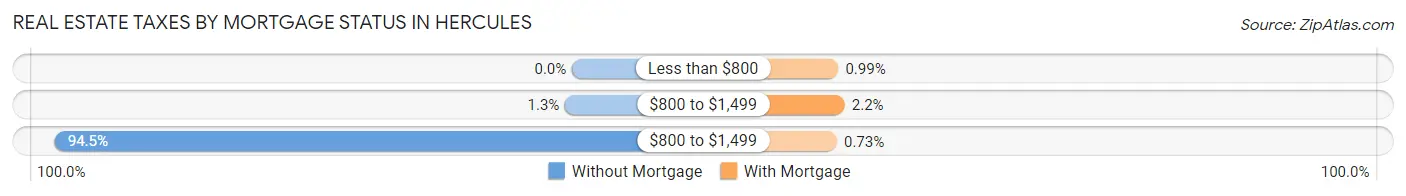
| Property Taxes | Without Mortgage | With Mortgage |
| Less than $800 | 0 (0.0%) | 57 (1.0%) |
| $800 to $1,499 | 18 (1.3%) | 124 (2.1%) |
| $800 to $1,499 | 1,352 (94.5%) | 42 (0.7%) |
| Total | 1,431 (100.0%) | 5,762 (100.0%) |
Health & Disability in Hercules
Health Insurance Coverage by Age in Hercules
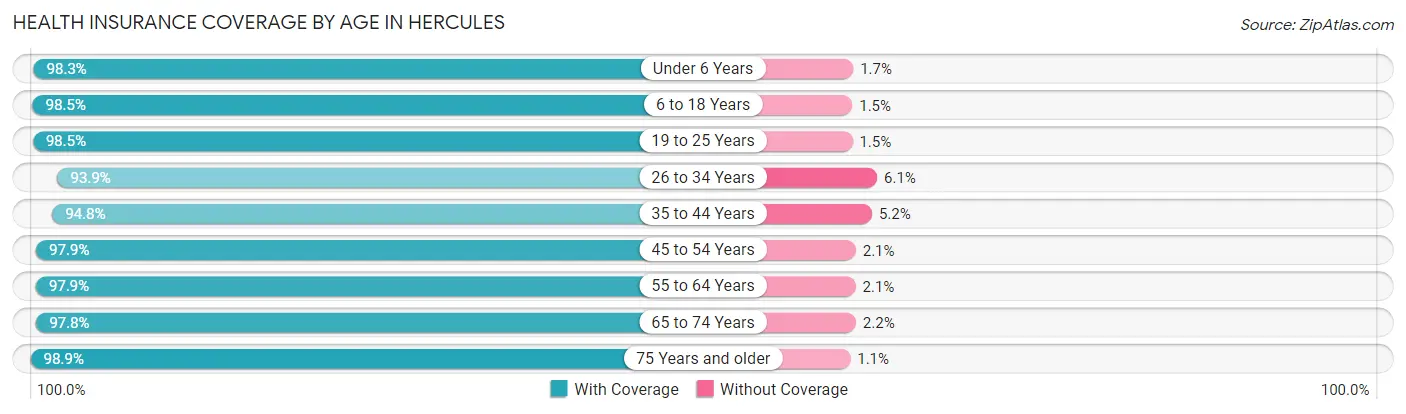
| Age Bracket | With Coverage | Without Coverage |
| Under 6 Years | 1,484 (98.3%) | 25 (1.7%) |
| 6 to 18 Years | 3,910 (98.5%) | 59 (1.5%) |
| 19 to 25 Years | 1,883 (98.5%) | 29 (1.5%) |
| 26 to 34 Years | 2,667 (93.9%) | 174 (6.1%) |
| 35 to 44 Years | 3,550 (94.8%) | 193 (5.2%) |
| 45 to 54 Years | 3,204 (97.9%) | 70 (2.1%) |
| 55 to 64 Years | 4,079 (97.9%) | 88 (2.1%) |
| 65 to 74 Years | 2,928 (97.8%) | 65 (2.2%) |
| 75 Years and older | 1,590 (98.9%) | 18 (1.1%) |
| Total | 25,295 (97.2%) | 721 (2.8%) |
Health Insurance Coverage by Citizenship Status in Hercules
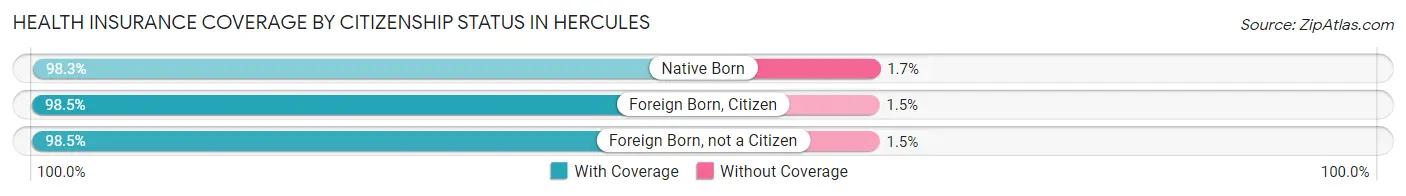
| Citizenship Status | With Coverage | Without Coverage |
| Native Born | 1,484 (98.3%) | 25 (1.7%) |
| Foreign Born, Citizen | 3,910 (98.5%) | 59 (1.5%) |
| Foreign Born, not a Citizen | 1,883 (98.5%) | 29 (1.5%) |
Health Insurance Coverage by Household Income in Hercules
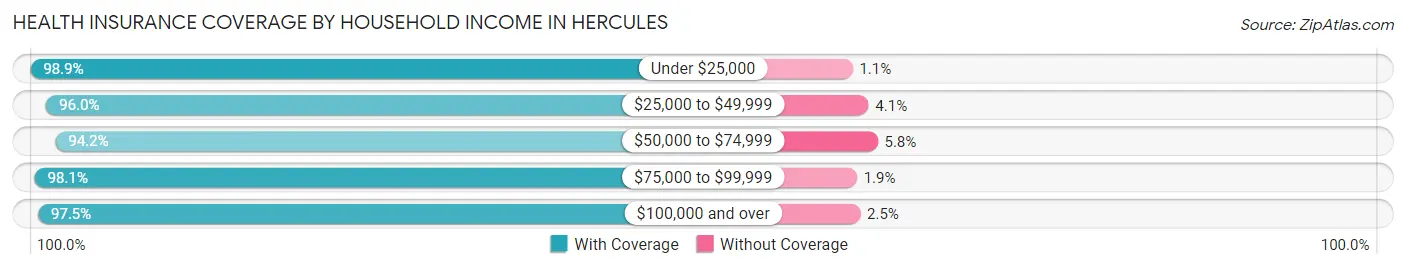
| Household Income | With Coverage | Without Coverage |
| Under $25,000 | 1,313 (98.9%) | 14 (1.1%) |
| $25,000 to $49,999 | 1,470 (96.0%) | 62 (4.1%) |
| $50,000 to $74,999 | 2,423 (94.2%) | 148 (5.8%) |
| $75,000 to $99,999 | 2,158 (98.1%) | 41 (1.9%) |
| $100,000 and over | 17,883 (97.5%) | 456 (2.5%) |
Public vs Private Health Insurance Coverage by Age in Hercules
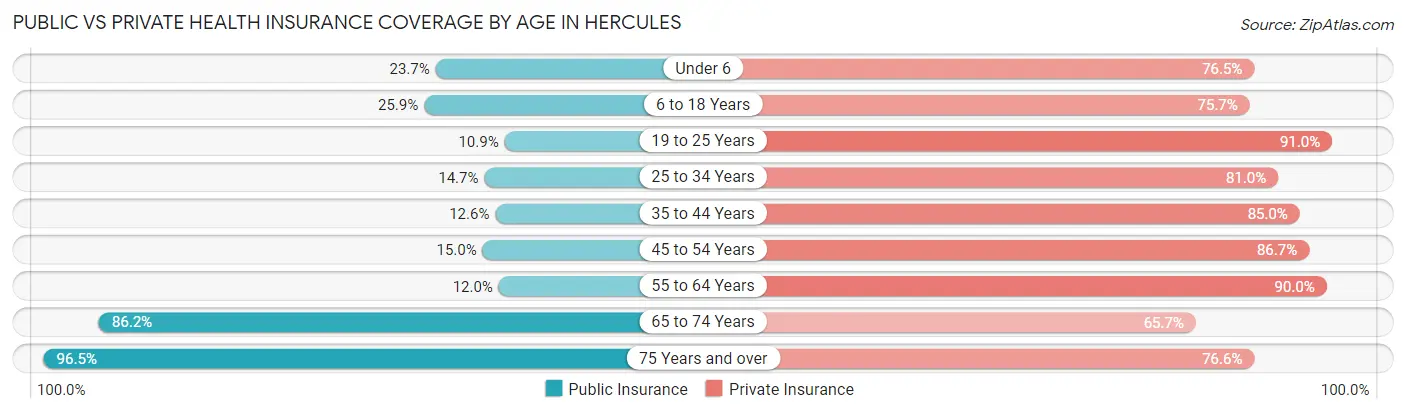
| Age Bracket | Public Insurance | Private Insurance |
| Under 6 | 358 (23.7%) | 1,155 (76.5%) |
| 6 to 18 Years | 1,026 (25.9%) | 3,004 (75.7%) |
| 19 to 25 Years | 209 (10.9%) | 1,740 (91.0%) |
| 25 to 34 Years | 417 (14.7%) | 2,300 (81.0%) |
| 35 to 44 Years | 473 (12.6%) | 3,181 (85.0%) |
| 45 to 54 Years | 491 (15.0%) | 2,839 (86.7%) |
| 55 to 64 Years | 500 (12.0%) | 3,750 (90.0%) |
| 65 to 74 Years | 2,580 (86.2%) | 1,966 (65.7%) |
| 75 Years and over | 1,551 (96.5%) | 1,231 (76.5%) |
| Total | 7,605 (29.2%) | 21,166 (81.4%) |
Disability Status by Sex by Age in Hercules
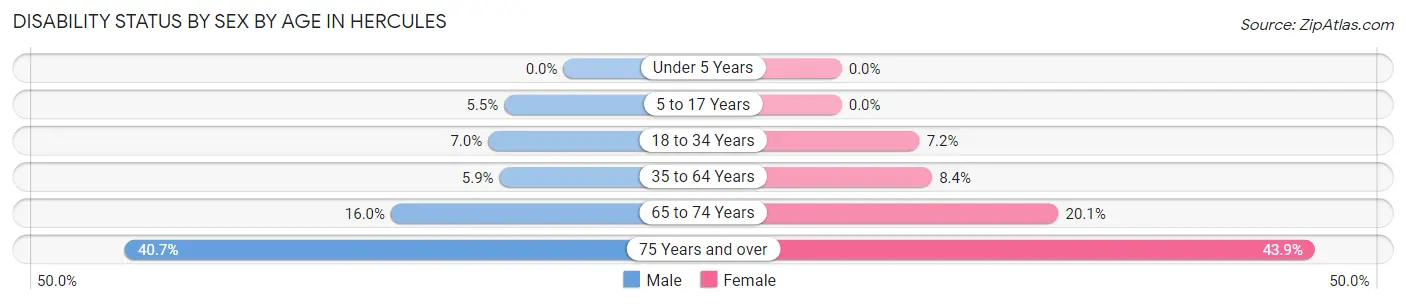
| Age Bracket | Male | Female |
| Under 5 Years | 0 (0.0%) | 0 (0.0%) |
| 5 to 17 Years | 109 (5.5%) | 0 (0.0%) |
| 18 to 34 Years | 173 (7.0%) | 189 (7.2%) |
| 35 to 64 Years | 311 (5.9%) | 498 (8.4%) |
| 65 to 74 Years | 203 (16.0%) | 347 (20.1%) |
| 75 Years and over | 288 (40.7%) | 395 (43.9%) |
Disability Class by Sex by Age in Hercules
Disability Class: Hearing Difficulty
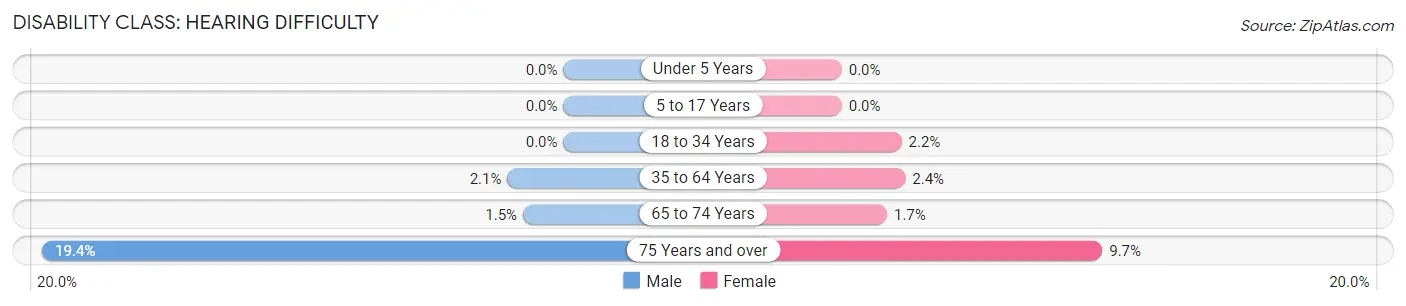
| Age Bracket | Male | Female |
| Under 5 Years | 0 (0.0%) | 0 (0.0%) |
| 5 to 17 Years | 0 (0.0%) | 0 (0.0%) |
| 18 to 34 Years | 0 (0.0%) | 58 (2.2%) |
| 35 to 64 Years | 109 (2.1%) | 140 (2.4%) |
| 65 to 74 Years | 19 (1.5%) | 29 (1.7%) |
| 75 Years and over | 137 (19.4%) | 87 (9.7%) |
Disability Class: Vision Difficulty
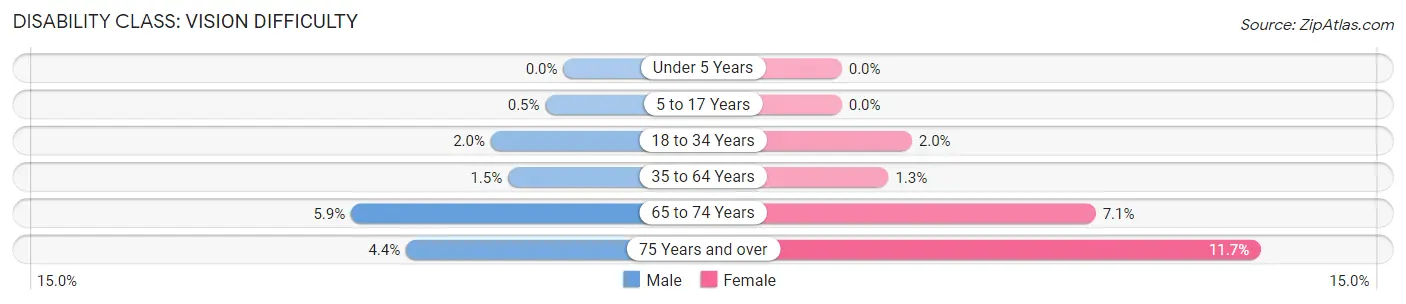
| Age Bracket | Male | Female |
| Under 5 Years | 0 (0.0%) | 0 (0.0%) |
| 5 to 17 Years | 10 (0.5%) | 0 (0.0%) |
| 18 to 34 Years | 50 (2.0%) | 51 (1.9%) |
| 35 to 64 Years | 81 (1.5%) | 77 (1.3%) |
| 65 to 74 Years | 75 (5.9%) | 122 (7.1%) |
| 75 Years and over | 31 (4.4%) | 105 (11.7%) |
Disability Class: Cognitive Difficulty
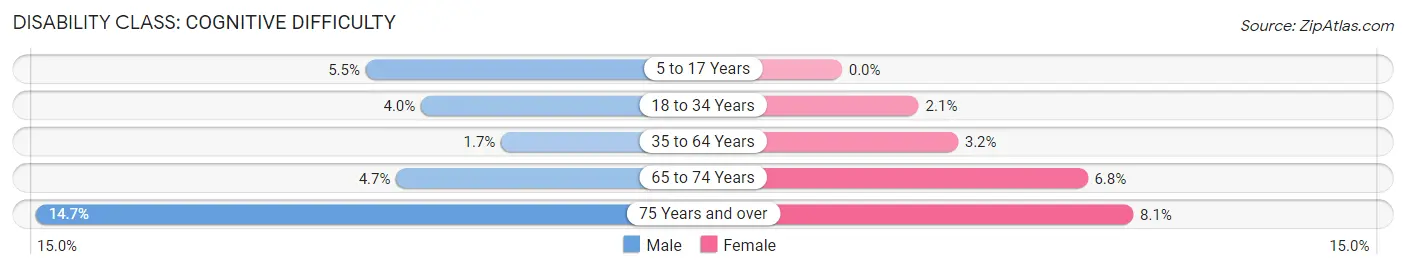
| Age Bracket | Male | Female |
| 5 to 17 Years | 109 (5.5%) | 0 (0.0%) |
| 18 to 34 Years | 98 (4.0%) | 56 (2.1%) |
| 35 to 64 Years | 91 (1.7%) | 192 (3.2%) |
| 65 to 74 Years | 59 (4.6%) | 118 (6.8%) |
| 75 Years and over | 104 (14.7%) | 73 (8.1%) |
Disability Class: Ambulatory Difficulty
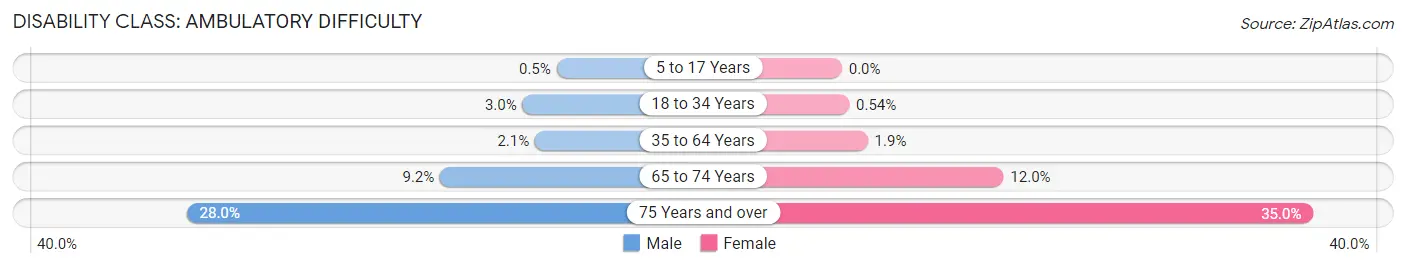
| Age Bracket | Male | Female |
| 5 to 17 Years | 10 (0.5%) | 0 (0.0%) |
| 18 to 34 Years | 75 (3.0%) | 14 (0.5%) |
| 35 to 64 Years | 110 (2.1%) | 114 (1.9%) |
| 65 to 74 Years | 116 (9.1%) | 207 (12.0%) |
| 75 Years and over | 198 (28.0%) | 315 (35.0%) |
Disability Class: Self-Care Difficulty
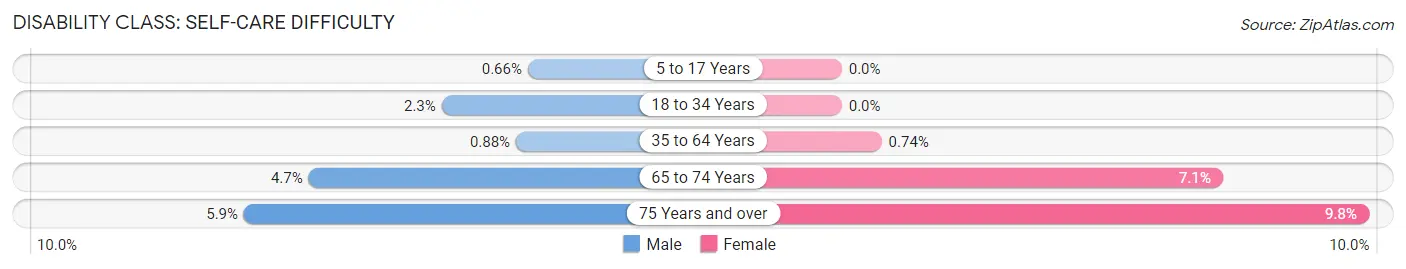
| Age Bracket | Male | Female |
| 5 to 17 Years | 13 (0.7%) | 0 (0.0%) |
| 18 to 34 Years | 56 (2.3%) | 0 (0.0%) |
| 35 to 64 Years | 46 (0.9%) | 44 (0.7%) |
| 65 to 74 Years | 60 (4.7%) | 122 (7.1%) |
| 75 Years and over | 42 (5.9%) | 88 (9.8%) |
Technology Access in Hercules
Computing Device Access in Hercules
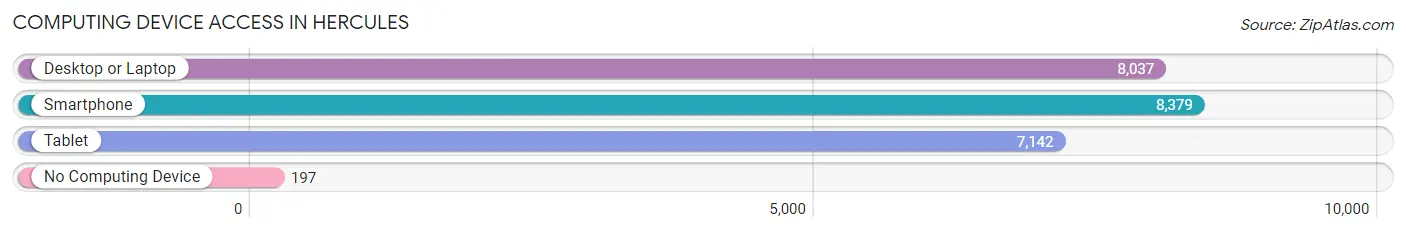
| Device Type | # Households | % Households |
| Desktop or Laptop | 8,037 | 89.4% |
| Smartphone | 8,379 | 93.2% |
| Tablet | 7,142 | 79.4% |
| No Computing Device | 197 | 2.2% |
| Total | 8,990 | 100.0% |
Internet Access in Hercules
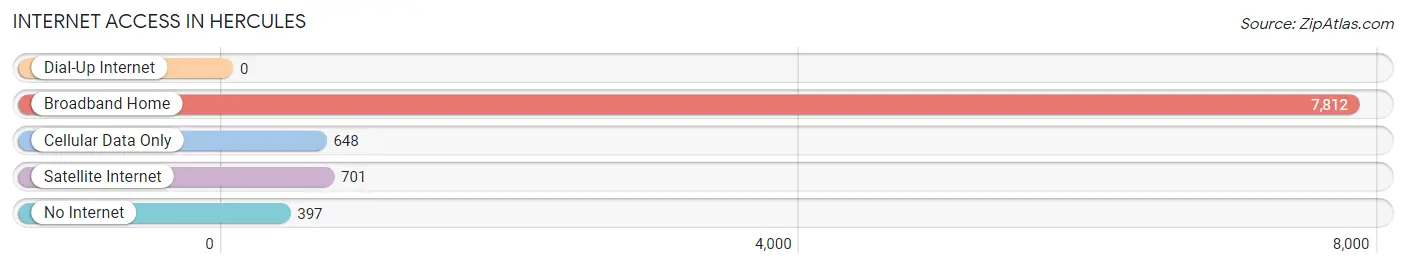
| Internet Type | # Households | % Households |
| Dial-Up Internet | 0 | 0.0% |
| Broadband Home | 7,812 | 86.9% |
| Cellular Data Only | 648 | 7.2% |
| Satellite Internet | 701 | 7.8% |
| No Internet | 397 | 4.4% |
| Total | 8,990 | 100.0% |
Hercules Summary
Hercules, California is a city located in Contra Costa County, in the San Francisco Bay Area. It is situated on the eastern shore of San Pablo Bay, and is bordered by the cities of Pinole, San Pablo, and Rodeo. The population of Hercules was 24,060 as of the 2010 census.
History
Hercules was originally inhabited by the Ohlone people, who lived in the area for thousands of years before the arrival of Europeans. The first European settlers arrived in the area in the late 1800s, and the town was officially founded in 1881. The town was named after the Greek mythological hero Hercules, and was originally a small agricultural community.
In the early 1900s, Hercules began to experience rapid growth due to the development of the nearby Port of Richmond. The port was a major shipping hub for the region, and the town of Hercules became a popular destination for workers and their families. The town was incorporated in 1900, and by the 1950s, it had become a thriving industrial center.
Geography
Hercules is located in Contra Costa County, in the San Francisco Bay Area. It is situated on the eastern shore of San Pablo Bay, and is bordered by the cities of Pinole, San Pablo, and Rodeo. The city covers an area of 5.3 square miles, and has a population density of 4,541 people per square mile.
The city is located in a temperate climate zone, and experiences mild temperatures throughout the year. The average high temperature in the summer is around 75 degrees Fahrenheit, and the average low temperature in the winter is around 45 degrees Fahrenheit.
Economy
Hercules is a major industrial center in the San Francisco Bay Area. The city is home to a number of large companies, including Chevron, Dow Chemical, and the Hercules Chemical Company. The city is also home to a number of smaller businesses, including restaurants, retail stores, and professional services.
The city is served by the Port of Richmond, which is one of the largest ports on the West Coast. The port is a major shipping hub for the region, and is a major source of employment for the city.
Demographics
As of the 2010 census, the population of Hercules was 24,060. The racial makeup of the city was 57.2% White, 16.3% African American, 0.7% Native American, 16.3% Asian, 0.2% Pacific Islander, and 8.5% from other races. The median household income was $76,837, and the median family income was $87,837.
The city is served by the West Contra Costa Unified School District, which includes Hercules High School. The city is also home to a number of private schools, including the Hercules Academy of Technology and Science.
Conclusion
Hercules, California is a city located in Contra Costa County, in the San Francisco Bay Area. It is situated on the eastern shore of San Pablo Bay, and is bordered by the cities of Pinole, San Pablo, and Rodeo. The population of Hercules was 24,060 as of the 2010 census. The city is a major industrial center in the region, and is served by the Port of Richmond. The city is also home to a number of businesses, including restaurants, retail stores, and professional services. The median household income was $76,837, and the median family income was $87,837. The city is served by the West Contra Costa Unified School District, which includes Hercules High School.
Common Questions
What is Per Capita Income in Hercules?
Per Capita income in Hercules is $52,818.
What is the Median Family Income in Hercules?
Median Family Income in Hercules is $140,214.
What is the Median Household income in Hercules?
Median Household Income in Hercules is $125,880.
What is Income or Wage Gap in Hercules?
Income or Wage Gap in Hercules is 28.1%.
Women in Hercules earn 71.9 cents for every dollar earned by a man.
What is Inequality or Gini Index in Hercules?
Inequality or Gini Index in Hercules is 0.41.
What is the Total Population of Hercules?
Total Population of Hercules is 26,041.
What is the Total Male Population of Hercules?
Total Male Population of Hercules is 12,267.
What is the Total Female Population of Hercules?
Total Female Population of Hercules is 13,774.
What is the Ratio of Males per 100 Females in Hercules?
There are 89.06 Males per 100 Females in Hercules.
What is the Ratio of Females per 100 Males in Hercules?
There are 112.28 Females per 100 Males in Hercules.
What is the Median Population Age in Hercules?
Median Population Age in Hercules is 42.6 Years.
What is the Average Family Size in Hercules
Average Family Size in Hercules is 3.5 People.
What is the Average Household Size in Hercules
Average Household Size in Hercules is 2.9 People.
How Large is the Labor Force in Hercules?
There are 14,363 People in the Labor Forcein in Hercules.
What is the Percentage of People in the Labor Force in Hercules?
67.2% of People are in the Labor Force in Hercules.
What is the Unemployment Rate in Hercules?
Unemployment Rate in Hercules is 4.4%.