Hamilton City, CA Map & Demographics
Hamilton City Map
Hamilton City Overview
$21,750
PER CAPITA INCOME
$55,598
AVG FAMILY INCOME
$46,887
AVG HOUSEHOLD INCOME
15.9%
WAGE / INCOME GAP [ % ]
84.1¢/ $1
WAGE / INCOME GAP [ $ ]
0.41
INEQUALITY / GINI INDEX
2,191
TOTAL POPULATION
1,106
MALE POPULATION
1,085
FEMALE POPULATION
101.94
MALES / 100 FEMALES
98.10
FEMALES / 100 MALES
29.2
MEDIAN AGE
3.5
AVG FAMILY SIZE
2.9
AVG HOUSEHOLD SIZE
1,191
LABOR FORCE [ PEOPLE ]
66.9%
PERCENT IN LABOR FORCE
10.0%
UNEMPLOYMENT RATE
Hamilton City Zip Codes
Hamilton City Area Codes
Income in Hamilton City
Income Overview in Hamilton City
Per Capita Income in Hamilton City is $21,750, while median incomes of families and households are $55,598 and $46,887 respectively.
| Characteristic | Number | Measure |
| Per Capita Income | 2,191 | $21,750 |
| Median Family Income | 535 | $55,598 |
| Mean Family Income | 535 | $66,461 |
| Median Household Income | 768 | $46,887 |
| Mean Household Income | 768 | $58,620 |
| Income Deficit | 535 | $0 |
| Wage / Income Gap (%) | 2,191 | 15.94% |
| Wage / Income Gap ($) | 2,191 | 84.06¢ per $1 |
| Gini / Inequality Index | 2,191 | 0.41 |
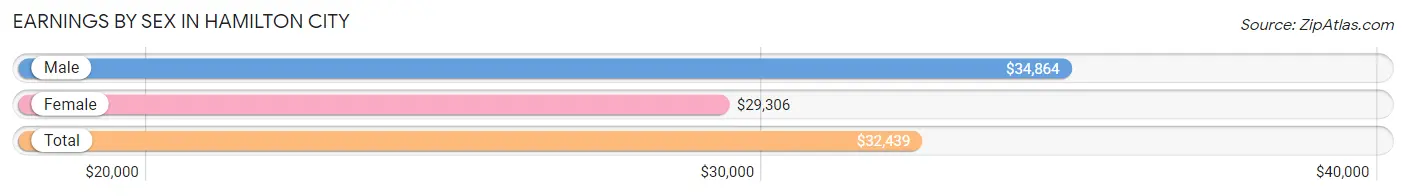
Earnings by Sex in Hamilton City
Average Earnings in Hamilton City are $32,439, $34,864 for men and $29,306 for women, a difference of 15.9%.
| Sex | Number | Average Earnings |
| Male | 590 (52.4%) | $34,864 |
| Female | 535 (47.6%) | $29,306 |
| Total | 1,125 (100.0%) | $32,439 |
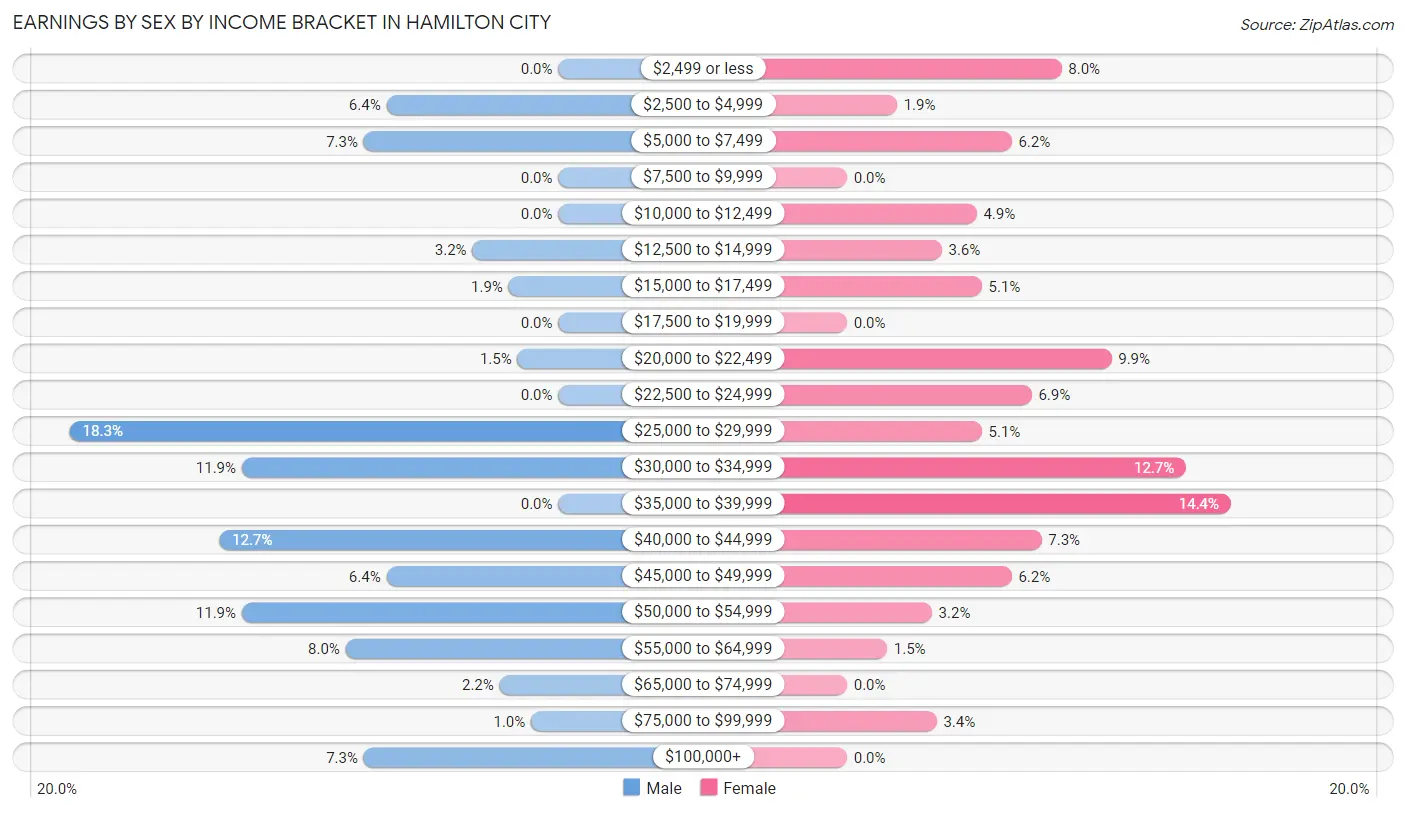
Earnings by Sex by Income Bracket in Hamilton City
The most common earnings brackets in Hamilton City are $25,000 to $29,999 for men (108 | 18.3%) and $35,000 to $39,999 for women (77 | 14.4%).
| Income | Male | Female |
| $2,499 or less | 0 (0.0%) | 43 (8.0%) |
| $2,500 to $4,999 | 38 (6.4%) | 10 (1.9%) |
| $5,000 to $7,499 | 43 (7.3%) | 33 (6.2%) |
| $7,500 to $9,999 | 0 (0.0%) | 0 (0.0%) |
| $10,000 to $12,499 | 0 (0.0%) | 26 (4.9%) |
| $12,500 to $14,999 | 19 (3.2%) | 19 (3.5%) |
| $15,000 to $17,499 | 11 (1.9%) | 27 (5.1%) |
| $17,500 to $19,999 | 0 (0.0%) | 0 (0.0%) |
| $20,000 to $22,499 | 9 (1.5%) | 53 (9.9%) |
| $22,500 to $24,999 | 0 (0.0%) | 37 (6.9%) |
| $25,000 to $29,999 | 108 (18.3%) | 27 (5.1%) |
| $30,000 to $34,999 | 70 (11.9%) | 68 (12.7%) |
| $35,000 to $39,999 | 0 (0.0%) | 77 (14.4%) |
| $40,000 to $44,999 | 75 (12.7%) | 39 (7.3%) |
| $45,000 to $49,999 | 38 (6.4%) | 33 (6.2%) |
| $50,000 to $54,999 | 70 (11.9%) | 17 (3.2%) |
| $55,000 to $64,999 | 47 (8.0%) | 8 (1.5%) |
| $65,000 to $74,999 | 13 (2.2%) | 0 (0.0%) |
| $75,000 to $99,999 | 6 (1.0%) | 18 (3.4%) |
| $100,000+ | 43 (7.3%) | 0 (0.0%) |
| Total | 590 (100.0%) | 535 (100.0%) |
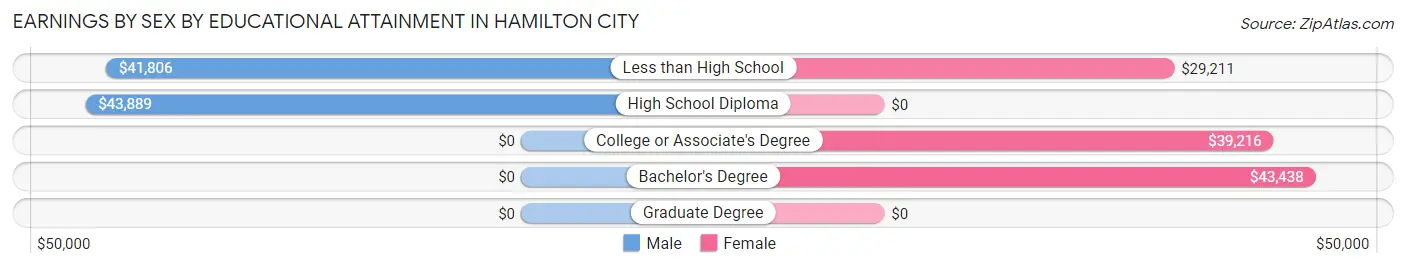
Earnings by Sex by Educational Attainment in Hamilton City
Average earnings in Hamilton City are $42,917 for men and $38,582 for women, a difference of 10.1%. Men with an educational attainment of high school diploma enjoy the highest average annual earnings of $43,889, while those with less than high school education earn the least with $41,806. Women with an educational attainment of bachelor's degree earn the most with the average annual earnings of $43,438, while those with less than high school education have the smallest earnings of $29,211.
| Educational Attainment | Male Income | Female Income |
| Less than High School | $41,806 | $29,211 |
| High School Diploma | $43,889 | $0 |
| College or Associate's Degree | - | - |
| Bachelor's Degree | - | - |
| Graduate Degree | - | - |
| Total | $42,917 | $38,582 |
Family Income in Hamilton City
Family Income Brackets in Hamilton City
According to the Hamilton City family income data, there are 89 families falling into the $35,000 to $49,999 income range, which is the most common income bracket and makes up 16.6% of all families. Conversely, the $200,000+ income bracket is the least frequent group with only 9 families (1.7%) belonging to this category.
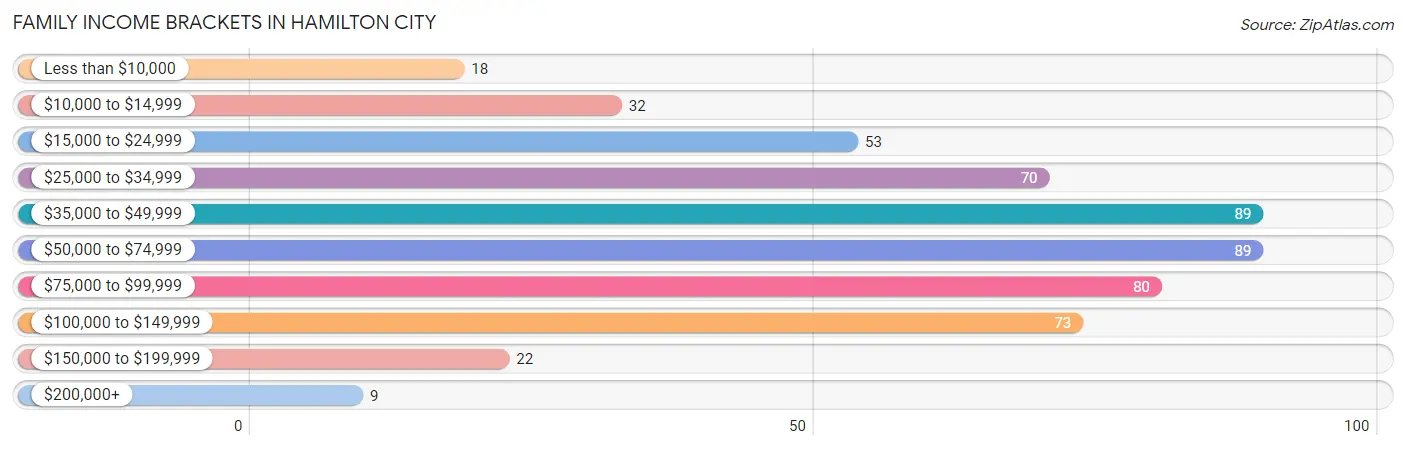
| Income Bracket | # Families | % Families |
| Less than $10,000 | 18 | 3.4% |
| $10,000 to $14,999 | 32 | 6.0% |
| $15,000 to $24,999 | 53 | 9.9% |
| $25,000 to $34,999 | 70 | 13.1% |
| $35,000 to $49,999 | 89 | 16.6% |
| $50,000 to $74,999 | 89 | 16.6% |
| $75,000 to $99,999 | 80 | 15.0% |
| $100,000 to $149,999 | 73 | 13.6% |
| $150,000 to $199,999 | 22 | 4.1% |
| $200,000+ | 9 | 1.7% |
Family Income by Famaliy Size in Hamilton City
4-person families (82 | 15.3%) account for the highest median family income in Hamilton City with $135,116 per family, while 4-person families (82 | 15.3%) have the highest median income of $33,779 per family member.
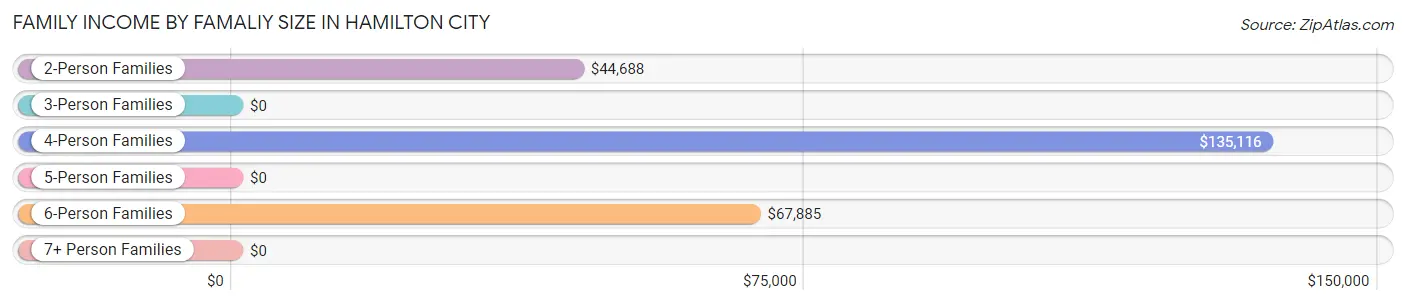
| Income Bracket | # Families | Median Income |
| 2-Person Families | 253 (47.3%) | $44,688 |
| 3-Person Families | 110 (20.6%) | $0 |
| 4-Person Families | 82 (15.3%) | $135,116 |
| 5-Person Families | 10 (1.9%) | $0 |
| 6-Person Families | 48 (9.0%) | $67,885 |
| 7+ Person Families | 32 (6.0%) | $0 |
| Total | 535 (100.0%) | $55,598 |
Family Income by Number of Earners in Hamilton City
The median family income in Hamilton City is $55,598, with families comprising 3+ earners (63) having the highest median family income of $87,019, while families with no earners (82) have the lowest median family income of $23,750, accounting for 11.8% and 15.3% of families, respectively.
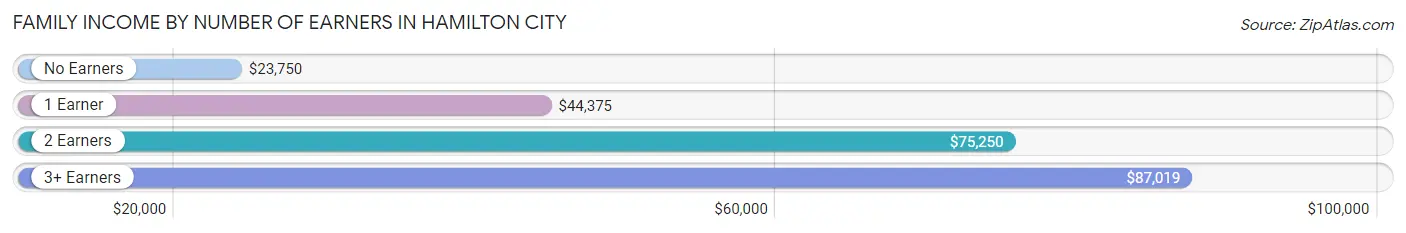
| Number of Earners | # Families | Median Income |
| No Earners | 82 (15.3%) | $23,750 |
| 1 Earner | 198 (37.0%) | $44,375 |
| 2 Earners | 192 (35.9%) | $75,250 |
| 3+ Earners | 63 (11.8%) | $87,019 |
| Total | 535 (100.0%) | $55,598 |
Household Income in Hamilton City
Household Income Brackets in Hamilton City
With 177 households falling in the category, the $50,000 to $74,999 income range is the most frequent in Hamilton City, accounting for 23.1% of all households. In contrast, only 9 households (1.2%) fall into the $200,000+ income bracket, making it the least populous group.
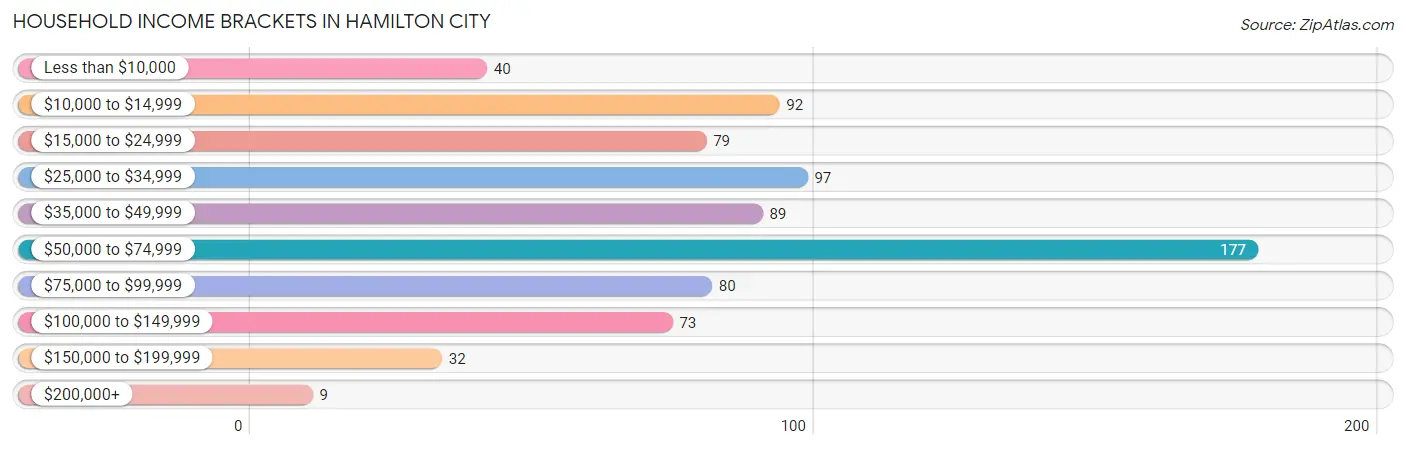
| Income Bracket | # Households | % Households |
| Less than $10,000 | 40 | 5.2% |
| $10,000 to $14,999 | 92 | 12.0% |
| $15,000 to $24,999 | 79 | 10.3% |
| $25,000 to $34,999 | 97 | 12.6% |
| $35,000 to $49,999 | 89 | 11.6% |
| $50,000 to $74,999 | 177 | 23.0% |
| $75,000 to $99,999 | 80 | 10.4% |
| $100,000 to $149,999 | 73 | 9.5% |
| $150,000 to $199,999 | 32 | 4.2% |
| $200,000+ | 9 | 1.2% |
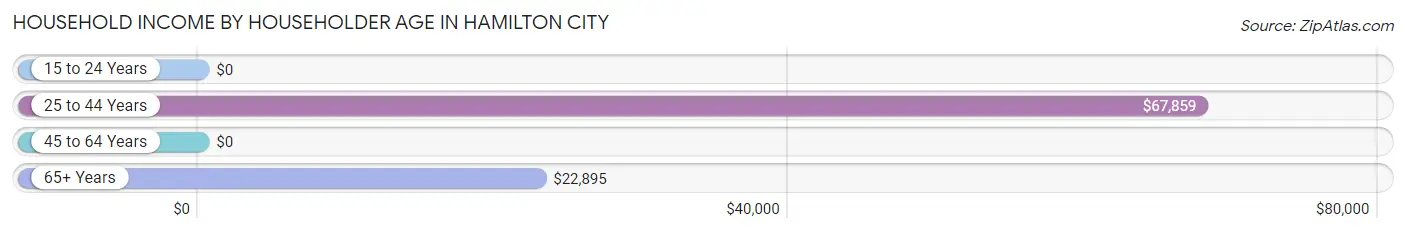
Household Income by Householder Age in Hamilton City
The median household income in Hamilton City is $46,887, with the highest median household income of $67,859 found in the 25 to 44 years age bracket for the primary householder. A total of 319 households (41.5%) fall into this category. Meanwhile, the 15 to 24 years age bracket for the primary householder has the lowest median household income of $0, with 61 households (7.9%) in this group.
| Income Bracket | # Households | Median Income |
| 15 to 24 Years | 61 (7.9%) | $0 |
| 25 to 44 Years | 319 (41.5%) | $67,859 |
| 45 to 64 Years | 198 (25.8%) | $0 |
| 65+ Years | 190 (24.7%) | $22,895 |
| Total | 768 (100.0%) | $46,887 |
Poverty in Hamilton City
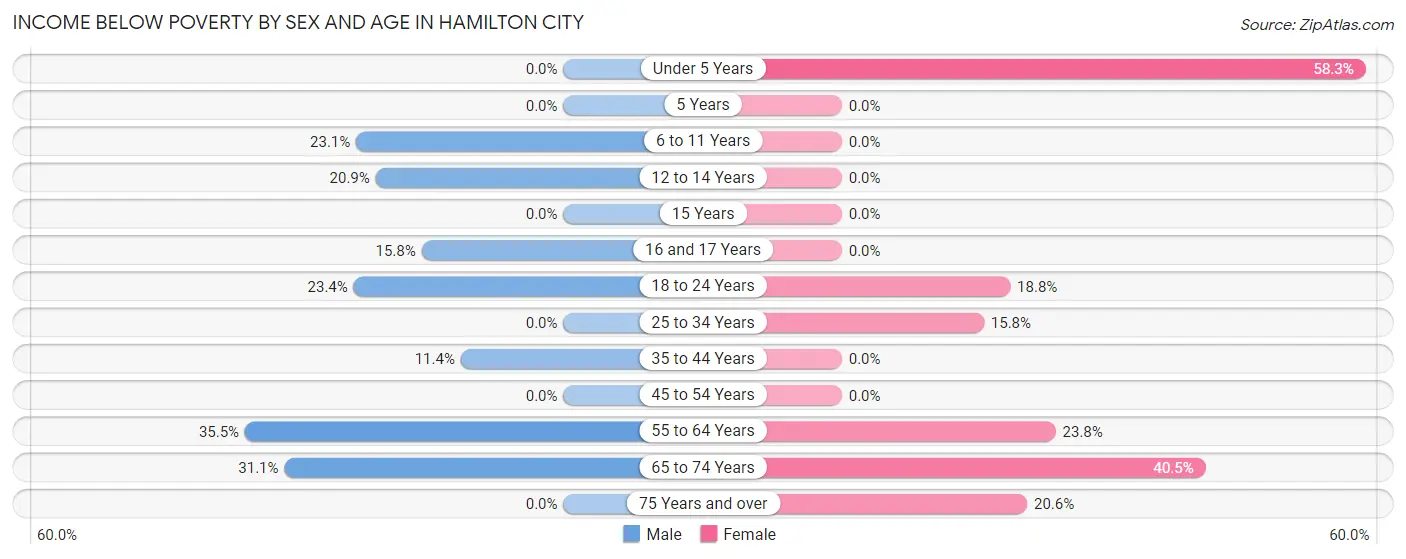
Income Below Poverty by Sex and Age in Hamilton City
With 17.3% poverty level for males and 14.5% for females among the residents of Hamilton City, 55 to 64 year old males and under 5 year old females are the most vulnerable to poverty, with 50 males (35.5%) and 14 females (58.3%) in their respective age groups living below the poverty level.
| Age Bracket | Male | Female |
| Under 5 Years | 0 (0.0%) | 14 (58.3%) |
| 5 Years | 0 (0.0%) | 0 (0.0%) |
| 6 to 11 Years | 15 (23.1%) | 0 (0.0%) |
| 12 to 14 Years | 23 (20.9%) | 0 (0.0%) |
| 15 Years | 0 (0.0%) | 0 (0.0%) |
| 16 and 17 Years | 9 (15.8%) | 0 (0.0%) |
| 18 to 24 Years | 50 (23.4%) | 45 (18.8%) |
| 25 to 34 Years | 0 (0.0%) | 28 (15.8%) |
| 35 to 44 Years | 12 (11.4%) | 0 (0.0%) |
| 45 to 54 Years | 0 (0.0%) | 0 (0.0%) |
| 55 to 64 Years | 50 (35.5%) | 25 (23.8%) |
| 65 to 74 Years | 32 (31.1%) | 32 (40.5%) |
| 75 Years and over | 0 (0.0%) | 13 (20.6%) |
| Total | 191 (17.3%) | 157 (14.5%) |
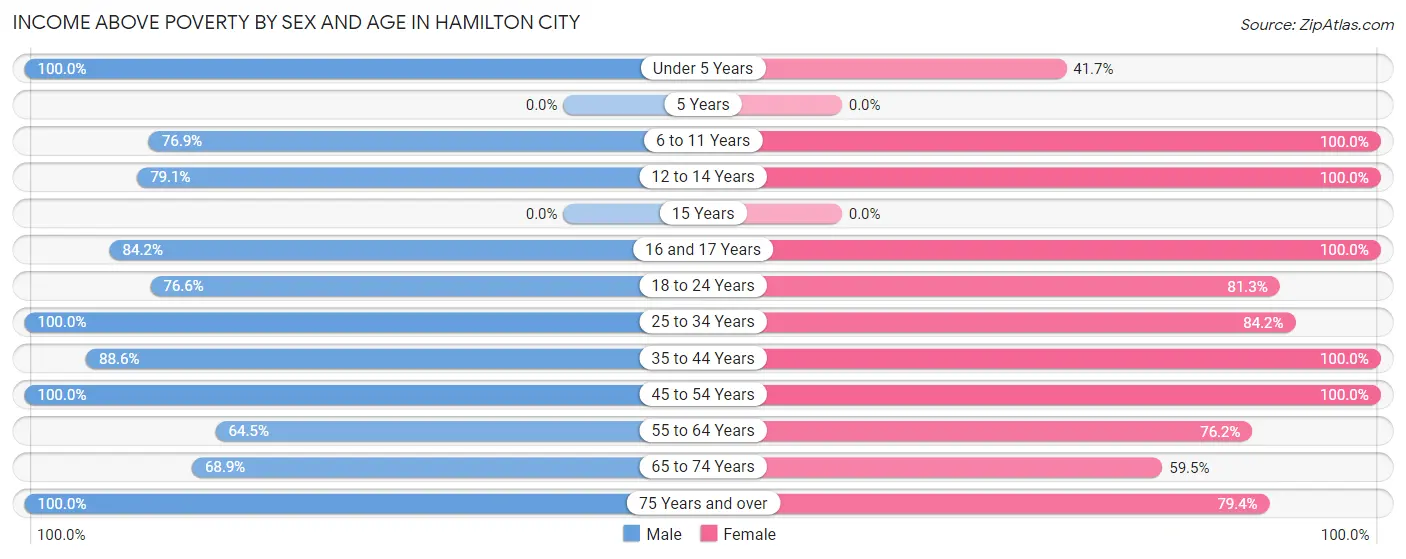
Income Above Poverty by Sex and Age in Hamilton City
According to the poverty statistics in Hamilton City, males aged under 5 years and females aged 6 to 11 years are the age groups that are most secure financially, with 100.0% of males and 100.0% of females in these age groups living above the poverty line.
| Age Bracket | Male | Female |
| Under 5 Years | 27 (100.0%) | 10 (41.7%) |
| 5 Years | 0 (0.0%) | 0 (0.0%) |
| 6 to 11 Years | 50 (76.9%) | 107 (100.0%) |
| 12 to 14 Years | 87 (79.1%) | 77 (100.0%) |
| 15 Years | 0 (0.0%) | 0 (0.0%) |
| 16 and 17 Years | 48 (84.2%) | 15 (100.0%) |
| 18 to 24 Years | 164 (76.6%) | 195 (81.2%) |
| 25 to 34 Years | 139 (100.0%) | 149 (84.2%) |
| 35 to 44 Years | 93 (88.6%) | 83 (100.0%) |
| 45 to 54 Years | 111 (100.0%) | 115 (100.0%) |
| 55 to 64 Years | 91 (64.5%) | 80 (76.2%) |
| 65 to 74 Years | 71 (68.9%) | 47 (59.5%) |
| 75 Years and over | 34 (100.0%) | 50 (79.4%) |
| Total | 915 (82.7%) | 928 (85.5%) |
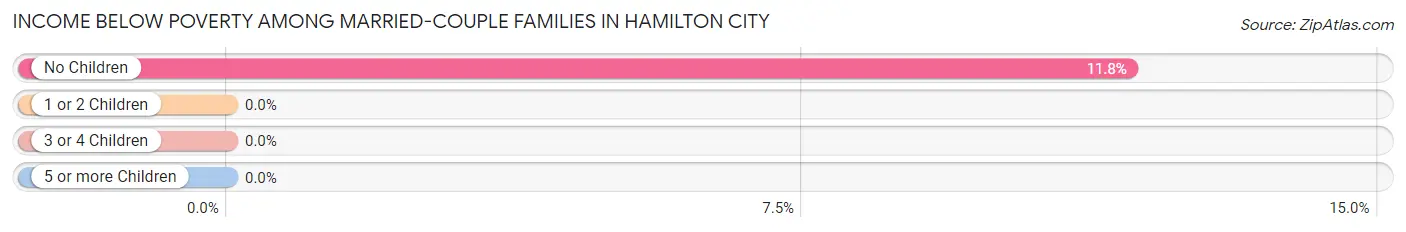
Income Below Poverty Among Married-Couple Families in Hamilton City
The poverty statistics for married-couple families in Hamilton City show that 7.1% or 26 of the total 367 families live below the poverty line. Families with no children have the highest poverty rate of 11.8%, comprising of 26 families. On the other hand, families with 1 or 2 children have the lowest poverty rate of 0.0%, which includes 0 families.
| Children | Above Poverty | Below Poverty |
| No Children | 195 (88.2%) | 26 (11.8%) |
| 1 or 2 Children | 117 (100.0%) | 0 (0.0%) |
| 3 or 4 Children | 29 (100.0%) | 0 (0.0%) |
| 5 or more Children | 0 (0.0%) | 0 (0.0%) |
| Total | 341 (92.9%) | 26 (7.1%) |
Income Below Poverty Among Single-Parent Households in Hamilton City
According to the poverty data in Hamilton City, 33.3% or 26 single-father households and 25.6% or 23 single-mother households are living below the poverty line. Among single-father households, those with 1 or 2 children have the highest poverty rate, with 26 households (68.4%) experiencing poverty. Likewise, among single-mother households, those with 3 or 4 children have the highest poverty rate, with 13 households (56.5%) falling below the poverty line.
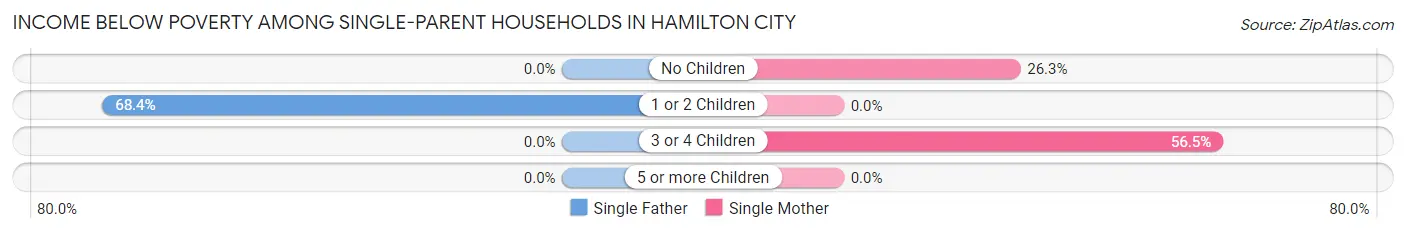
| Children | Single Father | Single Mother |
| No Children | 0 (0.0%) | 10 (26.3%) |
| 1 or 2 Children | 26 (68.4%) | 0 (0.0%) |
| 3 or 4 Children | 0 (0.0%) | 13 (56.5%) |
| 5 or more Children | 0 (0.0%) | 0 (0.0%) |
| Total | 26 (33.3%) | 23 (25.6%) |
Income Below Poverty Among Married-Couple vs Single-Parent Households in Hamilton City
The poverty data for Hamilton City shows that 26 of the married-couple family households (7.1%) and 49 of the single-parent households (29.2%) are living below the poverty level. Within the married-couple family households, those with no children have the highest poverty rate, with 26 households (11.8%) falling below the poverty line. Among the single-parent households, those with 3 or 4 children have the highest poverty rate, with 13 household (56.5%) living below poverty.
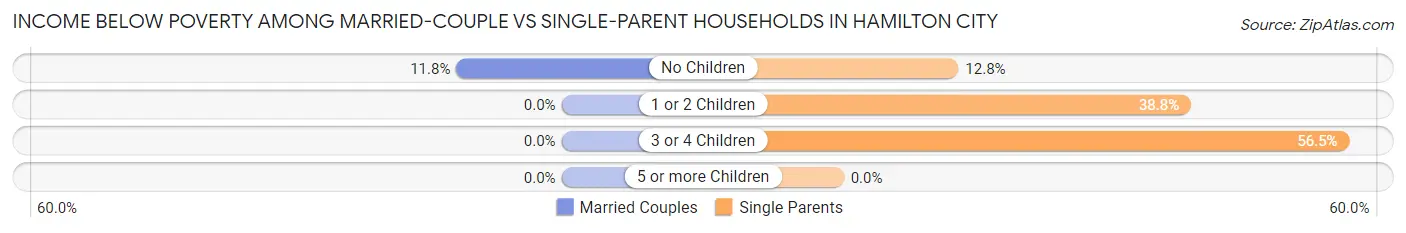
| Children | Married-Couple Families | Single-Parent Households |
| No Children | 26 (11.8%) | 10 (12.8%) |
| 1 or 2 Children | 0 (0.0%) | 26 (38.8%) |
| 3 or 4 Children | 0 (0.0%) | 13 (56.5%) |
| 5 or more Children | 0 (0.0%) | 0 (0.0%) |
| Total | 26 (7.1%) | 49 (29.2%) |
Race in Hamilton City
The most populous races in Hamilton City are Hispanic or Latino (2,003 | 91.4%), Some other Race (1,001 | 45.7%), and White / Caucasian (695 | 31.7%).
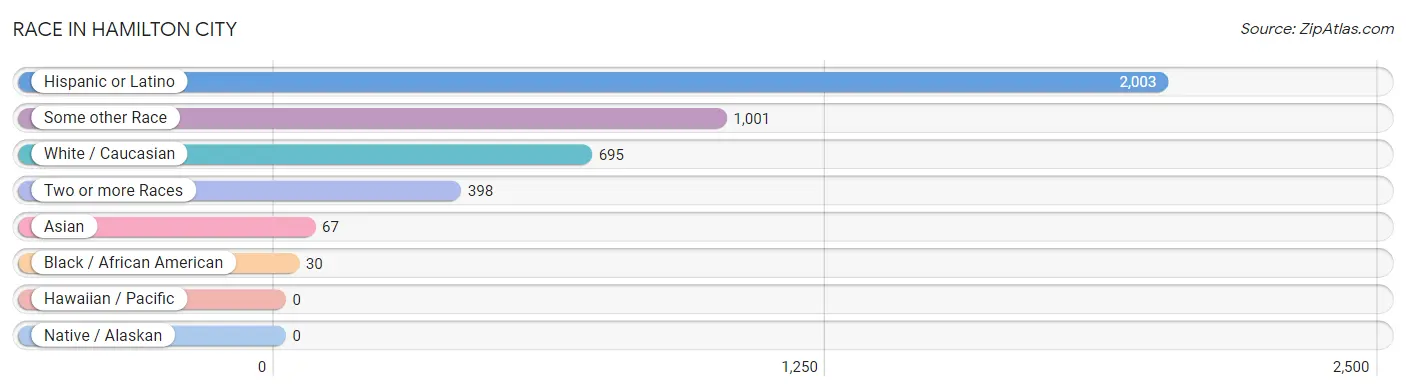
| Race | # Population | % Population |
| Asian | 67 | 3.1% |
| Black / African American | 30 | 1.4% |
| Hawaiian / Pacific | 0 | 0.0% |
| Hispanic or Latino | 2,003 | 91.4% |
| Native / Alaskan | 0 | 0.0% |
| White / Caucasian | 695 | 31.7% |
| Two or more Races | 398 | 18.2% |
| Some other Race | 1,001 | 45.7% |
| Total | 2,191 | 100.0% |
Ancestry in Hamilton City
The most populous ancestries reported in Hamilton City are Mexican (1,856 | 84.7%), Malaysian (67 | 3.1%), Central American (59 | 2.7%), Nicaraguan (59 | 2.7%), and German (44 | 2.0%), together accounting for 95.2% of all Hamilton City residents.
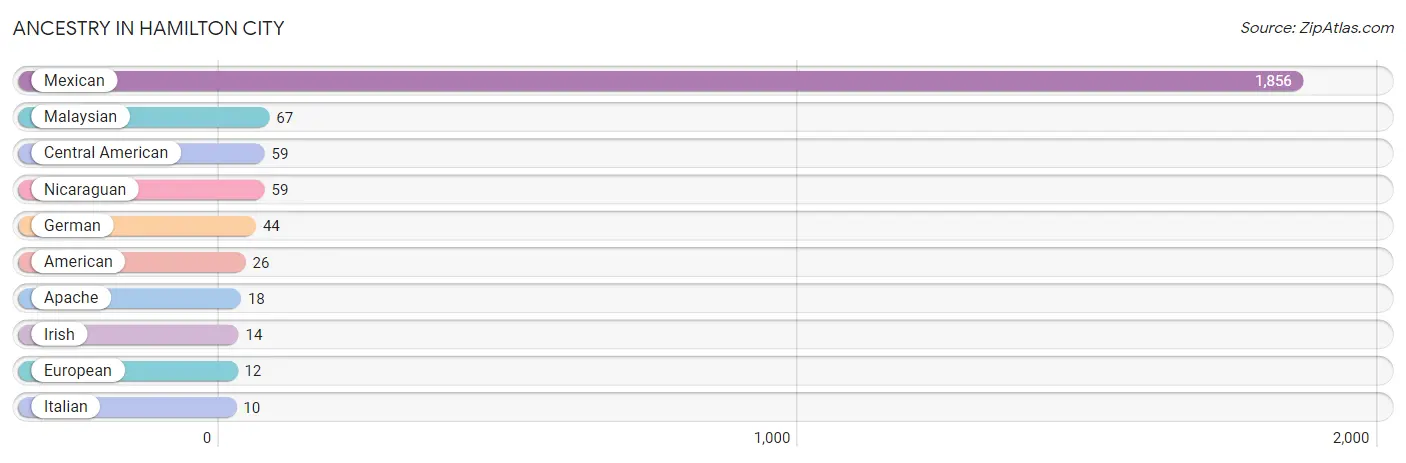
| Ancestry | # Population | % Population |
| American | 26 | 1.2% |
| Apache | 18 | 0.8% |
| Central American | 59 | 2.7% |
| European | 12 | 0.5% |
| German | 44 | 2.0% |
| Irish | 14 | 0.6% |
| Italian | 10 | 0.5% |
| Malaysian | 67 | 3.1% |
| Mexican | 1,856 | 84.7% |
| Nicaraguan | 59 | 2.7% | View All 10 Rows |
Immigrants in Hamilton City
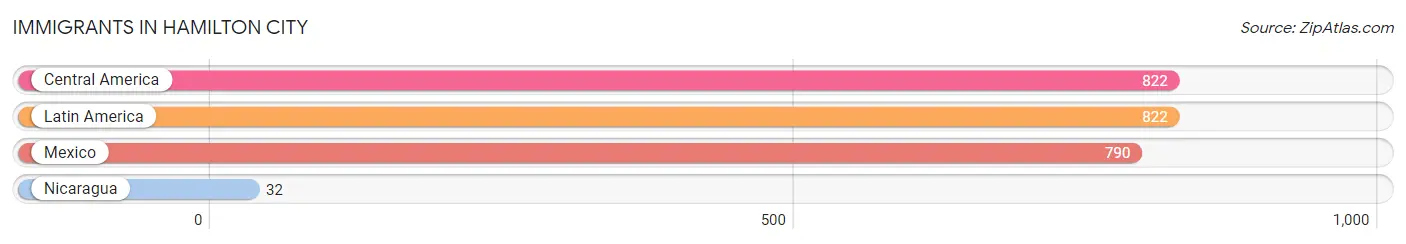
The most numerous immigrant groups reported in Hamilton City came from Central America (822 | 37.5%), Latin America (822 | 37.5%), Mexico (790 | 36.1%), and Nicaragua (32 | 1.5%), together accounting for 112.6% of all Hamilton City residents.
| Immigration Origin | # Population | % Population |
| Central America | 822 | 37.5% |
| Latin America | 822 | 37.5% |
| Mexico | 790 | 36.1% |
| Nicaragua | 32 | 1.5% | View All 4 Rows |
Sex and Age in Hamilton City
Sex and Age in Hamilton City
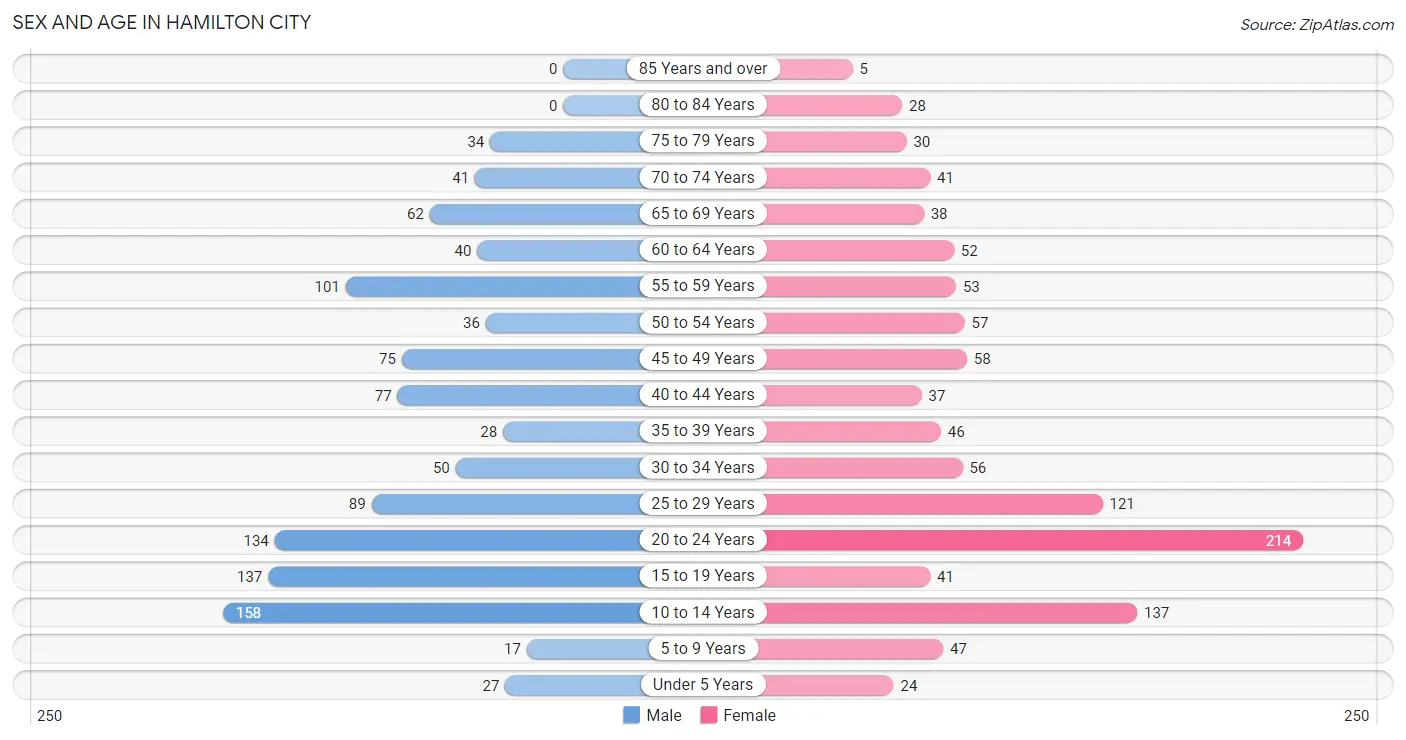
The most populous age groups in Hamilton City are 10 to 14 Years (158 | 14.3%) for men and 20 to 24 Years (214 | 19.7%) for women.
| Age Bracket | Male | Female |
| Under 5 Years | 27 (2.4%) | 24 (2.2%) |
| 5 to 9 Years | 17 (1.5%) | 47 (4.3%) |
| 10 to 14 Years | 158 (14.3%) | 137 (12.6%) |
| 15 to 19 Years | 137 (12.4%) | 41 (3.8%) |
| 20 to 24 Years | 134 (12.1%) | 214 (19.7%) |
| 25 to 29 Years | 89 (8.1%) | 121 (11.2%) |
| 30 to 34 Years | 50 (4.5%) | 56 (5.2%) |
| 35 to 39 Years | 28 (2.5%) | 46 (4.2%) |
| 40 to 44 Years | 77 (7.0%) | 37 (3.4%) |
| 45 to 49 Years | 75 (6.8%) | 58 (5.3%) |
| 50 to 54 Years | 36 (3.3%) | 57 (5.2%) |
| 55 to 59 Years | 101 (9.1%) | 53 (4.9%) |
| 60 to 64 Years | 40 (3.6%) | 52 (4.8%) |
| 65 to 69 Years | 62 (5.6%) | 38 (3.5%) |
| 70 to 74 Years | 41 (3.7%) | 41 (3.8%) |
| 75 to 79 Years | 34 (3.1%) | 30 (2.8%) |
| 80 to 84 Years | 0 (0.0%) | 28 (2.6%) |
| 85 Years and over | 0 (0.0%) | 5 (0.5%) |
| Total | 1,106 (100.0%) | 1,085 (100.0%) |
Families and Households in Hamilton City
Median Family Size in Hamilton City
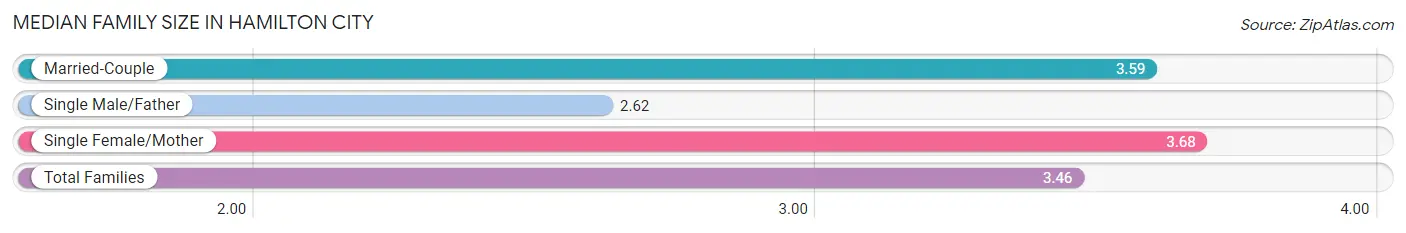
The median family size in Hamilton City is 3.46 persons per family, with single female/mother families (90 | 16.8%) accounting for the largest median family size of 3.68 persons per family. On the other hand, single male/father families (78 | 14.6%) represent the smallest median family size with 2.62 persons per family.
| Family Type | # Families | Family Size |
| Married-Couple | 367 (68.6%) | 3.59 |
| Single Male/Father | 78 (14.6%) | 2.62 |
| Single Female/Mother | 90 (16.8%) | 3.68 |
| Total Families | 535 (100.0%) | 3.46 |
Median Household Size in Hamilton City
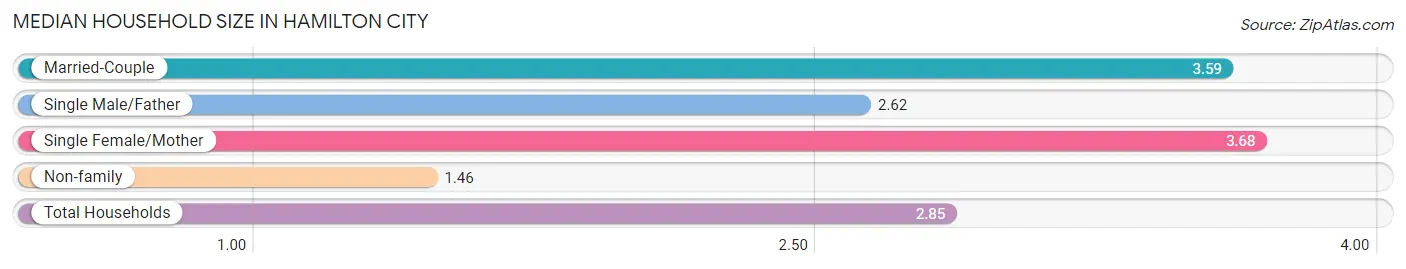
The median household size in Hamilton City is 2.85 persons per household, with single female/mother households (90 | 11.7%) accounting for the largest median household size of 3.68 persons per household. non-family households (233 | 30.3%) represent the smallest median household size with 1.46 persons per household.
| Household Type | # Households | Household Size |
| Married-Couple | 367 (47.8%) | 3.59 |
| Single Male/Father | 78 (10.2%) | 2.62 |
| Single Female/Mother | 90 (11.7%) | 3.68 |
| Non-family | 233 (30.3%) | 1.46 |
| Total Households | 768 (100.0%) | 2.85 |
Household Size by Marriage Status in Hamilton City
Out of a total of 768 households in Hamilton City, 535 (69.7%) are family households, while 233 (30.3%) are nonfamily households. The most numerous type of family households are 2-person households, comprising 253, and the most common type of nonfamily households are 2-person households, comprising 130.
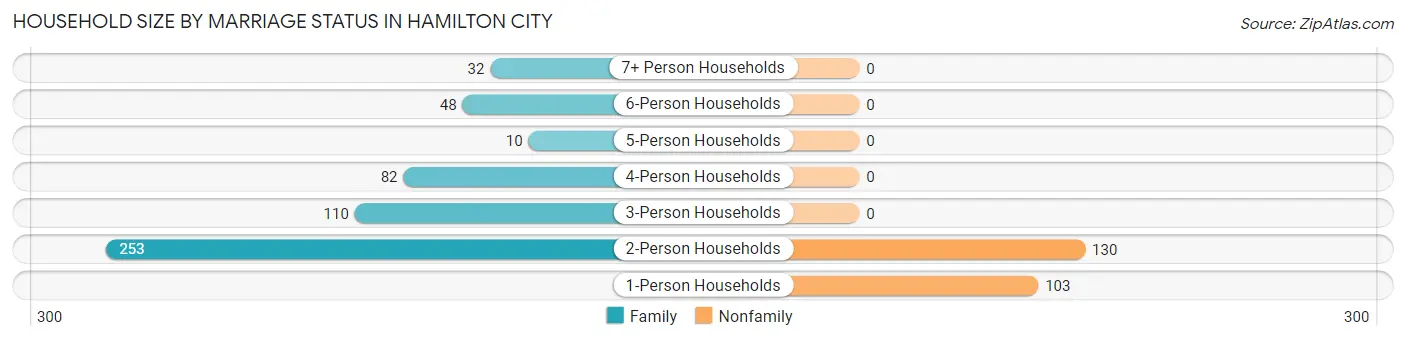
| Household Size | Family Households | Nonfamily Households |
| 1-Person Households | - | 103 (13.4%) |
| 2-Person Households | 253 (32.9%) | 130 (16.9%) |
| 3-Person Households | 110 (14.3%) | 0 (0.0%) |
| 4-Person Households | 82 (10.7%) | 0 (0.0%) |
| 5-Person Households | 10 (1.3%) | 0 (0.0%) |
| 6-Person Households | 48 (6.2%) | 0 (0.0%) |
| 7+ Person Households | 32 (4.2%) | 0 (0.0%) |
| Total | 535 (69.7%) | 233 (30.3%) |
Female Fertility in Hamilton City
Fertility by Age in Hamilton City
Average fertility rate in Hamilton City is 18.0 births per 1,000 women. Women in the age bracket of 35 to 50 years have the highest fertility rate with 64.0 births per 1,000 women. Women in the age bracket of 35 to 50 years acount for 100.0% of all women with births.
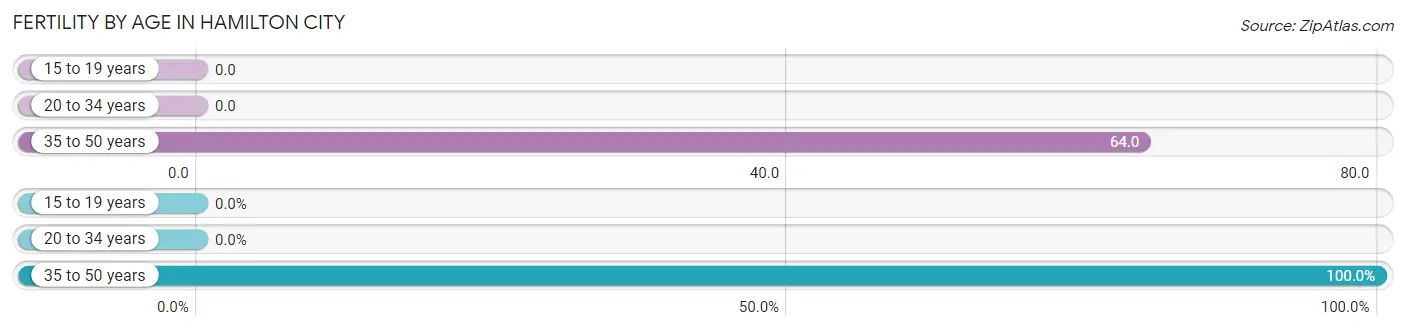
| Age Bracket | Women with Births | Births / 1,000 Women |
| 15 to 19 years | 0 (0.0%) | 0.0 |
| 20 to 34 years | 0 (0.0%) | 0.0 |
| 35 to 50 years | 11 (100.0%) | 64.0 |
| Total | 11 (100.0%) | 18.0 |
Fertility by Age by Marriage Status in Hamilton City
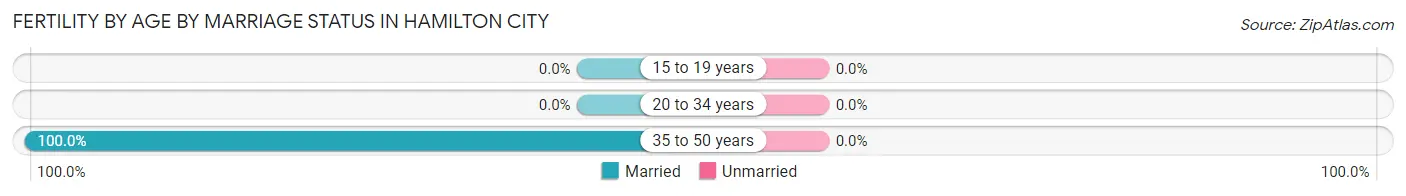
| Age Bracket | Married | Unmarried |
| 15 to 19 years | 0 (0.0%) | 0 (0.0%) |
| 20 to 34 years | 0 (0.0%) | 0 (0.0%) |
| 35 to 50 years | 11 (100.0%) | 0 (0.0%) |
| Total | 11 (100.0%) | 0 (0.0%) |
Fertility by Education in Hamilton City
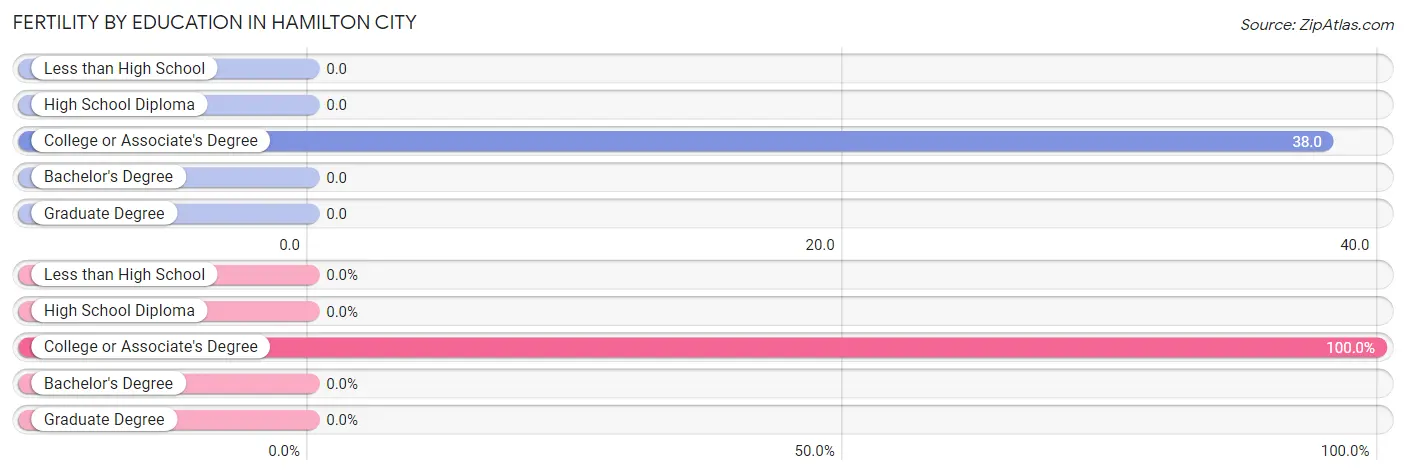
| Educational Attainment | Women with Births | Births / 1,000 Women |
| Less than High School | 0 (0.0%) | 0.0 |
| High School Diploma | 0 (0.0%) | 0.0 |
| College or Associate's Degree | 11 (100.0%) | 38.0 |
| Bachelor's Degree | 0 (0.0%) | 0.0 |
| Graduate Degree | 0 (0.0%) | 0.0 |
| Total | 11 (100.0%) | 18.0 |
Fertility by Education by Marriage Status in Hamilton City
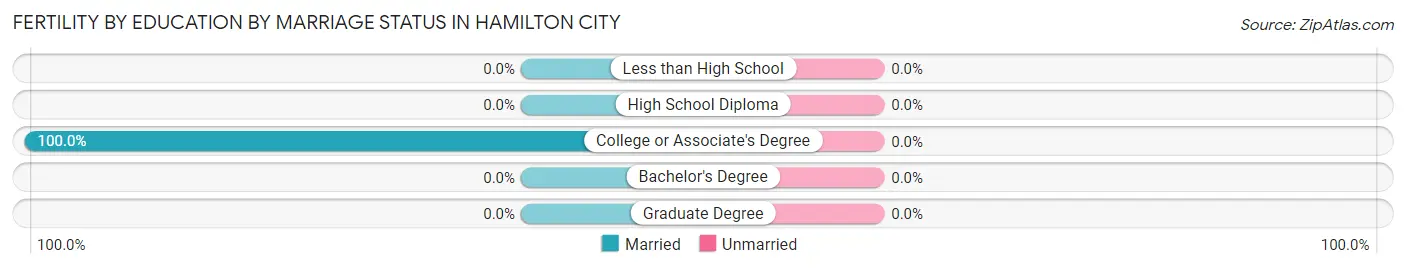
| Educational Attainment | Married | Unmarried |
| Less than High School | 0 (0.0%) | 0 (0.0%) |
| High School Diploma | 0 (0.0%) | 0 (0.0%) |
| College or Associate's Degree | 11 (100.0%) | 0 (0.0%) |
| Bachelor's Degree | 0 (0.0%) | 0 (0.0%) |
| Graduate Degree | 0 (0.0%) | 0 (0.0%) |
| Total | 11 (100.0%) | 0 (0.0%) |
Employment Characteristics in Hamilton City
Employment by Class of Employer in Hamilton City
Among the 1,073 employed individuals in Hamilton City, private company employees (952 | 88.7%), not-for-profit organizations (38 | 3.5%), and state government employees (33 | 3.1%) make up the most common classes of employment.
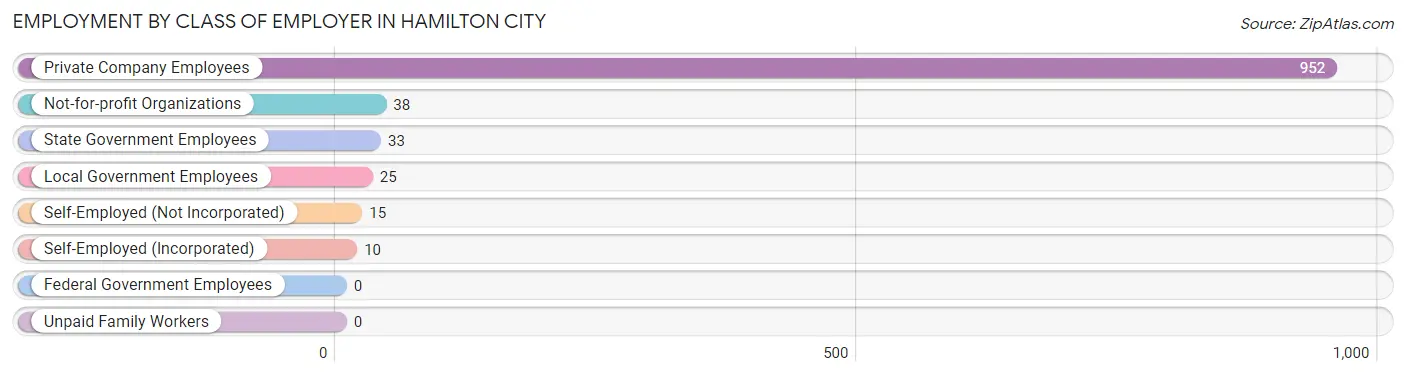
| Employer Class | # Employees | % Employees |
| Private Company Employees | 952 | 88.7% |
| Self-Employed (Incorporated) | 10 | 0.9% |
| Self-Employed (Not Incorporated) | 15 | 1.4% |
| Not-for-profit Organizations | 38 | 3.5% |
| Local Government Employees | 25 | 2.3% |
| State Government Employees | 33 | 3.1% |
| Federal Government Employees | 0 | 0.0% |
| Unpaid Family Workers | 0 | 0.0% |
| Total | 1,073 | 100.0% |
Employment Status by Age in Hamilton City
According to the labor force statistics for Hamilton City, out of the total population over 16 years of age (1,781), 66.9% or 1,191 individuals are in the labor force, with 10.0% or 119 of them unemployed. The age group with the highest labor force participation rate is 20 to 24 years, with 96.0% or 334 individuals in the labor force. Within the labor force, the 16 to 19 years age range has the highest percentage of unemployed individuals, with 26.0% or 20 of them being unemployed.
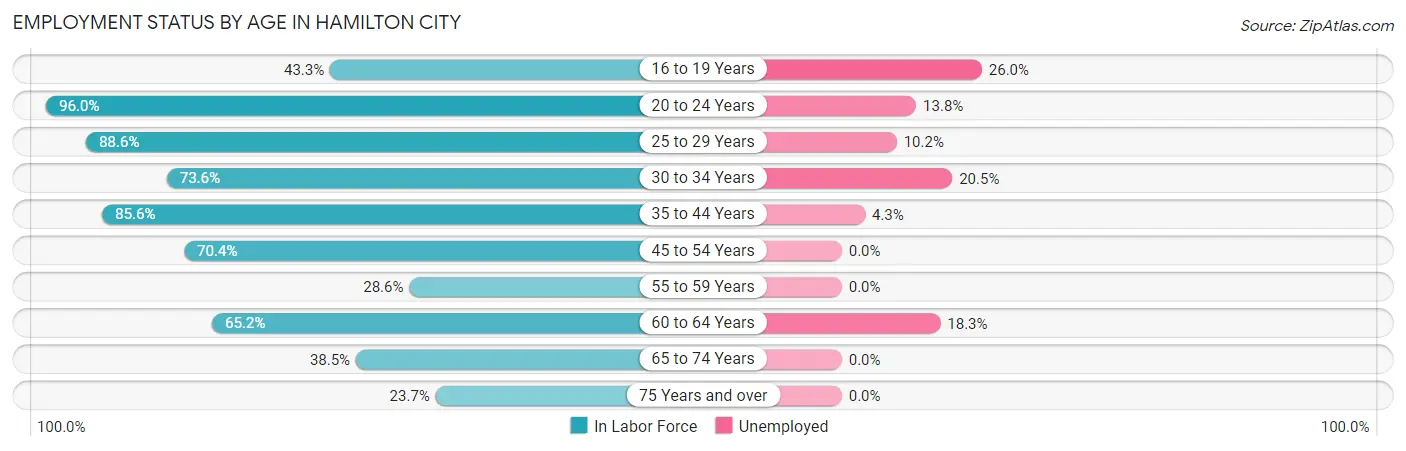
| Age Bracket | In Labor Force | Unemployed |
| 16 to 19 Years | 77 (43.3%) | 20 (26.0%) |
| 20 to 24 Years | 334 (96.0%) | 46 (13.8%) |
| 25 to 29 Years | 186 (88.6%) | 19 (10.2%) |
| 30 to 34 Years | 78 (73.6%) | 16 (20.5%) |
| 35 to 44 Years | 161 (85.6%) | 7 (4.3%) |
| 45 to 54 Years | 159 (70.4%) | 0 (0.0%) |
| 55 to 59 Years | 44 (28.6%) | 0 (0.0%) |
| 60 to 64 Years | 60 (65.2%) | 11 (18.3%) |
| 65 to 74 Years | 70 (38.5%) | 0 (0.0%) |
| 75 Years and over | 23 (23.7%) | 0 (0.0%) |
| Total | 1,191 (66.9%) | 119 (10.0%) |
Employment Status by Educational Attainment in Hamilton City
According to labor force statistics for Hamilton City, 70.5% of individuals (688) out of the total population between 25 and 64 years of age (976) are in the labor force, with 7.7% or 53 of them being unemployed. The group with the highest labor force participation rate are those with the educational attainment of bachelor's degree or higher, with 100.0% or 32 individuals in the labor force. Within the labor force, individuals with high school diploma education have the highest percentage of unemployment, with 12.1% or 23 of them being unemployed.
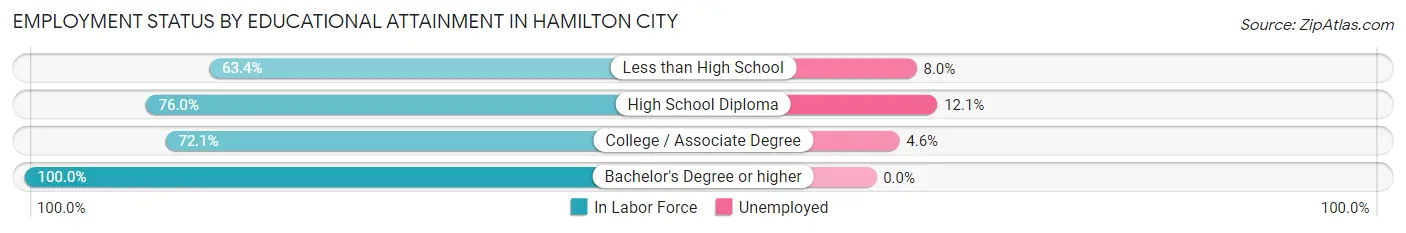
| Educational Attainment | In Labor Force | Unemployed |
| Less than High School | 249 (63.4%) | 31 (8.0%) |
| High School Diploma | 190 (76.0%) | 30 (12.1%) |
| College / Associate Degree | 217 (72.1%) | 14 (4.6%) |
| Bachelor's Degree or higher | 32 (100.0%) | 0 (0.0%) |
| Total | 688 (70.5%) | 75 (7.7%) |
Employment Occupations by Sex in Hamilton City
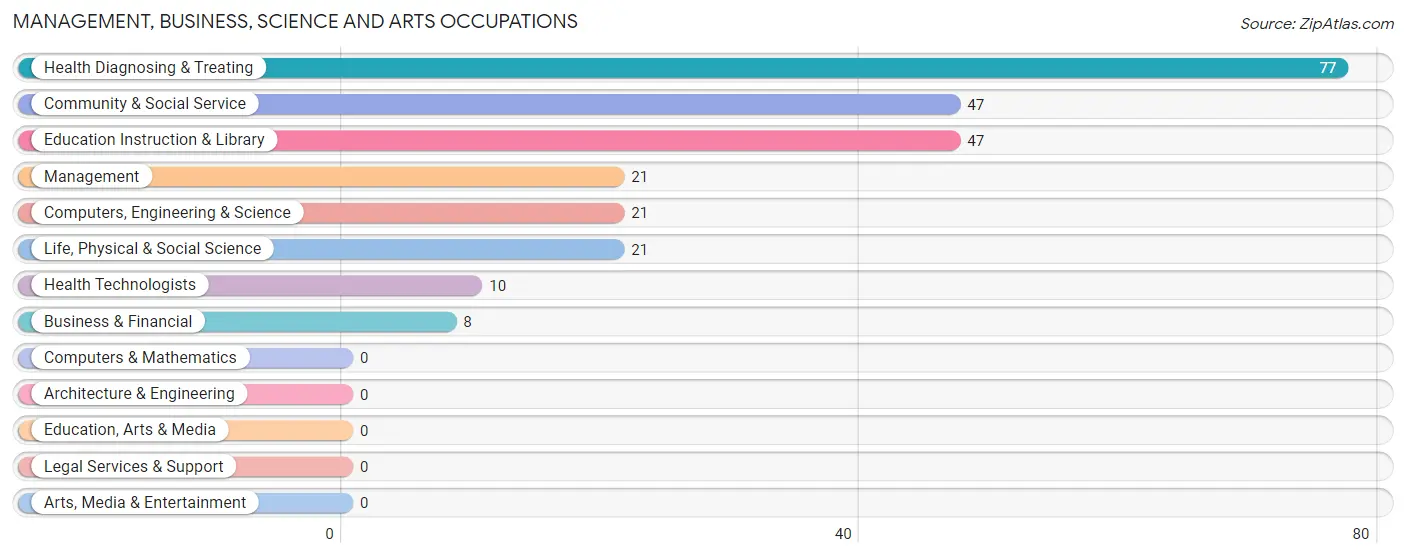
Management, Business, Science and Arts Occupations
The most common Management, Business, Science and Arts occupations in Hamilton City are Health Diagnosing & Treating (77 | 7.2%), Community & Social Service (47 | 4.4%), Education Instruction & Library (47 | 4.4%), Management (21 | 2.0%), and Computers, Engineering & Science (21 | 2.0%).
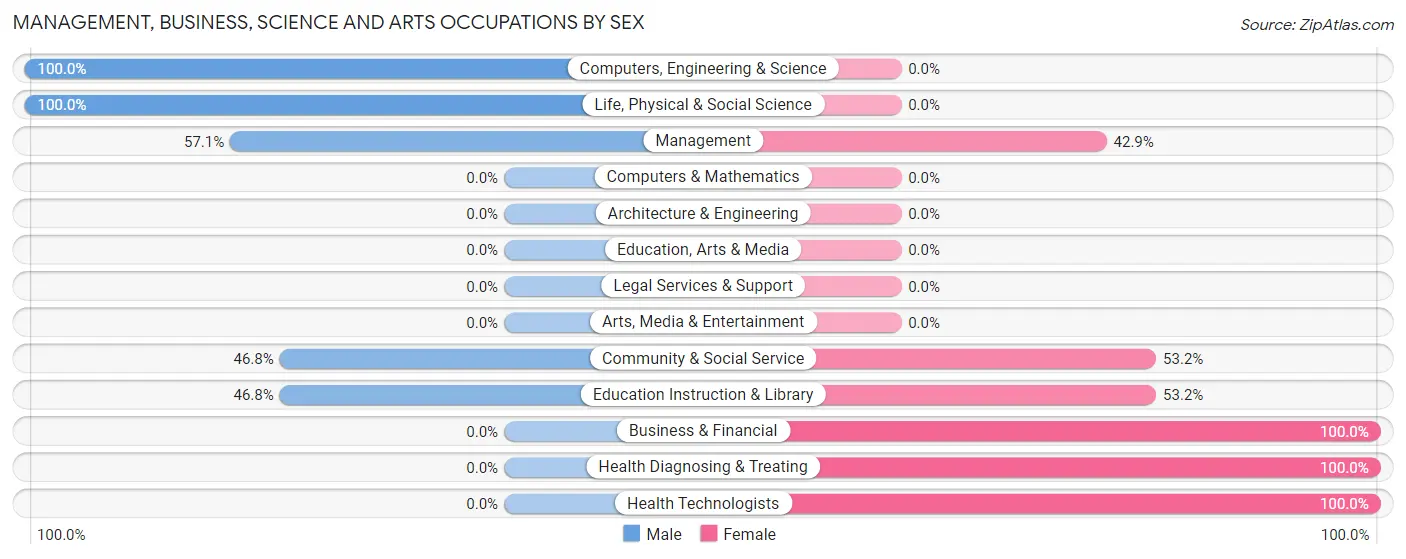
Management, Business, Science and Arts Occupations by Sex
Within the Management, Business, Science and Arts occupations in Hamilton City, the most male-oriented occupations are Computers, Engineering & Science (100.0%), Life, Physical & Social Science (100.0%), and Management (57.1%), while the most female-oriented occupations are Business & Financial (100.0%), Health Diagnosing & Treating (100.0%), and Health Technologists (100.0%).
| Occupation | Male | Female |
| Management | 12 (57.1%) | 9 (42.9%) |
| Business & Financial | 0 (0.0%) | 8 (100.0%) |
| Computers, Engineering & Science | 21 (100.0%) | 0 (0.0%) |
| Computers & Mathematics | 0 (0.0%) | 0 (0.0%) |
| Architecture & Engineering | 0 (0.0%) | 0 (0.0%) |
| Life, Physical & Social Science | 21 (100.0%) | 0 (0.0%) |
| Community & Social Service | 22 (46.8%) | 25 (53.2%) |
| Education, Arts & Media | 0 (0.0%) | 0 (0.0%) |
| Legal Services & Support | 0 (0.0%) | 0 (0.0%) |
| Education Instruction & Library | 22 (46.8%) | 25 (53.2%) |
| Arts, Media & Entertainment | 0 (0.0%) | 0 (0.0%) |
| Health Diagnosing & Treating | 0 (0.0%) | 77 (100.0%) |
| Health Technologists | 0 (0.0%) | 10 (100.0%) |
| Total (Category) | 55 (31.6%) | 119 (68.4%) |
| Total (Overall) | 566 (52.7%) | 507 (47.2%) |
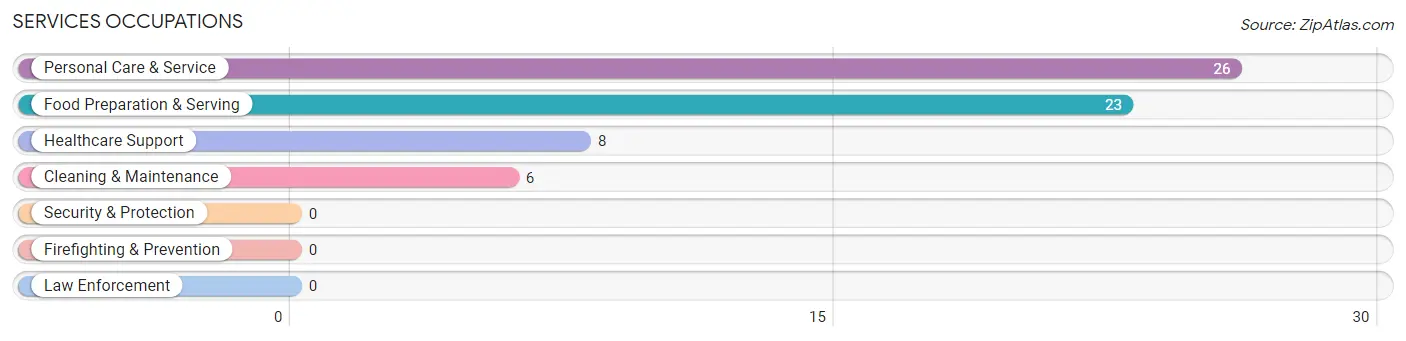
Services Occupations
The most common Services occupations in Hamilton City are Personal Care & Service (26 | 2.4%), Food Preparation & Serving (23 | 2.1%), Healthcare Support (8 | 0.7%), and Cleaning & Maintenance (6 | 0.6%).
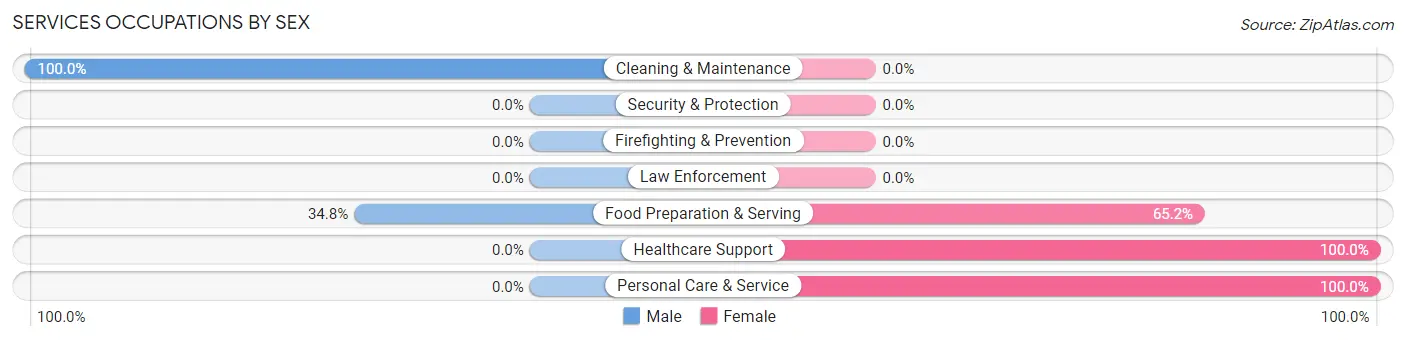
Services Occupations by Sex
Within the Services occupations in Hamilton City, the most male-oriented occupations are Cleaning & Maintenance (100.0%), and Food Preparation & Serving (34.8%), while the most female-oriented occupations are Healthcare Support (100.0%), Personal Care & Service (100.0%), and Food Preparation & Serving (65.2%).
| Occupation | Male | Female |
| Healthcare Support | 0 (0.0%) | 8 (100.0%) |
| Security & Protection | 0 (0.0%) | 0 (0.0%) |
| Firefighting & Prevention | 0 (0.0%) | 0 (0.0%) |
| Law Enforcement | 0 (0.0%) | 0 (0.0%) |
| Food Preparation & Serving | 8 (34.8%) | 15 (65.2%) |
| Cleaning & Maintenance | 6 (100.0%) | 0 (0.0%) |
| Personal Care & Service | 0 (0.0%) | 26 (100.0%) |
| Total (Category) | 14 (22.2%) | 49 (77.8%) |
| Total (Overall) | 566 (52.7%) | 507 (47.2%) |
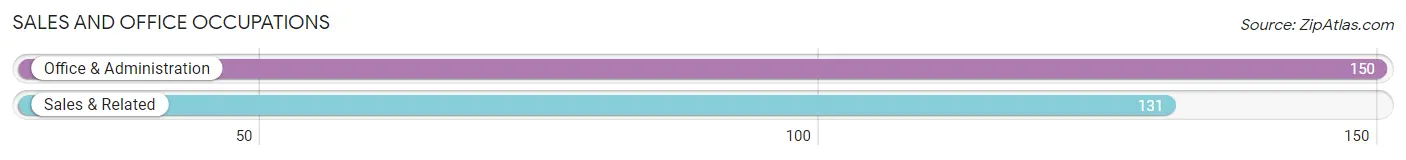
Sales and Office Occupations
The most common Sales and Office occupations in Hamilton City are Office & Administration (150 | 14.0%), and Sales & Related (131 | 12.2%).
Sales and Office Occupations by Sex
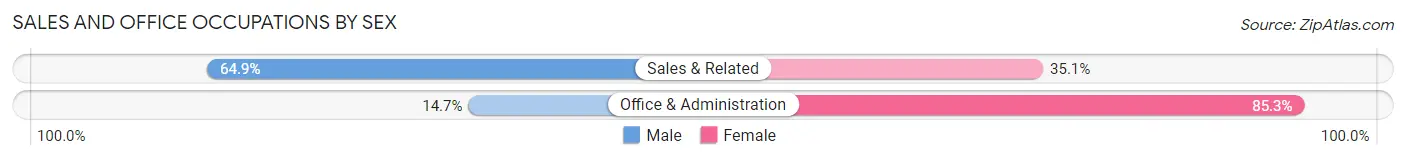
| Occupation | Male | Female |
| Sales & Related | 85 (64.9%) | 46 (35.1%) |
| Office & Administration | 22 (14.7%) | 128 (85.3%) |
| Total (Category) | 107 (38.1%) | 174 (61.9%) |
| Total (Overall) | 566 (52.7%) | 507 (47.2%) |
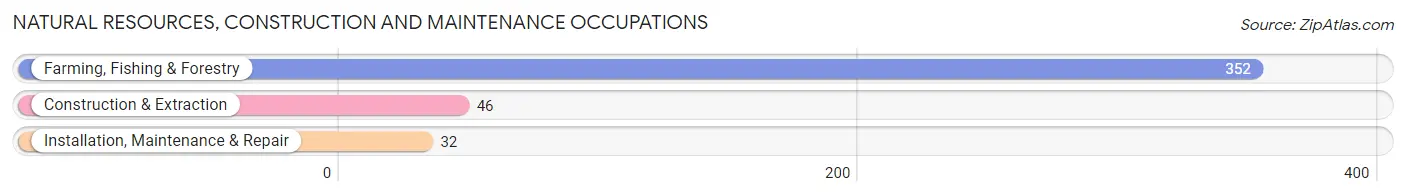
Natural Resources, Construction and Maintenance Occupations
The most common Natural Resources, Construction and Maintenance occupations in Hamilton City are Farming, Fishing & Forestry (352 | 32.8%), Construction & Extraction (46 | 4.3%), and Installation, Maintenance & Repair (32 | 3.0%).
Natural Resources, Construction and Maintenance Occupations by Sex
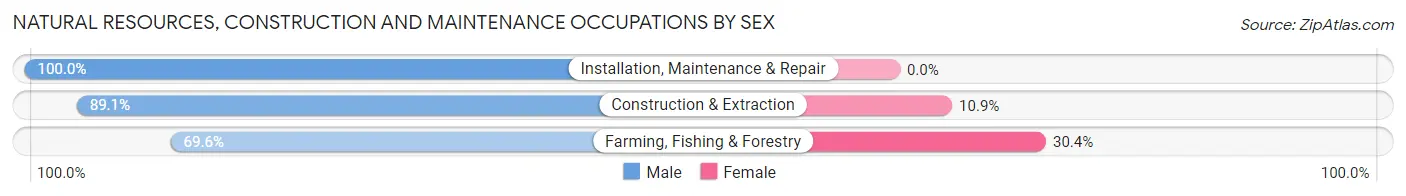
| Occupation | Male | Female |
| Farming, Fishing & Forestry | 245 (69.6%) | 107 (30.4%) |
| Construction & Extraction | 41 (89.1%) | 5 (10.9%) |
| Installation, Maintenance & Repair | 32 (100.0%) | 0 (0.0%) |
| Total (Category) | 318 (74.0%) | 112 (26.1%) |
| Total (Overall) | 566 (52.7%) | 507 (47.2%) |
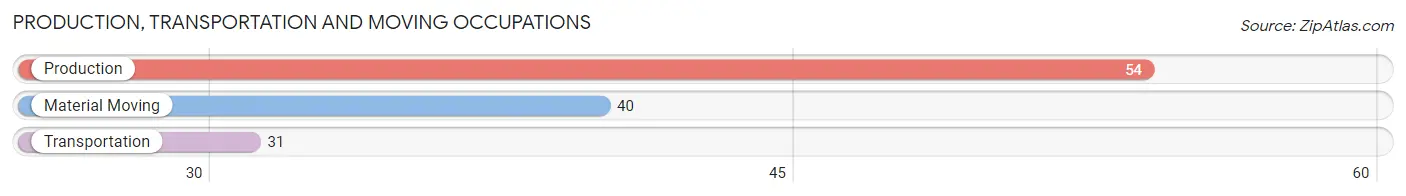
Production, Transportation and Moving Occupations
The most common Production, Transportation and Moving occupations in Hamilton City are Production (54 | 5.0%), Material Moving (40 | 3.7%), and Transportation (31 | 2.9%).
Production, Transportation and Moving Occupations by Sex
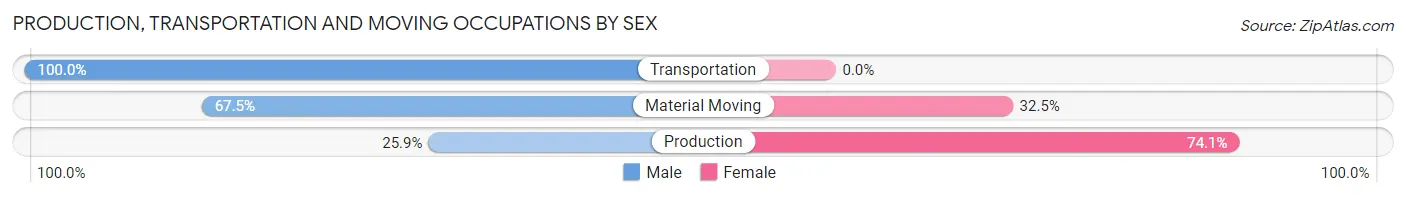
| Occupation | Male | Female |
| Production | 14 (25.9%) | 40 (74.1%) |
| Transportation | 31 (100.0%) | 0 (0.0%) |
| Material Moving | 27 (67.5%) | 13 (32.5%) |
| Total (Category) | 72 (57.6%) | 53 (42.4%) |
| Total (Overall) | 566 (52.7%) | 507 (47.2%) |
Employment Industries by Sex in Hamilton City
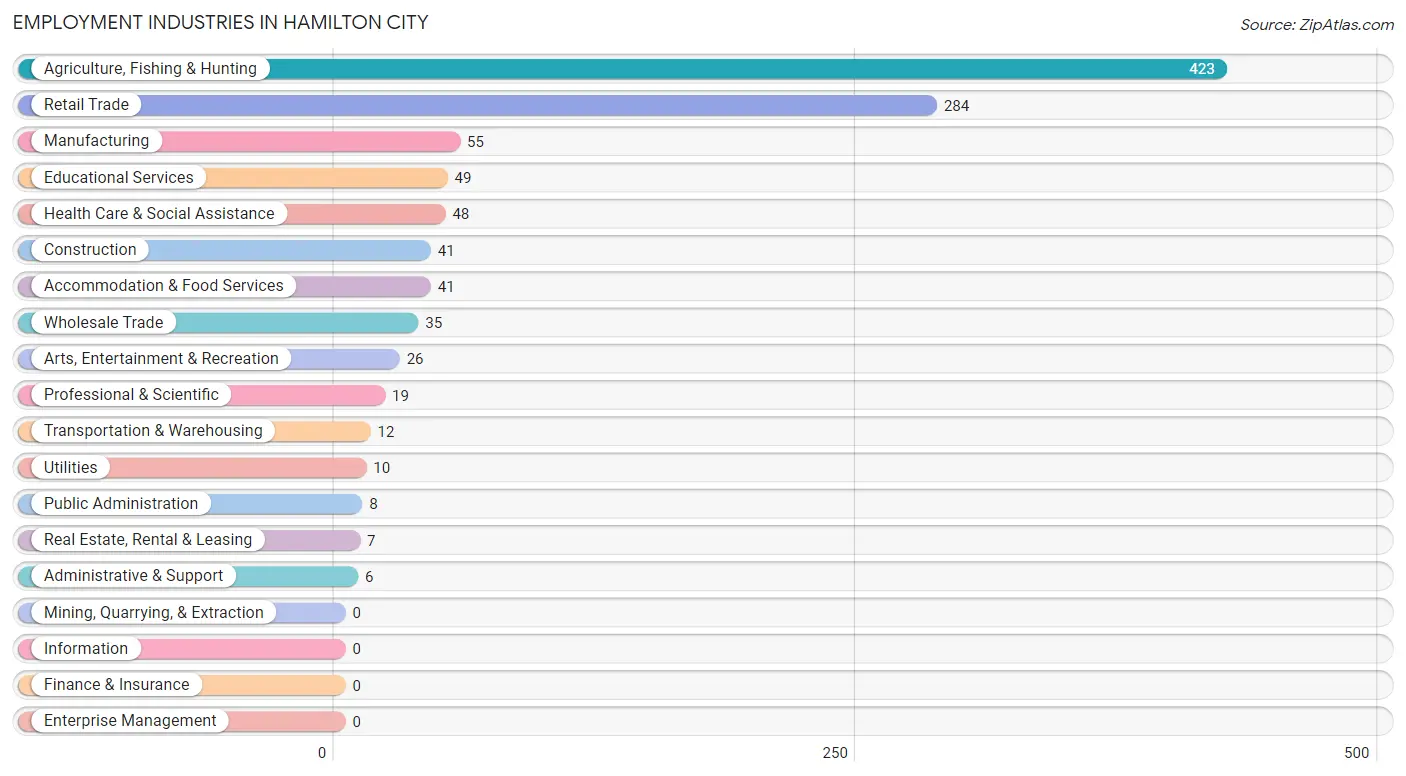
Employment Industries in Hamilton City
The major employment industries in Hamilton City include Agriculture, Fishing & Hunting (423 | 39.4%), Retail Trade (284 | 26.5%), Manufacturing (55 | 5.1%), Educational Services (49 | 4.6%), and Health Care & Social Assistance (48 | 4.5%).
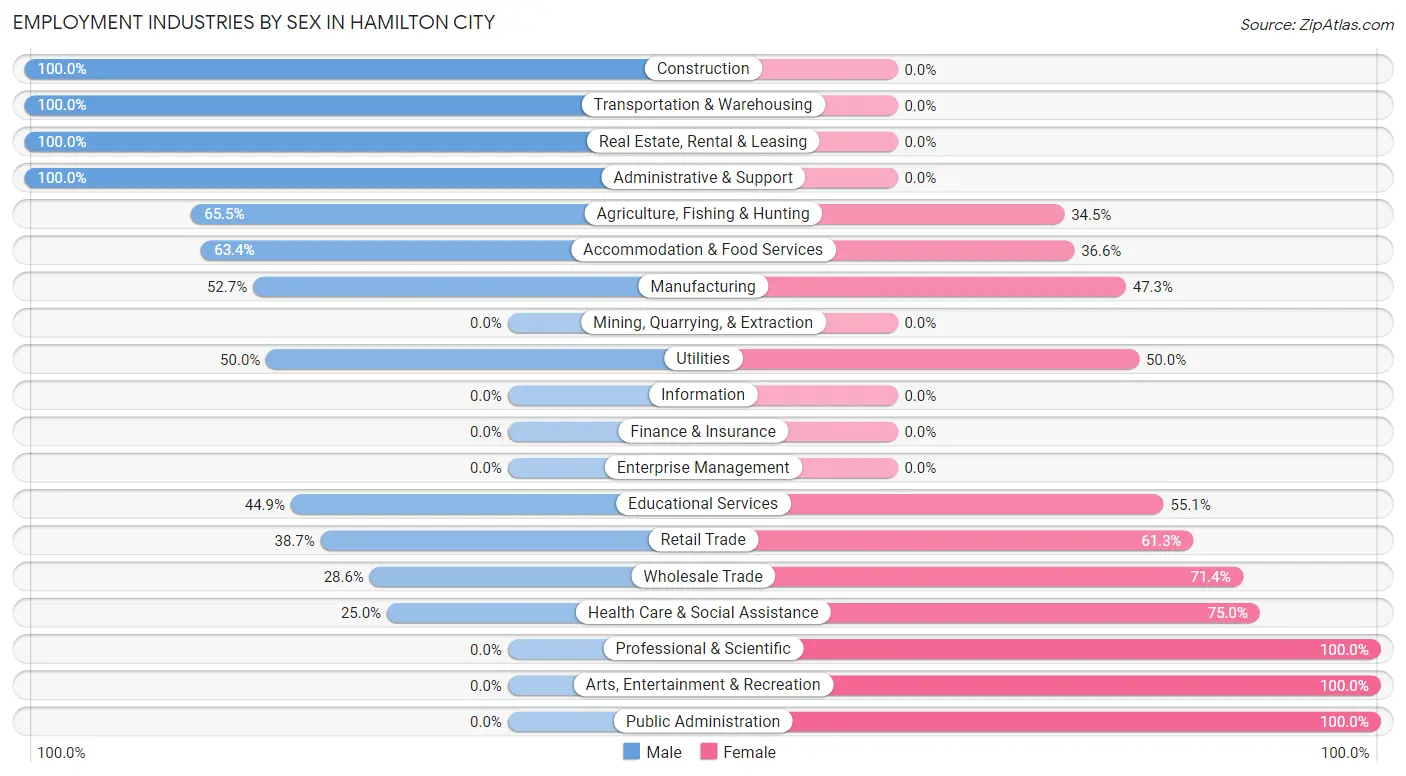
Employment Industries by Sex in Hamilton City
The Hamilton City industries that see more men than women are Construction (100.0%), Transportation & Warehousing (100.0%), and Real Estate, Rental & Leasing (100.0%), whereas the industries that tend to have a higher number of women are Professional & Scientific (100.0%), Arts, Entertainment & Recreation (100.0%), and Public Administration (100.0%).
| Industry | Male | Female |
| Agriculture, Fishing & Hunting | 277 (65.5%) | 146 (34.5%) |
| Mining, Quarrying, & Extraction | 0 (0.0%) | 0 (0.0%) |
| Construction | 41 (100.0%) | 0 (0.0%) |
| Manufacturing | 29 (52.7%) | 26 (47.3%) |
| Wholesale Trade | 10 (28.6%) | 25 (71.4%) |
| Retail Trade | 110 (38.7%) | 174 (61.3%) |
| Transportation & Warehousing | 12 (100.0%) | 0 (0.0%) |
| Utilities | 5 (50.0%) | 5 (50.0%) |
| Information | 0 (0.0%) | 0 (0.0%) |
| Finance & Insurance | 0 (0.0%) | 0 (0.0%) |
| Real Estate, Rental & Leasing | 7 (100.0%) | 0 (0.0%) |
| Professional & Scientific | 0 (0.0%) | 19 (100.0%) |
| Enterprise Management | 0 (0.0%) | 0 (0.0%) |
| Administrative & Support | 6 (100.0%) | 0 (0.0%) |
| Educational Services | 22 (44.9%) | 27 (55.1%) |
| Health Care & Social Assistance | 12 (25.0%) | 36 (75.0%) |
| Arts, Entertainment & Recreation | 0 (0.0%) | 26 (100.0%) |
| Accommodation & Food Services | 26 (63.4%) | 15 (36.6%) |
| Public Administration | 0 (0.0%) | 8 (100.0%) |
| Total | 566 (52.7%) | 507 (47.2%) |
Education in Hamilton City
School Enrollment in Hamilton City
The most common levels of schooling among the 645 students in Hamilton City are middle school (216 | 33.5%), college / undergraduate (181 | 28.1%), and elementary school (119 | 18.4%).
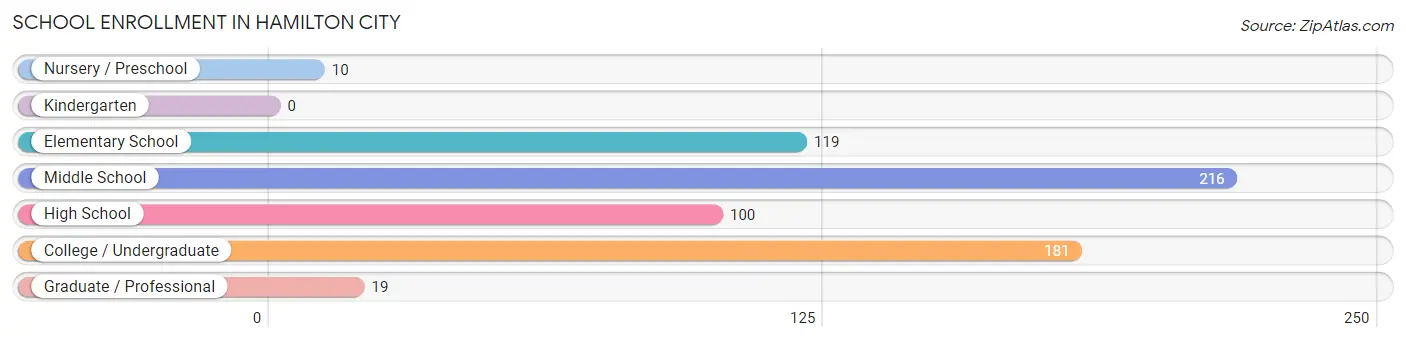
| School Level | # Students | % Students |
| Nursery / Preschool | 10 | 1.5% |
| Kindergarten | 0 | 0.0% |
| Elementary School | 119 | 18.4% |
| Middle School | 216 | 33.5% |
| High School | 100 | 15.5% |
| College / Undergraduate | 181 | 28.1% |
| Graduate / Professional | 19 | 2.9% |
| Total | 645 | 100.0% |
School Enrollment by Age by Funding Source in Hamilton City
Out of a total of 645 students who are enrolled in schools in Hamilton City, 13 (2.0%) attend a private institution, while the remaining 632 (98.0%) are enrolled in public schools. The age group of 35 years and over has the highest likelihood of being enrolled in private schools, with 13 (72.2% in the age bracket) enrolled. Conversely, the age group of 3 to 4 year olds has the lowest likelihood of being enrolled in a private school, with 10 (100.0% in the age bracket) attending a public institution.
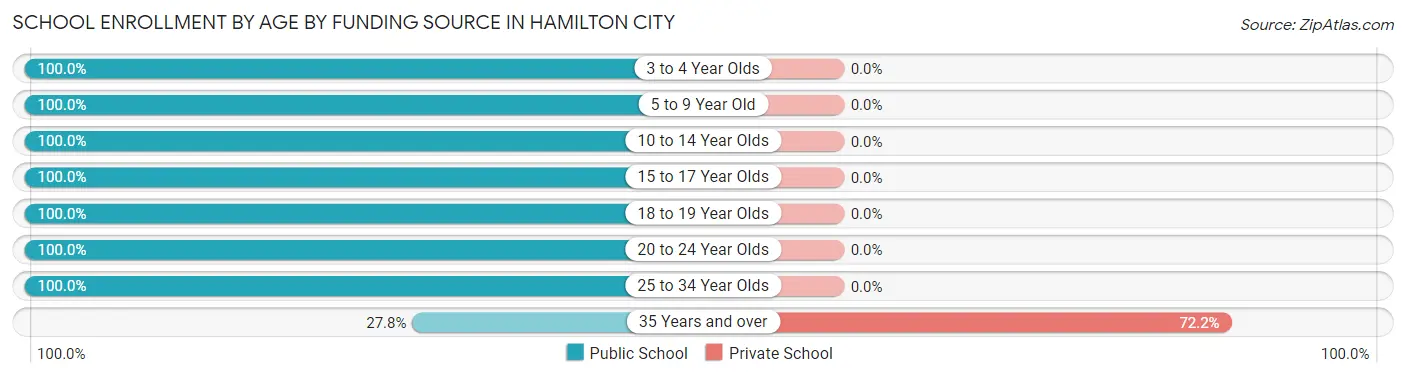
| Age Bracket | Public School | Private School |
| 3 to 4 Year Olds | 10 (100.0%) | 0 (0.0%) |
| 5 to 9 Year Old | 64 (100.0%) | 0 (0.0%) |
| 10 to 14 Year Olds | 286 (100.0%) | 0 (0.0%) |
| 15 to 17 Year Olds | 72 (100.0%) | 0 (0.0%) |
| 18 to 19 Year Olds | 91 (100.0%) | 0 (0.0%) |
| 20 to 24 Year Olds | 70 (100.0%) | 0 (0.0%) |
| 25 to 34 Year Olds | 34 (100.0%) | 0 (0.0%) |
| 35 Years and over | 5 (27.8%) | 13 (72.2%) |
| Total | 632 (98.0%) | 13 (2.0%) |
Educational Attainment by Field of Study in Hamilton City
Education (14 | 33.3%), bio, nature & agricultural (10 | 23.8%), science & technology (10 | 23.8%), and arts & humanities (8 | 19.1%) are the most common fields of study among 42 individuals in Hamilton City who have obtained a bachelor's degree or higher.
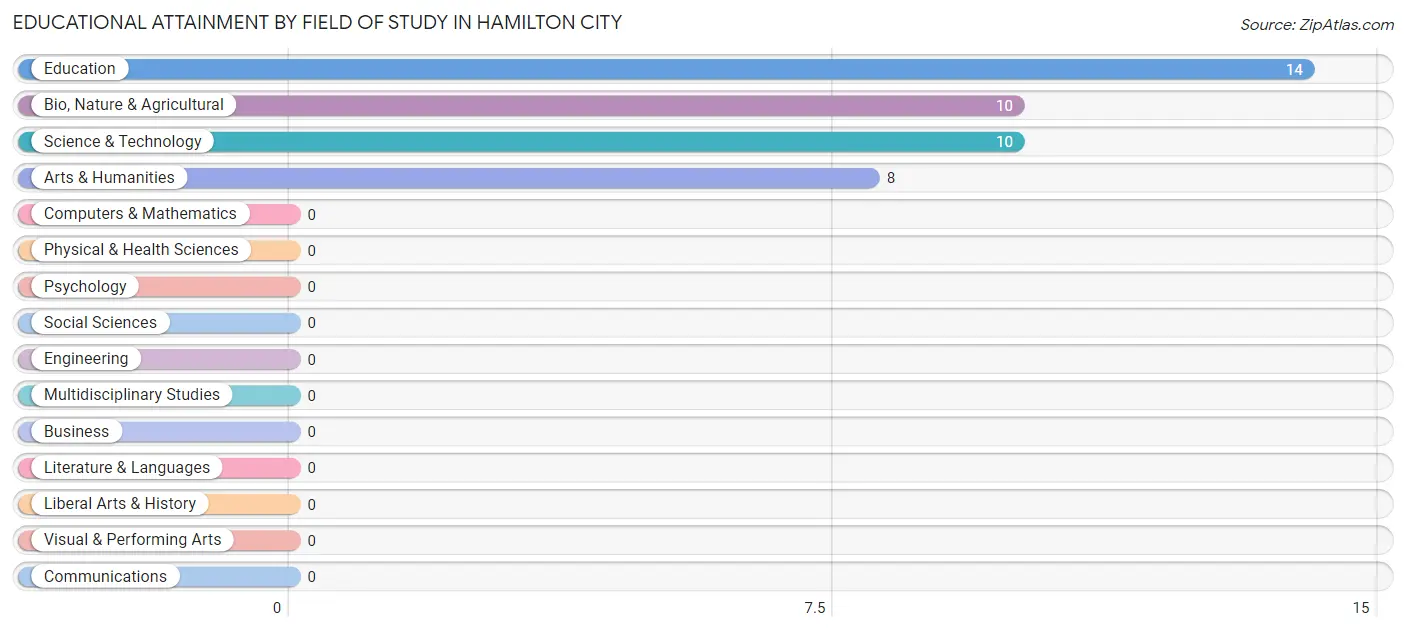
| Field of Study | # Graduates | % Graduates |
| Computers & Mathematics | 0 | 0.0% |
| Bio, Nature & Agricultural | 10 | 23.8% |
| Physical & Health Sciences | 0 | 0.0% |
| Psychology | 0 | 0.0% |
| Social Sciences | 0 | 0.0% |
| Engineering | 0 | 0.0% |
| Multidisciplinary Studies | 0 | 0.0% |
| Science & Technology | 10 | 23.8% |
| Business | 0 | 0.0% |
| Education | 14 | 33.3% |
| Literature & Languages | 0 | 0.0% |
| Liberal Arts & History | 0 | 0.0% |
| Visual & Performing Arts | 0 | 0.0% |
| Communications | 0 | 0.0% |
| Arts & Humanities | 8 | 19.1% |
| Total | 42 | 100.0% |
Transportation & Commute in Hamilton City
Vehicle Availability by Sex in Hamilton City
The most prevalent vehicle ownership categories in Hamilton City are males with 2 vehicles (324, accounting for 57.2%) and females with 2 vehicles (200, making up 63.9%).
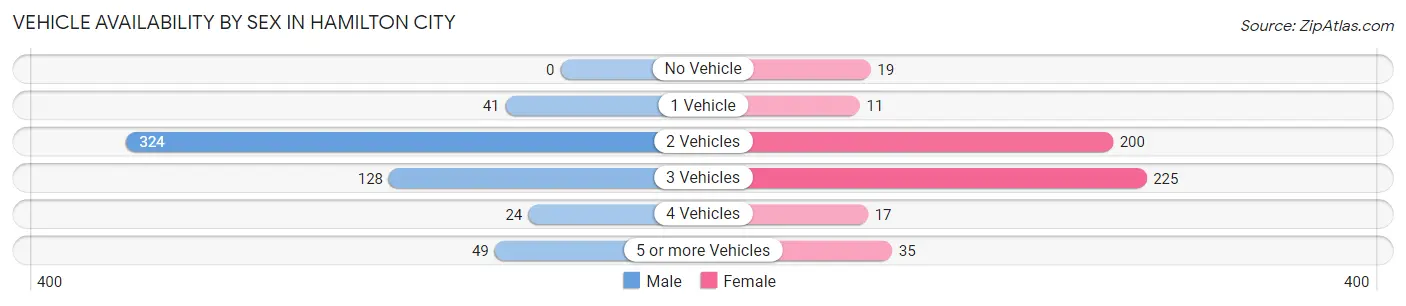
| Vehicles Available | Male | Female |
| No Vehicle | 0 (0.0%) | 19 (3.7%) |
| 1 Vehicle | 41 (7.2%) | 11 (2.2%) |
| 2 Vehicles | 324 (57.2%) | 200 (39.5%) |
| 3 Vehicles | 128 (22.6%) | 225 (44.4%) |
| 4 Vehicles | 24 (4.2%) | 17 (3.4%) |
| 5 or more Vehicles | 49 (8.7%) | 35 (6.9%) |
| Total | 566 (100.0%) | 507 (100.0%) |
Commute Time in Hamilton City
The most frequently occuring commute durations in Hamilton City are 15 to 19 minutes (384 commuters, 35.8%), 30 to 34 minutes (213 commuters, 19.9%), and 10 to 14 minutes (113 commuters, 10.5%).
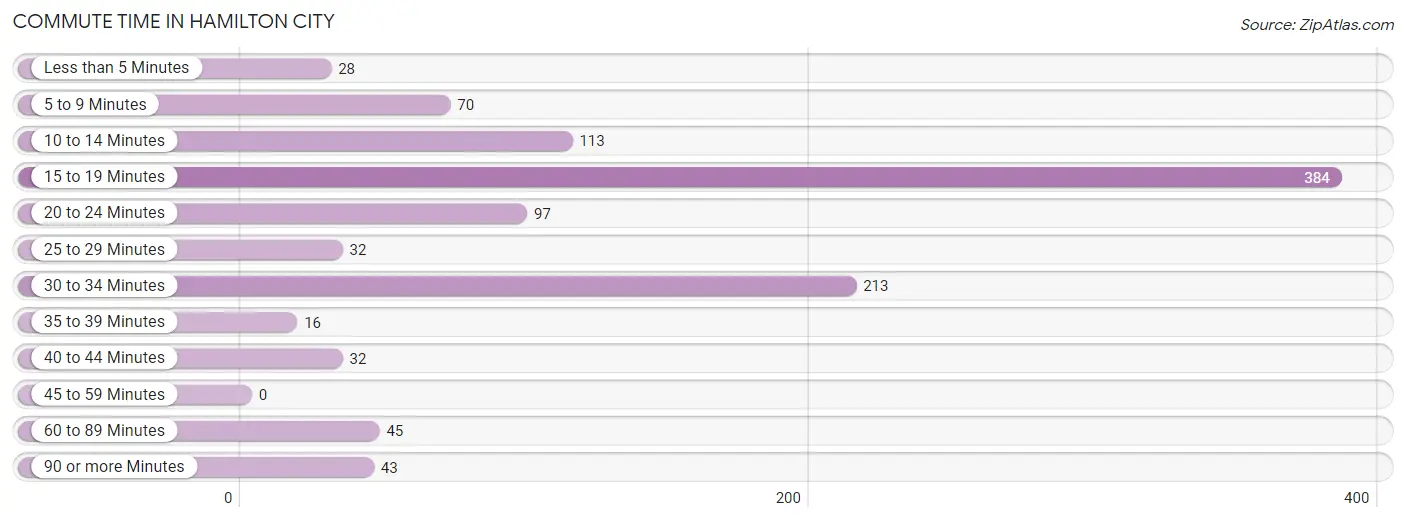
| Commute Time | # Commuters | % Commuters |
| Less than 5 Minutes | 28 | 2.6% |
| 5 to 9 Minutes | 70 | 6.5% |
| 10 to 14 Minutes | 113 | 10.5% |
| 15 to 19 Minutes | 384 | 35.8% |
| 20 to 24 Minutes | 97 | 9.0% |
| 25 to 29 Minutes | 32 | 3.0% |
| 30 to 34 Minutes | 213 | 19.9% |
| 35 to 39 Minutes | 16 | 1.5% |
| 40 to 44 Minutes | 32 | 3.0% |
| 45 to 59 Minutes | 0 | 0.0% |
| 60 to 89 Minutes | 45 | 4.2% |
| 90 or more Minutes | 43 | 4.0% |
Commute Time by Sex in Hamilton City
The most common commute times in Hamilton City are 15 to 19 minutes (163 commuters, 28.8%) for males and 15 to 19 minutes (221 commuters, 43.6%) for females.
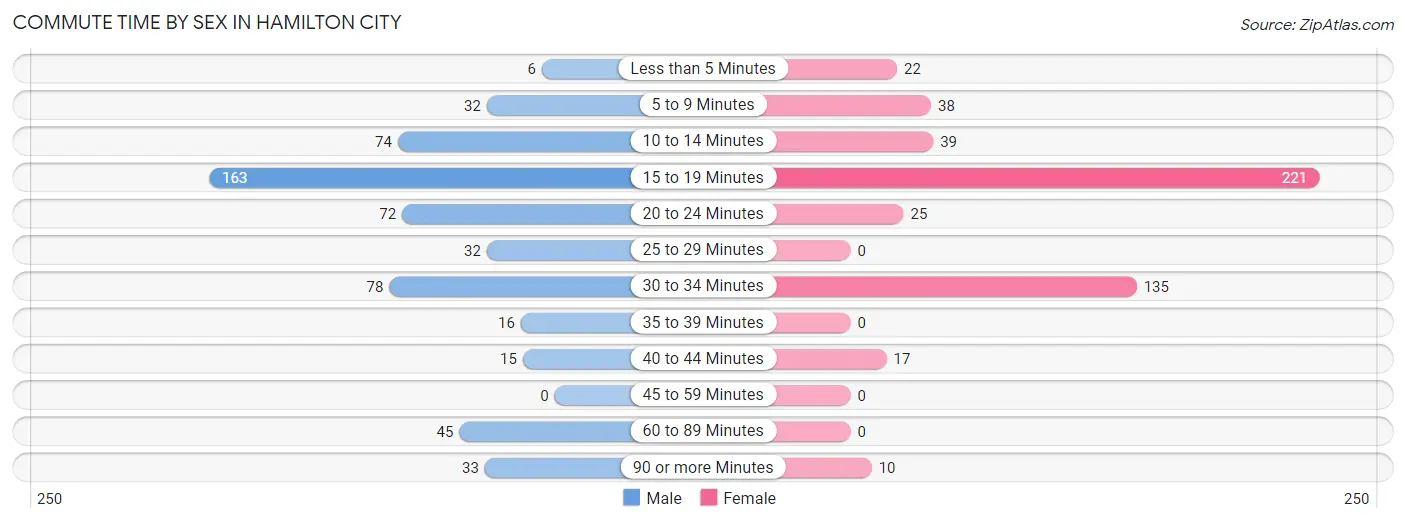
| Commute Time | Male | Female |
| Less than 5 Minutes | 6 (1.1%) | 22 (4.3%) |
| 5 to 9 Minutes | 32 (5.7%) | 38 (7.5%) |
| 10 to 14 Minutes | 74 (13.1%) | 39 (7.7%) |
| 15 to 19 Minutes | 163 (28.8%) | 221 (43.6%) |
| 20 to 24 Minutes | 72 (12.7%) | 25 (4.9%) |
| 25 to 29 Minutes | 32 (5.7%) | 0 (0.0%) |
| 30 to 34 Minutes | 78 (13.8%) | 135 (26.6%) |
| 35 to 39 Minutes | 16 (2.8%) | 0 (0.0%) |
| 40 to 44 Minutes | 15 (2.6%) | 17 (3.4%) |
| 45 to 59 Minutes | 0 (0.0%) | 0 (0.0%) |
| 60 to 89 Minutes | 45 (8.0%) | 0 (0.0%) |
| 90 or more Minutes | 33 (5.8%) | 10 (2.0%) |
Time of Departure to Work by Sex in Hamilton City
The most frequent times of departure to work in Hamilton City are 6:30 AM to 6:59 AM (118, 20.8%) for males and 7:00 AM to 7:29 AM (174, 34.3%) for females.
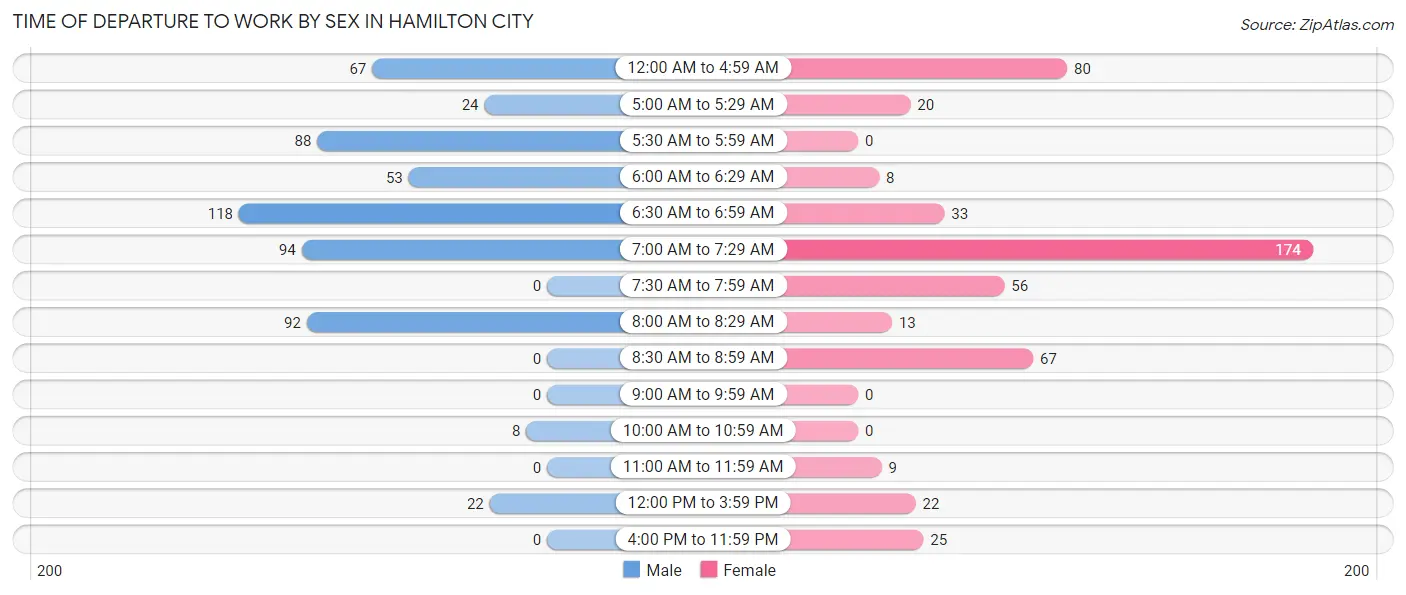
| Time of Departure | Male | Female |
| 12:00 AM to 4:59 AM | 67 (11.8%) | 80 (15.8%) |
| 5:00 AM to 5:29 AM | 24 (4.2%) | 20 (3.9%) |
| 5:30 AM to 5:59 AM | 88 (15.5%) | 0 (0.0%) |
| 6:00 AM to 6:29 AM | 53 (9.4%) | 8 (1.6%) |
| 6:30 AM to 6:59 AM | 118 (20.8%) | 33 (6.5%) |
| 7:00 AM to 7:29 AM | 94 (16.6%) | 174 (34.3%) |
| 7:30 AM to 7:59 AM | 0 (0.0%) | 56 (11.1%) |
| 8:00 AM to 8:29 AM | 92 (16.3%) | 13 (2.6%) |
| 8:30 AM to 8:59 AM | 0 (0.0%) | 67 (13.2%) |
| 9:00 AM to 9:59 AM | 0 (0.0%) | 0 (0.0%) |
| 10:00 AM to 10:59 AM | 8 (1.4%) | 0 (0.0%) |
| 11:00 AM to 11:59 AM | 0 (0.0%) | 9 (1.8%) |
| 12:00 PM to 3:59 PM | 22 (3.9%) | 22 (4.3%) |
| 4:00 PM to 11:59 PM | 0 (0.0%) | 25 (4.9%) |
| Total | 566 (100.0%) | 507 (100.0%) |
Housing Occupancy in Hamilton City
Occupancy by Ownership in Hamilton City
Of the total 768 dwellings in Hamilton City, owner-occupied units account for 458 (59.6%), while renter-occupied units make up 310 (40.4%).
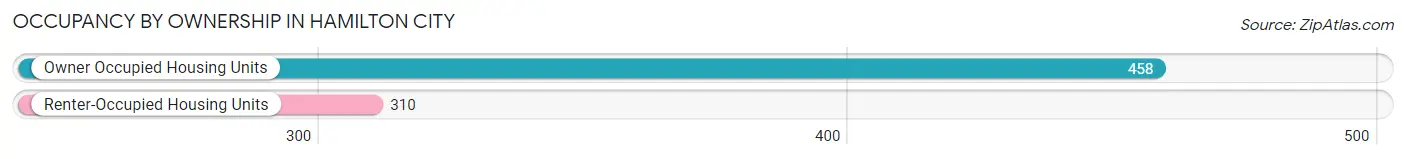
| Occupancy | # Housing Units | % Housing Units |
| Owner Occupied Housing Units | 458 | 59.6% |
| Renter-Occupied Housing Units | 310 | 40.4% |
| Total Occupied Housing Units | 768 | 100.0% |
Occupancy by Household Size in Hamilton City
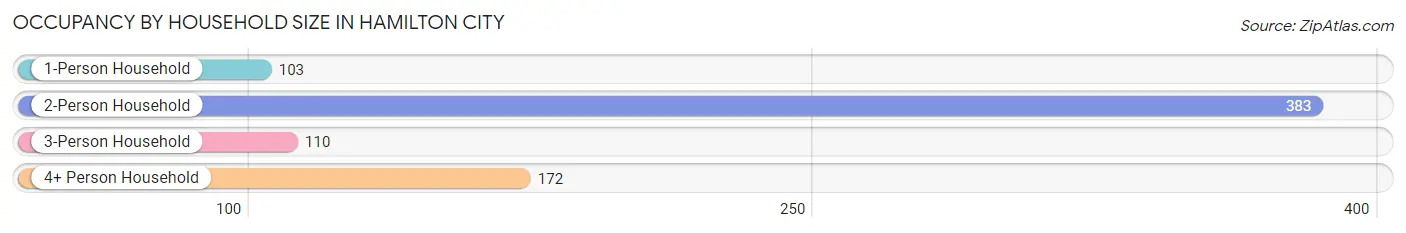
| Household Size | # Housing Units | % Housing Units |
| 1-Person Household | 103 | 13.4% |
| 2-Person Household | 383 | 49.9% |
| 3-Person Household | 110 | 14.3% |
| 4+ Person Household | 172 | 22.4% |
| Total Housing Units | 768 | 100.0% |
Occupancy by Ownership by Household Size in Hamilton City
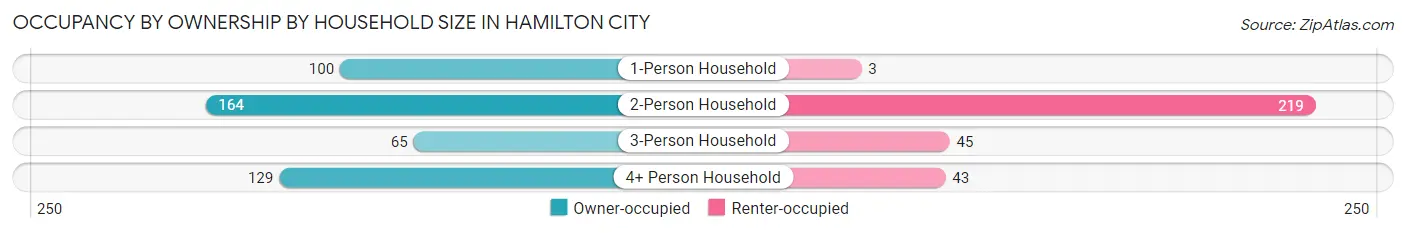
| Household Size | Owner-occupied | Renter-occupied |
| 1-Person Household | 100 (97.1%) | 3 (2.9%) |
| 2-Person Household | 164 (42.8%) | 219 (57.2%) |
| 3-Person Household | 65 (59.1%) | 45 (40.9%) |
| 4+ Person Household | 129 (75.0%) | 43 (25.0%) |
| Total Housing Units | 458 (59.6%) | 310 (40.4%) |
Occupancy by Educational Attainment in Hamilton City
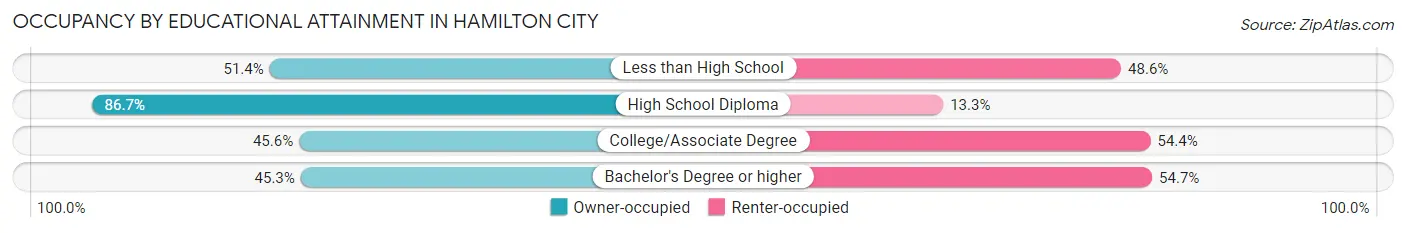
| Household Size | Owner-occupied | Renter-occupied |
| Less than High School | 162 (51.4%) | 153 (48.6%) |
| High School Diploma | 189 (86.7%) | 29 (13.3%) |
| College/Associate Degree | 83 (45.6%) | 99 (54.4%) |
| Bachelor's Degree or higher | 24 (45.3%) | 29 (54.7%) |
Occupancy by Age of Householder in Hamilton City
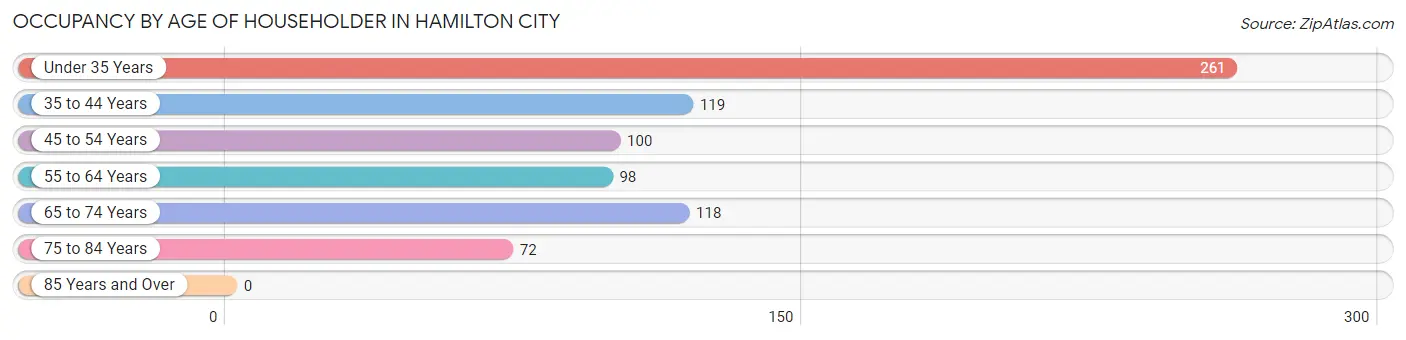
| Age Bracket | # Households | % Households |
| Under 35 Years | 261 | 34.0% |
| 35 to 44 Years | 119 | 15.5% |
| 45 to 54 Years | 100 | 13.0% |
| 55 to 64 Years | 98 | 12.8% |
| 65 to 74 Years | 118 | 15.4% |
| 75 to 84 Years | 72 | 9.4% |
| 85 Years and Over | 0 | 0.0% |
| Total | 768 | 100.0% |
Housing Finances in Hamilton City
Median Income by Occupancy in Hamilton City
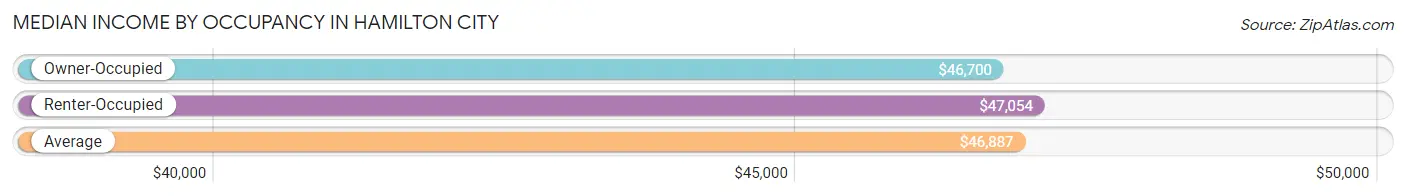
| Occupancy Type | # Households | Median Income |
| Owner-Occupied | 458 (59.6%) | $46,700 |
| Renter-Occupied | 310 (40.4%) | $47,054 |
| Average | 768 (100.0%) | $46,887 |
Occupancy by Householder Income Bracket in Hamilton City
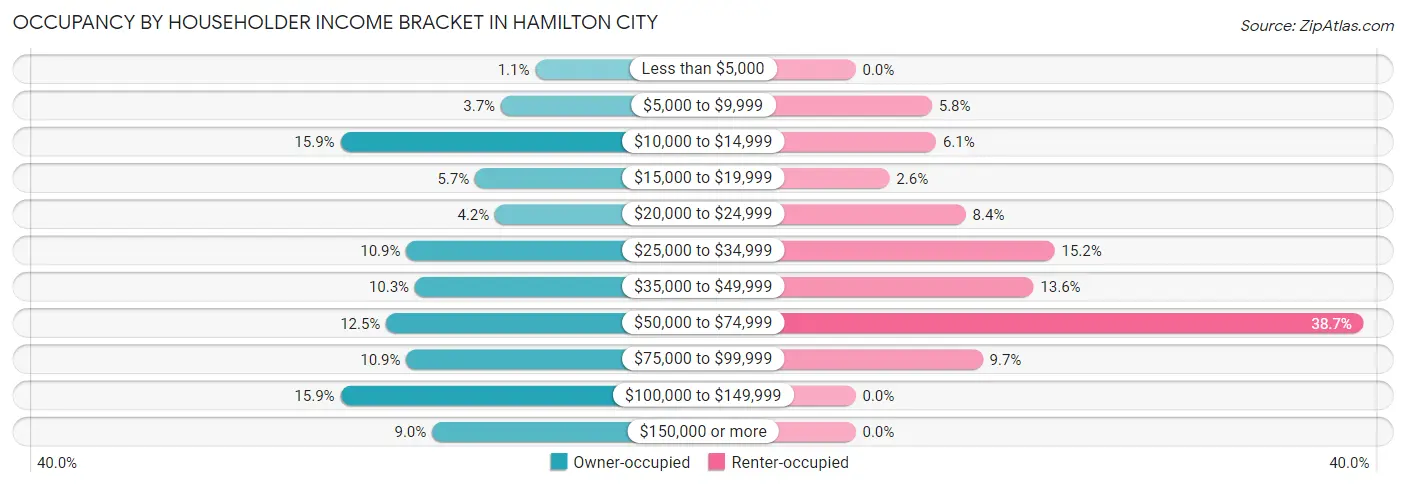
| Income Bracket | Owner-occupied | Renter-occupied |
| Less than $5,000 | 5 (1.1%) | 0 (0.0%) |
| $5,000 to $9,999 | 17 (3.7%) | 18 (5.8%) |
| $10,000 to $14,999 | 73 (15.9%) | 19 (6.1%) |
| $15,000 to $19,999 | 26 (5.7%) | 8 (2.6%) |
| $20,000 to $24,999 | 19 (4.2%) | 26 (8.4%) |
| $25,000 to $34,999 | 50 (10.9%) | 47 (15.2%) |
| $35,000 to $49,999 | 47 (10.3%) | 42 (13.6%) |
| $50,000 to $74,999 | 57 (12.4%) | 120 (38.7%) |
| $75,000 to $99,999 | 50 (10.9%) | 30 (9.7%) |
| $100,000 to $149,999 | 73 (15.9%) | 0 (0.0%) |
| $150,000 or more | 41 (8.9%) | 0 (0.0%) |
| Total | 458 (100.0%) | 310 (100.0%) |
Monthly Housing Cost Tiers in Hamilton City
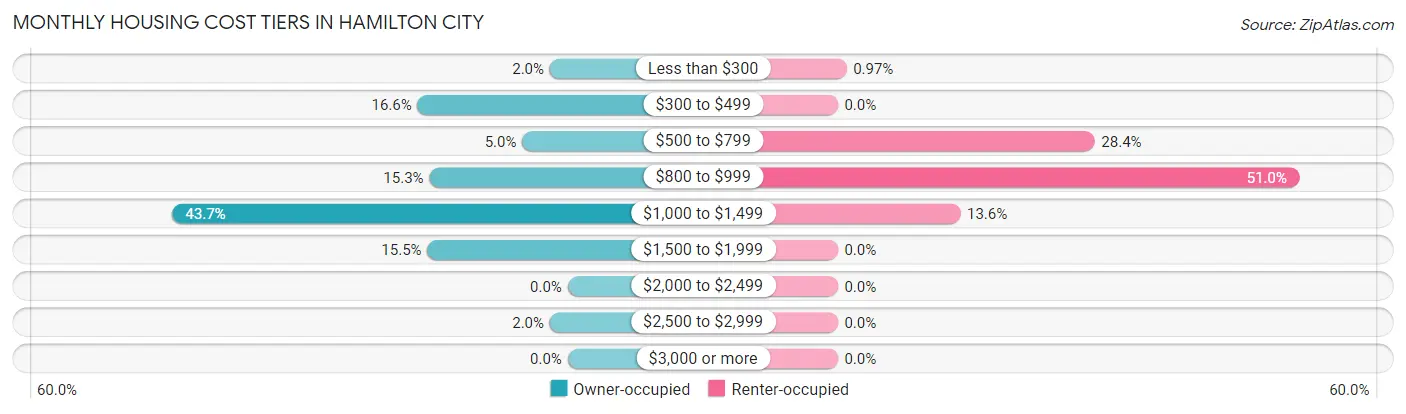
| Monthly Cost | Owner-occupied | Renter-occupied |
| Less than $300 | 9 (2.0%) | 3 (1.0%) |
| $300 to $499 | 76 (16.6%) | 0 (0.0%) |
| $500 to $799 | 23 (5.0%) | 88 (28.4%) |
| $800 to $999 | 70 (15.3%) | 158 (51.0%) |
| $1,000 to $1,499 | 200 (43.7%) | 42 (13.6%) |
| $1,500 to $1,999 | 71 (15.5%) | 0 (0.0%) |
| $2,000 to $2,499 | 0 (0.0%) | 0 (0.0%) |
| $2,500 to $2,999 | 9 (2.0%) | 0 (0.0%) |
| $3,000 or more | 0 (0.0%) | 0 (0.0%) |
| Total | 458 (100.0%) | 310 (100.0%) |
Physical Housing Characteristics in Hamilton City
Housing Structures in Hamilton City
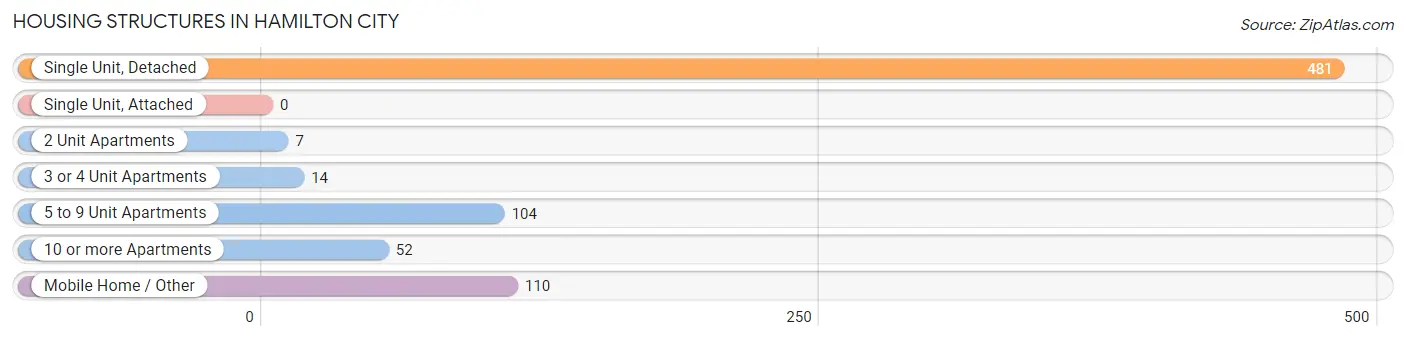
| Structure Type | # Housing Units | % Housing Units |
| Single Unit, Detached | 481 | 62.6% |
| Single Unit, Attached | 0 | 0.0% |
| 2 Unit Apartments | 7 | 0.9% |
| 3 or 4 Unit Apartments | 14 | 1.8% |
| 5 to 9 Unit Apartments | 104 | 13.5% |
| 10 or more Apartments | 52 | 6.8% |
| Mobile Home / Other | 110 | 14.3% |
| Total | 768 | 100.0% |
Housing Structures by Occupancy in Hamilton City
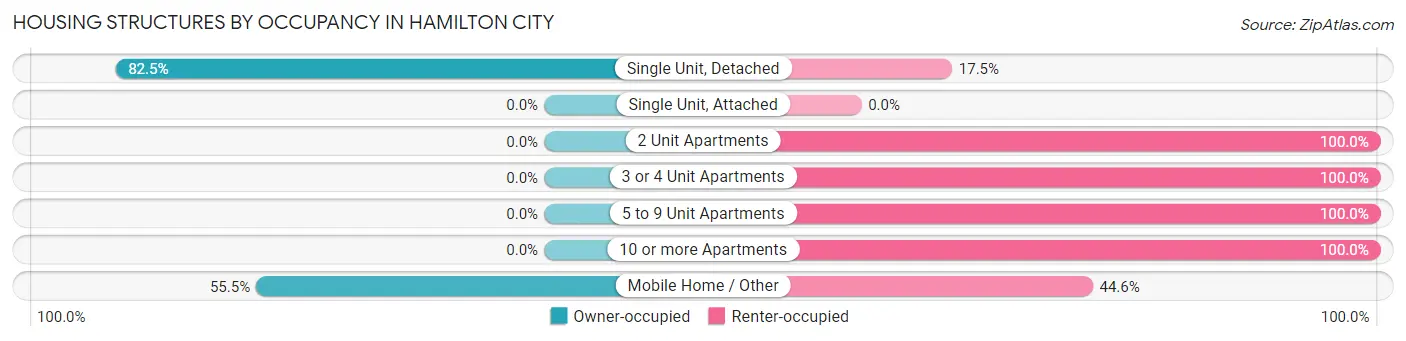
| Structure Type | Owner-occupied | Renter-occupied |
| Single Unit, Detached | 397 (82.5%) | 84 (17.5%) |
| Single Unit, Attached | 0 (0.0%) | 0 (0.0%) |
| 2 Unit Apartments | 0 (0.0%) | 7 (100.0%) |
| 3 or 4 Unit Apartments | 0 (0.0%) | 14 (100.0%) |
| 5 to 9 Unit Apartments | 0 (0.0%) | 104 (100.0%) |
| 10 or more Apartments | 0 (0.0%) | 52 (100.0%) |
| Mobile Home / Other | 61 (55.4%) | 49 (44.6%) |
| Total | 458 (59.6%) | 310 (40.4%) |
Housing Structures by Number of Rooms in Hamilton City
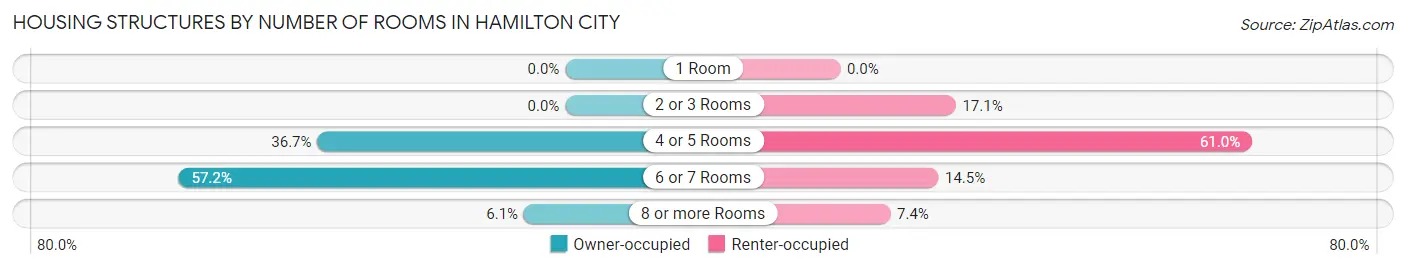
| Number of Rooms | Owner-occupied | Renter-occupied |
| 1 Room | 0 (0.0%) | 0 (0.0%) |
| 2 or 3 Rooms | 0 (0.0%) | 53 (17.1%) |
| 4 or 5 Rooms | 168 (36.7%) | 189 (61.0%) |
| 6 or 7 Rooms | 262 (57.2%) | 45 (14.5%) |
| 8 or more Rooms | 28 (6.1%) | 23 (7.4%) |
| Total | 458 (100.0%) | 310 (100.0%) |
Housing Structure by Heating Type in Hamilton City
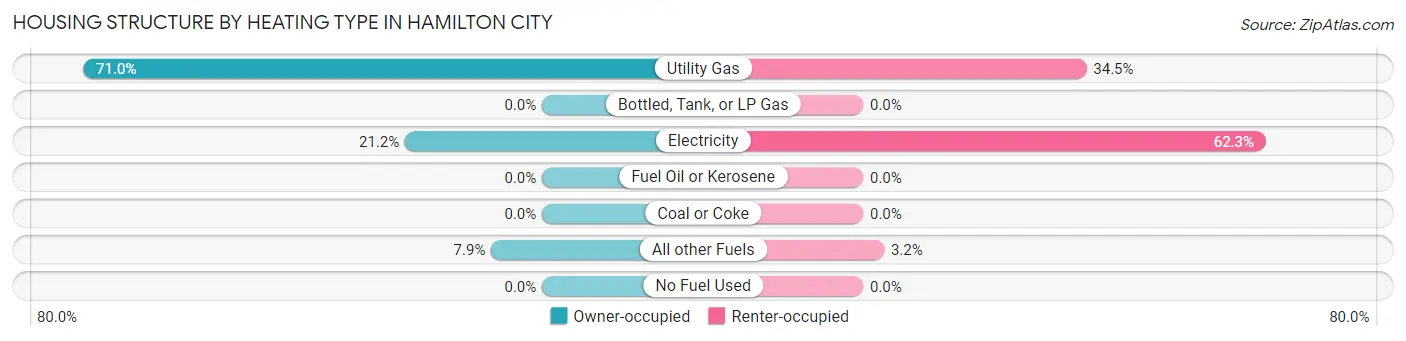
| Heating Type | Owner-occupied | Renter-occupied |
| Utility Gas | 325 (71.0%) | 107 (34.5%) |
| Bottled, Tank, or LP Gas | 0 (0.0%) | 0 (0.0%) |
| Electricity | 97 (21.2%) | 193 (62.3%) |
| Fuel Oil or Kerosene | 0 (0.0%) | 0 (0.0%) |
| Coal or Coke | 0 (0.0%) | 0 (0.0%) |
| All other Fuels | 36 (7.9%) | 10 (3.2%) |
| No Fuel Used | 0 (0.0%) | 0 (0.0%) |
| Total | 458 (100.0%) | 310 (100.0%) |
Household Vehicle Usage in Hamilton City
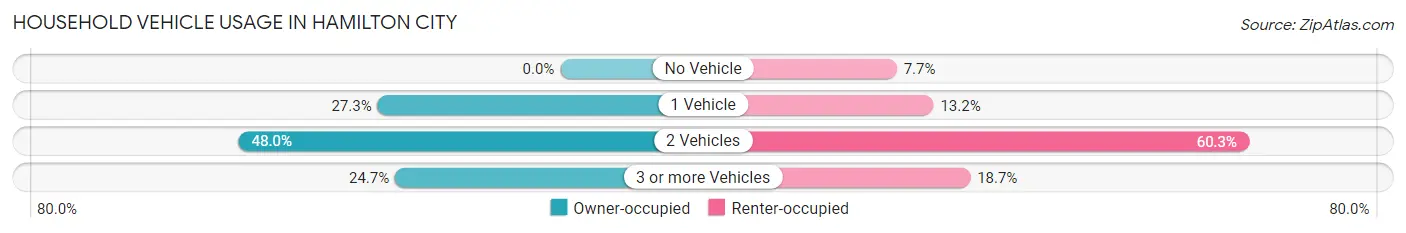
| Vehicles per Household | Owner-occupied | Renter-occupied |
| No Vehicle | 0 (0.0%) | 24 (7.7%) |
| 1 Vehicle | 125 (27.3%) | 41 (13.2%) |
| 2 Vehicles | 220 (48.0%) | 187 (60.3%) |
| 3 or more Vehicles | 113 (24.7%) | 58 (18.7%) |
| Total | 458 (100.0%) | 310 (100.0%) |
Real Estate & Mortgages in Hamilton City
Real Estate and Mortgage Overview in Hamilton City
| Characteristic | Without Mortgage | With Mortgage |
| Housing Units | 148 | 310 |
| Median Property Value | $271,800 | $278,900 |
| Median Household Income | $30,652 | $32 |
| Monthly Housing Costs | $548 | $0 |
| Real Estate Taxes | $1,724 | $0 |
Property Value by Mortgage Status in Hamilton City
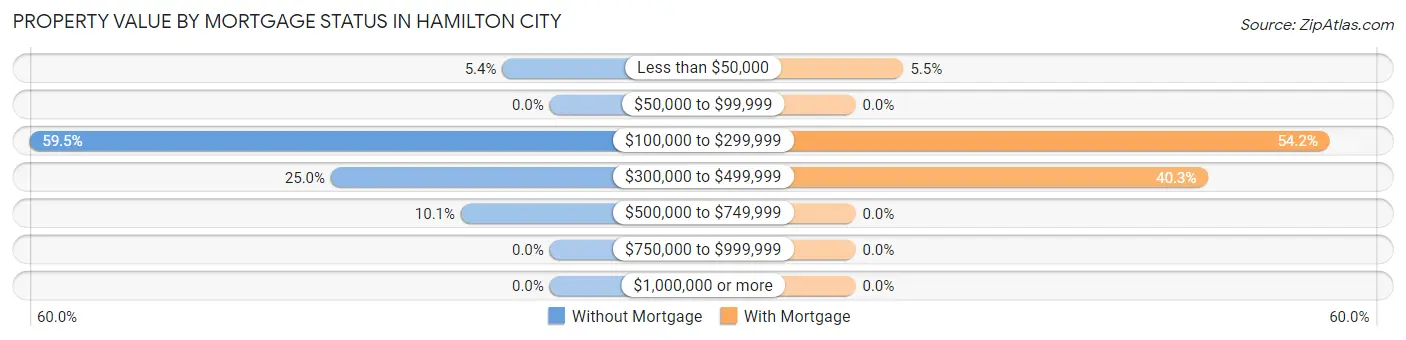
| Property Value | Without Mortgage | With Mortgage |
| Less than $50,000 | 8 (5.4%) | 17 (5.5%) |
| $50,000 to $99,999 | 0 (0.0%) | 0 (0.0%) |
| $100,000 to $299,999 | 88 (59.5%) | 168 (54.2%) |
| $300,000 to $499,999 | 37 (25.0%) | 125 (40.3%) |
| $500,000 to $749,999 | 15 (10.1%) | 0 (0.0%) |
| $750,000 to $999,999 | 0 (0.0%) | 0 (0.0%) |
| $1,000,000 or more | 0 (0.0%) | 0 (0.0%) |
| Total | 148 (100.0%) | 310 (100.0%) |
Household Income by Mortgage Status in Hamilton City
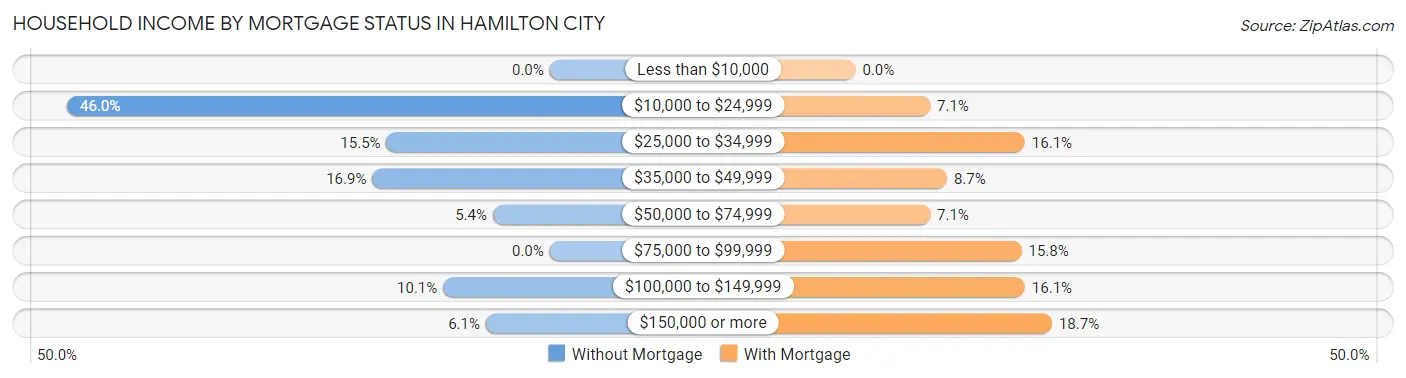
| Household Income | Without Mortgage | With Mortgage |
| Less than $10,000 | 0 (0.0%) | 0 (0.0%) |
| $10,000 to $24,999 | 68 (46.0%) | 22 (7.1%) |
| $25,000 to $34,999 | 23 (15.5%) | 50 (16.1%) |
| $35,000 to $49,999 | 25 (16.9%) | 27 (8.7%) |
| $50,000 to $74,999 | 8 (5.4%) | 22 (7.1%) |
| $75,000 to $99,999 | 0 (0.0%) | 49 (15.8%) |
| $100,000 to $149,999 | 15 (10.1%) | 50 (16.1%) |
| $150,000 or more | 9 (6.1%) | 58 (18.7%) |
| Total | 148 (100.0%) | 310 (100.0%) |
Property Value to Household Income Ratio in Hamilton City
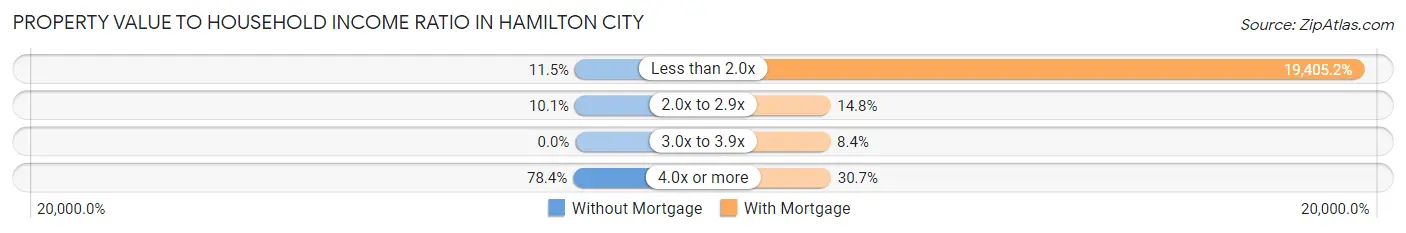
| Value-to-Income Ratio | Without Mortgage | With Mortgage |
| Less than 2.0x | 17 (11.5%) | 60,156 (19,405.2%) |
| 2.0x to 2.9x | 15 (10.1%) | 46 (14.8%) |
| 3.0x to 3.9x | 0 (0.0%) | 26 (8.4%) |
| 4.0x or more | 116 (78.4%) | 95 (30.6%) |
| Total | 148 (100.0%) | 310 (100.0%) |
Real Estate Taxes by Mortgage Status in Hamilton City
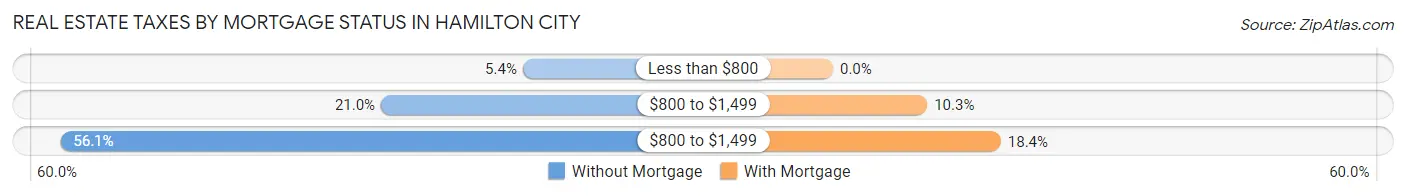
| Property Taxes | Without Mortgage | With Mortgage |
| Less than $800 | 8 (5.4%) | 0 (0.0%) |
| $800 to $1,499 | 31 (20.9%) | 32 (10.3%) |
| $800 to $1,499 | 83 (56.1%) | 57 (18.4%) |
| Total | 148 (100.0%) | 310 (100.0%) |
Health & Disability in Hamilton City
Health Insurance Coverage by Age in Hamilton City
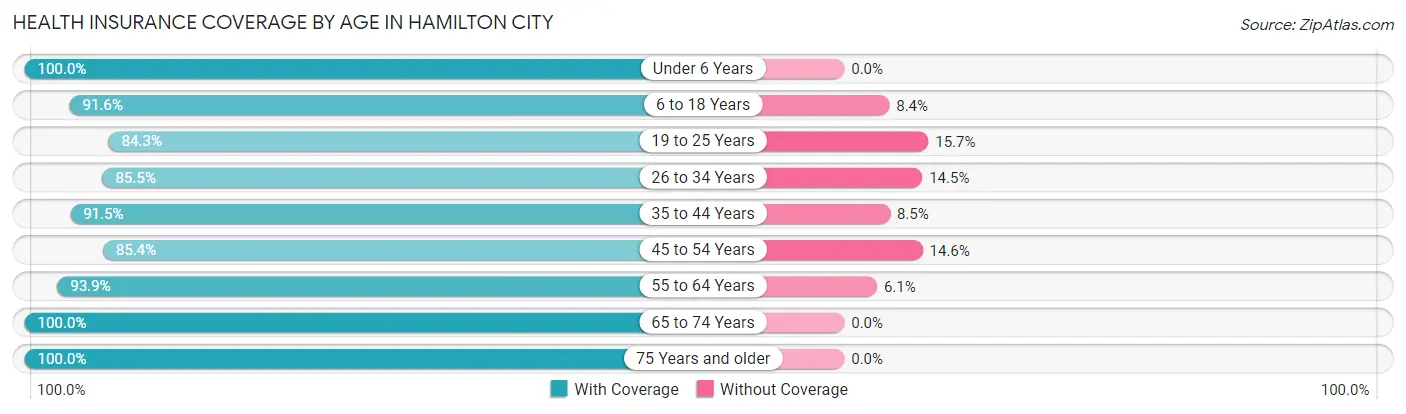
| Age Bracket | With Coverage | Without Coverage |
| Under 6 Years | 51 (100.0%) | 0 (0.0%) |
| 6 to 18 Years | 426 (91.6%) | 39 (8.4%) |
| 19 to 25 Years | 377 (84.3%) | 70 (15.7%) |
| 26 to 34 Years | 247 (85.5%) | 42 (14.5%) |
| 35 to 44 Years | 172 (91.5%) | 16 (8.5%) |
| 45 to 54 Years | 193 (85.4%) | 33 (14.6%) |
| 55 to 64 Years | 231 (93.9%) | 15 (6.1%) |
| 65 to 74 Years | 182 (100.0%) | 0 (0.0%) |
| 75 Years and older | 97 (100.0%) | 0 (0.0%) |
| Total | 1,976 (90.2%) | 215 (9.8%) |
Health Insurance Coverage by Citizenship Status in Hamilton City
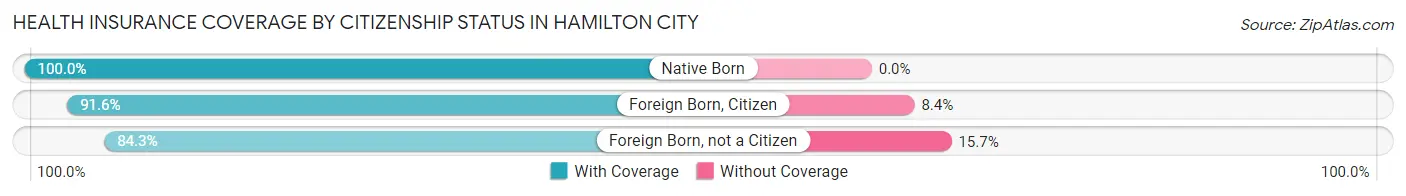
| Citizenship Status | With Coverage | Without Coverage |
| Native Born | 51 (100.0%) | 0 (0.0%) |
| Foreign Born, Citizen | 426 (91.6%) | 39 (8.4%) |
| Foreign Born, not a Citizen | 377 (84.3%) | 70 (15.7%) |
Health Insurance Coverage by Household Income in Hamilton City
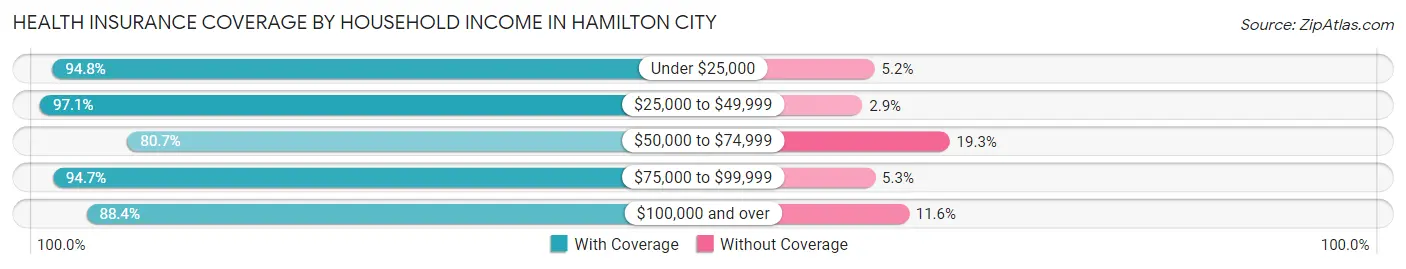
| Household Income | With Coverage | Without Coverage |
| Under $25,000 | 418 (94.8%) | 23 (5.2%) |
| $25,000 to $49,999 | 366 (97.1%) | 11 (2.9%) |
| $50,000 to $74,999 | 440 (80.7%) | 105 (19.3%) |
| $75,000 to $99,999 | 303 (94.7%) | 17 (5.3%) |
| $100,000 and over | 449 (88.4%) | 59 (11.6%) |
Public vs Private Health Insurance Coverage by Age in Hamilton City
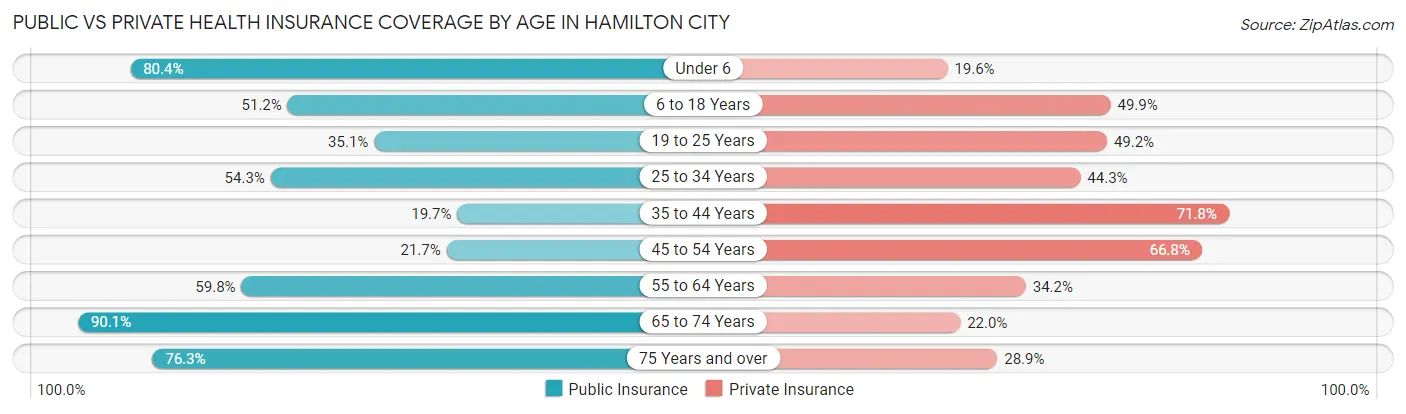
| Age Bracket | Public Insurance | Private Insurance |
| Under 6 | 41 (80.4%) | 10 (19.6%) |
| 6 to 18 Years | 238 (51.2%) | 232 (49.9%) |
| 19 to 25 Years | 157 (35.1%) | 220 (49.2%) |
| 25 to 34 Years | 157 (54.3%) | 128 (44.3%) |
| 35 to 44 Years | 37 (19.7%) | 135 (71.8%) |
| 45 to 54 Years | 49 (21.7%) | 151 (66.8%) |
| 55 to 64 Years | 147 (59.8%) | 84 (34.2%) |
| 65 to 74 Years | 164 (90.1%) | 40 (22.0%) |
| 75 Years and over | 74 (76.3%) | 28 (28.9%) |
| Total | 1,064 (48.6%) | 1,028 (46.9%) |
Disability Status by Sex by Age in Hamilton City
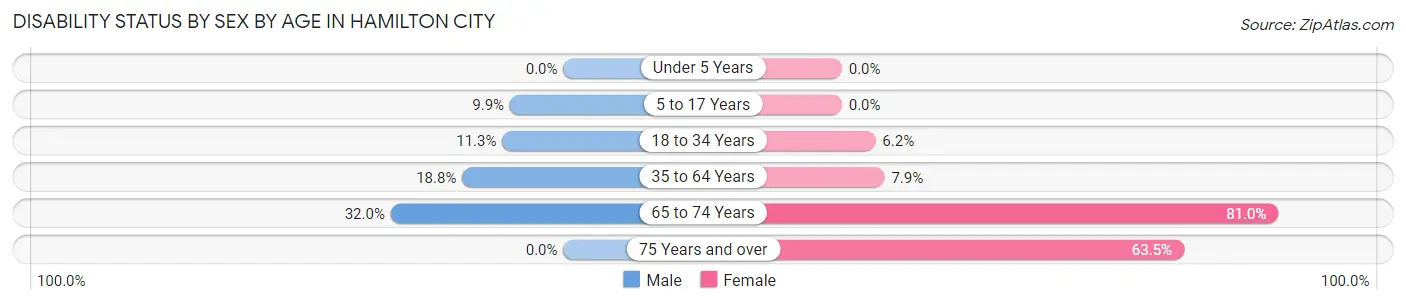
| Age Bracket | Male | Female |
| Under 5 Years | 0 (0.0%) | 0 (0.0%) |
| 5 to 17 Years | 23 (9.9%) | 0 (0.0%) |
| 18 to 34 Years | 40 (11.3%) | 26 (6.2%) |
| 35 to 64 Years | 67 (18.8%) | 24 (7.9%) |
| 65 to 74 Years | 33 (32.0%) | 64 (81.0%) |
| 75 Years and over | 0 (0.0%) | 40 (63.5%) |
Disability Class by Sex by Age in Hamilton City
Disability Class: Hearing Difficulty
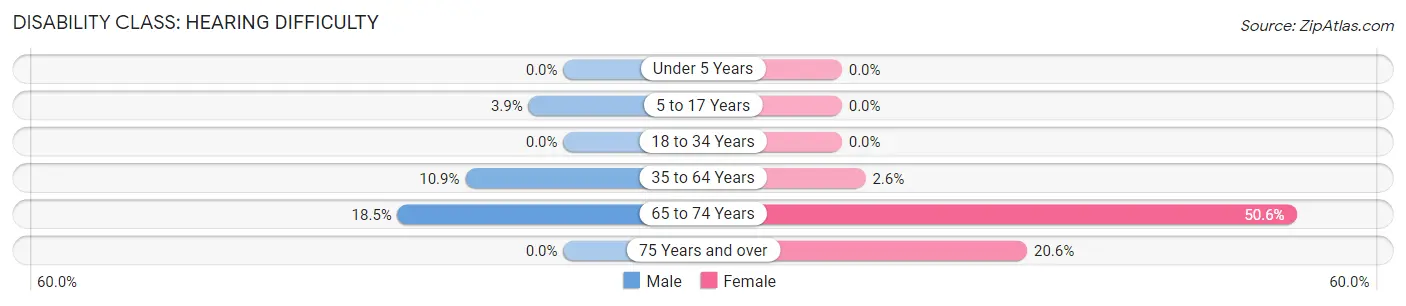
| Age Bracket | Male | Female |
| Under 5 Years | 0 (0.0%) | 0 (0.0%) |
| 5 to 17 Years | 9 (3.9%) | 0 (0.0%) |
| 18 to 34 Years | 0 (0.0%) | 0 (0.0%) |
| 35 to 64 Years | 39 (10.9%) | 8 (2.6%) |
| 65 to 74 Years | 19 (18.4%) | 40 (50.6%) |
| 75 Years and over | 0 (0.0%) | 13 (20.6%) |
Disability Class: Vision Difficulty
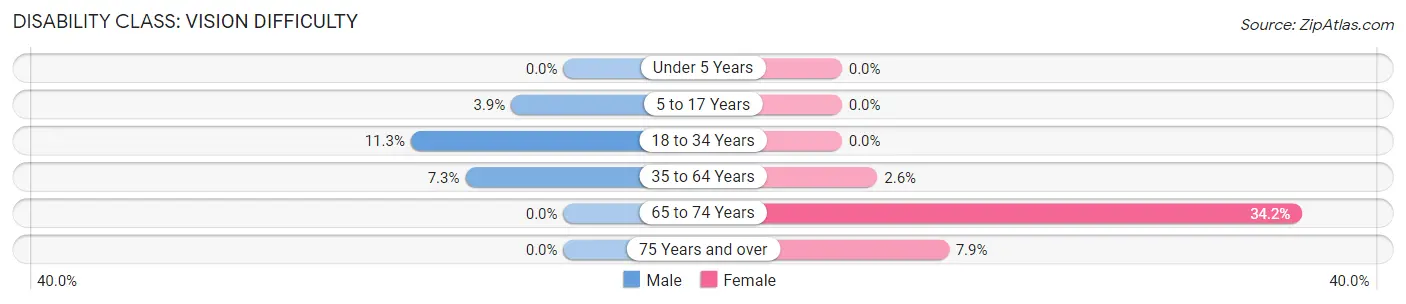
| Age Bracket | Male | Female |
| Under 5 Years | 0 (0.0%) | 0 (0.0%) |
| 5 to 17 Years | 9 (3.9%) | 0 (0.0%) |
| 18 to 34 Years | 40 (11.3%) | 0 (0.0%) |
| 35 to 64 Years | 26 (7.3%) | 8 (2.6%) |
| 65 to 74 Years | 0 (0.0%) | 27 (34.2%) |
| 75 Years and over | 0 (0.0%) | 5 (7.9%) |
Disability Class: Cognitive Difficulty
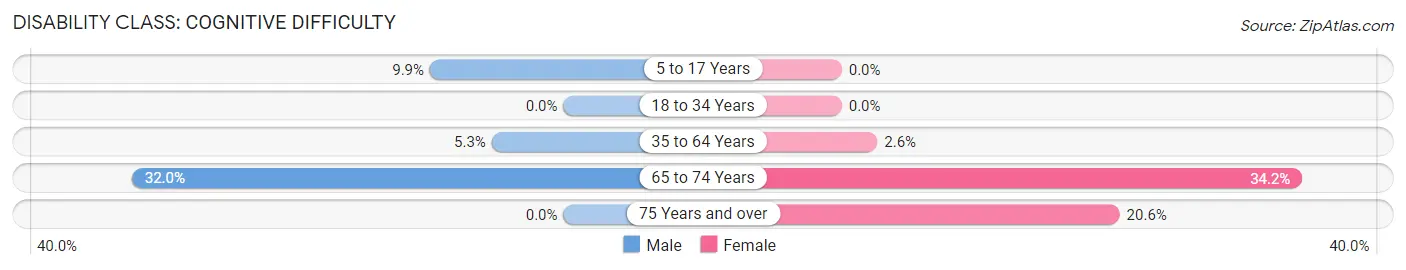
| Age Bracket | Male | Female |
| 5 to 17 Years | 23 (9.9%) | 0 (0.0%) |
| 18 to 34 Years | 0 (0.0%) | 0 (0.0%) |
| 35 to 64 Years | 19 (5.3%) | 8 (2.6%) |
| 65 to 74 Years | 33 (32.0%) | 27 (34.2%) |
| 75 Years and over | 0 (0.0%) | 13 (20.6%) |
Disability Class: Ambulatory Difficulty
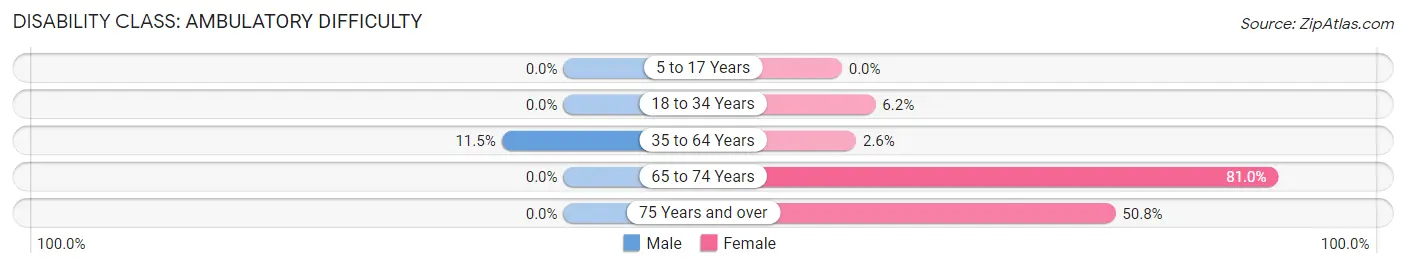
| Age Bracket | Male | Female |
| 5 to 17 Years | 0 (0.0%) | 0 (0.0%) |
| 18 to 34 Years | 0 (0.0%) | 26 (6.2%) |
| 35 to 64 Years | 41 (11.5%) | 8 (2.6%) |
| 65 to 74 Years | 0 (0.0%) | 64 (81.0%) |
| 75 Years and over | 0 (0.0%) | 32 (50.8%) |
Disability Class: Self-Care Difficulty
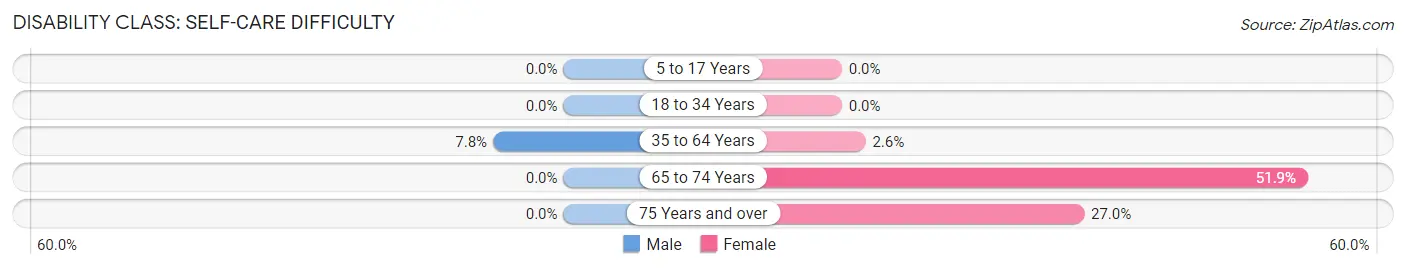
| Age Bracket | Male | Female |
| 5 to 17 Years | 0 (0.0%) | 0 (0.0%) |
| 18 to 34 Years | 0 (0.0%) | 0 (0.0%) |
| 35 to 64 Years | 28 (7.8%) | 8 (2.6%) |
| 65 to 74 Years | 0 (0.0%) | 41 (51.9%) |
| 75 Years and over | 0 (0.0%) | 17 (27.0%) |
Technology Access in Hamilton City
Computing Device Access in Hamilton City
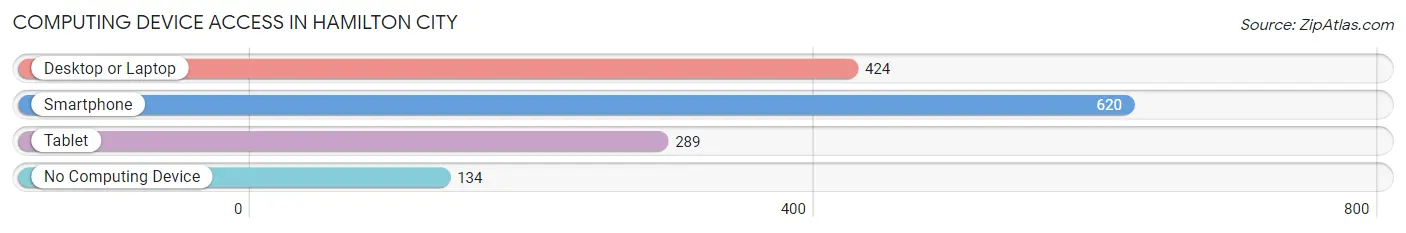
| Device Type | # Households | % Households |
| Desktop or Laptop | 424 | 55.2% |
| Smartphone | 620 | 80.7% |
| Tablet | 289 | 37.6% |
| No Computing Device | 134 | 17.4% |
| Total | 768 | 100.0% |
Internet Access in Hamilton City
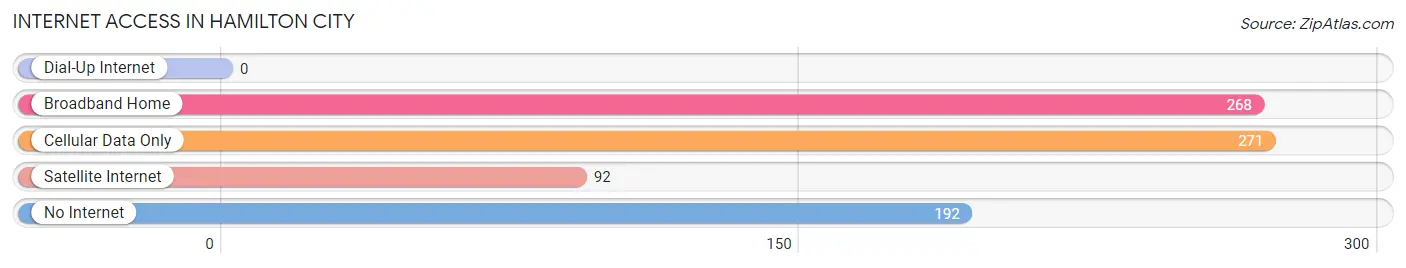
| Internet Type | # Households | % Households |
| Dial-Up Internet | 0 | 0.0% |
| Broadband Home | 268 | 34.9% |
| Cellular Data Only | 271 | 35.3% |
| Satellite Internet | 92 | 12.0% |
| No Internet | 192 | 25.0% |
| Total | 768 | 100.0% |
Hamilton City Summary
Introduction
Hamilton City is a small city located in Glenn County, California. It is situated in the Sacramento Valley, about halfway between Sacramento and Redding. The city was founded in 1872 and incorporated in 1910. It is home to a population of approximately 1,500 people.
History
The area that is now Hamilton City was originally inhabited by the Wintun Native American tribe. The first European settlers arrived in the area in the early 1850s. The town was originally called Hamilton’s Crossing, after the first settler, William Hamilton. In 1872, the town was officially established and renamed Hamilton City.
The town grew slowly but steadily over the next few decades. In 1910, it was officially incorporated as a city. During the early 20th century, the city was a major agricultural center, with many farms and ranches in the area. The city also had a thriving lumber industry, with several sawmills in the area.
In the 1950s, the city began to experience a decline in population as many of the farms and ranches closed down. The city’s economy shifted to focus more on tourism and recreation. In the late 1970s, the city began to experience a resurgence in population as people moved to the area to take advantage of the recreational opportunities.
Geography
Hamilton City is located in the Sacramento Valley, about halfway between Sacramento and Redding. The city is situated on the banks of the Sacramento River, which provides a natural border between the city and the surrounding countryside. The city is surrounded by rolling hills and farmland.
The climate in Hamilton City is mild and temperate. Summers are hot and dry, while winters are cool and wet. The average annual temperature is around 60 degrees Fahrenheit.
Economy
The economy of Hamilton City is largely based on agriculture and tourism. The city is home to several farms and ranches, which produce a variety of crops, including almonds, walnuts, and olives. The city also has a thriving tourism industry, with many visitors coming to the area to take advantage of the recreational opportunities.
The city also has a small manufacturing sector, with several small businesses located in the area. The city is home to a number of retail stores, restaurants, and other businesses.
Demographics
As of the 2010 census, the population of Hamilton City was 1,500. The racial makeup of the city was 75.2% White, 0.7% African American, 0.7% Native American, 0.7% Asian, 0.7% Pacific Islander, and 21.3% from other races. The median household income was $37,500.
Conclusion
Hamilton City is a small city located in Glenn County, California. It is situated in the Sacramento Valley, about halfway between Sacramento and Redding. The city was founded in 1872 and incorporated in 1910. It is home to a population of approximately 1,500 people. The economy of Hamilton City is largely based on agriculture and tourism. The city is home to several farms and ranches, which produce a variety of crops, and the city also has a thriving tourism industry. The racial makeup of the city is 75.2% White, 0.7% African American, 0.7% Native American, 0.7% Asian, 0.7% Pacific Islander, and 21.3% from other races. The median household income was $37,500.
Common Questions
What is Per Capita Income in Hamilton City?
Per Capita income in Hamilton City is $21,750.
What is the Median Family Income in Hamilton City?
Median Family Income in Hamilton City is $55,598.
What is the Median Household income in Hamilton City?
Median Household Income in Hamilton City is $46,887.
What is Income or Wage Gap in Hamilton City?
Income or Wage Gap in Hamilton City is 15.9%.
Women in Hamilton City earn 84.1 cents for every dollar earned by a man.
What is Inequality or Gini Index in Hamilton City?
Inequality or Gini Index in Hamilton City is 0.41.
What is the Total Population of Hamilton City?
Total Population of Hamilton City is 2,191.
What is the Total Male Population of Hamilton City?
Total Male Population of Hamilton City is 1,106.
What is the Total Female Population of Hamilton City?
Total Female Population of Hamilton City is 1,085.
What is the Ratio of Males per 100 Females in Hamilton City?
There are 101.94 Males per 100 Females in Hamilton City.
What is the Ratio of Females per 100 Males in Hamilton City?
There are 98.10 Females per 100 Males in Hamilton City.
What is the Median Population Age in Hamilton City?
Median Population Age in Hamilton City is 29.2 Years.
What is the Average Family Size in Hamilton City
Average Family Size in Hamilton City is 3.5 People.
What is the Average Household Size in Hamilton City
Average Household Size in Hamilton City is 2.9 People.
How Large is the Labor Force in Hamilton City?
There are 1,191 People in the Labor Forcein in Hamilton City.
What is the Percentage of People in the Labor Force in Hamilton City?
66.9% of People are in the Labor Force in Hamilton City.
What is the Unemployment Rate in Hamilton City?
Unemployment Rate in Hamilton City is 10.0%.