Guadalupe, CA Map & Demographics
Guadalupe Map
Guadalupe Overview
$20,314
PER CAPITA INCOME
$64,932
AVG FAMILY INCOME
$66,026
AVG HOUSEHOLD INCOME
6.4%
WAGE / INCOME GAP [ % ]
93.6¢/ $1
WAGE / INCOME GAP [ $ ]
$10,382
FAMILY INCOME DEFICIT
0.43
INEQUALITY / GINI INDEX
8,272
TOTAL POPULATION
4,021
MALE POPULATION
4,251
FEMALE POPULATION
94.59
MALES / 100 FEMALES
105.72
FEMALES / 100 MALES
28.4
MEDIAN AGE
4.1
AVG FAMILY SIZE
4.0
AVG HOUSEHOLD SIZE
3,748
LABOR FORCE [ PEOPLE ]
66.2%
PERCENT IN LABOR FORCE
9.5%
UNEMPLOYMENT RATE
Guadalupe Zip Codes
Guadalupe Area Codes
Income in Guadalupe
Income Overview in Guadalupe
Per Capita Income in Guadalupe is $20,314, while median incomes of families and households are $64,932 and $66,026 respectively.
| Characteristic | Number | Measure |
| Per Capita Income | 8,272 | $20,314 |
| Median Family Income | 1,811 | $64,932 |
| Mean Family Income | 1,811 | $80,696 |
| Median Household Income | 2,080 | $66,026 |
| Mean Household Income | 2,080 | $79,737 |
| Income Deficit | 1,811 | $10,382 |
| Wage / Income Gap (%) | 8,272 | 6.36% |
| Wage / Income Gap ($) | 8,272 | 93.64¢ per $1 |
| Gini / Inequality Index | 8,272 | 0.43 |
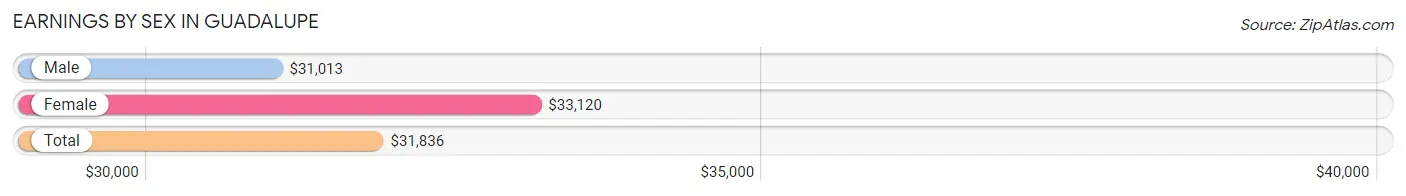
Earnings by Sex in Guadalupe
Average Earnings in Guadalupe are $31,836, $31,013 for men and $33,120 for women, a difference of 6.4%.
| Sex | Number | Average Earnings |
| Male | 2,112 (57.5%) | $31,013 |
| Female | 1,562 (42.5%) | $33,120 |
| Total | 3,674 (100.0%) | $31,836 |
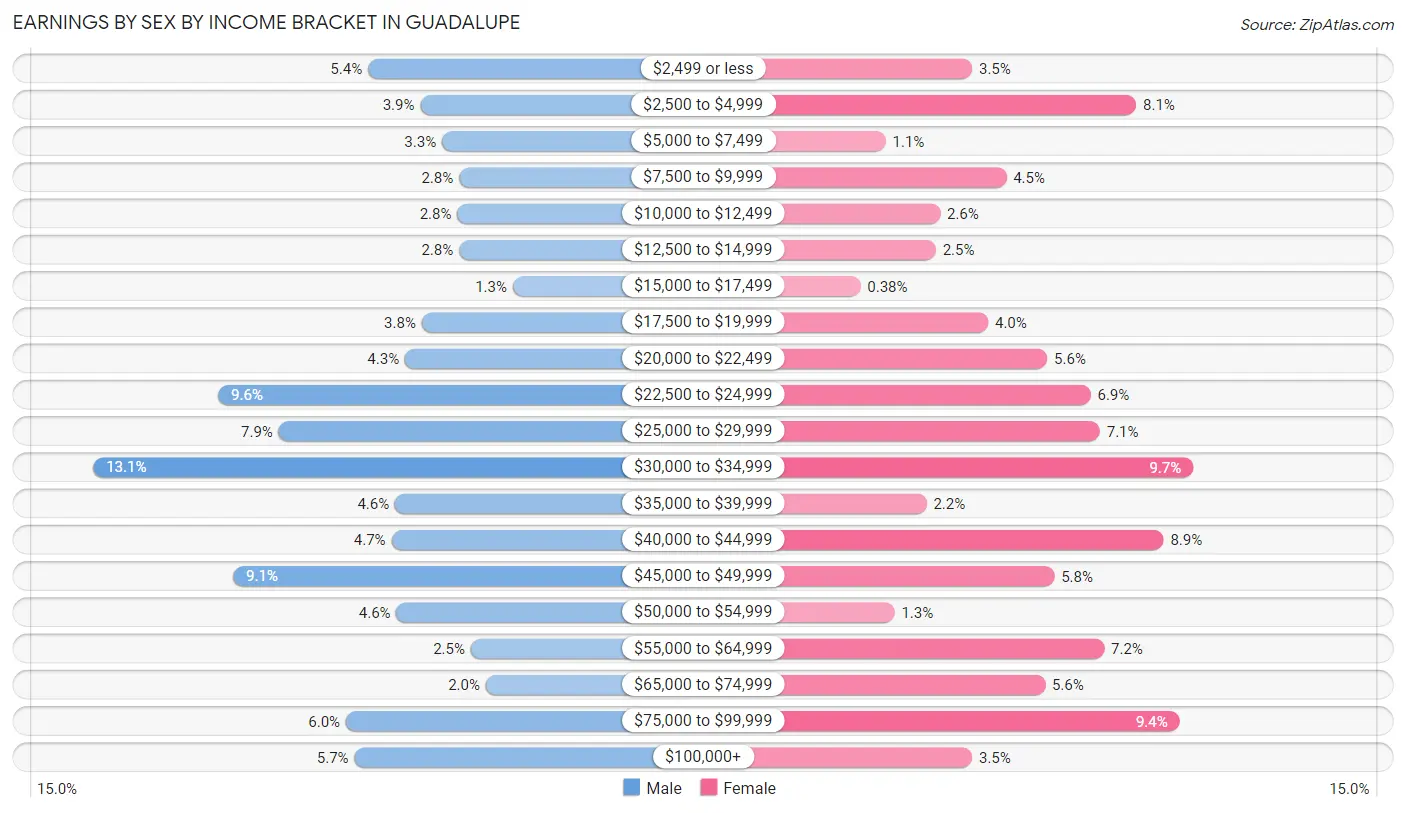
Earnings by Sex by Income Bracket in Guadalupe
The most common earnings brackets in Guadalupe are $30,000 to $34,999 for men (276 | 13.1%) and $30,000 to $34,999 for women (152 | 9.7%).
| Income | Male | Female |
| $2,499 or less | 113 (5.3%) | 55 (3.5%) |
| $2,500 to $4,999 | 82 (3.9%) | 127 (8.1%) |
| $5,000 to $7,499 | 69 (3.3%) | 17 (1.1%) |
| $7,500 to $9,999 | 59 (2.8%) | 70 (4.5%) |
| $10,000 to $12,499 | 60 (2.8%) | 41 (2.6%) |
| $12,500 to $14,999 | 59 (2.8%) | 39 (2.5%) |
| $15,000 to $17,499 | 27 (1.3%) | 6 (0.4%) |
| $17,500 to $19,999 | 81 (3.8%) | 62 (4.0%) |
| $20,000 to $22,499 | 91 (4.3%) | 88 (5.6%) |
| $22,500 to $24,999 | 202 (9.6%) | 107 (6.9%) |
| $25,000 to $29,999 | 166 (7.9%) | 111 (7.1%) |
| $30,000 to $34,999 | 276 (13.1%) | 152 (9.7%) |
| $35,000 to $39,999 | 97 (4.6%) | 35 (2.2%) |
| $40,000 to $44,999 | 99 (4.7%) | 139 (8.9%) |
| $45,000 to $49,999 | 193 (9.1%) | 91 (5.8%) |
| $50,000 to $54,999 | 96 (4.5%) | 21 (1.3%) |
| $55,000 to $64,999 | 52 (2.5%) | 113 (7.2%) |
| $65,000 to $74,999 | 43 (2.0%) | 87 (5.6%) |
| $75,000 to $99,999 | 126 (6.0%) | 146 (9.3%) |
| $100,000+ | 121 (5.7%) | 55 (3.5%) |
| Total | 2,112 (100.0%) | 1,562 (100.0%) |
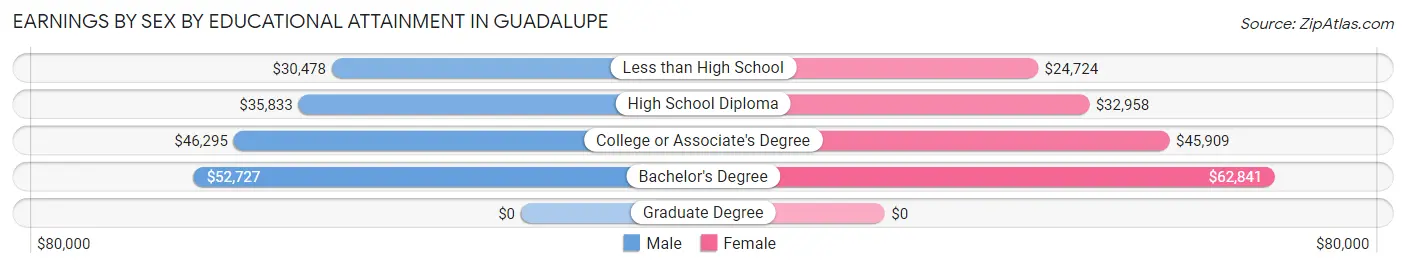
Earnings by Sex by Educational Attainment in Guadalupe
Average earnings in Guadalupe are $33,734 for men and $36,991 for women, a difference of 8.8%. Men with an educational attainment of bachelor's degree enjoy the highest average annual earnings of $52,727, while those with less than high school education earn the least with $30,478. Women with an educational attainment of bachelor's degree earn the most with the average annual earnings of $62,841, while those with less than high school education have the smallest earnings of $24,724.
| Educational Attainment | Male Income | Female Income |
| Less than High School | $30,478 | $24,724 |
| High School Diploma | $35,833 | $32,958 |
| College or Associate's Degree | $46,295 | $45,909 |
| Bachelor's Degree | $52,727 | $62,841 |
| Graduate Degree | - | - |
| Total | $33,734 | $36,991 |
Family Income in Guadalupe
Family Income Brackets in Guadalupe
According to the Guadalupe family income data, there are 378 families falling into the $75,000 to $99,999 income range, which is the most common income bracket and makes up 20.9% of all families. Conversely, the $10,000 to $14,999 income bracket is the least frequent group with only 27 families (1.5%) belonging to this category.
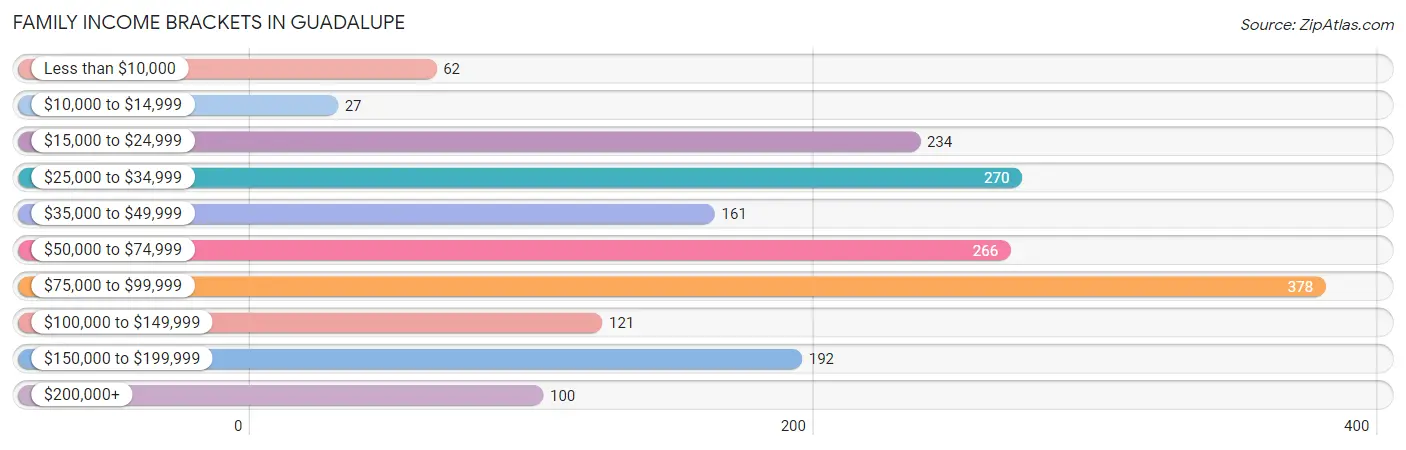
| Income Bracket | # Families | % Families |
| Less than $10,000 | 62 | 3.4% |
| $10,000 to $14,999 | 27 | 1.5% |
| $15,000 to $24,999 | 234 | 12.9% |
| $25,000 to $34,999 | 270 | 14.9% |
| $35,000 to $49,999 | 161 | 8.9% |
| $50,000 to $74,999 | 266 | 14.7% |
| $75,000 to $99,999 | 378 | 20.9% |
| $100,000 to $149,999 | 121 | 6.7% |
| $150,000 to $199,999 | 192 | 10.6% |
| $200,000+ | 100 | 5.5% |
Family Income by Famaliy Size in Guadalupe
6-person families (155 | 8.6%) account for the highest median family income in Guadalupe with $184,301 per family, while 2-person families (377 | 20.8%) have the highest median income of $31,418 per family member.
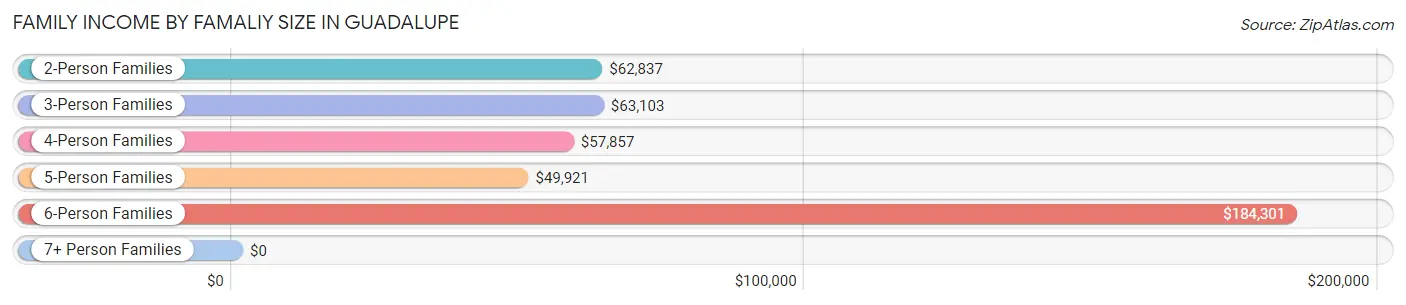
| Income Bracket | # Families | Median Income |
| 2-Person Families | 377 (20.8%) | $62,837 |
| 3-Person Families | 364 (20.1%) | $63,103 |
| 4-Person Families | 480 (26.5%) | $57,857 |
| 5-Person Families | 360 (19.9%) | $49,921 |
| 6-Person Families | 155 (8.6%) | $184,301 |
| 7+ Person Families | 75 (4.1%) | $0 |
| Total | 1,811 (100.0%) | $64,932 |
Family Income by Number of Earners in Guadalupe
The median family income in Guadalupe is $64,932, with families comprising 3+ earners (405) having the highest median family income of $134,883, while families with no earners (188) have the lowest median family income of $29,583, accounting for 22.4% and 10.4% of families, respectively.
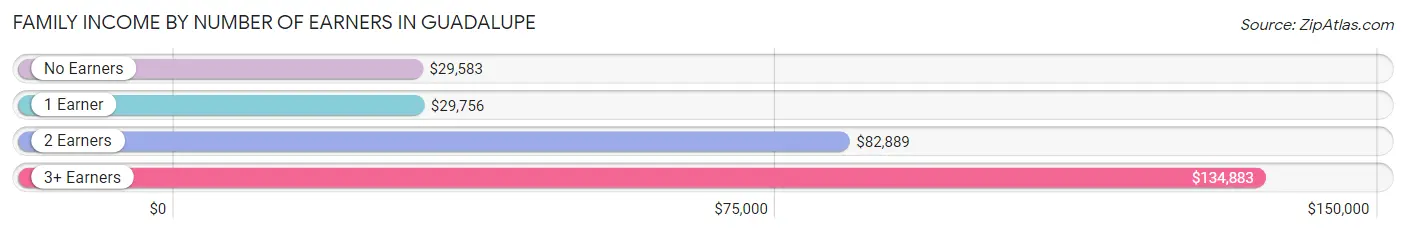
| Number of Earners | # Families | Median Income |
| No Earners | 188 (10.4%) | $29,583 |
| 1 Earner | 651 (35.9%) | $29,756 |
| 2 Earners | 567 (31.3%) | $82,889 |
| 3+ Earners | 405 (22.4%) | $134,883 |
| Total | 1,811 (100.0%) | $64,932 |
Household Income in Guadalupe
Household Income Brackets in Guadalupe
With 404 households falling in the category, the $75,000 to $99,999 income range is the most frequent in Guadalupe, accounting for 19.4% of all households. In contrast, only 75 households (3.6%) fall into the $10,000 to $14,999 income bracket, making it the least populous group.
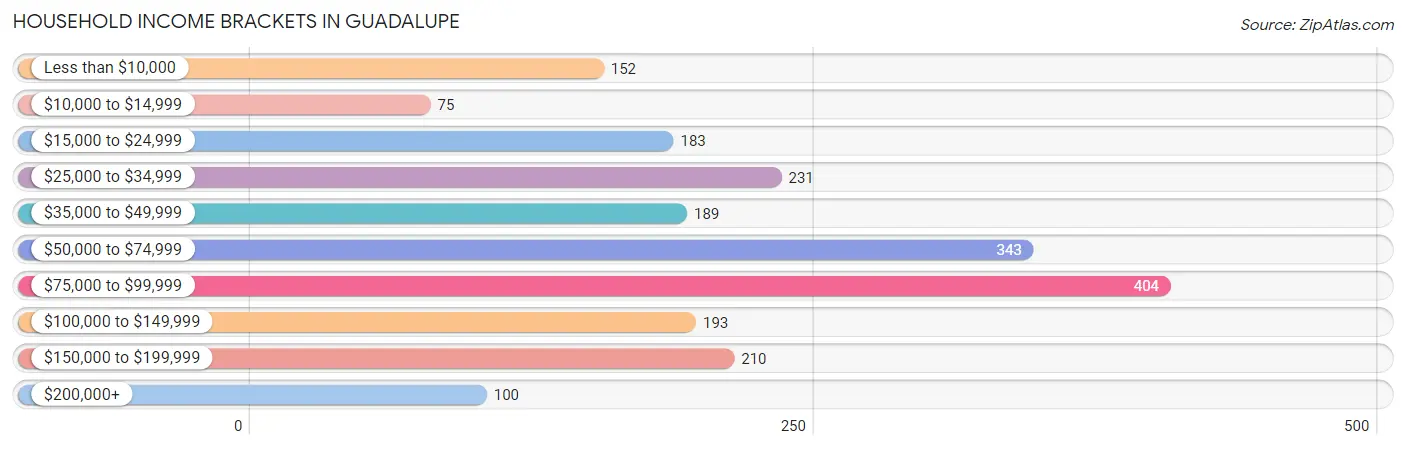
| Income Bracket | # Households | % Households |
| Less than $10,000 | 152 | 7.3% |
| $10,000 to $14,999 | 75 | 3.6% |
| $15,000 to $24,999 | 183 | 8.8% |
| $25,000 to $34,999 | 231 | 11.1% |
| $35,000 to $49,999 | 189 | 9.1% |
| $50,000 to $74,999 | 343 | 16.5% |
| $75,000 to $99,999 | 404 | 19.4% |
| $100,000 to $149,999 | 193 | 9.3% |
| $150,000 to $199,999 | 210 | 10.1% |
| $200,000+ | 100 | 4.8% |
Household Income by Householder Age in Guadalupe
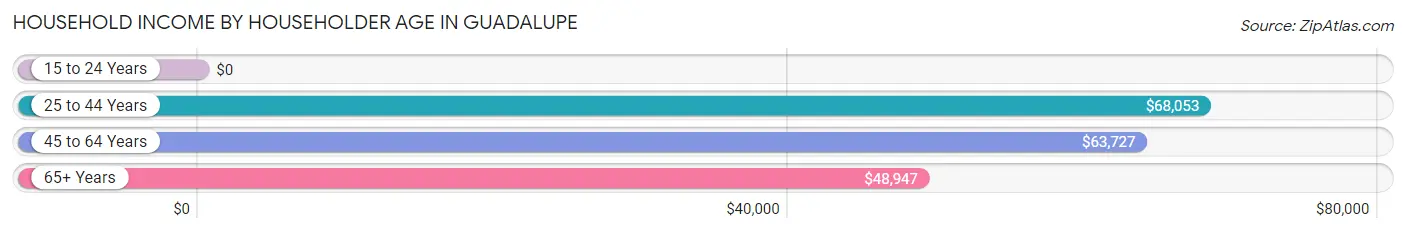
The median household income in Guadalupe is $66,026, with the highest median household income of $68,053 found in the 25 to 44 years age bracket for the primary householder. A total of 797 households (38.3%) fall into this category. Meanwhile, the 15 to 24 years age bracket for the primary householder has the lowest median household income of $0, with 81 households (3.9%) in this group.
| Income Bracket | # Households | Median Income |
| 15 to 24 Years | 81 (3.9%) | $0 |
| 25 to 44 Years | 797 (38.3%) | $68,053 |
| 45 to 64 Years | 738 (35.5%) | $63,727 |
| 65+ Years | 464 (22.3%) | $48,947 |
| Total | 2,080 (100.0%) | $66,026 |
Poverty in Guadalupe
Income Below Poverty by Sex and Age in Guadalupe
With 27.3% poverty level for males and 27.9% for females among the residents of Guadalupe, 16 and 17 year old males and 5 year old females are the most vulnerable to poverty, with 51 males (47.2%) and 17 females (63.0%) in their respective age groups living below the poverty level.
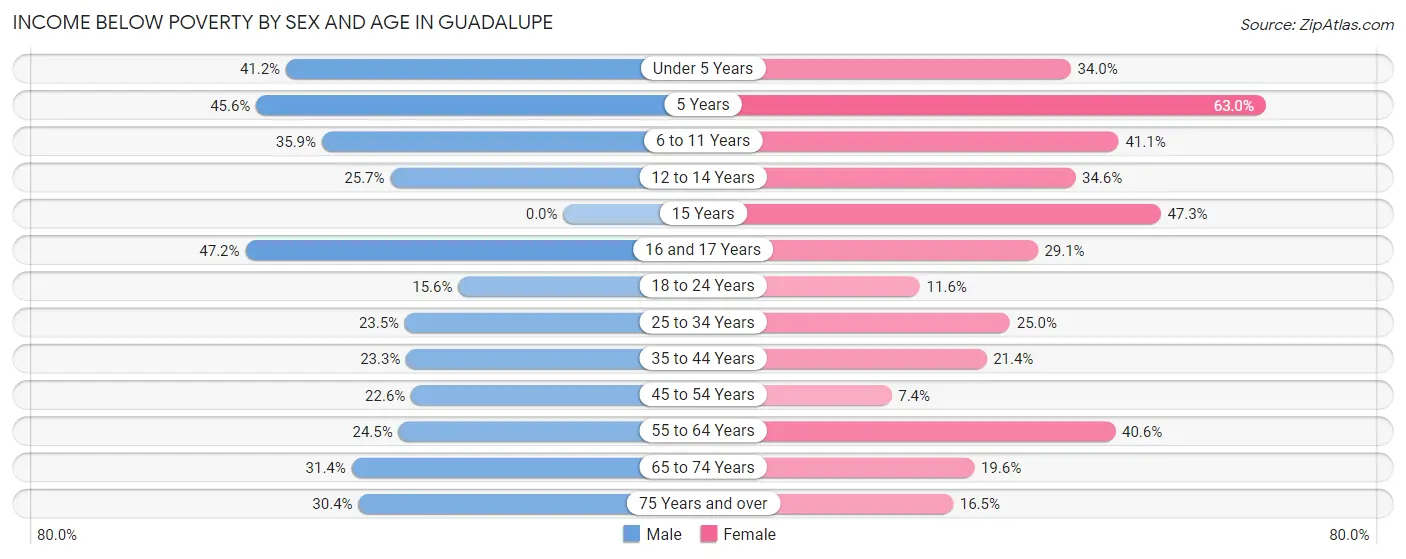
| Age Bracket | Male | Female |
| Under 5 Years | 173 (41.2%) | 140 (34.0%) |
| 5 Years | 26 (45.6%) | 17 (63.0%) |
| 6 to 11 Years | 170 (35.9%) | 233 (41.1%) |
| 12 to 14 Years | 37 (25.7%) | 89 (34.6%) |
| 15 Years | 0 (0.0%) | 53 (47.3%) |
| 16 and 17 Years | 51 (47.2%) | 61 (29.0%) |
| 18 to 24 Years | 71 (15.6%) | 49 (11.6%) |
| 25 to 34 Years | 123 (23.5%) | 119 (24.9%) |
| 35 to 44 Years | 140 (23.3%) | 143 (21.4%) |
| 45 to 54 Years | 94 (22.6%) | 15 (7.3%) |
| 55 to 64 Years | 93 (24.5%) | 181 (40.6%) |
| 65 to 74 Years | 61 (31.4%) | 42 (19.6%) |
| 75 Years and over | 49 (30.4%) | 30 (16.5%) |
| Total | 1,088 (27.3%) | 1,172 (27.9%) |
Income Above Poverty by Sex and Age in Guadalupe
According to the poverty statistics in Guadalupe, males aged 15 years and females aged 45 to 54 years are the age groups that are most secure financially, with 100.0% of males and 92.6% of females in these age groups living above the poverty line.
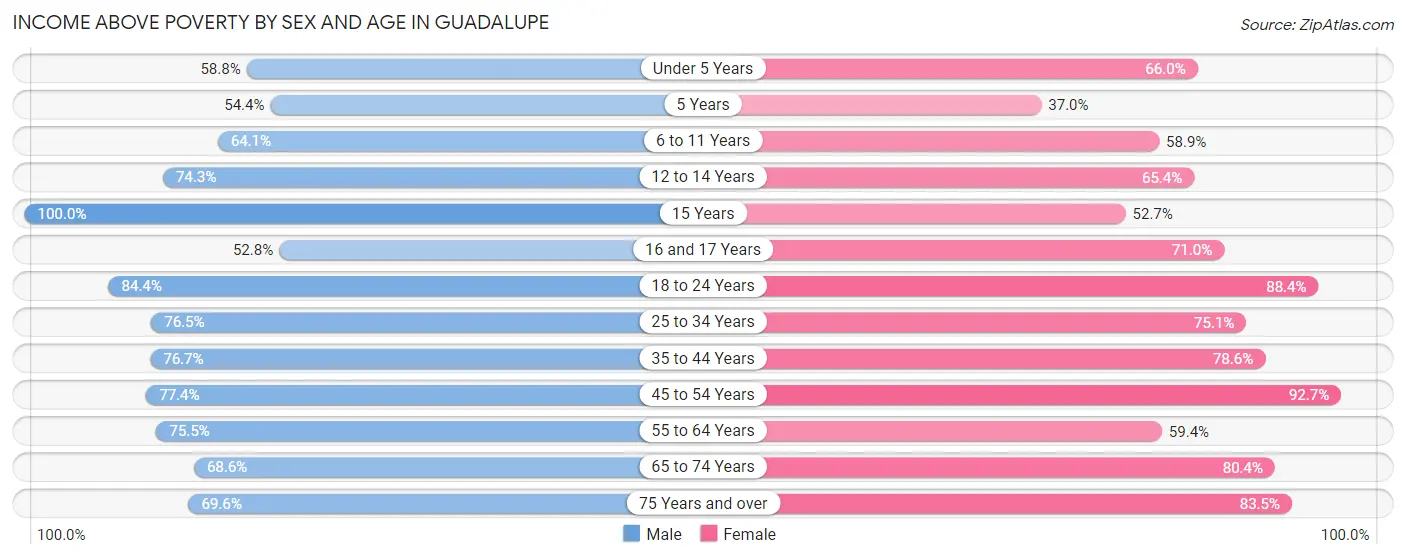
| Age Bracket | Male | Female |
| Under 5 Years | 247 (58.8%) | 272 (66.0%) |
| 5 Years | 31 (54.4%) | 10 (37.0%) |
| 6 to 11 Years | 304 (64.1%) | 334 (58.9%) |
| 12 to 14 Years | 107 (74.3%) | 168 (65.4%) |
| 15 Years | 53 (100.0%) | 59 (52.7%) |
| 16 and 17 Years | 57 (52.8%) | 149 (71.0%) |
| 18 to 24 Years | 384 (84.4%) | 375 (88.4%) |
| 25 to 34 Years | 400 (76.5%) | 358 (75.0%) |
| 35 to 44 Years | 460 (76.7%) | 524 (78.6%) |
| 45 to 54 Years | 322 (77.4%) | 189 (92.6%) |
| 55 to 64 Years | 287 (75.5%) | 265 (59.4%) |
| 65 to 74 Years | 133 (68.6%) | 172 (80.4%) |
| 75 Years and over | 112 (69.6%) | 152 (83.5%) |
| Total | 2,897 (72.7%) | 3,027 (72.1%) |
Income Below Poverty Among Married-Couple Families in Guadalupe
The poverty statistics for married-couple families in Guadalupe show that 15.7% or 184 of the total 1,174 families live below the poverty line. Families with 3 or 4 children have the highest poverty rate of 31.3%, comprising of 86 families. On the other hand, families with 1 or 2 children have the lowest poverty rate of 5.1%, which includes 22 families.
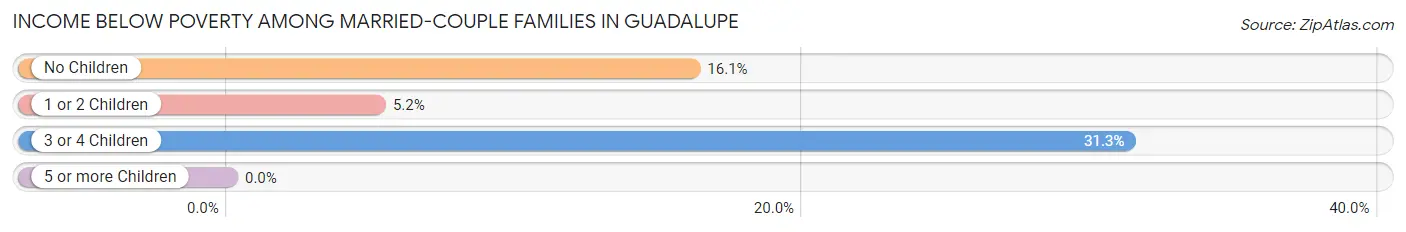
| Children | Above Poverty | Below Poverty |
| No Children | 396 (83.9%) | 76 (16.1%) |
| 1 or 2 Children | 405 (94.9%) | 22 (5.1%) |
| 3 or 4 Children | 189 (68.7%) | 86 (31.3%) |
| 5 or more Children | 0 (0.0%) | 0 (0.0%) |
| Total | 990 (84.3%) | 184 (15.7%) |
Income Below Poverty Among Single-Parent Households in Guadalupe
According to the poverty data in Guadalupe, 44.6% or 129 single-father households and 25.3% or 88 single-mother households are living below the poverty line. Among single-father households, those with 3 or 4 children have the highest poverty rate, with 76 households (100.0%) experiencing poverty. Likewise, among single-mother households, those with 3 or 4 children have the highest poverty rate, with 57 households (64.0%) falling below the poverty line.
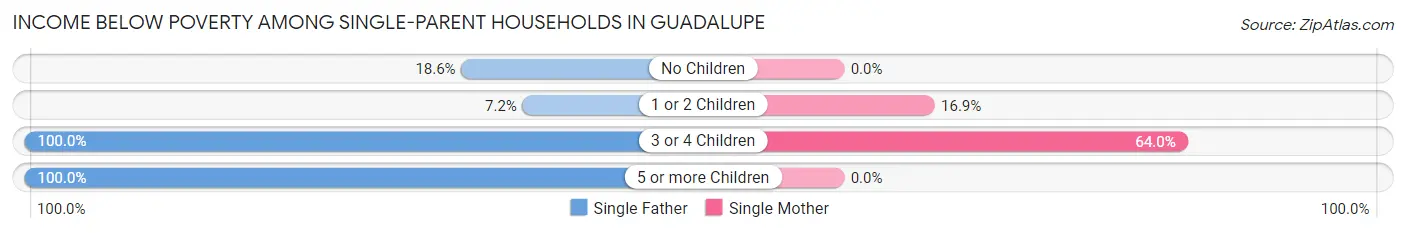
| Children | Single Father | Single Mother |
| No Children | 19 (18.6%) | 0 (0.0%) |
| 1 or 2 Children | 6 (7.2%) | 31 (16.9%) |
| 3 or 4 Children | 76 (100.0%) | 57 (64.0%) |
| 5 or more Children | 28 (100.0%) | 0 (0.0%) |
| Total | 129 (44.6%) | 88 (25.3%) |
Income Below Poverty Among Married-Couple vs Single-Parent Households in Guadalupe
The poverty data for Guadalupe shows that 184 of the married-couple family households (15.7%) and 217 of the single-parent households (34.1%) are living below the poverty level. Within the married-couple family households, those with 3 or 4 children have the highest poverty rate, with 86 households (31.3%) falling below the poverty line. Among the single-parent households, those with 5 or more children have the highest poverty rate, with 28 household (100.0%) living below poverty.
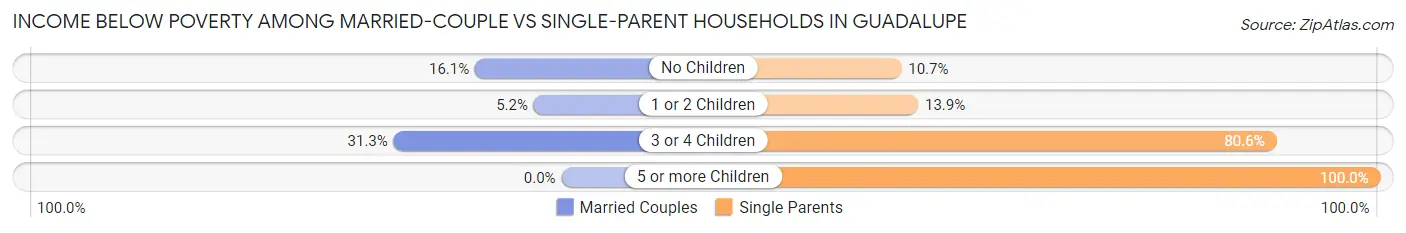
| Children | Married-Couple Families | Single-Parent Households |
| No Children | 76 (16.1%) | 19 (10.7%) |
| 1 or 2 Children | 22 (5.1%) | 37 (13.9%) |
| 3 or 4 Children | 86 (31.3%) | 133 (80.6%) |
| 5 or more Children | 0 (0.0%) | 28 (100.0%) |
| Total | 184 (15.7%) | 217 (34.1%) |
Race in Guadalupe
The most populous races in Guadalupe are Hispanic or Latino (7,476 | 90.4%), White / Caucasian (3,093 | 37.4%), and Two or more Races (2,503 | 30.3%).
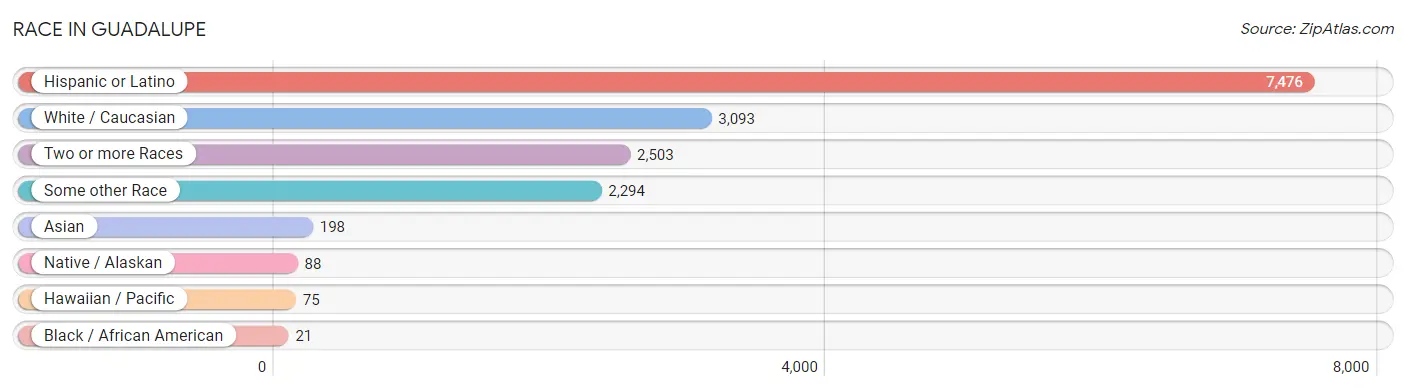
| Race | # Population | % Population |
| Asian | 198 | 2.4% |
| Black / African American | 21 | 0.3% |
| Hawaiian / Pacific | 75 | 0.9% |
| Hispanic or Latino | 7,476 | 90.4% |
| Native / Alaskan | 88 | 1.1% |
| White / Caucasian | 3,093 | 37.4% |
| Two or more Races | 2,503 | 30.3% |
| Some other Race | 2,294 | 27.7% |
| Total | 8,272 | 100.0% |
Ancestry in Guadalupe
The most populous ancestries reported in Guadalupe are Mexican (6,645 | 80.3%), Central American (706 | 8.5%), Salvadoran (706 | 8.5%), Korean (178 | 2.1%), and Mexican American Indian (162 | 2.0%), together accounting for 101.5% of all Guadalupe residents.
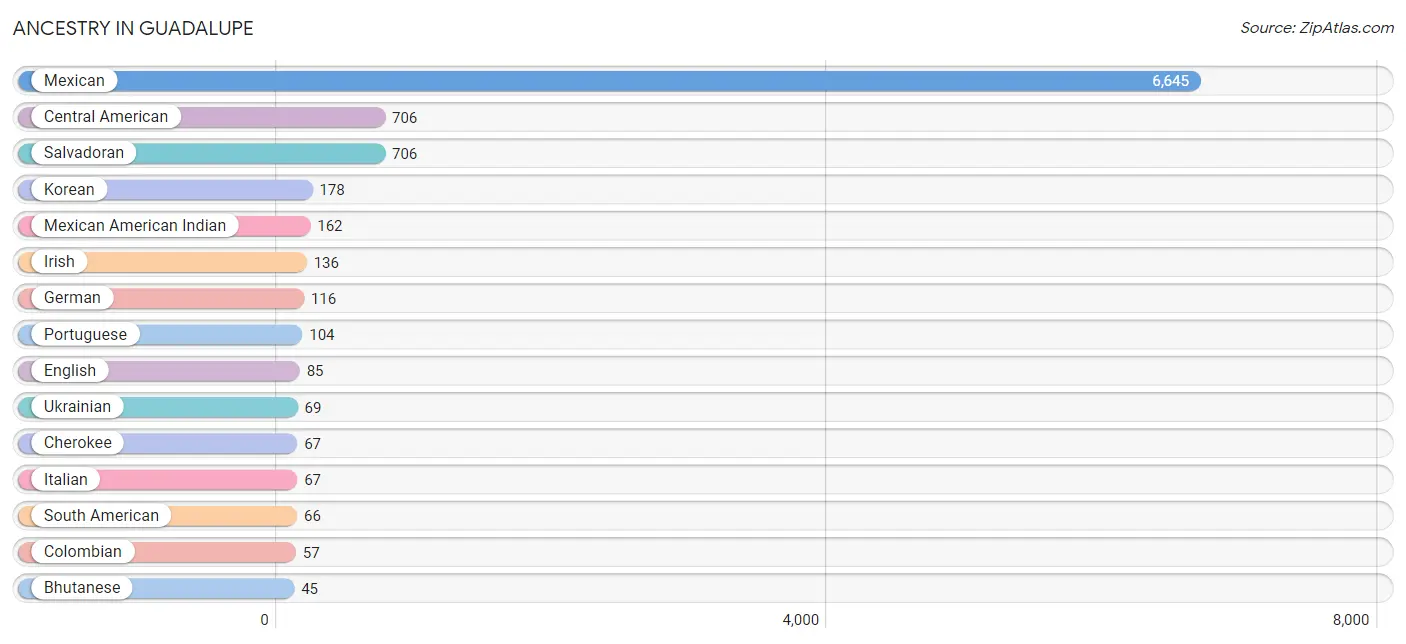
| Ancestry | # Population | % Population |
| American | 28 | 0.3% |
| Austrian | 26 | 0.3% |
| Bhutanese | 45 | 0.5% |
| Central American | 706 | 8.5% |
| Cherokee | 67 | 0.8% |
| Colombian | 57 | 0.7% |
| English | 85 | 1.0% |
| European | 30 | 0.4% |
| German | 116 | 1.4% |
| Irish | 136 | 1.6% |
| Italian | 67 | 0.8% |
| Korean | 178 | 2.1% |
| Mexican | 6,645 | 80.3% |
| Mexican American Indian | 162 | 2.0% |
| Peruvian | 9 | 0.1% |
| Polish | 14 | 0.2% |
| Portuguese | 104 | 1.3% |
| Salvadoran | 706 | 8.5% |
| Scandinavian | 14 | 0.2% |
| South American | 66 | 0.8% |
| Spaniard | 18 | 0.2% |
| Swiss | 42 | 0.5% |
| Ukrainian | 69 | 0.8% | View All 23 Rows |
Immigrants in Guadalupe
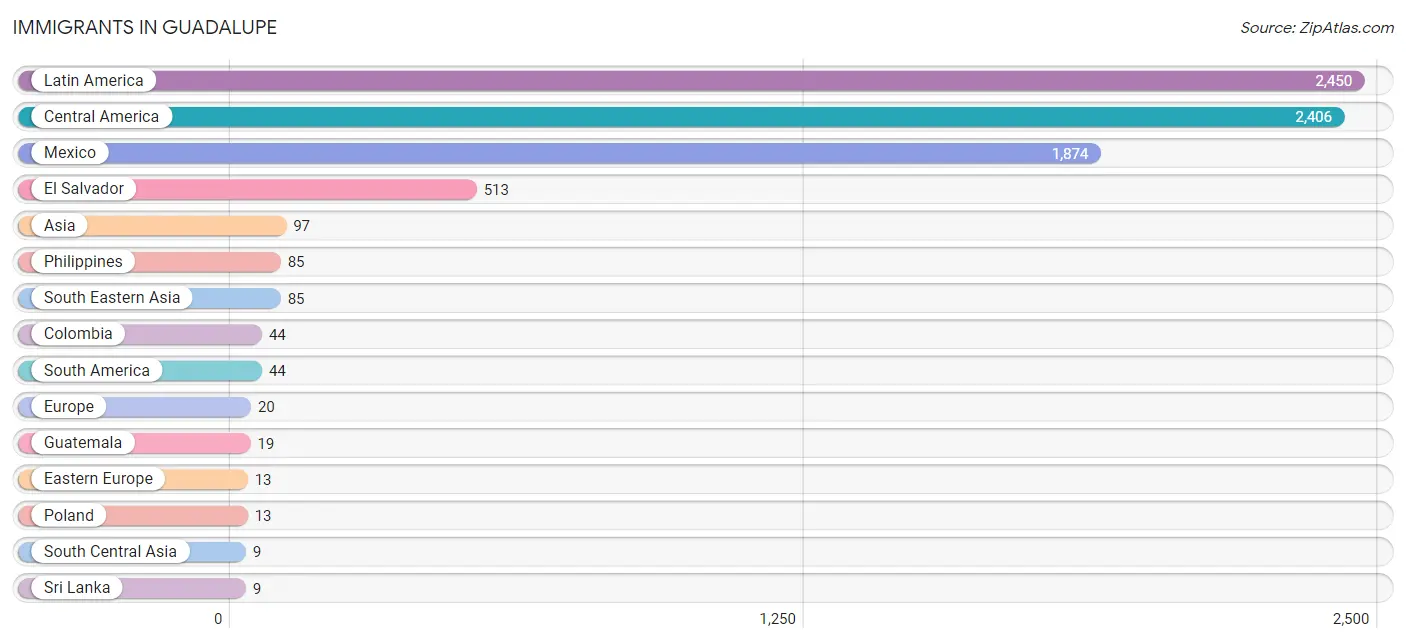
The most numerous immigrant groups reported in Guadalupe came from Latin America (2,450 | 29.6%), Central America (2,406 | 29.1%), Mexico (1,874 | 22.7%), El Salvador (513 | 6.2%), and Asia (97 | 1.2%), together accounting for 88.7% of all Guadalupe residents.
| Immigration Origin | # Population | % Population |
| Asia | 97 | 1.2% |
| Central America | 2,406 | 29.1% |
| China | 3 | 0.0% |
| Colombia | 44 | 0.5% |
| Eastern Asia | 3 | 0.0% |
| Eastern Europe | 13 | 0.2% |
| El Salvador | 513 | 6.2% |
| Europe | 20 | 0.2% |
| Guatemala | 19 | 0.2% |
| Hong Kong | 3 | 0.0% |
| Latin America | 2,450 | 29.6% |
| Mexico | 1,874 | 22.7% |
| Philippines | 85 | 1.0% |
| Poland | 13 | 0.2% |
| Portugal | 7 | 0.1% |
| South America | 44 | 0.5% |
| South Central Asia | 9 | 0.1% |
| South Eastern Asia | 85 | 1.0% |
| Southern Europe | 7 | 0.1% |
| Sri Lanka | 9 | 0.1% | View All 20 Rows |
Sex and Age in Guadalupe
Sex and Age in Guadalupe
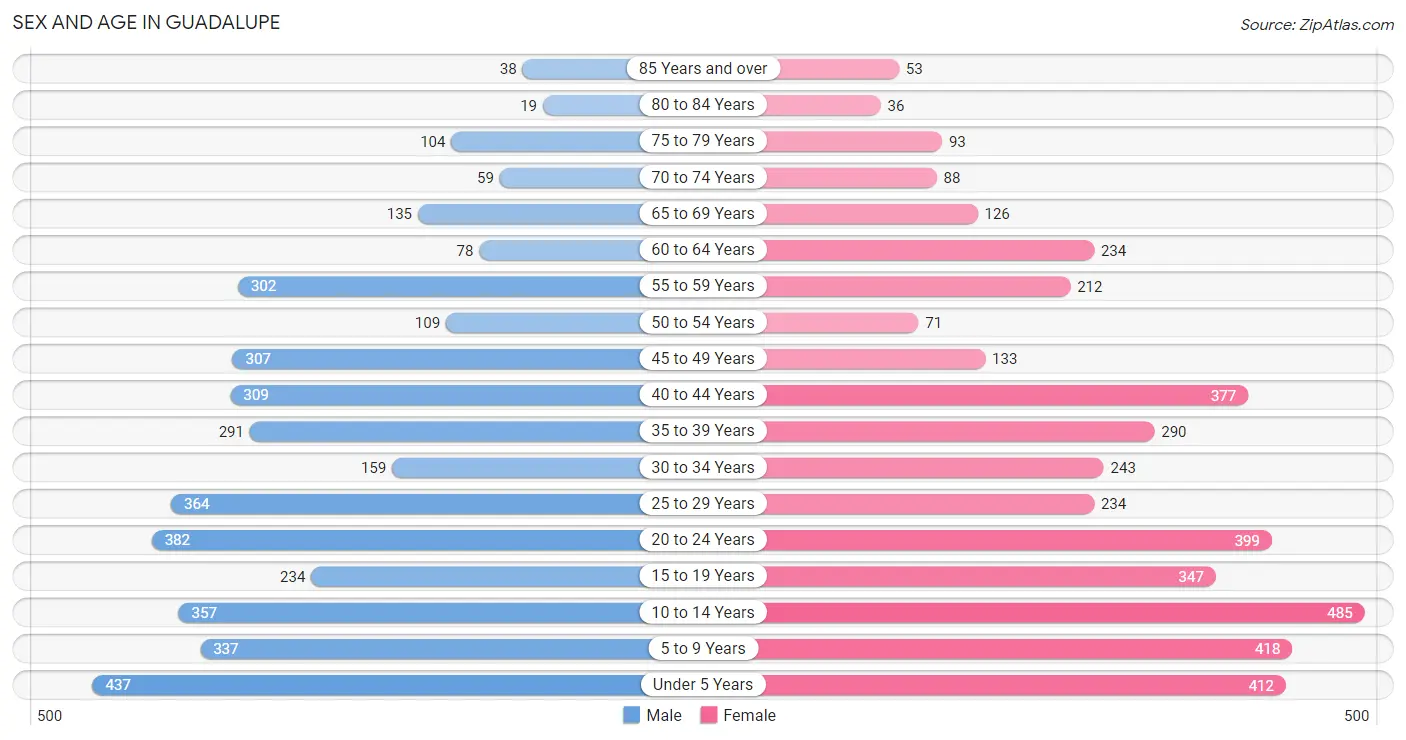
The most populous age groups in Guadalupe are Under 5 Years (437 | 10.9%) for men and 10 to 14 Years (485 | 11.4%) for women.
| Age Bracket | Male | Female |
| Under 5 Years | 437 (10.9%) | 412 (9.7%) |
| 5 to 9 Years | 337 (8.4%) | 418 (9.8%) |
| 10 to 14 Years | 357 (8.9%) | 485 (11.4%) |
| 15 to 19 Years | 234 (5.8%) | 347 (8.2%) |
| 20 to 24 Years | 382 (9.5%) | 399 (9.4%) |
| 25 to 29 Years | 364 (9.0%) | 234 (5.5%) |
| 30 to 34 Years | 159 (4.0%) | 243 (5.7%) |
| 35 to 39 Years | 291 (7.2%) | 290 (6.8%) |
| 40 to 44 Years | 309 (7.7%) | 377 (8.9%) |
| 45 to 49 Years | 307 (7.6%) | 133 (3.1%) |
| 50 to 54 Years | 109 (2.7%) | 71 (1.7%) |
| 55 to 59 Years | 302 (7.5%) | 212 (5.0%) |
| 60 to 64 Years | 78 (1.9%) | 234 (5.5%) |
| 65 to 69 Years | 135 (3.4%) | 126 (3.0%) |
| 70 to 74 Years | 59 (1.5%) | 88 (2.1%) |
| 75 to 79 Years | 104 (2.6%) | 93 (2.2%) |
| 80 to 84 Years | 19 (0.5%) | 36 (0.9%) |
| 85 Years and over | 38 (0.9%) | 53 (1.3%) |
| Total | 4,021 (100.0%) | 4,251 (100.0%) |
Families and Households in Guadalupe
Median Family Size in Guadalupe
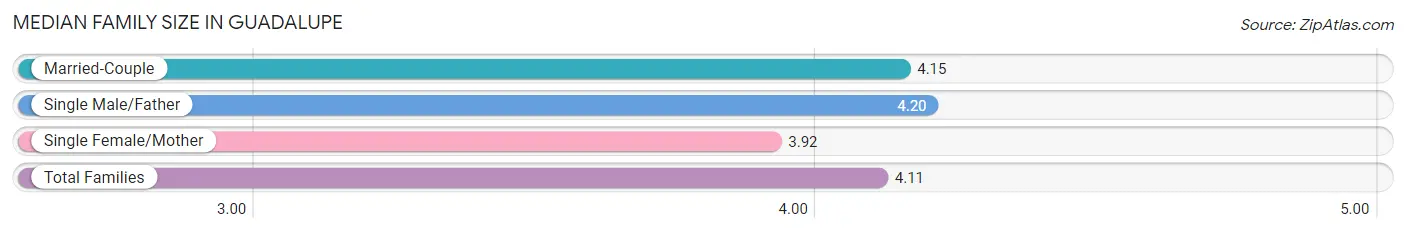
The median family size in Guadalupe is 4.11 persons per family, with single male/father families (289 | 16.0%) accounting for the largest median family size of 4.2 persons per family. On the other hand, single female/mother families (348 | 19.2%) represent the smallest median family size with 3.92 persons per family.
| Family Type | # Families | Family Size |
| Married-Couple | 1,174 (64.8%) | 4.15 |
| Single Male/Father | 289 (16.0%) | 4.20 |
| Single Female/Mother | 348 (19.2%) | 3.92 |
| Total Families | 1,811 (100.0%) | 4.11 |
Median Household Size in Guadalupe
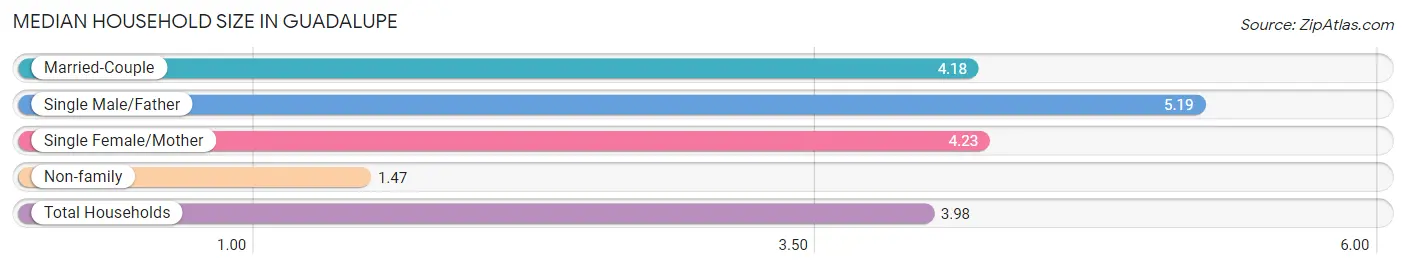
The median household size in Guadalupe is 3.98 persons per household, with single male/father households (289 | 13.9%) accounting for the largest median household size of 5.19 persons per household. non-family households (269 | 12.9%) represent the smallest median household size with 1.47 persons per household.
| Household Type | # Households | Household Size |
| Married-Couple | 1,174 (56.4%) | 4.18 |
| Single Male/Father | 289 (13.9%) | 5.19 |
| Single Female/Mother | 348 (16.7%) | 4.23 |
| Non-family | 269 (12.9%) | 1.47 |
| Total Households | 2,080 (100.0%) | 3.98 |
Household Size by Marriage Status in Guadalupe
Out of a total of 2,080 households in Guadalupe, 1,811 (87.1%) are family households, while 269 (12.9%) are nonfamily households. The most numerous type of family households are 5-person households, comprising 482, and the most common type of nonfamily households are 1-person households, comprising 229.
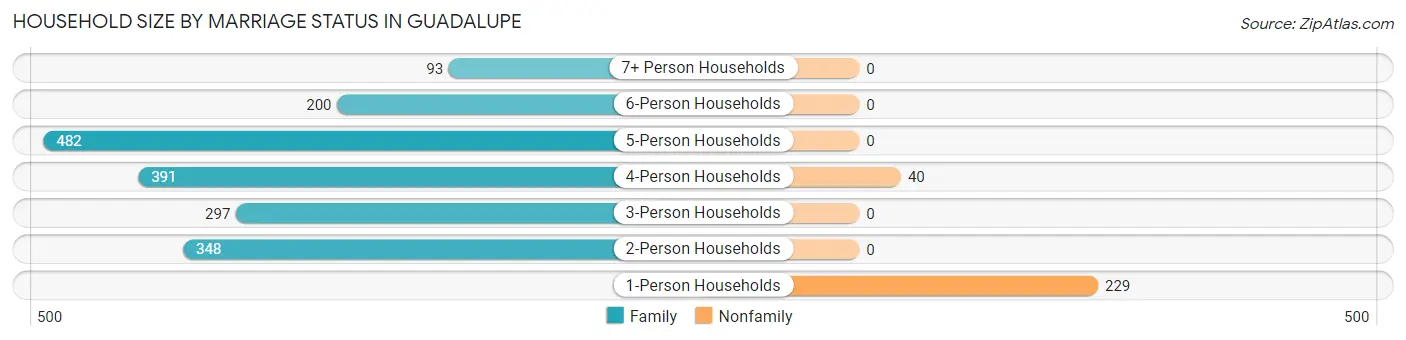
| Household Size | Family Households | Nonfamily Households |
| 1-Person Households | - | 229 (11.0%) |
| 2-Person Households | 348 (16.7%) | 0 (0.0%) |
| 3-Person Households | 297 (14.3%) | 0 (0.0%) |
| 4-Person Households | 391 (18.8%) | 40 (1.9%) |
| 5-Person Households | 482 (23.2%) | 0 (0.0%) |
| 6-Person Households | 200 (9.6%) | 0 (0.0%) |
| 7+ Person Households | 93 (4.5%) | 0 (0.0%) |
| Total | 1,811 (87.1%) | 269 (12.9%) |
Female Fertility in Guadalupe
Fertility by Age in Guadalupe
Average fertility rate in Guadalupe is 52.0 births per 1,000 women. Women in the age bracket of 20 to 34 years have the highest fertility rate with 78.0 births per 1,000 women. Women in the age bracket of 20 to 34 years acount for 64.1% of all women with births.
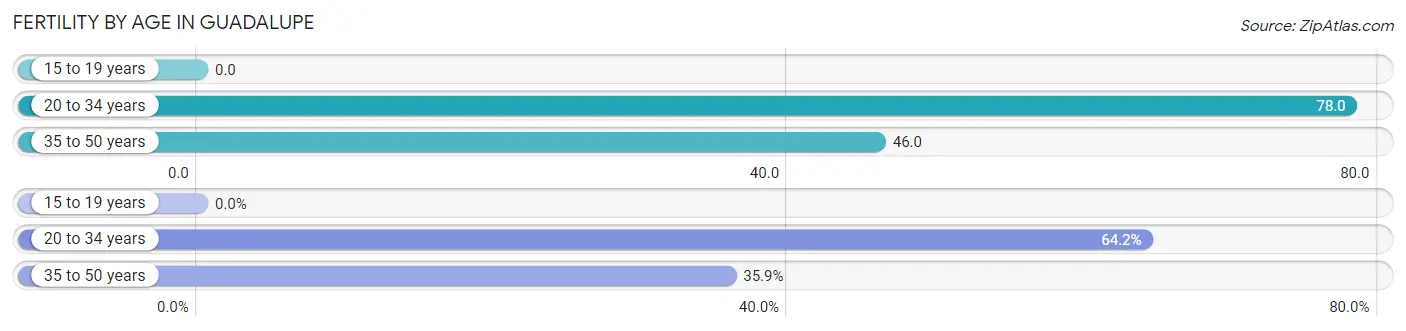
| Age Bracket | Women with Births | Births / 1,000 Women |
| 15 to 19 years | 0 (0.0%) | 0.0 |
| 20 to 34 years | 68 (64.1%) | 78.0 |
| 35 to 50 years | 38 (35.8%) | 46.0 |
| Total | 106 (100.0%) | 52.0 |
Fertility by Age by Marriage Status in Guadalupe
64.2% of women with births (106) in Guadalupe are married. The highest percentage of unmarried women with births falls into 35 to 50 years age bracket with 100.0% of them unmarried at the time of birth, while the lowest percentage of unmarried women with births belong to 20 to 34 years age bracket with 0.0% of them unmarried.
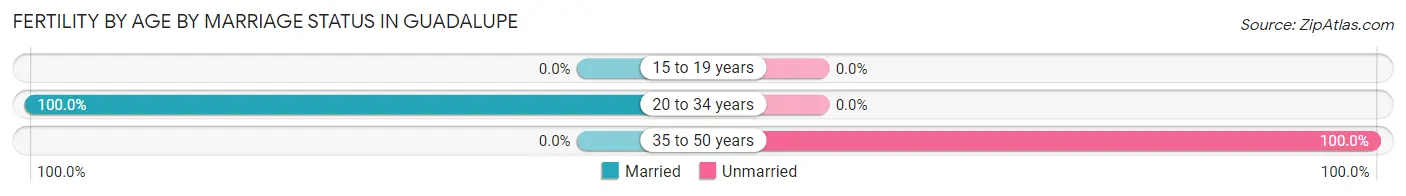
| Age Bracket | Married | Unmarried |
| 15 to 19 years | 0 (0.0%) | 0 (0.0%) |
| 20 to 34 years | 68 (100.0%) | 0 (0.0%) |
| 35 to 50 years | 0 (0.0%) | 38 (100.0%) |
| Total | 68 (64.1%) | 38 (35.8%) |
Fertility by Education in Guadalupe
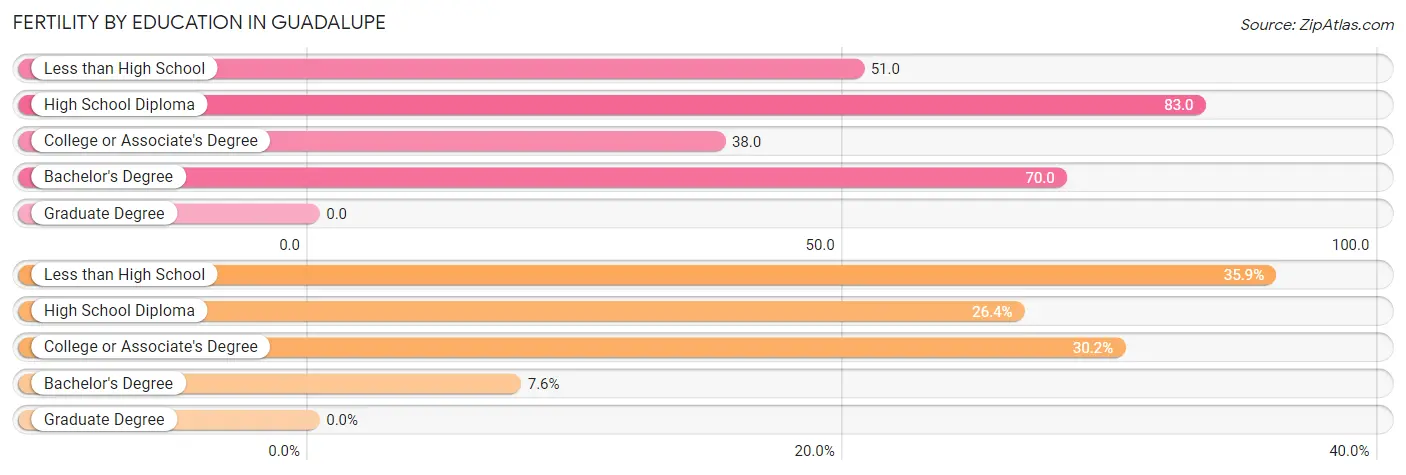
| Educational Attainment | Women with Births | Births / 1,000 Women |
| Less than High School | 38 (35.8%) | 51.0 |
| High School Diploma | 28 (26.4%) | 83.0 |
| College or Associate's Degree | 32 (30.2%) | 38.0 |
| Bachelor's Degree | 8 (7.5%) | 70.0 |
| Graduate Degree | 0 (0.0%) | 0.0 |
| Total | 106 (100.0%) | 52.0 |
Fertility by Education by Marriage Status in Guadalupe
35.8% of women with births in Guadalupe are unmarried. Women with the educational attainment of high school diploma are most likely to be married with 100.0% of them married at childbirth, while women with the educational attainment of less than high school are least likely to be married with 100.0% of them unmarried at childbirth.
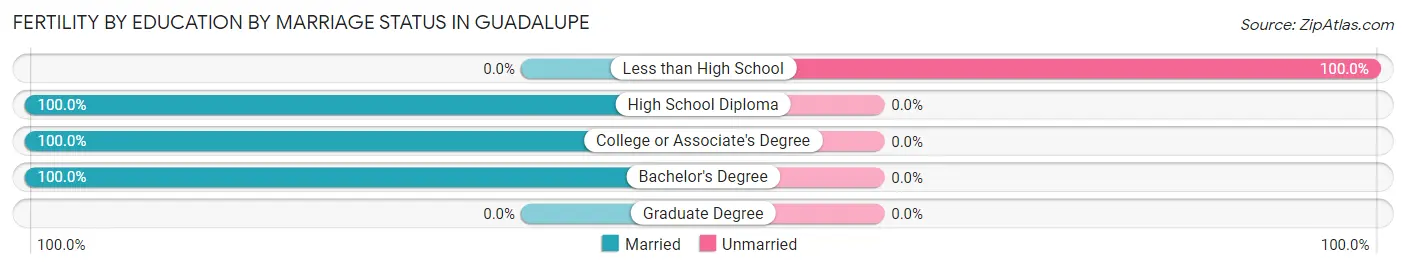
| Educational Attainment | Married | Unmarried |
| Less than High School | 0 (0.0%) | 38 (100.0%) |
| High School Diploma | 28 (100.0%) | 0 (0.0%) |
| College or Associate's Degree | 32 (100.0%) | 0 (0.0%) |
| Bachelor's Degree | 8 (100.0%) | 0 (0.0%) |
| Graduate Degree | 0 (0.0%) | 0 (0.0%) |
| Total | 68 (64.1%) | 38 (35.8%) |
Employment Characteristics in Guadalupe
Employment by Class of Employer in Guadalupe
Among the 3,242 employed individuals in Guadalupe, private company employees (2,483 | 76.6%), local government employees (258 | 8.0%), and self-employed (not incorporated) (184 | 5.7%) make up the most common classes of employment.
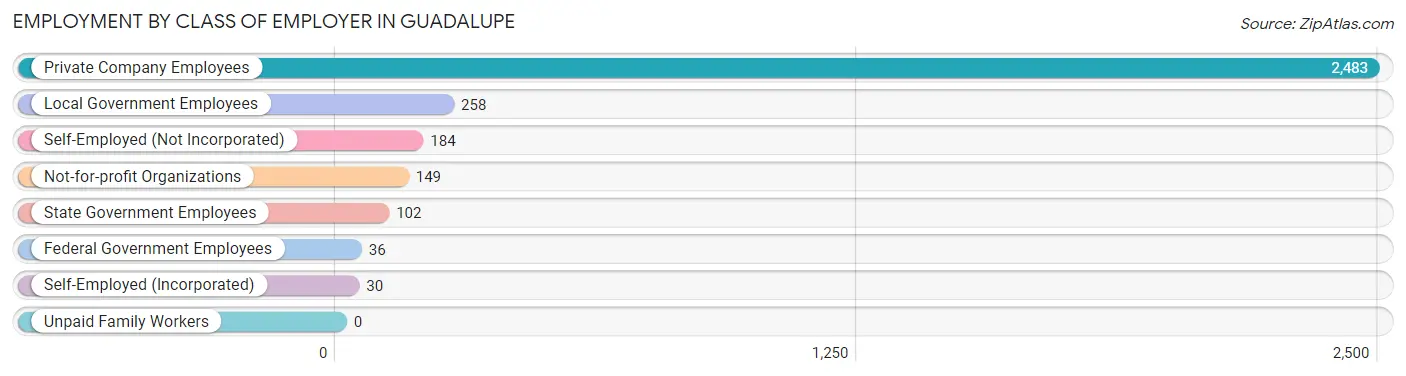
| Employer Class | # Employees | % Employees |
| Private Company Employees | 2,483 | 76.6% |
| Self-Employed (Incorporated) | 30 | 0.9% |
| Self-Employed (Not Incorporated) | 184 | 5.7% |
| Not-for-profit Organizations | 149 | 4.6% |
| Local Government Employees | 258 | 8.0% |
| State Government Employees | 102 | 3.2% |
| Federal Government Employees | 36 | 1.1% |
| Unpaid Family Workers | 0 | 0.0% |
| Total | 3,242 | 100.0% |
Employment Status by Age in Guadalupe
According to the labor force statistics for Guadalupe, out of the total population over 16 years of age (5,661), 66.2% or 3,748 individuals are in the labor force, with 9.5% or 356 of them unemployed. The age group with the highest labor force participation rate is 25 to 29 years, with 93.0% or 556 individuals in the labor force. Within the labor force, the 16 to 19 years age range has the highest percentage of unemployed individuals, with 23.2% or 19 of them being unemployed.
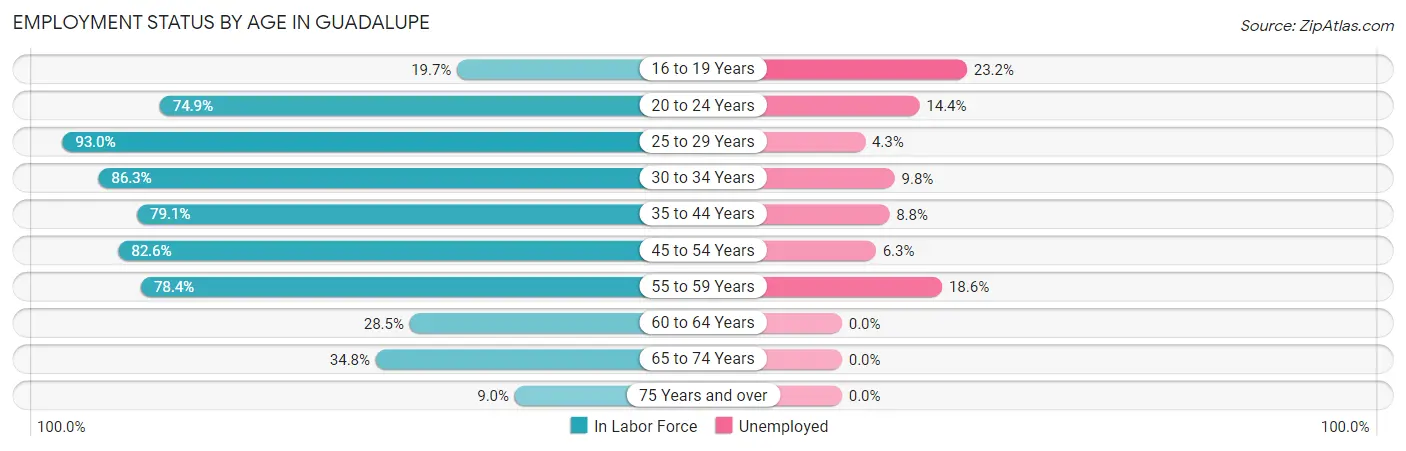
| Age Bracket | In Labor Force | Unemployed |
| 16 to 19 Years | 82 (19.7%) | 19 (23.2%) |
| 20 to 24 Years | 585 (74.9%) | 84 (14.4%) |
| 25 to 29 Years | 556 (93.0%) | 24 (4.3%) |
| 30 to 34 Years | 347 (86.3%) | 34 (9.8%) |
| 35 to 44 Years | 1,002 (79.1%) | 88 (8.8%) |
| 45 to 54 Years | 512 (82.6%) | 32 (6.3%) |
| 55 to 59 Years | 403 (78.4%) | 75 (18.6%) |
| 60 to 64 Years | 89 (28.5%) | 0 (0.0%) |
| 65 to 74 Years | 142 (34.8%) | 0 (0.0%) |
| 75 Years and over | 31 (9.0%) | 0 (0.0%) |
| Total | 3,748 (66.2%) | 356 (9.5%) |
Employment Status by Educational Attainment in Guadalupe
According to labor force statistics for Guadalupe, 78.3% of individuals (2,907) out of the total population between 25 and 64 years of age (3,713) are in the labor force, with 8.7% or 253 of them being unemployed. The group with the highest labor force participation rate are those with the educational attainment of college / associate degree, with 91.3% or 1,045 individuals in the labor force. Within the labor force, individuals with bachelor's degree or higher education have the highest percentage of unemployment, with 14.0% or 39 of them being unemployed.
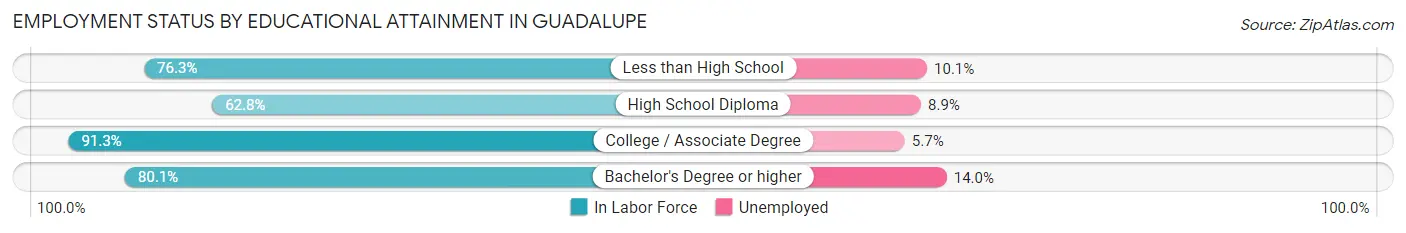
| Educational Attainment | In Labor Force | Unemployed |
| Less than High School | 1,081 (76.3%) | 143 (10.1%) |
| High School Diploma | 505 (62.8%) | 72 (8.9%) |
| College / Associate Degree | 1,045 (91.3%) | 65 (5.7%) |
| Bachelor's Degree or higher | 278 (80.1%) | 49 (14.0%) |
| Total | 2,907 (78.3%) | 323 (8.7%) |
Employment Occupations by Sex in Guadalupe
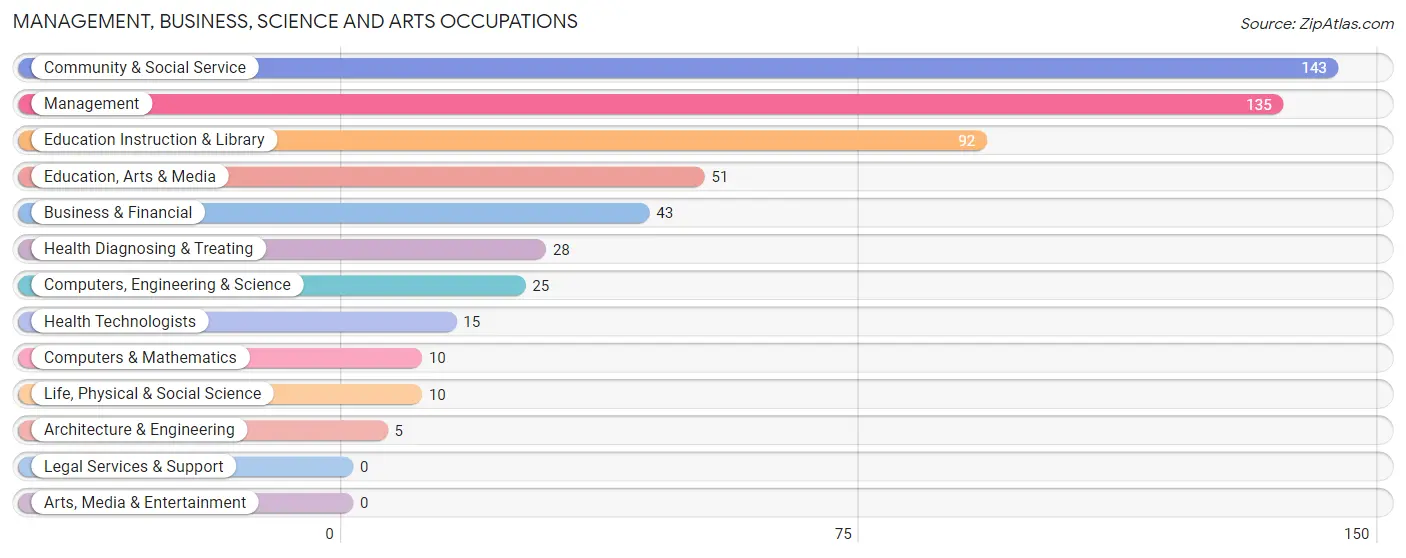
Management, Business, Science and Arts Occupations
The most common Management, Business, Science and Arts occupations in Guadalupe are Community & Social Service (143 | 4.2%), Management (135 | 4.0%), Education Instruction & Library (92 | 2.7%), Education, Arts & Media (51 | 1.5%), and Business & Financial (43 | 1.3%).
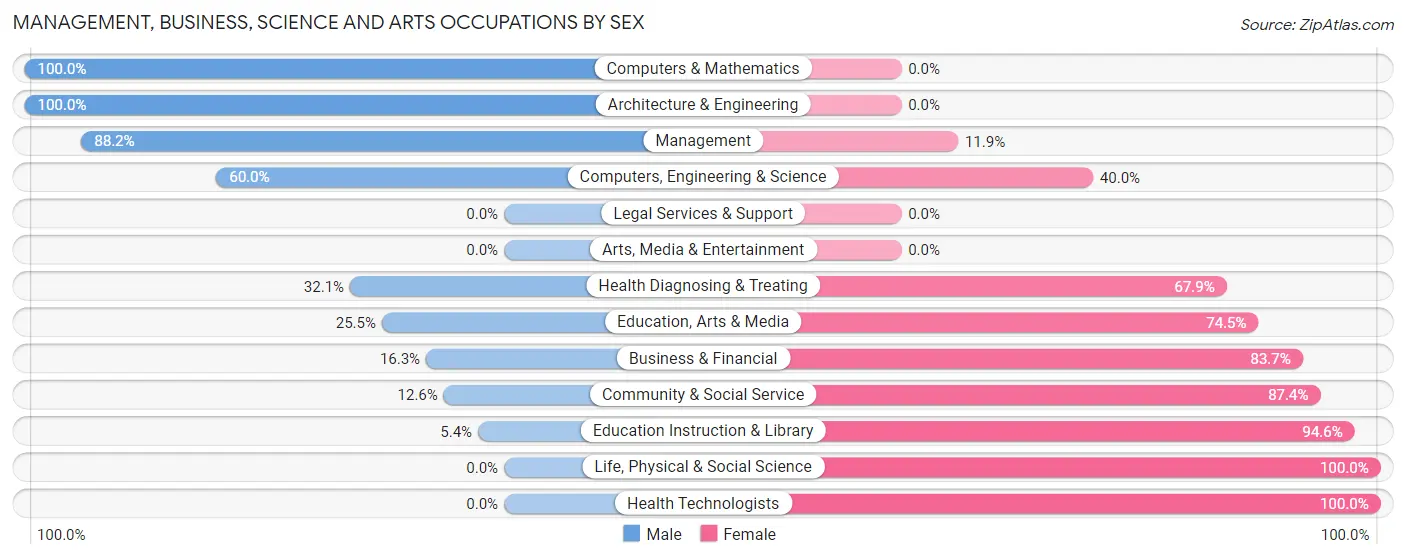
Management, Business, Science and Arts Occupations by Sex
Within the Management, Business, Science and Arts occupations in Guadalupe, the most male-oriented occupations are Computers & Mathematics (100.0%), Architecture & Engineering (100.0%), and Management (88.1%), while the most female-oriented occupations are Life, Physical & Social Science (100.0%), Health Technologists (100.0%), and Education Instruction & Library (94.6%).
| Occupation | Male | Female |
| Management | 119 (88.1%) | 16 (11.8%) |
| Business & Financial | 7 (16.3%) | 36 (83.7%) |
| Computers, Engineering & Science | 15 (60.0%) | 10 (40.0%) |
| Computers & Mathematics | 10 (100.0%) | 0 (0.0%) |
| Architecture & Engineering | 5 (100.0%) | 0 (0.0%) |
| Life, Physical & Social Science | 0 (0.0%) | 10 (100.0%) |
| Community & Social Service | 18 (12.6%) | 125 (87.4%) |
| Education, Arts & Media | 13 (25.5%) | 38 (74.5%) |
| Legal Services & Support | 0 (0.0%) | 0 (0.0%) |
| Education Instruction & Library | 5 (5.4%) | 87 (94.6%) |
| Arts, Media & Entertainment | 0 (0.0%) | 0 (0.0%) |
| Health Diagnosing & Treating | 9 (32.1%) | 19 (67.9%) |
| Health Technologists | 0 (0.0%) | 15 (100.0%) |
| Total (Category) | 168 (44.9%) | 206 (55.1%) |
| Total (Overall) | 2,022 (59.6%) | 1,371 (40.4%) |
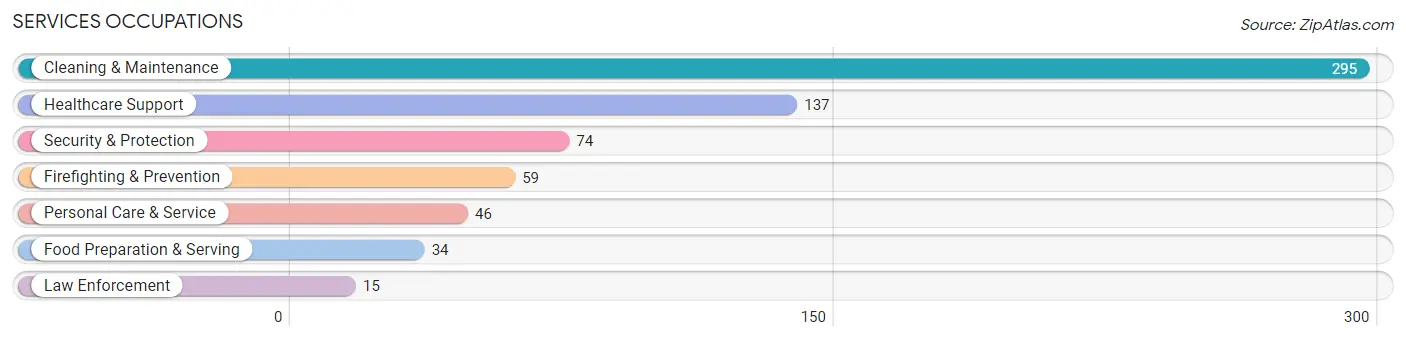
Services Occupations
The most common Services occupations in Guadalupe are Cleaning & Maintenance (295 | 8.7%), Healthcare Support (137 | 4.0%), Security & Protection (74 | 2.2%), Firefighting & Prevention (59 | 1.7%), and Personal Care & Service (46 | 1.4%).
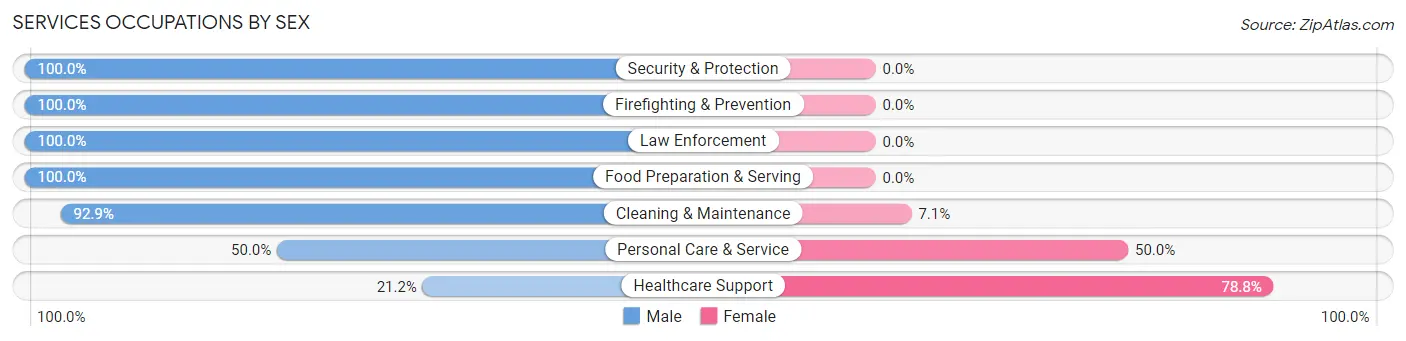
Services Occupations by Sex
Within the Services occupations in Guadalupe, the most male-oriented occupations are Security & Protection (100.0%), Firefighting & Prevention (100.0%), and Law Enforcement (100.0%), while the most female-oriented occupations are Healthcare Support (78.8%), Personal Care & Service (50.0%), and Cleaning & Maintenance (7.1%).
| Occupation | Male | Female |
| Healthcare Support | 29 (21.2%) | 108 (78.8%) |
| Security & Protection | 74 (100.0%) | 0 (0.0%) |
| Firefighting & Prevention | 59 (100.0%) | 0 (0.0%) |
| Law Enforcement | 15 (100.0%) | 0 (0.0%) |
| Food Preparation & Serving | 34 (100.0%) | 0 (0.0%) |
| Cleaning & Maintenance | 274 (92.9%) | 21 (7.1%) |
| Personal Care & Service | 23 (50.0%) | 23 (50.0%) |
| Total (Category) | 434 (74.1%) | 152 (25.9%) |
| Total (Overall) | 2,022 (59.6%) | 1,371 (40.4%) |
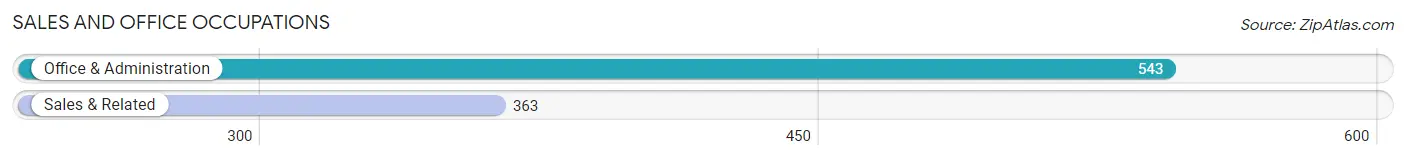
Sales and Office Occupations
The most common Sales and Office occupations in Guadalupe are Office & Administration (543 | 16.0%), and Sales & Related (363 | 10.7%).
Sales and Office Occupations by Sex
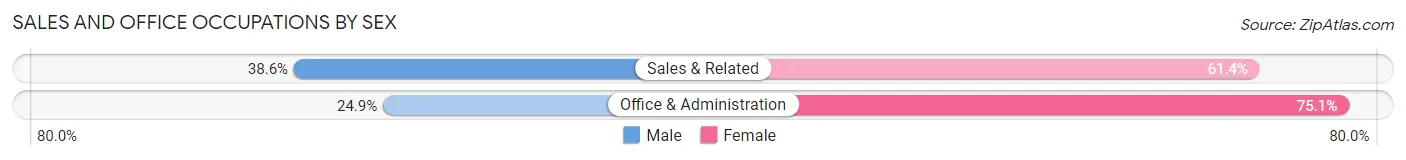
| Occupation | Male | Female |
| Sales & Related | 140 (38.6%) | 223 (61.4%) |
| Office & Administration | 135 (24.9%) | 408 (75.1%) |
| Total (Category) | 275 (30.3%) | 631 (69.7%) |
| Total (Overall) | 2,022 (59.6%) | 1,371 (40.4%) |
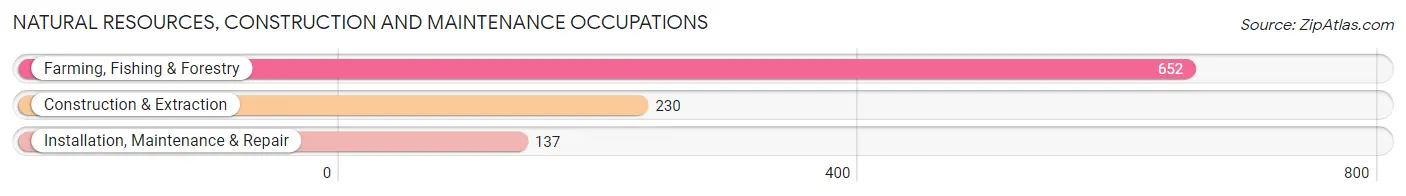
Natural Resources, Construction and Maintenance Occupations
The most common Natural Resources, Construction and Maintenance occupations in Guadalupe are Farming, Fishing & Forestry (652 | 19.2%), Construction & Extraction (230 | 6.8%), and Installation, Maintenance & Repair (137 | 4.0%).
Natural Resources, Construction and Maintenance Occupations by Sex
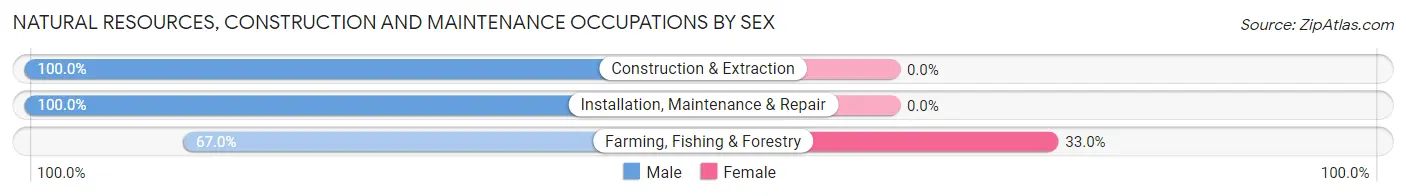
| Occupation | Male | Female |
| Farming, Fishing & Forestry | 437 (67.0%) | 215 (33.0%) |
| Construction & Extraction | 230 (100.0%) | 0 (0.0%) |
| Installation, Maintenance & Repair | 137 (100.0%) | 0 (0.0%) |
| Total (Category) | 804 (78.9%) | 215 (21.1%) |
| Total (Overall) | 2,022 (59.6%) | 1,371 (40.4%) |
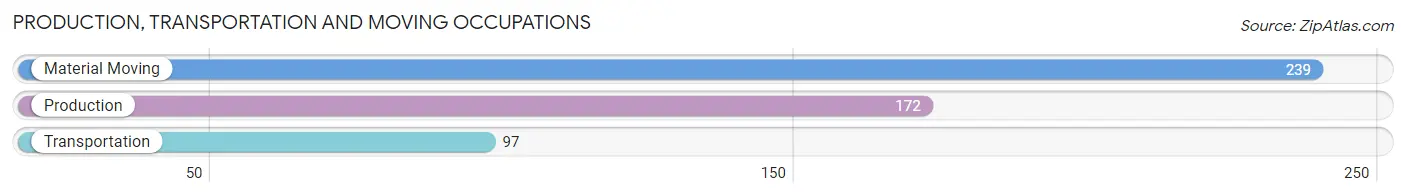
Production, Transportation and Moving Occupations
The most common Production, Transportation and Moving occupations in Guadalupe are Material Moving (239 | 7.0%), Production (172 | 5.1%), and Transportation (97 | 2.9%).
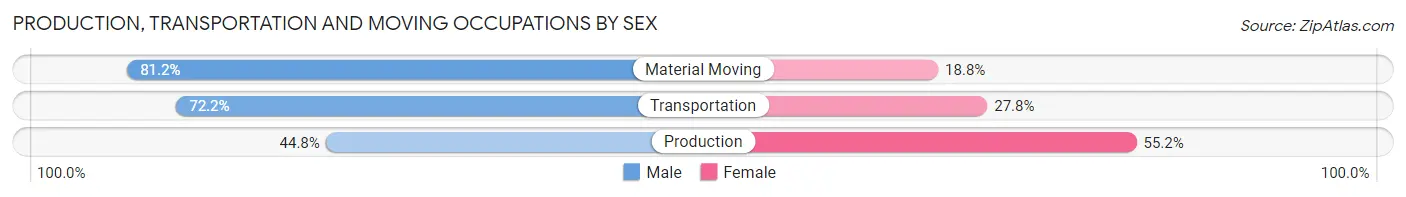
Production, Transportation and Moving Occupations by Sex
| Occupation | Male | Female |
| Production | 77 (44.8%) | 95 (55.2%) |
| Transportation | 70 (72.2%) | 27 (27.8%) |
| Material Moving | 194 (81.2%) | 45 (18.8%) |
| Total (Category) | 341 (67.1%) | 167 (32.9%) |
| Total (Overall) | 2,022 (59.6%) | 1,371 (40.4%) |
Employment Industries by Sex in Guadalupe
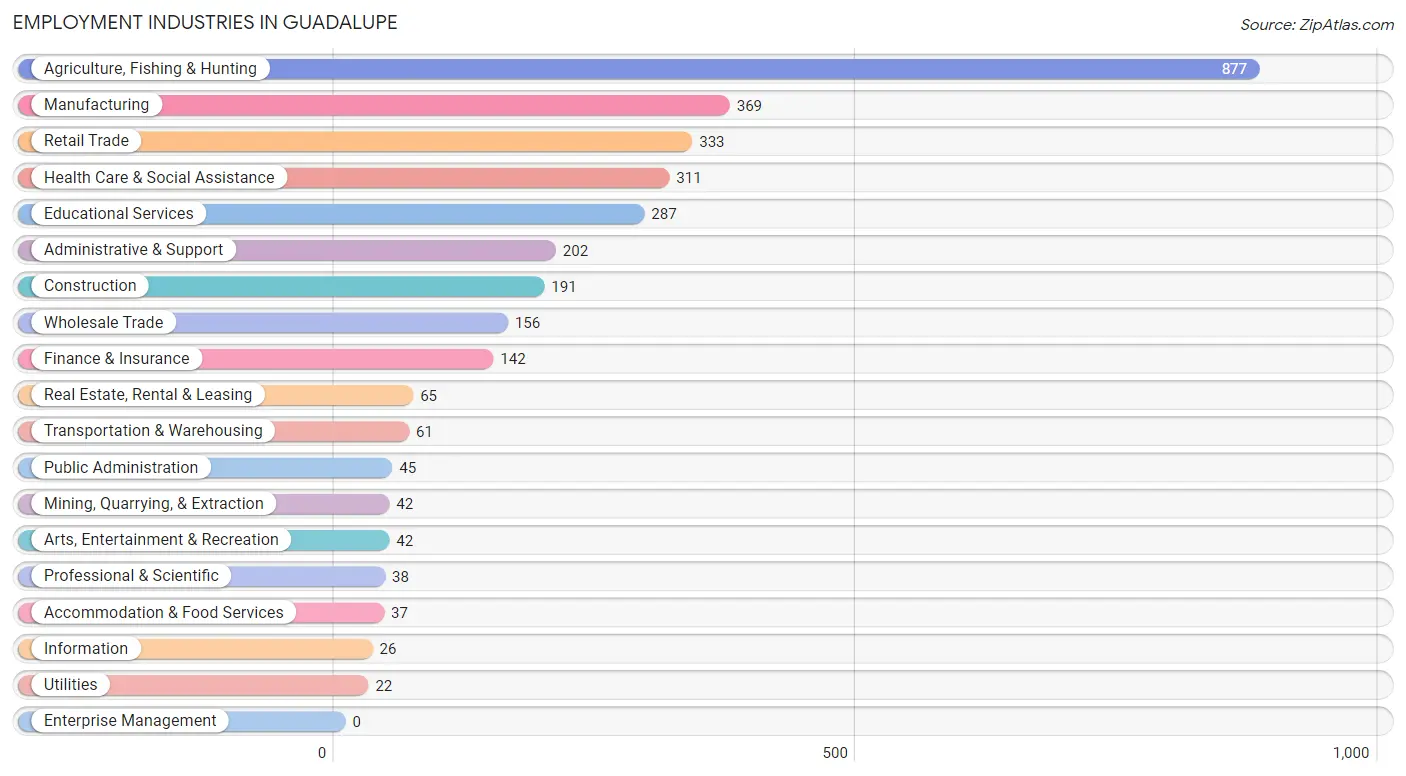
Employment Industries in Guadalupe
The major employment industries in Guadalupe include Agriculture, Fishing & Hunting (877 | 25.9%), Manufacturing (369 | 10.9%), Retail Trade (333 | 9.8%), Health Care & Social Assistance (311 | 9.2%), and Educational Services (287 | 8.5%).
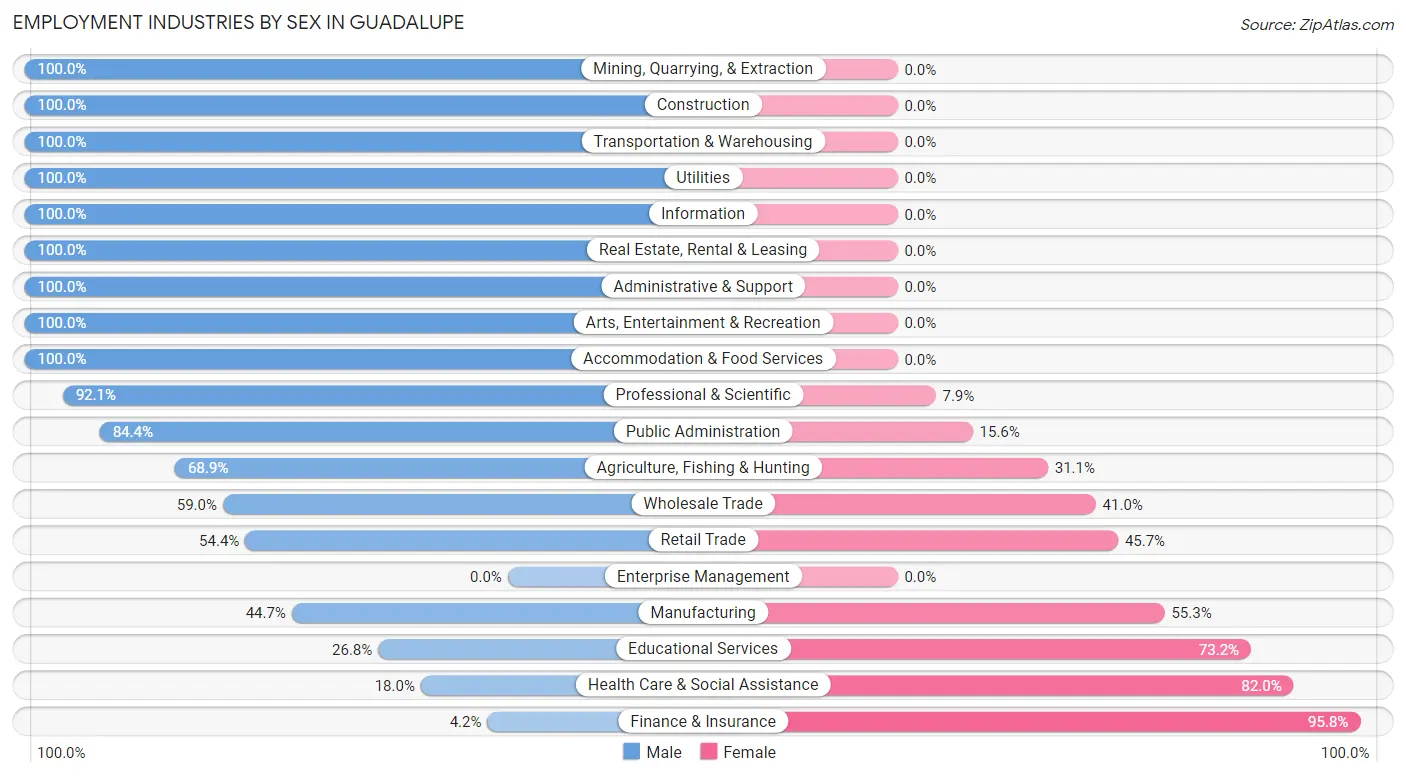
Employment Industries by Sex in Guadalupe
The Guadalupe industries that see more men than women are Mining, Quarrying, & Extraction (100.0%), Construction (100.0%), and Transportation & Warehousing (100.0%), whereas the industries that tend to have a higher number of women are Finance & Insurance (95.8%), Health Care & Social Assistance (82.0%), and Educational Services (73.2%).
| Industry | Male | Female |
| Agriculture, Fishing & Hunting | 604 (68.9%) | 273 (31.1%) |
| Mining, Quarrying, & Extraction | 42 (100.0%) | 0 (0.0%) |
| Construction | 191 (100.0%) | 0 (0.0%) |
| Manufacturing | 165 (44.7%) | 204 (55.3%) |
| Wholesale Trade | 92 (59.0%) | 64 (41.0%) |
| Retail Trade | 181 (54.3%) | 152 (45.7%) |
| Transportation & Warehousing | 61 (100.0%) | 0 (0.0%) |
| Utilities | 22 (100.0%) | 0 (0.0%) |
| Information | 26 (100.0%) | 0 (0.0%) |
| Finance & Insurance | 6 (4.2%) | 136 (95.8%) |
| Real Estate, Rental & Leasing | 65 (100.0%) | 0 (0.0%) |
| Professional & Scientific | 35 (92.1%) | 3 (7.9%) |
| Enterprise Management | 0 (0.0%) | 0 (0.0%) |
| Administrative & Support | 202 (100.0%) | 0 (0.0%) |
| Educational Services | 77 (26.8%) | 210 (73.2%) |
| Health Care & Social Assistance | 56 (18.0%) | 255 (82.0%) |
| Arts, Entertainment & Recreation | 42 (100.0%) | 0 (0.0%) |
| Accommodation & Food Services | 37 (100.0%) | 0 (0.0%) |
| Public Administration | 38 (84.4%) | 7 (15.6%) |
| Total | 2,022 (59.6%) | 1,371 (40.4%) |
Education in Guadalupe
School Enrollment in Guadalupe
The most common levels of schooling among the 2,536 students in Guadalupe are high school (688 | 27.1%), elementary school (660 | 26.0%), and middle school (549 | 21.6%).
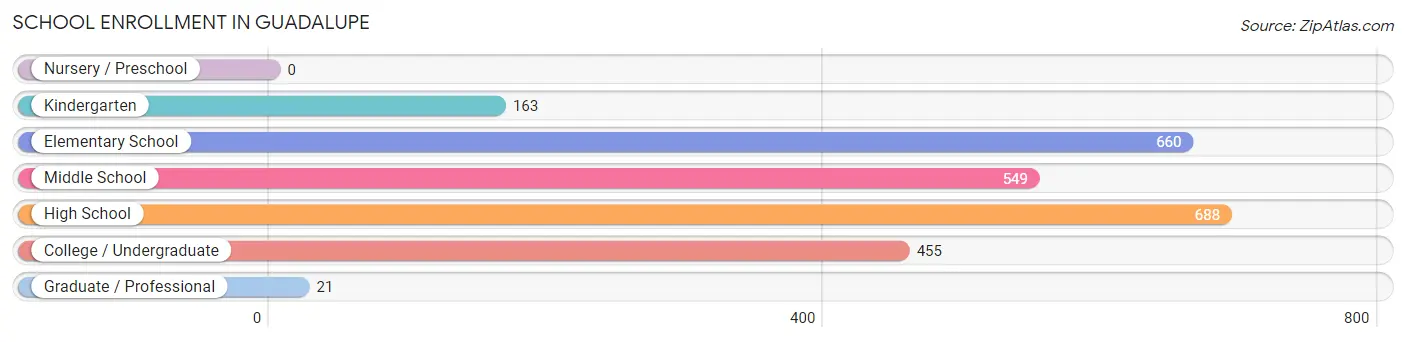
| School Level | # Students | % Students |
| Nursery / Preschool | 0 | 0.0% |
| Kindergarten | 163 | 6.4% |
| Elementary School | 660 | 26.0% |
| Middle School | 549 | 21.6% |
| High School | 688 | 27.1% |
| College / Undergraduate | 455 | 17.9% |
| Graduate / Professional | 21 | 0.8% |
| Total | 2,536 | 100.0% |
School Enrollment by Age by Funding Source in Guadalupe
Out of a total of 2,536 students who are enrolled in schools in Guadalupe, 30 (1.2%) attend a private institution, while the remaining 2,506 (98.8%) are enrolled in public schools. The age group of 20 to 24 year olds has the highest likelihood of being enrolled in private schools, with 11 (4.9% in the age bracket) enrolled. Conversely, the age group of 15 to 17 year olds has the lowest likelihood of being enrolled in a private school, with 462 (100.0% in the age bracket) attending a public institution.
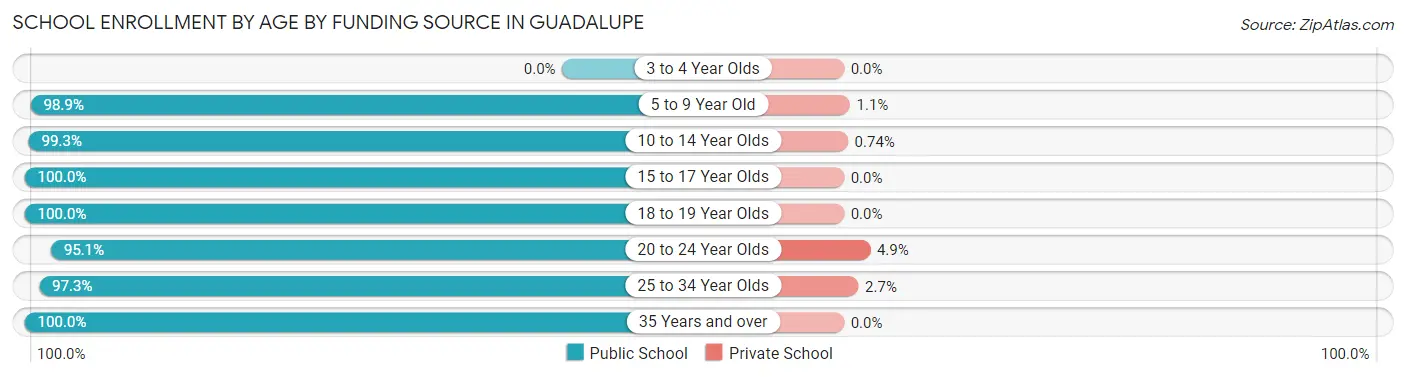
| Age Bracket | Public School | Private School |
| 3 to 4 Year Olds | 0 (0.0%) | 0 (0.0%) |
| 5 to 9 Year Old | 721 (98.9%) | 8 (1.1%) |
| 10 to 14 Year Olds | 804 (99.3%) | 6 (0.7%) |
| 15 to 17 Year Olds | 462 (100.0%) | 0 (0.0%) |
| 18 to 19 Year Olds | 71 (100.0%) | 0 (0.0%) |
| 20 to 24 Year Olds | 214 (95.1%) | 11 (4.9%) |
| 25 to 34 Year Olds | 180 (97.3%) | 5 (2.7%) |
| 35 Years and over | 54 (100.0%) | 0 (0.0%) |
| Total | 2,506 (98.8%) | 30 (1.2%) |
Educational Attainment by Field of Study in Guadalupe
Social sciences (99 | 23.4%), business (74 | 17.4%), psychology (37 | 8.7%), liberal arts & history (37 | 8.7%), and engineering (35 | 8.3%) are the most common fields of study among 424 individuals in Guadalupe who have obtained a bachelor's degree or higher.
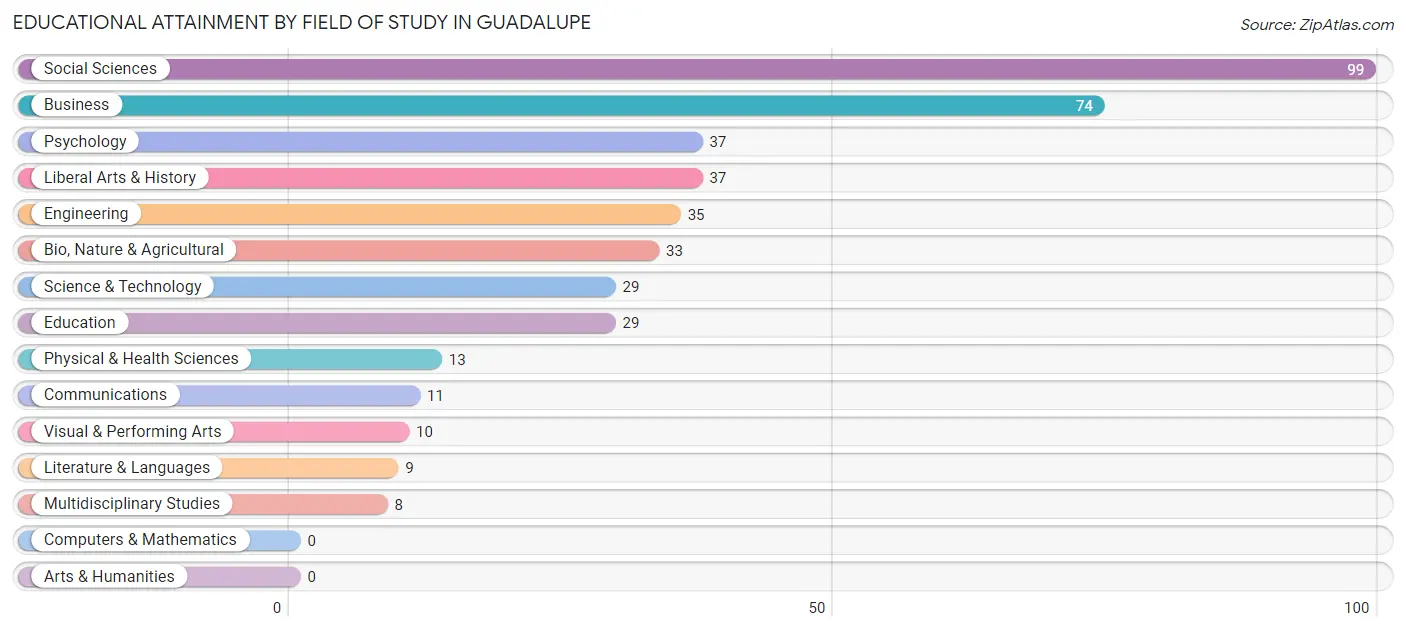
| Field of Study | # Graduates | % Graduates |
| Computers & Mathematics | 0 | 0.0% |
| Bio, Nature & Agricultural | 33 | 7.8% |
| Physical & Health Sciences | 13 | 3.1% |
| Psychology | 37 | 8.7% |
| Social Sciences | 99 | 23.4% |
| Engineering | 35 | 8.3% |
| Multidisciplinary Studies | 8 | 1.9% |
| Science & Technology | 29 | 6.8% |
| Business | 74 | 17.4% |
| Education | 29 | 6.8% |
| Literature & Languages | 9 | 2.1% |
| Liberal Arts & History | 37 | 8.7% |
| Visual & Performing Arts | 10 | 2.4% |
| Communications | 11 | 2.6% |
| Arts & Humanities | 0 | 0.0% |
| Total | 424 | 100.0% |
Transportation & Commute in Guadalupe
Vehicle Availability by Sex in Guadalupe
The most prevalent vehicle ownership categories in Guadalupe are males with 2 vehicles (746, accounting for 38.7%) and females with 2 vehicles (434, making up 56.8%).
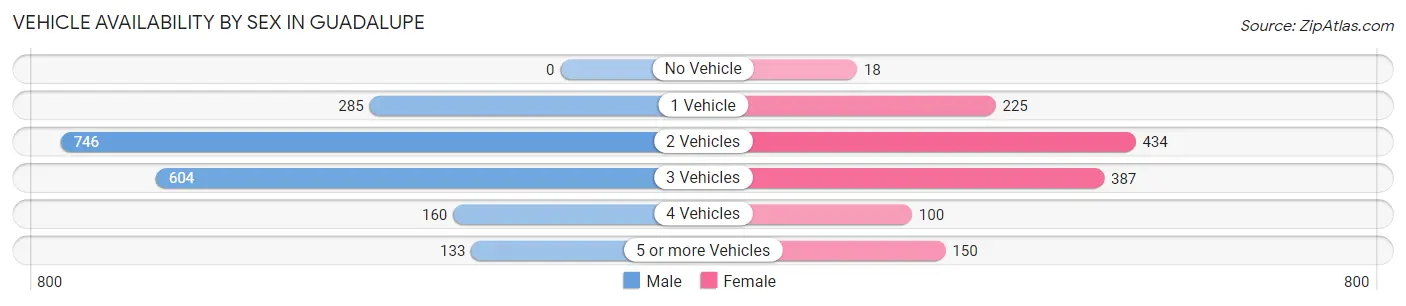
| Vehicles Available | Male | Female |
| No Vehicle | 0 (0.0%) | 18 (1.4%) |
| 1 Vehicle | 285 (14.8%) | 225 (17.1%) |
| 2 Vehicles | 746 (38.7%) | 434 (33.0%) |
| 3 Vehicles | 604 (31.3%) | 387 (29.4%) |
| 4 Vehicles | 160 (8.3%) | 100 (7.6%) |
| 5 or more Vehicles | 133 (6.9%) | 150 (11.4%) |
| Total | 1,928 (100.0%) | 1,314 (100.0%) |
Commute Time in Guadalupe
The most frequently occuring commute durations in Guadalupe are 15 to 19 minutes (662 commuters, 21.0%), 20 to 24 minutes (532 commuters, 16.9%), and 25 to 29 minutes (495 commuters, 15.7%).
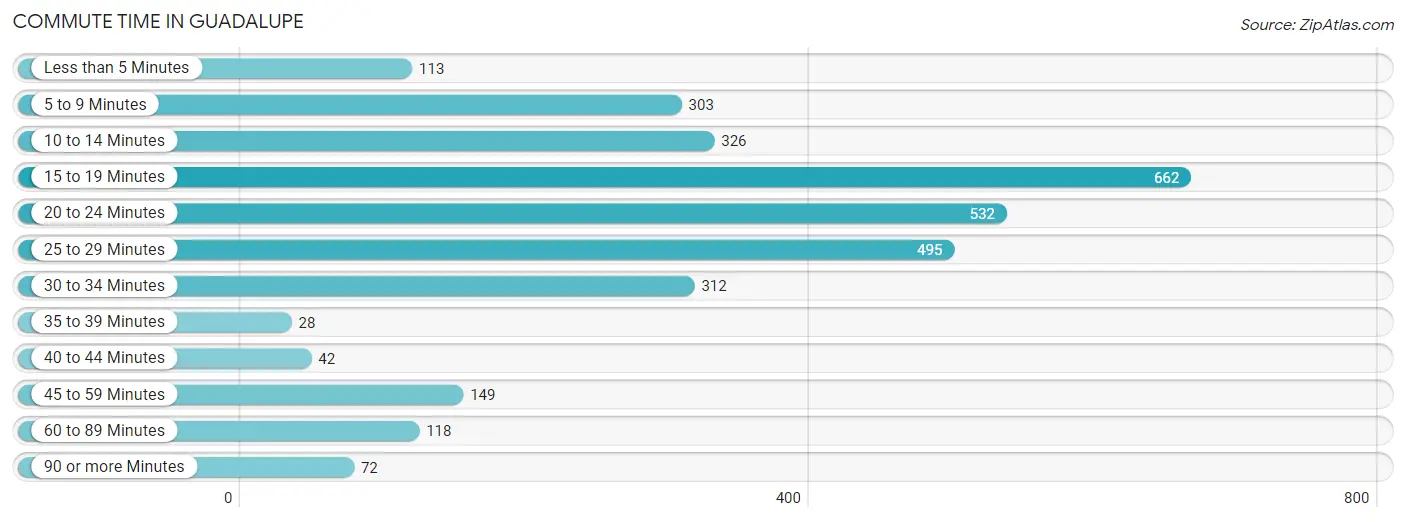
| Commute Time | # Commuters | % Commuters |
| Less than 5 Minutes | 113 | 3.6% |
| 5 to 9 Minutes | 303 | 9.6% |
| 10 to 14 Minutes | 326 | 10.3% |
| 15 to 19 Minutes | 662 | 21.0% |
| 20 to 24 Minutes | 532 | 16.9% |
| 25 to 29 Minutes | 495 | 15.7% |
| 30 to 34 Minutes | 312 | 9.9% |
| 35 to 39 Minutes | 28 | 0.9% |
| 40 to 44 Minutes | 42 | 1.3% |
| 45 to 59 Minutes | 149 | 4.7% |
| 60 to 89 Minutes | 118 | 3.7% |
| 90 or more Minutes | 72 | 2.3% |
Commute Time by Sex in Guadalupe
The most common commute times in Guadalupe are 15 to 19 minutes (409 commuters, 21.6%) for males and 15 to 19 minutes (253 commuters, 20.1%) for females.
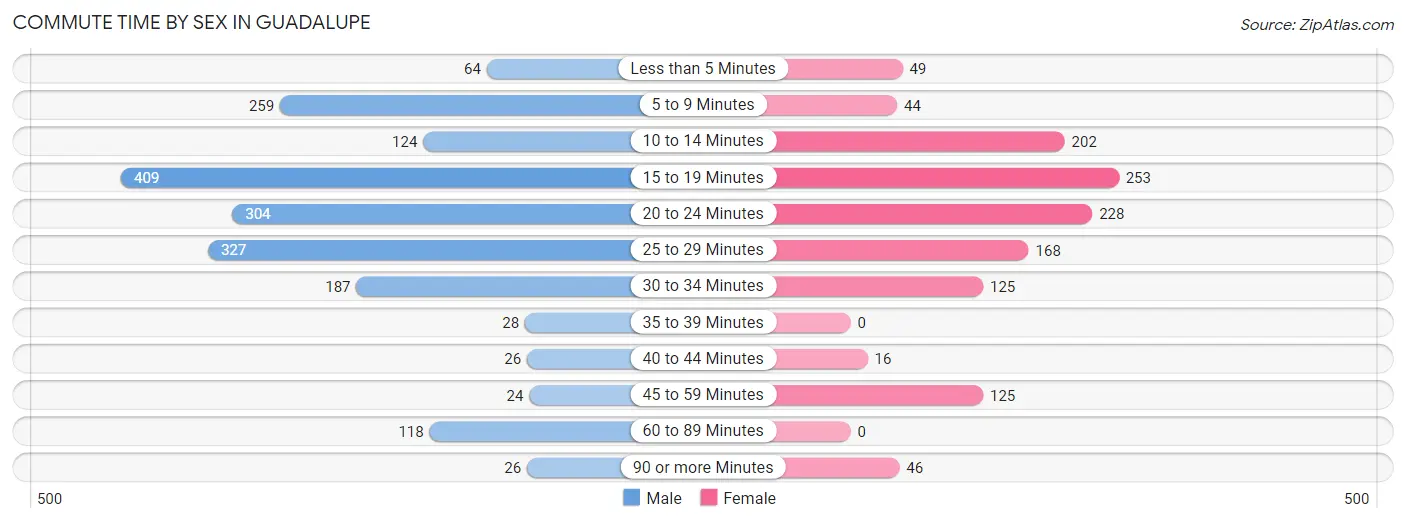
| Commute Time | Male | Female |
| Less than 5 Minutes | 64 (3.4%) | 49 (3.9%) |
| 5 to 9 Minutes | 259 (13.7%) | 44 (3.5%) |
| 10 to 14 Minutes | 124 (6.5%) | 202 (16.1%) |
| 15 to 19 Minutes | 409 (21.6%) | 253 (20.1%) |
| 20 to 24 Minutes | 304 (16.0%) | 228 (18.1%) |
| 25 to 29 Minutes | 327 (17.2%) | 168 (13.4%) |
| 30 to 34 Minutes | 187 (9.9%) | 125 (10.0%) |
| 35 to 39 Minutes | 28 (1.5%) | 0 (0.0%) |
| 40 to 44 Minutes | 26 (1.4%) | 16 (1.3%) |
| 45 to 59 Minutes | 24 (1.3%) | 125 (10.0%) |
| 60 to 89 Minutes | 118 (6.2%) | 0 (0.0%) |
| 90 or more Minutes | 26 (1.4%) | 46 (3.7%) |
Time of Departure to Work by Sex in Guadalupe
The most frequent times of departure to work in Guadalupe are 5:00 AM to 5:29 AM (330, 17.4%) for males and 7:30 AM to 7:59 AM (260, 20.7%) for females.
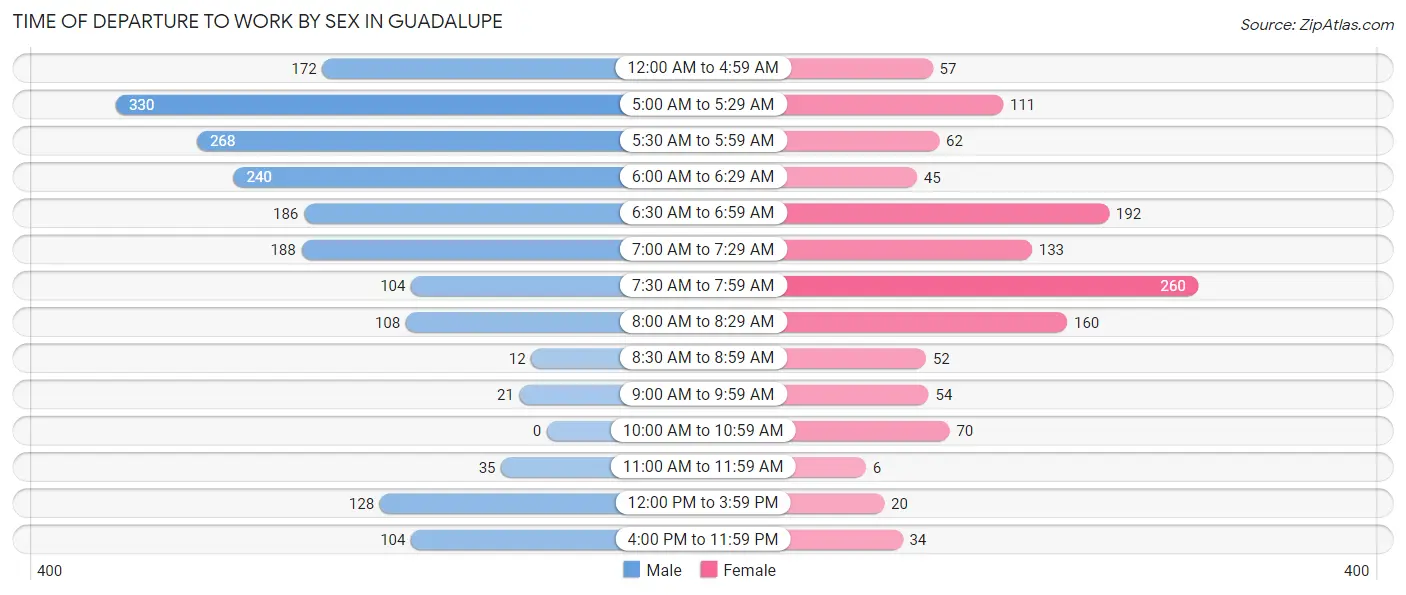
| Time of Departure | Male | Female |
| 12:00 AM to 4:59 AM | 172 (9.1%) | 57 (4.5%) |
| 5:00 AM to 5:29 AM | 330 (17.4%) | 111 (8.8%) |
| 5:30 AM to 5:59 AM | 268 (14.1%) | 62 (4.9%) |
| 6:00 AM to 6:29 AM | 240 (12.7%) | 45 (3.6%) |
| 6:30 AM to 6:59 AM | 186 (9.8%) | 192 (15.3%) |
| 7:00 AM to 7:29 AM | 188 (9.9%) | 133 (10.6%) |
| 7:30 AM to 7:59 AM | 104 (5.5%) | 260 (20.7%) |
| 8:00 AM to 8:29 AM | 108 (5.7%) | 160 (12.7%) |
| 8:30 AM to 8:59 AM | 12 (0.6%) | 52 (4.1%) |
| 9:00 AM to 9:59 AM | 21 (1.1%) | 54 (4.3%) |
| 10:00 AM to 10:59 AM | 0 (0.0%) | 70 (5.6%) |
| 11:00 AM to 11:59 AM | 35 (1.8%) | 6 (0.5%) |
| 12:00 PM to 3:59 PM | 128 (6.8%) | 20 (1.6%) |
| 4:00 PM to 11:59 PM | 104 (5.5%) | 34 (2.7%) |
| Total | 1,896 (100.0%) | 1,256 (100.0%) |
Housing Occupancy in Guadalupe
Occupancy by Ownership in Guadalupe
Of the total 2,080 dwellings in Guadalupe, owner-occupied units account for 1,092 (52.5%), while renter-occupied units make up 988 (47.5%).
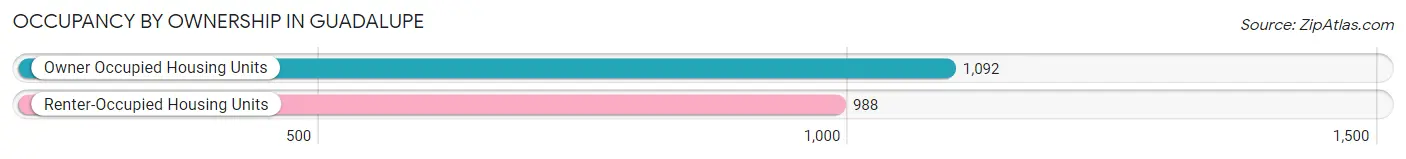
| Occupancy | # Housing Units | % Housing Units |
| Owner Occupied Housing Units | 1,092 | 52.5% |
| Renter-Occupied Housing Units | 988 | 47.5% |
| Total Occupied Housing Units | 2,080 | 100.0% |
Occupancy by Household Size in Guadalupe
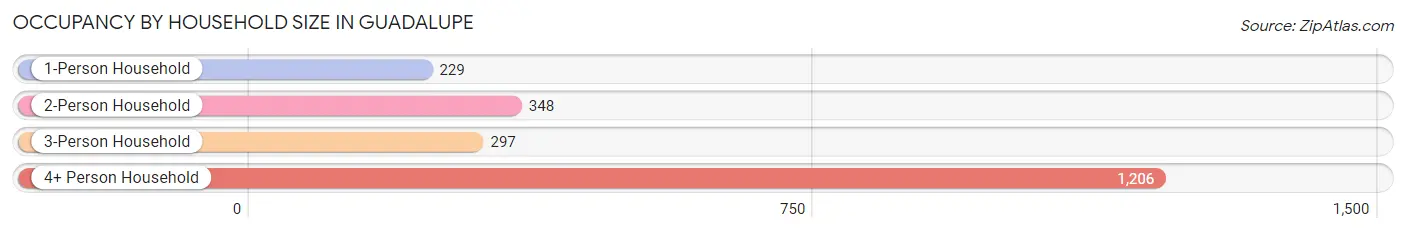
| Household Size | # Housing Units | % Housing Units |
| 1-Person Household | 229 | 11.0% |
| 2-Person Household | 348 | 16.7% |
| 3-Person Household | 297 | 14.3% |
| 4+ Person Household | 1,206 | 58.0% |
| Total Housing Units | 2,080 | 100.0% |
Occupancy by Ownership by Household Size in Guadalupe
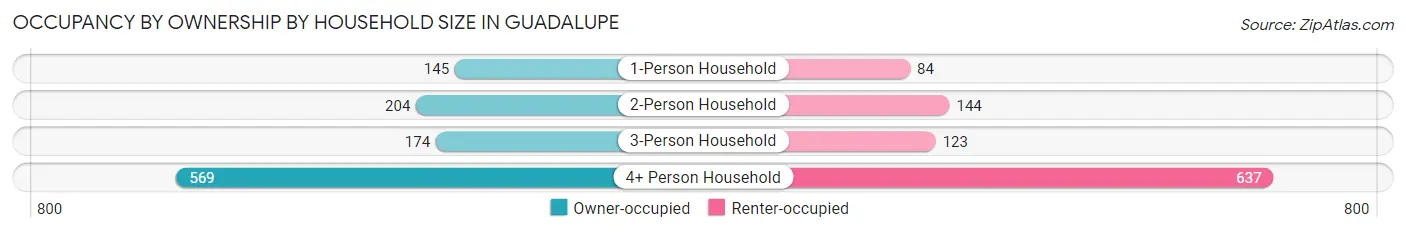
| Household Size | Owner-occupied | Renter-occupied |
| 1-Person Household | 145 (63.3%) | 84 (36.7%) |
| 2-Person Household | 204 (58.6%) | 144 (41.4%) |
| 3-Person Household | 174 (58.6%) | 123 (41.4%) |
| 4+ Person Household | 569 (47.2%) | 637 (52.8%) |
| Total Housing Units | 1,092 (52.5%) | 988 (47.5%) |
Occupancy by Educational Attainment in Guadalupe
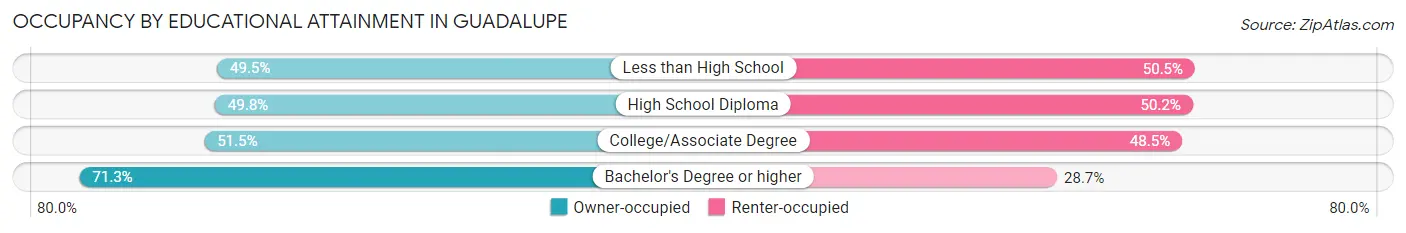
| Household Size | Owner-occupied | Renter-occupied |
| Less than High School | 461 (49.5%) | 471 (50.5%) |
| High School Diploma | 129 (49.8%) | 130 (50.2%) |
| College/Associate Degree | 343 (51.5%) | 323 (48.5%) |
| Bachelor's Degree or higher | 159 (71.3%) | 64 (28.7%) |
Occupancy by Age of Householder in Guadalupe
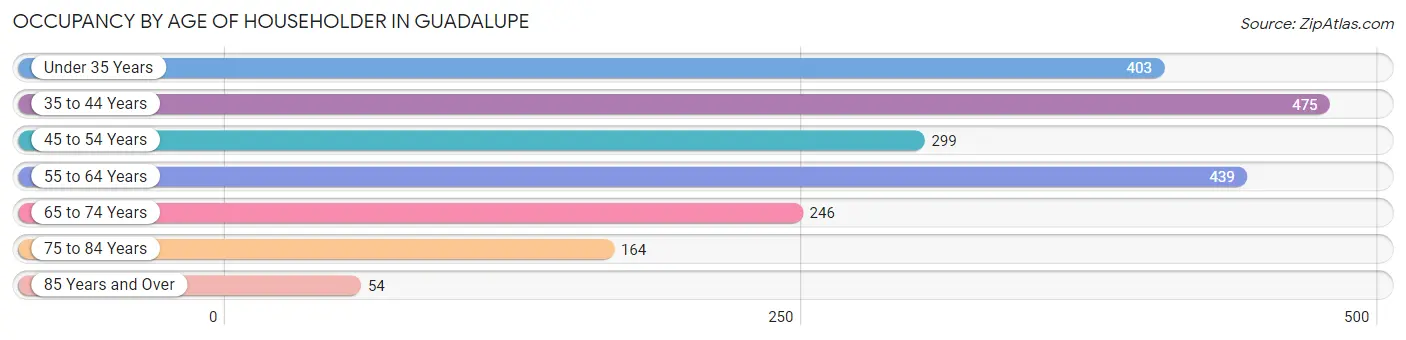
| Age Bracket | # Households | % Households |
| Under 35 Years | 403 | 19.4% |
| 35 to 44 Years | 475 | 22.8% |
| 45 to 54 Years | 299 | 14.4% |
| 55 to 64 Years | 439 | 21.1% |
| 65 to 74 Years | 246 | 11.8% |
| 75 to 84 Years | 164 | 7.9% |
| 85 Years and Over | 54 | 2.6% |
| Total | 2,080 | 100.0% |
Housing Finances in Guadalupe
Median Income by Occupancy in Guadalupe
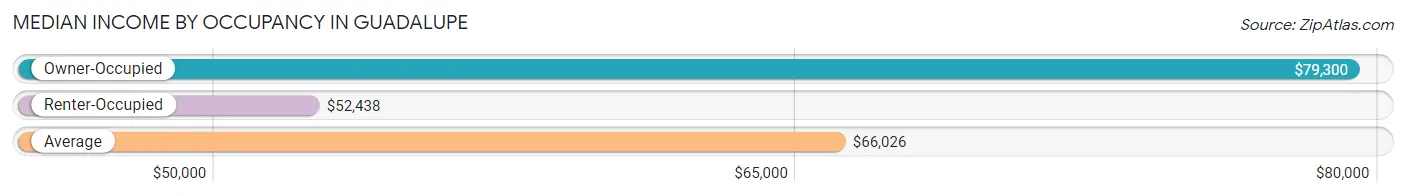
| Occupancy Type | # Households | Median Income |
| Owner-Occupied | 1,092 (52.5%) | $79,300 |
| Renter-Occupied | 988 (47.5%) | $52,438 |
| Average | 2,080 (100.0%) | $66,026 |
Occupancy by Householder Income Bracket in Guadalupe
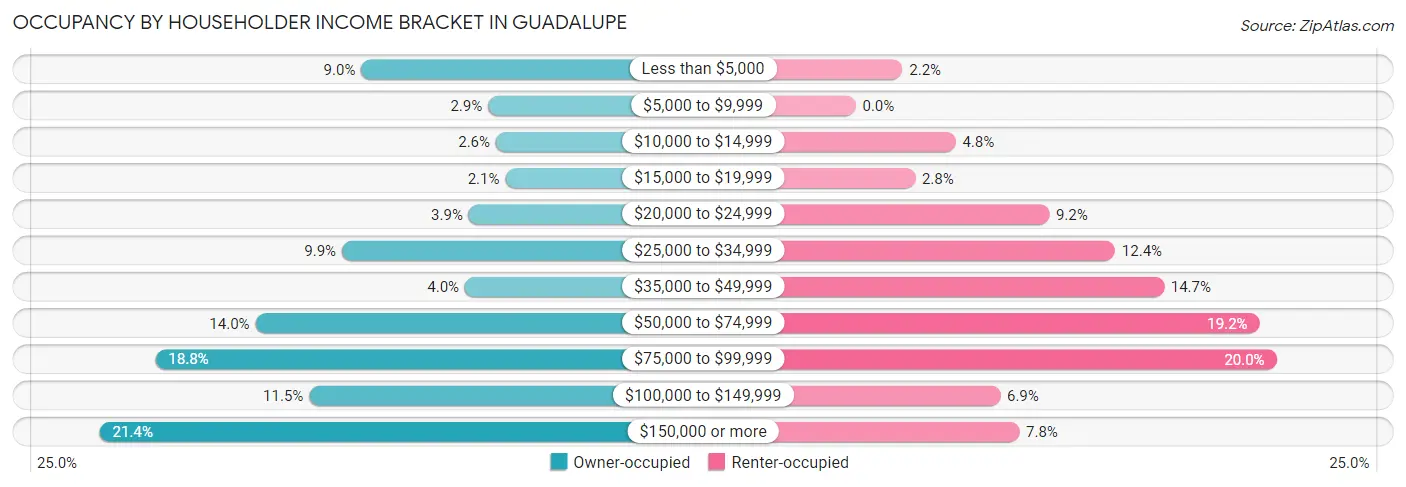
| Income Bracket | Owner-occupied | Renter-occupied |
| Less than $5,000 | 98 (9.0%) | 22 (2.2%) |
| $5,000 to $9,999 | 32 (2.9%) | 0 (0.0%) |
| $10,000 to $14,999 | 28 (2.6%) | 47 (4.8%) |
| $15,000 to $19,999 | 23 (2.1%) | 28 (2.8%) |
| $20,000 to $24,999 | 42 (3.8%) | 91 (9.2%) |
| $25,000 to $34,999 | 108 (9.9%) | 122 (12.3%) |
| $35,000 to $49,999 | 44 (4.0%) | 145 (14.7%) |
| $50,000 to $74,999 | 153 (14.0%) | 190 (19.2%) |
| $75,000 to $99,999 | 205 (18.8%) | 198 (20.0%) |
| $100,000 to $149,999 | 125 (11.5%) | 68 (6.9%) |
| $150,000 or more | 234 (21.4%) | 77 (7.8%) |
| Total | 1,092 (100.0%) | 988 (100.0%) |
Monthly Housing Cost Tiers in Guadalupe
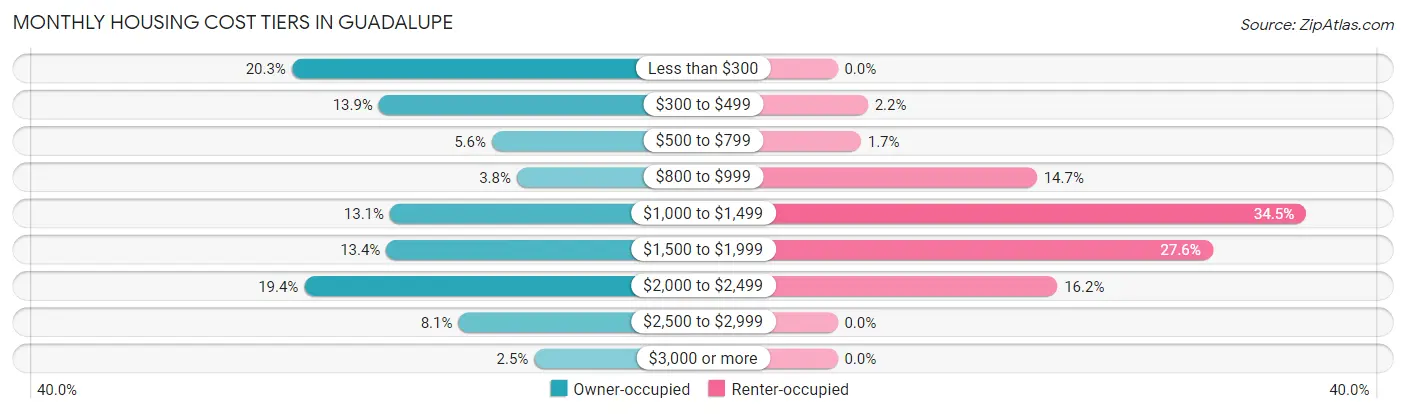
| Monthly Cost | Owner-occupied | Renter-occupied |
| Less than $300 | 222 (20.3%) | 0 (0.0%) |
| $300 to $499 | 152 (13.9%) | 22 (2.2%) |
| $500 to $799 | 61 (5.6%) | 17 (1.7%) |
| $800 to $999 | 41 (3.7%) | 145 (14.7%) |
| $1,000 to $1,499 | 143 (13.1%) | 341 (34.5%) |
| $1,500 to $1,999 | 146 (13.4%) | 273 (27.6%) |
| $2,000 to $2,499 | 212 (19.4%) | 160 (16.2%) |
| $2,500 to $2,999 | 88 (8.1%) | 0 (0.0%) |
| $3,000 or more | 27 (2.5%) | 0 (0.0%) |
| Total | 1,092 (100.0%) | 988 (100.0%) |
Physical Housing Characteristics in Guadalupe
Housing Structures in Guadalupe
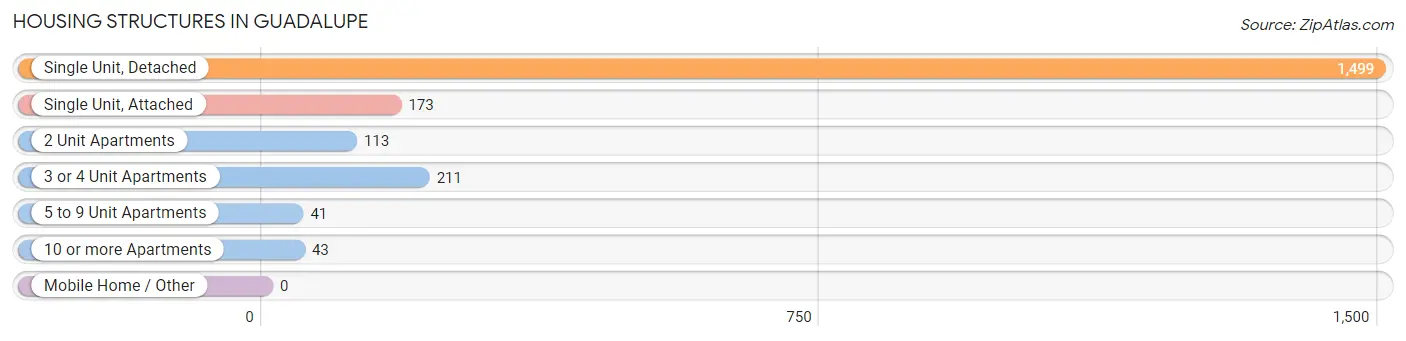
| Structure Type | # Housing Units | % Housing Units |
| Single Unit, Detached | 1,499 | 72.1% |
| Single Unit, Attached | 173 | 8.3% |
| 2 Unit Apartments | 113 | 5.4% |
| 3 or 4 Unit Apartments | 211 | 10.1% |
| 5 to 9 Unit Apartments | 41 | 2.0% |
| 10 or more Apartments | 43 | 2.1% |
| Mobile Home / Other | 0 | 0.0% |
| Total | 2,080 | 100.0% |
Housing Structures by Occupancy in Guadalupe
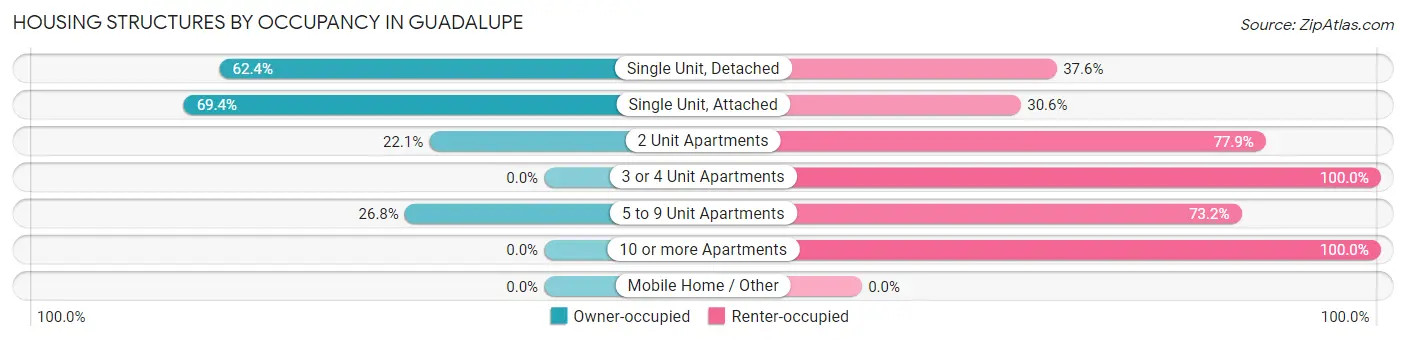
| Structure Type | Owner-occupied | Renter-occupied |
| Single Unit, Detached | 936 (62.4%) | 563 (37.6%) |
| Single Unit, Attached | 120 (69.4%) | 53 (30.6%) |
| 2 Unit Apartments | 25 (22.1%) | 88 (77.9%) |
| 3 or 4 Unit Apartments | 0 (0.0%) | 211 (100.0%) |
| 5 to 9 Unit Apartments | 11 (26.8%) | 30 (73.2%) |
| 10 or more Apartments | 0 (0.0%) | 43 (100.0%) |
| Mobile Home / Other | 0 (0.0%) | 0 (0.0%) |
| Total | 1,092 (52.5%) | 988 (47.5%) |
Housing Structures by Number of Rooms in Guadalupe
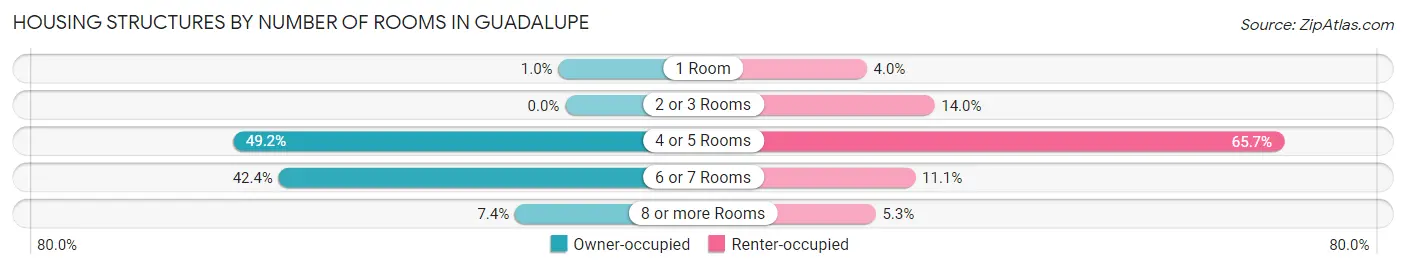
| Number of Rooms | Owner-occupied | Renter-occupied |
| 1 Room | 11 (1.0%) | 39 (4.0%) |
| 2 or 3 Rooms | 0 (0.0%) | 138 (14.0%) |
| 4 or 5 Rooms | 537 (49.2%) | 649 (65.7%) |
| 6 or 7 Rooms | 463 (42.4%) | 110 (11.1%) |
| 8 or more Rooms | 81 (7.4%) | 52 (5.3%) |
| Total | 1,092 (100.0%) | 988 (100.0%) |
Housing Structure by Heating Type in Guadalupe
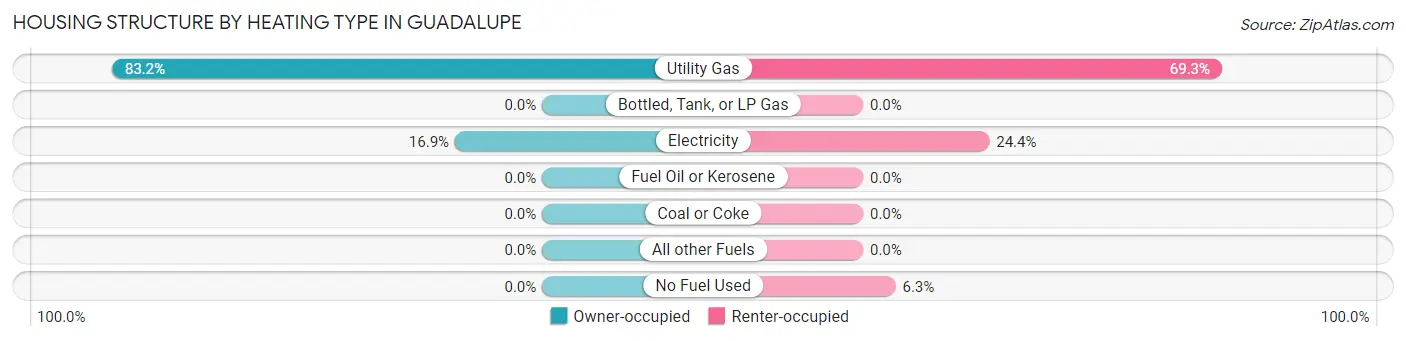
| Heating Type | Owner-occupied | Renter-occupied |
| Utility Gas | 908 (83.2%) | 685 (69.3%) |
| Bottled, Tank, or LP Gas | 0 (0.0%) | 0 (0.0%) |
| Electricity | 184 (16.9%) | 241 (24.4%) |
| Fuel Oil or Kerosene | 0 (0.0%) | 0 (0.0%) |
| Coal or Coke | 0 (0.0%) | 0 (0.0%) |
| All other Fuels | 0 (0.0%) | 0 (0.0%) |
| No Fuel Used | 0 (0.0%) | 62 (6.3%) |
| Total | 1,092 (100.0%) | 988 (100.0%) |
Household Vehicle Usage in Guadalupe
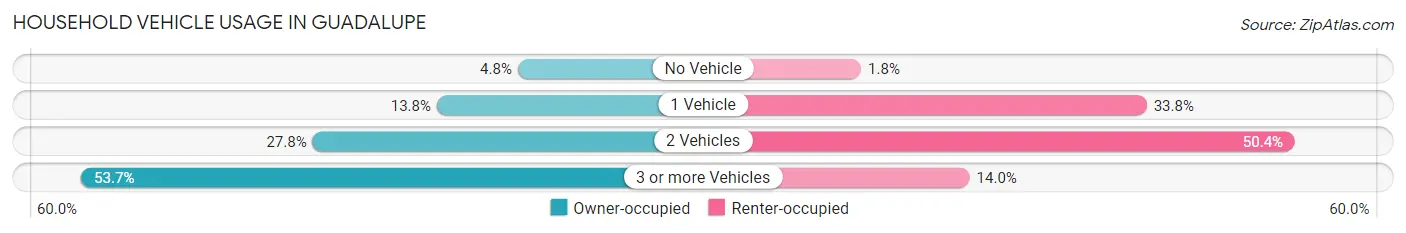
| Vehicles per Household | Owner-occupied | Renter-occupied |
| No Vehicle | 52 (4.8%) | 18 (1.8%) |
| 1 Vehicle | 151 (13.8%) | 334 (33.8%) |
| 2 Vehicles | 303 (27.8%) | 498 (50.4%) |
| 3 or more Vehicles | 586 (53.7%) | 138 (14.0%) |
| Total | 1,092 (100.0%) | 988 (100.0%) |
Real Estate & Mortgages in Guadalupe
Real Estate and Mortgage Overview in Guadalupe
| Characteristic | Without Mortgage | With Mortgage |
| Housing Units | 383 | 709 |
| Median Property Value | $326,200 | $435,300 |
| Median Household Income | $52,708 | $196 |
| Monthly Housing Costs | $286 | $27 |
| Real Estate Taxes | $1,168 | $18 |
Property Value by Mortgage Status in Guadalupe
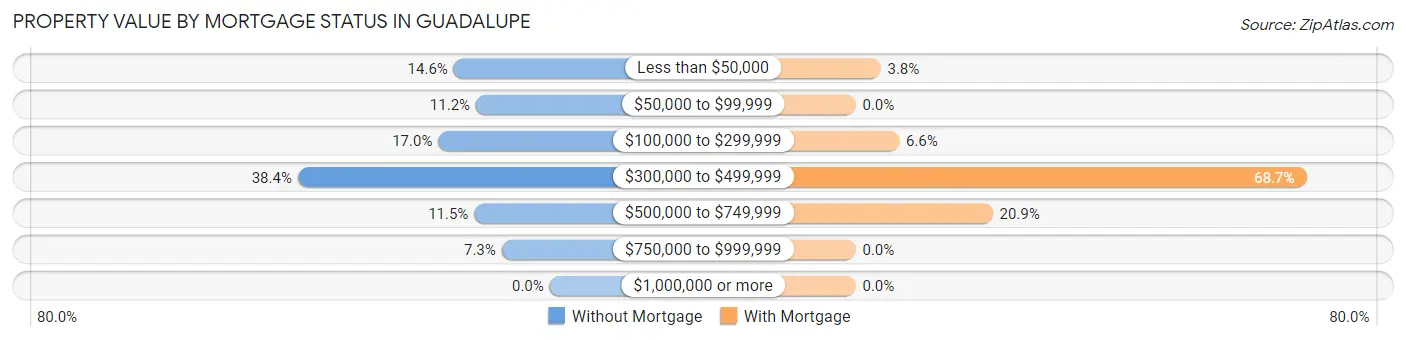
| Property Value | Without Mortgage | With Mortgage |
| Less than $50,000 | 56 (14.6%) | 27 (3.8%) |
| $50,000 to $99,999 | 43 (11.2%) | 0 (0.0%) |
| $100,000 to $299,999 | 65 (17.0%) | 47 (6.6%) |
| $300,000 to $499,999 | 147 (38.4%) | 487 (68.7%) |
| $500,000 to $749,999 | 44 (11.5%) | 148 (20.9%) |
| $750,000 to $999,999 | 28 (7.3%) | 0 (0.0%) |
| $1,000,000 or more | 0 (0.0%) | 0 (0.0%) |
| Total | 383 (100.0%) | 709 (100.0%) |
Household Income by Mortgage Status in Guadalupe
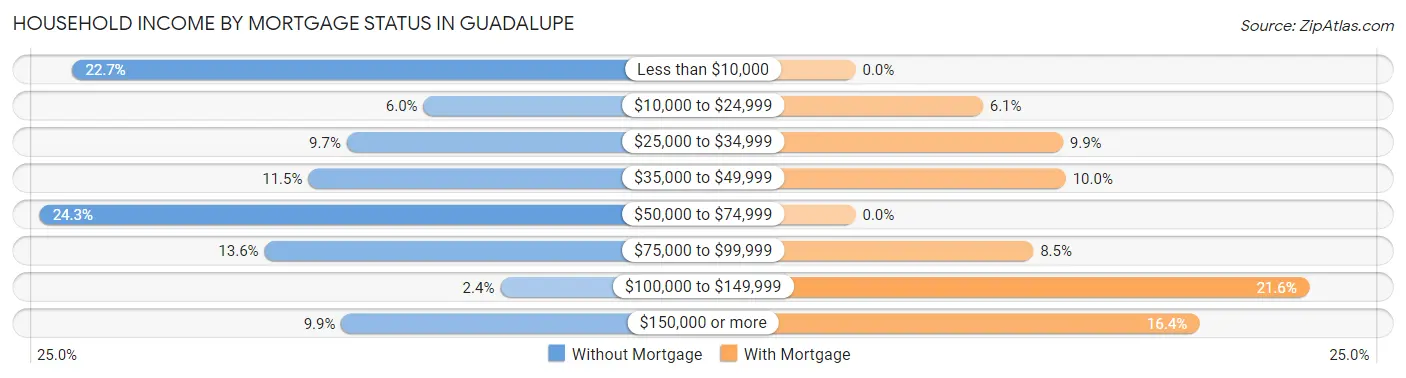
| Household Income | Without Mortgage | With Mortgage |
| Less than $10,000 | 87 (22.7%) | 0 (0.0%) |
| $10,000 to $24,999 | 23 (6.0%) | 43 (6.1%) |
| $25,000 to $34,999 | 37 (9.7%) | 70 (9.9%) |
| $35,000 to $49,999 | 44 (11.5%) | 71 (10.0%) |
| $50,000 to $74,999 | 93 (24.3%) | 0 (0.0%) |
| $75,000 to $99,999 | 52 (13.6%) | 60 (8.5%) |
| $100,000 to $149,999 | 9 (2.4%) | 153 (21.6%) |
| $150,000 or more | 38 (9.9%) | 116 (16.4%) |
| Total | 383 (100.0%) | 709 (100.0%) |
Property Value to Household Income Ratio in Guadalupe
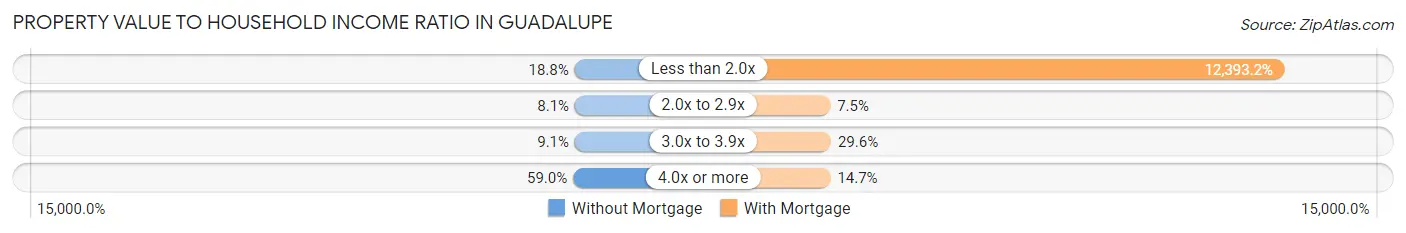
| Value-to-Income Ratio | Without Mortgage | With Mortgage |
| Less than 2.0x | 72 (18.8%) | 87,868 (12,393.2%) |
| 2.0x to 2.9x | 31 (8.1%) | 53 (7.5%) |
| 3.0x to 3.9x | 35 (9.1%) | 210 (29.6%) |
| 4.0x or more | 226 (59.0%) | 104 (14.7%) |
| Total | 383 (100.0%) | 709 (100.0%) |
Real Estate Taxes by Mortgage Status in Guadalupe
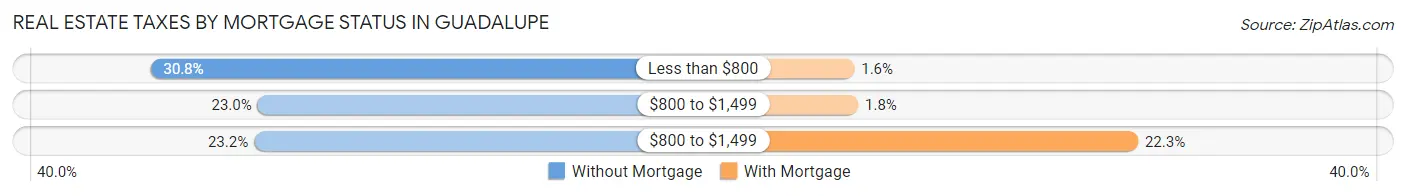
| Property Taxes | Without Mortgage | With Mortgage |
| Less than $800 | 118 (30.8%) | 11 (1.5%) |
| $800 to $1,499 | 88 (23.0%) | 13 (1.8%) |
| $800 to $1,499 | 89 (23.2%) | 158 (22.3%) |
| Total | 383 (100.0%) | 709 (100.0%) |
Health & Disability in Guadalupe
Health Insurance Coverage by Age in Guadalupe
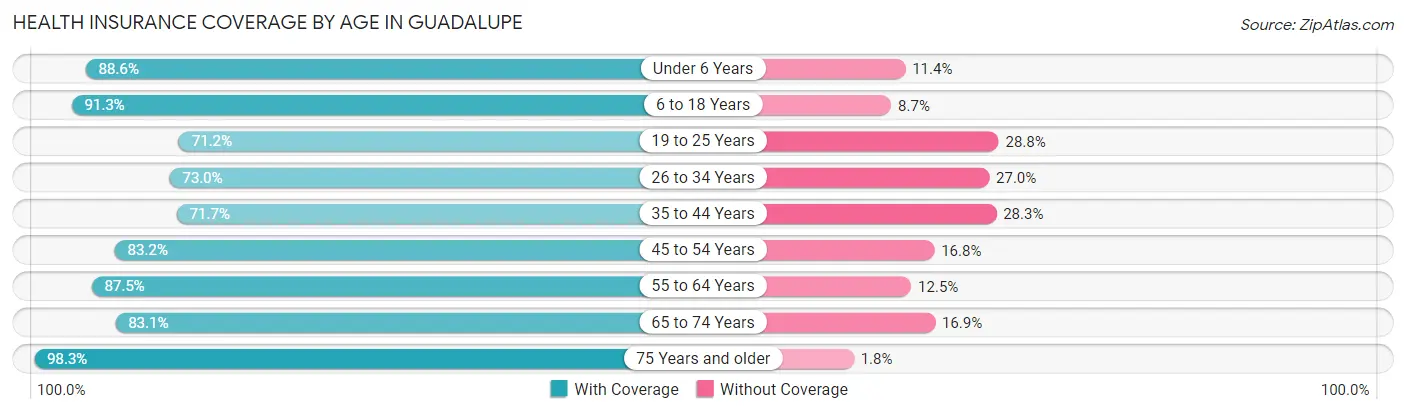
| Age Bracket | With Coverage | Without Coverage |
| Under 6 Years | 827 (88.6%) | 106 (11.4%) |
| 6 to 18 Years | 1,890 (91.3%) | 181 (8.7%) |
| 19 to 25 Years | 607 (71.2%) | 245 (28.8%) |
| 26 to 34 Years | 695 (73.0%) | 257 (27.0%) |
| 35 to 44 Years | 908 (71.7%) | 359 (28.3%) |
| 45 to 54 Years | 516 (83.2%) | 104 (16.8%) |
| 55 to 64 Years | 723 (87.5%) | 103 (12.5%) |
| 65 to 74 Years | 339 (83.1%) | 69 (16.9%) |
| 75 Years and older | 337 (98.3%) | 6 (1.8%) |
| Total | 6,842 (82.7%) | 1,430 (17.3%) |
Health Insurance Coverage by Citizenship Status in Guadalupe
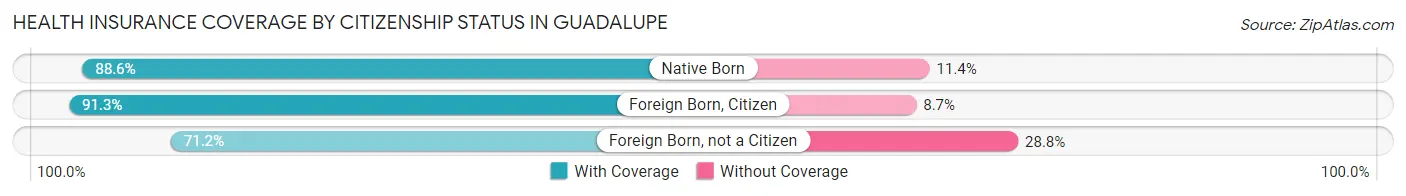
| Citizenship Status | With Coverage | Without Coverage |
| Native Born | 827 (88.6%) | 106 (11.4%) |
| Foreign Born, Citizen | 1,890 (91.3%) | 181 (8.7%) |
| Foreign Born, not a Citizen | 607 (71.2%) | 245 (28.8%) |
Health Insurance Coverage by Household Income in Guadalupe
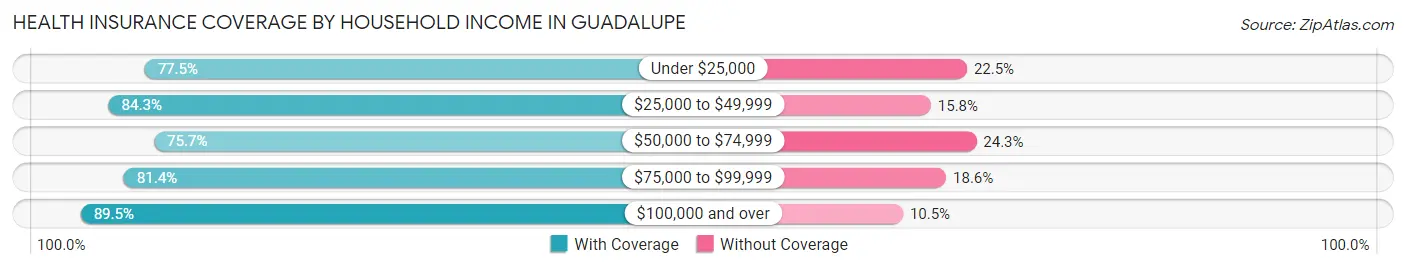
| Household Income | With Coverage | Without Coverage |
| Under $25,000 | 902 (77.5%) | 262 (22.5%) |
| $25,000 to $49,999 | 1,492 (84.3%) | 279 (15.8%) |
| $50,000 to $74,999 | 1,117 (75.7%) | 358 (24.3%) |
| $75,000 to $99,999 | 1,255 (81.4%) | 287 (18.6%) |
| $100,000 and over | 2,076 (89.5%) | 244 (10.5%) |
Public vs Private Health Insurance Coverage by Age in Guadalupe
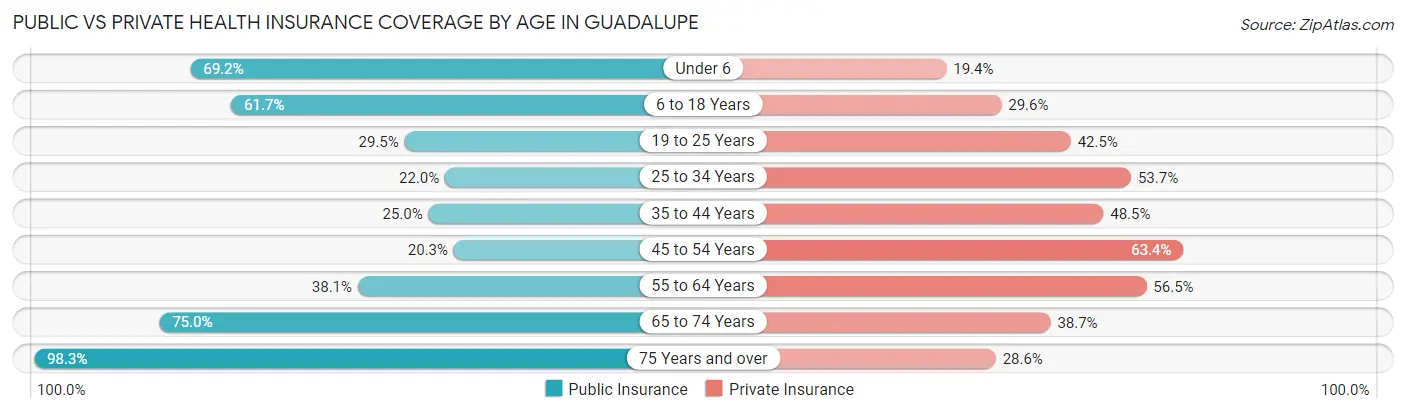
| Age Bracket | Public Insurance | Private Insurance |
| Under 6 | 646 (69.2%) | 181 (19.4%) |
| 6 to 18 Years | 1,277 (61.7%) | 613 (29.6%) |
| 19 to 25 Years | 251 (29.5%) | 362 (42.5%) |
| 25 to 34 Years | 209 (22.0%) | 511 (53.7%) |
| 35 to 44 Years | 317 (25.0%) | 615 (48.5%) |
| 45 to 54 Years | 126 (20.3%) | 393 (63.4%) |
| 55 to 64 Years | 315 (38.1%) | 467 (56.5%) |
| 65 to 74 Years | 306 (75.0%) | 158 (38.7%) |
| 75 Years and over | 337 (98.3%) | 98 (28.6%) |
| Total | 3,784 (45.7%) | 3,398 (41.1%) |
Disability Status by Sex by Age in Guadalupe
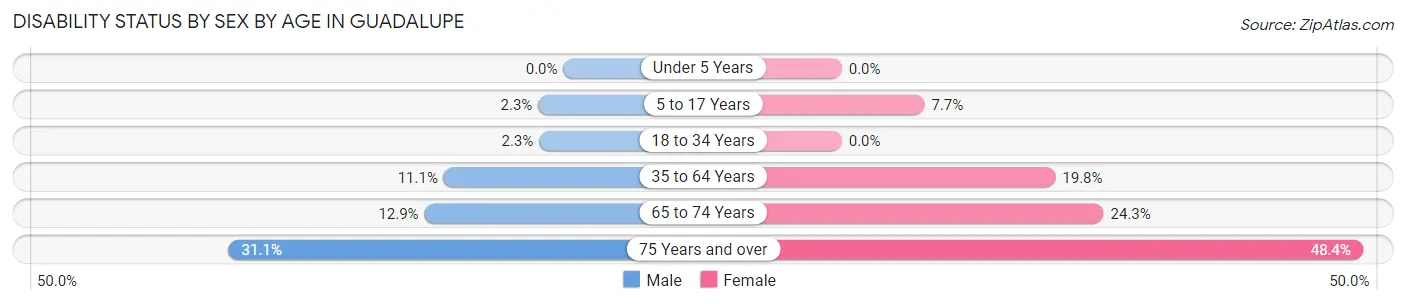
| Age Bracket | Male | Female |
| Under 5 Years | 0 (0.0%) | 0 (0.0%) |
| 5 to 17 Years | 20 (2.3%) | 94 (7.7%) |
| 18 to 34 Years | 22 (2.2%) | 0 (0.0%) |
| 35 to 64 Years | 155 (11.1%) | 261 (19.8%) |
| 65 to 74 Years | 25 (12.9%) | 52 (24.3%) |
| 75 Years and over | 50 (31.1%) | 88 (48.3%) |
Disability Class by Sex by Age in Guadalupe
Disability Class: Hearing Difficulty
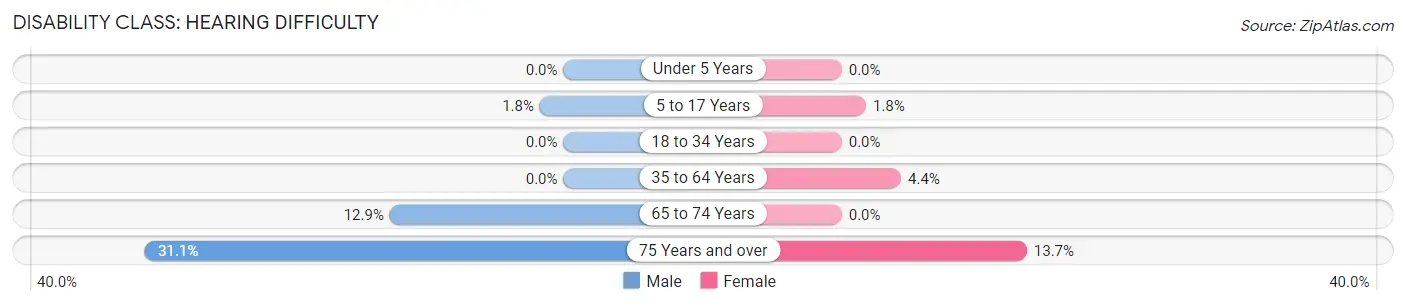
| Age Bracket | Male | Female |
| Under 5 Years | 0 (0.0%) | 0 (0.0%) |
| 5 to 17 Years | 15 (1.8%) | 22 (1.8%) |
| 18 to 34 Years | 0 (0.0%) | 0 (0.0%) |
| 35 to 64 Years | 0 (0.0%) | 58 (4.4%) |
| 65 to 74 Years | 25 (12.9%) | 0 (0.0%) |
| 75 Years and over | 50 (31.1%) | 25 (13.7%) |
Disability Class: Vision Difficulty
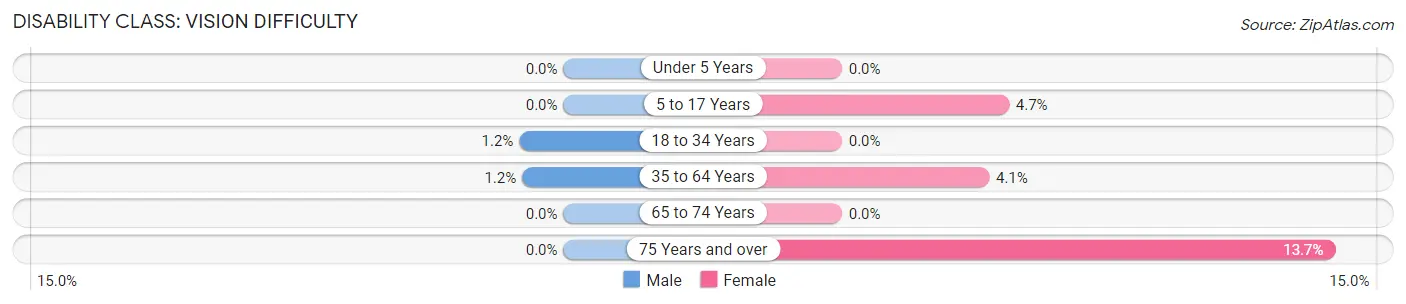
| Age Bracket | Male | Female |
| Under 5 Years | 0 (0.0%) | 0 (0.0%) |
| 5 to 17 Years | 0 (0.0%) | 57 (4.6%) |
| 18 to 34 Years | 12 (1.2%) | 0 (0.0%) |
| 35 to 64 Years | 16 (1.1%) | 54 (4.1%) |
| 65 to 74 Years | 0 (0.0%) | 0 (0.0%) |
| 75 Years and over | 0 (0.0%) | 25 (13.7%) |
Disability Class: Cognitive Difficulty
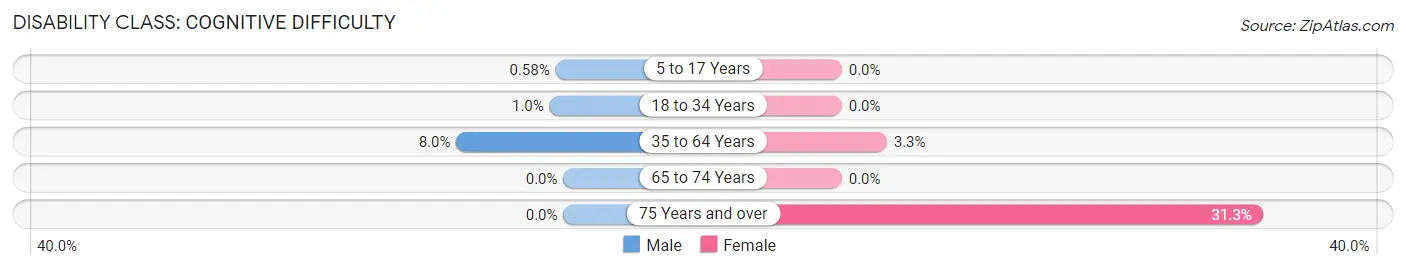
| Age Bracket | Male | Female |
| 5 to 17 Years | 5 (0.6%) | 0 (0.0%) |
| 18 to 34 Years | 10 (1.0%) | 0 (0.0%) |
| 35 to 64 Years | 111 (8.0%) | 44 (3.3%) |
| 65 to 74 Years | 0 (0.0%) | 0 (0.0%) |
| 75 Years and over | 0 (0.0%) | 57 (31.3%) |
Disability Class: Ambulatory Difficulty
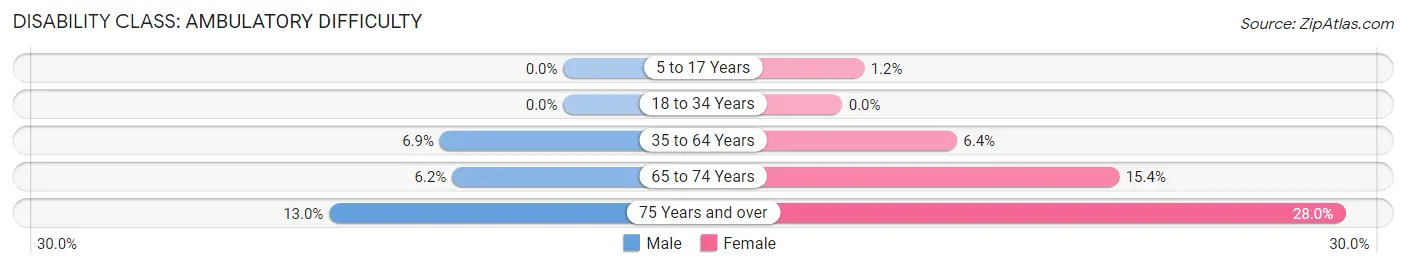
| Age Bracket | Male | Female |
| 5 to 17 Years | 0 (0.0%) | 15 (1.2%) |
| 18 to 34 Years | 0 (0.0%) | 0 (0.0%) |
| 35 to 64 Years | 96 (6.9%) | 84 (6.4%) |
| 65 to 74 Years | 12 (6.2%) | 33 (15.4%) |
| 75 Years and over | 21 (13.0%) | 51 (28.0%) |
Disability Class: Self-Care Difficulty
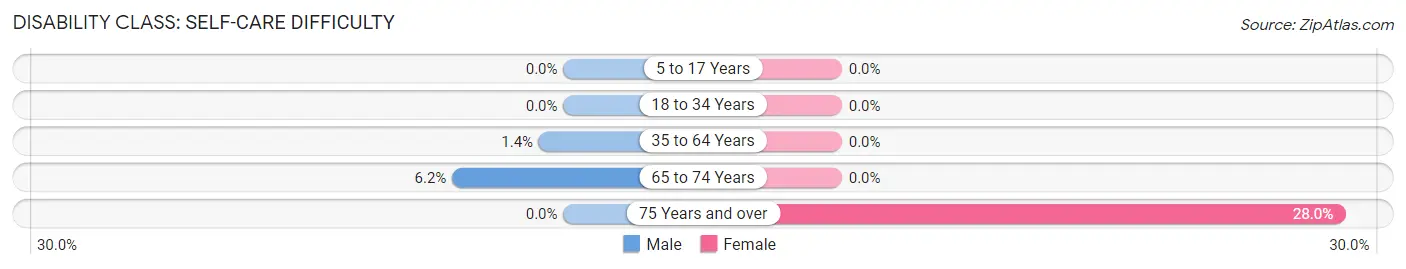
| Age Bracket | Male | Female |
| 5 to 17 Years | 0 (0.0%) | 0 (0.0%) |
| 18 to 34 Years | 0 (0.0%) | 0 (0.0%) |
| 35 to 64 Years | 19 (1.4%) | 0 (0.0%) |
| 65 to 74 Years | 12 (6.2%) | 0 (0.0%) |
| 75 Years and over | 0 (0.0%) | 51 (28.0%) |
Technology Access in Guadalupe
Computing Device Access in Guadalupe
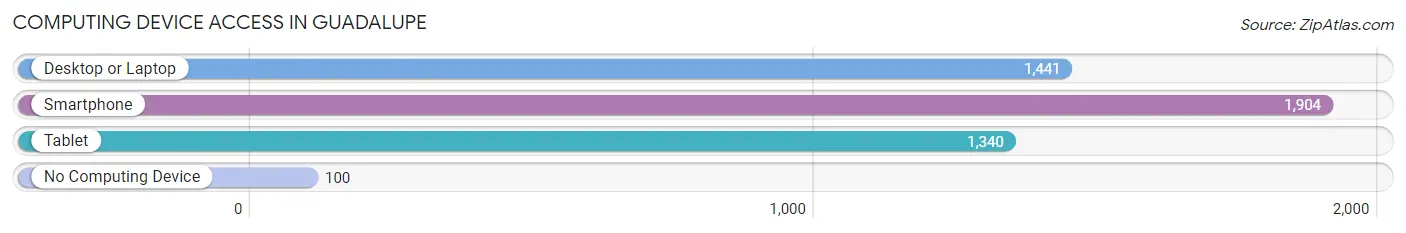
| Device Type | # Households | % Households |
| Desktop or Laptop | 1,441 | 69.3% |
| Smartphone | 1,904 | 91.5% |
| Tablet | 1,340 | 64.4% |
| No Computing Device | 100 | 4.8% |
| Total | 2,080 | 100.0% |
Internet Access in Guadalupe
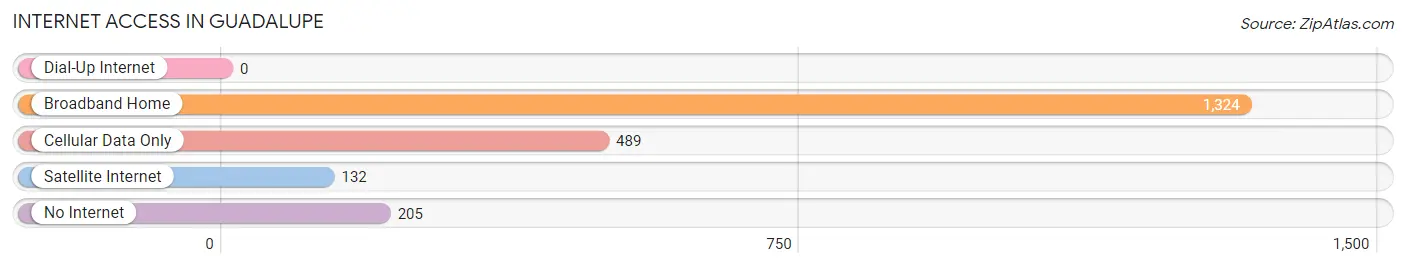
| Internet Type | # Households | % Households |
| Dial-Up Internet | 0 | 0.0% |
| Broadband Home | 1,324 | 63.6% |
| Cellular Data Only | 489 | 23.5% |
| Satellite Internet | 132 | 6.4% |
| No Internet | 205 | 9.9% |
| Total | 2,080 | 100.0% |
Guadalupe Summary
Guadalupe, California is a small town located in Santa Barbara County, California. It is situated on the Pacific Coast, approximately 8 miles northwest of Santa Barbara. The town has a population of approximately 7,000 people and is known for its agricultural production, particularly of strawberries.
History
The area that is now Guadalupe was originally inhabited by the Chumash people, who lived in the area for thousands of years before the arrival of Europeans. The first Europeans to settle in the area were Spanish missionaries, who established the Mission Santa Ines in 1804. The mission was the 19th of the 21 missions established in California by the Spanish.
The town of Guadalupe was founded in 1887 by a group of Mexican settlers who named the town after the Virgin of Guadalupe. The town was incorporated in 1902 and has remained a small, rural community ever since.
Geography
Guadalupe is located in the Santa Ynez Valley, which is part of the larger Central Coast region of California. The town is situated on the Pacific Coast, approximately 8 miles northwest of Santa Barbara. The town is surrounded by rolling hills and is located near the Santa Ynez River.
The climate in Guadalupe is Mediterranean, with mild winters and warm, dry summers. The average annual temperature is around 60°F (15°C). The average annual precipitation is around 18 inches (45 cm).
Economy
The economy of Guadalupe is largely based on agriculture. The town is known for its production of strawberries, which are grown in the surrounding hills. Other crops grown in the area include lettuce, broccoli, cauliflower, and celery.
The town also has a small manufacturing sector, which produces a variety of products, including furniture, clothing, and electronics.
Demographics
As of the 2010 census, the population of Guadalupe was 7,080. The racial makeup of the town was 68.3% White, 0.7% African American, 0.7% Native American, 0.7% Asian, 0.2% Pacific Islander, and 28.3% from other races. The median household income was $37,917.
The town is predominantly Hispanic, with a large Mexican-American population. The majority of the population is Roman Catholic.
Conclusion
Guadalupe, California is a small town located in Santa Barbara County, California. It is situated on the Pacific Coast, approximately 8 miles northwest of Santa Barbara. The town has a population of approximately 7,000 people and is known for its agricultural production, particularly of strawberries. The economy of Guadalupe is largely based on agriculture, with a small manufacturing sector. The town is predominantly Hispanic, with a large Mexican-American population.
Common Questions
What is Per Capita Income in Guadalupe?
Per Capita income in Guadalupe is $20,314.
What is the Median Family Income in Guadalupe?
Median Family Income in Guadalupe is $64,932.
What is the Median Household income in Guadalupe?
Median Household Income in Guadalupe is $66,026.
What is Income or Wage Gap in Guadalupe?
Income or Wage Gap in Guadalupe is 6.4%.
Women in Guadalupe earn 93.6 cents for every dollar earned by a man.
What is Family Income Deficit in Guadalupe?
Family Income Deficit in Guadalupe is $10,382.
Families that are below poverty line in Guadalupe earn $10,382 less on average than the poverty threshold level.
What is Inequality or Gini Index in Guadalupe?
Inequality or Gini Index in Guadalupe is 0.43.
What is the Total Population of Guadalupe?
Total Population of Guadalupe is 8,272.
What is the Total Male Population of Guadalupe?
Total Male Population of Guadalupe is 4,021.
What is the Total Female Population of Guadalupe?
Total Female Population of Guadalupe is 4,251.
What is the Ratio of Males per 100 Females in Guadalupe?
There are 94.59 Males per 100 Females in Guadalupe.
What is the Ratio of Females per 100 Males in Guadalupe?
There are 105.72 Females per 100 Males in Guadalupe.
What is the Median Population Age in Guadalupe?
Median Population Age in Guadalupe is 28.4 Years.
What is the Average Family Size in Guadalupe
Average Family Size in Guadalupe is 4.1 People.
What is the Average Household Size in Guadalupe
Average Household Size in Guadalupe is 4.0 People.
How Large is the Labor Force in Guadalupe?
There are 3,748 People in the Labor Forcein in Guadalupe.
What is the Percentage of People in the Labor Force in Guadalupe?
66.2% of People are in the Labor Force in Guadalupe.
What is the Unemployment Rate in Guadalupe?
Unemployment Rate in Guadalupe is 9.5%.