Grizzly Flats, CA Map & Demographics
Grizzly Flats Map
Grizzly Flats Overview
$35,287
PER CAPITA INCOME
$84,390
AVG FAMILY INCOME
$84,843
AVG HOUSEHOLD INCOME
0.28
INEQUALITY / GINI INDEX
1,374
TOTAL POPULATION
620
MALE POPULATION
754
FEMALE POPULATION
82.23
MALES / 100 FEMALES
121.61
FEMALES / 100 MALES
44.3
MEDIAN AGE
3.4
AVG FAMILY SIZE
2.8
AVG HOUSEHOLD SIZE
599
LABOR FORCE [ PEOPLE ]
57.6%
PERCENT IN LABOR FORCE
Grizzly Flats Zip Codes
Grizzly Flats Area Codes
Income in Grizzly Flats
Income Overview in Grizzly Flats
Per Capita Income in Grizzly Flats is $35,287, while median incomes of families and households are $84,390 and $84,843 respectively.
| Characteristic | Number | Measure |
| Per Capita Income | 1,374 | $35,287 |
| Median Family Income | 370 | $84,390 |
| Mean Family Income | 370 | $106,912 |
| Median Household Income | 484 | $84,843 |
| Mean Household Income | 484 | $102,602 |
| Income Deficit | 370 | $0 |
| Wage / Income Gap (%) | 1,374 | 0.00% |
| Wage / Income Gap ($) | 1,374 | 100.00¢ per $1 |
| Gini / Inequality Index | 1,374 | 0.28 |
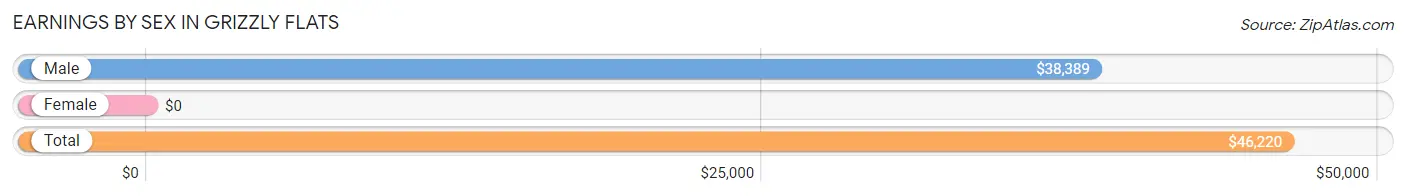
Earnings by Sex in Grizzly Flats
| Sex | Number | Average Earnings |
| Male | 257 (42.0%) | $38,389 |
| Female | 355 (58.0%) | $0 |
| Total | 612 (100.0%) | $46,220 |
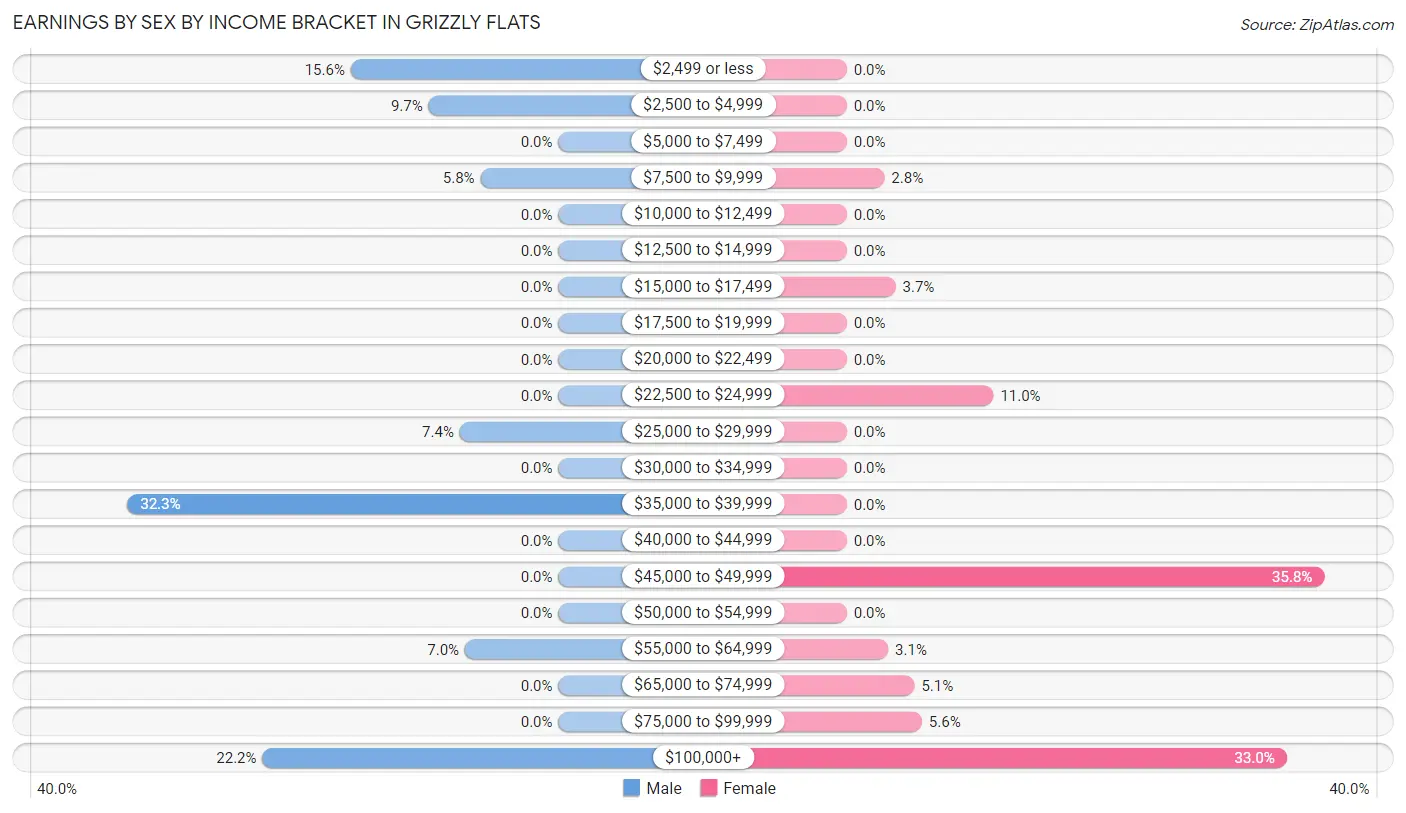
Earnings by Sex by Income Bracket in Grizzly Flats
The most common earnings brackets in Grizzly Flats are $35,000 to $39,999 for men (83 | 32.3%) and $45,000 to $49,999 for women (127 | 35.8%).
| Income | Male | Female |
| $2,499 or less | 40 (15.6%) | 0 (0.0%) |
| $2,500 to $4,999 | 25 (9.7%) | 0 (0.0%) |
| $5,000 to $7,499 | 0 (0.0%) | 0 (0.0%) |
| $7,500 to $9,999 | 15 (5.8%) | 10 (2.8%) |
| $10,000 to $12,499 | 0 (0.0%) | 0 (0.0%) |
| $12,500 to $14,999 | 0 (0.0%) | 0 (0.0%) |
| $15,000 to $17,499 | 0 (0.0%) | 13 (3.7%) |
| $17,500 to $19,999 | 0 (0.0%) | 0 (0.0%) |
| $20,000 to $22,499 | 0 (0.0%) | 0 (0.0%) |
| $22,500 to $24,999 | 0 (0.0%) | 39 (11.0%) |
| $25,000 to $29,999 | 19 (7.4%) | 0 (0.0%) |
| $30,000 to $34,999 | 0 (0.0%) | 0 (0.0%) |
| $35,000 to $39,999 | 83 (32.3%) | 0 (0.0%) |
| $40,000 to $44,999 | 0 (0.0%) | 0 (0.0%) |
| $45,000 to $49,999 | 0 (0.0%) | 127 (35.8%) |
| $50,000 to $54,999 | 0 (0.0%) | 0 (0.0%) |
| $55,000 to $64,999 | 18 (7.0%) | 11 (3.1%) |
| $65,000 to $74,999 | 0 (0.0%) | 18 (5.1%) |
| $75,000 to $99,999 | 0 (0.0%) | 20 (5.6%) |
| $100,000+ | 57 (22.2%) | 117 (33.0%) |
| Total | 257 (100.0%) | 355 (100.0%) |
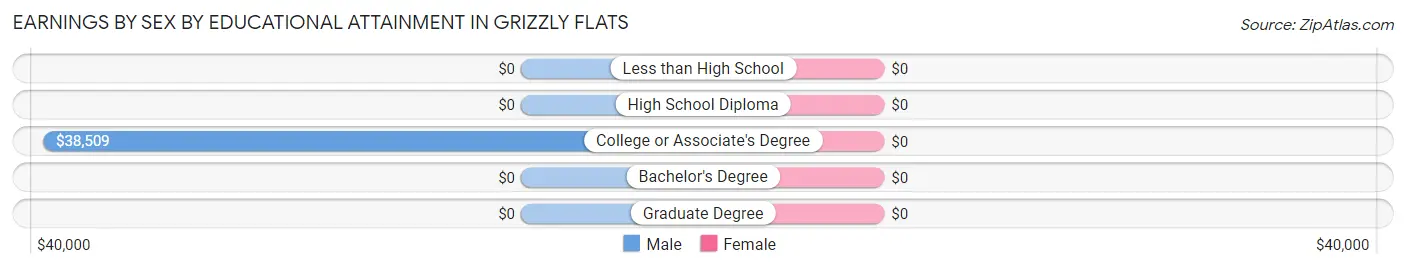
Earnings by Sex by Educational Attainment in Grizzly Flats
| Educational Attainment | Male Income | Female Income |
| Less than High School | - | - |
| High School Diploma | - | - |
| College or Associate's Degree | $38,509 | $0 |
| Bachelor's Degree | - | - |
| Graduate Degree | - | - |
| Total | - | - |
Family Income in Grizzly Flats
Family Income Brackets in Grizzly Flats
According to the Grizzly Flats family income data, there are 127 families falling into the $75,000 to $99,999 income range, which is the most common income bracket and makes up 34.3% of all families.
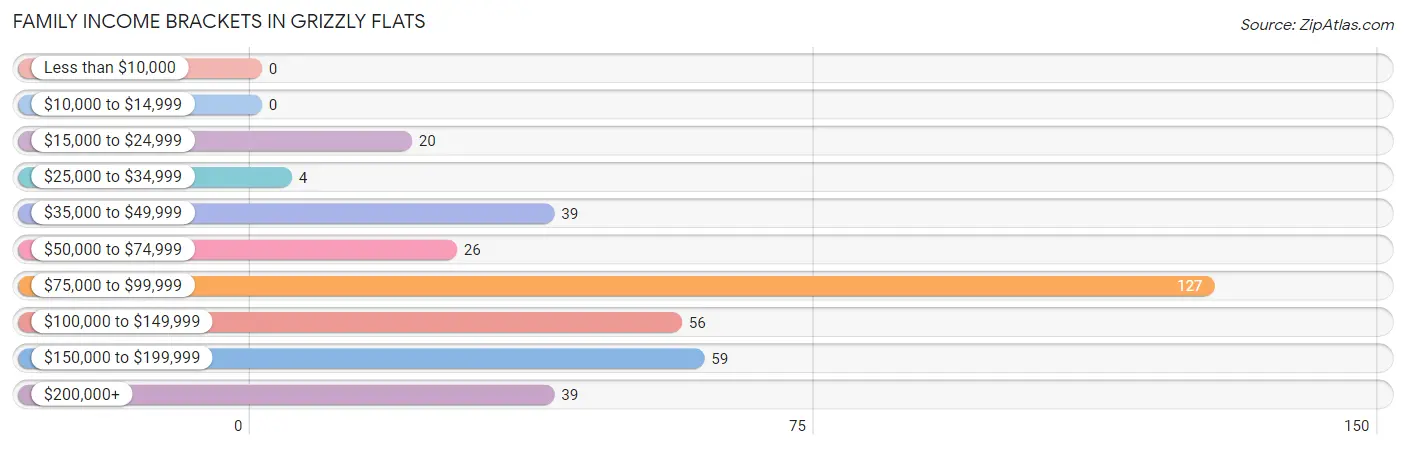
| Income Bracket | # Families | % Families |
| Less than $10,000 | 0 | 0.0% |
| $10,000 to $14,999 | 0 | 0.0% |
| $15,000 to $24,999 | 20 | 5.4% |
| $25,000 to $34,999 | 4 | 1.1% |
| $35,000 to $49,999 | 39 | 10.5% |
| $50,000 to $74,999 | 26 | 7.0% |
| $75,000 to $99,999 | 127 | 34.3% |
| $100,000 to $149,999 | 56 | 15.1% |
| $150,000 to $199,999 | 59 | 15.9% |
| $200,000+ | 39 | 10.5% |
Family Income by Famaliy Size in Grizzly Flats
4-person families (236 | 63.8%) account for the highest median family income in Grizzly Flats with $84,055 per family, while 4-person families (236 | 63.8%) have the highest median income of $21,014 per family member.
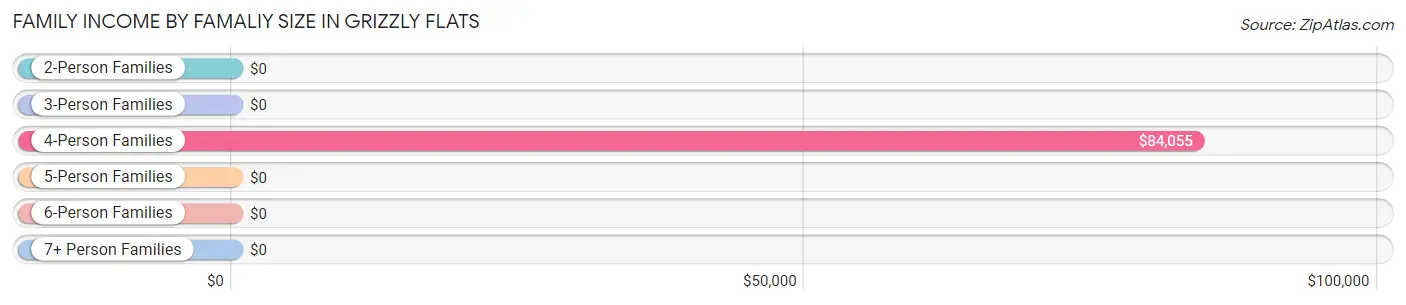
| Income Bracket | # Families | Median Income |
| 2-Person Families | 98 (26.5%) | $0 |
| 3-Person Families | 18 (4.9%) | $0 |
| 4-Person Families | 236 (63.8%) | $84,055 |
| 5-Person Families | 8 (2.2%) | $0 |
| 6-Person Families | 10 (2.7%) | $0 |
| 7+ Person Families | 0 (0.0%) | $0 |
| Total | 370 (100.0%) | $84,390 |
Family Income by Number of Earners in Grizzly Flats
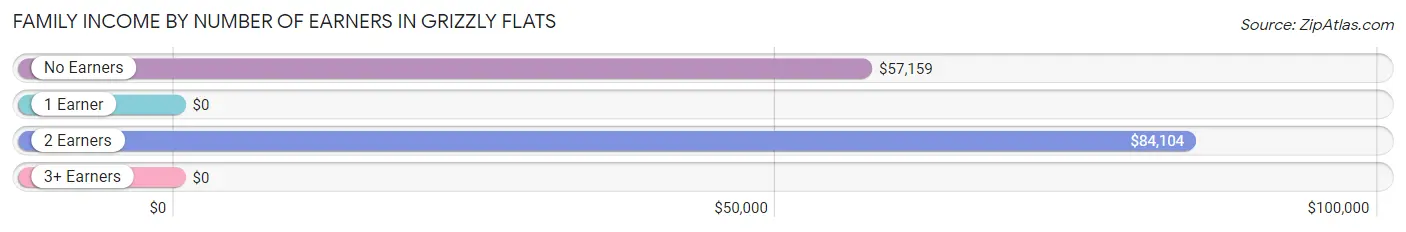
| Number of Earners | # Families | Median Income |
| No Earners | 67 (18.1%) | $57,159 |
| 1 Earner | 62 (16.8%) | $0 |
| 2 Earners | 241 (65.1%) | $84,104 |
| 3+ Earners | 0 (0.0%) | $0 |
| Total | 370 (100.0%) | $84,390 |
Household Income in Grizzly Flats
Household Income Brackets in Grizzly Flats
With 143 households falling in the category, the $75,000 to $99,999 income range is the most frequent in Grizzly Flats, accounting for 29.5% of all households.
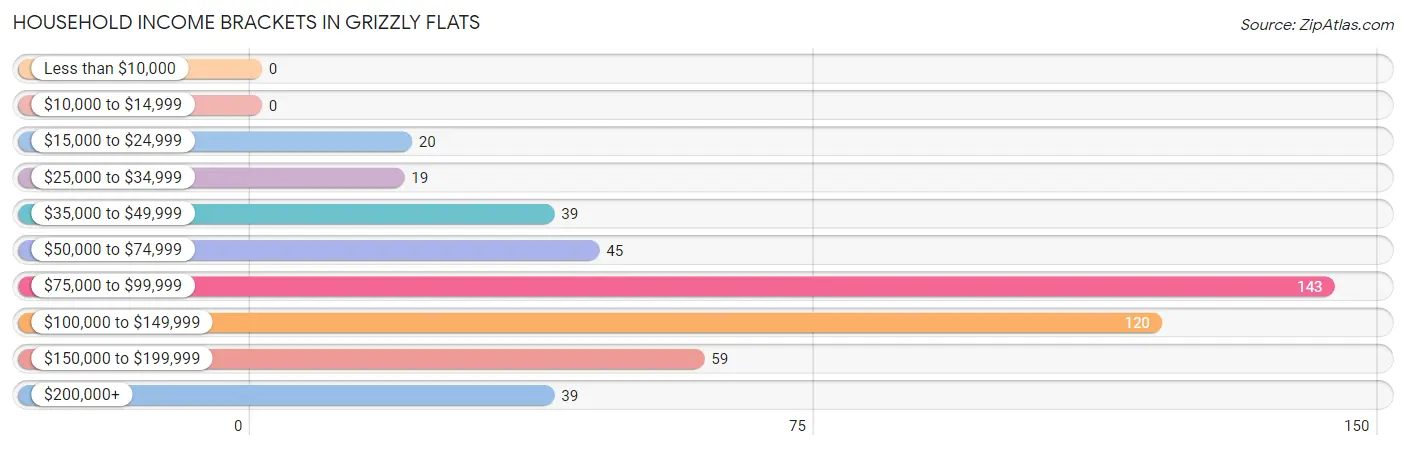
| Income Bracket | # Households | % Households |
| Less than $10,000 | 0 | 0.0% |
| $10,000 to $14,999 | 0 | 0.0% |
| $15,000 to $24,999 | 20 | 4.1% |
| $25,000 to $34,999 | 19 | 3.9% |
| $35,000 to $49,999 | 39 | 8.1% |
| $50,000 to $74,999 | 45 | 9.3% |
| $75,000 to $99,999 | 143 | 29.5% |
| $100,000 to $149,999 | 120 | 24.8% |
| $150,000 to $199,999 | 59 | 12.2% |
| $200,000+ | 39 | 8.1% |
Household Income by Householder Age in Grizzly Flats
The median household income in Grizzly Flats is $84,843, with the highest median household income of $165,392 found in the 45 to 64 years age bracket for the primary householder. A total of 140 households (28.9%) fall into this category.
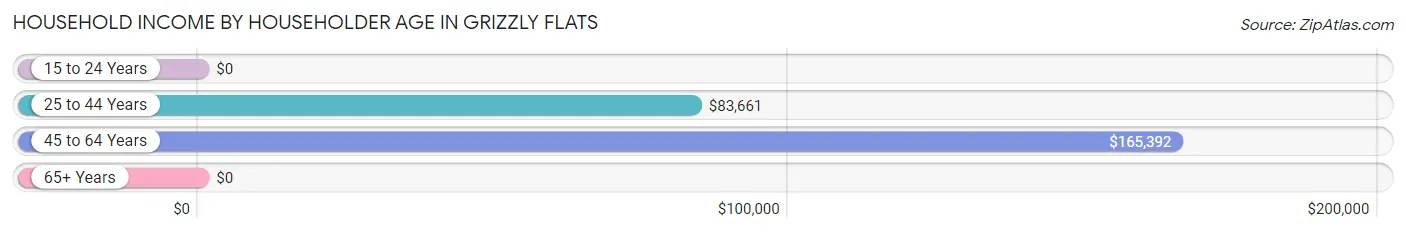
| Income Bracket | # Households | Median Income |
| 15 to 24 Years | 0 (0.0%) | $0 |
| 25 to 44 Years | 196 (40.5%) | $83,661 |
| 45 to 64 Years | 140 (28.9%) | $165,392 |
| 65+ Years | 148 (30.6%) | $0 |
| Total | 484 (100.0%) | $84,843 |
Poverty in Grizzly Flats
Income Below Poverty by Sex and Age in Grizzly Flats
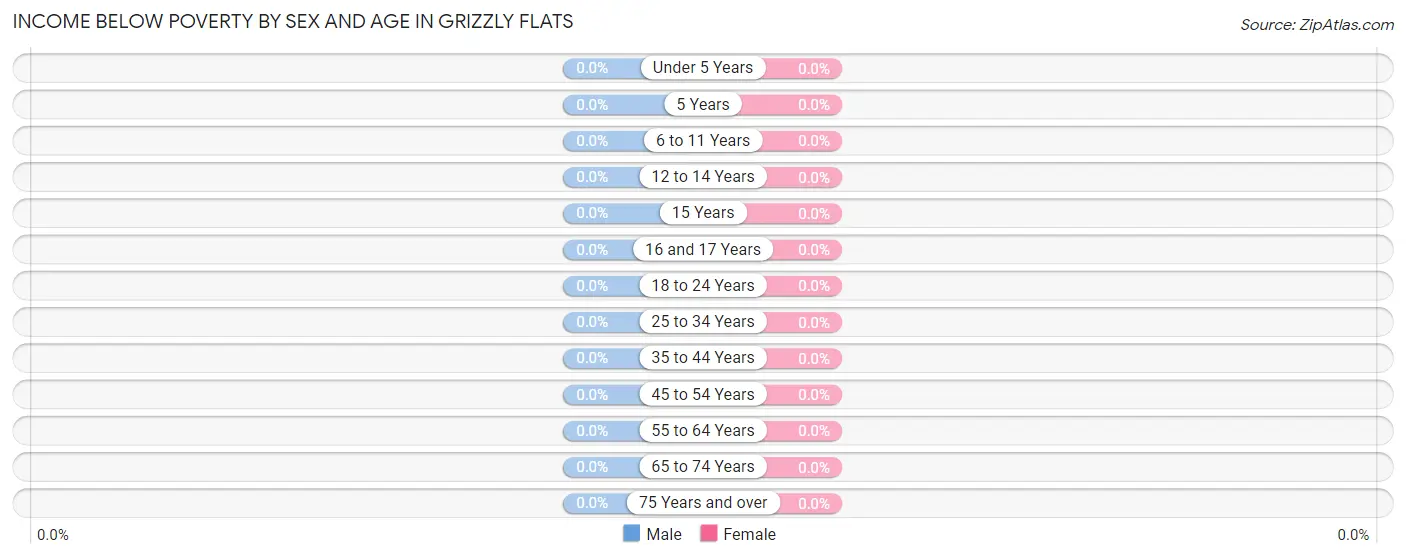
| Age Bracket | Male | Female |
| Under 5 Years | 0 (0.0%) | 0 (0.0%) |
| 5 Years | 0 (0.0%) | 0 (0.0%) |
| 6 to 11 Years | 0 (0.0%) | 0 (0.0%) |
| 12 to 14 Years | 0 (0.0%) | 0 (0.0%) |
| 15 Years | 0 (0.0%) | 0 (0.0%) |
| 16 and 17 Years | 0 (0.0%) | 0 (0.0%) |
| 18 to 24 Years | 0 (0.0%) | 0 (0.0%) |
| 25 to 34 Years | 0 (0.0%) | 0 (0.0%) |
| 35 to 44 Years | 0 (0.0%) | 0 (0.0%) |
| 45 to 54 Years | 0 (0.0%) | 0 (0.0%) |
| 55 to 64 Years | 0 (0.0%) | 0 (0.0%) |
| 65 to 74 Years | 0 (0.0%) | 0 (0.0%) |
| 75 Years and over | 0 (0.0%) | 0 (0.0%) |
| Total | 0 (0.0%) | 0 (0.0%) |
Income Above Poverty by Sex and Age in Grizzly Flats
According to the poverty statistics in Grizzly Flats, males aged 6 to 11 years and females aged 6 to 11 years are the age groups that are most secure financially, with 100.0% of males and 100.0% of females in these age groups living above the poverty line.
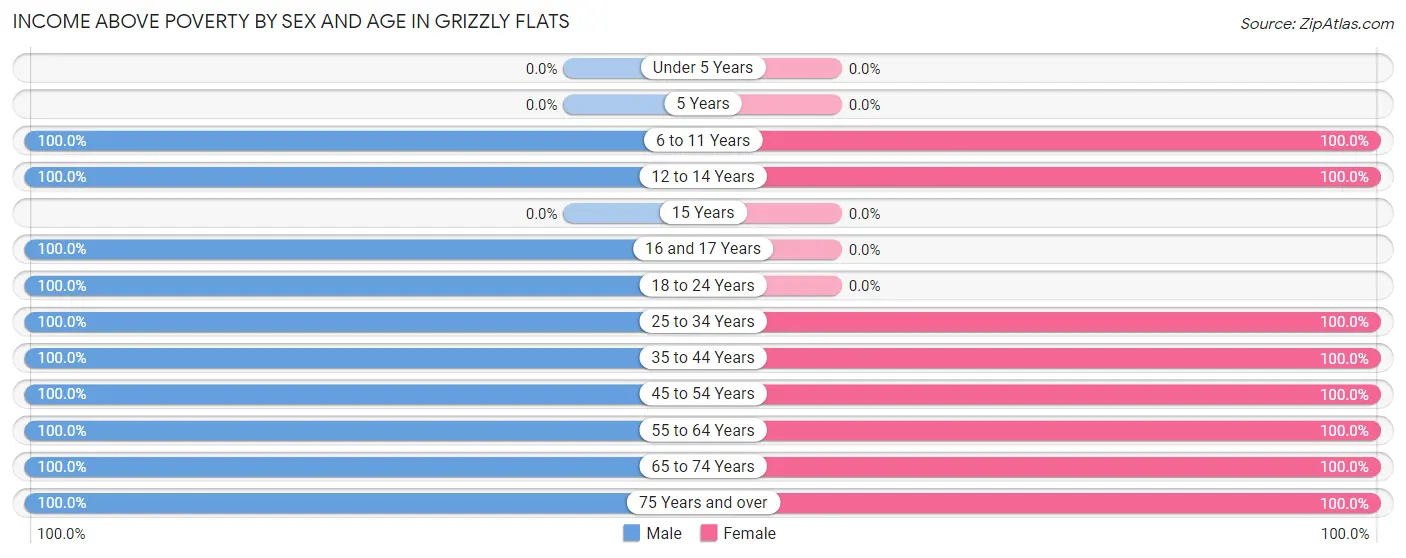
| Age Bracket | Male | Female |
| Under 5 Years | 0 (0.0%) | 0 (0.0%) |
| 5 Years | 0 (0.0%) | 0 (0.0%) |
| 6 to 11 Years | 146 (100.0%) | 125 (100.0%) |
| 12 to 14 Years | 9 (100.0%) | 54 (100.0%) |
| 15 Years | 0 (0.0%) | 0 (0.0%) |
| 16 and 17 Years | 58 (100.0%) | 0 (0.0%) |
| 18 to 24 Years | 25 (100.0%) | 0 (0.0%) |
| 25 to 34 Years | 20 (100.0%) | 136 (100.0%) |
| 35 to 44 Years | 10 (100.0%) | 194 (100.0%) |
| 45 to 54 Years | 60 (100.0%) | 24 (100.0%) |
| 55 to 64 Years | 177 (100.0%) | 89 (100.0%) |
| 65 to 74 Years | 88 (100.0%) | 88 (100.0%) |
| 75 Years and over | 27 (100.0%) | 44 (100.0%) |
| Total | 620 (100.0%) | 754 (100.0%) |
Income Below Poverty Among Married-Couple Families in Grizzly Flats
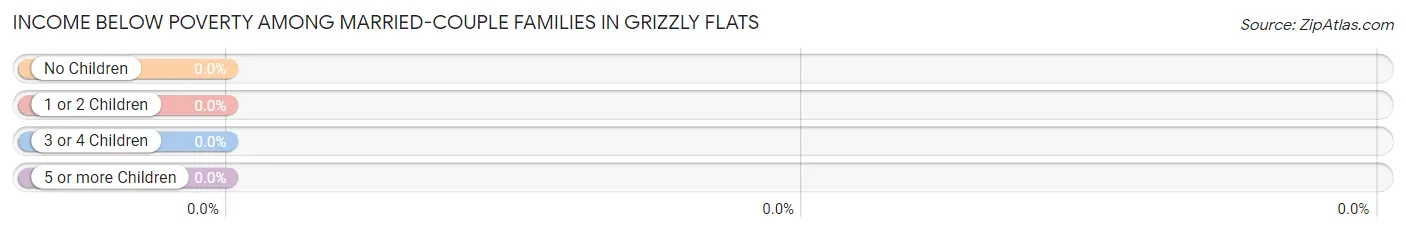
| Children | Above Poverty | Below Poverty |
| No Children | 168 (100.0%) | 0 (0.0%) |
| 1 or 2 Children | 184 (100.0%) | 0 (0.0%) |
| 3 or 4 Children | 18 (100.0%) | 0 (0.0%) |
| 5 or more Children | 0 (0.0%) | 0 (0.0%) |
| Total | 370 (100.0%) | 0 (0.0%) |
Income Below Poverty Among Single-Parent Households in Grizzly Flats
| Children | Single Father | Single Mother |
| No Children | 0 (0.0%) | 0 (0.0%) |
| 1 or 2 Children | 0 (0.0%) | 0 (0.0%) |
| 3 or 4 Children | 0 (0.0%) | 0 (0.0%) |
| 5 or more Children | 0 (0.0%) | 0 (0.0%) |
| Total | 0 (0.0%) | 0 (0.0%) |
Income Below Poverty Among Married-Couple vs Single-Parent Households in Grizzly Flats
| Children | Married-Couple Families | Single-Parent Households |
| No Children | 0 (0.0%) | 0 (0.0%) |
| 1 or 2 Children | 0 (0.0%) | 0 (0.0%) |
| 3 or 4 Children | 0 (0.0%) | 0 (0.0%) |
| 5 or more Children | 0 (0.0%) | 0 (0.0%) |
| Total | 0 (0.0%) | 0 (0.0%) |
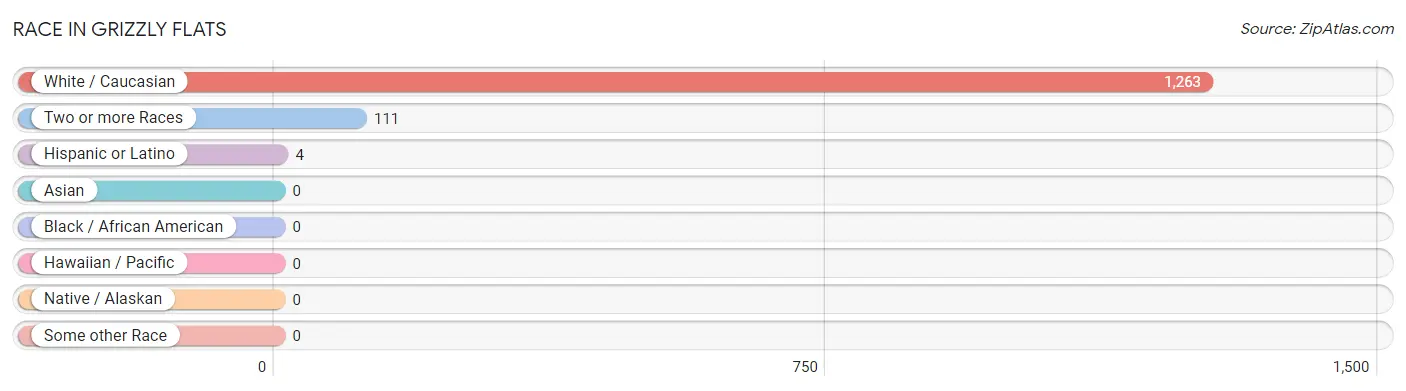
Race in Grizzly Flats
The most populous races in Grizzly Flats are White / Caucasian (1,263 | 91.9%), Two or more Races (111 | 8.1%), and Hispanic or Latino (4 | 0.3%).
| Race | # Population | % Population |
| Asian | 0 | 0.0% |
| Black / African American | 0 | 0.0% |
| Hawaiian / Pacific | 0 | 0.0% |
| Hispanic or Latino | 4 | 0.3% |
| Native / Alaskan | 0 | 0.0% |
| White / Caucasian | 1,263 | 91.9% |
| Two or more Races | 111 | 8.1% |
| Some other Race | 0 | 0.0% |
| Total | 1,374 | 100.0% |
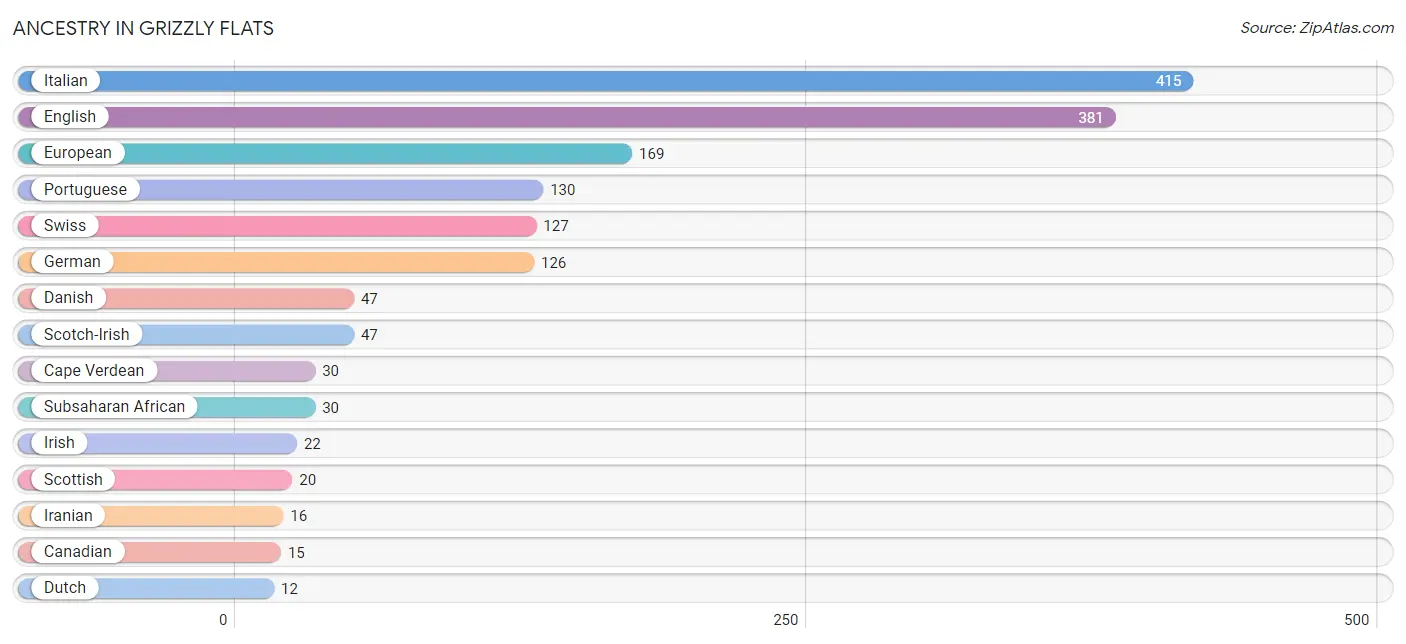
Ancestry in Grizzly Flats
The most populous ancestries reported in Grizzly Flats are Italian (415 | 30.2%), English (381 | 27.7%), European (169 | 12.3%), Portuguese (130 | 9.5%), and Swiss (127 | 9.2%), together accounting for 88.9% of all Grizzly Flats residents.
| Ancestry | # Population | % Population |
| Canadian | 15 | 1.1% |
| Cape Verdean | 30 | 2.2% |
| Croatian | 7 | 0.5% |
| Danish | 47 | 3.4% |
| Dutch | 12 | 0.9% |
| English | 381 | 27.7% |
| European | 169 | 12.3% |
| French | 11 | 0.8% |
| German | 126 | 9.2% |
| Greek | 7 | 0.5% |
| Iranian | 16 | 1.2% |
| Irish | 22 | 1.6% |
| Italian | 415 | 30.2% |
| Mexican | 4 | 0.3% |
| Portuguese | 130 | 9.5% |
| Scotch-Irish | 47 | 3.4% |
| Scottish | 20 | 1.5% |
| Senegalese | 8 | 0.6% |
| Subsaharan African | 30 | 2.2% |
| Swiss | 127 | 9.2% | View All 20 Rows |
Immigrants in Grizzly Flats
The most numerous immigrant groups reported in Grizzly Flats came from , and Canada (15 | 1.1%), together accounting for 1.1% of all Grizzly Flats residents.

| Immigration Origin | # Population | % Population |
| Canada | 15 | 1.1% | View All 1 Rows |
Sex and Age in Grizzly Flats
Sex and Age in Grizzly Flats
The most populous age groups in Grizzly Flats are 55 to 59 Years (161 | 26.0%) for men and 40 to 44 Years (176 | 23.3%) for women.
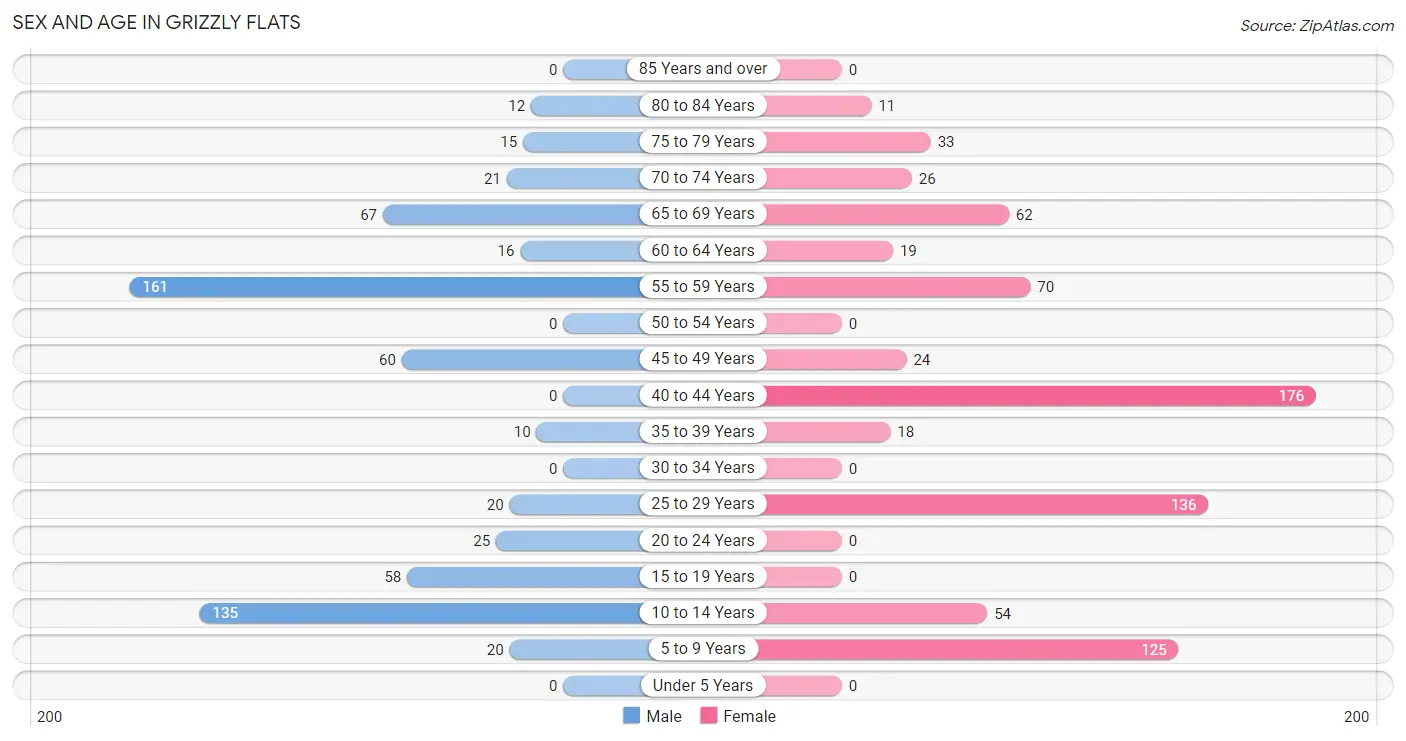
| Age Bracket | Male | Female |
| Under 5 Years | 0 (0.0%) | 0 (0.0%) |
| 5 to 9 Years | 20 (3.2%) | 125 (16.6%) |
| 10 to 14 Years | 135 (21.8%) | 54 (7.2%) |
| 15 to 19 Years | 58 (9.3%) | 0 (0.0%) |
| 20 to 24 Years | 25 (4.0%) | 0 (0.0%) |
| 25 to 29 Years | 20 (3.2%) | 136 (18.0%) |
| 30 to 34 Years | 0 (0.0%) | 0 (0.0%) |
| 35 to 39 Years | 10 (1.6%) | 18 (2.4%) |
| 40 to 44 Years | 0 (0.0%) | 176 (23.3%) |
| 45 to 49 Years | 60 (9.7%) | 24 (3.2%) |
| 50 to 54 Years | 0 (0.0%) | 0 (0.0%) |
| 55 to 59 Years | 161 (26.0%) | 70 (9.3%) |
| 60 to 64 Years | 16 (2.6%) | 19 (2.5%) |
| 65 to 69 Years | 67 (10.8%) | 62 (8.2%) |
| 70 to 74 Years | 21 (3.4%) | 26 (3.5%) |
| 75 to 79 Years | 15 (2.4%) | 33 (4.4%) |
| 80 to 84 Years | 12 (1.9%) | 11 (1.5%) |
| 85 Years and over | 0 (0.0%) | 0 (0.0%) |
| Total | 620 (100.0%) | 754 (100.0%) |
Families and Households in Grizzly Flats
Median Family Size in Grizzly Flats
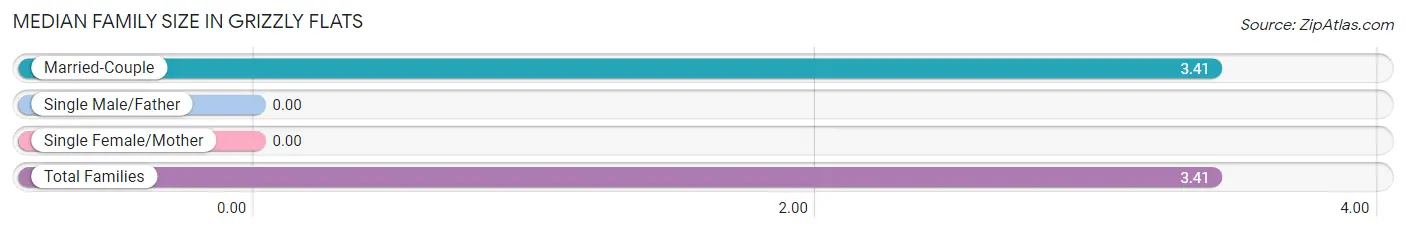
| Family Type | # Families | Family Size |
| Married-Couple | 370 (100.0%) | 3.41 |
| Single Male/Father | 0 (0.0%) | - |
| Single Female/Mother | 0 (0.0%) | - |
| Total Families | 370 (100.0%) | 3.41 |
Median Household Size in Grizzly Flats
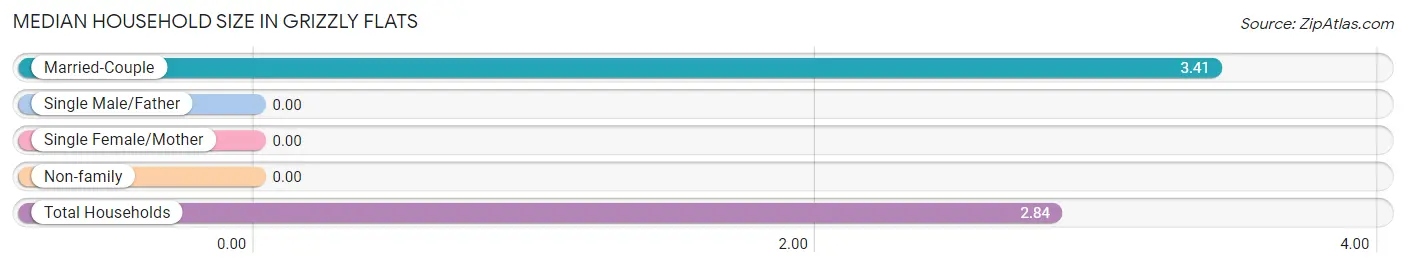
| Household Type | # Households | Household Size |
| Married-Couple | 370 (76.4%) | 3.41 |
| Single Male/Father | 0 (0.0%) | - |
| Single Female/Mother | 0 (0.0%) | - |
| Non-family | 114 (23.5%) | - |
| Total Households | 484 (100.0%) | 2.84 |
Household Size by Marriage Status in Grizzly Flats
Out of a total of 484 households in Grizzly Flats, 370 (76.4%) are family households, while 114 (23.5%) are nonfamily households. The most numerous type of family households are 4-person households, comprising 236, and the most common type of nonfamily households are 1-person households, comprising 114.
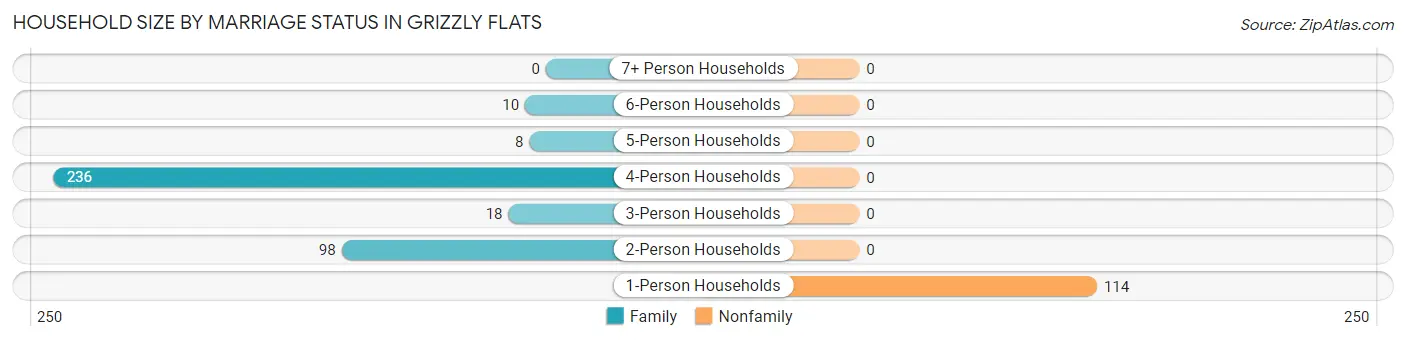
| Household Size | Family Households | Nonfamily Households |
| 1-Person Households | - | 114 (23.5%) |
| 2-Person Households | 98 (20.3%) | 0 (0.0%) |
| 3-Person Households | 18 (3.7%) | 0 (0.0%) |
| 4-Person Households | 236 (48.8%) | 0 (0.0%) |
| 5-Person Households | 8 (1.7%) | 0 (0.0%) |
| 6-Person Households | 10 (2.1%) | 0 (0.0%) |
| 7+ Person Households | 0 (0.0%) | 0 (0.0%) |
| Total | 370 (76.4%) | 114 (23.5%) |
Female Fertility in Grizzly Flats
Fertility by Age in Grizzly Flats
| Age Bracket | Women with Births | Births / 1,000 Women |
| 15 to 19 years | 0 (0.0%) | 0.0 |
| 20 to 34 years | 0 (0.0%) | 0.0 |
| 35 to 50 years | 0 (0.0%) | 0.0 |
| Total | 0 (0.0%) | 0.0 |
Fertility by Age by Marriage Status in Grizzly Flats
| Age Bracket | Married | Unmarried |
| 15 to 19 years | 0 (0.0%) | 0 (0.0%) |
| 20 to 34 years | 0 (0.0%) | 0 (0.0%) |
| 35 to 50 years | 0 (0.0%) | 0 (0.0%) |
| Total | 0 (0.0%) | 0 (0.0%) |
Fertility by Education in Grizzly Flats
| Educational Attainment | Women with Births | Births / 1,000 Women |
| Less than High School | 0 (0.0%) | 0.0 |
| High School Diploma | 0 (0.0%) | 0.0 |
| College or Associate's Degree | 0 (0.0%) | 0.0 |
| Bachelor's Degree | 0 (0.0%) | 0.0 |
| Graduate Degree | 0 (0.0%) | 0.0 |
| Total | 0 (0.0%) | 0.0 |
Fertility by Education by Marriage Status in Grizzly Flats
| Educational Attainment | Married | Unmarried |
| Less than High School | 0 (0.0%) | 0 (0.0%) |
| High School Diploma | 0 (0.0%) | 0 (0.0%) |
| College or Associate's Degree | 0 (0.0%) | 0 (0.0%) |
| Bachelor's Degree | 0 (0.0%) | 0 (0.0%) |
| Graduate Degree | 0 (0.0%) | 0 (0.0%) |
| Total | 0 (0.0%) | 0 (0.0%) |
Employment Characteristics in Grizzly Flats
Employment by Class of Employer in Grizzly Flats
Among the 544 employed individuals in Grizzly Flats, private company employees (317 | 58.3%), state government employees (75 | 13.8%), and local government employees (70 | 12.9%) make up the most common classes of employment.
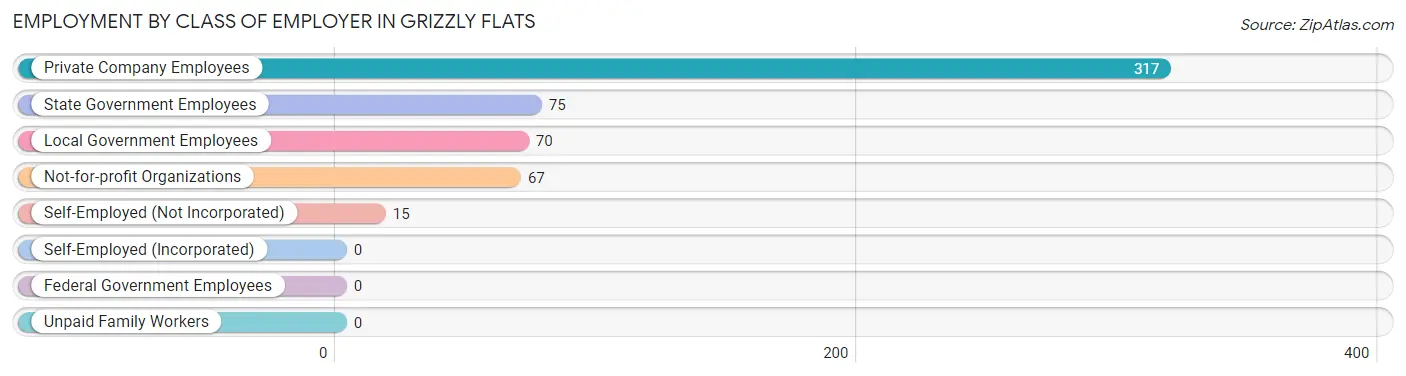
| Employer Class | # Employees | % Employees |
| Private Company Employees | 317 | 58.3% |
| Self-Employed (Incorporated) | 0 | 0.0% |
| Self-Employed (Not Incorporated) | 15 | 2.8% |
| Not-for-profit Organizations | 67 | 12.3% |
| Local Government Employees | 70 | 12.9% |
| State Government Employees | 75 | 13.8% |
| Federal Government Employees | 0 | 0.0% |
| Unpaid Family Workers | 0 | 0.0% |
| Total | 544 | 100.0% |
Employment Status by Age in Grizzly Flats
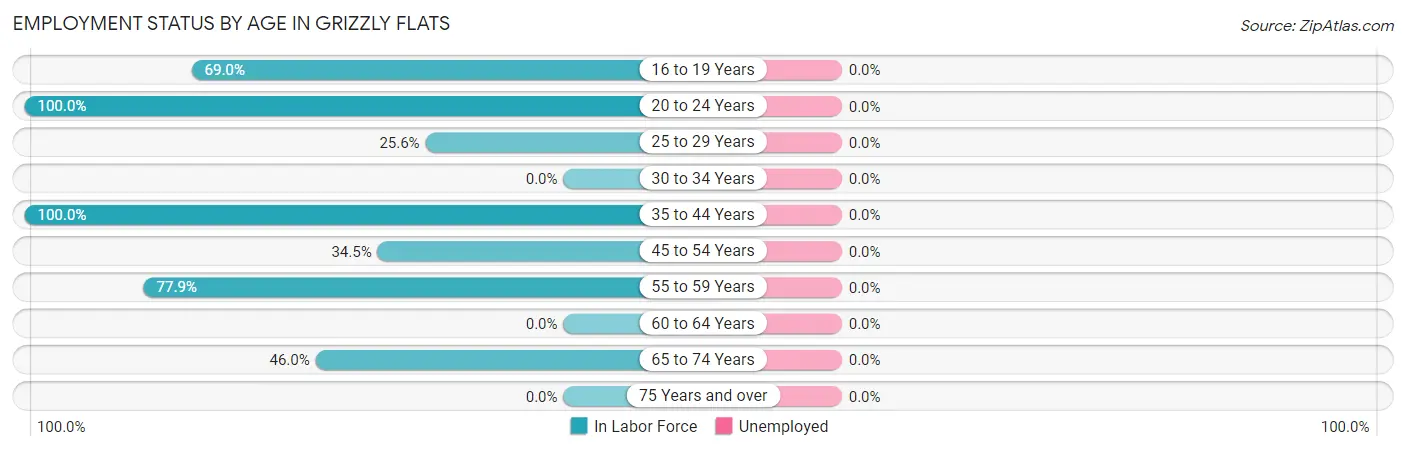
| Age Bracket | In Labor Force | Unemployed |
| 16 to 19 Years | 40 (69.0%) | 0 (0.0%) |
| 20 to 24 Years | 25 (100.0%) | 0 (0.0%) |
| 25 to 29 Years | 40 (25.6%) | 0 (0.0%) |
| 30 to 34 Years | 0 (0.0%) | 0 (0.0%) |
| 35 to 44 Years | 204 (100.0%) | 0 (0.0%) |
| 45 to 54 Years | 29 (34.5%) | 0 (0.0%) |
| 55 to 59 Years | 180 (77.9%) | 0 (0.0%) |
| 60 to 64 Years | 0 (0.0%) | 0 (0.0%) |
| 65 to 74 Years | 81 (46.0%) | 0 (0.0%) |
| 75 Years and over | 0 (0.0%) | 0 (0.0%) |
| Total | 599 (57.6%) | 0 (0.0%) |
Employment Status by Educational Attainment in Grizzly Flats
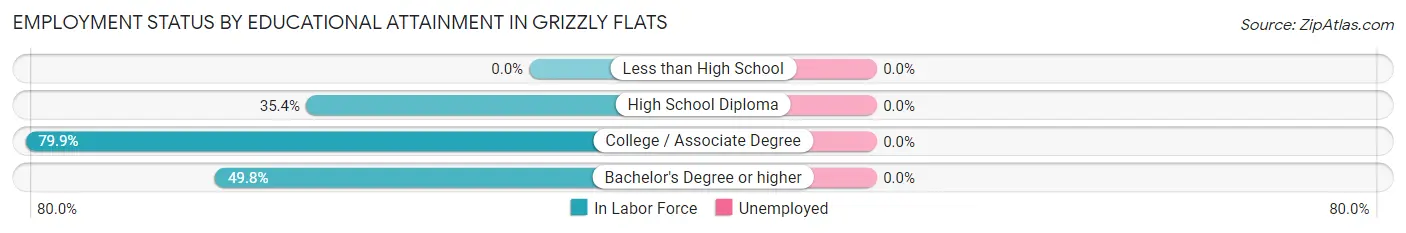
| Educational Attainment | In Labor Force | Unemployed |
| Less than High School | 0 (0.0%) | 0 (0.0%) |
| High School Diploma | 28 (35.4%) | 0 (0.0%) |
| College / Associate Degree | 294 (79.9%) | 0 (0.0%) |
| Bachelor's Degree or higher | 131 (49.8%) | 0 (0.0%) |
| Total | 453 (63.8%) | 0 (0.0%) |
Employment Occupations by Sex in Grizzly Flats
Management, Business, Science and Arts Occupations
The most common Management, Business, Science and Arts occupations in Grizzly Flats are Community & Social Service (121 | 20.2%), Education Instruction & Library (53 | 8.8%), Education, Arts & Media (49 | 8.2%), Health Diagnosing & Treating (47 | 7.9%), and Health Technologists (47 | 7.9%).
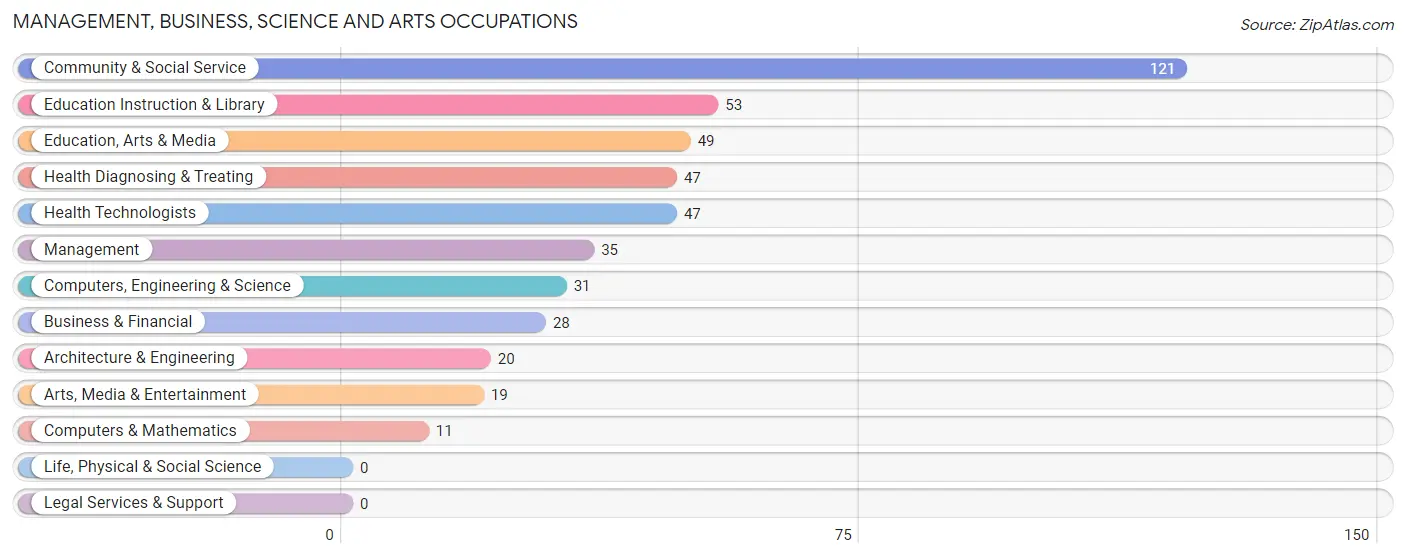
Management, Business, Science and Arts Occupations by Sex
Within the Management, Business, Science and Arts occupations in Grizzly Flats, the most male-oriented occupations are Architecture & Engineering (100.0%), Arts, Media & Entertainment (100.0%), and Computers, Engineering & Science (64.5%), while the most female-oriented occupations are Management (100.0%), Computers & Mathematics (100.0%), and Education, Arts & Media (100.0%).
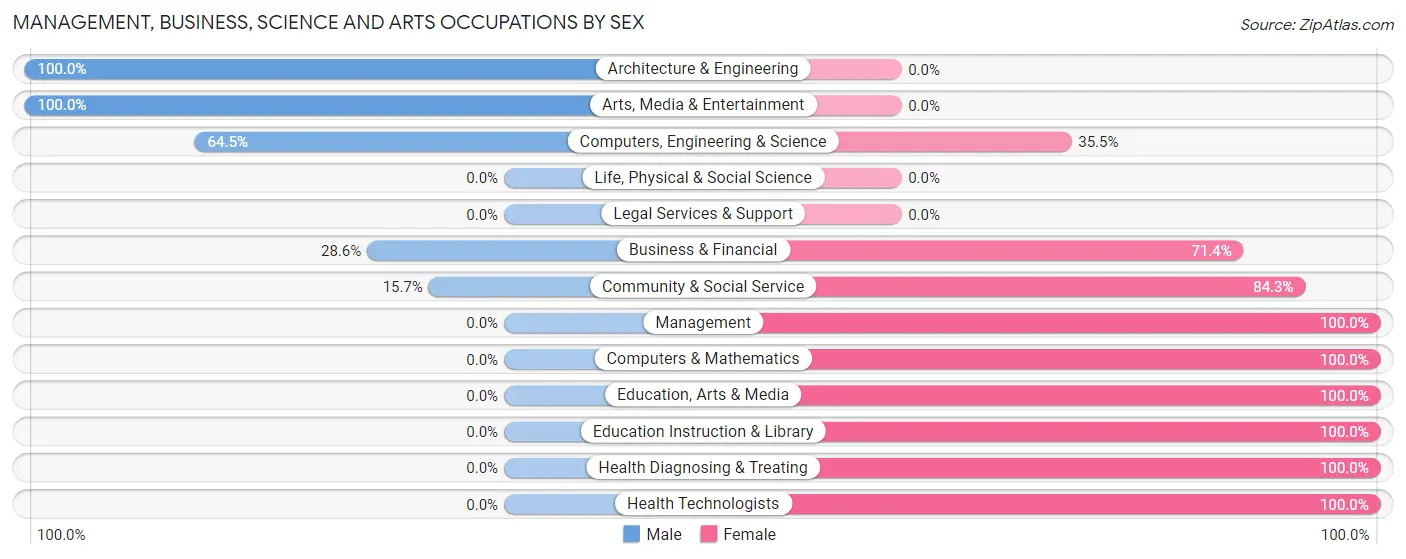
| Occupation | Male | Female |
| Management | 0 (0.0%) | 35 (100.0%) |
| Business & Financial | 8 (28.6%) | 20 (71.4%) |
| Computers, Engineering & Science | 20 (64.5%) | 11 (35.5%) |
| Computers & Mathematics | 0 (0.0%) | 11 (100.0%) |
| Architecture & Engineering | 20 (100.0%) | 0 (0.0%) |
| Life, Physical & Social Science | 0 (0.0%) | 0 (0.0%) |
| Community & Social Service | 19 (15.7%) | 102 (84.3%) |
| Education, Arts & Media | 0 (0.0%) | 49 (100.0%) |
| Legal Services & Support | 0 (0.0%) | 0 (0.0%) |
| Education Instruction & Library | 0 (0.0%) | 53 (100.0%) |
| Arts, Media & Entertainment | 19 (100.0%) | 0 (0.0%) |
| Health Diagnosing & Treating | 0 (0.0%) | 47 (100.0%) |
| Health Technologists | 0 (0.0%) | 47 (100.0%) |
| Total (Category) | 47 (17.9%) | 215 (82.1%) |
| Total (Overall) | 257 (42.9%) | 342 (57.1%) |
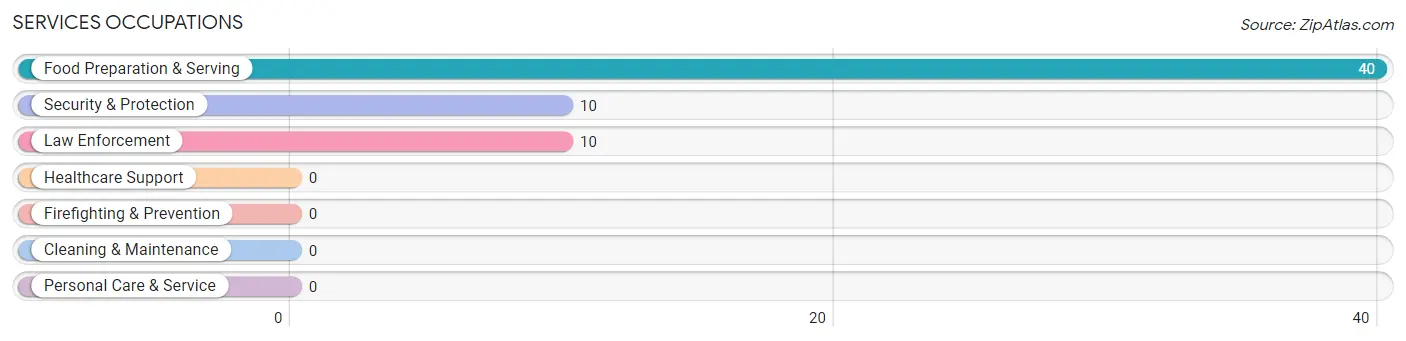
Services Occupations
The most common Services occupations in Grizzly Flats are Food Preparation & Serving (40 | 6.7%), Security & Protection (10 | 1.7%), and Law Enforcement (10 | 1.7%).
Services Occupations by Sex
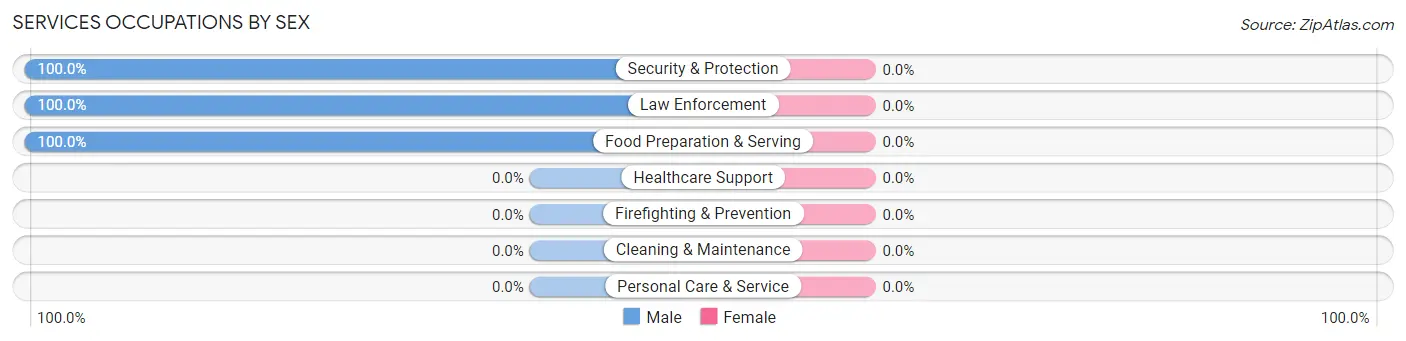
| Occupation | Male | Female |
| Healthcare Support | 0 (0.0%) | 0 (0.0%) |
| Security & Protection | 10 (100.0%) | 0 (0.0%) |
| Firefighting & Prevention | 0 (0.0%) | 0 (0.0%) |
| Law Enforcement | 10 (100.0%) | 0 (0.0%) |
| Food Preparation & Serving | 40 (100.0%) | 0 (0.0%) |
| Cleaning & Maintenance | 0 (0.0%) | 0 (0.0%) |
| Personal Care & Service | 0 (0.0%) | 0 (0.0%) |
| Total (Category) | 50 (100.0%) | 0 (0.0%) |
| Total (Overall) | 257 (42.9%) | 342 (57.1%) |
Sales and Office Occupations
The most common Sales and Office occupations in Grizzly Flats are , and Office & Administration (127 | 21.2%).
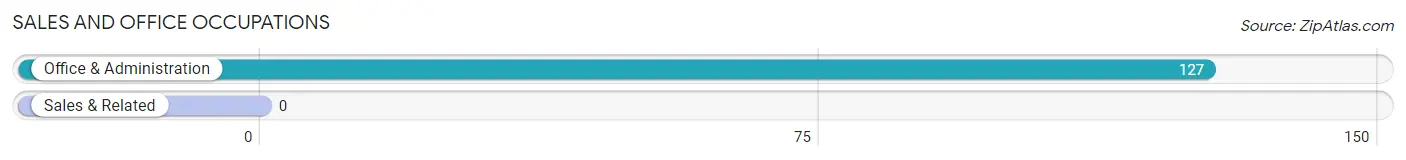
Sales and Office Occupations by Sex
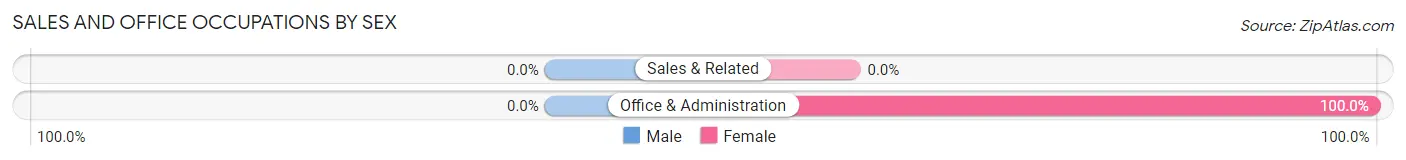
| Occupation | Male | Female |
| Sales & Related | 0 (0.0%) | 0 (0.0%) |
| Office & Administration | 0 (0.0%) | 127 (100.0%) |
| Total (Category) | 0 (0.0%) | 127 (100.0%) |
| Total (Overall) | 257 (42.9%) | 342 (57.1%) |
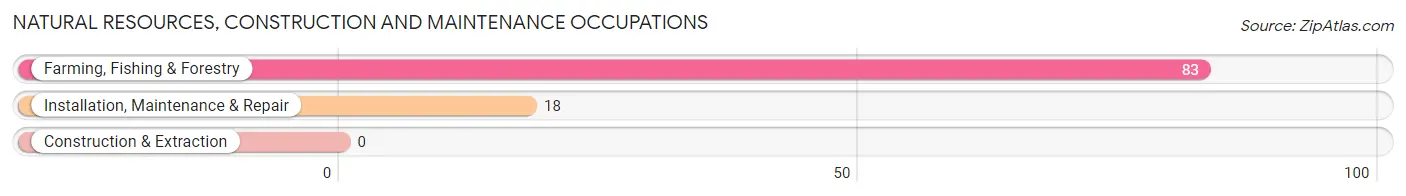
Natural Resources, Construction and Maintenance Occupations
The most common Natural Resources, Construction and Maintenance occupations in Grizzly Flats are Farming, Fishing & Forestry (83 | 13.9%), and Installation, Maintenance & Repair (18 | 3.0%).
Natural Resources, Construction and Maintenance Occupations by Sex
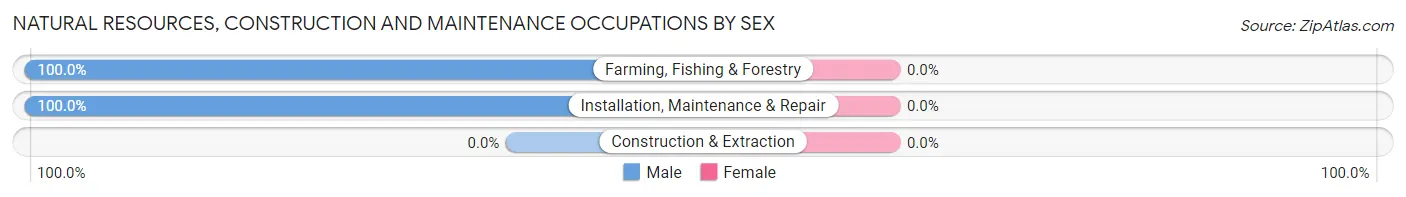
| Occupation | Male | Female |
| Farming, Fishing & Forestry | 83 (100.0%) | 0 (0.0%) |
| Construction & Extraction | 0 (0.0%) | 0 (0.0%) |
| Installation, Maintenance & Repair | 18 (100.0%) | 0 (0.0%) |
| Total (Category) | 101 (100.0%) | 0 (0.0%) |
| Total (Overall) | 257 (42.9%) | 342 (57.1%) |
Production, Transportation and Moving Occupations
The most common Production, Transportation and Moving occupations in Grizzly Flats are , and Production (59 | 9.9%).
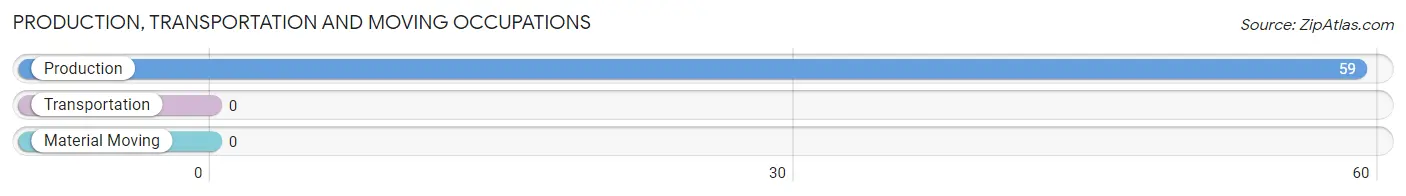
Production, Transportation and Moving Occupations by Sex
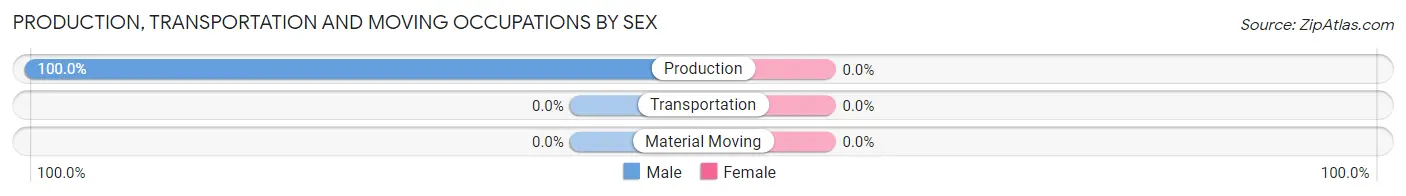
| Occupation | Male | Female |
| Production | 59 (100.0%) | 0 (0.0%) |
| Transportation | 0 (0.0%) | 0 (0.0%) |
| Material Moving | 0 (0.0%) | 0 (0.0%) |
| Total (Category) | 59 (100.0%) | 0 (0.0%) |
| Total (Overall) | 257 (42.9%) | 342 (57.1%) |
Employment Industries by Sex in Grizzly Flats
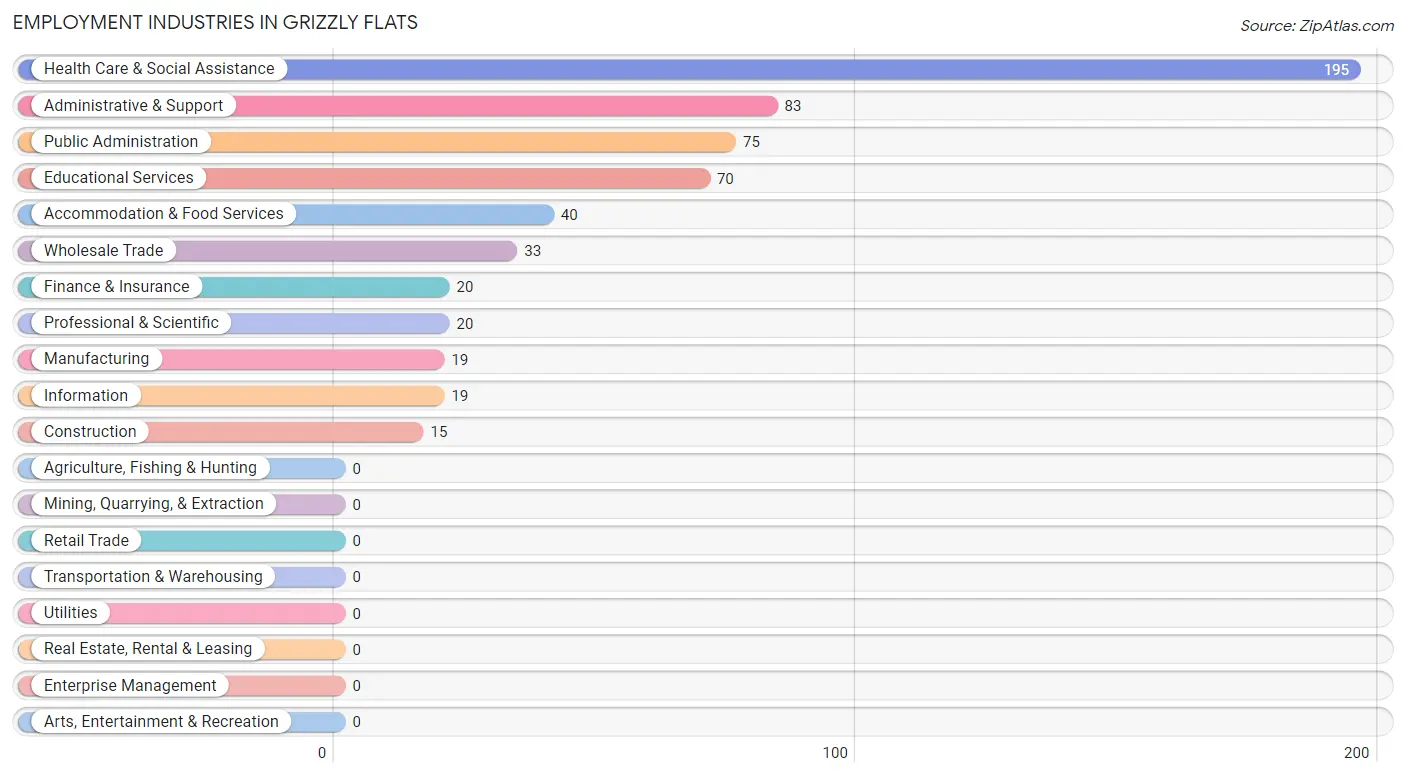
Employment Industries in Grizzly Flats
The major employment industries in Grizzly Flats include Health Care & Social Assistance (195 | 32.6%), Administrative & Support (83 | 13.9%), Public Administration (75 | 12.5%), Educational Services (70 | 11.7%), and Accommodation & Food Services (40 | 6.7%).
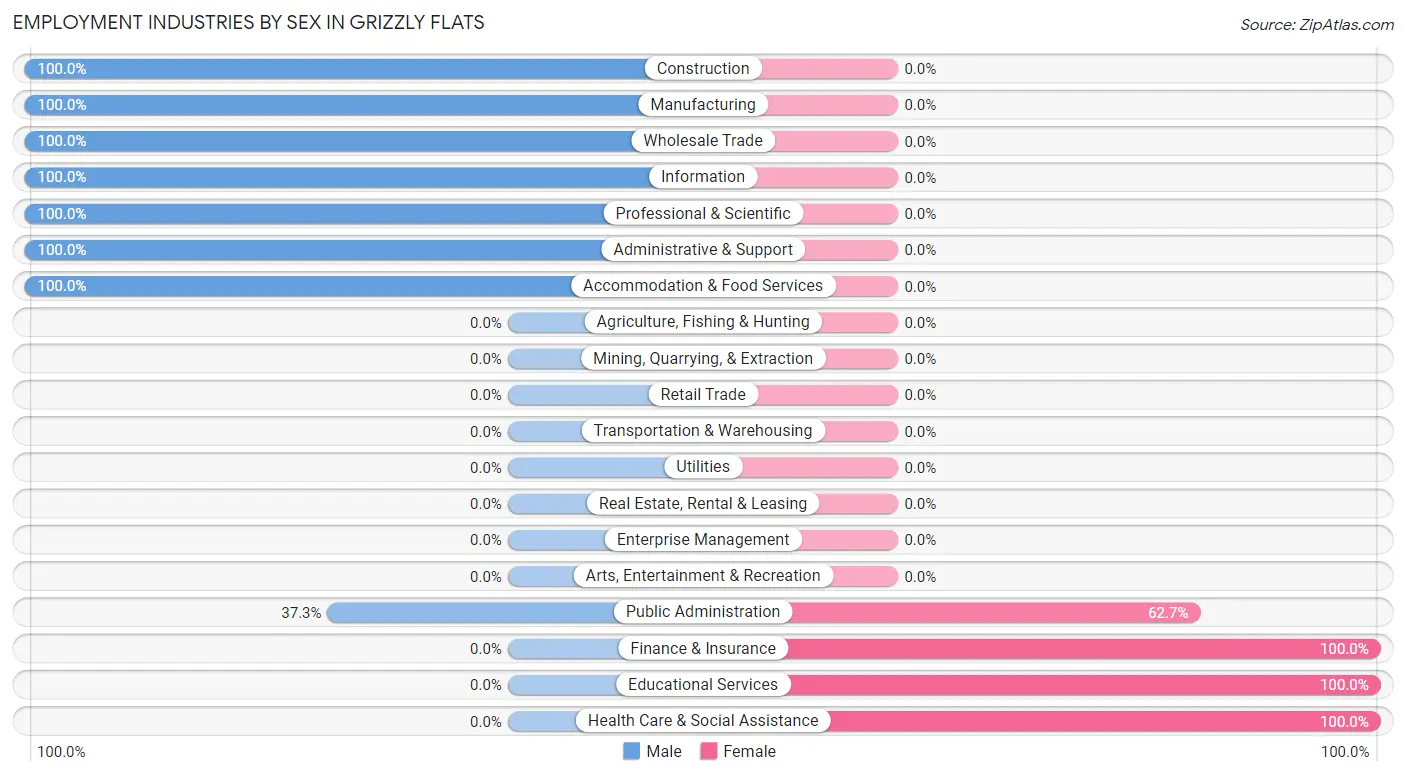
Employment Industries by Sex in Grizzly Flats
The Grizzly Flats industries that see more men than women are Construction (100.0%), Manufacturing (100.0%), and Wholesale Trade (100.0%), whereas the industries that tend to have a higher number of women are Finance & Insurance (100.0%), Educational Services (100.0%), and Health Care & Social Assistance (100.0%).
| Industry | Male | Female |
| Agriculture, Fishing & Hunting | 0 (0.0%) | 0 (0.0%) |
| Mining, Quarrying, & Extraction | 0 (0.0%) | 0 (0.0%) |
| Construction | 15 (100.0%) | 0 (0.0%) |
| Manufacturing | 19 (100.0%) | 0 (0.0%) |
| Wholesale Trade | 33 (100.0%) | 0 (0.0%) |
| Retail Trade | 0 (0.0%) | 0 (0.0%) |
| Transportation & Warehousing | 0 (0.0%) | 0 (0.0%) |
| Utilities | 0 (0.0%) | 0 (0.0%) |
| Information | 19 (100.0%) | 0 (0.0%) |
| Finance & Insurance | 0 (0.0%) | 20 (100.0%) |
| Real Estate, Rental & Leasing | 0 (0.0%) | 0 (0.0%) |
| Professional & Scientific | 20 (100.0%) | 0 (0.0%) |
| Enterprise Management | 0 (0.0%) | 0 (0.0%) |
| Administrative & Support | 83 (100.0%) | 0 (0.0%) |
| Educational Services | 0 (0.0%) | 70 (100.0%) |
| Health Care & Social Assistance | 0 (0.0%) | 195 (100.0%) |
| Arts, Entertainment & Recreation | 0 (0.0%) | 0 (0.0%) |
| Accommodation & Food Services | 40 (100.0%) | 0 (0.0%) |
| Public Administration | 28 (37.3%) | 47 (62.7%) |
| Total | 257 (42.9%) | 342 (57.1%) |
Education in Grizzly Flats
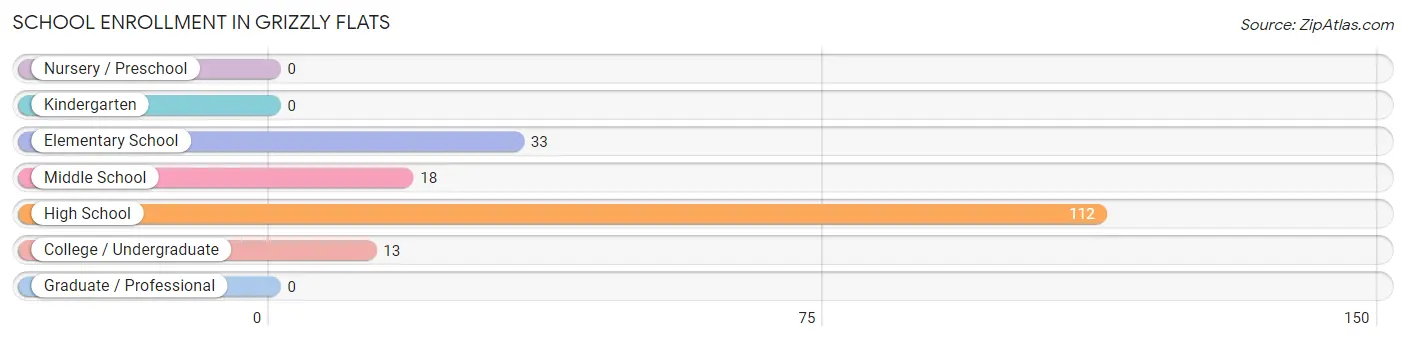
School Enrollment in Grizzly Flats
The most common levels of schooling among the 176 students in Grizzly Flats are high school (112 | 63.6%), elementary school (33 | 18.8%), and middle school (18 | 10.2%).
| School Level | # Students | % Students |
| Nursery / Preschool | 0 | 0.0% |
| Kindergarten | 0 | 0.0% |
| Elementary School | 33 | 18.8% |
| Middle School | 18 | 10.2% |
| High School | 112 | 63.6% |
| College / Undergraduate | 13 | 7.4% |
| Graduate / Professional | 0 | 0.0% |
| Total | 176 | 100.0% |
School Enrollment by Age by Funding Source in Grizzly Flats
Out of a total of 176 students who are enrolled in schools in Grizzly Flats, 11 (6.3%) attend a private institution, while the remaining 165 (93.7%) are enrolled in public schools. The age group of 5 to 9 year old has the highest likelihood of being enrolled in private schools, with 11 (50.0% in the age bracket) enrolled. Conversely, the age group of 10 to 14 year olds has the lowest likelihood of being enrolled in a private school, with 83 (100.0% in the age bracket) attending a public institution.
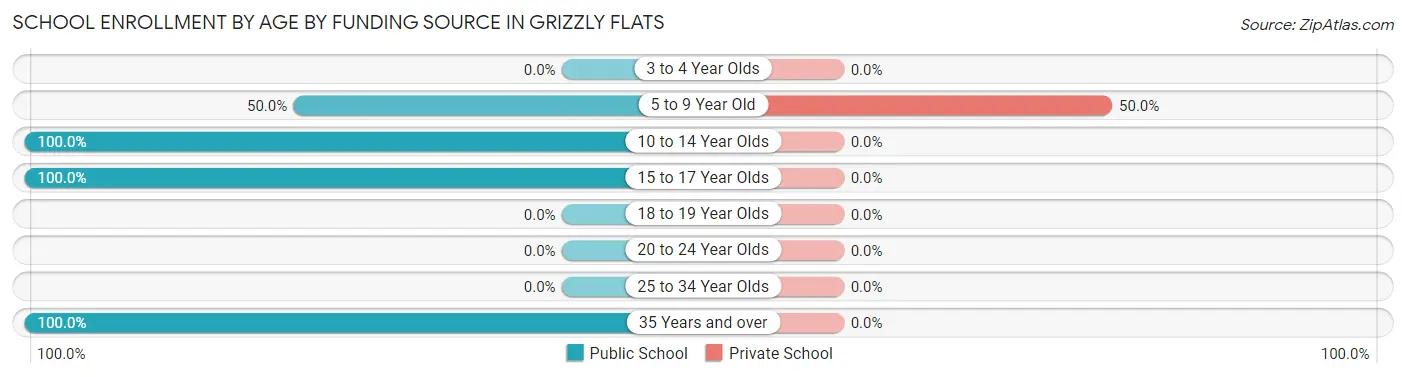
| Age Bracket | Public School | Private School |
| 3 to 4 Year Olds | 0 (0.0%) | 0 (0.0%) |
| 5 to 9 Year Old | 11 (50.0%) | 11 (50.0%) |
| 10 to 14 Year Olds | 83 (100.0%) | 0 (0.0%) |
| 15 to 17 Year Olds | 58 (100.0%) | 0 (0.0%) |
| 18 to 19 Year Olds | 0 (0.0%) | 0 (0.0%) |
| 20 to 24 Year Olds | 0 (0.0%) | 0 (0.0%) |
| 25 to 34 Year Olds | 0 (0.0%) | 0 (0.0%) |
| 35 Years and over | 13 (100.0%) | 0 (0.0%) |
| Total | 165 (93.8%) | 11 (6.3%) |
Educational Attainment by Field of Study in Grizzly Flats
Social sciences (116 | 36.7%), education (53 | 16.8%), psychology (39 | 12.3%), business (29 | 9.2%), and visual & performing arts (28 | 8.9%) are the most common fields of study among 316 individuals in Grizzly Flats who have obtained a bachelor's degree or higher.
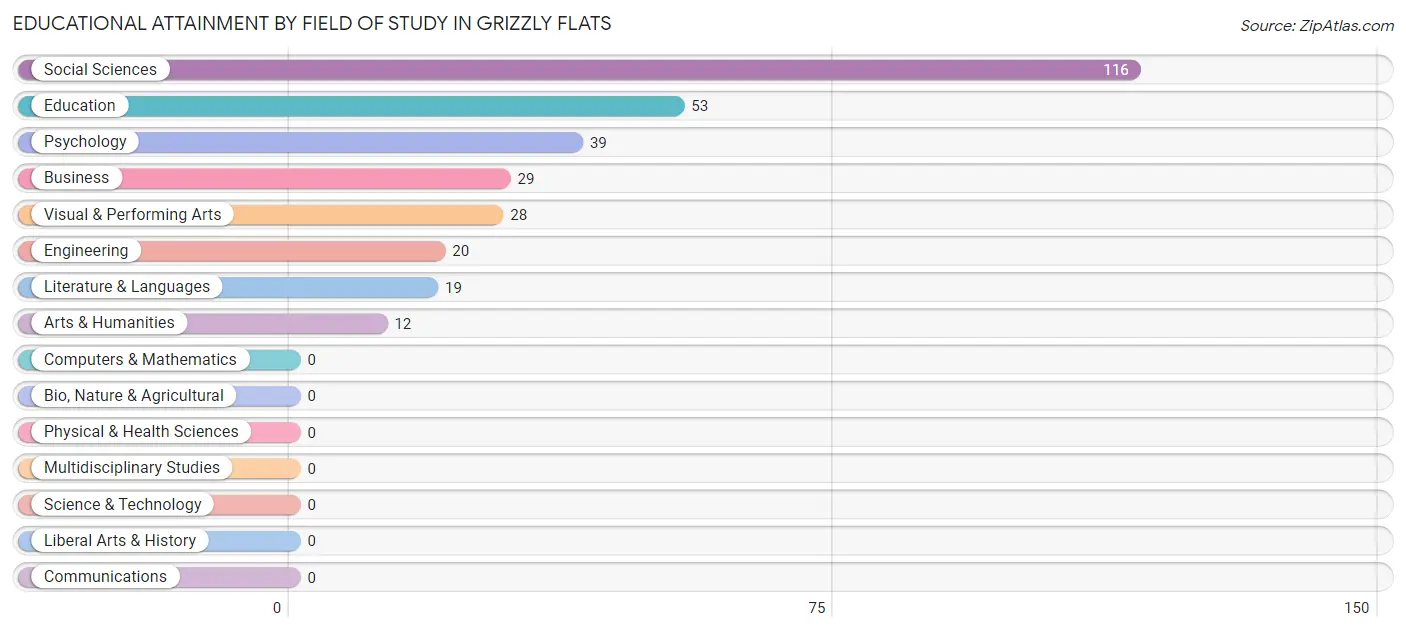
| Field of Study | # Graduates | % Graduates |
| Computers & Mathematics | 0 | 0.0% |
| Bio, Nature & Agricultural | 0 | 0.0% |
| Physical & Health Sciences | 0 | 0.0% |
| Psychology | 39 | 12.3% |
| Social Sciences | 116 | 36.7% |
| Engineering | 20 | 6.3% |
| Multidisciplinary Studies | 0 | 0.0% |
| Science & Technology | 0 | 0.0% |
| Business | 29 | 9.2% |
| Education | 53 | 16.8% |
| Literature & Languages | 19 | 6.0% |
| Liberal Arts & History | 0 | 0.0% |
| Visual & Performing Arts | 28 | 8.9% |
| Communications | 0 | 0.0% |
| Arts & Humanities | 12 | 3.8% |
| Total | 316 | 100.0% |
Transportation & Commute in Grizzly Flats
Vehicle Availability by Sex in Grizzly Flats
The most prevalent vehicle ownership categories in Grizzly Flats are males with 3 vehicles (91, accounting for 42.7%) and females with 3 vehicles (127, making up 27.5%).
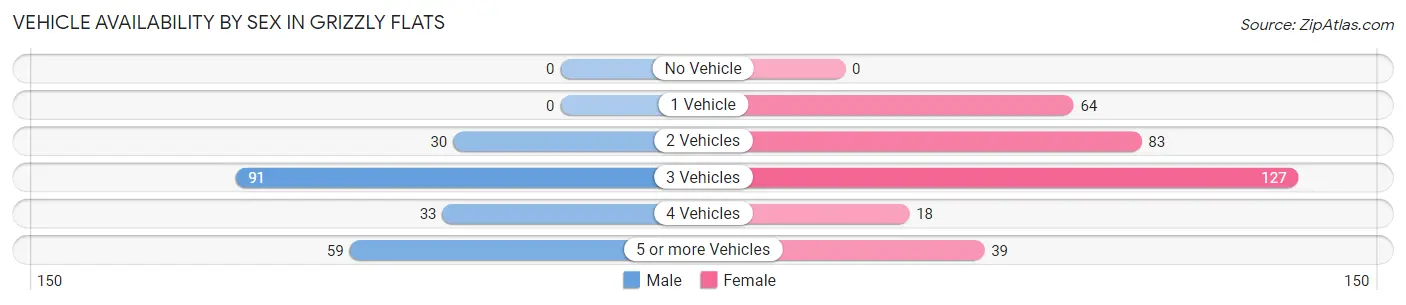
| Vehicles Available | Male | Female |
| No Vehicle | 0 (0.0%) | 0 (0.0%) |
| 1 Vehicle | 0 (0.0%) | 64 (19.3%) |
| 2 Vehicles | 30 (14.1%) | 83 (25.1%) |
| 3 Vehicles | 91 (42.7%) | 127 (38.4%) |
| 4 Vehicles | 33 (15.5%) | 18 (5.4%) |
| 5 or more Vehicles | 59 (27.7%) | 39 (11.8%) |
| Total | 213 (100.0%) | 331 (100.0%) |
Commute Time in Grizzly Flats
The most frequently occuring commute durations in Grizzly Flats are 60 to 89 minutes (214 commuters, 52.8%), 45 to 59 minutes (141 commuters, 34.8%), and 90 or more minutes (35 commuters, 8.6%).
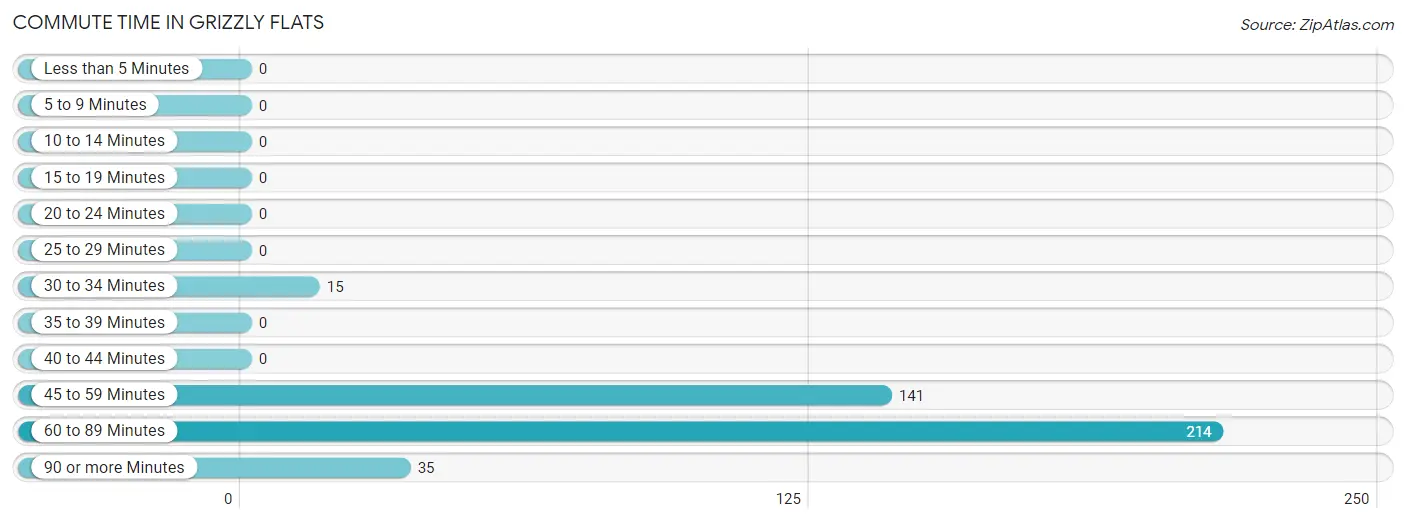
| Commute Time | # Commuters | % Commuters |
| Less than 5 Minutes | 0 | 0.0% |
| 5 to 9 Minutes | 0 | 0.0% |
| 10 to 14 Minutes | 0 | 0.0% |
| 15 to 19 Minutes | 0 | 0.0% |
| 20 to 24 Minutes | 0 | 0.0% |
| 25 to 29 Minutes | 0 | 0.0% |
| 30 to 34 Minutes | 15 | 3.7% |
| 35 to 39 Minutes | 0 | 0.0% |
| 40 to 44 Minutes | 0 | 0.0% |
| 45 to 59 Minutes | 141 | 34.8% |
| 60 to 89 Minutes | 214 | 52.8% |
| 90 or more Minutes | 35 | 8.6% |
Commute Time by Sex in Grizzly Flats
The most common commute times in Grizzly Flats are 45 to 59 minutes (123 commuters, 69.9%) for males and 60 to 89 minutes (194 commuters, 84.7%) for females.
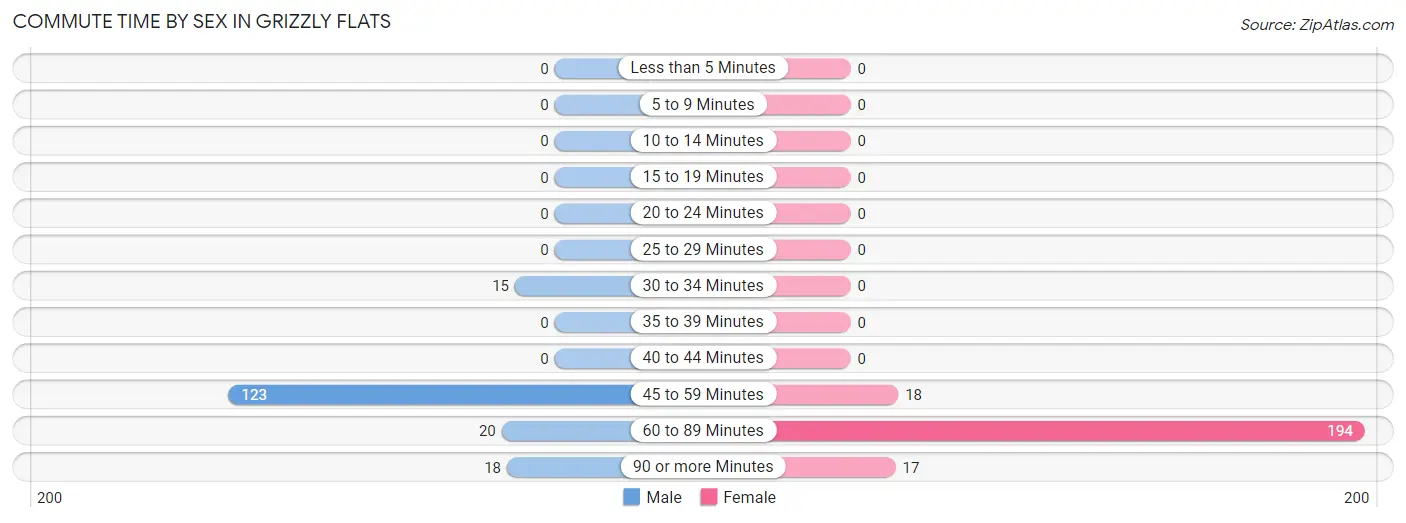
| Commute Time | Male | Female |
| Less than 5 Minutes | 0 (0.0%) | 0 (0.0%) |
| 5 to 9 Minutes | 0 (0.0%) | 0 (0.0%) |
| 10 to 14 Minutes | 0 (0.0%) | 0 (0.0%) |
| 15 to 19 Minutes | 0 (0.0%) | 0 (0.0%) |
| 20 to 24 Minutes | 0 (0.0%) | 0 (0.0%) |
| 25 to 29 Minutes | 0 (0.0%) | 0 (0.0%) |
| 30 to 34 Minutes | 15 (8.5%) | 0 (0.0%) |
| 35 to 39 Minutes | 0 (0.0%) | 0 (0.0%) |
| 40 to 44 Minutes | 0 (0.0%) | 0 (0.0%) |
| 45 to 59 Minutes | 123 (69.9%) | 18 (7.9%) |
| 60 to 89 Minutes | 20 (11.4%) | 194 (84.7%) |
| 90 or more Minutes | 18 (10.2%) | 17 (7.4%) |
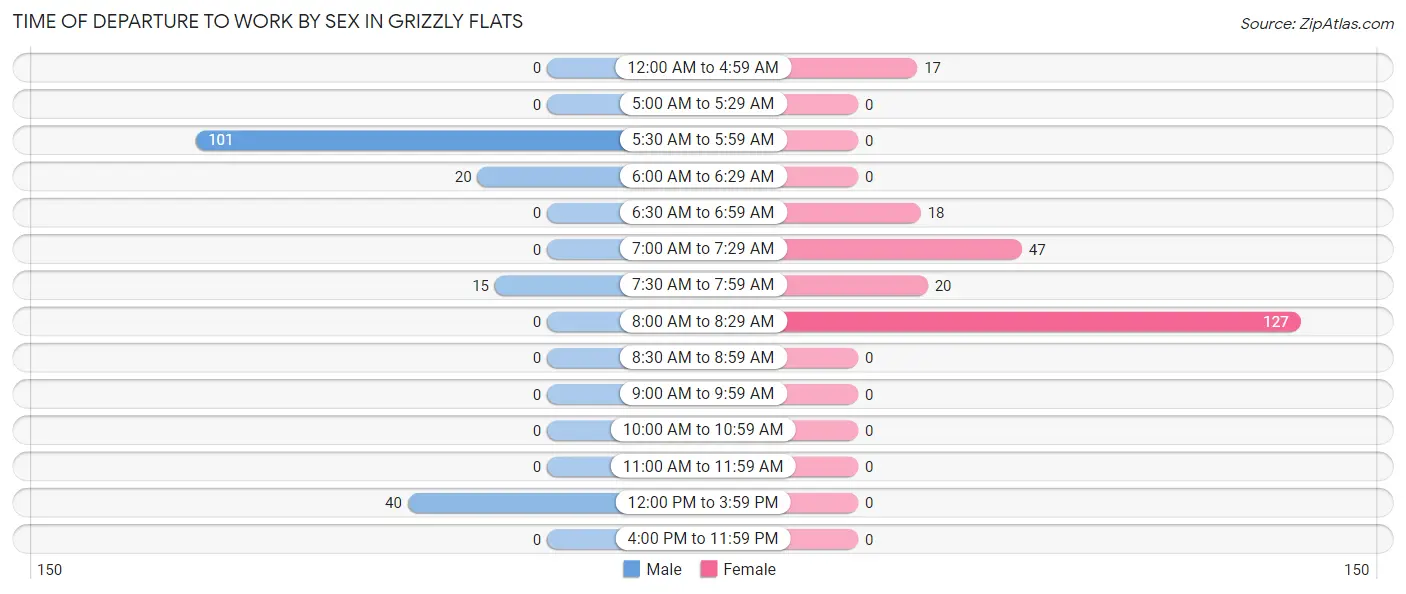
Time of Departure to Work by Sex in Grizzly Flats
The most frequent times of departure to work in Grizzly Flats are 5:30 AM to 5:59 AM (101, 57.4%) for males and 8:00 AM to 8:29 AM (127, 55.5%) for females.
| Time of Departure | Male | Female |
| 12:00 AM to 4:59 AM | 0 (0.0%) | 17 (7.4%) |
| 5:00 AM to 5:29 AM | 0 (0.0%) | 0 (0.0%) |
| 5:30 AM to 5:59 AM | 101 (57.4%) | 0 (0.0%) |
| 6:00 AM to 6:29 AM | 20 (11.4%) | 0 (0.0%) |
| 6:30 AM to 6:59 AM | 0 (0.0%) | 18 (7.9%) |
| 7:00 AM to 7:29 AM | 0 (0.0%) | 47 (20.5%) |
| 7:30 AM to 7:59 AM | 15 (8.5%) | 20 (8.7%) |
| 8:00 AM to 8:29 AM | 0 (0.0%) | 127 (55.5%) |
| 8:30 AM to 8:59 AM | 0 (0.0%) | 0 (0.0%) |
| 9:00 AM to 9:59 AM | 0 (0.0%) | 0 (0.0%) |
| 10:00 AM to 10:59 AM | 0 (0.0%) | 0 (0.0%) |
| 11:00 AM to 11:59 AM | 0 (0.0%) | 0 (0.0%) |
| 12:00 PM to 3:59 PM | 40 (22.7%) | 0 (0.0%) |
| 4:00 PM to 11:59 PM | 0 (0.0%) | 0 (0.0%) |
| Total | 176 (100.0%) | 229 (100.0%) |
Housing Occupancy in Grizzly Flats
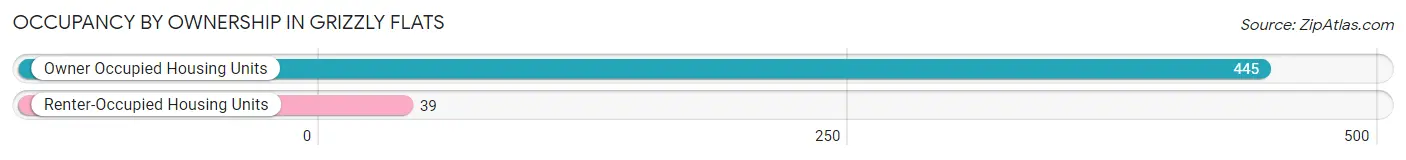
Occupancy by Ownership in Grizzly Flats
Of the total 484 dwellings in Grizzly Flats, owner-occupied units account for 445 (91.9%), while renter-occupied units make up 39 (8.1%).
| Occupancy | # Housing Units | % Housing Units |
| Owner Occupied Housing Units | 445 | 91.9% |
| Renter-Occupied Housing Units | 39 | 8.1% |
| Total Occupied Housing Units | 484 | 100.0% |
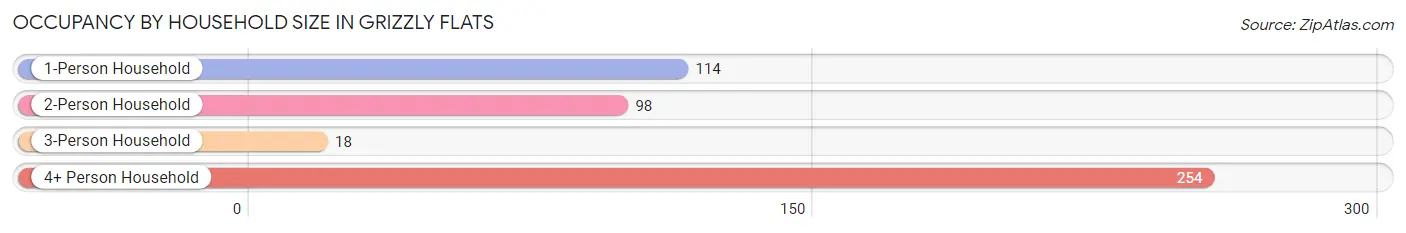
Occupancy by Household Size in Grizzly Flats
| Household Size | # Housing Units | % Housing Units |
| 1-Person Household | 114 | 23.5% |
| 2-Person Household | 98 | 20.3% |
| 3-Person Household | 18 | 3.7% |
| 4+ Person Household | 254 | 52.5% |
| Total Housing Units | 484 | 100.0% |
Occupancy by Ownership by Household Size in Grizzly Flats
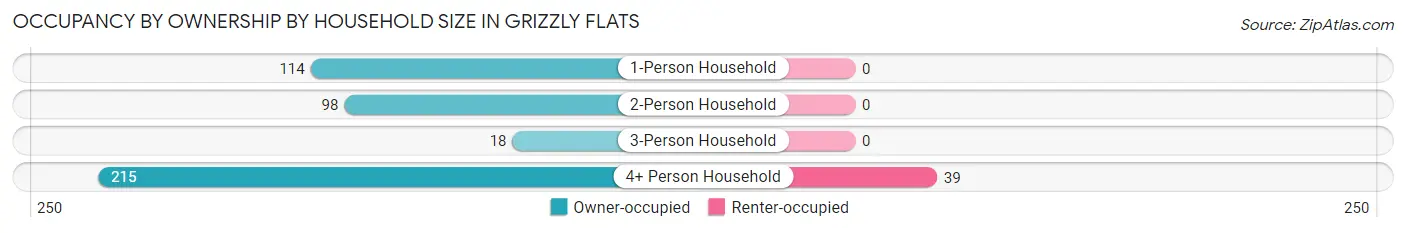
| Household Size | Owner-occupied | Renter-occupied |
| 1-Person Household | 114 (100.0%) | 0 (0.0%) |
| 2-Person Household | 98 (100.0%) | 0 (0.0%) |
| 3-Person Household | 18 (100.0%) | 0 (0.0%) |
| 4+ Person Household | 215 (84.7%) | 39 (15.3%) |
| Total Housing Units | 445 (91.9%) | 39 (8.1%) |
Occupancy by Educational Attainment in Grizzly Flats
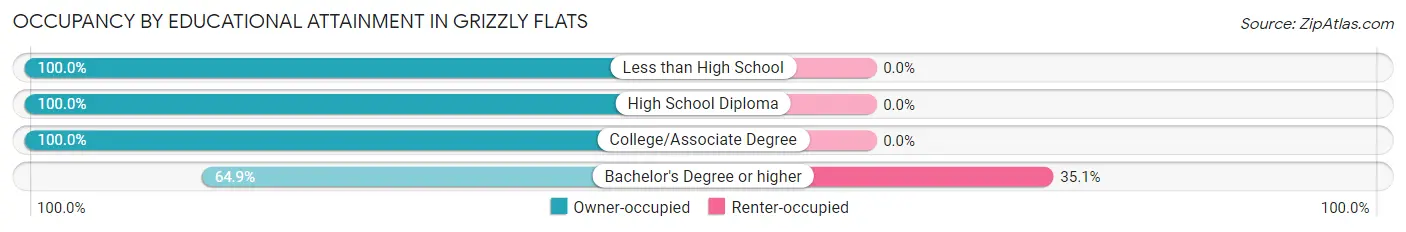
| Household Size | Owner-occupied | Renter-occupied |
| Less than High School | 15 (100.0%) | 0 (0.0%) |
| High School Diploma | 79 (100.0%) | 0 (0.0%) |
| College/Associate Degree | 279 (100.0%) | 0 (0.0%) |
| Bachelor's Degree or higher | 72 (64.9%) | 39 (35.1%) |
Occupancy by Age of Householder in Grizzly Flats
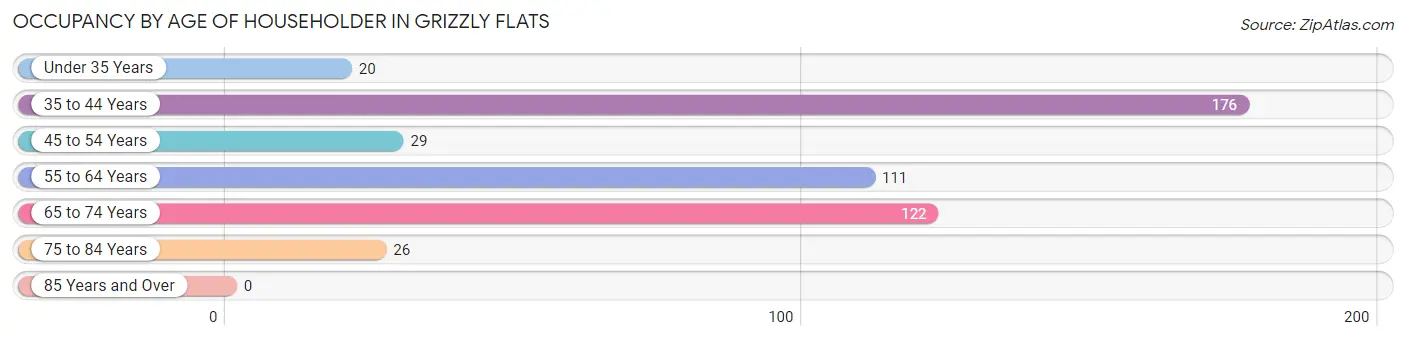
| Age Bracket | # Households | % Households |
| Under 35 Years | 20 | 4.1% |
| 35 to 44 Years | 176 | 36.4% |
| 45 to 54 Years | 29 | 6.0% |
| 55 to 64 Years | 111 | 22.9% |
| 65 to 74 Years | 122 | 25.2% |
| 75 to 84 Years | 26 | 5.4% |
| 85 Years and Over | 0 | 0.0% |
| Total | 484 | 100.0% |
Housing Finances in Grizzly Flats
Median Income by Occupancy in Grizzly Flats
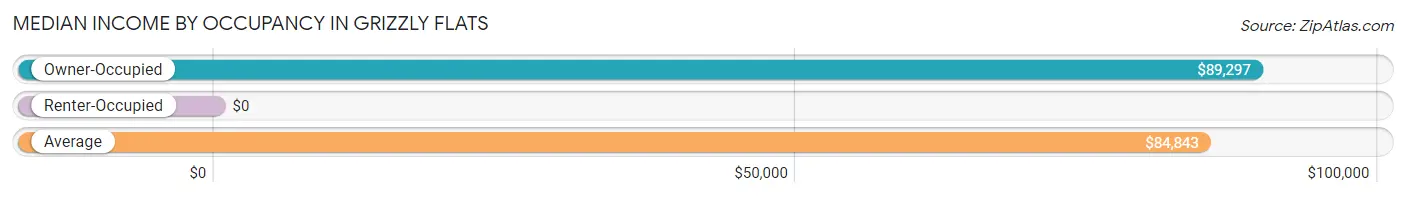
| Occupancy Type | # Households | Median Income |
| Owner-Occupied | 445 (91.9%) | $89,297 |
| Renter-Occupied | 39 (8.1%) | $0 |
| Average | 484 (100.0%) | $84,843 |
Occupancy by Householder Income Bracket in Grizzly Flats
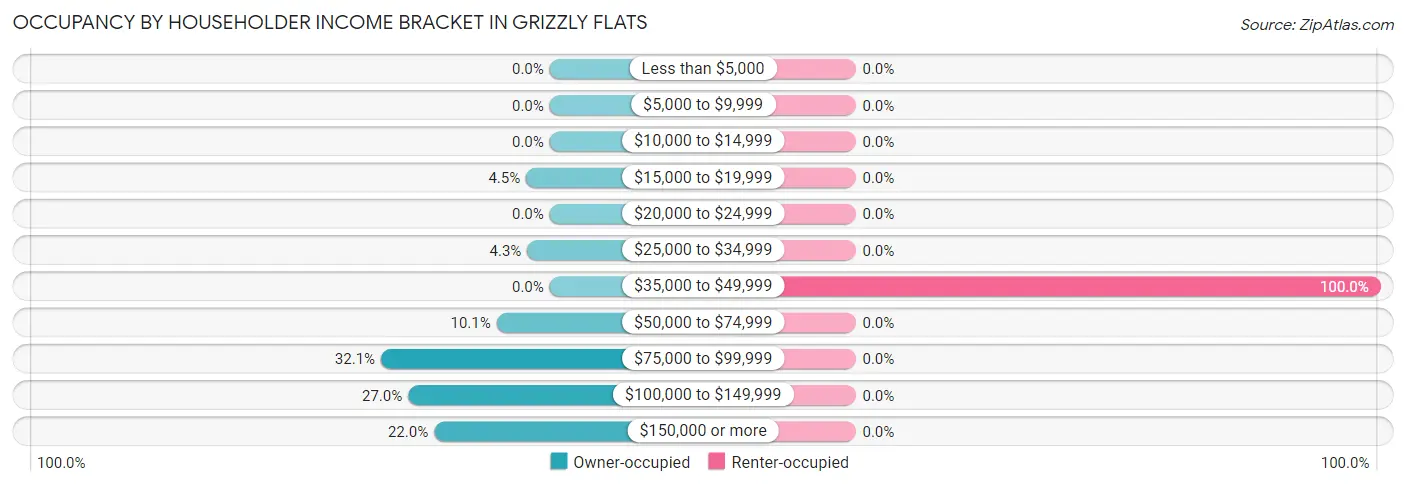
| Income Bracket | Owner-occupied | Renter-occupied |
| Less than $5,000 | 0 (0.0%) | 0 (0.0%) |
| $5,000 to $9,999 | 0 (0.0%) | 0 (0.0%) |
| $10,000 to $14,999 | 0 (0.0%) | 0 (0.0%) |
| $15,000 to $19,999 | 20 (4.5%) | 0 (0.0%) |
| $20,000 to $24,999 | 0 (0.0%) | 0 (0.0%) |
| $25,000 to $34,999 | 19 (4.3%) | 0 (0.0%) |
| $35,000 to $49,999 | 0 (0.0%) | 39 (100.0%) |
| $50,000 to $74,999 | 45 (10.1%) | 0 (0.0%) |
| $75,000 to $99,999 | 143 (32.1%) | 0 (0.0%) |
| $100,000 to $149,999 | 120 (27.0%) | 0 (0.0%) |
| $150,000 or more | 98 (22.0%) | 0 (0.0%) |
| Total | 445 (100.0%) | 39 (100.0%) |
Monthly Housing Cost Tiers in Grizzly Flats
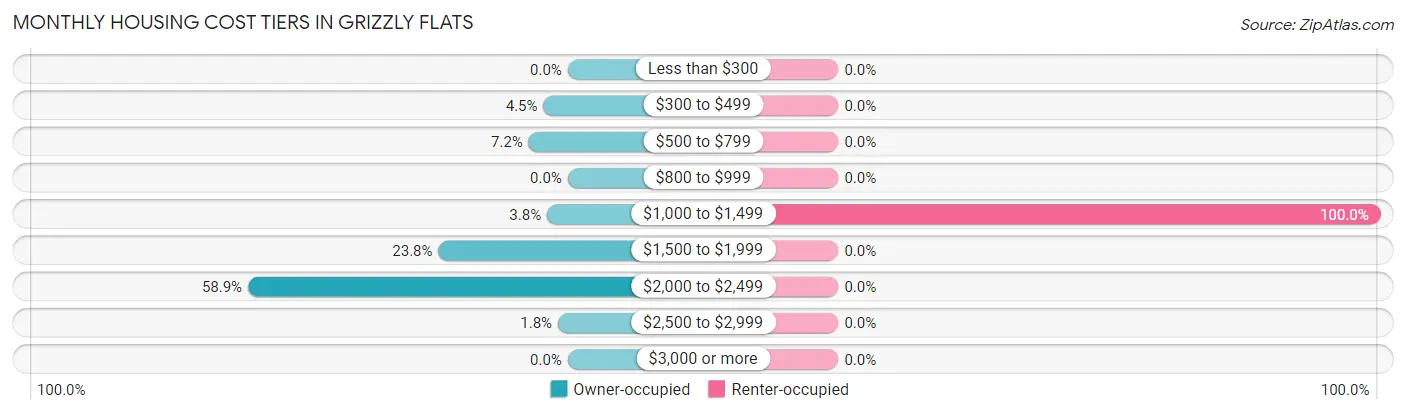
| Monthly Cost | Owner-occupied | Renter-occupied |
| Less than $300 | 0 (0.0%) | 0 (0.0%) |
| $300 to $499 | 20 (4.5%) | 0 (0.0%) |
| $500 to $799 | 32 (7.2%) | 0 (0.0%) |
| $800 to $999 | 0 (0.0%) | 0 (0.0%) |
| $1,000 to $1,499 | 17 (3.8%) | 39 (100.0%) |
| $1,500 to $1,999 | 106 (23.8%) | 0 (0.0%) |
| $2,000 to $2,499 | 262 (58.9%) | 0 (0.0%) |
| $2,500 to $2,999 | 8 (1.8%) | 0 (0.0%) |
| $3,000 or more | 0 (0.0%) | 0 (0.0%) |
| Total | 445 (100.0%) | 39 (100.0%) |
Physical Housing Characteristics in Grizzly Flats
Housing Structures in Grizzly Flats
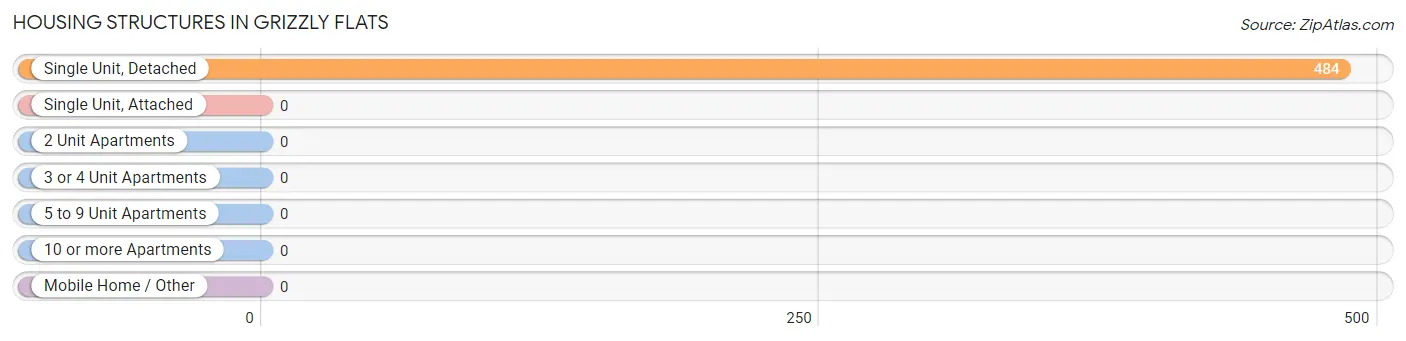
| Structure Type | # Housing Units | % Housing Units |
| Single Unit, Detached | 484 | 100.0% |
| Single Unit, Attached | 0 | 0.0% |
| 2 Unit Apartments | 0 | 0.0% |
| 3 or 4 Unit Apartments | 0 | 0.0% |
| 5 to 9 Unit Apartments | 0 | 0.0% |
| 10 or more Apartments | 0 | 0.0% |
| Mobile Home / Other | 0 | 0.0% |
| Total | 484 | 100.0% |
Housing Structures by Occupancy in Grizzly Flats
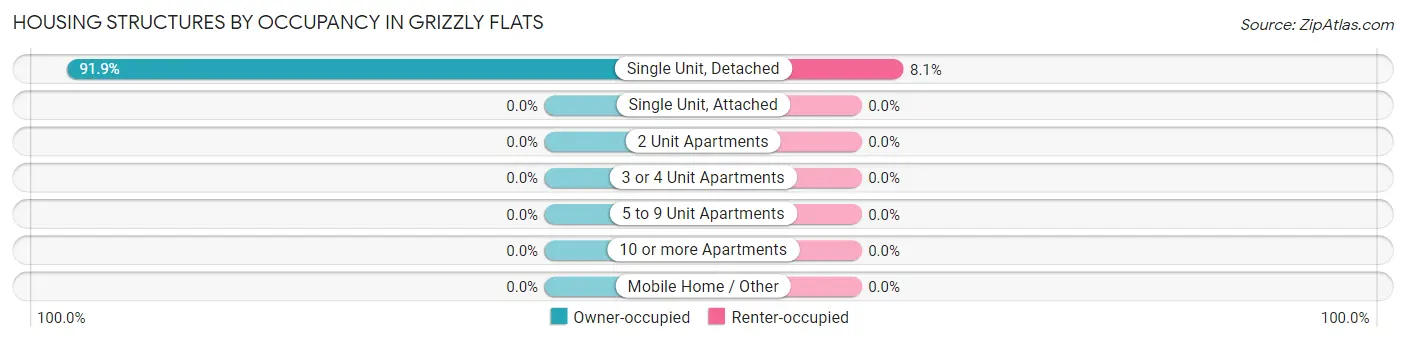
| Structure Type | Owner-occupied | Renter-occupied |
| Single Unit, Detached | 445 (91.9%) | 39 (8.1%) |
| Single Unit, Attached | 0 (0.0%) | 0 (0.0%) |
| 2 Unit Apartments | 0 (0.0%) | 0 (0.0%) |
| 3 or 4 Unit Apartments | 0 (0.0%) | 0 (0.0%) |
| 5 to 9 Unit Apartments | 0 (0.0%) | 0 (0.0%) |
| 10 or more Apartments | 0 (0.0%) | 0 (0.0%) |
| Mobile Home / Other | 0 (0.0%) | 0 (0.0%) |
| Total | 445 (91.9%) | 39 (8.1%) |
Housing Structures by Number of Rooms in Grizzly Flats
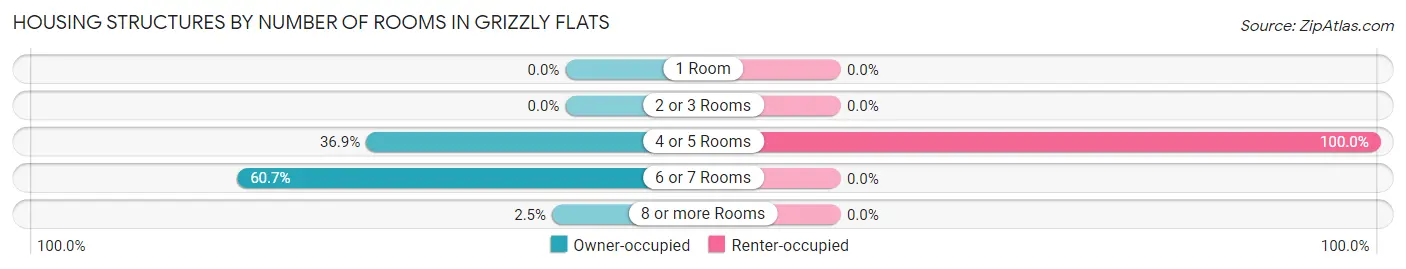
| Number of Rooms | Owner-occupied | Renter-occupied |
| 1 Room | 0 (0.0%) | 0 (0.0%) |
| 2 or 3 Rooms | 0 (0.0%) | 0 (0.0%) |
| 4 or 5 Rooms | 164 (36.8%) | 39 (100.0%) |
| 6 or 7 Rooms | 270 (60.7%) | 0 (0.0%) |
| 8 or more Rooms | 11 (2.5%) | 0 (0.0%) |
| Total | 445 (100.0%) | 39 (100.0%) |
Housing Structure by Heating Type in Grizzly Flats
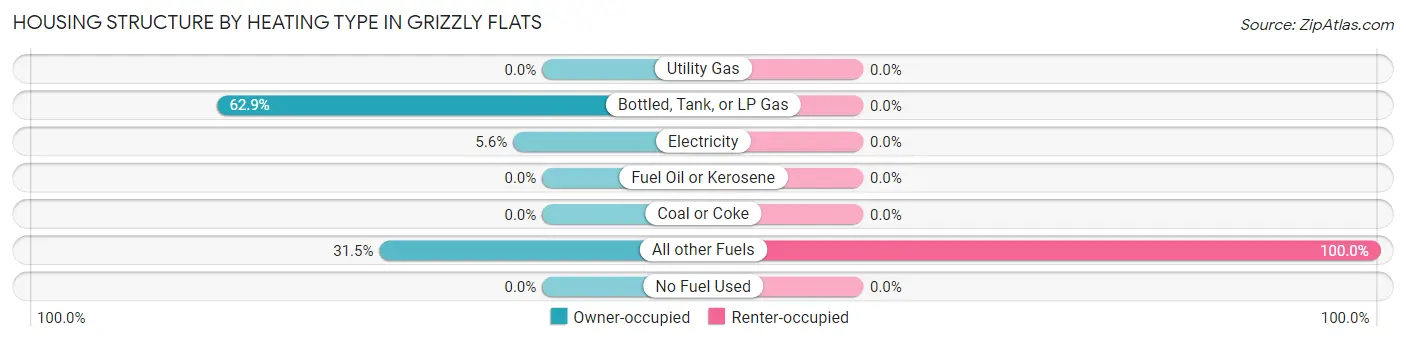
| Heating Type | Owner-occupied | Renter-occupied |
| Utility Gas | 0 (0.0%) | 0 (0.0%) |
| Bottled, Tank, or LP Gas | 280 (62.9%) | 0 (0.0%) |
| Electricity | 25 (5.6%) | 0 (0.0%) |
| Fuel Oil or Kerosene | 0 (0.0%) | 0 (0.0%) |
| Coal or Coke | 0 (0.0%) | 0 (0.0%) |
| All other Fuels | 140 (31.5%) | 39 (100.0%) |
| No Fuel Used | 0 (0.0%) | 0 (0.0%) |
| Total | 445 (100.0%) | 39 (100.0%) |
Household Vehicle Usage in Grizzly Flats
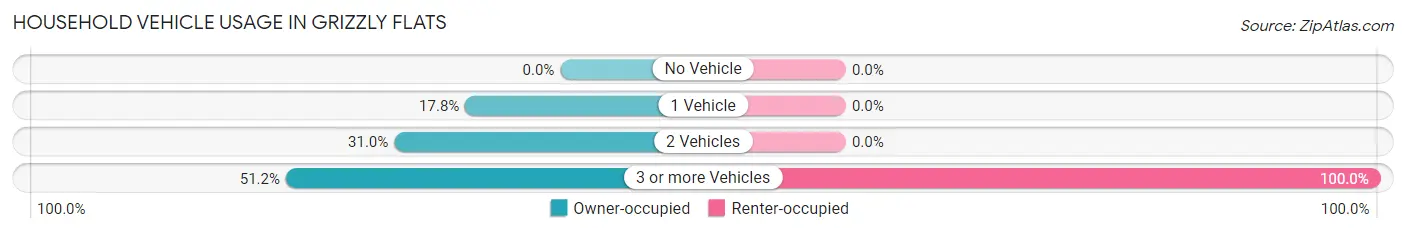
| Vehicles per Household | Owner-occupied | Renter-occupied |
| No Vehicle | 0 (0.0%) | 0 (0.0%) |
| 1 Vehicle | 79 (17.7%) | 0 (0.0%) |
| 2 Vehicles | 138 (31.0%) | 0 (0.0%) |
| 3 or more Vehicles | 228 (51.2%) | 39 (100.0%) |
| Total | 445 (100.0%) | 39 (100.0%) |
Real Estate & Mortgages in Grizzly Flats
Real Estate and Mortgage Overview in Grizzly Flats
| Characteristic | Without Mortgage | With Mortgage |
| Housing Units | 37 | 408 |
| Median Property Value | - | - |
| Median Household Income | - | - |
| Monthly Housing Costs | - | - |
| Real Estate Taxes | - | - |
Property Value by Mortgage Status in Grizzly Flats
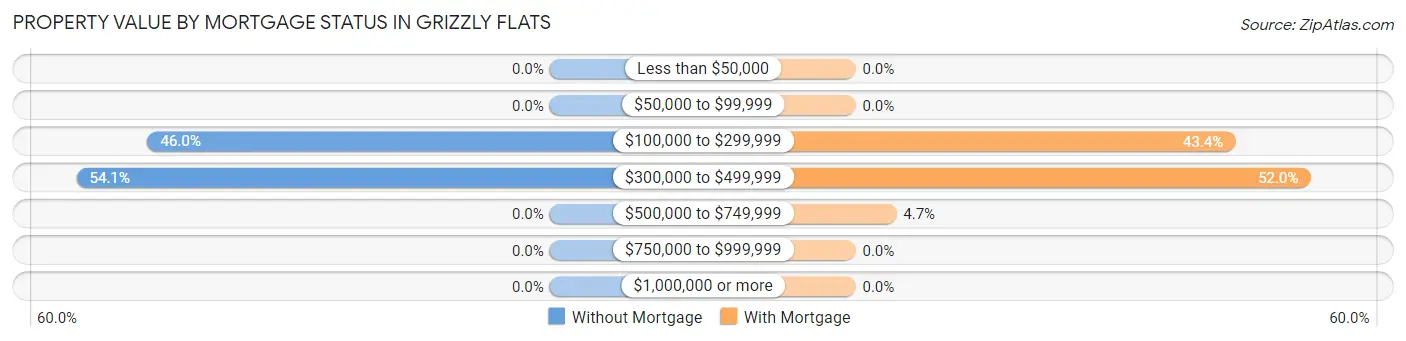
| Property Value | Without Mortgage | With Mortgage |
| Less than $50,000 | 0 (0.0%) | 0 (0.0%) |
| $50,000 to $99,999 | 0 (0.0%) | 0 (0.0%) |
| $100,000 to $299,999 | 17 (46.0%) | 177 (43.4%) |
| $300,000 to $499,999 | 20 (54.0%) | 212 (52.0%) |
| $500,000 to $749,999 | 0 (0.0%) | 19 (4.7%) |
| $750,000 to $999,999 | 0 (0.0%) | 0 (0.0%) |
| $1,000,000 or more | 0 (0.0%) | 0 (0.0%) |
| Total | 37 (100.0%) | 408 (100.0%) |
Household Income by Mortgage Status in Grizzly Flats
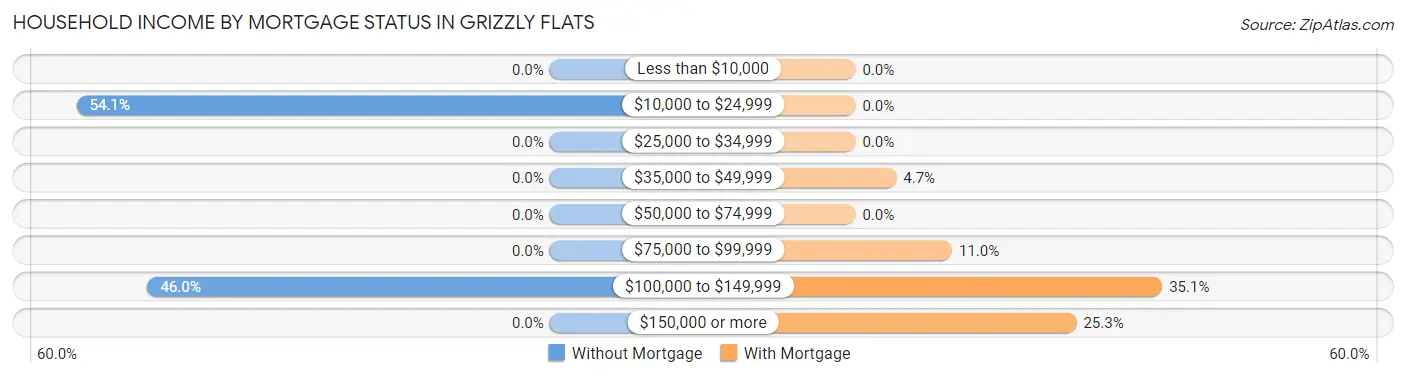
| Household Income | Without Mortgage | With Mortgage |
| Less than $10,000 | 0 (0.0%) | 0 (0.0%) |
| $10,000 to $24,999 | 20 (54.0%) | 0 (0.0%) |
| $25,000 to $34,999 | 0 (0.0%) | 0 (0.0%) |
| $35,000 to $49,999 | 0 (0.0%) | 19 (4.7%) |
| $50,000 to $74,999 | 0 (0.0%) | 0 (0.0%) |
| $75,000 to $99,999 | 0 (0.0%) | 45 (11.0%) |
| $100,000 to $149,999 | 17 (46.0%) | 143 (35.0%) |
| $150,000 or more | 0 (0.0%) | 103 (25.3%) |
| Total | 37 (100.0%) | 408 (100.0%) |
Property Value to Household Income Ratio in Grizzly Flats
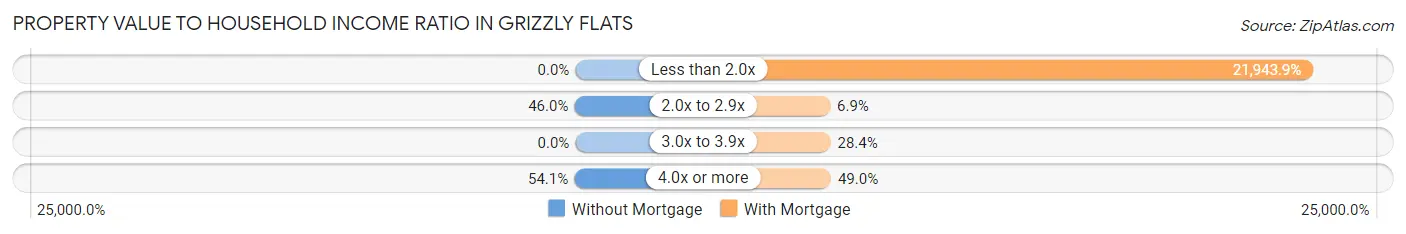
| Value-to-Income Ratio | Without Mortgage | With Mortgage |
| Less than 2.0x | 0 (0.0%) | 89,531 (21,943.9%) |
| 2.0x to 2.9x | 17 (46.0%) | 28 (6.9%) |
| 3.0x to 3.9x | 0 (0.0%) | 116 (28.4%) |
| 4.0x or more | 20 (54.0%) | 200 (49.0%) |
| Total | 37 (100.0%) | 408 (100.0%) |
Real Estate Taxes by Mortgage Status in Grizzly Flats
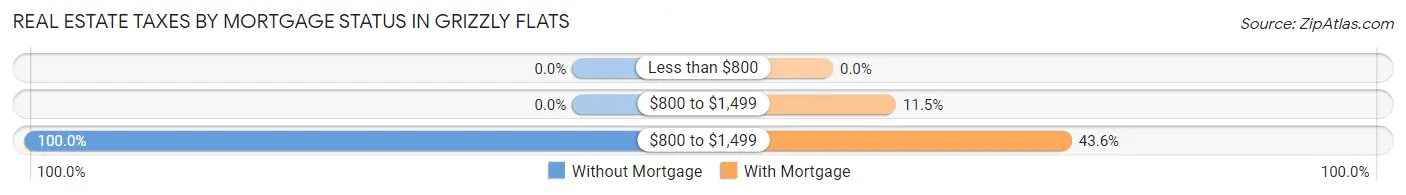
| Property Taxes | Without Mortgage | With Mortgage |
| Less than $800 | 0 (0.0%) | 0 (0.0%) |
| $800 to $1,499 | 0 (0.0%) | 47 (11.5%) |
| $800 to $1,499 | 37 (100.0%) | 178 (43.6%) |
| Total | 37 (100.0%) | 408 (100.0%) |
Health & Disability in Grizzly Flats
Health Insurance Coverage by Age in Grizzly Flats
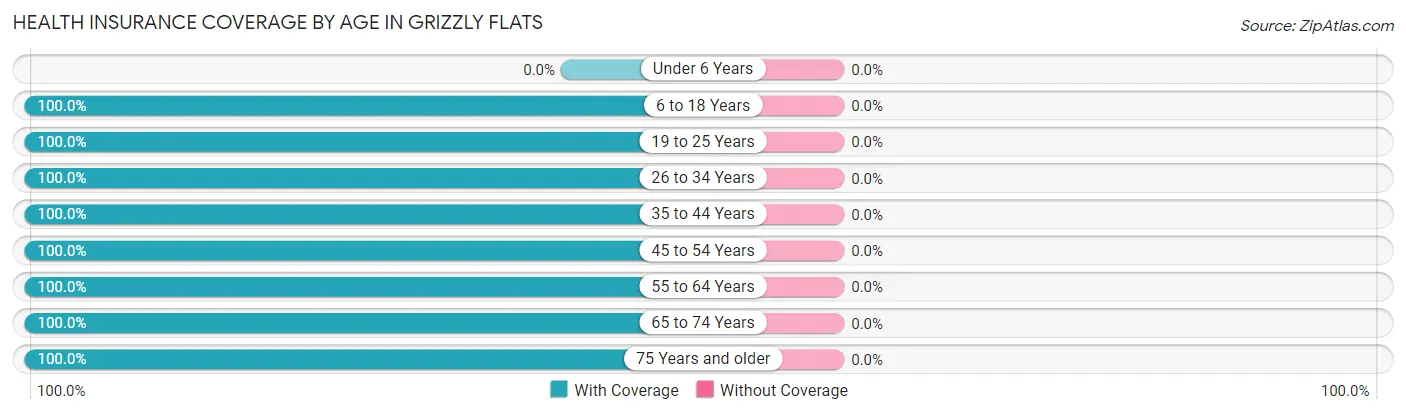
| Age Bracket | With Coverage | Without Coverage |
| Under 6 Years | 0 (0.0%) | 0 (0.0%) |
| 6 to 18 Years | 392 (100.0%) | 0 (0.0%) |
| 19 to 25 Years | 25 (100.0%) | 0 (0.0%) |
| 26 to 34 Years | 156 (100.0%) | 0 (0.0%) |
| 35 to 44 Years | 204 (100.0%) | 0 (0.0%) |
| 45 to 54 Years | 84 (100.0%) | 0 (0.0%) |
| 55 to 64 Years | 266 (100.0%) | 0 (0.0%) |
| 65 to 74 Years | 176 (100.0%) | 0 (0.0%) |
| 75 Years and older | 71 (100.0%) | 0 (0.0%) |
| Total | 1,374 (100.0%) | 0 (0.0%) |
Health Insurance Coverage by Citizenship Status in Grizzly Flats
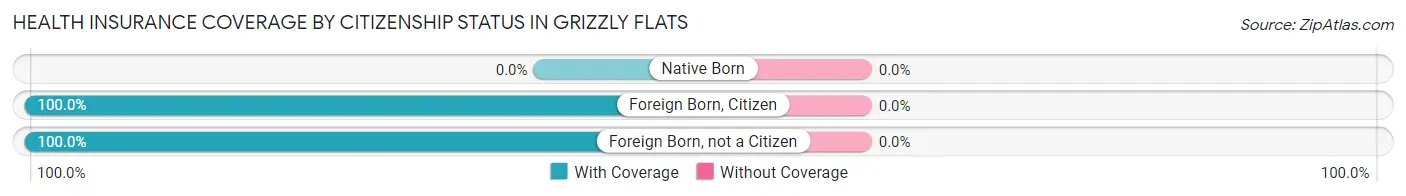
| Citizenship Status | With Coverage | Without Coverage |
| Native Born | 0 (0.0%) | 0 (0.0%) |
| Foreign Born, Citizen | 392 (100.0%) | 0 (0.0%) |
| Foreign Born, not a Citizen | 25 (100.0%) | 0 (0.0%) |
Health Insurance Coverage by Household Income in Grizzly Flats
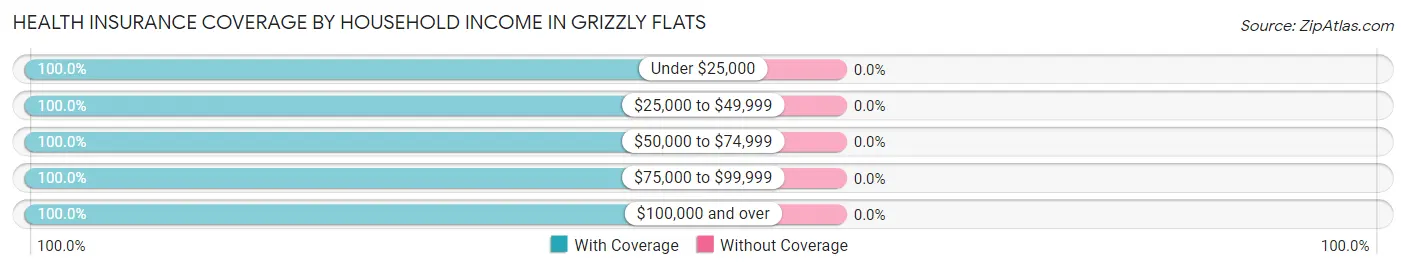
| Household Income | With Coverage | Without Coverage |
| Under $25,000 | 39 (100.0%) | 0 (0.0%) |
| $25,000 to $49,999 | 189 (100.0%) | 0 (0.0%) |
| $50,000 to $74,999 | 72 (100.0%) | 0 (0.0%) |
| $75,000 to $99,999 | 446 (100.0%) | 0 (0.0%) |
| $100,000 and over | 628 (100.0%) | 0 (0.0%) |
Public vs Private Health Insurance Coverage by Age in Grizzly Flats
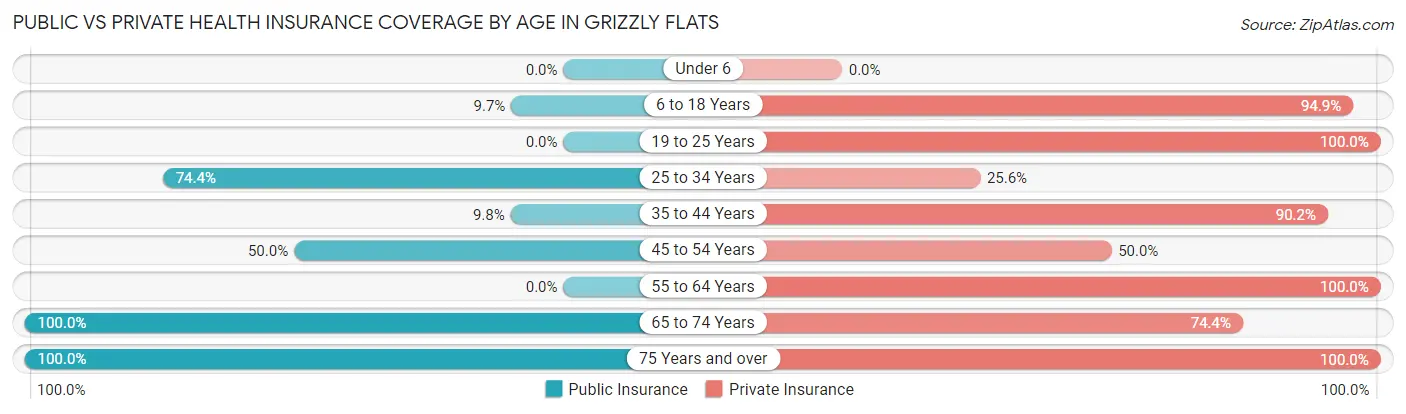
| Age Bracket | Public Insurance | Private Insurance |
| Under 6 | 0 (0.0%) | 0 (0.0%) |
| 6 to 18 Years | 38 (9.7%) | 372 (94.9%) |
| 19 to 25 Years | 0 (0.0%) | 25 (100.0%) |
| 25 to 34 Years | 116 (74.4%) | 40 (25.6%) |
| 35 to 44 Years | 20 (9.8%) | 184 (90.2%) |
| 45 to 54 Years | 42 (50.0%) | 42 (50.0%) |
| 55 to 64 Years | 0 (0.0%) | 266 (100.0%) |
| 65 to 74 Years | 176 (100.0%) | 131 (74.4%) |
| 75 Years and over | 71 (100.0%) | 71 (100.0%) |
| Total | 463 (33.7%) | 1,131 (82.3%) |
Disability Status by Sex by Age in Grizzly Flats
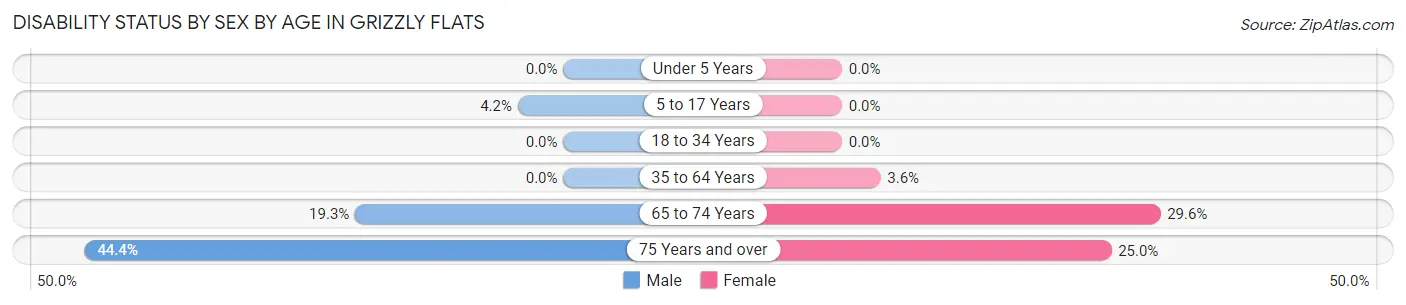
| Age Bracket | Male | Female |
| Under 5 Years | 0 (0.0%) | 0 (0.0%) |
| 5 to 17 Years | 9 (4.2%) | 0 (0.0%) |
| 18 to 34 Years | 0 (0.0%) | 0 (0.0%) |
| 35 to 64 Years | 0 (0.0%) | 11 (3.6%) |
| 65 to 74 Years | 17 (19.3%) | 26 (29.5%) |
| 75 Years and over | 12 (44.4%) | 11 (25.0%) |
Disability Class by Sex by Age in Grizzly Flats
Disability Class: Hearing Difficulty
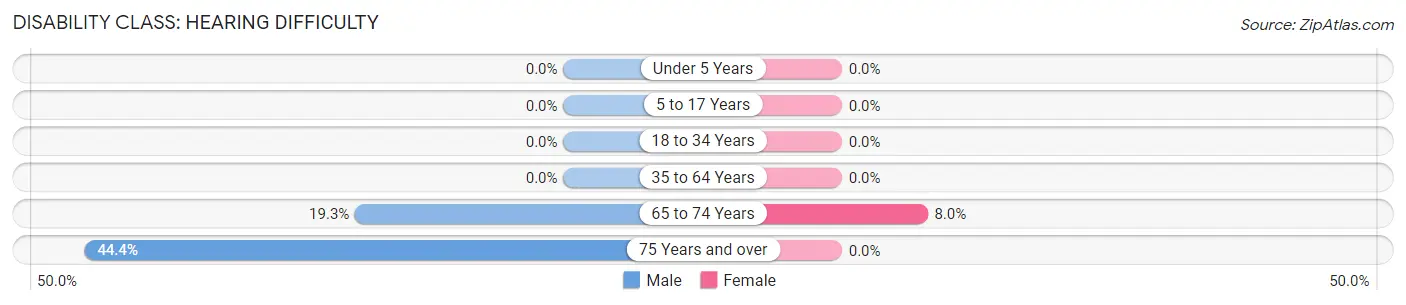
| Age Bracket | Male | Female |
| Under 5 Years | 0 (0.0%) | 0 (0.0%) |
| 5 to 17 Years | 0 (0.0%) | 0 (0.0%) |
| 18 to 34 Years | 0 (0.0%) | 0 (0.0%) |
| 35 to 64 Years | 0 (0.0%) | 0 (0.0%) |
| 65 to 74 Years | 17 (19.3%) | 7 (8.0%) |
| 75 Years and over | 12 (44.4%) | 0 (0.0%) |
Disability Class: Vision Difficulty
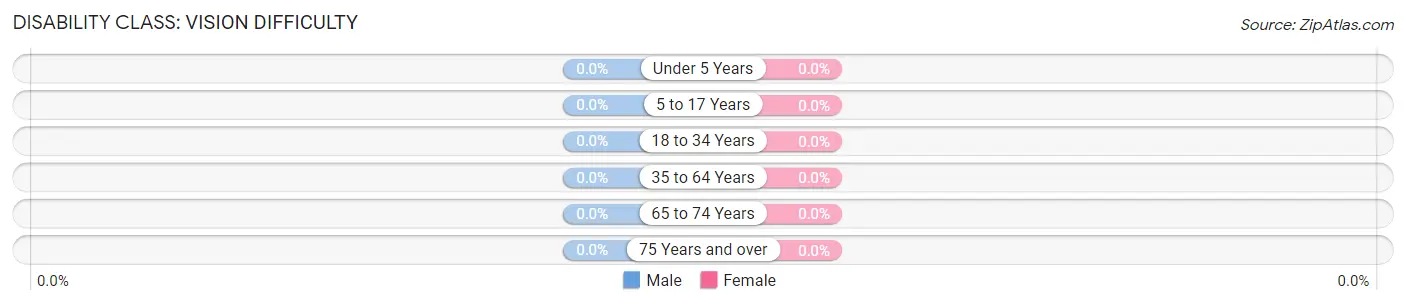
| Age Bracket | Male | Female |
| Under 5 Years | 0 (0.0%) | 0 (0.0%) |
| 5 to 17 Years | 0 (0.0%) | 0 (0.0%) |
| 18 to 34 Years | 0 (0.0%) | 0 (0.0%) |
| 35 to 64 Years | 0 (0.0%) | 0 (0.0%) |
| 65 to 74 Years | 0 (0.0%) | 0 (0.0%) |
| 75 Years and over | 0 (0.0%) | 0 (0.0%) |
Disability Class: Cognitive Difficulty
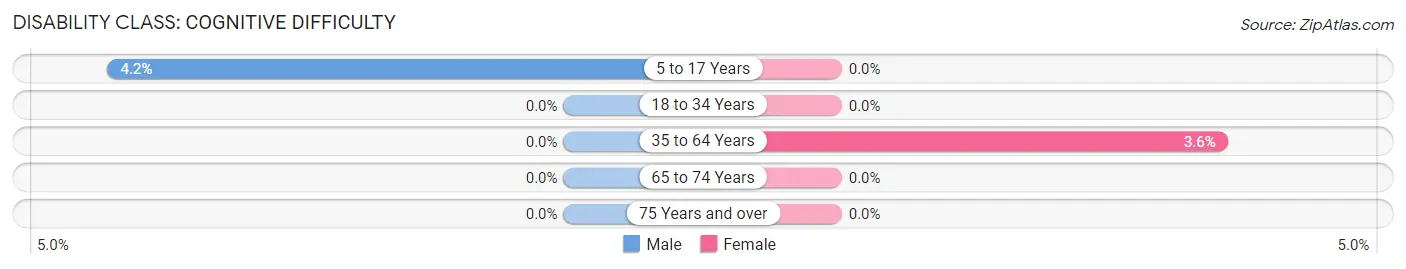
| Age Bracket | Male | Female |
| 5 to 17 Years | 9 (4.2%) | 0 (0.0%) |
| 18 to 34 Years | 0 (0.0%) | 0 (0.0%) |
| 35 to 64 Years | 0 (0.0%) | 11 (3.6%) |
| 65 to 74 Years | 0 (0.0%) | 0 (0.0%) |
| 75 Years and over | 0 (0.0%) | 0 (0.0%) |
Disability Class: Ambulatory Difficulty
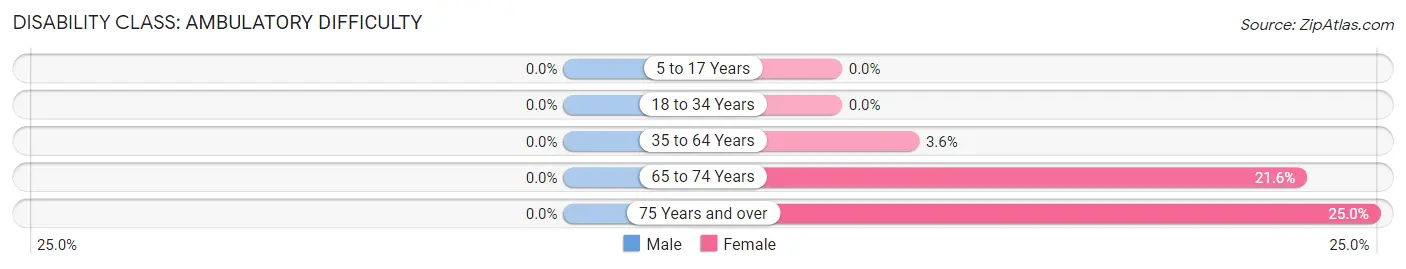
| Age Bracket | Male | Female |
| 5 to 17 Years | 0 (0.0%) | 0 (0.0%) |
| 18 to 34 Years | 0 (0.0%) | 0 (0.0%) |
| 35 to 64 Years | 0 (0.0%) | 11 (3.6%) |
| 65 to 74 Years | 0 (0.0%) | 19 (21.6%) |
| 75 Years and over | 0 (0.0%) | 11 (25.0%) |
Disability Class: Self-Care Difficulty
| Age Bracket | Male | Female |
| 5 to 17 Years | 0 (0.0%) | 0 (0.0%) |
| 18 to 34 Years | 0 (0.0%) | 0 (0.0%) |
| 35 to 64 Years | 0 (0.0%) | 0 (0.0%) |
| 65 to 74 Years | 0 (0.0%) | 0 (0.0%) |
| 75 Years and over | 0 (0.0%) | 0 (0.0%) |
Technology Access in Grizzly Flats
Computing Device Access in Grizzly Flats
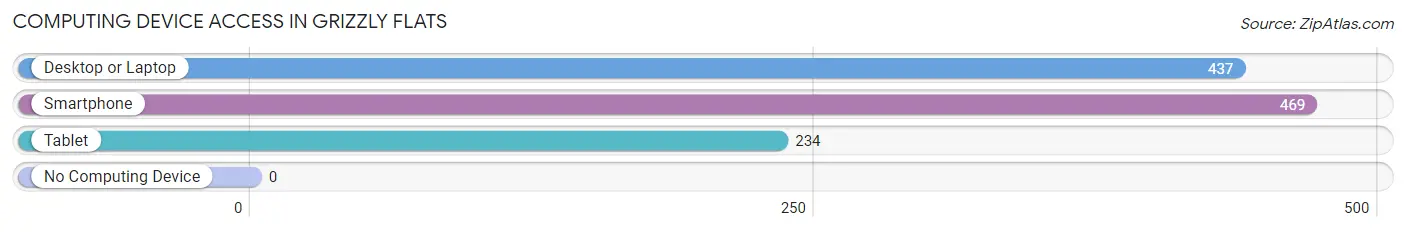
| Device Type | # Households | % Households |
| Desktop or Laptop | 437 | 90.3% |
| Smartphone | 469 | 96.9% |
| Tablet | 234 | 48.3% |
| No Computing Device | 0 | 0.0% |
| Total | 484 | 100.0% |
Internet Access in Grizzly Flats
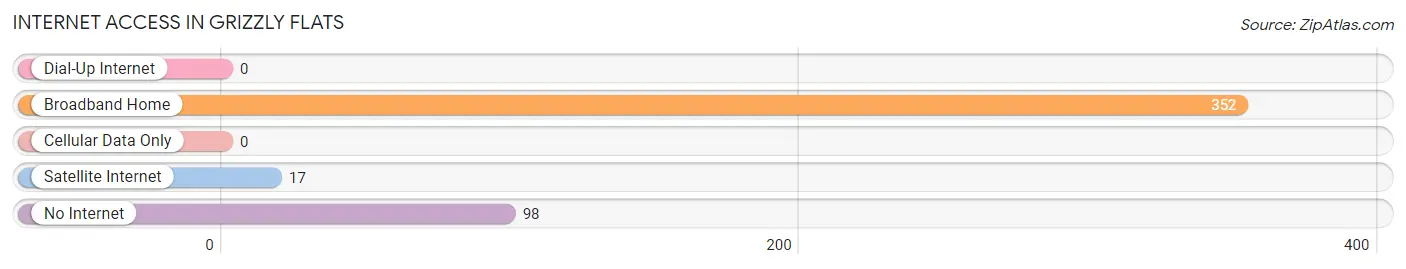
| Internet Type | # Households | % Households |
| Dial-Up Internet | 0 | 0.0% |
| Broadband Home | 352 | 72.7% |
| Cellular Data Only | 0 | 0.0% |
| Satellite Internet | 17 | 3.5% |
| No Internet | 98 | 20.3% |
| Total | 484 | 100.0% |
Grizzly Flats Summary
Grizzly Flats is a small unincorporated community located in El Dorado County, California. It is situated in the Sierra Nevada foothills, approximately 25 miles east of Placerville and 40 miles northeast of Sacramento. The community is located in a rural area, surrounded by rolling hills and oak woodlands. The population of Grizzly Flats was estimated to be 1,092 in 2000.
History
Grizzly Flats was first settled in the 1850s by miners and ranchers. The town was named after the grizzly bear, which was once abundant in the area. The first post office was established in 1858. In the late 1800s, Grizzly Flats was a popular stop for stagecoaches traveling between Placerville and Sacramento.
In the early 1900s, the town was home to a number of businesses, including a general store, a blacksmith shop, a hotel, and a saloon. The town also had a school, which was built in 1891.
Geography
Grizzly Flats is located in the Sierra Nevada foothills, at an elevation of 2,400 feet. The town is situated in a rural area, surrounded by rolling hills and oak woodlands. The area is known for its mild climate and scenic beauty.
The town is located approximately 25 miles east of Placerville and 40 miles northeast of Sacramento. It is accessible via State Route 49 and State Route 88.
Economy
Grizzly Flats is a small, rural community with a limited economy. The town is home to a few small businesses, including a general store, a gas station, and a restaurant. The town also has a post office and a volunteer fire department.
The town is also home to a number of small farms and ranches. The area is known for its production of apples, pears, and other fruits and vegetables.
Demographics
Grizzly Flats had an estimated population of 1,092 in 2000. The population is predominantly white (94.2%), with a small minority population (5.8%). The median household income is $45,000, and the median age is 44.
Conclusion
Grizzly Flats is a small, rural community located in El Dorado County, California. It is situated in the Sierra Nevada foothills, approximately 25 miles east of Placerville and 40 miles northeast of Sacramento. The population of Grizzly Flats was estimated to be 1,092 in 2000. The town is home to a few small businesses, and is known for its production of apples, pears, and other fruits and vegetables. The population is predominantly white, with a small minority population. The median household income is $45,000, and the median age is 44.
Common Questions
What is Per Capita Income in Grizzly Flats?
Per Capita income in Grizzly Flats is $35,287.
What is the Median Family Income in Grizzly Flats?
Median Family Income in Grizzly Flats is $84,390.
What is the Median Household income in Grizzly Flats?
Median Household Income in Grizzly Flats is $84,843.
What is Inequality or Gini Index in Grizzly Flats?
Inequality or Gini Index in Grizzly Flats is 0.28.
What is the Total Population of Grizzly Flats?
Total Population of Grizzly Flats is 1,374.
What is the Total Male Population of Grizzly Flats?
Total Male Population of Grizzly Flats is 620.
What is the Total Female Population of Grizzly Flats?
Total Female Population of Grizzly Flats is 754.
What is the Ratio of Males per 100 Females in Grizzly Flats?
There are 82.23 Males per 100 Females in Grizzly Flats.
What is the Ratio of Females per 100 Males in Grizzly Flats?
There are 121.61 Females per 100 Males in Grizzly Flats.
What is the Median Population Age in Grizzly Flats?
Median Population Age in Grizzly Flats is 44.3 Years.
What is the Average Family Size in Grizzly Flats
Average Family Size in Grizzly Flats is 3.4 People.
What is the Average Household Size in Grizzly Flats
Average Household Size in Grizzly Flats is 2.8 People.
How Large is the Labor Force in Grizzly Flats?
There are 599 People in the Labor Forcein in Grizzly Flats.
What is the Percentage of People in the Labor Force in Grizzly Flats?
57.6% of People are in the Labor Force in Grizzly Flats.