Grimes, CA Map & Demographics
Grimes Map
Grimes Overview
$24,779
PER CAPITA INCOME
$75,439
AVG FAMILY INCOME
22.2%
WAGE / INCOME GAP [ % ]
77.8¢/ $1
WAGE / INCOME GAP [ $ ]
0.39
INEQUALITY / GINI INDEX
355
TOTAL POPULATION
176
MALE POPULATION
179
FEMALE POPULATION
98.32
MALES / 100 FEMALES
101.70
FEMALES / 100 MALES
53.6
MEDIAN AGE
3.8
AVG FAMILY SIZE
3.3
AVG HOUSEHOLD SIZE
183
LABOR FORCE [ PEOPLE ]
68.5%
PERCENT IN LABOR FORCE
14.2%
UNEMPLOYMENT RATE
Grimes Zip Codes
Grimes Area Codes
Income in Grimes
Income Overview in Grimes
| Characteristic | Number | Measure |
| Per Capita Income | 355 | $24,779 |
| Median Family Income | 81 | $75,439 |
| Mean Family Income | 81 | $80,685 |
| Median Household Income | 109 | $0 |
| Mean Household Income | 109 | $70,541 |
| Income Deficit | 81 | $0 |
| Wage / Income Gap (%) | 355 | 22.20% |
| Wage / Income Gap ($) | 355 | 77.80¢ per $1 |
| Gini / Inequality Index | 355 | 0.39 |
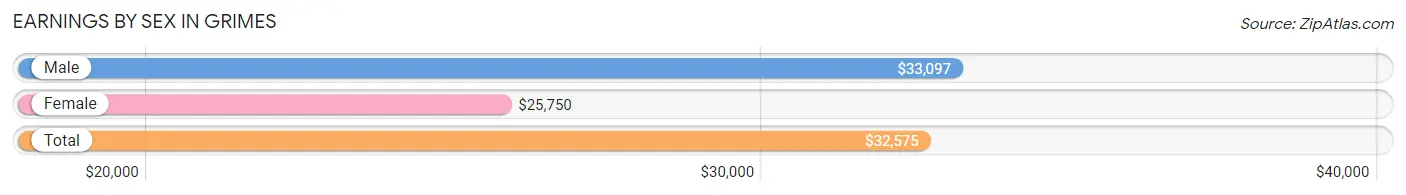
Earnings by Sex in Grimes
Average Earnings in Grimes are $32,575, $33,097 for men and $25,750 for women, a difference of 22.2%.
| Sex | Number | Average Earnings |
| Male | 102 (50.0%) | $33,097 |
| Female | 102 (50.0%) | $25,750 |
| Total | 204 (100.0%) | $32,575 |
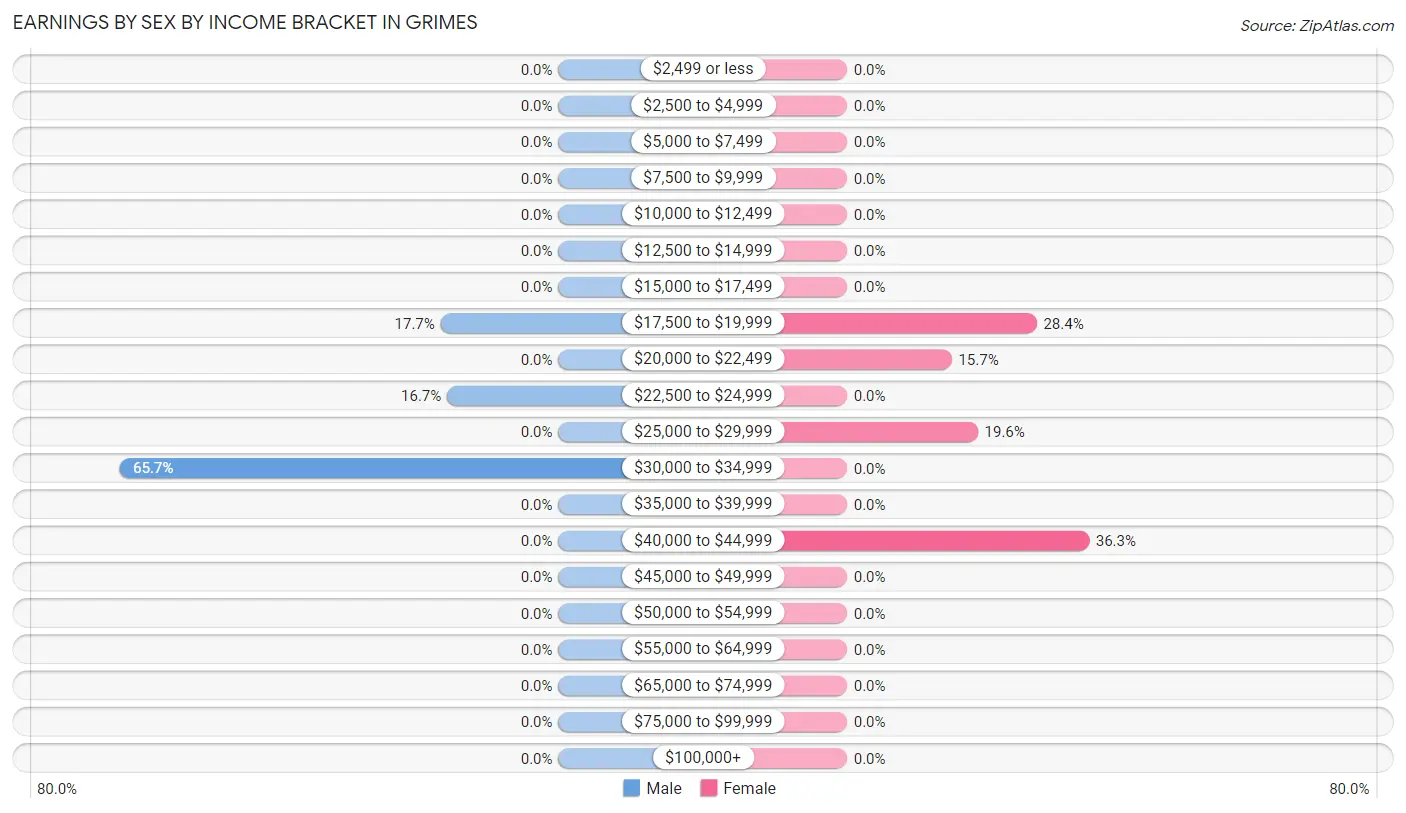
Earnings by Sex by Income Bracket in Grimes
The most common earnings brackets in Grimes are $30,000 to $34,999 for men (67 | 65.7%) and $40,000 to $44,999 for women (37 | 36.3%).
| Income | Male | Female |
| $2,499 or less | 0 (0.0%) | 0 (0.0%) |
| $2,500 to $4,999 | 0 (0.0%) | 0 (0.0%) |
| $5,000 to $7,499 | 0 (0.0%) | 0 (0.0%) |
| $7,500 to $9,999 | 0 (0.0%) | 0 (0.0%) |
| $10,000 to $12,499 | 0 (0.0%) | 0 (0.0%) |
| $12,500 to $14,999 | 0 (0.0%) | 0 (0.0%) |
| $15,000 to $17,499 | 0 (0.0%) | 0 (0.0%) |
| $17,500 to $19,999 | 18 (17.6%) | 29 (28.4%) |
| $20,000 to $22,499 | 0 (0.0%) | 16 (15.7%) |
| $22,500 to $24,999 | 17 (16.7%) | 0 (0.0%) |
| $25,000 to $29,999 | 0 (0.0%) | 20 (19.6%) |
| $30,000 to $34,999 | 67 (65.7%) | 0 (0.0%) |
| $35,000 to $39,999 | 0 (0.0%) | 0 (0.0%) |
| $40,000 to $44,999 | 0 (0.0%) | 37 (36.3%) |
| $45,000 to $49,999 | 0 (0.0%) | 0 (0.0%) |
| $50,000 to $54,999 | 0 (0.0%) | 0 (0.0%) |
| $55,000 to $64,999 | 0 (0.0%) | 0 (0.0%) |
| $65,000 to $74,999 | 0 (0.0%) | 0 (0.0%) |
| $75,000 to $99,999 | 0 (0.0%) | 0 (0.0%) |
| $100,000+ | 0 (0.0%) | 0 (0.0%) |
| Total | 102 (100.0%) | 102 (100.0%) |
Earnings by Sex by Educational Attainment in Grimes
| Educational Attainment | Male Income | Female Income |
| Less than High School | - | - |
| High School Diploma | - | - |
| College or Associate's Degree | - | - |
| Bachelor's Degree | - | - |
| Graduate Degree | - | - |
| Total | $33,097 | $25,750 |
Family Income in Grimes
Family Income Brackets in Grimes
According to the Grimes family income data, there are 37 families falling into the $75,000 to $99,999 income range, which is the most common income bracket and makes up 45.7% of all families.
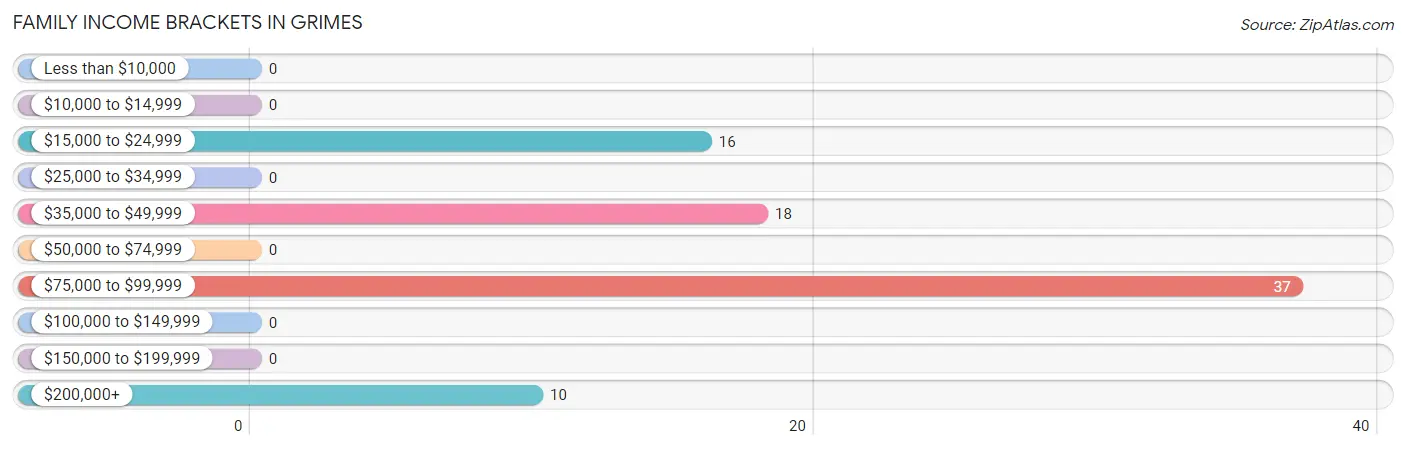
| Income Bracket | # Families | % Families |
| Less than $10,000 | 0 | 0.0% |
| $10,000 to $14,999 | 0 | 0.0% |
| $15,000 to $24,999 | 16 | 19.8% |
| $25,000 to $34,999 | 0 | 0.0% |
| $35,000 to $49,999 | 18 | 22.2% |
| $50,000 to $74,999 | 0 | 0.0% |
| $75,000 to $99,999 | 37 | 45.7% |
| $100,000 to $149,999 | 0 | 0.0% |
| $150,000 to $199,999 | 0 | 0.0% |
| $200,000+ | 10 | 12.3% |
Family Income by Famaliy Size in Grimes
| Income Bracket | # Families | Median Income |
| 2-Person Families | 0 (0.0%) | $0 |
| 3-Person Families | 63 (77.8%) | $0 |
| 4-Person Families | 0 (0.0%) | $0 |
| 5-Person Families | 0 (0.0%) | $0 |
| 6-Person Families | 18 (22.2%) | $0 |
| 7+ Person Families | 0 (0.0%) | $0 |
| Total | 81 (100.0%) | $75,439 |
Family Income by Number of Earners in Grimes
| Number of Earners | # Families | Median Income |
| No Earners | 10 (12.3%) | $0 |
| 1 Earner | 16 (19.8%) | $0 |
| 2 Earners | 55 (67.9%) | $0 |
| 3+ Earners | 0 (0.0%) | $0 |
| Total | 81 (100.0%) | $75,439 |
Household Income in Grimes
Household Income Brackets in Grimes
With 37 households falling in the category, the $75,000 to $99,999 income range is the most frequent in Grimes, accounting for 33.9% of all households.
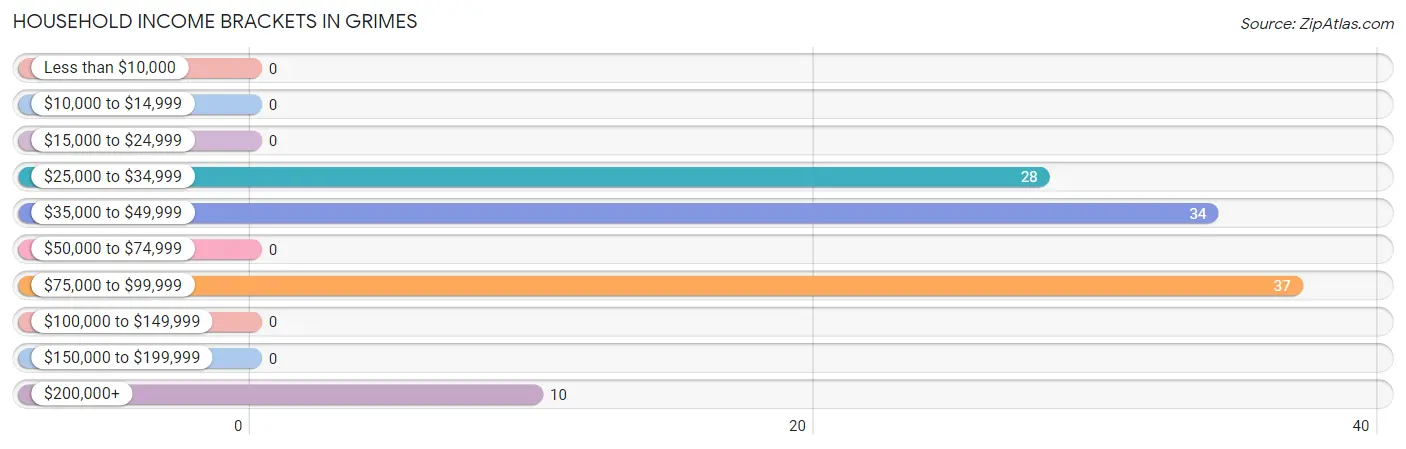
| Income Bracket | # Households | % Households |
| Less than $10,000 | 0 | 0.0% |
| $10,000 to $14,999 | 0 | 0.0% |
| $15,000 to $24,999 | 0 | 0.0% |
| $25,000 to $34,999 | 28 | 25.7% |
| $35,000 to $49,999 | 34 | 31.2% |
| $50,000 to $74,999 | 0 | 0.0% |
| $75,000 to $99,999 | 37 | 33.9% |
| $100,000 to $149,999 | 0 | 0.0% |
| $150,000 to $199,999 | 0 | 0.0% |
| $200,000+ | 10 | 9.2% |
Household Income by Householder Age in Grimes
| Income Bracket | # Households | Median Income |
| 15 to 24 Years | 0 (0.0%) | $0 |
| 25 to 44 Years | 18 (16.5%) | $0 |
| 45 to 64 Years | 53 (48.6%) | $0 |
| 65+ Years | 38 (34.9%) | $0 |
| Total | 109 (100.0%) | $0 |
Poverty in Grimes
Income Below Poverty by Sex and Age in Grimes
With 46.6% poverty level for males and 44.7% for females among the residents of Grimes, under 5 year old males and 6 to 11 year old females are the most vulnerable to poverty, with 15 males (100.0%) and 35 females (100.0%) in their respective age groups living below the poverty level.
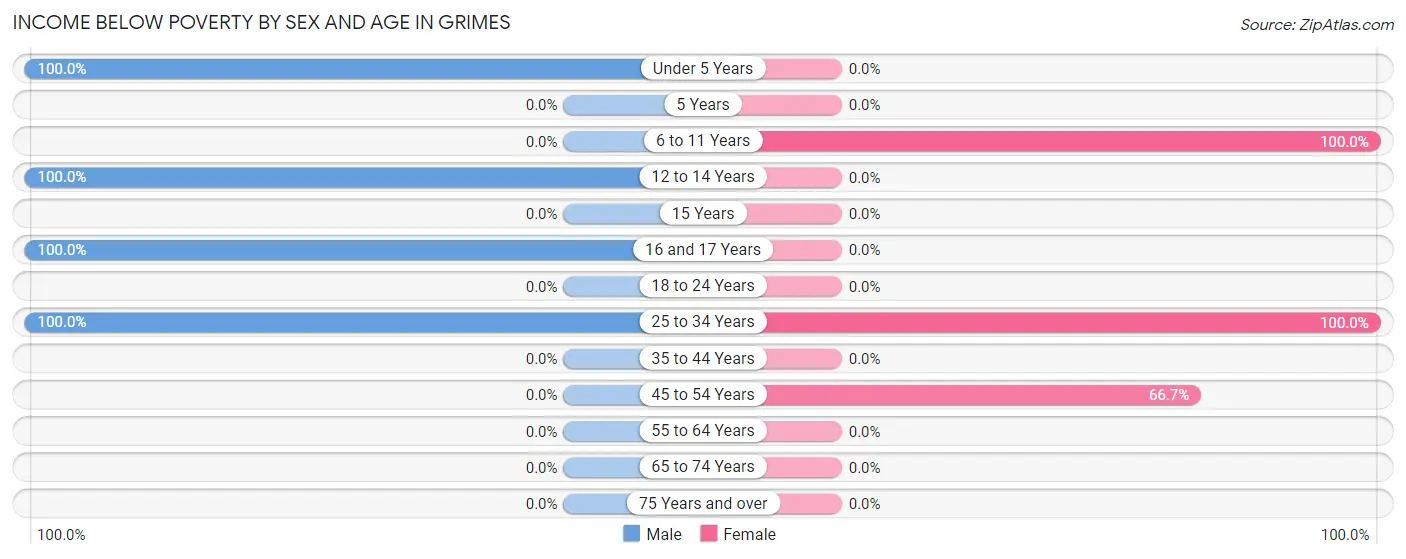
| Age Bracket | Male | Female |
| Under 5 Years | 15 (100.0%) | 0 (0.0%) |
| 5 Years | 0 (0.0%) | 0 (0.0%) |
| 6 to 11 Years | 0 (0.0%) | 35 (100.0%) |
| 12 to 14 Years | 38 (100.0%) | 0 (0.0%) |
| 15 Years | 0 (0.0%) | 0 (0.0%) |
| 16 and 17 Years | 11 (100.0%) | 0 (0.0%) |
| 18 to 24 Years | 0 (0.0%) | 0 (0.0%) |
| 25 to 34 Years | 18 (100.0%) | 29 (100.0%) |
| 35 to 44 Years | 0 (0.0%) | 0 (0.0%) |
| 45 to 54 Years | 0 (0.0%) | 16 (66.7%) |
| 55 to 64 Years | 0 (0.0%) | 0 (0.0%) |
| 65 to 74 Years | 0 (0.0%) | 0 (0.0%) |
| 75 Years and over | 0 (0.0%) | 0 (0.0%) |
| Total | 82 (46.6%) | 80 (44.7%) |
Income Above Poverty by Sex and Age in Grimes
According to the poverty statistics in Grimes, males aged 45 to 54 years and females aged 55 to 64 years are the age groups that are most secure financially, with 100.0% of males and 100.0% of females in these age groups living above the poverty line.
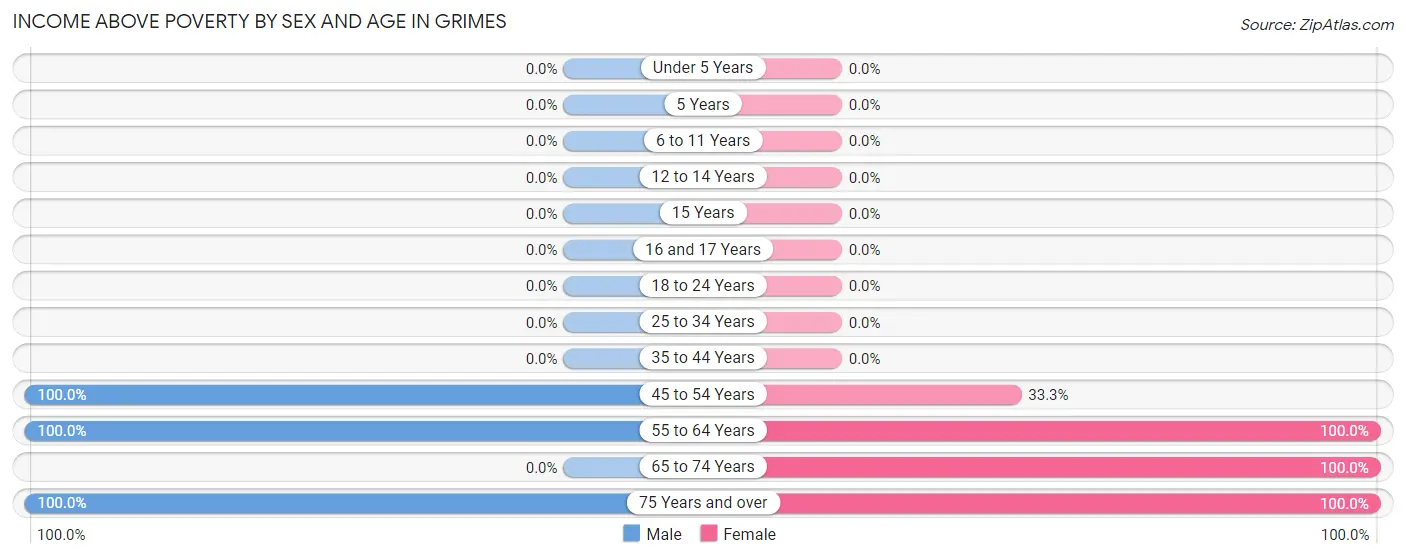
| Age Bracket | Male | Female |
| Under 5 Years | 0 (0.0%) | 0 (0.0%) |
| 5 Years | 0 (0.0%) | 0 (0.0%) |
| 6 to 11 Years | 0 (0.0%) | 0 (0.0%) |
| 12 to 14 Years | 0 (0.0%) | 0 (0.0%) |
| 15 Years | 0 (0.0%) | 0 (0.0%) |
| 16 and 17 Years | 0 (0.0%) | 0 (0.0%) |
| 18 to 24 Years | 0 (0.0%) | 0 (0.0%) |
| 25 to 34 Years | 0 (0.0%) | 0 (0.0%) |
| 35 to 44 Years | 0 (0.0%) | 0 (0.0%) |
| 45 to 54 Years | 17 (100.0%) | 8 (33.3%) |
| 55 to 64 Years | 67 (100.0%) | 37 (100.0%) |
| 65 to 74 Years | 0 (0.0%) | 37 (100.0%) |
| 75 Years and over | 10 (100.0%) | 17 (100.0%) |
| Total | 94 (53.4%) | 99 (55.3%) |
Income Below Poverty Among Married-Couple Families in Grimes
The poverty statistics for married-couple families in Grimes show that 27.7% or 18 of the total 65 families live below the poverty line. Families with 3 or 4 children have the highest poverty rate of 100.0%, comprising of 18 families. On the other hand, families with no children have the lowest poverty rate of 0.0%, which includes 0 families.
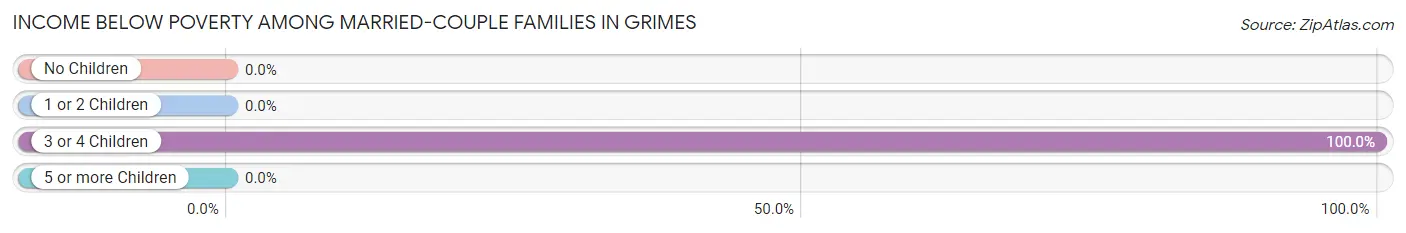
| Children | Above Poverty | Below Poverty |
| No Children | 47 (100.0%) | 0 (0.0%) |
| 1 or 2 Children | 0 (0.0%) | 0 (0.0%) |
| 3 or 4 Children | 0 (0.0%) | 18 (100.0%) |
| 5 or more Children | 0 (0.0%) | 0 (0.0%) |
| Total | 47 (72.3%) | 18 (27.7%) |
Income Below Poverty Among Single-Parent Households in Grimes
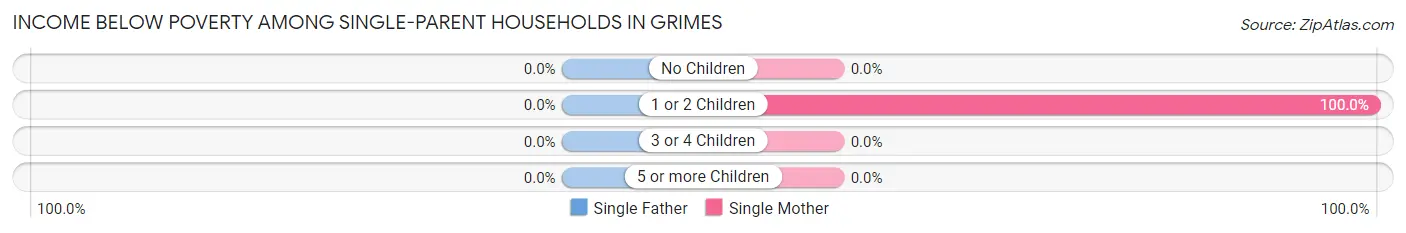
| Children | Single Father | Single Mother |
| No Children | 0 (0.0%) | 0 (0.0%) |
| 1 or 2 Children | 0 (0.0%) | 16 (100.0%) |
| 3 or 4 Children | 0 (0.0%) | 0 (0.0%) |
| 5 or more Children | 0 (0.0%) | 0 (0.0%) |
| Total | 0 (0.0%) | 16 (100.0%) |
Income Below Poverty Among Married-Couple vs Single-Parent Households in Grimes
The poverty data for Grimes shows that 18 of the married-couple family households (27.7%) and 16 of the single-parent households (100.0%) are living below the poverty level. Within the married-couple family households, those with 3 or 4 children have the highest poverty rate, with 18 households (100.0%) falling below the poverty line. Among the single-parent households, those with 1 or 2 children have the highest poverty rate, with 16 household (100.0%) living below poverty.
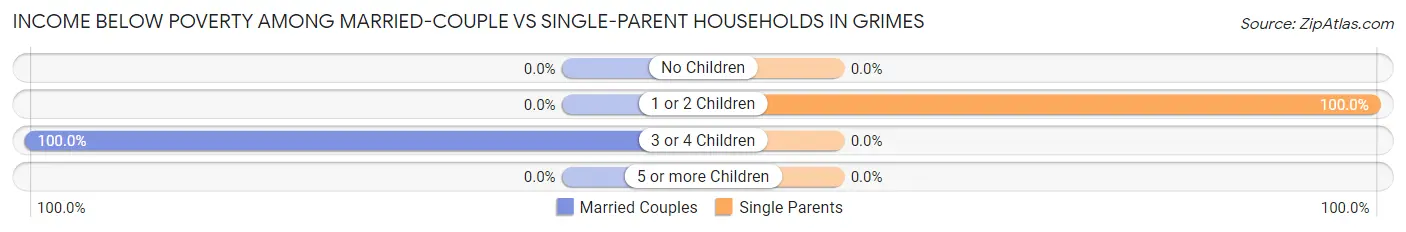
| Children | Married-Couple Families | Single-Parent Households |
| No Children | 0 (0.0%) | 0 (0.0%) |
| 1 or 2 Children | 0 (0.0%) | 16 (100.0%) |
| 3 or 4 Children | 18 (100.0%) | 0 (0.0%) |
| 5 or more Children | 0 (0.0%) | 0 (0.0%) |
| Total | 18 (27.7%) | 16 (100.0%) |
Race in Grimes
The most populous races in Grimes are White / Caucasian (288 | 81.1%), Two or more Races (67 | 18.9%), and Hispanic or Latino (61 | 17.2%).
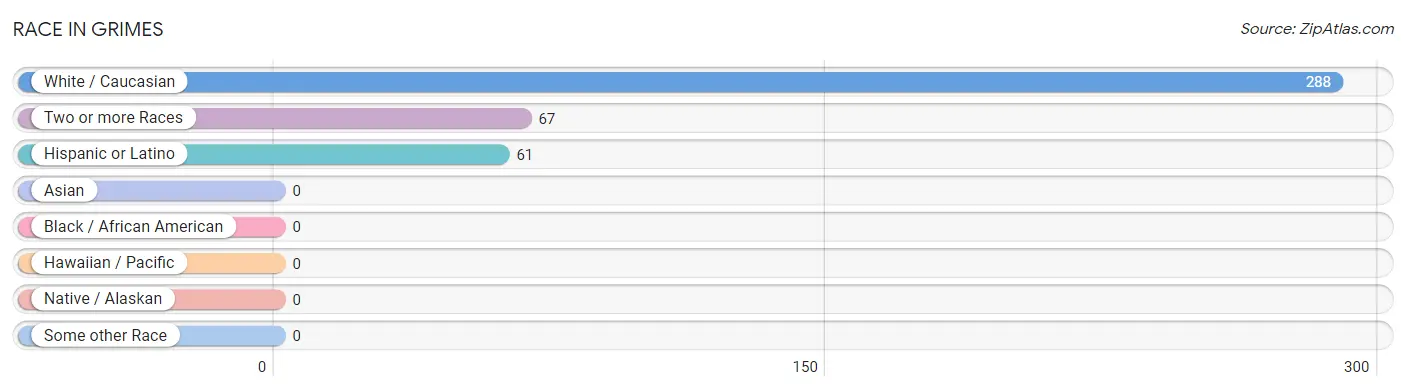
| Race | # Population | % Population |
| Asian | 0 | 0.0% |
| Black / African American | 0 | 0.0% |
| Hawaiian / Pacific | 0 | 0.0% |
| Hispanic or Latino | 61 | 17.2% |
| Native / Alaskan | 0 | 0.0% |
| White / Caucasian | 288 | 81.1% |
| Two or more Races | 67 | 18.9% |
| Some other Race | 0 | 0.0% |
| Total | 355 | 100.0% |
Ancestry in Grimes
The most populous ancestries reported in Grimes are German (84 | 23.7%), Mexican (61 | 17.2%), Irish (28 | 7.9%), English (25 | 7.0%), and Italian (17 | 4.8%), together accounting for 60.6% of all Grimes residents.
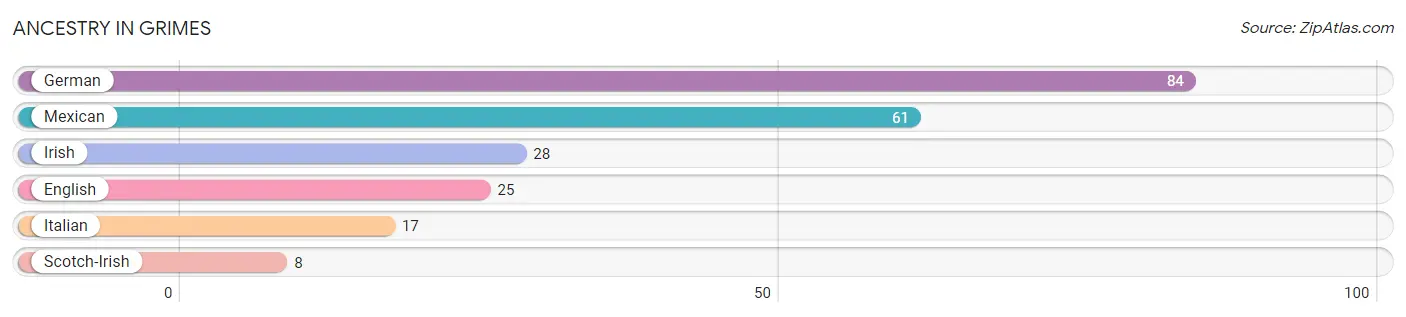
| Ancestry | # Population | % Population |
| English | 25 | 7.0% |
| German | 84 | 23.7% |
| Irish | 28 | 7.9% |
| Italian | 17 | 4.8% |
| Mexican | 61 | 17.2% |
| Scotch-Irish | 8 | 2.2% | View All 6 Rows |
Immigrants in Grimes
The most numerous immigrant groups reported in Grimes came from Central America (33 | 9.3%), Latin America (33 | 9.3%), and Mexico (33 | 9.3%), together accounting for 27.9% of all Grimes residents.
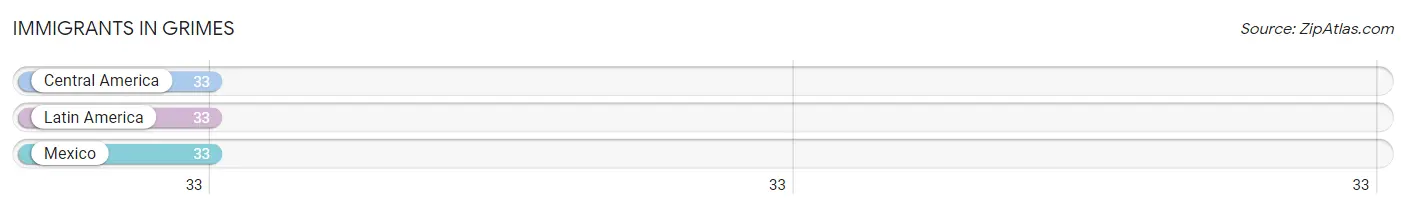
| Immigration Origin | # Population | % Population |
| Central America | 33 | 9.3% |
| Latin America | 33 | 9.3% |
| Mexico | 33 | 9.3% | View All 3 Rows |
Sex and Age in Grimes
Sex and Age in Grimes
The most populous age groups in Grimes are 55 to 59 Years (67 | 38.1%) for men and 55 to 59 Years (37 | 20.7%) for women.
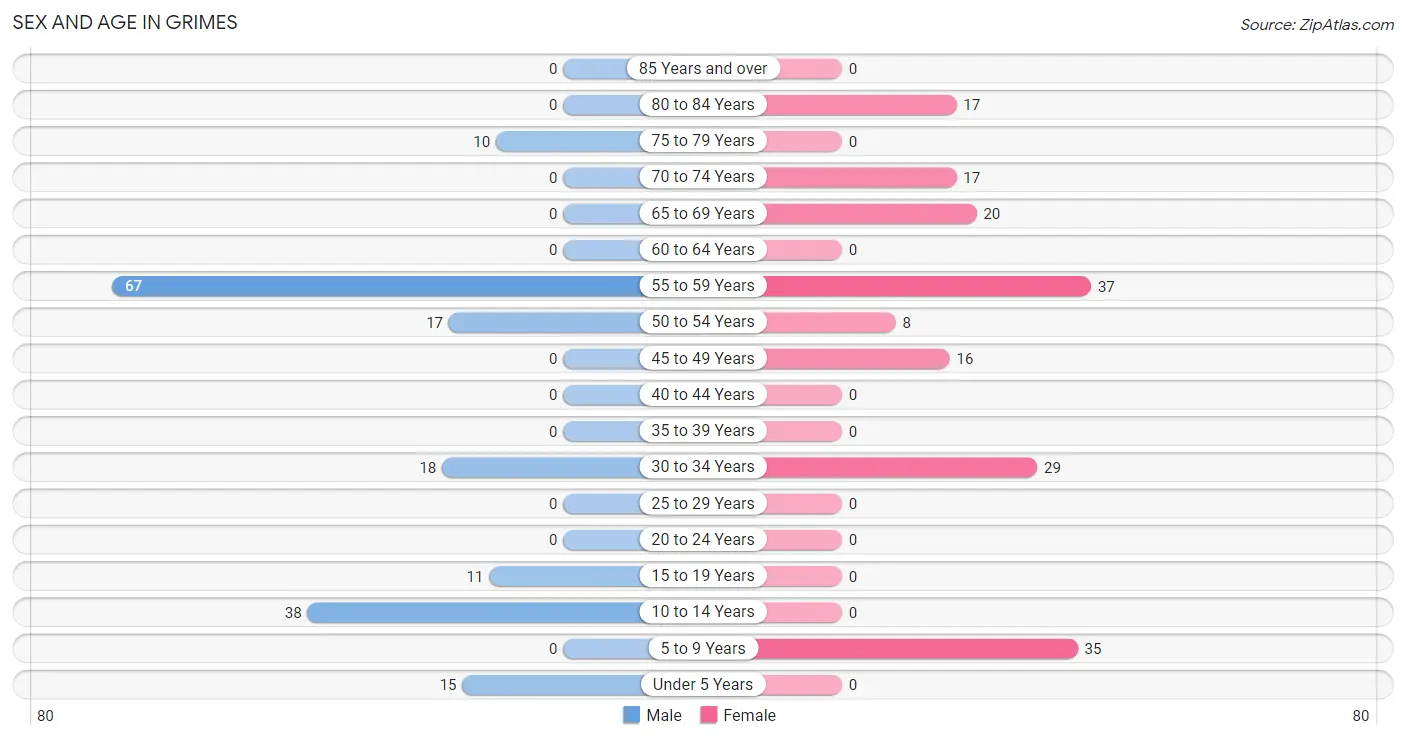
| Age Bracket | Male | Female |
| Under 5 Years | 15 (8.5%) | 0 (0.0%) |
| 5 to 9 Years | 0 (0.0%) | 35 (19.6%) |
| 10 to 14 Years | 38 (21.6%) | 0 (0.0%) |
| 15 to 19 Years | 11 (6.2%) | 0 (0.0%) |
| 20 to 24 Years | 0 (0.0%) | 0 (0.0%) |
| 25 to 29 Years | 0 (0.0%) | 0 (0.0%) |
| 30 to 34 Years | 18 (10.2%) | 29 (16.2%) |
| 35 to 39 Years | 0 (0.0%) | 0 (0.0%) |
| 40 to 44 Years | 0 (0.0%) | 0 (0.0%) |
| 45 to 49 Years | 0 (0.0%) | 16 (8.9%) |
| 50 to 54 Years | 17 (9.7%) | 8 (4.5%) |
| 55 to 59 Years | 67 (38.1%) | 37 (20.7%) |
| 60 to 64 Years | 0 (0.0%) | 0 (0.0%) |
| 65 to 69 Years | 0 (0.0%) | 20 (11.2%) |
| 70 to 74 Years | 0 (0.0%) | 17 (9.5%) |
| 75 to 79 Years | 10 (5.7%) | 0 (0.0%) |
| 80 to 84 Years | 0 (0.0%) | 17 (9.5%) |
| 85 Years and over | 0 (0.0%) | 0 (0.0%) |
| Total | 176 (100.0%) | 179 (100.0%) |
Families and Households in Grimes
Median Family Size in Grimes
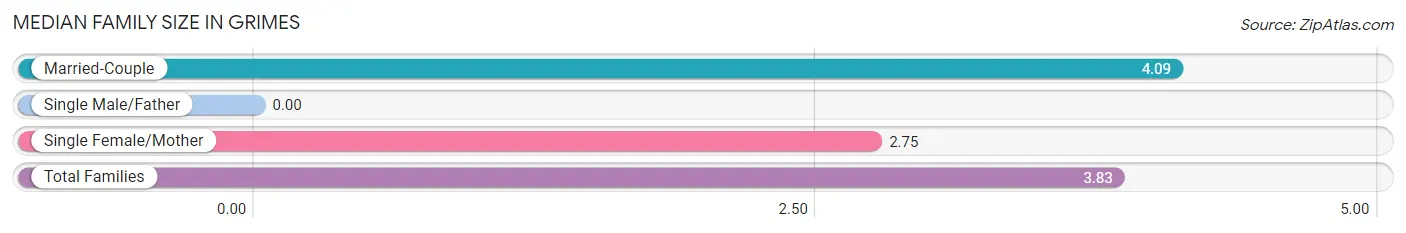
| Family Type | # Families | Family Size |
| Married-Couple | 65 (80.2%) | 4.09 |
| Single Male/Father | 0 (0.0%) | - |
| Single Female/Mother | 16 (19.8%) | 2.75 |
| Total Families | 81 (100.0%) | 3.83 |
Median Household Size in Grimes
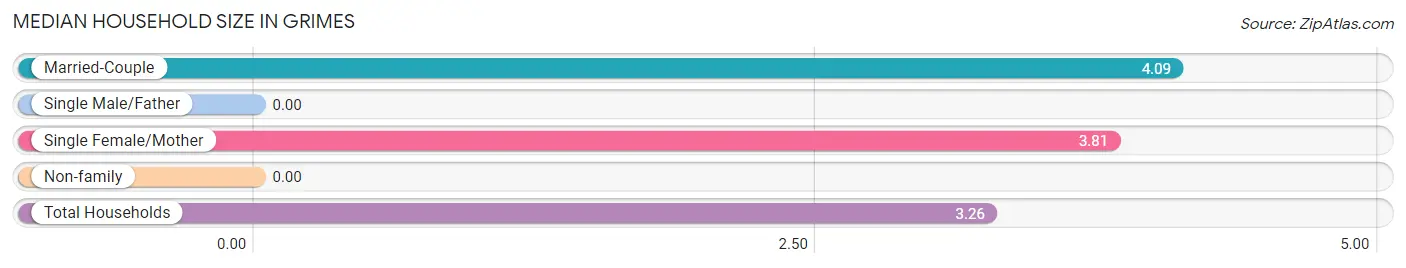
| Household Type | # Households | Household Size |
| Married-Couple | 65 (59.6%) | 4.09 |
| Single Male/Father | 0 (0.0%) | - |
| Single Female/Mother | 16 (14.7%) | 3.81 |
| Non-family | 28 (25.7%) | - |
| Total Households | 109 (100.0%) | 3.26 |
Household Size by Marriage Status in Grimes
Out of a total of 109 households in Grimes, 81 (74.3%) are family households, while 28 (25.7%) are nonfamily households. The most numerous type of family households are 3-person households, comprising 47, and the most common type of nonfamily households are 1-person households, comprising 28.
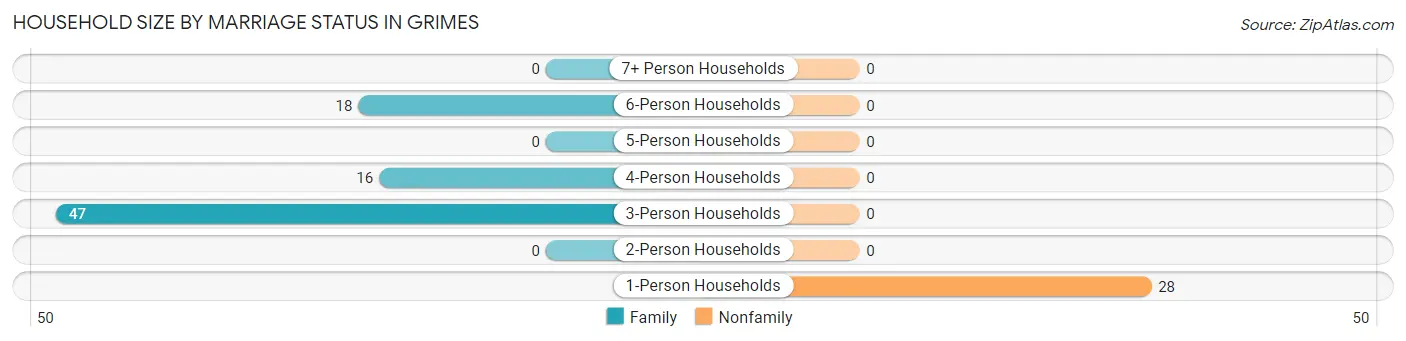
| Household Size | Family Households | Nonfamily Households |
| 1-Person Households | - | 28 (25.7%) |
| 2-Person Households | 0 (0.0%) | 0 (0.0%) |
| 3-Person Households | 47 (43.1%) | 0 (0.0%) |
| 4-Person Households | 16 (14.7%) | 0 (0.0%) |
| 5-Person Households | 0 (0.0%) | 0 (0.0%) |
| 6-Person Households | 18 (16.5%) | 0 (0.0%) |
| 7+ Person Households | 0 (0.0%) | 0 (0.0%) |
| Total | 81 (74.3%) | 28 (25.7%) |
Female Fertility in Grimes
Fertility by Age in Grimes
| Age Bracket | Women with Births | Births / 1,000 Women |
| 15 to 19 years | 0 (0.0%) | 0.0 |
| 20 to 34 years | 0 (0.0%) | 0.0 |
| 35 to 50 years | 0 (0.0%) | 0.0 |
| Total | 0 (0.0%) | 0.0 |
Fertility by Age by Marriage Status in Grimes
| Age Bracket | Married | Unmarried |
| 15 to 19 years | 0 (0.0%) | 0 (0.0%) |
| 20 to 34 years | 0 (0.0%) | 0 (0.0%) |
| 35 to 50 years | 0 (0.0%) | 0 (0.0%) |
| Total | 0 (0.0%) | 0 (0.0%) |
Fertility by Education in Grimes
| Educational Attainment | Women with Births | Births / 1,000 Women |
| Less than High School | 0 (0.0%) | 0.0 |
| High School Diploma | 0 (0.0%) | 0.0 |
| College or Associate's Degree | 0 (0.0%) | 0.0 |
| Bachelor's Degree | 0 (0.0%) | 0.0 |
| Graduate Degree | 0 (0.0%) | 0.0 |
| Total | 0 (0.0%) | 0.0 |
Fertility by Education by Marriage Status in Grimes
| Educational Attainment | Married | Unmarried |
| Less than High School | 0 (0.0%) | 0 (0.0%) |
| High School Diploma | 0 (0.0%) | 0 (0.0%) |
| College or Associate's Degree | 0 (0.0%) | 0 (0.0%) |
| Bachelor's Degree | 0 (0.0%) | 0 (0.0%) |
| Graduate Degree | 0 (0.0%) | 0 (0.0%) |
| Total | 0 (0.0%) | 0 (0.0%) |
Employment Characteristics in Grimes
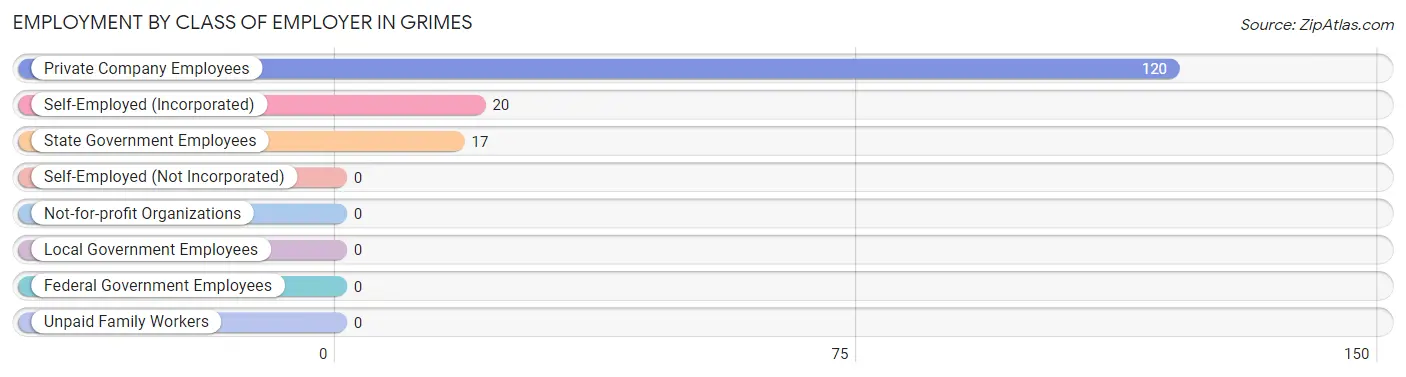
Employment by Class of Employer in Grimes
Among the 157 employed individuals in Grimes, private company employees (120 | 76.4%), self-employed (incorporated) (20 | 12.7%), and state government employees (17 | 10.8%) make up the most common classes of employment.
| Employer Class | # Employees | % Employees |
| Private Company Employees | 120 | 76.4% |
| Self-Employed (Incorporated) | 20 | 12.7% |
| Self-Employed (Not Incorporated) | 0 | 0.0% |
| Not-for-profit Organizations | 0 | 0.0% |
| Local Government Employees | 0 | 0.0% |
| State Government Employees | 17 | 10.8% |
| Federal Government Employees | 0 | 0.0% |
| Unpaid Family Workers | 0 | 0.0% |
| Total | 157 | 100.0% |
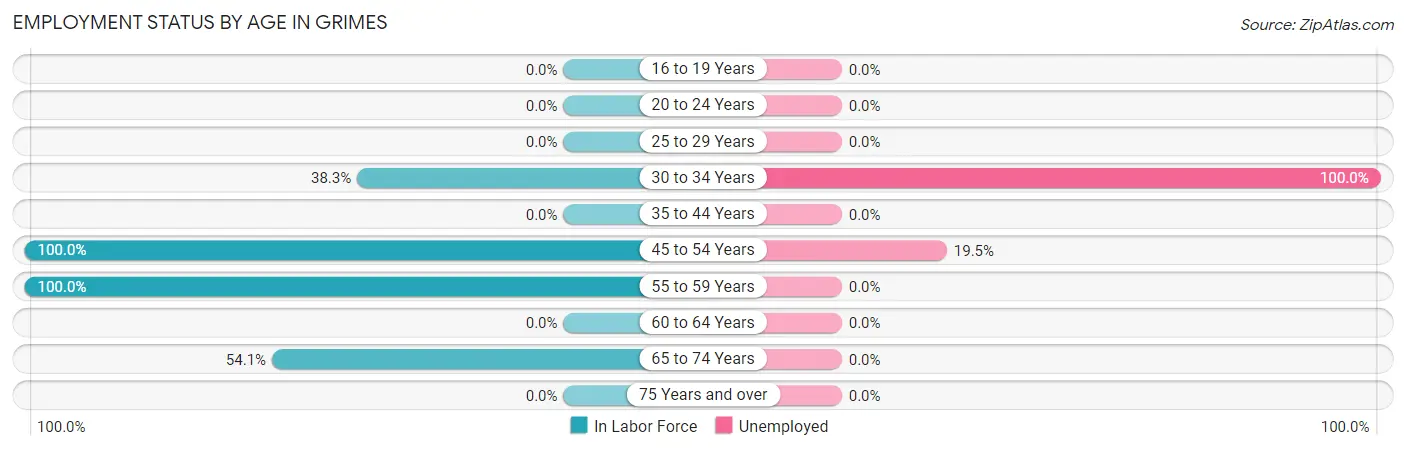
Employment Status by Age in Grimes
According to the labor force statistics for Grimes, out of the total population over 16 years of age (267), 68.5% or 183 individuals are in the labor force, with 14.2% or 26 of them unemployed. The age group with the highest labor force participation rate is 45 to 54 years, with 100.0% or 41 individuals in the labor force. Within the labor force, the 30 to 34 years age range has the highest percentage of unemployed individuals, with 100.0% or 18 of them being unemployed.
| Age Bracket | In Labor Force | Unemployed |
| 16 to 19 Years | 0 (0.0%) | 0 (0.0%) |
| 20 to 24 Years | 0 (0.0%) | 0 (0.0%) |
| 25 to 29 Years | 0 (0.0%) | 0 (0.0%) |
| 30 to 34 Years | 18 (38.3%) | 18 (100.0%) |
| 35 to 44 Years | 0 (0.0%) | 0 (0.0%) |
| 45 to 54 Years | 41 (100.0%) | 8 (19.5%) |
| 55 to 59 Years | 104 (100.0%) | 0 (0.0%) |
| 60 to 64 Years | 0 (0.0%) | 0 (0.0%) |
| 65 to 74 Years | 20 (54.1%) | 0 (0.0%) |
| 75 Years and over | 0 (0.0%) | 0 (0.0%) |
| Total | 183 (68.5%) | 26 (14.2%) |
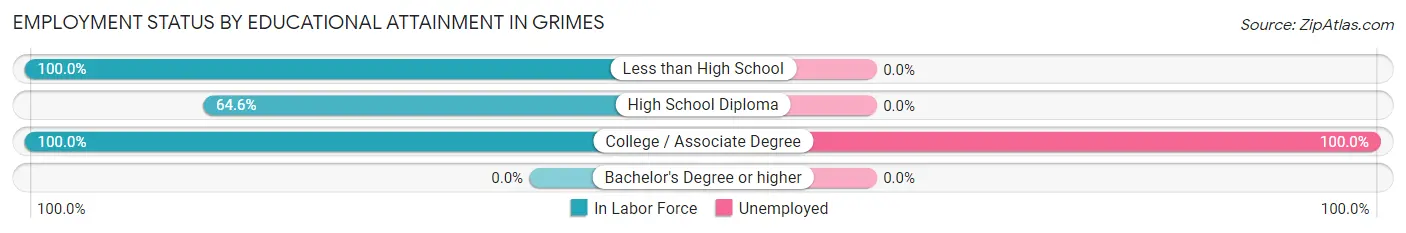
Employment Status by Educational Attainment in Grimes
According to labor force statistics for Grimes, 84.9% of individuals (163) out of the total population between 25 and 64 years of age (192) are in the labor force, with 16.0% or 26 of them being unemployed. The group with the highest labor force participation rate are those with the educational attainment of less than high school, with 100.0% or 84 individuals in the labor force. Within the labor force, individuals with college / associate degree education have the highest percentage of unemployment, with 100.0% or 26 of them being unemployed.
| Educational Attainment | In Labor Force | Unemployed |
| Less than High School | 84 (100.0%) | 0 (0.0%) |
| High School Diploma | 53 (64.6%) | 0 (0.0%) |
| College / Associate Degree | 26 (100.0%) | 26 (100.0%) |
| Bachelor's Degree or higher | 0 (0.0%) | 0 (0.0%) |
| Total | 163 (84.9%) | 31 (16.0%) |
Employment Occupations by Sex in Grimes
Management, Business, Science and Arts Occupations
Management, Business, Science and Arts Occupations by Sex
| Occupation | Male | Female |
| Management | 0 (0.0%) | 0 (0.0%) |
| Business & Financial | 0 (0.0%) | 0 (0.0%) |
| Computers, Engineering & Science | 0 (0.0%) | 0 (0.0%) |
| Computers & Mathematics | 0 (0.0%) | 0 (0.0%) |
| Architecture & Engineering | 0 (0.0%) | 0 (0.0%) |
| Life, Physical & Social Science | 0 (0.0%) | 0 (0.0%) |
| Community & Social Service | 0 (0.0%) | 0 (0.0%) |
| Education, Arts & Media | 0 (0.0%) | 0 (0.0%) |
| Legal Services & Support | 0 (0.0%) | 0 (0.0%) |
| Education Instruction & Library | 0 (0.0%) | 0 (0.0%) |
| Arts, Media & Entertainment | 0 (0.0%) | 0 (0.0%) |
| Health Diagnosing & Treating | 0 (0.0%) | 0 (0.0%) |
| Health Technologists | 0 (0.0%) | 0 (0.0%) |
| Total (Category) | 0 (0.0%) | 0 (0.0%) |
| Total (Overall) | 84 (53.5%) | 73 (46.5%) |
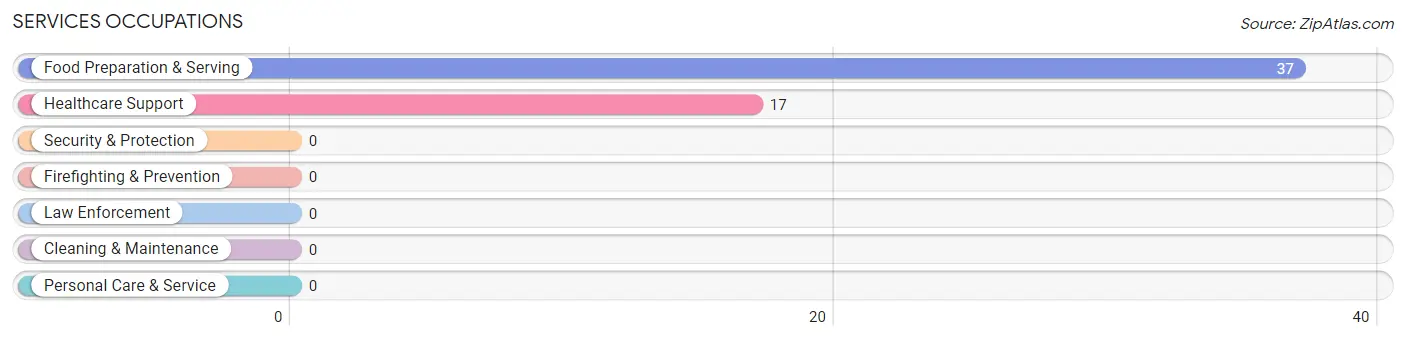
Services Occupations
The most common Services occupations in Grimes are Food Preparation & Serving (37 | 23.6%), and Healthcare Support (17 | 10.8%).
Services Occupations by Sex
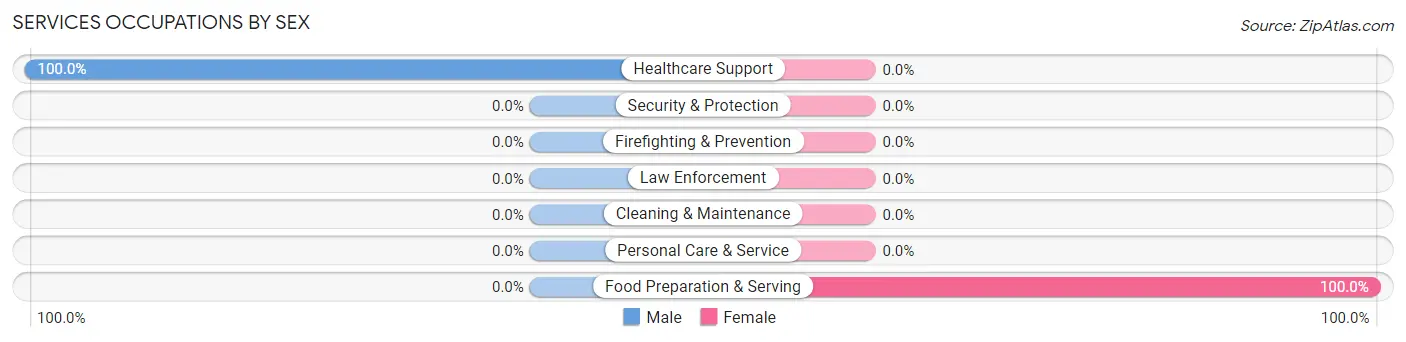
| Occupation | Male | Female |
| Healthcare Support | 17 (100.0%) | 0 (0.0%) |
| Security & Protection | 0 (0.0%) | 0 (0.0%) |
| Firefighting & Prevention | 0 (0.0%) | 0 (0.0%) |
| Law Enforcement | 0 (0.0%) | 0 (0.0%) |
| Food Preparation & Serving | 0 (0.0%) | 37 (100.0%) |
| Cleaning & Maintenance | 0 (0.0%) | 0 (0.0%) |
| Personal Care & Service | 0 (0.0%) | 0 (0.0%) |
| Total (Category) | 17 (31.5%) | 37 (68.5%) |
| Total (Overall) | 84 (53.5%) | 73 (46.5%) |
Sales and Office Occupations
The most common Sales and Office occupations in Grimes are , and Sales & Related (20 | 12.7%).
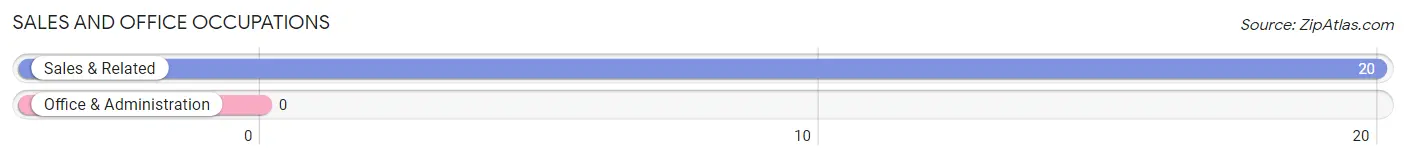
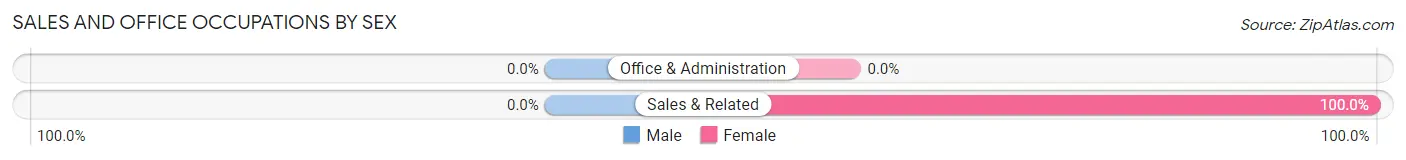
Sales and Office Occupations by Sex
| Occupation | Male | Female |
| Sales & Related | 0 (0.0%) | 20 (100.0%) |
| Office & Administration | 0 (0.0%) | 0 (0.0%) |
| Total (Category) | 0 (0.0%) | 20 (100.0%) |
| Total (Overall) | 84 (53.5%) | 73 (46.5%) |
Natural Resources, Construction and Maintenance Occupations
The most common Natural Resources, Construction and Maintenance occupations in Grimes are , and Farming, Fishing & Forestry (16 | 10.2%).
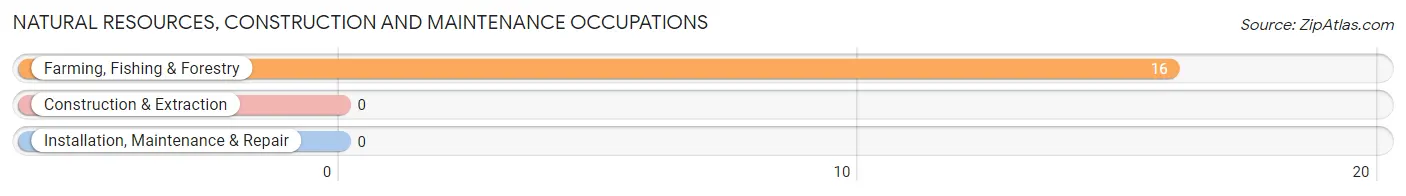
Natural Resources, Construction and Maintenance Occupations by Sex
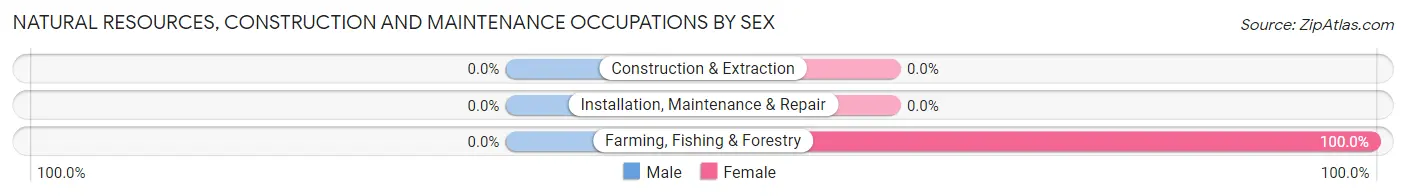
| Occupation | Male | Female |
| Farming, Fishing & Forestry | 0 (0.0%) | 16 (100.0%) |
| Construction & Extraction | 0 (0.0%) | 0 (0.0%) |
| Installation, Maintenance & Repair | 0 (0.0%) | 0 (0.0%) |
| Total (Category) | 0 (0.0%) | 16 (100.0%) |
| Total (Overall) | 84 (53.5%) | 73 (46.5%) |
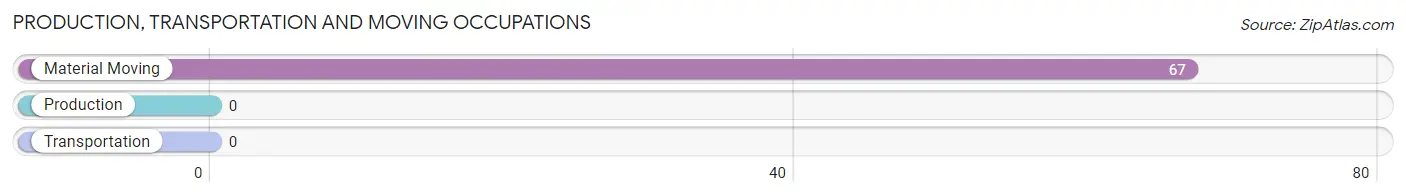
Production, Transportation and Moving Occupations
The most common Production, Transportation and Moving occupations in Grimes are , and Material Moving (67 | 42.7%).
Production, Transportation and Moving Occupations by Sex
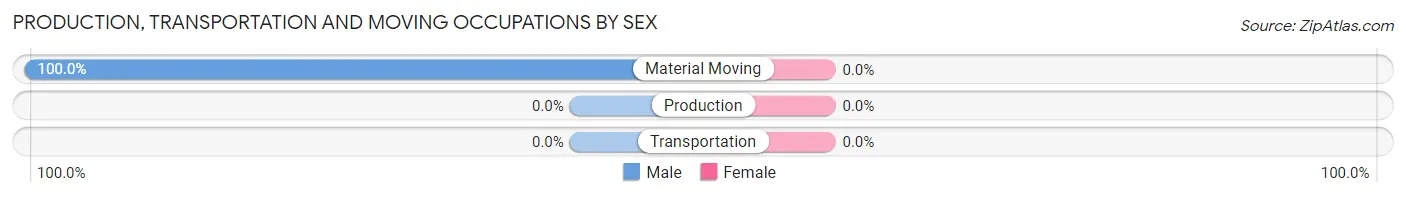
| Occupation | Male | Female |
| Production | 0 (0.0%) | 0 (0.0%) |
| Transportation | 0 (0.0%) | 0 (0.0%) |
| Material Moving | 67 (100.0%) | 0 (0.0%) |
| Total (Category) | 67 (100.0%) | 0 (0.0%) |
| Total (Overall) | 84 (53.5%) | 73 (46.5%) |
Employment Industries by Sex in Grimes
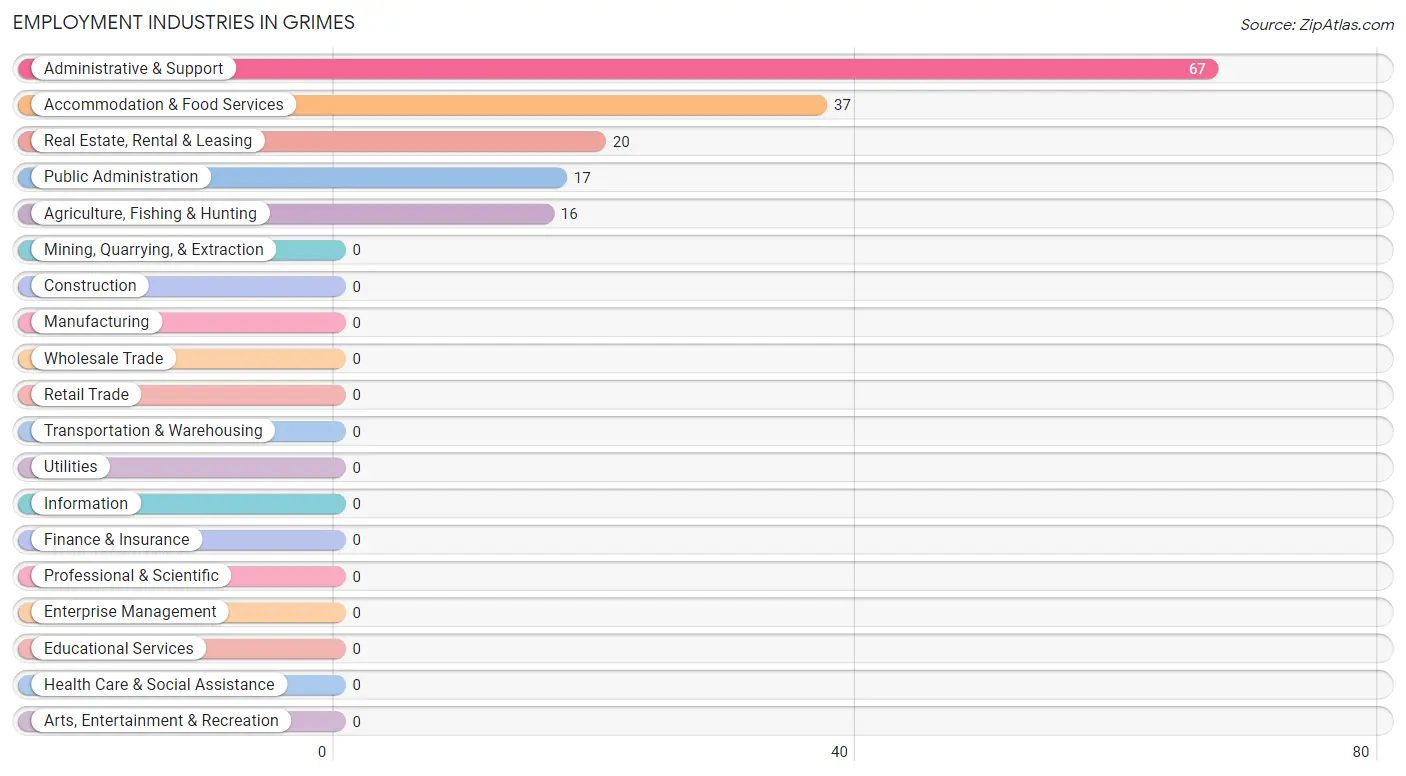
Employment Industries in Grimes
The major employment industries in Grimes include Administrative & Support (67 | 42.7%), Accommodation & Food Services (37 | 23.6%), Real Estate, Rental & Leasing (20 | 12.7%), Public Administration (17 | 10.8%), and Agriculture, Fishing & Hunting (16 | 10.2%).
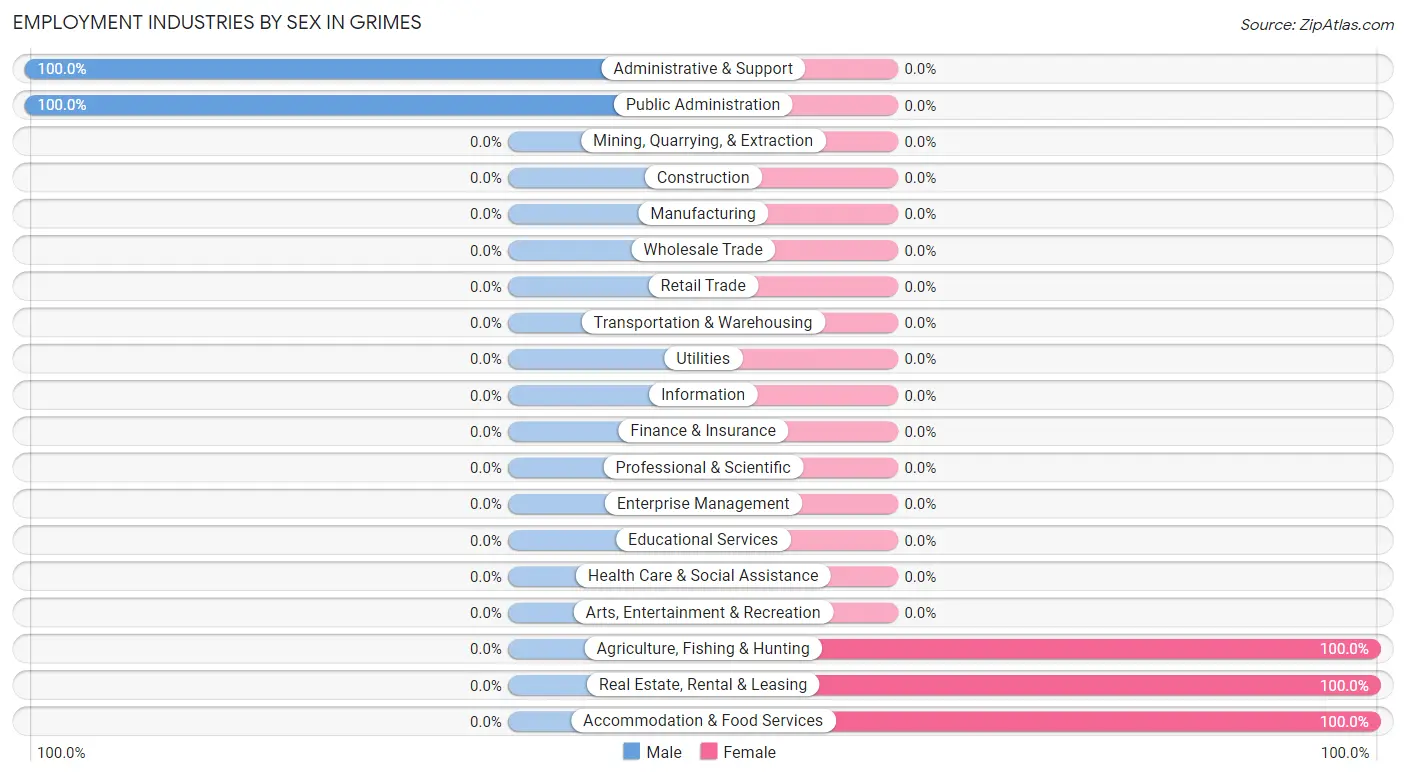
Employment Industries by Sex in Grimes
The Grimes industries that see more men than women are Administrative & Support (100.0%), and Public Administration (100.0%), whereas the industries that tend to have a higher number of women are Agriculture, Fishing & Hunting (100.0%), Real Estate, Rental & Leasing (100.0%), and Accommodation & Food Services (100.0%).
| Industry | Male | Female |
| Agriculture, Fishing & Hunting | 0 (0.0%) | 16 (100.0%) |
| Mining, Quarrying, & Extraction | 0 (0.0%) | 0 (0.0%) |
| Construction | 0 (0.0%) | 0 (0.0%) |
| Manufacturing | 0 (0.0%) | 0 (0.0%) |
| Wholesale Trade | 0 (0.0%) | 0 (0.0%) |
| Retail Trade | 0 (0.0%) | 0 (0.0%) |
| Transportation & Warehousing | 0 (0.0%) | 0 (0.0%) |
| Utilities | 0 (0.0%) | 0 (0.0%) |
| Information | 0 (0.0%) | 0 (0.0%) |
| Finance & Insurance | 0 (0.0%) | 0 (0.0%) |
| Real Estate, Rental & Leasing | 0 (0.0%) | 20 (100.0%) |
| Professional & Scientific | 0 (0.0%) | 0 (0.0%) |
| Enterprise Management | 0 (0.0%) | 0 (0.0%) |
| Administrative & Support | 67 (100.0%) | 0 (0.0%) |
| Educational Services | 0 (0.0%) | 0 (0.0%) |
| Health Care & Social Assistance | 0 (0.0%) | 0 (0.0%) |
| Arts, Entertainment & Recreation | 0 (0.0%) | 0 (0.0%) |
| Accommodation & Food Services | 0 (0.0%) | 37 (100.0%) |
| Public Administration | 17 (100.0%) | 0 (0.0%) |
| Total | 84 (53.5%) | 73 (46.5%) |
Education in Grimes
School Enrollment in Grimes
The most common levels of schooling among the 102 students in Grimes are middle school (56 | 54.9%), college / undergraduate (18 | 17.6%), and elementary school (17 | 16.7%).
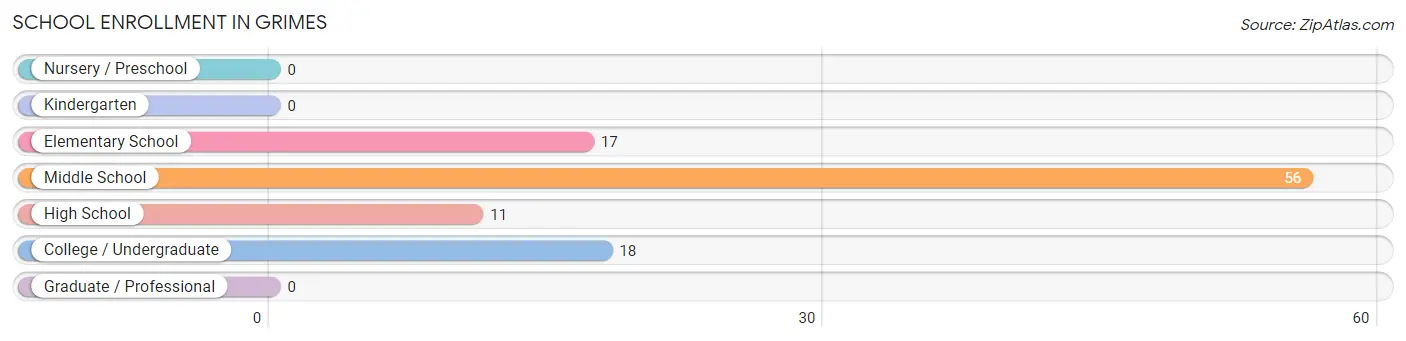
| School Level | # Students | % Students |
| Nursery / Preschool | 0 | 0.0% |
| Kindergarten | 0 | 0.0% |
| Elementary School | 17 | 16.7% |
| Middle School | 56 | 54.9% |
| High School | 11 | 10.8% |
| College / Undergraduate | 18 | 17.6% |
| Graduate / Professional | 0 | 0.0% |
| Total | 102 | 100.0% |
School Enrollment by Age by Funding Source in Grimes
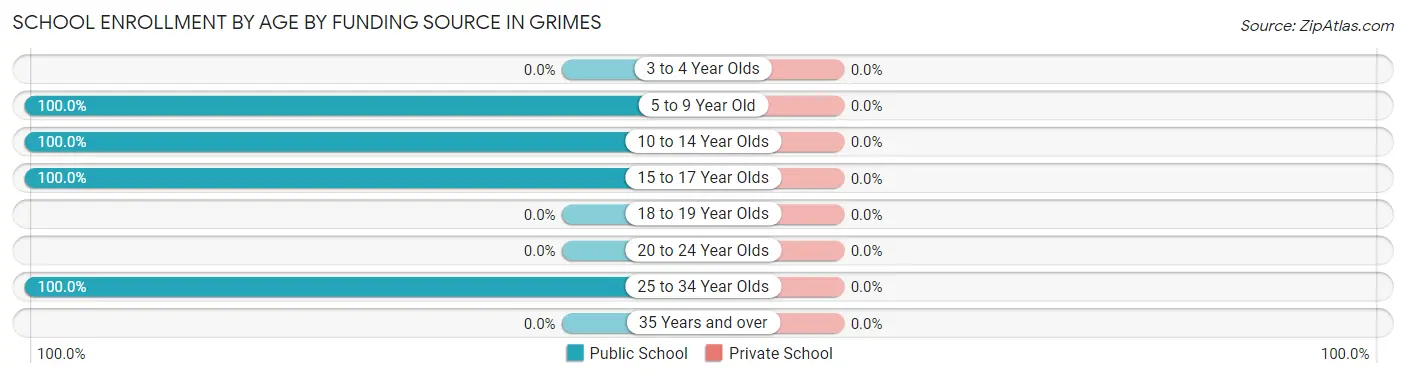
| Age Bracket | Public School | Private School |
| 3 to 4 Year Olds | 0 (0.0%) | 0 (0.0%) |
| 5 to 9 Year Old | 35 (100.0%) | 0 (0.0%) |
| 10 to 14 Year Olds | 38 (100.0%) | 0 (0.0%) |
| 15 to 17 Year Olds | 11 (100.0%) | 0 (0.0%) |
| 18 to 19 Year Olds | 0 (0.0%) | 0 (0.0%) |
| 20 to 24 Year Olds | 0 (0.0%) | 0 (0.0%) |
| 25 to 34 Year Olds | 18 (100.0%) | 0 (0.0%) |
| 35 Years and over | 0 (0.0%) | 0 (0.0%) |
| Total | 102 (100.0%) | 0 (0.0%) |
Educational Attainment by Field of Study in Grimes
Social sciences (20 | 66.7%), and bio, nature & agricultural (10 | 33.3%) are the most common fields of study among 30 individuals in Grimes who have obtained a bachelor's degree or higher.
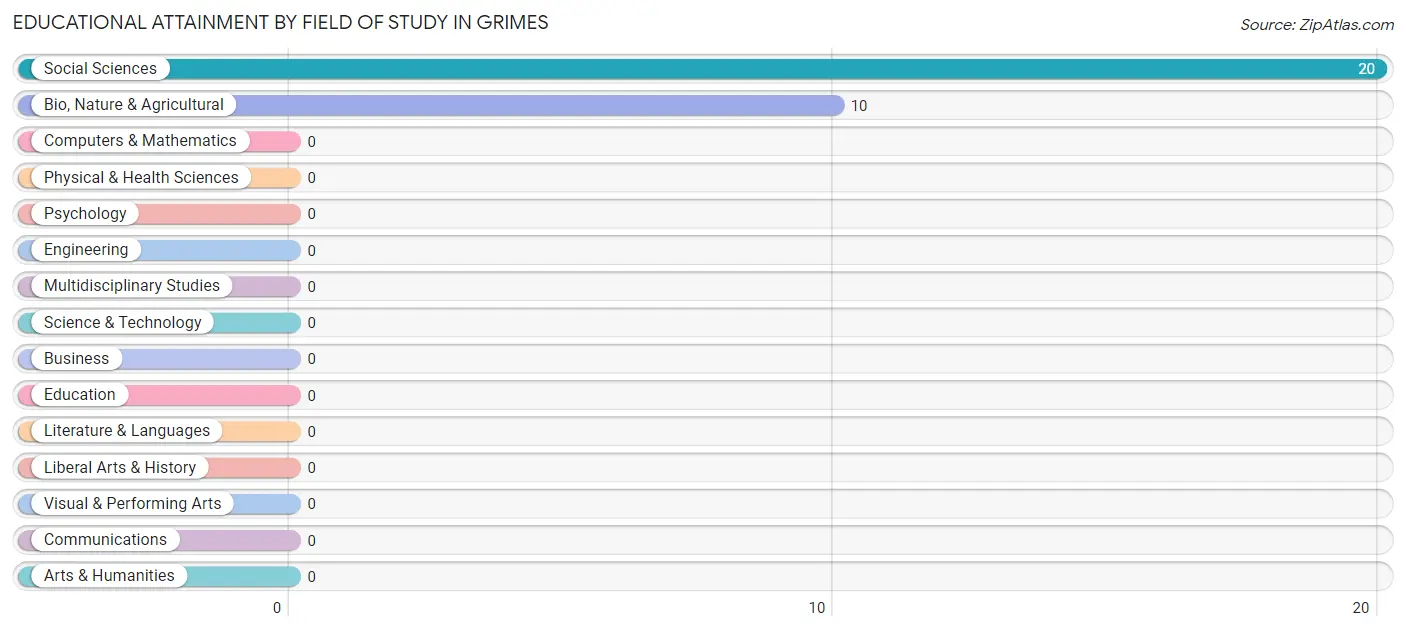
| Field of Study | # Graduates | % Graduates |
| Computers & Mathematics | 0 | 0.0% |
| Bio, Nature & Agricultural | 10 | 33.3% |
| Physical & Health Sciences | 0 | 0.0% |
| Psychology | 0 | 0.0% |
| Social Sciences | 20 | 66.7% |
| Engineering | 0 | 0.0% |
| Multidisciplinary Studies | 0 | 0.0% |
| Science & Technology | 0 | 0.0% |
| Business | 0 | 0.0% |
| Education | 0 | 0.0% |
| Literature & Languages | 0 | 0.0% |
| Liberal Arts & History | 0 | 0.0% |
| Visual & Performing Arts | 0 | 0.0% |
| Communications | 0 | 0.0% |
| Arts & Humanities | 0 | 0.0% |
| Total | 30 | 100.0% |
Transportation & Commute in Grimes
Vehicle Availability by Sex in Grimes
The most prevalent vehicle ownership categories in Grimes are males with 2 vehicles (67, accounting for 79.8%) and females with 2 vehicles (37, making up 91.8%).
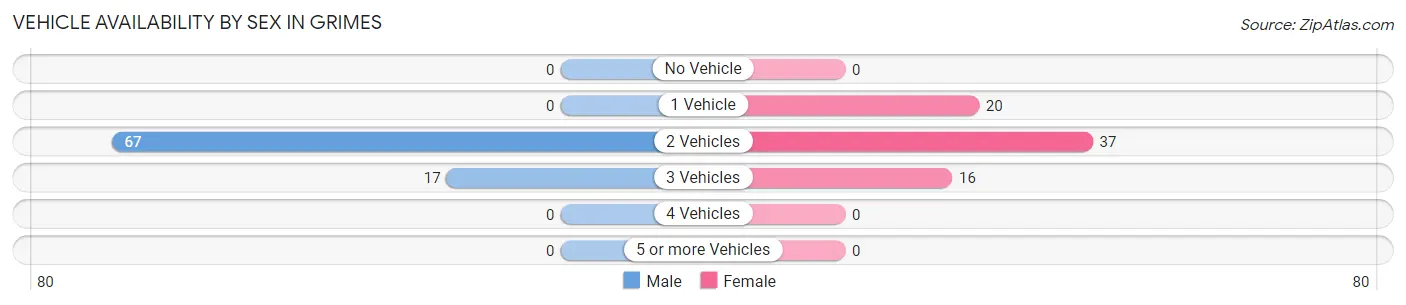
| Vehicles Available | Male | Female |
| No Vehicle | 0 (0.0%) | 0 (0.0%) |
| 1 Vehicle | 0 (0.0%) | 20 (27.4%) |
| 2 Vehicles | 67 (79.8%) | 37 (50.7%) |
| 3 Vehicles | 17 (20.2%) | 16 (21.9%) |
| 4 Vehicles | 0 (0.0%) | 0 (0.0%) |
| 5 or more Vehicles | 0 (0.0%) | 0 (0.0%) |
| Total | 84 (100.0%) | 73 (100.0%) |
Commute Time in Grimes
The most frequently occuring commute durations in Grimes are 15 to 19 minutes (20 commuters, 37.7%), 5 to 9 minutes (17 commuters, 32.1%), and 60 to 89 minutes (16 commuters, 30.2%).
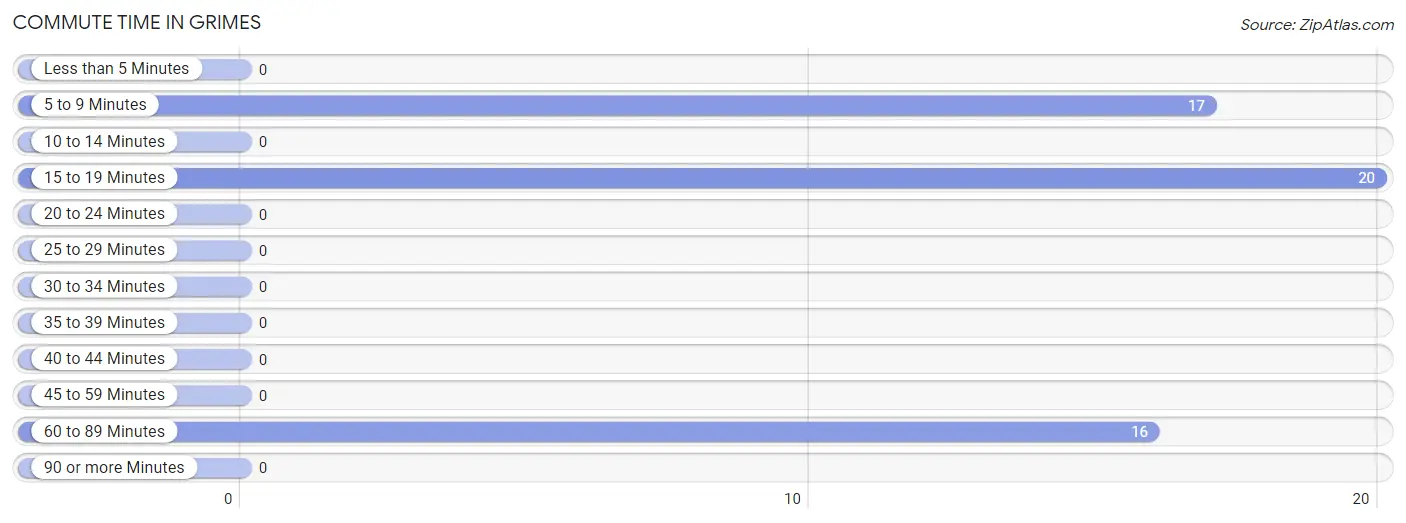
| Commute Time | # Commuters | % Commuters |
| Less than 5 Minutes | 0 | 0.0% |
| 5 to 9 Minutes | 17 | 32.1% |
| 10 to 14 Minutes | 0 | 0.0% |
| 15 to 19 Minutes | 20 | 37.7% |
| 20 to 24 Minutes | 0 | 0.0% |
| 25 to 29 Minutes | 0 | 0.0% |
| 30 to 34 Minutes | 0 | 0.0% |
| 35 to 39 Minutes | 0 | 0.0% |
| 40 to 44 Minutes | 0 | 0.0% |
| 45 to 59 Minutes | 0 | 0.0% |
| 60 to 89 Minutes | 16 | 30.2% |
| 90 or more Minutes | 0 | 0.0% |
Commute Time by Sex in Grimes
The most common commute times in Grimes are 5 to 9 minutes (17 commuters, 100.0%) for males and 15 to 19 minutes (20 commuters, 55.6%) for females.
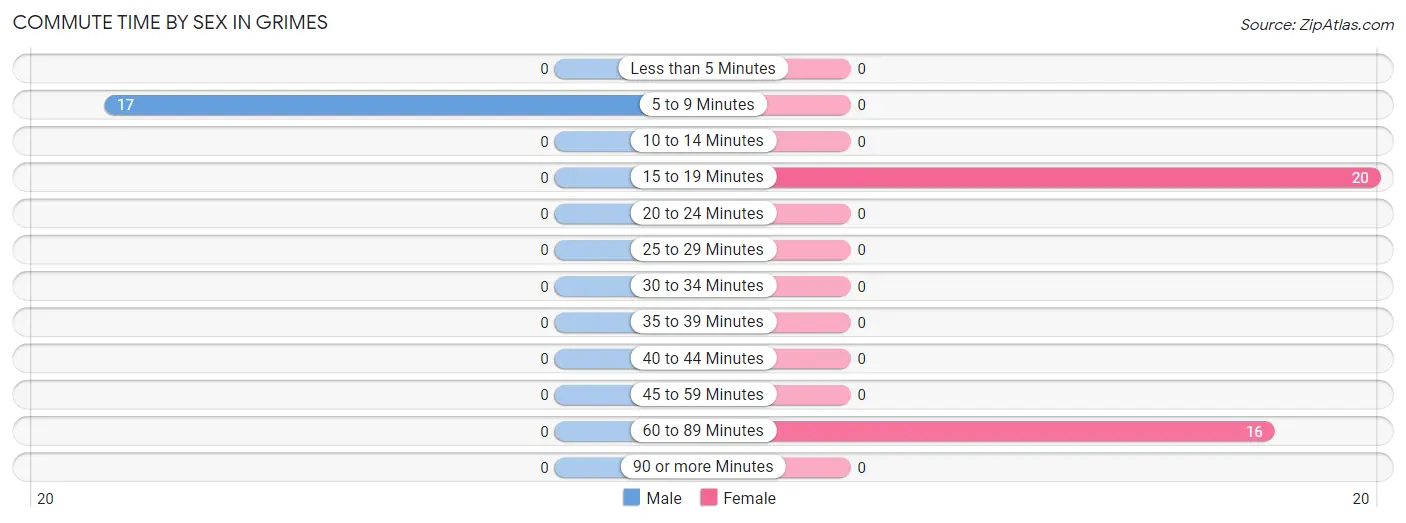
| Commute Time | Male | Female |
| Less than 5 Minutes | 0 (0.0%) | 0 (0.0%) |
| 5 to 9 Minutes | 17 (100.0%) | 0 (0.0%) |
| 10 to 14 Minutes | 0 (0.0%) | 0 (0.0%) |
| 15 to 19 Minutes | 0 (0.0%) | 20 (55.6%) |
| 20 to 24 Minutes | 0 (0.0%) | 0 (0.0%) |
| 25 to 29 Minutes | 0 (0.0%) | 0 (0.0%) |
| 30 to 34 Minutes | 0 (0.0%) | 0 (0.0%) |
| 35 to 39 Minutes | 0 (0.0%) | 0 (0.0%) |
| 40 to 44 Minutes | 0 (0.0%) | 0 (0.0%) |
| 45 to 59 Minutes | 0 (0.0%) | 0 (0.0%) |
| 60 to 89 Minutes | 0 (0.0%) | 16 (44.4%) |
| 90 or more Minutes | 0 (0.0%) | 0 (0.0%) |
Time of Departure to Work by Sex in Grimes
The most frequent times of departure to work in Grimes are 7:00 AM to 7:29 AM (17, 100.0%) for males and 9:00 AM to 9:59 AM (20, 55.6%) for females.
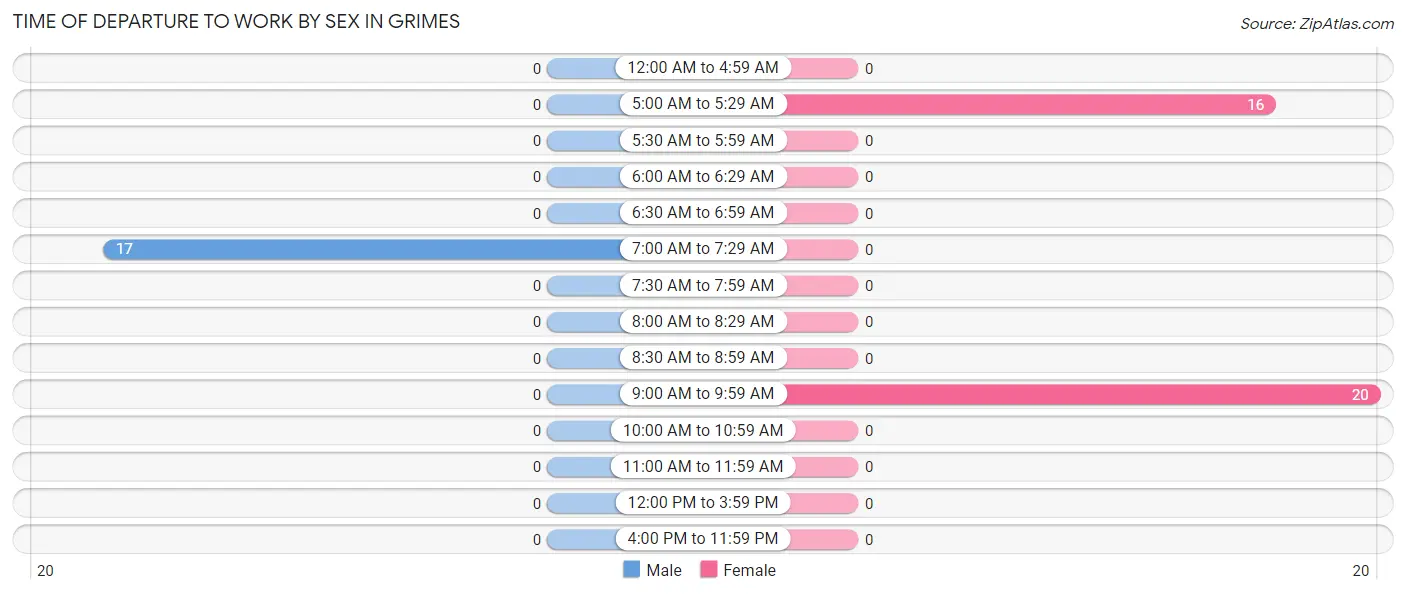
| Time of Departure | Male | Female |
| 12:00 AM to 4:59 AM | 0 (0.0%) | 0 (0.0%) |
| 5:00 AM to 5:29 AM | 0 (0.0%) | 16 (44.4%) |
| 5:30 AM to 5:59 AM | 0 (0.0%) | 0 (0.0%) |
| 6:00 AM to 6:29 AM | 0 (0.0%) | 0 (0.0%) |
| 6:30 AM to 6:59 AM | 0 (0.0%) | 0 (0.0%) |
| 7:00 AM to 7:29 AM | 17 (100.0%) | 0 (0.0%) |
| 7:30 AM to 7:59 AM | 0 (0.0%) | 0 (0.0%) |
| 8:00 AM to 8:29 AM | 0 (0.0%) | 0 (0.0%) |
| 8:30 AM to 8:59 AM | 0 (0.0%) | 0 (0.0%) |
| 9:00 AM to 9:59 AM | 0 (0.0%) | 20 (55.6%) |
| 10:00 AM to 10:59 AM | 0 (0.0%) | 0 (0.0%) |
| 11:00 AM to 11:59 AM | 0 (0.0%) | 0 (0.0%) |
| 12:00 PM to 3:59 PM | 0 (0.0%) | 0 (0.0%) |
| 4:00 PM to 11:59 PM | 0 (0.0%) | 0 (0.0%) |
| Total | 17 (100.0%) | 36 (100.0%) |
Housing Occupancy in Grimes
Occupancy by Ownership in Grimes
Of the total 109 dwellings in Grimes, owner-occupied units account for 75 (68.8%), while renter-occupied units make up 34 (31.2%).
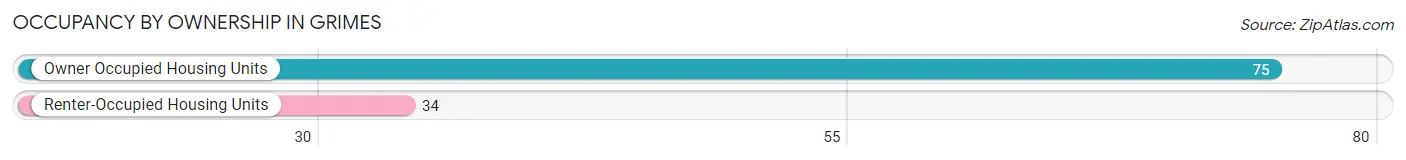
| Occupancy | # Housing Units | % Housing Units |
| Owner Occupied Housing Units | 75 | 68.8% |
| Renter-Occupied Housing Units | 34 | 31.2% |
| Total Occupied Housing Units | 109 | 100.0% |
Occupancy by Household Size in Grimes
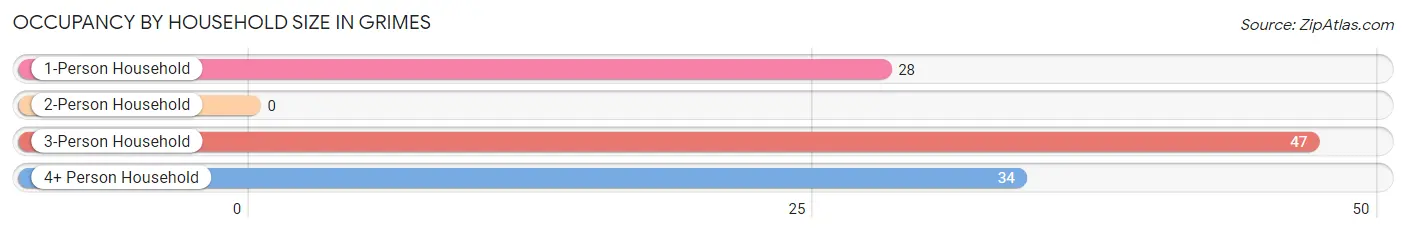
| Household Size | # Housing Units | % Housing Units |
| 1-Person Household | 28 | 25.7% |
| 2-Person Household | 0 | 0.0% |
| 3-Person Household | 47 | 43.1% |
| 4+ Person Household | 34 | 31.2% |
| Total Housing Units | 109 | 100.0% |
Occupancy by Ownership by Household Size in Grimes
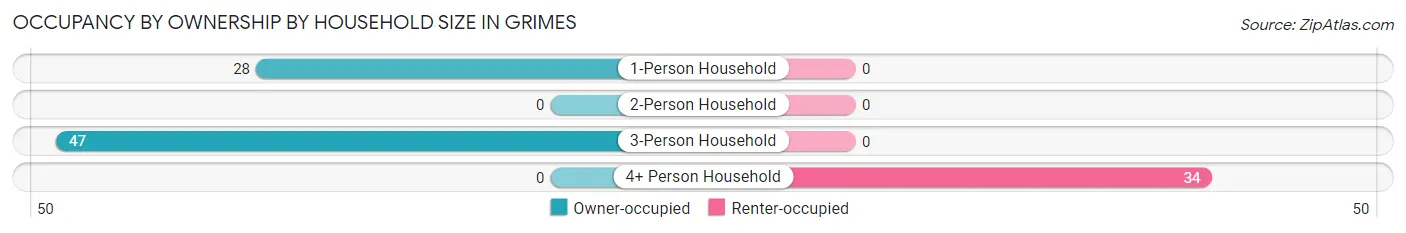
| Household Size | Owner-occupied | Renter-occupied |
| 1-Person Household | 28 (100.0%) | 0 (0.0%) |
| 2-Person Household | 0 (0.0%) | 0 (0.0%) |
| 3-Person Household | 47 (100.0%) | 0 (0.0%) |
| 4+ Person Household | 0 (0.0%) | 34 (100.0%) |
| Total Housing Units | 75 (68.8%) | 34 (31.2%) |
Occupancy by Educational Attainment in Grimes
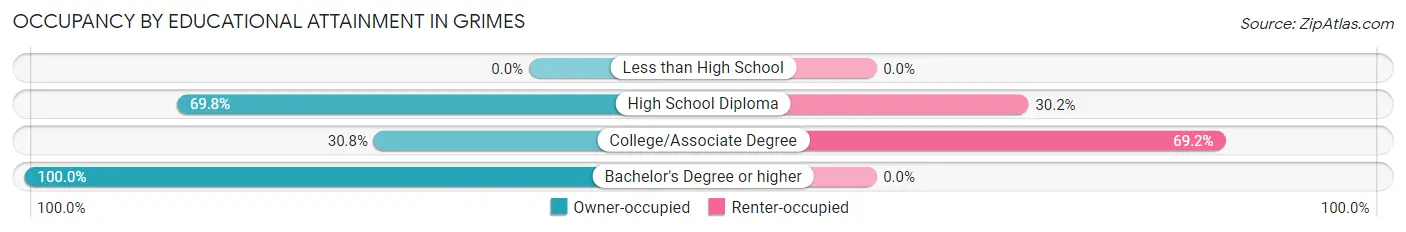
| Household Size | Owner-occupied | Renter-occupied |
| Less than High School | 0 (0.0%) | 0 (0.0%) |
| High School Diploma | 37 (69.8%) | 16 (30.2%) |
| College/Associate Degree | 8 (30.8%) | 18 (69.2%) |
| Bachelor's Degree or higher | 30 (100.0%) | 0 (0.0%) |
Occupancy by Age of Householder in Grimes
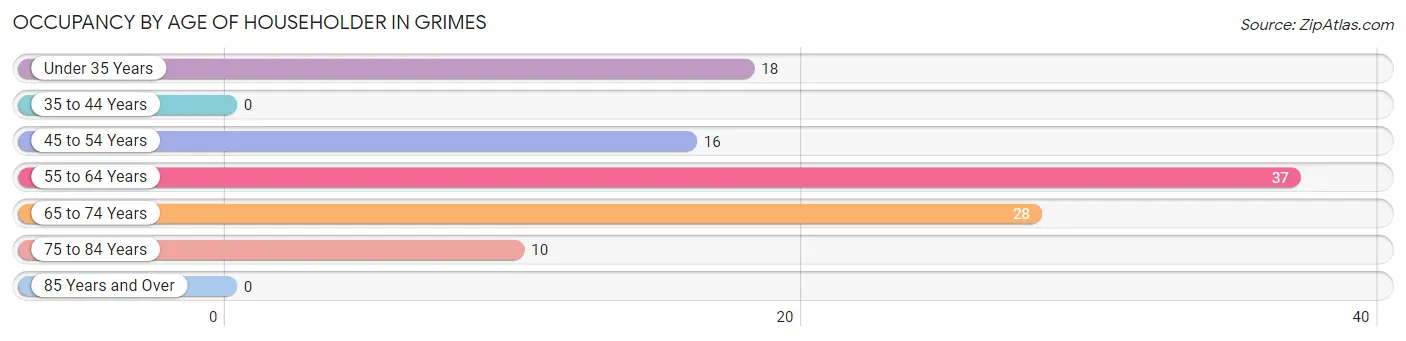
| Age Bracket | # Households | % Households |
| Under 35 Years | 18 | 16.5% |
| 35 to 44 Years | 0 | 0.0% |
| 45 to 54 Years | 16 | 14.7% |
| 55 to 64 Years | 37 | 33.9% |
| 65 to 74 Years | 28 | 25.7% |
| 75 to 84 Years | 10 | 9.2% |
| 85 Years and Over | 0 | 0.0% |
| Total | 109 | 100.0% |
Housing Finances in Grimes
Median Income by Occupancy in Grimes
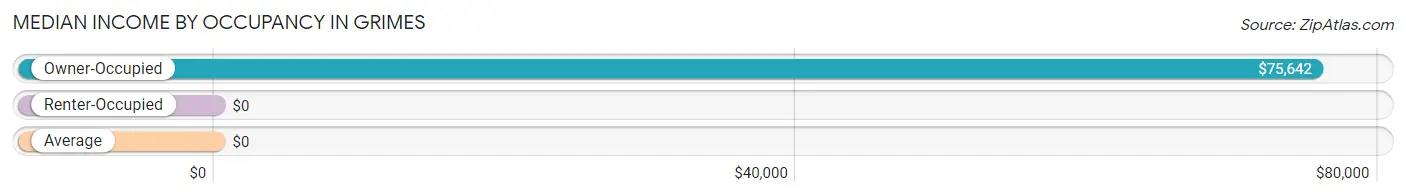
| Occupancy Type | # Households | Median Income |
| Owner-Occupied | 75 (68.8%) | $75,642 |
| Renter-Occupied | 34 (31.2%) | $0 |
| Average | 109 (100.0%) | $0 |
Occupancy by Householder Income Bracket in Grimes
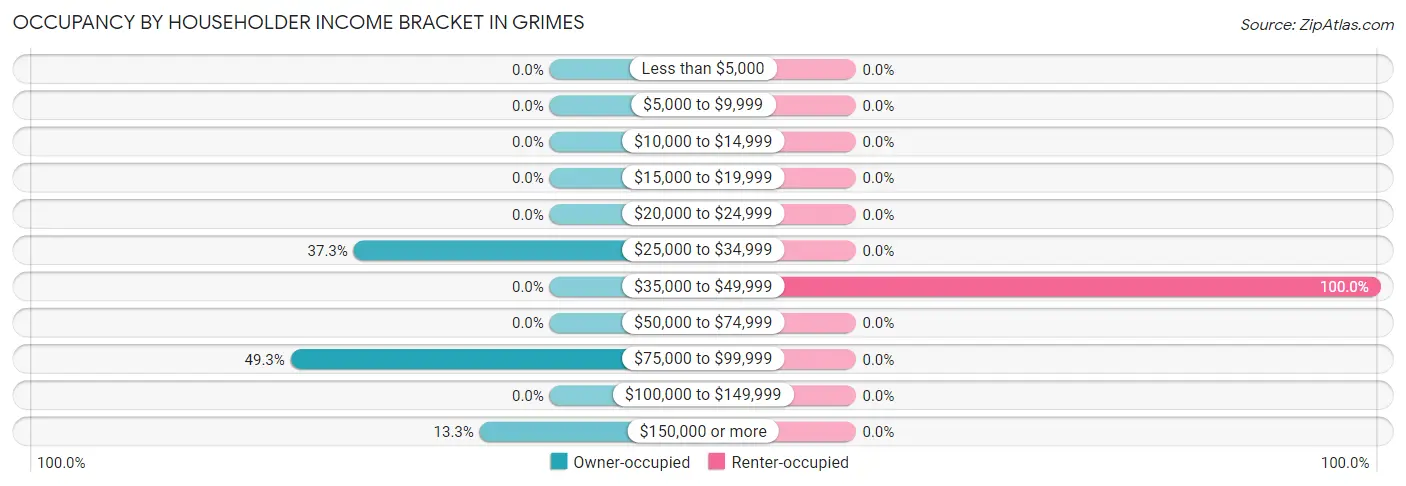
| Income Bracket | Owner-occupied | Renter-occupied |
| Less than $5,000 | 0 (0.0%) | 0 (0.0%) |
| $5,000 to $9,999 | 0 (0.0%) | 0 (0.0%) |
| $10,000 to $14,999 | 0 (0.0%) | 0 (0.0%) |
| $15,000 to $19,999 | 0 (0.0%) | 0 (0.0%) |
| $20,000 to $24,999 | 0 (0.0%) | 0 (0.0%) |
| $25,000 to $34,999 | 28 (37.3%) | 0 (0.0%) |
| $35,000 to $49,999 | 0 (0.0%) | 34 (100.0%) |
| $50,000 to $74,999 | 0 (0.0%) | 0 (0.0%) |
| $75,000 to $99,999 | 37 (49.3%) | 0 (0.0%) |
| $100,000 to $149,999 | 0 (0.0%) | 0 (0.0%) |
| $150,000 or more | 10 (13.3%) | 0 (0.0%) |
| Total | 75 (100.0%) | 34 (100.0%) |
Monthly Housing Cost Tiers in Grimes
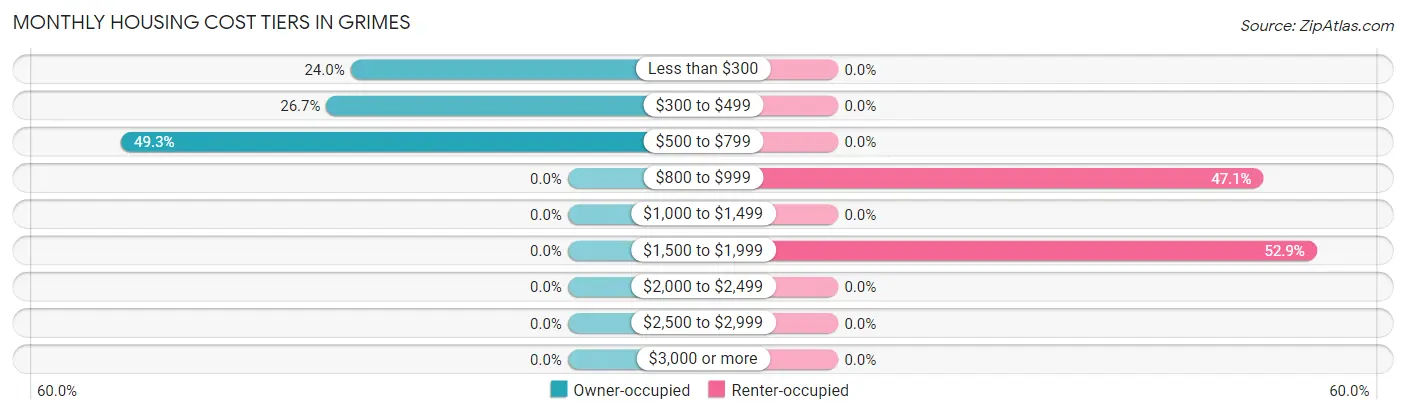
| Monthly Cost | Owner-occupied | Renter-occupied |
| Less than $300 | 18 (24.0%) | 0 (0.0%) |
| $300 to $499 | 20 (26.7%) | 0 (0.0%) |
| $500 to $799 | 37 (49.3%) | 0 (0.0%) |
| $800 to $999 | 0 (0.0%) | 16 (47.1%) |
| $1,000 to $1,499 | 0 (0.0%) | 0 (0.0%) |
| $1,500 to $1,999 | 0 (0.0%) | 18 (52.9%) |
| $2,000 to $2,499 | 0 (0.0%) | 0 (0.0%) |
| $2,500 to $2,999 | 0 (0.0%) | 0 (0.0%) |
| $3,000 or more | 0 (0.0%) | 0 (0.0%) |
| Total | 75 (100.0%) | 34 (100.0%) |
Physical Housing Characteristics in Grimes
Housing Structures in Grimes
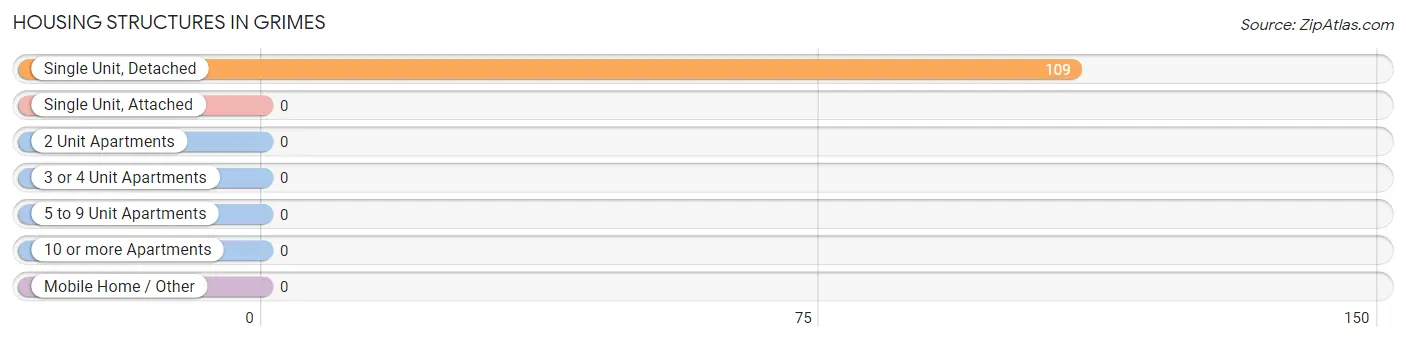
| Structure Type | # Housing Units | % Housing Units |
| Single Unit, Detached | 109 | 100.0% |
| Single Unit, Attached | 0 | 0.0% |
| 2 Unit Apartments | 0 | 0.0% |
| 3 or 4 Unit Apartments | 0 | 0.0% |
| 5 to 9 Unit Apartments | 0 | 0.0% |
| 10 or more Apartments | 0 | 0.0% |
| Mobile Home / Other | 0 | 0.0% |
| Total | 109 | 100.0% |
Housing Structures by Occupancy in Grimes
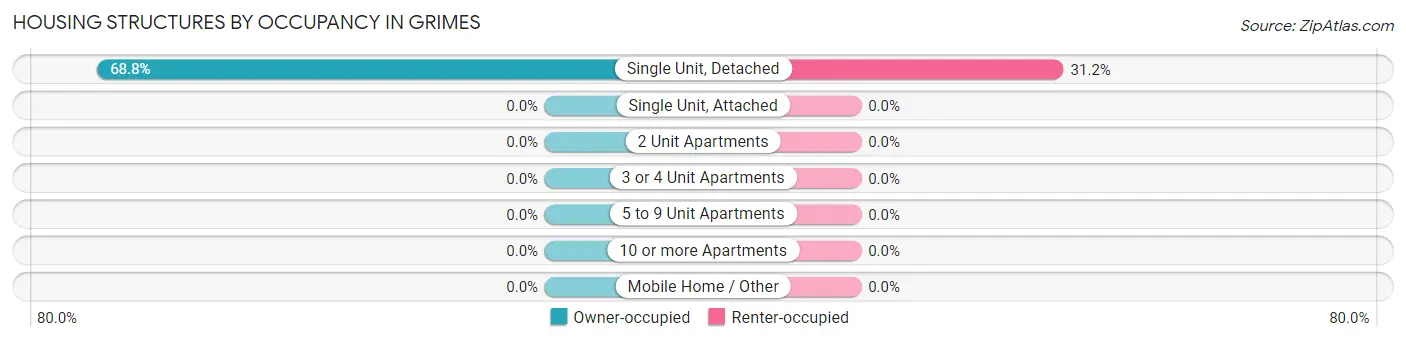
| Structure Type | Owner-occupied | Renter-occupied |
| Single Unit, Detached | 75 (68.8%) | 34 (31.2%) |
| Single Unit, Attached | 0 (0.0%) | 0 (0.0%) |
| 2 Unit Apartments | 0 (0.0%) | 0 (0.0%) |
| 3 or 4 Unit Apartments | 0 (0.0%) | 0 (0.0%) |
| 5 to 9 Unit Apartments | 0 (0.0%) | 0 (0.0%) |
| 10 or more Apartments | 0 (0.0%) | 0 (0.0%) |
| Mobile Home / Other | 0 (0.0%) | 0 (0.0%) |
| Total | 75 (68.8%) | 34 (31.2%) |
Housing Structures by Number of Rooms in Grimes
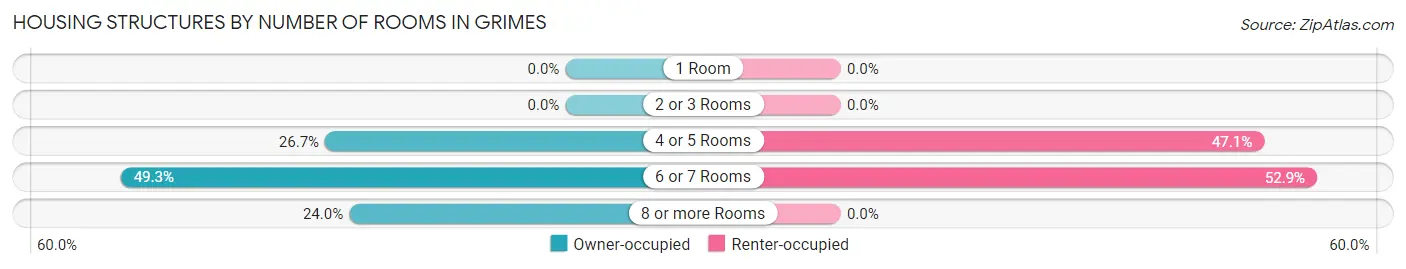
| Number of Rooms | Owner-occupied | Renter-occupied |
| 1 Room | 0 (0.0%) | 0 (0.0%) |
| 2 or 3 Rooms | 0 (0.0%) | 0 (0.0%) |
| 4 or 5 Rooms | 20 (26.7%) | 16 (47.1%) |
| 6 or 7 Rooms | 37 (49.3%) | 18 (52.9%) |
| 8 or more Rooms | 18 (24.0%) | 0 (0.0%) |
| Total | 75 (100.0%) | 34 (100.0%) |
Housing Structure by Heating Type in Grimes
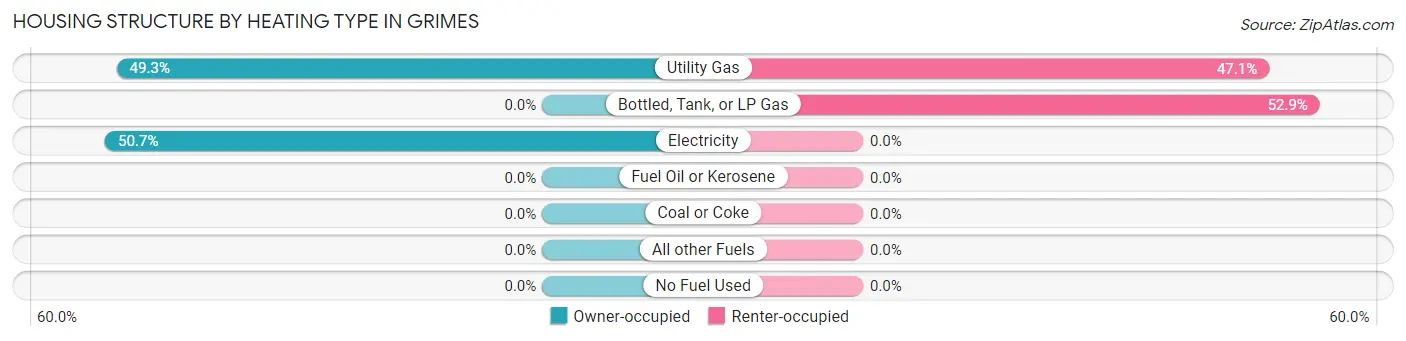
| Heating Type | Owner-occupied | Renter-occupied |
| Utility Gas | 37 (49.3%) | 16 (47.1%) |
| Bottled, Tank, or LP Gas | 0 (0.0%) | 18 (52.9%) |
| Electricity | 38 (50.7%) | 0 (0.0%) |
| Fuel Oil or Kerosene | 0 (0.0%) | 0 (0.0%) |
| Coal or Coke | 0 (0.0%) | 0 (0.0%) |
| All other Fuels | 0 (0.0%) | 0 (0.0%) |
| No Fuel Used | 0 (0.0%) | 0 (0.0%) |
| Total | 75 (100.0%) | 34 (100.0%) |
Household Vehicle Usage in Grimes
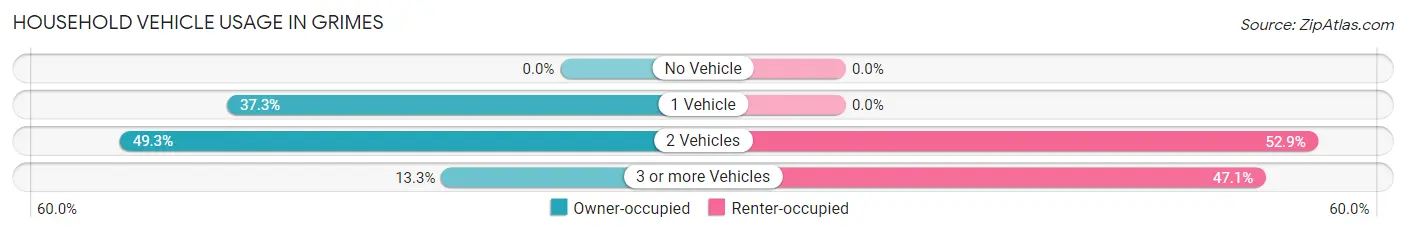
| Vehicles per Household | Owner-occupied | Renter-occupied |
| No Vehicle | 0 (0.0%) | 0 (0.0%) |
| 1 Vehicle | 28 (37.3%) | 0 (0.0%) |
| 2 Vehicles | 37 (49.3%) | 18 (52.9%) |
| 3 or more Vehicles | 10 (13.3%) | 16 (47.1%) |
| Total | 75 (100.0%) | 34 (100.0%) |
Real Estate & Mortgages in Grimes
Real Estate and Mortgage Overview in Grimes
| Characteristic | Without Mortgage | With Mortgage |
| Housing Units | 38 | 37 |
| Median Property Value | $336,700 | $0 |
| Median Household Income | - | - |
| Monthly Housing Costs | $405 | $0 |
| Real Estate Taxes | $2,367 | $0 |
Property Value by Mortgage Status in Grimes
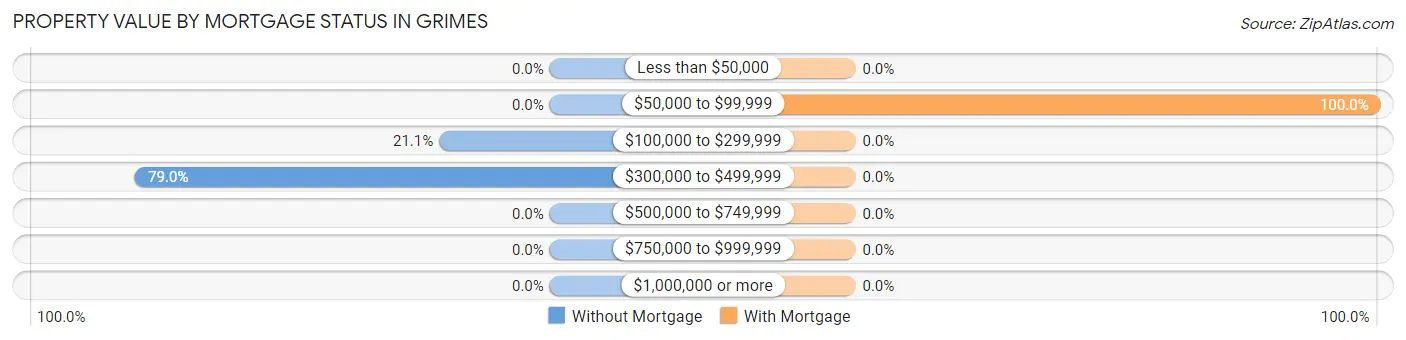
| Property Value | Without Mortgage | With Mortgage |
| Less than $50,000 | 0 (0.0%) | 0 (0.0%) |
| $50,000 to $99,999 | 0 (0.0%) | 37 (100.0%) |
| $100,000 to $299,999 | 8 (21.0%) | 0 (0.0%) |
| $300,000 to $499,999 | 30 (78.9%) | 0 (0.0%) |
| $500,000 to $749,999 | 0 (0.0%) | 0 (0.0%) |
| $750,000 to $999,999 | 0 (0.0%) | 0 (0.0%) |
| $1,000,000 or more | 0 (0.0%) | 0 (0.0%) |
| Total | 38 (100.0%) | 37 (100.0%) |
Household Income by Mortgage Status in Grimes
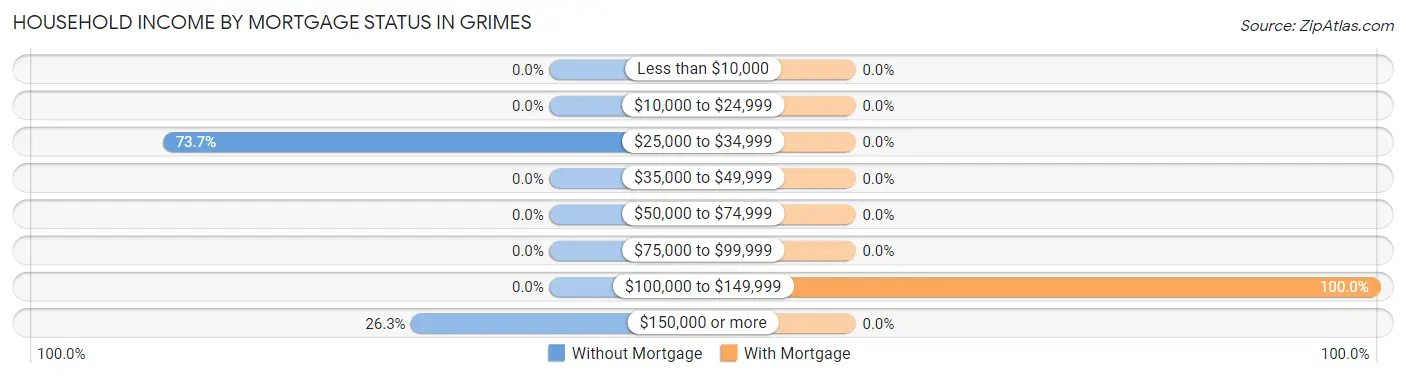
| Household Income | Without Mortgage | With Mortgage |
| Less than $10,000 | 0 (0.0%) | 0 (0.0%) |
| $10,000 to $24,999 | 0 (0.0%) | 0 (0.0%) |
| $25,000 to $34,999 | 28 (73.7%) | 0 (0.0%) |
| $35,000 to $49,999 | 0 (0.0%) | 0 (0.0%) |
| $50,000 to $74,999 | 0 (0.0%) | 0 (0.0%) |
| $75,000 to $99,999 | 0 (0.0%) | 0 (0.0%) |
| $100,000 to $149,999 | 0 (0.0%) | 37 (100.0%) |
| $150,000 or more | 10 (26.3%) | 0 (0.0%) |
| Total | 38 (100.0%) | 37 (100.0%) |
Property Value to Household Income Ratio in Grimes
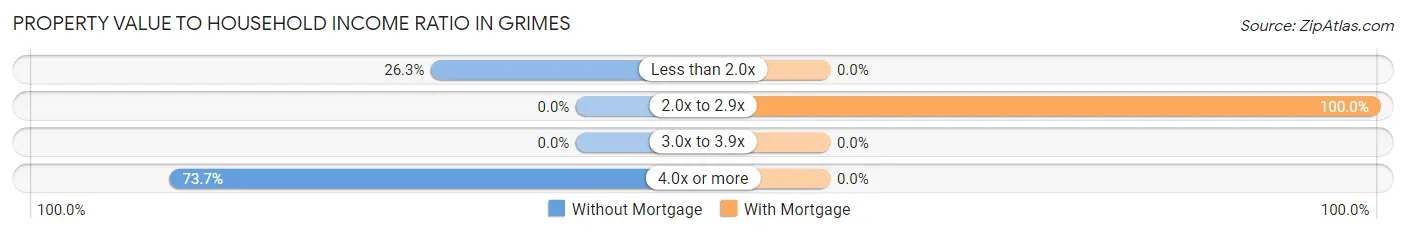
| Value-to-Income Ratio | Without Mortgage | With Mortgage |
| Less than 2.0x | 10 (26.3%) | 0 (0.0%) |
| 2.0x to 2.9x | 0 (0.0%) | 37 (100.0%) |
| 3.0x to 3.9x | 0 (0.0%) | 0 (0.0%) |
| 4.0x or more | 28 (73.7%) | 0 (0.0%) |
| Total | 38 (100.0%) | 37 (100.0%) |
Real Estate Taxes by Mortgage Status in Grimes
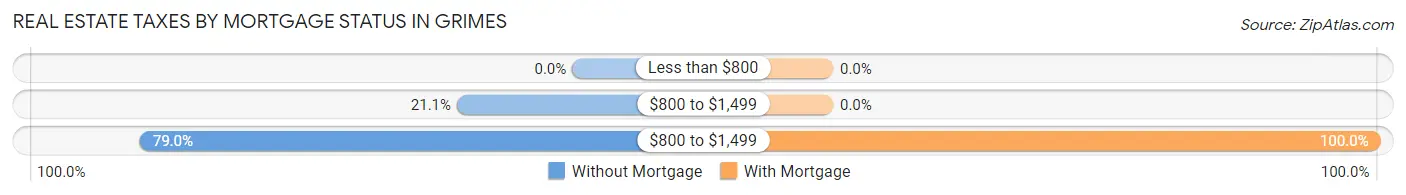
| Property Taxes | Without Mortgage | With Mortgage |
| Less than $800 | 0 (0.0%) | 0 (0.0%) |
| $800 to $1,499 | 8 (21.0%) | 0 (0.0%) |
| $800 to $1,499 | 30 (78.9%) | 37 (100.0%) |
| Total | 38 (100.0%) | 37 (100.0%) |
Health & Disability in Grimes
Health Insurance Coverage by Age in Grimes
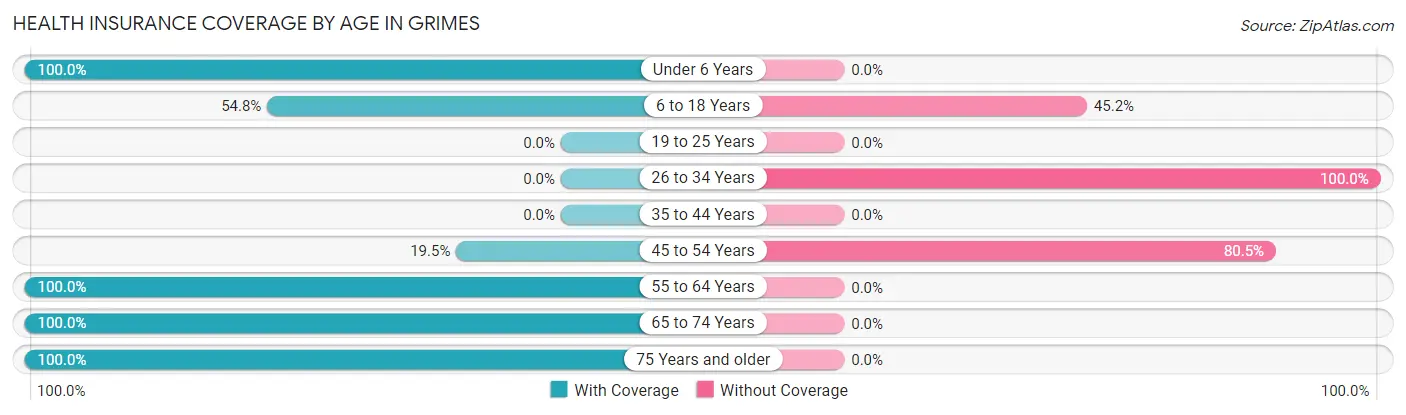
| Age Bracket | With Coverage | Without Coverage |
| Under 6 Years | 15 (100.0%) | 0 (0.0%) |
| 6 to 18 Years | 46 (54.8%) | 38 (45.2%) |
| 19 to 25 Years | 0 (0.0%) | 0 (0.0%) |
| 26 to 34 Years | 0 (0.0%) | 47 (100.0%) |
| 35 to 44 Years | 0 (0.0%) | 0 (0.0%) |
| 45 to 54 Years | 8 (19.5%) | 33 (80.5%) |
| 55 to 64 Years | 104 (100.0%) | 0 (0.0%) |
| 65 to 74 Years | 37 (100.0%) | 0 (0.0%) |
| 75 Years and older | 27 (100.0%) | 0 (0.0%) |
| Total | 237 (66.8%) | 118 (33.2%) |
Health Insurance Coverage by Citizenship Status in Grimes
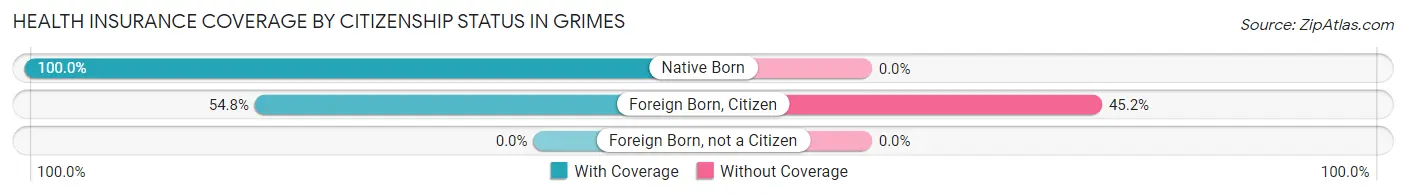
| Citizenship Status | With Coverage | Without Coverage |
| Native Born | 15 (100.0%) | 0 (0.0%) |
| Foreign Born, Citizen | 46 (54.8%) | 38 (45.2%) |
| Foreign Born, not a Citizen | 0 (0.0%) | 0 (0.0%) |
Health Insurance Coverage by Household Income in Grimes
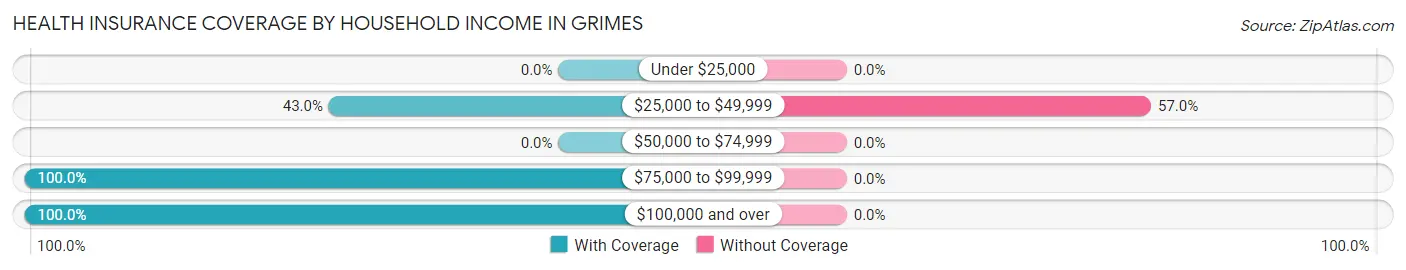
| Household Income | With Coverage | Without Coverage |
| Under $25,000 | 0 (0.0%) | 0 (0.0%) |
| $25,000 to $49,999 | 89 (43.0%) | 118 (57.0%) |
| $50,000 to $74,999 | 0 (0.0%) | 0 (0.0%) |
| $75,000 to $99,999 | 121 (100.0%) | 0 (0.0%) |
| $100,000 and over | 27 (100.0%) | 0 (0.0%) |
Public vs Private Health Insurance Coverage by Age in Grimes
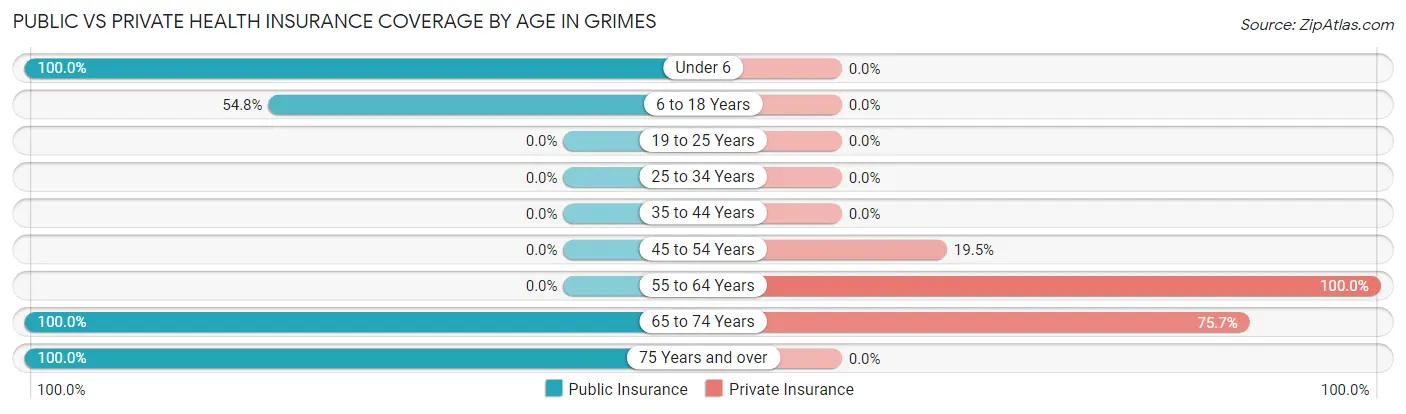
| Age Bracket | Public Insurance | Private Insurance |
| Under 6 | 15 (100.0%) | 0 (0.0%) |
| 6 to 18 Years | 46 (54.8%) | 0 (0.0%) |
| 19 to 25 Years | 0 (0.0%) | 0 (0.0%) |
| 25 to 34 Years | 0 (0.0%) | 0 (0.0%) |
| 35 to 44 Years | 0 (0.0%) | 0 (0.0%) |
| 45 to 54 Years | 0 (0.0%) | 8 (19.5%) |
| 55 to 64 Years | 0 (0.0%) | 104 (100.0%) |
| 65 to 74 Years | 37 (100.0%) | 28 (75.7%) |
| 75 Years and over | 27 (100.0%) | 0 (0.0%) |
| Total | 125 (35.2%) | 140 (39.4%) |
Disability Status by Sex by Age in Grimes
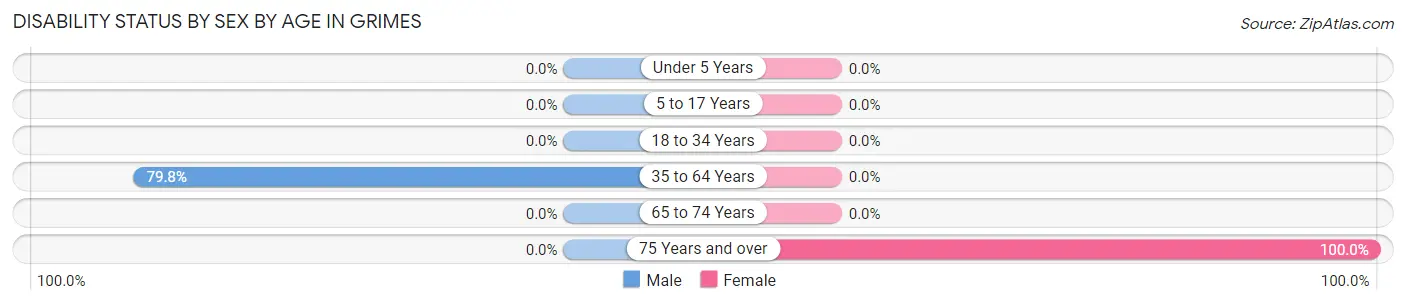
| Age Bracket | Male | Female |
| Under 5 Years | 0 (0.0%) | 0 (0.0%) |
| 5 to 17 Years | 0 (0.0%) | 0 (0.0%) |
| 18 to 34 Years | 0 (0.0%) | 0 (0.0%) |
| 35 to 64 Years | 67 (79.8%) | 0 (0.0%) |
| 65 to 74 Years | 0 (0.0%) | 0 (0.0%) |
| 75 Years and over | 0 (0.0%) | 17 (100.0%) |
Disability Class by Sex by Age in Grimes
Disability Class: Hearing Difficulty
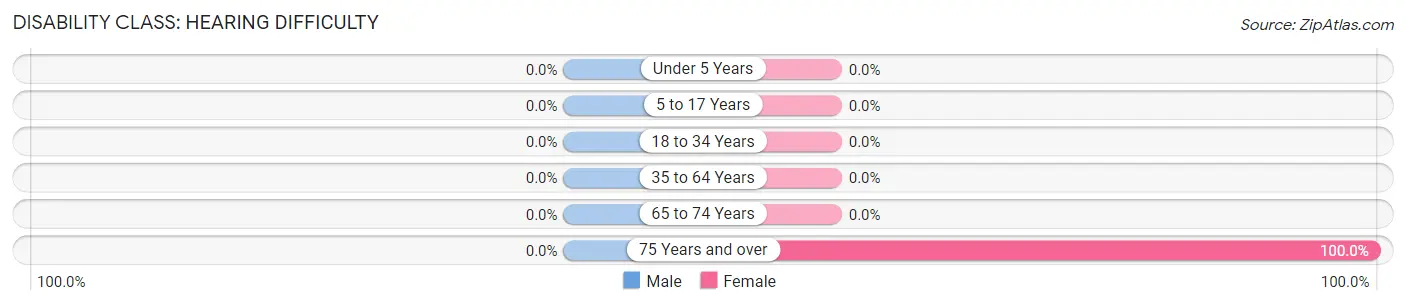
| Age Bracket | Male | Female |
| Under 5 Years | 0 (0.0%) | 0 (0.0%) |
| 5 to 17 Years | 0 (0.0%) | 0 (0.0%) |
| 18 to 34 Years | 0 (0.0%) | 0 (0.0%) |
| 35 to 64 Years | 0 (0.0%) | 0 (0.0%) |
| 65 to 74 Years | 0 (0.0%) | 0 (0.0%) |
| 75 Years and over | 0 (0.0%) | 17 (100.0%) |
Disability Class: Vision Difficulty
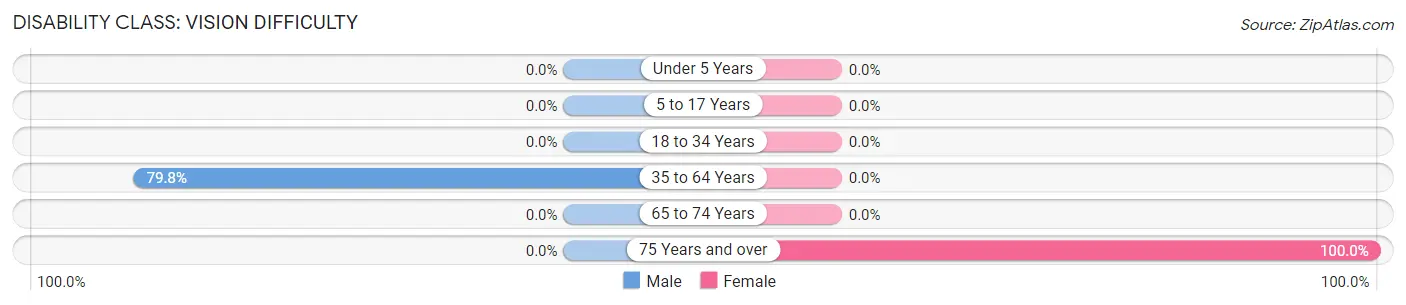
| Age Bracket | Male | Female |
| Under 5 Years | 0 (0.0%) | 0 (0.0%) |
| 5 to 17 Years | 0 (0.0%) | 0 (0.0%) |
| 18 to 34 Years | 0 (0.0%) | 0 (0.0%) |
| 35 to 64 Years | 67 (79.8%) | 0 (0.0%) |
| 65 to 74 Years | 0 (0.0%) | 0 (0.0%) |
| 75 Years and over | 0 (0.0%) | 17 (100.0%) |
Disability Class: Cognitive Difficulty
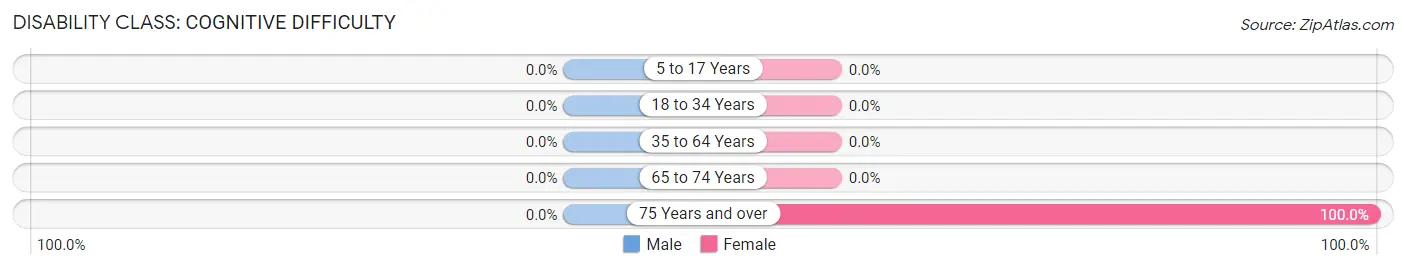
| Age Bracket | Male | Female |
| 5 to 17 Years | 0 (0.0%) | 0 (0.0%) |
| 18 to 34 Years | 0 (0.0%) | 0 (0.0%) |
| 35 to 64 Years | 0 (0.0%) | 0 (0.0%) |
| 65 to 74 Years | 0 (0.0%) | 0 (0.0%) |
| 75 Years and over | 0 (0.0%) | 17 (100.0%) |
Disability Class: Ambulatory Difficulty
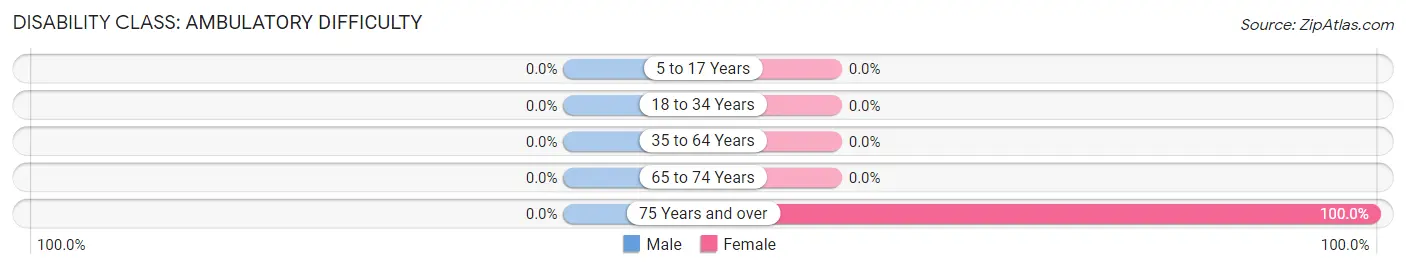
| Age Bracket | Male | Female |
| 5 to 17 Years | 0 (0.0%) | 0 (0.0%) |
| 18 to 34 Years | 0 (0.0%) | 0 (0.0%) |
| 35 to 64 Years | 0 (0.0%) | 0 (0.0%) |
| 65 to 74 Years | 0 (0.0%) | 0 (0.0%) |
| 75 Years and over | 0 (0.0%) | 17 (100.0%) |
Disability Class: Self-Care Difficulty
| Age Bracket | Male | Female |
| 5 to 17 Years | 0 (0.0%) | 0 (0.0%) |
| 18 to 34 Years | 0 (0.0%) | 0 (0.0%) |
| 35 to 64 Years | 0 (0.0%) | 0 (0.0%) |
| 65 to 74 Years | 0 (0.0%) | 0 (0.0%) |
| 75 Years and over | 0 (0.0%) | 0 (0.0%) |
Technology Access in Grimes
Computing Device Access in Grimes
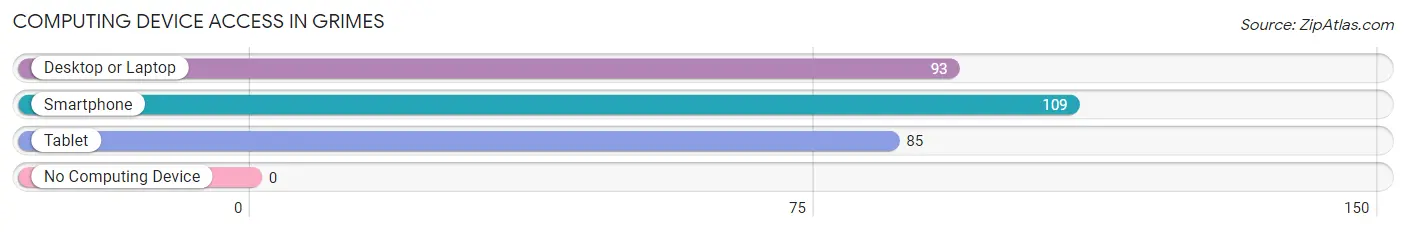
| Device Type | # Households | % Households |
| Desktop or Laptop | 93 | 85.3% |
| Smartphone | 109 | 100.0% |
| Tablet | 85 | 78.0% |
| No Computing Device | 0 | 0.0% |
| Total | 109 | 100.0% |
Internet Access in Grimes
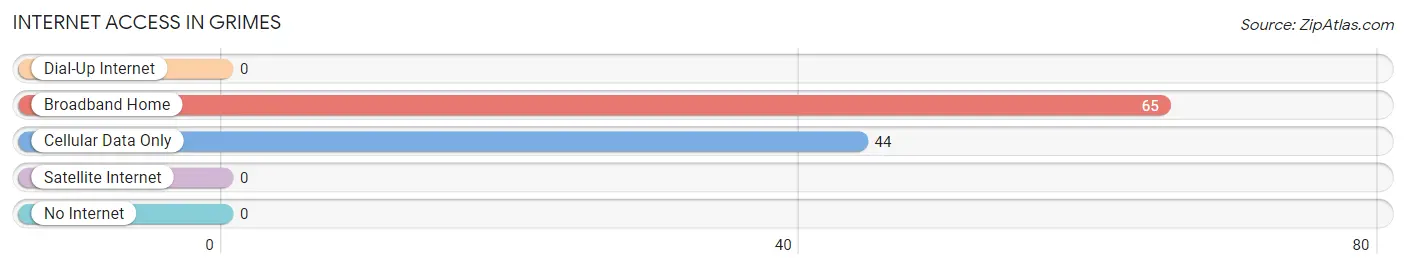
| Internet Type | # Households | % Households |
| Dial-Up Internet | 0 | 0.0% |
| Broadband Home | 65 | 59.6% |
| Cellular Data Only | 44 | 40.4% |
| Satellite Internet | 0 | 0.0% |
| No Internet | 0 | 0.0% |
| Total | 109 | 100.0% |
Grimes Summary
Grimes is a small unincorporated community located in the Central Valley of California, in the county of Colusa. It is situated about halfway between the cities of Sacramento and Chico, and is approximately 40 miles from the state capital of Sacramento. The population of Grimes was estimated to be around 1,000 people in 2020.
History
Grimes was founded in 1851 by a group of settlers from the Midwest. The settlers were attracted to the area due to its fertile soil and abundant water supply. The town was named after the Grimes family, who were among the first settlers. The town quickly grew and by the late 1800s, it had become a thriving agricultural community.
Grimes was a major stop on the Central Pacific Railroad, which connected the Central Valley to the Bay Area. The railroad brought in new settlers and businesses, and the town continued to grow. In the early 1900s, the town was home to a number of businesses, including a hotel, a general store, a blacksmith shop, and a post office.
Geography
Grimes is located in the Central Valley of California, in the county of Colusa. It is situated about halfway between the cities of Sacramento and Chico, and is approximately 40 miles from the state capital of Sacramento. The town is situated on the banks of the Sacramento River, and is surrounded by rolling hills and farmland.
The climate in Grimes is generally mild, with hot summers and cool winters. The average annual temperature is around 70 degrees Fahrenheit, and the average annual precipitation is around 20 inches.
Economy
Grimes is primarily an agricultural community, and the main crops grown in the area are rice, tomatoes, and almonds. The town is also home to a number of small businesses, including a grocery store, a hardware store, and a few restaurants.
Demographics
As of 2020, the population of Grimes was estimated to be around 1,000 people. The racial makeup of the town is predominantly white (90%), with the remaining population being made up of Hispanic (5%), African American (2%), and Asian (3%) residents. The median household income in Grimes is around $50,000, and the median home value is around $200,000.
Conclusion
Grimes is a small unincorporated community located in the Central Valley of California, in the county of Colusa. It is situated about halfway between the cities of Sacramento and Chico, and is approximately 40 miles from the state capital of Sacramento. The town is primarily an agricultural community, and the main crops grown in the area are rice, tomatoes, and almonds. The population of Grimes was estimated to be around 1,000 people in 2020, and the racial makeup of the town is predominantly white. The median household income in Grimes is around $50,000, and the median home value is around $200,000.
Common Questions
What is Per Capita Income in Grimes?
Per Capita income in Grimes is $24,779.
What is the Median Family Income in Grimes?
Median Family Income in Grimes is $75,439.
What is Income or Wage Gap in Grimes?
Income or Wage Gap in Grimes is 22.2%.
Women in Grimes earn 77.8 cents for every dollar earned by a man.
What is Inequality or Gini Index in Grimes?
Inequality or Gini Index in Grimes is 0.39.
What is the Total Population of Grimes?
Total Population of Grimes is 355.
What is the Total Male Population of Grimes?
Total Male Population of Grimes is 176.
What is the Total Female Population of Grimes?
Total Female Population of Grimes is 179.
What is the Ratio of Males per 100 Females in Grimes?
There are 98.32 Males per 100 Females in Grimes.
What is the Ratio of Females per 100 Males in Grimes?
There are 101.70 Females per 100 Males in Grimes.
What is the Median Population Age in Grimes?
Median Population Age in Grimes is 53.6 Years.
What is the Average Family Size in Grimes
Average Family Size in Grimes is 3.8 People.
What is the Average Household Size in Grimes
Average Household Size in Grimes is 3.3 People.
How Large is the Labor Force in Grimes?
There are 183 People in the Labor Forcein in Grimes.
What is the Percentage of People in the Labor Force in Grimes?
68.5% of People are in the Labor Force in Grimes.
What is the Unemployment Rate in Grimes?
Unemployment Rate in Grimes is 14.2%.