Zip Codes with the Highest Percentage of Population Employed in Transportation & Warehousing in Grass Valley, CA
RELATED REPORTS & OPTIONS
Transportation & Warehousing
Grass Valley
Compare Zip Codes
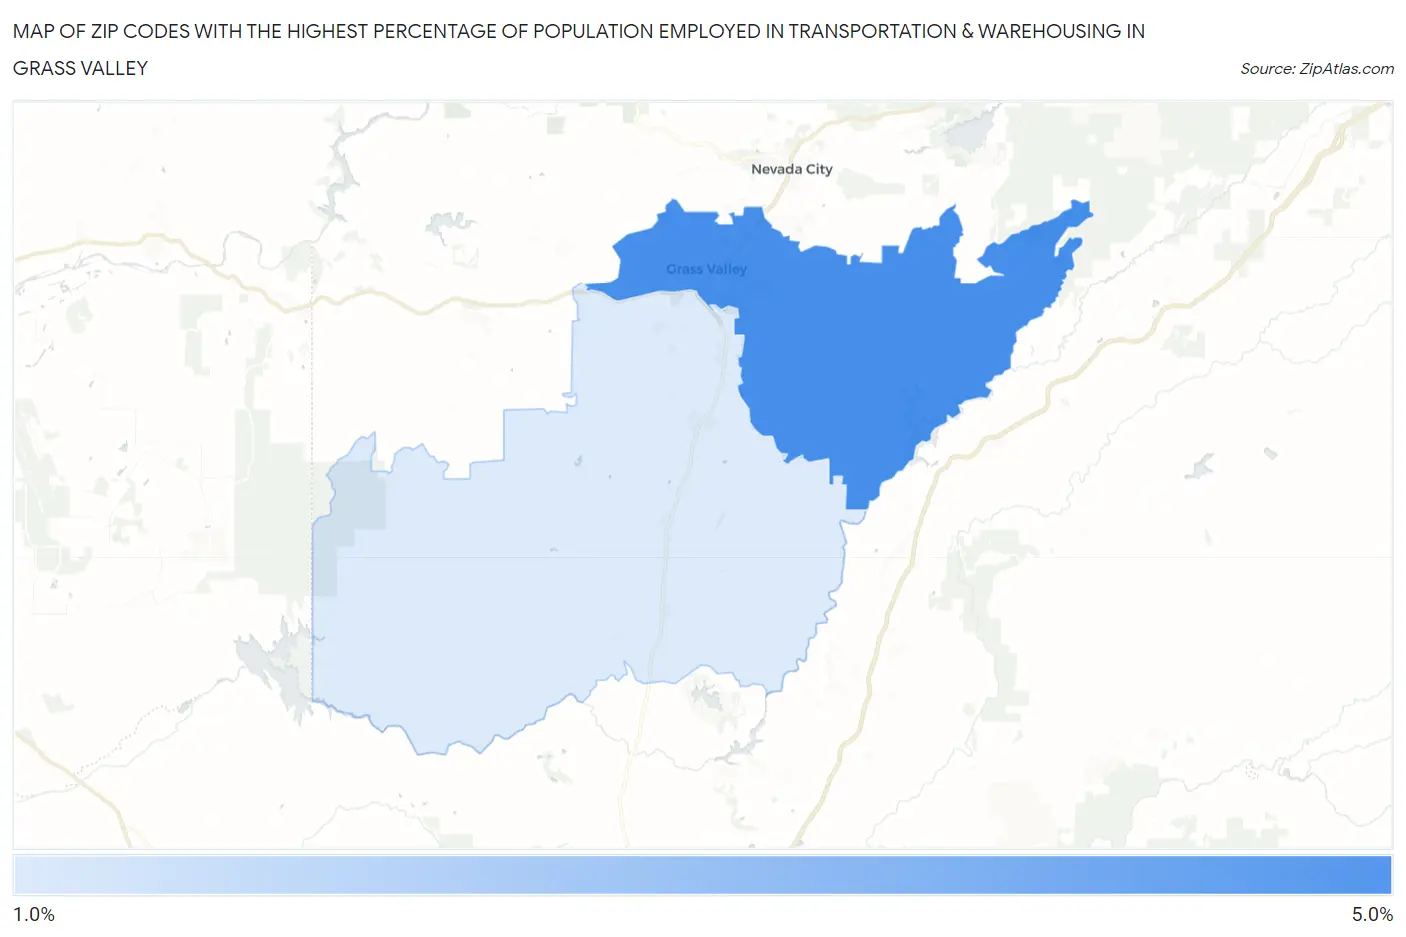
Map of Zip Codes with the Highest Percentage of Population Employed in Transportation & Warehousing in Grass Valley
1.9%
4.7%
Zip Codes with the Highest Percentage of Population Employed in Transportation & Warehousing in Grass Valley, CA
| Zip Code | % Employed | vs State | vs National | |
| 1. | 95945 | 4.7% | 5.1%(-0.446)#615 | 4.9%(-0.261)#13,080 |
| 2. | 95949 | 1.9% | 5.1%(-3.23)#1,271 | 4.9%(-3.05)#24,616 |
1
Common Questions
What are the Top Zip Codes with the Highest Percentage of Population Employed in Transportation & Warehousing in Grass Valley, CA?
Top Zip Codes with the Highest Percentage of Population Employed in Transportation & Warehousing in Grass Valley, CA are:
What zip code has the Highest Percentage of Population Employed in Transportation & Warehousing in Grass Valley, CA?
95945 has the Highest Percentage of Population Employed in Transportation & Warehousing in Grass Valley, CA with 4.7%.
What is the Percentage of Population Employed in Transportation & Warehousing in Grass Valley, CA?
Percentage of Population Employed in Transportation & Warehousing in Grass Valley is 6.4%.
What is the Percentage of Population Employed in Transportation & Warehousing in California?
Percentage of Population Employed in Transportation & Warehousing in California is 5.1%.
What is the Percentage of Population Employed in Transportation & Warehousing in the United States?
Percentage of Population Employed in Transportation & Warehousing in the United States is 4.9%.