Zip Codes with the Highest Percentage of Population Employed in Arts, Entertainment & Recreation in Grass Valley, CA
RELATED REPORTS & OPTIONS
Arts, Entertainment & Recreation
Grass Valley
Compare Zip Codes
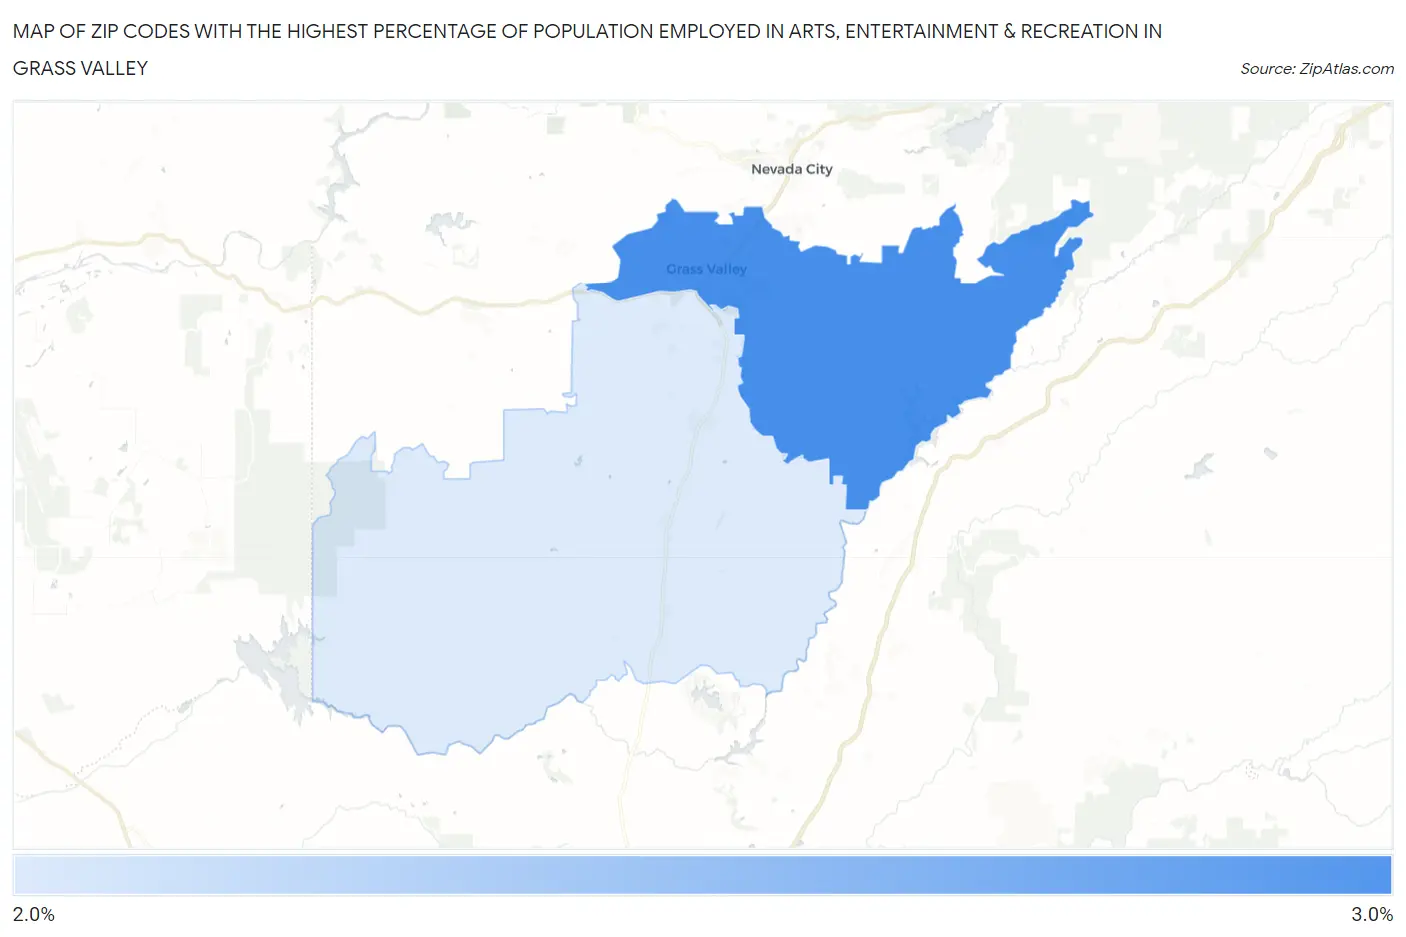
Map of Zip Codes with the Highest Percentage of Population Employed in Arts, Entertainment & Recreation in Grass Valley
0.0%
3.0%
Zip Codes with the Highest Percentage of Population Employed in Arts, Entertainment & Recreation in Grass Valley, CA
| Zip Code | % Employed | vs State | vs National | |
| 1. | 95945 | 2.6% | 2.6%(+0.053)#632 | 2.1%(+0.524)#6,733 |
| 2. | 95949 | 2.1% | 2.6%(-0.486)#890 | 2.1%(-0.015)#9,380 |
1
Common Questions
What are the Top Zip Codes with the Highest Percentage of Population Employed in Arts, Entertainment & Recreation in Grass Valley, CA?
Top Zip Codes with the Highest Percentage of Population Employed in Arts, Entertainment & Recreation in Grass Valley, CA are:
What zip code has the Highest Percentage of Population Employed in Arts, Entertainment & Recreation in Grass Valley, CA?
95945 has the Highest Percentage of Population Employed in Arts, Entertainment & Recreation in Grass Valley, CA with 2.6%.
What is the Percentage of Population Employed in Arts, Entertainment & Recreation in Grass Valley, CA?
Percentage of Population Employed in Arts, Entertainment & Recreation in Grass Valley is 2.5%.
What is the Percentage of Population Employed in Arts, Entertainment & Recreation in California?
Percentage of Population Employed in Arts, Entertainment & Recreation in California is 2.6%.
What is the Percentage of Population Employed in Arts, Entertainment & Recreation in the United States?
Percentage of Population Employed in Arts, Entertainment & Recreation in the United States is 2.1%.