Granite Bay, CA Map & Demographics
Granite Bay Map
Granite Bay Overview
$82,448
PER CAPITA INCOME
$203,929
AVG FAMILY INCOME
$177,803
AVG HOUSEHOLD INCOME
52.8%
WAGE / INCOME GAP [ % ]
47.2¢/ $1
WAGE / INCOME GAP [ $ ]
0.46
INEQUALITY / GINI INDEX
22,180
TOTAL POPULATION
11,082
MALE POPULATION
11,098
FEMALE POPULATION
99.86
MALES / 100 FEMALES
100.14
FEMALES / 100 MALES
47.7
MEDIAN AGE
3.1
AVG FAMILY SIZE
2.9
AVG HOUSEHOLD SIZE
10,410
LABOR FORCE [ PEOPLE ]
58.6%
PERCENT IN LABOR FORCE
3.9%
UNEMPLOYMENT RATE
Granite Bay Zip Codes
Income in Granite Bay
Income Overview in Granite Bay
Per Capita Income in Granite Bay is $82,448, while median incomes of families and households are $203,929 and $177,803 respectively.
| Characteristic | Number | Measure |
| Per Capita Income | 22,180 | $82,448 |
| Median Family Income | 6,486 | $203,929 |
| Mean Family Income | 6,486 | $256,722 |
| Median Household Income | 7,731 | $177,803 |
| Mean Household Income | 7,731 | $231,869 |
| Income Deficit | 6,486 | $0 |
| Wage / Income Gap (%) | 22,180 | 52.78% |
| Wage / Income Gap ($) | 22,180 | 47.22¢ per $1 |
| Gini / Inequality Index | 22,180 | 0.46 |
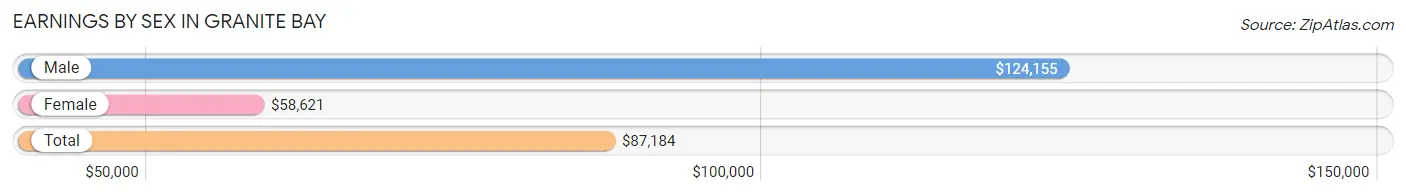
Earnings by Sex in Granite Bay
Average Earnings in Granite Bay are $87,184, $124,155 for men and $58,621 for women, a difference of 52.8%.
| Sex | Number | Average Earnings |
| Male | 5,769 (53.6%) | $124,155 |
| Female | 4,992 (46.4%) | $58,621 |
| Total | 10,761 (100.0%) | $87,184 |
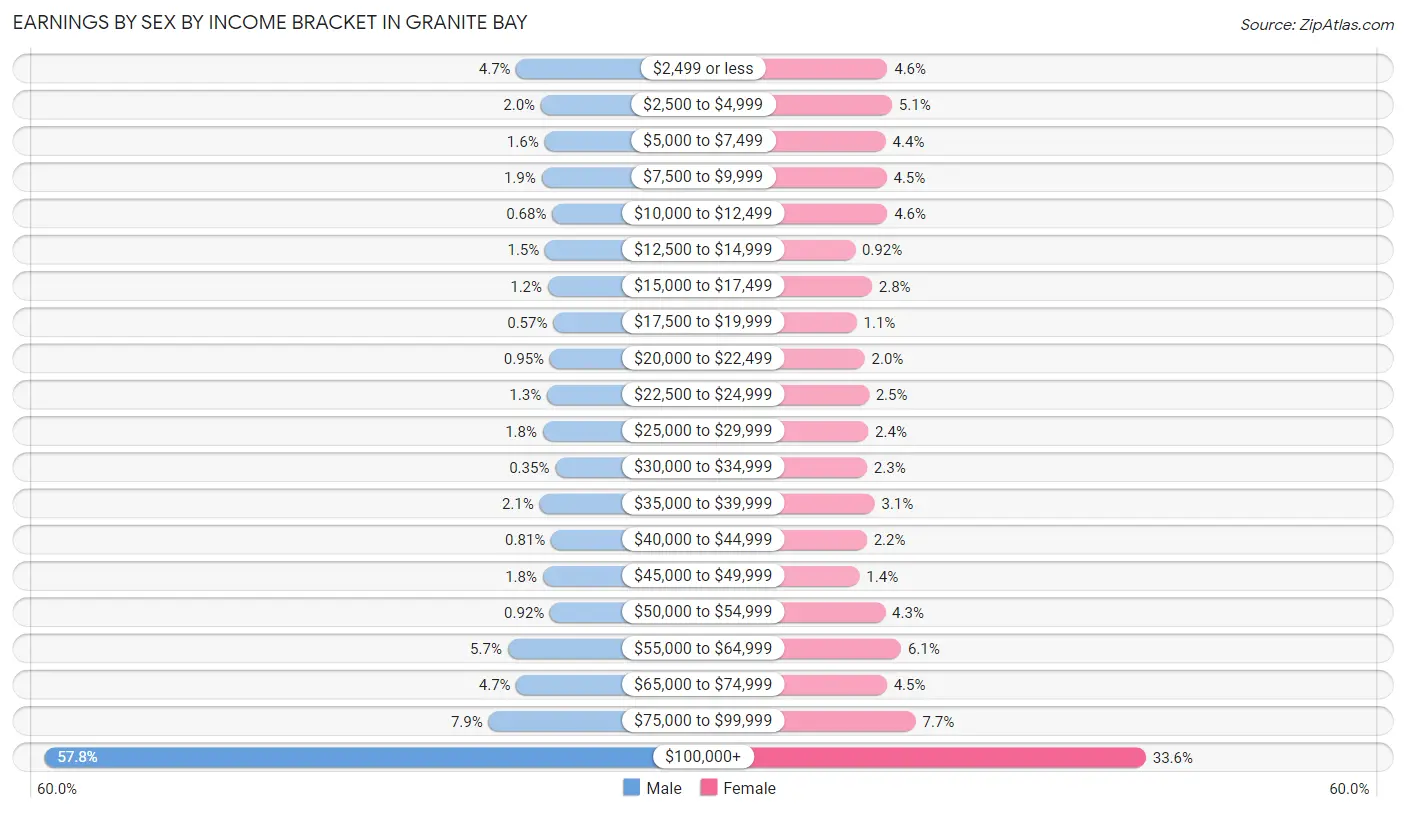
Earnings by Sex by Income Bracket in Granite Bay
The most common earnings brackets in Granite Bay are $100,000+ for men (3,333 | 57.8%) and $100,000+ for women (1,678 | 33.6%).
| Income | Male | Female |
| $2,499 or less | 272 (4.7%) | 227 (4.5%) |
| $2,500 to $4,999 | 113 (2.0%) | 253 (5.1%) |
| $5,000 to $7,499 | 90 (1.6%) | 218 (4.4%) |
| $7,500 to $9,999 | 109 (1.9%) | 223 (4.5%) |
| $10,000 to $12,499 | 39 (0.7%) | 227 (4.5%) |
| $12,500 to $14,999 | 86 (1.5%) | 46 (0.9%) |
| $15,000 to $17,499 | 68 (1.2%) | 141 (2.8%) |
| $17,500 to $19,999 | 33 (0.6%) | 55 (1.1%) |
| $20,000 to $22,499 | 55 (0.9%) | 100 (2.0%) |
| $22,500 to $24,999 | 74 (1.3%) | 123 (2.5%) |
| $25,000 to $29,999 | 101 (1.8%) | 120 (2.4%) |
| $30,000 to $34,999 | 20 (0.4%) | 113 (2.3%) |
| $35,000 to $39,999 | 122 (2.1%) | 156 (3.1%) |
| $40,000 to $44,999 | 47 (0.8%) | 112 (2.2%) |
| $45,000 to $49,999 | 101 (1.8%) | 71 (1.4%) |
| $50,000 to $54,999 | 53 (0.9%) | 215 (4.3%) |
| $55,000 to $64,999 | 328 (5.7%) | 304 (6.1%) |
| $65,000 to $74,999 | 272 (4.7%) | 224 (4.5%) |
| $75,000 to $99,999 | 453 (7.9%) | 386 (7.7%) |
| $100,000+ | 3,333 (57.8%) | 1,678 (33.6%) |
| Total | 5,769 (100.0%) | 4,992 (100.0%) |
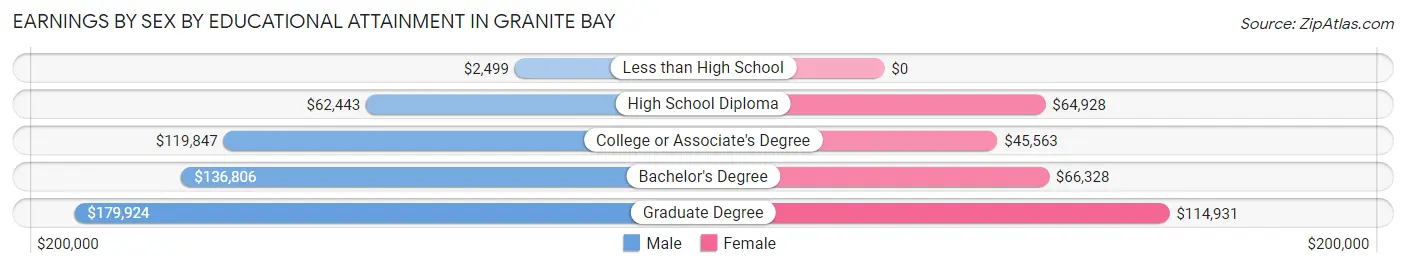
Earnings by Sex by Educational Attainment in Granite Bay
Average earnings in Granite Bay are $135,389 for men and $68,426 for women, a difference of 49.5%. Men with an educational attainment of graduate degree enjoy the highest average annual earnings of $179,924, while those with less than high school education earn the least with $2,499. Women with an educational attainment of graduate degree earn the most with the average annual earnings of $114,931, while those with college or associate's degree education have the smallest earnings of $45,563.
| Educational Attainment | Male Income | Female Income |
| Less than High School | $2,499 | $0 |
| High School Diploma | $62,443 | $64,928 |
| College or Associate's Degree | $119,847 | $45,563 |
| Bachelor's Degree | $136,806 | $66,328 |
| Graduate Degree | $179,924 | $114,931 |
| Total | $135,389 | $68,426 |
Family Income in Granite Bay
Family Income Brackets in Granite Bay
According to the Granite Bay family income data, there are 3,308 families falling into the $200,000+ income range, which is the most common income bracket and makes up 51.0% of all families. Conversely, the $10,000 to $14,999 income bracket is the least frequent group with only 52 families (0.8%) belonging to this category.
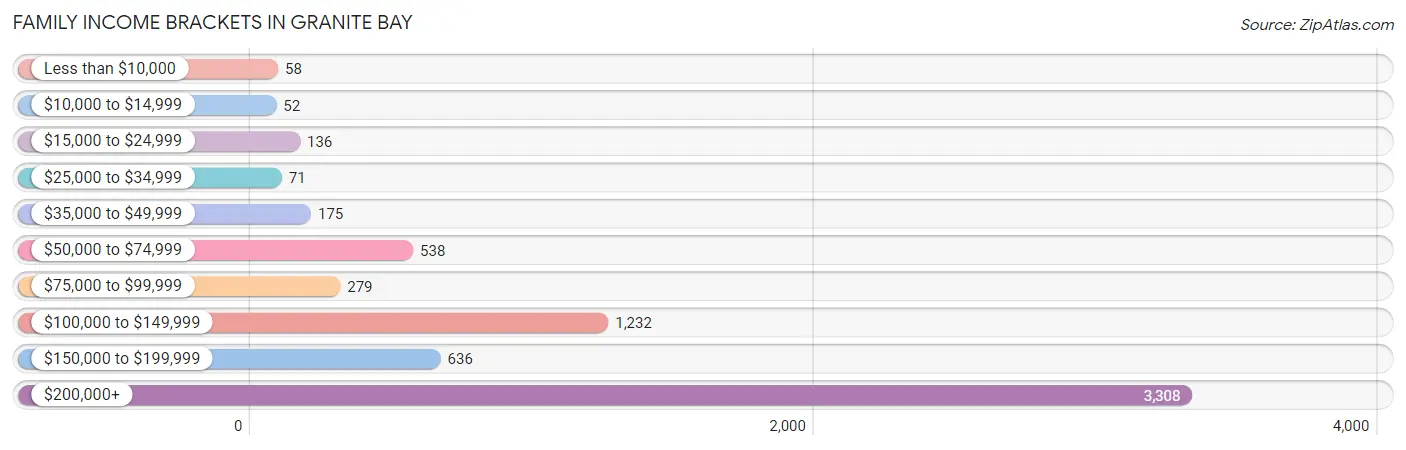
| Income Bracket | # Families | % Families |
| Less than $10,000 | 58 | 0.9% |
| $10,000 to $14,999 | 52 | 0.8% |
| $15,000 to $24,999 | 136 | 2.1% |
| $25,000 to $34,999 | 71 | 1.1% |
| $35,000 to $49,999 | 175 | 2.7% |
| $50,000 to $74,999 | 538 | 8.3% |
| $75,000 to $99,999 | 279 | 4.3% |
| $100,000 to $149,999 | 1,232 | 19.0% |
| $150,000 to $199,999 | 636 | 9.8% |
| $200,000+ | 3,308 | 51.0% |
Family Income by Famaliy Size in Granite Bay
5-person families (458 | 7.1%) account for the highest median family income in Granite Bay with $250,001 per family, while 3-person families (1,650 | 25.4%) have the highest median income of $75,417 per family member.
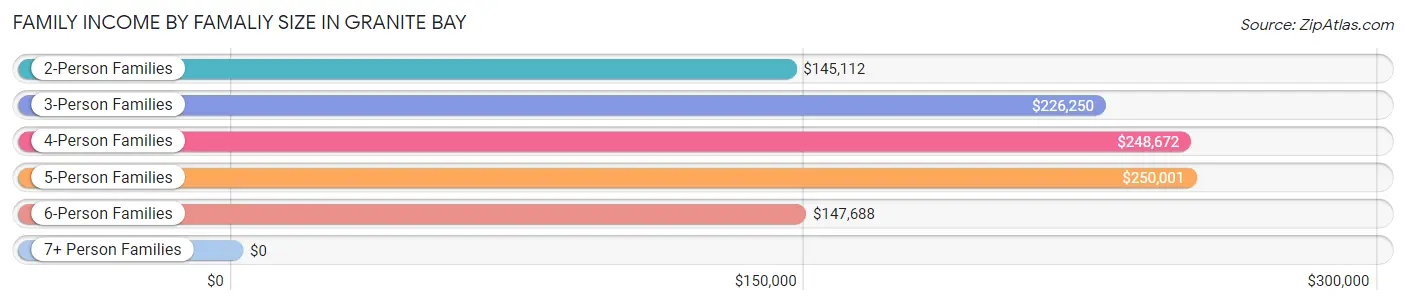
| Income Bracket | # Families | Median Income |
| 2-Person Families | 2,764 (42.6%) | $145,112 |
| 3-Person Families | 1,650 (25.4%) | $226,250 |
| 4-Person Families | 1,413 (21.8%) | $248,672 |
| 5-Person Families | 458 (7.1%) | $250,001 |
| 6-Person Families | 171 (2.6%) | $147,688 |
| 7+ Person Families | 30 (0.5%) | $0 |
| Total | 6,486 (100.0%) | $203,929 |
Family Income by Number of Earners in Granite Bay
The median family income in Granite Bay is $203,929, with families comprising 2 earners (2,739) having the highest median family income of $250,001, while families with no earners (1,056) have the lowest median family income of $99,934, accounting for 42.2% and 16.3% of families, respectively.
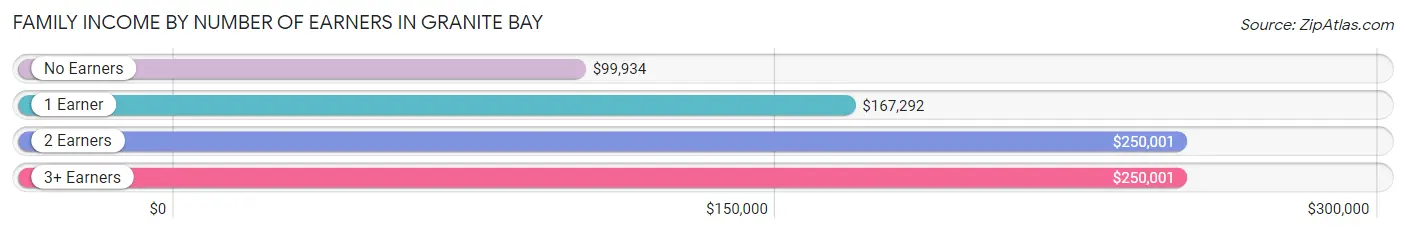
| Number of Earners | # Families | Median Income |
| No Earners | 1,056 (16.3%) | $99,934 |
| 1 Earner | 2,046 (31.5%) | $167,292 |
| 2 Earners | 2,739 (42.2%) | $250,001 |
| 3+ Earners | 645 (9.9%) | $250,001 |
| Total | 6,486 (100.0%) | $203,929 |
Household Income in Granite Bay
Household Income Brackets in Granite Bay
With 3,525 households falling in the category, the $200,000+ income range is the most frequent in Granite Bay, accounting for 45.6% of all households. In contrast, only 70 households (0.9%) fall into the $10,000 to $14,999 income bracket, making it the least populous group.
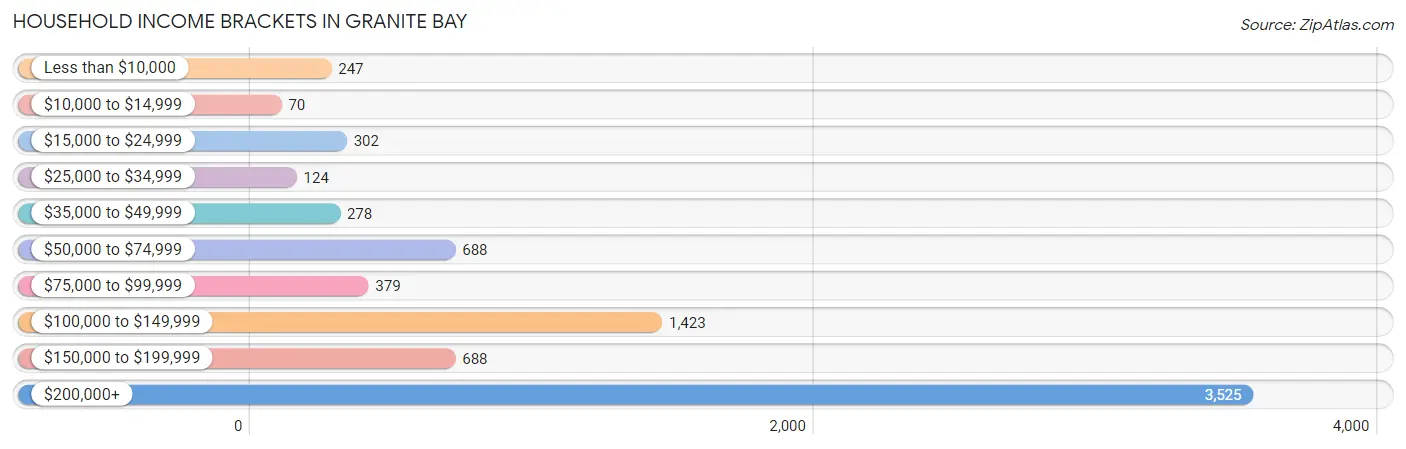
| Income Bracket | # Households | % Households |
| Less than $10,000 | 247 | 3.2% |
| $10,000 to $14,999 | 70 | 0.9% |
| $15,000 to $24,999 | 302 | 3.9% |
| $25,000 to $34,999 | 124 | 1.6% |
| $35,000 to $49,999 | 278 | 3.6% |
| $50,000 to $74,999 | 688 | 8.9% |
| $75,000 to $99,999 | 379 | 4.9% |
| $100,000 to $149,999 | 1,423 | 18.4% |
| $150,000 to $199,999 | 688 | 8.9% |
| $200,000+ | 3,525 | 45.6% |
Household Income by Householder Age in Granite Bay
The median household income in Granite Bay is $177,803, with the highest median household income of $238,750 found in the 25 to 44 years age bracket for the primary householder. A total of 1,313 households (17.0%) fall into this category. Meanwhile, the 15 to 24 years age bracket for the primary householder has the lowest median household income of $0, with 38 households (0.5%) in this group.
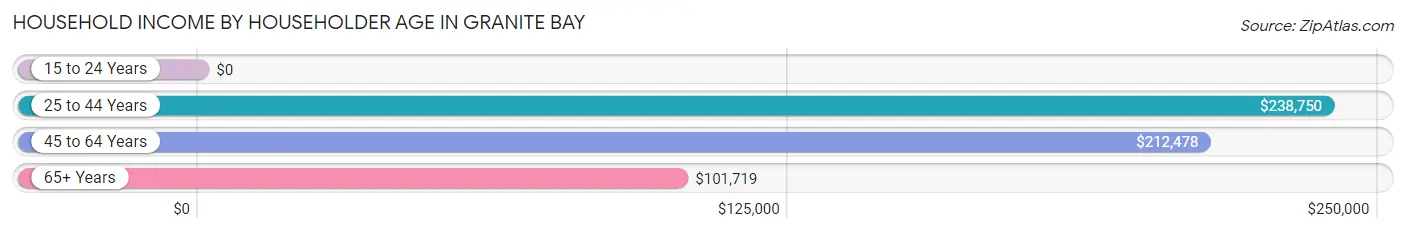
| Income Bracket | # Households | Median Income |
| 15 to 24 Years | 38 (0.5%) | $0 |
| 25 to 44 Years | 1,313 (17.0%) | $238,750 |
| 45 to 64 Years | 3,656 (47.3%) | $212,478 |
| 65+ Years | 2,724 (35.2%) | $101,719 |
| Total | 7,731 (100.0%) | $177,803 |
Poverty in Granite Bay
Income Below Poverty by Sex and Age in Granite Bay
With 5.1% poverty level for males and 4.8% for females among the residents of Granite Bay, 16 and 17 year old males and 12 to 14 year old females are the most vulnerable to poverty, with 70 males (15.6%) and 79 females (11.5%) in their respective age groups living below the poverty level.
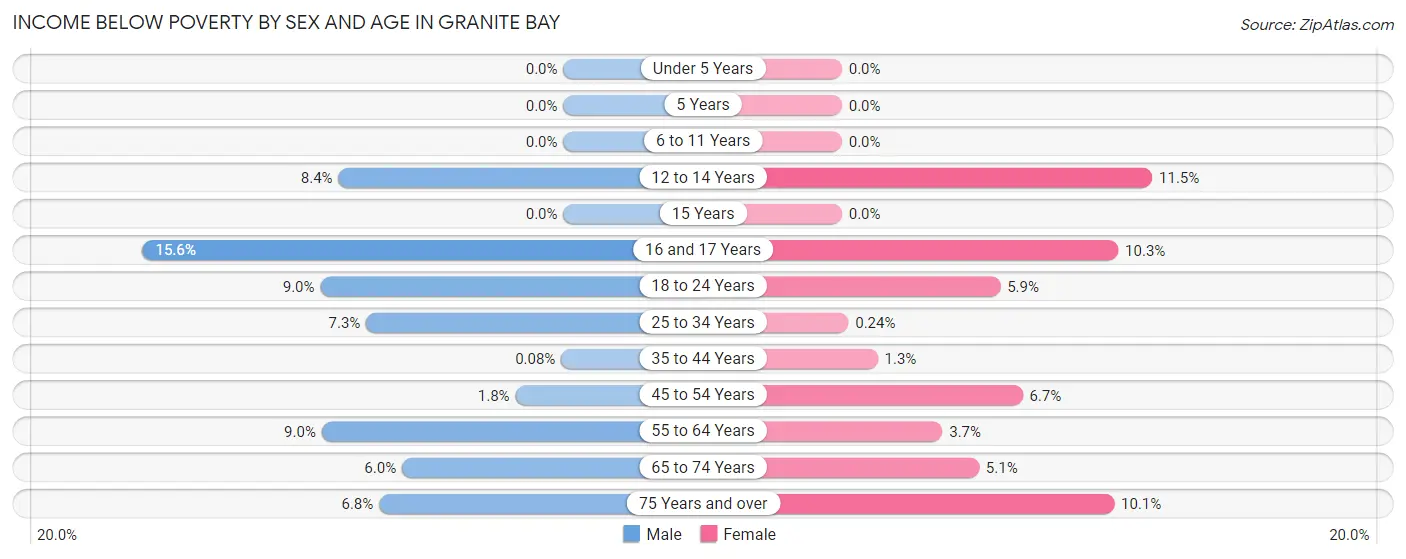
| Age Bracket | Male | Female |
| Under 5 Years | 0 (0.0%) | 0 (0.0%) |
| 5 Years | 0 (0.0%) | 0 (0.0%) |
| 6 to 11 Years | 0 (0.0%) | 0 (0.0%) |
| 12 to 14 Years | 38 (8.4%) | 79 (11.5%) |
| 15 Years | 0 (0.0%) | 0 (0.0%) |
| 16 and 17 Years | 70 (15.6%) | 32 (10.3%) |
| 18 to 24 Years | 62 (9.0%) | 56 (5.9%) |
| 25 to 34 Years | 36 (7.3%) | 1 (0.2%) |
| 35 to 44 Years | 1 (0.1%) | 19 (1.3%) |
| 45 to 54 Years | 31 (1.8%) | 110 (6.7%) |
| 55 to 64 Years | 175 (9.0%) | 64 (3.7%) |
| 65 to 74 Years | 93 (6.0%) | 67 (5.1%) |
| 75 Years and over | 61 (6.8%) | 102 (10.1%) |
| Total | 567 (5.1%) | 530 (4.8%) |
Income Above Poverty by Sex and Age in Granite Bay
According to the poverty statistics in Granite Bay, males aged under 5 years and females aged under 5 years are the age groups that are most secure financially, with 100.0% of males and 100.0% of females in these age groups living above the poverty line.
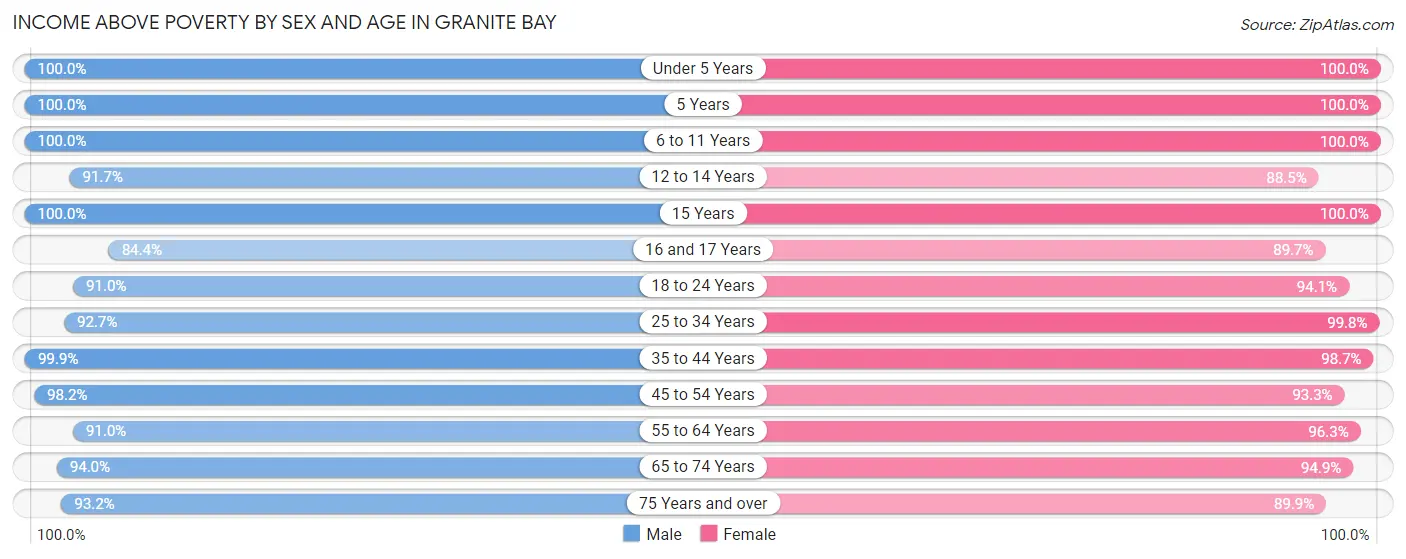
| Age Bracket | Male | Female |
| Under 5 Years | 351 (100.0%) | 448 (100.0%) |
| 5 Years | 89 (100.0%) | 112 (100.0%) |
| 6 to 11 Years | 990 (100.0%) | 676 (100.0%) |
| 12 to 14 Years | 417 (91.6%) | 607 (88.5%) |
| 15 Years | 206 (100.0%) | 320 (100.0%) |
| 16 and 17 Years | 378 (84.4%) | 280 (89.7%) |
| 18 to 24 Years | 625 (91.0%) | 897 (94.1%) |
| 25 to 34 Years | 456 (92.7%) | 414 (99.8%) |
| 35 to 44 Years | 1,176 (99.9%) | 1,408 (98.7%) |
| 45 to 54 Years | 1,715 (98.2%) | 1,530 (93.3%) |
| 55 to 64 Years | 1,776 (91.0%) | 1,652 (96.3%) |
| 65 to 74 Years | 1,460 (94.0%) | 1,250 (94.9%) |
| 75 Years and over | 831 (93.2%) | 907 (89.9%) |
| Total | 10,470 (94.9%) | 10,501 (95.2%) |
Income Below Poverty Among Married-Couple Families in Granite Bay
The poverty statistics for married-couple families in Granite Bay show that 2.7% or 155 of the total 5,782 families live below the poverty line. Families with no children have the highest poverty rate of 2.9%, comprising of 96 families. On the other hand, families with 3 or 4 children have the lowest poverty rate of 0.0%, which includes 0 families.
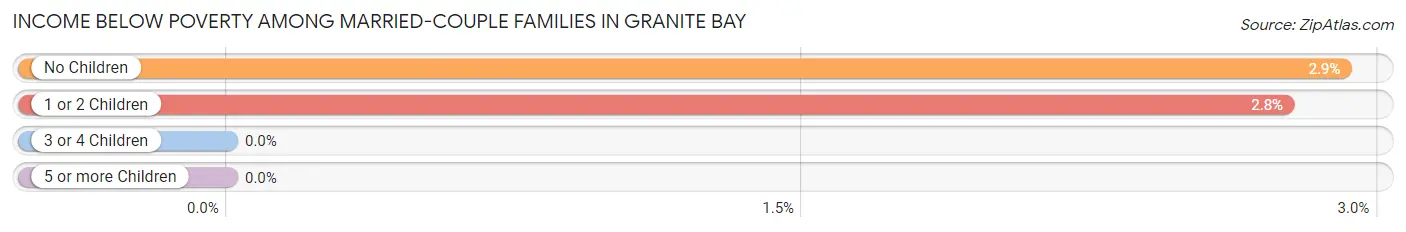
| Children | Above Poverty | Below Poverty |
| No Children | 3,206 (97.1%) | 96 (2.9%) |
| 1 or 2 Children | 2,077 (97.2%) | 59 (2.8%) |
| 3 or 4 Children | 337 (100.0%) | 0 (0.0%) |
| 5 or more Children | 7 (100.0%) | 0 (0.0%) |
| Total | 5,627 (97.3%) | 155 (2.7%) |
Income Below Poverty Among Single-Parent Households in Granite Bay
According to the poverty data in Granite Bay, 7.0% or 22 single-father households and 10.3% or 40 single-mother households are living below the poverty line. Among single-father households, those with 1 or 2 children have the highest poverty rate, with 22 households (21.6%) experiencing poverty. Likewise, among single-mother households, those with 1 or 2 children have the highest poverty rate, with 25 households (12.9%) falling below the poverty line.
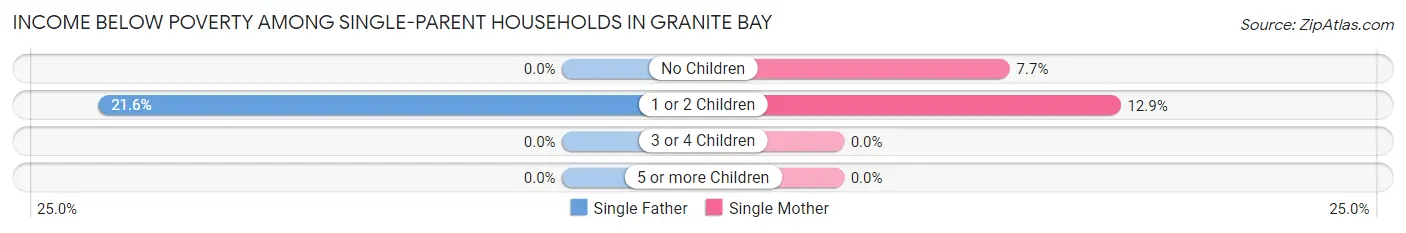
| Children | Single Father | Single Mother |
| No Children | 0 (0.0%) | 15 (7.7%) |
| 1 or 2 Children | 22 (21.6%) | 25 (12.9%) |
| 3 or 4 Children | 0 (0.0%) | 0 (0.0%) |
| 5 or more Children | 0 (0.0%) | 0 (0.0%) |
| Total | 22 (7.0%) | 40 (10.3%) |
Income Below Poverty Among Married-Couple vs Single-Parent Households in Granite Bay
The poverty data for Granite Bay shows that 155 of the married-couple family households (2.7%) and 62 of the single-parent households (8.8%) are living below the poverty level. Within the married-couple family households, those with no children have the highest poverty rate, with 96 households (2.9%) falling below the poverty line. Among the single-parent households, those with 1 or 2 children have the highest poverty rate, with 47 household (15.9%) living below poverty.
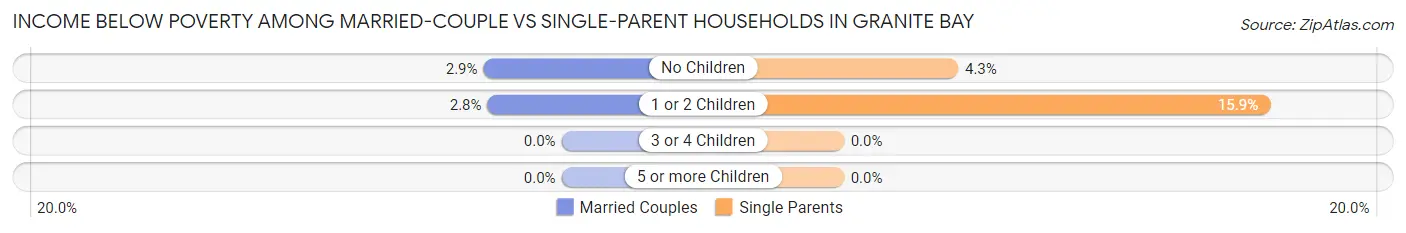
| Children | Married-Couple Families | Single-Parent Households |
| No Children | 96 (2.9%) | 15 (4.3%) |
| 1 or 2 Children | 59 (2.8%) | 47 (15.9%) |
| 3 or 4 Children | 0 (0.0%) | 0 (0.0%) |
| 5 or more Children | 0 (0.0%) | 0 (0.0%) |
| Total | 155 (2.7%) | 62 (8.8%) |
Race in Granite Bay
The most populous races in Granite Bay are White / Caucasian (17,867 | 80.5%), Asian (1,962 | 8.8%), and Hispanic or Latino (1,952 | 8.8%).
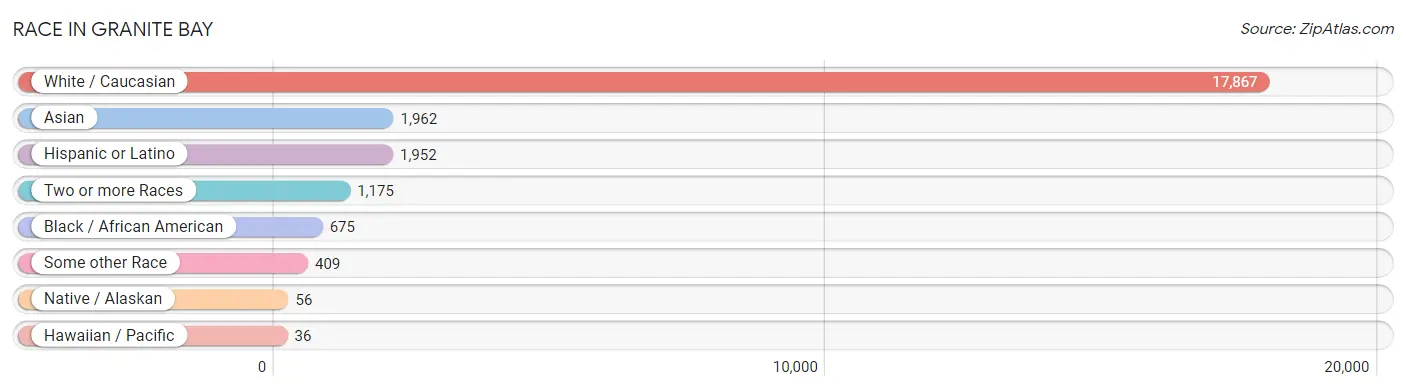
| Race | # Population | % Population |
| Asian | 1,962 | 8.8% |
| Black / African American | 675 | 3.0% |
| Hawaiian / Pacific | 36 | 0.2% |
| Hispanic or Latino | 1,952 | 8.8% |
| Native / Alaskan | 56 | 0.3% |
| White / Caucasian | 17,867 | 80.5% |
| Two or more Races | 1,175 | 5.3% |
| Some other Race | 409 | 1.8% |
| Total | 22,180 | 100.0% |
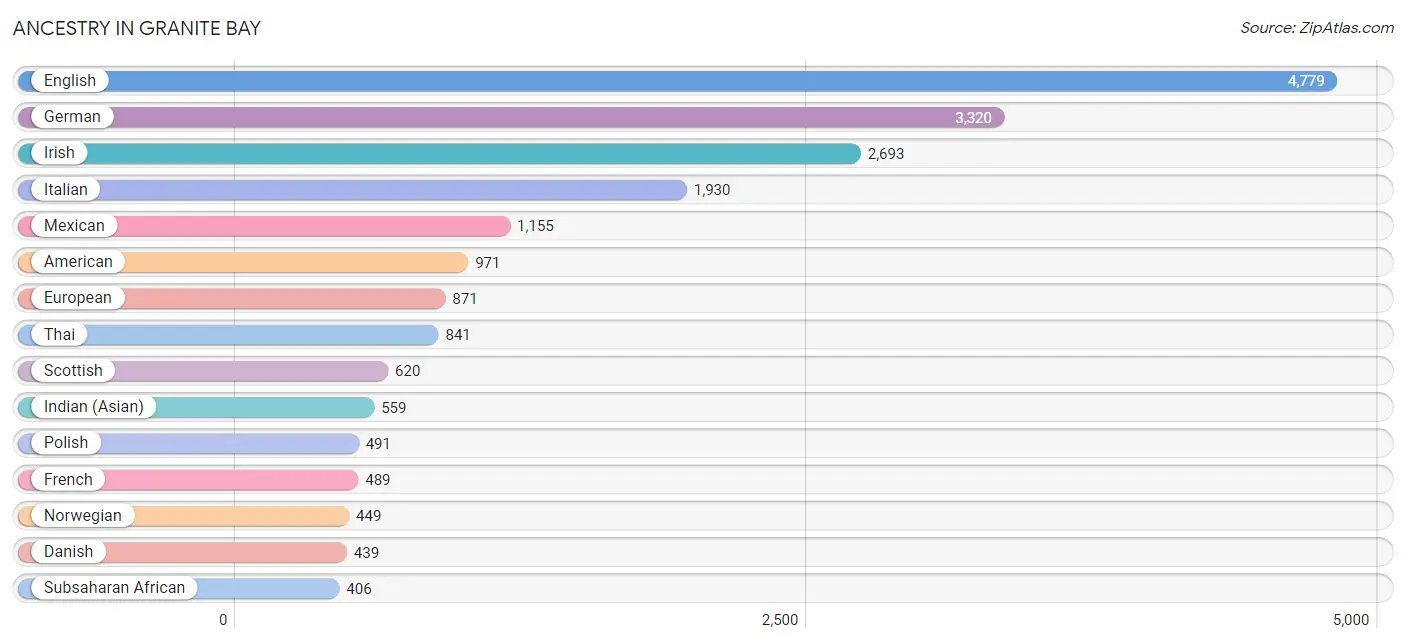
Ancestry in Granite Bay
The most populous ancestries reported in Granite Bay are English (4,779 | 21.5%), German (3,320 | 15.0%), Irish (2,693 | 12.1%), Italian (1,930 | 8.7%), and Mexican (1,155 | 5.2%), together accounting for 62.6% of all Granite Bay residents.
| Ancestry | # Population | % Population |
| African | 2 | 0.0% |
| Aleut | 34 | 0.2% |
| American | 971 | 4.4% |
| Arab | 171 | 0.8% |
| Armenian | 7 | 0.0% |
| Assyrian / Chaldean / Syriac | 85 | 0.4% |
| Australian | 39 | 0.2% |
| Austrian | 132 | 0.6% |
| Basque | 21 | 0.1% |
| Belgian | 96 | 0.4% |
| Bhutanese | 199 | 0.9% |
| British | 198 | 0.9% |
| Bulgarian | 54 | 0.2% |
| Burmese | 151 | 0.7% |
| Canadian | 73 | 0.3% |
| Central American | 176 | 0.8% |
| Cherokee | 65 | 0.3% |
| Chilean | 33 | 0.2% |
| Chippewa | 7 | 0.0% |
| Colombian | 10 | 0.1% |
| Costa Rican | 36 | 0.2% |
| Croatian | 71 | 0.3% |
| Cypriot | 11 | 0.1% |
| Czech | 169 | 0.8% |
| Danish | 439 | 2.0% |
| Dutch | 193 | 0.9% |
| Eastern European | 68 | 0.3% |
| Egyptian | 39 | 0.2% |
| English | 4,779 | 21.5% |
| European | 871 | 3.9% |
| Filipino | 58 | 0.3% |
| Finnish | 85 | 0.4% |
| French | 489 | 2.2% |
| French Canadian | 186 | 0.8% |
| German | 3,320 | 15.0% |
| German Russian | 21 | 0.1% |
| Greek | 241 | 1.1% |
| Honduran | 64 | 0.3% |
| Hungarian | 19 | 0.1% |
| Indian (Asian) | 559 | 2.5% |
| Iranian | 158 | 0.7% |
| Irish | 2,693 | 12.1% |
| Italian | 1,930 | 8.7% |
| Korean | 269 | 1.2% |
| Laotian | 61 | 0.3% |
| Lebanese | 25 | 0.1% |
| Lithuanian | 100 | 0.4% |
| Mexican | 1,155 | 5.2% |
| Native Hawaiian | 24 | 0.1% |
| Nicaraguan | 31 | 0.1% |
| Northern European | 2 | 0.0% |
| Norwegian | 449 | 2.0% |
| Palestinian | 25 | 0.1% |
| Peruvian | 63 | 0.3% |
| Polish | 491 | 2.2% |
| Portuguese | 281 | 1.3% |
| Puerto Rican | 96 | 0.4% |
| Romanian | 68 | 0.3% |
| Russian | 181 | 0.8% |
| Salvadoran | 45 | 0.2% |
| Samoan | 20 | 0.1% |
| Scandinavian | 63 | 0.3% |
| Scotch-Irish | 215 | 1.0% |
| Scottish | 620 | 2.8% |
| Serbian | 50 | 0.2% |
| Slovak | 65 | 0.3% |
| Slovene | 8 | 0.0% |
| South African | 77 | 0.4% |
| South American | 106 | 0.5% |
| South American Indian | 6 | 0.0% |
| Spaniard | 233 | 1.1% |
| Spanish | 100 | 0.4% |
| Sri Lankan | 145 | 0.6% |
| Subsaharan African | 406 | 1.8% |
| Swedish | 337 | 1.5% |
| Swiss | 149 | 0.7% |
| Syrian | 81 | 0.4% |
| Thai | 841 | 3.8% |
| Ukrainian | 33 | 0.2% |
| Welsh | 338 | 1.5% |
| Yugoslavian | 59 | 0.3% | View All 81 Rows |
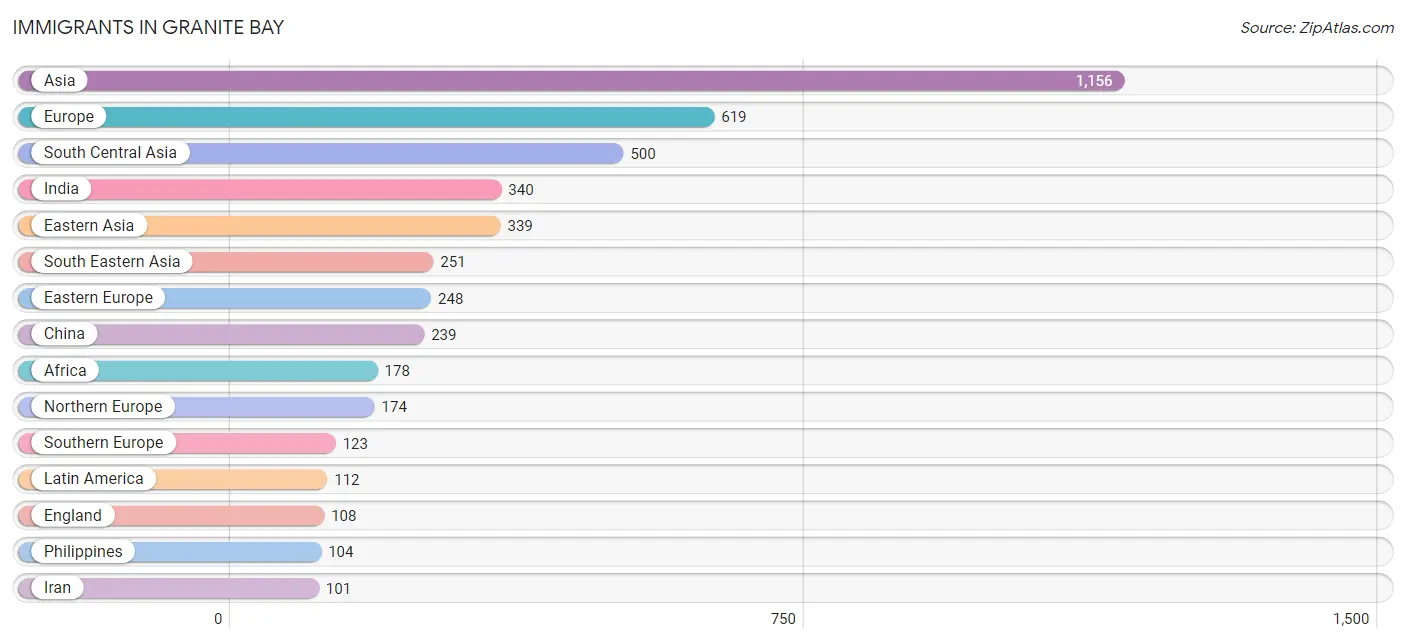
Immigrants in Granite Bay
The most numerous immigrant groups reported in Granite Bay came from Asia (1,156 | 5.2%), Europe (619 | 2.8%), South Central Asia (500 | 2.2%), India (340 | 1.5%), and Eastern Asia (339 | 1.5%), together accounting for 13.3% of all Granite Bay residents.
| Immigration Origin | # Population | % Population |
| Africa | 178 | 0.8% |
| Asia | 1,156 | 5.2% |
| Australia | 23 | 0.1% |
| Bolivia | 8 | 0.0% |
| Bulgaria | 54 | 0.2% |
| Canada | 69 | 0.3% |
| Central America | 98 | 0.4% |
| China | 239 | 1.1% |
| Costa Rica | 8 | 0.0% |
| Croatia | 12 | 0.1% |
| Eastern Africa | 9 | 0.0% |
| Eastern Asia | 339 | 1.5% |
| Eastern Europe | 248 | 1.1% |
| Egypt | 12 | 0.1% |
| El Salvador | 12 | 0.1% |
| England | 108 | 0.5% |
| Europe | 619 | 2.8% |
| Fiji | 23 | 0.1% |
| France | 5 | 0.0% |
| Germany | 29 | 0.1% |
| Greece | 18 | 0.1% |
| Hong Kong | 22 | 0.1% |
| Hungary | 12 | 0.1% |
| India | 340 | 1.5% |
| Indonesia | 24 | 0.1% |
| Iran | 101 | 0.5% |
| Ireland | 18 | 0.1% |
| Italy | 10 | 0.1% |
| Japan | 30 | 0.1% |
| Kenya | 9 | 0.0% |
| Korea | 70 | 0.3% |
| Latin America | 112 | 0.5% |
| Lithuania | 25 | 0.1% |
| Mexico | 78 | 0.4% |
| Middle Africa | 80 | 0.4% |
| Netherlands | 40 | 0.2% |
| Northern Africa | 12 | 0.1% |
| Northern Europe | 174 | 0.8% |
| Norway | 16 | 0.1% |
| Oceania | 46 | 0.2% |
| Pakistan | 59 | 0.3% |
| Peru | 6 | 0.0% |
| Philippines | 104 | 0.5% |
| Poland | 76 | 0.3% |
| Russia | 51 | 0.2% |
| Singapore | 56 | 0.3% |
| South Africa | 77 | 0.4% |
| South America | 14 | 0.1% |
| South Central Asia | 500 | 2.2% |
| South Eastern Asia | 251 | 1.1% |
| Southern Europe | 123 | 0.5% |
| Spain | 95 | 0.4% |
| Syria | 30 | 0.1% |
| Taiwan | 54 | 0.2% |
| Vietnam | 67 | 0.3% |
| Western Asia | 53 | 0.2% |
| Western Europe | 74 | 0.3% |
| Zaire | 80 | 0.4% | View All 58 Rows |
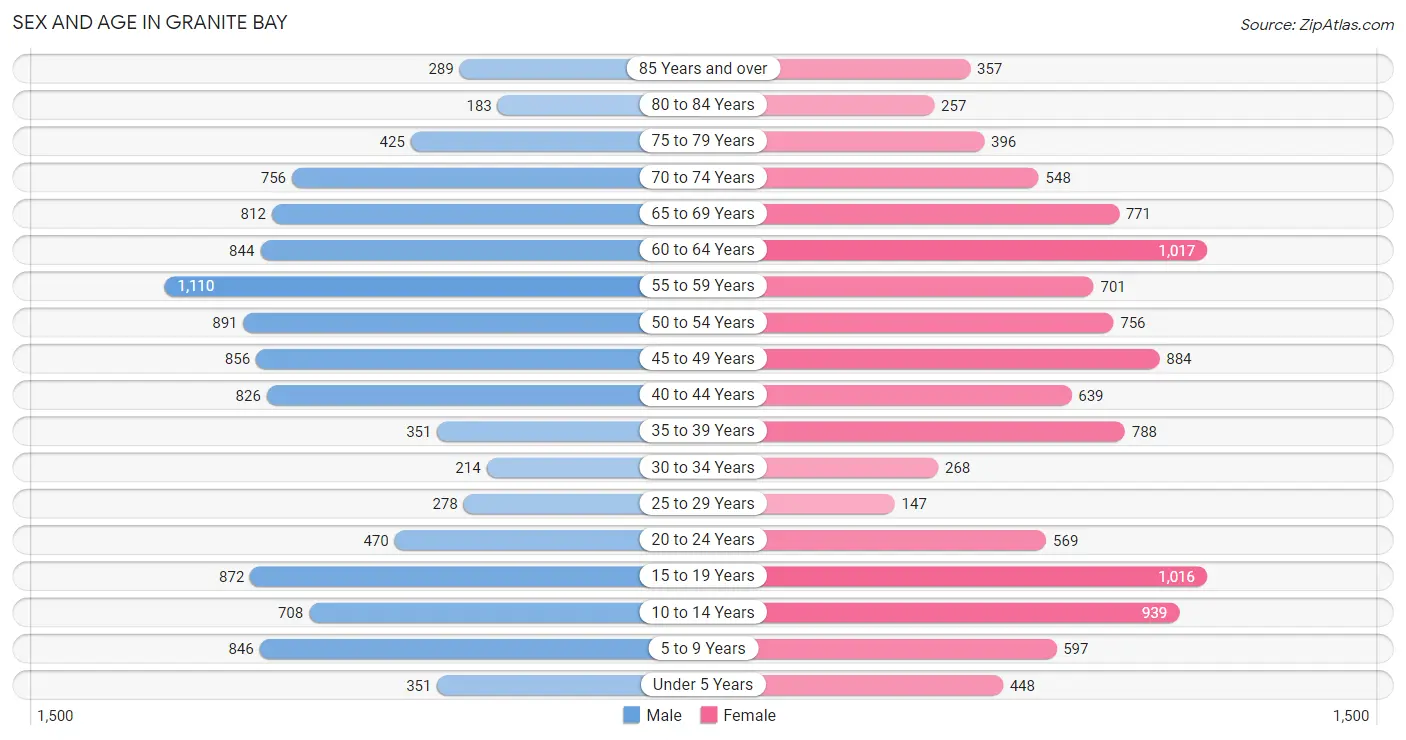
Sex and Age in Granite Bay
Sex and Age in Granite Bay
The most populous age groups in Granite Bay are 55 to 59 Years (1,110 | 10.0%) for men and 60 to 64 Years (1,017 | 9.2%) for women.
| Age Bracket | Male | Female |
| Under 5 Years | 351 (3.2%) | 448 (4.0%) |
| 5 to 9 Years | 846 (7.6%) | 597 (5.4%) |
| 10 to 14 Years | 708 (6.4%) | 939 (8.5%) |
| 15 to 19 Years | 872 (7.9%) | 1,016 (9.1%) |
| 20 to 24 Years | 470 (4.2%) | 569 (5.1%) |
| 25 to 29 Years | 278 (2.5%) | 147 (1.3%) |
| 30 to 34 Years | 214 (1.9%) | 268 (2.4%) |
| 35 to 39 Years | 351 (3.2%) | 788 (7.1%) |
| 40 to 44 Years | 826 (7.4%) | 639 (5.8%) |
| 45 to 49 Years | 856 (7.7%) | 884 (8.0%) |
| 50 to 54 Years | 891 (8.0%) | 756 (6.8%) |
| 55 to 59 Years | 1,110 (10.0%) | 701 (6.3%) |
| 60 to 64 Years | 844 (7.6%) | 1,017 (9.2%) |
| 65 to 69 Years | 812 (7.3%) | 771 (7.0%) |
| 70 to 74 Years | 756 (6.8%) | 548 (4.9%) |
| 75 to 79 Years | 425 (3.8%) | 396 (3.6%) |
| 80 to 84 Years | 183 (1.7%) | 257 (2.3%) |
| 85 Years and over | 289 (2.6%) | 357 (3.2%) |
| Total | 11,082 (100.0%) | 11,098 (100.0%) |
Families and Households in Granite Bay
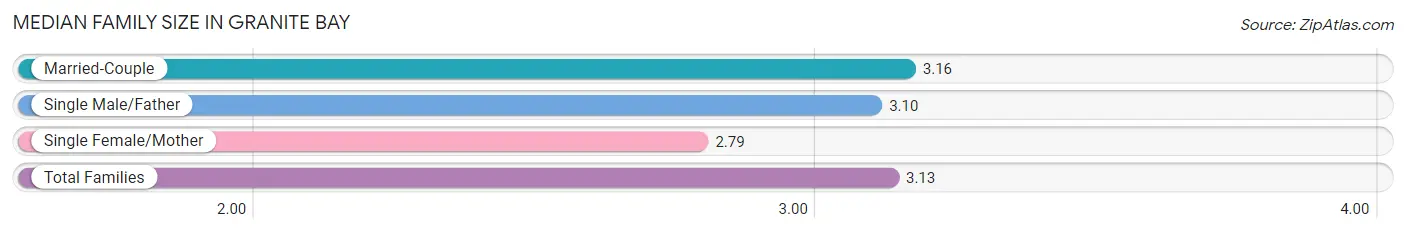
Median Family Size in Granite Bay
The median family size in Granite Bay is 3.13 persons per family, with married-couple families (5,782 | 89.1%) accounting for the largest median family size of 3.16 persons per family. On the other hand, single female/mother families (388 | 6.0%) represent the smallest median family size with 2.79 persons per family.
| Family Type | # Families | Family Size |
| Married-Couple | 5,782 (89.1%) | 3.16 |
| Single Male/Father | 316 (4.9%) | 3.10 |
| Single Female/Mother | 388 (6.0%) | 2.79 |
| Total Families | 6,486 (100.0%) | 3.13 |
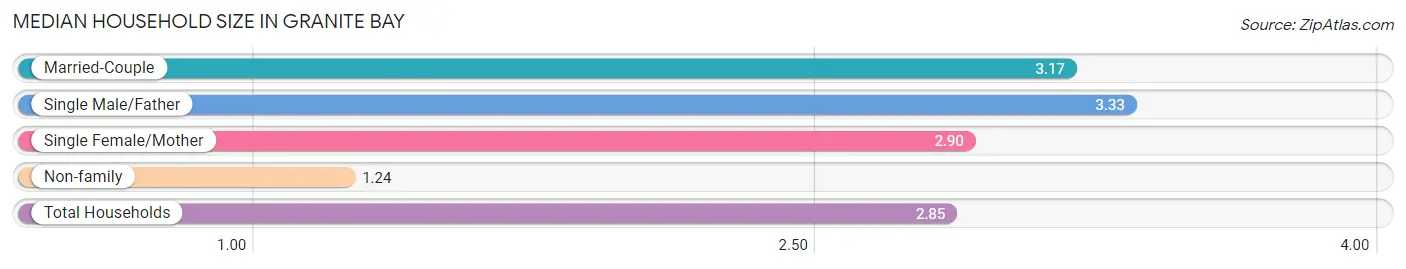
Median Household Size in Granite Bay
The median household size in Granite Bay is 2.85 persons per household, with single male/father households (316 | 4.1%) accounting for the largest median household size of 3.33 persons per household. non-family households (1,245 | 16.1%) represent the smallest median household size with 1.24 persons per household.
| Household Type | # Households | Household Size |
| Married-Couple | 5,782 (74.8%) | 3.17 |
| Single Male/Father | 316 (4.1%) | 3.33 |
| Single Female/Mother | 388 (5.0%) | 2.90 |
| Non-family | 1,245 (16.1%) | 1.24 |
| Total Households | 7,731 (100.0%) | 2.85 |
Household Size by Marriage Status in Granite Bay
Out of a total of 7,731 households in Granite Bay, 6,486 (83.9%) are family households, while 1,245 (16.1%) are nonfamily households. The most numerous type of family households are 2-person households, comprising 2,701, and the most common type of nonfamily households are 1-person households, comprising 1,004.
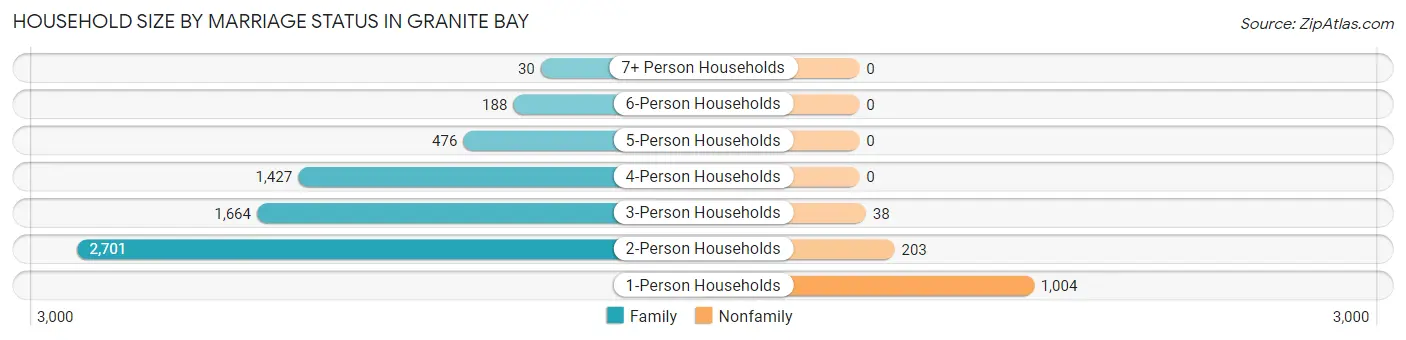
| Household Size | Family Households | Nonfamily Households |
| 1-Person Households | - | 1,004 (13.0%) |
| 2-Person Households | 2,701 (34.9%) | 203 (2.6%) |
| 3-Person Households | 1,664 (21.5%) | 38 (0.5%) |
| 4-Person Households | 1,427 (18.5%) | 0 (0.0%) |
| 5-Person Households | 476 (6.2%) | 0 (0.0%) |
| 6-Person Households | 188 (2.4%) | 0 (0.0%) |
| 7+ Person Households | 30 (0.4%) | 0 (0.0%) |
| Total | 6,486 (83.9%) | 1,245 (16.1%) |
Female Fertility in Granite Bay
Fertility by Age in Granite Bay
Average fertility rate in Granite Bay is 51.0 births per 1,000 women. Women in the age bracket of 35 to 50 years have the highest fertility rate with 66.0 births per 1,000 women. Women in the age bracket of 35 to 50 years acount for 71.6% of all women with births.
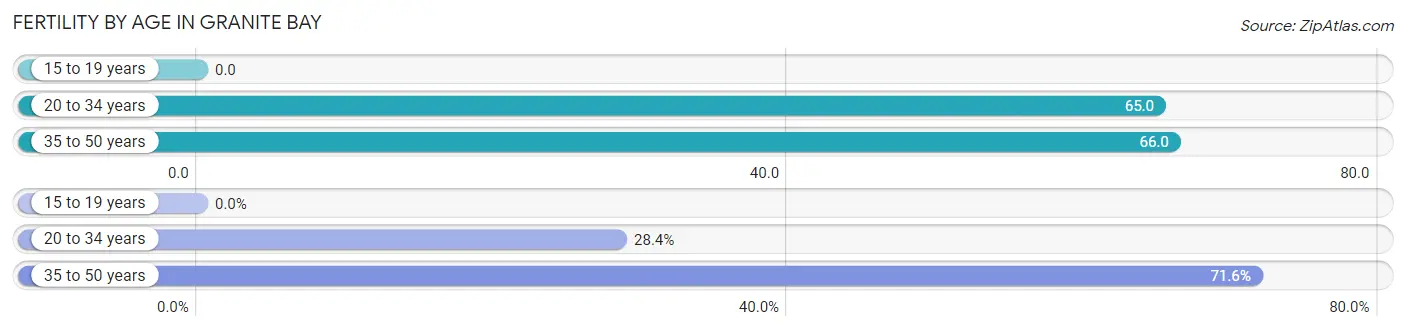
| Age Bracket | Women with Births | Births / 1,000 Women |
| 15 to 19 years | 0 (0.0%) | 0.0 |
| 20 to 34 years | 64 (28.4%) | 65.0 |
| 35 to 50 years | 161 (71.6%) | 66.0 |
| Total | 225 (100.0%) | 51.0 |
Fertility by Age by Marriage Status in Granite Bay
84.9% of women with births (225) in Granite Bay are married. The highest percentage of unmarried women with births falls into 20 to 34 years age bracket with 53.1% of them unmarried at the time of birth, while the lowest percentage of unmarried women with births belong to 35 to 50 years age bracket with 0.0% of them unmarried.
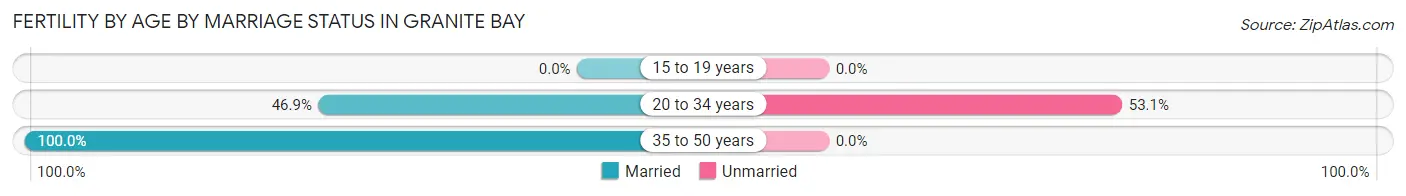
| Age Bracket | Married | Unmarried |
| 15 to 19 years | 0 (0.0%) | 0 (0.0%) |
| 20 to 34 years | 30 (46.9%) | 34 (53.1%) |
| 35 to 50 years | 161 (100.0%) | 0 (0.0%) |
| Total | 191 (84.9%) | 34 (15.1%) |
Fertility by Education in Granite Bay
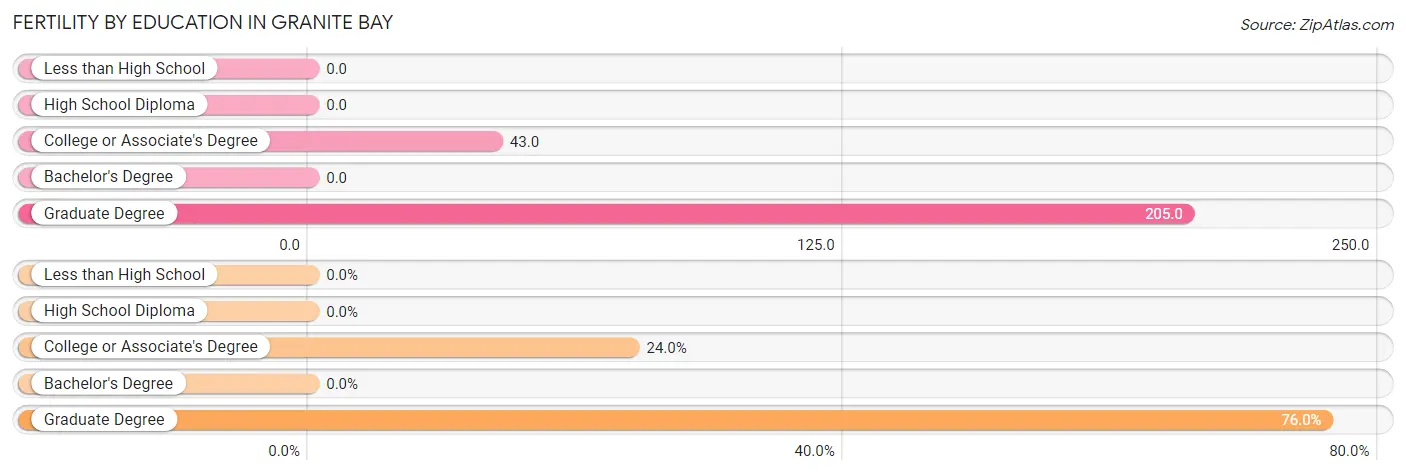
| Educational Attainment | Women with Births | Births / 1,000 Women |
| Less than High School | 0 (0.0%) | 0.0 |
| High School Diploma | 0 (0.0%) | 0.0 |
| College or Associate's Degree | 54 (24.0%) | 43.0 |
| Bachelor's Degree | 0 (0.0%) | 0.0 |
| Graduate Degree | 171 (76.0%) | 205.0 |
| Total | 225 (100.0%) | 51.0 |
Fertility by Education by Marriage Status in Granite Bay
15.1% of women with births in Granite Bay are unmarried. Women with the educational attainment of graduate degree are most likely to be married with 100.0% of them married at childbirth, while women with the educational attainment of college or associate's degree are least likely to be married with 63.0% of them unmarried at childbirth.
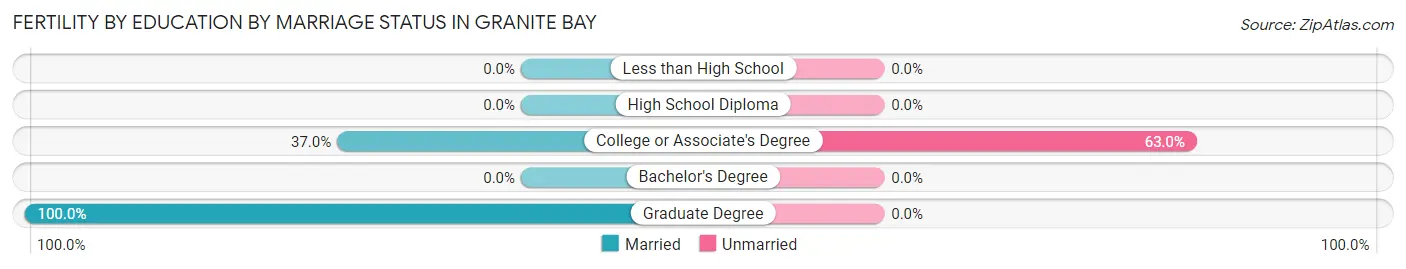
| Educational Attainment | Married | Unmarried |
| Less than High School | 0 (0.0%) | 0 (0.0%) |
| High School Diploma | 0 (0.0%) | 0 (0.0%) |
| College or Associate's Degree | 20 (37.0%) | 34 (63.0%) |
| Bachelor's Degree | 0 (0.0%) | 0 (0.0%) |
| Graduate Degree | 171 (100.0%) | 0 (0.0%) |
| Total | 191 (84.9%) | 34 (15.1%) |
Employment Characteristics in Granite Bay
Employment by Class of Employer in Granite Bay
Among the 9,800 employed individuals in Granite Bay, private company employees (5,373 | 54.8%), state government employees (1,123 | 11.5%), and local government employees (905 | 9.2%) make up the most common classes of employment.
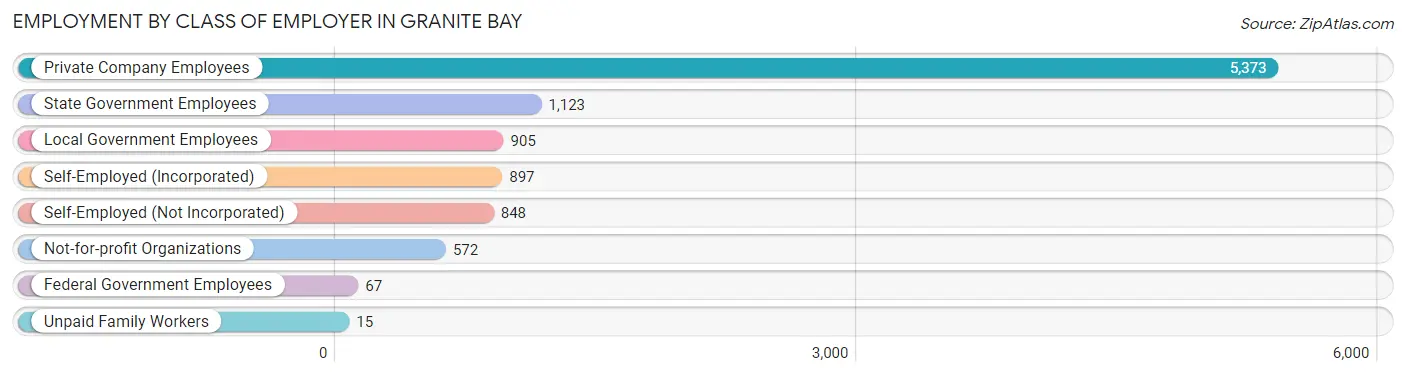
| Employer Class | # Employees | % Employees |
| Private Company Employees | 5,373 | 54.8% |
| Self-Employed (Incorporated) | 897 | 9.1% |
| Self-Employed (Not Incorporated) | 848 | 8.6% |
| Not-for-profit Organizations | 572 | 5.8% |
| Local Government Employees | 905 | 9.2% |
| State Government Employees | 1,123 | 11.5% |
| Federal Government Employees | 67 | 0.7% |
| Unpaid Family Workers | 15 | 0.2% |
| Total | 9,800 | 100.0% |
Employment Status by Age in Granite Bay
According to the labor force statistics for Granite Bay, out of the total population over 16 years of age (17,765), 58.6% or 10,410 individuals are in the labor force, with 3.9% or 406 of them unemployed. The age group with the highest labor force participation rate is 35 to 44 years, with 87.8% or 2,286 individuals in the labor force. Within the labor force, the 20 to 24 years age range has the highest percentage of unemployed individuals, with 17.2% or 118 of them being unemployed.
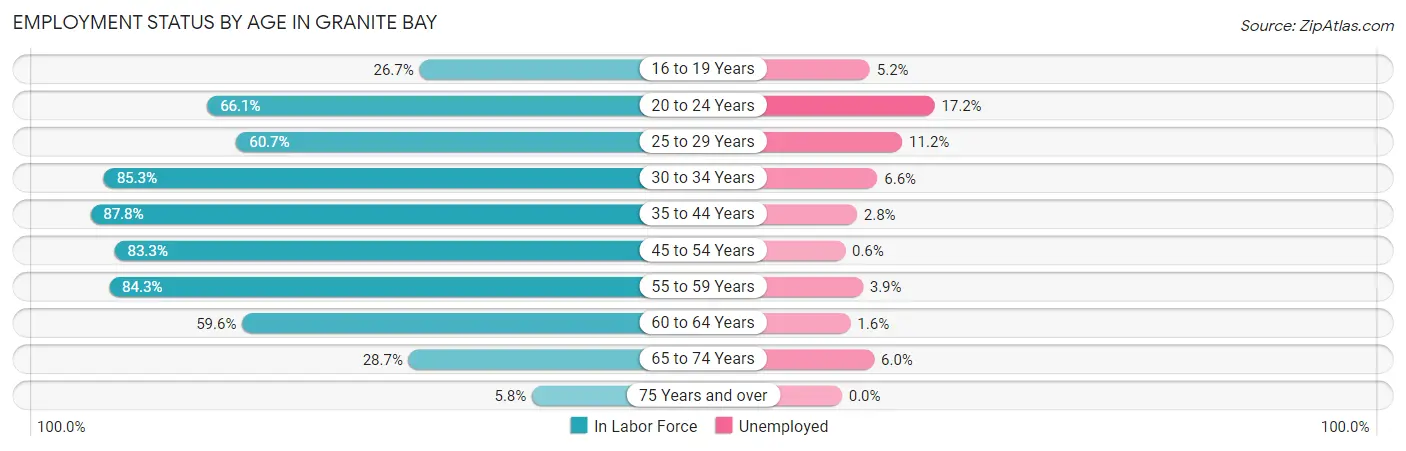
| Age Bracket | In Labor Force | Unemployed |
| 16 to 19 Years | 364 (26.7%) | 19 (5.2%) |
| 20 to 24 Years | 687 (66.1%) | 118 (17.2%) |
| 25 to 29 Years | 258 (60.7%) | 29 (11.2%) |
| 30 to 34 Years | 411 (85.3%) | 27 (6.6%) |
| 35 to 44 Years | 2,286 (87.8%) | 64 (2.8%) |
| 45 to 54 Years | 2,821 (83.3%) | 17 (0.6%) |
| 55 to 59 Years | 1,527 (84.3%) | 60 (3.9%) |
| 60 to 64 Years | 1,109 (59.6%) | 18 (1.6%) |
| 65 to 74 Years | 829 (28.7%) | 50 (6.0%) |
| 75 Years and over | 111 (5.8%) | 0 (0.0%) |
| Total | 10,410 (58.6%) | 406 (3.9%) |
Employment Status by Educational Attainment in Granite Bay
According to labor force statistics for Granite Bay, 79.6% of individuals (8,414) out of the total population between 25 and 64 years of age (10,570) are in the labor force, with 2.5% or 210 of them being unemployed. The group with the highest labor force participation rate are those with the educational attainment of bachelor's degree or higher, with 86.0% or 5,673 individuals in the labor force. Within the labor force, individuals with high school diploma education have the highest percentage of unemployment, with 12.8% or 77 of them being unemployed.
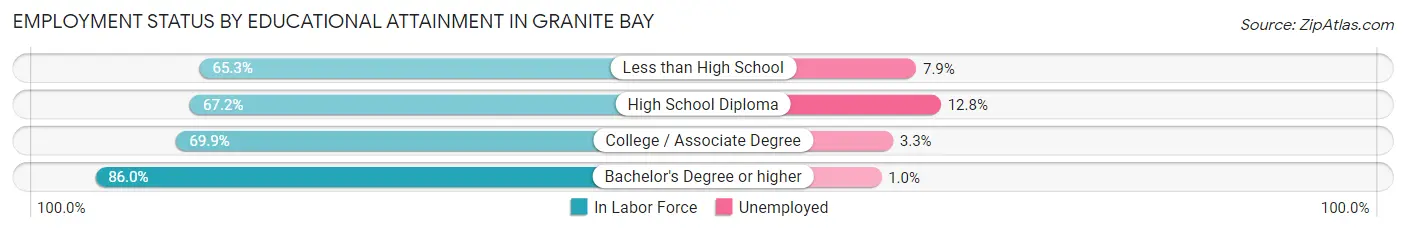
| Educational Attainment | In Labor Force | Unemployed |
| Less than High School | 177 (65.3%) | 21 (7.9%) |
| High School Diploma | 601 (67.2%) | 114 (12.8%) |
| College / Associate Degree | 1,963 (69.9%) | 93 (3.3%) |
| Bachelor's Degree or higher | 5,673 (86.0%) | 66 (1.0%) |
| Total | 8,414 (79.6%) | 264 (2.5%) |
Employment Occupations by Sex in Granite Bay
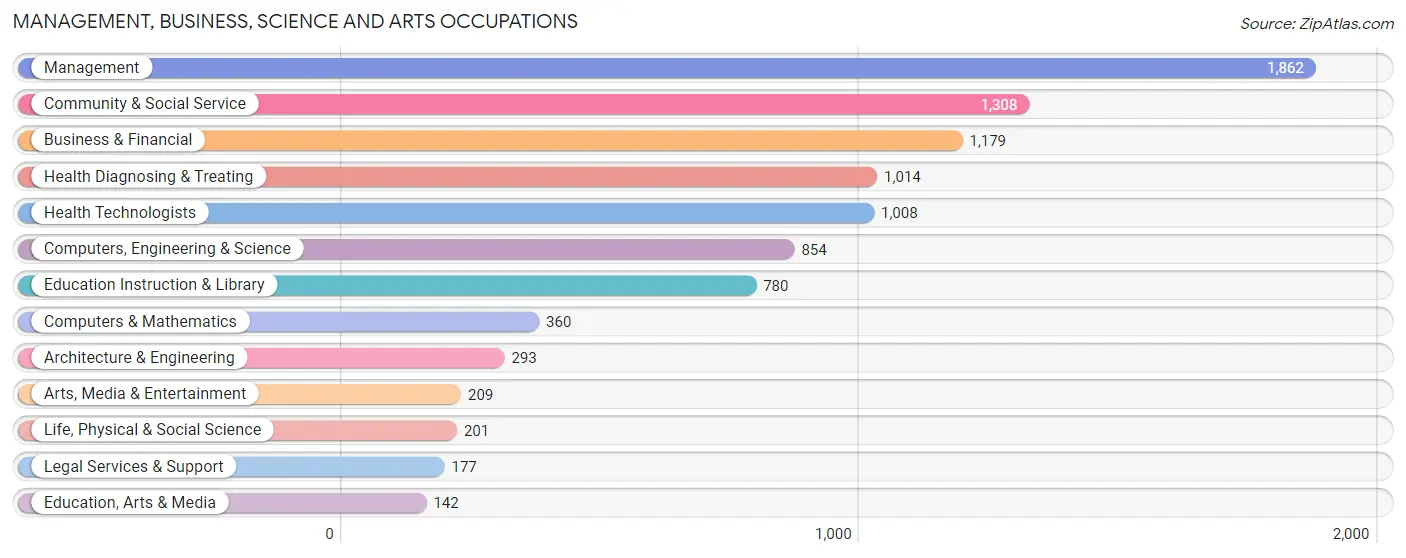
Management, Business, Science and Arts Occupations
The most common Management, Business, Science and Arts occupations in Granite Bay are Management (1,862 | 18.6%), Community & Social Service (1,308 | 13.1%), Business & Financial (1,179 | 11.8%), Health Diagnosing & Treating (1,014 | 10.1%), and Health Technologists (1,008 | 10.1%).
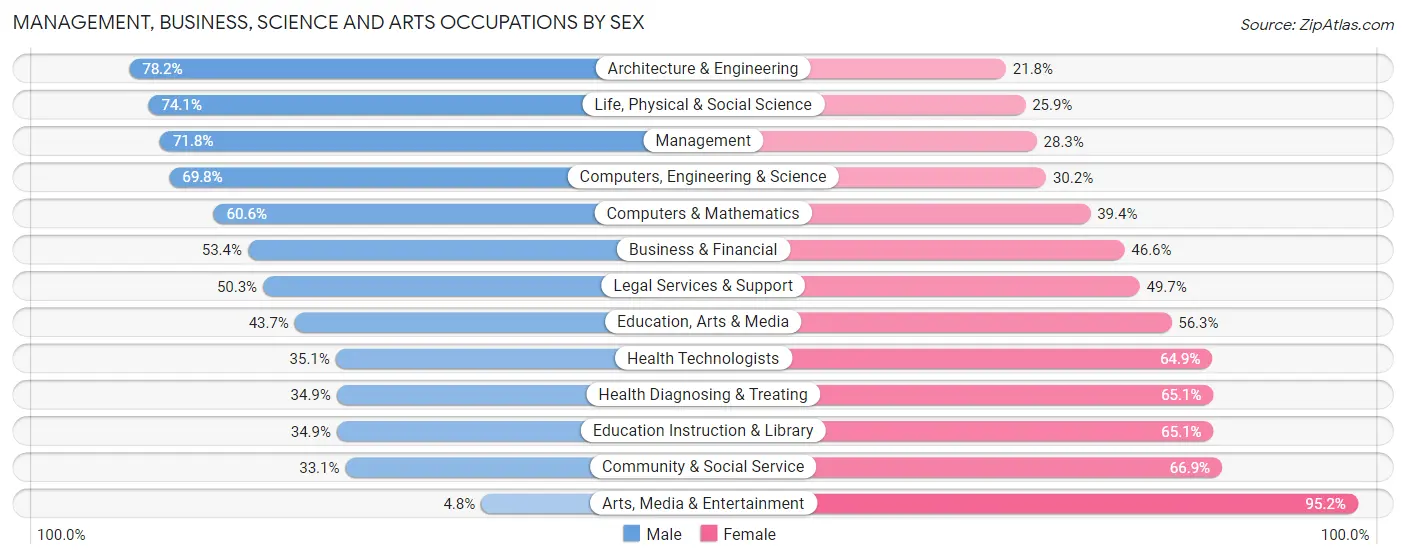
Management, Business, Science and Arts Occupations by Sex
Within the Management, Business, Science and Arts occupations in Granite Bay, the most male-oriented occupations are Architecture & Engineering (78.2%), Life, Physical & Social Science (74.1%), and Management (71.8%), while the most female-oriented occupations are Arts, Media & Entertainment (95.2%), Community & Social Service (66.9%), and Education Instruction & Library (65.1%).
| Occupation | Male | Female |
| Management | 1,336 (71.8%) | 526 (28.2%) |
| Business & Financial | 630 (53.4%) | 549 (46.6%) |
| Computers, Engineering & Science | 596 (69.8%) | 258 (30.2%) |
| Computers & Mathematics | 218 (60.6%) | 142 (39.4%) |
| Architecture & Engineering | 229 (78.2%) | 64 (21.8%) |
| Life, Physical & Social Science | 149 (74.1%) | 52 (25.9%) |
| Community & Social Service | 433 (33.1%) | 875 (66.9%) |
| Education, Arts & Media | 62 (43.7%) | 80 (56.3%) |
| Legal Services & Support | 89 (50.3%) | 88 (49.7%) |
| Education Instruction & Library | 272 (34.9%) | 508 (65.1%) |
| Arts, Media & Entertainment | 10 (4.8%) | 199 (95.2%) |
| Health Diagnosing & Treating | 354 (34.9%) | 660 (65.1%) |
| Health Technologists | 354 (35.1%) | 654 (64.9%) |
| Total (Category) | 3,349 (53.9%) | 2,868 (46.1%) |
| Total (Overall) | 5,306 (53.0%) | 4,697 (47.0%) |
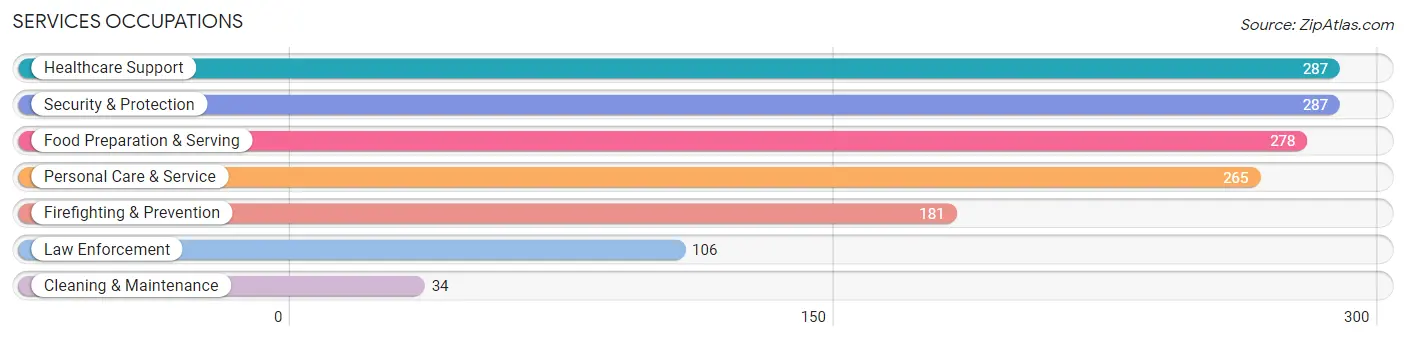
Services Occupations
The most common Services occupations in Granite Bay are Healthcare Support (287 | 2.9%), Security & Protection (287 | 2.9%), Food Preparation & Serving (278 | 2.8%), Personal Care & Service (265 | 2.6%), and Firefighting & Prevention (181 | 1.8%).
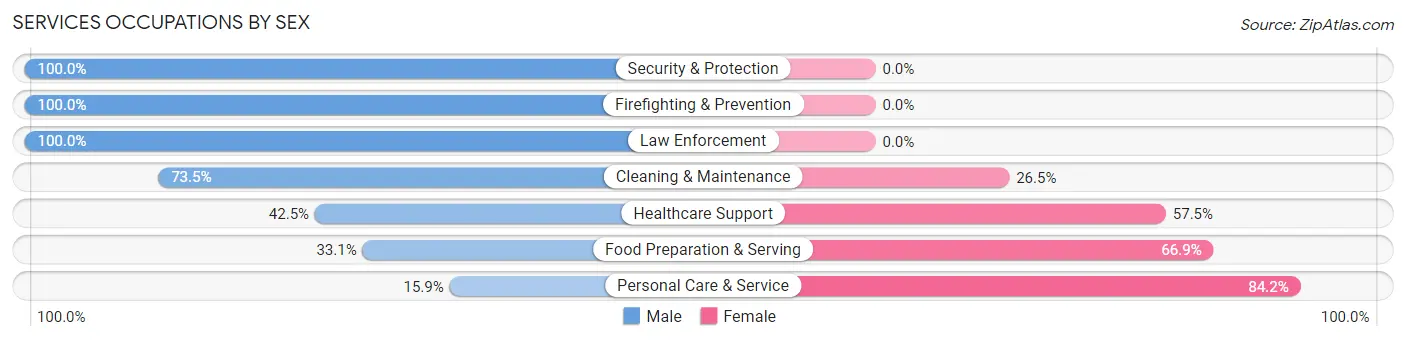
Services Occupations by Sex
Within the Services occupations in Granite Bay, the most male-oriented occupations are Security & Protection (100.0%), Firefighting & Prevention (100.0%), and Law Enforcement (100.0%), while the most female-oriented occupations are Personal Care & Service (84.2%), Food Preparation & Serving (66.9%), and Healthcare Support (57.5%).
| Occupation | Male | Female |
| Healthcare Support | 122 (42.5%) | 165 (57.5%) |
| Security & Protection | 287 (100.0%) | 0 (0.0%) |
| Firefighting & Prevention | 181 (100.0%) | 0 (0.0%) |
| Law Enforcement | 106 (100.0%) | 0 (0.0%) |
| Food Preparation & Serving | 92 (33.1%) | 186 (66.9%) |
| Cleaning & Maintenance | 25 (73.5%) | 9 (26.5%) |
| Personal Care & Service | 42 (15.9%) | 223 (84.2%) |
| Total (Category) | 568 (49.3%) | 583 (50.6%) |
| Total (Overall) | 5,306 (53.0%) | 4,697 (47.0%) |
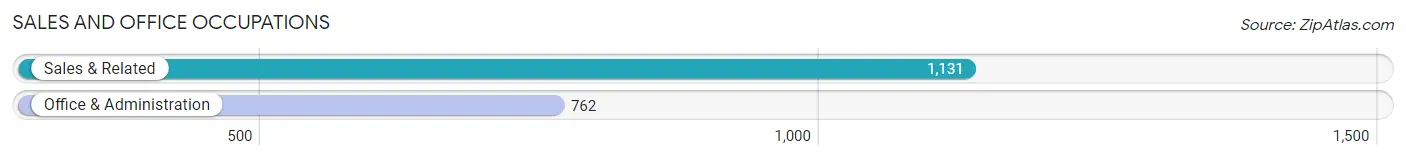
Sales and Office Occupations
The most common Sales and Office occupations in Granite Bay are Sales & Related (1,131 | 11.3%), and Office & Administration (762 | 7.6%).
Sales and Office Occupations by Sex
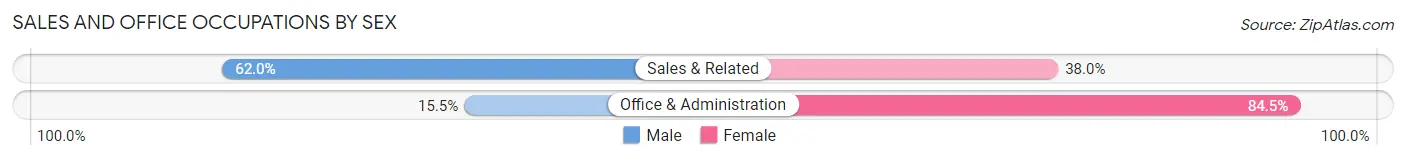
| Occupation | Male | Female |
| Sales & Related | 701 (62.0%) | 430 (38.0%) |
| Office & Administration | 118 (15.5%) | 644 (84.5%) |
| Total (Category) | 819 (43.3%) | 1,074 (56.7%) |
| Total (Overall) | 5,306 (53.0%) | 4,697 (47.0%) |
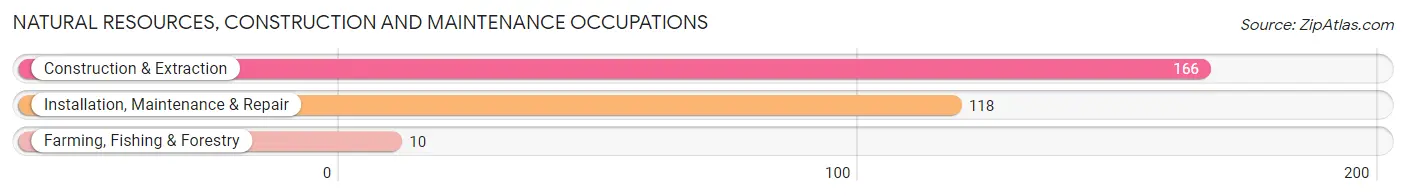
Natural Resources, Construction and Maintenance Occupations
The most common Natural Resources, Construction and Maintenance occupations in Granite Bay are Construction & Extraction (166 | 1.7%), Installation, Maintenance & Repair (118 | 1.2%), and Farming, Fishing & Forestry (10 | 0.1%).
Natural Resources, Construction and Maintenance Occupations by Sex
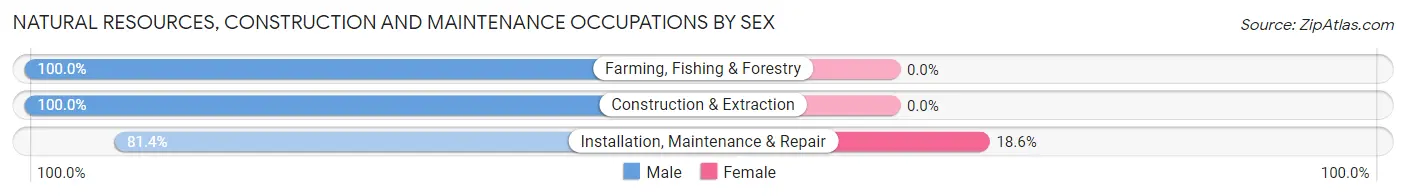
| Occupation | Male | Female |
| Farming, Fishing & Forestry | 10 (100.0%) | 0 (0.0%) |
| Construction & Extraction | 166 (100.0%) | 0 (0.0%) |
| Installation, Maintenance & Repair | 96 (81.4%) | 22 (18.6%) |
| Total (Category) | 272 (92.5%) | 22 (7.5%) |
| Total (Overall) | 5,306 (53.0%) | 4,697 (47.0%) |
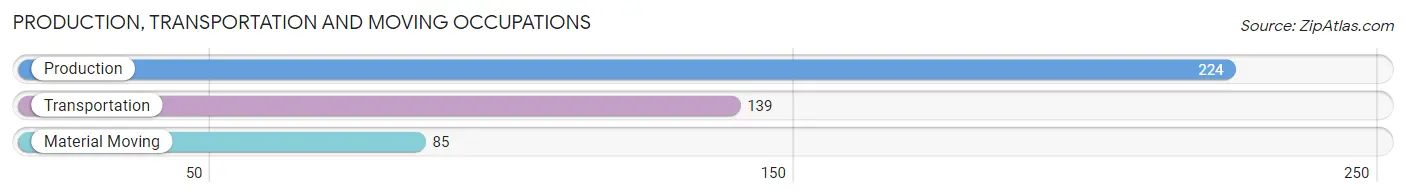
Production, Transportation and Moving Occupations
The most common Production, Transportation and Moving occupations in Granite Bay are Production (224 | 2.2%), Transportation (139 | 1.4%), and Material Moving (85 | 0.9%).
Production, Transportation and Moving Occupations by Sex
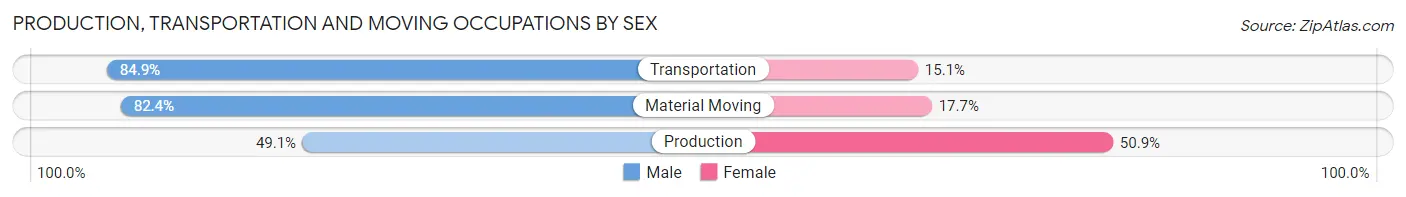
| Occupation | Male | Female |
| Production | 110 (49.1%) | 114 (50.9%) |
| Transportation | 118 (84.9%) | 21 (15.1%) |
| Material Moving | 70 (82.4%) | 15 (17.6%) |
| Total (Category) | 298 (66.5%) | 150 (33.5%) |
| Total (Overall) | 5,306 (53.0%) | 4,697 (47.0%) |
Employment Industries by Sex in Granite Bay
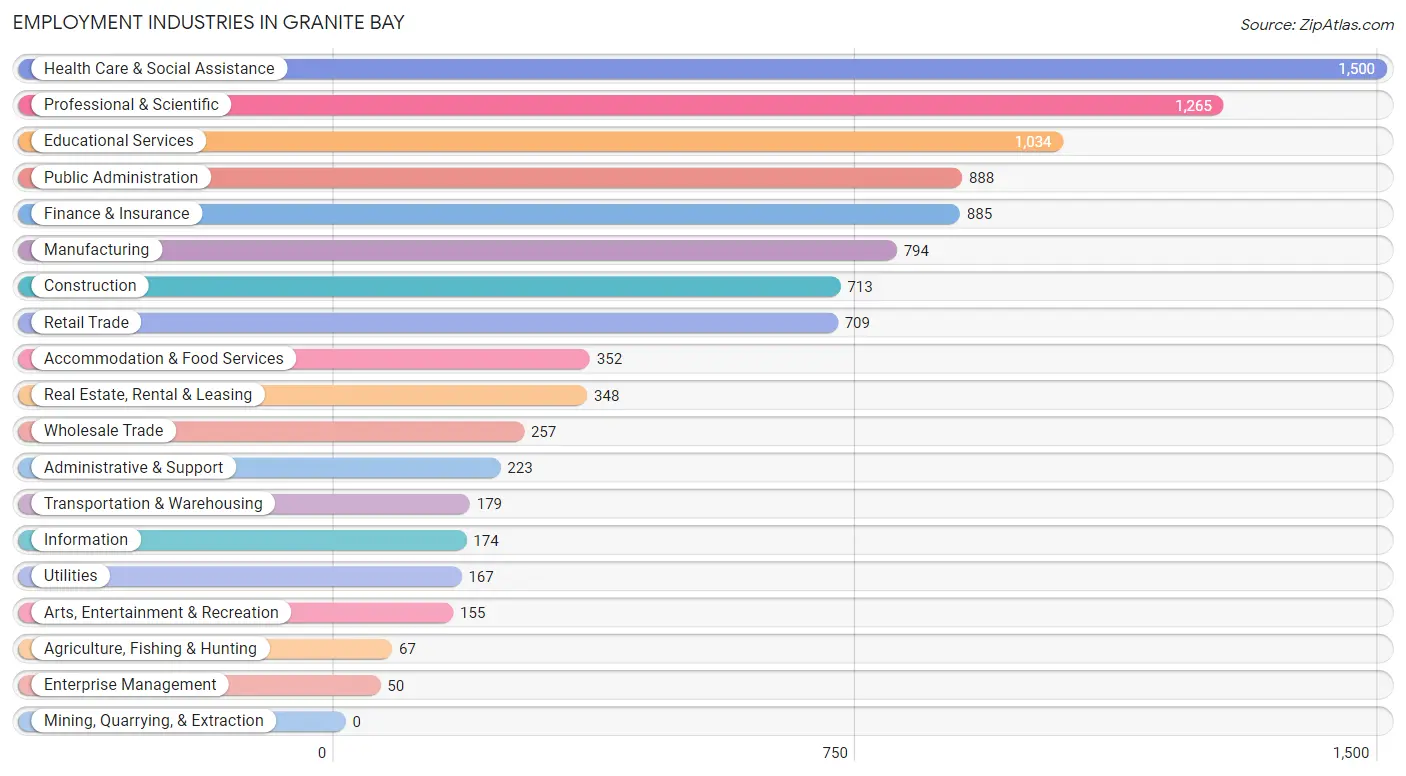
Employment Industries in Granite Bay
The major employment industries in Granite Bay include Health Care & Social Assistance (1,500 | 15.0%), Professional & Scientific (1,265 | 12.7%), Educational Services (1,034 | 10.3%), Public Administration (888 | 8.9%), and Finance & Insurance (885 | 8.8%).
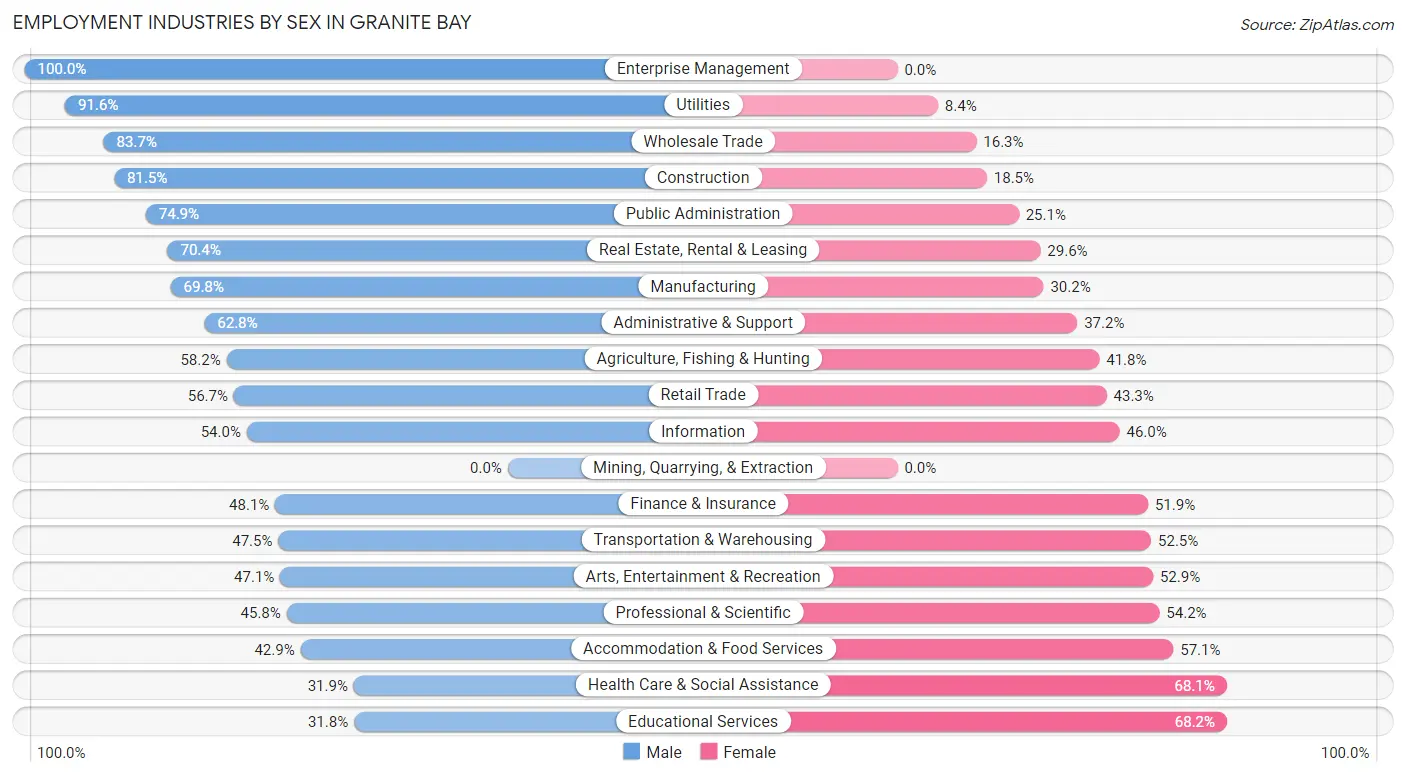
Employment Industries by Sex in Granite Bay
The Granite Bay industries that see more men than women are Enterprise Management (100.0%), Utilities (91.6%), and Wholesale Trade (83.7%), whereas the industries that tend to have a higher number of women are Educational Services (68.2%), Health Care & Social Assistance (68.1%), and Accommodation & Food Services (57.1%).
| Industry | Male | Female |
| Agriculture, Fishing & Hunting | 39 (58.2%) | 28 (41.8%) |
| Mining, Quarrying, & Extraction | 0 (0.0%) | 0 (0.0%) |
| Construction | 581 (81.5%) | 132 (18.5%) |
| Manufacturing | 554 (69.8%) | 240 (30.2%) |
| Wholesale Trade | 215 (83.7%) | 42 (16.3%) |
| Retail Trade | 402 (56.7%) | 307 (43.3%) |
| Transportation & Warehousing | 85 (47.5%) | 94 (52.5%) |
| Utilities | 153 (91.6%) | 14 (8.4%) |
| Information | 94 (54.0%) | 80 (46.0%) |
| Finance & Insurance | 426 (48.1%) | 459 (51.9%) |
| Real Estate, Rental & Leasing | 245 (70.4%) | 103 (29.6%) |
| Professional & Scientific | 579 (45.8%) | 686 (54.2%) |
| Enterprise Management | 50 (100.0%) | 0 (0.0%) |
| Administrative & Support | 140 (62.8%) | 83 (37.2%) |
| Educational Services | 329 (31.8%) | 705 (68.2%) |
| Health Care & Social Assistance | 478 (31.9%) | 1,022 (68.1%) |
| Arts, Entertainment & Recreation | 73 (47.1%) | 82 (52.9%) |
| Accommodation & Food Services | 151 (42.9%) | 201 (57.1%) |
| Public Administration | 665 (74.9%) | 223 (25.1%) |
| Total | 5,306 (53.0%) | 4,697 (47.0%) |
Education in Granite Bay
School Enrollment in Granite Bay
The most common levels of schooling among the 5,879 students in Granite Bay are high school (1,496 | 25.5%), middle school (1,405 | 23.9%), and elementary school (1,220 | 20.7%).
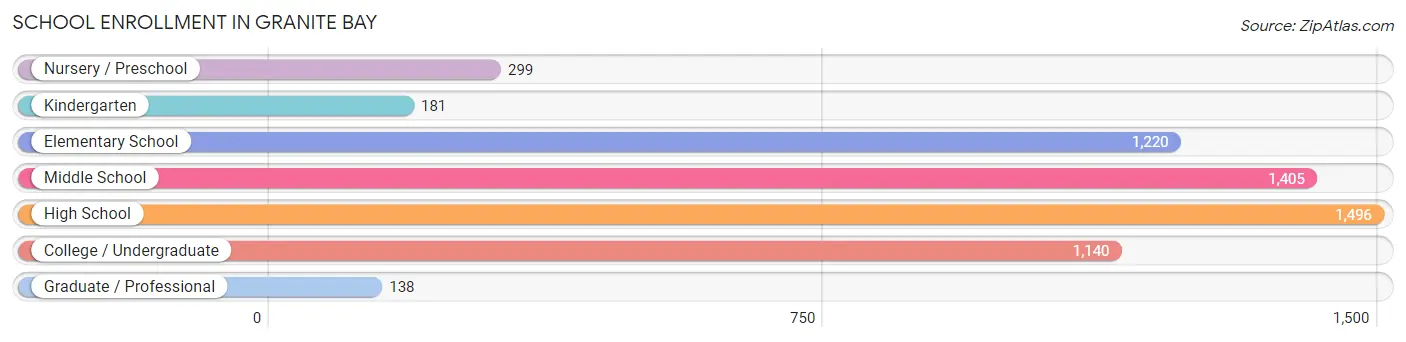
| School Level | # Students | % Students |
| Nursery / Preschool | 299 | 5.1% |
| Kindergarten | 181 | 3.1% |
| Elementary School | 1,220 | 20.7% |
| Middle School | 1,405 | 23.9% |
| High School | 1,496 | 25.5% |
| College / Undergraduate | 1,140 | 19.4% |
| Graduate / Professional | 138 | 2.4% |
| Total | 5,879 | 100.0% |
School Enrollment by Age by Funding Source in Granite Bay
Out of a total of 5,879 students who are enrolled in schools in Granite Bay, 1,158 (19.7%) attend a private institution, while the remaining 4,721 (80.3%) are enrolled in public schools. The age group of 3 to 4 year olds has the highest likelihood of being enrolled in private schools, with 129 (48.3% in the age bracket) enrolled. Conversely, the age group of 10 to 14 year olds has the lowest likelihood of being enrolled in a private school, with 1,427 (89.1% in the age bracket) attending a public institution.
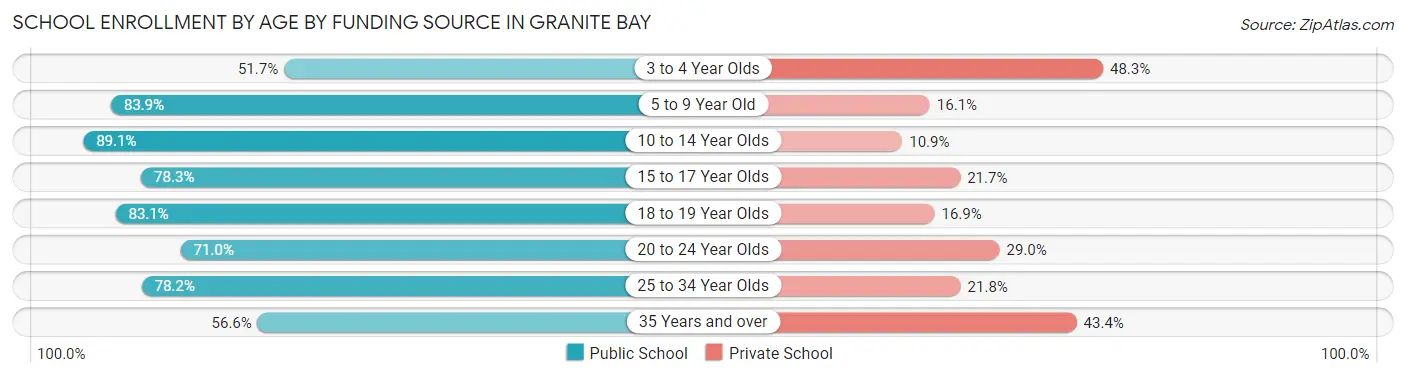
| Age Bracket | Public School | Private School |
| 3 to 4 Year Olds | 138 (51.7%) | 129 (48.3%) |
| 5 to 9 Year Old | 1,150 (83.9%) | 220 (16.1%) |
| 10 to 14 Year Olds | 1,427 (89.1%) | 175 (10.9%) |
| 15 to 17 Year Olds | 981 (78.3%) | 272 (21.7%) |
| 18 to 19 Year Olds | 466 (83.1%) | 95 (16.9%) |
| 20 to 24 Year Olds | 364 (71.0%) | 149 (29.0%) |
| 25 to 34 Year Olds | 61 (78.2%) | 17 (21.8%) |
| 35 Years and over | 133 (56.6%) | 102 (43.4%) |
| Total | 4,721 (80.3%) | 1,158 (19.7%) |
Educational Attainment by Field of Study in Granite Bay
Business (1,925 | 20.1%), engineering (1,076 | 11.2%), social sciences (1,069 | 11.1%), bio, nature & agricultural (832 | 8.7%), and psychology (623 | 6.5%) are the most common fields of study among 9,594 individuals in Granite Bay who have obtained a bachelor's degree or higher.
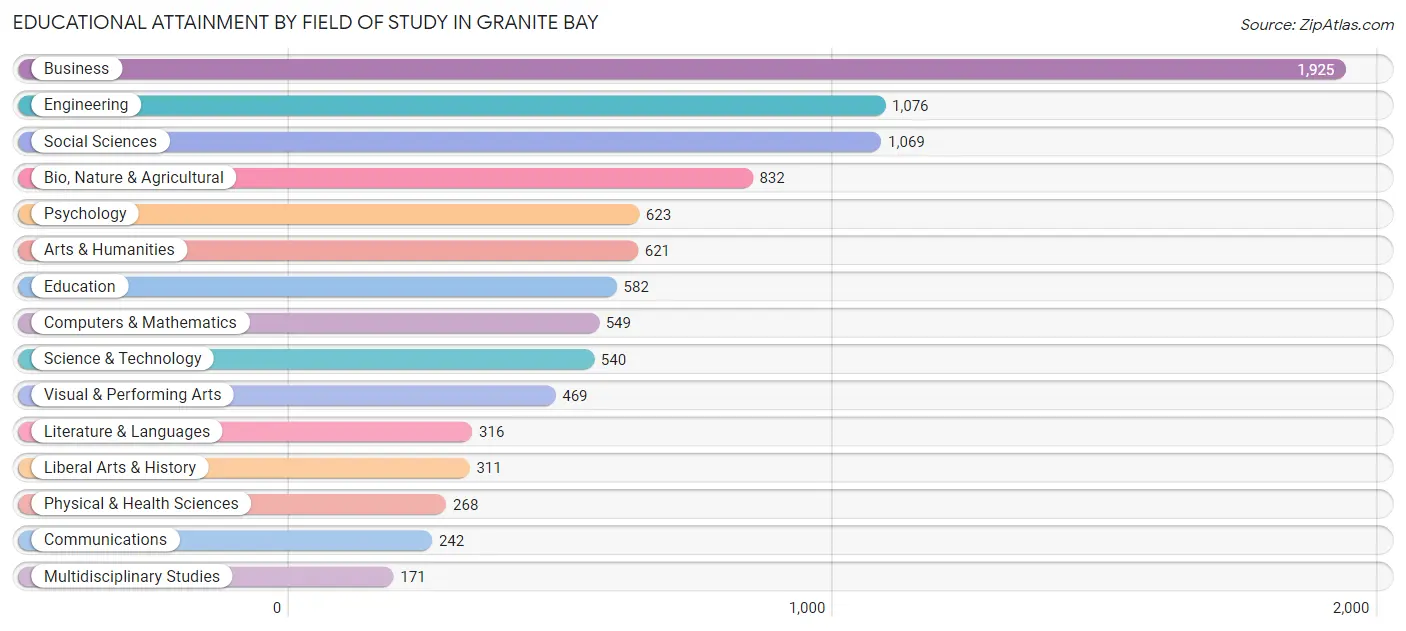
| Field of Study | # Graduates | % Graduates |
| Computers & Mathematics | 549 | 5.7% |
| Bio, Nature & Agricultural | 832 | 8.7% |
| Physical & Health Sciences | 268 | 2.8% |
| Psychology | 623 | 6.5% |
| Social Sciences | 1,069 | 11.1% |
| Engineering | 1,076 | 11.2% |
| Multidisciplinary Studies | 171 | 1.8% |
| Science & Technology | 540 | 5.6% |
| Business | 1,925 | 20.1% |
| Education | 582 | 6.1% |
| Literature & Languages | 316 | 3.3% |
| Liberal Arts & History | 311 | 3.2% |
| Visual & Performing Arts | 469 | 4.9% |
| Communications | 242 | 2.5% |
| Arts & Humanities | 621 | 6.5% |
| Total | 9,594 | 100.0% |
Transportation & Commute in Granite Bay
Vehicle Availability by Sex in Granite Bay
The most prevalent vehicle ownership categories in Granite Bay are males with 2 vehicles (2,363, accounting for 44.9%) and females with 2 vehicles (1,745, making up 52.3%).
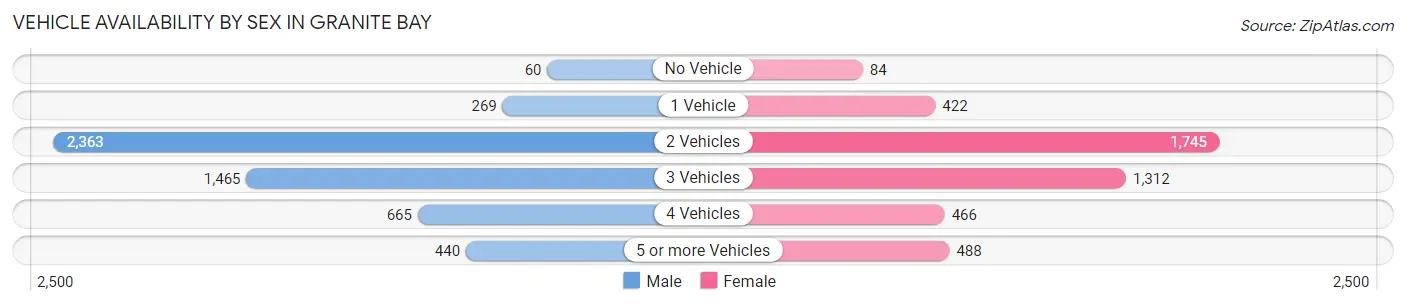
| Vehicles Available | Male | Female |
| No Vehicle | 60 (1.1%) | 84 (1.9%) |
| 1 Vehicle | 269 (5.1%) | 422 (9.3%) |
| 2 Vehicles | 2,363 (44.9%) | 1,745 (38.6%) |
| 3 Vehicles | 1,465 (27.8%) | 1,312 (29.0%) |
| 4 Vehicles | 665 (12.6%) | 466 (10.3%) |
| 5 or more Vehicles | 440 (8.4%) | 488 (10.8%) |
| Total | 5,262 (100.0%) | 4,517 (100.0%) |
Commute Time in Granite Bay
The most frequently occuring commute durations in Granite Bay are 15 to 19 minutes (1,175 commuters, 15.4%), 20 to 24 minutes (1,067 commuters, 14.0%), and 10 to 14 minutes (908 commuters, 11.9%).
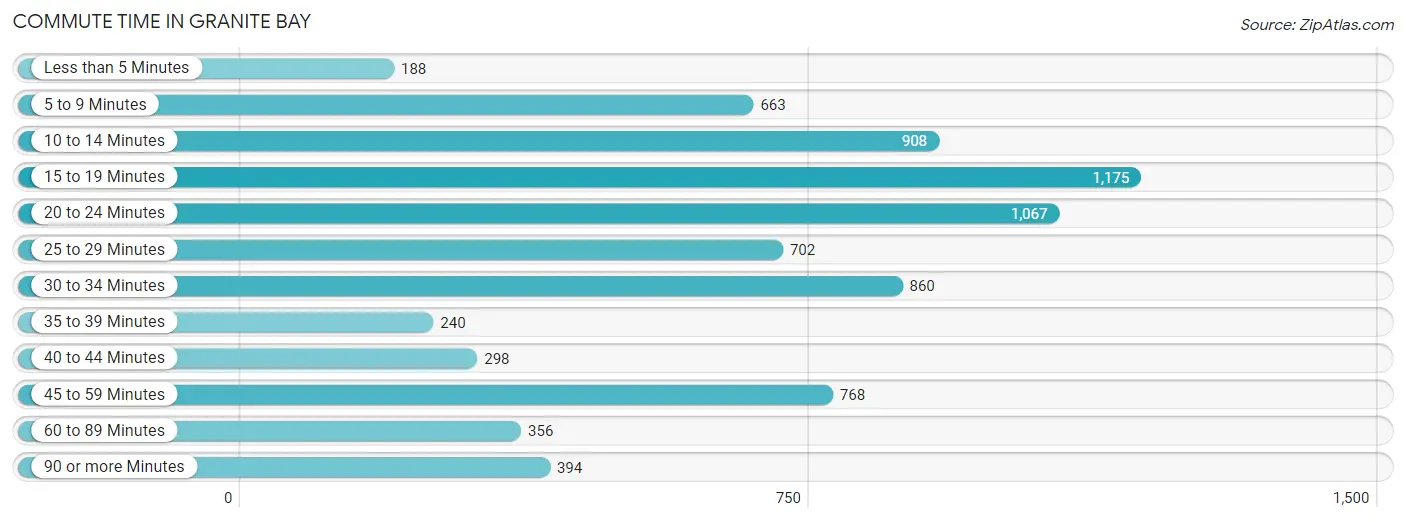
| Commute Time | # Commuters | % Commuters |
| Less than 5 Minutes | 188 | 2.5% |
| 5 to 9 Minutes | 663 | 8.7% |
| 10 to 14 Minutes | 908 | 11.9% |
| 15 to 19 Minutes | 1,175 | 15.4% |
| 20 to 24 Minutes | 1,067 | 14.0% |
| 25 to 29 Minutes | 702 | 9.2% |
| 30 to 34 Minutes | 860 | 11.3% |
| 35 to 39 Minutes | 240 | 3.2% |
| 40 to 44 Minutes | 298 | 3.9% |
| 45 to 59 Minutes | 768 | 10.1% |
| 60 to 89 Minutes | 356 | 4.7% |
| 90 or more Minutes | 394 | 5.2% |
Commute Time by Sex in Granite Bay
The most common commute times in Granite Bay are 15 to 19 minutes (702 commuters, 16.7%) for males and 10 to 14 minutes (507 commuters, 14.8%) for females.
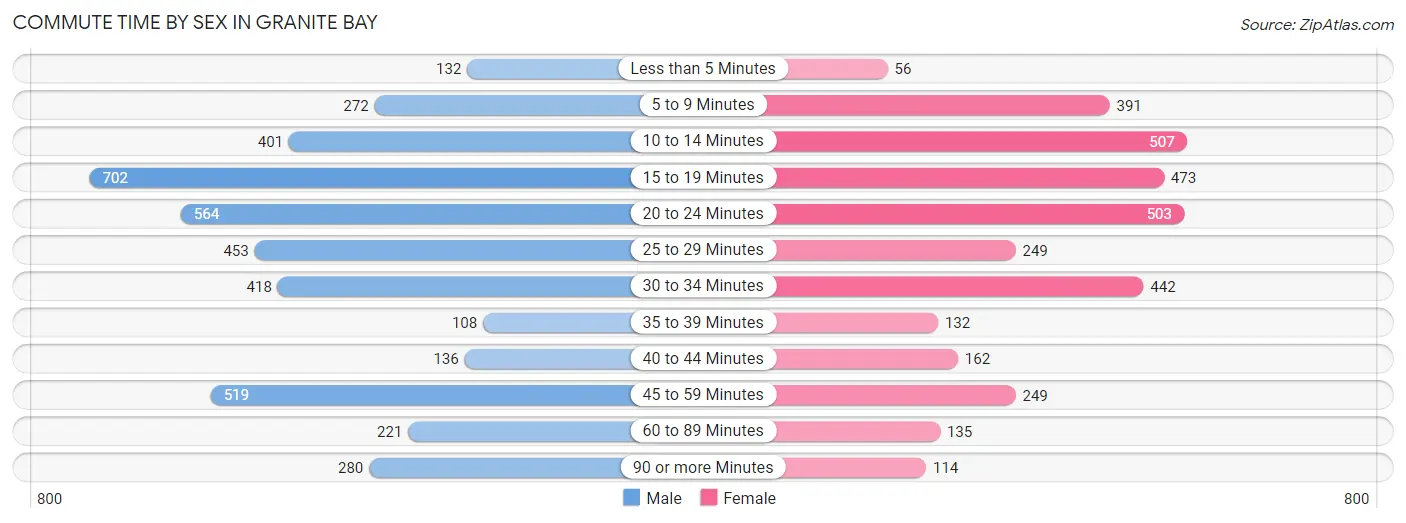
| Commute Time | Male | Female |
| Less than 5 Minutes | 132 (3.1%) | 56 (1.6%) |
| 5 to 9 Minutes | 272 (6.5%) | 391 (11.5%) |
| 10 to 14 Minutes | 401 (9.5%) | 507 (14.8%) |
| 15 to 19 Minutes | 702 (16.7%) | 473 (13.9%) |
| 20 to 24 Minutes | 564 (13.4%) | 503 (14.7%) |
| 25 to 29 Minutes | 453 (10.8%) | 249 (7.3%) |
| 30 to 34 Minutes | 418 (9.9%) | 442 (13.0%) |
| 35 to 39 Minutes | 108 (2.6%) | 132 (3.9%) |
| 40 to 44 Minutes | 136 (3.2%) | 162 (4.8%) |
| 45 to 59 Minutes | 519 (12.3%) | 249 (7.3%) |
| 60 to 89 Minutes | 221 (5.2%) | 135 (4.0%) |
| 90 or more Minutes | 280 (6.7%) | 114 (3.3%) |
Time of Departure to Work by Sex in Granite Bay
The most frequent times of departure to work in Granite Bay are 8:00 AM to 8:29 AM (782, 18.6%) for males and 7:30 AM to 7:59 AM (832, 24.4%) for females.
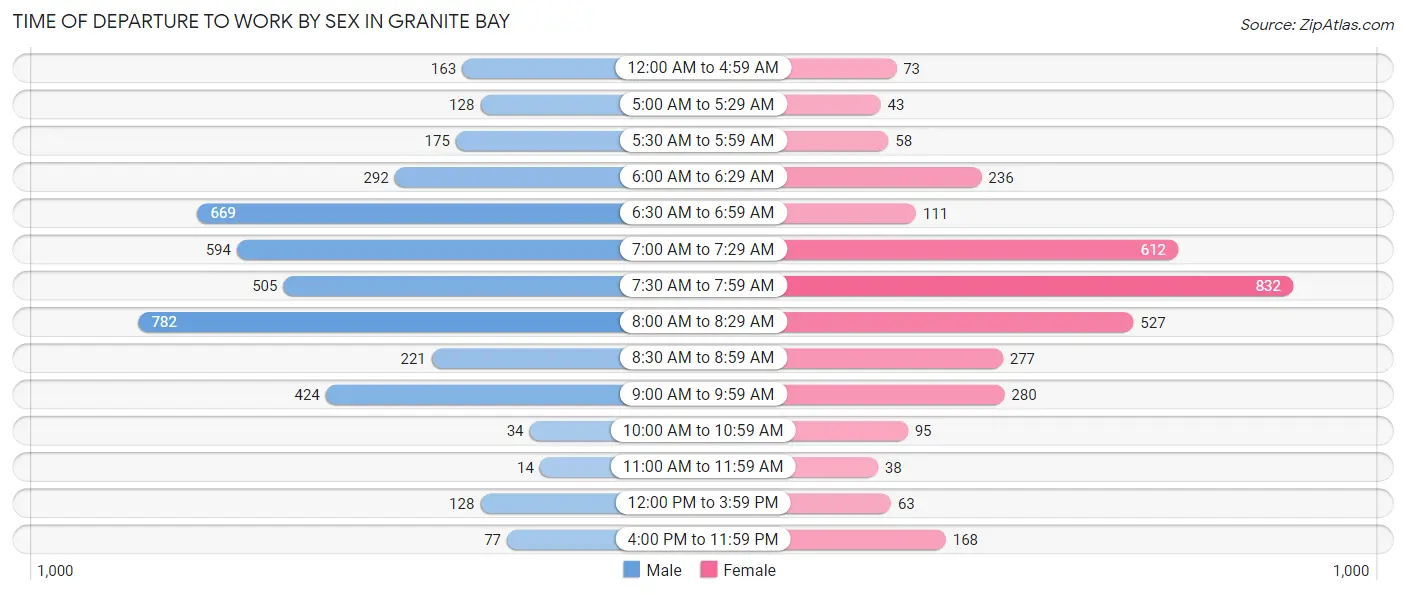
| Time of Departure | Male | Female |
| 12:00 AM to 4:59 AM | 163 (3.9%) | 73 (2.1%) |
| 5:00 AM to 5:29 AM | 128 (3.0%) | 43 (1.3%) |
| 5:30 AM to 5:59 AM | 175 (4.2%) | 58 (1.7%) |
| 6:00 AM to 6:29 AM | 292 (6.9%) | 236 (6.9%) |
| 6:30 AM to 6:59 AM | 669 (15.9%) | 111 (3.3%) |
| 7:00 AM to 7:29 AM | 594 (14.1%) | 612 (17.9%) |
| 7:30 AM to 7:59 AM | 505 (12.0%) | 832 (24.4%) |
| 8:00 AM to 8:29 AM | 782 (18.6%) | 527 (15.4%) |
| 8:30 AM to 8:59 AM | 221 (5.2%) | 277 (8.1%) |
| 9:00 AM to 9:59 AM | 424 (10.1%) | 280 (8.2%) |
| 10:00 AM to 10:59 AM | 34 (0.8%) | 95 (2.8%) |
| 11:00 AM to 11:59 AM | 14 (0.3%) | 38 (1.1%) |
| 12:00 PM to 3:59 PM | 128 (3.0%) | 63 (1.8%) |
| 4:00 PM to 11:59 PM | 77 (1.8%) | 168 (4.9%) |
| Total | 4,206 (100.0%) | 3,413 (100.0%) |
Housing Occupancy in Granite Bay
Occupancy by Ownership in Granite Bay
Of the total 7,731 dwellings in Granite Bay, owner-occupied units account for 7,084 (91.6%), while renter-occupied units make up 647 (8.4%).
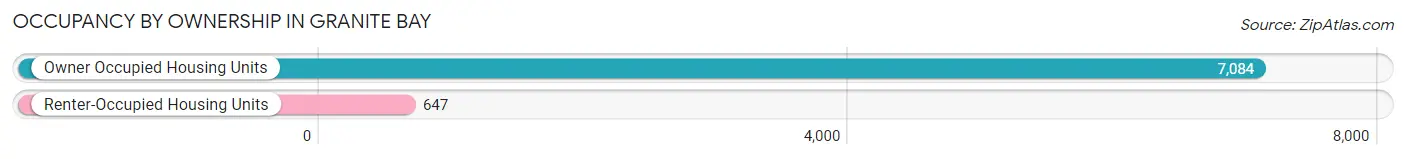
| Occupancy | # Housing Units | % Housing Units |
| Owner Occupied Housing Units | 7,084 | 91.6% |
| Renter-Occupied Housing Units | 647 | 8.4% |
| Total Occupied Housing Units | 7,731 | 100.0% |
Occupancy by Household Size in Granite Bay
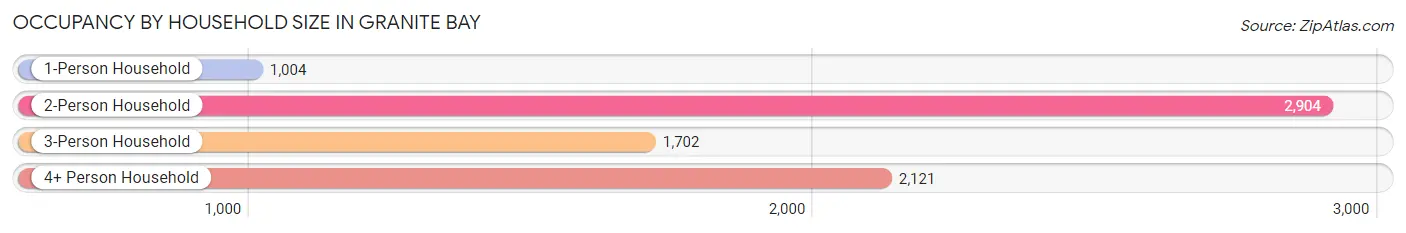
| Household Size | # Housing Units | % Housing Units |
| 1-Person Household | 1,004 | 13.0% |
| 2-Person Household | 2,904 | 37.6% |
| 3-Person Household | 1,702 | 22.0% |
| 4+ Person Household | 2,121 | 27.4% |
| Total Housing Units | 7,731 | 100.0% |
Occupancy by Ownership by Household Size in Granite Bay
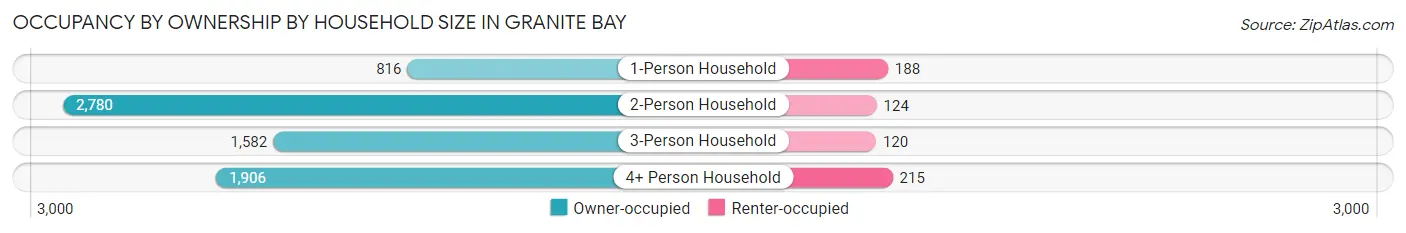
| Household Size | Owner-occupied | Renter-occupied |
| 1-Person Household | 816 (81.3%) | 188 (18.7%) |
| 2-Person Household | 2,780 (95.7%) | 124 (4.3%) |
| 3-Person Household | 1,582 (92.9%) | 120 (7.0%) |
| 4+ Person Household | 1,906 (89.9%) | 215 (10.1%) |
| Total Housing Units | 7,084 (91.6%) | 647 (8.4%) |
Occupancy by Educational Attainment in Granite Bay
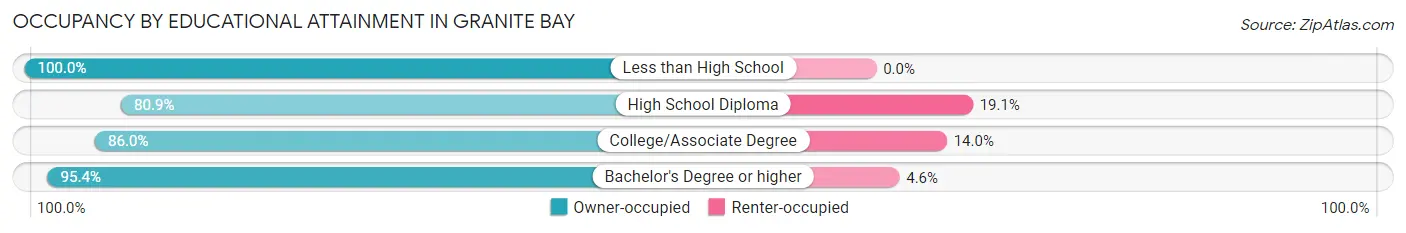
| Household Size | Owner-occupied | Renter-occupied |
| Less than High School | 71 (100.0%) | 0 (0.0%) |
| High School Diploma | 562 (80.9%) | 133 (19.1%) |
| College/Associate Degree | 1,783 (86.0%) | 290 (14.0%) |
| Bachelor's Degree or higher | 4,668 (95.4%) | 224 (4.6%) |
Occupancy by Age of Householder in Granite Bay
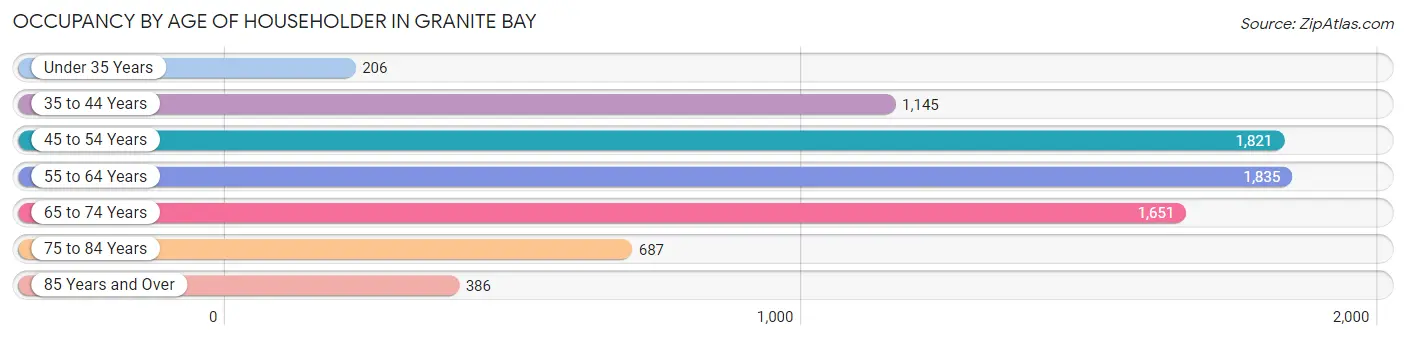
| Age Bracket | # Households | % Households |
| Under 35 Years | 206 | 2.7% |
| 35 to 44 Years | 1,145 | 14.8% |
| 45 to 54 Years | 1,821 | 23.5% |
| 55 to 64 Years | 1,835 | 23.7% |
| 65 to 74 Years | 1,651 | 21.4% |
| 75 to 84 Years | 687 | 8.9% |
| 85 Years and Over | 386 | 5.0% |
| Total | 7,731 | 100.0% |
Housing Finances in Granite Bay
Median Income by Occupancy in Granite Bay
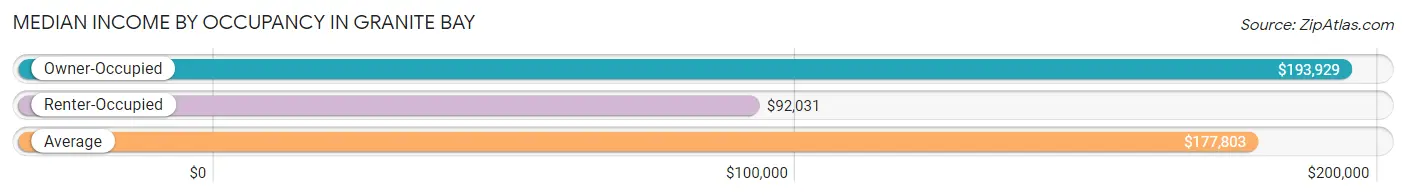
| Occupancy Type | # Households | Median Income |
| Owner-Occupied | 7,084 (91.6%) | $193,929 |
| Renter-Occupied | 647 (8.4%) | $92,031 |
| Average | 7,731 (100.0%) | $177,803 |
Occupancy by Householder Income Bracket in Granite Bay
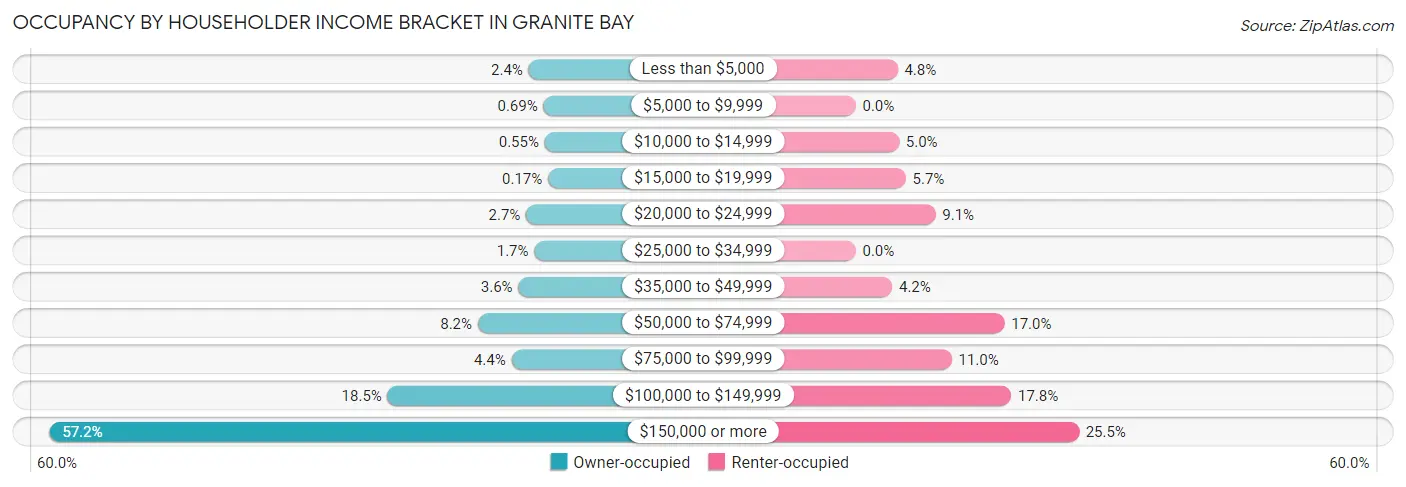
| Income Bracket | Owner-occupied | Renter-occupied |
| Less than $5,000 | 169 (2.4%) | 31 (4.8%) |
| $5,000 to $9,999 | 49 (0.7%) | 0 (0.0%) |
| $10,000 to $14,999 | 39 (0.5%) | 32 (5.0%) |
| $15,000 to $19,999 | 12 (0.2%) | 37 (5.7%) |
| $20,000 to $24,999 | 190 (2.7%) | 59 (9.1%) |
| $25,000 to $34,999 | 123 (1.7%) | 0 (0.0%) |
| $35,000 to $49,999 | 252 (3.6%) | 27 (4.2%) |
| $50,000 to $74,999 | 581 (8.2%) | 110 (17.0%) |
| $75,000 to $99,999 | 308 (4.3%) | 71 (11.0%) |
| $100,000 to $149,999 | 1,311 (18.5%) | 115 (17.8%) |
| $150,000 or more | 4,050 (57.2%) | 165 (25.5%) |
| Total | 7,084 (100.0%) | 647 (100.0%) |
Monthly Housing Cost Tiers in Granite Bay
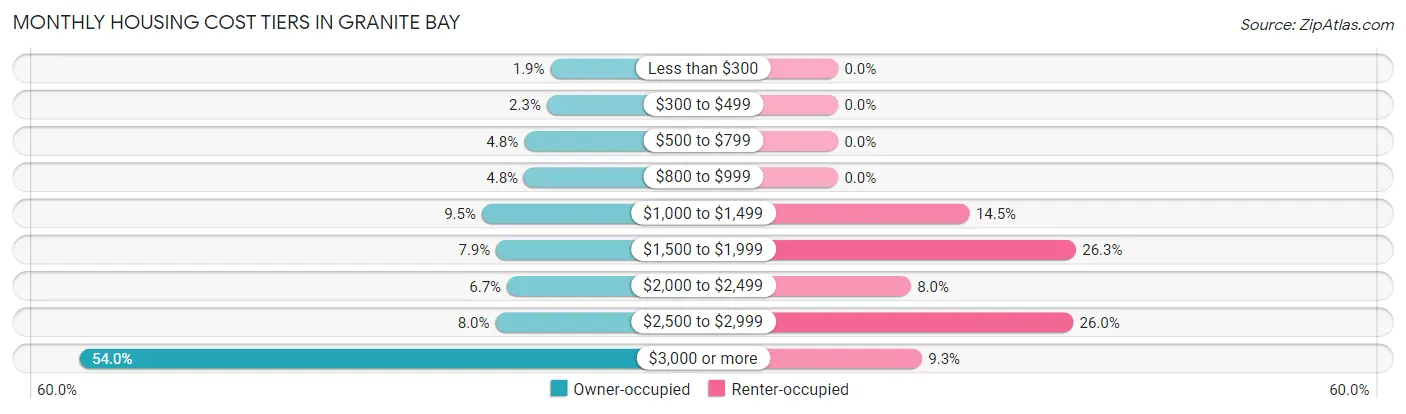
| Monthly Cost | Owner-occupied | Renter-occupied |
| Less than $300 | 136 (1.9%) | 0 (0.0%) |
| $300 to $499 | 164 (2.3%) | 0 (0.0%) |
| $500 to $799 | 342 (4.8%) | 0 (0.0%) |
| $800 to $999 | 343 (4.8%) | 0 (0.0%) |
| $1,000 to $1,499 | 672 (9.5%) | 94 (14.5%) |
| $1,500 to $1,999 | 561 (7.9%) | 170 (26.3%) |
| $2,000 to $2,499 | 476 (6.7%) | 52 (8.0%) |
| $2,500 to $2,999 | 566 (8.0%) | 168 (26.0%) |
| $3,000 or more | 3,824 (54.0%) | 60 (9.3%) |
| Total | 7,084 (100.0%) | 647 (100.0%) |
Physical Housing Characteristics in Granite Bay
Housing Structures in Granite Bay
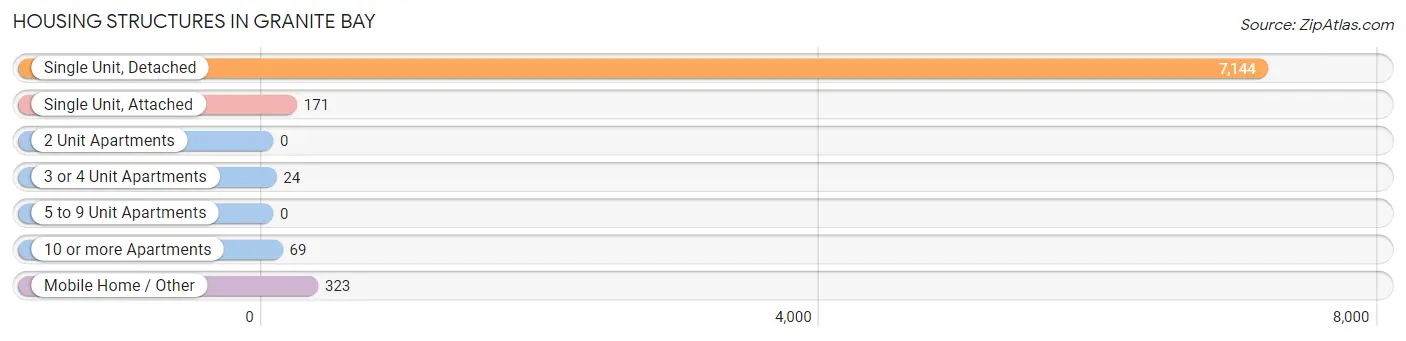
| Structure Type | # Housing Units | % Housing Units |
| Single Unit, Detached | 7,144 | 92.4% |
| Single Unit, Attached | 171 | 2.2% |
| 2 Unit Apartments | 0 | 0.0% |
| 3 or 4 Unit Apartments | 24 | 0.3% |
| 5 to 9 Unit Apartments | 0 | 0.0% |
| 10 or more Apartments | 69 | 0.9% |
| Mobile Home / Other | 323 | 4.2% |
| Total | 7,731 | 100.0% |
Housing Structures by Occupancy in Granite Bay
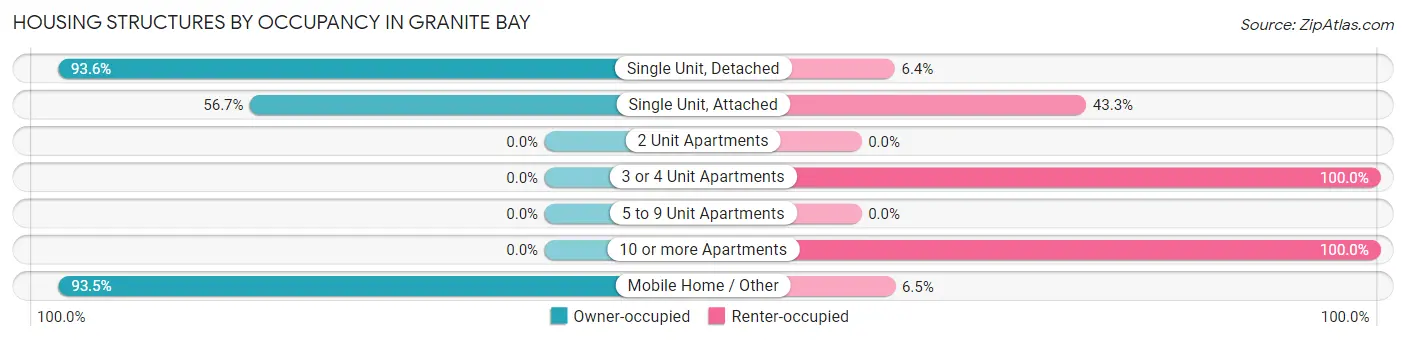
| Structure Type | Owner-occupied | Renter-occupied |
| Single Unit, Detached | 6,685 (93.6%) | 459 (6.4%) |
| Single Unit, Attached | 97 (56.7%) | 74 (43.3%) |
| 2 Unit Apartments | 0 (0.0%) | 0 (0.0%) |
| 3 or 4 Unit Apartments | 0 (0.0%) | 24 (100.0%) |
| 5 to 9 Unit Apartments | 0 (0.0%) | 0 (0.0%) |
| 10 or more Apartments | 0 (0.0%) | 69 (100.0%) |
| Mobile Home / Other | 302 (93.5%) | 21 (6.5%) |
| Total | 7,084 (91.6%) | 647 (8.4%) |
Housing Structures by Number of Rooms in Granite Bay
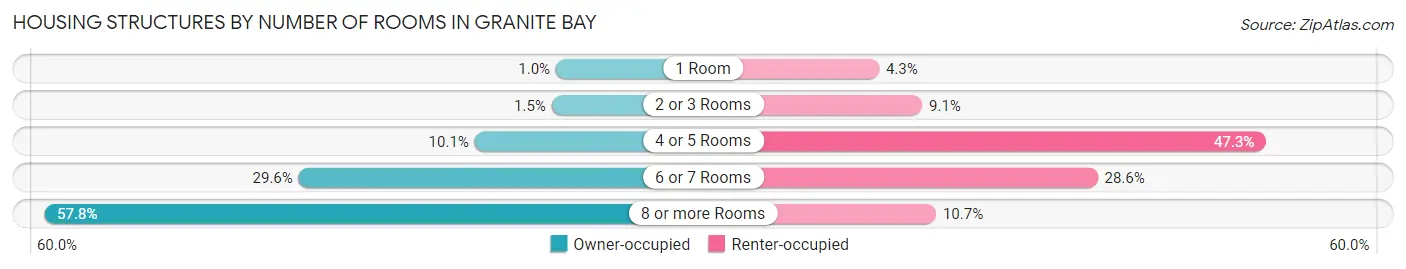
| Number of Rooms | Owner-occupied | Renter-occupied |
| 1 Room | 73 (1.0%) | 28 (4.3%) |
| 2 or 3 Rooms | 106 (1.5%) | 59 (9.1%) |
| 4 or 5 Rooms | 712 (10.1%) | 306 (47.3%) |
| 6 or 7 Rooms | 2,096 (29.6%) | 185 (28.6%) |
| 8 or more Rooms | 4,097 (57.8%) | 69 (10.7%) |
| Total | 7,084 (100.0%) | 647 (100.0%) |
Housing Structure by Heating Type in Granite Bay
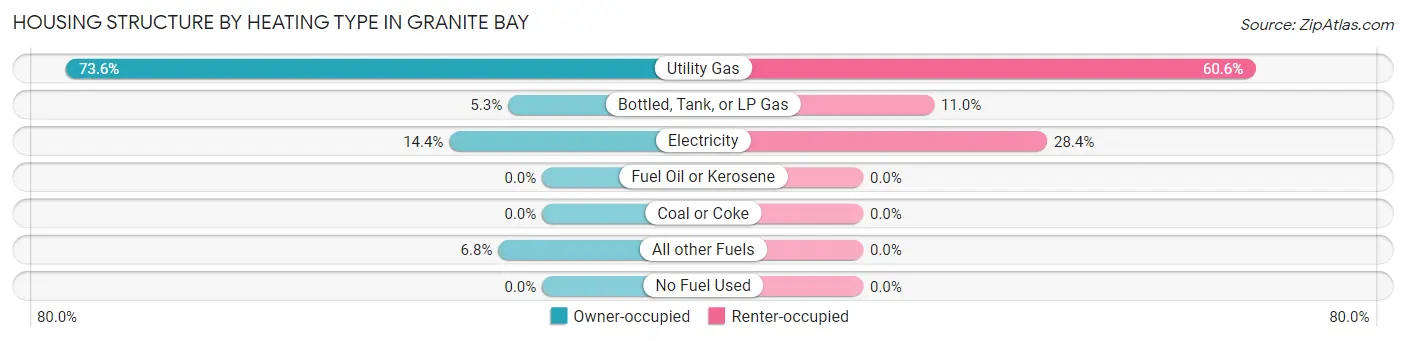
| Heating Type | Owner-occupied | Renter-occupied |
| Utility Gas | 5,214 (73.6%) | 392 (60.6%) |
| Bottled, Tank, or LP Gas | 373 (5.3%) | 71 (11.0%) |
| Electricity | 1,017 (14.4%) | 184 (28.4%) |
| Fuel Oil or Kerosene | 0 (0.0%) | 0 (0.0%) |
| Coal or Coke | 0 (0.0%) | 0 (0.0%) |
| All other Fuels | 480 (6.8%) | 0 (0.0%) |
| No Fuel Used | 0 (0.0%) | 0 (0.0%) |
| Total | 7,084 (100.0%) | 647 (100.0%) |
Household Vehicle Usage in Granite Bay
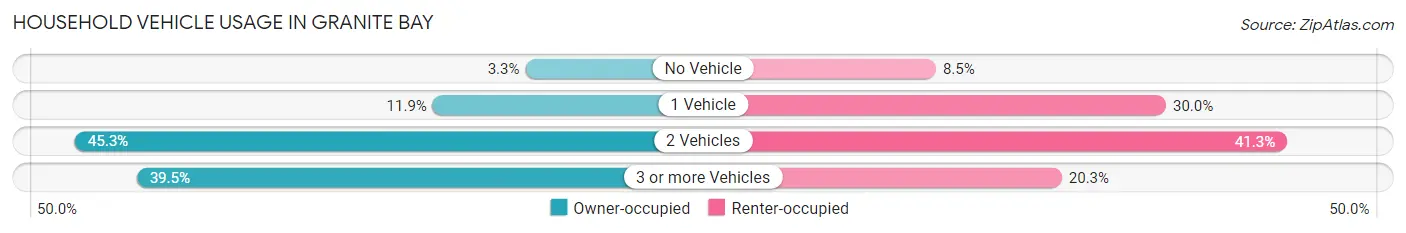
| Vehicles per Household | Owner-occupied | Renter-occupied |
| No Vehicle | 231 (3.3%) | 55 (8.5%) |
| 1 Vehicle | 844 (11.9%) | 194 (30.0%) |
| 2 Vehicles | 3,209 (45.3%) | 267 (41.3%) |
| 3 or more Vehicles | 2,800 (39.5%) | 131 (20.3%) |
| Total | 7,084 (100.0%) | 647 (100.0%) |
Real Estate & Mortgages in Granite Bay
Real Estate and Mortgage Overview in Granite Bay
| Characteristic | Without Mortgage | With Mortgage |
| Housing Units | 2,309 | 4,775 |
| Median Property Value | $899,600 | $1,071,900 |
| Median Household Income | $116,354 | $3,210 |
| Monthly Housing Costs | $1,158 | $3,759 |
| Real Estate Taxes | $7,388 | $82 |
Property Value by Mortgage Status in Granite Bay
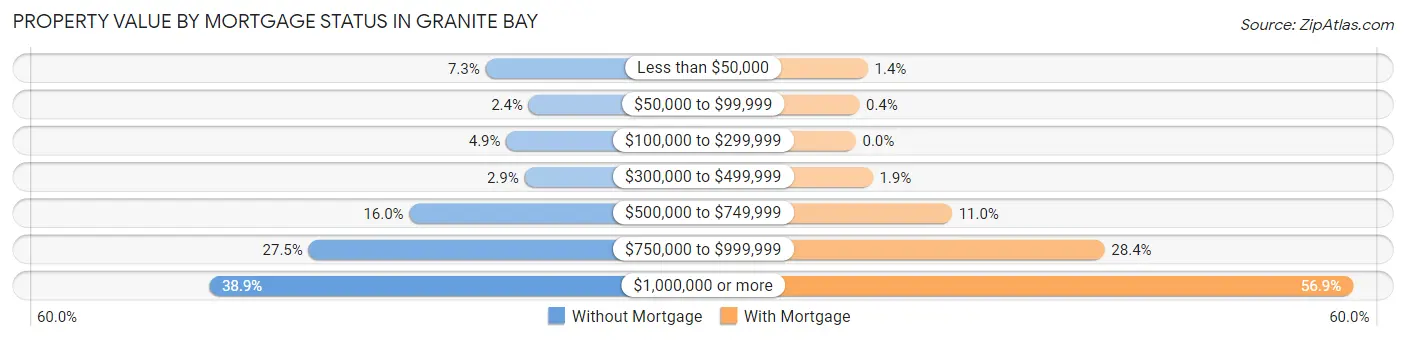
| Property Value | Without Mortgage | With Mortgage |
| Less than $50,000 | 169 (7.3%) | 66 (1.4%) |
| $50,000 to $99,999 | 55 (2.4%) | 19 (0.4%) |
| $100,000 to $299,999 | 114 (4.9%) | 0 (0.0%) |
| $300,000 to $499,999 | 66 (2.9%) | 92 (1.9%) |
| $500,000 to $749,999 | 370 (16.0%) | 525 (11.0%) |
| $750,000 to $999,999 | 636 (27.5%) | 1,358 (28.4%) |
| $1,000,000 or more | 899 (38.9%) | 2,715 (56.9%) |
| Total | 2,309 (100.0%) | 4,775 (100.0%) |
Household Income by Mortgage Status in Granite Bay
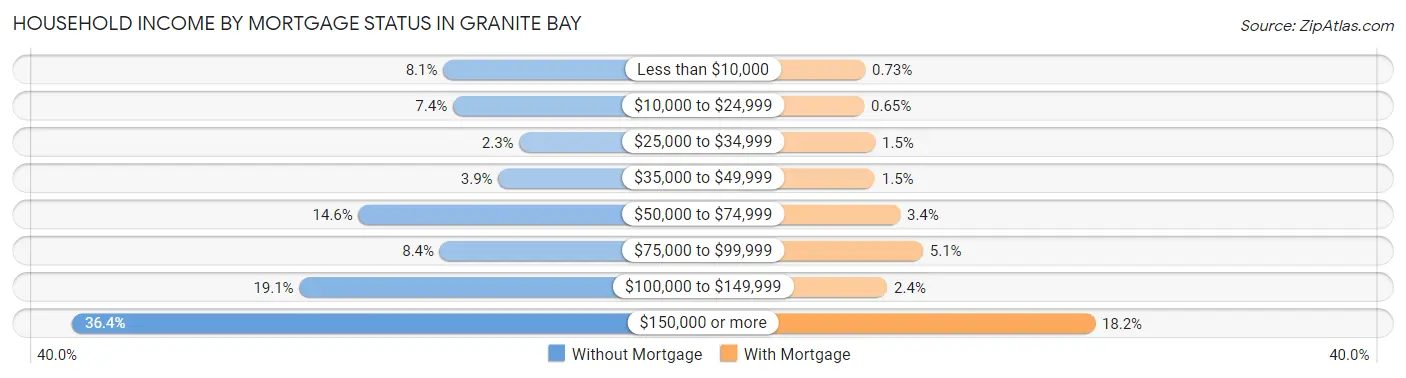
| Household Income | Without Mortgage | With Mortgage |
| Less than $10,000 | 187 (8.1%) | 35 (0.7%) |
| $10,000 to $24,999 | 170 (7.4%) | 31 (0.6%) |
| $25,000 to $34,999 | 53 (2.3%) | 71 (1.5%) |
| $35,000 to $49,999 | 90 (3.9%) | 70 (1.5%) |
| $50,000 to $74,999 | 336 (14.5%) | 162 (3.4%) |
| $75,000 to $99,999 | 193 (8.4%) | 245 (5.1%) |
| $100,000 to $149,999 | 440 (19.1%) | 115 (2.4%) |
| $150,000 or more | 840 (36.4%) | 871 (18.2%) |
| Total | 2,309 (100.0%) | 4,775 (100.0%) |
Property Value to Household Income Ratio in Granite Bay
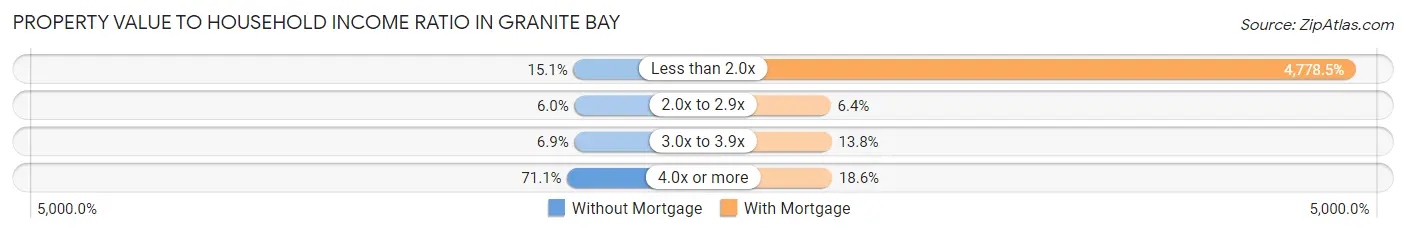
| Value-to-Income Ratio | Without Mortgage | With Mortgage |
| Less than 2.0x | 349 (15.1%) | 228,173 (4,778.5%) |
| 2.0x to 2.9x | 139 (6.0%) | 303 (6.4%) |
| 3.0x to 3.9x | 159 (6.9%) | 658 (13.8%) |
| 4.0x or more | 1,642 (71.1%) | 888 (18.6%) |
| Total | 2,309 (100.0%) | 4,775 (100.0%) |
Real Estate Taxes by Mortgage Status in Granite Bay
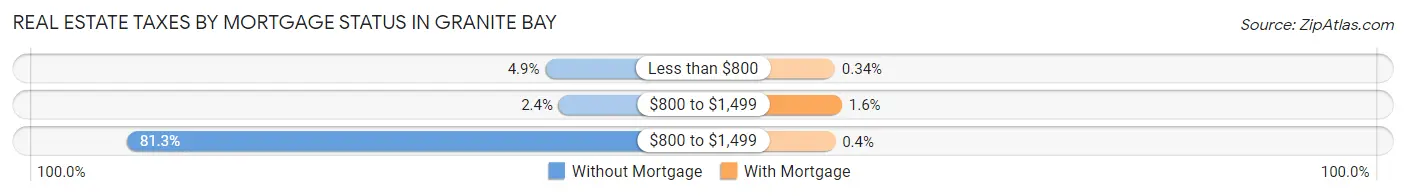
| Property Taxes | Without Mortgage | With Mortgage |
| Less than $800 | 113 (4.9%) | 16 (0.3%) |
| $800 to $1,499 | 56 (2.4%) | 77 (1.6%) |
| $800 to $1,499 | 1,878 (81.3%) | 19 (0.4%) |
| Total | 2,309 (100.0%) | 4,775 (100.0%) |
Health & Disability in Granite Bay
Health Insurance Coverage by Age in Granite Bay
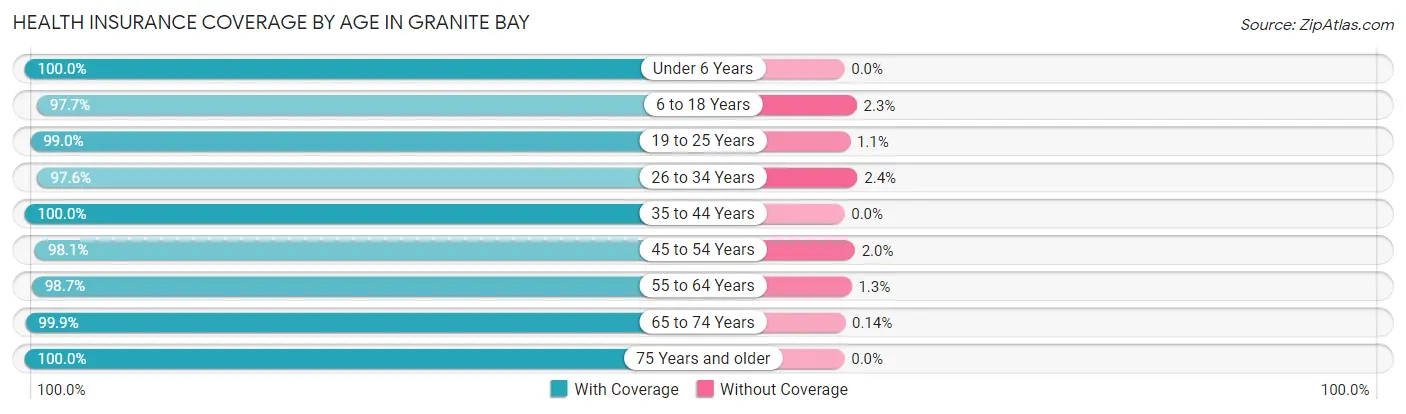
| Age Bracket | With Coverage | Without Coverage |
| Under 6 Years | 1,022 (100.0%) | 0 (0.0%) |
| 6 to 18 Years | 4,404 (97.7%) | 103 (2.3%) |
| 19 to 25 Years | 1,318 (99.0%) | 14 (1.1%) |
| 26 to 34 Years | 840 (97.6%) | 21 (2.4%) |
| 35 to 44 Years | 2,604 (100.0%) | 0 (0.0%) |
| 45 to 54 Years | 3,320 (98.1%) | 66 (1.9%) |
| 55 to 64 Years | 3,618 (98.7%) | 49 (1.3%) |
| 65 to 74 Years | 2,866 (99.9%) | 4 (0.1%) |
| 75 Years and older | 1,901 (100.0%) | 0 (0.0%) |
| Total | 21,893 (98.8%) | 257 (1.2%) |
Health Insurance Coverage by Citizenship Status in Granite Bay
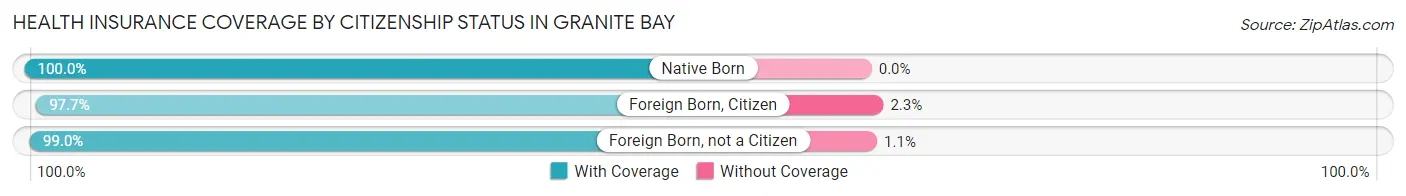
| Citizenship Status | With Coverage | Without Coverage |
| Native Born | 1,022 (100.0%) | 0 (0.0%) |
| Foreign Born, Citizen | 4,404 (97.7%) | 103 (2.3%) |
| Foreign Born, not a Citizen | 1,318 (99.0%) | 14 (1.1%) |
Health Insurance Coverage by Household Income in Granite Bay
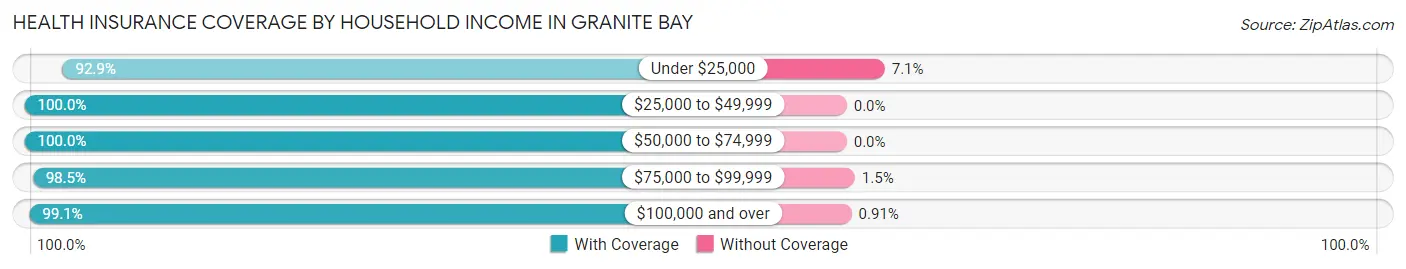
| Household Income | With Coverage | Without Coverage |
| Under $25,000 | 1,031 (92.9%) | 79 (7.1%) |
| $25,000 to $49,999 | 719 (100.0%) | 0 (0.0%) |
| $50,000 to $74,999 | 1,773 (100.0%) | 0 (0.0%) |
| $75,000 to $99,999 | 907 (98.5%) | 14 (1.5%) |
| $100,000 and over | 17,359 (99.1%) | 159 (0.9%) |
Public vs Private Health Insurance Coverage by Age in Granite Bay
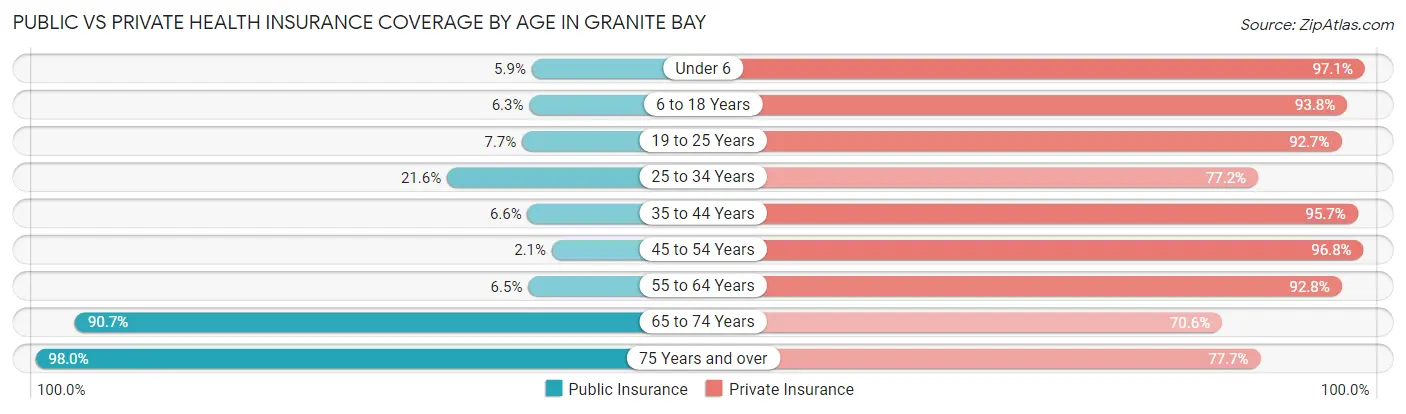
| Age Bracket | Public Insurance | Private Insurance |
| Under 6 | 60 (5.9%) | 992 (97.1%) |
| 6 to 18 Years | 285 (6.3%) | 4,227 (93.8%) |
| 19 to 25 Years | 102 (7.7%) | 1,235 (92.7%) |
| 25 to 34 Years | 186 (21.6%) | 665 (77.2%) |
| 35 to 44 Years | 173 (6.6%) | 2,493 (95.7%) |
| 45 to 54 Years | 72 (2.1%) | 3,278 (96.8%) |
| 55 to 64 Years | 239 (6.5%) | 3,402 (92.8%) |
| 65 to 74 Years | 2,602 (90.7%) | 2,025 (70.6%) |
| 75 Years and over | 1,863 (98.0%) | 1,477 (77.7%) |
| Total | 5,582 (25.2%) | 19,794 (89.4%) |
Disability Status by Sex by Age in Granite Bay
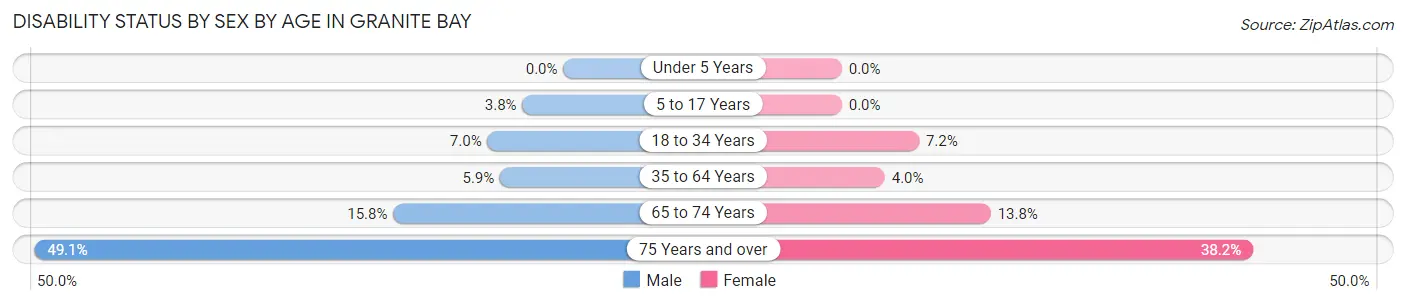
| Age Bracket | Male | Female |
| Under 5 Years | 0 (0.0%) | 0 (0.0%) |
| 5 to 17 Years | 84 (3.8%) | 0 (0.0%) |
| 18 to 34 Years | 83 (7.0%) | 98 (7.2%) |
| 35 to 64 Years | 286 (5.9%) | 191 (4.0%) |
| 65 to 74 Years | 245 (15.8%) | 182 (13.8%) |
| 75 Years and over | 438 (49.1%) | 385 (38.2%) |
Disability Class by Sex by Age in Granite Bay
Disability Class: Hearing Difficulty
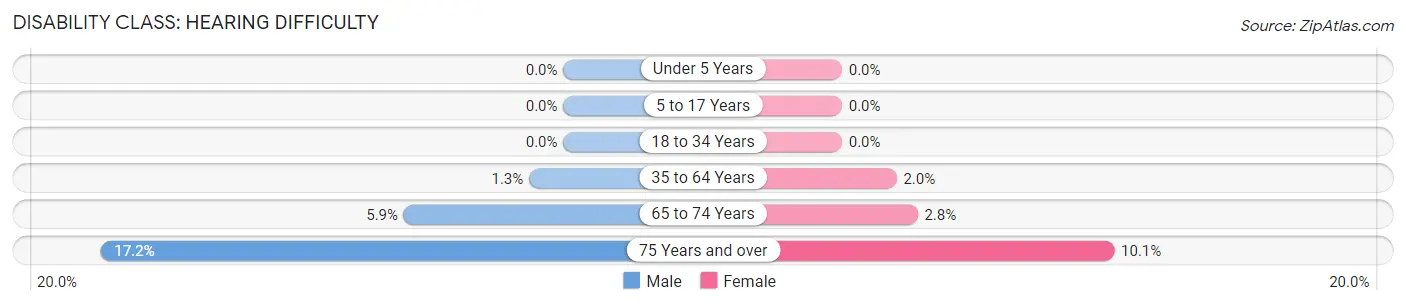
| Age Bracket | Male | Female |
| Under 5 Years | 0 (0.0%) | 0 (0.0%) |
| 5 to 17 Years | 0 (0.0%) | 0 (0.0%) |
| 18 to 34 Years | 0 (0.0%) | 0 (0.0%) |
| 35 to 64 Years | 62 (1.3%) | 97 (2.0%) |
| 65 to 74 Years | 92 (5.9%) | 37 (2.8%) |
| 75 Years and over | 153 (17.2%) | 102 (10.1%) |
Disability Class: Vision Difficulty
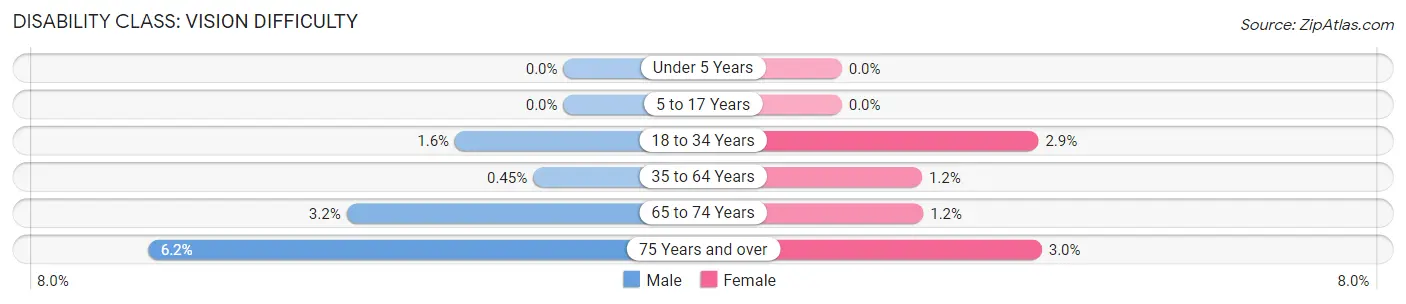
| Age Bracket | Male | Female |
| Under 5 Years | 0 (0.0%) | 0 (0.0%) |
| 5 to 17 Years | 0 (0.0%) | 0 (0.0%) |
| 18 to 34 Years | 19 (1.6%) | 40 (2.9%) |
| 35 to 64 Years | 22 (0.4%) | 57 (1.2%) |
| 65 to 74 Years | 50 (3.2%) | 16 (1.2%) |
| 75 Years and over | 55 (6.2%) | 30 (3.0%) |
Disability Class: Cognitive Difficulty
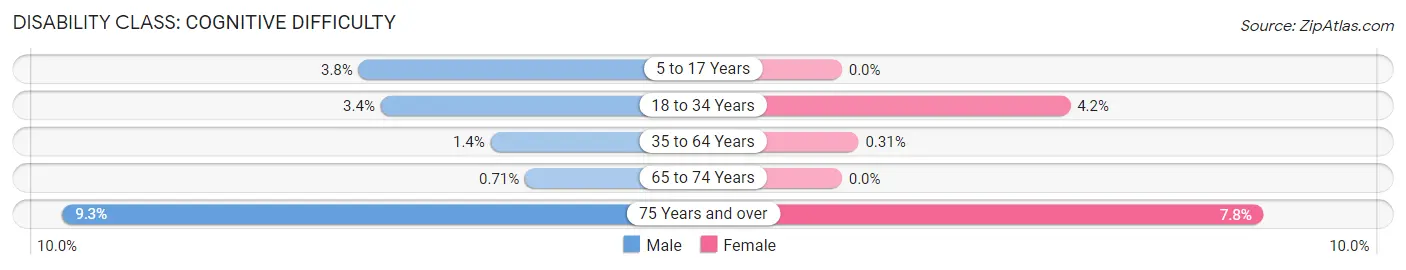
| Age Bracket | Male | Female |
| 5 to 17 Years | 84 (3.8%) | 0 (0.0%) |
| 18 to 34 Years | 40 (3.4%) | 58 (4.2%) |
| 35 to 64 Years | 66 (1.3%) | 15 (0.3%) |
| 65 to 74 Years | 11 (0.7%) | 0 (0.0%) |
| 75 Years and over | 83 (9.3%) | 79 (7.8%) |
Disability Class: Ambulatory Difficulty
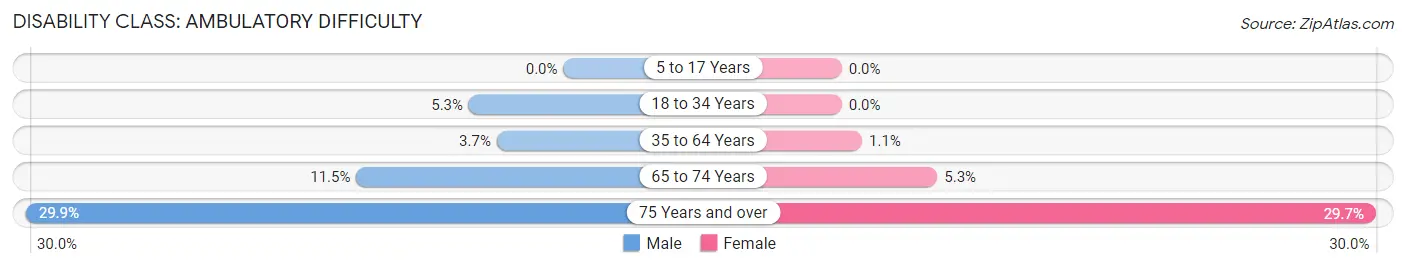
| Age Bracket | Male | Female |
| 5 to 17 Years | 0 (0.0%) | 0 (0.0%) |
| 18 to 34 Years | 62 (5.3%) | 0 (0.0%) |
| 35 to 64 Years | 181 (3.7%) | 54 (1.1%) |
| 65 to 74 Years | 179 (11.5%) | 70 (5.3%) |
| 75 Years and over | 267 (29.9%) | 300 (29.7%) |
Disability Class: Self-Care Difficulty
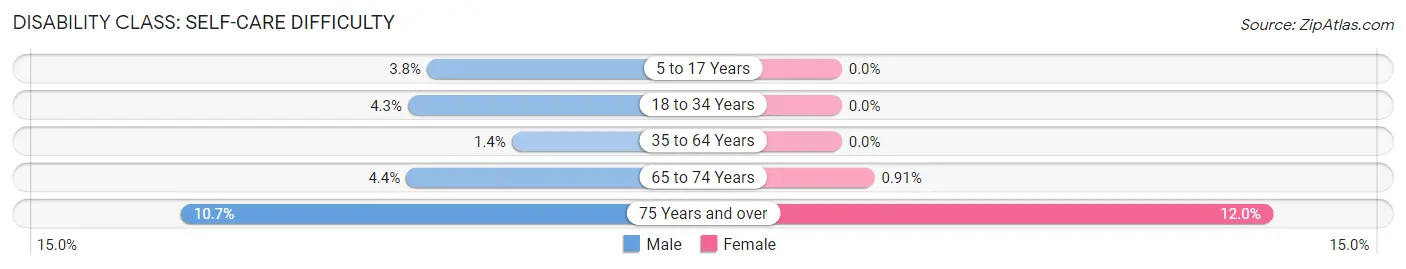
| Age Bracket | Male | Female |
| 5 to 17 Years | 84 (3.8%) | 0 (0.0%) |
| 18 to 34 Years | 51 (4.3%) | 0 (0.0%) |
| 35 to 64 Years | 70 (1.4%) | 0 (0.0%) |
| 65 to 74 Years | 68 (4.4%) | 12 (0.9%) |
| 75 Years and over | 95 (10.6%) | 121 (12.0%) |
Technology Access in Granite Bay
Computing Device Access in Granite Bay
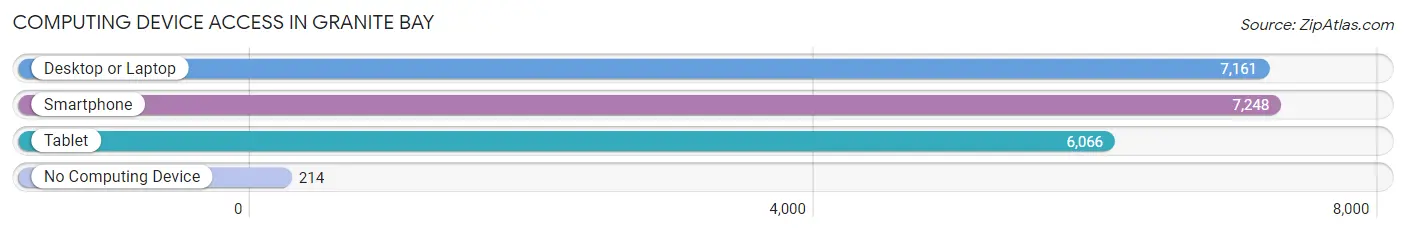
| Device Type | # Households | % Households |
| Desktop or Laptop | 7,161 | 92.6% |
| Smartphone | 7,248 | 93.8% |
| Tablet | 6,066 | 78.5% |
| No Computing Device | 214 | 2.8% |
| Total | 7,731 | 100.0% |
Internet Access in Granite Bay
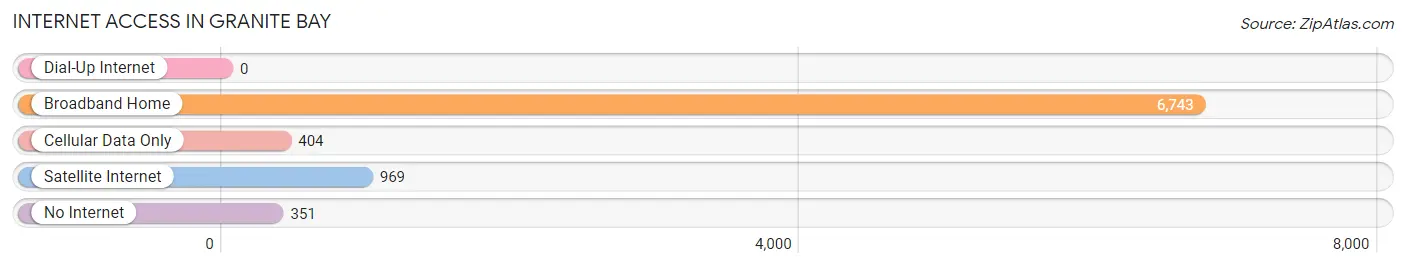
| Internet Type | # Households | % Households |
| Dial-Up Internet | 0 | 0.0% |
| Broadband Home | 6,743 | 87.2% |
| Cellular Data Only | 404 | 5.2% |
| Satellite Internet | 969 | 12.5% |
| No Internet | 351 | 4.5% |
| Total | 7,731 | 100.0% |
Granite Bay Summary
Granite Bay is a census-designated place located in Placer County, California, United States. It is part of the Sacramento–Arden-Arcade–Roseville Metropolitan Statistical Area. The population was 20,402 at the 2010 census, up from 19,388 at the 2000 census.
History
Granite Bay was originally inhabited by the Maidu Indians, who lived in the area for thousands of years before the arrival of European settlers. The first Europeans to settle in the area were miners and ranchers in the mid-1800s. The area was known as “Granite Bay” due to the abundance of granite in the area.
In the early 1900s, the area was developed as a resort community, with many of the homes being built by wealthy San Franciscans. The area was also home to a number of summer camps, including Camp Far West, which was a popular destination for children from the Bay Area.
In the 1950s, Granite Bay began to experience rapid growth as the population of the Sacramento area increased. The area was incorporated as a city in 1964, and the population continued to grow throughout the 1970s and 1980s.
Geography
Granite Bay is located at 38°45'25" North, 121°10'45" West (38.756944, -121.179167). It is situated in the foothills of the Sierra Nevada mountain range, approximately 25 miles northeast of Sacramento.
The area is characterized by rolling hills and valleys, with granite outcroppings throughout. The area is home to several lakes, including Folsom Lake, which is the largest lake in the area.
Economy
Granite Bay is home to a number of businesses, including technology companies, medical offices, and retail stores. The area is also home to a number of corporate headquarters, including Intel, Hewlett-Packard, and Oracle.
The area is also home to a number of wineries, including the Granite Bay Winery, which produces a variety of wines from grapes grown in the area.
Demographics
As of the 2010 census, the population of Granite Bay was 20,402. The racial makeup of the city was 87.2% White, 4.2% Asian, 2.7% African American, 0.7% Native American, 0.2% Pacific Islander, and 4.0% from other races. Hispanic or Latino of any race were 8.3% of the population.
The median household income in Granite Bay was $118,845, and the median family income was $133,917. The per capita income for the city was $50,945. About 2.7% of families and 3.7% of the population were below the poverty line, including 4.2% of those under age 18 and 2.2% of those age 65 or over.
Common Questions
What is Per Capita Income in Granite Bay?
Per Capita income in Granite Bay is $82,448.
What is the Median Family Income in Granite Bay?
Median Family Income in Granite Bay is $203,929.
What is the Median Household income in Granite Bay?
Median Household Income in Granite Bay is $177,803.
What is Income or Wage Gap in Granite Bay?
Income or Wage Gap in Granite Bay is 52.8%.
Women in Granite Bay earn 47.2 cents for every dollar earned by a man.
What is Inequality or Gini Index in Granite Bay?
Inequality or Gini Index in Granite Bay is 0.46.
What is the Total Population of Granite Bay?
Total Population of Granite Bay is 22,180.
What is the Total Male Population of Granite Bay?
Total Male Population of Granite Bay is 11,082.
What is the Total Female Population of Granite Bay?
Total Female Population of Granite Bay is 11,098.
What is the Ratio of Males per 100 Females in Granite Bay?
There are 99.86 Males per 100 Females in Granite Bay.
What is the Ratio of Females per 100 Males in Granite Bay?
There are 100.14 Females per 100 Males in Granite Bay.
What is the Median Population Age in Granite Bay?
Median Population Age in Granite Bay is 47.7 Years.
What is the Average Family Size in Granite Bay
Average Family Size in Granite Bay is 3.1 People.
What is the Average Household Size in Granite Bay
Average Household Size in Granite Bay is 2.9 People.
How Large is the Labor Force in Granite Bay?
There are 10,410 People in the Labor Forcein in Granite Bay.
What is the Percentage of People in the Labor Force in Granite Bay?
58.6% of People are in the Labor Force in Granite Bay.
What is the Unemployment Rate in Granite Bay?
Unemployment Rate in Granite Bay is 3.9%.