Goleta, CA Map & Demographics
Goleta Map
Goleta Overview
$49,259
PER CAPITA INCOME
$133,427
AVG FAMILY INCOME
$113,889
AVG HOUSEHOLD INCOME
24.6%
WAGE / INCOME GAP [ % ]
75.4¢/ $1
WAGE / INCOME GAP [ $ ]
0.41
INEQUALITY / GINI INDEX
32,640
TOTAL POPULATION
16,879
MALE POPULATION
15,761
FEMALE POPULATION
107.09
MALES / 100 FEMALES
93.38
FEMALES / 100 MALES
35.0
MEDIAN AGE
3.3
AVG FAMILY SIZE
2.7
AVG HOUSEHOLD SIZE
18,445
LABOR FORCE [ PEOPLE ]
68.4%
PERCENT IN LABOR FORCE
4.0%
UNEMPLOYMENT RATE
Goleta Zip Codes
Goleta Area Codes
Income in Goleta
Income Overview in Goleta
Per Capita Income in Goleta is $49,259, while median incomes of families and households are $133,427 and $113,889 respectively.
| Characteristic | Number | Measure |
| Per Capita Income | 32,640 | $49,259 |
| Median Family Income | 7,234 | $133,427 |
| Mean Family Income | 7,234 | $154,335 |
| Median Household Income | 11,938 | $113,889 |
| Mean Household Income | 11,938 | $134,224 |
| Income Deficit | 7,234 | $0 |
| Wage / Income Gap (%) | 32,640 | 24.60% |
| Wage / Income Gap ($) | 32,640 | 75.40¢ per $1 |
| Gini / Inequality Index | 32,640 | 0.41 |
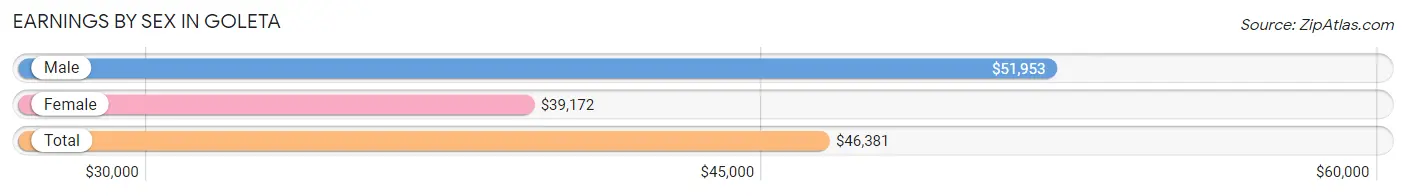
Earnings by Sex in Goleta
Average Earnings in Goleta are $46,381, $51,953 for men and $39,172 for women, a difference of 24.6%.
| Sex | Number | Average Earnings |
| Male | 10,764 (55.3%) | $51,953 |
| Female | 8,711 (44.7%) | $39,172 |
| Total | 19,475 (100.0%) | $46,381 |
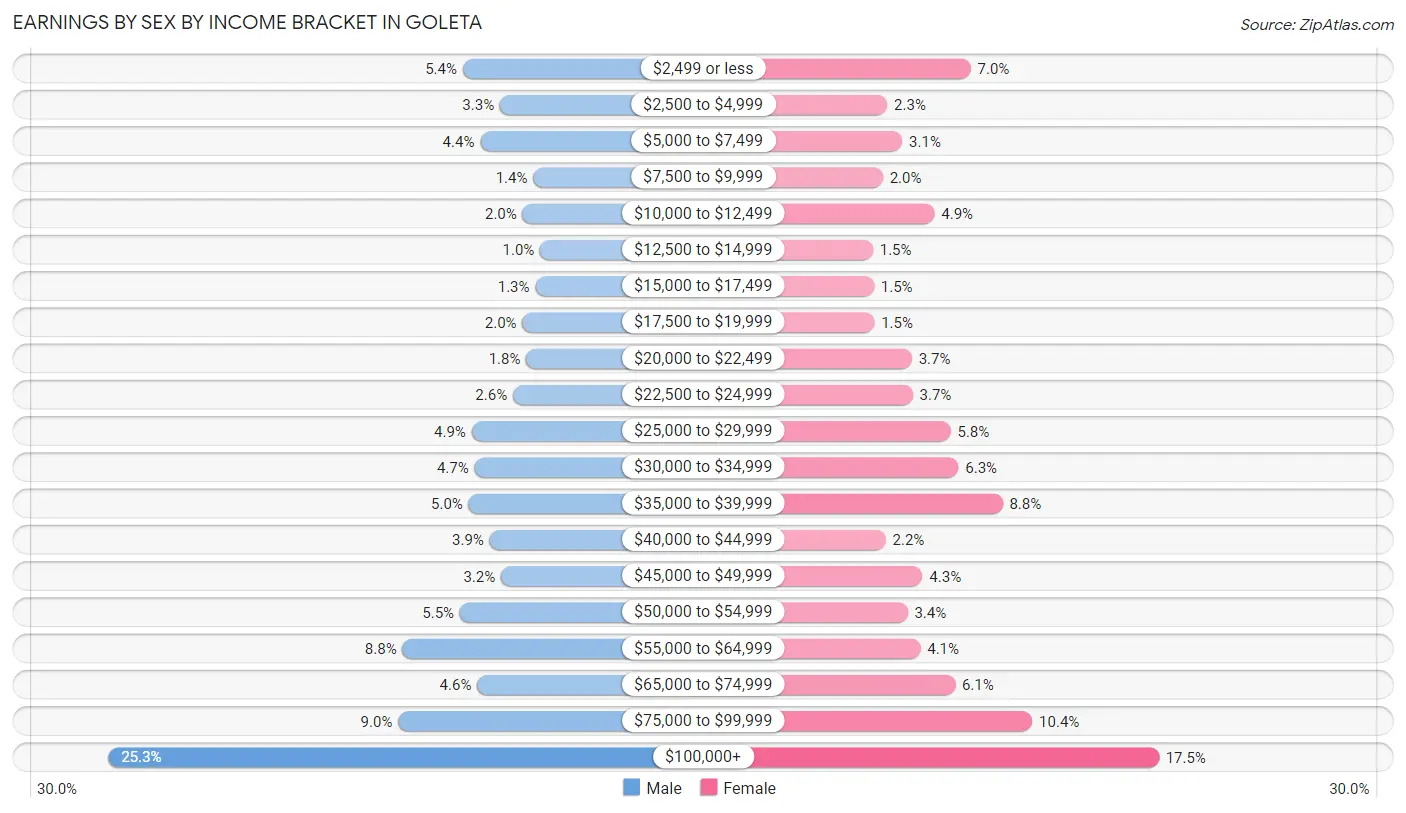
Earnings by Sex by Income Bracket in Goleta
The most common earnings brackets in Goleta are $100,000+ for men (2,723 | 25.3%) and $100,000+ for women (1,527 | 17.5%).
| Income | Male | Female |
| $2,499 or less | 578 (5.4%) | 606 (7.0%) |
| $2,500 to $4,999 | 353 (3.3%) | 198 (2.3%) |
| $5,000 to $7,499 | 473 (4.4%) | 271 (3.1%) |
| $7,500 to $9,999 | 152 (1.4%) | 176 (2.0%) |
| $10,000 to $12,499 | 216 (2.0%) | 429 (4.9%) |
| $12,500 to $14,999 | 110 (1.0%) | 127 (1.5%) |
| $15,000 to $17,499 | 139 (1.3%) | 132 (1.5%) |
| $17,500 to $19,999 | 217 (2.0%) | 134 (1.5%) |
| $20,000 to $22,499 | 194 (1.8%) | 318 (3.6%) |
| $22,500 to $24,999 | 274 (2.5%) | 322 (3.7%) |
| $25,000 to $29,999 | 524 (4.9%) | 508 (5.8%) |
| $30,000 to $34,999 | 507 (4.7%) | 546 (6.3%) |
| $35,000 to $39,999 | 543 (5.0%) | 762 (8.7%) |
| $40,000 to $44,999 | 416 (3.9%) | 190 (2.2%) |
| $45,000 to $49,999 | 347 (3.2%) | 370 (4.3%) |
| $50,000 to $54,999 | 595 (5.5%) | 297 (3.4%) |
| $55,000 to $64,999 | 943 (8.8%) | 360 (4.1%) |
| $65,000 to $74,999 | 491 (4.6%) | 530 (6.1%) |
| $75,000 to $99,999 | 969 (9.0%) | 908 (10.4%) |
| $100,000+ | 2,723 (25.3%) | 1,527 (17.5%) |
| Total | 10,764 (100.0%) | 8,711 (100.0%) |
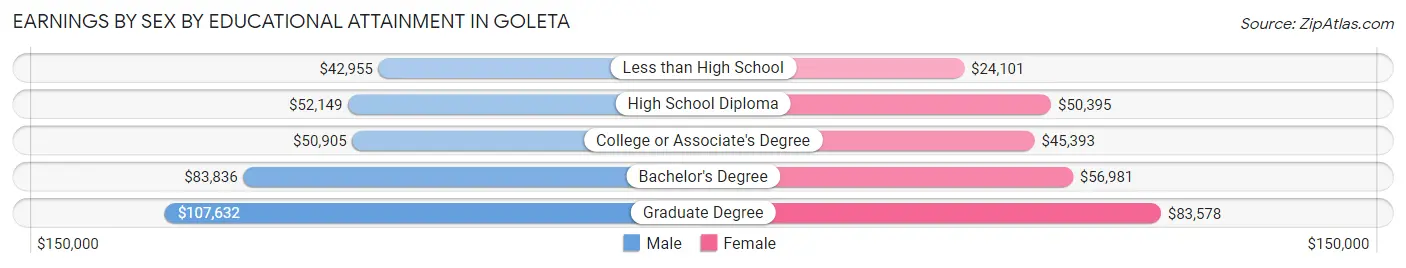
Earnings by Sex by Educational Attainment in Goleta
Average earnings in Goleta are $62,372 for men and $51,250 for women, a difference of 17.8%. Men with an educational attainment of graduate degree enjoy the highest average annual earnings of $107,632, while those with less than high school education earn the least with $42,955. Women with an educational attainment of graduate degree earn the most with the average annual earnings of $83,578, while those with less than high school education have the smallest earnings of $24,101.
| Educational Attainment | Male Income | Female Income |
| Less than High School | $42,955 | $24,101 |
| High School Diploma | $52,149 | $50,395 |
| College or Associate's Degree | $50,905 | $45,393 |
| Bachelor's Degree | $83,836 | $56,981 |
| Graduate Degree | $107,632 | $83,578 |
| Total | $62,372 | $51,250 |
Family Income in Goleta
Family Income Brackets in Goleta
According to the Goleta family income data, there are 2,091 families falling into the $200,000+ income range, which is the most common income bracket and makes up 28.9% of all families. Conversely, the $10,000 to $14,999 income bracket is the least frequent group with only 51 families (0.7%) belonging to this category.
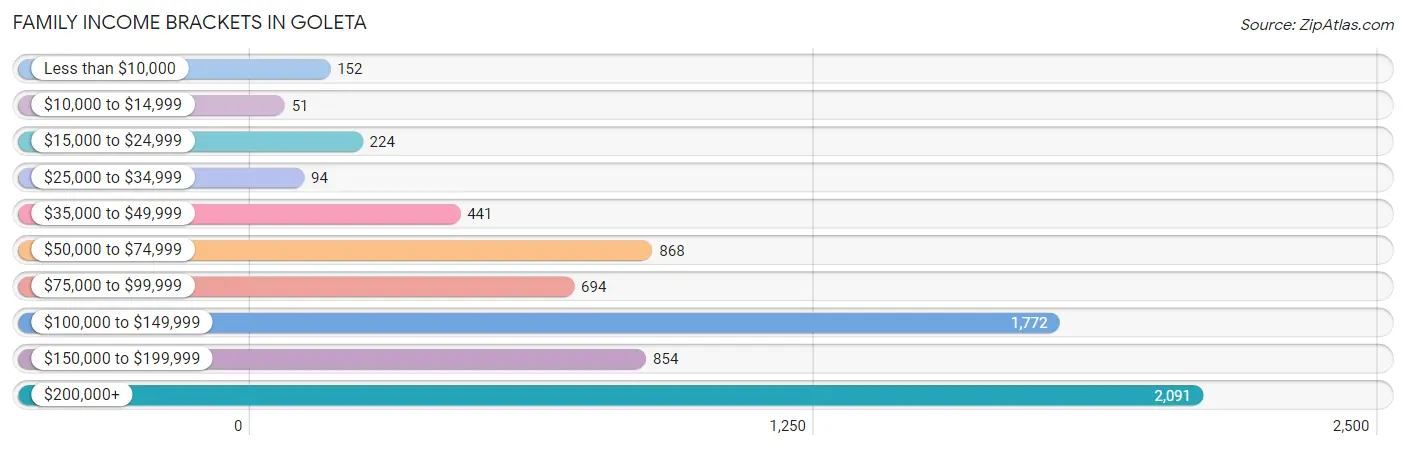
| Income Bracket | # Families | % Families |
| Less than $10,000 | 152 | 2.1% |
| $10,000 to $14,999 | 51 | 0.7% |
| $15,000 to $24,999 | 224 | 3.1% |
| $25,000 to $34,999 | 94 | 1.3% |
| $35,000 to $49,999 | 441 | 6.1% |
| $50,000 to $74,999 | 868 | 12.0% |
| $75,000 to $99,999 | 694 | 9.6% |
| $100,000 to $149,999 | 1,772 | 24.5% |
| $150,000 to $199,999 | 854 | 11.8% |
| $200,000+ | 2,091 | 28.9% |
Family Income by Famaliy Size in Goleta
7+ person families (237 | 3.3%) account for the highest median family income in Goleta with $220,881 per family, while 2-person families (2,985 | 41.3%) have the highest median income of $58,590 per family member.
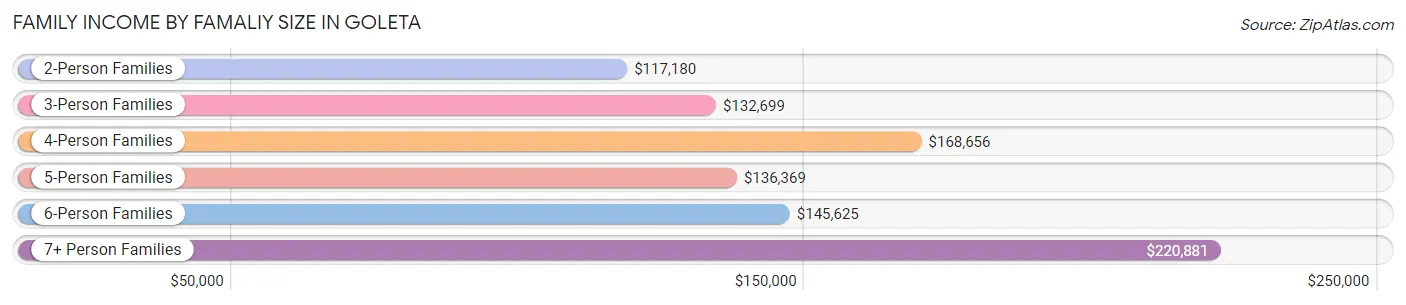
| Income Bracket | # Families | Median Income |
| 2-Person Families | 2,985 (41.3%) | $117,180 |
| 3-Person Families | 1,749 (24.2%) | $132,699 |
| 4-Person Families | 1,553 (21.5%) | $168,656 |
| 5-Person Families | 551 (7.6%) | $136,369 |
| 6-Person Families | 159 (2.2%) | $145,625 |
| 7+ Person Families | 237 (3.3%) | $220,881 |
| Total | 7,234 (100.0%) | $133,427 |
Family Income by Number of Earners in Goleta
The median family income in Goleta is $133,427, with families comprising 3+ earners (1,274) having the highest median family income of $187,583, while families with 1 earner (2,123) have the lowest median family income of $87,806, accounting for 17.6% and 29.3% of families, respectively.
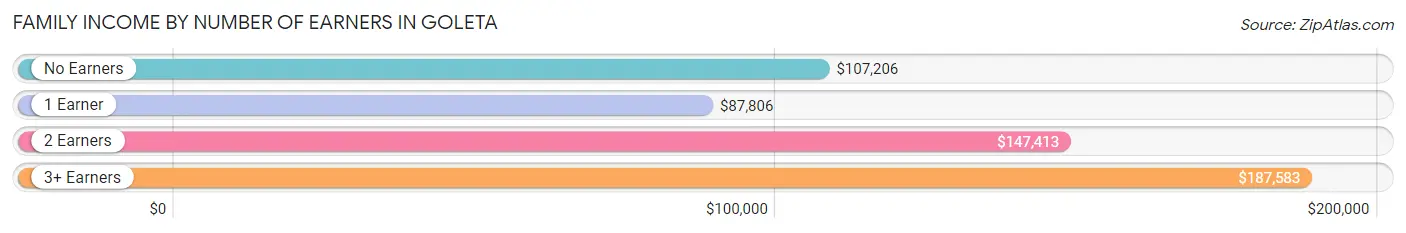
| Number of Earners | # Families | Median Income |
| No Earners | 690 (9.5%) | $107,206 |
| 1 Earner | 2,123 (29.3%) | $87,806 |
| 2 Earners | 3,147 (43.5%) | $147,413 |
| 3+ Earners | 1,274 (17.6%) | $187,583 |
| Total | 7,234 (100.0%) | $133,427 |
Household Income in Goleta
Household Income Brackets in Goleta
With 2,626 households falling in the category, the $200,000+ income range is the most frequent in Goleta, accounting for 22.0% of all households. In contrast, only 287 households (2.4%) fall into the $25,000 to $34,999 income bracket, making it the least populous group.
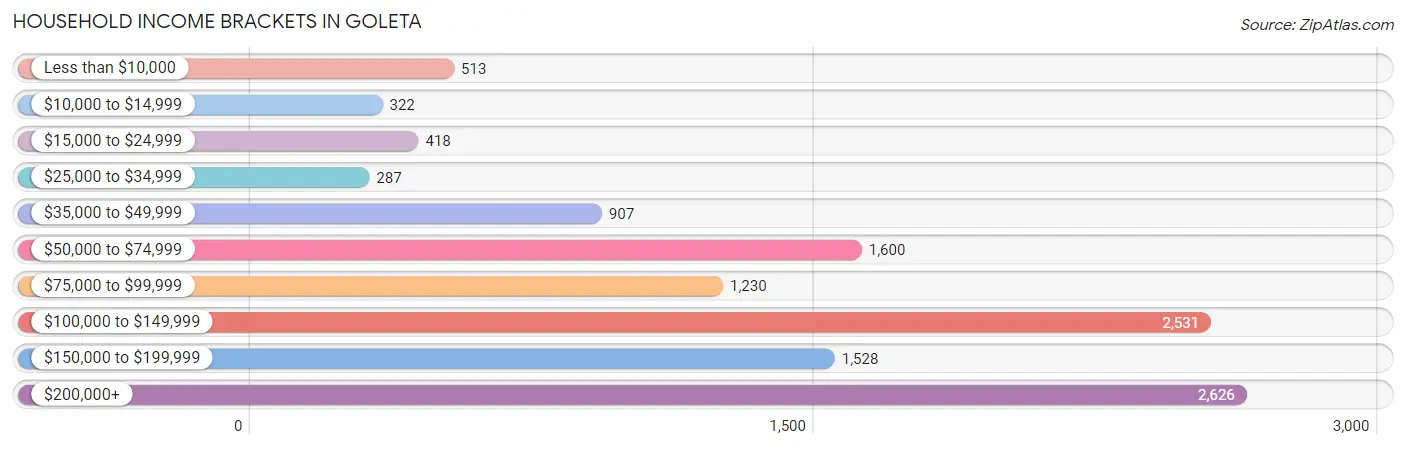
| Income Bracket | # Households | % Households |
| Less than $10,000 | 513 | 4.3% |
| $10,000 to $14,999 | 322 | 2.7% |
| $15,000 to $24,999 | 418 | 3.5% |
| $25,000 to $34,999 | 287 | 2.4% |
| $35,000 to $49,999 | 907 | 7.6% |
| $50,000 to $74,999 | 1,600 | 13.4% |
| $75,000 to $99,999 | 1,230 | 10.3% |
| $100,000 to $149,999 | 2,531 | 21.2% |
| $150,000 to $199,999 | 1,528 | 12.8% |
| $200,000+ | 2,626 | 22.0% |
Household Income by Householder Age in Goleta
The median household income in Goleta is $113,889, with the highest median household income of $142,241 found in the 45 to 64 years age bracket for the primary householder. A total of 4,274 households (35.8%) fall into this category. Meanwhile, the 15 to 24 years age bracket for the primary householder has the lowest median household income of $0, with 879 households (7.4%) in this group.
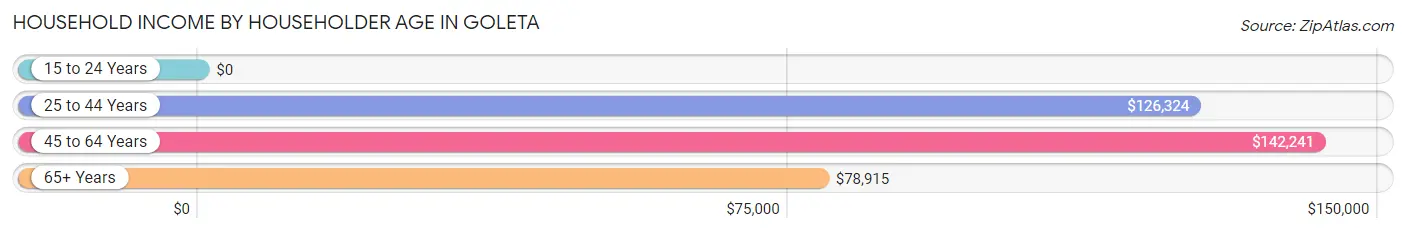
| Income Bracket | # Households | Median Income |
| 15 to 24 Years | 879 (7.4%) | $0 |
| 25 to 44 Years | 3,972 (33.3%) | $126,324 |
| 45 to 64 Years | 4,274 (35.8%) | $142,241 |
| 65+ Years | 2,813 (23.6%) | $78,915 |
| Total | 11,938 (100.0%) | $113,889 |
Poverty in Goleta
Income Below Poverty by Sex and Age in Goleta
With 12.3% poverty level for males and 10.6% for females among the residents of Goleta, 5 year old males and 18 to 24 year old females are the most vulnerable to poverty, with 125 males (63.8%) and 447 females (20.0%) in their respective age groups living below the poverty level.
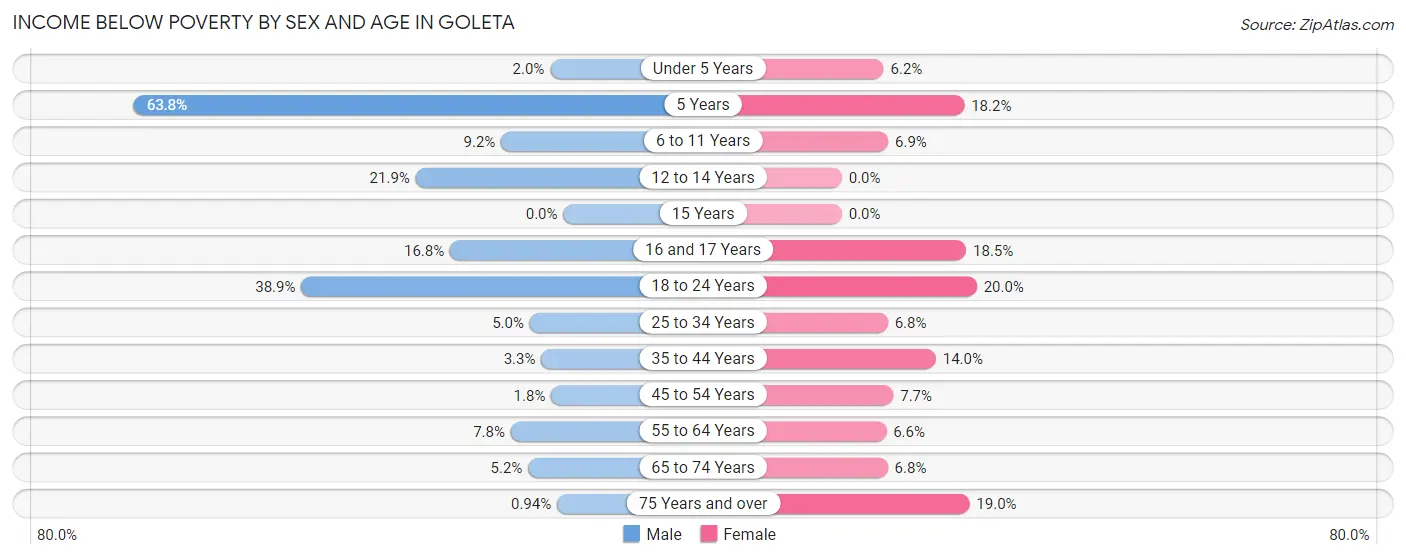
| Age Bracket | Male | Female |
| Under 5 Years | 17 (1.9%) | 52 (6.2%) |
| 5 Years | 125 (63.8%) | 26 (18.2%) |
| 6 to 11 Years | 95 (9.2%) | 68 (6.9%) |
| 12 to 14 Years | 182 (21.9%) | 0 (0.0%) |
| 15 Years | 0 (0.0%) | 0 (0.0%) |
| 16 and 17 Years | 55 (16.8%) | 72 (18.5%) |
| 18 to 24 Years | 1,102 (38.9%) | 447 (20.0%) |
| 25 to 34 Years | 134 (5.0%) | 149 (6.8%) |
| 35 to 44 Years | 63 (3.3%) | 248 (14.0%) |
| 45 to 54 Years | 27 (1.8%) | 134 (7.6%) |
| 55 to 64 Years | 178 (7.8%) | 145 (6.6%) |
| 65 to 74 Years | 70 (5.2%) | 84 (6.8%) |
| 75 Years and over | 8 (0.9%) | 239 (19.0%) |
| Total | 2,056 (12.3%) | 1,664 (10.6%) |
Income Above Poverty by Sex and Age in Goleta
According to the poverty statistics in Goleta, males aged 15 years and females aged 12 to 14 years are the age groups that are most secure financially, with 100.0% of males and 100.0% of females in these age groups living above the poverty line.
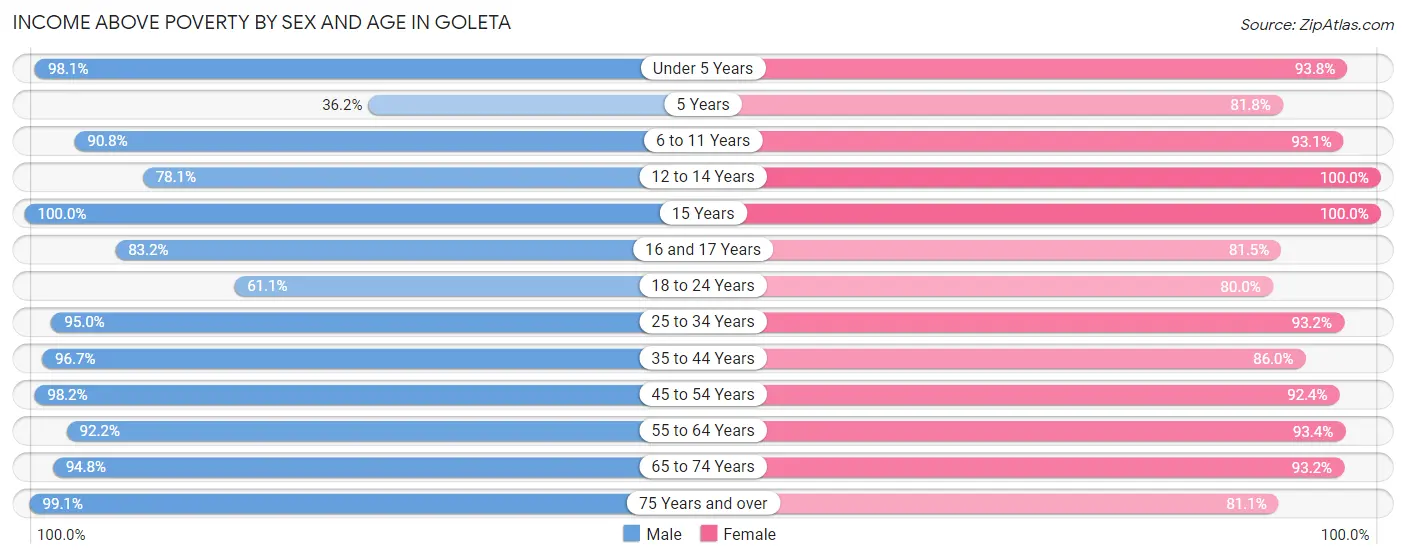
| Age Bracket | Male | Female |
| Under 5 Years | 856 (98.1%) | 785 (93.8%) |
| 5 Years | 71 (36.2%) | 117 (81.8%) |
| 6 to 11 Years | 934 (90.8%) | 920 (93.1%) |
| 12 to 14 Years | 648 (78.1%) | 355 (100.0%) |
| 15 Years | 64 (100.0%) | 307 (100.0%) |
| 16 and 17 Years | 272 (83.2%) | 318 (81.5%) |
| 18 to 24 Years | 1,730 (61.1%) | 1,785 (80.0%) |
| 25 to 34 Years | 2,559 (95.0%) | 2,037 (93.2%) |
| 35 to 44 Years | 1,865 (96.7%) | 1,529 (86.0%) |
| 45 to 54 Years | 1,476 (98.2%) | 1,618 (92.3%) |
| 55 to 64 Years | 2,105 (92.2%) | 2,055 (93.4%) |
| 65 to 74 Years | 1,271 (94.8%) | 1,149 (93.2%) |
| 75 Years and over | 842 (99.1%) | 1,022 (81.0%) |
| Total | 14,693 (87.7%) | 13,997 (89.4%) |
Income Below Poverty Among Married-Couple Families in Goleta
The poverty statistics for married-couple families in Goleta show that 2.2% or 120 of the total 5,489 families live below the poverty line. Families with no children have the highest poverty rate of 2.9%, comprising of 92 families. On the other hand, families with 3 or 4 children have the lowest poverty rate of 0.0%, which includes 0 families.
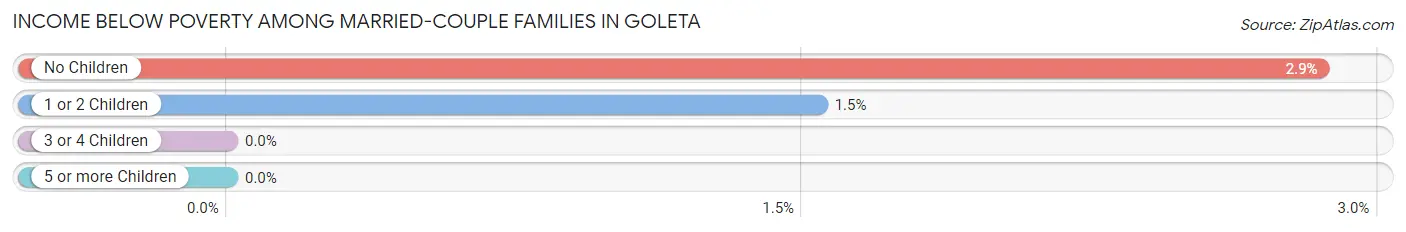
| Children | Above Poverty | Below Poverty |
| No Children | 3,131 (97.2%) | 92 (2.9%) |
| 1 or 2 Children | 1,788 (98.5%) | 28 (1.5%) |
| 3 or 4 Children | 370 (100.0%) | 0 (0.0%) |
| 5 or more Children | 80 (100.0%) | 0 (0.0%) |
| Total | 5,369 (97.8%) | 120 (2.2%) |
Income Below Poverty Among Single-Parent Households in Goleta
According to the poverty data in Goleta, 2.1% or 7 single-father households and 20.3% or 287 single-mother households are living below the poverty line. Among single-father households, those with 1 or 2 children have the highest poverty rate, with 7 households (3.9%) experiencing poverty. Likewise, among single-mother households, those with 3 or 4 children have the highest poverty rate, with 77 households (43.8%) falling below the poverty line.
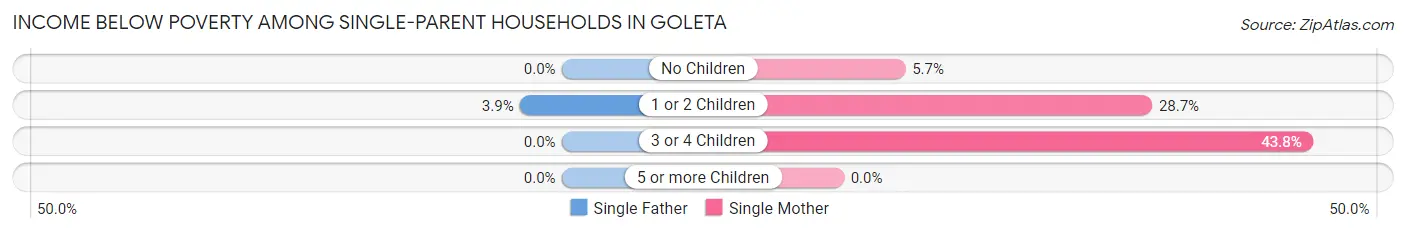
| Children | Single Father | Single Mother |
| No Children | 0 (0.0%) | 36 (5.7%) |
| 1 or 2 Children | 7 (3.9%) | 174 (28.7%) |
| 3 or 4 Children | 0 (0.0%) | 77 (43.8%) |
| 5 or more Children | 0 (0.0%) | 0 (0.0%) |
| Total | 7 (2.1%) | 287 (20.3%) |
Income Below Poverty Among Married-Couple vs Single-Parent Households in Goleta
The poverty data for Goleta shows that 120 of the married-couple family households (2.2%) and 294 of the single-parent households (16.9%) are living below the poverty level. Within the married-couple family households, those with no children have the highest poverty rate, with 92 households (2.9%) falling below the poverty line. Among the single-parent households, those with 3 or 4 children have the highest poverty rate, with 77 household (41.8%) living below poverty.
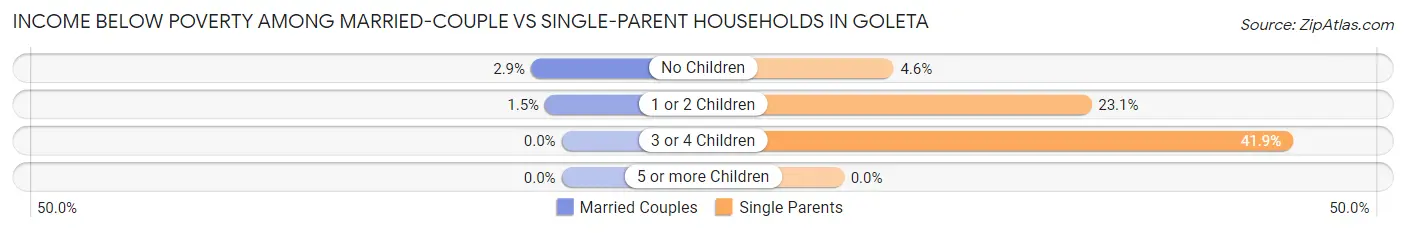
| Children | Married-Couple Families | Single-Parent Households |
| No Children | 92 (2.9%) | 36 (4.6%) |
| 1 or 2 Children | 28 (1.5%) | 181 (23.1%) |
| 3 or 4 Children | 0 (0.0%) | 77 (41.8%) |
| 5 or more Children | 0 (0.0%) | 0 (0.0%) |
| Total | 120 (2.2%) | 294 (16.9%) |
Race in Goleta
The most populous races in Goleta are White / Caucasian (18,597 | 57.0%), Hispanic or Latino (11,876 | 36.4%), and Some other Race (4,858 | 14.9%).
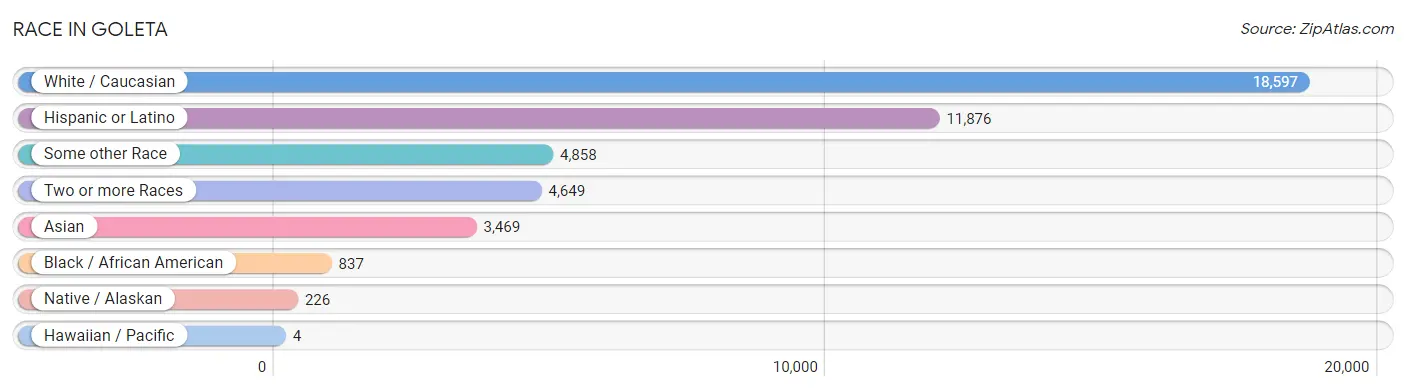
| Race | # Population | % Population |
| Asian | 3,469 | 10.6% |
| Black / African American | 837 | 2.6% |
| Hawaiian / Pacific | 4 | 0.0% |
| Hispanic or Latino | 11,876 | 36.4% |
| Native / Alaskan | 226 | 0.7% |
| White / Caucasian | 18,597 | 57.0% |
| Two or more Races | 4,649 | 14.2% |
| Some other Race | 4,858 | 14.9% |
| Total | 32,640 | 100.0% |
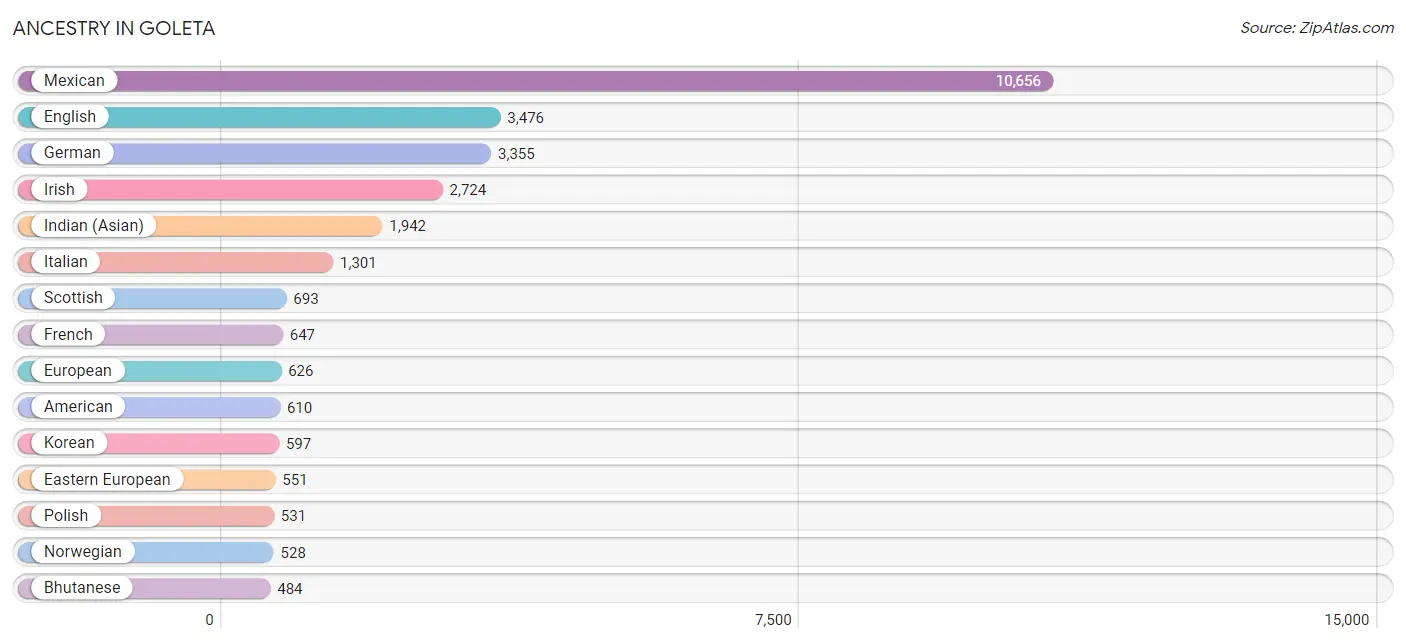
Ancestry in Goleta
The most populous ancestries reported in Goleta are Mexican (10,656 | 32.7%), English (3,476 | 10.6%), German (3,355 | 10.3%), Irish (2,724 | 8.4%), and Indian (Asian) (1,942 | 5.9%), together accounting for 67.9% of all Goleta residents.
| Ancestry | # Population | % Population |
| African | 78 | 0.2% |
| American | 610 | 1.9% |
| Apache | 28 | 0.1% |
| Arab | 327 | 1.0% |
| Argentinean | 47 | 0.1% |
| Armenian | 40 | 0.1% |
| Australian | 49 | 0.2% |
| Austrian | 160 | 0.5% |
| Bangladeshi | 30 | 0.1% |
| Belgian | 98 | 0.3% |
| Bhutanese | 484 | 1.5% |
| Brazilian | 65 | 0.2% |
| British | 366 | 1.1% |
| Bulgarian | 22 | 0.1% |
| Burmese | 284 | 0.9% |
| Canadian | 101 | 0.3% |
| Central American | 238 | 0.7% |
| Central American Indian | 126 | 0.4% |
| Cherokee | 87 | 0.3% |
| Chickasaw | 29 | 0.1% |
| Chilean | 38 | 0.1% |
| Chippewa | 98 | 0.3% |
| Choctaw | 4 | 0.0% |
| Colombian | 96 | 0.3% |
| Costa Rican | 46 | 0.1% |
| Croatian | 125 | 0.4% |
| Cuban | 9 | 0.0% |
| Czech | 65 | 0.2% |
| Czechoslovakian | 11 | 0.0% |
| Danish | 210 | 0.6% |
| Delaware | 3 | 0.0% |
| Dutch | 303 | 0.9% |
| Eastern European | 551 | 1.7% |
| Ecuadorian | 13 | 0.0% |
| Egyptian | 187 | 0.6% |
| English | 3,476 | 10.6% |
| Estonian | 48 | 0.2% |
| Ethiopian | 107 | 0.3% |
| European | 626 | 1.9% |
| Filipino | 20 | 0.1% |
| Finnish | 23 | 0.1% |
| French | 647 | 2.0% |
| French Canadian | 55 | 0.2% |
| German | 3,355 | 10.3% |
| Ghanaian | 24 | 0.1% |
| Greek | 111 | 0.3% |
| Guamanian / Chamorro | 10 | 0.0% |
| Guatemalan | 113 | 0.4% |
| Haitian | 48 | 0.2% |
| Honduran | 12 | 0.0% |
| Hungarian | 307 | 0.9% |
| Indian (Asian) | 1,942 | 5.9% |
| Indonesian | 86 | 0.3% |
| Iranian | 201 | 0.6% |
| Irish | 2,724 | 8.4% |
| Italian | 1,301 | 4.0% |
| Korean | 597 | 1.8% |
| Latvian | 21 | 0.1% |
| Lebanese | 4 | 0.0% |
| Lithuanian | 40 | 0.1% |
| Luxembourger | 9 | 0.0% |
| Mexican | 10,656 | 32.7% |
| Mexican American Indian | 248 | 0.8% |
| Native Hawaiian | 24 | 0.1% |
| Nicaraguan | 8 | 0.0% |
| Northern European | 60 | 0.2% |
| Norwegian | 528 | 1.6% |
| Okinawan | 9 | 0.0% |
| Peruvian | 52 | 0.2% |
| Polish | 531 | 1.6% |
| Portuguese | 153 | 0.5% |
| Puerto Rican | 69 | 0.2% |
| Romanian | 25 | 0.1% |
| Russian | 336 | 1.0% |
| Salvadoran | 59 | 0.2% |
| Samoan | 4 | 0.0% |
| Scandinavian | 232 | 0.7% |
| Scotch-Irish | 229 | 0.7% |
| Scottish | 693 | 2.1% |
| Serbian | 66 | 0.2% |
| Slovak | 14 | 0.0% |
| South American | 346 | 1.1% |
| Spaniard | 116 | 0.4% |
| Spanish | 180 | 0.5% |
| Sri Lankan | 441 | 1.3% |
| Subsaharan African | 209 | 0.6% |
| Swedish | 417 | 1.3% |
| Swiss | 258 | 0.8% |
| Syrian | 68 | 0.2% |
| Thai | 466 | 1.4% |
| Trinidadian and Tobagonian | 33 | 0.1% |
| Turkish | 10 | 0.0% |
| Ukrainian | 135 | 0.4% |
| Venezuelan | 100 | 0.3% |
| Welsh | 72 | 0.2% |
| West Indian | 19 | 0.1% |
| Yaqui | 29 | 0.1% |
| Yugoslavian | 11 | 0.0% | View All 98 Rows |
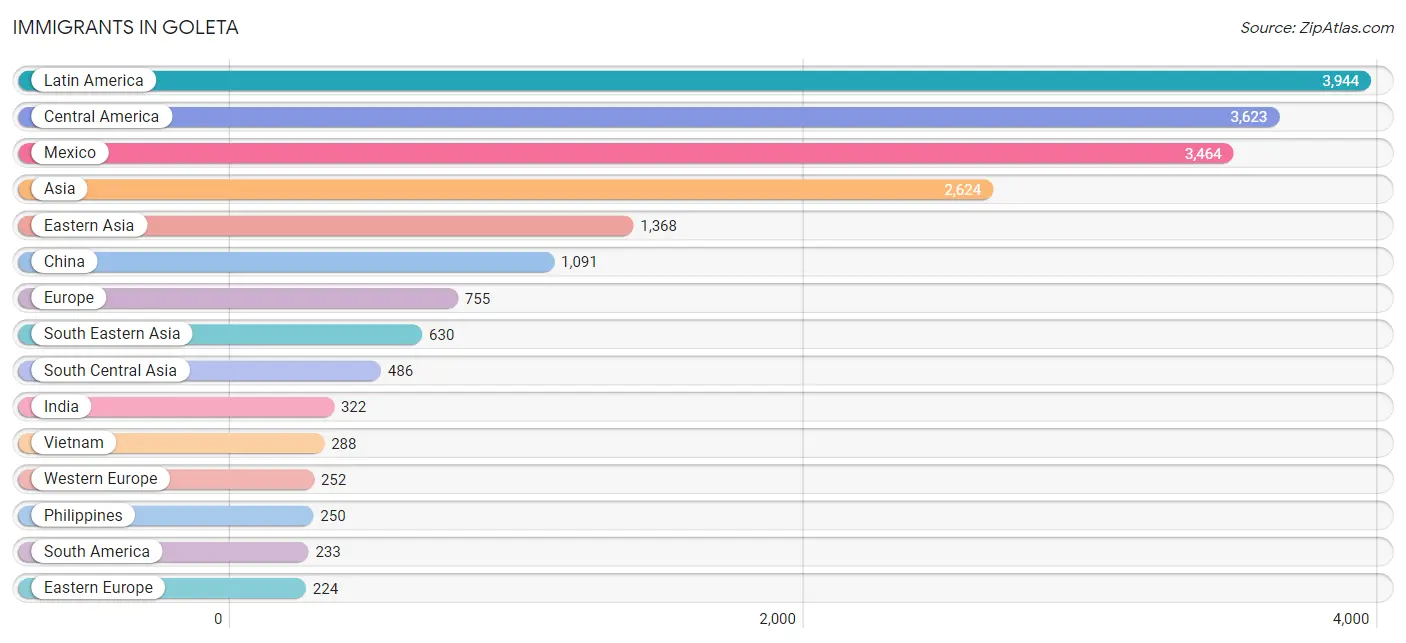
Immigrants in Goleta
The most numerous immigrant groups reported in Goleta came from Latin America (3,944 | 12.1%), Central America (3,623 | 11.1%), Mexico (3,464 | 10.6%), Asia (2,624 | 8.0%), and Eastern Asia (1,368 | 4.2%), together accounting for 46.0% of all Goleta residents.
| Immigration Origin | # Population | % Population |
| Africa | 135 | 0.4% |
| Argentina | 25 | 0.1% |
| Armenia | 28 | 0.1% |
| Asia | 2,624 | 8.0% |
| Australia | 32 | 0.1% |
| Belarus | 9 | 0.0% |
| Belgium | 13 | 0.0% |
| Bosnia and Herzegovina | 9 | 0.0% |
| Brazil | 42 | 0.1% |
| Bulgaria | 8 | 0.0% |
| Canada | 122 | 0.4% |
| Caribbean | 88 | 0.3% |
| Central America | 3,623 | 11.1% |
| Chile | 9 | 0.0% |
| China | 1,091 | 3.3% |
| Colombia | 54 | 0.2% |
| Costa Rica | 13 | 0.0% |
| Denmark | 24 | 0.1% |
| Eastern Africa | 30 | 0.1% |
| Eastern Asia | 1,368 | 4.2% |
| Eastern Europe | 224 | 0.7% |
| Egypt | 20 | 0.1% |
| El Salvador | 49 | 0.2% |
| England | 31 | 0.1% |
| Ethiopia | 21 | 0.1% |
| Europe | 755 | 2.3% |
| France | 45 | 0.1% |
| Germany | 140 | 0.4% |
| Greece | 7 | 0.0% |
| Guatemala | 93 | 0.3% |
| Haiti | 55 | 0.2% |
| Honduras | 4 | 0.0% |
| Hong Kong | 41 | 0.1% |
| Hungary | 12 | 0.0% |
| India | 322 | 1.0% |
| Iran | 146 | 0.4% |
| Italy | 69 | 0.2% |
| Japan | 58 | 0.2% |
| Korea | 219 | 0.7% |
| Laos | 16 | 0.1% |
| Latin America | 3,944 | 12.1% |
| Lebanon | 4 | 0.0% |
| Liberia | 1 | 0.0% |
| Mexico | 3,464 | 10.6% |
| Moldova | 20 | 0.1% |
| Nepal | 13 | 0.0% |
| Netherlands | 33 | 0.1% |
| Nigeria | 66 | 0.2% |
| Northern Africa | 31 | 0.1% |
| Northern Europe | 184 | 0.6% |
| Oceania | 40 | 0.1% |
| Pakistan | 5 | 0.0% |
| Peru | 24 | 0.1% |
| Philippines | 250 | 0.8% |
| Poland | 27 | 0.1% |
| Portugal | 19 | 0.1% |
| Russia | 31 | 0.1% |
| Saudi Arabia | 16 | 0.1% |
| Serbia | 35 | 0.1% |
| Singapore | 32 | 0.1% |
| South America | 233 | 0.7% |
| South Central Asia | 486 | 1.5% |
| South Eastern Asia | 630 | 1.9% |
| Southern Europe | 95 | 0.3% |
| Switzerland | 21 | 0.1% |
| Syria | 79 | 0.2% |
| Taiwan | 95 | 0.3% |
| Trinidad and Tobago | 33 | 0.1% |
| Ukraine | 44 | 0.1% |
| Venezuela | 79 | 0.2% |
| Vietnam | 288 | 0.9% |
| Western Africa | 67 | 0.2% |
| Western Asia | 140 | 0.4% |
| Western Europe | 252 | 0.8% | View All 74 Rows |
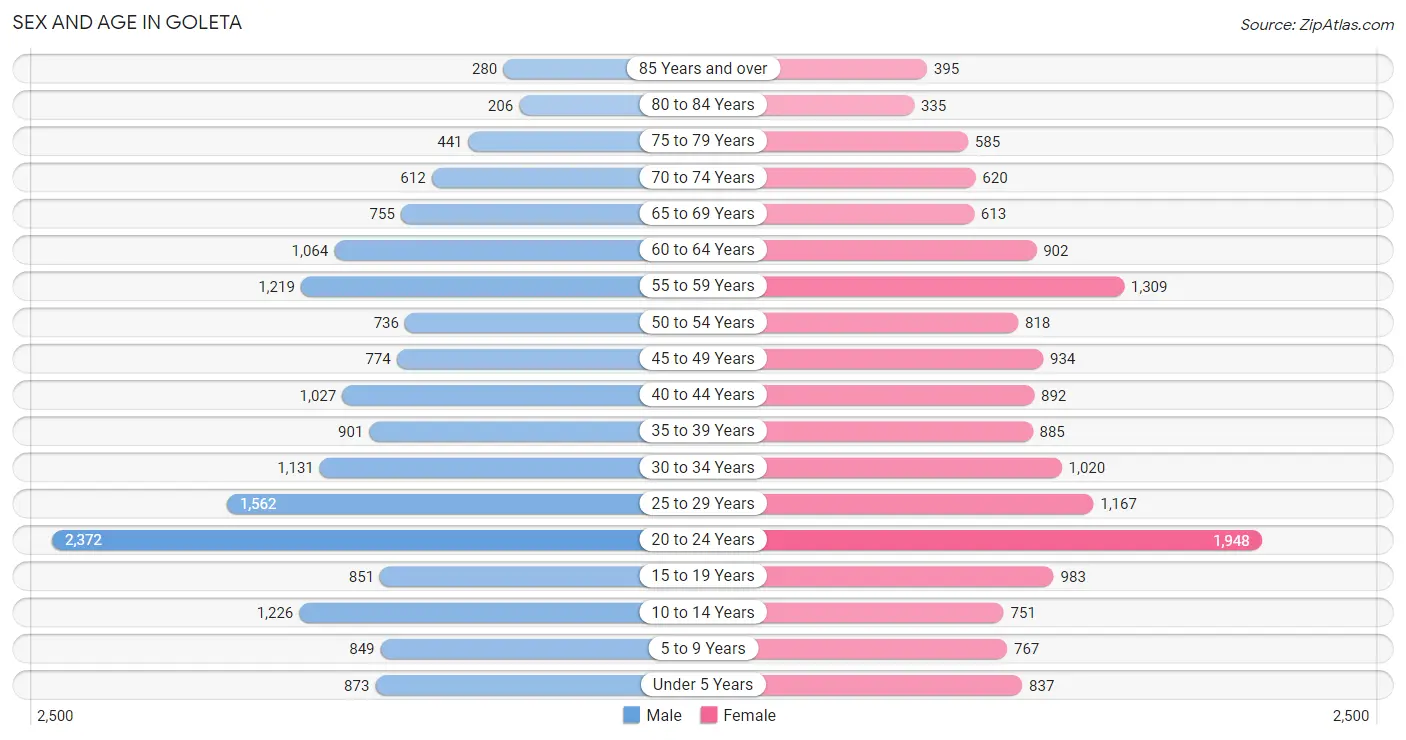
Sex and Age in Goleta
Sex and Age in Goleta
The most populous age groups in Goleta are 20 to 24 Years (2,372 | 14.1%) for men and 20 to 24 Years (1,948 | 12.4%) for women.
| Age Bracket | Male | Female |
| Under 5 Years | 873 (5.2%) | 837 (5.3%) |
| 5 to 9 Years | 849 (5.0%) | 767 (4.9%) |
| 10 to 14 Years | 1,226 (7.3%) | 751 (4.8%) |
| 15 to 19 Years | 851 (5.0%) | 983 (6.2%) |
| 20 to 24 Years | 2,372 (14.1%) | 1,948 (12.4%) |
| 25 to 29 Years | 1,562 (9.2%) | 1,167 (7.4%) |
| 30 to 34 Years | 1,131 (6.7%) | 1,020 (6.5%) |
| 35 to 39 Years | 901 (5.3%) | 885 (5.6%) |
| 40 to 44 Years | 1,027 (6.1%) | 892 (5.7%) |
| 45 to 49 Years | 774 (4.6%) | 934 (5.9%) |
| 50 to 54 Years | 736 (4.4%) | 818 (5.2%) |
| 55 to 59 Years | 1,219 (7.2%) | 1,309 (8.3%) |
| 60 to 64 Years | 1,064 (6.3%) | 902 (5.7%) |
| 65 to 69 Years | 755 (4.5%) | 613 (3.9%) |
| 70 to 74 Years | 612 (3.6%) | 620 (3.9%) |
| 75 to 79 Years | 441 (2.6%) | 585 (3.7%) |
| 80 to 84 Years | 206 (1.2%) | 335 (2.1%) |
| 85 Years and over | 280 (1.7%) | 395 (2.5%) |
| Total | 16,879 (100.0%) | 15,761 (100.0%) |
Families and Households in Goleta
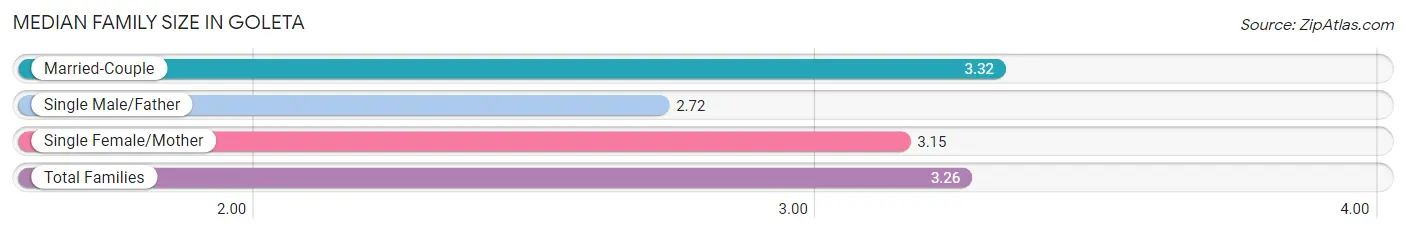
Median Family Size in Goleta
The median family size in Goleta is 3.26 persons per family, with married-couple families (5,489 | 75.9%) accounting for the largest median family size of 3.32 persons per family. On the other hand, single male/father families (335 | 4.6%) represent the smallest median family size with 2.72 persons per family.
| Family Type | # Families | Family Size |
| Married-Couple | 5,489 (75.9%) | 3.32 |
| Single Male/Father | 335 (4.6%) | 2.72 |
| Single Female/Mother | 1,410 (19.5%) | 3.15 |
| Total Families | 7,234 (100.0%) | 3.26 |
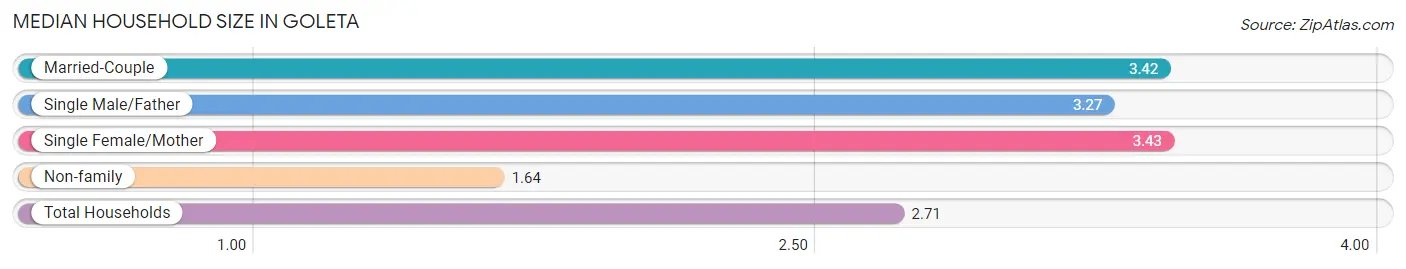
Median Household Size in Goleta
The median household size in Goleta is 2.71 persons per household, with single female/mother households (1,410 | 11.8%) accounting for the largest median household size of 3.43 persons per household. non-family households (4,704 | 39.4%) represent the smallest median household size with 1.64 persons per household.
| Household Type | # Households | Household Size |
| Married-Couple | 5,489 (46.0%) | 3.42 |
| Single Male/Father | 335 (2.8%) | 3.27 |
| Single Female/Mother | 1,410 (11.8%) | 3.43 |
| Non-family | 4,704 (39.4%) | 1.64 |
| Total Households | 11,938 (100.0%) | 2.71 |
Household Size by Marriage Status in Goleta
Out of a total of 11,938 households in Goleta, 7,234 (60.6%) are family households, while 4,704 (39.4%) are nonfamily households. The most numerous type of family households are 2-person households, comprising 2,754, and the most common type of nonfamily households are 1-person households, comprising 3,061.
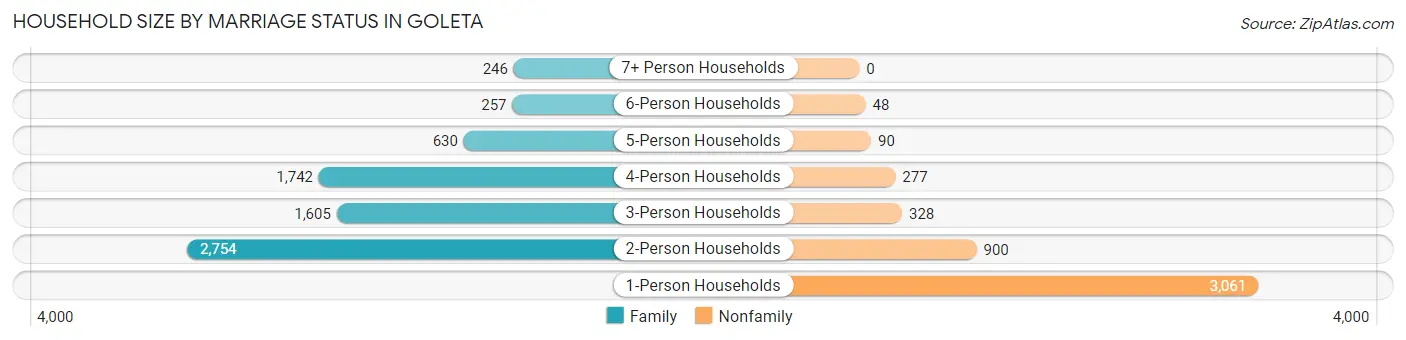
| Household Size | Family Households | Nonfamily Households |
| 1-Person Households | - | 3,061 (25.6%) |
| 2-Person Households | 2,754 (23.1%) | 900 (7.5%) |
| 3-Person Households | 1,605 (13.4%) | 328 (2.8%) |
| 4-Person Households | 1,742 (14.6%) | 277 (2.3%) |
| 5-Person Households | 630 (5.3%) | 90 (0.7%) |
| 6-Person Households | 257 (2.1%) | 48 (0.4%) |
| 7+ Person Households | 246 (2.1%) | 0 (0.0%) |
| Total | 7,234 (60.6%) | 4,704 (39.4%) |
Female Fertility in Goleta
Fertility by Age in Goleta
Average fertility rate in Goleta is 56.0 births per 1,000 women. Women in the age bracket of 20 to 34 years have the highest fertility rate with 67.0 births per 1,000 women. Women in the age bracket of 20 to 34 years acount for 62.3% of all women with births.
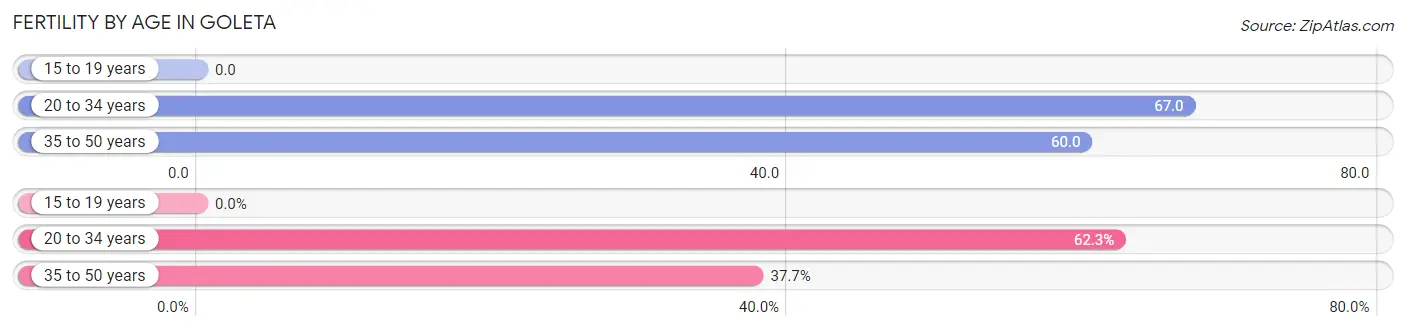
| Age Bracket | Women with Births | Births / 1,000 Women |
| 15 to 19 years | 0 (0.0%) | 0.0 |
| 20 to 34 years | 276 (62.3%) | 67.0 |
| 35 to 50 years | 167 (37.7%) | 60.0 |
| Total | 443 (100.0%) | 56.0 |
Fertility by Age by Marriage Status in Goleta
63.4% of women with births (443) in Goleta are married. The highest percentage of unmarried women with births falls into 20 to 34 years age bracket with 42.7% of them unmarried at the time of birth, while the lowest percentage of unmarried women with births belong to 35 to 50 years age bracket with 26.3% of them unmarried.
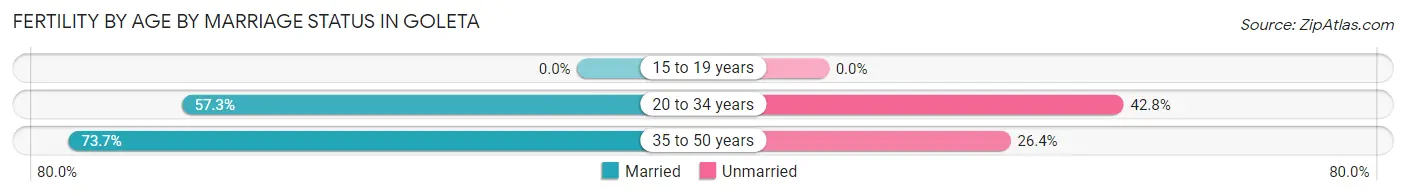
| Age Bracket | Married | Unmarried |
| 15 to 19 years | 0 (0.0%) | 0 (0.0%) |
| 20 to 34 years | 158 (57.3%) | 118 (42.7%) |
| 35 to 50 years | 123 (73.7%) | 44 (26.4%) |
| Total | 281 (63.4%) | 162 (36.6%) |
Fertility by Education in Goleta
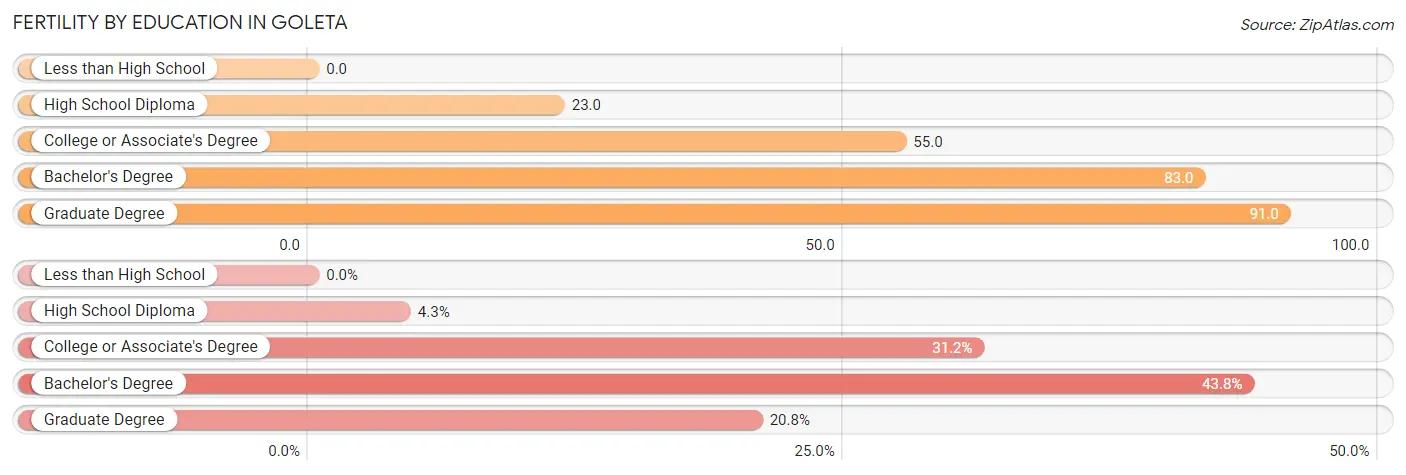
| Educational Attainment | Women with Births | Births / 1,000 Women |
| Less than High School | 0 (0.0%) | 0.0 |
| High School Diploma | 19 (4.3%) | 23.0 |
| College or Associate's Degree | 138 (31.1%) | 55.0 |
| Bachelor's Degree | 194 (43.8%) | 83.0 |
| Graduate Degree | 92 (20.8%) | 91.0 |
| Total | 443 (100.0%) | 56.0 |
Fertility by Education by Marriage Status in Goleta
36.6% of women with births in Goleta are unmarried. Women with the educational attainment of graduate degree are most likely to be married with 100.0% of them married at childbirth, while women with the educational attainment of high school diploma are least likely to be married with 100.0% of them unmarried at childbirth.
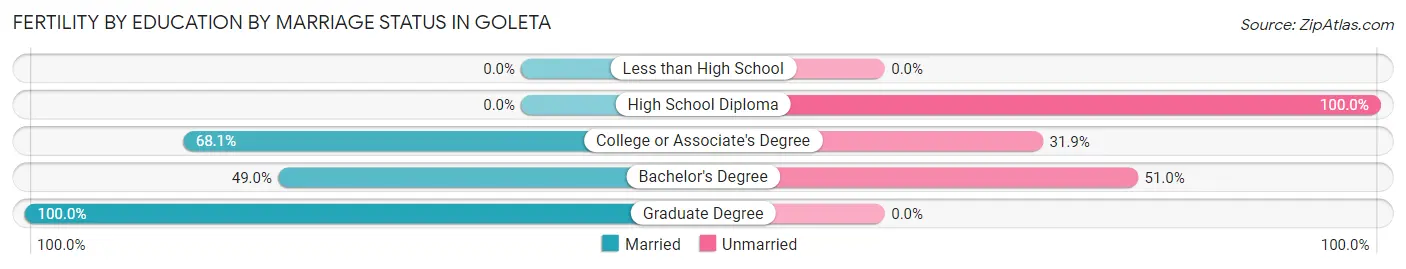
| Educational Attainment | Married | Unmarried |
| Less than High School | 0 (0.0%) | 0 (0.0%) |
| High School Diploma | 0 (0.0%) | 19 (100.0%) |
| College or Associate's Degree | 94 (68.1%) | 44 (31.9%) |
| Bachelor's Degree | 95 (49.0%) | 99 (51.0%) |
| Graduate Degree | 92 (100.0%) | 0 (0.0%) |
| Total | 281 (63.4%) | 162 (36.6%) |
Employment Characteristics in Goleta
Employment by Class of Employer in Goleta
Among the 17,265 employed individuals in Goleta, private company employees (9,888 | 57.3%), local government employees (1,711 | 9.9%), and not-for-profit organizations (1,615 | 9.3%) make up the most common classes of employment.
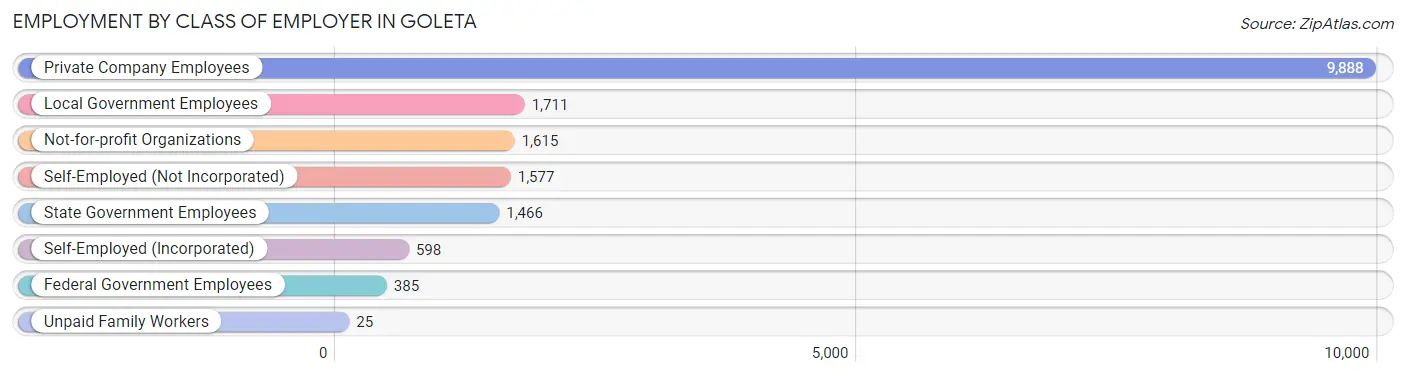
| Employer Class | # Employees | % Employees |
| Private Company Employees | 9,888 | 57.3% |
| Self-Employed (Incorporated) | 598 | 3.5% |
| Self-Employed (Not Incorporated) | 1,577 | 9.1% |
| Not-for-profit Organizations | 1,615 | 9.3% |
| Local Government Employees | 1,711 | 9.9% |
| State Government Employees | 1,466 | 8.5% |
| Federal Government Employees | 385 | 2.2% |
| Unpaid Family Workers | 25 | 0.1% |
| Total | 17,265 | 100.0% |
Employment Status by Age in Goleta
According to the labor force statistics for Goleta, out of the total population over 16 years of age (26,966), 68.4% or 18,445 individuals are in the labor force, with 4.0% or 738 of them unemployed. The age group with the highest labor force participation rate is 35 to 44 years, with 92.0% or 3,409 individuals in the labor force. Within the labor force, the 75 years and over age range has the highest percentage of unemployed individuals, with 27.1% or 45 of them being unemployed.
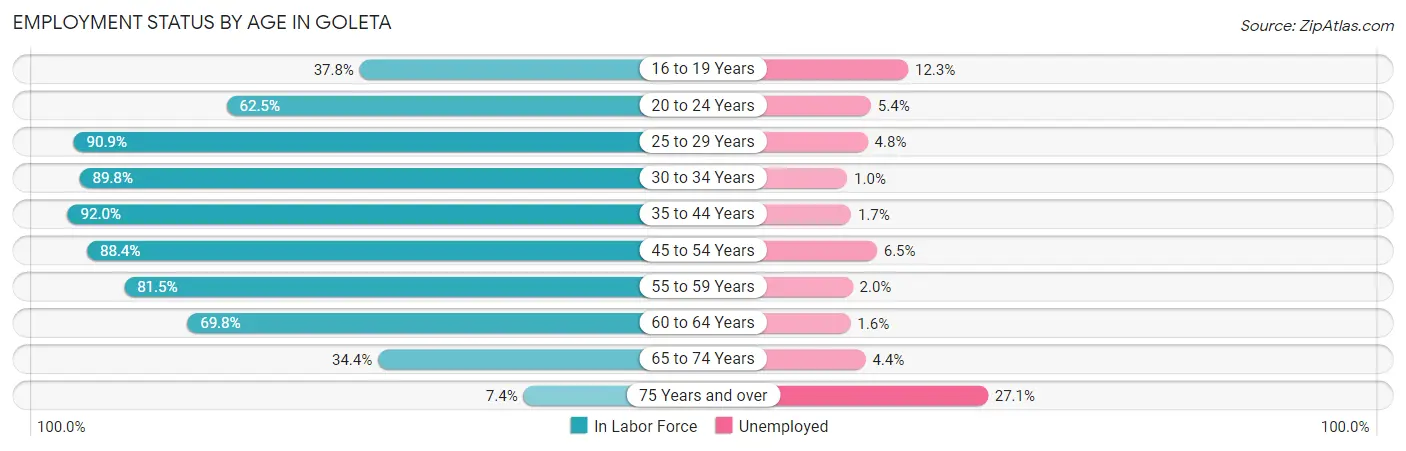
| Age Bracket | In Labor Force | Unemployed |
| 16 to 19 Years | 553 (37.8%) | 68 (12.3%) |
| 20 to 24 Years | 2,700 (62.5%) | 146 (5.4%) |
| 25 to 29 Years | 2,481 (90.9%) | 119 (4.8%) |
| 30 to 34 Years | 1,932 (89.8%) | 19 (1.0%) |
| 35 to 44 Years | 3,409 (92.0%) | 58 (1.7%) |
| 45 to 54 Years | 2,884 (88.4%) | 187 (6.5%) |
| 55 to 59 Years | 2,060 (81.5%) | 41 (2.0%) |
| 60 to 64 Years | 1,372 (69.8%) | 22 (1.6%) |
| 65 to 74 Years | 894 (34.4%) | 39 (4.4%) |
| 75 Years and over | 166 (7.4%) | 45 (27.1%) |
| Total | 18,445 (68.4%) | 738 (4.0%) |
Employment Status by Educational Attainment in Goleta
According to labor force statistics for Goleta, 86.5% of individuals (14,135) out of the total population between 25 and 64 years of age (16,341) are in the labor force, with 3.2% or 452 of them being unemployed. The group with the highest labor force participation rate are those with the educational attainment of bachelor's degree or higher, with 90.1% or 7,418 individuals in the labor force. Within the labor force, individuals with college / associate degree education have the highest percentage of unemployment, with 4.6% or 170 of them being unemployed.
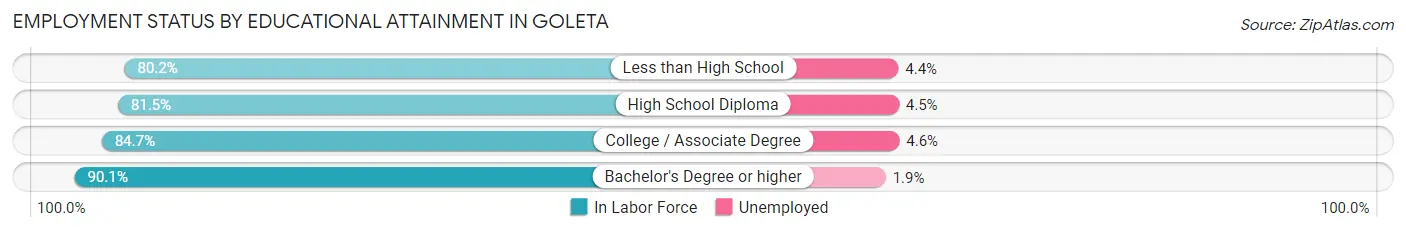
| Educational Attainment | In Labor Force | Unemployed |
| Less than High School | 1,586 (80.2%) | 87 (4.4%) |
| High School Diploma | 1,450 (81.5%) | 80 (4.5%) |
| College / Associate Degree | 3,685 (84.7%) | 200 (4.6%) |
| Bachelor's Degree or higher | 7,418 (90.1%) | 156 (1.9%) |
| Total | 14,135 (86.5%) | 523 (3.2%) |
Employment Occupations by Sex in Goleta
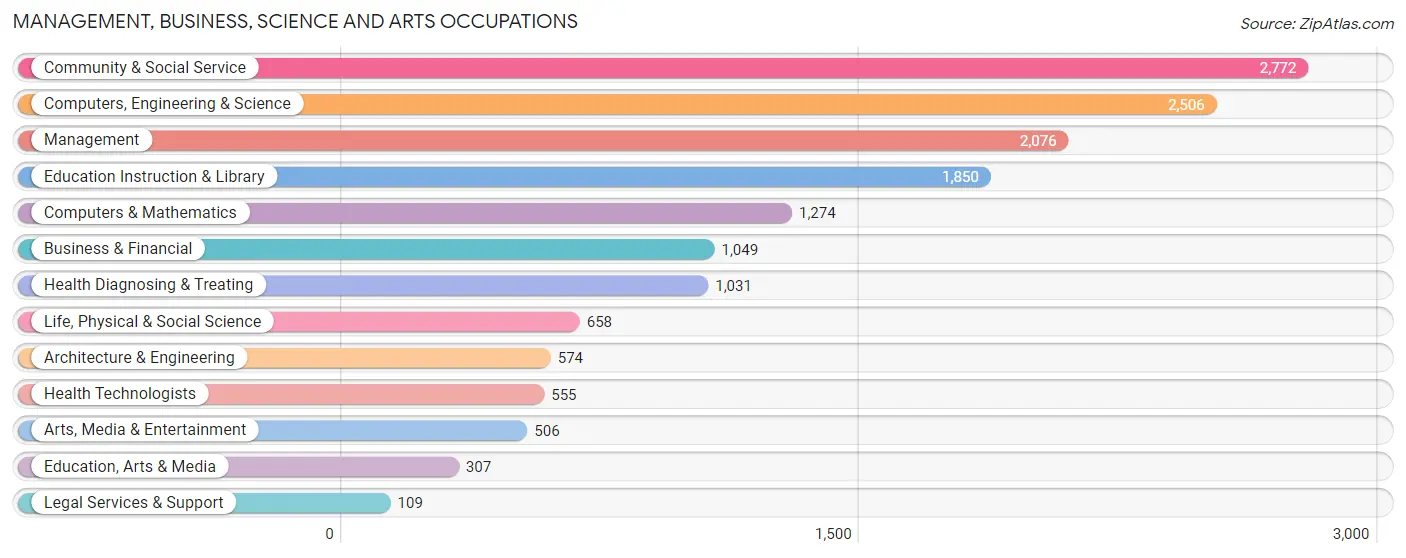
Management, Business, Science and Arts Occupations
The most common Management, Business, Science and Arts occupations in Goleta are Community & Social Service (2,772 | 15.7%), Computers, Engineering & Science (2,506 | 14.1%), Management (2,076 | 11.7%), Education Instruction & Library (1,850 | 10.4%), and Computers & Mathematics (1,274 | 7.2%).
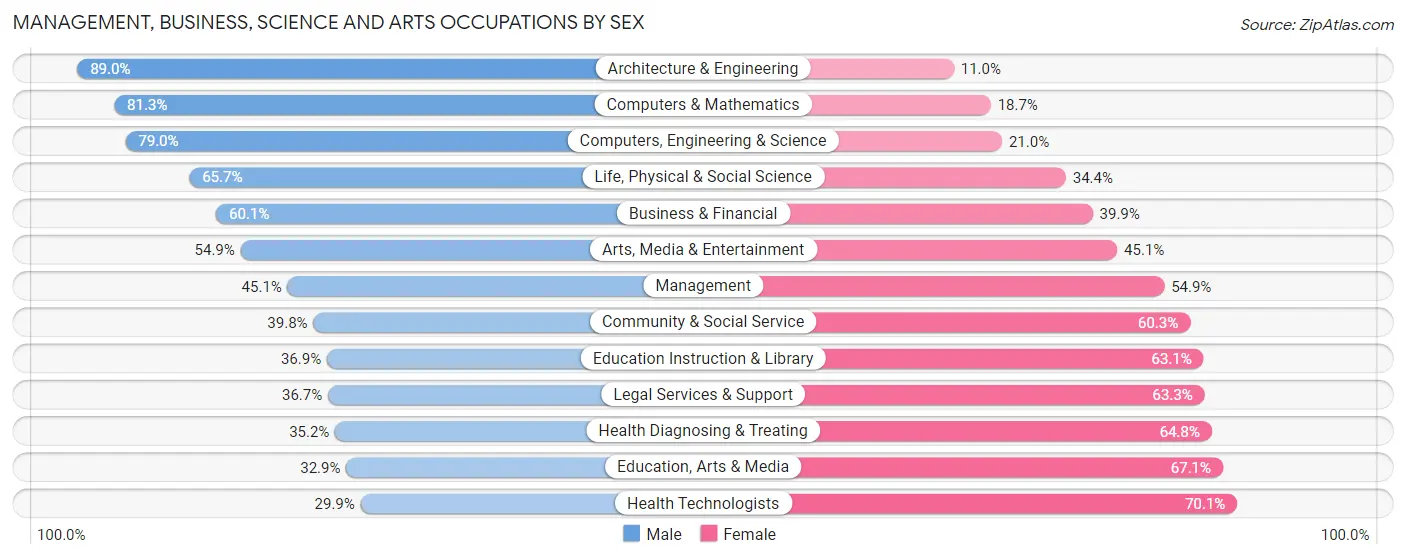
Management, Business, Science and Arts Occupations by Sex
Within the Management, Business, Science and Arts occupations in Goleta, the most male-oriented occupations are Architecture & Engineering (89.0%), Computers & Mathematics (81.3%), and Computers, Engineering & Science (79.0%), while the most female-oriented occupations are Health Technologists (70.1%), Education, Arts & Media (67.1%), and Health Diagnosing & Treating (64.8%).
| Occupation | Male | Female |
| Management | 937 (45.1%) | 1,139 (54.9%) |
| Business & Financial | 630 (60.1%) | 419 (39.9%) |
| Computers, Engineering & Science | 1,979 (79.0%) | 527 (21.0%) |
| Computers & Mathematics | 1,036 (81.3%) | 238 (18.7%) |
| Architecture & Engineering | 511 (89.0%) | 63 (11.0%) |
| Life, Physical & Social Science | 432 (65.6%) | 226 (34.4%) |
| Community & Social Service | 1,102 (39.8%) | 1,670 (60.3%) |
| Education, Arts & Media | 101 (32.9%) | 206 (67.1%) |
| Legal Services & Support | 40 (36.7%) | 69 (63.3%) |
| Education Instruction & Library | 683 (36.9%) | 1,167 (63.1%) |
| Arts, Media & Entertainment | 278 (54.9%) | 228 (45.1%) |
| Health Diagnosing & Treating | 363 (35.2%) | 668 (64.8%) |
| Health Technologists | 166 (29.9%) | 389 (70.1%) |
| Total (Category) | 5,011 (53.1%) | 4,423 (46.9%) |
| Total (Overall) | 9,795 (55.3%) | 7,909 (44.7%) |
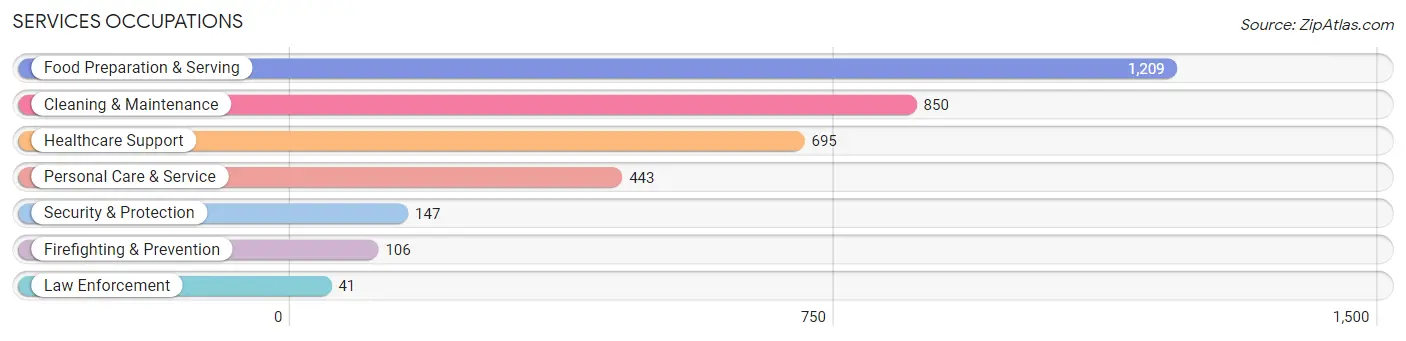
Services Occupations
The most common Services occupations in Goleta are Food Preparation & Serving (1,209 | 6.8%), Cleaning & Maintenance (850 | 4.8%), Healthcare Support (695 | 3.9%), Personal Care & Service (443 | 2.5%), and Security & Protection (147 | 0.8%).
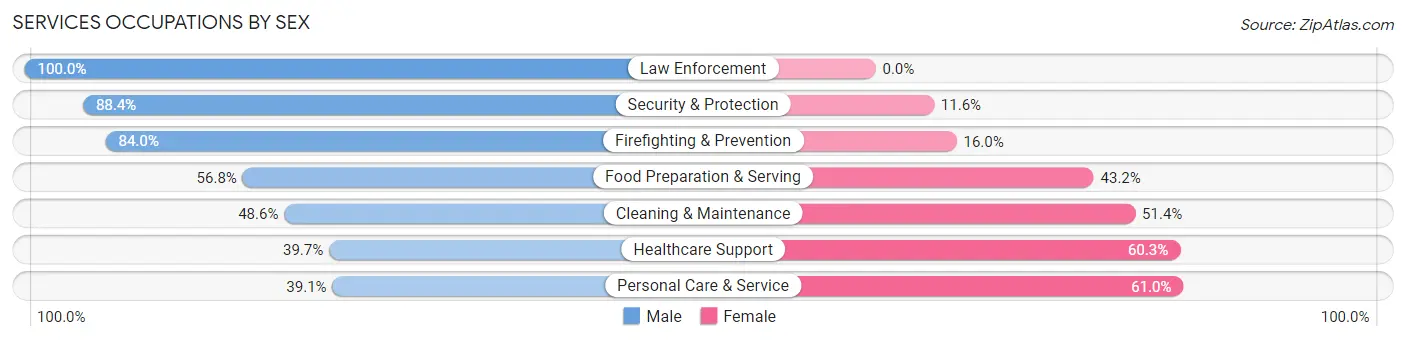
Services Occupations by Sex
Within the Services occupations in Goleta, the most male-oriented occupations are Law Enforcement (100.0%), Security & Protection (88.4%), and Firefighting & Prevention (84.0%), while the most female-oriented occupations are Personal Care & Service (61.0%), Healthcare Support (60.3%), and Cleaning & Maintenance (51.4%).
| Occupation | Male | Female |
| Healthcare Support | 276 (39.7%) | 419 (60.3%) |
| Security & Protection | 130 (88.4%) | 17 (11.6%) |
| Firefighting & Prevention | 89 (84.0%) | 17 (16.0%) |
| Law Enforcement | 41 (100.0%) | 0 (0.0%) |
| Food Preparation & Serving | 687 (56.8%) | 522 (43.2%) |
| Cleaning & Maintenance | 413 (48.6%) | 437 (51.4%) |
| Personal Care & Service | 173 (39.1%) | 270 (61.0%) |
| Total (Category) | 1,679 (50.2%) | 1,665 (49.8%) |
| Total (Overall) | 9,795 (55.3%) | 7,909 (44.7%) |
Sales and Office Occupations
The most common Sales and Office occupations in Goleta are Office & Administration (1,764 | 10.0%), and Sales & Related (943 | 5.3%).

Sales and Office Occupations by Sex
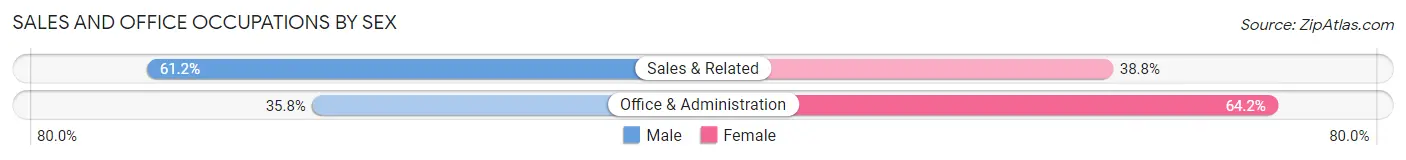
| Occupation | Male | Female |
| Sales & Related | 577 (61.2%) | 366 (38.8%) |
| Office & Administration | 632 (35.8%) | 1,132 (64.2%) |
| Total (Category) | 1,209 (44.7%) | 1,498 (55.3%) |
| Total (Overall) | 9,795 (55.3%) | 7,909 (44.7%) |
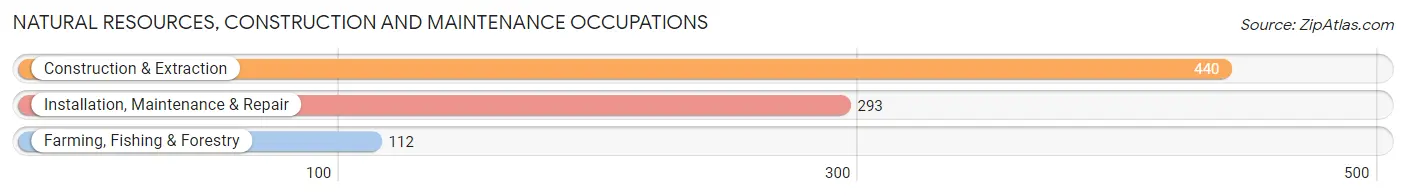
Natural Resources, Construction and Maintenance Occupations
The most common Natural Resources, Construction and Maintenance occupations in Goleta are Construction & Extraction (440 | 2.5%), Installation, Maintenance & Repair (293 | 1.7%), and Farming, Fishing & Forestry (112 | 0.6%).
Natural Resources, Construction and Maintenance Occupations by Sex
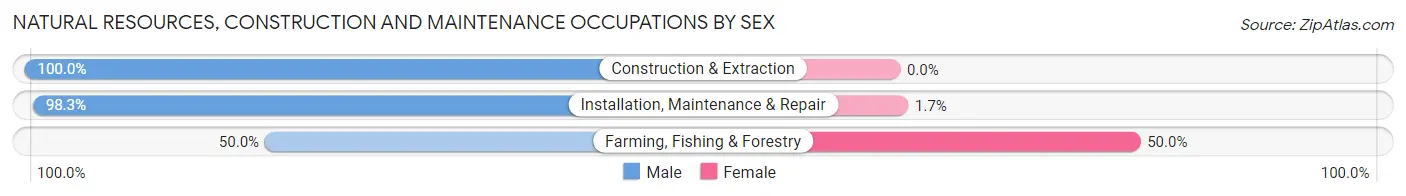
| Occupation | Male | Female |
| Farming, Fishing & Forestry | 56 (50.0%) | 56 (50.0%) |
| Construction & Extraction | 440 (100.0%) | 0 (0.0%) |
| Installation, Maintenance & Repair | 288 (98.3%) | 5 (1.7%) |
| Total (Category) | 784 (92.8%) | 61 (7.2%) |
| Total (Overall) | 9,795 (55.3%) | 7,909 (44.7%) |
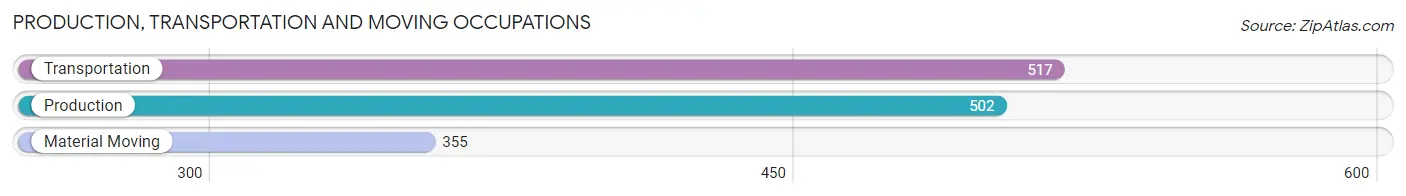
Production, Transportation and Moving Occupations
The most common Production, Transportation and Moving occupations in Goleta are Transportation (517 | 2.9%), Production (502 | 2.8%), and Material Moving (355 | 2.0%).
Production, Transportation and Moving Occupations by Sex
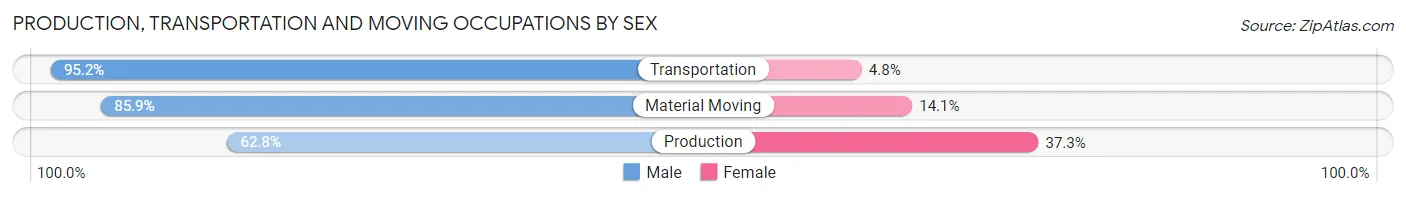
| Occupation | Male | Female |
| Production | 315 (62.7%) | 187 (37.2%) |
| Transportation | 492 (95.2%) | 25 (4.8%) |
| Material Moving | 305 (85.9%) | 50 (14.1%) |
| Total (Category) | 1,112 (80.9%) | 262 (19.1%) |
| Total (Overall) | 9,795 (55.3%) | 7,909 (44.7%) |
Employment Industries by Sex in Goleta
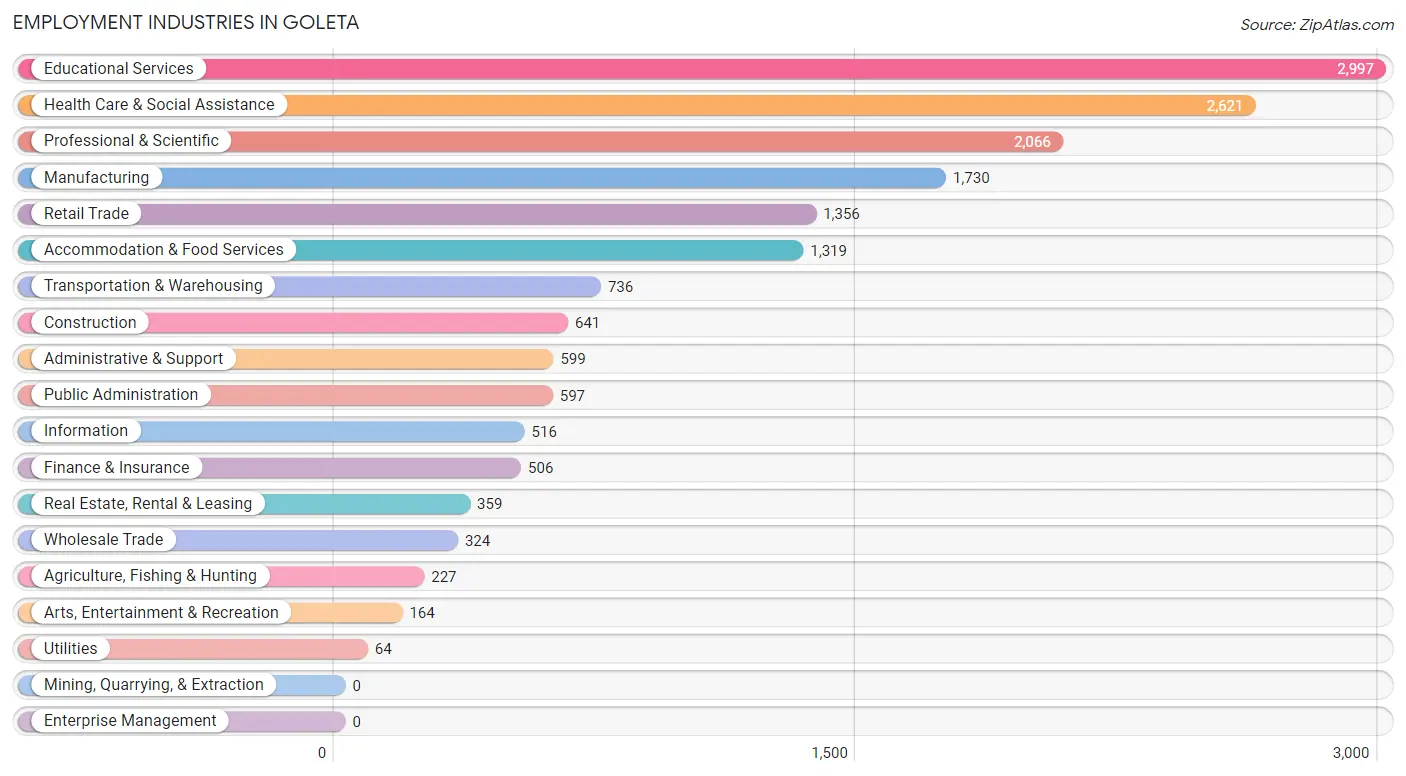
Employment Industries in Goleta
The major employment industries in Goleta include Educational Services (2,997 | 16.9%), Health Care & Social Assistance (2,621 | 14.8%), Professional & Scientific (2,066 | 11.7%), Manufacturing (1,730 | 9.8%), and Retail Trade (1,356 | 7.7%).
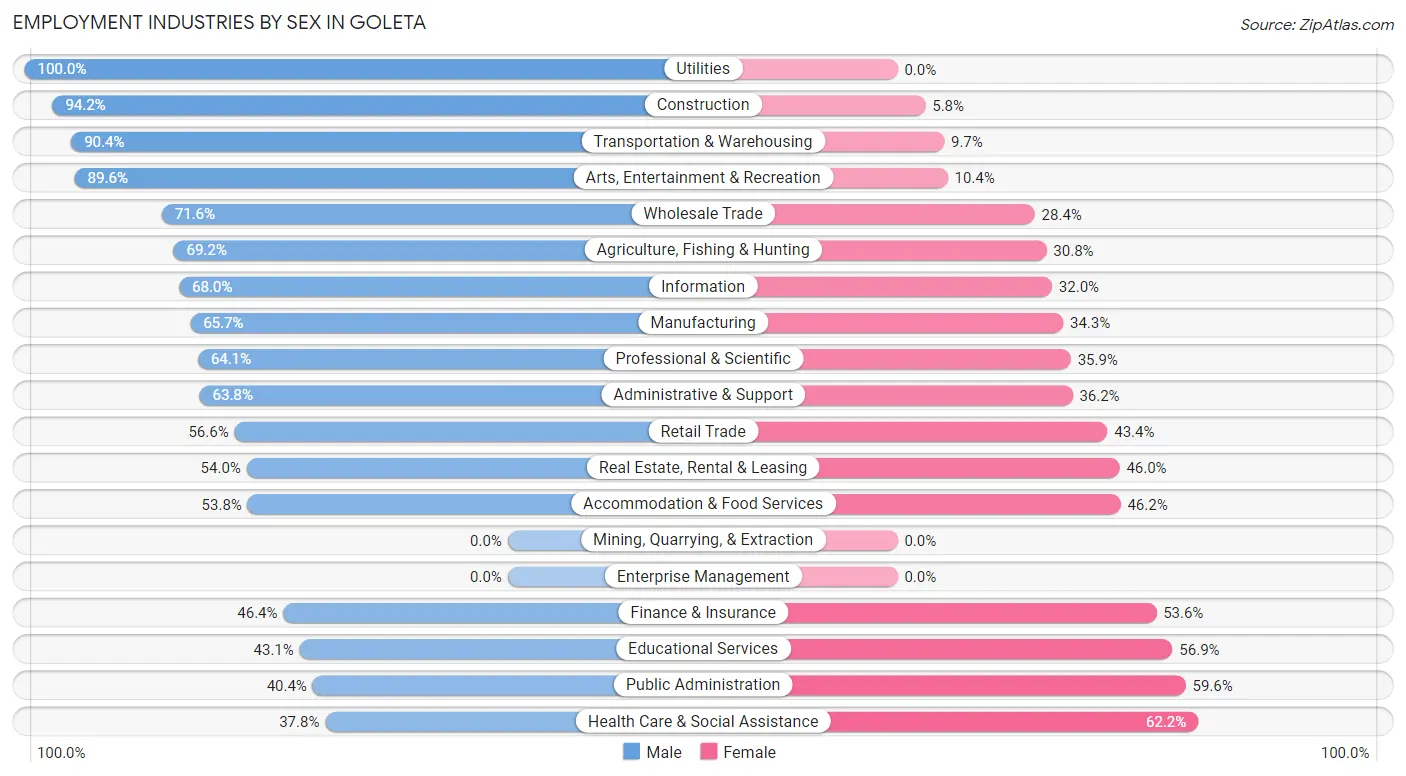
Employment Industries by Sex in Goleta
The Goleta industries that see more men than women are Utilities (100.0%), Construction (94.2%), and Transportation & Warehousing (90.3%), whereas the industries that tend to have a higher number of women are Health Care & Social Assistance (62.2%), Public Administration (59.6%), and Educational Services (56.9%).
| Industry | Male | Female |
| Agriculture, Fishing & Hunting | 157 (69.2%) | 70 (30.8%) |
| Mining, Quarrying, & Extraction | 0 (0.0%) | 0 (0.0%) |
| Construction | 604 (94.2%) | 37 (5.8%) |
| Manufacturing | 1,137 (65.7%) | 593 (34.3%) |
| Wholesale Trade | 232 (71.6%) | 92 (28.4%) |
| Retail Trade | 767 (56.6%) | 589 (43.4%) |
| Transportation & Warehousing | 665 (90.3%) | 71 (9.7%) |
| Utilities | 64 (100.0%) | 0 (0.0%) |
| Information | 351 (68.0%) | 165 (32.0%) |
| Finance & Insurance | 235 (46.4%) | 271 (53.6%) |
| Real Estate, Rental & Leasing | 194 (54.0%) | 165 (46.0%) |
| Professional & Scientific | 1,325 (64.1%) | 741 (35.9%) |
| Enterprise Management | 0 (0.0%) | 0 (0.0%) |
| Administrative & Support | 382 (63.8%) | 217 (36.2%) |
| Educational Services | 1,291 (43.1%) | 1,706 (56.9%) |
| Health Care & Social Assistance | 990 (37.8%) | 1,631 (62.2%) |
| Arts, Entertainment & Recreation | 147 (89.6%) | 17 (10.4%) |
| Accommodation & Food Services | 710 (53.8%) | 609 (46.2%) |
| Public Administration | 241 (40.4%) | 356 (59.6%) |
| Total | 9,795 (55.3%) | 7,909 (44.7%) |
Education in Goleta
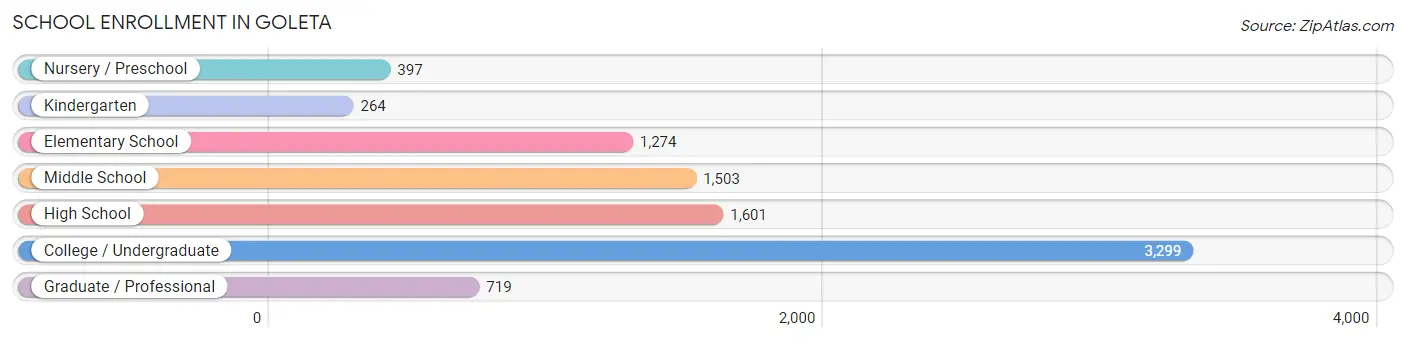
School Enrollment in Goleta
The most common levels of schooling among the 9,057 students in Goleta are college / undergraduate (3,299 | 36.4%), high school (1,601 | 17.7%), and middle school (1,503 | 16.6%).
| School Level | # Students | % Students |
| Nursery / Preschool | 397 | 4.4% |
| Kindergarten | 264 | 2.9% |
| Elementary School | 1,274 | 14.1% |
| Middle School | 1,503 | 16.6% |
| High School | 1,601 | 17.7% |
| College / Undergraduate | 3,299 | 36.4% |
| Graduate / Professional | 719 | 7.9% |
| Total | 9,057 | 100.0% |
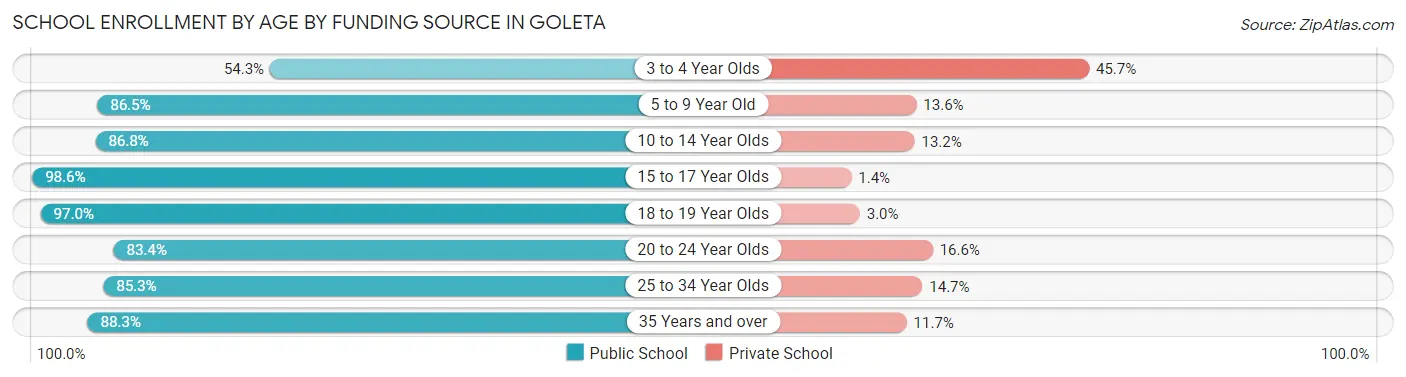
School Enrollment by Age by Funding Source in Goleta
Out of a total of 9,057 students who are enrolled in schools in Goleta, 1,196 (13.2%) attend a private institution, while the remaining 7,861 (86.8%) are enrolled in public schools. The age group of 3 to 4 year olds has the highest likelihood of being enrolled in private schools, with 138 (45.7% in the age bracket) enrolled. Conversely, the age group of 15 to 17 year olds has the lowest likelihood of being enrolled in a private school, with 1,034 (98.6% in the age bracket) attending a public institution.
| Age Bracket | Public School | Private School |
| 3 to 4 Year Olds | 164 (54.3%) | 138 (45.7%) |
| 5 to 9 Year Old | 1,244 (86.5%) | 195 (13.6%) |
| 10 to 14 Year Olds | 1,716 (86.8%) | 261 (13.2%) |
| 15 to 17 Year Olds | 1,034 (98.6%) | 15 (1.4%) |
| 18 to 19 Year Olds | 647 (97.0%) | 20 (3.0%) |
| 20 to 24 Year Olds | 2,129 (83.4%) | 423 (16.6%) |
| 25 to 34 Year Olds | 623 (85.3%) | 107 (14.7%) |
| 35 Years and over | 301 (88.3%) | 40 (11.7%) |
| Total | 7,861 (86.8%) | 1,196 (13.2%) |
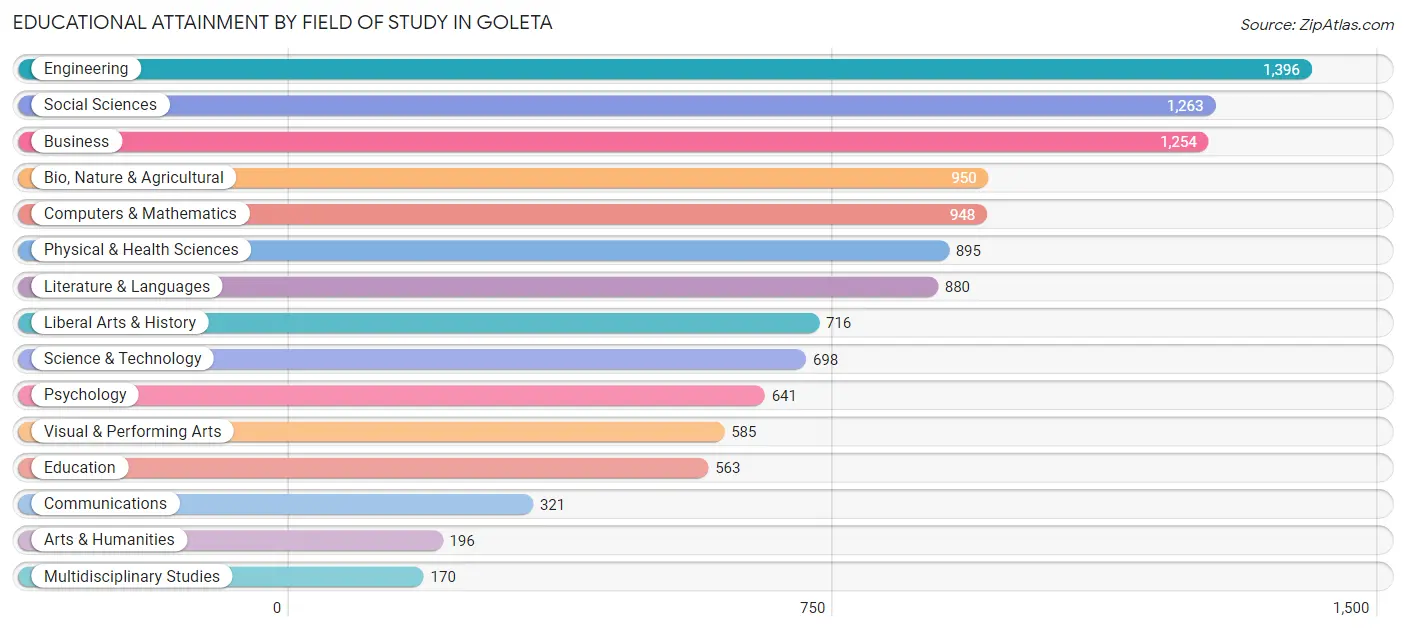
Educational Attainment by Field of Study in Goleta
Engineering (1,396 | 12.2%), social sciences (1,263 | 11.0%), business (1,254 | 10.9%), bio, nature & agricultural (950 | 8.3%), and computers & mathematics (948 | 8.3%) are the most common fields of study among 11,476 individuals in Goleta who have obtained a bachelor's degree or higher.
| Field of Study | # Graduates | % Graduates |
| Computers & Mathematics | 948 | 8.3% |
| Bio, Nature & Agricultural | 950 | 8.3% |
| Physical & Health Sciences | 895 | 7.8% |
| Psychology | 641 | 5.6% |
| Social Sciences | 1,263 | 11.0% |
| Engineering | 1,396 | 12.2% |
| Multidisciplinary Studies | 170 | 1.5% |
| Science & Technology | 698 | 6.1% |
| Business | 1,254 | 10.9% |
| Education | 563 | 4.9% |
| Literature & Languages | 880 | 7.7% |
| Liberal Arts & History | 716 | 6.2% |
| Visual & Performing Arts | 585 | 5.1% |
| Communications | 321 | 2.8% |
| Arts & Humanities | 196 | 1.7% |
| Total | 11,476 | 100.0% |
Transportation & Commute in Goleta
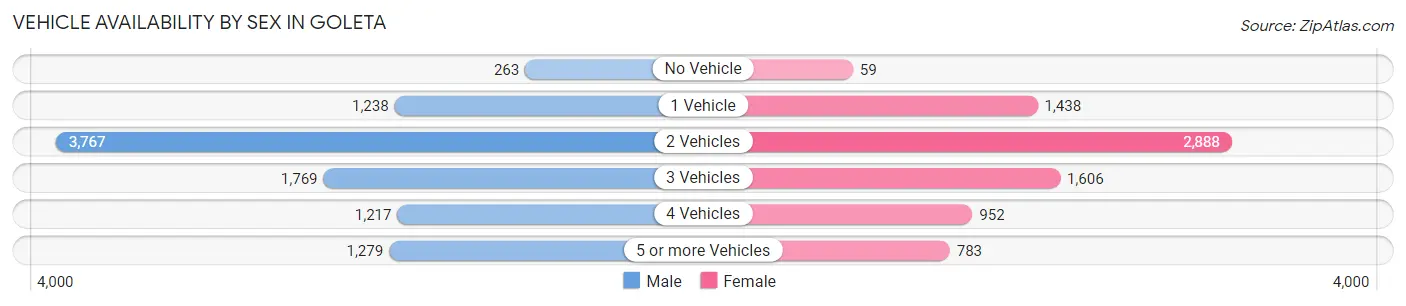
Vehicle Availability by Sex in Goleta
The most prevalent vehicle ownership categories in Goleta are males with 2 vehicles (3,767, accounting for 39.5%) and females with 2 vehicles (2,888, making up 48.8%).
| Vehicles Available | Male | Female |
| No Vehicle | 263 (2.8%) | 59 (0.8%) |
| 1 Vehicle | 1,238 (13.0%) | 1,438 (18.6%) |
| 2 Vehicles | 3,767 (39.5%) | 2,888 (37.4%) |
| 3 Vehicles | 1,769 (18.6%) | 1,606 (20.8%) |
| 4 Vehicles | 1,217 (12.8%) | 952 (12.3%) |
| 5 or more Vehicles | 1,279 (13.4%) | 783 (10.1%) |
| Total | 9,533 (100.0%) | 7,726 (100.0%) |
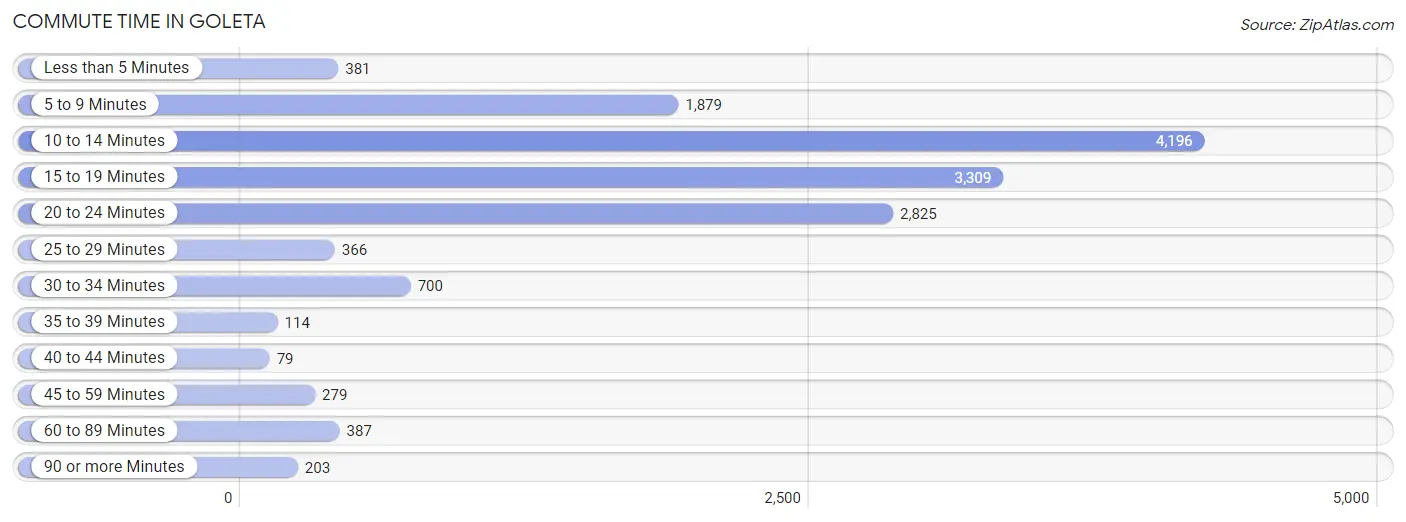
Commute Time in Goleta
The most frequently occuring commute durations in Goleta are 10 to 14 minutes (4,196 commuters, 28.5%), 15 to 19 minutes (3,309 commuters, 22.5%), and 20 to 24 minutes (2,825 commuters, 19.2%).
| Commute Time | # Commuters | % Commuters |
| Less than 5 Minutes | 381 | 2.6% |
| 5 to 9 Minutes | 1,879 | 12.8% |
| 10 to 14 Minutes | 4,196 | 28.5% |
| 15 to 19 Minutes | 3,309 | 22.5% |
| 20 to 24 Minutes | 2,825 | 19.2% |
| 25 to 29 Minutes | 366 | 2.5% |
| 30 to 34 Minutes | 700 | 4.8% |
| 35 to 39 Minutes | 114 | 0.8% |
| 40 to 44 Minutes | 79 | 0.5% |
| 45 to 59 Minutes | 279 | 1.9% |
| 60 to 89 Minutes | 387 | 2.6% |
| 90 or more Minutes | 203 | 1.4% |
Commute Time by Sex in Goleta
The most common commute times in Goleta are 10 to 14 minutes (2,381 commuters, 29.3%) for males and 10 to 14 minutes (1,815 commuters, 27.6%) for females.
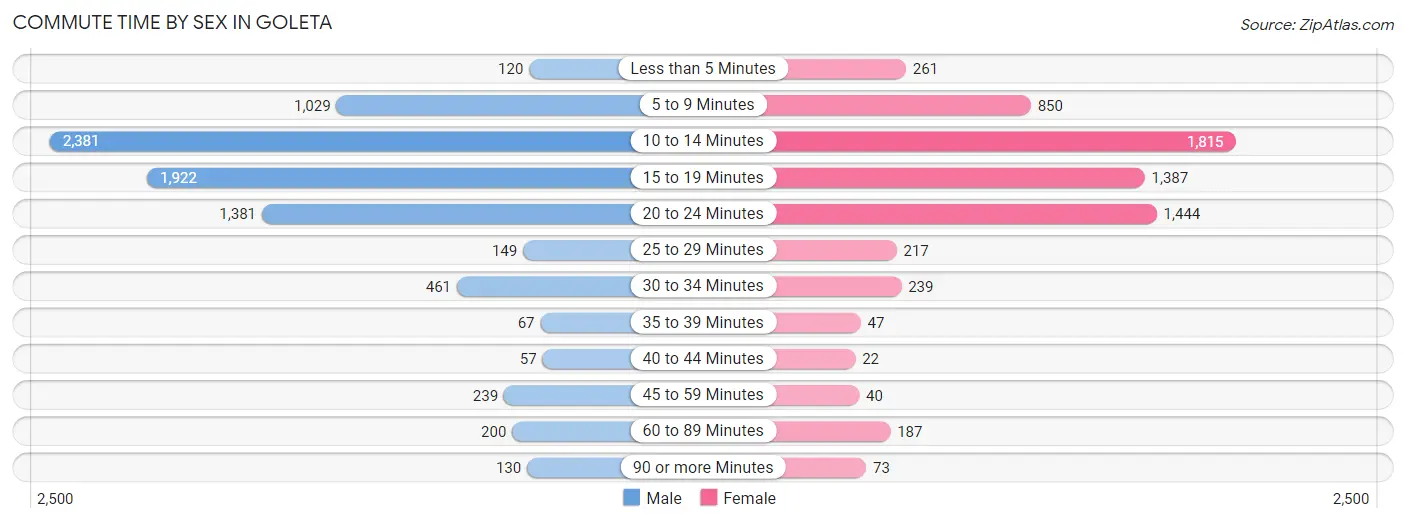
| Commute Time | Male | Female |
| Less than 5 Minutes | 120 (1.5%) | 261 (4.0%) |
| 5 to 9 Minutes | 1,029 (12.7%) | 850 (12.9%) |
| 10 to 14 Minutes | 2,381 (29.3%) | 1,815 (27.6%) |
| 15 to 19 Minutes | 1,922 (23.6%) | 1,387 (21.1%) |
| 20 to 24 Minutes | 1,381 (17.0%) | 1,444 (21.9%) |
| 25 to 29 Minutes | 149 (1.8%) | 217 (3.3%) |
| 30 to 34 Minutes | 461 (5.7%) | 239 (3.6%) |
| 35 to 39 Minutes | 67 (0.8%) | 47 (0.7%) |
| 40 to 44 Minutes | 57 (0.7%) | 22 (0.3%) |
| 45 to 59 Minutes | 239 (2.9%) | 40 (0.6%) |
| 60 to 89 Minutes | 200 (2.5%) | 187 (2.8%) |
| 90 or more Minutes | 130 (1.6%) | 73 (1.1%) |
Time of Departure to Work by Sex in Goleta
The most frequent times of departure to work in Goleta are 7:30 AM to 7:59 AM (1,487, 18.3%) for males and 8:00 AM to 8:29 AM (1,354, 20.6%) for females.
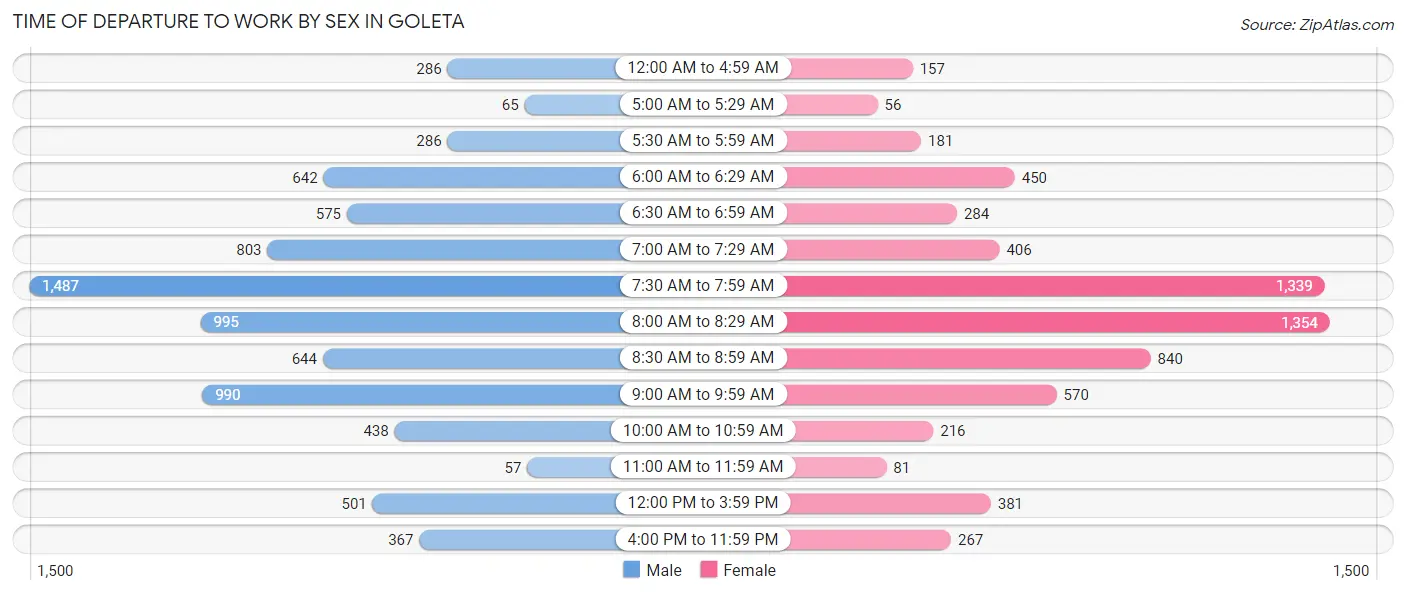
| Time of Departure | Male | Female |
| 12:00 AM to 4:59 AM | 286 (3.5%) | 157 (2.4%) |
| 5:00 AM to 5:29 AM | 65 (0.8%) | 56 (0.9%) |
| 5:30 AM to 5:59 AM | 286 (3.5%) | 181 (2.8%) |
| 6:00 AM to 6:29 AM | 642 (7.9%) | 450 (6.8%) |
| 6:30 AM to 6:59 AM | 575 (7.1%) | 284 (4.3%) |
| 7:00 AM to 7:29 AM | 803 (9.9%) | 406 (6.2%) |
| 7:30 AM to 7:59 AM | 1,487 (18.3%) | 1,339 (20.3%) |
| 8:00 AM to 8:29 AM | 995 (12.2%) | 1,354 (20.6%) |
| 8:30 AM to 8:59 AM | 644 (7.9%) | 840 (12.8%) |
| 9:00 AM to 9:59 AM | 990 (12.2%) | 570 (8.7%) |
| 10:00 AM to 10:59 AM | 438 (5.4%) | 216 (3.3%) |
| 11:00 AM to 11:59 AM | 57 (0.7%) | 81 (1.2%) |
| 12:00 PM to 3:59 PM | 501 (6.2%) | 381 (5.8%) |
| 4:00 PM to 11:59 PM | 367 (4.5%) | 267 (4.1%) |
| Total | 8,136 (100.0%) | 6,582 (100.0%) |
Housing Occupancy in Goleta
Occupancy by Ownership in Goleta
Of the total 11,938 dwellings in Goleta, owner-occupied units account for 6,115 (51.2%), while renter-occupied units make up 5,823 (48.8%).
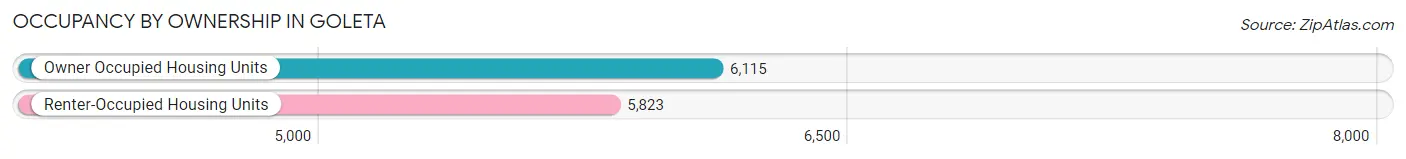
| Occupancy | # Housing Units | % Housing Units |
| Owner Occupied Housing Units | 6,115 | 51.2% |
| Renter-Occupied Housing Units | 5,823 | 48.8% |
| Total Occupied Housing Units | 11,938 | 100.0% |
Occupancy by Household Size in Goleta
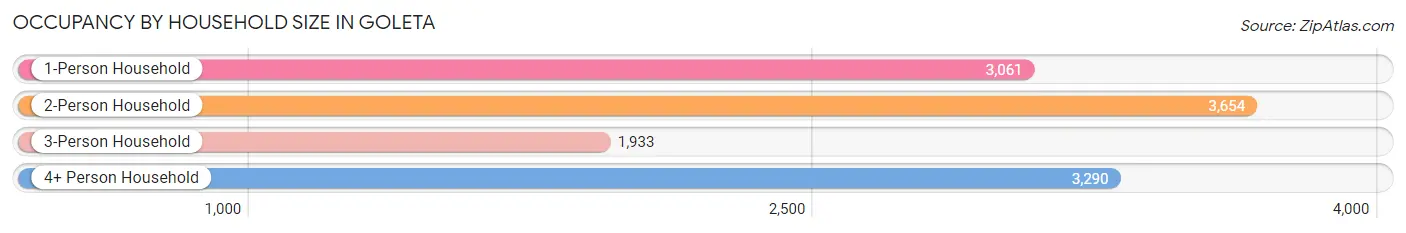
| Household Size | # Housing Units | % Housing Units |
| 1-Person Household | 3,061 | 25.6% |
| 2-Person Household | 3,654 | 30.6% |
| 3-Person Household | 1,933 | 16.2% |
| 4+ Person Household | 3,290 | 27.6% |
| Total Housing Units | 11,938 | 100.0% |
Occupancy by Ownership by Household Size in Goleta
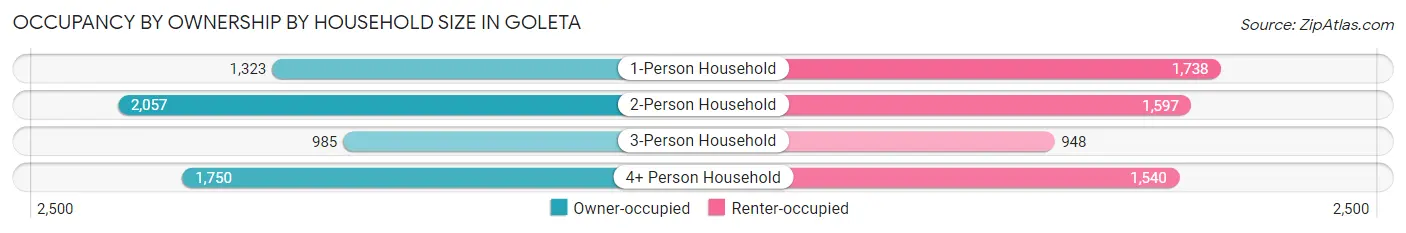
| Household Size | Owner-occupied | Renter-occupied |
| 1-Person Household | 1,323 (43.2%) | 1,738 (56.8%) |
| 2-Person Household | 2,057 (56.3%) | 1,597 (43.7%) |
| 3-Person Household | 985 (51.0%) | 948 (49.0%) |
| 4+ Person Household | 1,750 (53.2%) | 1,540 (46.8%) |
| Total Housing Units | 6,115 (51.2%) | 5,823 (48.8%) |
Occupancy by Educational Attainment in Goleta
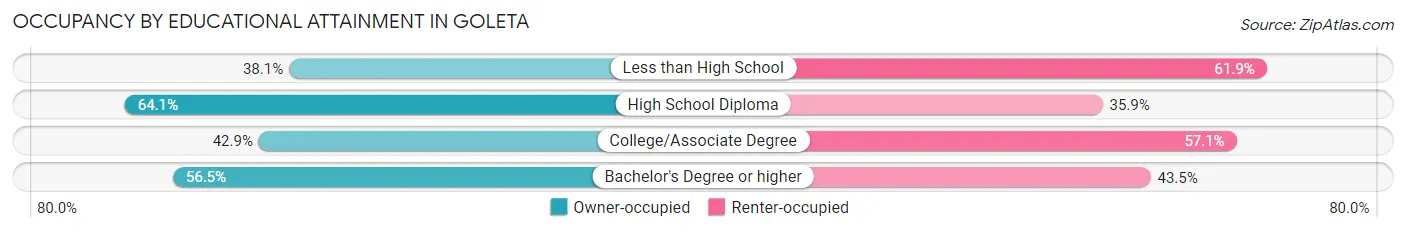
| Household Size | Owner-occupied | Renter-occupied |
| Less than High School | 461 (38.1%) | 750 (61.9%) |
| High School Diploma | 698 (64.1%) | 391 (35.9%) |
| College/Associate Degree | 1,534 (42.9%) | 2,045 (57.1%) |
| Bachelor's Degree or higher | 3,422 (56.5%) | 2,637 (43.5%) |
Occupancy by Age of Householder in Goleta
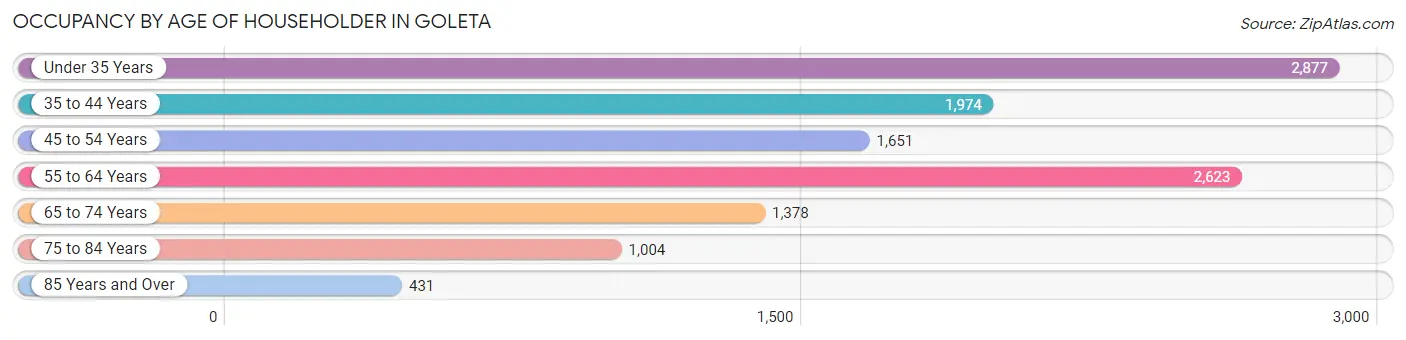
| Age Bracket | # Households | % Households |
| Under 35 Years | 2,877 | 24.1% |
| 35 to 44 Years | 1,974 | 16.5% |
| 45 to 54 Years | 1,651 | 13.8% |
| 55 to 64 Years | 2,623 | 22.0% |
| 65 to 74 Years | 1,378 | 11.5% |
| 75 to 84 Years | 1,004 | 8.4% |
| 85 Years and Over | 431 | 3.6% |
| Total | 11,938 | 100.0% |
Housing Finances in Goleta
Median Income by Occupancy in Goleta
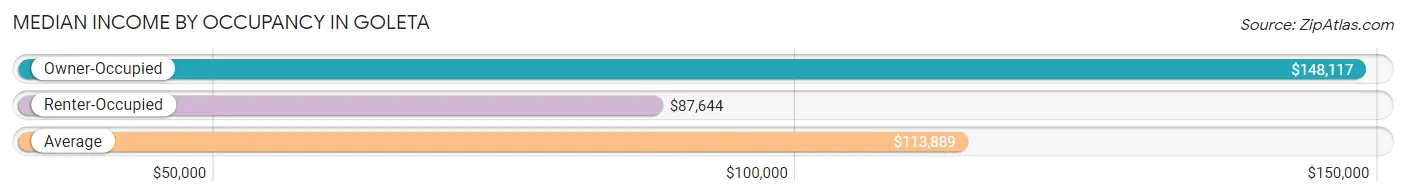
| Occupancy Type | # Households | Median Income |
| Owner-Occupied | 6,115 (51.2%) | $148,117 |
| Renter-Occupied | 5,823 (48.8%) | $87,644 |
| Average | 11,938 (100.0%) | $113,889 |
Occupancy by Householder Income Bracket in Goleta
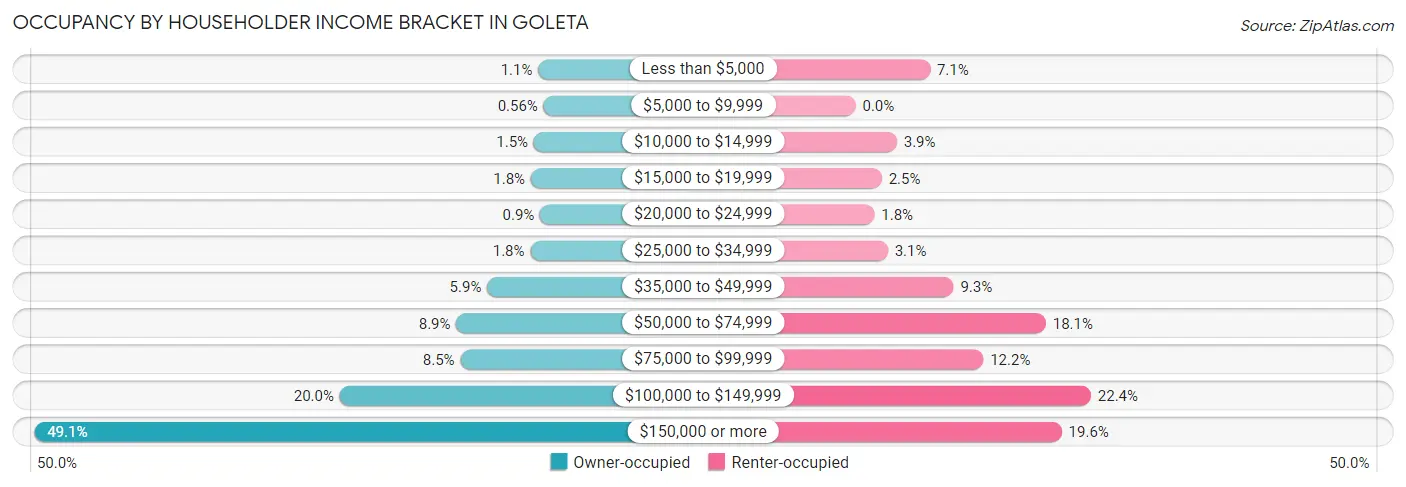
| Income Bracket | Owner-occupied | Renter-occupied |
| Less than $5,000 | 66 (1.1%) | 413 (7.1%) |
| $5,000 to $9,999 | 34 (0.6%) | 0 (0.0%) |
| $10,000 to $14,999 | 91 (1.5%) | 229 (3.9%) |
| $15,000 to $19,999 | 109 (1.8%) | 145 (2.5%) |
| $20,000 to $24,999 | 55 (0.9%) | 104 (1.8%) |
| $25,000 to $34,999 | 112 (1.8%) | 178 (3.1%) |
| $35,000 to $49,999 | 363 (5.9%) | 543 (9.3%) |
| $50,000 to $74,999 | 543 (8.9%) | 1,055 (18.1%) |
| $75,000 to $99,999 | 519 (8.5%) | 708 (12.2%) |
| $100,000 to $149,999 | 1,222 (20.0%) | 1,305 (22.4%) |
| $150,000 or more | 3,001 (49.1%) | 1,143 (19.6%) |
| Total | 6,115 (100.0%) | 5,823 (100.0%) |
Monthly Housing Cost Tiers in Goleta
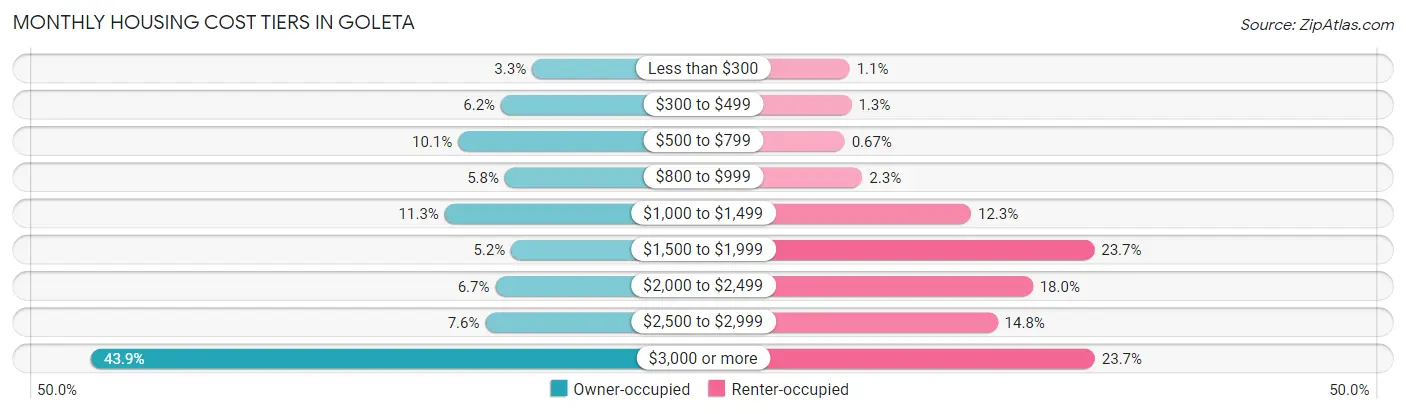
| Monthly Cost | Owner-occupied | Renter-occupied |
| Less than $300 | 201 (3.3%) | 66 (1.1%) |
| $300 to $499 | 376 (6.1%) | 75 (1.3%) |
| $500 to $799 | 617 (10.1%) | 39 (0.7%) |
| $800 to $999 | 354 (5.8%) | 134 (2.3%) |
| $1,000 to $1,499 | 693 (11.3%) | 716 (12.3%) |
| $1,500 to $1,999 | 319 (5.2%) | 1,377 (23.6%) |
| $2,000 to $2,499 | 408 (6.7%) | 1,047 (18.0%) |
| $2,500 to $2,999 | 464 (7.6%) | 859 (14.7%) |
| $3,000 or more | 2,683 (43.9%) | 1,380 (23.7%) |
| Total | 6,115 (100.0%) | 5,823 (100.0%) |
Physical Housing Characteristics in Goleta
Housing Structures in Goleta
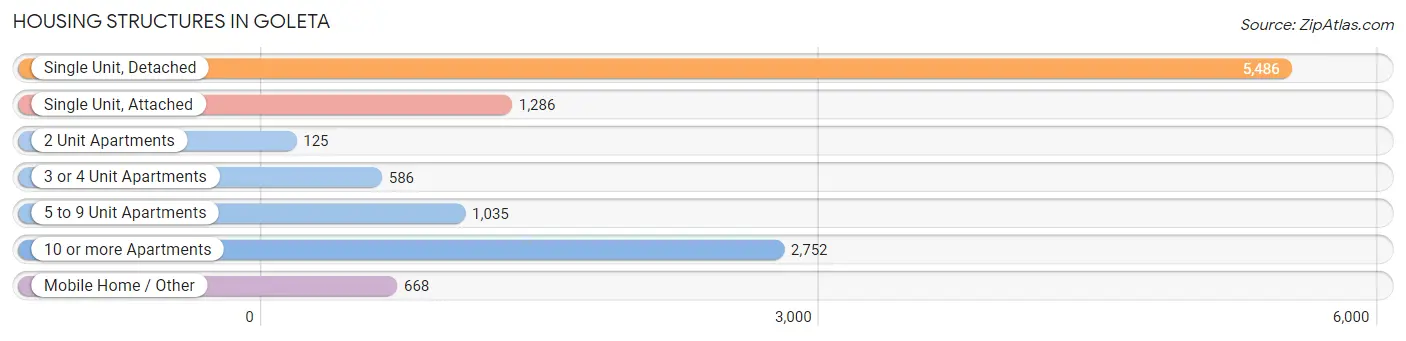
| Structure Type | # Housing Units | % Housing Units |
| Single Unit, Detached | 5,486 | 46.0% |
| Single Unit, Attached | 1,286 | 10.8% |
| 2 Unit Apartments | 125 | 1.1% |
| 3 or 4 Unit Apartments | 586 | 4.9% |
| 5 to 9 Unit Apartments | 1,035 | 8.7% |
| 10 or more Apartments | 2,752 | 23.1% |
| Mobile Home / Other | 668 | 5.6% |
| Total | 11,938 | 100.0% |
Housing Structures by Occupancy in Goleta
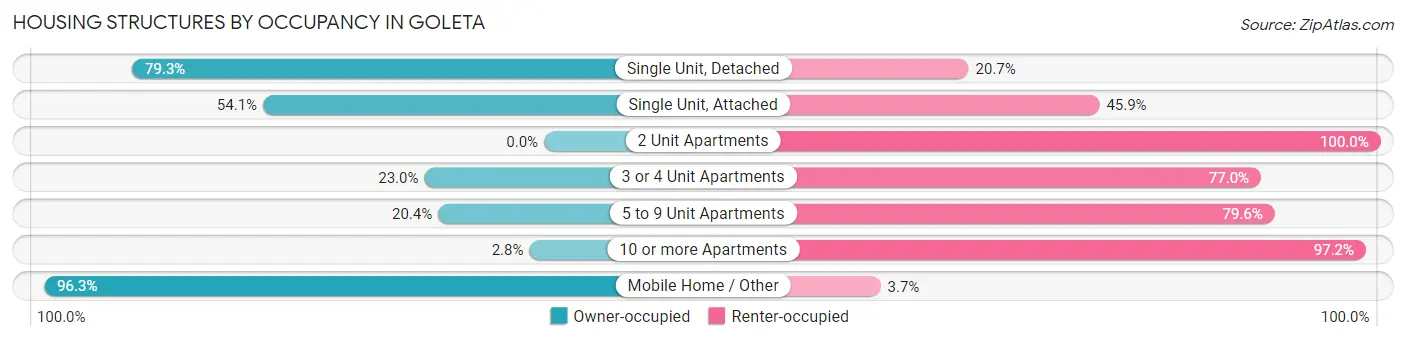
| Structure Type | Owner-occupied | Renter-occupied |
| Single Unit, Detached | 4,352 (79.3%) | 1,134 (20.7%) |
| Single Unit, Attached | 696 (54.1%) | 590 (45.9%) |
| 2 Unit Apartments | 0 (0.0%) | 125 (100.0%) |
| 3 or 4 Unit Apartments | 135 (23.0%) | 451 (77.0%) |
| 5 to 9 Unit Apartments | 211 (20.4%) | 824 (79.6%) |
| 10 or more Apartments | 78 (2.8%) | 2,674 (97.2%) |
| Mobile Home / Other | 643 (96.3%) | 25 (3.7%) |
| Total | 6,115 (51.2%) | 5,823 (48.8%) |
Housing Structures by Number of Rooms in Goleta
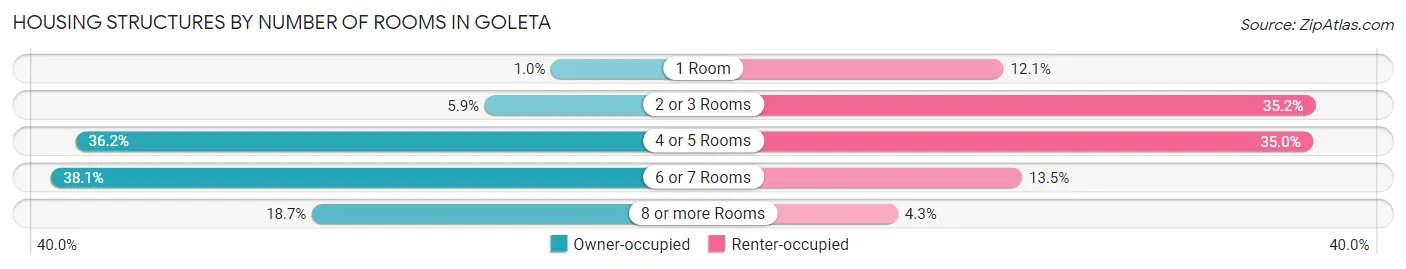
| Number of Rooms | Owner-occupied | Renter-occupied |
| 1 Room | 63 (1.0%) | 705 (12.1%) |
| 2 or 3 Rooms | 363 (5.9%) | 2,047 (35.1%) |
| 4 or 5 Rooms | 2,215 (36.2%) | 2,036 (35.0%) |
| 6 or 7 Rooms | 2,329 (38.1%) | 785 (13.5%) |
| 8 or more Rooms | 1,145 (18.7%) | 250 (4.3%) |
| Total | 6,115 (100.0%) | 5,823 (100.0%) |
Housing Structure by Heating Type in Goleta
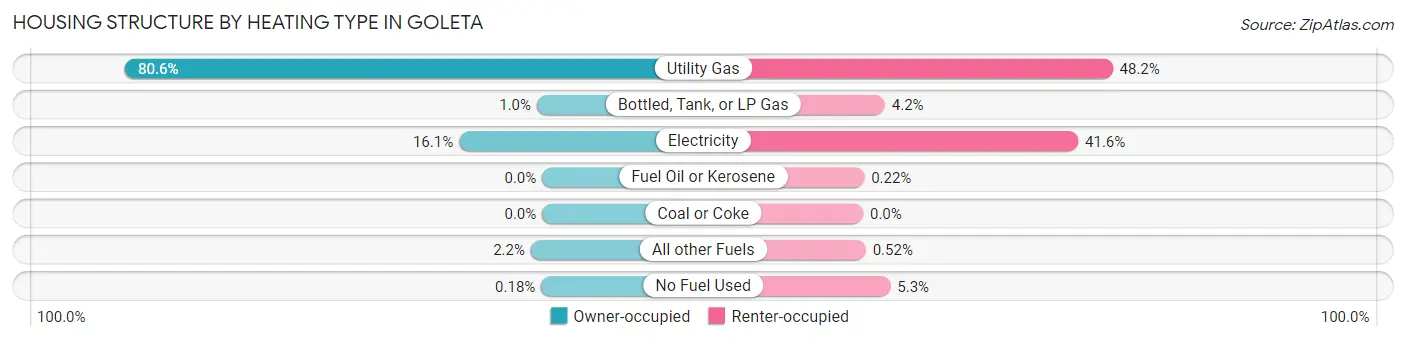
| Heating Type | Owner-occupied | Renter-occupied |
| Utility Gas | 4,926 (80.6%) | 2,808 (48.2%) |
| Bottled, Tank, or LP Gas | 62 (1.0%) | 245 (4.2%) |
| Electricity | 982 (16.1%) | 2,420 (41.6%) |
| Fuel Oil or Kerosene | 0 (0.0%) | 13 (0.2%) |
| Coal or Coke | 0 (0.0%) | 0 (0.0%) |
| All other Fuels | 134 (2.2%) | 30 (0.5%) |
| No Fuel Used | 11 (0.2%) | 307 (5.3%) |
| Total | 6,115 (100.0%) | 5,823 (100.0%) |
Household Vehicle Usage in Goleta
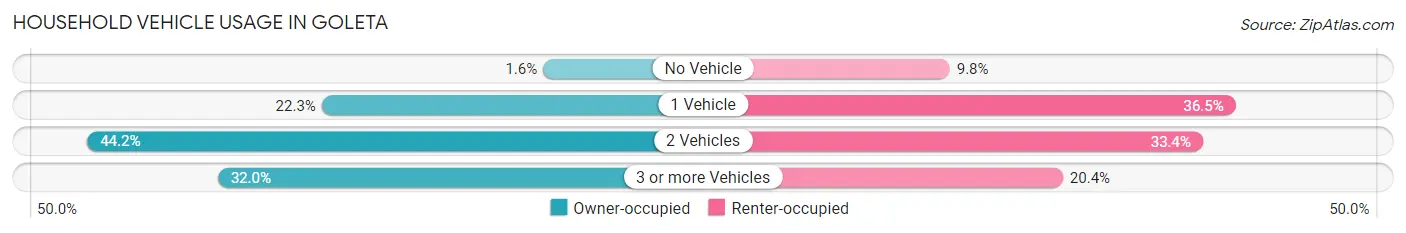
| Vehicles per Household | Owner-occupied | Renter-occupied |
| No Vehicle | 98 (1.6%) | 570 (9.8%) |
| 1 Vehicle | 1,362 (22.3%) | 2,123 (36.5%) |
| 2 Vehicles | 2,700 (44.2%) | 1,945 (33.4%) |
| 3 or more Vehicles | 1,955 (32.0%) | 1,185 (20.3%) |
| Total | 6,115 (100.0%) | 5,823 (100.0%) |
Real Estate & Mortgages in Goleta
Real Estate and Mortgage Overview in Goleta
| Characteristic | Without Mortgage | With Mortgage |
| Housing Units | 2,040 | 4,075 |
| Median Property Value | $877,500 | $926,000 |
| Median Household Income | $98,088 | $2,388 |
| Monthly Housing Costs | $705 | $2,667 |
| Real Estate Taxes | $3,840 | $161 |
Property Value by Mortgage Status in Goleta
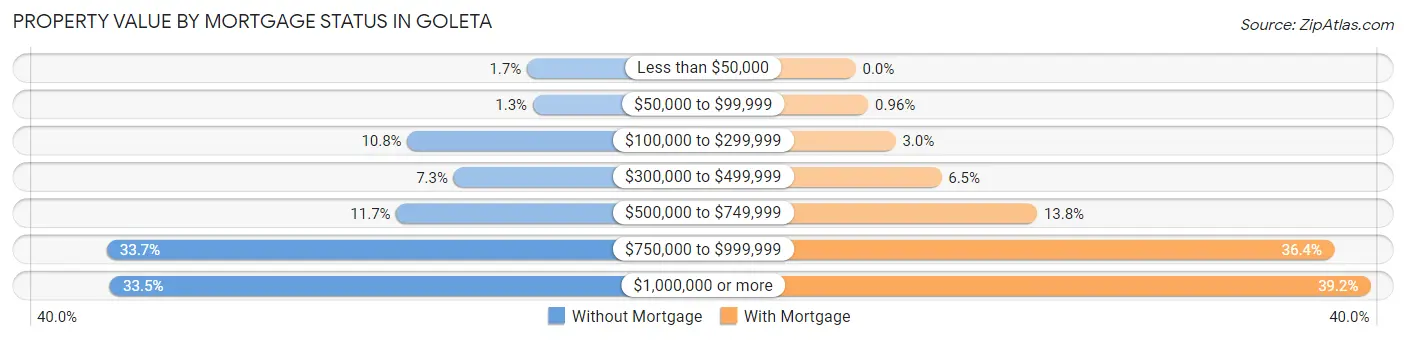
| Property Value | Without Mortgage | With Mortgage |
| Less than $50,000 | 35 (1.7%) | 0 (0.0%) |
| $50,000 to $99,999 | 26 (1.3%) | 39 (1.0%) |
| $100,000 to $299,999 | 221 (10.8%) | 124 (3.0%) |
| $300,000 to $499,999 | 149 (7.3%) | 266 (6.5%) |
| $500,000 to $749,999 | 238 (11.7%) | 563 (13.8%) |
| $750,000 to $999,999 | 688 (33.7%) | 1,485 (36.4%) |
| $1,000,000 or more | 683 (33.5%) | 1,598 (39.2%) |
| Total | 2,040 (100.0%) | 4,075 (100.0%) |
Household Income by Mortgage Status in Goleta
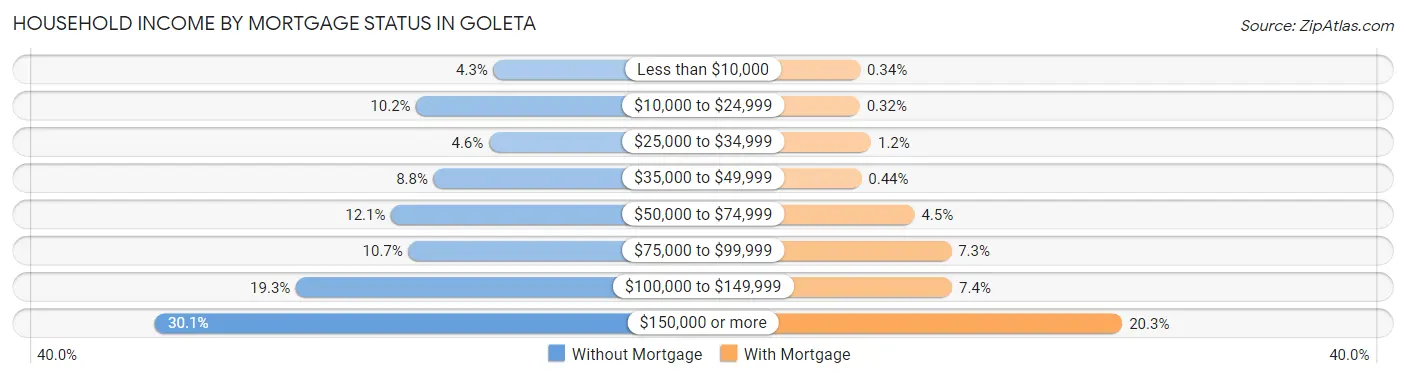
| Household Income | Without Mortgage | With Mortgage |
| Less than $10,000 | 87 (4.3%) | 14 (0.3%) |
| $10,000 to $24,999 | 207 (10.2%) | 13 (0.3%) |
| $25,000 to $34,999 | 94 (4.6%) | 48 (1.2%) |
| $35,000 to $49,999 | 180 (8.8%) | 18 (0.4%) |
| $50,000 to $74,999 | 246 (12.1%) | 183 (4.5%) |
| $75,000 to $99,999 | 219 (10.7%) | 297 (7.3%) |
| $100,000 to $149,999 | 394 (19.3%) | 300 (7.4%) |
| $150,000 or more | 613 (30.0%) | 828 (20.3%) |
| Total | 2,040 (100.0%) | 4,075 (100.0%) |
Property Value to Household Income Ratio in Goleta
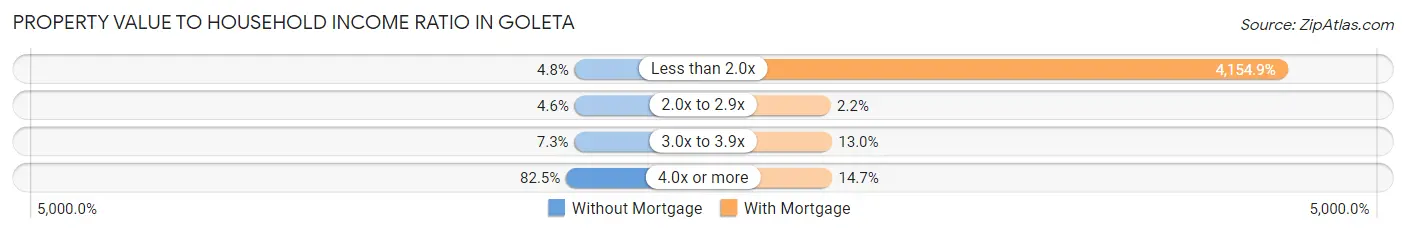
| Value-to-Income Ratio | Without Mortgage | With Mortgage |
| Less than 2.0x | 98 (4.8%) | 169,310 (4,154.8%) |
| 2.0x to 2.9x | 94 (4.6%) | 91 (2.2%) |
| 3.0x to 3.9x | 148 (7.2%) | 530 (13.0%) |
| 4.0x or more | 1,683 (82.5%) | 600 (14.7%) |
| Total | 2,040 (100.0%) | 4,075 (100.0%) |
Real Estate Taxes by Mortgage Status in Goleta
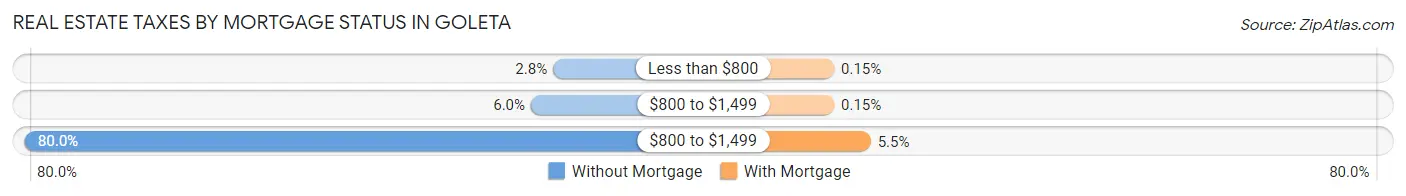
| Property Taxes | Without Mortgage | With Mortgage |
| Less than $800 | 57 (2.8%) | 6 (0.2%) |
| $800 to $1,499 | 123 (6.0%) | 6 (0.2%) |
| $800 to $1,499 | 1,631 (79.9%) | 224 (5.5%) |
| Total | 2,040 (100.0%) | 4,075 (100.0%) |
Health & Disability in Goleta
Health Insurance Coverage by Age in Goleta
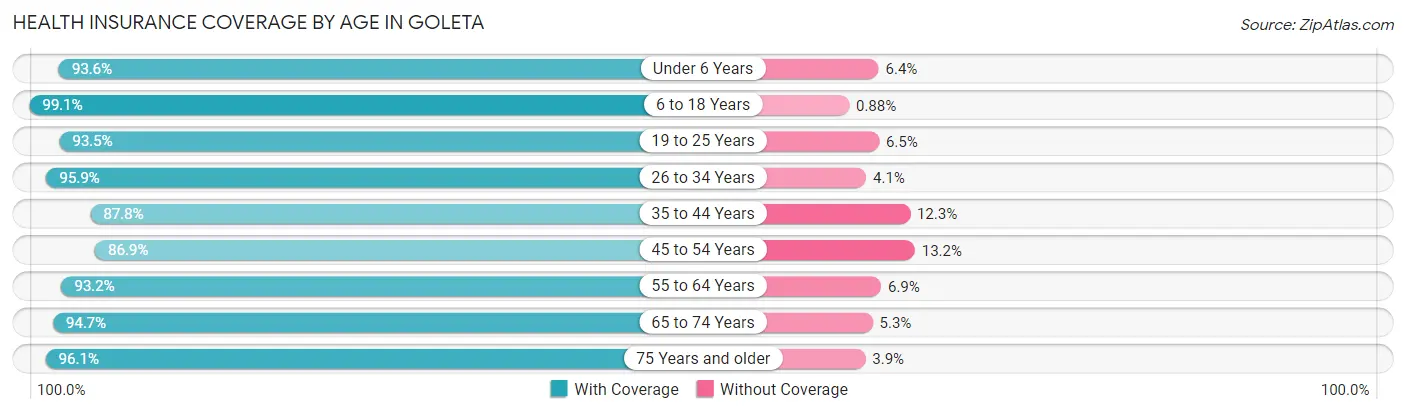
| Age Bracket | With Coverage | Without Coverage |
| Under 6 Years | 1,918 (93.6%) | 131 (6.4%) |
| 6 to 18 Years | 4,732 (99.1%) | 42 (0.9%) |
| 19 to 25 Years | 4,711 (93.5%) | 326 (6.5%) |
| 26 to 34 Years | 4,290 (95.9%) | 182 (4.1%) |
| 35 to 44 Years | 3,251 (87.7%) | 454 (12.2%) |
| 45 to 54 Years | 2,827 (86.9%) | 428 (13.2%) |
| 55 to 64 Years | 4,176 (93.1%) | 307 (6.9%) |
| 65 to 74 Years | 2,438 (94.7%) | 136 (5.3%) |
| 75 Years and older | 2,028 (96.1%) | 83 (3.9%) |
| Total | 30,371 (93.6%) | 2,089 (6.4%) |
Health Insurance Coverage by Citizenship Status in Goleta
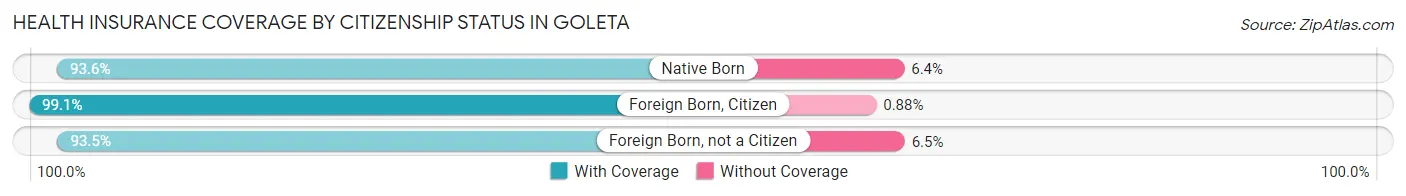
| Citizenship Status | With Coverage | Without Coverage |
| Native Born | 1,918 (93.6%) | 131 (6.4%) |
| Foreign Born, Citizen | 4,732 (99.1%) | 42 (0.9%) |
| Foreign Born, not a Citizen | 4,711 (93.5%) | 326 (6.5%) |
Health Insurance Coverage by Household Income in Goleta
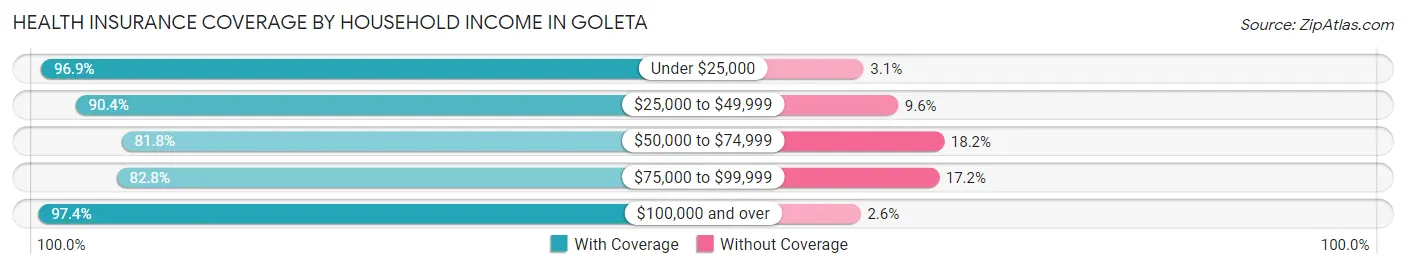
| Household Income | With Coverage | Without Coverage |
| Under $25,000 | 2,028 (96.9%) | 65 (3.1%) |
| $25,000 to $49,999 | 2,101 (90.4%) | 222 (9.6%) |
| $50,000 to $74,999 | 3,265 (81.8%) | 726 (18.2%) |
| $75,000 to $99,999 | 2,594 (82.8%) | 540 (17.2%) |
| $100,000 and over | 20,327 (97.4%) | 533 (2.6%) |
Public vs Private Health Insurance Coverage by Age in Goleta
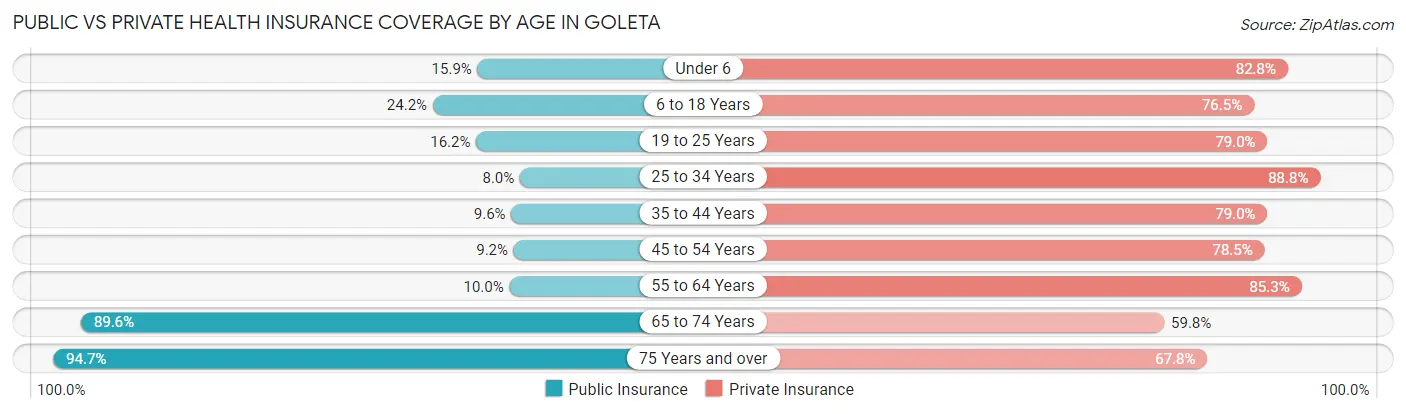
| Age Bracket | Public Insurance | Private Insurance |
| Under 6 | 326 (15.9%) | 1,696 (82.8%) |
| 6 to 18 Years | 1,156 (24.2%) | 3,652 (76.5%) |
| 19 to 25 Years | 814 (16.2%) | 3,979 (79.0%) |
| 25 to 34 Years | 359 (8.0%) | 3,971 (88.8%) |
| 35 to 44 Years | 357 (9.6%) | 2,927 (79.0%) |
| 45 to 54 Years | 299 (9.2%) | 2,554 (78.5%) |
| 55 to 64 Years | 448 (10.0%) | 3,825 (85.3%) |
| 65 to 74 Years | 2,305 (89.5%) | 1,540 (59.8%) |
| 75 Years and over | 1,999 (94.7%) | 1,432 (67.8%) |
| Total | 8,063 (24.8%) | 25,576 (78.8%) |
Disability Status by Sex by Age in Goleta
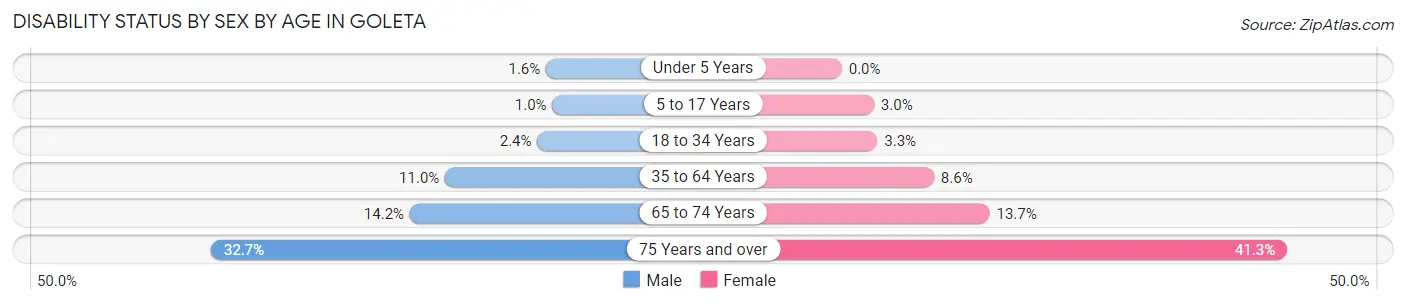
| Age Bracket | Male | Female |
| Under 5 Years | 14 (1.6%) | 0 (0.0%) |
| 5 to 17 Years | 25 (1.0%) | 66 (3.0%) |
| 18 to 34 Years | 133 (2.4%) | 146 (3.3%) |
| 35 to 64 Years | 627 (11.0%) | 490 (8.6%) |
| 65 to 74 Years | 191 (14.2%) | 169 (13.7%) |
| 75 Years and over | 278 (32.7%) | 521 (41.3%) |
Disability Class by Sex by Age in Goleta
Disability Class: Hearing Difficulty
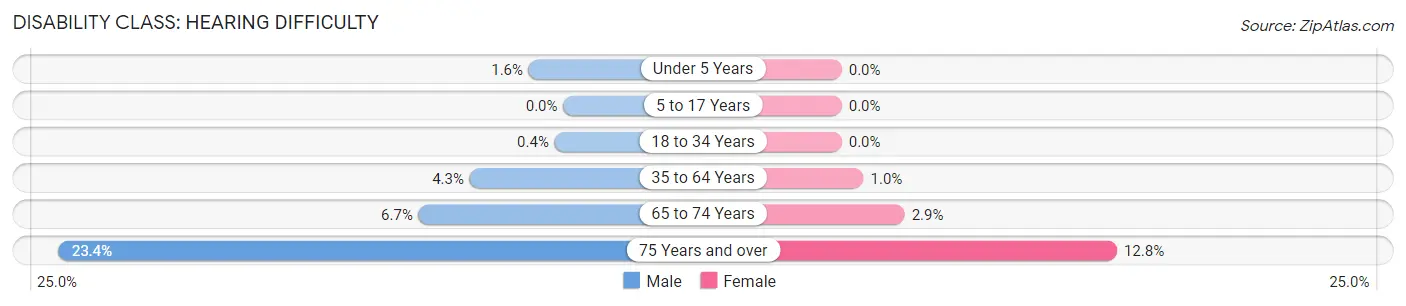
| Age Bracket | Male | Female |
| Under 5 Years | 14 (1.6%) | 0 (0.0%) |
| 5 to 17 Years | 0 (0.0%) | 0 (0.0%) |
| 18 to 34 Years | 22 (0.4%) | 0 (0.0%) |
| 35 to 64 Years | 248 (4.3%) | 58 (1.0%) |
| 65 to 74 Years | 90 (6.7%) | 36 (2.9%) |
| 75 Years and over | 199 (23.4%) | 161 (12.8%) |
Disability Class: Vision Difficulty
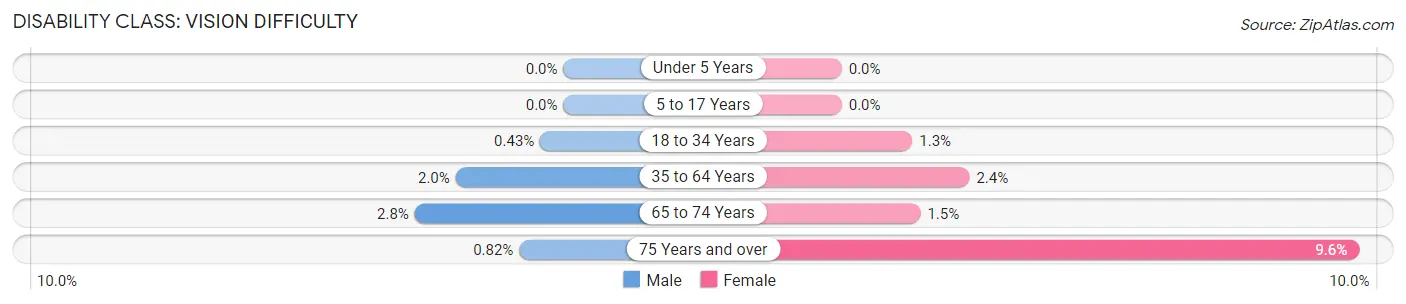
| Age Bracket | Male | Female |
| Under 5 Years | 0 (0.0%) | 0 (0.0%) |
| 5 to 17 Years | 0 (0.0%) | 0 (0.0%) |
| 18 to 34 Years | 24 (0.4%) | 58 (1.3%) |
| 35 to 64 Years | 114 (2.0%) | 136 (2.4%) |
| 65 to 74 Years | 37 (2.8%) | 18 (1.5%) |
| 75 Years and over | 7 (0.8%) | 121 (9.6%) |
Disability Class: Cognitive Difficulty
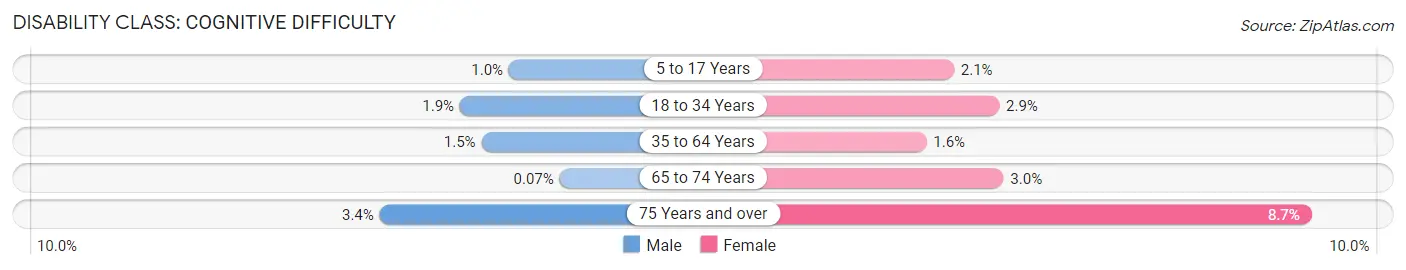
| Age Bracket | Male | Female |
| 5 to 17 Years | 25 (1.0%) | 46 (2.1%) |
| 18 to 34 Years | 106 (1.9%) | 129 (2.9%) |
| 35 to 64 Years | 87 (1.5%) | 90 (1.6%) |
| 65 to 74 Years | 1 (0.1%) | 37 (3.0%) |
| 75 Years and over | 29 (3.4%) | 110 (8.7%) |
Disability Class: Ambulatory Difficulty
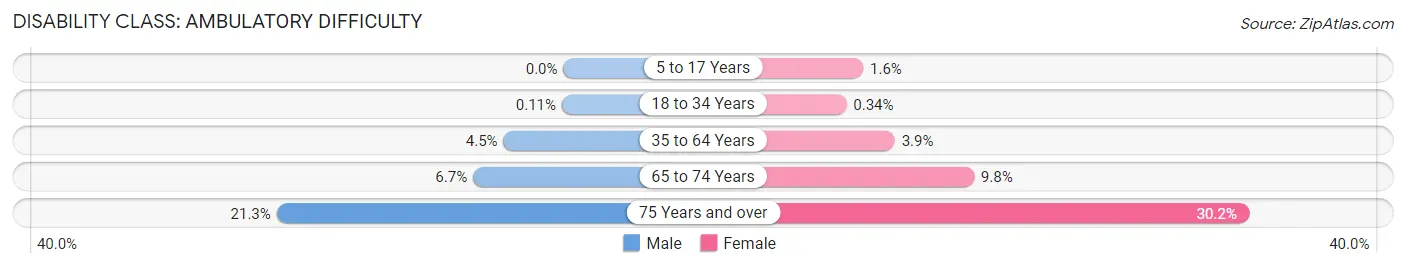
| Age Bracket | Male | Female |
| 5 to 17 Years | 0 (0.0%) | 35 (1.6%) |
| 18 to 34 Years | 6 (0.1%) | 15 (0.3%) |
| 35 to 64 Years | 254 (4.4%) | 225 (3.9%) |
| 65 to 74 Years | 90 (6.7%) | 121 (9.8%) |
| 75 Years and over | 181 (21.3%) | 381 (30.2%) |
Disability Class: Self-Care Difficulty
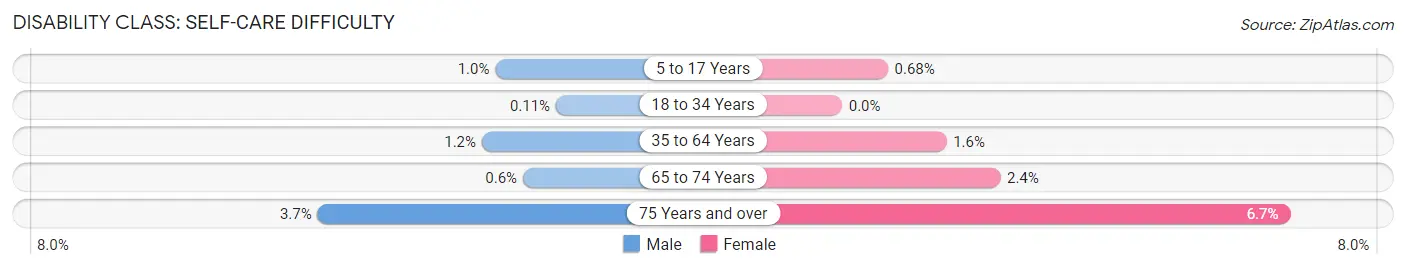
| Age Bracket | Male | Female |
| 5 to 17 Years | 25 (1.0%) | 15 (0.7%) |
| 18 to 34 Years | 6 (0.1%) | 0 (0.0%) |
| 35 to 64 Years | 69 (1.2%) | 89 (1.5%) |
| 65 to 74 Years | 8 (0.6%) | 29 (2.4%) |
| 75 Years and over | 31 (3.6%) | 84 (6.7%) |
Technology Access in Goleta
Computing Device Access in Goleta
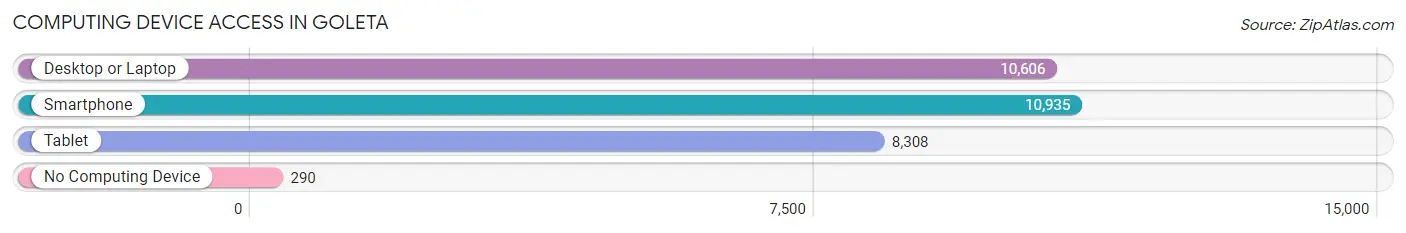
| Device Type | # Households | % Households |
| Desktop or Laptop | 10,606 | 88.8% |
| Smartphone | 10,935 | 91.6% |
| Tablet | 8,308 | 69.6% |
| No Computing Device | 290 | 2.4% |
| Total | 11,938 | 100.0% |
Internet Access in Goleta
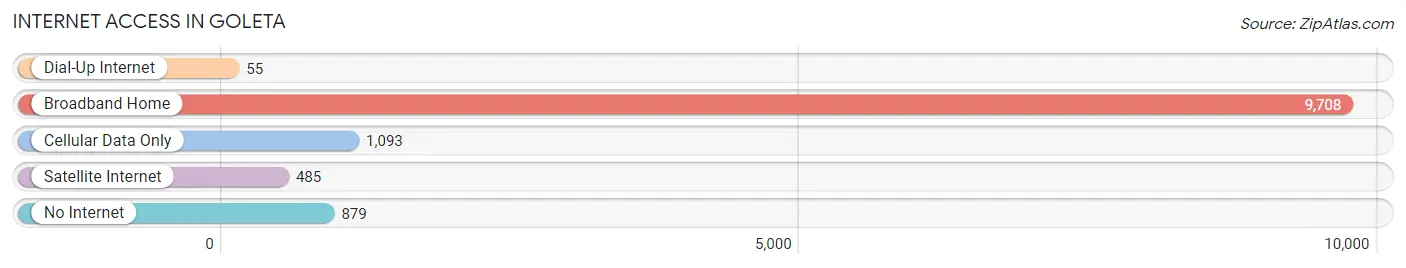
| Internet Type | # Households | % Households |
| Dial-Up Internet | 55 | 0.5% |
| Broadband Home | 9,708 | 81.3% |
| Cellular Data Only | 1,093 | 9.2% |
| Satellite Internet | 485 | 4.1% |
| No Internet | 879 | 7.4% |
| Total | 11,938 | 100.0% |
Goleta Summary
Goleta, California is a city located in Santa Barbara County, California, United States. It is situated on the Pacific coast, about 8 miles (13 km) west of Santa Barbara and 65 miles (105 km) northwest of Los Angeles. The population of Goleta was 30,717 at the 2010 census, up from 28,008 at the 2000 census.
History
The area now known as Goleta was originally inhabited by the Chumash people, who settled in the area around 10,000 years ago. The first European to explore the area was Spanish explorer Juan Rodríguez Cabrillo, who sailed along the coast in 1542. The area was later explored by the Spanish missionaries, who established the Mission Santa Barbara in 1786.
In 1839, the area was granted to the Mexican government, and in 1848, it became part of the United States after the Mexican-American War. The area was then divided into large land grants, and in 1853, the area now known as Goleta was granted to the Dibblee family.
In the late 19th century, the area was developed as a resort town, and in 1887, the Goleta Land and Improvement Company was formed to develop the area. The company built a railroad line, a hotel, and a pier, and the area became known as Goleta Beach.
In the early 20th century, the area was developed as an agricultural center, and in the 1950s, the area began to experience rapid growth as a suburb of Santa Barbara. In 2002, the city of Goleta was incorporated.
Geography
Goleta is located in Santa Barbara County, California, at 34°24'N 119°48'W. It is situated on the Pacific coast, about 8 miles (13 km) west of Santa Barbara and 65 miles (105 km) northwest of Los Angeles.
The city covers an area of 10.7 square miles (27.7 km2), of which 10.5 square miles (27.2 km2) is land and 0.2 square miles (0.5 km2) is water. The city is bordered by the Pacific Ocean to the west, the Santa Ynez Mountains to the east, and the Santa Barbara Channel to the south.
Economy
Goleta is home to a variety of businesses and industries, including technology, manufacturing, and tourism. The city is home to several major employers, including Raytheon, Deckers Outdoor Corporation, and Citrix Systems.
The city is also home to the University of California, Santa Barbara, which is one of the largest employers in the city. The university is a major contributor to the local economy, providing jobs and generating revenue through research and development.
Demographics
As of the 2010 census, there were 30,717 people, 11,845 households, and 6,945 families residing in the city. The population density was 2,919.3 people per square mile (1,127.2/km2). There were 12,541 housing units at an average density of 1,190.2 per square mile (459.7/km2).
The racial makeup of the city was 74.2% White, 2.2% African American, 0.7% Native American, 11.3% Asian, 0.2% Pacific Islander, 8.2% from other races, and 3.2% from two or more races. Hispanic or Latino of any race were 19.3% of the population.
The median income for a household in the city was $60,845, and the median income for a family was $76,945. Males had a median income of $50,845 versus $41,945 for females. The per capita income for the city was $30,945. About 5.2% of families and 8.3% of the population were below the poverty line, including 9.2% of those under age 18 and 5.2% of those age 65 or over.
Common Questions
What is Per Capita Income in Goleta?
Per Capita income in Goleta is $49,259.
What is the Median Family Income in Goleta?
Median Family Income in Goleta is $133,427.
What is the Median Household income in Goleta?
Median Household Income in Goleta is $113,889.
What is Income or Wage Gap in Goleta?
Income or Wage Gap in Goleta is 24.6%.
Women in Goleta earn 75.4 cents for every dollar earned by a man.
What is Inequality or Gini Index in Goleta?
Inequality or Gini Index in Goleta is 0.41.
What is the Total Population of Goleta?
Total Population of Goleta is 32,640.
What is the Total Male Population of Goleta?
Total Male Population of Goleta is 16,879.
What is the Total Female Population of Goleta?
Total Female Population of Goleta is 15,761.
What is the Ratio of Males per 100 Females in Goleta?
There are 107.09 Males per 100 Females in Goleta.
What is the Ratio of Females per 100 Males in Goleta?
There are 93.38 Females per 100 Males in Goleta.
What is the Median Population Age in Goleta?
Median Population Age in Goleta is 35.0 Years.
What is the Average Family Size in Goleta
Average Family Size in Goleta is 3.3 People.
What is the Average Household Size in Goleta
Average Household Size in Goleta is 2.7 People.
How Large is the Labor Force in Goleta?
There are 18,445 People in the Labor Forcein in Goleta.
What is the Percentage of People in the Labor Force in Goleta?
68.4% of People are in the Labor Force in Goleta.
What is the Unemployment Rate in Goleta?
Unemployment Rate in Goleta is 4.0%.