Georgetown, CA Map & Demographics
Georgetown Map
Georgetown Overview
$46,337
PER CAPITA INCOME
$115,563
AVG FAMILY INCOME
$88,596
AVG HOUSEHOLD INCOME
29.6%
WAGE / INCOME GAP [ % ]
70.4¢/ $1
WAGE / INCOME GAP [ $ ]
0.42
INEQUALITY / GINI INDEX
2,546
TOTAL POPULATION
1,289
MALE POPULATION
1,257
FEMALE POPULATION
102.55
MALES / 100 FEMALES
97.52
FEMALES / 100 MALES
61.5
MEDIAN AGE
2.8
AVG FAMILY SIZE
2.1
AVG HOUSEHOLD SIZE
840
LABOR FORCE [ PEOPLE ]
37.7%
PERCENT IN LABOR FORCE
18.1%
UNEMPLOYMENT RATE
Georgetown Zip Codes
Georgetown Area Codes
Income in Georgetown
Income Overview in Georgetown
Per Capita Income in Georgetown is $46,337, while median incomes of families and households are $115,563 and $88,596 respectively.
| Characteristic | Number | Measure |
| Per Capita Income | 2,546 | $46,337 |
| Median Family Income | 631 | $115,563 |
| Mean Family Income | 631 | $126,945 |
| Median Household Income | 1,169 | $88,596 |
| Mean Household Income | 1,169 | $98,652 |
| Income Deficit | 631 | $0 |
| Wage / Income Gap (%) | 2,546 | 29.63% |
| Wage / Income Gap ($) | 2,546 | 70.37¢ per $1 |
| Gini / Inequality Index | 2,546 | 0.42 |
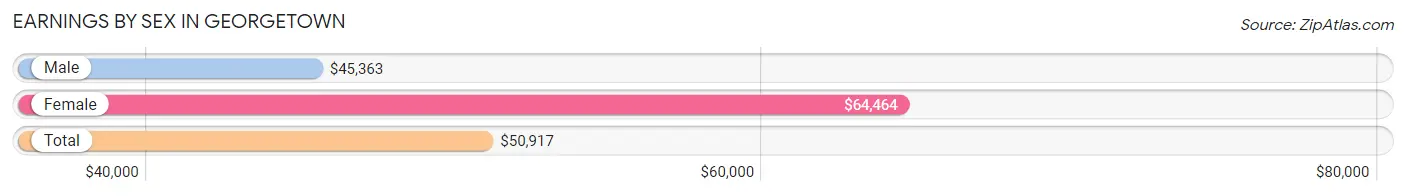
Earnings by Sex in Georgetown
Average Earnings in Georgetown are $50,917, $45,363 for men and $64,464 for women, a difference of 29.6%.
| Sex | Number | Average Earnings |
| Male | 371 (45.6%) | $45,363 |
| Female | 443 (54.4%) | $64,464 |
| Total | 814 (100.0%) | $50,917 |
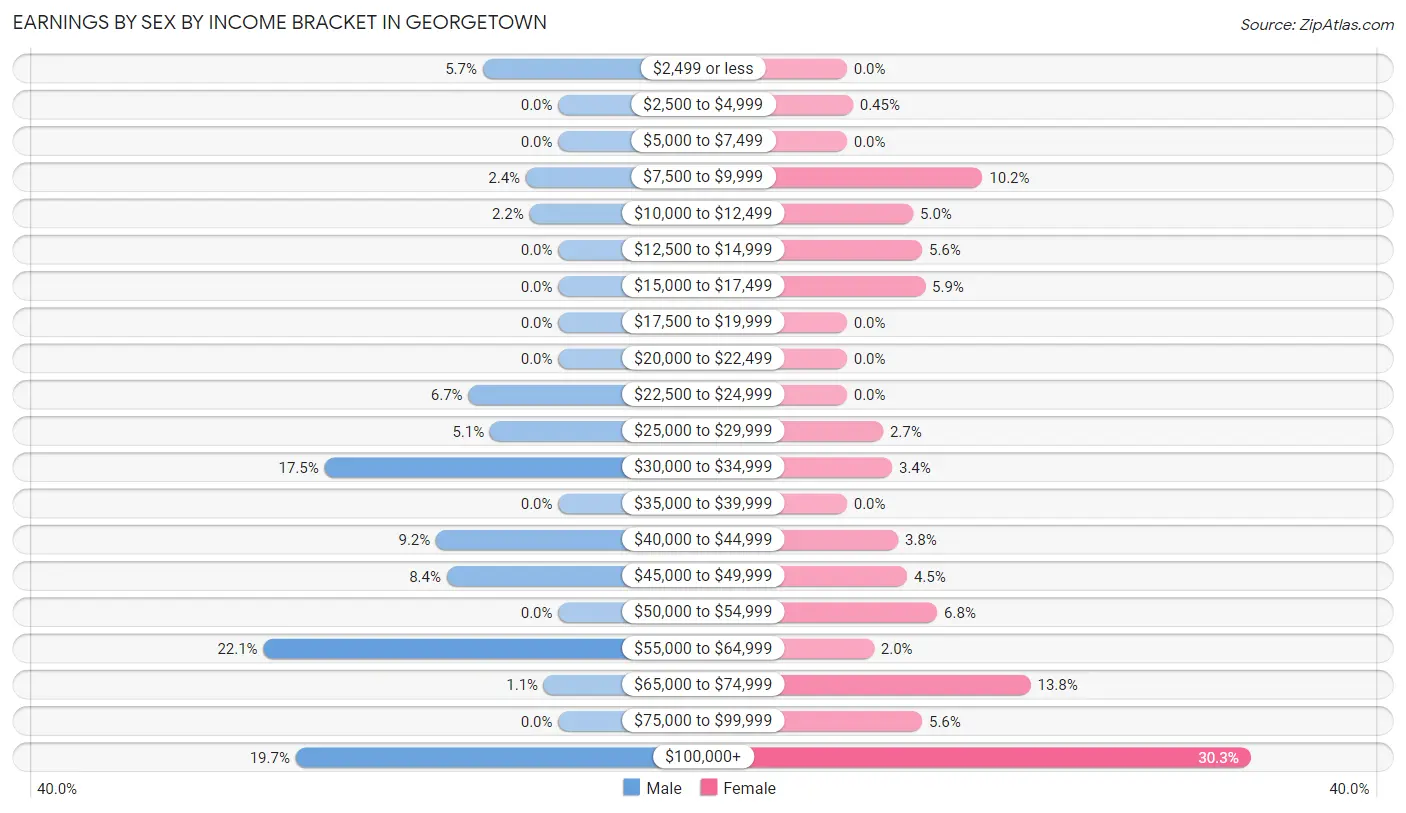
Earnings by Sex by Income Bracket in Georgetown
The most common earnings brackets in Georgetown are $55,000 to $64,999 for men (82 | 22.1%) and $100,000+ for women (134 | 30.2%).
| Income | Male | Female |
| $2,499 or less | 21 (5.7%) | 0 (0.0%) |
| $2,500 to $4,999 | 0 (0.0%) | 2 (0.4%) |
| $5,000 to $7,499 | 0 (0.0%) | 0 (0.0%) |
| $7,500 to $9,999 | 9 (2.4%) | 45 (10.2%) |
| $10,000 to $12,499 | 8 (2.2%) | 22 (5.0%) |
| $12,500 to $14,999 | 0 (0.0%) | 25 (5.6%) |
| $15,000 to $17,499 | 0 (0.0%) | 26 (5.9%) |
| $17,500 to $19,999 | 0 (0.0%) | 0 (0.0%) |
| $20,000 to $22,499 | 0 (0.0%) | 0 (0.0%) |
| $22,500 to $24,999 | 25 (6.7%) | 0 (0.0%) |
| $25,000 to $29,999 | 19 (5.1%) | 12 (2.7%) |
| $30,000 to $34,999 | 65 (17.5%) | 15 (3.4%) |
| $35,000 to $39,999 | 0 (0.0%) | 0 (0.0%) |
| $40,000 to $44,999 | 34 (9.2%) | 17 (3.8%) |
| $45,000 to $49,999 | 31 (8.4%) | 20 (4.5%) |
| $50,000 to $54,999 | 0 (0.0%) | 30 (6.8%) |
| $55,000 to $64,999 | 82 (22.1%) | 9 (2.0%) |
| $65,000 to $74,999 | 4 (1.1%) | 61 (13.8%) |
| $75,000 to $99,999 | 0 (0.0%) | 25 (5.6%) |
| $100,000+ | 73 (19.7%) | 134 (30.2%) |
| Total | 371 (100.0%) | 443 (100.0%) |
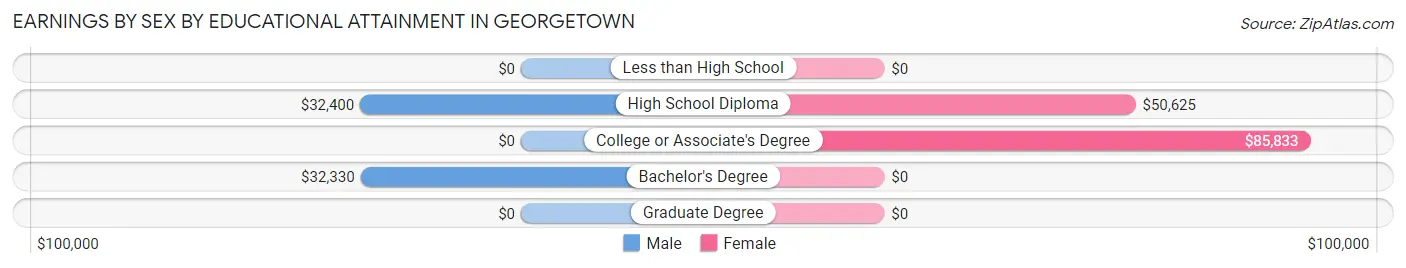
Earnings by Sex by Educational Attainment in Georgetown
Average earnings in Georgetown are $41,213 for men and $67,097 for women, a difference of 38.6%. Men with an educational attainment of high school diploma enjoy the highest average annual earnings of $32,400, while those with bachelor's degree education earn the least with $32,330. Women with an educational attainment of college or associate's degree earn the most with the average annual earnings of $85,833, while those with high school diploma education have the smallest earnings of $50,625.
| Educational Attainment | Male Income | Female Income |
| Less than High School | - | - |
| High School Diploma | $32,400 | $50,625 |
| College or Associate's Degree | - | - |
| Bachelor's Degree | $32,330 | $0 |
| Graduate Degree | - | - |
| Total | $41,213 | $67,097 |
Family Income in Georgetown
Family Income Brackets in Georgetown
According to the Georgetown family income data, there are 220 families falling into the $100,000 to $149,999 income range, which is the most common income bracket and makes up 34.9% of all families.
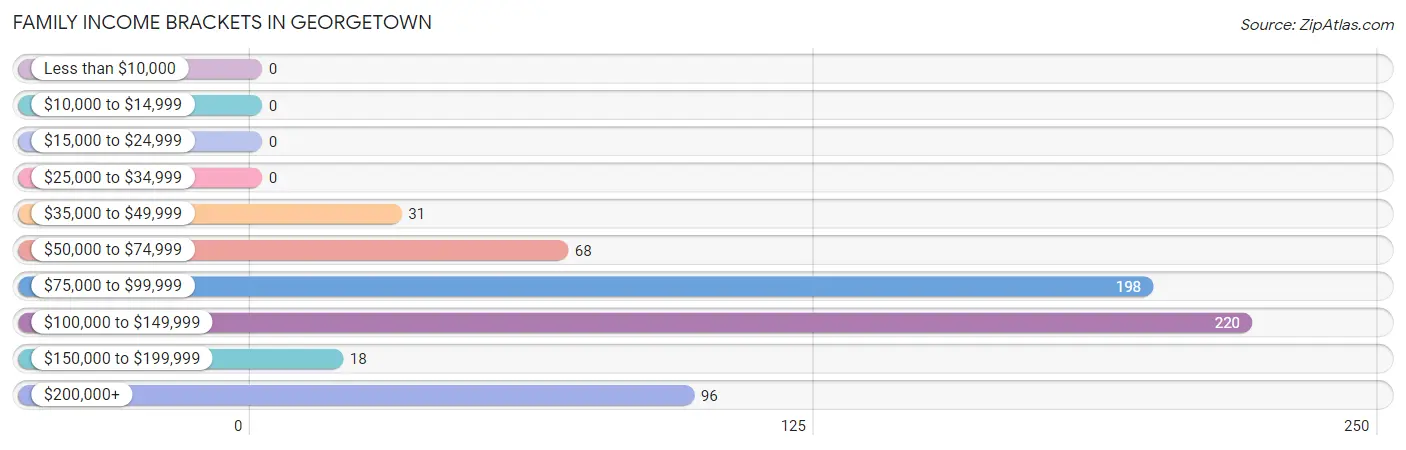
| Income Bracket | # Families | % Families |
| Less than $10,000 | 0 | 0.0% |
| $10,000 to $14,999 | 0 | 0.0% |
| $15,000 to $24,999 | 0 | 0.0% |
| $25,000 to $34,999 | 0 | 0.0% |
| $35,000 to $49,999 | 31 | 4.9% |
| $50,000 to $74,999 | 68 | 10.8% |
| $75,000 to $99,999 | 198 | 31.4% |
| $100,000 to $149,999 | 220 | 34.9% |
| $150,000 to $199,999 | 18 | 2.9% |
| $200,000+ | 96 | 15.2% |
Family Income by Famaliy Size in Georgetown
5-person families (30 | 4.8%) account for the highest median family income in Georgetown with $236,667 per family, while 5-person families (30 | 4.8%) have the highest median income of $47,333 per family member.
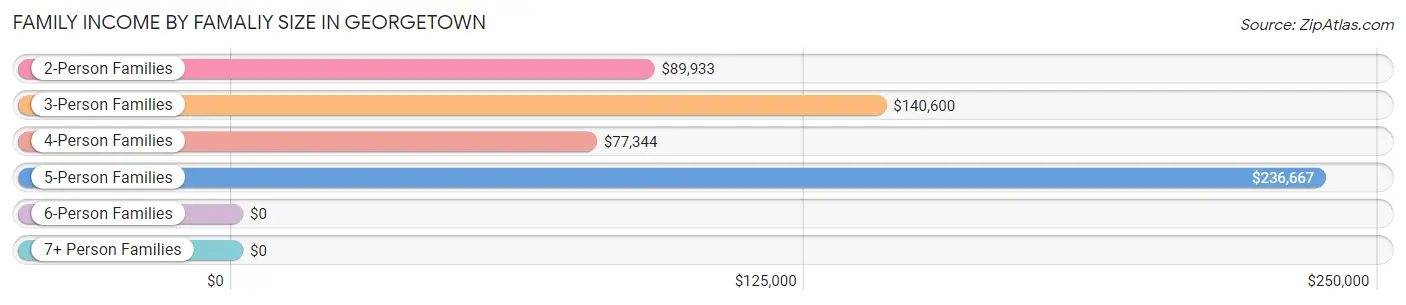
| Income Bracket | # Families | Median Income |
| 2-Person Families | 448 (71.0%) | $89,933 |
| 3-Person Families | 90 (14.3%) | $140,600 |
| 4-Person Families | 15 (2.4%) | $77,344 |
| 5-Person Families | 30 (4.8%) | $236,667 |
| 6-Person Families | 30 (4.8%) | $0 |
| 7+ Person Families | 18 (2.9%) | $0 |
| Total | 631 (100.0%) | $115,563 |
Family Income by Number of Earners in Georgetown
The median family income in Georgetown is $115,563, with families comprising 3+ earners (71) having the highest median family income of $202,740, while families with no earners (306) have the lowest median family income of $88,833, accounting for 11.3% and 48.5% of families, respectively.
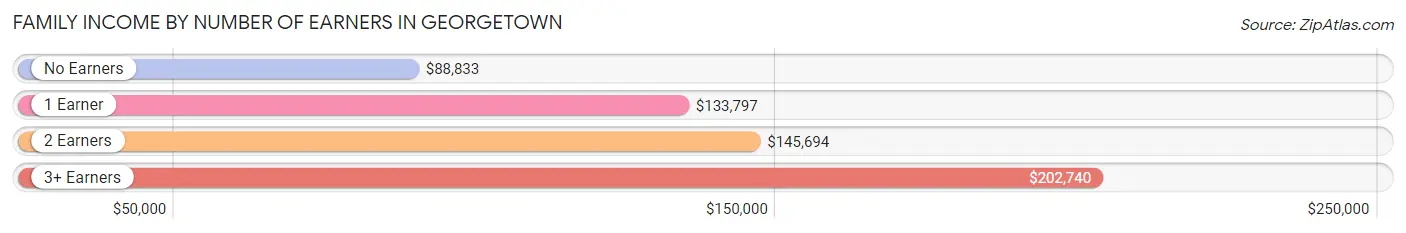
| Number of Earners | # Families | Median Income |
| No Earners | 306 (48.5%) | $88,833 |
| 1 Earner | 130 (20.6%) | $133,797 |
| 2 Earners | 124 (19.7%) | $145,694 |
| 3+ Earners | 71 (11.3%) | $202,740 |
| Total | 631 (100.0%) | $115,563 |
Household Income in Georgetown
Household Income Brackets in Georgetown
With 358 households falling in the category, the $100,000 to $149,999 income range is the most frequent in Georgetown, accounting for 30.6% of all households.
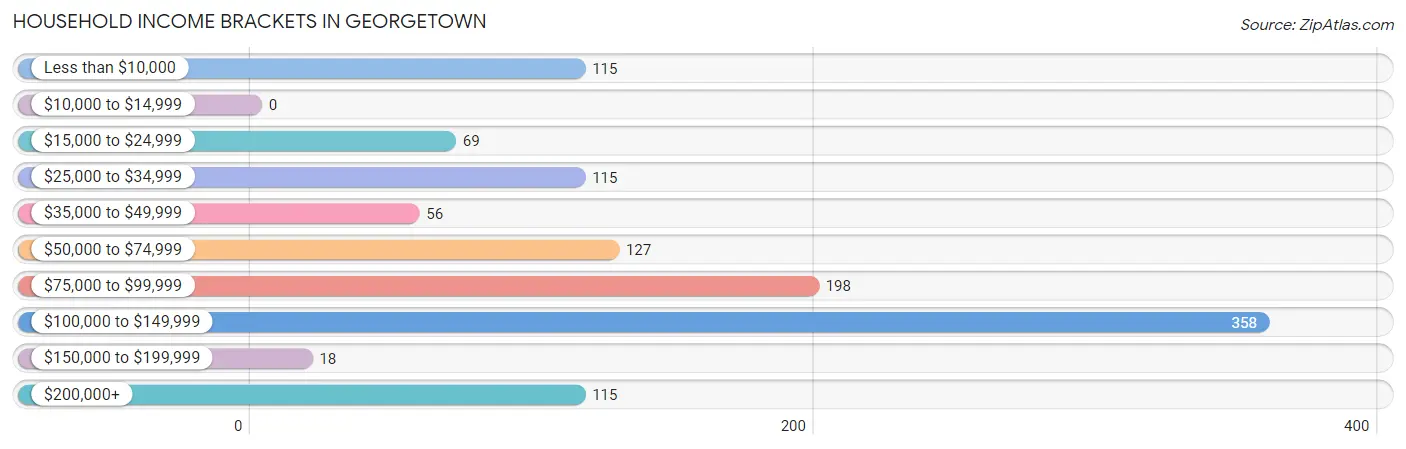
| Income Bracket | # Households | % Households |
| Less than $10,000 | 115 | 9.8% |
| $10,000 to $14,999 | 0 | 0.0% |
| $15,000 to $24,999 | 69 | 5.9% |
| $25,000 to $34,999 | 115 | 9.8% |
| $35,000 to $49,999 | 56 | 4.8% |
| $50,000 to $74,999 | 127 | 10.9% |
| $75,000 to $99,999 | 198 | 16.9% |
| $100,000 to $149,999 | 358 | 30.6% |
| $150,000 to $199,999 | 18 | 1.5% |
| $200,000+ | 115 | 9.8% |
Household Income by Householder Age in Georgetown
The median household income in Georgetown is $88,596, with the highest median household income of $134,826 found in the 45 to 64 years age bracket for the primary householder. A total of 285 households (24.4%) fall into this category.
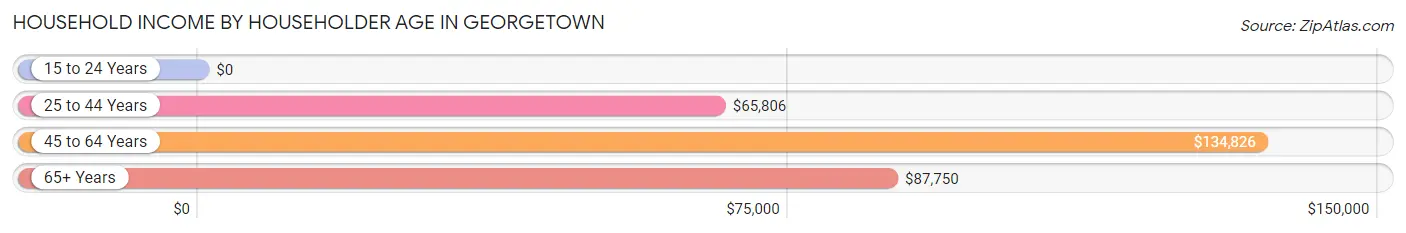
| Income Bracket | # Households | Median Income |
| 15 to 24 Years | 0 (0.0%) | $0 |
| 25 to 44 Years | 180 (15.4%) | $65,806 |
| 45 to 64 Years | 285 (24.4%) | $134,826 |
| 65+ Years | 704 (60.2%) | $87,750 |
| Total | 1,169 (100.0%) | $88,596 |
Poverty in Georgetown
Income Below Poverty by Sex and Age in Georgetown
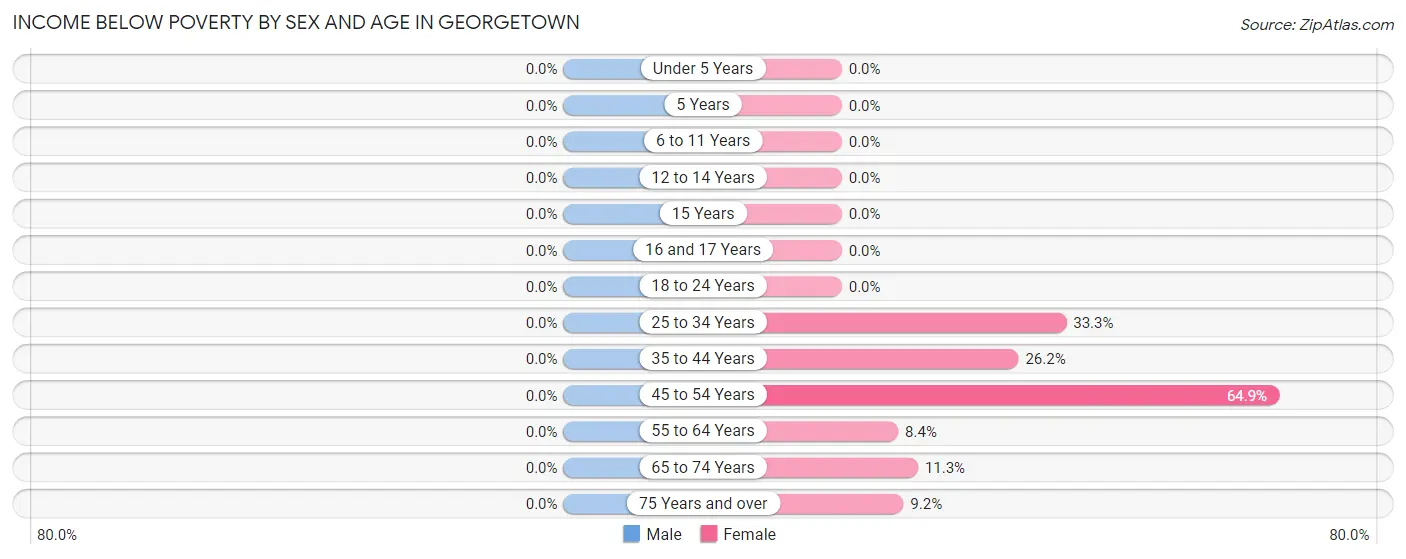
| Age Bracket | Male | Female |
| Under 5 Years | 0 (0.0%) | 0 (0.0%) |
| 5 Years | 0 (0.0%) | 0 (0.0%) |
| 6 to 11 Years | 0 (0.0%) | 0 (0.0%) |
| 12 to 14 Years | 0 (0.0%) | 0 (0.0%) |
| 15 Years | 0 (0.0%) | 0 (0.0%) |
| 16 and 17 Years | 0 (0.0%) | 0 (0.0%) |
| 18 to 24 Years | 0 (0.0%) | 0 (0.0%) |
| 25 to 34 Years | 0 (0.0%) | 9 (33.3%) |
| 35 to 44 Years | 0 (0.0%) | 53 (26.2%) |
| 45 to 54 Years | 0 (0.0%) | 74 (64.9%) |
| 55 to 64 Years | 0 (0.0%) | 20 (8.4%) |
| 65 to 74 Years | 0 (0.0%) | 31 (11.3%) |
| 75 Years and over | 0 (0.0%) | 15 (9.1%) |
| Total | 0 (0.0%) | 202 (16.1%) |
Income Above Poverty by Sex and Age in Georgetown
According to the poverty statistics in Georgetown, males aged under 5 years and females aged under 5 years are the age groups that are most secure financially, with 100.0% of males and 100.0% of females in these age groups living above the poverty line.
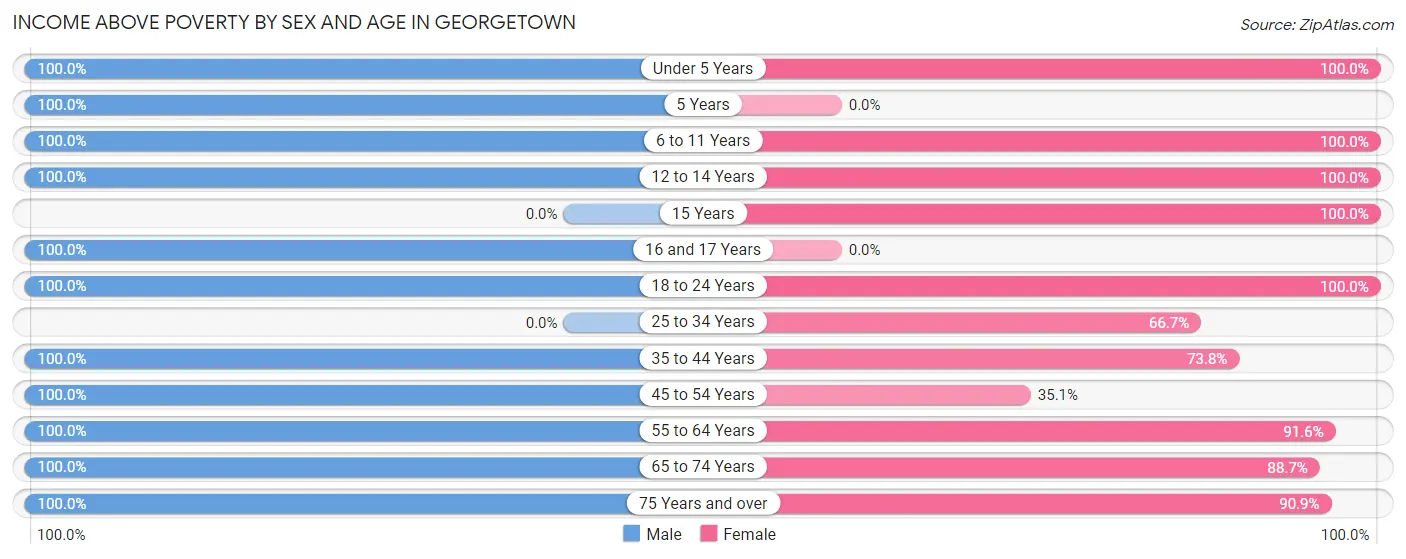
| Age Bracket | Male | Female |
| Under 5 Years | 63 (100.0%) | 37 (100.0%) |
| 5 Years | 31 (100.0%) | 0 (0.0%) |
| 6 to 11 Years | 41 (100.0%) | 64 (100.0%) |
| 12 to 14 Years | 8 (100.0%) | 4 (100.0%) |
| 15 Years | 0 (0.0%) | 50 (100.0%) |
| 16 and 17 Years | 31 (100.0%) | 0 (0.0%) |
| 18 to 24 Years | 133 (100.0%) | 82 (100.0%) |
| 25 to 34 Years | 0 (0.0%) | 18 (66.7%) |
| 35 to 44 Years | 98 (100.0%) | 149 (73.8%) |
| 45 to 54 Years | 38 (100.0%) | 40 (35.1%) |
| 55 to 64 Years | 165 (100.0%) | 219 (91.6%) |
| 65 to 74 Years | 219 (100.0%) | 243 (88.7%) |
| 75 Years and over | 354 (100.0%) | 149 (90.8%) |
| Total | 1,181 (100.0%) | 1,055 (83.9%) |
Income Below Poverty Among Married-Couple Families in Georgetown
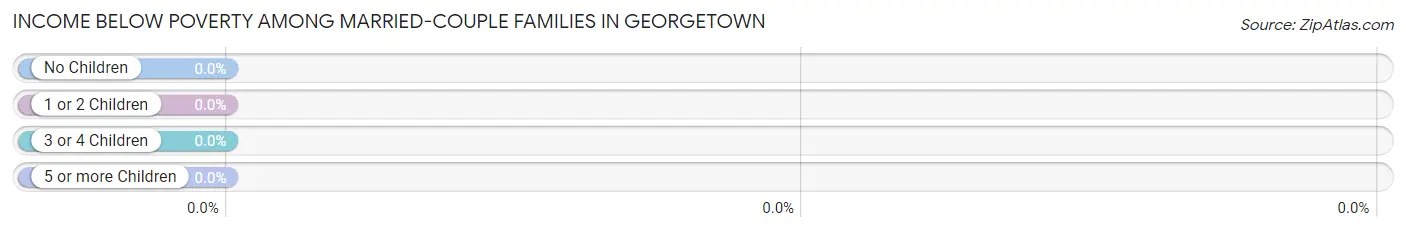
| Children | Above Poverty | Below Poverty |
| No Children | 484 (100.0%) | 0 (0.0%) |
| 1 or 2 Children | 53 (100.0%) | 0 (0.0%) |
| 3 or 4 Children | 11 (100.0%) | 0 (0.0%) |
| 5 or more Children | 18 (100.0%) | 0 (0.0%) |
| Total | 566 (100.0%) | 0 (0.0%) |
Income Below Poverty Among Single-Parent Households in Georgetown
| Children | Single Father | Single Mother |
| No Children | 0 (0.0%) | 0 (0.0%) |
| 1 or 2 Children | 0 (0.0%) | 0 (0.0%) |
| 3 or 4 Children | 0 (0.0%) | 0 (0.0%) |
| 5 or more Children | 0 (0.0%) | 0 (0.0%) |
| Total | 0 (0.0%) | 0 (0.0%) |
Income Below Poverty Among Married-Couple vs Single-Parent Households in Georgetown
| Children | Married-Couple Families | Single-Parent Households |
| No Children | 0 (0.0%) | 0 (0.0%) |
| 1 or 2 Children | 0 (0.0%) | 0 (0.0%) |
| 3 or 4 Children | 0 (0.0%) | 0 (0.0%) |
| 5 or more Children | 0 (0.0%) | 0 (0.0%) |
| Total | 0 (0.0%) | 0 (0.0%) |
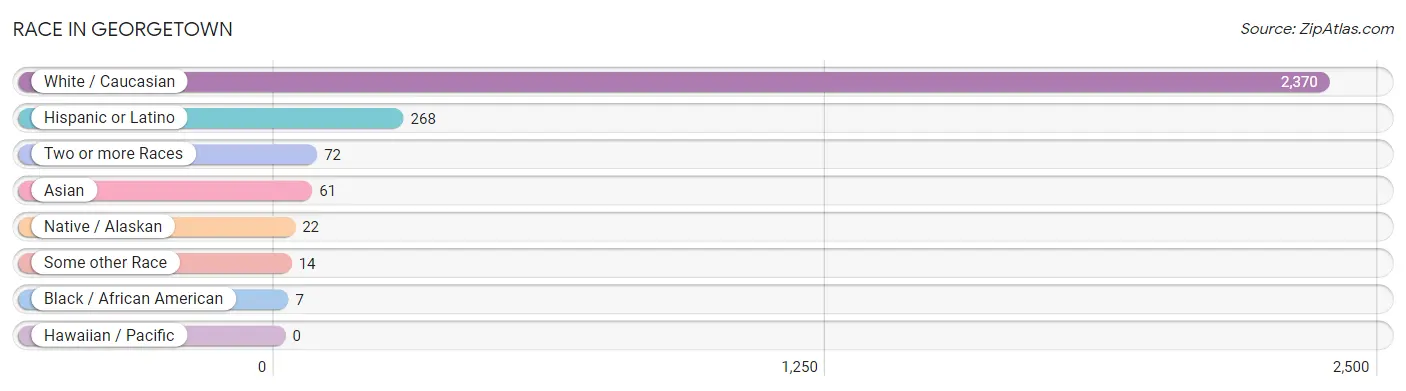
Race in Georgetown
The most populous races in Georgetown are White / Caucasian (2,370 | 93.1%), Hispanic or Latino (268 | 10.5%), and Two or more Races (72 | 2.8%).
| Race | # Population | % Population |
| Asian | 61 | 2.4% |
| Black / African American | 7 | 0.3% |
| Hawaiian / Pacific | 0 | 0.0% |
| Hispanic or Latino | 268 | 10.5% |
| Native / Alaskan | 22 | 0.9% |
| White / Caucasian | 2,370 | 93.1% |
| Two or more Races | 72 | 2.8% |
| Some other Race | 14 | 0.5% |
| Total | 2,546 | 100.0% |
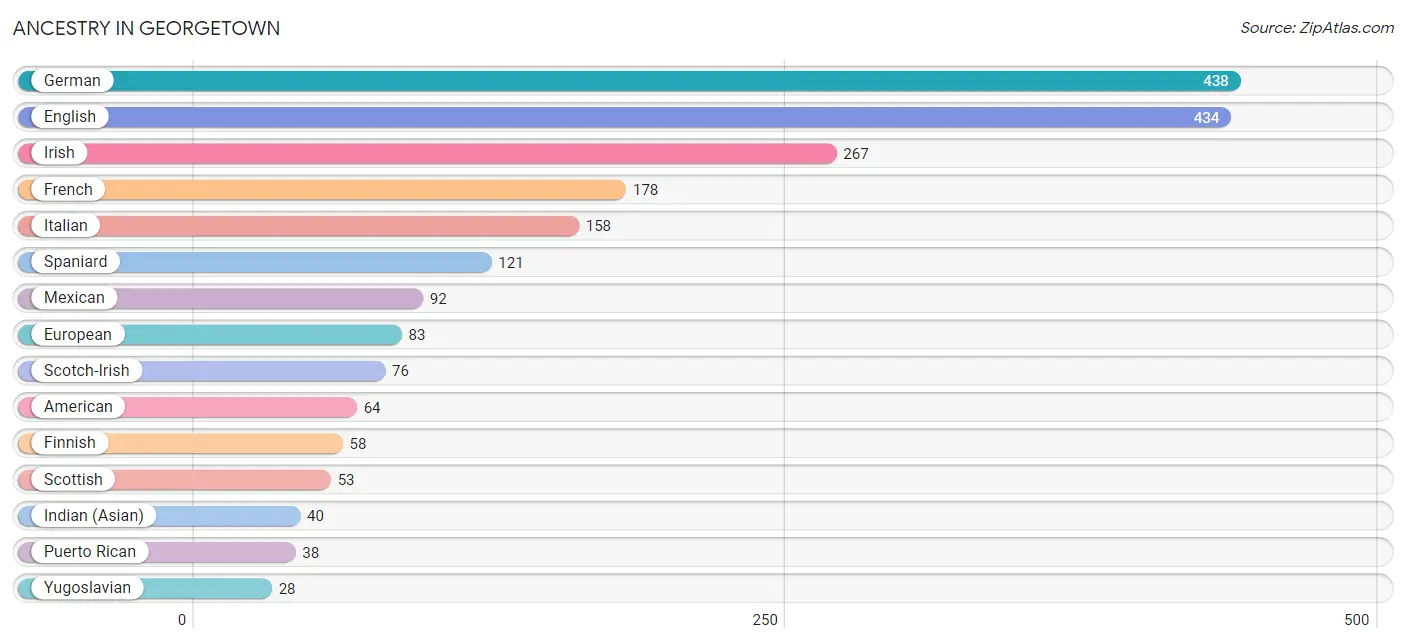
Ancestry in Georgetown
The most populous ancestries reported in Georgetown are German (438 | 17.2%), English (434 | 17.1%), Irish (267 | 10.5%), French (178 | 7.0%), and Italian (158 | 6.2%), together accounting for 57.9% of all Georgetown residents.
| Ancestry | # Population | % Population |
| Afghan | 9 | 0.4% |
| American | 64 | 2.5% |
| Austrian | 11 | 0.4% |
| Central American | 11 | 0.4% |
| Cherokee | 15 | 0.6% |
| Choctaw | 7 | 0.3% |
| Danish | 7 | 0.3% |
| English | 434 | 17.1% |
| European | 83 | 3.3% |
| Finnish | 58 | 2.3% |
| French | 178 | 7.0% |
| French Canadian | 2 | 0.1% |
| German | 438 | 17.2% |
| Indian (Asian) | 40 | 1.6% |
| Irish | 267 | 10.5% |
| Israeli | 2 | 0.1% |
| Italian | 158 | 6.2% |
| Korean | 16 | 0.6% |
| Mexican | 92 | 3.6% |
| Native Hawaiian | 2 | 0.1% |
| Norwegian | 1 | 0.0% |
| Panamanian | 11 | 0.4% |
| Portuguese | 2 | 0.1% |
| Puerto Rican | 38 | 1.5% |
| Russian | 11 | 0.4% |
| Scandinavian | 11 | 0.4% |
| Scotch-Irish | 76 | 3.0% |
| Scottish | 53 | 2.1% |
| Spaniard | 121 | 4.8% |
| Swedish | 26 | 1.0% |
| Yaqui | 7 | 0.3% |
| Yugoslavian | 28 | 1.1% | View All 32 Rows |
Immigrants in Georgetown
The most numerous immigrant groups reported in Georgetown came from Asia (54 | 2.1%), Europe (34 | 1.3%), China (32 | 1.3%), Eastern Asia (32 | 1.3%), and Western Europe (29 | 1.1%), together accounting for 7.1% of all Georgetown residents.
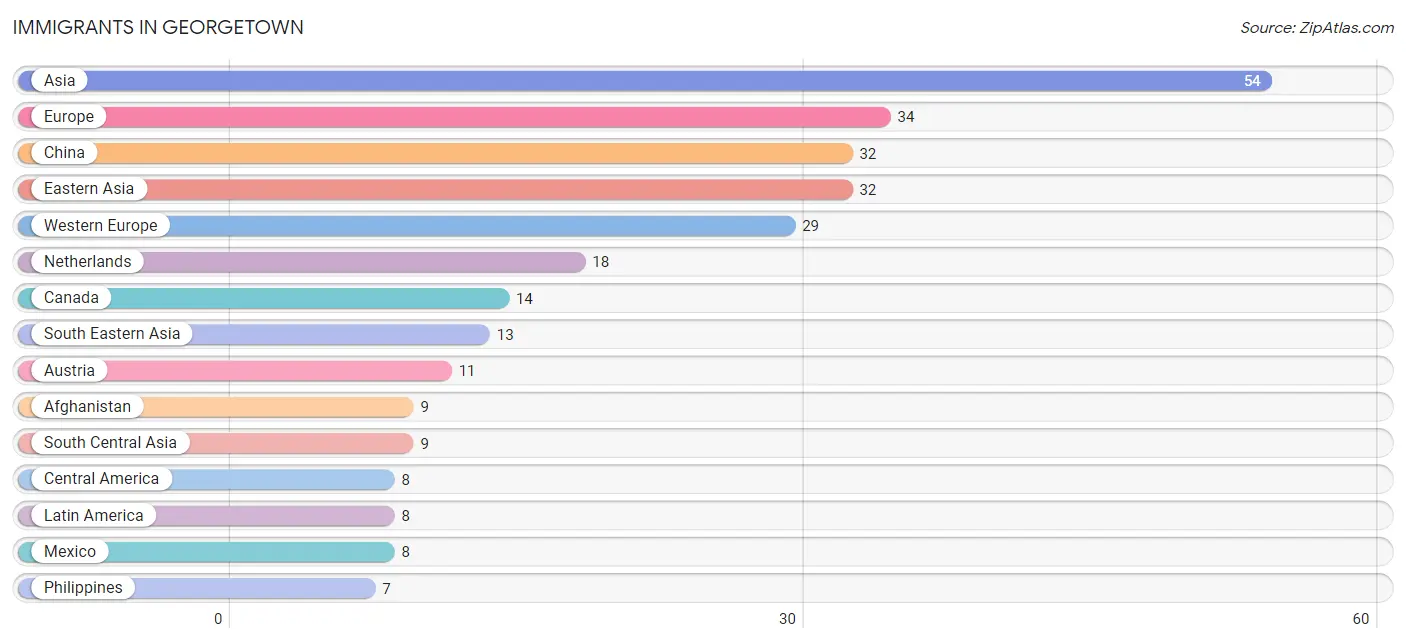
| Immigration Origin | # Population | % Population |
| Afghanistan | 9 | 0.4% |
| Asia | 54 | 2.1% |
| Austria | 11 | 0.4% |
| Canada | 14 | 0.5% |
| Central America | 8 | 0.3% |
| China | 32 | 1.3% |
| Eastern Asia | 32 | 1.3% |
| Europe | 34 | 1.3% |
| Indonesia | 6 | 0.2% |
| Ireland | 5 | 0.2% |
| Latin America | 8 | 0.3% |
| Mexico | 8 | 0.3% |
| Netherlands | 18 | 0.7% |
| Northern Europe | 5 | 0.2% |
| Philippines | 7 | 0.3% |
| South Central Asia | 9 | 0.4% |
| South Eastern Asia | 13 | 0.5% |
| Western Europe | 29 | 1.1% | View All 18 Rows |
Sex and Age in Georgetown
Sex and Age in Georgetown
The most populous age groups in Georgetown are 75 to 79 Years (159 | 12.3%) for men and 70 to 74 Years (184 | 14.6%) for women.
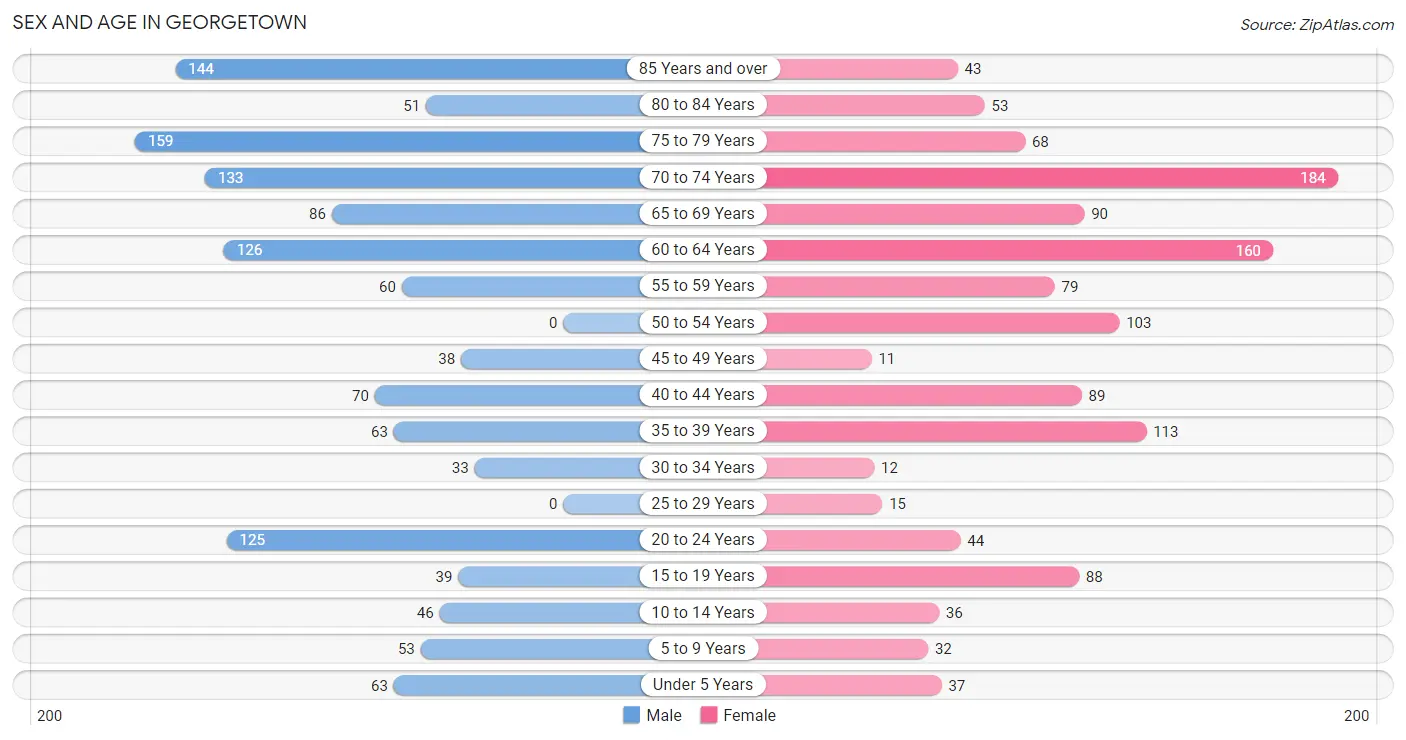
| Age Bracket | Male | Female |
| Under 5 Years | 63 (4.9%) | 37 (2.9%) |
| 5 to 9 Years | 53 (4.1%) | 32 (2.5%) |
| 10 to 14 Years | 46 (3.6%) | 36 (2.9%) |
| 15 to 19 Years | 39 (3.0%) | 88 (7.0%) |
| 20 to 24 Years | 125 (9.7%) | 44 (3.5%) |
| 25 to 29 Years | 0 (0.0%) | 15 (1.2%) |
| 30 to 34 Years | 33 (2.6%) | 12 (0.9%) |
| 35 to 39 Years | 63 (4.9%) | 113 (9.0%) |
| 40 to 44 Years | 70 (5.4%) | 89 (7.1%) |
| 45 to 49 Years | 38 (2.9%) | 11 (0.9%) |
| 50 to 54 Years | 0 (0.0%) | 103 (8.2%) |
| 55 to 59 Years | 60 (4.6%) | 79 (6.3%) |
| 60 to 64 Years | 126 (9.8%) | 160 (12.7%) |
| 65 to 69 Years | 86 (6.7%) | 90 (7.2%) |
| 70 to 74 Years | 133 (10.3%) | 184 (14.6%) |
| 75 to 79 Years | 159 (12.3%) | 68 (5.4%) |
| 80 to 84 Years | 51 (4.0%) | 53 (4.2%) |
| 85 Years and over | 144 (11.2%) | 43 (3.4%) |
| Total | 1,289 (100.0%) | 1,257 (100.0%) |
Families and Households in Georgetown
Median Family Size in Georgetown
The median family size in Georgetown is 2.83 persons per family, with single female/mother families (38 | 6.0%) accounting for the largest median family size of 5.53 persons per family. On the other hand, single male/father families (27 | 4.3%) represent the smallest median family size with 1.85 persons per family.
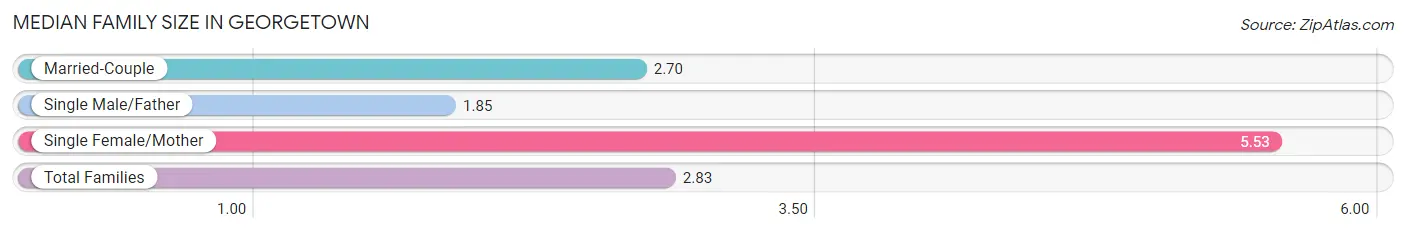
| Family Type | # Families | Family Size |
| Married-Couple | 566 (89.7%) | 2.70 |
| Single Male/Father | 27 (4.3%) | 1.85 |
| Single Female/Mother | 38 (6.0%) | 5.53 |
| Total Families | 631 (100.0%) | 2.83 |
Median Household Size in Georgetown
The median household size in Georgetown is 2.07 persons per household, with single female/mother households (38 | 3.3%) accounting for the largest median household size of 5.53 persons per household. non-family households (538 | 46.0%) represent the smallest median household size with 1.04 persons per household.
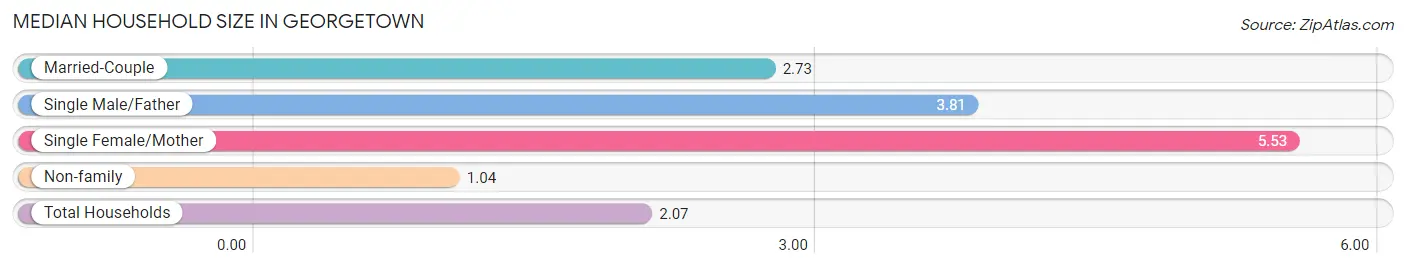
| Household Type | # Households | Household Size |
| Married-Couple | 566 (48.4%) | 2.73 |
| Single Male/Father | 27 (2.3%) | 3.81 |
| Single Female/Mother | 38 (3.3%) | 5.53 |
| Non-family | 538 (46.0%) | 1.04 |
| Total Households | 1,169 (100.0%) | 2.07 |
Household Size by Marriage Status in Georgetown
Out of a total of 1,169 households in Georgetown, 631 (54.0%) are family households, while 538 (46.0%) are nonfamily households. The most numerous type of family households are 2-person households, comprising 436, and the most common type of nonfamily households are 1-person households, comprising 520.
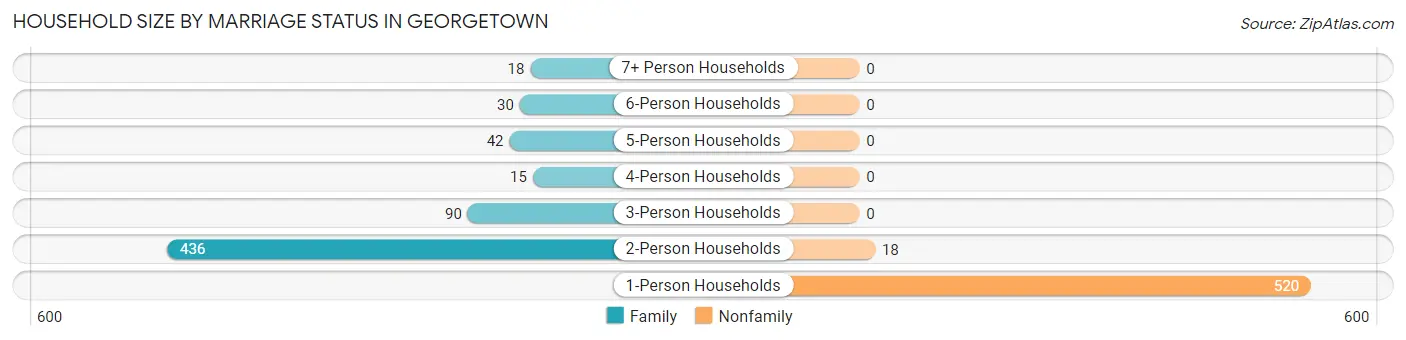
| Household Size | Family Households | Nonfamily Households |
| 1-Person Households | - | 520 (44.5%) |
| 2-Person Households | 436 (37.3%) | 18 (1.5%) |
| 3-Person Households | 90 (7.7%) | 0 (0.0%) |
| 4-Person Households | 15 (1.3%) | 0 (0.0%) |
| 5-Person Households | 42 (3.6%) | 0 (0.0%) |
| 6-Person Households | 30 (2.6%) | 0 (0.0%) |
| 7+ Person Households | 18 (1.5%) | 0 (0.0%) |
| Total | 631 (54.0%) | 538 (46.0%) |
Female Fertility in Georgetown
Fertility by Age in Georgetown
Average fertility rate in Georgetown is 77.0 births per 1,000 women. Women in the age bracket of 35 to 50 years have the highest fertility rate with 126.0 births per 1,000 women. Women in the age bracket of 35 to 50 years acount for 100.0% of all women with births.
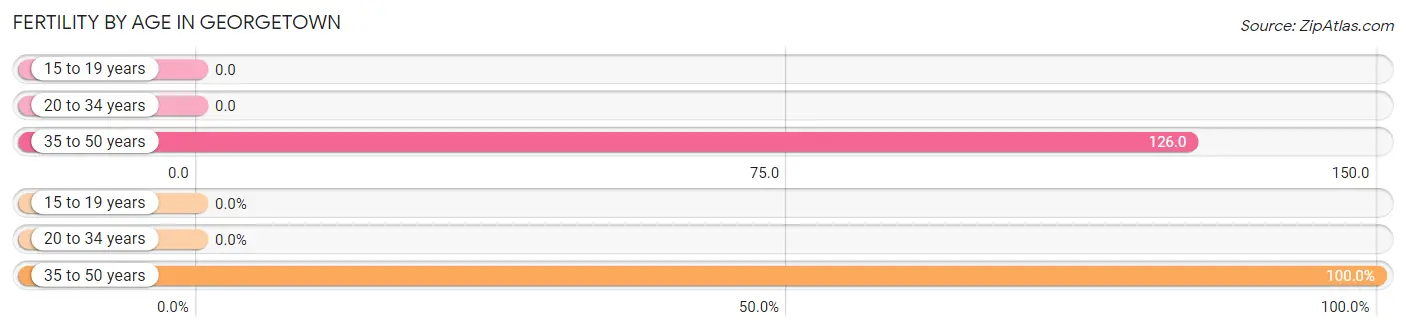
| Age Bracket | Women with Births | Births / 1,000 Women |
| 15 to 19 years | 0 (0.0%) | 0.0 |
| 20 to 34 years | 0 (0.0%) | 0.0 |
| 35 to 50 years | 31 (100.0%) | 126.0 |
| Total | 31 (100.0%) | 77.0 |
Fertility by Age by Marriage Status in Georgetown
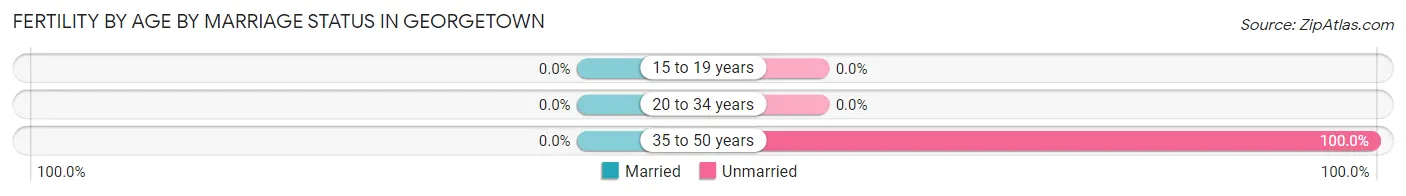
| Age Bracket | Married | Unmarried |
| 15 to 19 years | 0 (0.0%) | 0 (0.0%) |
| 20 to 34 years | 0 (0.0%) | 0 (0.0%) |
| 35 to 50 years | 0 (0.0%) | 31 (100.0%) |
| Total | 0 (0.0%) | 31 (100.0%) |
Fertility by Education in Georgetown
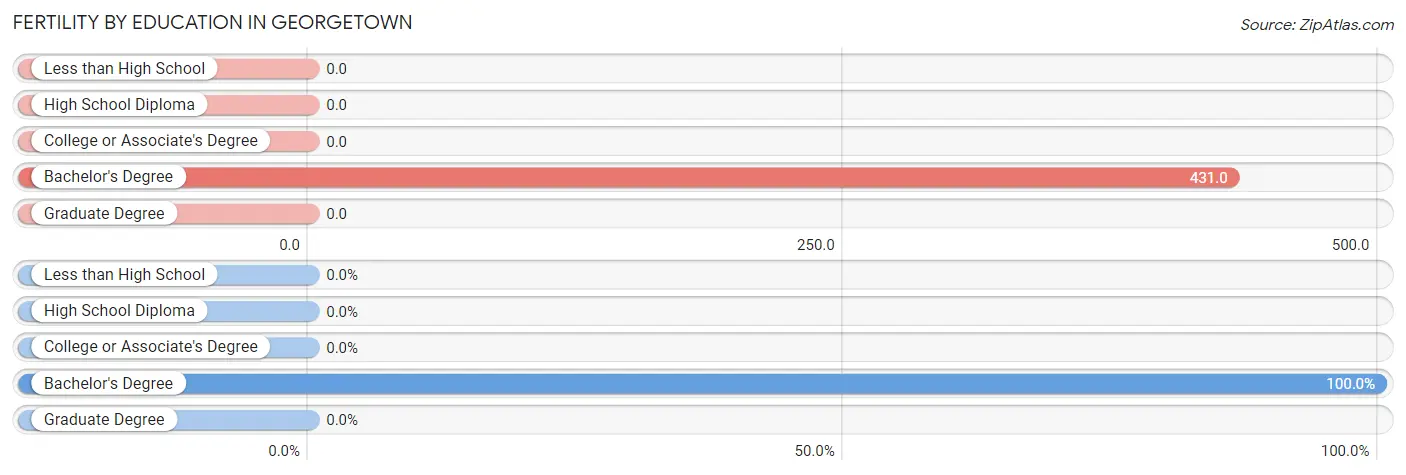
| Educational Attainment | Women with Births | Births / 1,000 Women |
| Less than High School | 0 (0.0%) | 0.0 |
| High School Diploma | 0 (0.0%) | 0.0 |
| College or Associate's Degree | 0 (0.0%) | 0.0 |
| Bachelor's Degree | 31 (100.0%) | 431.0 |
| Graduate Degree | 0 (0.0%) | 0.0 |
| Total | 31 (100.0%) | 77.0 |
Fertility by Education by Marriage Status in Georgetown
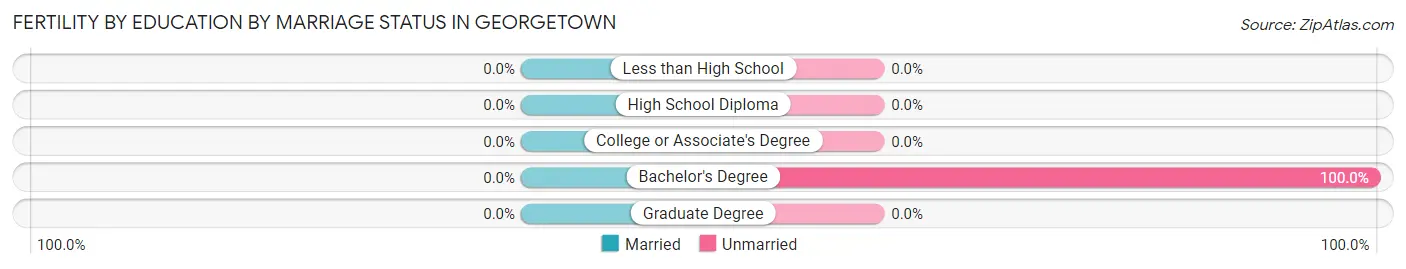
| Educational Attainment | Married | Unmarried |
| Less than High School | 0 (0.0%) | 0 (0.0%) |
| High School Diploma | 0 (0.0%) | 0 (0.0%) |
| College or Associate's Degree | 0 (0.0%) | 0 (0.0%) |
| Bachelor's Degree | 0 (0.0%) | 31 (100.0%) |
| Graduate Degree | 0 (0.0%) | 0 (0.0%) |
| Total | 0 (0.0%) | 31 (100.0%) |
Employment Characteristics in Georgetown
Employment by Class of Employer in Georgetown
Among the 689 employed individuals in Georgetown, private company employees (458 | 66.5%), self-employed (not incorporated) (73 | 10.6%), and local government employees (69 | 10.0%) make up the most common classes of employment.
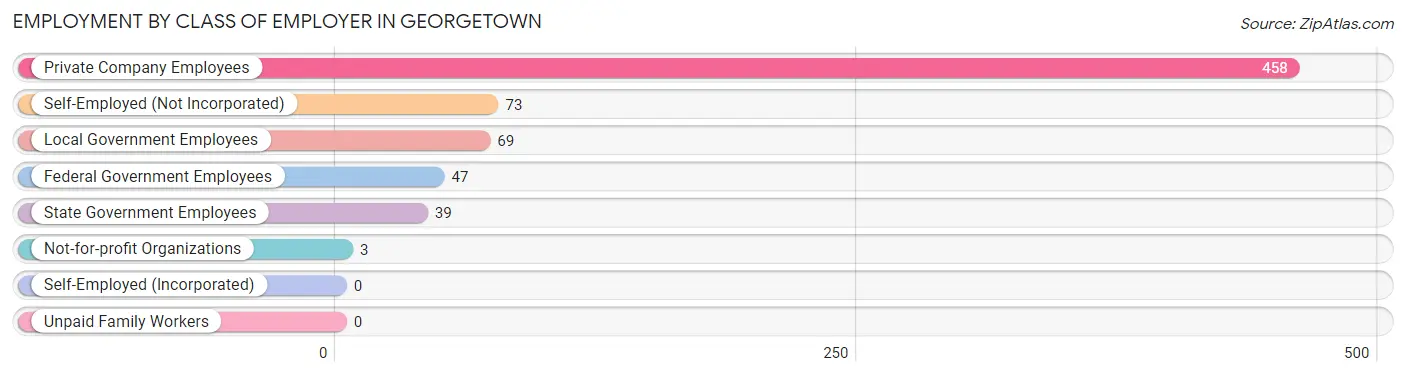
| Employer Class | # Employees | % Employees |
| Private Company Employees | 458 | 66.5% |
| Self-Employed (Incorporated) | 0 | 0.0% |
| Self-Employed (Not Incorporated) | 73 | 10.6% |
| Not-for-profit Organizations | 3 | 0.4% |
| Local Government Employees | 69 | 10.0% |
| State Government Employees | 39 | 5.7% |
| Federal Government Employees | 47 | 6.8% |
| Unpaid Family Workers | 0 | 0.0% |
| Total | 689 | 100.0% |
Employment Status by Age in Georgetown
According to the labor force statistics for Georgetown, out of the total population over 16 years of age (2,229), 37.7% or 840 individuals are in the labor force, with 18.1% or 152 of them unemployed. The age group with the highest labor force participation rate is 55 to 59 years, with 93.5% or 130 individuals in the labor force. Within the labor force, the 45 to 54 years age range has the highest percentage of unemployed individuals, with 74.0% or 57 of them being unemployed.
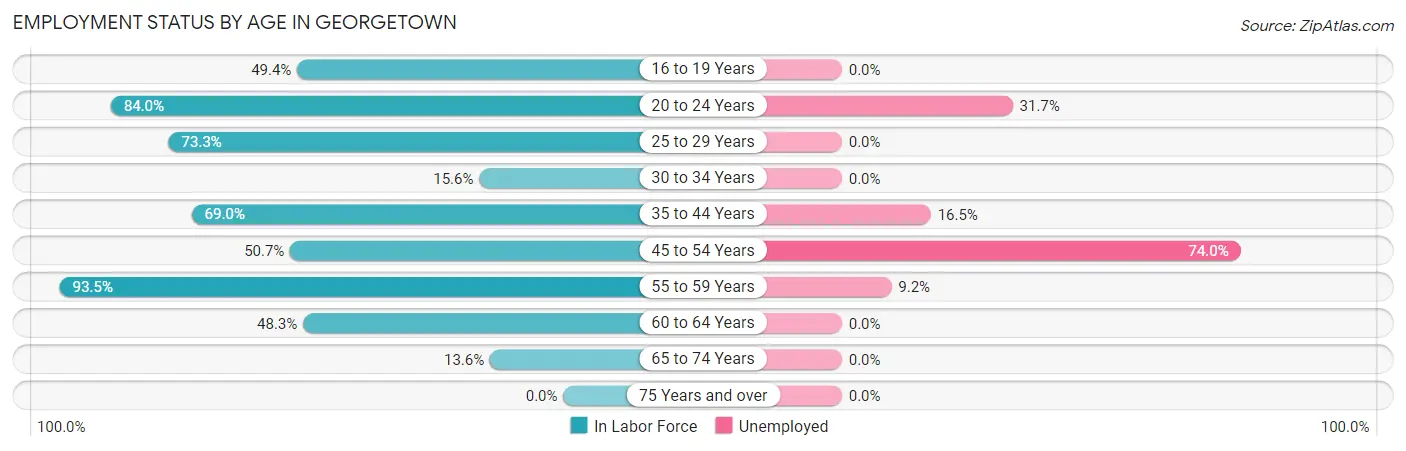
| Age Bracket | In Labor Force | Unemployed |
| 16 to 19 Years | 38 (49.4%) | 0 (0.0%) |
| 20 to 24 Years | 142 (84.0%) | 45 (31.7%) |
| 25 to 29 Years | 11 (73.3%) | 0 (0.0%) |
| 30 to 34 Years | 7 (15.6%) | 0 (0.0%) |
| 35 to 44 Years | 231 (69.0%) | 38 (16.5%) |
| 45 to 54 Years | 77 (50.7%) | 57 (74.0%) |
| 55 to 59 Years | 130 (93.5%) | 12 (9.2%) |
| 60 to 64 Years | 138 (48.3%) | 0 (0.0%) |
| 65 to 74 Years | 67 (13.6%) | 0 (0.0%) |
| 75 Years and over | 0 (0.0%) | 0 (0.0%) |
| Total | 840 (37.7%) | 152 (18.1%) |
Employment Status by Educational Attainment in Georgetown
According to labor force statistics for Georgetown, 61.1% of individuals (594) out of the total population between 25 and 64 years of age (972) are in the labor force, with 18.0% or 107 of them being unemployed. The group with the highest labor force participation rate are those with the educational attainment of high school diploma, with 75.9% or 227 individuals in the labor force. Within the labor force, individuals with high school diploma education have the highest percentage of unemployment, with 36.1% or 82 of them being unemployed.
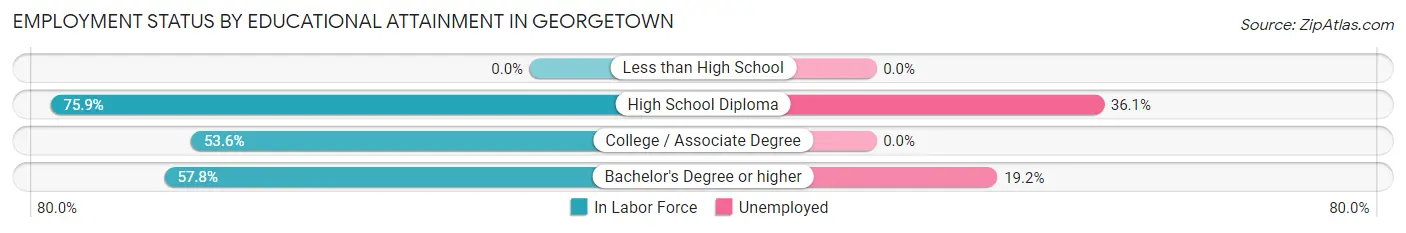
| Educational Attainment | In Labor Force | Unemployed |
| Less than High School | 0 (0.0%) | 0 (0.0%) |
| High School Diploma | 227 (75.9%) | 108 (36.1%) |
| College / Associate Degree | 237 (53.6%) | 0 (0.0%) |
| Bachelor's Degree or higher | 130 (57.8%) | 43 (19.2%) |
| Total | 594 (61.1%) | 175 (18.0%) |
Employment Occupations by Sex in Georgetown
Management, Business, Science and Arts Occupations
The most common Management, Business, Science and Arts occupations in Georgetown are Management (64 | 9.3%), Business & Financial (41 | 5.9%), Computers, Engineering & Science (28 | 4.1%), Life, Physical & Social Science (24 | 3.5%), and Health Diagnosing & Treating (20 | 2.9%).
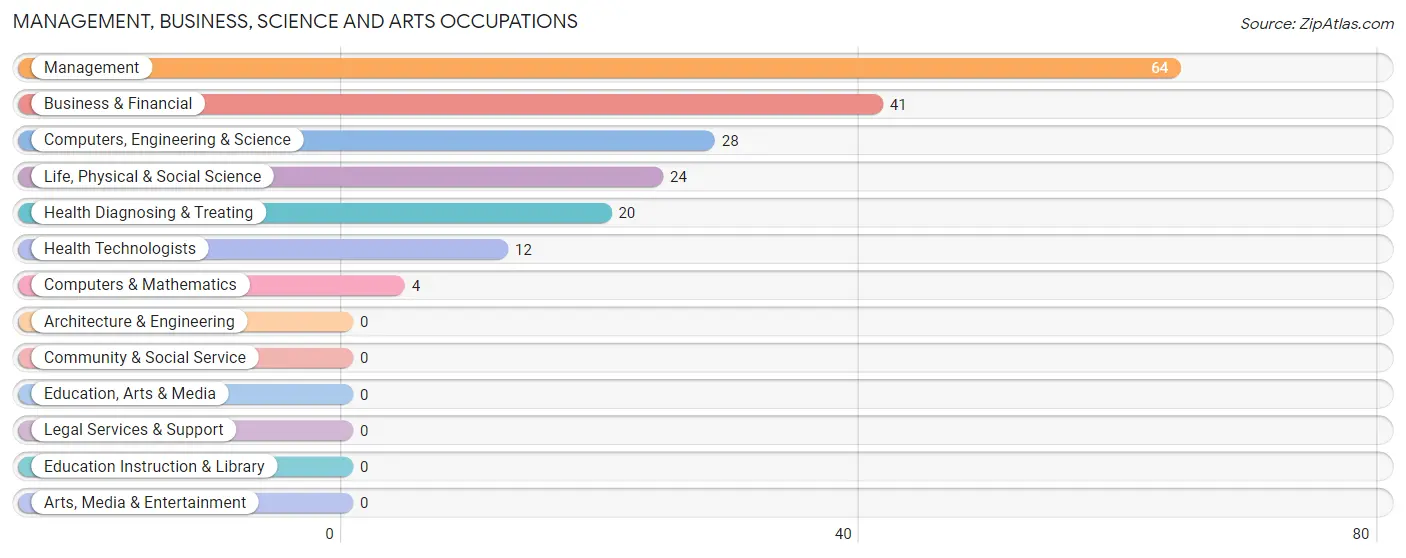
Management, Business, Science and Arts Occupations by Sex
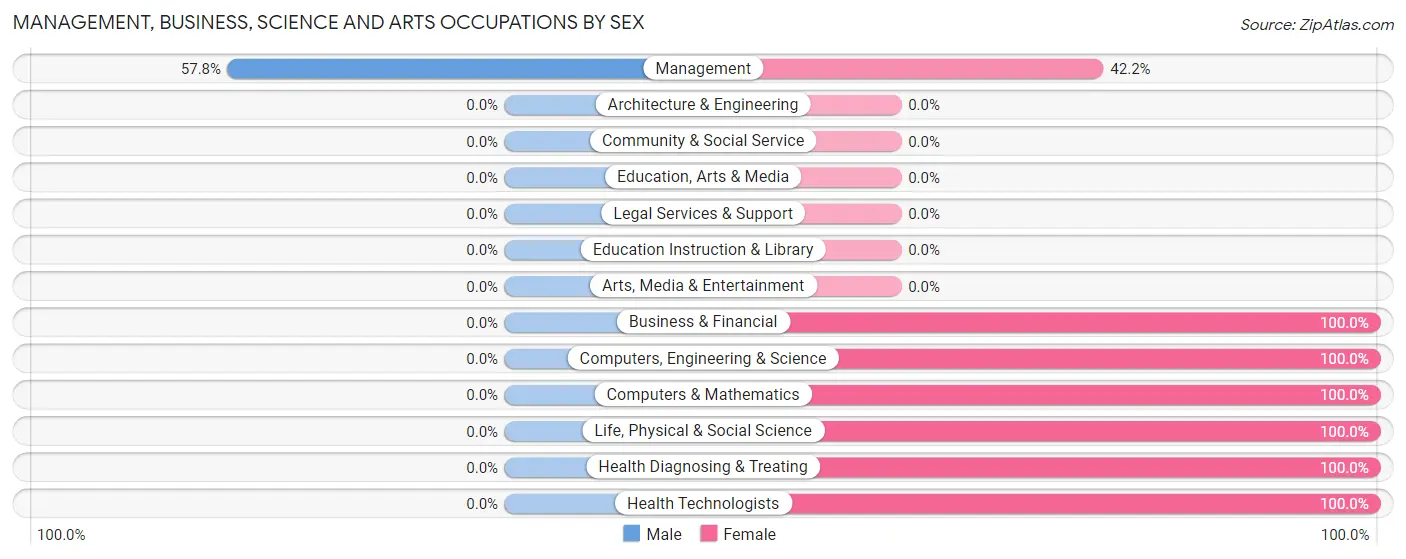
| Occupation | Male | Female |
| Management | 37 (57.8%) | 27 (42.2%) |
| Business & Financial | 0 (0.0%) | 41 (100.0%) |
| Computers, Engineering & Science | 0 (0.0%) | 28 (100.0%) |
| Computers & Mathematics | 0 (0.0%) | 4 (100.0%) |
| Architecture & Engineering | 0 (0.0%) | 0 (0.0%) |
| Life, Physical & Social Science | 0 (0.0%) | 24 (100.0%) |
| Community & Social Service | 0 (0.0%) | 0 (0.0%) |
| Education, Arts & Media | 0 (0.0%) | 0 (0.0%) |
| Legal Services & Support | 0 (0.0%) | 0 (0.0%) |
| Education Instruction & Library | 0 (0.0%) | 0 (0.0%) |
| Arts, Media & Entertainment | 0 (0.0%) | 0 (0.0%) |
| Health Diagnosing & Treating | 0 (0.0%) | 20 (100.0%) |
| Health Technologists | 0 (0.0%) | 12 (100.0%) |
| Total (Category) | 37 (24.2%) | 116 (75.8%) |
| Total (Overall) | 263 (38.2%) | 426 (61.8%) |
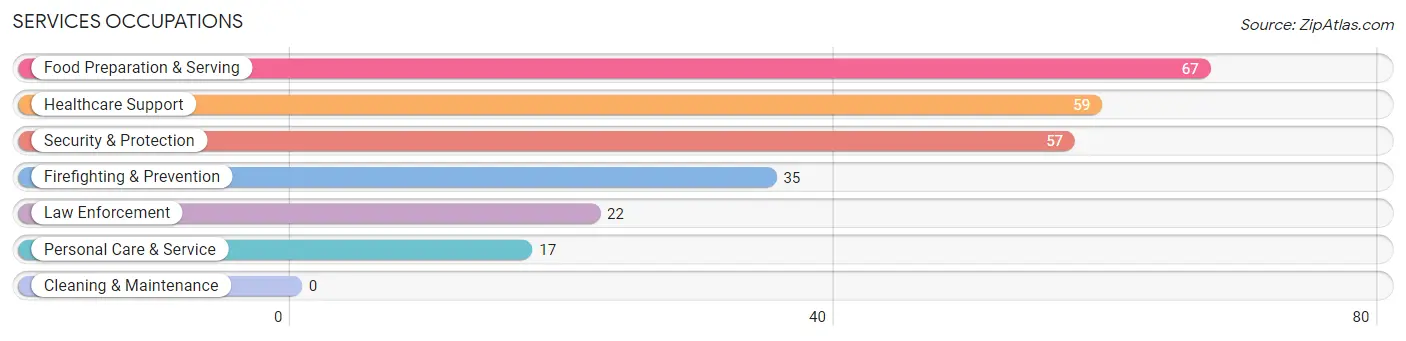
Services Occupations
The most common Services occupations in Georgetown are Food Preparation & Serving (67 | 9.7%), Healthcare Support (59 | 8.6%), Security & Protection (57 | 8.3%), Firefighting & Prevention (35 | 5.1%), and Law Enforcement (22 | 3.2%).
Services Occupations by Sex
Within the Services occupations in Georgetown, the most male-oriented occupations are Security & Protection (100.0%), Firefighting & Prevention (100.0%), and Law Enforcement (100.0%), while the most female-oriented occupations are Healthcare Support (100.0%), Personal Care & Service (100.0%), and Food Preparation & Serving (94.0%).
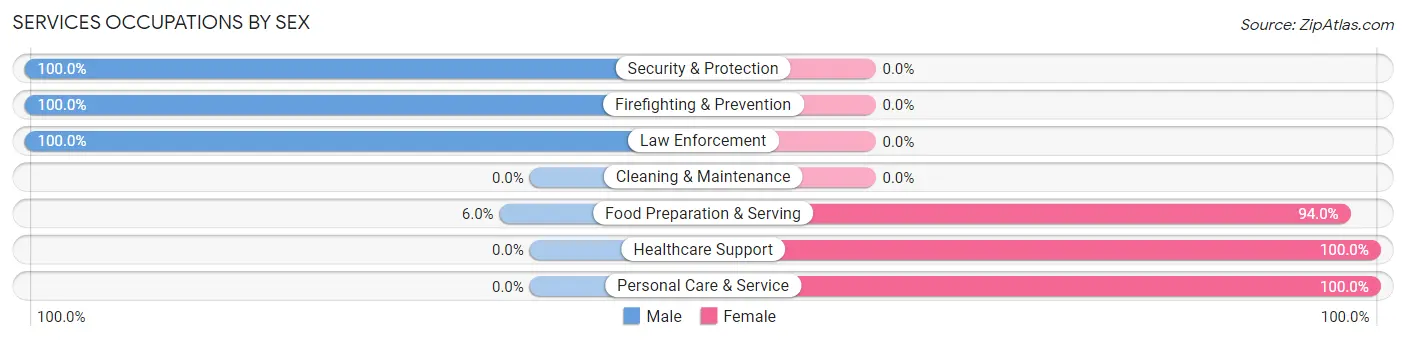
| Occupation | Male | Female |
| Healthcare Support | 0 (0.0%) | 59 (100.0%) |
| Security & Protection | 57 (100.0%) | 0 (0.0%) |
| Firefighting & Prevention | 35 (100.0%) | 0 (0.0%) |
| Law Enforcement | 22 (100.0%) | 0 (0.0%) |
| Food Preparation & Serving | 4 (6.0%) | 63 (94.0%) |
| Cleaning & Maintenance | 0 (0.0%) | 0 (0.0%) |
| Personal Care & Service | 0 (0.0%) | 17 (100.0%) |
| Total (Category) | 61 (30.5%) | 139 (69.5%) |
| Total (Overall) | 263 (38.2%) | 426 (61.8%) |
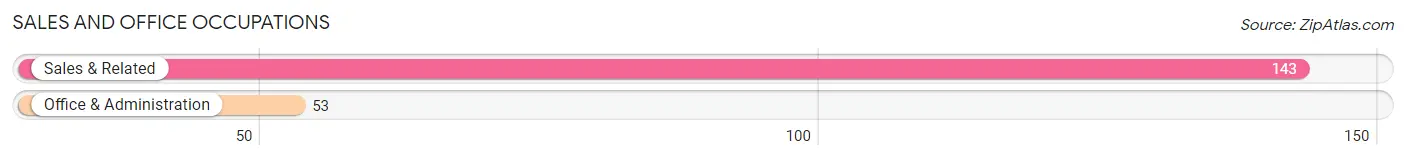
Sales and Office Occupations
The most common Sales and Office occupations in Georgetown are Sales & Related (143 | 20.7%), and Office & Administration (53 | 7.7%).
Sales and Office Occupations by Sex
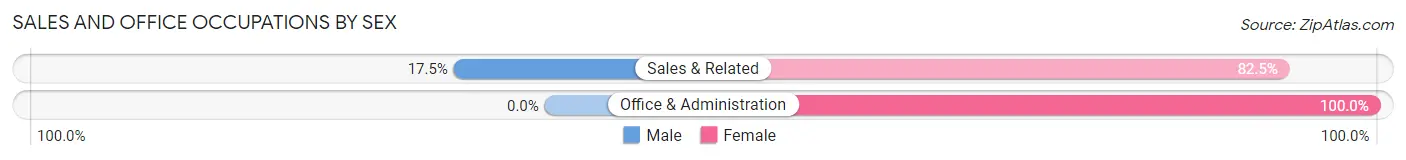
| Occupation | Male | Female |
| Sales & Related | 25 (17.5%) | 118 (82.5%) |
| Office & Administration | 0 (0.0%) | 53 (100.0%) |
| Total (Category) | 25 (12.8%) | 171 (87.2%) |
| Total (Overall) | 263 (38.2%) | 426 (61.8%) |
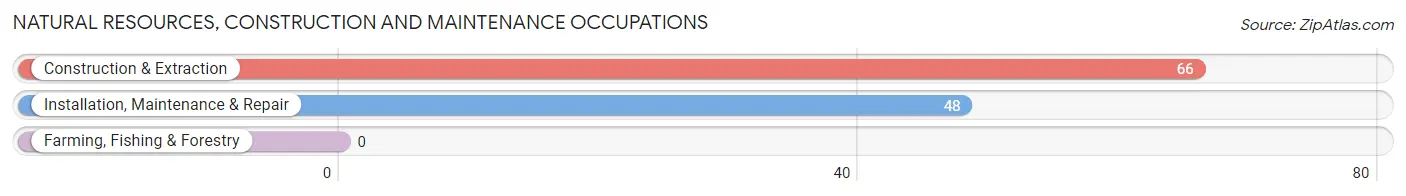
Natural Resources, Construction and Maintenance Occupations
The most common Natural Resources, Construction and Maintenance occupations in Georgetown are Construction & Extraction (66 | 9.6%), and Installation, Maintenance & Repair (48 | 7.0%).
Natural Resources, Construction and Maintenance Occupations by Sex
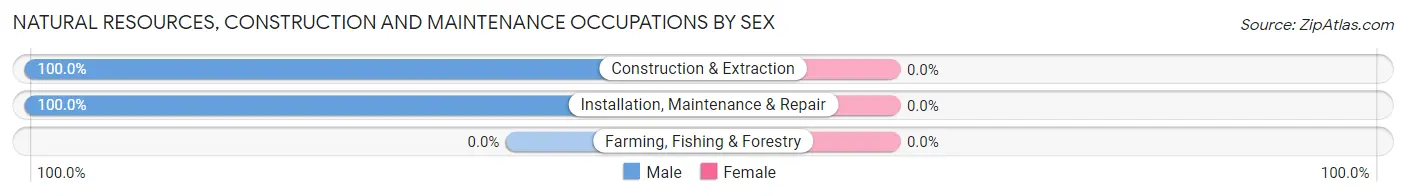
| Occupation | Male | Female |
| Farming, Fishing & Forestry | 0 (0.0%) | 0 (0.0%) |
| Construction & Extraction | 66 (100.0%) | 0 (0.0%) |
| Installation, Maintenance & Repair | 48 (100.0%) | 0 (0.0%) |
| Total (Category) | 114 (100.0%) | 0 (0.0%) |
| Total (Overall) | 263 (38.2%) | 426 (61.8%) |
Production, Transportation and Moving Occupations
The most common Production, Transportation and Moving occupations in Georgetown are Material Moving (18 | 2.6%), and Production (8 | 1.2%).
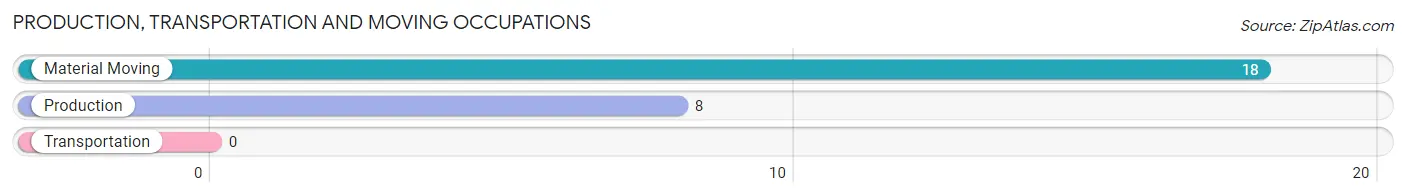
Production, Transportation and Moving Occupations by Sex
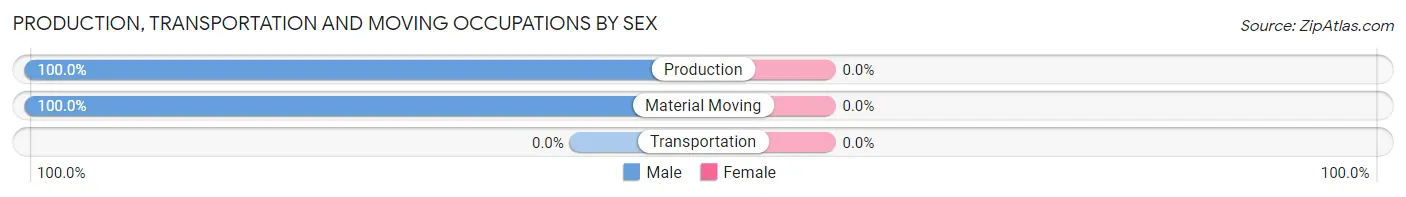
| Occupation | Male | Female |
| Production | 8 (100.0%) | 0 (0.0%) |
| Transportation | 0 (0.0%) | 0 (0.0%) |
| Material Moving | 18 (100.0%) | 0 (0.0%) |
| Total (Category) | 26 (100.0%) | 0 (0.0%) |
| Total (Overall) | 263 (38.2%) | 426 (61.8%) |
Employment Industries by Sex in Georgetown
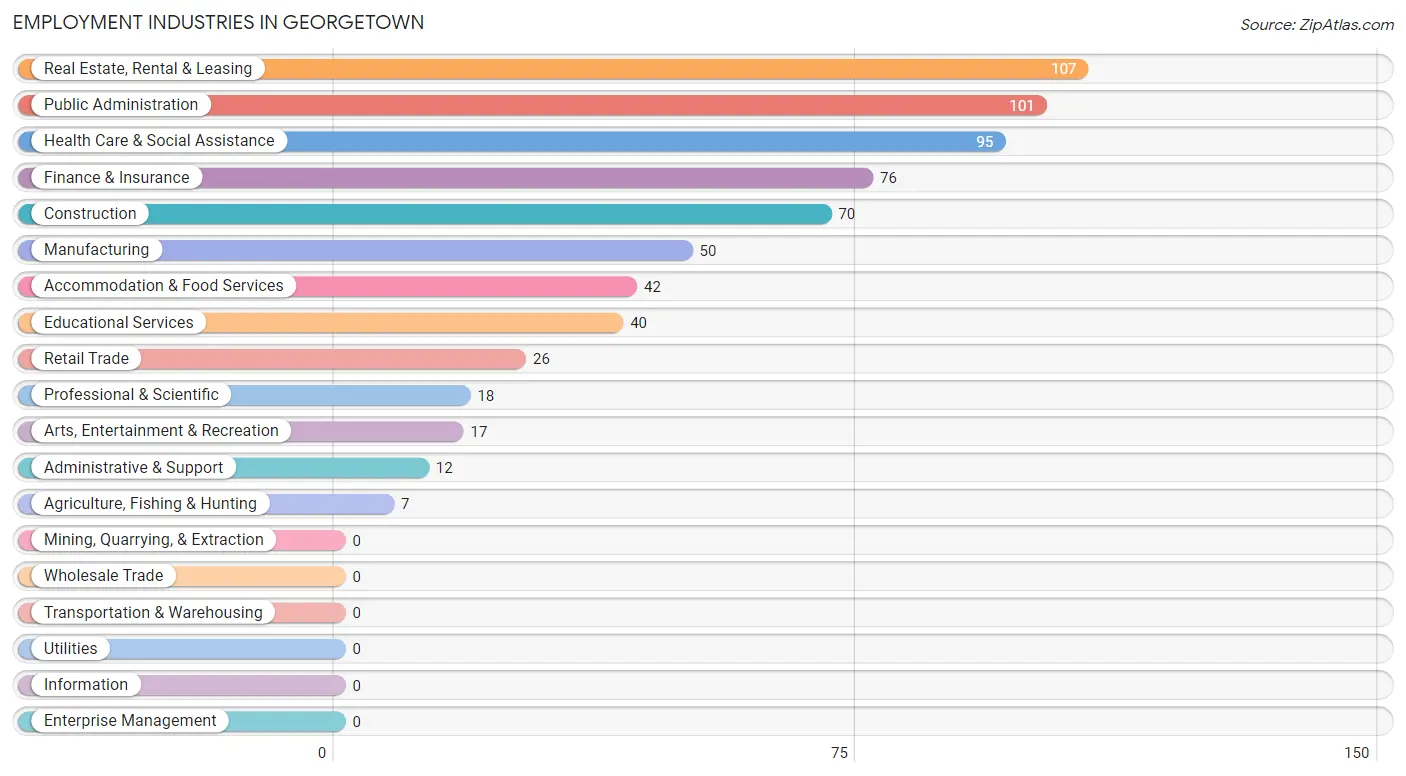
Employment Industries in Georgetown
The major employment industries in Georgetown include Real Estate, Rental & Leasing (107 | 15.5%), Public Administration (101 | 14.7%), Health Care & Social Assistance (95 | 13.8%), Finance & Insurance (76 | 11.0%), and Construction (70 | 10.2%).
Employment Industries by Sex in Georgetown
The Georgetown industries that see more men than women are Construction (100.0%), Retail Trade (100.0%), and Administrative & Support (100.0%), whereas the industries that tend to have a higher number of women are Agriculture, Fishing & Hunting (100.0%), Manufacturing (100.0%), and Real Estate, Rental & Leasing (100.0%).
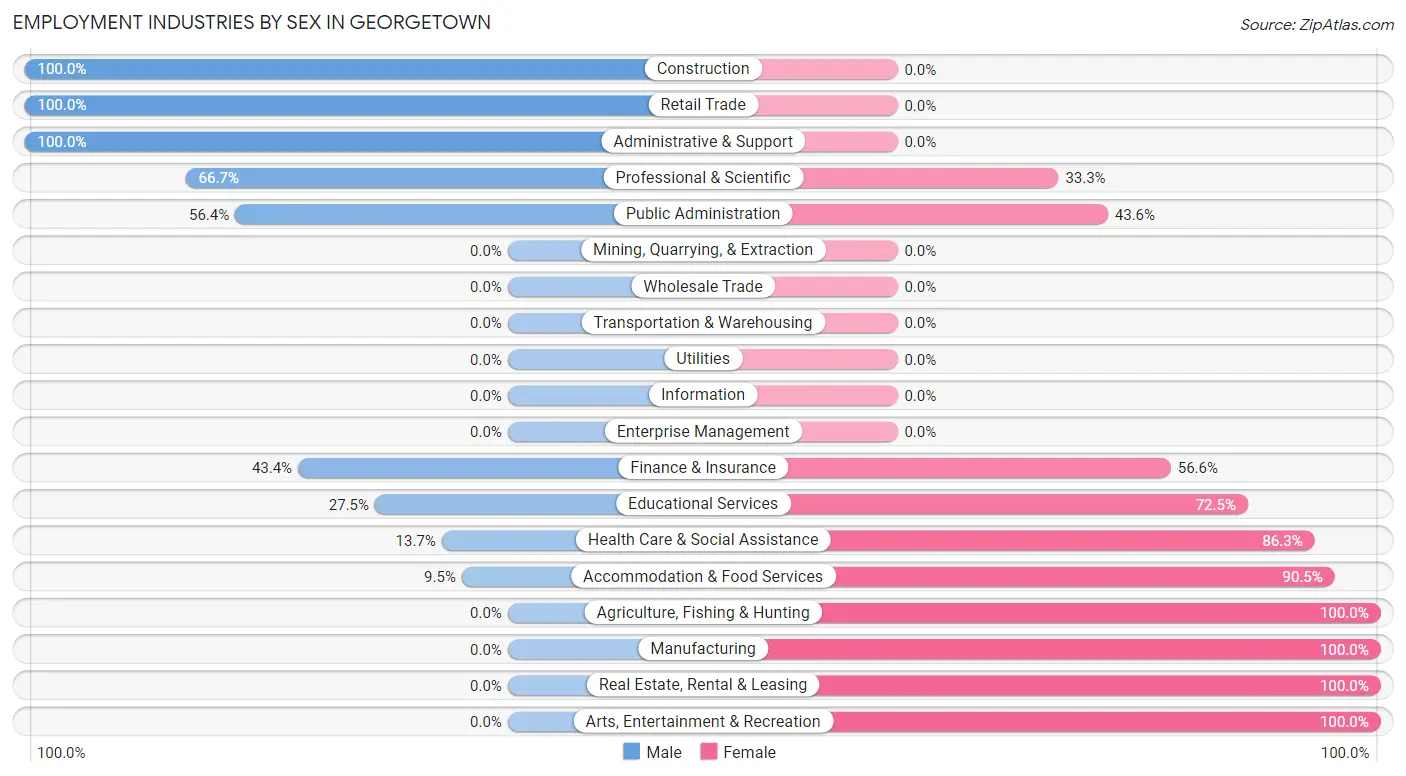
| Industry | Male | Female |
| Agriculture, Fishing & Hunting | 0 (0.0%) | 7 (100.0%) |
| Mining, Quarrying, & Extraction | 0 (0.0%) | 0 (0.0%) |
| Construction | 70 (100.0%) | 0 (0.0%) |
| Manufacturing | 0 (0.0%) | 50 (100.0%) |
| Wholesale Trade | 0 (0.0%) | 0 (0.0%) |
| Retail Trade | 26 (100.0%) | 0 (0.0%) |
| Transportation & Warehousing | 0 (0.0%) | 0 (0.0%) |
| Utilities | 0 (0.0%) | 0 (0.0%) |
| Information | 0 (0.0%) | 0 (0.0%) |
| Finance & Insurance | 33 (43.4%) | 43 (56.6%) |
| Real Estate, Rental & Leasing | 0 (0.0%) | 107 (100.0%) |
| Professional & Scientific | 12 (66.7%) | 6 (33.3%) |
| Enterprise Management | 0 (0.0%) | 0 (0.0%) |
| Administrative & Support | 12 (100.0%) | 0 (0.0%) |
| Educational Services | 11 (27.5%) | 29 (72.5%) |
| Health Care & Social Assistance | 13 (13.7%) | 82 (86.3%) |
| Arts, Entertainment & Recreation | 0 (0.0%) | 17 (100.0%) |
| Accommodation & Food Services | 4 (9.5%) | 38 (90.5%) |
| Public Administration | 57 (56.4%) | 44 (43.6%) |
| Total | 263 (38.2%) | 426 (61.8%) |
Education in Georgetown
School Enrollment in Georgetown
The most common levels of schooling among the 402 students in Georgetown are high school (96 | 23.9%), elementary school (93 | 23.1%), and college / undergraduate (80 | 19.9%).
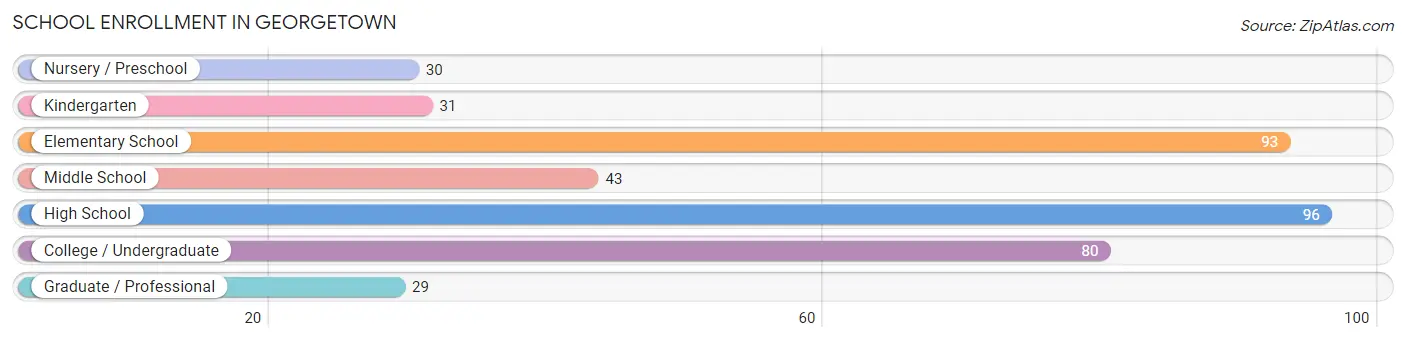
| School Level | # Students | % Students |
| Nursery / Preschool | 30 | 7.5% |
| Kindergarten | 31 | 7.7% |
| Elementary School | 93 | 23.1% |
| Middle School | 43 | 10.7% |
| High School | 96 | 23.9% |
| College / Undergraduate | 80 | 19.9% |
| Graduate / Professional | 29 | 7.2% |
| Total | 402 | 100.0% |
School Enrollment by Age by Funding Source in Georgetown
Out of a total of 402 students who are enrolled in schools in Georgetown, 121 (30.1%) attend a private institution, while the remaining 281 (69.9%) are enrolled in public schools. The age group of 3 to 4 year olds has the highest likelihood of being enrolled in private schools, with 30 (100.0% in the age bracket) enrolled. Conversely, the age group of 18 to 19 year olds has the lowest likelihood of being enrolled in a private school, with 46 (100.0% in the age bracket) attending a public institution.
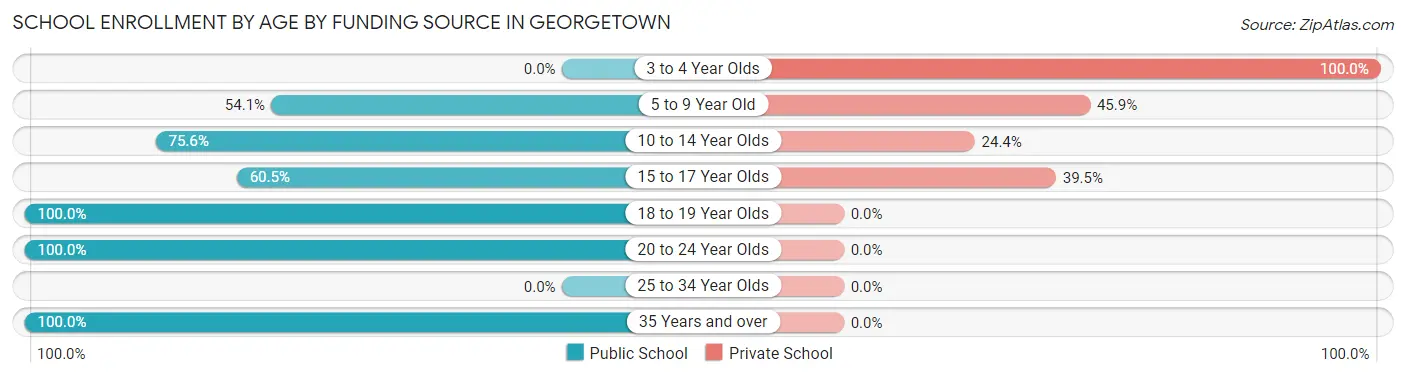
| Age Bracket | Public School | Private School |
| 3 to 4 Year Olds | 0 (0.0%) | 30 (100.0%) |
| 5 to 9 Year Old | 46 (54.1%) | 39 (45.9%) |
| 10 to 14 Year Olds | 62 (75.6%) | 20 (24.4%) |
| 15 to 17 Year Olds | 49 (60.5%) | 32 (39.5%) |
| 18 to 19 Year Olds | 46 (100.0%) | 0 (0.0%) |
| 20 to 24 Year Olds | 27 (100.0%) | 0 (0.0%) |
| 25 to 34 Year Olds | 0 (0.0%) | 0 (0.0%) |
| 35 Years and over | 51 (100.0%) | 0 (0.0%) |
| Total | 281 (69.9%) | 121 (30.1%) |
Educational Attainment by Field of Study in Georgetown
Psychology (129 | 27.1%), bio, nature & agricultural (74 | 15.5%), business (72 | 15.1%), science & technology (54 | 11.3%), and social sciences (50 | 10.5%) are the most common fields of study among 476 individuals in Georgetown who have obtained a bachelor's degree or higher.
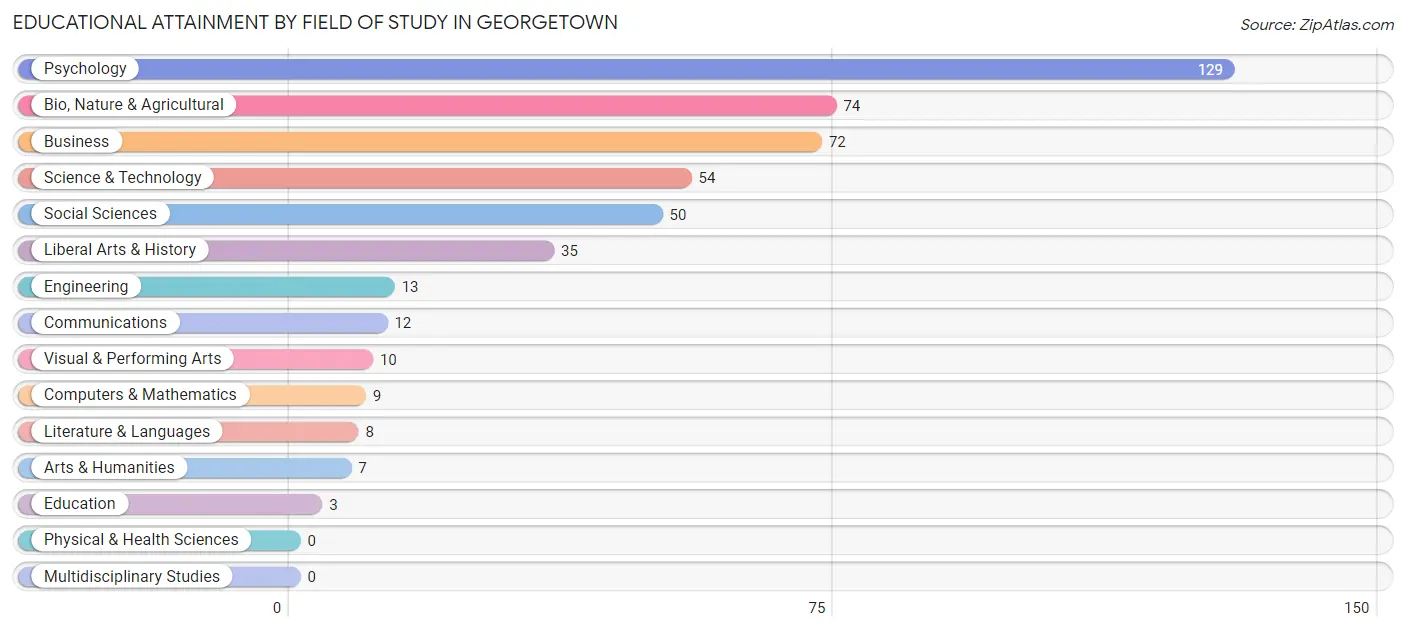
| Field of Study | # Graduates | % Graduates |
| Computers & Mathematics | 9 | 1.9% |
| Bio, Nature & Agricultural | 74 | 15.5% |
| Physical & Health Sciences | 0 | 0.0% |
| Psychology | 129 | 27.1% |
| Social Sciences | 50 | 10.5% |
| Engineering | 13 | 2.7% |
| Multidisciplinary Studies | 0 | 0.0% |
| Science & Technology | 54 | 11.3% |
| Business | 72 | 15.1% |
| Education | 3 | 0.6% |
| Literature & Languages | 8 | 1.7% |
| Liberal Arts & History | 35 | 7.3% |
| Visual & Performing Arts | 10 | 2.1% |
| Communications | 12 | 2.5% |
| Arts & Humanities | 7 | 1.5% |
| Total | 476 | 100.0% |
Transportation & Commute in Georgetown
Vehicle Availability by Sex in Georgetown
The most prevalent vehicle ownership categories in Georgetown are males with 3 vehicles (175, accounting for 66.5%) and females with 3 vehicles (235, making up 41.4%).
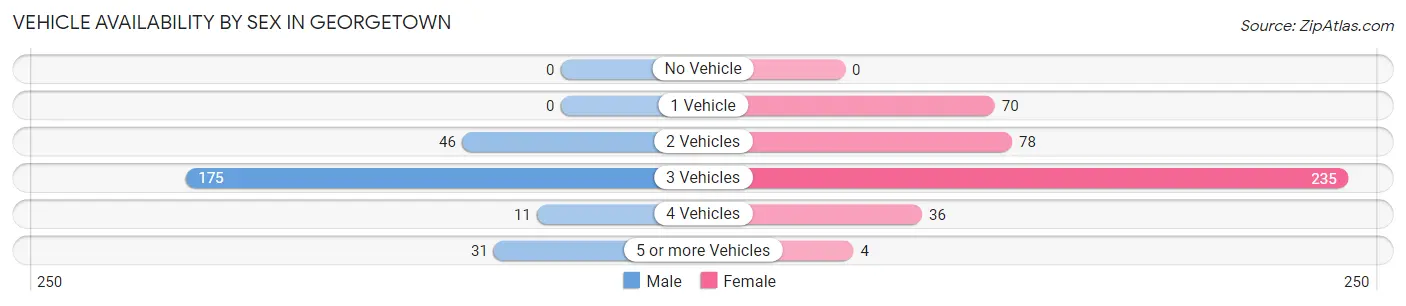
| Vehicles Available | Male | Female |
| No Vehicle | 0 (0.0%) | 0 (0.0%) |
| 1 Vehicle | 0 (0.0%) | 70 (16.6%) |
| 2 Vehicles | 46 (17.5%) | 78 (18.4%) |
| 3 Vehicles | 175 (66.5%) | 235 (55.6%) |
| 4 Vehicles | 11 (4.2%) | 36 (8.5%) |
| 5 or more Vehicles | 31 (11.8%) | 4 (0.9%) |
| Total | 263 (100.0%) | 423 (100.0%) |
Commute Time in Georgetown
The most frequently occuring commute durations in Georgetown are 90 or more minutes (132 commuters, 19.6%), 30 to 34 minutes (123 commuters, 18.2%), and 5 to 9 minutes (110 commuters, 16.3%).
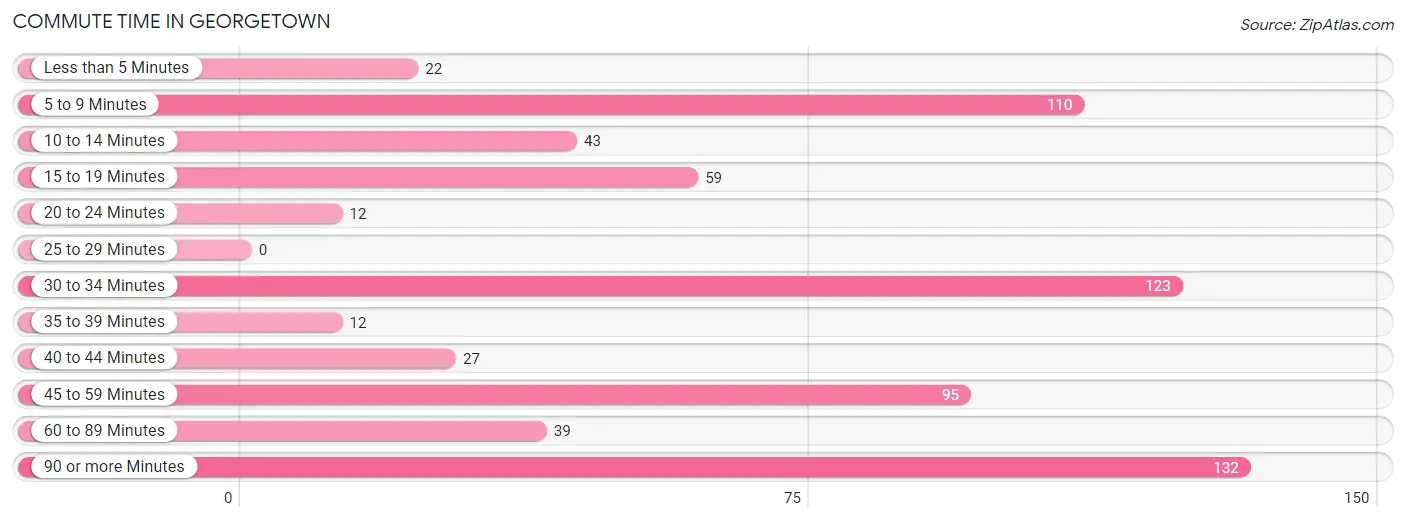
| Commute Time | # Commuters | % Commuters |
| Less than 5 Minutes | 22 | 3.3% |
| 5 to 9 Minutes | 110 | 16.3% |
| 10 to 14 Minutes | 43 | 6.4% |
| 15 to 19 Minutes | 59 | 8.7% |
| 20 to 24 Minutes | 12 | 1.8% |
| 25 to 29 Minutes | 0 | 0.0% |
| 30 to 34 Minutes | 123 | 18.2% |
| 35 to 39 Minutes | 12 | 1.8% |
| 40 to 44 Minutes | 27 | 4.0% |
| 45 to 59 Minutes | 95 | 14.1% |
| 60 to 89 Minutes | 39 | 5.8% |
| 90 or more Minutes | 132 | 19.6% |
Commute Time by Sex in Georgetown
The most common commute times in Georgetown are 90 or more minutes (59 commuters, 22.4%) for males and 30 to 34 minutes (111 commuters, 27.0%) for females.
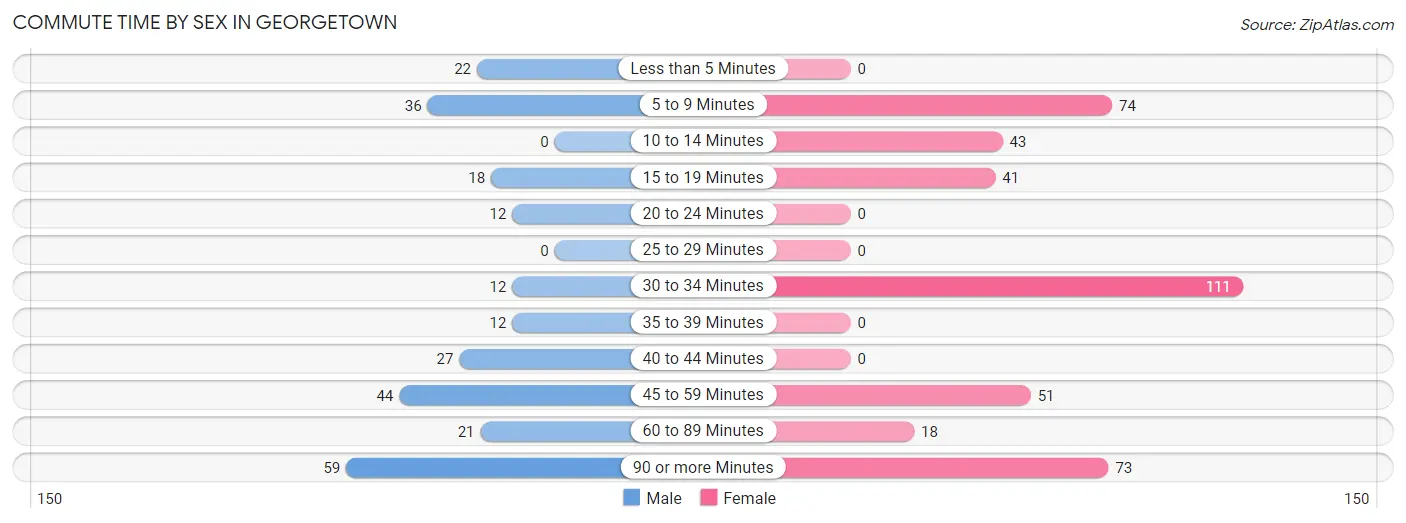
| Commute Time | Male | Female |
| Less than 5 Minutes | 22 (8.4%) | 0 (0.0%) |
| 5 to 9 Minutes | 36 (13.7%) | 74 (18.0%) |
| 10 to 14 Minutes | 0 (0.0%) | 43 (10.5%) |
| 15 to 19 Minutes | 18 (6.8%) | 41 (10.0%) |
| 20 to 24 Minutes | 12 (4.6%) | 0 (0.0%) |
| 25 to 29 Minutes | 0 (0.0%) | 0 (0.0%) |
| 30 to 34 Minutes | 12 (4.6%) | 111 (27.0%) |
| 35 to 39 Minutes | 12 (4.6%) | 0 (0.0%) |
| 40 to 44 Minutes | 27 (10.3%) | 0 (0.0%) |
| 45 to 59 Minutes | 44 (16.7%) | 51 (12.4%) |
| 60 to 89 Minutes | 21 (8.0%) | 18 (4.4%) |
| 90 or more Minutes | 59 (22.4%) | 73 (17.8%) |
Time of Departure to Work by Sex in Georgetown
The most frequent times of departure to work in Georgetown are 9:00 AM to 9:59 AM (75, 28.5%) for males and 7:30 AM to 7:59 AM (157, 38.2%) for females.
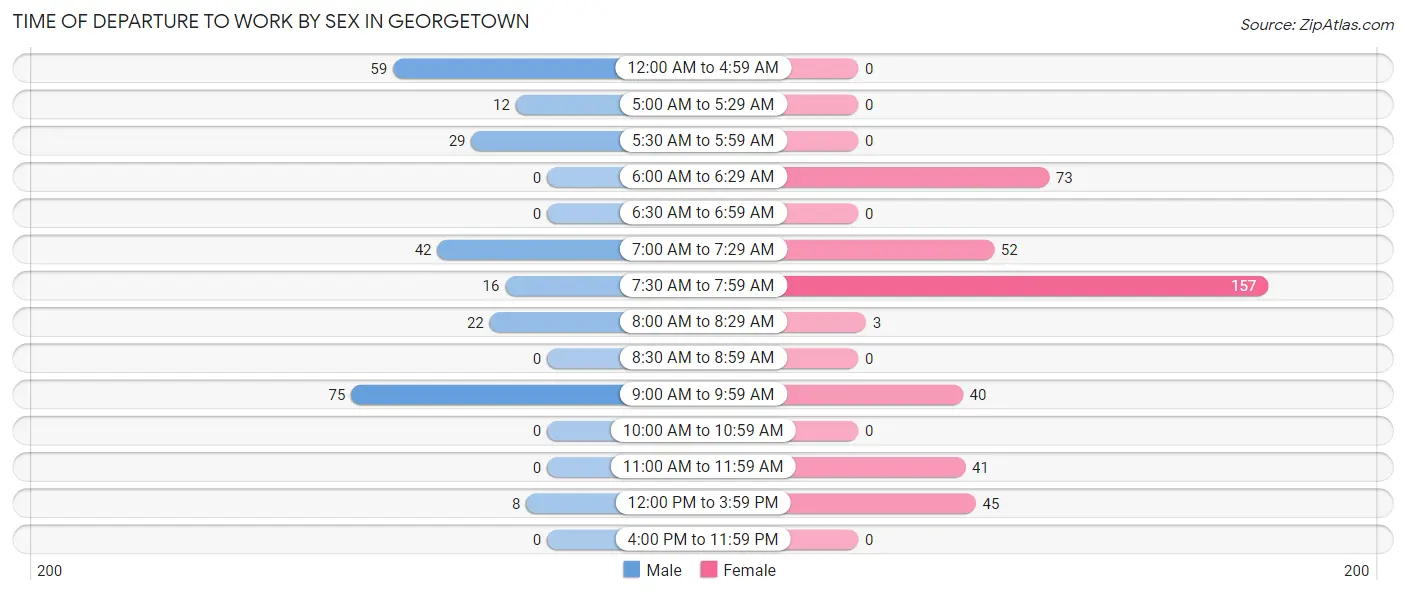
| Time of Departure | Male | Female |
| 12:00 AM to 4:59 AM | 59 (22.4%) | 0 (0.0%) |
| 5:00 AM to 5:29 AM | 12 (4.6%) | 0 (0.0%) |
| 5:30 AM to 5:59 AM | 29 (11.0%) | 0 (0.0%) |
| 6:00 AM to 6:29 AM | 0 (0.0%) | 73 (17.8%) |
| 6:30 AM to 6:59 AM | 0 (0.0%) | 0 (0.0%) |
| 7:00 AM to 7:29 AM | 42 (16.0%) | 52 (12.7%) |
| 7:30 AM to 7:59 AM | 16 (6.1%) | 157 (38.2%) |
| 8:00 AM to 8:29 AM | 22 (8.4%) | 3 (0.7%) |
| 8:30 AM to 8:59 AM | 0 (0.0%) | 0 (0.0%) |
| 9:00 AM to 9:59 AM | 75 (28.5%) | 40 (9.7%) |
| 10:00 AM to 10:59 AM | 0 (0.0%) | 0 (0.0%) |
| 11:00 AM to 11:59 AM | 0 (0.0%) | 41 (10.0%) |
| 12:00 PM to 3:59 PM | 8 (3.0%) | 45 (11.0%) |
| 4:00 PM to 11:59 PM | 0 (0.0%) | 0 (0.0%) |
| Total | 263 (100.0%) | 411 (100.0%) |
Housing Occupancy in Georgetown
Occupancy by Ownership in Georgetown
Of the total 1,169 dwellings in Georgetown, owner-occupied units account for 1,024 (87.6%), while renter-occupied units make up 145 (12.4%).
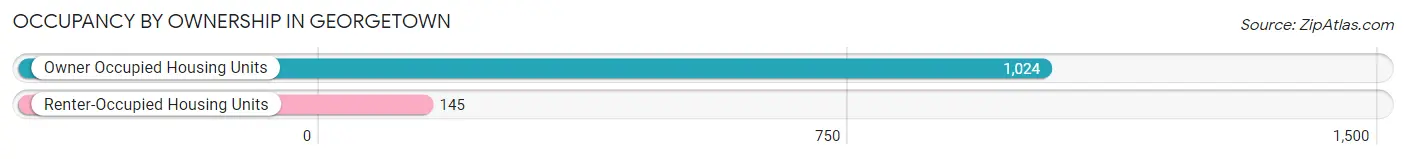
| Occupancy | # Housing Units | % Housing Units |
| Owner Occupied Housing Units | 1,024 | 87.6% |
| Renter-Occupied Housing Units | 145 | 12.4% |
| Total Occupied Housing Units | 1,169 | 100.0% |
Occupancy by Household Size in Georgetown
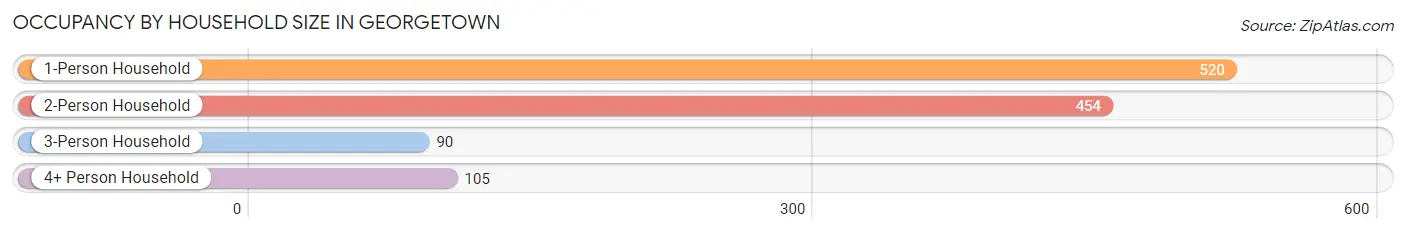
| Household Size | # Housing Units | % Housing Units |
| 1-Person Household | 520 | 44.5% |
| 2-Person Household | 454 | 38.8% |
| 3-Person Household | 90 | 7.7% |
| 4+ Person Household | 105 | 9.0% |
| Total Housing Units | 1,169 | 100.0% |
Occupancy by Ownership by Household Size in Georgetown
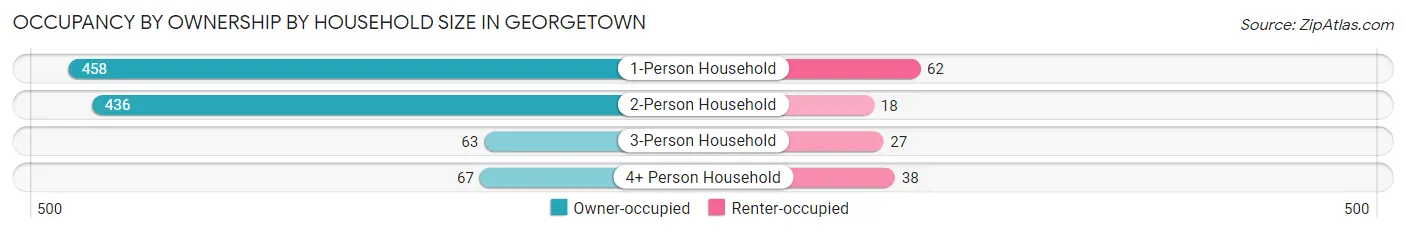
| Household Size | Owner-occupied | Renter-occupied |
| 1-Person Household | 458 (88.1%) | 62 (11.9%) |
| 2-Person Household | 436 (96.0%) | 18 (4.0%) |
| 3-Person Household | 63 (70.0%) | 27 (30.0%) |
| 4+ Person Household | 67 (63.8%) | 38 (36.2%) |
| Total Housing Units | 1,024 (87.6%) | 145 (12.4%) |
Occupancy by Educational Attainment in Georgetown
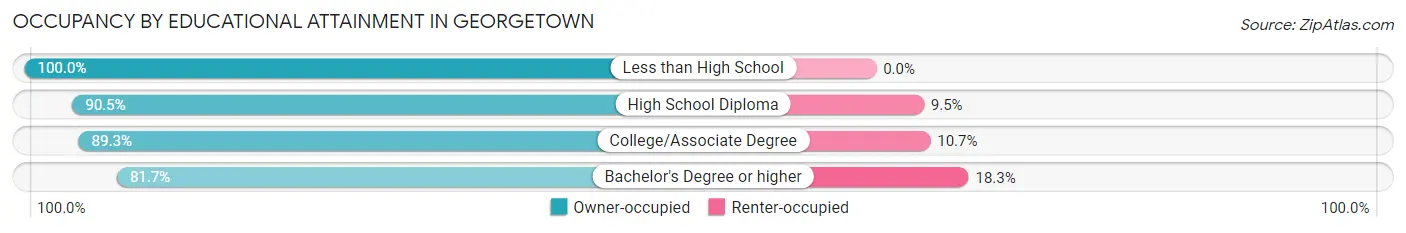
| Household Size | Owner-occupied | Renter-occupied |
| Less than High School | 8 (100.0%) | 0 (0.0%) |
| High School Diploma | 287 (90.5%) | 30 (9.5%) |
| College/Associate Degree | 466 (89.3%) | 56 (10.7%) |
| Bachelor's Degree or higher | 263 (81.7%) | 59 (18.3%) |
Occupancy by Age of Householder in Georgetown
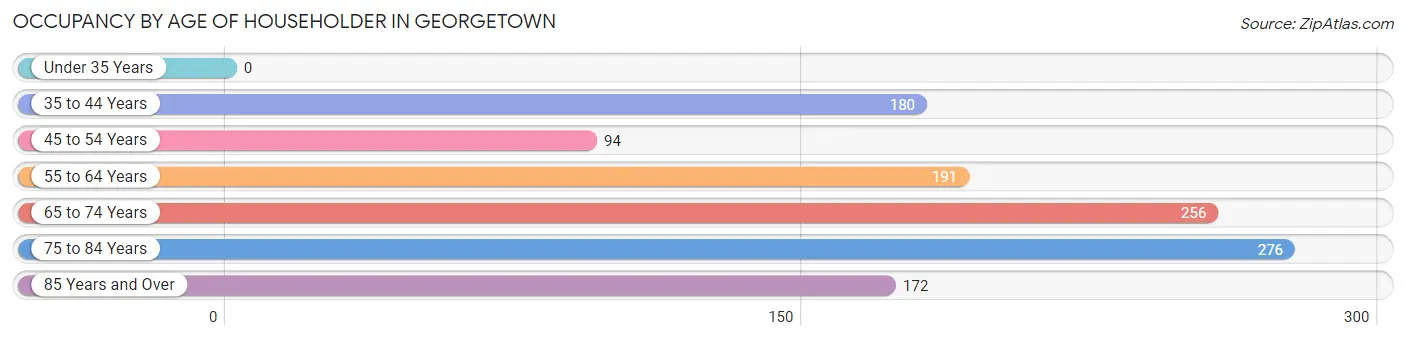
| Age Bracket | # Households | % Households |
| Under 35 Years | 0 | 0.0% |
| 35 to 44 Years | 180 | 15.4% |
| 45 to 54 Years | 94 | 8.0% |
| 55 to 64 Years | 191 | 16.3% |
| 65 to 74 Years | 256 | 21.9% |
| 75 to 84 Years | 276 | 23.6% |
| 85 Years and Over | 172 | 14.7% |
| Total | 1,169 | 100.0% |
Housing Finances in Georgetown
Median Income by Occupancy in Georgetown
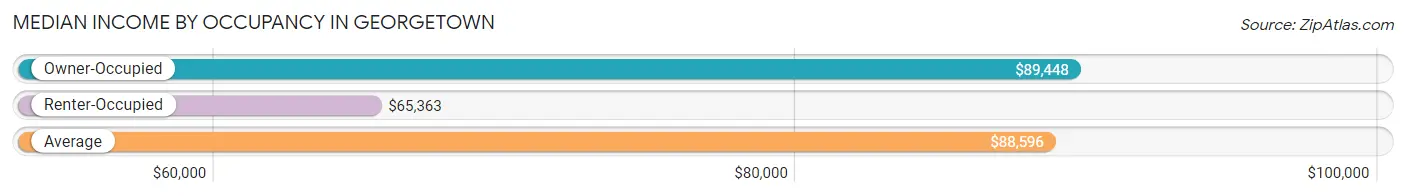
| Occupancy Type | # Households | Median Income |
| Owner-Occupied | 1,024 (87.6%) | $89,448 |
| Renter-Occupied | 145 (12.4%) | $65,363 |
| Average | 1,169 (100.0%) | $88,596 |
Occupancy by Householder Income Bracket in Georgetown
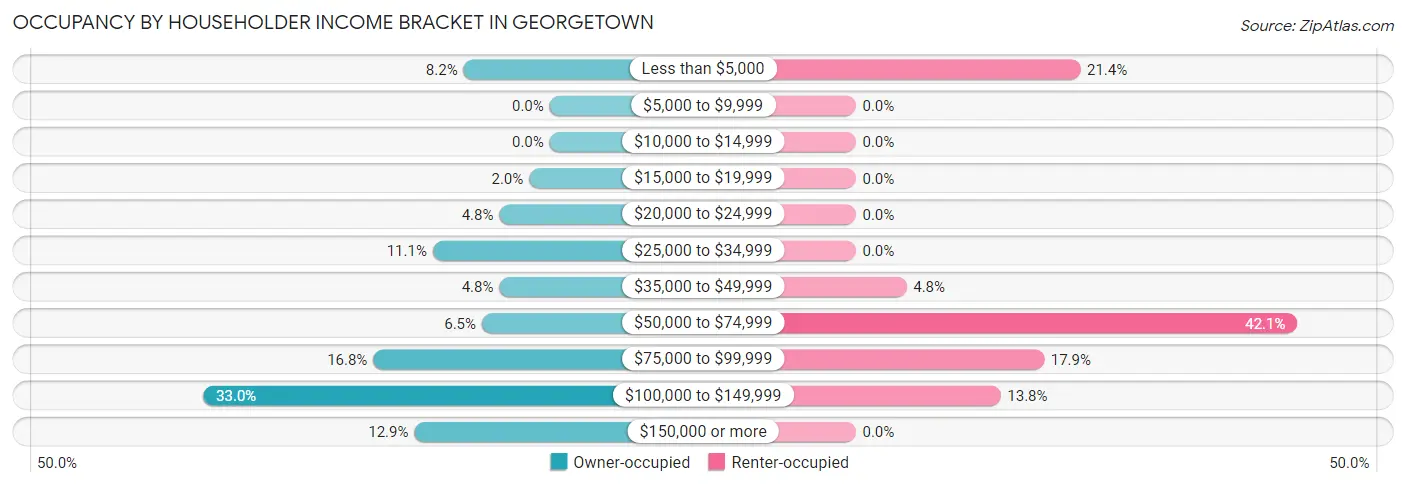
| Income Bracket | Owner-occupied | Renter-occupied |
| Less than $5,000 | 84 (8.2%) | 31 (21.4%) |
| $5,000 to $9,999 | 0 (0.0%) | 0 (0.0%) |
| $10,000 to $14,999 | 0 (0.0%) | 0 (0.0%) |
| $15,000 to $19,999 | 20 (1.9%) | 0 (0.0%) |
| $20,000 to $24,999 | 49 (4.8%) | 0 (0.0%) |
| $25,000 to $34,999 | 114 (11.1%) | 0 (0.0%) |
| $35,000 to $49,999 | 49 (4.8%) | 7 (4.8%) |
| $50,000 to $74,999 | 66 (6.5%) | 61 (42.1%) |
| $75,000 to $99,999 | 172 (16.8%) | 26 (17.9%) |
| $100,000 to $149,999 | 338 (33.0%) | 20 (13.8%) |
| $150,000 or more | 132 (12.9%) | 0 (0.0%) |
| Total | 1,024 (100.0%) | 145 (100.0%) |
Monthly Housing Cost Tiers in Georgetown
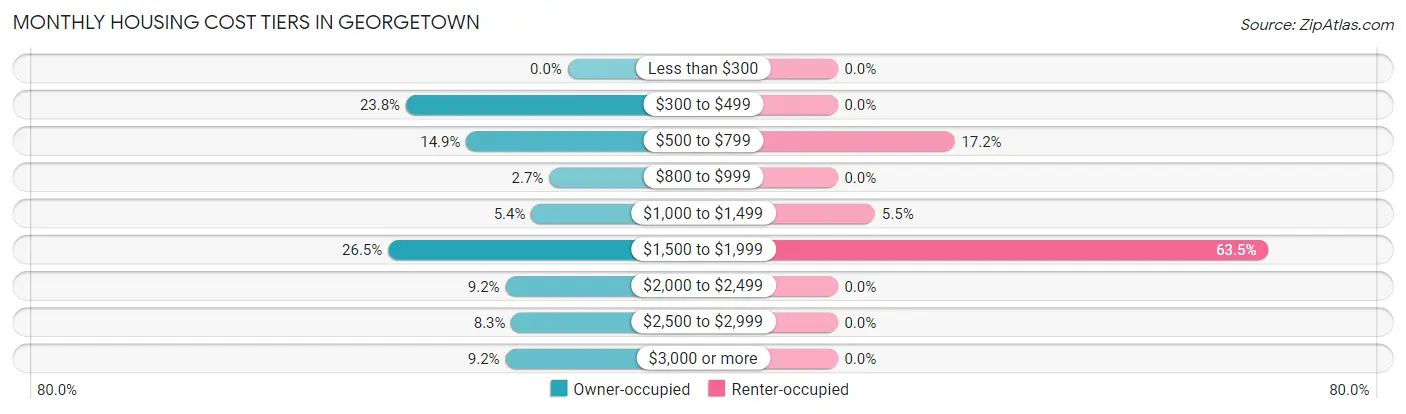
| Monthly Cost | Owner-occupied | Renter-occupied |
| Less than $300 | 0 (0.0%) | 0 (0.0%) |
| $300 to $499 | 244 (23.8%) | 0 (0.0%) |
| $500 to $799 | 153 (14.9%) | 25 (17.2%) |
| $800 to $999 | 28 (2.7%) | 0 (0.0%) |
| $1,000 to $1,499 | 55 (5.4%) | 8 (5.5%) |
| $1,500 to $1,999 | 271 (26.5%) | 92 (63.4%) |
| $2,000 to $2,499 | 94 (9.2%) | 0 (0.0%) |
| $2,500 to $2,999 | 85 (8.3%) | 0 (0.0%) |
| $3,000 or more | 94 (9.2%) | 0 (0.0%) |
| Total | 1,024 (100.0%) | 145 (100.0%) |
Physical Housing Characteristics in Georgetown
Housing Structures in Georgetown
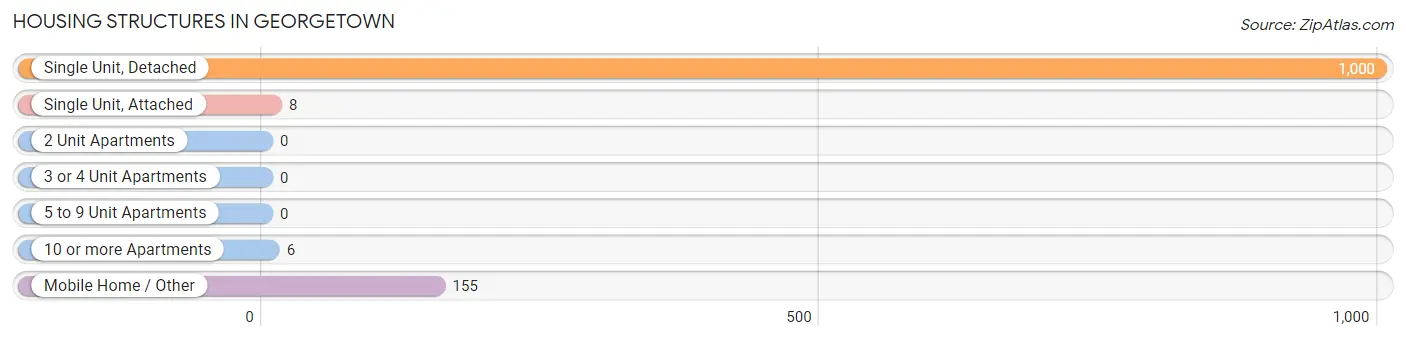
| Structure Type | # Housing Units | % Housing Units |
| Single Unit, Detached | 1,000 | 85.5% |
| Single Unit, Attached | 8 | 0.7% |
| 2 Unit Apartments | 0 | 0.0% |
| 3 or 4 Unit Apartments | 0 | 0.0% |
| 5 to 9 Unit Apartments | 0 | 0.0% |
| 10 or more Apartments | 6 | 0.5% |
| Mobile Home / Other | 155 | 13.3% |
| Total | 1,169 | 100.0% |
Housing Structures by Occupancy in Georgetown
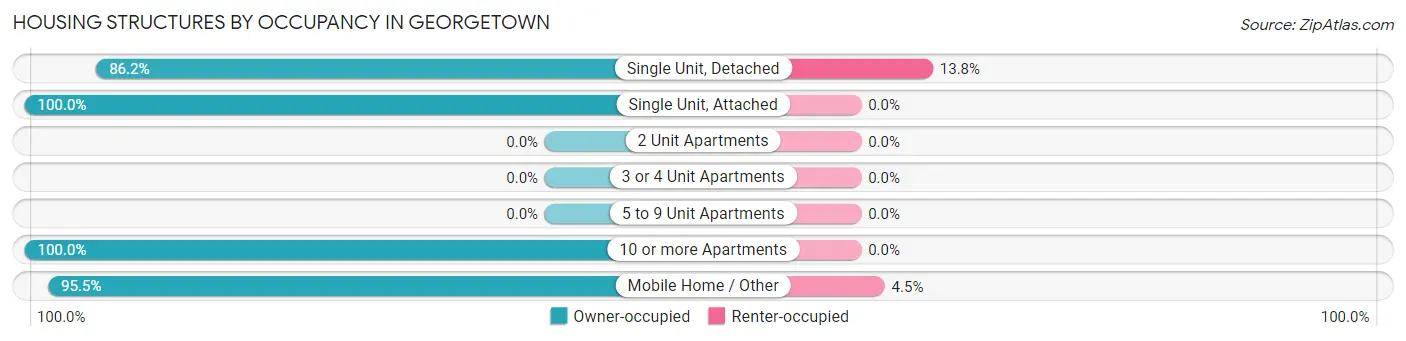
| Structure Type | Owner-occupied | Renter-occupied |
| Single Unit, Detached | 862 (86.2%) | 138 (13.8%) |
| Single Unit, Attached | 8 (100.0%) | 0 (0.0%) |
| 2 Unit Apartments | 0 (0.0%) | 0 (0.0%) |
| 3 or 4 Unit Apartments | 0 (0.0%) | 0 (0.0%) |
| 5 to 9 Unit Apartments | 0 (0.0%) | 0 (0.0%) |
| 10 or more Apartments | 6 (100.0%) | 0 (0.0%) |
| Mobile Home / Other | 148 (95.5%) | 7 (4.5%) |
| Total | 1,024 (87.6%) | 145 (12.4%) |
Housing Structures by Number of Rooms in Georgetown
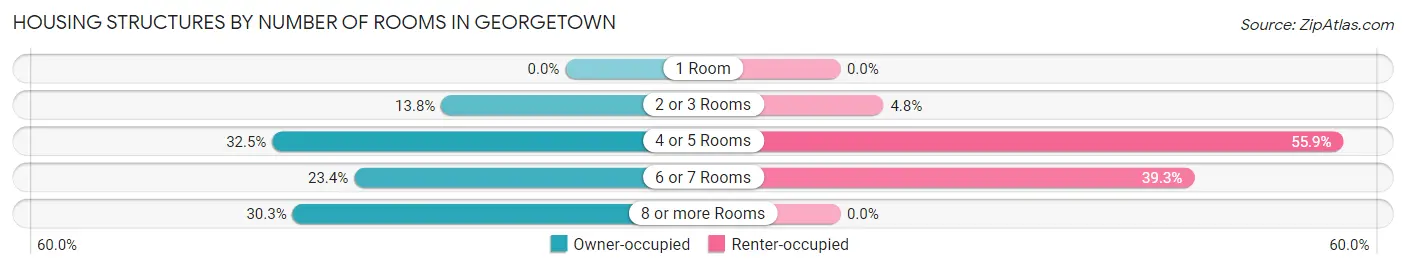
| Number of Rooms | Owner-occupied | Renter-occupied |
| 1 Room | 0 (0.0%) | 0 (0.0%) |
| 2 or 3 Rooms | 141 (13.8%) | 7 (4.8%) |
| 4 or 5 Rooms | 333 (32.5%) | 81 (55.9%) |
| 6 or 7 Rooms | 240 (23.4%) | 57 (39.3%) |
| 8 or more Rooms | 310 (30.3%) | 0 (0.0%) |
| Total | 1,024 (100.0%) | 145 (100.0%) |
Housing Structure by Heating Type in Georgetown
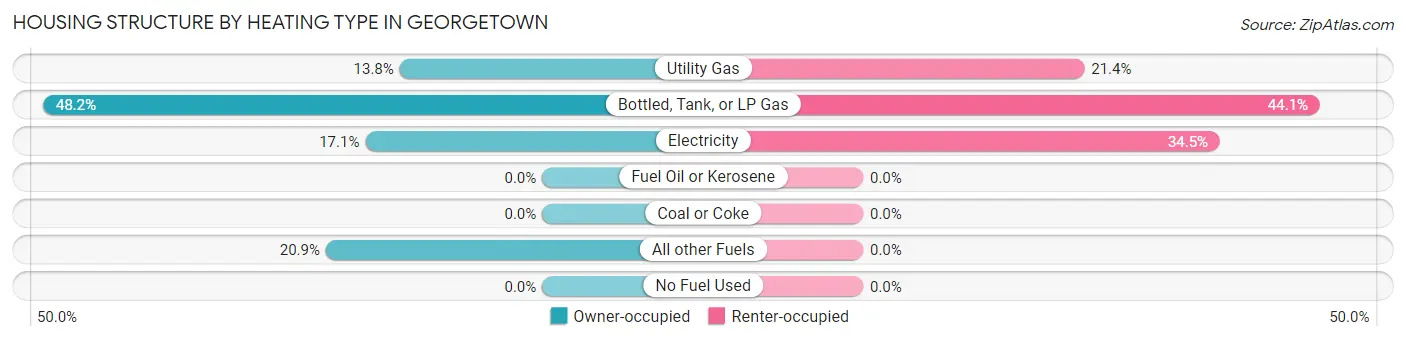
| Heating Type | Owner-occupied | Renter-occupied |
| Utility Gas | 141 (13.8%) | 31 (21.4%) |
| Bottled, Tank, or LP Gas | 494 (48.2%) | 64 (44.1%) |
| Electricity | 175 (17.1%) | 50 (34.5%) |
| Fuel Oil or Kerosene | 0 (0.0%) | 0 (0.0%) |
| Coal or Coke | 0 (0.0%) | 0 (0.0%) |
| All other Fuels | 214 (20.9%) | 0 (0.0%) |
| No Fuel Used | 0 (0.0%) | 0 (0.0%) |
| Total | 1,024 (100.0%) | 145 (100.0%) |
Household Vehicle Usage in Georgetown
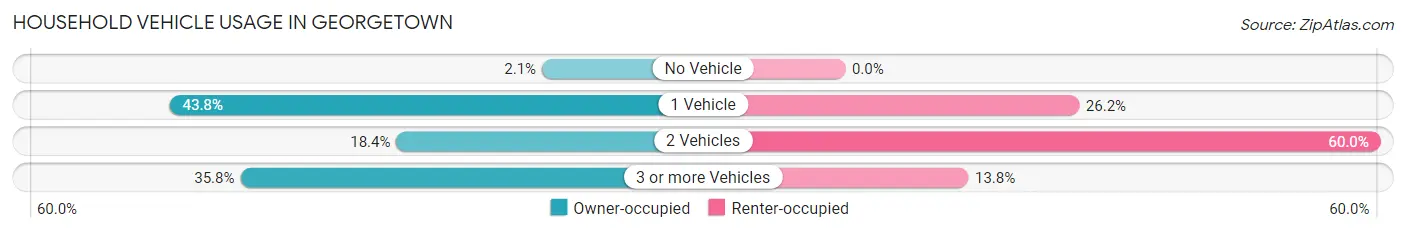
| Vehicles per Household | Owner-occupied | Renter-occupied |
| No Vehicle | 21 (2.1%) | 0 (0.0%) |
| 1 Vehicle | 448 (43.8%) | 38 (26.2%) |
| 2 Vehicles | 188 (18.4%) | 87 (60.0%) |
| 3 or more Vehicles | 367 (35.8%) | 20 (13.8%) |
| Total | 1,024 (100.0%) | 145 (100.0%) |
Real Estate & Mortgages in Georgetown
Real Estate and Mortgage Overview in Georgetown
| Characteristic | Without Mortgage | With Mortgage |
| Housing Units | 449 | 575 |
| Median Property Value | - | - |
| Median Household Income | - | - |
| Monthly Housing Costs | $407 | $66 |
| Real Estate Taxes | $901 | $16 |
Property Value by Mortgage Status in Georgetown
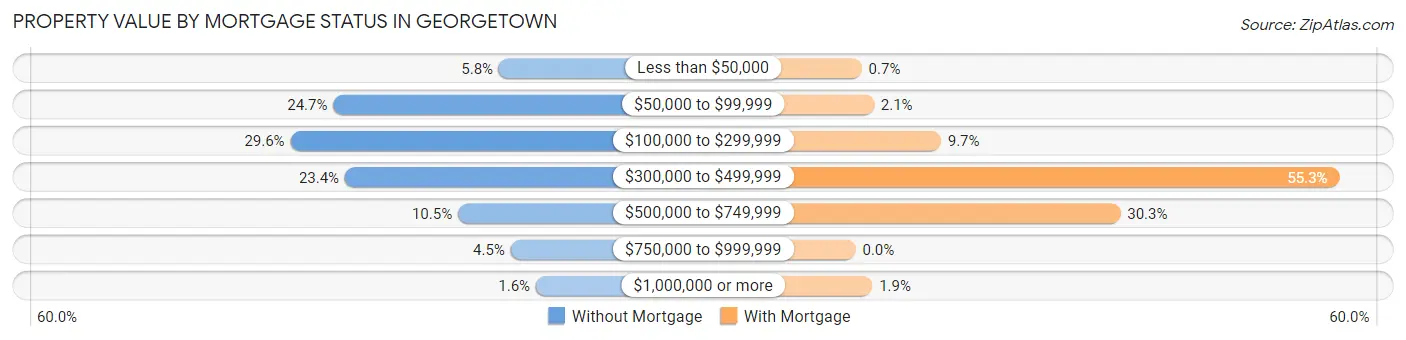
| Property Value | Without Mortgage | With Mortgage |
| Less than $50,000 | 26 (5.8%) | 4 (0.7%) |
| $50,000 to $99,999 | 111 (24.7%) | 12 (2.1%) |
| $100,000 to $299,999 | 133 (29.6%) | 56 (9.7%) |
| $300,000 to $499,999 | 105 (23.4%) | 318 (55.3%) |
| $500,000 to $749,999 | 47 (10.5%) | 174 (30.3%) |
| $750,000 to $999,999 | 20 (4.4%) | 0 (0.0%) |
| $1,000,000 or more | 7 (1.6%) | 11 (1.9%) |
| Total | 449 (100.0%) | 575 (100.0%) |
Household Income by Mortgage Status in Georgetown
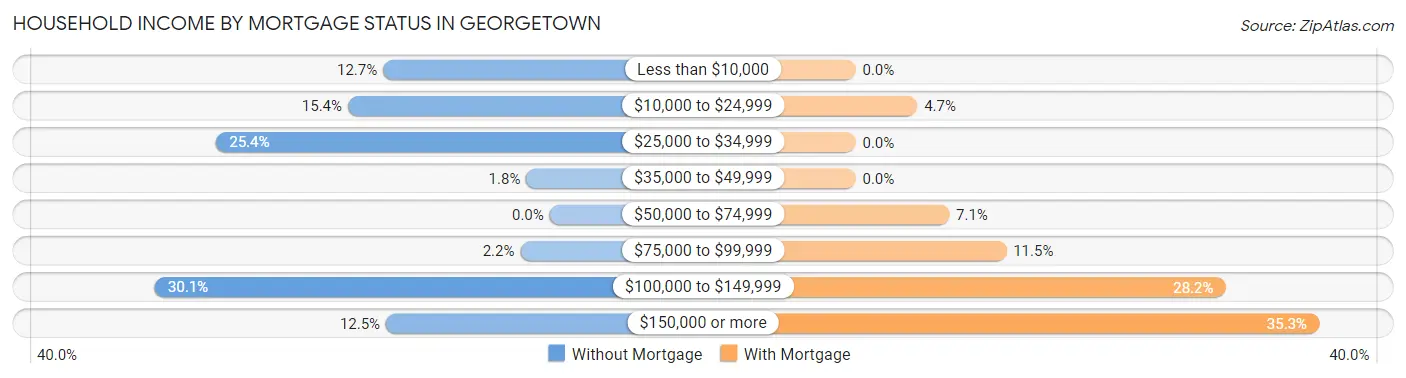
| Household Income | Without Mortgage | With Mortgage |
| Less than $10,000 | 57 (12.7%) | 0 (0.0%) |
| $10,000 to $24,999 | 69 (15.4%) | 27 (4.7%) |
| $25,000 to $34,999 | 114 (25.4%) | 0 (0.0%) |
| $35,000 to $49,999 | 8 (1.8%) | 0 (0.0%) |
| $50,000 to $74,999 | 0 (0.0%) | 41 (7.1%) |
| $75,000 to $99,999 | 10 (2.2%) | 66 (11.5%) |
| $100,000 to $149,999 | 135 (30.1%) | 162 (28.2%) |
| $150,000 or more | 56 (12.5%) | 203 (35.3%) |
| Total | 449 (100.0%) | 575 (100.0%) |
Property Value to Household Income Ratio in Georgetown
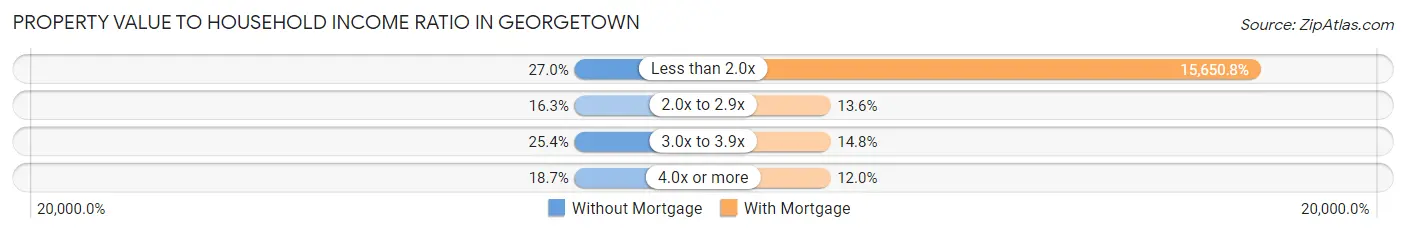
| Value-to-Income Ratio | Without Mortgage | With Mortgage |
| Less than 2.0x | 121 (27.0%) | 89,992 (15,650.8%) |
| 2.0x to 2.9x | 73 (16.3%) | 78 (13.6%) |
| 3.0x to 3.9x | 114 (25.4%) | 85 (14.8%) |
| 4.0x or more | 84 (18.7%) | 69 (12.0%) |
| Total | 449 (100.0%) | 575 (100.0%) |
Real Estate Taxes by Mortgage Status in Georgetown
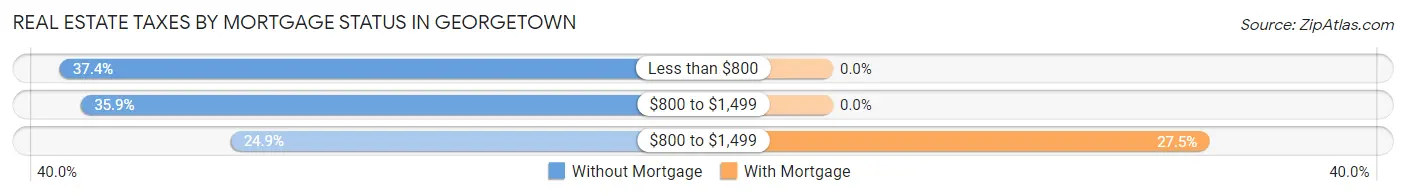
| Property Taxes | Without Mortgage | With Mortgage |
| Less than $800 | 168 (37.4%) | 0 (0.0%) |
| $800 to $1,499 | 161 (35.9%) | 0 (0.0%) |
| $800 to $1,499 | 112 (24.9%) | 158 (27.5%) |
| Total | 449 (100.0%) | 575 (100.0%) |
Health & Disability in Georgetown
Health Insurance Coverage by Age in Georgetown
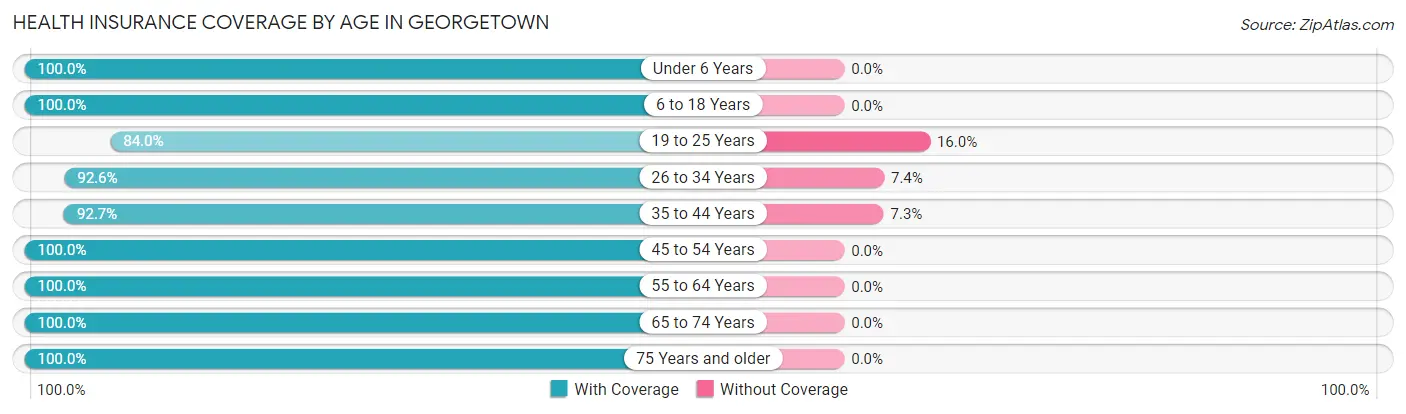
| Age Bracket | With Coverage | Without Coverage |
| Under 6 Years | 131 (100.0%) | 0 (0.0%) |
| 6 to 18 Years | 263 (100.0%) | 0 (0.0%) |
| 19 to 25 Years | 142 (84.0%) | 27 (16.0%) |
| 26 to 34 Years | 25 (92.6%) | 2 (7.4%) |
| 35 to 44 Years | 278 (92.7%) | 22 (7.3%) |
| 45 to 54 Years | 152 (100.0%) | 0 (0.0%) |
| 55 to 64 Years | 404 (100.0%) | 0 (0.0%) |
| 65 to 74 Years | 493 (100.0%) | 0 (0.0%) |
| 75 Years and older | 518 (100.0%) | 0 (0.0%) |
| Total | 2,406 (97.9%) | 51 (2.1%) |
Health Insurance Coverage by Citizenship Status in Georgetown
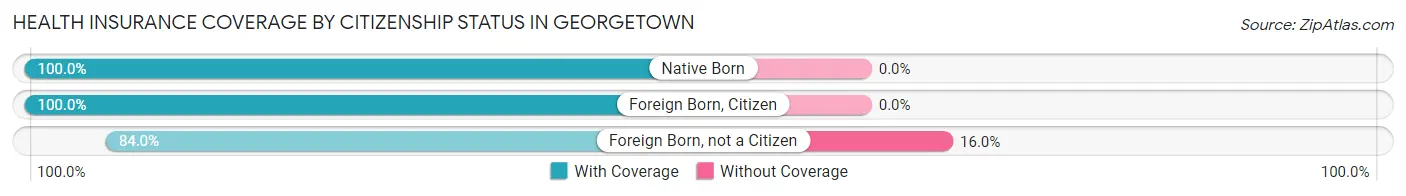
| Citizenship Status | With Coverage | Without Coverage |
| Native Born | 131 (100.0%) | 0 (0.0%) |
| Foreign Born, Citizen | 263 (100.0%) | 0 (0.0%) |
| Foreign Born, not a Citizen | 142 (84.0%) | 27 (16.0%) |
Health Insurance Coverage by Household Income in Georgetown
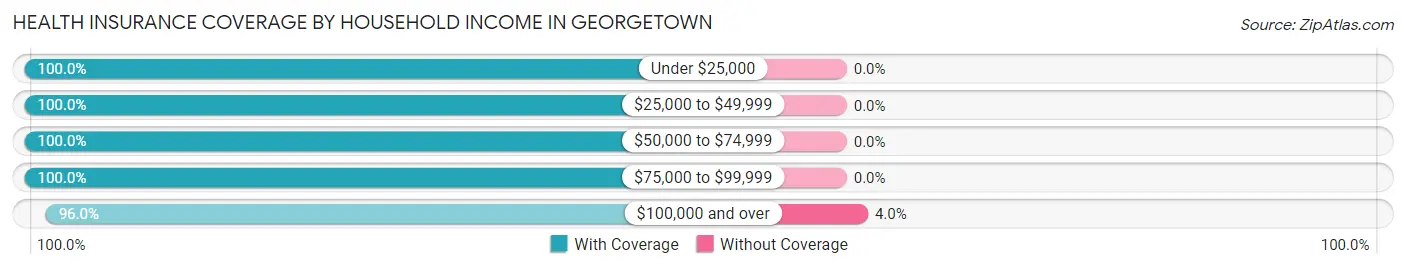
| Household Income | With Coverage | Without Coverage |
| Under $25,000 | 184 (100.0%) | 0 (0.0%) |
| $25,000 to $49,999 | 255 (100.0%) | 0 (0.0%) |
| $50,000 to $74,999 | 341 (100.0%) | 0 (0.0%) |
| $75,000 to $99,999 | 400 (100.0%) | 0 (0.0%) |
| $100,000 and over | 1,189 (96.0%) | 49 (4.0%) |
Public vs Private Health Insurance Coverage by Age in Georgetown
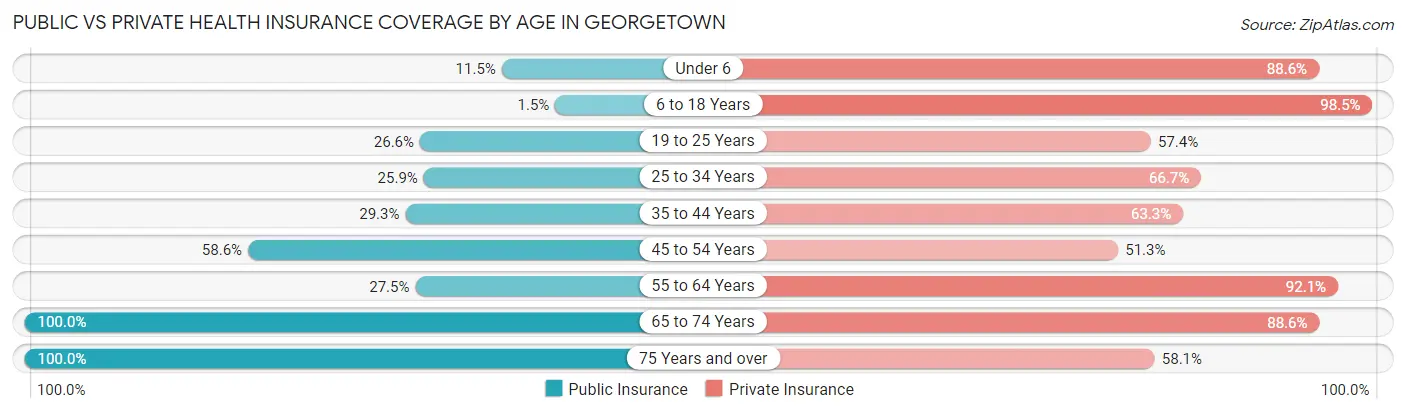
| Age Bracket | Public Insurance | Private Insurance |
| Under 6 | 15 (11.5%) | 116 (88.5%) |
| 6 to 18 Years | 4 (1.5%) | 259 (98.5%) |
| 19 to 25 Years | 45 (26.6%) | 97 (57.4%) |
| 25 to 34 Years | 7 (25.9%) | 18 (66.7%) |
| 35 to 44 Years | 88 (29.3%) | 190 (63.3%) |
| 45 to 54 Years | 89 (58.6%) | 78 (51.3%) |
| 55 to 64 Years | 111 (27.5%) | 372 (92.1%) |
| 65 to 74 Years | 493 (100.0%) | 437 (88.6%) |
| 75 Years and over | 518 (100.0%) | 301 (58.1%) |
| Total | 1,370 (55.8%) | 1,868 (76.0%) |
Disability Status by Sex by Age in Georgetown
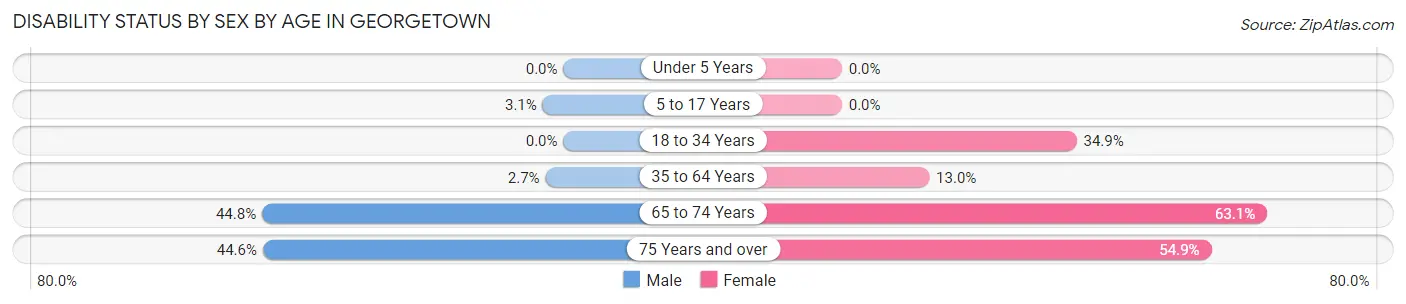
| Age Bracket | Male | Female |
| Under 5 Years | 0 (0.0%) | 0 (0.0%) |
| 5 to 17 Years | 4 (3.1%) | 0 (0.0%) |
| 18 to 34 Years | 0 (0.0%) | 38 (34.9%) |
| 35 to 64 Years | 8 (2.7%) | 72 (13.0%) |
| 65 to 74 Years | 98 (44.8%) | 173 (63.1%) |
| 75 Years and over | 158 (44.6%) | 90 (54.9%) |
Disability Class by Sex by Age in Georgetown
Disability Class: Hearing Difficulty
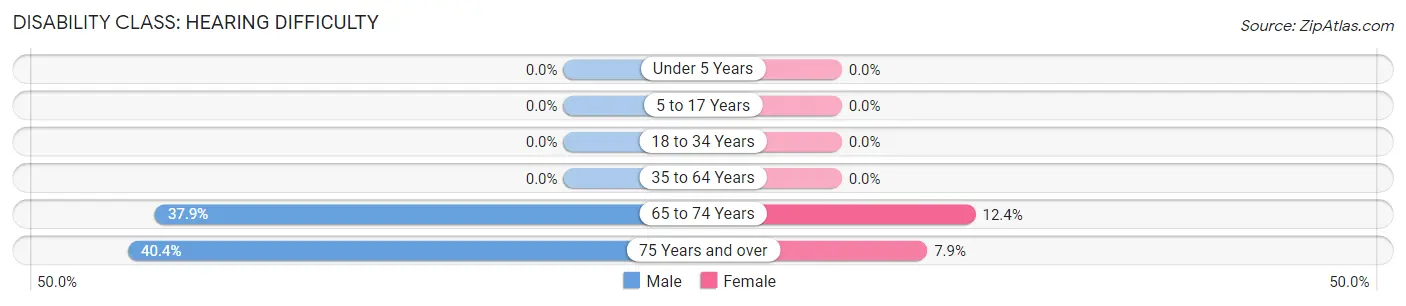
| Age Bracket | Male | Female |
| Under 5 Years | 0 (0.0%) | 0 (0.0%) |
| 5 to 17 Years | 0 (0.0%) | 0 (0.0%) |
| 18 to 34 Years | 0 (0.0%) | 0 (0.0%) |
| 35 to 64 Years | 0 (0.0%) | 0 (0.0%) |
| 65 to 74 Years | 83 (37.9%) | 34 (12.4%) |
| 75 Years and over | 143 (40.4%) | 13 (7.9%) |
Disability Class: Vision Difficulty
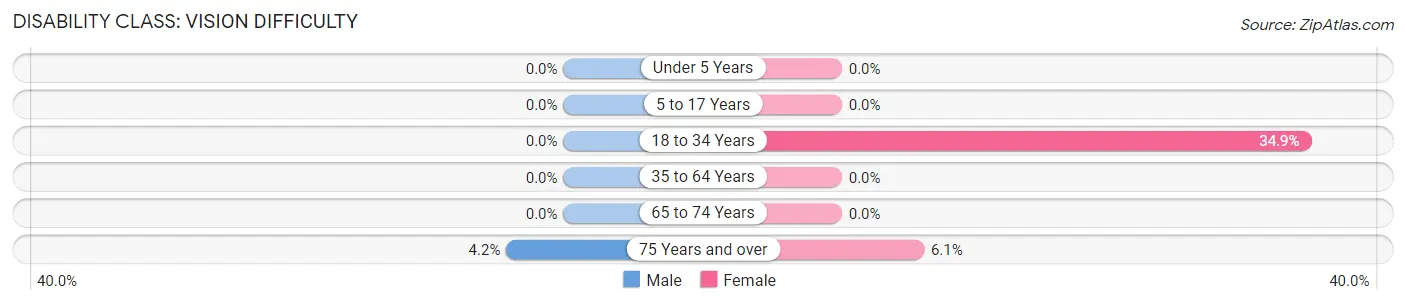
| Age Bracket | Male | Female |
| Under 5 Years | 0 (0.0%) | 0 (0.0%) |
| 5 to 17 Years | 0 (0.0%) | 0 (0.0%) |
| 18 to 34 Years | 0 (0.0%) | 38 (34.9%) |
| 35 to 64 Years | 0 (0.0%) | 0 (0.0%) |
| 65 to 74 Years | 0 (0.0%) | 0 (0.0%) |
| 75 Years and over | 15 (4.2%) | 10 (6.1%) |
Disability Class: Cognitive Difficulty
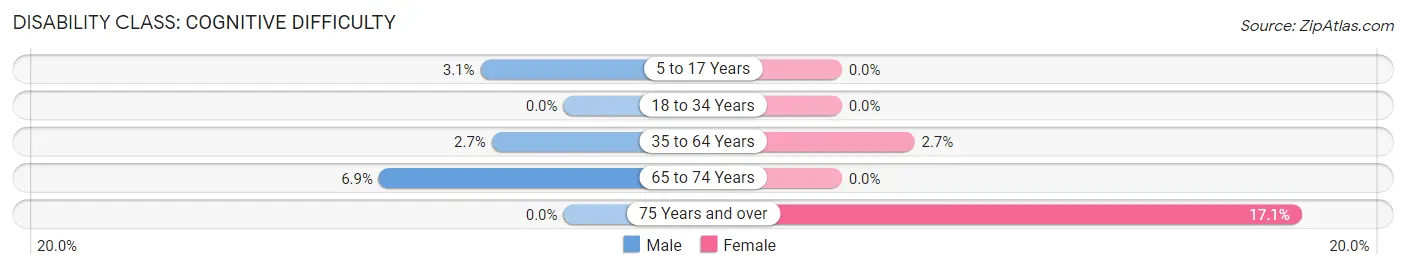
| Age Bracket | Male | Female |
| 5 to 17 Years | 4 (3.1%) | 0 (0.0%) |
| 18 to 34 Years | 0 (0.0%) | 0 (0.0%) |
| 35 to 64 Years | 8 (2.7%) | 15 (2.7%) |
| 65 to 74 Years | 15 (6.9%) | 0 (0.0%) |
| 75 Years and over | 0 (0.0%) | 28 (17.1%) |
Disability Class: Ambulatory Difficulty
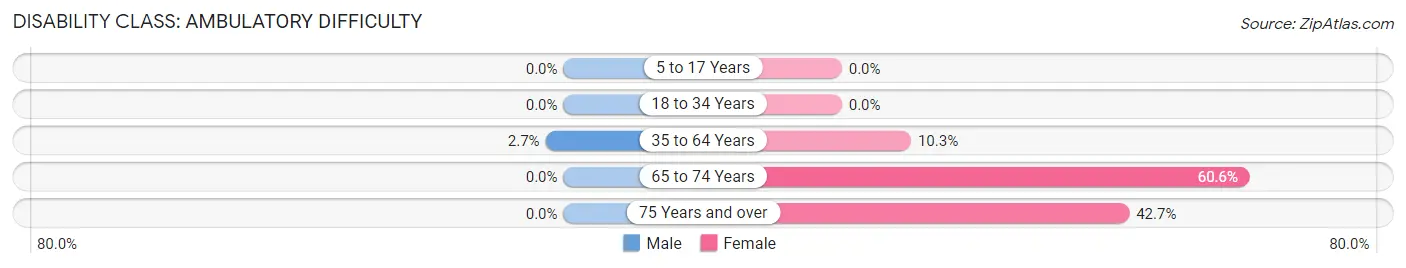
| Age Bracket | Male | Female |
| 5 to 17 Years | 0 (0.0%) | 0 (0.0%) |
| 18 to 34 Years | 0 (0.0%) | 0 (0.0%) |
| 35 to 64 Years | 8 (2.7%) | 57 (10.3%) |
| 65 to 74 Years | 0 (0.0%) | 166 (60.6%) |
| 75 Years and over | 0 (0.0%) | 70 (42.7%) |
Disability Class: Self-Care Difficulty
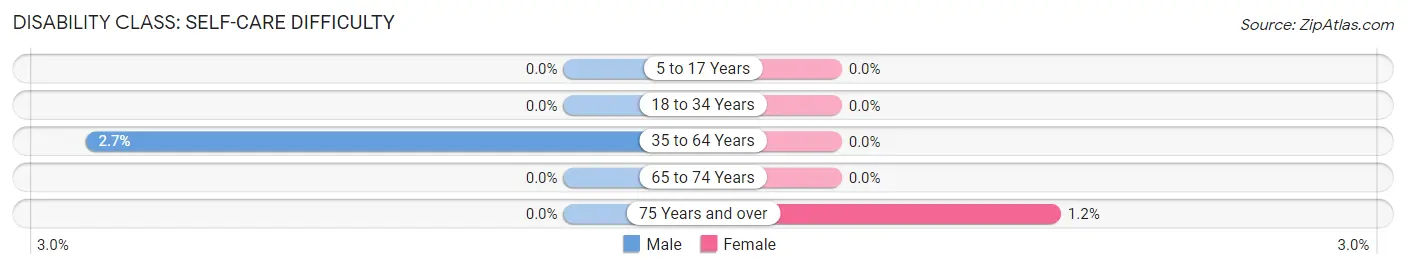
| Age Bracket | Male | Female |
| 5 to 17 Years | 0 (0.0%) | 0 (0.0%) |
| 18 to 34 Years | 0 (0.0%) | 0 (0.0%) |
| 35 to 64 Years | 8 (2.7%) | 0 (0.0%) |
| 65 to 74 Years | 0 (0.0%) | 0 (0.0%) |
| 75 Years and over | 0 (0.0%) | 2 (1.2%) |
Technology Access in Georgetown
Computing Device Access in Georgetown
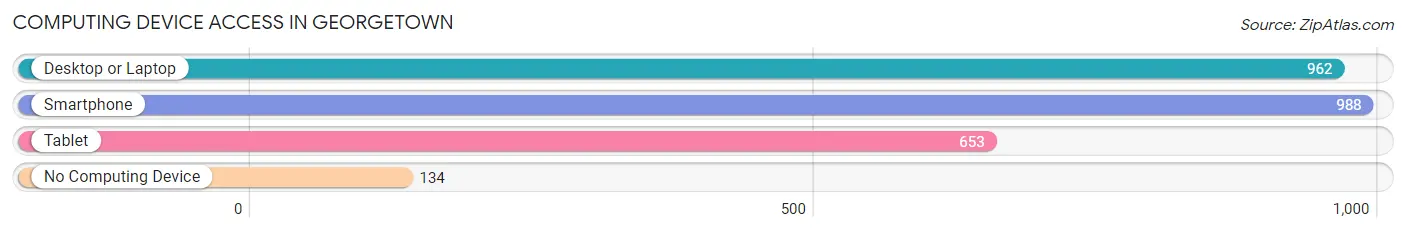
| Device Type | # Households | % Households |
| Desktop or Laptop | 962 | 82.3% |
| Smartphone | 988 | 84.5% |
| Tablet | 653 | 55.9% |
| No Computing Device | 134 | 11.5% |
| Total | 1,169 | 100.0% |
Internet Access in Georgetown
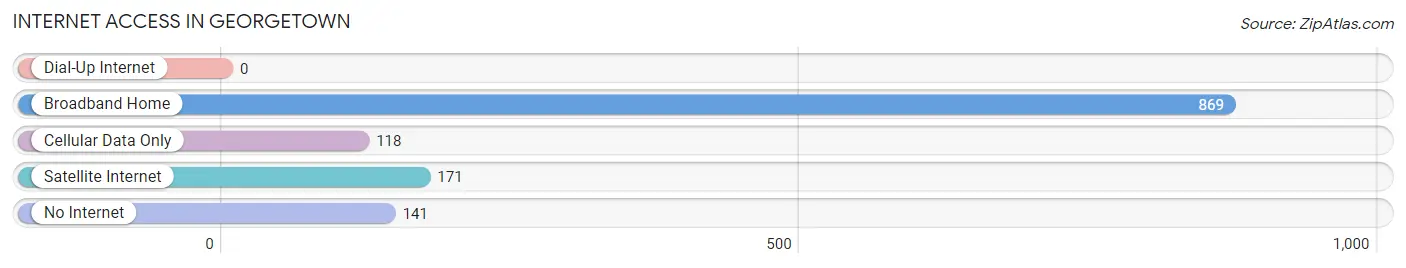
| Internet Type | # Households | % Households |
| Dial-Up Internet | 0 | 0.0% |
| Broadband Home | 869 | 74.3% |
| Cellular Data Only | 118 | 10.1% |
| Satellite Internet | 171 | 14.6% |
| No Internet | 141 | 12.1% |
| Total | 1,169 | 100.0% |
Georgetown Summary
Georgetown is a small, unincorporated community located in El Dorado County, California. It is situated in the Sierra Nevada foothills, approximately 40 miles east of Sacramento and 30 miles west of South Lake Tahoe. The town is located at an elevation of 2,500 feet and is surrounded by the Eldorado National Forest.
History
Georgetown was founded in 1849 by a group of miners who were searching for gold. The town was named after George Phipps, a miner who discovered gold in the area. The town quickly grew and by 1852, it had a population of over 1,000 people. Georgetown was the largest town in El Dorado County at the time and was the center of commerce for the region.
The town was home to several businesses, including a hotel, saloon, blacksmith shop, and a post office. In 1853, the first school in the county was established in Georgetown. The town also had a newspaper, the Georgetown Gazette, which was published from 1854 to 1856.
Georgetown was a major stop on the stagecoach route between Placerville and Sacramento. The town was also a popular destination for tourists who wanted to experience the beauty of the Sierra Nevada.
Geography
Georgetown is located in the Sierra Nevada foothills, approximately 40 miles east of Sacramento and 30 miles west of South Lake Tahoe. The town is situated at an elevation of 2,500 feet and is surrounded by the Eldorado National Forest.
The town is located in a valley surrounded by the Sierra Nevada Mountains. The area is known for its beautiful scenery and is a popular destination for outdoor activities such as hiking, camping, and fishing.
Economy
Georgetown’s economy is largely based on tourism. The town is a popular destination for outdoor activities such as hiking, camping, and fishing. The town is also home to several wineries and is a popular destination for wine tasting.
The town is also home to several small businesses, including restaurants, shops, and lodging. The town is also home to a small airport, which is used for private planes and helicopters.
Demographics
As of the 2010 census, the population of Georgetown was 1,335. The town is predominantly white, with 87.3% of the population identifying as white. The town also has a small Hispanic population, with 8.3% of the population identifying as Hispanic or Latino.
The median household income in Georgetown is $50,000, which is slightly higher than the national average. The median home value in the town is $310,000, which is significantly higher than the national average.
Conclusion
Georgetown is a small, unincorporated community located in El Dorado County, California. It is situated in the Sierra Nevada foothills, approximately 40 miles east of Sacramento and 30 miles west of South Lake Tahoe. The town is known for its beautiful scenery and is a popular destination for outdoor activities such as hiking, camping, and fishing. The town’s economy is largely based on tourism and the town is home to several small businesses. The population of Georgetown is predominantly white, with 87.3% of the population identifying as white. The median household income in Georgetown is $50,000, which is slightly higher than the national average.
Common Questions
What is Per Capita Income in Georgetown?
Per Capita income in Georgetown is $46,337.
What is the Median Family Income in Georgetown?
Median Family Income in Georgetown is $115,563.
What is the Median Household income in Georgetown?
Median Household Income in Georgetown is $88,596.
What is Income or Wage Gap in Georgetown?
Income or Wage Gap in Georgetown is 29.6%.
Women in Georgetown earn 70.4 cents for every dollar earned by a man.
What is Inequality or Gini Index in Georgetown?
Inequality or Gini Index in Georgetown is 0.42.
What is the Total Population of Georgetown?
Total Population of Georgetown is 2,546.
What is the Total Male Population of Georgetown?
Total Male Population of Georgetown is 1,289.
What is the Total Female Population of Georgetown?
Total Female Population of Georgetown is 1,257.
What is the Ratio of Males per 100 Females in Georgetown?
There are 102.55 Males per 100 Females in Georgetown.
What is the Ratio of Females per 100 Males in Georgetown?
There are 97.52 Females per 100 Males in Georgetown.
What is the Median Population Age in Georgetown?
Median Population Age in Georgetown is 61.5 Years.
What is the Average Family Size in Georgetown
Average Family Size in Georgetown is 2.8 People.
What is the Average Household Size in Georgetown
Average Household Size in Georgetown is 2.1 People.
How Large is the Labor Force in Georgetown?
There are 840 People in the Labor Forcein in Georgetown.
What is the Percentage of People in the Labor Force in Georgetown?
37.7% of People are in the Labor Force in Georgetown.
What is the Unemployment Rate in Georgetown?
Unemployment Rate in Georgetown is 18.1%.