Garey, CA Map & Demographics
Garey Map
Garey Overview
$52,546
PER CAPITA INCOME
$107,917
AVG FAMILY INCOME
$97,083
AVG HOUSEHOLD INCOME
0.25
INEQUALITY / GINI INDEX
52
TOTAL POPULATION
22
MALE POPULATION
30
FEMALE POPULATION
73.33
MALES / 100 FEMALES
136.36
FEMALES / 100 MALES
57.5
MEDIAN AGE
2.5
AVG FAMILY SIZE
2.1
AVG HOUSEHOLD SIZE
30
LABOR FORCE [ PEOPLE ]
57.7%
PERCENT IN LABOR FORCE
23.3%
UNEMPLOYMENT RATE
Income in Garey
Income Overview in Garey
Per Capita Income in Garey is $52,546, while median incomes of families and households are $107,917 and $97,083 respectively.
| Characteristic | Number | Measure |
| Per Capita Income | 52 | $52,546 |
| Median Family Income | 15 | $107,917 |
| Mean Family Income | 15 | $118,380 |
| Median Household Income | 25 | $97,083 |
| Mean Household Income | 25 | $110,400 |
| Income Deficit | 15 | $0 |
| Wage / Income Gap (%) | 52 | 0.00% |
| Wage / Income Gap ($) | 52 | 100.00¢ per $1 |
| Gini / Inequality Index | 52 | 0.25 |
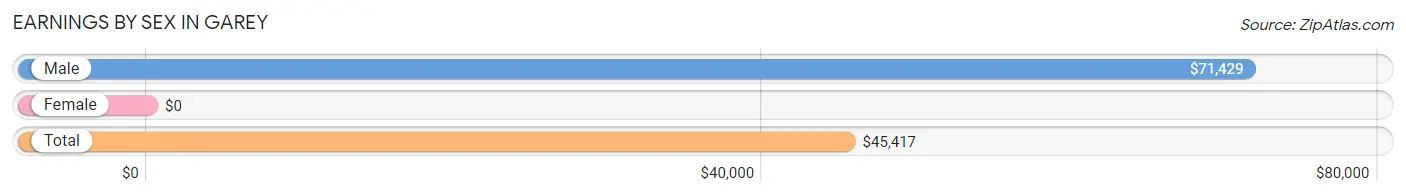
Earnings by Sex in Garey
| Sex | Number | Average Earnings |
| Male | 12 (44.4%) | $71,429 |
| Female | 15 (55.6%) | $0 |
| Total | 27 (100.0%) | $45,417 |
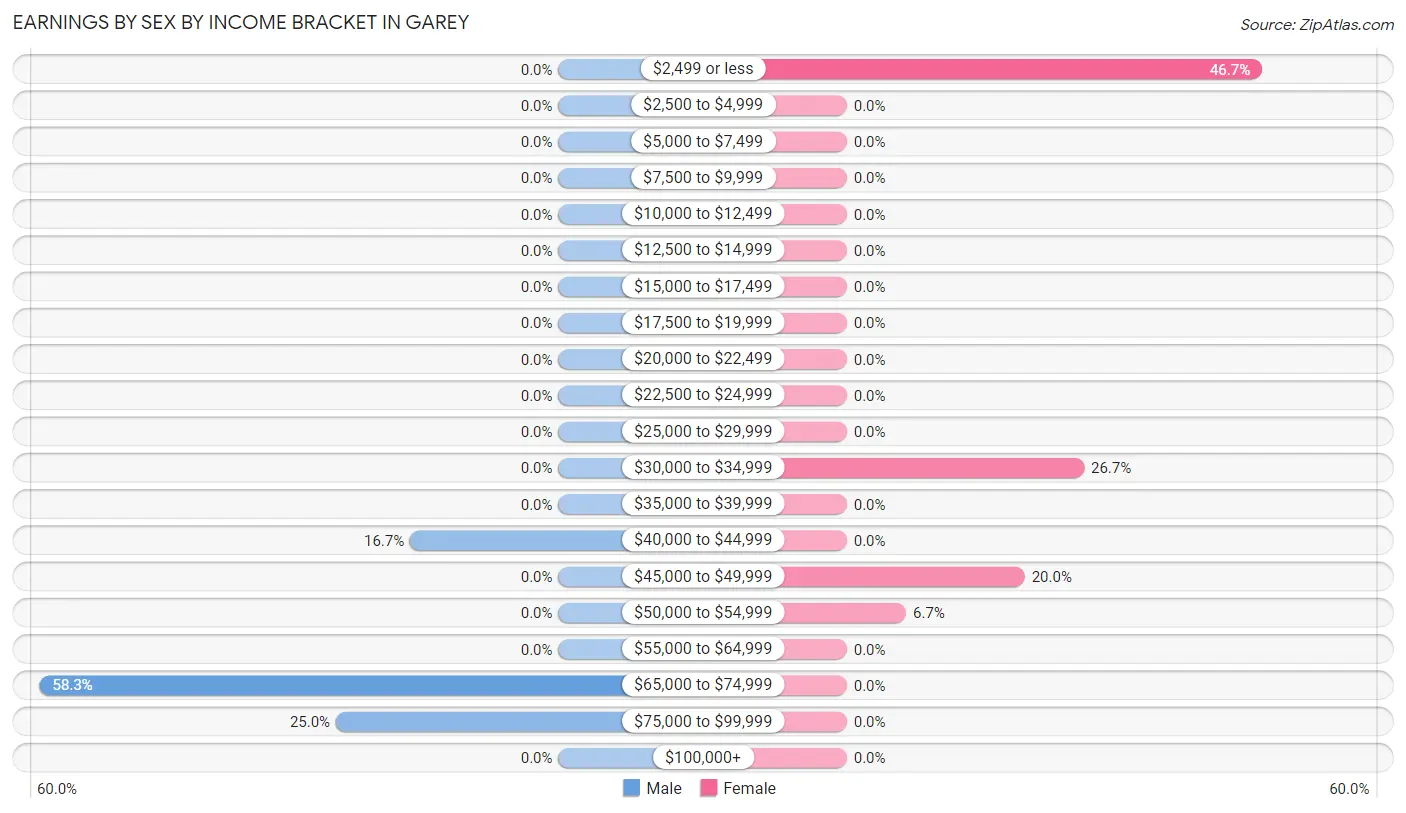
Earnings by Sex by Income Bracket in Garey
The most common earnings brackets in Garey are $65,000 to $74,999 for men (7 | 58.3%) and $2,499 or less for women (7 | 46.7%).
| Income | Male | Female |
| $2,499 or less | 0 (0.0%) | 7 (46.7%) |
| $2,500 to $4,999 | 0 (0.0%) | 0 (0.0%) |
| $5,000 to $7,499 | 0 (0.0%) | 0 (0.0%) |
| $7,500 to $9,999 | 0 (0.0%) | 0 (0.0%) |
| $10,000 to $12,499 | 0 (0.0%) | 0 (0.0%) |
| $12,500 to $14,999 | 0 (0.0%) | 0 (0.0%) |
| $15,000 to $17,499 | 0 (0.0%) | 0 (0.0%) |
| $17,500 to $19,999 | 0 (0.0%) | 0 (0.0%) |
| $20,000 to $22,499 | 0 (0.0%) | 0 (0.0%) |
| $22,500 to $24,999 | 0 (0.0%) | 0 (0.0%) |
| $25,000 to $29,999 | 0 (0.0%) | 0 (0.0%) |
| $30,000 to $34,999 | 0 (0.0%) | 4 (26.7%) |
| $35,000 to $39,999 | 0 (0.0%) | 0 (0.0%) |
| $40,000 to $44,999 | 2 (16.7%) | 0 (0.0%) |
| $45,000 to $49,999 | 0 (0.0%) | 3 (20.0%) |
| $50,000 to $54,999 | 0 (0.0%) | 1 (6.7%) |
| $55,000 to $64,999 | 0 (0.0%) | 0 (0.0%) |
| $65,000 to $74,999 | 7 (58.3%) | 0 (0.0%) |
| $75,000 to $99,999 | 3 (25.0%) | 0 (0.0%) |
| $100,000+ | 0 (0.0%) | 0 (0.0%) |
| Total | 12 (100.0%) | 15 (100.0%) |
Earnings by Sex by Educational Attainment in Garey
| Educational Attainment | Male Income | Female Income |
| Less than High School | - | - |
| High School Diploma | - | - |
| College or Associate's Degree | - | - |
| Bachelor's Degree | - | - |
| Graduate Degree | - | - |
| Total | $71,429 | $0 |
Family Income in Garey
Family Income Brackets in Garey
According to the Garey family income data, there are 4 families falling into the $35,000 to $49,999 income range, which is the most common income bracket and makes up 26.7% of all families.
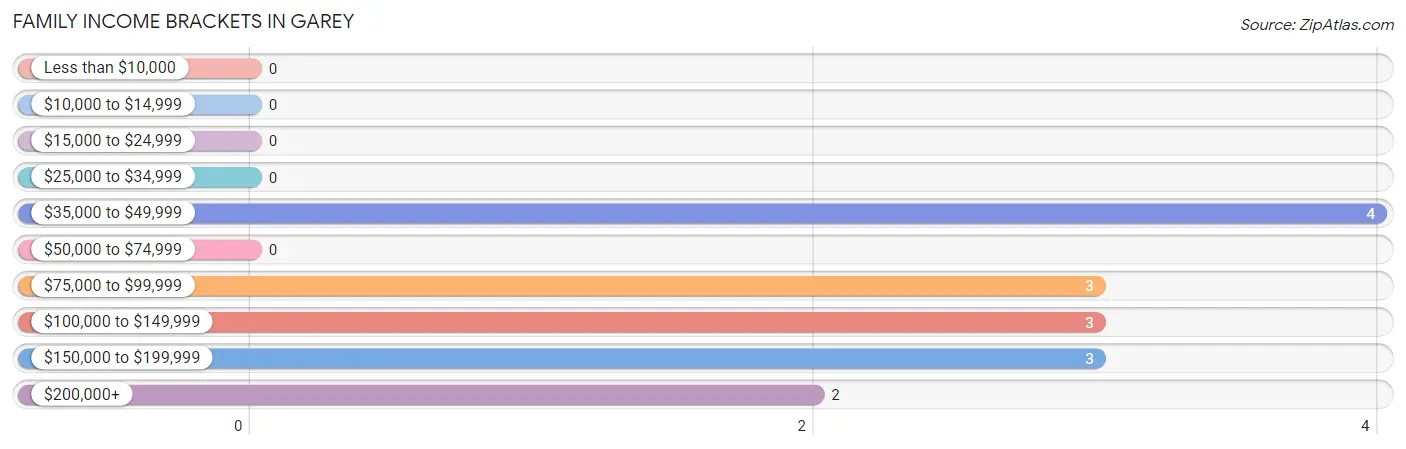
| Income Bracket | # Families | % Families |
| Less than $10,000 | 0 | 0.0% |
| $10,000 to $14,999 | 0 | 0.0% |
| $15,000 to $24,999 | 0 | 0.0% |
| $25,000 to $34,999 | 0 | 0.0% |
| $35,000 to $49,999 | 4 | 26.7% |
| $50,000 to $74,999 | 0 | 0.0% |
| $75,000 to $99,999 | 3 | 20.0% |
| $100,000 to $149,999 | 3 | 20.0% |
| $150,000 to $199,999 | 3 | 20.0% |
| $200,000+ | 2 | 13.3% |
Family Income by Famaliy Size in Garey
| Income Bracket | # Families | Median Income |
| 2-Person Families | 9 (60.0%) | $0 |
| 3-Person Families | 3 (20.0%) | $0 |
| 4-Person Families | 3 (20.0%) | $0 |
| 5-Person Families | 0 (0.0%) | $0 |
| 6-Person Families | 0 (0.0%) | $0 |
| 7+ Person Families | 0 (0.0%) | $0 |
| Total | 15 (100.0%) | $107,917 |
Family Income by Number of Earners in Garey
| Number of Earners | # Families | Median Income |
| No Earners | 5 (33.3%) | $0 |
| 1 Earner | 7 (46.7%) | $0 |
| 2 Earners | 3 (20.0%) | $0 |
| 3+ Earners | 0 (0.0%) | $0 |
| Total | 15 (100.0%) | $107,917 |
Household Income in Garey
Household Income Brackets in Garey
With 7 households falling in the category, the $50,000 to $74,999 income range is the most frequent in Garey, accounting for 28.0% of all households.
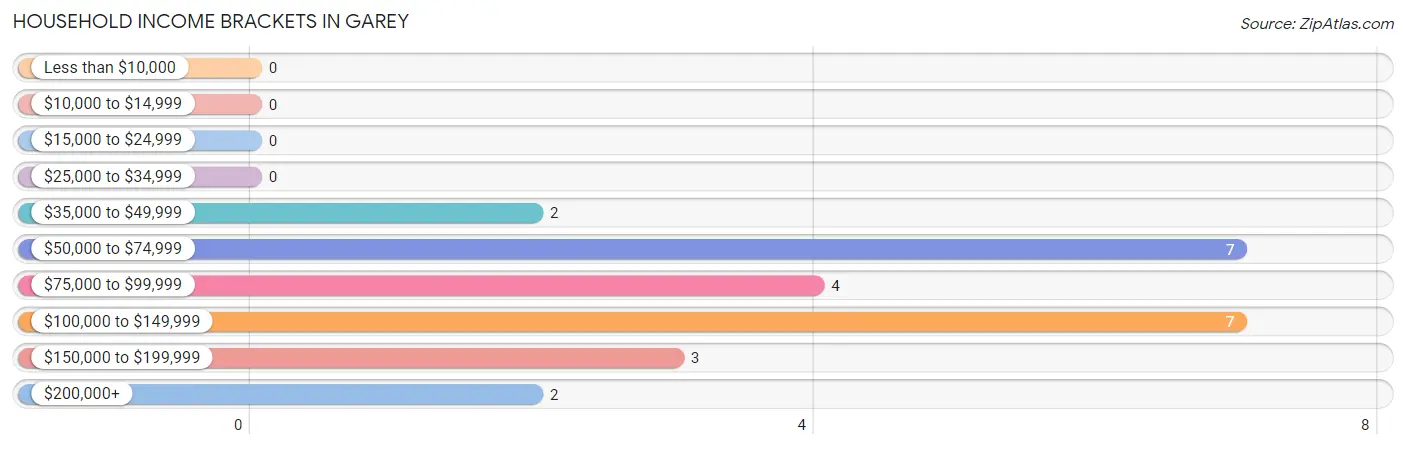
| Income Bracket | # Households | % Households |
| Less than $10,000 | 0 | 0.0% |
| $10,000 to $14,999 | 0 | 0.0% |
| $15,000 to $24,999 | 0 | 0.0% |
| $25,000 to $34,999 | 0 | 0.0% |
| $35,000 to $49,999 | 2 | 8.0% |
| $50,000 to $74,999 | 7 | 28.0% |
| $75,000 to $99,999 | 4 | 16.0% |
| $100,000 to $149,999 | 7 | 28.0% |
| $150,000 to $199,999 | 3 | 12.0% |
| $200,000+ | 2 | 8.0% |
Household Income by Householder Age in Garey
The median household income in Garey is $97,083, with the highest median household income of $109,583 found in the 65+ years age bracket for the primary householder. A total of 7 households (28.0%) fall into this category.
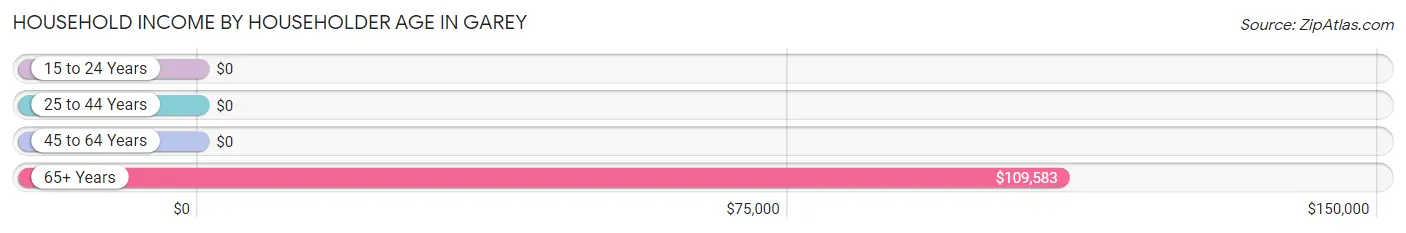
| Income Bracket | # Households | Median Income |
| 15 to 24 Years | 0 (0.0%) | $0 |
| 25 to 44 Years | 3 (12.0%) | $0 |
| 45 to 64 Years | 15 (60.0%) | $0 |
| 65+ Years | 7 (28.0%) | $109,583 |
| Total | 25 (100.0%) | $97,083 |
Poverty in Garey
Income Below Poverty by Sex and Age in Garey
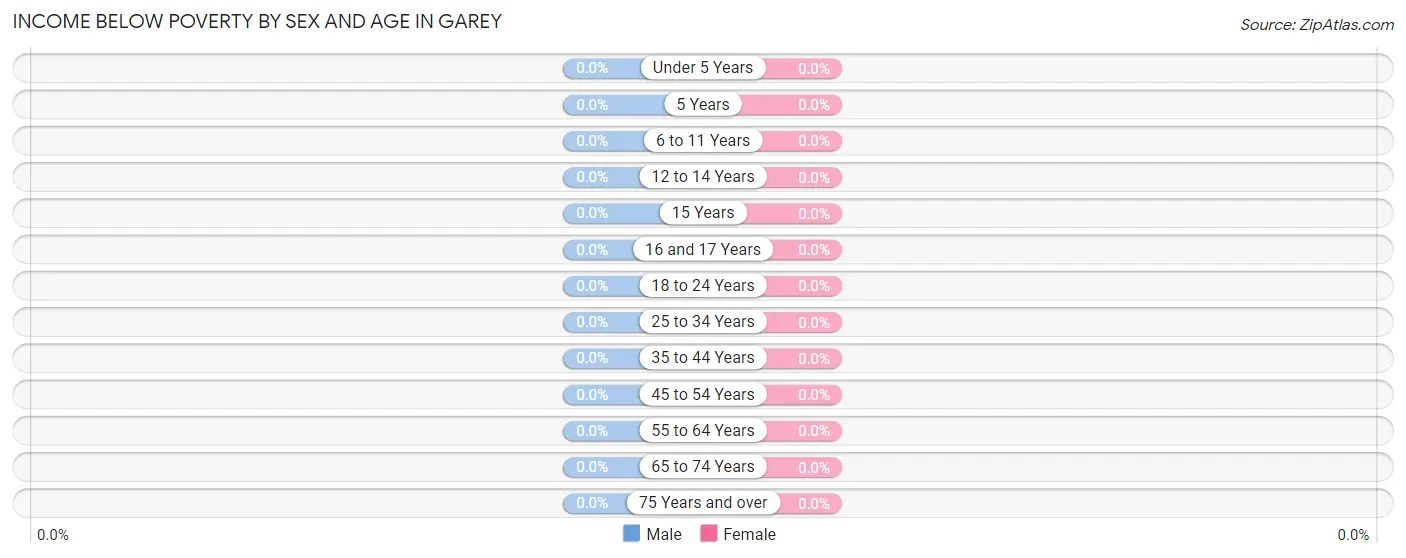
| Age Bracket | Male | Female |
| Under 5 Years | 0 (0.0%) | 0 (0.0%) |
| 5 Years | 0 (0.0%) | 0 (0.0%) |
| 6 to 11 Years | 0 (0.0%) | 0 (0.0%) |
| 12 to 14 Years | 0 (0.0%) | 0 (0.0%) |
| 15 Years | 0 (0.0%) | 0 (0.0%) |
| 16 and 17 Years | 0 (0.0%) | 0 (0.0%) |
| 18 to 24 Years | 0 (0.0%) | 0 (0.0%) |
| 25 to 34 Years | 0 (0.0%) | 0 (0.0%) |
| 35 to 44 Years | 0 (0.0%) | 0 (0.0%) |
| 45 to 54 Years | 0 (0.0%) | 0 (0.0%) |
| 55 to 64 Years | 0 (0.0%) | 0 (0.0%) |
| 65 to 74 Years | 0 (0.0%) | 0 (0.0%) |
| 75 Years and over | 0 (0.0%) | 0 (0.0%) |
| Total | 0 (0.0%) | 0 (0.0%) |
Income Above Poverty by Sex and Age in Garey
According to the poverty statistics in Garey, males aged 25 to 34 years and females aged 16 and 17 years are the age groups that are most secure financially, with 100.0% of males and 100.0% of females in these age groups living above the poverty line.
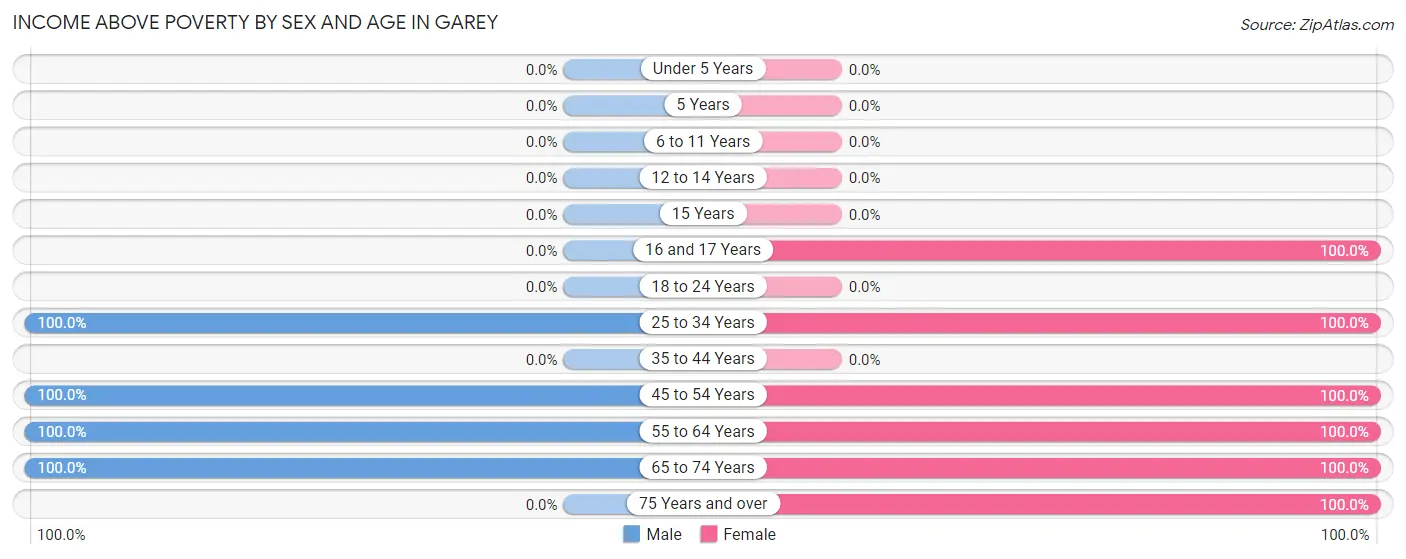
| Age Bracket | Male | Female |
| Under 5 Years | 0 (0.0%) | 0 (0.0%) |
| 5 Years | 0 (0.0%) | 0 (0.0%) |
| 6 to 11 Years | 0 (0.0%) | 0 (0.0%) |
| 12 to 14 Years | 0 (0.0%) | 0 (0.0%) |
| 15 Years | 0 (0.0%) | 0 (0.0%) |
| 16 and 17 Years | 0 (0.0%) | 4 (100.0%) |
| 18 to 24 Years | 0 (0.0%) | 0 (0.0%) |
| 25 to 34 Years | 3 (100.0%) | 3 (100.0%) |
| 35 to 44 Years | 0 (0.0%) | 0 (0.0%) |
| 45 to 54 Years | 2 (100.0%) | 9 (100.0%) |
| 55 to 64 Years | 9 (100.0%) | 7 (100.0%) |
| 65 to 74 Years | 8 (100.0%) | 4 (100.0%) |
| 75 Years and over | 0 (0.0%) | 3 (100.0%) |
| Total | 22 (100.0%) | 30 (100.0%) |
Income Below Poverty Among Married-Couple Families in Garey
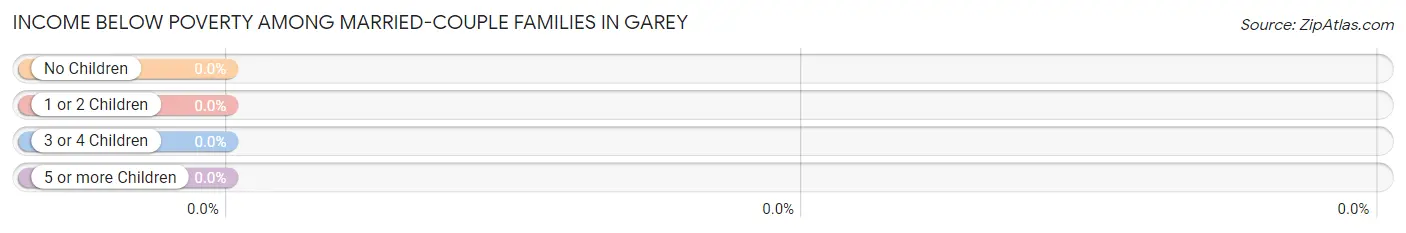
| Children | Above Poverty | Below Poverty |
| No Children | 8 (100.0%) | 0 (0.0%) |
| 1 or 2 Children | 0 (0.0%) | 0 (0.0%) |
| 3 or 4 Children | 0 (0.0%) | 0 (0.0%) |
| 5 or more Children | 0 (0.0%) | 0 (0.0%) |
| Total | 8 (100.0%) | 0 (0.0%) |
Income Below Poverty Among Single-Parent Households in Garey
| Children | Single Father | Single Mother |
| No Children | 0 (0.0%) | 0 (0.0%) |
| 1 or 2 Children | 0 (0.0%) | 0 (0.0%) |
| 3 or 4 Children | 0 (0.0%) | 0 (0.0%) |
| 5 or more Children | 0 (0.0%) | 0 (0.0%) |
| Total | 0 (0.0%) | 0 (0.0%) |
Income Below Poverty Among Married-Couple vs Single-Parent Households in Garey
| Children | Married-Couple Families | Single-Parent Households |
| No Children | 0 (0.0%) | 0 (0.0%) |
| 1 or 2 Children | 0 (0.0%) | 0 (0.0%) |
| 3 or 4 Children | 0 (0.0%) | 0 (0.0%) |
| 5 or more Children | 0 (0.0%) | 0 (0.0%) |
| Total | 0 (0.0%) | 0 (0.0%) |
Race in Garey
The most populous races in Garey are White / Caucasian (49 | 94.2%), Hispanic or Latino (5 | 9.6%), and Two or more Races (3 | 5.8%).
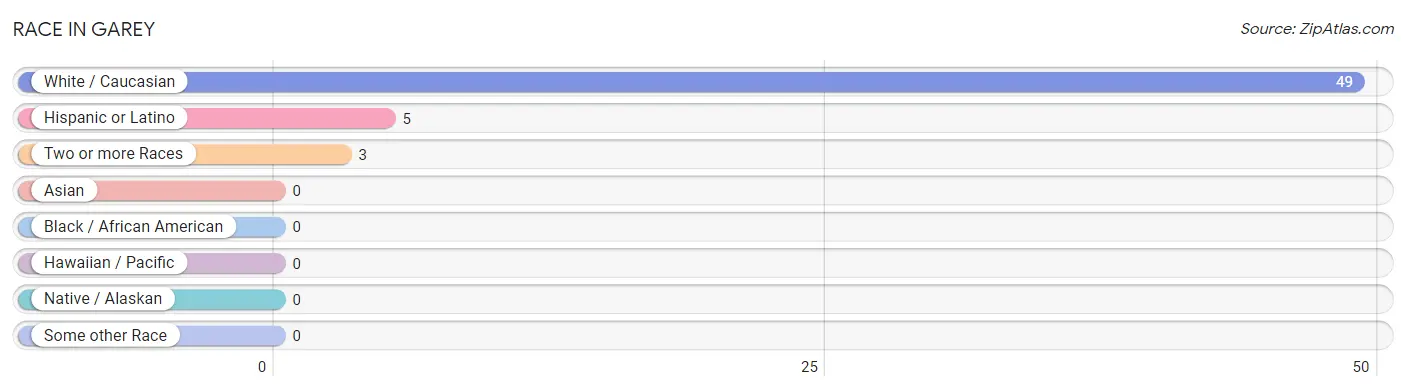
| Race | # Population | % Population |
| Asian | 0 | 0.0% |
| Black / African American | 0 | 0.0% |
| Hawaiian / Pacific | 0 | 0.0% |
| Hispanic or Latino | 5 | 9.6% |
| Native / Alaskan | 0 | 0.0% |
| White / Caucasian | 49 | 94.2% |
| Two or more Races | 3 | 5.8% |
| Some other Race | 0 | 0.0% |
| Total | 52 | 100.0% |
Ancestry in Garey
The most populous ancestries reported in Garey are English (16 | 30.8%), American (12 | 23.1%), German (8 | 15.4%), Mexican (5 | 9.6%), and Scotch-Irish (4 | 7.7%), together accounting for 86.5% of all Garey residents.
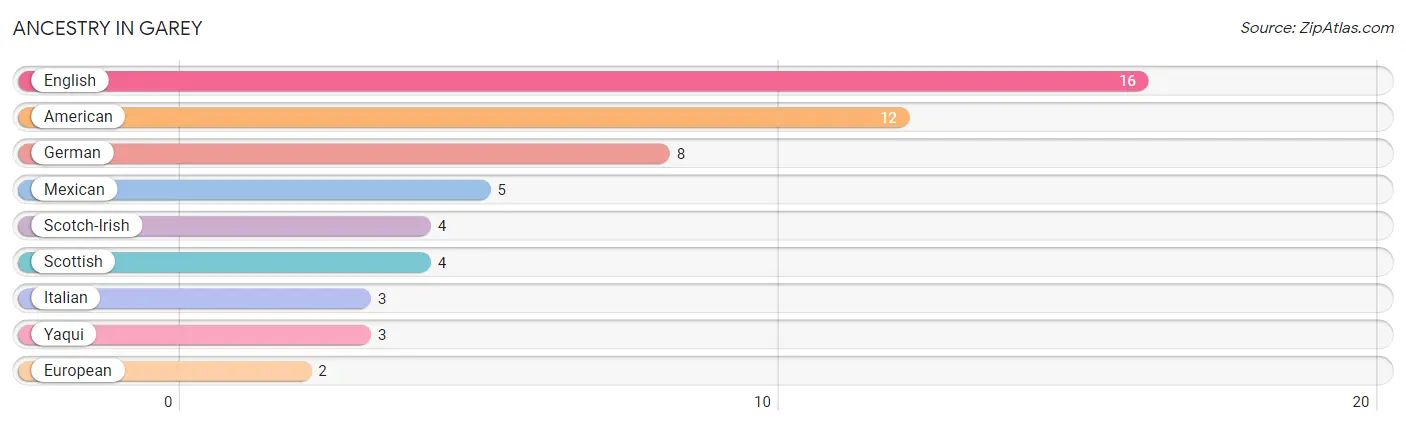
| Ancestry | # Population | % Population |
| American | 12 | 23.1% |
| English | 16 | 30.8% |
| European | 2 | 3.8% |
| German | 8 | 15.4% |
| Italian | 3 | 5.8% |
| Mexican | 5 | 9.6% |
| Scotch-Irish | 4 | 7.7% |
| Scottish | 4 | 7.7% |
| Yaqui | 3 | 5.8% | View All 9 Rows |
Immigrants in Garey
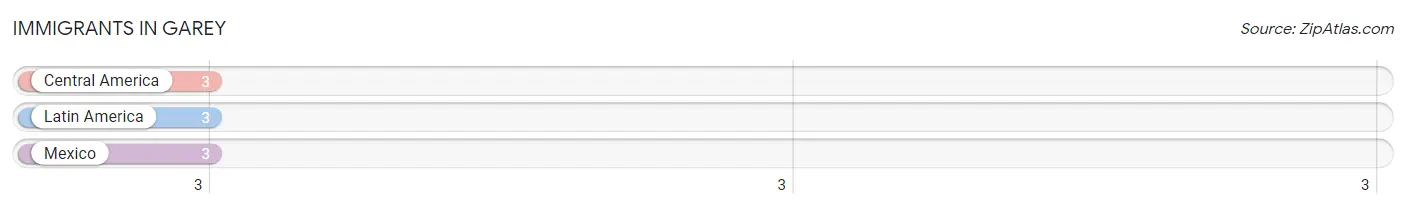
The most numerous immigrant groups reported in Garey came from Central America (3 | 5.8%), Latin America (3 | 5.8%), and Mexico (3 | 5.8%), together accounting for 17.3% of all Garey residents.
| Immigration Origin | # Population | % Population |
| Central America | 3 | 5.8% |
| Latin America | 3 | 5.8% |
| Mexico | 3 | 5.8% | View All 3 Rows |
Sex and Age in Garey
Sex and Age in Garey
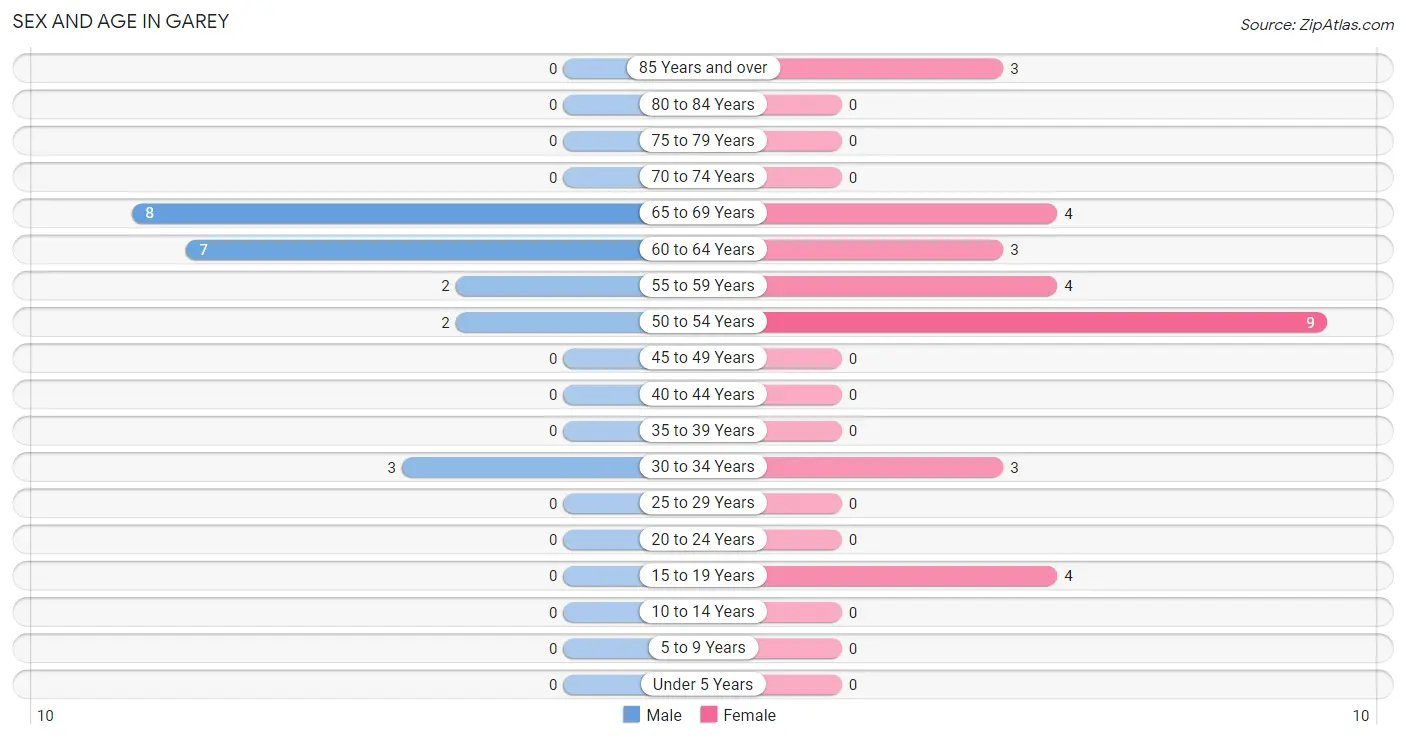
The most populous age groups in Garey are 65 to 69 Years (8 | 36.4%) for men and 50 to 54 Years (9 | 30.0%) for women.
| Age Bracket | Male | Female |
| Under 5 Years | 0 (0.0%) | 0 (0.0%) |
| 5 to 9 Years | 0 (0.0%) | 0 (0.0%) |
| 10 to 14 Years | 0 (0.0%) | 0 (0.0%) |
| 15 to 19 Years | 0 (0.0%) | 4 (13.3%) |
| 20 to 24 Years | 0 (0.0%) | 0 (0.0%) |
| 25 to 29 Years | 0 (0.0%) | 0 (0.0%) |
| 30 to 34 Years | 3 (13.6%) | 3 (10.0%) |
| 35 to 39 Years | 0 (0.0%) | 0 (0.0%) |
| 40 to 44 Years | 0 (0.0%) | 0 (0.0%) |
| 45 to 49 Years | 0 (0.0%) | 0 (0.0%) |
| 50 to 54 Years | 2 (9.1%) | 9 (30.0%) |
| 55 to 59 Years | 2 (9.1%) | 4 (13.3%) |
| 60 to 64 Years | 7 (31.8%) | 3 (10.0%) |
| 65 to 69 Years | 8 (36.4%) | 4 (13.3%) |
| 70 to 74 Years | 0 (0.0%) | 0 (0.0%) |
| 75 to 79 Years | 0 (0.0%) | 0 (0.0%) |
| 80 to 84 Years | 0 (0.0%) | 0 (0.0%) |
| 85 Years and over | 0 (0.0%) | 3 (10.0%) |
| Total | 22 (100.0%) | 30 (100.0%) |
Families and Households in Garey
Median Family Size in Garey
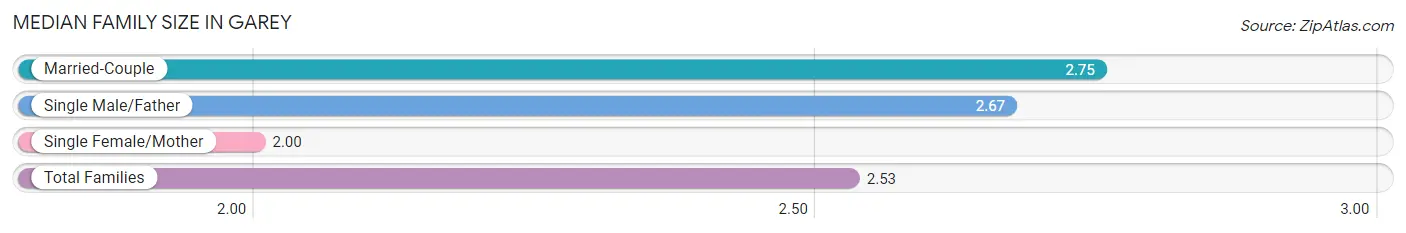
The median family size in Garey is 2.53 persons per family, with married-couple families (8 | 53.3%) accounting for the largest median family size of 2.75 persons per family. On the other hand, single female/mother families (4 | 26.7%) represent the smallest median family size with 2.00 persons per family.
| Family Type | # Families | Family Size |
| Married-Couple | 8 (53.3%) | 2.75 |
| Single Male/Father | 3 (20.0%) | 2.67 |
| Single Female/Mother | 4 (26.7%) | 2.00 |
| Total Families | 15 (100.0%) | 2.53 |
Median Household Size in Garey
| Household Type | # Households | Household Size |
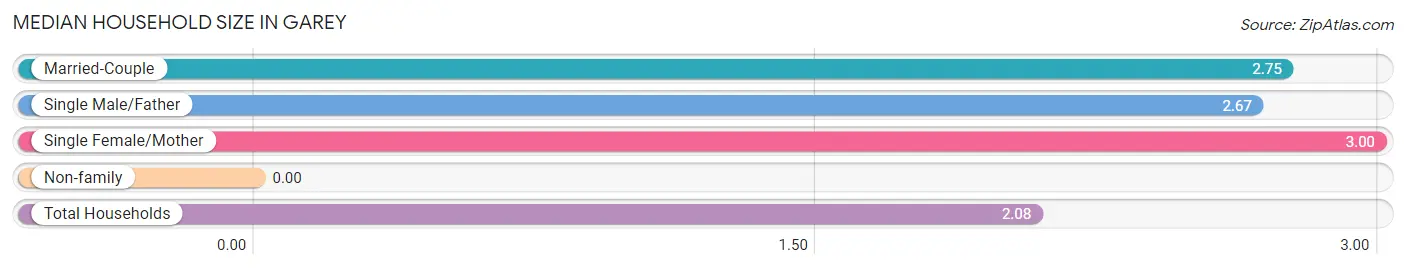
| Married-Couple | 8 (32.0%) | 2.75 |
| Single Male/Father | 3 (12.0%) | 2.67 |
| Single Female/Mother | 4 (16.0%) | 3.00 |
| Non-family | 10 (40.0%) | - |
| Total Households | 25 (100.0%) | 2.08 |
Household Size by Marriage Status in Garey
Out of a total of 25 households in Garey, 15 (60.0%) are family households, while 10 (40.0%) are nonfamily households. The most numerous type of family households are 3-person households, comprising 7, and the most common type of nonfamily households are 1-person households, comprising 10.
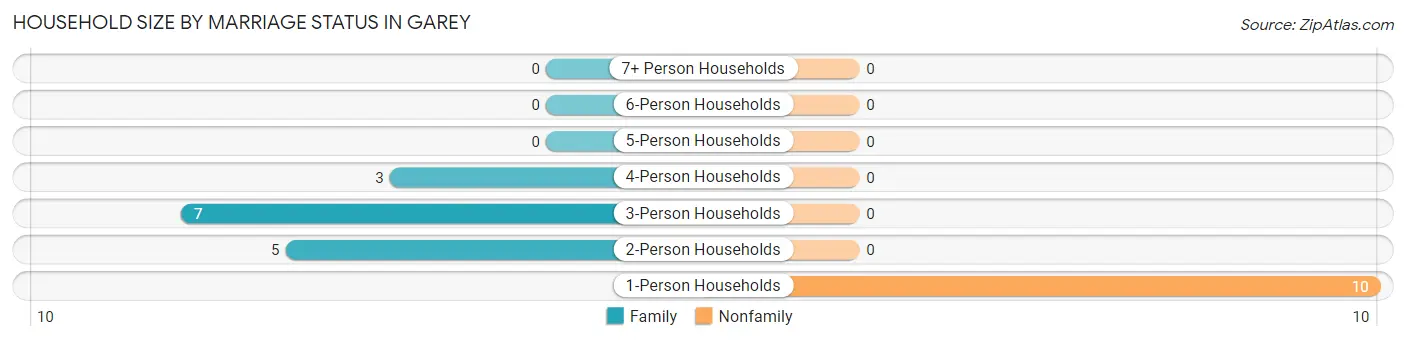
| Household Size | Family Households | Nonfamily Households |
| 1-Person Households | - | 10 (40.0%) |
| 2-Person Households | 5 (20.0%) | 0 (0.0%) |
| 3-Person Households | 7 (28.0%) | 0 (0.0%) |
| 4-Person Households | 3 (12.0%) | 0 (0.0%) |
| 5-Person Households | 0 (0.0%) | 0 (0.0%) |
| 6-Person Households | 0 (0.0%) | 0 (0.0%) |
| 7+ Person Households | 0 (0.0%) | 0 (0.0%) |
| Total | 15 (60.0%) | 10 (40.0%) |
Female Fertility in Garey
Fertility by Age in Garey
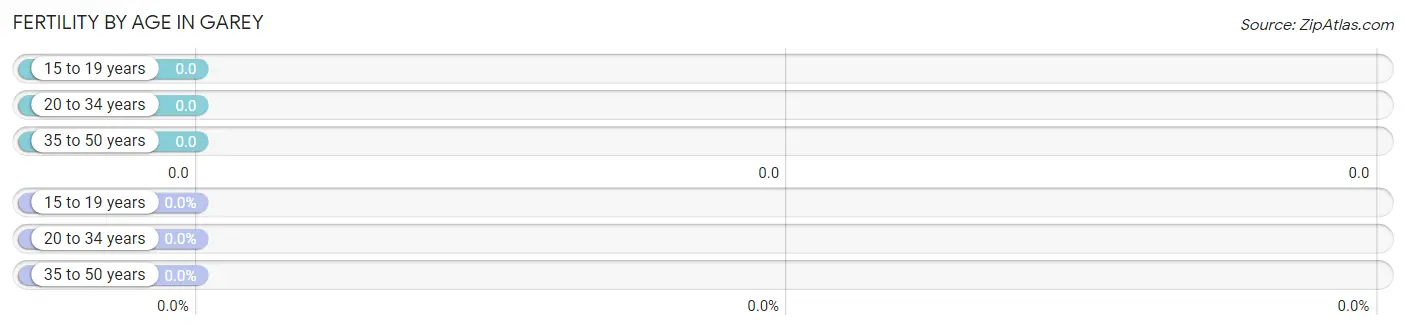
| Age Bracket | Women with Births | Births / 1,000 Women |
| 15 to 19 years | 0 (0.0%) | 0.0 |
| 20 to 34 years | 0 (0.0%) | 0.0 |
| 35 to 50 years | 0 (0.0%) | 0.0 |
| Total | 0 (0.0%) | 0.0 |
Fertility by Age by Marriage Status in Garey
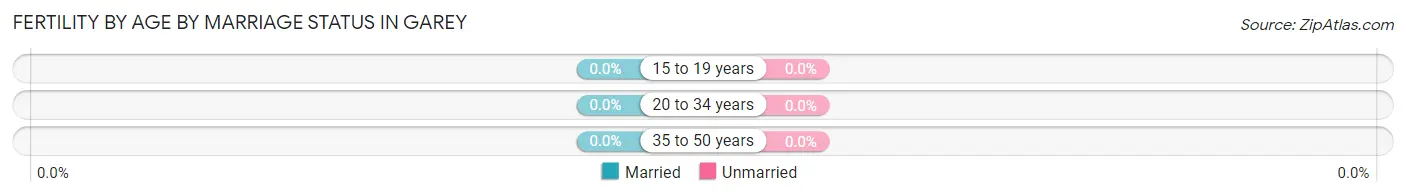
| Age Bracket | Married | Unmarried |
| 15 to 19 years | 0 (0.0%) | 0 (0.0%) |
| 20 to 34 years | 0 (0.0%) | 0 (0.0%) |
| 35 to 50 years | 0 (0.0%) | 0 (0.0%) |
| Total | 0 (0.0%) | 0 (0.0%) |
Fertility by Education in Garey
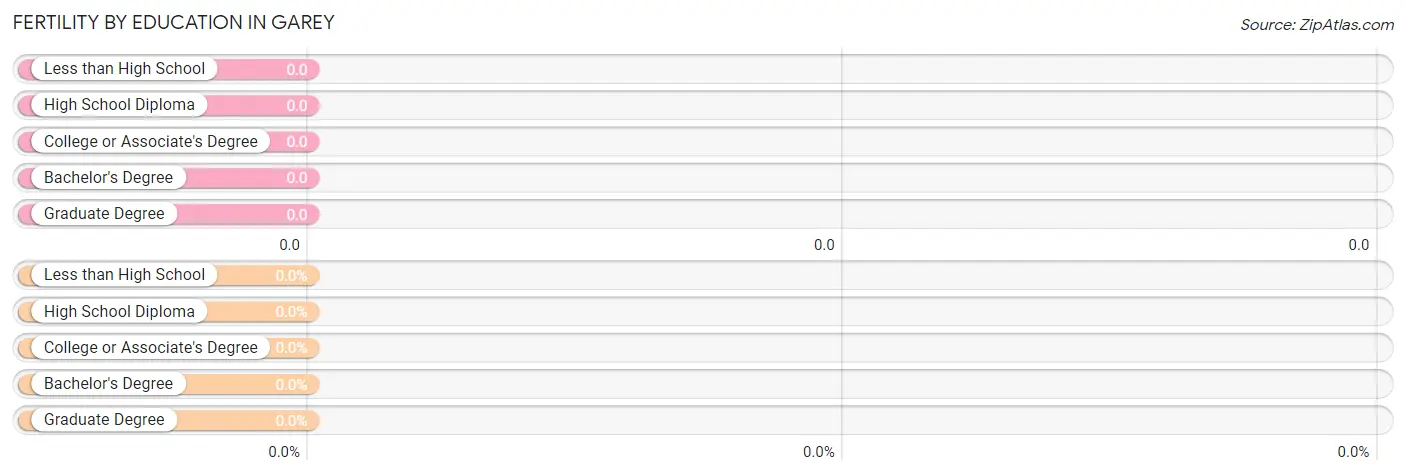
| Educational Attainment | Women with Births | Births / 1,000 Women |
| Less than High School | 0 (0.0%) | 0.0 |
| High School Diploma | 0 (0.0%) | 0.0 |
| College or Associate's Degree | 0 (0.0%) | 0.0 |
| Bachelor's Degree | 0 (0.0%) | 0.0 |
| Graduate Degree | 0 (0.0%) | 0.0 |
| Total | 0 (0.0%) | 0.0 |
Fertility by Education by Marriage Status in Garey
| Educational Attainment | Married | Unmarried |
| Less than High School | 0 (0.0%) | 0 (0.0%) |
| High School Diploma | 0 (0.0%) | 0 (0.0%) |
| College or Associate's Degree | 0 (0.0%) | 0 (0.0%) |
| Bachelor's Degree | 0 (0.0%) | 0 (0.0%) |
| Graduate Degree | 0 (0.0%) | 0 (0.0%) |
| Total | 0 (0.0%) | 0 (0.0%) |
Employment Characteristics in Garey
Employment by Class of Employer in Garey
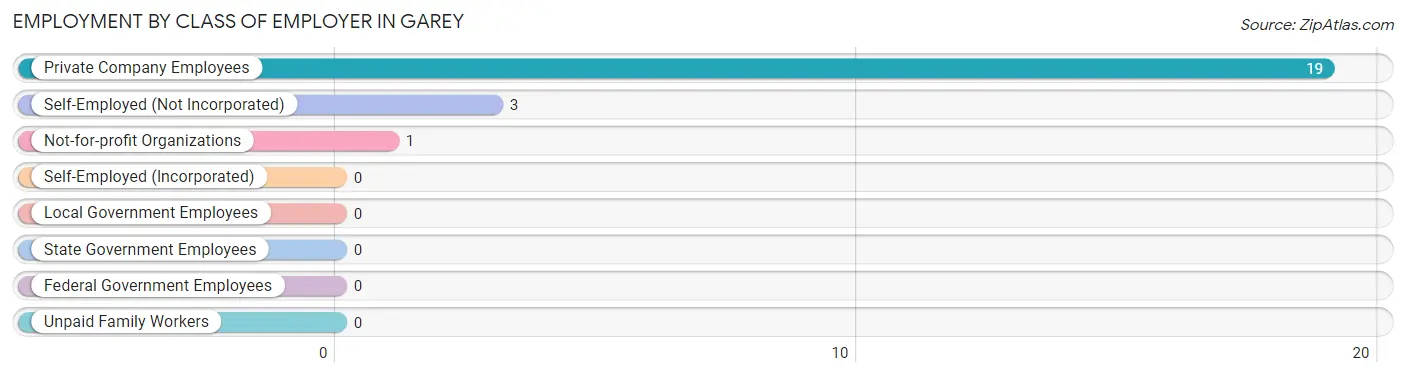
Among the 23 employed individuals in Garey, private company employees (19 | 82.6%), self-employed (not incorporated) (3 | 13.0%), and not-for-profit organizations (1 | 4.3%) make up the most common classes of employment.
| Employer Class | # Employees | % Employees |
| Private Company Employees | 19 | 82.6% |
| Self-Employed (Incorporated) | 0 | 0.0% |
| Self-Employed (Not Incorporated) | 3 | 13.0% |
| Not-for-profit Organizations | 1 | 4.3% |
| Local Government Employees | 0 | 0.0% |
| State Government Employees | 0 | 0.0% |
| Federal Government Employees | 0 | 0.0% |
| Unpaid Family Workers | 0 | 0.0% |
| Total | 23 | 100.0% |
Employment Status by Age in Garey
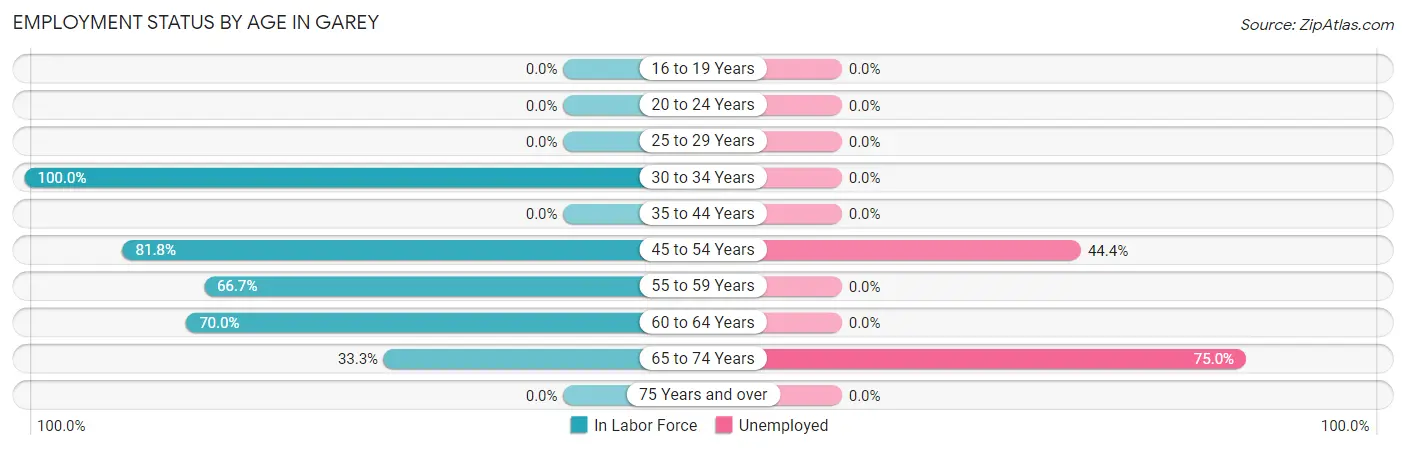
According to the labor force statistics for Garey, out of the total population over 16 years of age (52), 57.7% or 30 individuals are in the labor force, with 23.3% or 7 of them unemployed. The age group with the highest labor force participation rate is 30 to 34 years, with 100.0% or 6 individuals in the labor force. Within the labor force, the 65 to 74 years age range has the highest percentage of unemployed individuals, with 75.0% or 3 of them being unemployed.
| Age Bracket | In Labor Force | Unemployed |
| 16 to 19 Years | 0 (0.0%) | 0 (0.0%) |
| 20 to 24 Years | 0 (0.0%) | 0 (0.0%) |
| 25 to 29 Years | 0 (0.0%) | 0 (0.0%) |
| 30 to 34 Years | 6 (100.0%) | 0 (0.0%) |
| 35 to 44 Years | 0 (0.0%) | 0 (0.0%) |
| 45 to 54 Years | 9 (81.8%) | 4 (44.4%) |
| 55 to 59 Years | 4 (66.7%) | 0 (0.0%) |
| 60 to 64 Years | 7 (70.0%) | 0 (0.0%) |
| 65 to 74 Years | 4 (33.3%) | 3 (75.0%) |
| 75 Years and over | 0 (0.0%) | 0 (0.0%) |
| Total | 30 (57.7%) | 7 (23.3%) |
Employment Status by Educational Attainment in Garey
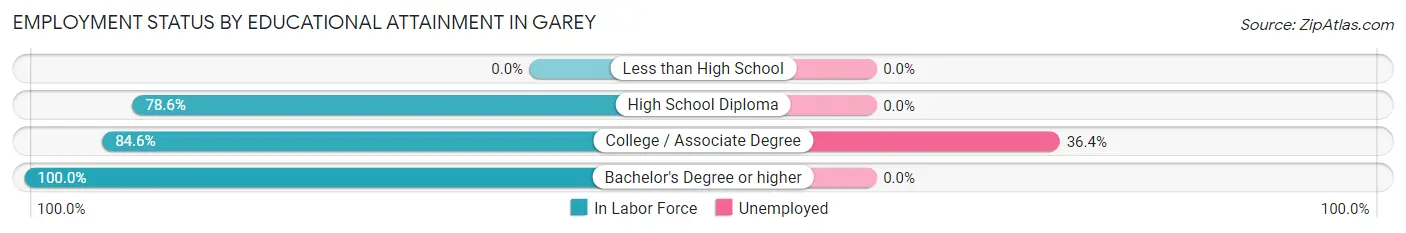
According to labor force statistics for Garey, 78.8% of individuals (26) out of the total population between 25 and 64 years of age (33) are in the labor force, with 15.4% or 4 of them being unemployed. The group with the highest labor force participation rate are those with the educational attainment of bachelor's degree or higher, with 100.0% or 4 individuals in the labor force. Within the labor force, individuals with college / associate degree education have the highest percentage of unemployment, with 36.4% or 4 of them being unemployed.
| Educational Attainment | In Labor Force | Unemployed |
| Less than High School | 0 (0.0%) | 0 (0.0%) |
| High School Diploma | 11 (78.6%) | 0 (0.0%) |
| College / Associate Degree | 11 (84.6%) | 5 (36.4%) |
| Bachelor's Degree or higher | 4 (100.0%) | 0 (0.0%) |
| Total | 26 (78.8%) | 5 (15.4%) |
Employment Occupations by Sex in Garey
Management, Business, Science and Arts Occupations
The most common Management, Business, Science and Arts occupations in Garey are Business & Financial (3 | 13.0%), and Management (1 | 4.3%).
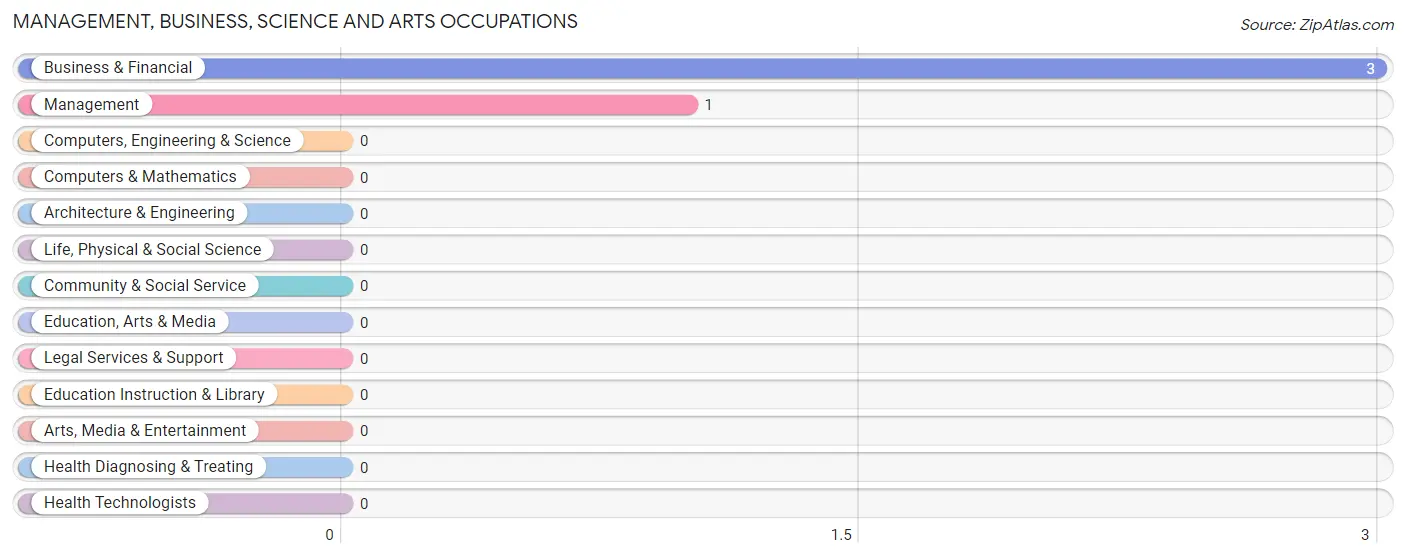
Management, Business, Science and Arts Occupations by Sex
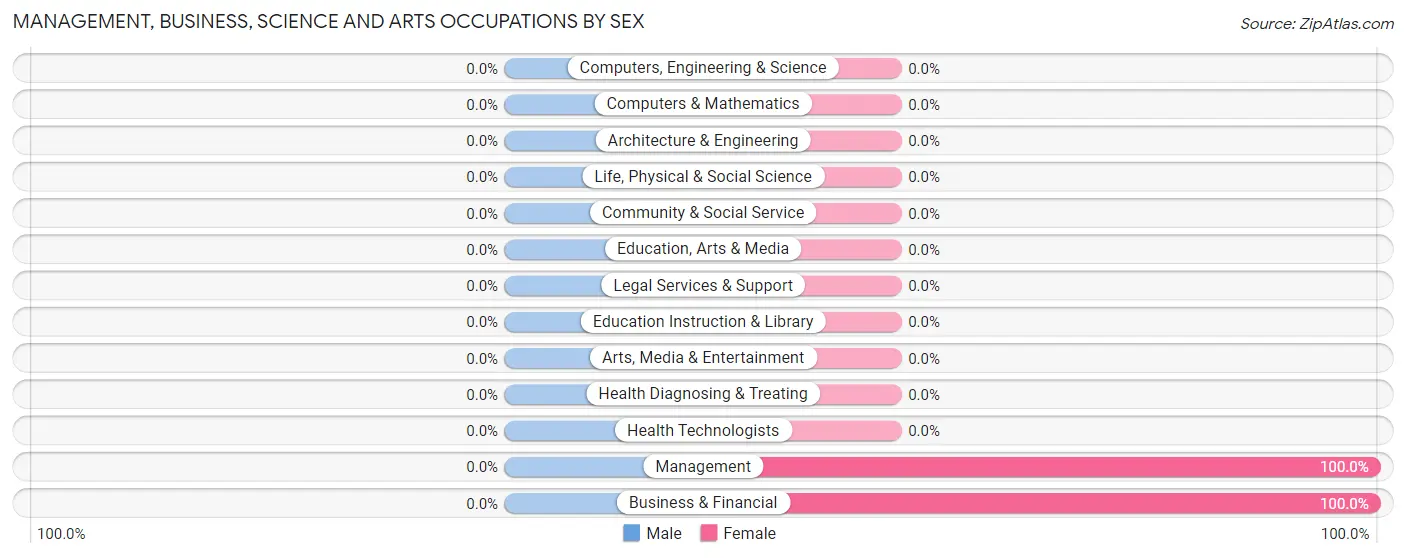
| Occupation | Male | Female |
| Management | 0 (0.0%) | 1 (100.0%) |
| Business & Financial | 0 (0.0%) | 3 (100.0%) |
| Computers, Engineering & Science | 0 (0.0%) | 0 (0.0%) |
| Computers & Mathematics | 0 (0.0%) | 0 (0.0%) |
| Architecture & Engineering | 0 (0.0%) | 0 (0.0%) |
| Life, Physical & Social Science | 0 (0.0%) | 0 (0.0%) |
| Community & Social Service | 0 (0.0%) | 0 (0.0%) |
| Education, Arts & Media | 0 (0.0%) | 0 (0.0%) |
| Legal Services & Support | 0 (0.0%) | 0 (0.0%) |
| Education Instruction & Library | 0 (0.0%) | 0 (0.0%) |
| Arts, Media & Entertainment | 0 (0.0%) | 0 (0.0%) |
| Health Diagnosing & Treating | 0 (0.0%) | 0 (0.0%) |
| Health Technologists | 0 (0.0%) | 0 (0.0%) |
| Total (Category) | 0 (0.0%) | 4 (100.0%) |
| Total (Overall) | 12 (52.2%) | 11 (47.8%) |
Services Occupations
The most common Services occupations in Garey are , and Personal Care & Service (3 | 13.0%).
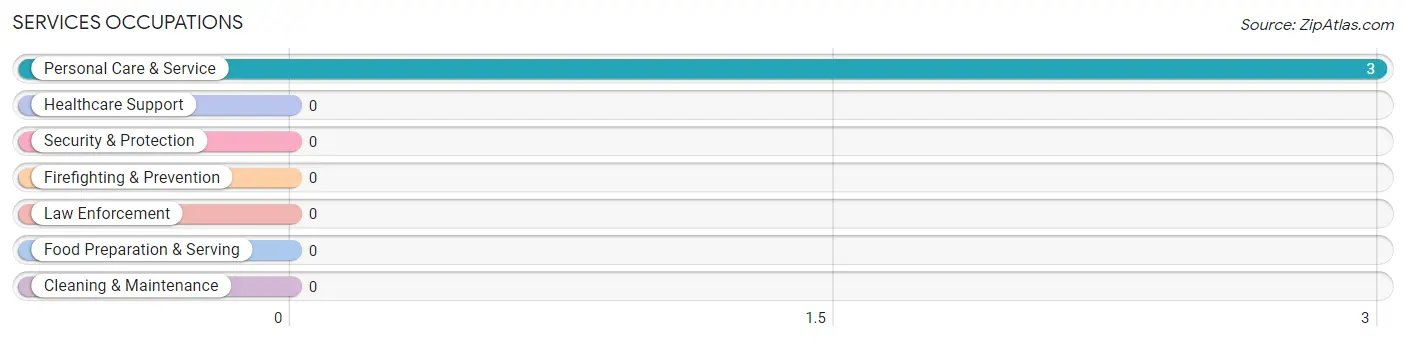
Services Occupations by Sex
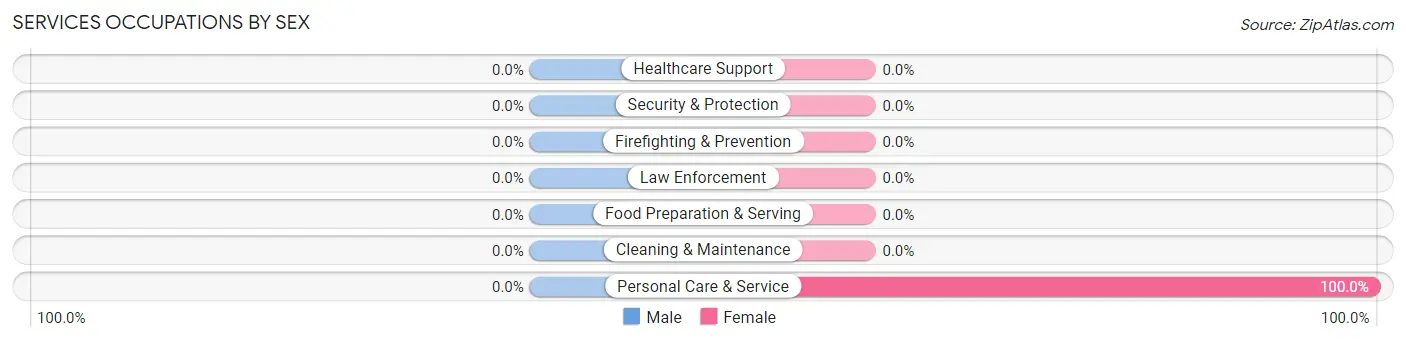
| Occupation | Male | Female |
| Healthcare Support | 0 (0.0%) | 0 (0.0%) |
| Security & Protection | 0 (0.0%) | 0 (0.0%) |
| Firefighting & Prevention | 0 (0.0%) | 0 (0.0%) |
| Law Enforcement | 0 (0.0%) | 0 (0.0%) |
| Food Preparation & Serving | 0 (0.0%) | 0 (0.0%) |
| Cleaning & Maintenance | 0 (0.0%) | 0 (0.0%) |
| Personal Care & Service | 0 (0.0%) | 3 (100.0%) |
| Total (Category) | 0 (0.0%) | 3 (100.0%) |
| Total (Overall) | 12 (52.2%) | 11 (47.8%) |
Sales and Office Occupations
The most common Sales and Office occupations in Garey are , and Sales & Related (2 | 8.7%).
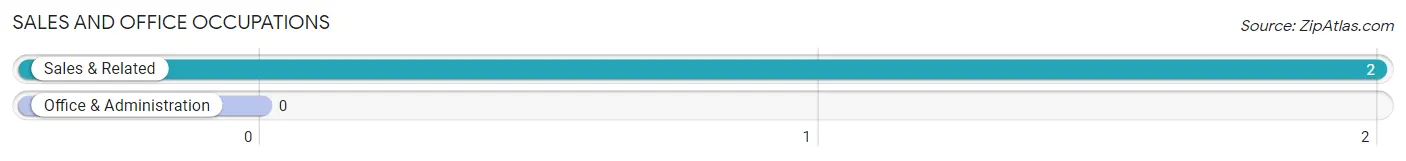
Sales and Office Occupations by Sex
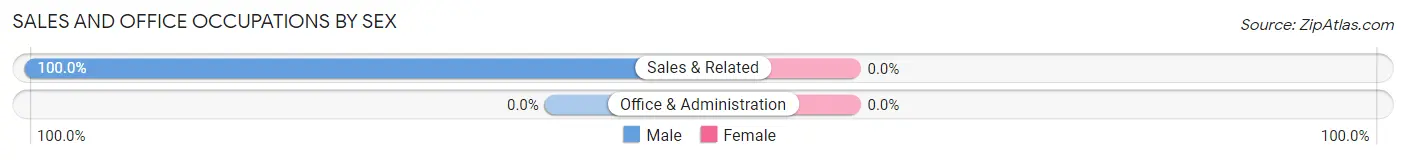
| Occupation | Male | Female |
| Sales & Related | 2 (100.0%) | 0 (0.0%) |
| Office & Administration | 0 (0.0%) | 0 (0.0%) |
| Total (Category) | 2 (100.0%) | 0 (0.0%) |
| Total (Overall) | 12 (52.2%) | 11 (47.8%) |
Natural Resources, Construction and Maintenance Occupations
The most common Natural Resources, Construction and Maintenance occupations in Garey are , and Construction & Extraction (3 | 13.0%).
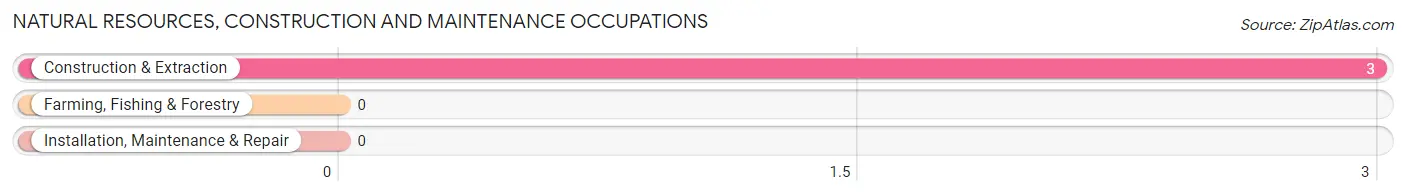
Natural Resources, Construction and Maintenance Occupations by Sex
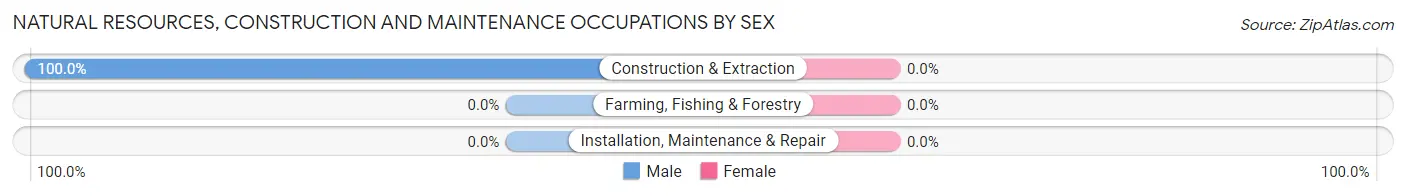
| Occupation | Male | Female |
| Farming, Fishing & Forestry | 0 (0.0%) | 0 (0.0%) |
| Construction & Extraction | 3 (100.0%) | 0 (0.0%) |
| Installation, Maintenance & Repair | 0 (0.0%) | 0 (0.0%) |
| Total (Category) | 3 (100.0%) | 0 (0.0%) |
| Total (Overall) | 12 (52.2%) | 11 (47.8%) |
Production, Transportation and Moving Occupations
The most common Production, Transportation and Moving occupations in Garey are , and Transportation (11 | 47.8%).
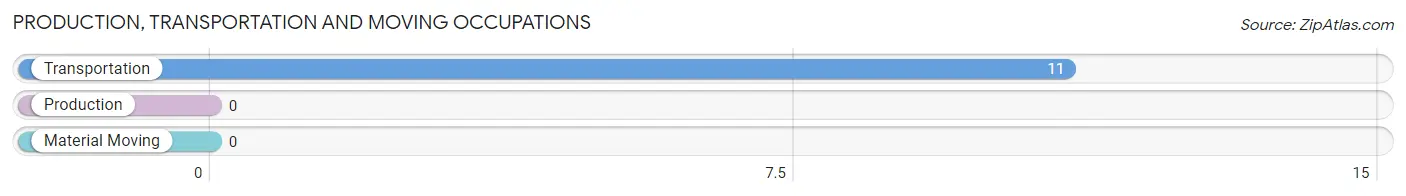
Production, Transportation and Moving Occupations by Sex
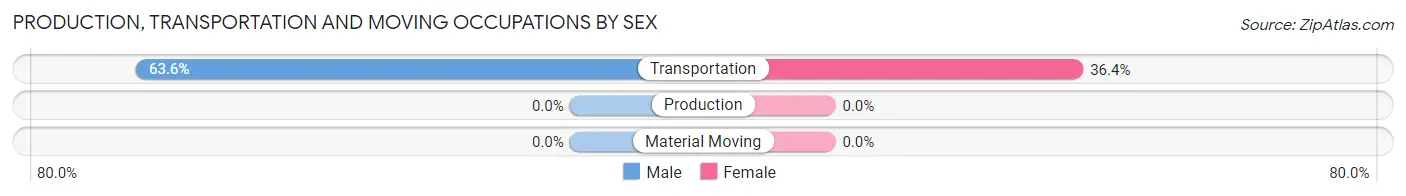
| Occupation | Male | Female |
| Production | 0 (0.0%) | 0 (0.0%) |
| Transportation | 7 (63.6%) | 4 (36.4%) |
| Material Moving | 0 (0.0%) | 0 (0.0%) |
| Total (Category) | 7 (63.6%) | 4 (36.4%) |
| Total (Overall) | 12 (52.2%) | 11 (47.8%) |
Employment Industries by Sex in Garey
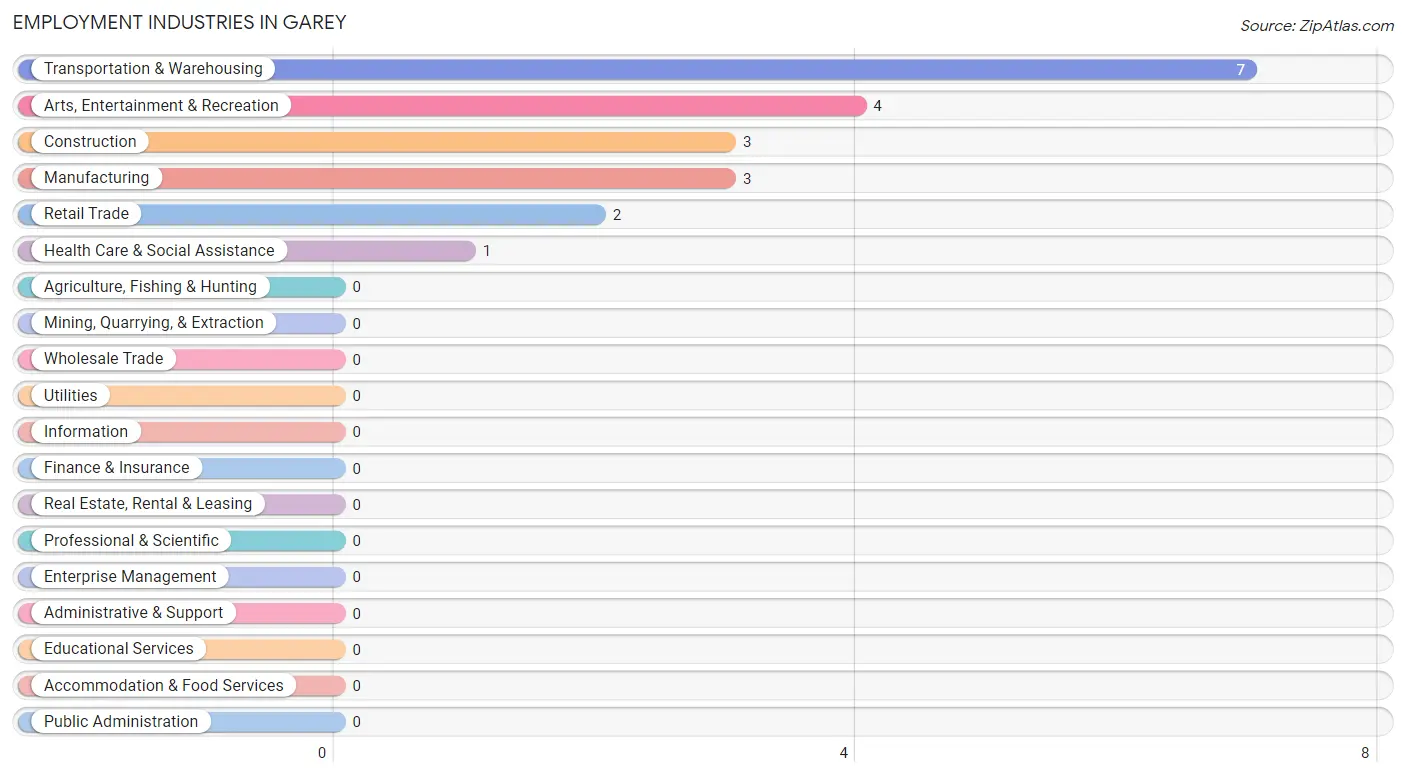
Employment Industries in Garey
The major employment industries in Garey include Transportation & Warehousing (7 | 30.4%), Arts, Entertainment & Recreation (4 | 17.4%), Construction (3 | 13.0%), Manufacturing (3 | 13.0%), and Retail Trade (2 | 8.7%).
Employment Industries by Sex in Garey
The Garey industries that see more men than women are Construction (100.0%), Retail Trade (100.0%), and Transportation & Warehousing (100.0%), whereas the industries that tend to have a higher number of women are Manufacturing (100.0%), Health Care & Social Assistance (100.0%), and Arts, Entertainment & Recreation (100.0%).
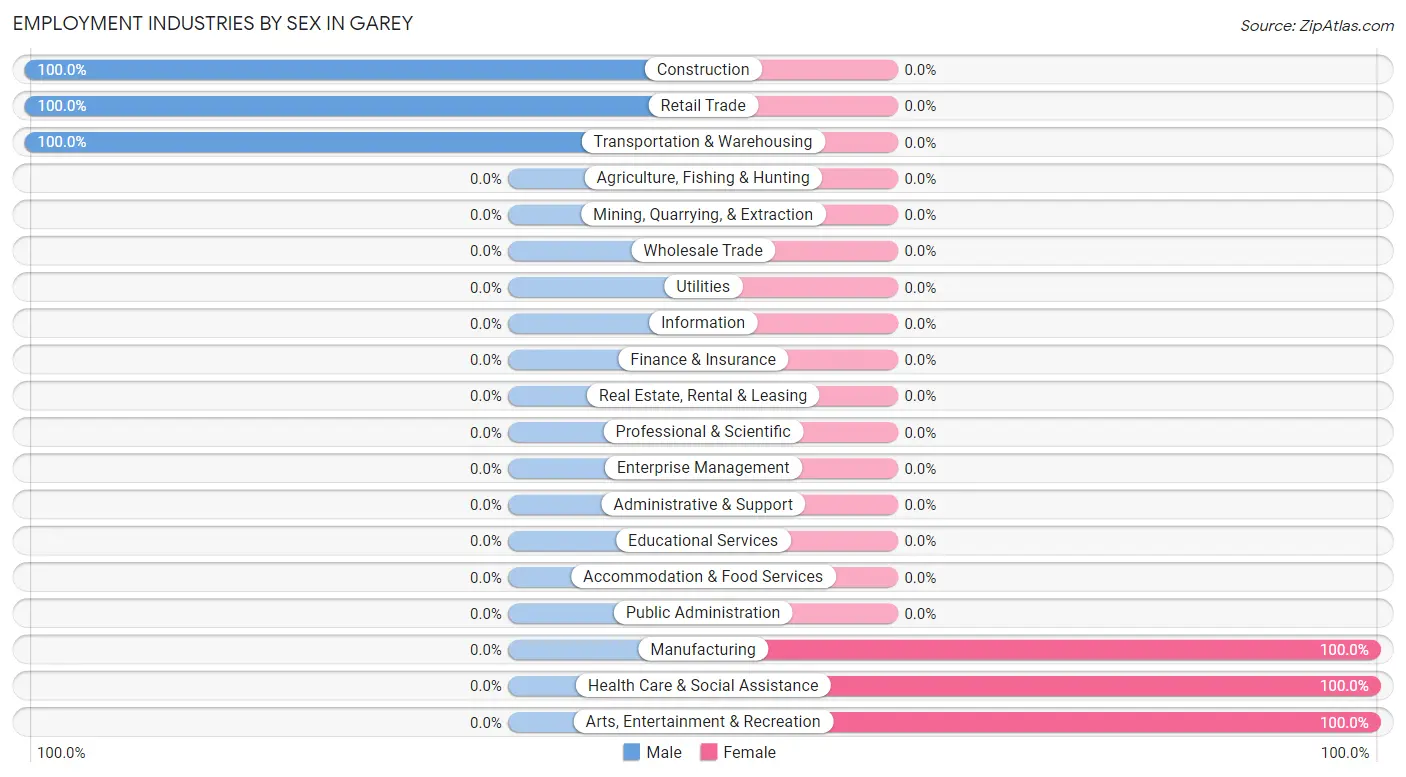
| Industry | Male | Female |
| Agriculture, Fishing & Hunting | 0 (0.0%) | 0 (0.0%) |
| Mining, Quarrying, & Extraction | 0 (0.0%) | 0 (0.0%) |
| Construction | 3 (100.0%) | 0 (0.0%) |
| Manufacturing | 0 (0.0%) | 3 (100.0%) |
| Wholesale Trade | 0 (0.0%) | 0 (0.0%) |
| Retail Trade | 2 (100.0%) | 0 (0.0%) |
| Transportation & Warehousing | 7 (100.0%) | 0 (0.0%) |
| Utilities | 0 (0.0%) | 0 (0.0%) |
| Information | 0 (0.0%) | 0 (0.0%) |
| Finance & Insurance | 0 (0.0%) | 0 (0.0%) |
| Real Estate, Rental & Leasing | 0 (0.0%) | 0 (0.0%) |
| Professional & Scientific | 0 (0.0%) | 0 (0.0%) |
| Enterprise Management | 0 (0.0%) | 0 (0.0%) |
| Administrative & Support | 0 (0.0%) | 0 (0.0%) |
| Educational Services | 0 (0.0%) | 0 (0.0%) |
| Health Care & Social Assistance | 0 (0.0%) | 1 (100.0%) |
| Arts, Entertainment & Recreation | 0 (0.0%) | 4 (100.0%) |
| Accommodation & Food Services | 0 (0.0%) | 0 (0.0%) |
| Public Administration | 0 (0.0%) | 0 (0.0%) |
| Total | 12 (52.2%) | 11 (47.8%) |
Education in Garey
School Enrollment in Garey
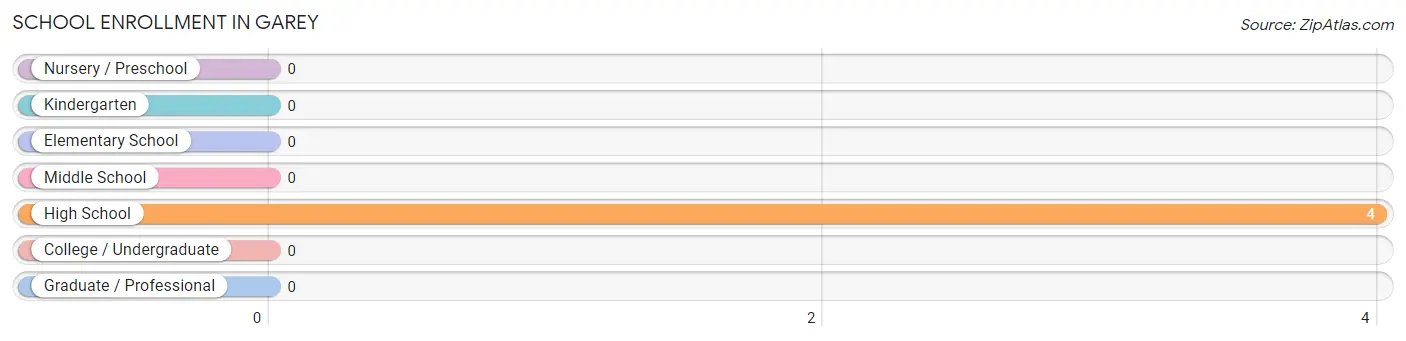
| School Level | # Students | % Students |
| Nursery / Preschool | 0 | 0.0% |
| Kindergarten | 0 | 0.0% |
| Elementary School | 0 | 0.0% |
| Middle School | 0 | 0.0% |
| High School | 4 | 100.0% |
| College / Undergraduate | 0 | 0.0% |
| Graduate / Professional | 0 | 0.0% |
| Total | 4 | 100.0% |
School Enrollment by Age by Funding Source in Garey
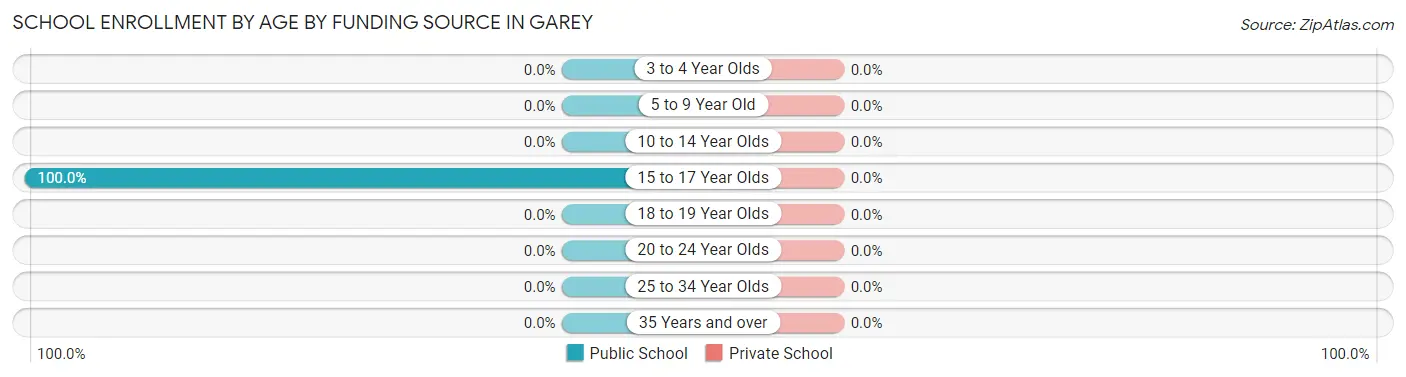
| Age Bracket | Public School | Private School |
| 3 to 4 Year Olds | 0 (0.0%) | 0 (0.0%) |
| 5 to 9 Year Old | 0 (0.0%) | 0 (0.0%) |
| 10 to 14 Year Olds | 0 (0.0%) | 0 (0.0%) |
| 15 to 17 Year Olds | 4 (100.0%) | 0 (0.0%) |
| 18 to 19 Year Olds | 0 (0.0%) | 0 (0.0%) |
| 20 to 24 Year Olds | 0 (0.0%) | 0 (0.0%) |
| 25 to 34 Year Olds | 0 (0.0%) | 0 (0.0%) |
| 35 Years and over | 0 (0.0%) | 0 (0.0%) |
| Total | 4 (100.0%) | 0 (0.0%) |
Educational Attainment by Field of Study in Garey
Education (7 | 50.0%), physical & health sciences (4 | 28.6%), and liberal arts & history (3 | 21.4%) are the most common fields of study among 14 individuals in Garey who have obtained a bachelor's degree or higher.
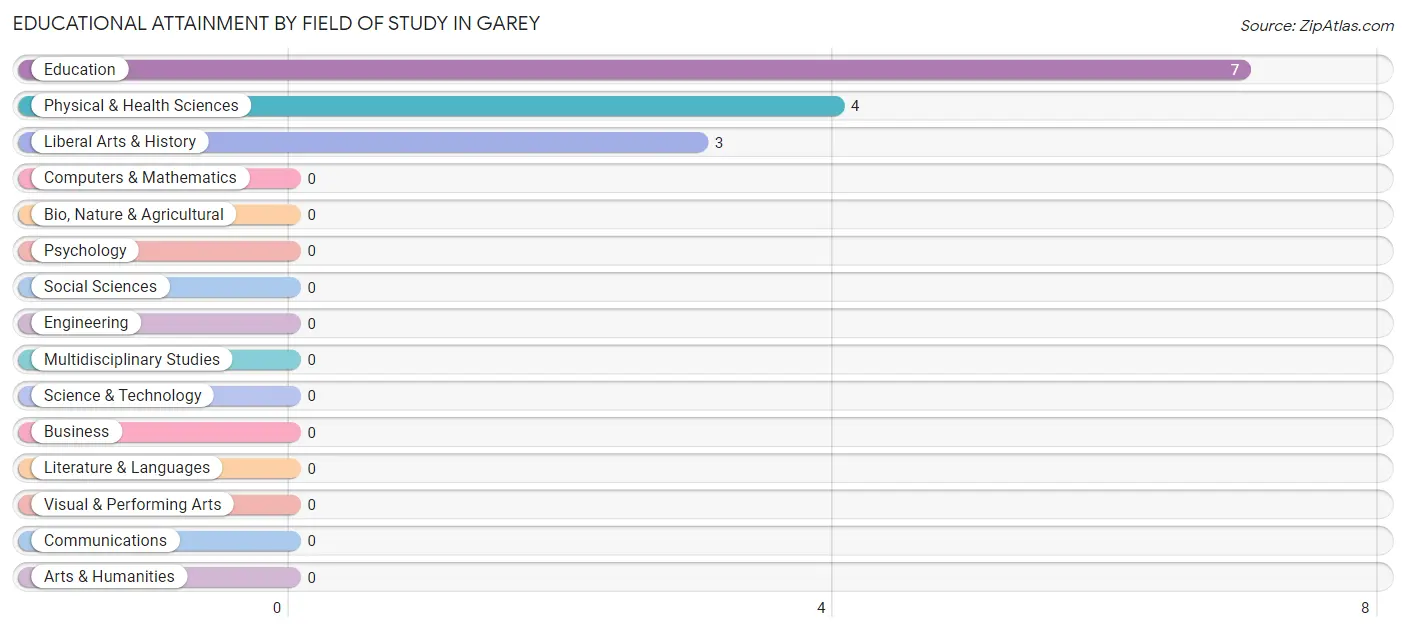
| Field of Study | # Graduates | % Graduates |
| Computers & Mathematics | 0 | 0.0% |
| Bio, Nature & Agricultural | 0 | 0.0% |
| Physical & Health Sciences | 4 | 28.6% |
| Psychology | 0 | 0.0% |
| Social Sciences | 0 | 0.0% |
| Engineering | 0 | 0.0% |
| Multidisciplinary Studies | 0 | 0.0% |
| Science & Technology | 0 | 0.0% |
| Business | 0 | 0.0% |
| Education | 7 | 50.0% |
| Literature & Languages | 0 | 0.0% |
| Liberal Arts & History | 3 | 21.4% |
| Visual & Performing Arts | 0 | 0.0% |
| Communications | 0 | 0.0% |
| Arts & Humanities | 0 | 0.0% |
| Total | 14 | 100.0% |
Transportation & Commute in Garey
Vehicle Availability by Sex in Garey
The most prevalent vehicle ownership categories in Garey are males with 1 vehicle (9, accounting for 75.0%) and females with 1 vehicle (1, making up 81.8%).
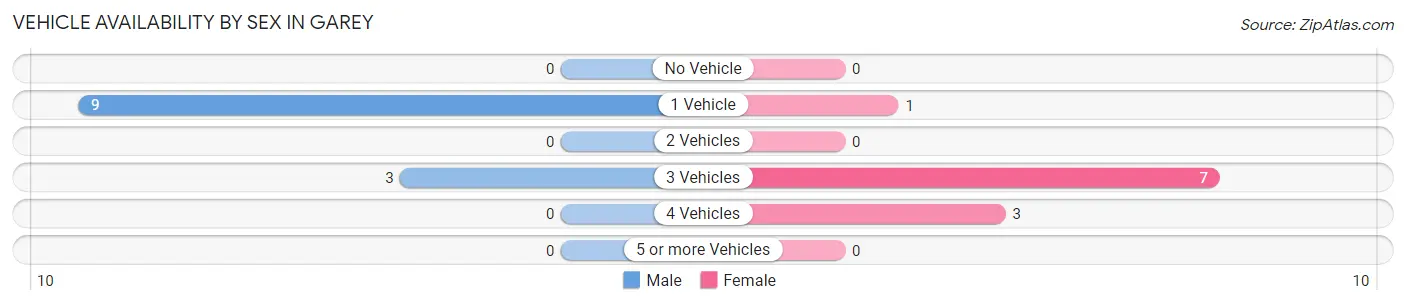
| Vehicles Available | Male | Female |
| No Vehicle | 0 (0.0%) | 0 (0.0%) |
| 1 Vehicle | 9 (75.0%) | 1 (9.1%) |
| 2 Vehicles | 0 (0.0%) | 0 (0.0%) |
| 3 Vehicles | 3 (25.0%) | 7 (63.6%) |
| 4 Vehicles | 0 (0.0%) | 3 (27.3%) |
| 5 or more Vehicles | 0 (0.0%) | 0 (0.0%) |
| Total | 12 (100.0%) | 11 (100.0%) |
Commute Time in Garey
The most frequently occuring commute durations in Garey are 10 to 14 minutes (7 commuters, 30.4%), 15 to 19 minutes (4 commuters, 17.4%), and 40 to 44 minutes (4 commuters, 17.4%).
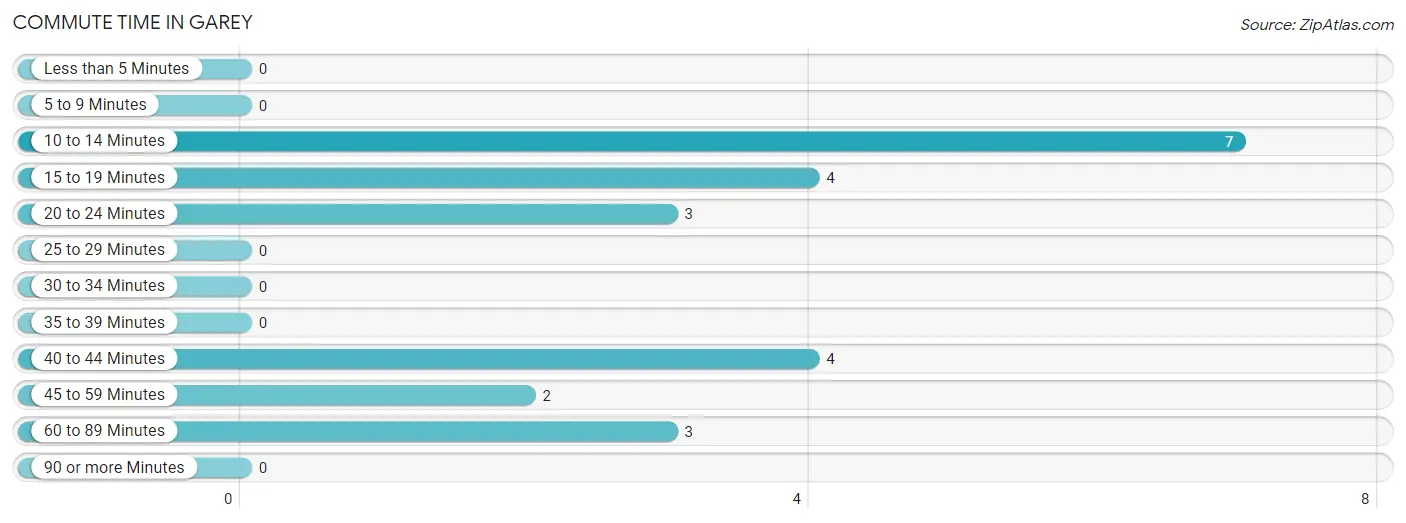
| Commute Time | # Commuters | % Commuters |
| Less than 5 Minutes | 0 | 0.0% |
| 5 to 9 Minutes | 0 | 0.0% |
| 10 to 14 Minutes | 7 | 30.4% |
| 15 to 19 Minutes | 4 | 17.4% |
| 20 to 24 Minutes | 3 | 13.0% |
| 25 to 29 Minutes | 0 | 0.0% |
| 30 to 34 Minutes | 0 | 0.0% |
| 35 to 39 Minutes | 0 | 0.0% |
| 40 to 44 Minutes | 4 | 17.4% |
| 45 to 59 Minutes | 2 | 8.7% |
| 60 to 89 Minutes | 3 | 13.0% |
| 90 or more Minutes | 0 | 0.0% |
Commute Time by Sex in Garey
The most common commute times in Garey are 10 to 14 minutes (7 commuters, 58.3%) for males and 15 to 19 minutes (4 commuters, 36.4%) for females.
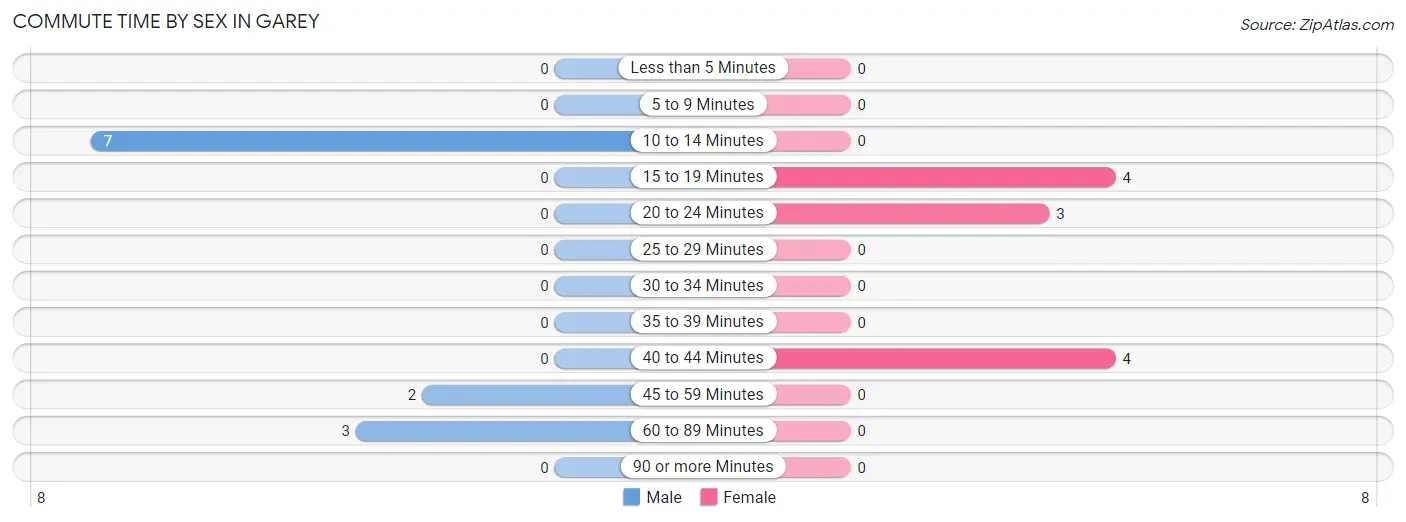
| Commute Time | Male | Female |
| Less than 5 Minutes | 0 (0.0%) | 0 (0.0%) |
| 5 to 9 Minutes | 0 (0.0%) | 0 (0.0%) |
| 10 to 14 Minutes | 7 (58.3%) | 0 (0.0%) |
| 15 to 19 Minutes | 0 (0.0%) | 4 (36.4%) |
| 20 to 24 Minutes | 0 (0.0%) | 3 (27.3%) |
| 25 to 29 Minutes | 0 (0.0%) | 0 (0.0%) |
| 30 to 34 Minutes | 0 (0.0%) | 0 (0.0%) |
| 35 to 39 Minutes | 0 (0.0%) | 0 (0.0%) |
| 40 to 44 Minutes | 0 (0.0%) | 4 (36.4%) |
| 45 to 59 Minutes | 2 (16.7%) | 0 (0.0%) |
| 60 to 89 Minutes | 3 (25.0%) | 0 (0.0%) |
| 90 or more Minutes | 0 (0.0%) | 0 (0.0%) |
Time of Departure to Work by Sex in Garey
The most frequent times of departure to work in Garey are 5:00 AM to 5:29 AM (7, 58.3%) for males and 6:00 AM to 6:29 AM (5, 45.5%) for females.
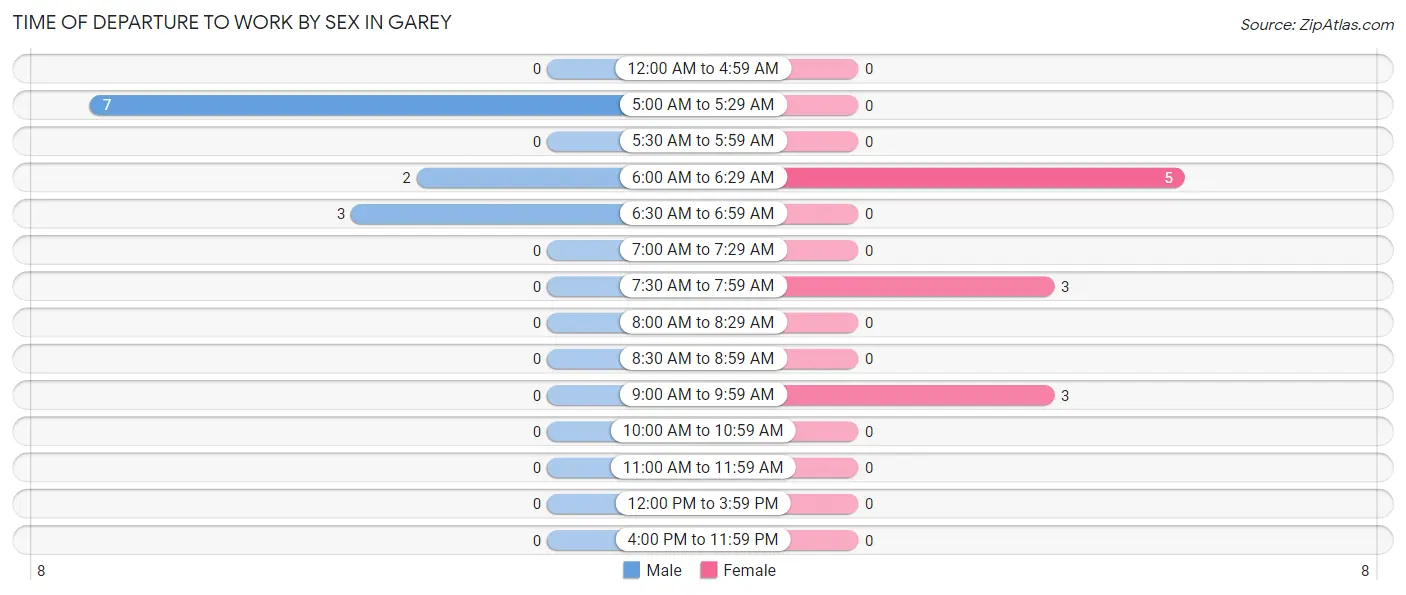
| Time of Departure | Male | Female |
| 12:00 AM to 4:59 AM | 0 (0.0%) | 0 (0.0%) |
| 5:00 AM to 5:29 AM | 7 (58.3%) | 0 (0.0%) |
| 5:30 AM to 5:59 AM | 0 (0.0%) | 0 (0.0%) |
| 6:00 AM to 6:29 AM | 2 (16.7%) | 5 (45.5%) |
| 6:30 AM to 6:59 AM | 3 (25.0%) | 0 (0.0%) |
| 7:00 AM to 7:29 AM | 0 (0.0%) | 0 (0.0%) |
| 7:30 AM to 7:59 AM | 0 (0.0%) | 3 (27.3%) |
| 8:00 AM to 8:29 AM | 0 (0.0%) | 0 (0.0%) |
| 8:30 AM to 8:59 AM | 0 (0.0%) | 0 (0.0%) |
| 9:00 AM to 9:59 AM | 0 (0.0%) | 3 (27.3%) |
| 10:00 AM to 10:59 AM | 0 (0.0%) | 0 (0.0%) |
| 11:00 AM to 11:59 AM | 0 (0.0%) | 0 (0.0%) |
| 12:00 PM to 3:59 PM | 0 (0.0%) | 0 (0.0%) |
| 4:00 PM to 11:59 PM | 0 (0.0%) | 0 (0.0%) |
| Total | 12 (100.0%) | 11 (100.0%) |
Housing Occupancy in Garey
Occupancy by Ownership in Garey
Of the total 25 dwellings in Garey, owner-occupied units account for 25 (100.0%), while renter-occupied units make up 0 (0.0%).
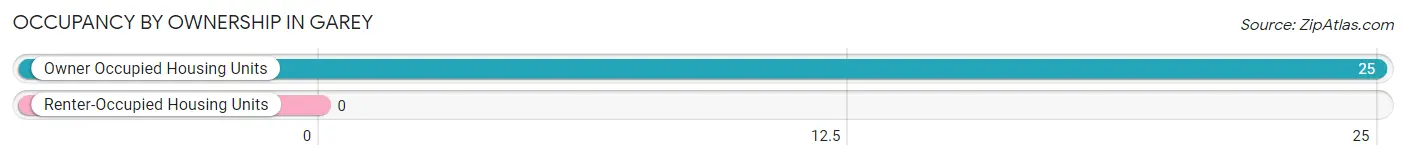
| Occupancy | # Housing Units | % Housing Units |
| Owner Occupied Housing Units | 25 | 100.0% |
| Renter-Occupied Housing Units | 0 | 0.0% |
| Total Occupied Housing Units | 25 | 100.0% |
Occupancy by Household Size in Garey
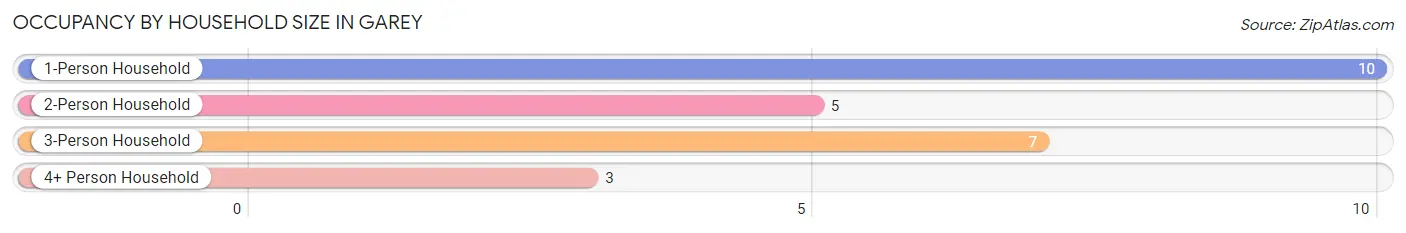
| Household Size | # Housing Units | % Housing Units |
| 1-Person Household | 10 | 40.0% |
| 2-Person Household | 5 | 20.0% |
| 3-Person Household | 7 | 28.0% |
| 4+ Person Household | 3 | 12.0% |
| Total Housing Units | 25 | 100.0% |
Occupancy by Ownership by Household Size in Garey
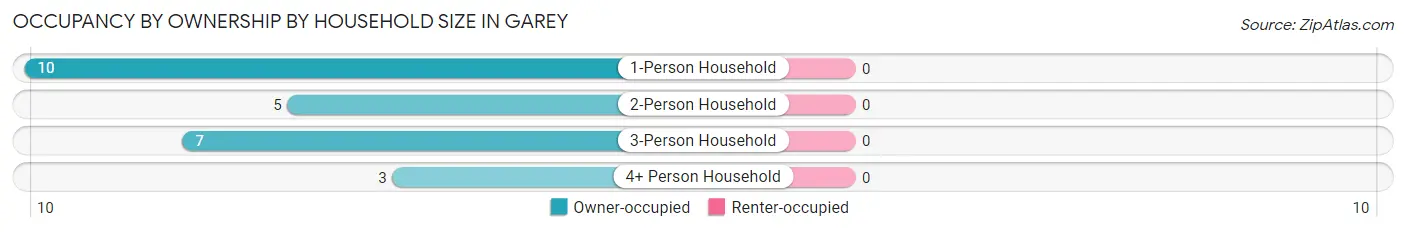
| Household Size | Owner-occupied | Renter-occupied |
| 1-Person Household | 10 (100.0%) | 0 (0.0%) |
| 2-Person Household | 5 (100.0%) | 0 (0.0%) |
| 3-Person Household | 7 (100.0%) | 0 (0.0%) |
| 4+ Person Household | 3 (100.0%) | 0 (0.0%) |
| Total Housing Units | 25 (100.0%) | 0 (0.0%) |
Occupancy by Educational Attainment in Garey
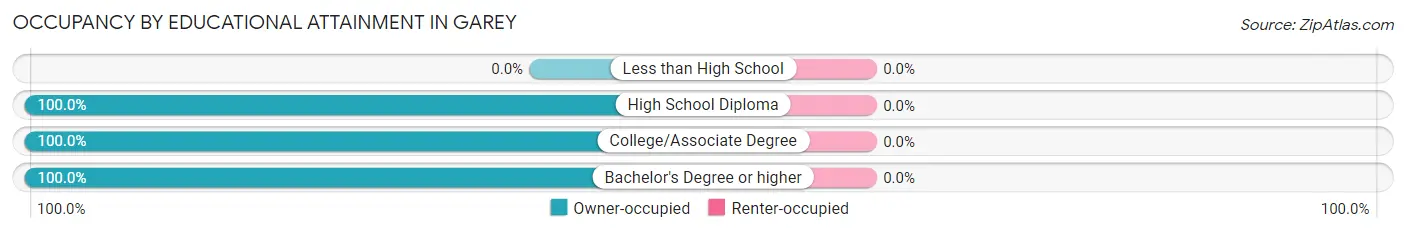
| Household Size | Owner-occupied | Renter-occupied |
| Less than High School | 0 (0.0%) | 0 (0.0%) |
| High School Diploma | 8 (100.0%) | 0 (0.0%) |
| College/Associate Degree | 13 (100.0%) | 0 (0.0%) |
| Bachelor's Degree or higher | 4 (100.0%) | 0 (0.0%) |
Occupancy by Age of Householder in Garey
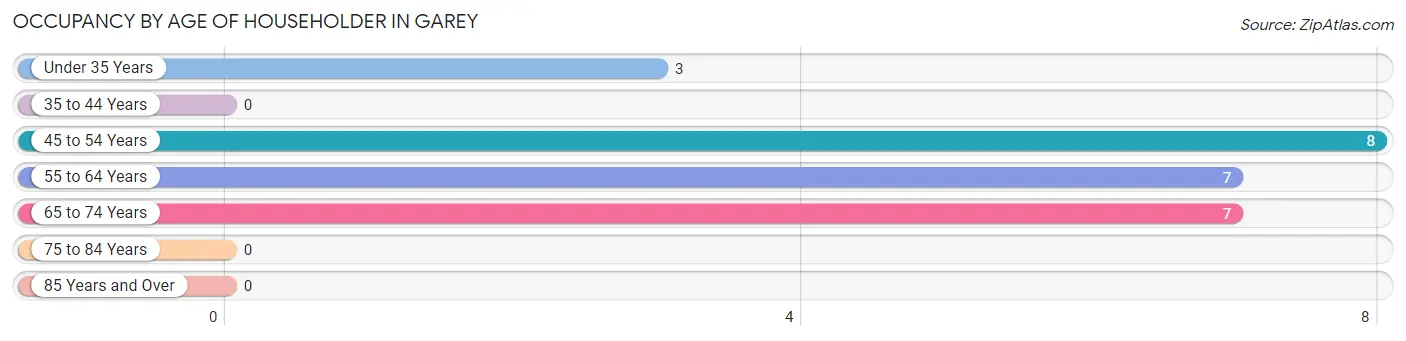
| Age Bracket | # Households | % Households |
| Under 35 Years | 3 | 12.0% |
| 35 to 44 Years | 0 | 0.0% |
| 45 to 54 Years | 8 | 32.0% |
| 55 to 64 Years | 7 | 28.0% |
| 65 to 74 Years | 7 | 28.0% |
| 75 to 84 Years | 0 | 0.0% |
| 85 Years and Over | 0 | 0.0% |
| Total | 25 | 100.0% |
Housing Finances in Garey
Median Income by Occupancy in Garey
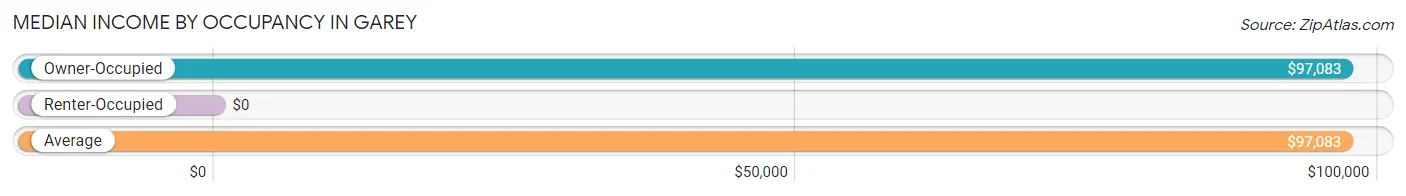
| Occupancy Type | # Households | Median Income |
| Owner-Occupied | 25 (100.0%) | $97,083 |
| Renter-Occupied | 0 (0.0%) | $0 |
| Average | 25 (100.0%) | $97,083 |
Occupancy by Householder Income Bracket in Garey
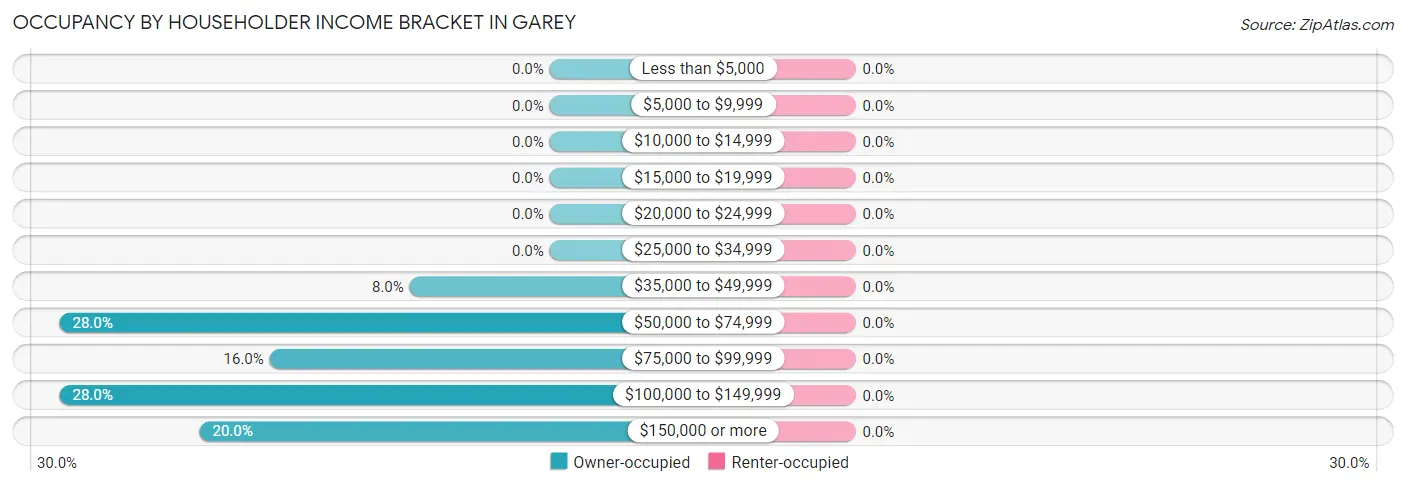
| Income Bracket | Owner-occupied | Renter-occupied |
| Less than $5,000 | 0 (0.0%) | 0 (0.0%) |
| $5,000 to $9,999 | 0 (0.0%) | 0 (0.0%) |
| $10,000 to $14,999 | 0 (0.0%) | 0 (0.0%) |
| $15,000 to $19,999 | 0 (0.0%) | 0 (0.0%) |
| $20,000 to $24,999 | 0 (0.0%) | 0 (0.0%) |
| $25,000 to $34,999 | 0 (0.0%) | 0 (0.0%) |
| $35,000 to $49,999 | 2 (8.0%) | 0 (0.0%) |
| $50,000 to $74,999 | 7 (28.0%) | 0 (0.0%) |
| $75,000 to $99,999 | 4 (16.0%) | 0 (0.0%) |
| $100,000 to $149,999 | 7 (28.0%) | 0 (0.0%) |
| $150,000 or more | 5 (20.0%) | 0 (0.0%) |
| Total | 25 (100.0%) | 0 (0.0%) |
Monthly Housing Cost Tiers in Garey
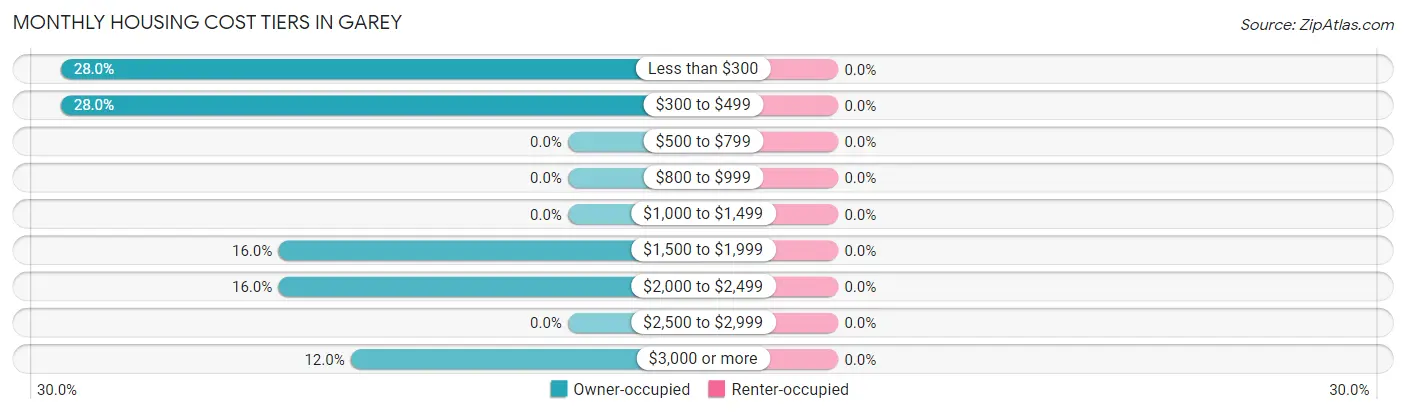
| Monthly Cost | Owner-occupied | Renter-occupied |
| Less than $300 | 7 (28.0%) | 0 (0.0%) |
| $300 to $499 | 7 (28.0%) | 0 (0.0%) |
| $500 to $799 | 0 (0.0%) | 0 (0.0%) |
| $800 to $999 | 0 (0.0%) | 0 (0.0%) |
| $1,000 to $1,499 | 0 (0.0%) | 0 (0.0%) |
| $1,500 to $1,999 | 4 (16.0%) | 0 (0.0%) |
| $2,000 to $2,499 | 4 (16.0%) | 0 (0.0%) |
| $2,500 to $2,999 | 0 (0.0%) | 0 (0.0%) |
| $3,000 or more | 3 (12.0%) | 0 (0.0%) |
| Total | 25 (100.0%) | 0 (0.0%) |
Physical Housing Characteristics in Garey
Housing Structures in Garey
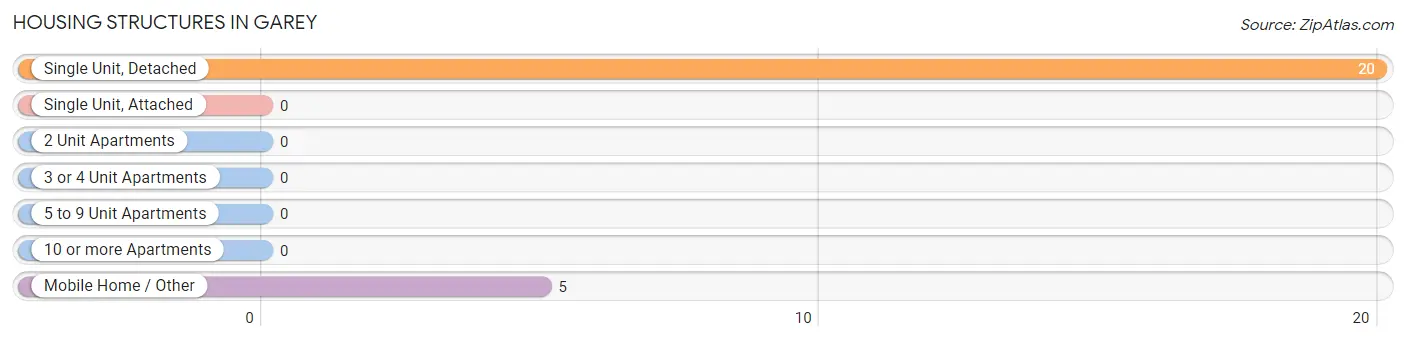
| Structure Type | # Housing Units | % Housing Units |
| Single Unit, Detached | 20 | 80.0% |
| Single Unit, Attached | 0 | 0.0% |
| 2 Unit Apartments | 0 | 0.0% |
| 3 or 4 Unit Apartments | 0 | 0.0% |
| 5 to 9 Unit Apartments | 0 | 0.0% |
| 10 or more Apartments | 0 | 0.0% |
| Mobile Home / Other | 5 | 20.0% |
| Total | 25 | 100.0% |
Housing Structures by Occupancy in Garey
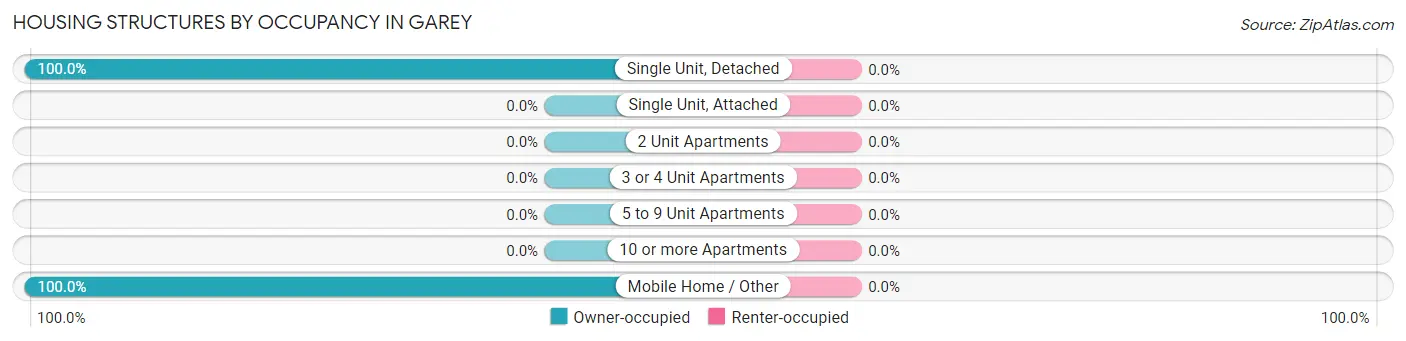
| Structure Type | Owner-occupied | Renter-occupied |
| Single Unit, Detached | 20 (100.0%) | 0 (0.0%) |
| Single Unit, Attached | 0 (0.0%) | 0 (0.0%) |
| 2 Unit Apartments | 0 (0.0%) | 0 (0.0%) |
| 3 or 4 Unit Apartments | 0 (0.0%) | 0 (0.0%) |
| 5 to 9 Unit Apartments | 0 (0.0%) | 0 (0.0%) |
| 10 or more Apartments | 0 (0.0%) | 0 (0.0%) |
| Mobile Home / Other | 5 (100.0%) | 0 (0.0%) |
| Total | 25 (100.0%) | 0 (0.0%) |
Housing Structures by Number of Rooms in Garey
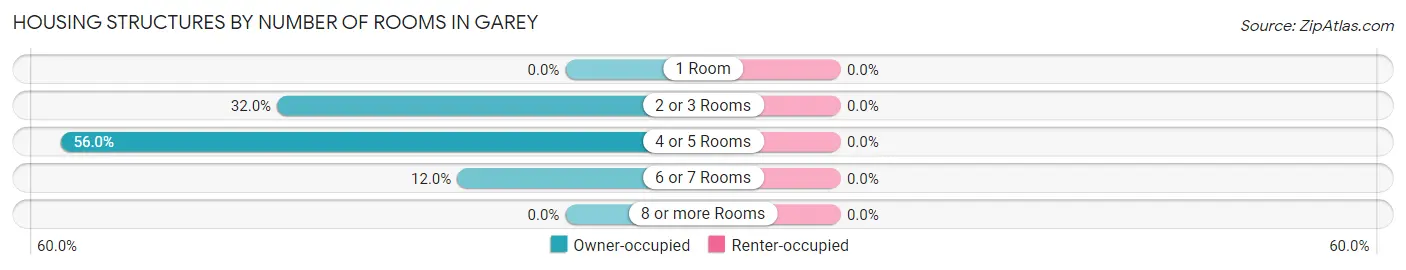
| Number of Rooms | Owner-occupied | Renter-occupied |
| 1 Room | 0 (0.0%) | 0 (0.0%) |
| 2 or 3 Rooms | 8 (32.0%) | 0 (0.0%) |
| 4 or 5 Rooms | 14 (56.0%) | 0 (0.0%) |
| 6 or 7 Rooms | 3 (12.0%) | 0 (0.0%) |
| 8 or more Rooms | 0 (0.0%) | 0 (0.0%) |
| Total | 25 (100.0%) | 0 (0.0%) |
Housing Structure by Heating Type in Garey
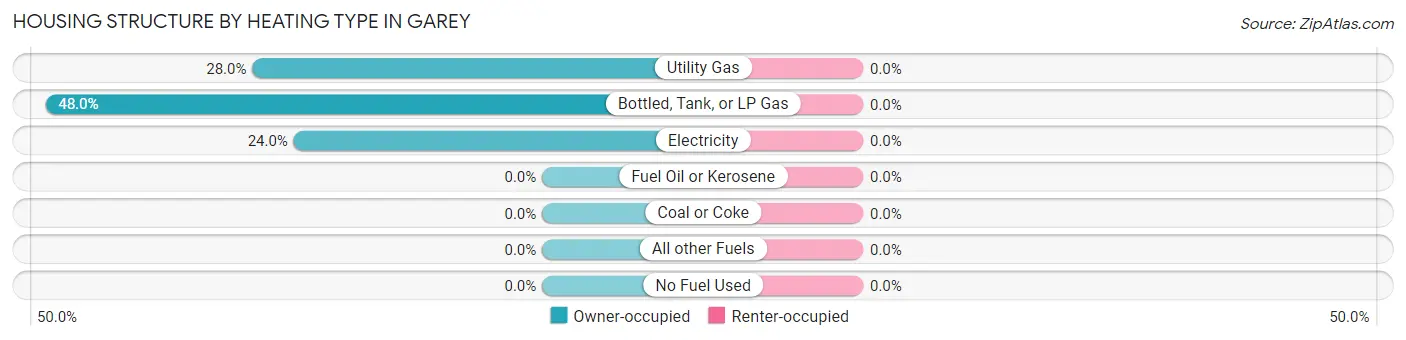
| Heating Type | Owner-occupied | Renter-occupied |
| Utility Gas | 7 (28.0%) | 0 (0.0%) |
| Bottled, Tank, or LP Gas | 12 (48.0%) | 0 (0.0%) |
| Electricity | 6 (24.0%) | 0 (0.0%) |
| Fuel Oil or Kerosene | 0 (0.0%) | 0 (0.0%) |
| Coal or Coke | 0 (0.0%) | 0 (0.0%) |
| All other Fuels | 0 (0.0%) | 0 (0.0%) |
| No Fuel Used | 0 (0.0%) | 0 (0.0%) |
| Total | 25 (100.0%) | 0 (0.0%) |
Household Vehicle Usage in Garey
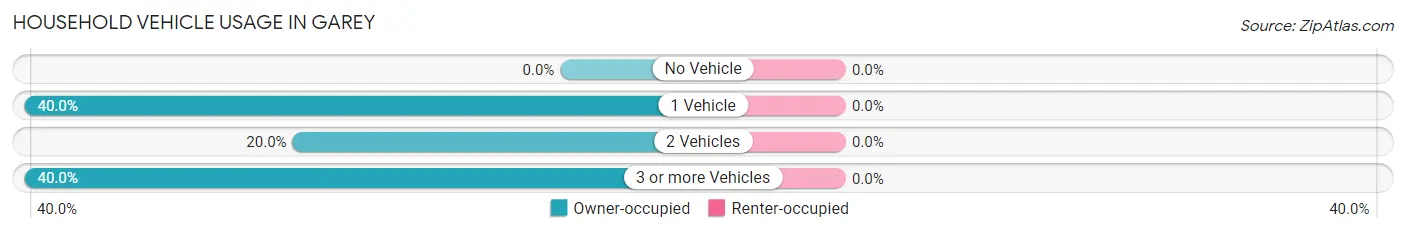
| Vehicles per Household | Owner-occupied | Renter-occupied |
| No Vehicle | 0 (0.0%) | 0 (0.0%) |
| 1 Vehicle | 10 (40.0%) | 0 (0.0%) |
| 2 Vehicles | 5 (20.0%) | 0 (0.0%) |
| 3 or more Vehicles | 10 (40.0%) | 0 (0.0%) |
| Total | 25 (100.0%) | 0 (0.0%) |
Real Estate & Mortgages in Garey
Real Estate and Mortgage Overview in Garey
| Characteristic | Without Mortgage | With Mortgage |
| Housing Units | 14 | 11 |
| Median Property Value | $428,600 | $0 |
| Median Household Income | $71,786 | $3 |
| Monthly Housing Costs | $350 | $3 |
| Real Estate Taxes | - | - |
Property Value by Mortgage Status in Garey
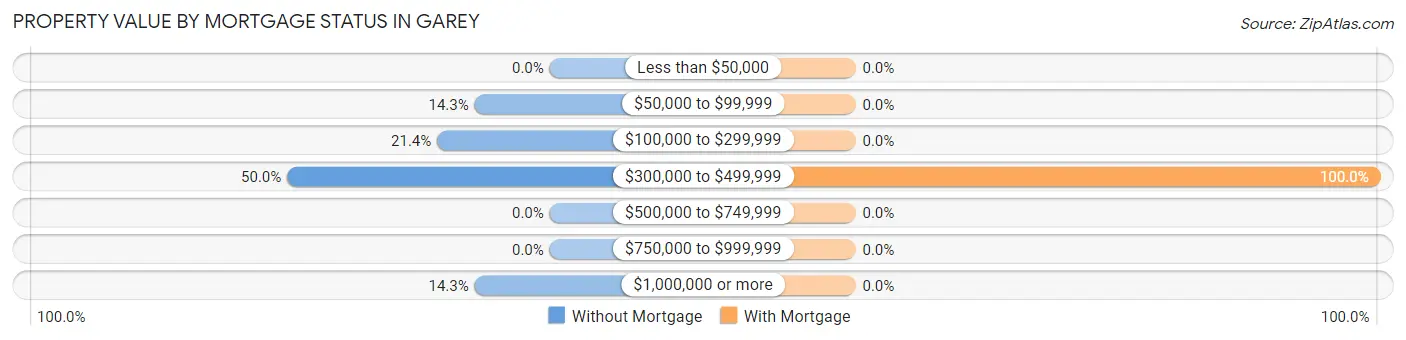
| Property Value | Without Mortgage | With Mortgage |
| Less than $50,000 | 0 (0.0%) | 0 (0.0%) |
| $50,000 to $99,999 | 2 (14.3%) | 0 (0.0%) |
| $100,000 to $299,999 | 3 (21.4%) | 0 (0.0%) |
| $300,000 to $499,999 | 7 (50.0%) | 11 (100.0%) |
| $500,000 to $749,999 | 0 (0.0%) | 0 (0.0%) |
| $750,000 to $999,999 | 0 (0.0%) | 0 (0.0%) |
| $1,000,000 or more | 2 (14.3%) | 0 (0.0%) |
| Total | 14 (100.0%) | 11 (100.0%) |
Household Income by Mortgage Status in Garey
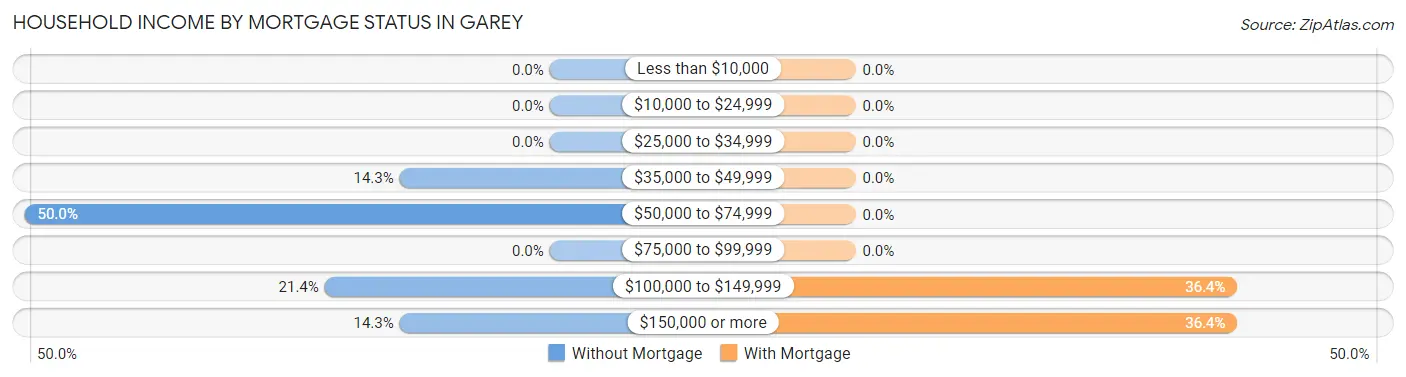
| Household Income | Without Mortgage | With Mortgage |
| Less than $10,000 | 0 (0.0%) | 0 (0.0%) |
| $10,000 to $24,999 | 0 (0.0%) | 0 (0.0%) |
| $25,000 to $34,999 | 0 (0.0%) | 0 (0.0%) |
| $35,000 to $49,999 | 2 (14.3%) | 0 (0.0%) |
| $50,000 to $74,999 | 7 (50.0%) | 0 (0.0%) |
| $75,000 to $99,999 | 0 (0.0%) | 0 (0.0%) |
| $100,000 to $149,999 | 3 (21.4%) | 4 (36.4%) |
| $150,000 or more | 2 (14.3%) | 4 (36.4%) |
| Total | 14 (100.0%) | 11 (100.0%) |
Property Value to Household Income Ratio in Garey
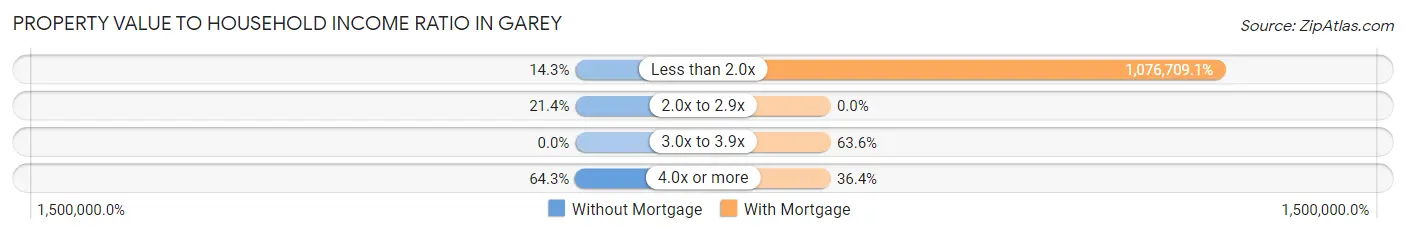
| Value-to-Income Ratio | Without Mortgage | With Mortgage |
| Less than 2.0x | 2 (14.3%) | 118,438 (1,076,709.1%) |
| 2.0x to 2.9x | 3 (21.4%) | 0 (0.0%) |
| 3.0x to 3.9x | 0 (0.0%) | 7 (63.6%) |
| 4.0x or more | 9 (64.3%) | 4 (36.4%) |
| Total | 14 (100.0%) | 11 (100.0%) |
Real Estate Taxes by Mortgage Status in Garey
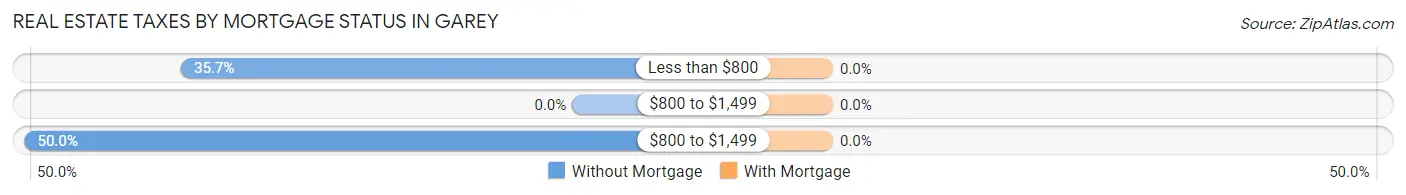
| Property Taxes | Without Mortgage | With Mortgage |
| Less than $800 | 5 (35.7%) | 0 (0.0%) |
| $800 to $1,499 | 0 (0.0%) | 0 (0.0%) |
| $800 to $1,499 | 7 (50.0%) | 0 (0.0%) |
| Total | 14 (100.0%) | 11 (100.0%) |
Health & Disability in Garey
Health Insurance Coverage by Age in Garey
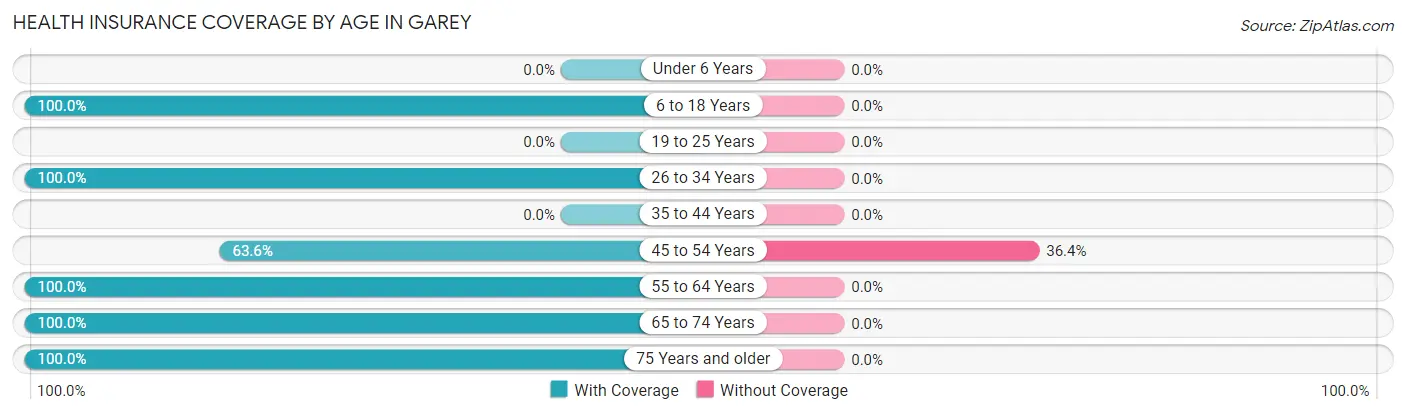
| Age Bracket | With Coverage | Without Coverage |
| Under 6 Years | 0 (0.0%) | 0 (0.0%) |
| 6 to 18 Years | 4 (100.0%) | 0 (0.0%) |
| 19 to 25 Years | 0 (0.0%) | 0 (0.0%) |
| 26 to 34 Years | 6 (100.0%) | 0 (0.0%) |
| 35 to 44 Years | 0 (0.0%) | 0 (0.0%) |
| 45 to 54 Years | 7 (63.6%) | 4 (36.4%) |
| 55 to 64 Years | 16 (100.0%) | 0 (0.0%) |
| 65 to 74 Years | 12 (100.0%) | 0 (0.0%) |
| 75 Years and older | 3 (100.0%) | 0 (0.0%) |
| Total | 48 (92.3%) | 4 (7.7%) |
Health Insurance Coverage by Citizenship Status in Garey
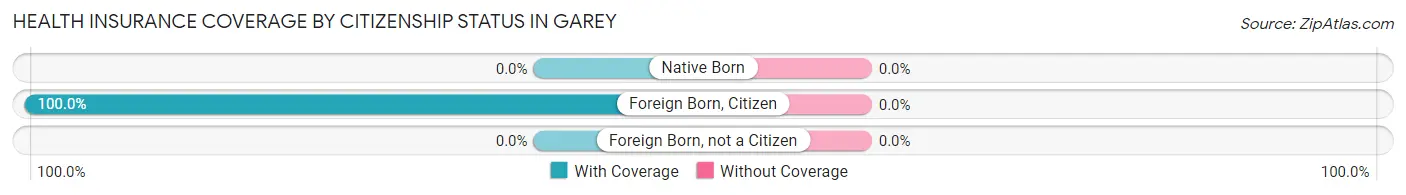
| Citizenship Status | With Coverage | Without Coverage |
| Native Born | 0 (0.0%) | 0 (0.0%) |
| Foreign Born, Citizen | 4 (100.0%) | 0 (0.0%) |
| Foreign Born, not a Citizen | 0 (0.0%) | 0 (0.0%) |
Health Insurance Coverage by Household Income in Garey
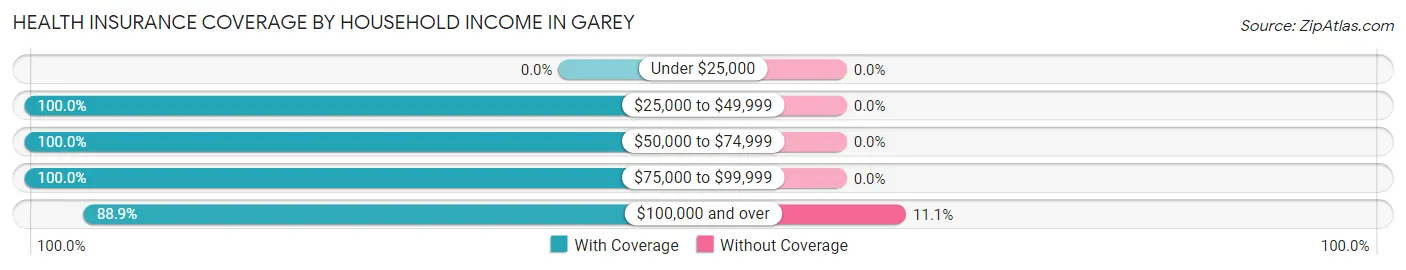
| Household Income | With Coverage | Without Coverage |
| Under $25,000 | 0 (0.0%) | 0 (0.0%) |
| $25,000 to $49,999 | 2 (100.0%) | 0 (0.0%) |
| $50,000 to $74,999 | 7 (100.0%) | 0 (0.0%) |
| $75,000 to $99,999 | 7 (100.0%) | 0 (0.0%) |
| $100,000 and over | 32 (88.9%) | 4 (11.1%) |
Public vs Private Health Insurance Coverage by Age in Garey
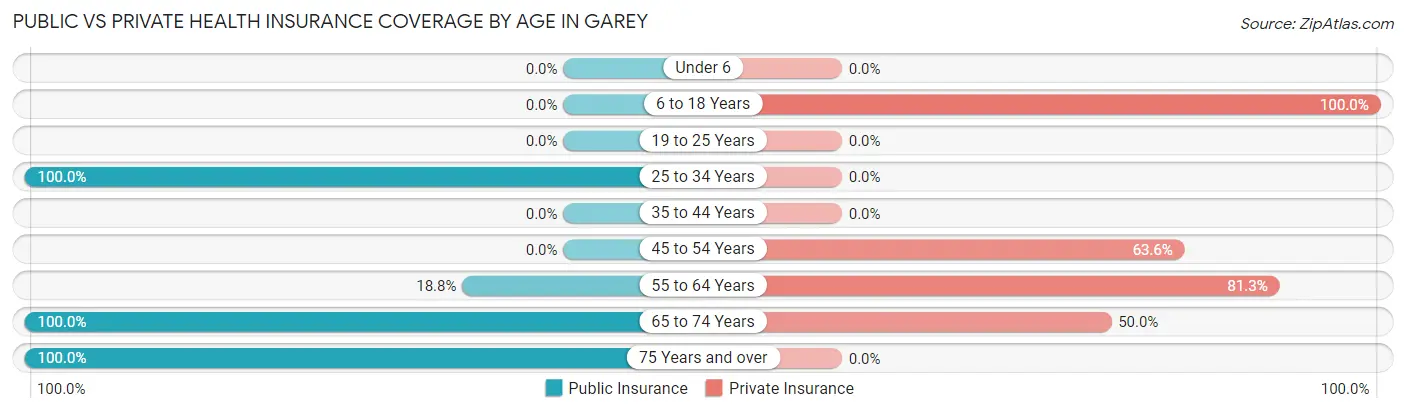
| Age Bracket | Public Insurance | Private Insurance |
| Under 6 | 0 (0.0%) | 0 (0.0%) |
| 6 to 18 Years | 0 (0.0%) | 4 (100.0%) |
| 19 to 25 Years | 0 (0.0%) | 0 (0.0%) |
| 25 to 34 Years | 6 (100.0%) | 0 (0.0%) |
| 35 to 44 Years | 0 (0.0%) | 0 (0.0%) |
| 45 to 54 Years | 0 (0.0%) | 7 (63.6%) |
| 55 to 64 Years | 3 (18.8%) | 13 (81.2%) |
| 65 to 74 Years | 12 (100.0%) | 6 (50.0%) |
| 75 Years and over | 3 (100.0%) | 0 (0.0%) |
| Total | 24 (46.2%) | 30 (57.7%) |
Disability Status by Sex by Age in Garey
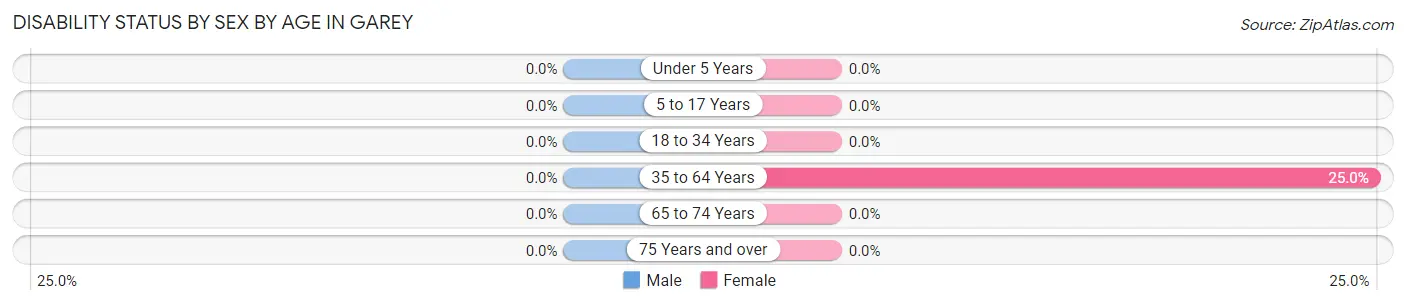
| Age Bracket | Male | Female |
| Under 5 Years | 0 (0.0%) | 0 (0.0%) |
| 5 to 17 Years | 0 (0.0%) | 0 (0.0%) |
| 18 to 34 Years | 0 (0.0%) | 0 (0.0%) |
| 35 to 64 Years | 0 (0.0%) | 4 (25.0%) |
| 65 to 74 Years | 0 (0.0%) | 0 (0.0%) |
| 75 Years and over | 0 (0.0%) | 0 (0.0%) |
Disability Class by Sex by Age in Garey
Disability Class: Hearing Difficulty
| Age Bracket | Male | Female |
| Under 5 Years | 0 (0.0%) | 0 (0.0%) |
| 5 to 17 Years | 0 (0.0%) | 0 (0.0%) |
| 18 to 34 Years | 0 (0.0%) | 0 (0.0%) |
| 35 to 64 Years | 0 (0.0%) | 0 (0.0%) |
| 65 to 74 Years | 0 (0.0%) | 0 (0.0%) |
| 75 Years and over | 0 (0.0%) | 0 (0.0%) |
Disability Class: Vision Difficulty
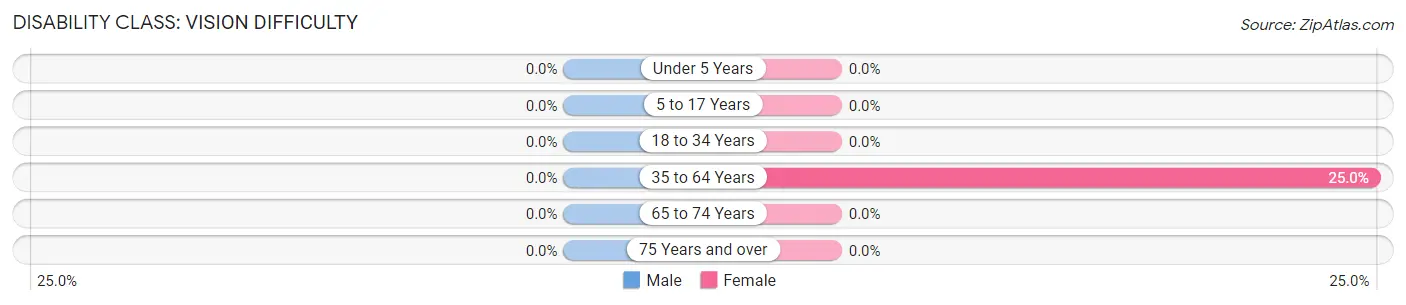
| Age Bracket | Male | Female |
| Under 5 Years | 0 (0.0%) | 0 (0.0%) |
| 5 to 17 Years | 0 (0.0%) | 0 (0.0%) |
| 18 to 34 Years | 0 (0.0%) | 0 (0.0%) |
| 35 to 64 Years | 0 (0.0%) | 4 (25.0%) |
| 65 to 74 Years | 0 (0.0%) | 0 (0.0%) |
| 75 Years and over | 0 (0.0%) | 0 (0.0%) |
Disability Class: Cognitive Difficulty
| Age Bracket | Male | Female |
| 5 to 17 Years | 0 (0.0%) | 0 (0.0%) |
| 18 to 34 Years | 0 (0.0%) | 0 (0.0%) |
| 35 to 64 Years | 0 (0.0%) | 0 (0.0%) |
| 65 to 74 Years | 0 (0.0%) | 0 (0.0%) |
| 75 Years and over | 0 (0.0%) | 0 (0.0%) |
Disability Class: Ambulatory Difficulty
| Age Bracket | Male | Female |
| 5 to 17 Years | 0 (0.0%) | 0 (0.0%) |
| 18 to 34 Years | 0 (0.0%) | 0 (0.0%) |
| 35 to 64 Years | 0 (0.0%) | 0 (0.0%) |
| 65 to 74 Years | 0 (0.0%) | 0 (0.0%) |
| 75 Years and over | 0 (0.0%) | 0 (0.0%) |
Disability Class: Self-Care Difficulty
| Age Bracket | Male | Female |
| 5 to 17 Years | 0 (0.0%) | 0 (0.0%) |
| 18 to 34 Years | 0 (0.0%) | 0 (0.0%) |
| 35 to 64 Years | 0 (0.0%) | 0 (0.0%) |
| 65 to 74 Years | 0 (0.0%) | 0 (0.0%) |
| 75 Years and over | 0 (0.0%) | 0 (0.0%) |
Technology Access in Garey
Computing Device Access in Garey
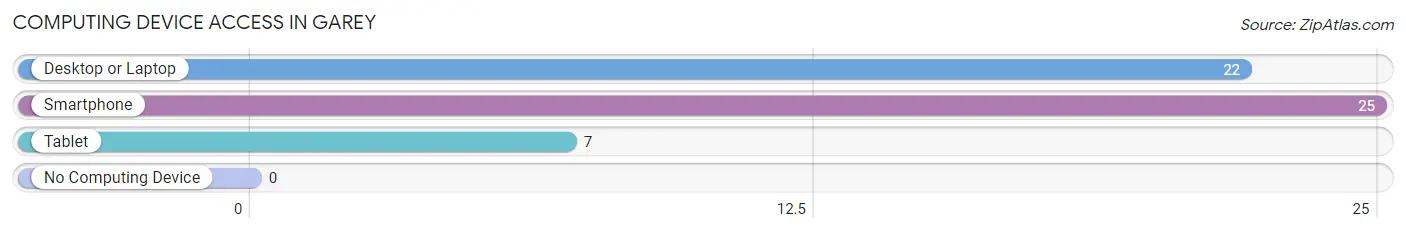
| Device Type | # Households | % Households |
| Desktop or Laptop | 22 | 88.0% |
| Smartphone | 25 | 100.0% |
| Tablet | 7 | 28.0% |
| No Computing Device | 0 | 0.0% |
| Total | 25 | 100.0% |
Internet Access in Garey
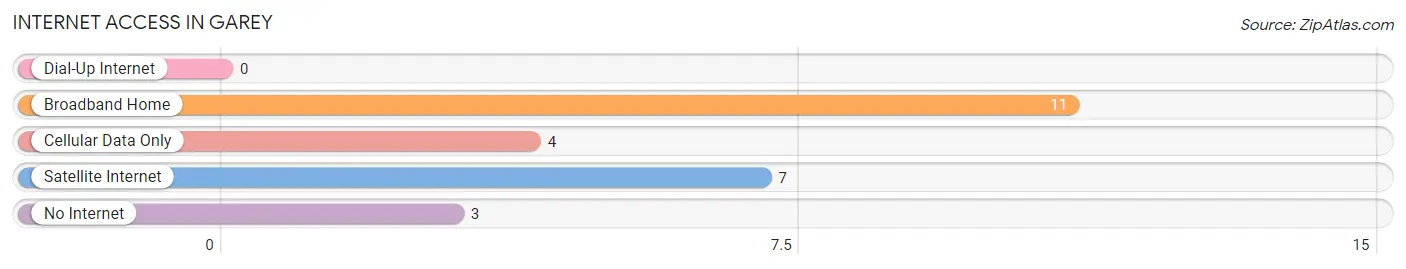
| Internet Type | # Households | % Households |
| Dial-Up Internet | 0 | 0.0% |
| Broadband Home | 11 | 44.0% |
| Cellular Data Only | 4 | 16.0% |
| Satellite Internet | 7 | 28.0% |
| No Internet | 3 | 12.0% |
| Total | 25 | 100.0% |
Garey Summary
Garey is a small unincorporated community located in Santa Barbara County, California. It is situated in the Santa Ynez Valley, approximately 8 miles east of the city of Santa Barbara. The population of Garey was estimated to be around 1,000 people in 2020.
History
Garey was founded in 1887 by William Garey, a rancher from San Luis Obispo. He purchased the land from the local Chumash Indians and began to develop the area. Garey was originally a small farming community, with the main crops being wheat, barley, and oats. In the early 1900s, Garey began to grow in population as more people moved to the area. The town was incorporated in 1911 and the first post office was established in 1912.
Geography
Garey is located in the Santa Ynez Valley, which is part of the Central Coast region of California. The valley is surrounded by the Santa Ynez Mountains to the north and the San Rafael Mountains to the south. The climate in Garey is Mediterranean, with hot, dry summers and mild, wet winters. The average annual temperature is around 65°F (18°C).
Economy
Garey’s economy is largely based on agriculture and tourism. The main crops grown in the area are grapes, olives, and avocados. The area is also known for its wine production, with several wineries located in the area. Tourism is also an important part of the local economy, with many visitors coming to the area to enjoy the scenic views and outdoor activities.
Demographics
Garey is a predominantly white community, with the majority of the population being of European descent. The median household income in Garey is around $60,000, which is slightly higher than the national average. The median age of the population is around 40 years old.
Conclusion
Garey is a small unincorporated community located in Santa Barbara County, California. It has a long history of agriculture and tourism, and is known for its scenic views and outdoor activities. The population of Garey is predominantly white, with the median household income being slightly higher than the national average. Garey is a great place to live and visit, and is sure to provide a unique and enjoyable experience for all who visit.
Common Questions
What is Per Capita Income in Garey?
Per Capita income in Garey is $52,546.
What is the Median Family Income in Garey?
Median Family Income in Garey is $107,917.
What is the Median Household income in Garey?
Median Household Income in Garey is $97,083.
What is Inequality or Gini Index in Garey?
Inequality or Gini Index in Garey is 0.25.
What is the Total Population of Garey?
Total Population of Garey is 52.
What is the Total Male Population of Garey?
Total Male Population of Garey is 22.
What is the Total Female Population of Garey?
Total Female Population of Garey is 30.
What is the Ratio of Males per 100 Females in Garey?
There are 73.33 Males per 100 Females in Garey.
What is the Ratio of Females per 100 Males in Garey?
There are 136.36 Females per 100 Males in Garey.
What is the Median Population Age in Garey?
Median Population Age in Garey is 57.5 Years.
What is the Average Family Size in Garey
Average Family Size in Garey is 2.5 People.
What is the Average Household Size in Garey
Average Household Size in Garey is 2.1 People.
How Large is the Labor Force in Garey?
There are 30 People in the Labor Forcein in Garey.
What is the Percentage of People in the Labor Force in Garey?
57.7% of People are in the Labor Force in Garey.
What is the Unemployment Rate in Garey?
Unemployment Rate in Garey is 23.3%.