Fuller Acres, CA Map & Demographics
Fuller Acres Map
Fuller Acres Overview
$13,415
PER CAPITA INCOME
$42,596
AVG FAMILY INCOME
$39,125
AVG HOUSEHOLD INCOME
65.9%
WAGE / INCOME GAP [ % ]
34.1¢/ $1
WAGE / INCOME GAP [ $ ]
0.43
INEQUALITY / GINI INDEX
717
TOTAL POPULATION
369
MALE POPULATION
348
FEMALE POPULATION
106.03
MALES / 100 FEMALES
94.31
FEMALES / 100 MALES
30.1
MEDIAN AGE
4.5
AVG FAMILY SIZE
4.4
AVG HOUSEHOLD SIZE
256
LABOR FORCE [ PEOPLE ]
44.4%
PERCENT IN LABOR FORCE
10.9%
UNEMPLOYMENT RATE
Income in Fuller Acres
Income Overview in Fuller Acres
Per Capita Income in Fuller Acres is $13,415, while median incomes of families and households are $42,596 and $39,125 respectively.
| Characteristic | Number | Measure |
| Per Capita Income | 717 | $13,415 |
| Median Family Income | 135 | $42,596 |
| Mean Family Income | 135 | $57,180 |
| Median Household Income | 162 | $39,125 |
| Mean Household Income | 162 | $54,059 |
| Income Deficit | 135 | $0 |
| Wage / Income Gap (%) | 717 | 65.88% |
| Wage / Income Gap ($) | 717 | 34.12¢ per $1 |
| Gini / Inequality Index | 717 | 0.43 |
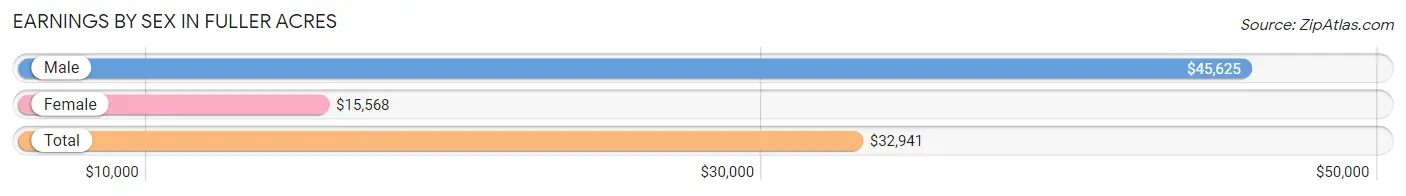
Earnings by Sex in Fuller Acres
Average Earnings in Fuller Acres are $32,941, $45,625 for men and $15,568 for women, a difference of 65.9%.
| Sex | Number | Average Earnings |
| Male | 148 (63.2%) | $45,625 |
| Female | 86 (36.7%) | $15,568 |
| Total | 234 (100.0%) | $32,941 |
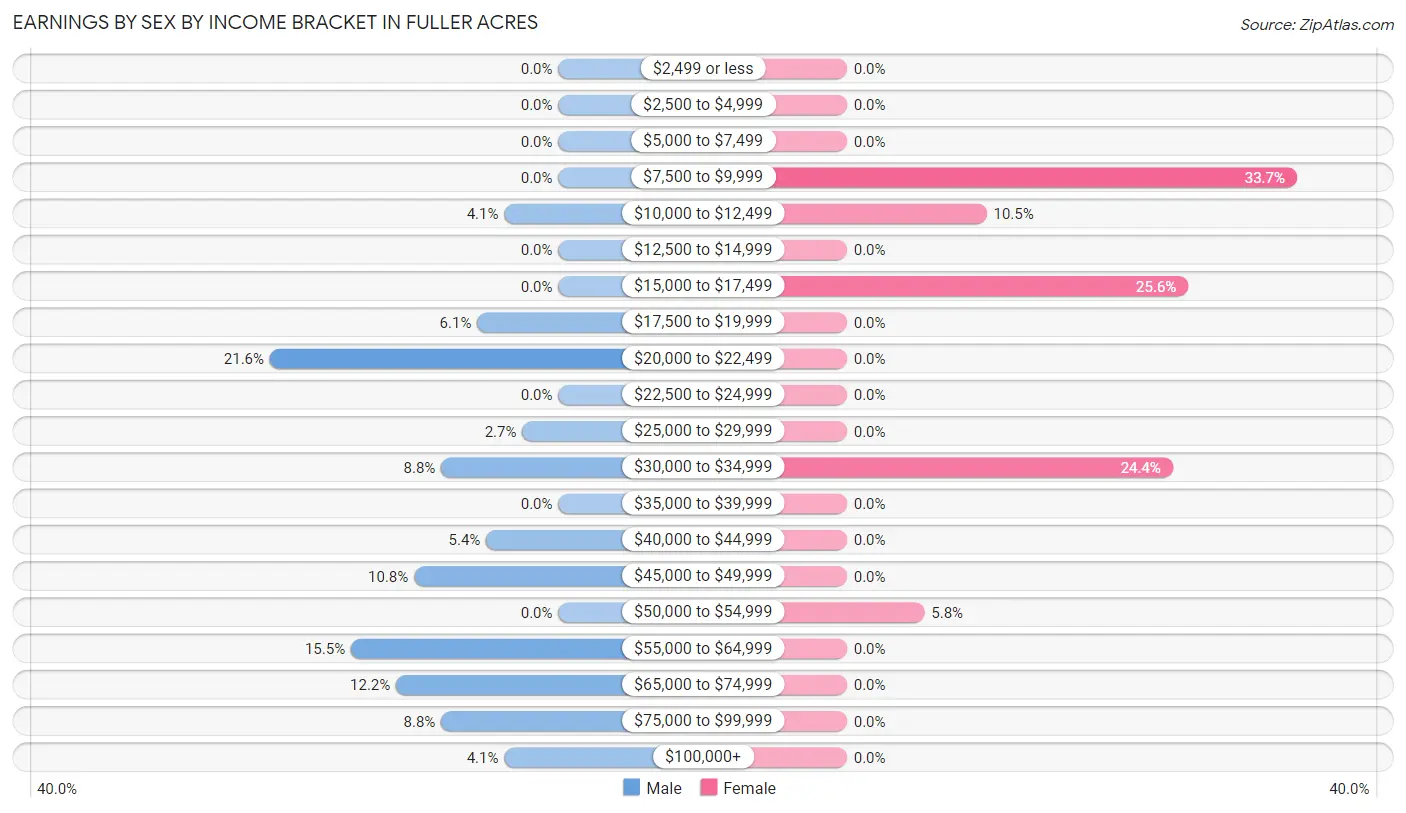
Earnings by Sex by Income Bracket in Fuller Acres
The most common earnings brackets in Fuller Acres are $20,000 to $22,499 for men (32 | 21.6%) and $7,500 to $9,999 for women (29 | 33.7%).
| Income | Male | Female |
| $2,499 or less | 0 (0.0%) | 0 (0.0%) |
| $2,500 to $4,999 | 0 (0.0%) | 0 (0.0%) |
| $5,000 to $7,499 | 0 (0.0%) | 0 (0.0%) |
| $7,500 to $9,999 | 0 (0.0%) | 29 (33.7%) |
| $10,000 to $12,499 | 6 (4.1%) | 9 (10.5%) |
| $12,500 to $14,999 | 0 (0.0%) | 0 (0.0%) |
| $15,000 to $17,499 | 0 (0.0%) | 22 (25.6%) |
| $17,500 to $19,999 | 9 (6.1%) | 0 (0.0%) |
| $20,000 to $22,499 | 32 (21.6%) | 0 (0.0%) |
| $22,500 to $24,999 | 0 (0.0%) | 0 (0.0%) |
| $25,000 to $29,999 | 4 (2.7%) | 0 (0.0%) |
| $30,000 to $34,999 | 13 (8.8%) | 21 (24.4%) |
| $35,000 to $39,999 | 0 (0.0%) | 0 (0.0%) |
| $40,000 to $44,999 | 8 (5.4%) | 0 (0.0%) |
| $45,000 to $49,999 | 16 (10.8%) | 0 (0.0%) |
| $50,000 to $54,999 | 0 (0.0%) | 5 (5.8%) |
| $55,000 to $64,999 | 23 (15.5%) | 0 (0.0%) |
| $65,000 to $74,999 | 18 (12.2%) | 0 (0.0%) |
| $75,000 to $99,999 | 13 (8.8%) | 0 (0.0%) |
| $100,000+ | 6 (4.1%) | 0 (0.0%) |
| Total | 148 (100.0%) | 86 (100.0%) |
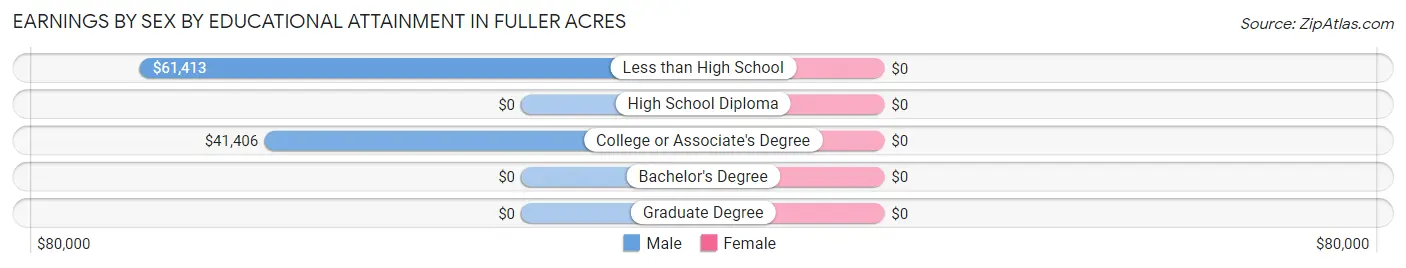
Earnings by Sex by Educational Attainment in Fuller Acres
| Educational Attainment | Male Income | Female Income |
| Less than High School | $61,413 | $0 |
| High School Diploma | - | - |
| College or Associate's Degree | $41,406 | $0 |
| Bachelor's Degree | - | - |
| Graduate Degree | - | - |
| Total | $60,054 | $0 |
Family Income in Fuller Acres
Family Income Brackets in Fuller Acres
According to the Fuller Acres family income data, there are 36 families falling into the $25,000 to $34,999 income range, which is the most common income bracket and makes up 26.7% of all families.
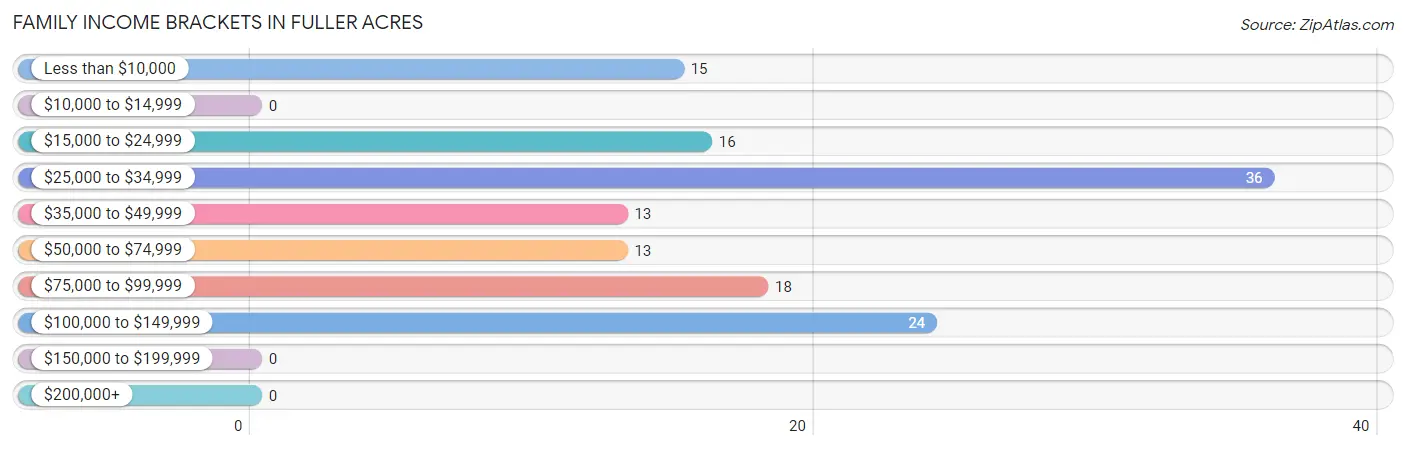
| Income Bracket | # Families | % Families |
| Less than $10,000 | 15 | 11.1% |
| $10,000 to $14,999 | 0 | 0.0% |
| $15,000 to $24,999 | 16 | 11.9% |
| $25,000 to $34,999 | 36 | 26.7% |
| $35,000 to $49,999 | 13 | 9.6% |
| $50,000 to $74,999 | 13 | 9.6% |
| $75,000 to $99,999 | 18 | 13.3% |
| $100,000 to $149,999 | 24 | 17.8% |
| $150,000 to $199,999 | 0 | 0.0% |
| $200,000+ | 0 | 0.0% |
Family Income by Famaliy Size in Fuller Acres
5-person families (31 | 23.0%) account for the highest median family income in Fuller Acres with $43,173 per family, while 5-person families (31 | 23.0%) have the highest median income of $8,635 per family member.
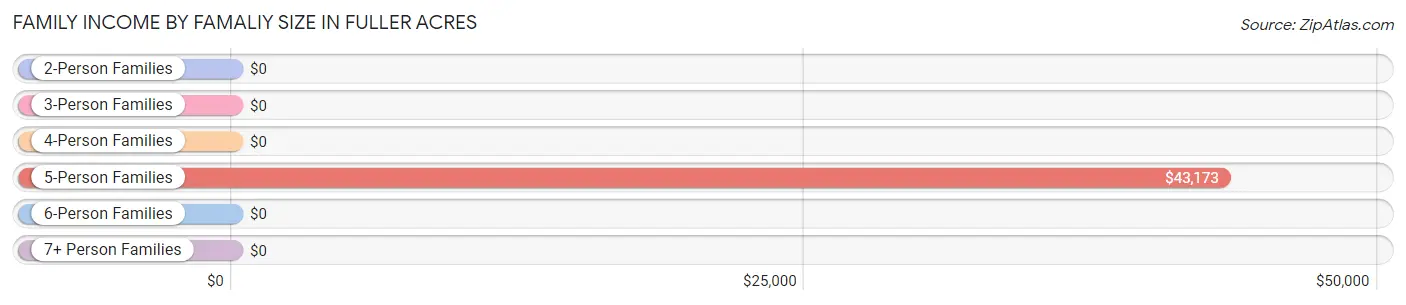
| Income Bracket | # Families | Median Income |
| 2-Person Families | 28 (20.7%) | $0 |
| 3-Person Families | 19 (14.1%) | $0 |
| 4-Person Families | 30 (22.2%) | $0 |
| 5-Person Families | 31 (23.0%) | $43,173 |
| 6-Person Families | 7 (5.2%) | $0 |
| 7+ Person Families | 20 (14.8%) | $0 |
| Total | 135 (100.0%) | $42,596 |
Family Income by Number of Earners in Fuller Acres
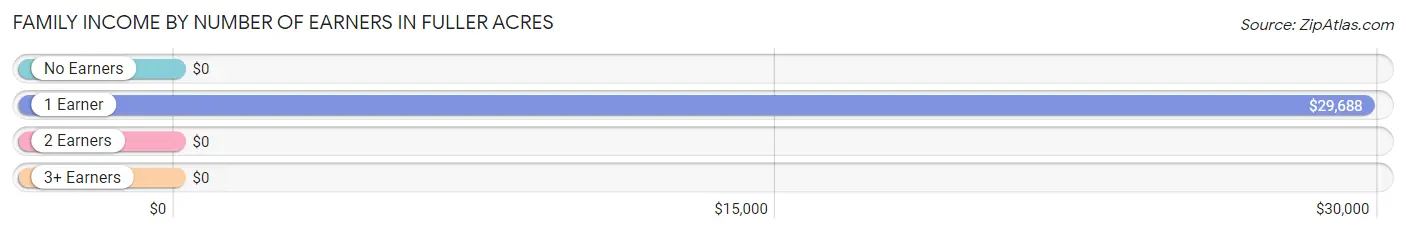
| Number of Earners | # Families | Median Income |
| No Earners | 19 (14.1%) | $0 |
| 1 Earner | 67 (49.6%) | $29,688 |
| 2 Earners | 24 (17.8%) | $0 |
| 3+ Earners | 25 (18.5%) | $0 |
| Total | 135 (100.0%) | $42,596 |
Household Income in Fuller Acres
Household Income Brackets in Fuller Acres
With 33 households falling in the category, the $35,000 to $49,999 income range is the most frequent in Fuller Acres, accounting for 20.4% of all households.
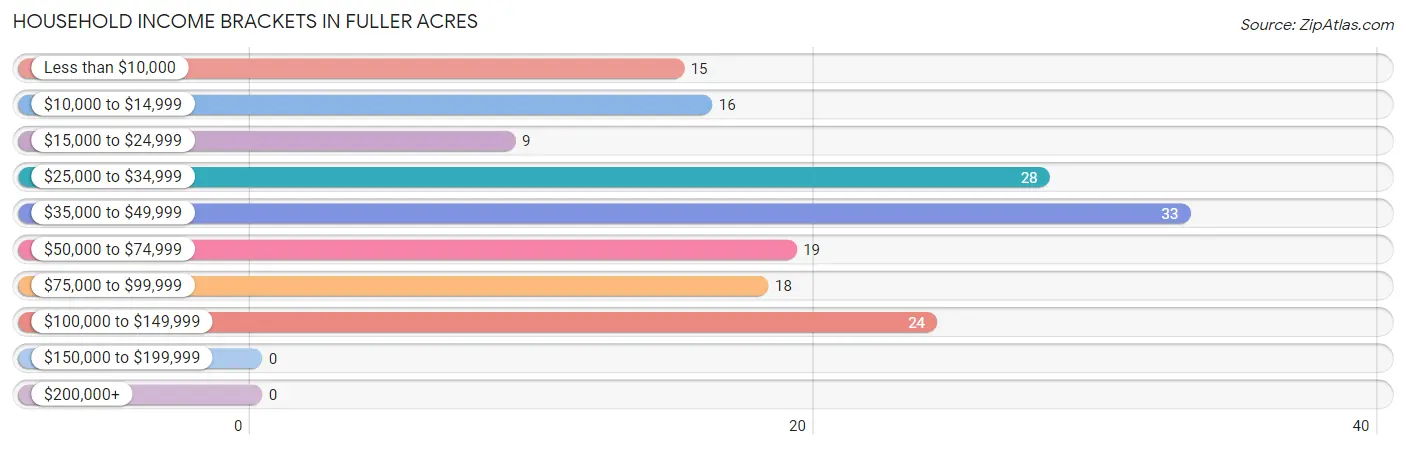
| Income Bracket | # Households | % Households |
| Less than $10,000 | 15 | 9.3% |
| $10,000 to $14,999 | 16 | 9.9% |
| $15,000 to $24,999 | 9 | 5.6% |
| $25,000 to $34,999 | 28 | 17.3% |
| $35,000 to $49,999 | 33 | 20.4% |
| $50,000 to $74,999 | 19 | 11.7% |
| $75,000 to $99,999 | 18 | 11.1% |
| $100,000 to $149,999 | 24 | 14.8% |
| $150,000 to $199,999 | 0 | 0.0% |
| $200,000+ | 0 | 0.0% |
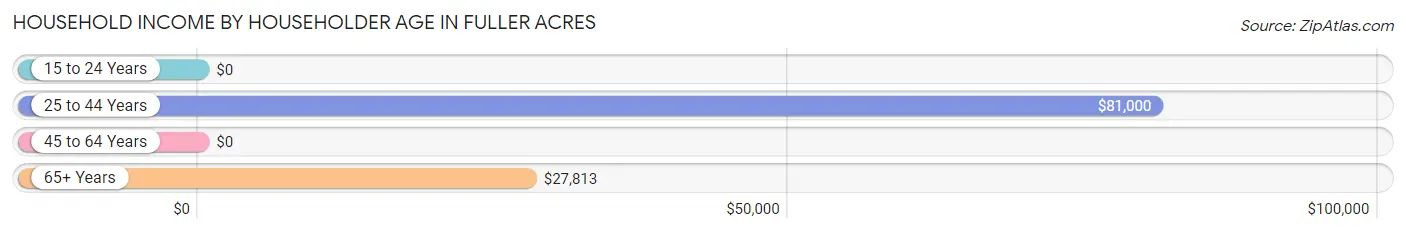
Household Income by Householder Age in Fuller Acres
The median household income in Fuller Acres is $39,125, with the highest median household income of $81,000 found in the 25 to 44 years age bracket for the primary householder. A total of 44 households (27.2%) fall into this category. Meanwhile, the 15 to 24 years age bracket for the primary householder has the lowest median household income of $0, with 35 households (21.6%) in this group.
| Income Bracket | # Households | Median Income |
| 15 to 24 Years | 35 (21.6%) | $0 |
| 25 to 44 Years | 44 (27.2%) | $81,000 |
| 45 to 64 Years | 52 (32.1%) | $0 |
| 65+ Years | 31 (19.1%) | $27,813 |
| Total | 162 (100.0%) | $39,125 |
Poverty in Fuller Acres
Income Below Poverty by Sex and Age in Fuller Acres
With 48.0% poverty level for males and 58.9% for females among the residents of Fuller Acres, 16 and 17 year old males and 6 to 11 year old females are the most vulnerable to poverty, with 21 males (100.0%) and 20 females (100.0%) in their respective age groups living below the poverty level.
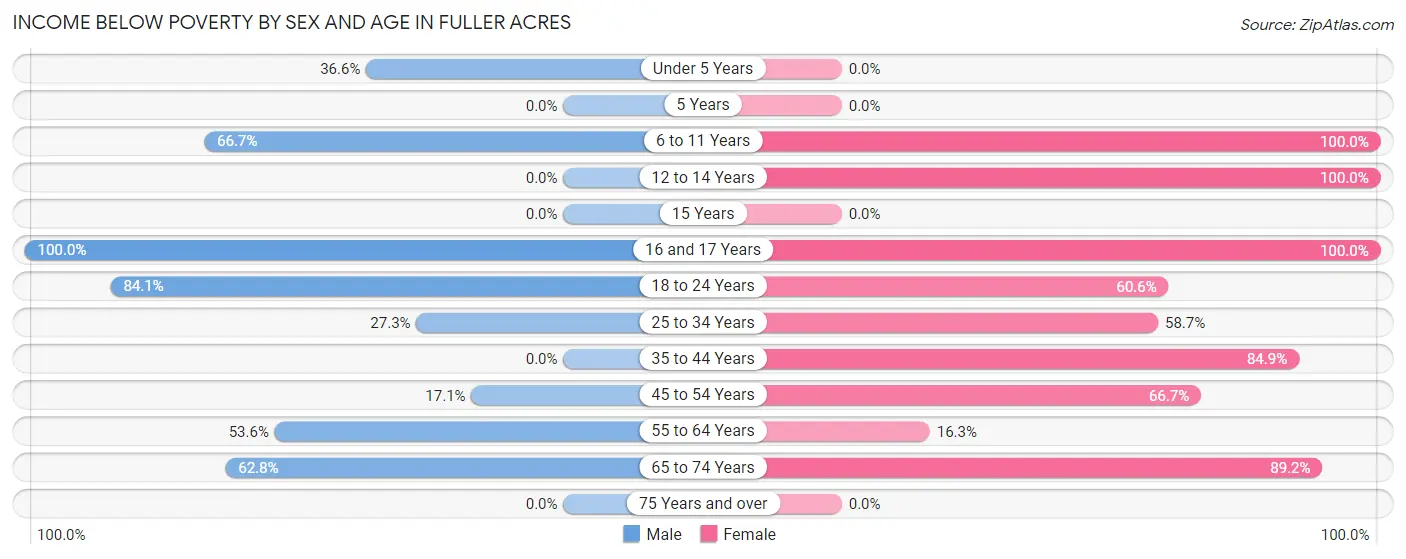
| Age Bracket | Male | Female |
| Under 5 Years | 15 (36.6%) | 0 (0.0%) |
| 5 Years | 0 (0.0%) | 0 (0.0%) |
| 6 to 11 Years | 14 (66.7%) | 20 (100.0%) |
| 12 to 14 Years | 0 (0.0%) | 13 (100.0%) |
| 15 Years | 0 (0.0%) | 0 (0.0%) |
| 16 and 17 Years | 21 (100.0%) | 7 (100.0%) |
| 18 to 24 Years | 58 (84.1%) | 57 (60.6%) |
| 25 to 34 Years | 15 (27.3%) | 27 (58.7%) |
| 35 to 44 Years | 0 (0.0%) | 28 (84.9%) |
| 45 to 54 Years | 7 (17.1%) | 12 (66.7%) |
| 55 to 64 Years | 15 (53.6%) | 8 (16.3%) |
| 65 to 74 Years | 32 (62.7%) | 33 (89.2%) |
| 75 Years and over | 0 (0.0%) | 0 (0.0%) |
| Total | 177 (48.0%) | 205 (58.9%) |
Income Above Poverty by Sex and Age in Fuller Acres
According to the poverty statistics in Fuller Acres, males aged 12 to 14 years and females aged under 5 years are the age groups that are most secure financially, with 100.0% of males and 100.0% of females in these age groups living above the poverty line.
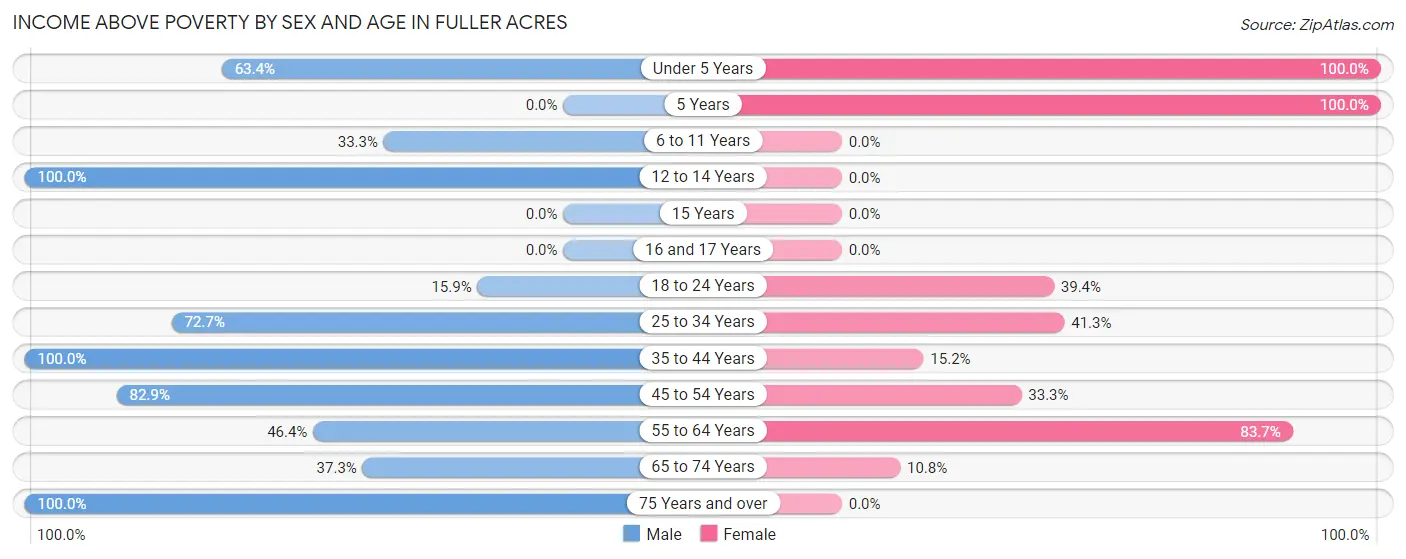
| Age Bracket | Male | Female |
| Under 5 Years | 26 (63.4%) | 26 (100.0%) |
| 5 Years | 0 (0.0%) | 5 (100.0%) |
| 6 to 11 Years | 7 (33.3%) | 0 (0.0%) |
| 12 to 14 Years | 14 (100.0%) | 0 (0.0%) |
| 15 Years | 0 (0.0%) | 0 (0.0%) |
| 16 and 17 Years | 0 (0.0%) | 0 (0.0%) |
| 18 to 24 Years | 11 (15.9%) | 37 (39.4%) |
| 25 to 34 Years | 40 (72.7%) | 19 (41.3%) |
| 35 to 44 Years | 23 (100.0%) | 5 (15.1%) |
| 45 to 54 Years | 34 (82.9%) | 6 (33.3%) |
| 55 to 64 Years | 13 (46.4%) | 41 (83.7%) |
| 65 to 74 Years | 19 (37.2%) | 4 (10.8%) |
| 75 Years and over | 5 (100.0%) | 0 (0.0%) |
| Total | 192 (52.0%) | 143 (41.1%) |
Income Below Poverty Among Married-Couple Families in Fuller Acres
The poverty statistics for married-couple families in Fuller Acres show that 15.8% or 9 of the total 57 families live below the poverty line. Families with no children have the highest poverty rate of 29.0%, comprising of 9 families. On the other hand, families with 1 or 2 children have the lowest poverty rate of 0.0%, which includes 0 families.
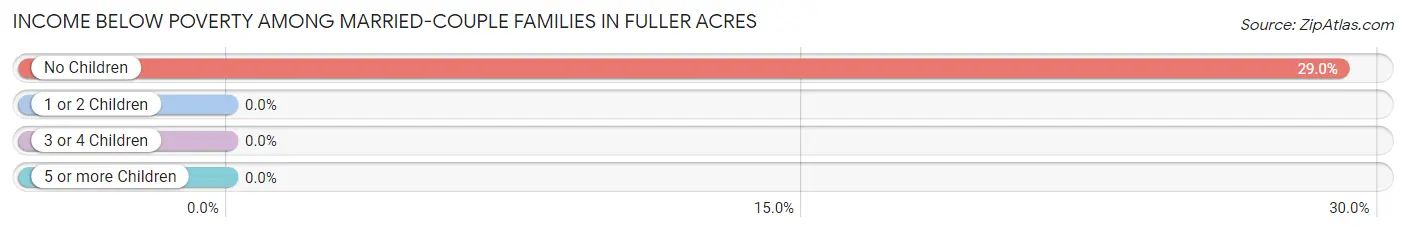
| Children | Above Poverty | Below Poverty |
| No Children | 22 (71.0%) | 9 (29.0%) |
| 1 or 2 Children | 20 (100.0%) | 0 (0.0%) |
| 3 or 4 Children | 6 (100.0%) | 0 (0.0%) |
| 5 or more Children | 0 (0.0%) | 0 (0.0%) |
| Total | 48 (84.2%) | 9 (15.8%) |
Income Below Poverty Among Single-Parent Households in Fuller Acres
According to the poverty data in Fuller Acres, 26.9% or 7 single-father households and 90.4% or 47 single-mother households are living below the poverty line. Among single-father households, those with 1 or 2 children have the highest poverty rate, with 7 households (35.0%) experiencing poverty. Likewise, among single-mother households, those with 3 or 4 children have the highest poverty rate, with 12 households (100.0%) falling below the poverty line.
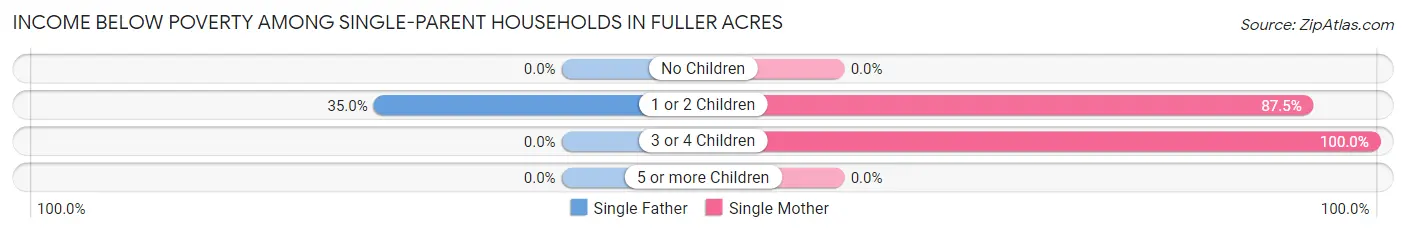
| Children | Single Father | Single Mother |
| No Children | 0 (0.0%) | 0 (0.0%) |
| 1 or 2 Children | 7 (35.0%) | 35 (87.5%) |
| 3 or 4 Children | 0 (0.0%) | 12 (100.0%) |
| 5 or more Children | 0 (0.0%) | 0 (0.0%) |
| Total | 7 (26.9%) | 47 (90.4%) |
Income Below Poverty Among Married-Couple vs Single-Parent Households in Fuller Acres
The poverty data for Fuller Acres shows that 9 of the married-couple family households (15.8%) and 54 of the single-parent households (69.2%) are living below the poverty level. Within the married-couple family households, those with no children have the highest poverty rate, with 9 households (29.0%) falling below the poverty line. Among the single-parent households, those with 3 or 4 children have the highest poverty rate, with 12 household (100.0%) living below poverty.
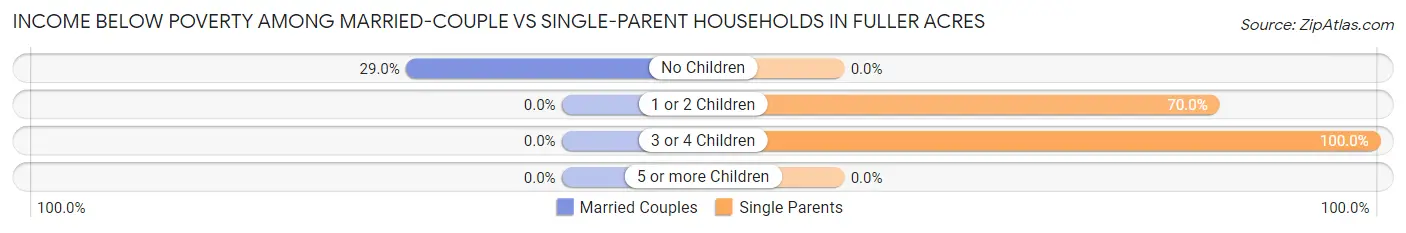
| Children | Married-Couple Families | Single-Parent Households |
| No Children | 9 (29.0%) | 0 (0.0%) |
| 1 or 2 Children | 0 (0.0%) | 42 (70.0%) |
| 3 or 4 Children | 0 (0.0%) | 12 (100.0%) |
| 5 or more Children | 0 (0.0%) | 0 (0.0%) |
| Total | 9 (15.8%) | 54 (69.2%) |
Race in Fuller Acres
The most populous races in Fuller Acres are Hispanic or Latino (646 | 90.1%), Some other Race (370 | 51.6%), and White / Caucasian (293 | 40.9%).
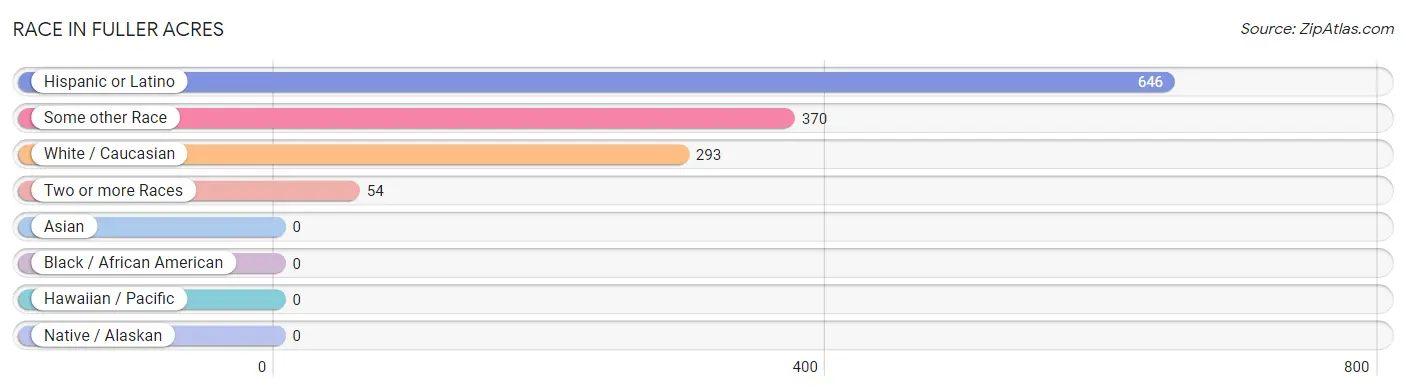
| Race | # Population | % Population |
| Asian | 0 | 0.0% |
| Black / African American | 0 | 0.0% |
| Hawaiian / Pacific | 0 | 0.0% |
| Hispanic or Latino | 646 | 90.1% |
| Native / Alaskan | 0 | 0.0% |
| White / Caucasian | 293 | 40.9% |
| Two or more Races | 54 | 7.5% |
| Some other Race | 370 | 51.6% |
| Total | 717 | 100.0% |
Ancestry in Fuller Acres
The most populous ancestries reported in Fuller Acres are Mexican (646 | 90.1%), Irish (37 | 5.2%), and German (25 | 3.5%), together accounting for 98.8% of all Fuller Acres residents.
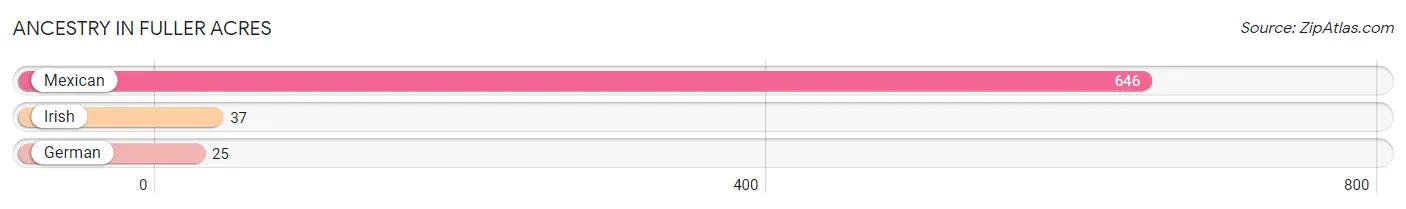
| Ancestry | # Population | % Population |
| German | 25 | 3.5% |
| Irish | 37 | 5.2% |
| Mexican | 646 | 90.1% | View All 3 Rows |
Immigrants in Fuller Acres
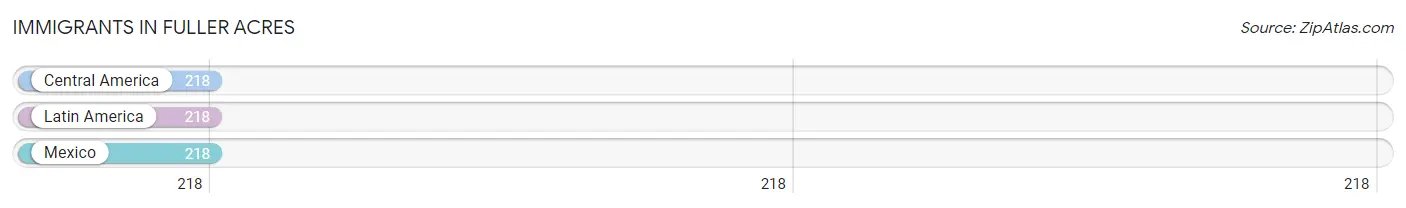
The most numerous immigrant groups reported in Fuller Acres came from Central America (218 | 30.4%), Latin America (218 | 30.4%), and Mexico (218 | 30.4%), together accounting for 91.2% of all Fuller Acres residents.
| Immigration Origin | # Population | % Population |
| Central America | 218 | 30.4% |
| Latin America | 218 | 30.4% |
| Mexico | 218 | 30.4% | View All 3 Rows |
Sex and Age in Fuller Acres
Sex and Age in Fuller Acres
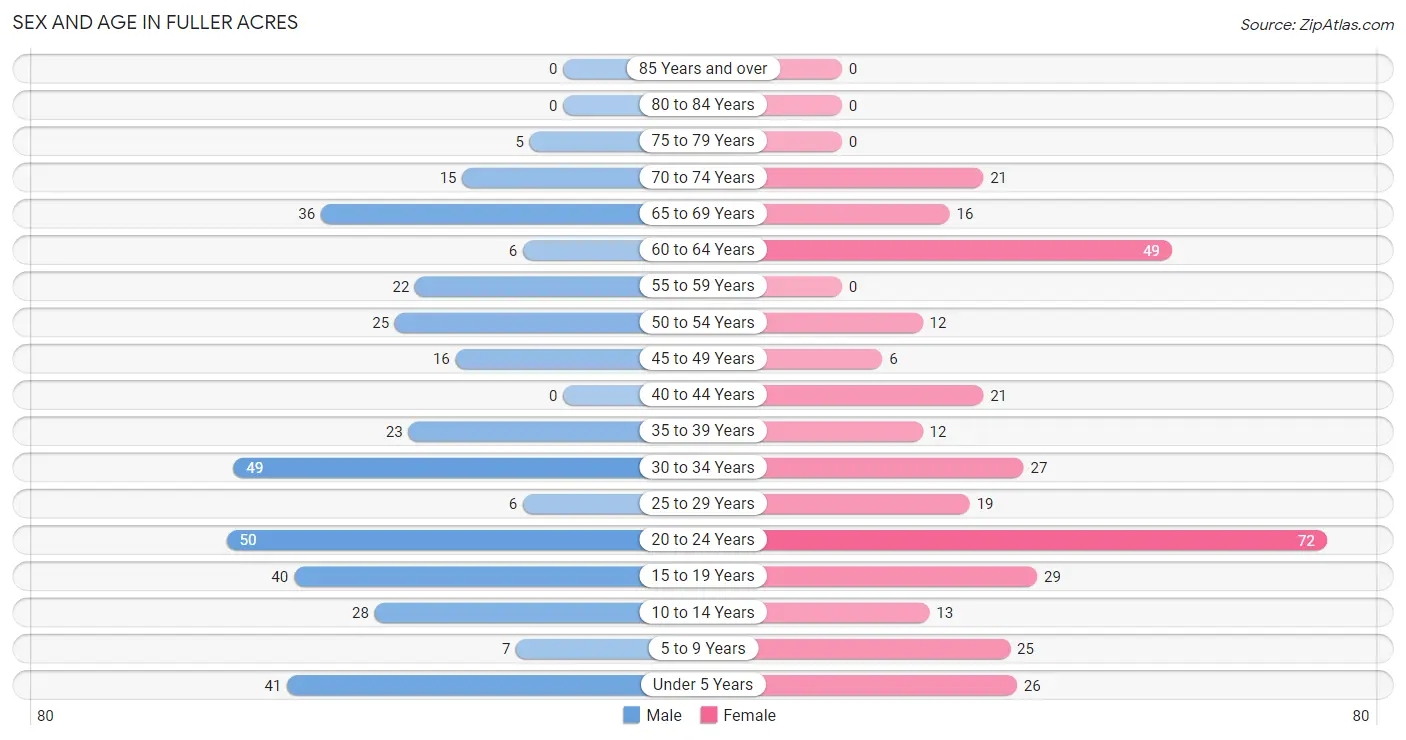
The most populous age groups in Fuller Acres are 20 to 24 Years (50 | 13.6%) for men and 20 to 24 Years (72 | 20.7%) for women.
| Age Bracket | Male | Female |
| Under 5 Years | 41 (11.1%) | 26 (7.5%) |
| 5 to 9 Years | 7 (1.9%) | 25 (7.2%) |
| 10 to 14 Years | 28 (7.6%) | 13 (3.7%) |
| 15 to 19 Years | 40 (10.8%) | 29 (8.3%) |
| 20 to 24 Years | 50 (13.6%) | 72 (20.7%) |
| 25 to 29 Years | 6 (1.6%) | 19 (5.5%) |
| 30 to 34 Years | 49 (13.3%) | 27 (7.8%) |
| 35 to 39 Years | 23 (6.2%) | 12 (3.5%) |
| 40 to 44 Years | 0 (0.0%) | 21 (6.0%) |
| 45 to 49 Years | 16 (4.3%) | 6 (1.7%) |
| 50 to 54 Years | 25 (6.8%) | 12 (3.5%) |
| 55 to 59 Years | 22 (6.0%) | 0 (0.0%) |
| 60 to 64 Years | 6 (1.6%) | 49 (14.1%) |
| 65 to 69 Years | 36 (9.8%) | 16 (4.6%) |
| 70 to 74 Years | 15 (4.1%) | 21 (6.0%) |
| 75 to 79 Years | 5 (1.4%) | 0 (0.0%) |
| 80 to 84 Years | 0 (0.0%) | 0 (0.0%) |
| 85 Years and over | 0 (0.0%) | 0 (0.0%) |
| Total | 369 (100.0%) | 348 (100.0%) |
Families and Households in Fuller Acres
Median Family Size in Fuller Acres
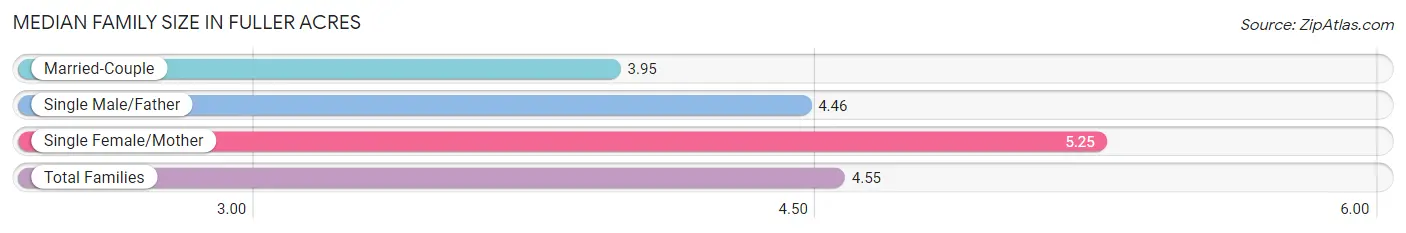
The median family size in Fuller Acres is 4.55 persons per family, with single female/mother families (52 | 38.5%) accounting for the largest median family size of 5.25 persons per family. On the other hand, married-couple families (57 | 42.2%) represent the smallest median family size with 3.95 persons per family.
| Family Type | # Families | Family Size |
| Married-Couple | 57 (42.2%) | 3.95 |
| Single Male/Father | 26 (19.3%) | 4.46 |
| Single Female/Mother | 52 (38.5%) | 5.25 |
| Total Families | 135 (100.0%) | 4.55 |
Median Household Size in Fuller Acres
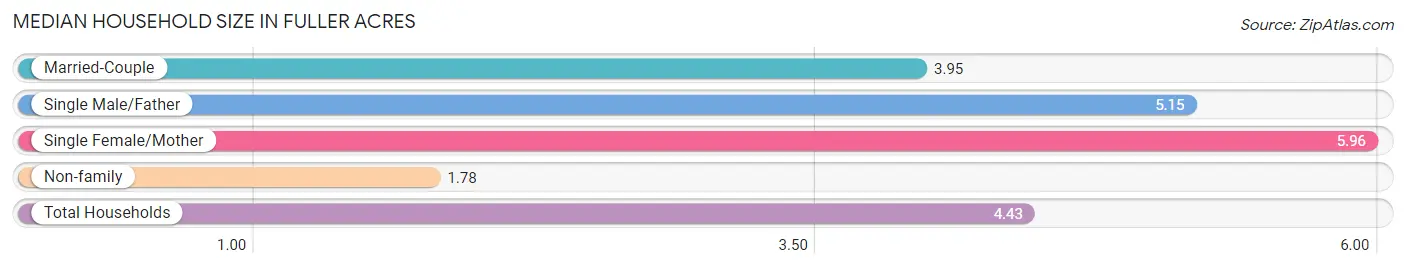
The median household size in Fuller Acres is 4.43 persons per household, with single female/mother households (52 | 32.1%) accounting for the largest median household size of 5.96 persons per household. non-family households (27 | 16.7%) represent the smallest median household size with 1.78 persons per household.
| Household Type | # Households | Household Size |
| Married-Couple | 57 (35.2%) | 3.95 |
| Single Male/Father | 26 (16.1%) | 5.15 |
| Single Female/Mother | 52 (32.1%) | 5.96 |
| Non-family | 27 (16.7%) | 1.78 |
| Total Households | 162 (100.0%) | 4.43 |
Household Size by Marriage Status in Fuller Acres
Out of a total of 162 households in Fuller Acres, 135 (83.3%) are family households, while 27 (16.7%) are nonfamily households. The most numerous type of family households are 3-person households, comprising 34, and the most common type of nonfamily households are 2-person households, comprising 17.
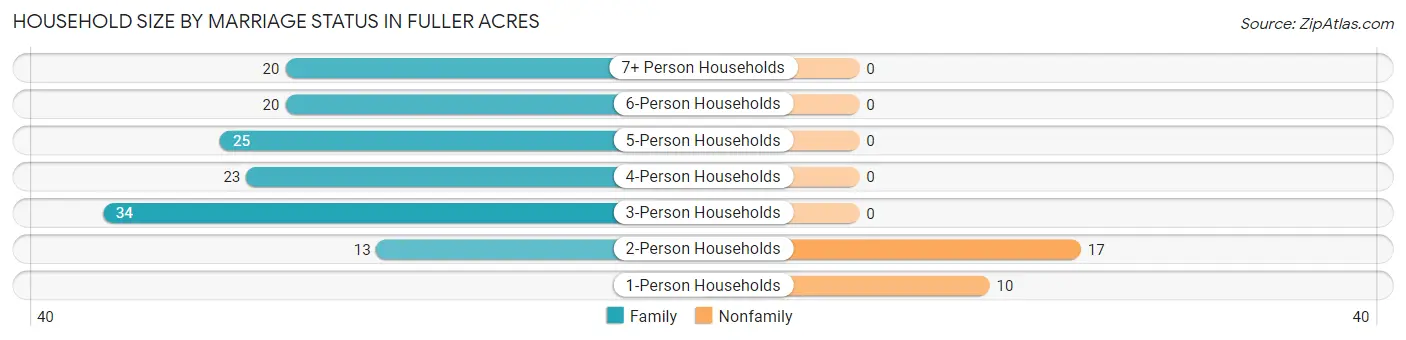
| Household Size | Family Households | Nonfamily Households |
| 1-Person Households | - | 10 (6.2%) |
| 2-Person Households | 13 (8.0%) | 17 (10.5%) |
| 3-Person Households | 34 (21.0%) | 0 (0.0%) |
| 4-Person Households | 23 (14.2%) | 0 (0.0%) |
| 5-Person Households | 25 (15.4%) | 0 (0.0%) |
| 6-Person Households | 20 (12.3%) | 0 (0.0%) |
| 7+ Person Households | 20 (12.3%) | 0 (0.0%) |
| Total | 135 (83.3%) | 27 (16.7%) |
Female Fertility in Fuller Acres
Fertility by Age in Fuller Acres
Average fertility rate in Fuller Acres is 151.0 births per 1,000 women. Women in the age bracket of 20 to 34 years have the highest fertility rate with 237.0 births per 1,000 women. Women in the age bracket of 20 to 34 years acount for 100.0% of all women with births.
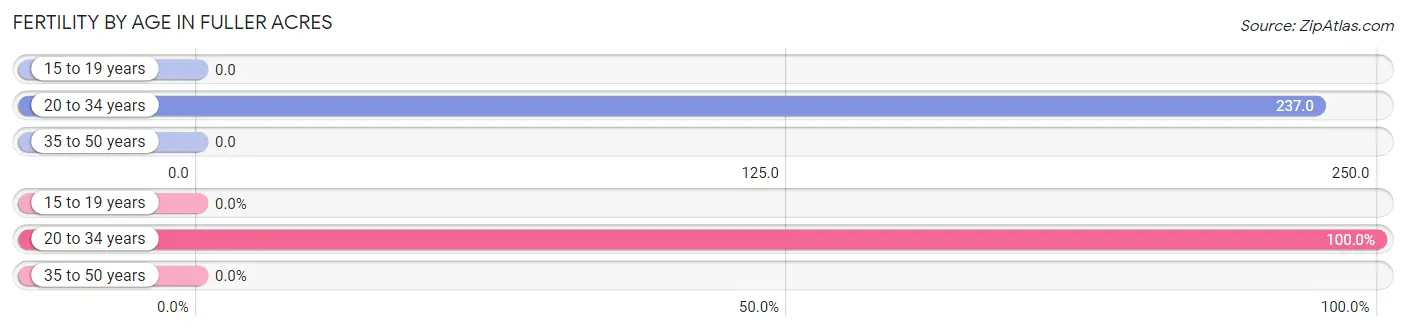
| Age Bracket | Women with Births | Births / 1,000 Women |
| 15 to 19 years | 0 (0.0%) | 0.0 |
| 20 to 34 years | 28 (100.0%) | 237.0 |
| 35 to 50 years | 0 (0.0%) | 0.0 |
| Total | 28 (100.0%) | 151.0 |
Fertility by Age by Marriage Status in Fuller Acres
46.4% of women with births (28) in Fuller Acres are married. The highest percentage of unmarried women with births falls into 20 to 34 years age bracket with 53.6% of them unmarried at the time of birth, while the lowest percentage of unmarried women with births belong to 20 to 34 years age bracket with 53.6% of them unmarried.
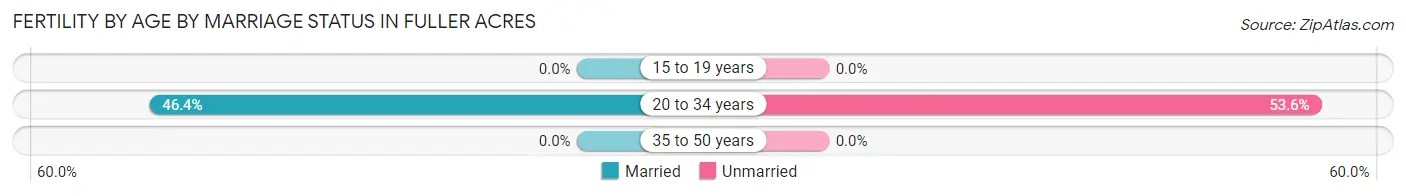
| Age Bracket | Married | Unmarried |
| 15 to 19 years | 0 (0.0%) | 0 (0.0%) |
| 20 to 34 years | 13 (46.4%) | 15 (53.6%) |
| 35 to 50 years | 0 (0.0%) | 0 (0.0%) |
| Total | 13 (46.4%) | 15 (53.6%) |
Fertility by Education in Fuller Acres
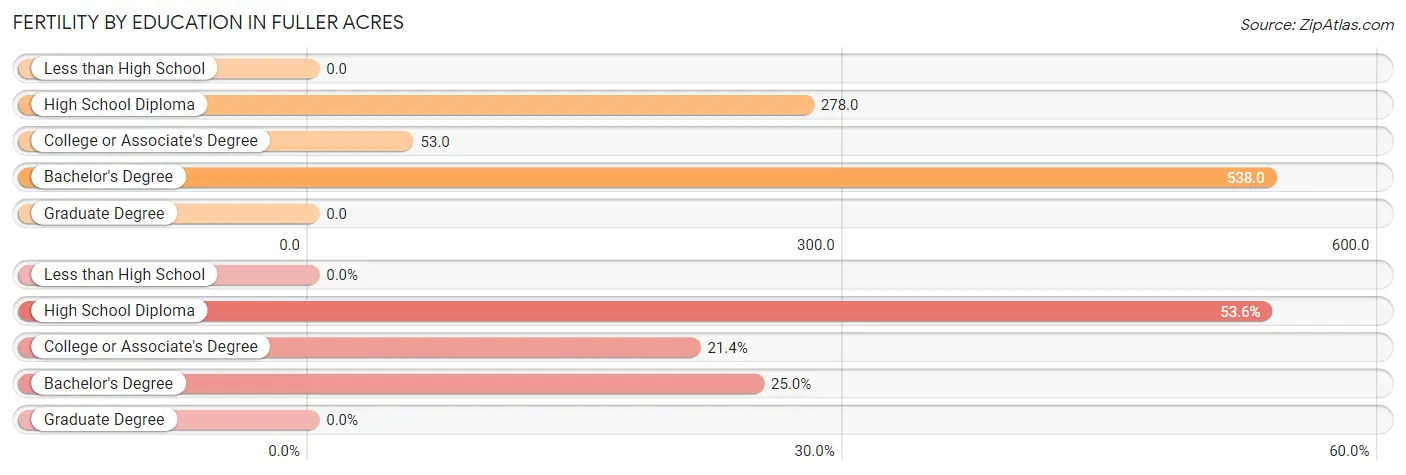
| Educational Attainment | Women with Births | Births / 1,000 Women |
| Less than High School | 0 (0.0%) | 0.0 |
| High School Diploma | 15 (53.6%) | 278.0 |
| College or Associate's Degree | 6 (21.4%) | 53.0 |
| Bachelor's Degree | 7 (25.0%) | 538.0 |
| Graduate Degree | 0 (0.0%) | 0.0 |
| Total | 28 (100.0%) | 151.0 |
Fertility by Education by Marriage Status in Fuller Acres
53.6% of women with births in Fuller Acres are unmarried. Women with the educational attainment of college or associate's degree are most likely to be married with 100.0% of them married at childbirth, while women with the educational attainment of high school diploma are least likely to be married with 100.0% of them unmarried at childbirth.
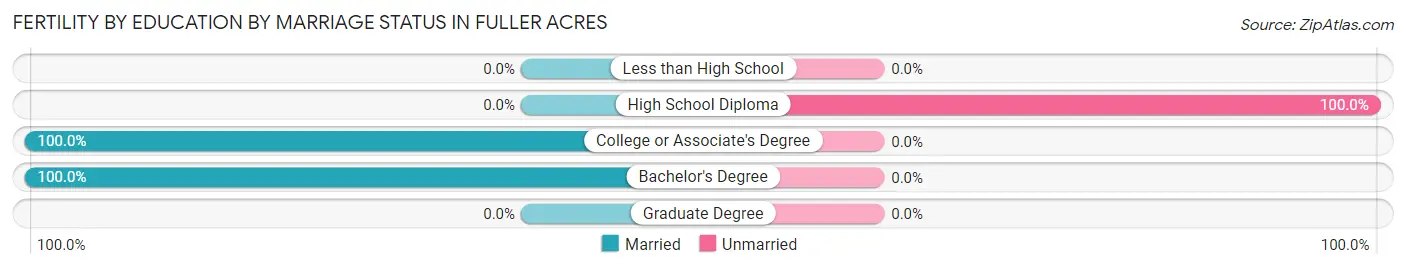
| Educational Attainment | Married | Unmarried |
| Less than High School | 0 (0.0%) | 0 (0.0%) |
| High School Diploma | 0 (0.0%) | 15 (100.0%) |
| College or Associate's Degree | 6 (100.0%) | 0 (0.0%) |
| Bachelor's Degree | 7 (100.0%) | 0 (0.0%) |
| Graduate Degree | 0 (0.0%) | 0 (0.0%) |
| Total | 13 (46.4%) | 15 (53.6%) |
Employment Characteristics in Fuller Acres
Employment by Class of Employer in Fuller Acres
Among the 219 employed individuals in Fuller Acres, private company employees (106 | 48.4%), self-employed (not incorporated) (76 | 34.7%), and not-for-profit organizations (24 | 11.0%) make up the most common classes of employment.
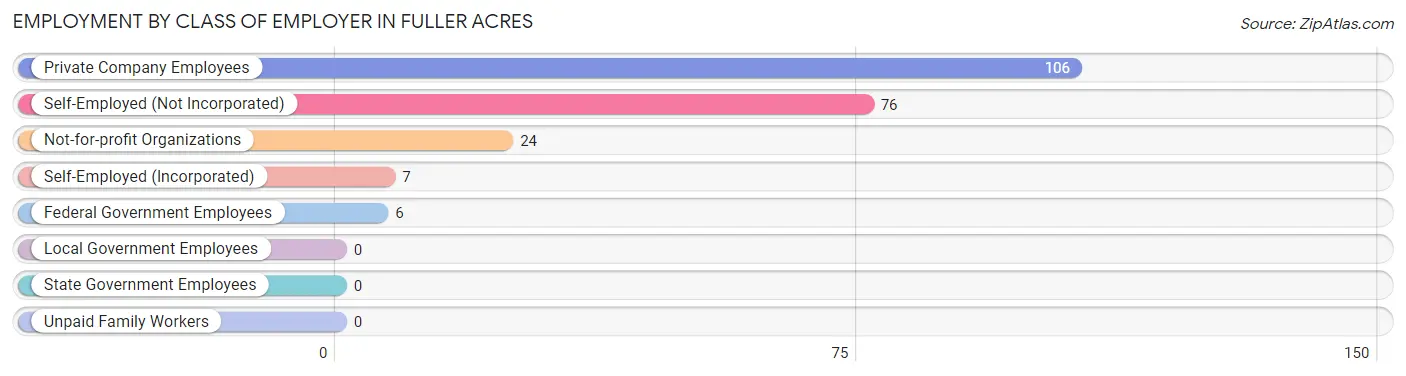
| Employer Class | # Employees | % Employees |
| Private Company Employees | 106 | 48.4% |
| Self-Employed (Incorporated) | 7 | 3.2% |
| Self-Employed (Not Incorporated) | 76 | 34.7% |
| Not-for-profit Organizations | 24 | 11.0% |
| Local Government Employees | 0 | 0.0% |
| State Government Employees | 0 | 0.0% |
| Federal Government Employees | 6 | 2.7% |
| Unpaid Family Workers | 0 | 0.0% |
| Total | 219 | 100.0% |
Employment Status by Age in Fuller Acres
According to the labor force statistics for Fuller Acres, out of the total population over 16 years of age (577), 44.4% or 256 individuals are in the labor force, with 10.9% or 28 of them unemployed. The age group with the highest labor force participation rate is 45 to 54 years, with 89.8% or 53 individuals in the labor force. Within the labor force, the 55 to 59 years age range has the highest percentage of unemployed individuals, with 43.8% or 7 of them being unemployed.
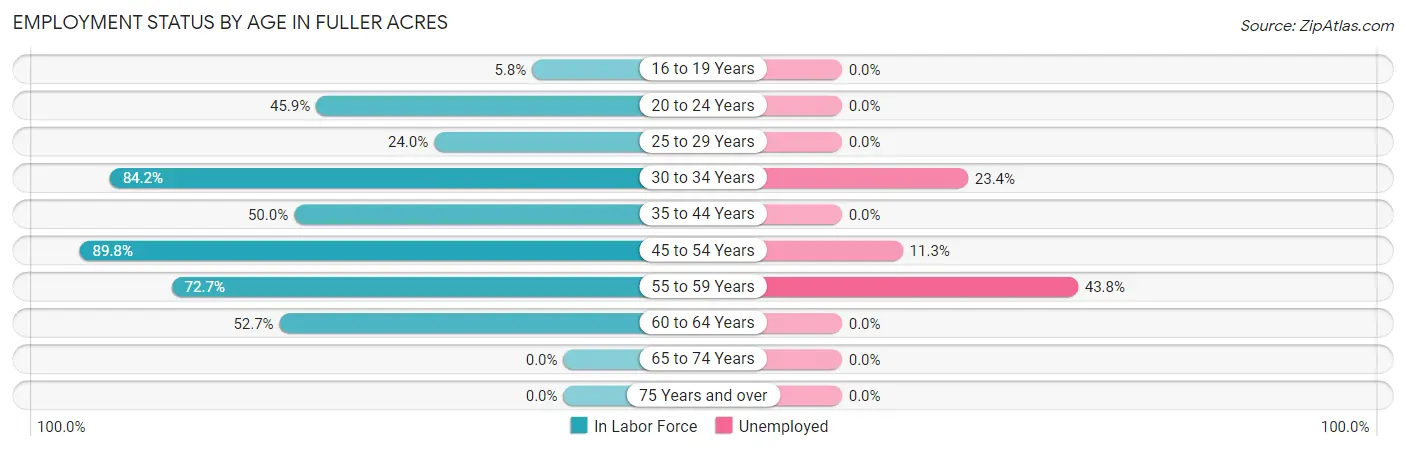
| Age Bracket | In Labor Force | Unemployed |
| 16 to 19 Years | 4 (5.8%) | 0 (0.0%) |
| 20 to 24 Years | 56 (45.9%) | 0 (0.0%) |
| 25 to 29 Years | 6 (24.0%) | 0 (0.0%) |
| 30 to 34 Years | 64 (84.2%) | 15 (23.4%) |
| 35 to 44 Years | 28 (50.0%) | 0 (0.0%) |
| 45 to 54 Years | 53 (89.8%) | 6 (11.3%) |
| 55 to 59 Years | 16 (72.7%) | 7 (43.8%) |
| 60 to 64 Years | 29 (52.7%) | 0 (0.0%) |
| 65 to 74 Years | 0 (0.0%) | 0 (0.0%) |
| 75 Years and over | 0 (0.0%) | 0 (0.0%) |
| Total | 256 (44.4%) | 28 (10.9%) |
Employment Status by Educational Attainment in Fuller Acres
According to labor force statistics for Fuller Acres, 66.9% of individuals (196) out of the total population between 25 and 64 years of age (293) are in the labor force, with 14.3% or 28 of them being unemployed. The group with the highest labor force participation rate are those with the educational attainment of high school diploma, with 82.9% or 58 individuals in the labor force. Within the labor force, individuals with high school diploma education have the highest percentage of unemployment, with 25.9% or 15 of them being unemployed.
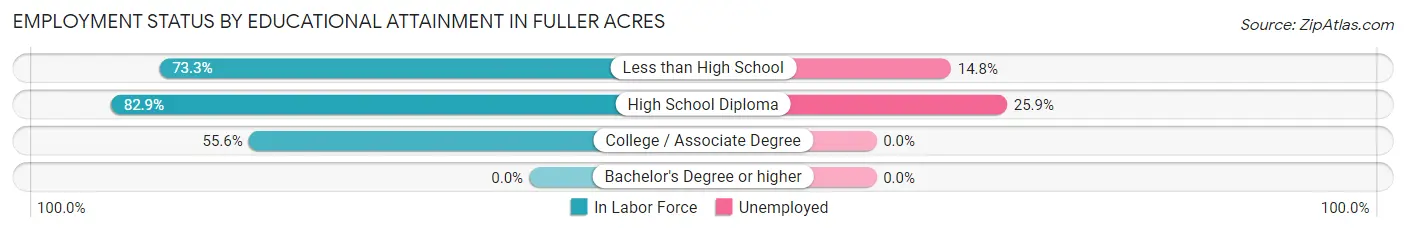
| Educational Attainment | In Labor Force | Unemployed |
| Less than High School | 88 (73.3%) | 18 (14.8%) |
| High School Diploma | 58 (82.9%) | 18 (25.9%) |
| College / Associate Degree | 50 (55.6%) | 0 (0.0%) |
| Bachelor's Degree or higher | 0 (0.0%) | 0 (0.0%) |
| Total | 196 (66.9%) | 42 (14.3%) |
Employment Occupations by Sex in Fuller Acres
Management, Business, Science and Arts Occupations
The most common Management, Business, Science and Arts occupations in Fuller Acres are , and Management (15 | 6.6%).
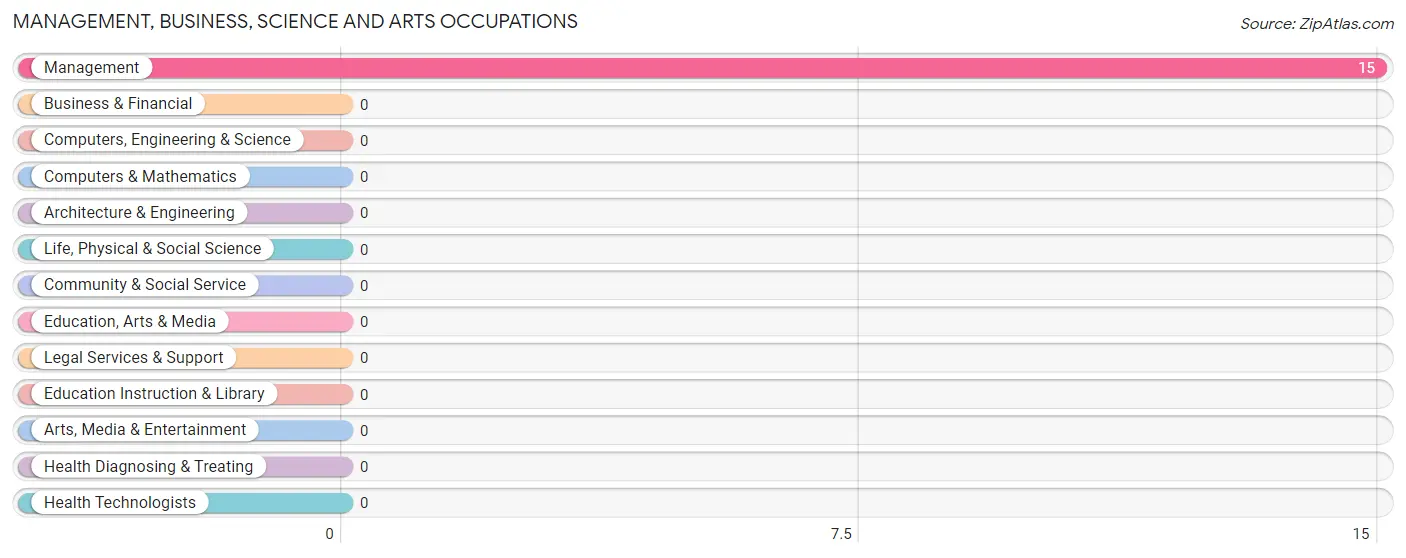
Management, Business, Science and Arts Occupations by Sex
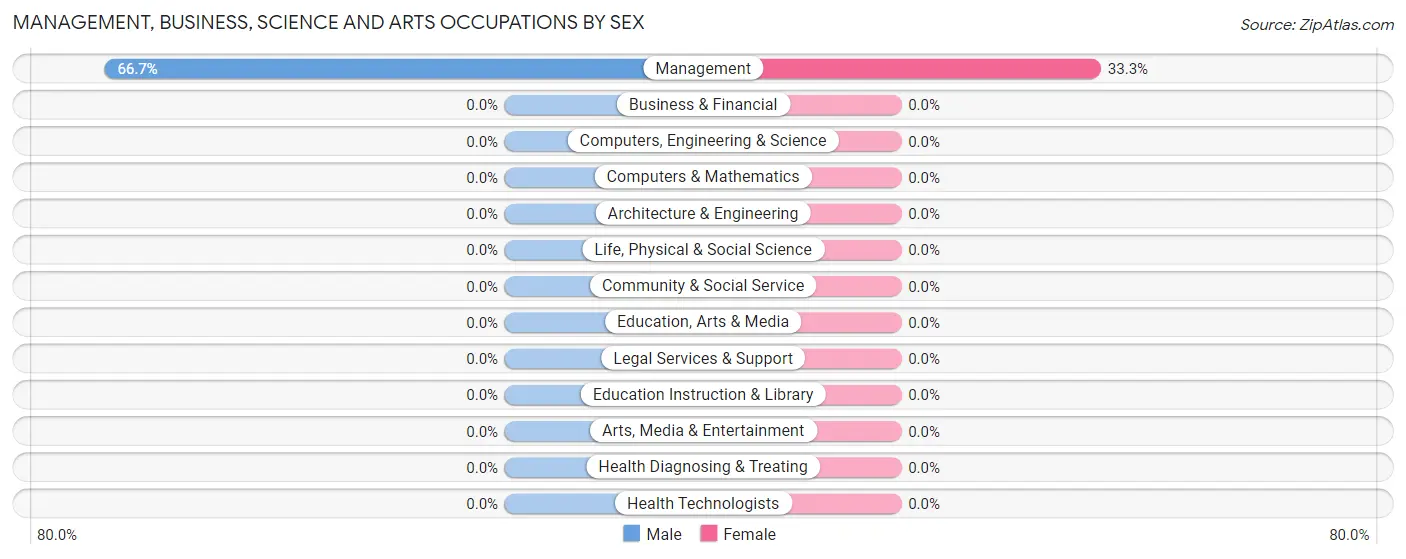
| Occupation | Male | Female |
| Management | 10 (66.7%) | 5 (33.3%) |
| Business & Financial | 0 (0.0%) | 0 (0.0%) |
| Computers, Engineering & Science | 0 (0.0%) | 0 (0.0%) |
| Computers & Mathematics | 0 (0.0%) | 0 (0.0%) |
| Architecture & Engineering | 0 (0.0%) | 0 (0.0%) |
| Life, Physical & Social Science | 0 (0.0%) | 0 (0.0%) |
| Community & Social Service | 0 (0.0%) | 0 (0.0%) |
| Education, Arts & Media | 0 (0.0%) | 0 (0.0%) |
| Legal Services & Support | 0 (0.0%) | 0 (0.0%) |
| Education Instruction & Library | 0 (0.0%) | 0 (0.0%) |
| Arts, Media & Entertainment | 0 (0.0%) | 0 (0.0%) |
| Health Diagnosing & Treating | 0 (0.0%) | 0 (0.0%) |
| Health Technologists | 0 (0.0%) | 0 (0.0%) |
| Total (Category) | 10 (66.7%) | 5 (33.3%) |
| Total (Overall) | 148 (64.9%) | 80 (35.1%) |
Services Occupations
The most common Services occupations in Fuller Acres are Cleaning & Maintenance (25 | 11.0%), Security & Protection (8 | 3.5%), Firefighting & Prevention (8 | 3.5%), Food Preparation & Serving (7 | 3.1%), and Healthcare Support (6 | 2.6%).
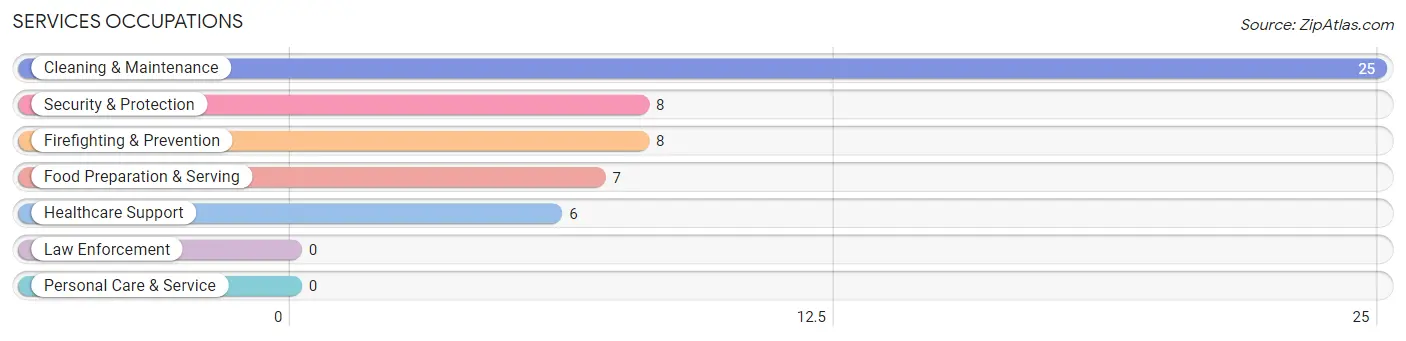
Services Occupations by Sex
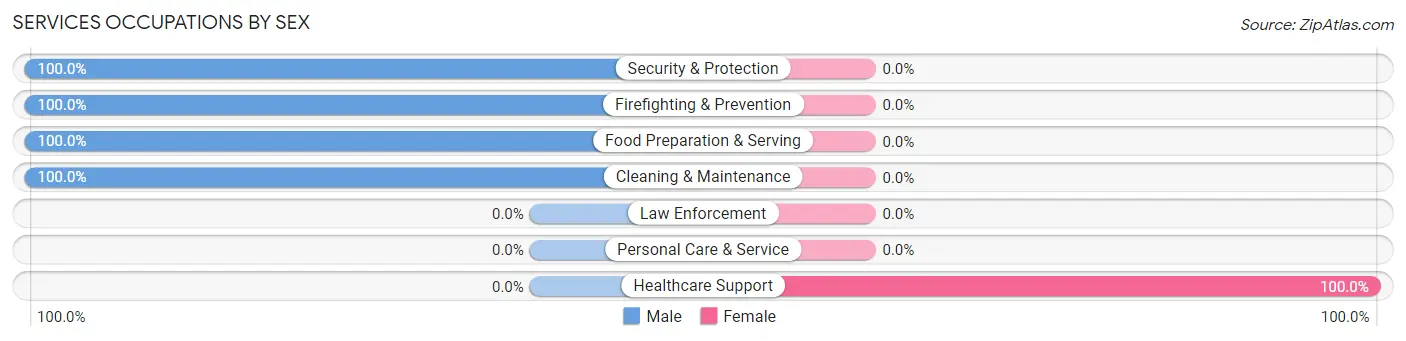
| Occupation | Male | Female |
| Healthcare Support | 0 (0.0%) | 6 (100.0%) |
| Security & Protection | 8 (100.0%) | 0 (0.0%) |
| Firefighting & Prevention | 8 (100.0%) | 0 (0.0%) |
| Law Enforcement | 0 (0.0%) | 0 (0.0%) |
| Food Preparation & Serving | 7 (100.0%) | 0 (0.0%) |
| Cleaning & Maintenance | 25 (100.0%) | 0 (0.0%) |
| Personal Care & Service | 0 (0.0%) | 0 (0.0%) |
| Total (Category) | 40 (87.0%) | 6 (13.0%) |
| Total (Overall) | 148 (64.9%) | 80 (35.1%) |
Sales and Office Occupations
The most common Sales and Office occupations in Fuller Acres are Sales & Related (36 | 15.8%), and Office & Administration (15 | 6.6%).
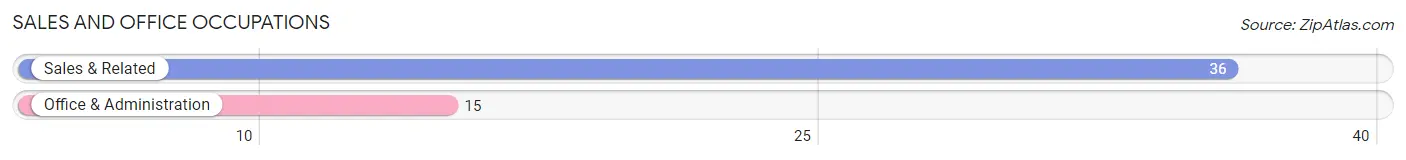
Sales and Office Occupations by Sex
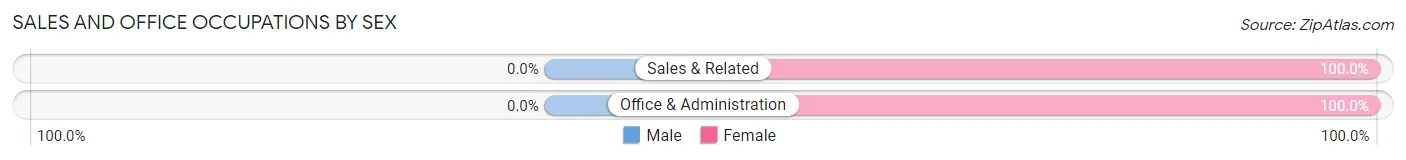
| Occupation | Male | Female |
| Sales & Related | 0 (0.0%) | 36 (100.0%) |
| Office & Administration | 0 (0.0%) | 15 (100.0%) |
| Total (Category) | 0 (0.0%) | 51 (100.0%) |
| Total (Overall) | 148 (64.9%) | 80 (35.1%) |
Natural Resources, Construction and Maintenance Occupations
The most common Natural Resources, Construction and Maintenance occupations in Fuller Acres are Farming, Fishing & Forestry (37 | 16.2%), and Construction & Extraction (16 | 7.0%).
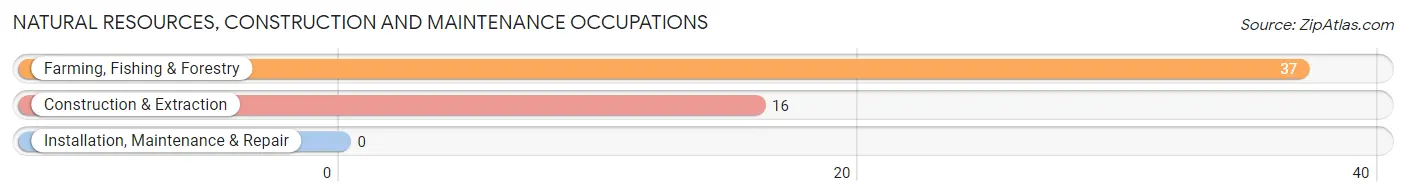
Natural Resources, Construction and Maintenance Occupations by Sex
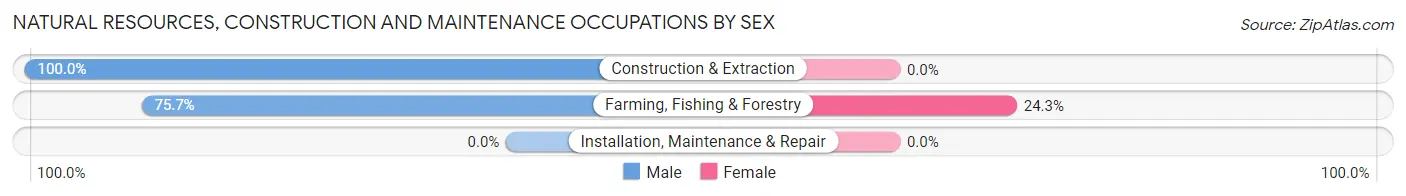
| Occupation | Male | Female |
| Farming, Fishing & Forestry | 28 (75.7%) | 9 (24.3%) |
| Construction & Extraction | 16 (100.0%) | 0 (0.0%) |
| Installation, Maintenance & Repair | 0 (0.0%) | 0 (0.0%) |
| Total (Category) | 44 (83.0%) | 9 (17.0%) |
| Total (Overall) | 148 (64.9%) | 80 (35.1%) |
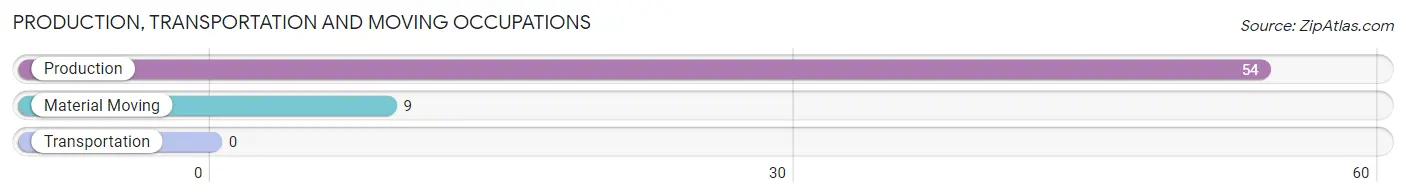
Production, Transportation and Moving Occupations
The most common Production, Transportation and Moving occupations in Fuller Acres are Production (54 | 23.7%), and Material Moving (9 | 4.0%).
Production, Transportation and Moving Occupations by Sex
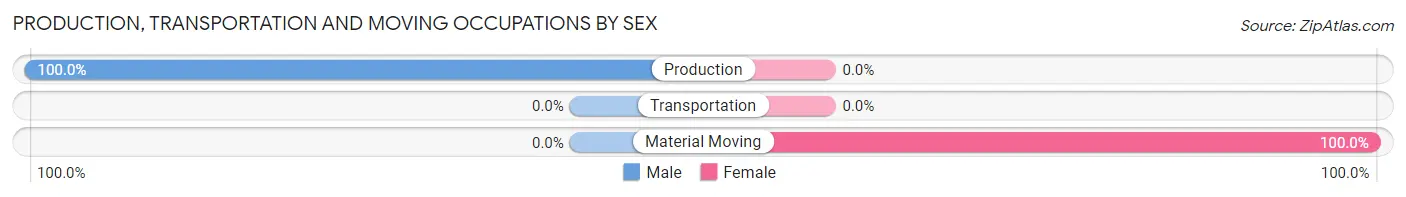
| Occupation | Male | Female |
| Production | 54 (100.0%) | 0 (0.0%) |
| Transportation | 0 (0.0%) | 0 (0.0%) |
| Material Moving | 0 (0.0%) | 9 (100.0%) |
| Total (Category) | 54 (85.7%) | 9 (14.3%) |
| Total (Overall) | 148 (64.9%) | 80 (35.1%) |
Employment Industries by Sex in Fuller Acres
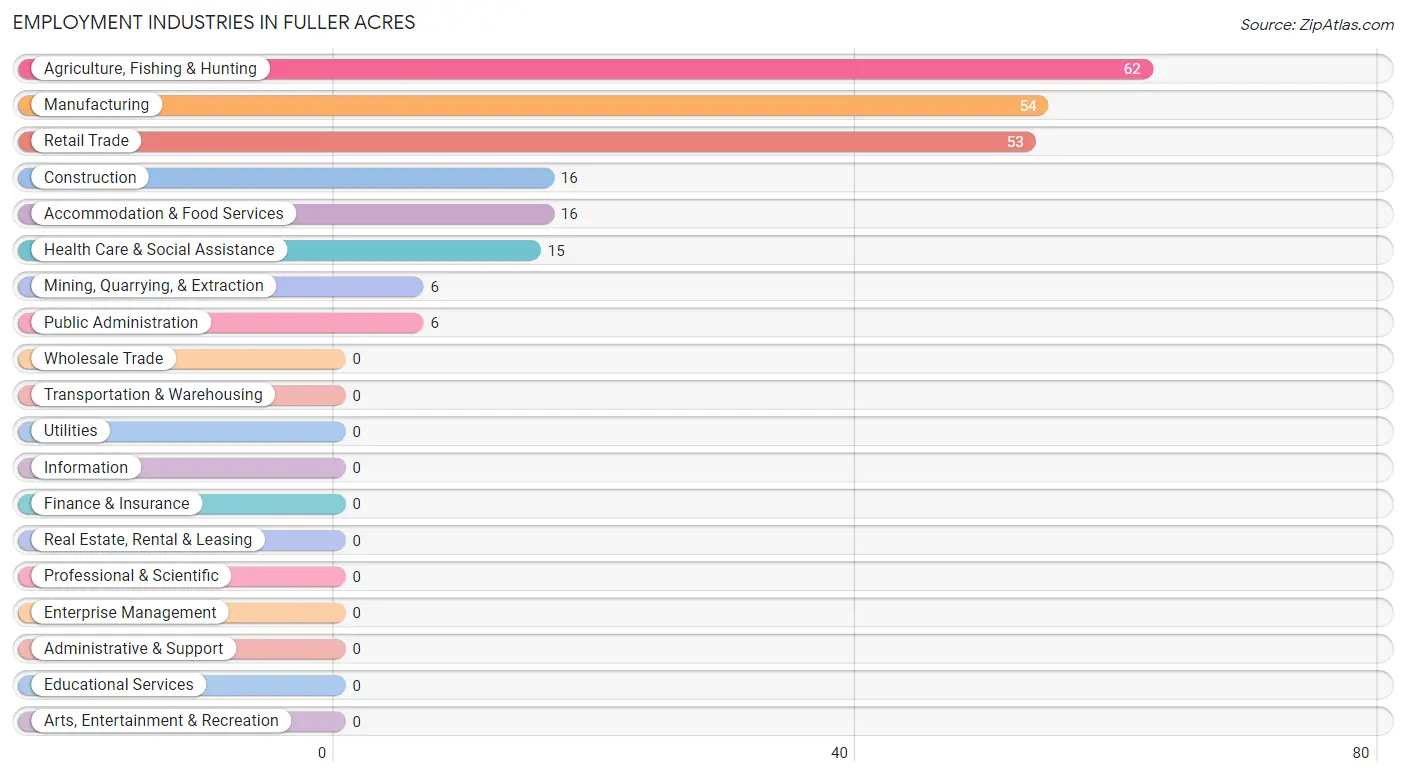
Employment Industries in Fuller Acres
The major employment industries in Fuller Acres include Agriculture, Fishing & Hunting (62 | 27.2%), Manufacturing (54 | 23.7%), Retail Trade (53 | 23.3%), Construction (16 | 7.0%), and Accommodation & Food Services (16 | 7.0%).
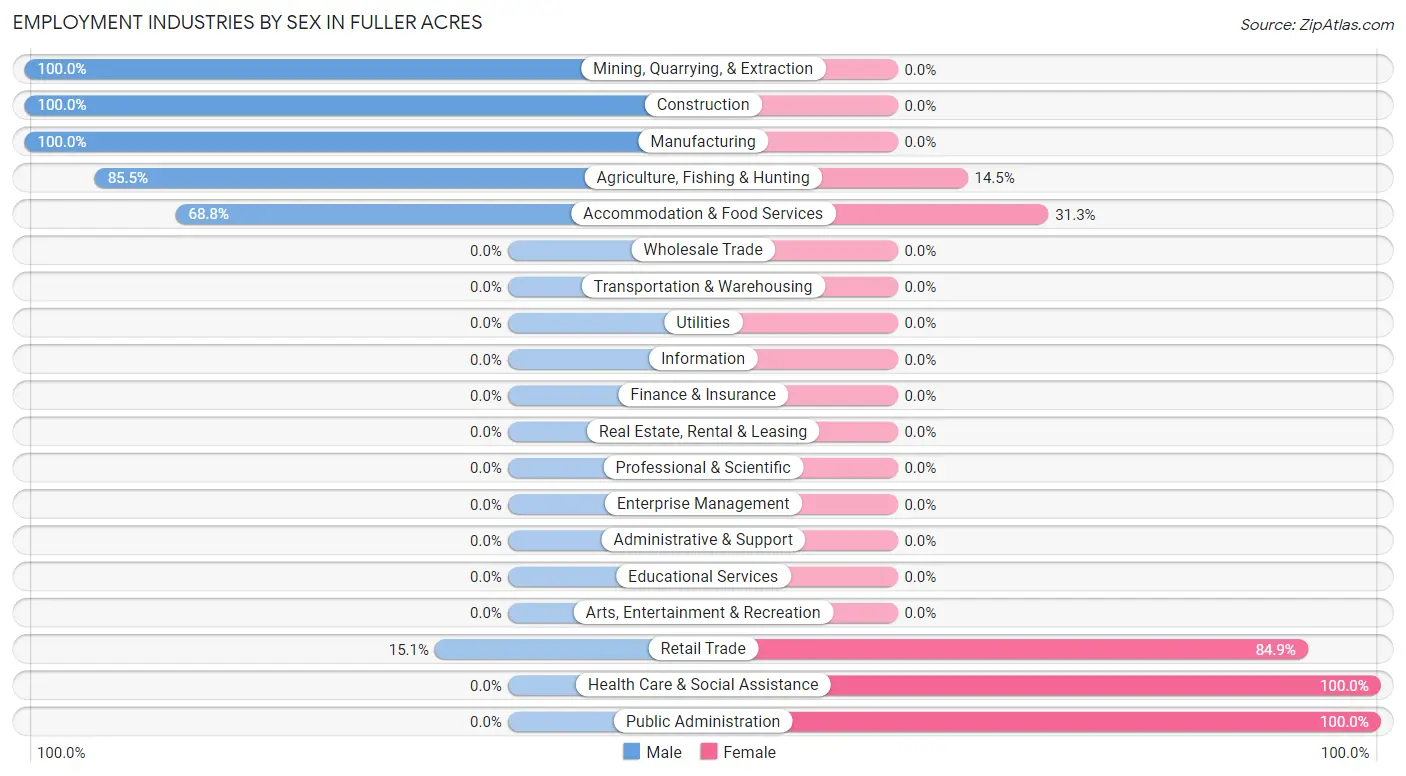
Employment Industries by Sex in Fuller Acres
The Fuller Acres industries that see more men than women are Mining, Quarrying, & Extraction (100.0%), Construction (100.0%), and Manufacturing (100.0%), whereas the industries that tend to have a higher number of women are Health Care & Social Assistance (100.0%), Public Administration (100.0%), and Retail Trade (84.9%).
| Industry | Male | Female |
| Agriculture, Fishing & Hunting | 53 (85.5%) | 9 (14.5%) |
| Mining, Quarrying, & Extraction | 6 (100.0%) | 0 (0.0%) |
| Construction | 16 (100.0%) | 0 (0.0%) |
| Manufacturing | 54 (100.0%) | 0 (0.0%) |
| Wholesale Trade | 0 (0.0%) | 0 (0.0%) |
| Retail Trade | 8 (15.1%) | 45 (84.9%) |
| Transportation & Warehousing | 0 (0.0%) | 0 (0.0%) |
| Utilities | 0 (0.0%) | 0 (0.0%) |
| Information | 0 (0.0%) | 0 (0.0%) |
| Finance & Insurance | 0 (0.0%) | 0 (0.0%) |
| Real Estate, Rental & Leasing | 0 (0.0%) | 0 (0.0%) |
| Professional & Scientific | 0 (0.0%) | 0 (0.0%) |
| Enterprise Management | 0 (0.0%) | 0 (0.0%) |
| Administrative & Support | 0 (0.0%) | 0 (0.0%) |
| Educational Services | 0 (0.0%) | 0 (0.0%) |
| Health Care & Social Assistance | 0 (0.0%) | 15 (100.0%) |
| Arts, Entertainment & Recreation | 0 (0.0%) | 0 (0.0%) |
| Accommodation & Food Services | 11 (68.8%) | 5 (31.2%) |
| Public Administration | 0 (0.0%) | 6 (100.0%) |
| Total | 148 (64.9%) | 80 (35.1%) |
Education in Fuller Acres
School Enrollment in Fuller Acres
The most common levels of schooling among the 169 students in Fuller Acres are college / undergraduate (62 | 36.7%), middle school (41 | 24.3%), and high school (28 | 16.6%).
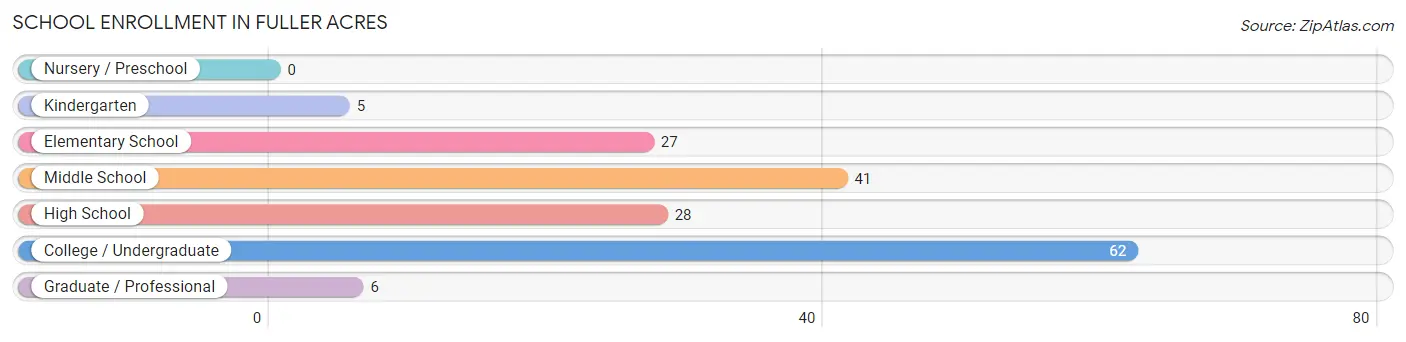
| School Level | # Students | % Students |
| Nursery / Preschool | 0 | 0.0% |
| Kindergarten | 5 | 3.0% |
| Elementary School | 27 | 16.0% |
| Middle School | 41 | 24.3% |
| High School | 28 | 16.6% |
| College / Undergraduate | 62 | 36.7% |
| Graduate / Professional | 6 | 3.5% |
| Total | 169 | 100.0% |
School Enrollment by Age by Funding Source in Fuller Acres
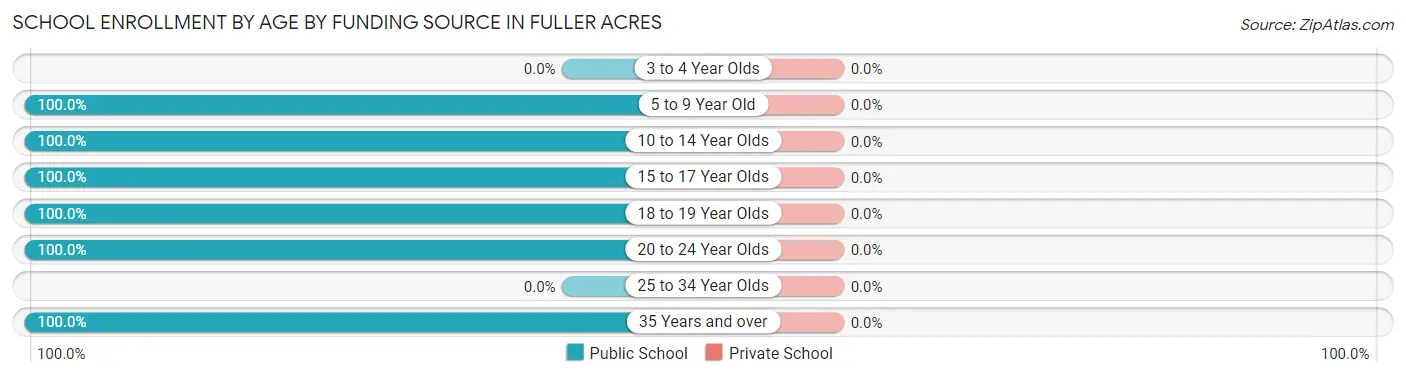
| Age Bracket | Public School | Private School |
| 3 to 4 Year Olds | 0 (0.0%) | 0 (0.0%) |
| 5 to 9 Year Old | 32 (100.0%) | 0 (0.0%) |
| 10 to 14 Year Olds | 41 (100.0%) | 0 (0.0%) |
| 15 to 17 Year Olds | 28 (100.0%) | 0 (0.0%) |
| 18 to 19 Year Olds | 15 (100.0%) | 0 (0.0%) |
| 20 to 24 Year Olds | 47 (100.0%) | 0 (0.0%) |
| 25 to 34 Year Olds | 0 (0.0%) | 0 (0.0%) |
| 35 Years and over | 6 (100.0%) | 0 (0.0%) |
| Total | 169 (100.0%) | 0 (0.0%) |
Educational Attainment by Field of Study in Fuller Acres
Bio, nature & agricultural (7 | 53.8%), and engineering (6 | 46.2%) are the most common fields of study among 13 individuals in Fuller Acres who have obtained a bachelor's degree or higher.
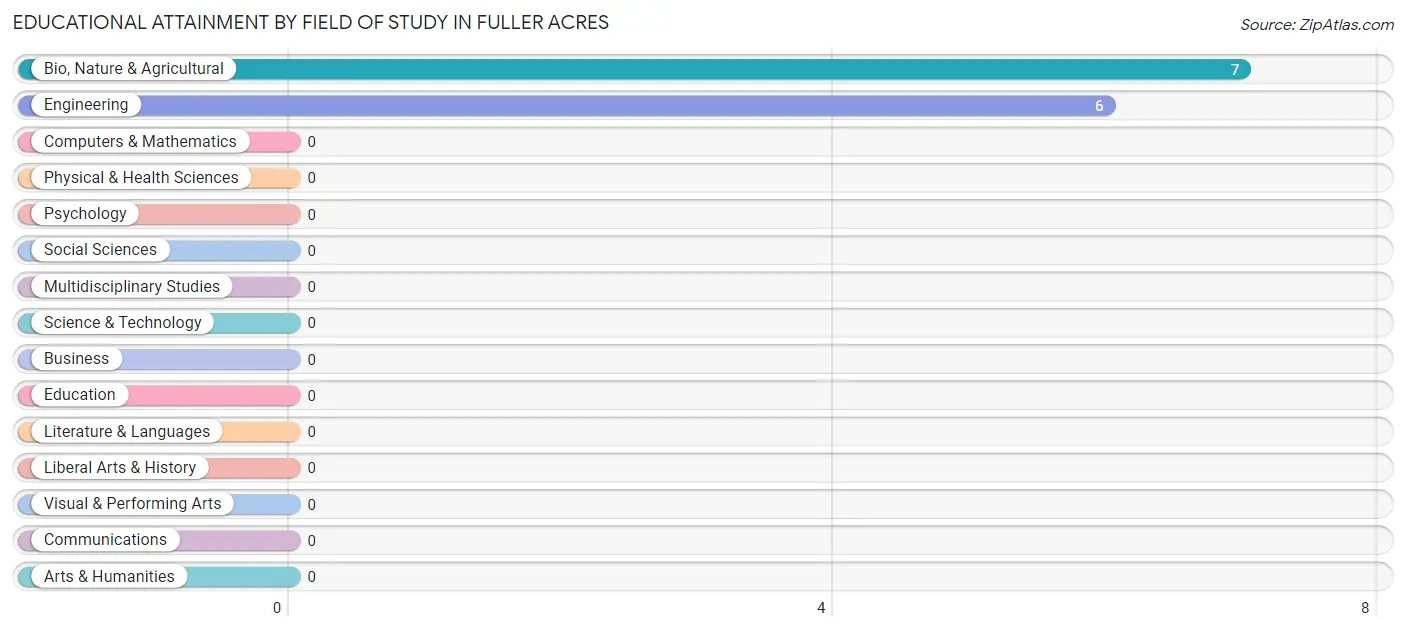
| Field of Study | # Graduates | % Graduates |
| Computers & Mathematics | 0 | 0.0% |
| Bio, Nature & Agricultural | 7 | 53.8% |
| Physical & Health Sciences | 0 | 0.0% |
| Psychology | 0 | 0.0% |
| Social Sciences | 0 | 0.0% |
| Engineering | 6 | 46.2% |
| Multidisciplinary Studies | 0 | 0.0% |
| Science & Technology | 0 | 0.0% |
| Business | 0 | 0.0% |
| Education | 0 | 0.0% |
| Literature & Languages | 0 | 0.0% |
| Liberal Arts & History | 0 | 0.0% |
| Visual & Performing Arts | 0 | 0.0% |
| Communications | 0 | 0.0% |
| Arts & Humanities | 0 | 0.0% |
| Total | 13 | 100.0% |
Transportation & Commute in Fuller Acres
Vehicle Availability by Sex in Fuller Acres
The most prevalent vehicle ownership categories in Fuller Acres are males with 3 vehicles (72, accounting for 48.6%) and females with 3 vehicles (41, making up 101.4%).
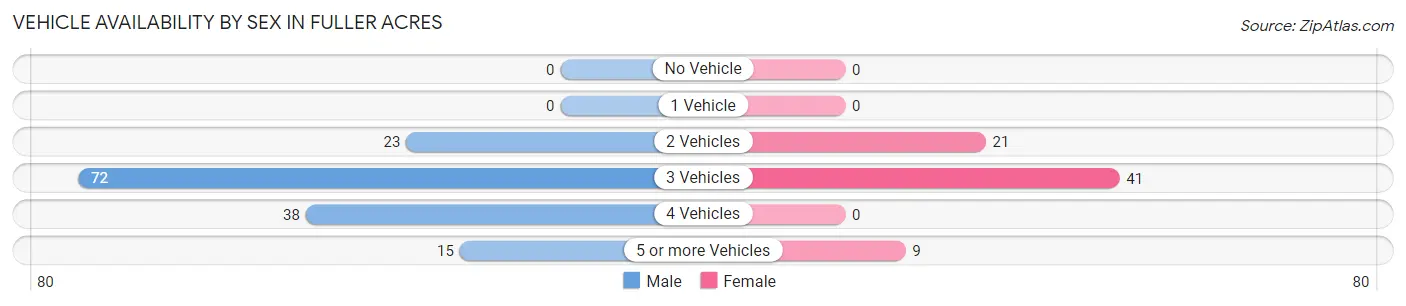
| Vehicles Available | Male | Female |
| No Vehicle | 0 (0.0%) | 0 (0.0%) |
| 1 Vehicle | 0 (0.0%) | 0 (0.0%) |
| 2 Vehicles | 23 (15.5%) | 21 (29.6%) |
| 3 Vehicles | 72 (48.6%) | 41 (57.8%) |
| 4 Vehicles | 38 (25.7%) | 0 (0.0%) |
| 5 or more Vehicles | 15 (10.1%) | 9 (12.7%) |
| Total | 148 (100.0%) | 71 (100.0%) |
Commute Time in Fuller Acres
The most frequently occuring commute durations in Fuller Acres are 20 to 24 minutes (73 commuters, 41.0%), 15 to 19 minutes (44 commuters, 24.7%), and 10 to 14 minutes (18 commuters, 10.1%).
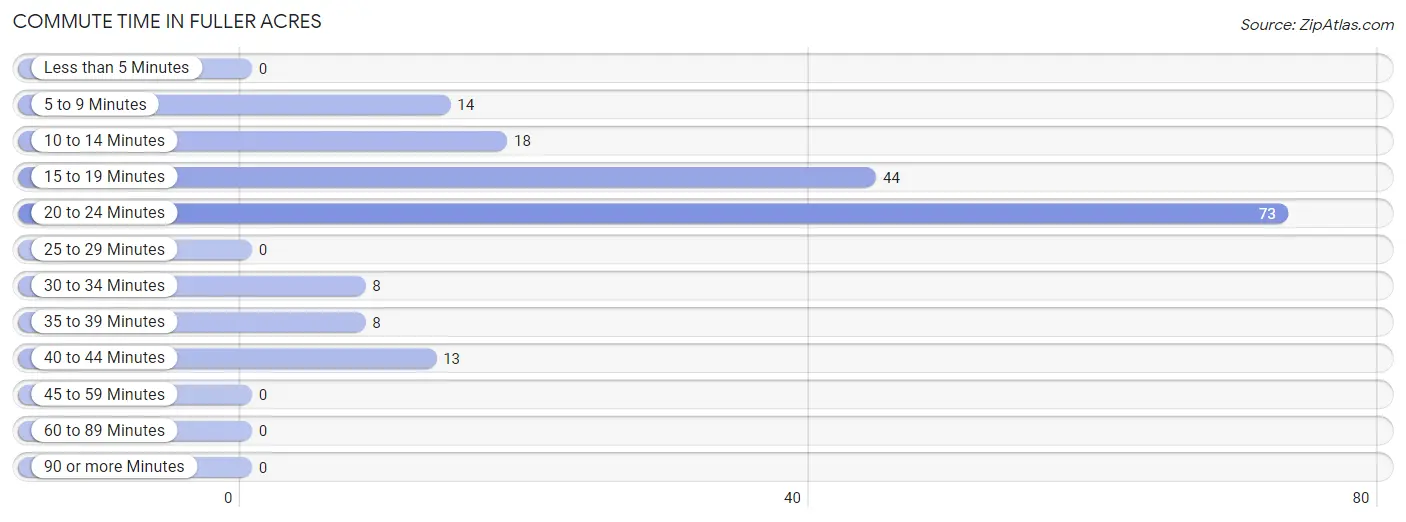
| Commute Time | # Commuters | % Commuters |
| Less than 5 Minutes | 0 | 0.0% |
| 5 to 9 Minutes | 14 | 7.9% |
| 10 to 14 Minutes | 18 | 10.1% |
| 15 to 19 Minutes | 44 | 24.7% |
| 20 to 24 Minutes | 73 | 41.0% |
| 25 to 29 Minutes | 0 | 0.0% |
| 30 to 34 Minutes | 8 | 4.5% |
| 35 to 39 Minutes | 8 | 4.5% |
| 40 to 44 Minutes | 13 | 7.3% |
| 45 to 59 Minutes | 0 | 0.0% |
| 60 to 89 Minutes | 0 | 0.0% |
| 90 or more Minutes | 0 | 0.0% |
Commute Time by Sex in Fuller Acres
The most common commute times in Fuller Acres are 15 to 19 minutes (44 commuters, 41.1%) for males and 20 to 24 minutes (52 commuters, 73.2%) for females.
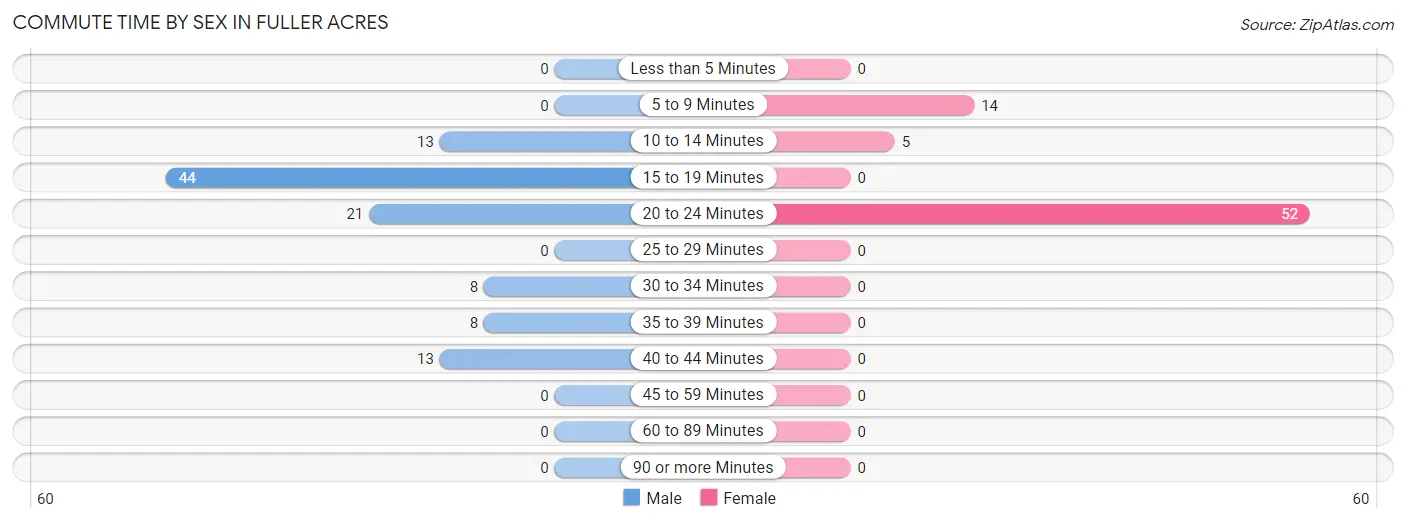
| Commute Time | Male | Female |
| Less than 5 Minutes | 0 (0.0%) | 0 (0.0%) |
| 5 to 9 Minutes | 0 (0.0%) | 14 (19.7%) |
| 10 to 14 Minutes | 13 (12.1%) | 5 (7.0%) |
| 15 to 19 Minutes | 44 (41.1%) | 0 (0.0%) |
| 20 to 24 Minutes | 21 (19.6%) | 52 (73.2%) |
| 25 to 29 Minutes | 0 (0.0%) | 0 (0.0%) |
| 30 to 34 Minutes | 8 (7.5%) | 0 (0.0%) |
| 35 to 39 Minutes | 8 (7.5%) | 0 (0.0%) |
| 40 to 44 Minutes | 13 (12.1%) | 0 (0.0%) |
| 45 to 59 Minutes | 0 (0.0%) | 0 (0.0%) |
| 60 to 89 Minutes | 0 (0.0%) | 0 (0.0%) |
| 90 or more Minutes | 0 (0.0%) | 0 (0.0%) |
Time of Departure to Work by Sex in Fuller Acres
The most frequent times of departure to work in Fuller Acres are 7:00 AM to 7:29 AM (48, 44.9%) for males and 8:00 AM to 8:29 AM (28, 39.4%) for females.
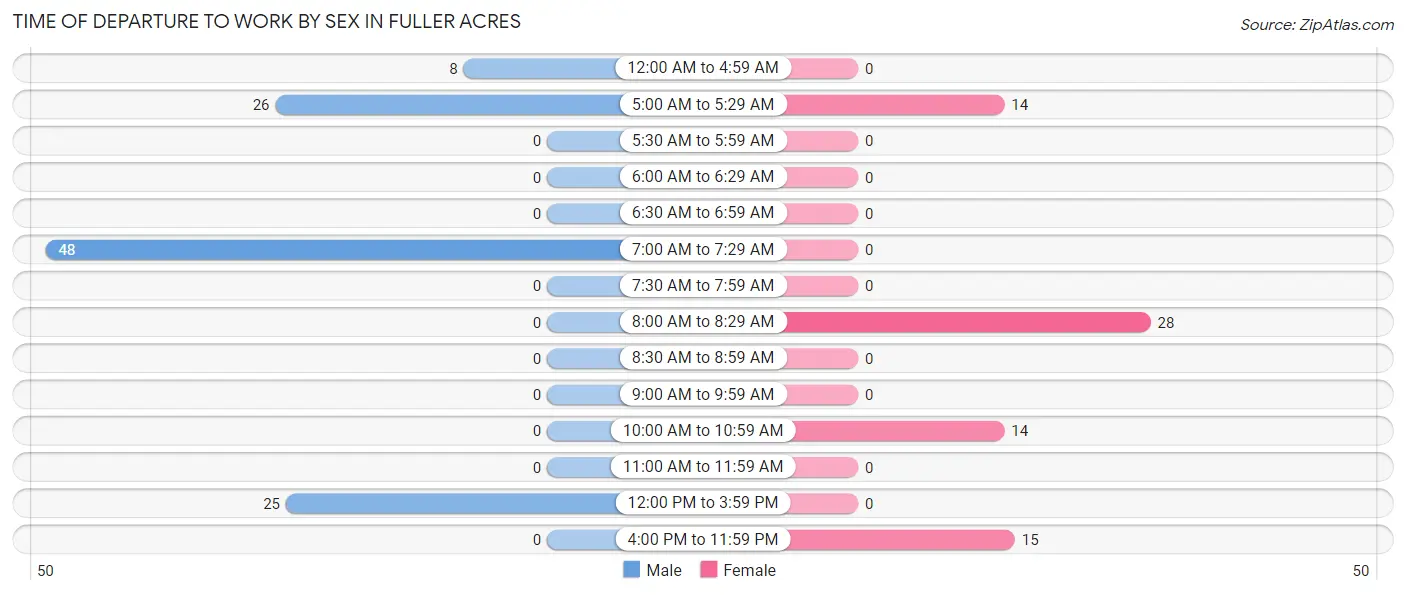
| Time of Departure | Male | Female |
| 12:00 AM to 4:59 AM | 8 (7.5%) | 0 (0.0%) |
| 5:00 AM to 5:29 AM | 26 (24.3%) | 14 (19.7%) |
| 5:30 AM to 5:59 AM | 0 (0.0%) | 0 (0.0%) |
| 6:00 AM to 6:29 AM | 0 (0.0%) | 0 (0.0%) |
| 6:30 AM to 6:59 AM | 0 (0.0%) | 0 (0.0%) |
| 7:00 AM to 7:29 AM | 48 (44.9%) | 0 (0.0%) |
| 7:30 AM to 7:59 AM | 0 (0.0%) | 0 (0.0%) |
| 8:00 AM to 8:29 AM | 0 (0.0%) | 28 (39.4%) |
| 8:30 AM to 8:59 AM | 0 (0.0%) | 0 (0.0%) |
| 9:00 AM to 9:59 AM | 0 (0.0%) | 0 (0.0%) |
| 10:00 AM to 10:59 AM | 0 (0.0%) | 14 (19.7%) |
| 11:00 AM to 11:59 AM | 0 (0.0%) | 0 (0.0%) |
| 12:00 PM to 3:59 PM | 25 (23.4%) | 0 (0.0%) |
| 4:00 PM to 11:59 PM | 0 (0.0%) | 15 (21.1%) |
| Total | 107 (100.0%) | 71 (100.0%) |
Housing Occupancy in Fuller Acres
Occupancy by Ownership in Fuller Acres
Of the total 162 dwellings in Fuller Acres, owner-occupied units account for 86 (53.1%), while renter-occupied units make up 76 (46.9%).
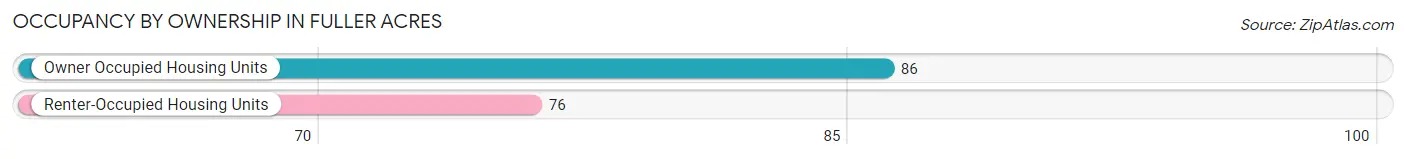
| Occupancy | # Housing Units | % Housing Units |
| Owner Occupied Housing Units | 86 | 53.1% |
| Renter-Occupied Housing Units | 76 | 46.9% |
| Total Occupied Housing Units | 162 | 100.0% |
Occupancy by Household Size in Fuller Acres
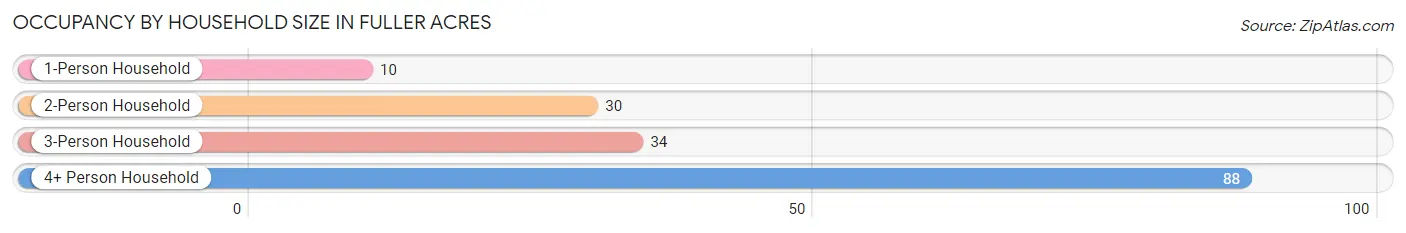
| Household Size | # Housing Units | % Housing Units |
| 1-Person Household | 10 | 6.2% |
| 2-Person Household | 30 | 18.5% |
| 3-Person Household | 34 | 21.0% |
| 4+ Person Household | 88 | 54.3% |
| Total Housing Units | 162 | 100.0% |
Occupancy by Ownership by Household Size in Fuller Acres
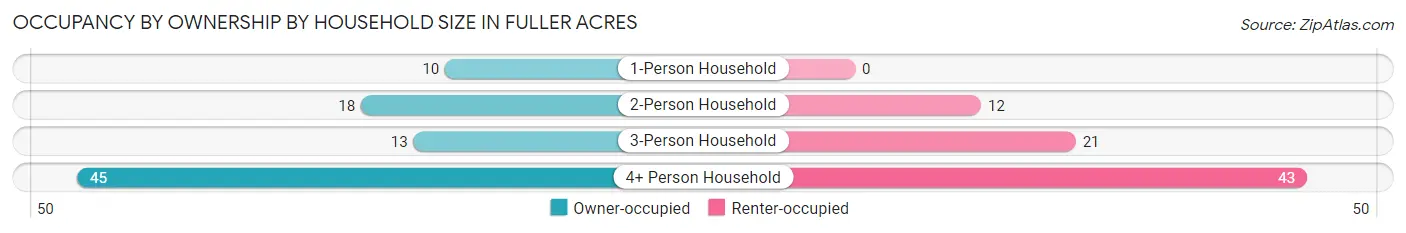
| Household Size | Owner-occupied | Renter-occupied |
| 1-Person Household | 10 (100.0%) | 0 (0.0%) |
| 2-Person Household | 18 (60.0%) | 12 (40.0%) |
| 3-Person Household | 13 (38.2%) | 21 (61.8%) |
| 4+ Person Household | 45 (51.1%) | 43 (48.9%) |
| Total Housing Units | 86 (53.1%) | 76 (46.9%) |
Occupancy by Educational Attainment in Fuller Acres
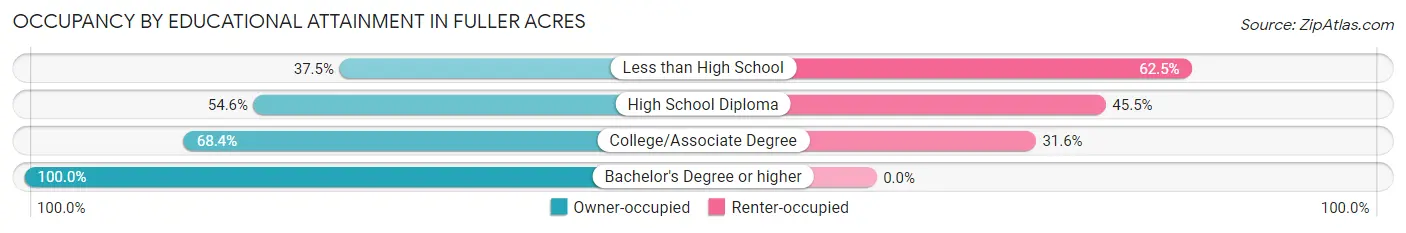
| Household Size | Owner-occupied | Renter-occupied |
| Less than High School | 18 (37.5%) | 30 (62.5%) |
| High School Diploma | 48 (54.5%) | 40 (45.5%) |
| College/Associate Degree | 13 (68.4%) | 6 (31.6%) |
| Bachelor's Degree or higher | 7 (100.0%) | 0 (0.0%) |
Occupancy by Age of Householder in Fuller Acres
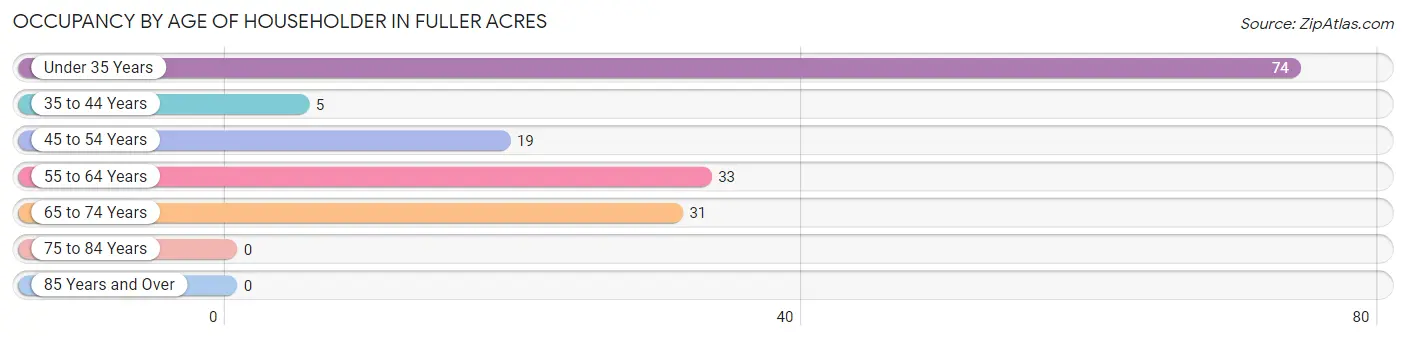
| Age Bracket | # Households | % Households |
| Under 35 Years | 74 | 45.7% |
| 35 to 44 Years | 5 | 3.1% |
| 45 to 54 Years | 19 | 11.7% |
| 55 to 64 Years | 33 | 20.4% |
| 65 to 74 Years | 31 | 19.1% |
| 75 to 84 Years | 0 | 0.0% |
| 85 Years and Over | 0 | 0.0% |
| Total | 162 | 100.0% |
Housing Finances in Fuller Acres
Median Income by Occupancy in Fuller Acres
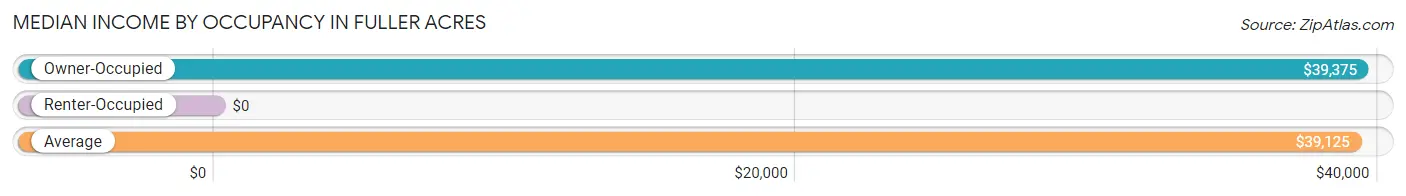
| Occupancy Type | # Households | Median Income |
| Owner-Occupied | 86 (53.1%) | $39,375 |
| Renter-Occupied | 76 (46.9%) | $0 |
| Average | 162 (100.0%) | $39,125 |
Occupancy by Householder Income Bracket in Fuller Acres
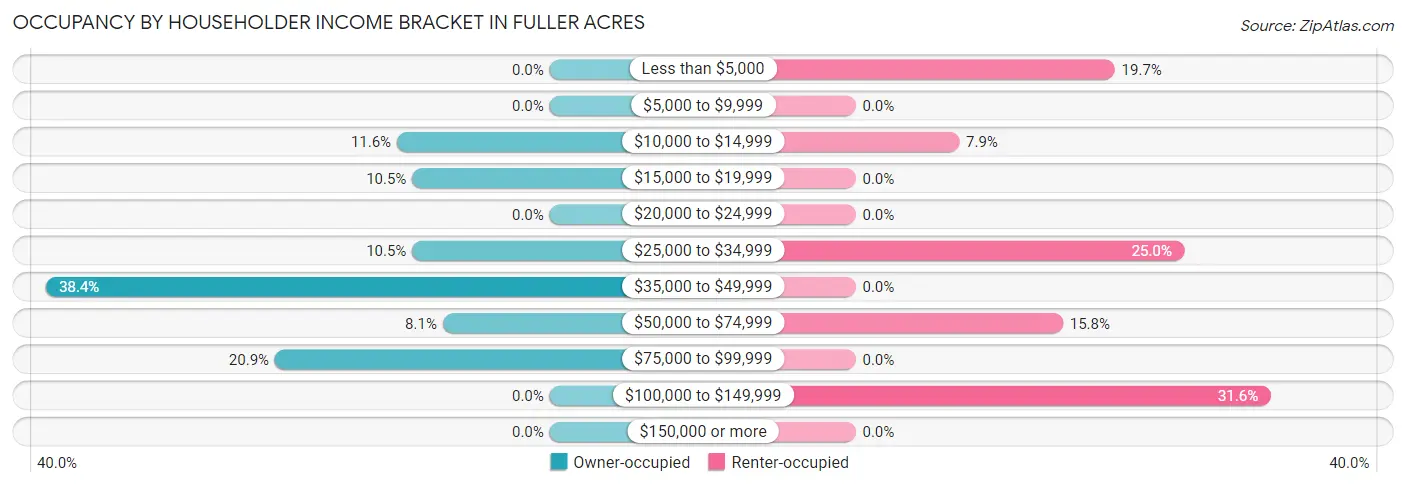
| Income Bracket | Owner-occupied | Renter-occupied |
| Less than $5,000 | 0 (0.0%) | 15 (19.7%) |
| $5,000 to $9,999 | 0 (0.0%) | 0 (0.0%) |
| $10,000 to $14,999 | 10 (11.6%) | 6 (7.9%) |
| $15,000 to $19,999 | 9 (10.5%) | 0 (0.0%) |
| $20,000 to $24,999 | 0 (0.0%) | 0 (0.0%) |
| $25,000 to $34,999 | 9 (10.5%) | 19 (25.0%) |
| $35,000 to $49,999 | 33 (38.4%) | 0 (0.0%) |
| $50,000 to $74,999 | 7 (8.1%) | 12 (15.8%) |
| $75,000 to $99,999 | 18 (20.9%) | 0 (0.0%) |
| $100,000 to $149,999 | 0 (0.0%) | 24 (31.6%) |
| $150,000 or more | 0 (0.0%) | 0 (0.0%) |
| Total | 86 (100.0%) | 76 (100.0%) |
Monthly Housing Cost Tiers in Fuller Acres
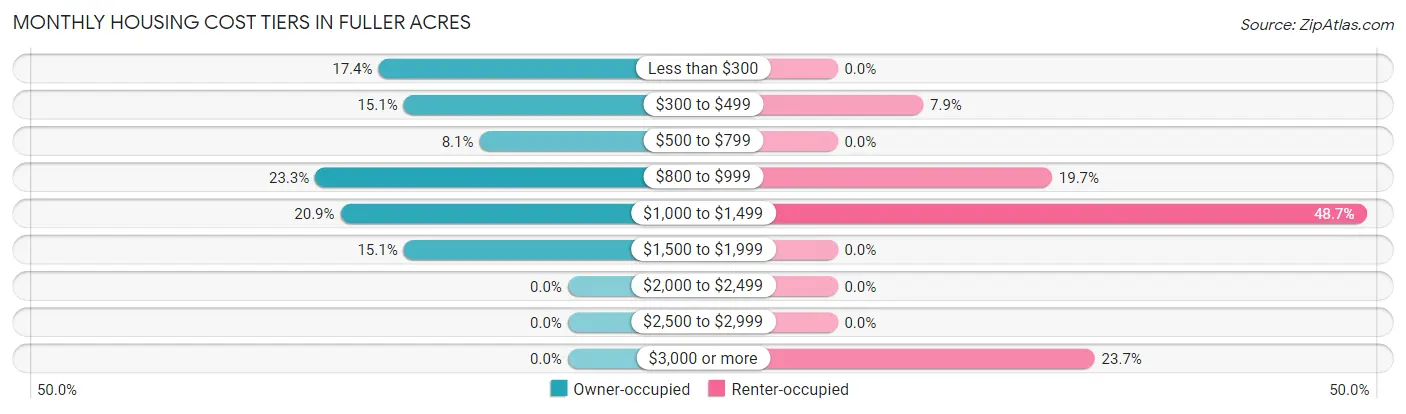
| Monthly Cost | Owner-occupied | Renter-occupied |
| Less than $300 | 15 (17.4%) | 0 (0.0%) |
| $300 to $499 | 13 (15.1%) | 6 (7.9%) |
| $500 to $799 | 7 (8.1%) | 0 (0.0%) |
| $800 to $999 | 20 (23.3%) | 15 (19.7%) |
| $1,000 to $1,499 | 18 (20.9%) | 37 (48.7%) |
| $1,500 to $1,999 | 13 (15.1%) | 0 (0.0%) |
| $2,000 to $2,499 | 0 (0.0%) | 0 (0.0%) |
| $2,500 to $2,999 | 0 (0.0%) | 0 (0.0%) |
| $3,000 or more | 0 (0.0%) | 18 (23.7%) |
| Total | 86 (100.0%) | 76 (100.0%) |
Physical Housing Characteristics in Fuller Acres
Housing Structures in Fuller Acres
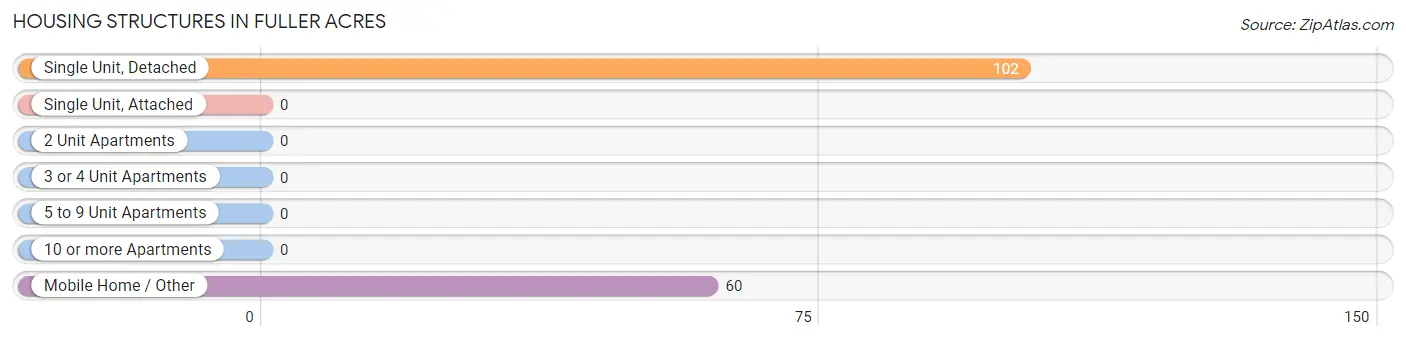
| Structure Type | # Housing Units | % Housing Units |
| Single Unit, Detached | 102 | 63.0% |
| Single Unit, Attached | 0 | 0.0% |
| 2 Unit Apartments | 0 | 0.0% |
| 3 or 4 Unit Apartments | 0 | 0.0% |
| 5 to 9 Unit Apartments | 0 | 0.0% |
| 10 or more Apartments | 0 | 0.0% |
| Mobile Home / Other | 60 | 37.0% |
| Total | 162 | 100.0% |
Housing Structures by Occupancy in Fuller Acres
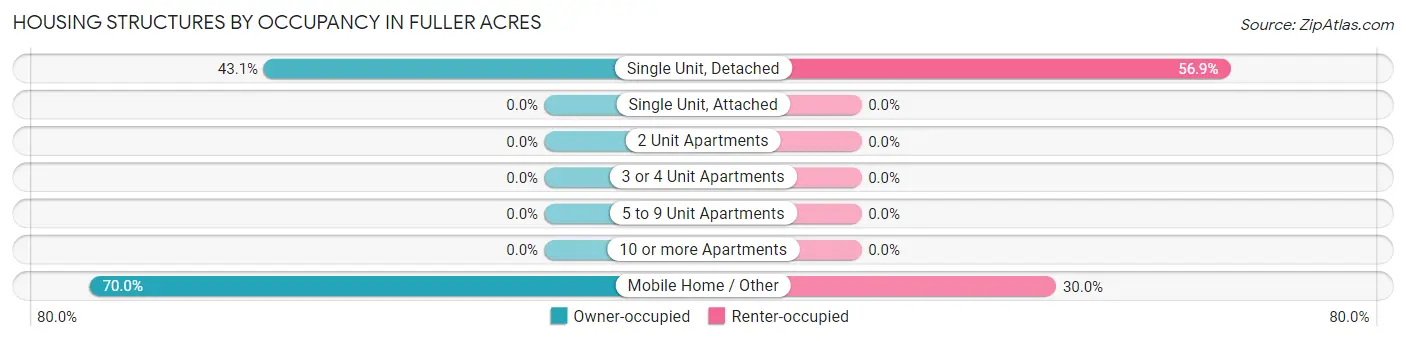
| Structure Type | Owner-occupied | Renter-occupied |
| Single Unit, Detached | 44 (43.1%) | 58 (56.9%) |
| Single Unit, Attached | 0 (0.0%) | 0 (0.0%) |
| 2 Unit Apartments | 0 (0.0%) | 0 (0.0%) |
| 3 or 4 Unit Apartments | 0 (0.0%) | 0 (0.0%) |
| 5 to 9 Unit Apartments | 0 (0.0%) | 0 (0.0%) |
| 10 or more Apartments | 0 (0.0%) | 0 (0.0%) |
| Mobile Home / Other | 42 (70.0%) | 18 (30.0%) |
| Total | 86 (53.1%) | 76 (46.9%) |
Housing Structures by Number of Rooms in Fuller Acres
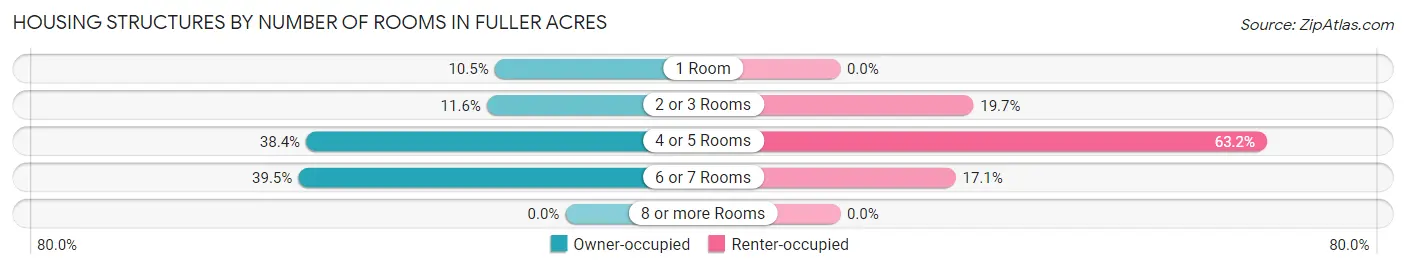
| Number of Rooms | Owner-occupied | Renter-occupied |
| 1 Room | 9 (10.5%) | 0 (0.0%) |
| 2 or 3 Rooms | 10 (11.6%) | 15 (19.7%) |
| 4 or 5 Rooms | 33 (38.4%) | 48 (63.2%) |
| 6 or 7 Rooms | 34 (39.5%) | 13 (17.1%) |
| 8 or more Rooms | 0 (0.0%) | 0 (0.0%) |
| Total | 86 (100.0%) | 76 (100.0%) |
Housing Structure by Heating Type in Fuller Acres
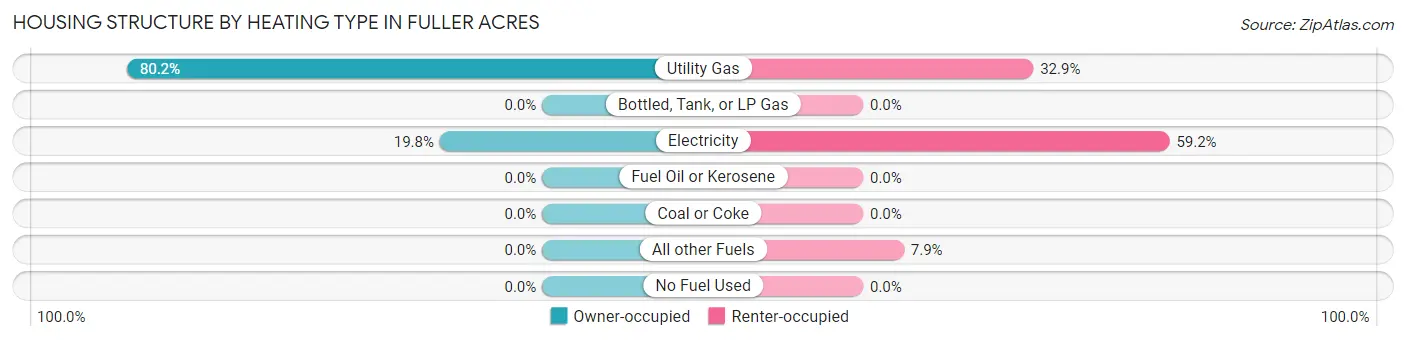
| Heating Type | Owner-occupied | Renter-occupied |
| Utility Gas | 69 (80.2%) | 25 (32.9%) |
| Bottled, Tank, or LP Gas | 0 (0.0%) | 0 (0.0%) |
| Electricity | 17 (19.8%) | 45 (59.2%) |
| Fuel Oil or Kerosene | 0 (0.0%) | 0 (0.0%) |
| Coal or Coke | 0 (0.0%) | 0 (0.0%) |
| All other Fuels | 0 (0.0%) | 6 (7.9%) |
| No Fuel Used | 0 (0.0%) | 0 (0.0%) |
| Total | 86 (100.0%) | 76 (100.0%) |
Household Vehicle Usage in Fuller Acres
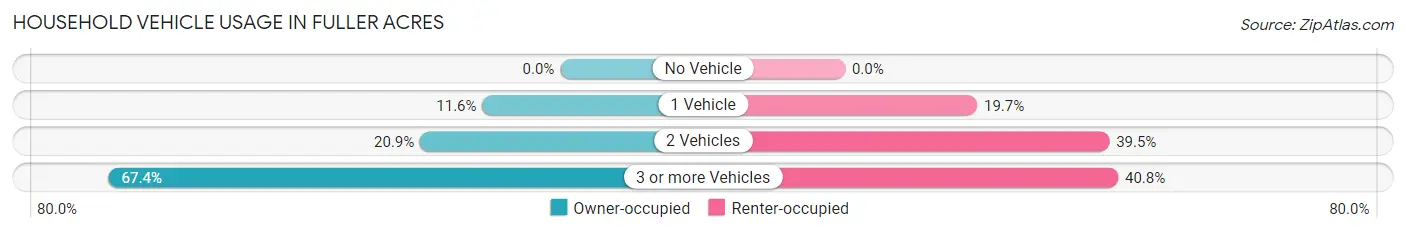
| Vehicles per Household | Owner-occupied | Renter-occupied |
| No Vehicle | 0 (0.0%) | 0 (0.0%) |
| 1 Vehicle | 10 (11.6%) | 15 (19.7%) |
| 2 Vehicles | 18 (20.9%) | 30 (39.5%) |
| 3 or more Vehicles | 58 (67.4%) | 31 (40.8%) |
| Total | 86 (100.0%) | 76 (100.0%) |
Real Estate & Mortgages in Fuller Acres
Real Estate and Mortgage Overview in Fuller Acres
| Characteristic | Without Mortgage | With Mortgage |
| Housing Units | 55 | 31 |
| Median Property Value | $156,500 | $0 |
| Median Household Income | $29,688 | $0 |
| Monthly Housing Costs | $488 | $0 |
| Real Estate Taxes | $1,526 | $0 |
Property Value by Mortgage Status in Fuller Acres
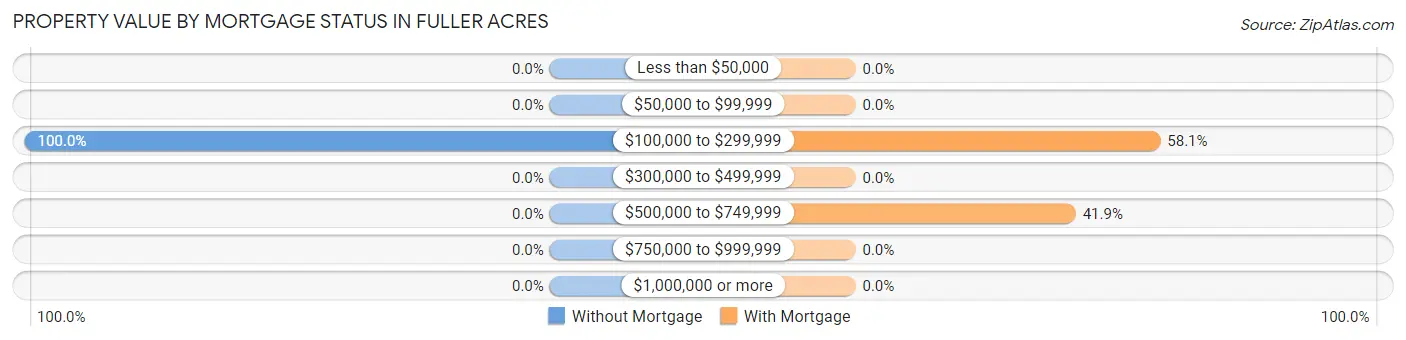
| Property Value | Without Mortgage | With Mortgage |
| Less than $50,000 | 0 (0.0%) | 0 (0.0%) |
| $50,000 to $99,999 | 0 (0.0%) | 0 (0.0%) |
| $100,000 to $299,999 | 55 (100.0%) | 18 (58.1%) |
| $300,000 to $499,999 | 0 (0.0%) | 0 (0.0%) |
| $500,000 to $749,999 | 0 (0.0%) | 13 (41.9%) |
| $750,000 to $999,999 | 0 (0.0%) | 0 (0.0%) |
| $1,000,000 or more | 0 (0.0%) | 0 (0.0%) |
| Total | 55 (100.0%) | 31 (100.0%) |
Household Income by Mortgage Status in Fuller Acres
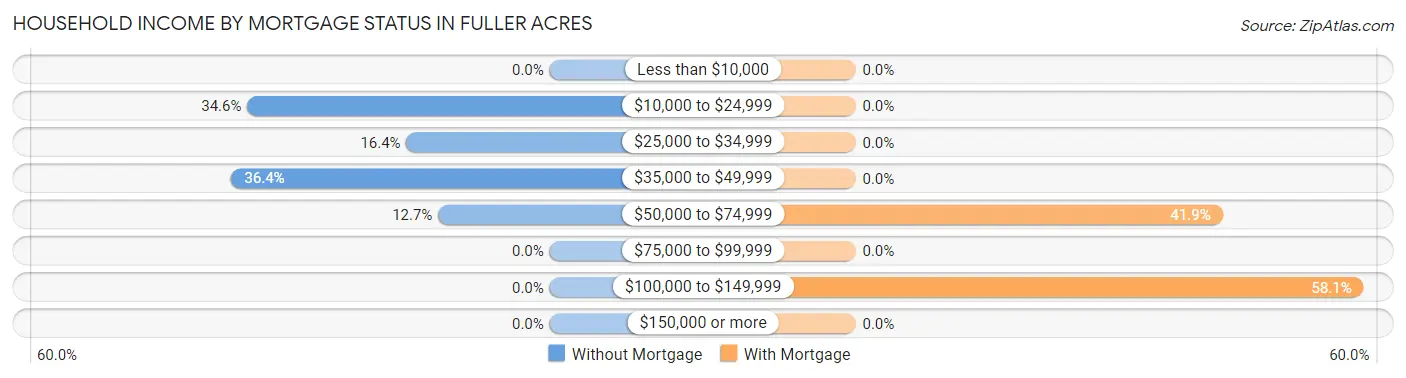
| Household Income | Without Mortgage | With Mortgage |
| Less than $10,000 | 0 (0.0%) | 0 (0.0%) |
| $10,000 to $24,999 | 19 (34.5%) | 0 (0.0%) |
| $25,000 to $34,999 | 9 (16.4%) | 0 (0.0%) |
| $35,000 to $49,999 | 20 (36.4%) | 0 (0.0%) |
| $50,000 to $74,999 | 7 (12.7%) | 13 (41.9%) |
| $75,000 to $99,999 | 0 (0.0%) | 0 (0.0%) |
| $100,000 to $149,999 | 0 (0.0%) | 18 (58.1%) |
| $150,000 or more | 0 (0.0%) | 0 (0.0%) |
| Total | 55 (100.0%) | 31 (100.0%) |
Property Value to Household Income Ratio in Fuller Acres
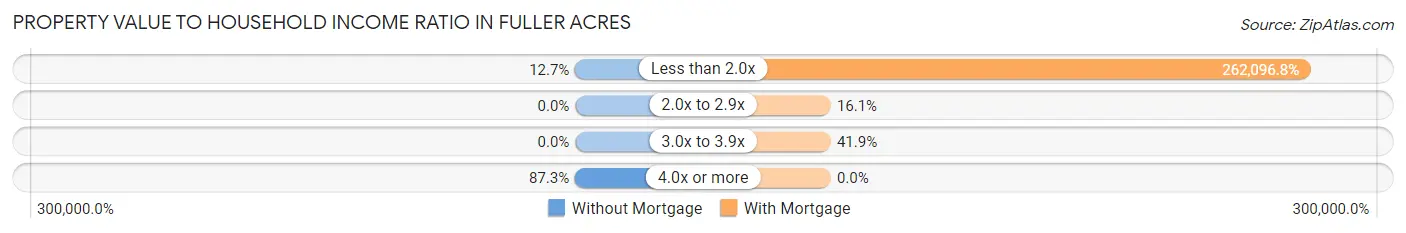
| Value-to-Income Ratio | Without Mortgage | With Mortgage |
| Less than 2.0x | 7 (12.7%) | 81,250 (262,096.8%) |
| 2.0x to 2.9x | 0 (0.0%) | 5 (16.1%) |
| 3.0x to 3.9x | 0 (0.0%) | 13 (41.9%) |
| 4.0x or more | 48 (87.3%) | 0 (0.0%) |
| Total | 55 (100.0%) | 31 (100.0%) |
Real Estate Taxes by Mortgage Status in Fuller Acres
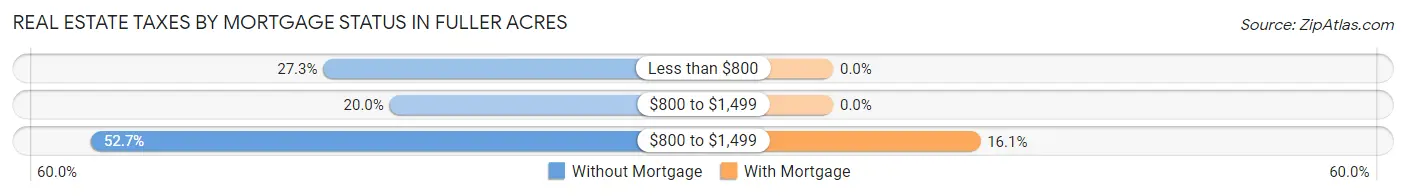
| Property Taxes | Without Mortgage | With Mortgage |
| Less than $800 | 15 (27.3%) | 0 (0.0%) |
| $800 to $1,499 | 11 (20.0%) | 0 (0.0%) |
| $800 to $1,499 | 29 (52.7%) | 5 (16.1%) |
| Total | 55 (100.0%) | 31 (100.0%) |
Health & Disability in Fuller Acres
Health Insurance Coverage by Age in Fuller Acres
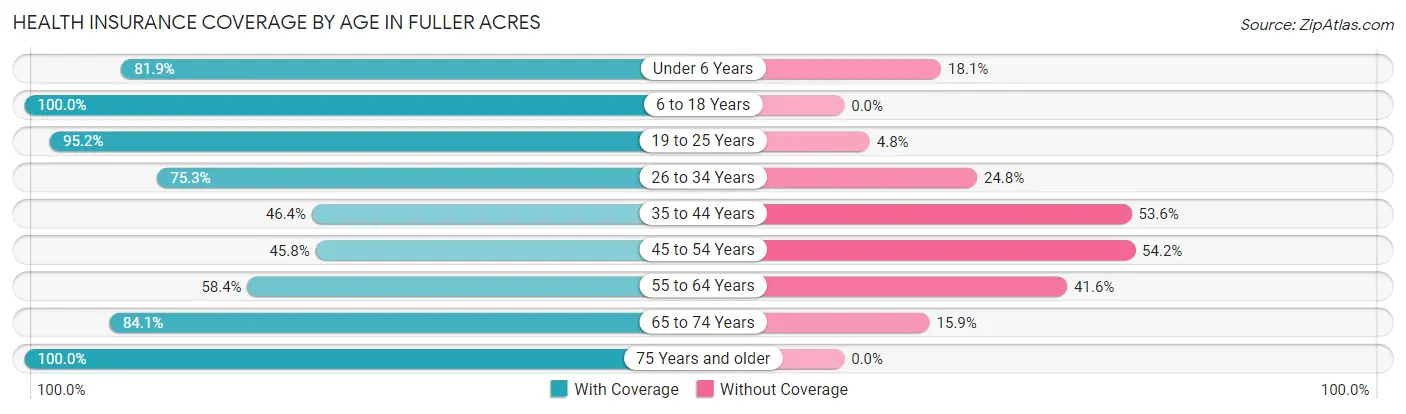
| Age Bracket | With Coverage | Without Coverage |
| Under 6 Years | 59 (81.9%) | 13 (18.1%) |
| 6 to 18 Years | 133 (100.0%) | 0 (0.0%) |
| 19 to 25 Years | 120 (95.2%) | 6 (4.8%) |
| 26 to 34 Years | 76 (75.2%) | 25 (24.7%) |
| 35 to 44 Years | 26 (46.4%) | 30 (53.6%) |
| 45 to 54 Years | 27 (45.8%) | 32 (54.2%) |
| 55 to 64 Years | 45 (58.4%) | 32 (41.6%) |
| 65 to 74 Years | 74 (84.1%) | 14 (15.9%) |
| 75 Years and older | 5 (100.0%) | 0 (0.0%) |
| Total | 565 (78.8%) | 152 (21.2%) |
Health Insurance Coverage by Citizenship Status in Fuller Acres
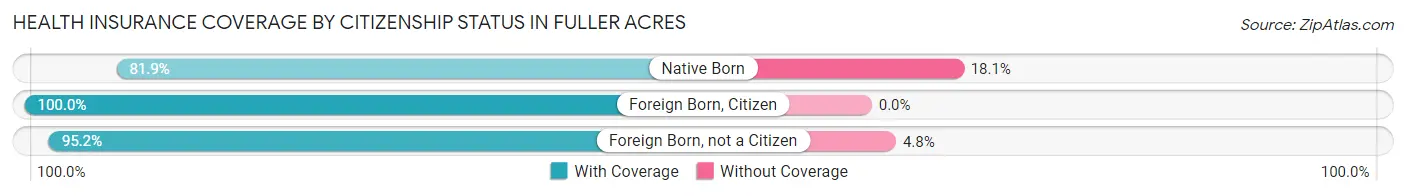
| Citizenship Status | With Coverage | Without Coverage |
| Native Born | 59 (81.9%) | 13 (18.1%) |
| Foreign Born, Citizen | 133 (100.0%) | 0 (0.0%) |
| Foreign Born, not a Citizen | 120 (95.2%) | 6 (4.8%) |
Health Insurance Coverage by Household Income in Fuller Acres
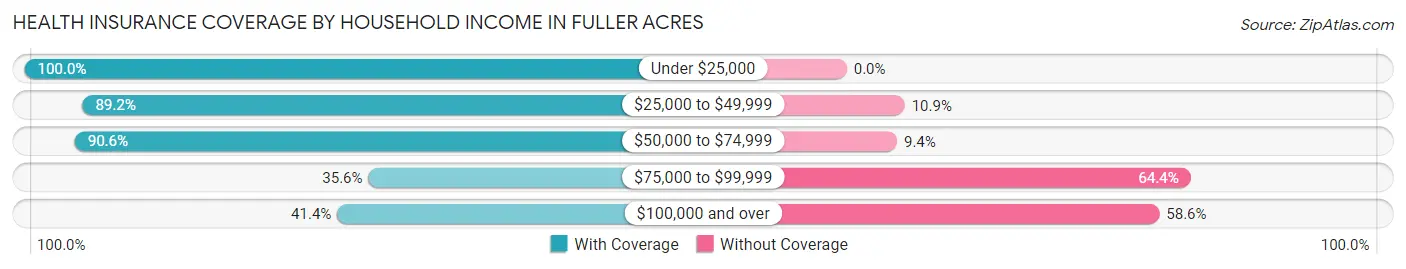
| Household Income | With Coverage | Without Coverage |
| Under $25,000 | 84 (100.0%) | 0 (0.0%) |
| $25,000 to $49,999 | 337 (89.1%) | 41 (10.8%) |
| $50,000 to $74,999 | 77 (90.6%) | 8 (9.4%) |
| $75,000 to $99,999 | 21 (35.6%) | 38 (64.4%) |
| $100,000 and over | 46 (41.4%) | 65 (58.6%) |
Public vs Private Health Insurance Coverage by Age in Fuller Acres
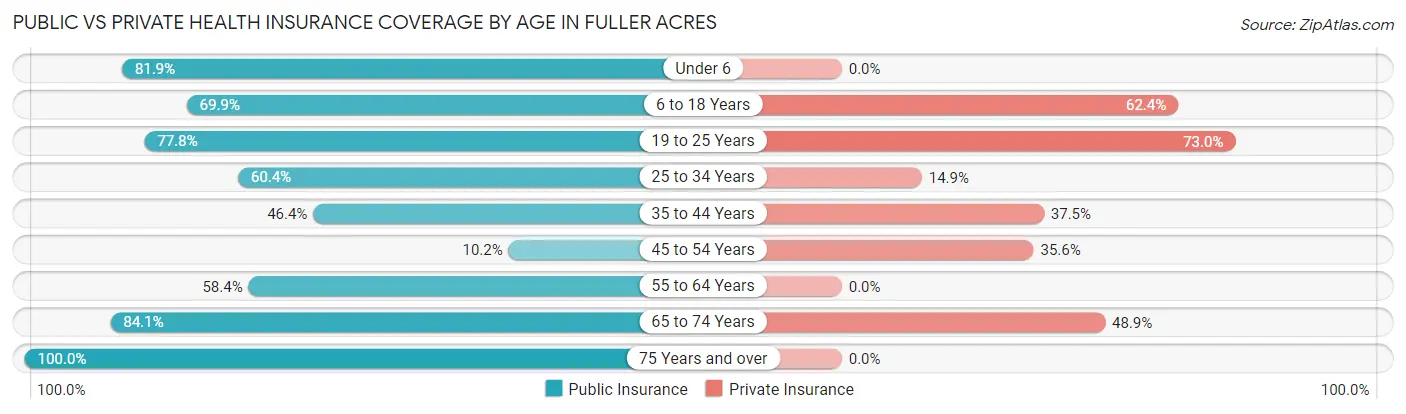
| Age Bracket | Public Insurance | Private Insurance |
| Under 6 | 59 (81.9%) | 0 (0.0%) |
| 6 to 18 Years | 93 (69.9%) | 83 (62.4%) |
| 19 to 25 Years | 98 (77.8%) | 92 (73.0%) |
| 25 to 34 Years | 61 (60.4%) | 15 (14.8%) |
| 35 to 44 Years | 26 (46.4%) | 21 (37.5%) |
| 45 to 54 Years | 6 (10.2%) | 21 (35.6%) |
| 55 to 64 Years | 45 (58.4%) | 0 (0.0%) |
| 65 to 74 Years | 74 (84.1%) | 43 (48.9%) |
| 75 Years and over | 5 (100.0%) | 0 (0.0%) |
| Total | 467 (65.1%) | 275 (38.4%) |
Disability Status by Sex by Age in Fuller Acres
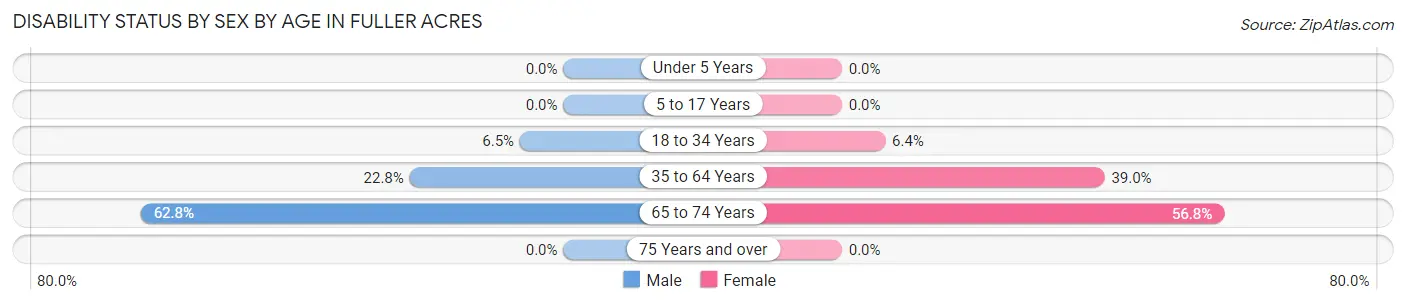
| Age Bracket | Male | Female |
| Under 5 Years | 0 (0.0%) | 0 (0.0%) |
| 5 to 17 Years | 0 (0.0%) | 0 (0.0%) |
| 18 to 34 Years | 8 (6.5%) | 9 (6.4%) |
| 35 to 64 Years | 21 (22.8%) | 39 (39.0%) |
| 65 to 74 Years | 32 (62.7%) | 21 (56.8%) |
| 75 Years and over | 0 (0.0%) | 0 (0.0%) |
Disability Class by Sex by Age in Fuller Acres
Disability Class: Hearing Difficulty
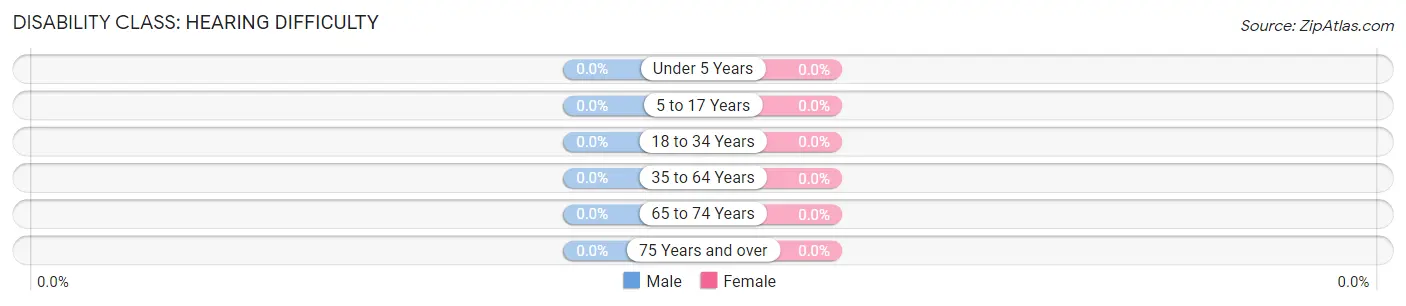
| Age Bracket | Male | Female |
| Under 5 Years | 0 (0.0%) | 0 (0.0%) |
| 5 to 17 Years | 0 (0.0%) | 0 (0.0%) |
| 18 to 34 Years | 0 (0.0%) | 0 (0.0%) |
| 35 to 64 Years | 0 (0.0%) | 0 (0.0%) |
| 65 to 74 Years | 0 (0.0%) | 0 (0.0%) |
| 75 Years and over | 0 (0.0%) | 0 (0.0%) |
Disability Class: Vision Difficulty
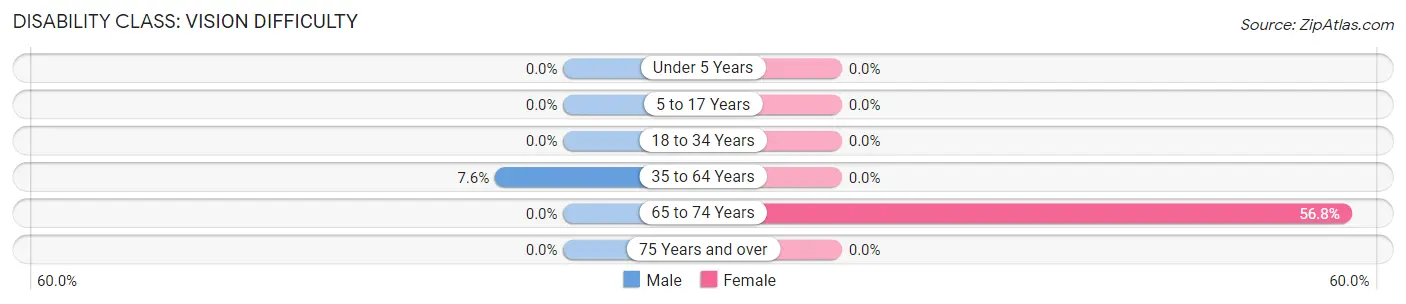
| Age Bracket | Male | Female |
| Under 5 Years | 0 (0.0%) | 0 (0.0%) |
| 5 to 17 Years | 0 (0.0%) | 0 (0.0%) |
| 18 to 34 Years | 0 (0.0%) | 0 (0.0%) |
| 35 to 64 Years | 7 (7.6%) | 0 (0.0%) |
| 65 to 74 Years | 0 (0.0%) | 21 (56.8%) |
| 75 Years and over | 0 (0.0%) | 0 (0.0%) |
Disability Class: Cognitive Difficulty
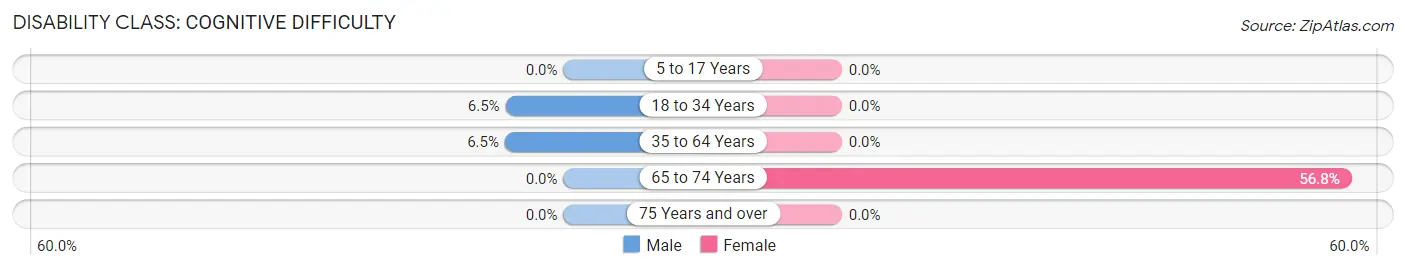
| Age Bracket | Male | Female |
| 5 to 17 Years | 0 (0.0%) | 0 (0.0%) |
| 18 to 34 Years | 8 (6.5%) | 0 (0.0%) |
| 35 to 64 Years | 6 (6.5%) | 0 (0.0%) |
| 65 to 74 Years | 0 (0.0%) | 21 (56.8%) |
| 75 Years and over | 0 (0.0%) | 0 (0.0%) |
Disability Class: Ambulatory Difficulty
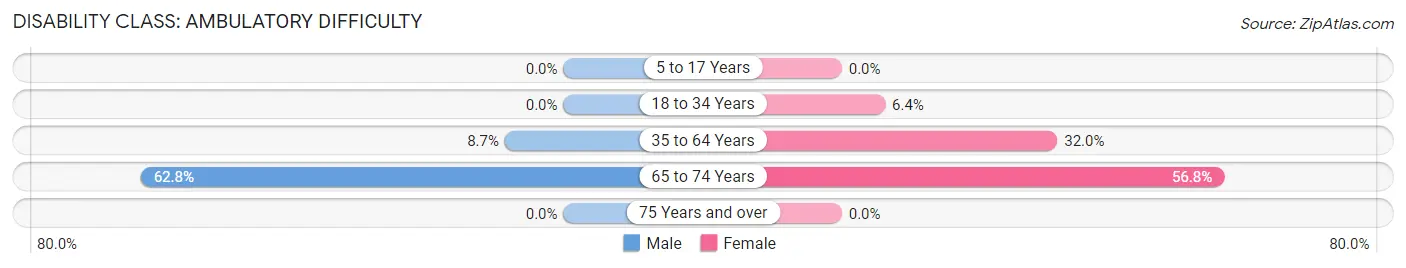
| Age Bracket | Male | Female |
| 5 to 17 Years | 0 (0.0%) | 0 (0.0%) |
| 18 to 34 Years | 0 (0.0%) | 9 (6.4%) |
| 35 to 64 Years | 8 (8.7%) | 32 (32.0%) |
| 65 to 74 Years | 32 (62.7%) | 21 (56.8%) |
| 75 Years and over | 0 (0.0%) | 0 (0.0%) |
Disability Class: Self-Care Difficulty
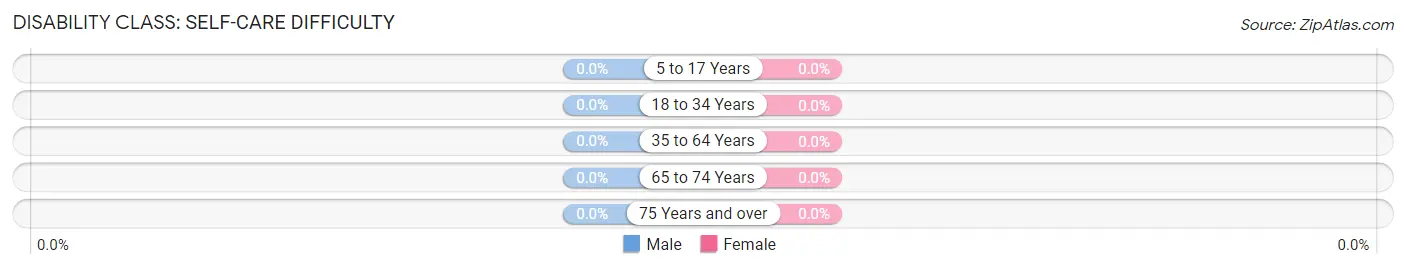
| Age Bracket | Male | Female |
| 5 to 17 Years | 0 (0.0%) | 0 (0.0%) |
| 18 to 34 Years | 0 (0.0%) | 0 (0.0%) |
| 35 to 64 Years | 0 (0.0%) | 0 (0.0%) |
| 65 to 74 Years | 0 (0.0%) | 0 (0.0%) |
| 75 Years and over | 0 (0.0%) | 0 (0.0%) |
Technology Access in Fuller Acres
Computing Device Access in Fuller Acres
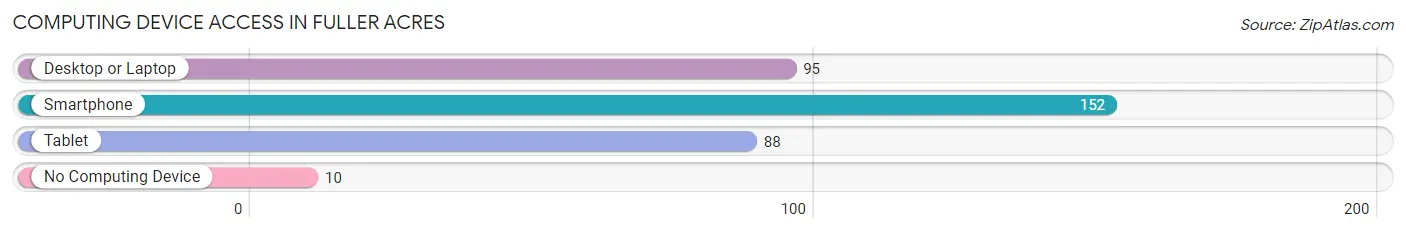
| Device Type | # Households | % Households |
| Desktop or Laptop | 95 | 58.6% |
| Smartphone | 152 | 93.8% |
| Tablet | 88 | 54.3% |
| No Computing Device | 10 | 6.2% |
| Total | 162 | 100.0% |
Internet Access in Fuller Acres
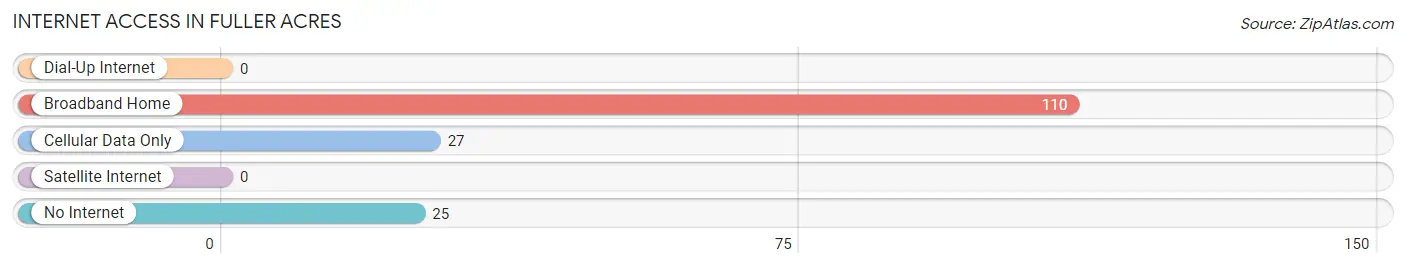
| Internet Type | # Households | % Households |
| Dial-Up Internet | 0 | 0.0% |
| Broadband Home | 110 | 67.9% |
| Cellular Data Only | 27 | 16.7% |
| Satellite Internet | 0 | 0.0% |
| No Internet | 25 | 15.4% |
| Total | 162 | 100.0% |
Fuller Acres Summary
Fuller Acres is a small city located in the San Joaquin Valley of California. It is situated in the foothills of the Sierra Nevada Mountains, about 30 miles east of Fresno. The city has a population of approximately 8,000 people and is part of the Fresno-Madera-Kings County Metropolitan Statistical Area.
History
Fuller Acres was founded in 1872 by William Fuller, a rancher from the Midwest. He purchased a large tract of land in the area and began to develop it into a farming community. The town was named after him and was incorporated in 1887.
In the early 1900s, the town began to grow rapidly as the railroad was extended to the area. This allowed for the transportation of goods and people to and from the city. The population of Fuller Acres grew to over 1,000 by the 1920s.
During the Great Depression, the city experienced a decline in population as many people moved away in search of work. However, the city was able to survive and eventually began to grow again in the 1950s.
Geography
Fuller Acres is located in the San Joaquin Valley of California. It is situated in the foothills of the Sierra Nevada Mountains, about 30 miles east of Fresno. The city has a total area of 4.2 square miles, all of which is land.
The city is located at an elevation of approximately 1,000 feet above sea level. The climate is generally mild, with hot summers and cool winters. The average annual temperature is around 70 degrees Fahrenheit.
Economy
The economy of Fuller Acres is largely based on agriculture. The city is home to a number of farms and ranches, which produce a variety of crops, including grapes, almonds, and olives. The city also has a number of manufacturing and service-based businesses.
The city is home to a number of retail stores, restaurants, and other businesses. The city also has a number of parks and recreational facilities, including a golf course.
Demographics
As of the 2010 census, the population of Fuller Acres was 8,000. The racial makeup of the city was 75.3% White, 0.7% African American, 0.3% Native American, 0.7% Asian, 0.1% Pacific Islander, and 22.1% from other races. Hispanic or Latino of any race were 33.3% of the population.
The median household income in Fuller Acres was $41,944, and the median family income was $48,944. The per capita income for the city was $19,944. About 17.3% of families and 21.3% of the population were below the poverty line.
Common Questions
What is Per Capita Income in Fuller Acres?
Per Capita income in Fuller Acres is $13,415.
What is the Median Family Income in Fuller Acres?
Median Family Income in Fuller Acres is $42,596.
What is the Median Household income in Fuller Acres?
Median Household Income in Fuller Acres is $39,125.
What is Income or Wage Gap in Fuller Acres?
Income or Wage Gap in Fuller Acres is 65.9%.
Women in Fuller Acres earn 34.1 cents for every dollar earned by a man.
What is Inequality or Gini Index in Fuller Acres?
Inequality or Gini Index in Fuller Acres is 0.43.
What is the Total Population of Fuller Acres?
Total Population of Fuller Acres is 717.
What is the Total Male Population of Fuller Acres?
Total Male Population of Fuller Acres is 369.
What is the Total Female Population of Fuller Acres?
Total Female Population of Fuller Acres is 348.
What is the Ratio of Males per 100 Females in Fuller Acres?
There are 106.03 Males per 100 Females in Fuller Acres.
What is the Ratio of Females per 100 Males in Fuller Acres?
There are 94.31 Females per 100 Males in Fuller Acres.
What is the Median Population Age in Fuller Acres?
Median Population Age in Fuller Acres is 30.1 Years.
What is the Average Family Size in Fuller Acres
Average Family Size in Fuller Acres is 4.5 People.
What is the Average Household Size in Fuller Acres
Average Household Size in Fuller Acres is 4.4 People.
How Large is the Labor Force in Fuller Acres?
There are 256 People in the Labor Forcein in Fuller Acres.
What is the Percentage of People in the Labor Force in Fuller Acres?
44.4% of People are in the Labor Force in Fuller Acres.
What is the Unemployment Rate in Fuller Acres?
Unemployment Rate in Fuller Acres is 10.9%.