Friant, CA Map & Demographics
Friant Map
Friant Overview
$36,493
PER CAPITA INCOME
$49,534
AVG HOUSEHOLD INCOME
13.8%
WAGE / INCOME GAP [ % ]
86.2¢/ $1
WAGE / INCOME GAP [ $ ]
0.35
INEQUALITY / GINI INDEX
317
TOTAL POPULATION
83
MALE POPULATION
234
FEMALE POPULATION
35.47
MALES / 100 FEMALES
281.93
FEMALES / 100 MALES
50.3
MEDIAN AGE
2.8
AVG FAMILY SIZE
1.8
AVG HOUSEHOLD SIZE
182
LABOR FORCE [ PEOPLE ]
65.5%
PERCENT IN LABOR FORCE
Friant Zip Codes
Friant Area Codes
Income in Friant
Income Overview in Friant
| Characteristic | Number | Measure |
| Per Capita Income | 317 | $36,493 |
| Median Family Income | 66 | $0 |
| Mean Family Income | 66 | $90,926 |
| Median Household Income | 181 | $49,534 |
| Mean Household Income | 181 | $63,581 |
| Income Deficit | 66 | $0 |
| Wage / Income Gap (%) | 317 | 13.78% |
| Wage / Income Gap ($) | 317 | 86.22¢ per $1 |
| Gini / Inequality Index | 317 | 0.35 |
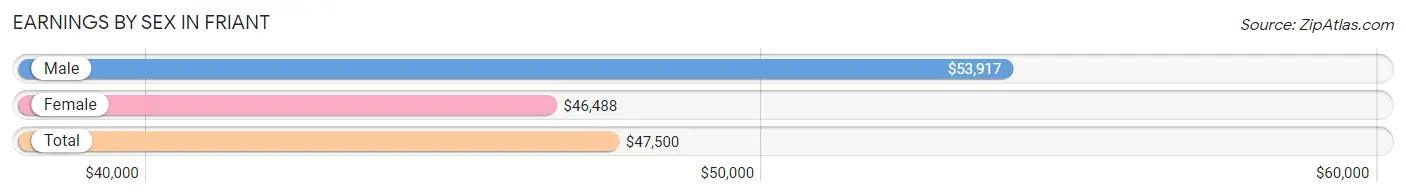
Earnings by Sex in Friant
Average Earnings in Friant are $47,500, $53,917 for men and $46,488 for women, a difference of 13.8%.
| Sex | Number | Average Earnings |
| Male | 59 (29.2%) | $53,917 |
| Female | 143 (70.8%) | $46,488 |
| Total | 202 (100.0%) | $47,500 |
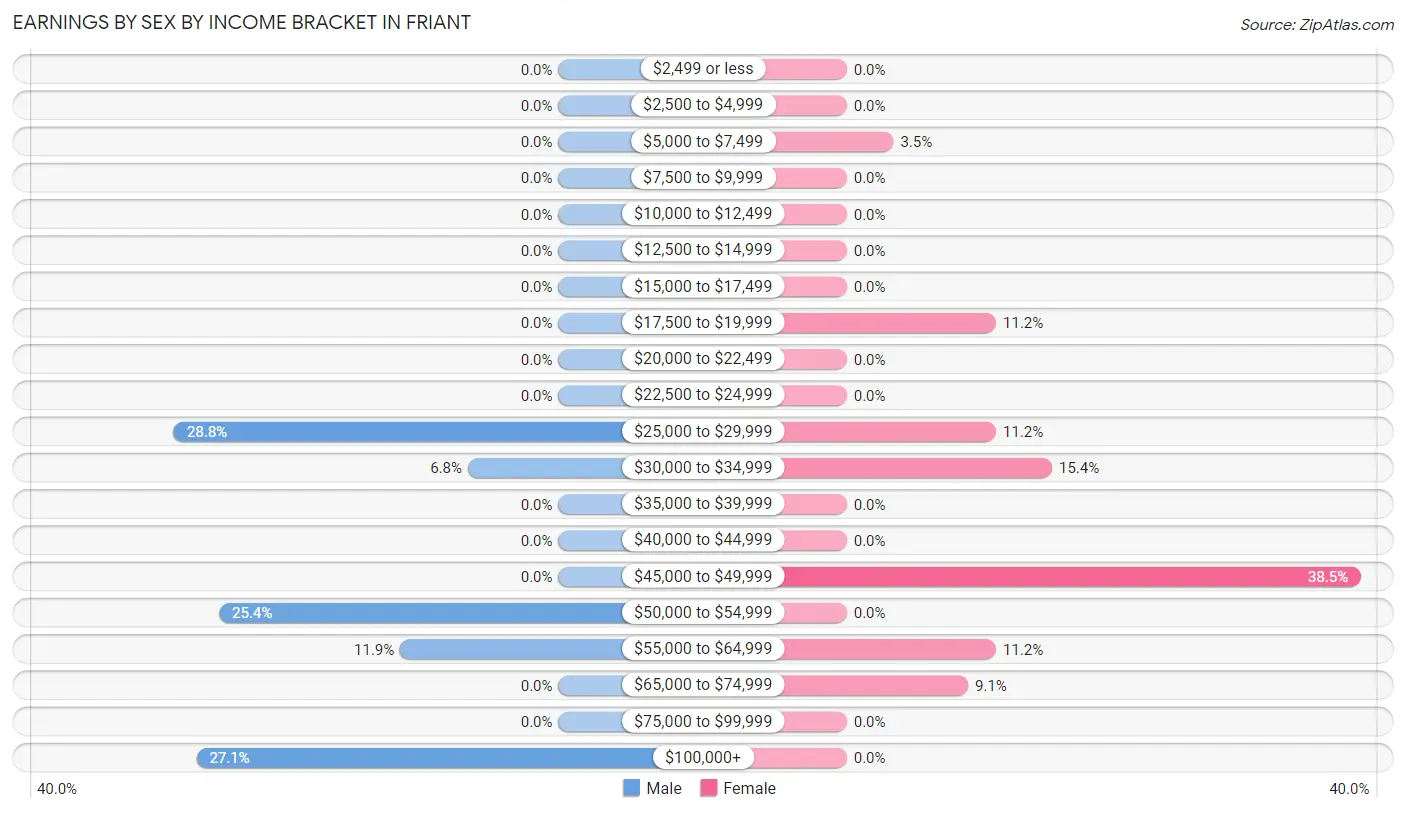
Earnings by Sex by Income Bracket in Friant
The most common earnings brackets in Friant are $25,000 to $29,999 for men (17 | 28.8%) and $45,000 to $49,999 for women (55 | 38.5%).
| Income | Male | Female |
| $2,499 or less | 0 (0.0%) | 0 (0.0%) |
| $2,500 to $4,999 | 0 (0.0%) | 0 (0.0%) |
| $5,000 to $7,499 | 0 (0.0%) | 5 (3.5%) |
| $7,500 to $9,999 | 0 (0.0%) | 0 (0.0%) |
| $10,000 to $12,499 | 0 (0.0%) | 0 (0.0%) |
| $12,500 to $14,999 | 0 (0.0%) | 0 (0.0%) |
| $15,000 to $17,499 | 0 (0.0%) | 0 (0.0%) |
| $17,500 to $19,999 | 0 (0.0%) | 16 (11.2%) |
| $20,000 to $22,499 | 0 (0.0%) | 0 (0.0%) |
| $22,500 to $24,999 | 0 (0.0%) | 0 (0.0%) |
| $25,000 to $29,999 | 17 (28.8%) | 16 (11.2%) |
| $30,000 to $34,999 | 4 (6.8%) | 22 (15.4%) |
| $35,000 to $39,999 | 0 (0.0%) | 0 (0.0%) |
| $40,000 to $44,999 | 0 (0.0%) | 0 (0.0%) |
| $45,000 to $49,999 | 0 (0.0%) | 55 (38.5%) |
| $50,000 to $54,999 | 15 (25.4%) | 0 (0.0%) |
| $55,000 to $64,999 | 7 (11.9%) | 16 (11.2%) |
| $65,000 to $74,999 | 0 (0.0%) | 13 (9.1%) |
| $75,000 to $99,999 | 0 (0.0%) | 0 (0.0%) |
| $100,000+ | 16 (27.1%) | 0 (0.0%) |
| Total | 59 (100.0%) | 143 (100.0%) |
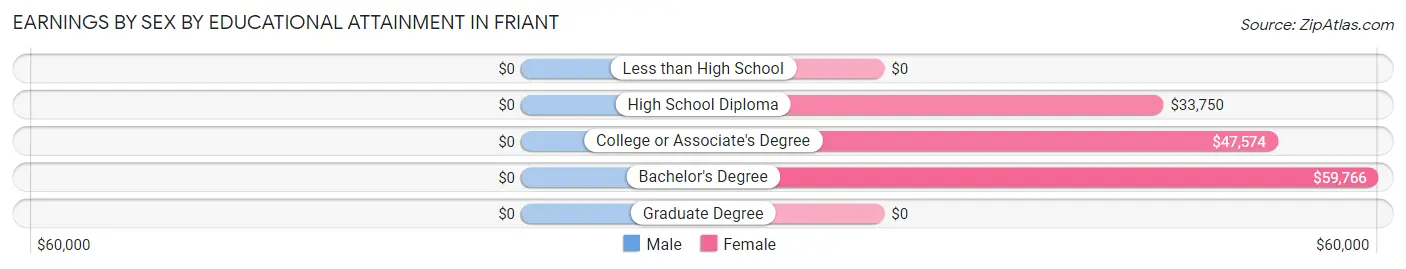
Earnings by Sex by Educational Attainment in Friant
| Educational Attainment | Male Income | Female Income |
| Less than High School | - | - |
| High School Diploma | - | - |
| College or Associate's Degree | - | - |
| Bachelor's Degree | - | - |
| Graduate Degree | - | - |
| Total | $53,917 | $47,440 |
Family Income in Friant
Family Income Brackets in Friant
According to the Friant family income data, there are 27 families falling into the $100,000 to $149,999 income range, which is the most common income bracket and makes up 40.9% of all families.
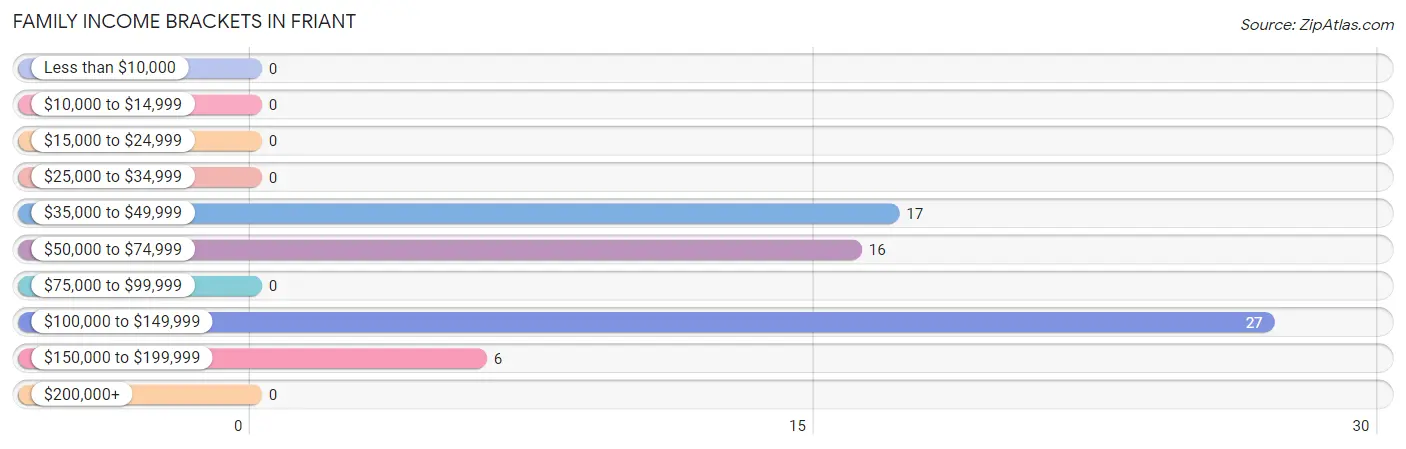
| Income Bracket | # Families | % Families |
| Less than $10,000 | 0 | 0.0% |
| $10,000 to $14,999 | 0 | 0.0% |
| $15,000 to $24,999 | 0 | 0.0% |
| $25,000 to $34,999 | 0 | 0.0% |
| $35,000 to $49,999 | 17 | 25.8% |
| $50,000 to $74,999 | 16 | 24.2% |
| $75,000 to $99,999 | 0 | 0.0% |
| $100,000 to $149,999 | 27 | 40.9% |
| $150,000 to $199,999 | 6 | 9.1% |
| $200,000+ | 0 | 0.0% |
Family Income by Famaliy Size in Friant
3-person families (42 | 63.6%) account for the highest median family income in Friant with $105,833 per family, while 3-person families (42 | 63.6%) have the highest median income of $35,278 per family member.
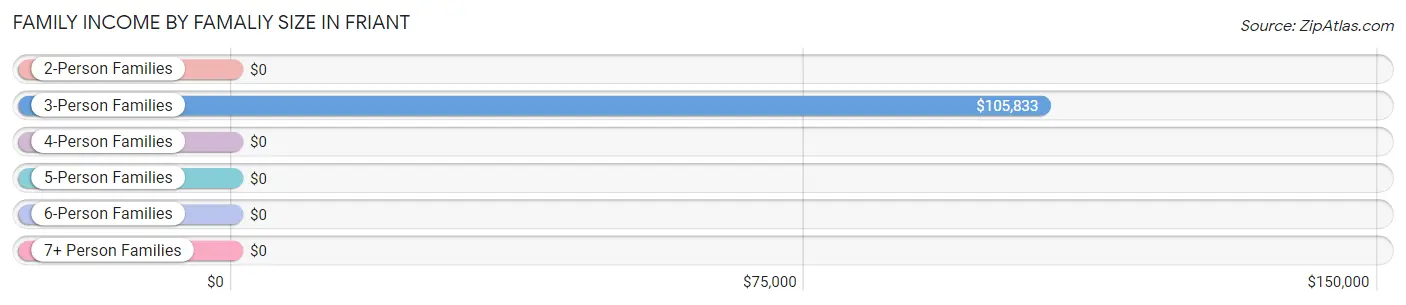
| Income Bracket | # Families | Median Income |
| 2-Person Families | 24 (36.4%) | $0 |
| 3-Person Families | 42 (63.6%) | $105,833 |
| 4-Person Families | 0 (0.0%) | $0 |
| 5-Person Families | 0 (0.0%) | $0 |
| 6-Person Families | 0 (0.0%) | $0 |
| 7+ Person Families | 0 (0.0%) | $0 |
| Total | 66 (100.0%) | $0 |
Family Income by Number of Earners in Friant
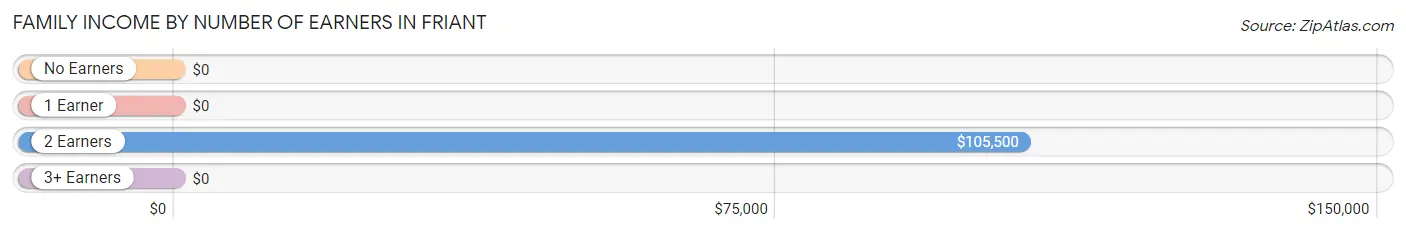
| Number of Earners | # Families | Median Income |
| No Earners | 0 (0.0%) | $0 |
| 1 Earner | 22 (33.3%) | $0 |
| 2 Earners | 38 (57.6%) | $105,500 |
| 3+ Earners | 6 (9.1%) | $0 |
| Total | 66 (100.0%) | $0 |
Household Income in Friant
Household Income Brackets in Friant
With 67 households falling in the category, the $35,000 to $49,999 income range is the most frequent in Friant, accounting for 37.0% of all households.
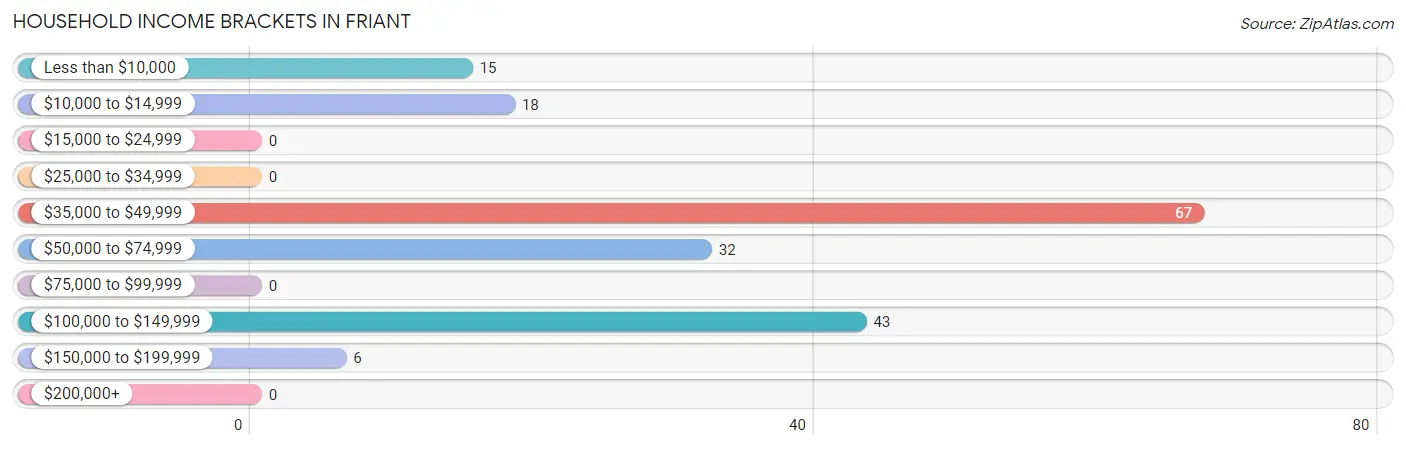
| Income Bracket | # Households | % Households |
| Less than $10,000 | 15 | 8.3% |
| $10,000 to $14,999 | 18 | 9.9% |
| $15,000 to $24,999 | 0 | 0.0% |
| $25,000 to $34,999 | 0 | 0.0% |
| $35,000 to $49,999 | 67 | 37.0% |
| $50,000 to $74,999 | 32 | 17.7% |
| $75,000 to $99,999 | 0 | 0.0% |
| $100,000 to $149,999 | 43 | 23.8% |
| $150,000 to $199,999 | 6 | 3.3% |
| $200,000+ | 0 | 0.0% |
Household Income by Householder Age in Friant
The median household income in Friant is $49,534, with the highest median household income of $49,890 found in the 45 to 64 years age bracket for the primary householder. A total of 97 households (53.6%) fall into this category.
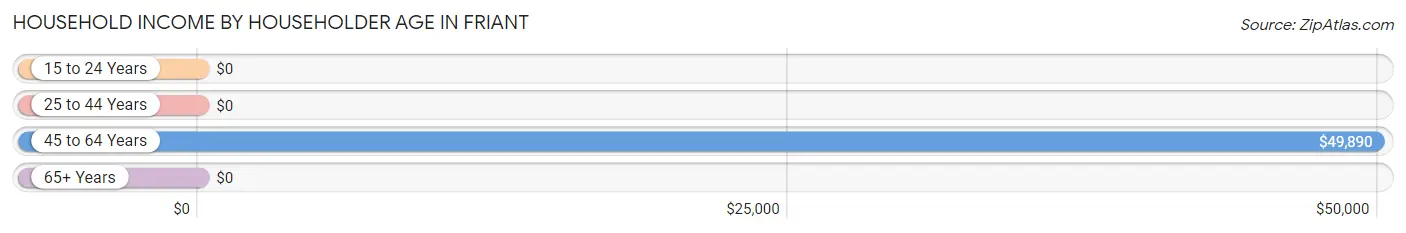
| Income Bracket | # Households | Median Income |
| 15 to 24 Years | 0 (0.0%) | $0 |
| 25 to 44 Years | 29 (16.0%) | $0 |
| 45 to 64 Years | 97 (53.6%) | $49,890 |
| 65+ Years | 55 (30.4%) | $0 |
| Total | 181 (100.0%) | $49,534 |
Poverty in Friant
Income Below Poverty by Sex and Age in Friant
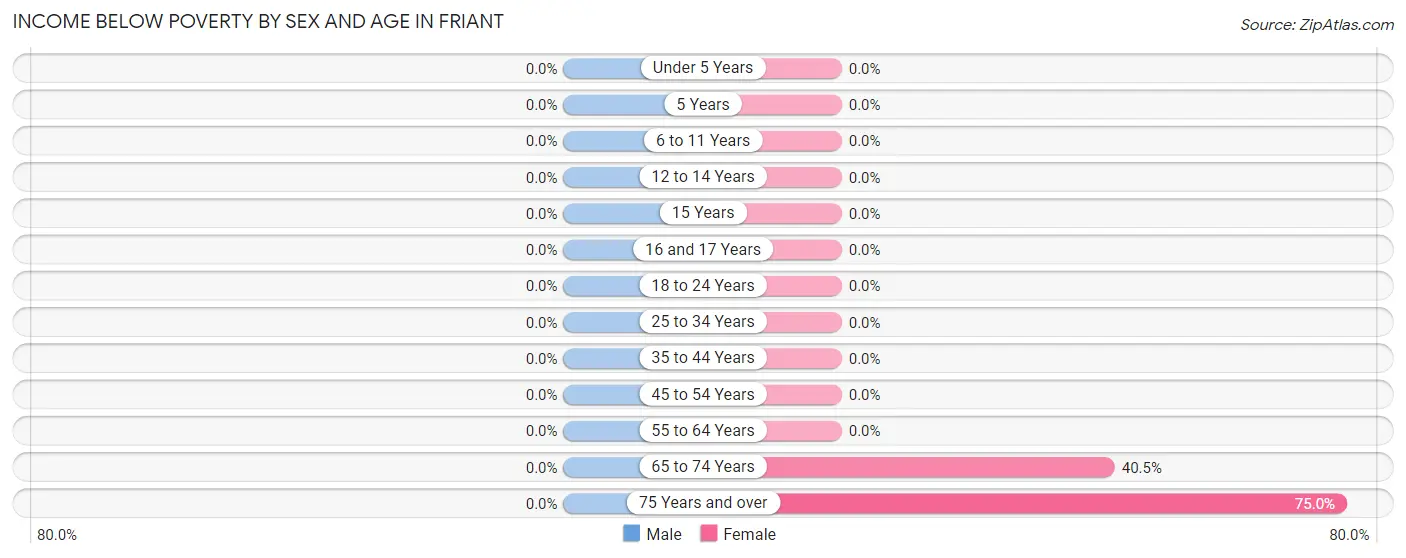
| Age Bracket | Male | Female |
| Under 5 Years | 0 (0.0%) | 0 (0.0%) |
| 5 Years | 0 (0.0%) | 0 (0.0%) |
| 6 to 11 Years | 0 (0.0%) | 0 (0.0%) |
| 12 to 14 Years | 0 (0.0%) | 0 (0.0%) |
| 15 Years | 0 (0.0%) | 0 (0.0%) |
| 16 and 17 Years | 0 (0.0%) | 0 (0.0%) |
| 18 to 24 Years | 0 (0.0%) | 0 (0.0%) |
| 25 to 34 Years | 0 (0.0%) | 0 (0.0%) |
| 35 to 44 Years | 0 (0.0%) | 0 (0.0%) |
| 45 to 54 Years | 0 (0.0%) | 0 (0.0%) |
| 55 to 64 Years | 0 (0.0%) | 0 (0.0%) |
| 65 to 74 Years | 0 (0.0%) | 15 (40.5%) |
| 75 Years and over | 0 (0.0%) | 18 (75.0%) |
| Total | 0 (0.0%) | 33 (15.4%) |
Income Above Poverty by Sex and Age in Friant
According to the poverty statistics in Friant, males aged under 5 years and females aged 18 to 24 years are the age groups that are most secure financially, with 100.0% of males and 100.0% of females in these age groups living above the poverty line.
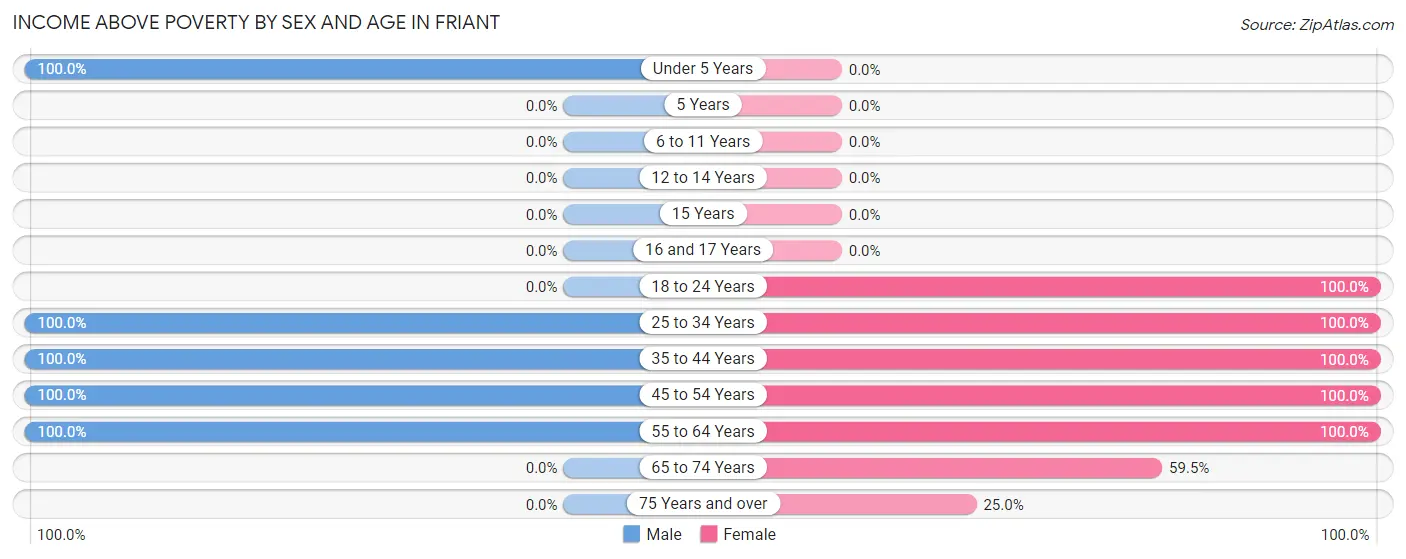
| Age Bracket | Male | Female |
| Under 5 Years | 19 (100.0%) | 0 (0.0%) |
| 5 Years | 0 (0.0%) | 0 (0.0%) |
| 6 to 11 Years | 0 (0.0%) | 0 (0.0%) |
| 12 to 14 Years | 0 (0.0%) | 0 (0.0%) |
| 15 Years | 0 (0.0%) | 0 (0.0%) |
| 16 and 17 Years | 0 (0.0%) | 0 (0.0%) |
| 18 to 24 Years | 0 (0.0%) | 16 (100.0%) |
| 25 to 34 Years | 21 (100.0%) | 16 (100.0%) |
| 35 to 44 Years | 7 (100.0%) | 13 (100.0%) |
| 45 to 54 Years | 15 (100.0%) | 103 (100.0%) |
| 55 to 64 Years | 21 (100.0%) | 5 (100.0%) |
| 65 to 74 Years | 0 (0.0%) | 22 (59.5%) |
| 75 Years and over | 0 (0.0%) | 6 (25.0%) |
| Total | 83 (100.0%) | 181 (84.6%) |
Income Below Poverty Among Married-Couple Families in Friant
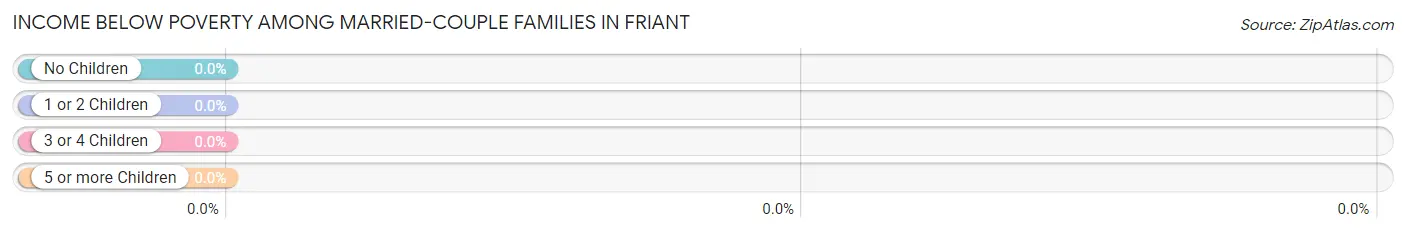
| Children | Above Poverty | Below Poverty |
| No Children | 27 (100.0%) | 0 (0.0%) |
| 1 or 2 Children | 16 (100.0%) | 0 (0.0%) |
| 3 or 4 Children | 0 (0.0%) | 0 (0.0%) |
| 5 or more Children | 0 (0.0%) | 0 (0.0%) |
| Total | 43 (100.0%) | 0 (0.0%) |
Income Below Poverty Among Single-Parent Households in Friant
| Children | Single Father | Single Mother |
| No Children | 0 (0.0%) | 0 (0.0%) |
| 1 or 2 Children | 0 (0.0%) | 0 (0.0%) |
| 3 or 4 Children | 0 (0.0%) | 0 (0.0%) |
| 5 or more Children | 0 (0.0%) | 0 (0.0%) |
| Total | 0 (0.0%) | 0 (0.0%) |
Income Below Poverty Among Married-Couple vs Single-Parent Households in Friant
| Children | Married-Couple Families | Single-Parent Households |
| No Children | 0 (0.0%) | 0 (0.0%) |
| 1 or 2 Children | 0 (0.0%) | 0 (0.0%) |
| 3 or 4 Children | 0 (0.0%) | 0 (0.0%) |
| 5 or more Children | 0 (0.0%) | 0 (0.0%) |
| Total | 0 (0.0%) | 0 (0.0%) |
Race in Friant
The most populous races in Friant are White / Caucasian (258 | 81.4%), Hispanic or Latino (33 | 10.4%), and Black / African American (20 | 6.3%).
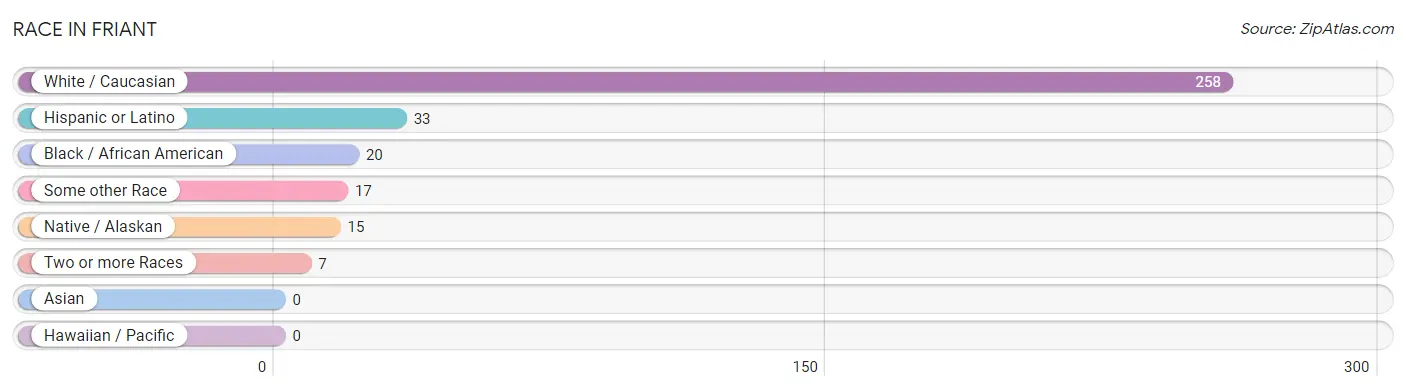
| Race | # Population | % Population |
| Asian | 0 | 0.0% |
| Black / African American | 20 | 6.3% |
| Hawaiian / Pacific | 0 | 0.0% |
| Hispanic or Latino | 33 | 10.4% |
| Native / Alaskan | 15 | 4.7% |
| White / Caucasian | 258 | 81.4% |
| Two or more Races | 7 | 2.2% |
| Some other Race | 17 | 5.4% |
| Total | 317 | 100.0% |
Ancestry in Friant
The most populous ancestries reported in Friant are German (65 | 20.5%), English (46 | 14.5%), Mexican (33 | 10.4%), French (31 | 9.8%), and British (22 | 6.9%), together accounting for 62.1% of all Friant residents.
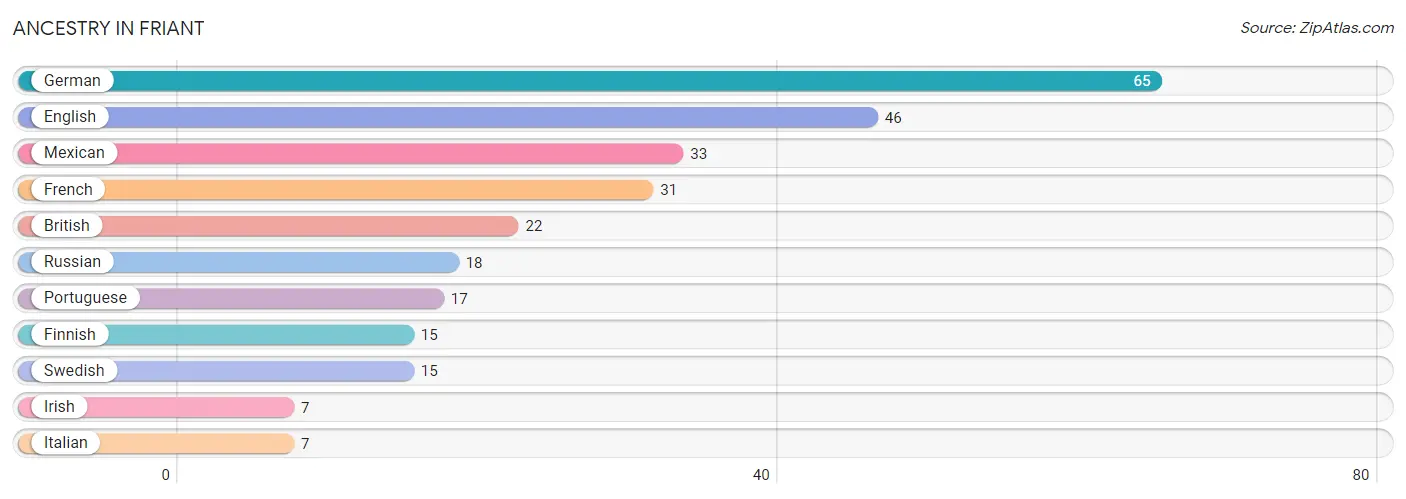
| Ancestry | # Population | % Population |
| British | 22 | 6.9% |
| English | 46 | 14.5% |
| Finnish | 15 | 4.7% |
| French | 31 | 9.8% |
| German | 65 | 20.5% |
| Irish | 7 | 2.2% |
| Italian | 7 | 2.2% |
| Mexican | 33 | 10.4% |
| Portuguese | 17 | 5.4% |
| Russian | 18 | 5.7% |
| Swedish | 15 | 4.7% | View All 11 Rows |
Immigrants in Friant

| Immigration Origin | # Population | % Population | View All 0 Rows |
Sex and Age in Friant
Sex and Age in Friant
The most populous age groups in Friant are 60 to 64 Years (21 | 25.3%) for men and 50 to 54 Years (65 | 27.8%) for women.
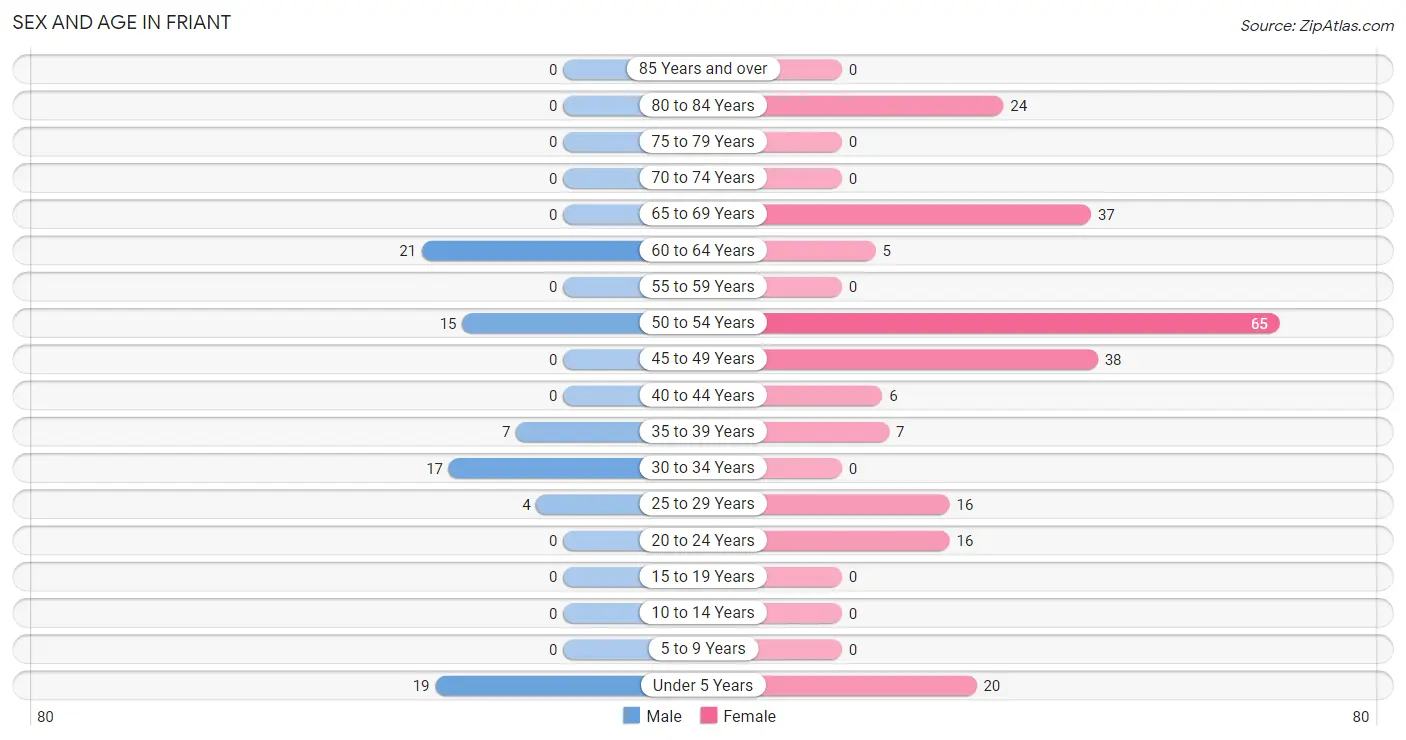
| Age Bracket | Male | Female |
| Under 5 Years | 19 (22.9%) | 20 (8.6%) |
| 5 to 9 Years | 0 (0.0%) | 0 (0.0%) |
| 10 to 14 Years | 0 (0.0%) | 0 (0.0%) |
| 15 to 19 Years | 0 (0.0%) | 0 (0.0%) |
| 20 to 24 Years | 0 (0.0%) | 16 (6.8%) |
| 25 to 29 Years | 4 (4.8%) | 16 (6.8%) |
| 30 to 34 Years | 17 (20.5%) | 0 (0.0%) |
| 35 to 39 Years | 7 (8.4%) | 7 (3.0%) |
| 40 to 44 Years | 0 (0.0%) | 6 (2.6%) |
| 45 to 49 Years | 0 (0.0%) | 38 (16.2%) |
| 50 to 54 Years | 15 (18.1%) | 65 (27.8%) |
| 55 to 59 Years | 0 (0.0%) | 0 (0.0%) |
| 60 to 64 Years | 21 (25.3%) | 5 (2.1%) |
| 65 to 69 Years | 0 (0.0%) | 37 (15.8%) |
| 70 to 74 Years | 0 (0.0%) | 0 (0.0%) |
| 75 to 79 Years | 0 (0.0%) | 0 (0.0%) |
| 80 to 84 Years | 0 (0.0%) | 24 (10.3%) |
| 85 Years and over | 0 (0.0%) | 0 (0.0%) |
| Total | 83 (100.0%) | 234 (100.0%) |
Families and Households in Friant
Median Family Size in Friant
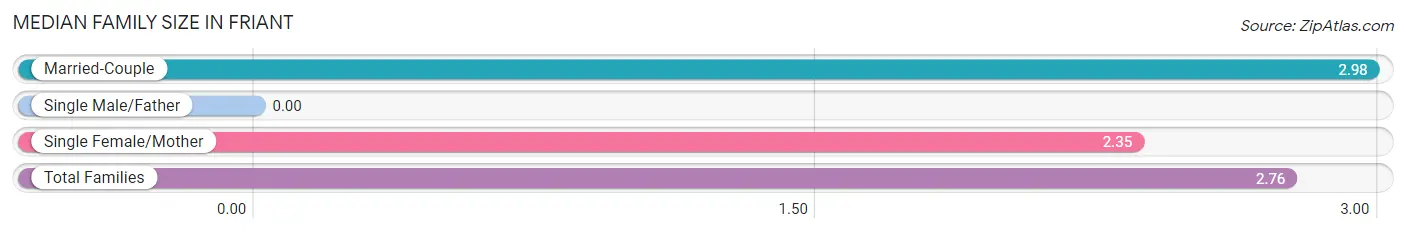
| Family Type | # Families | Family Size |
| Married-Couple | 43 (65.1%) | 2.98 |
| Single Male/Father | 0 (0.0%) | - |
| Single Female/Mother | 23 (34.8%) | 2.35 |
| Total Families | 66 (100.0%) | 2.76 |
Median Household Size in Friant
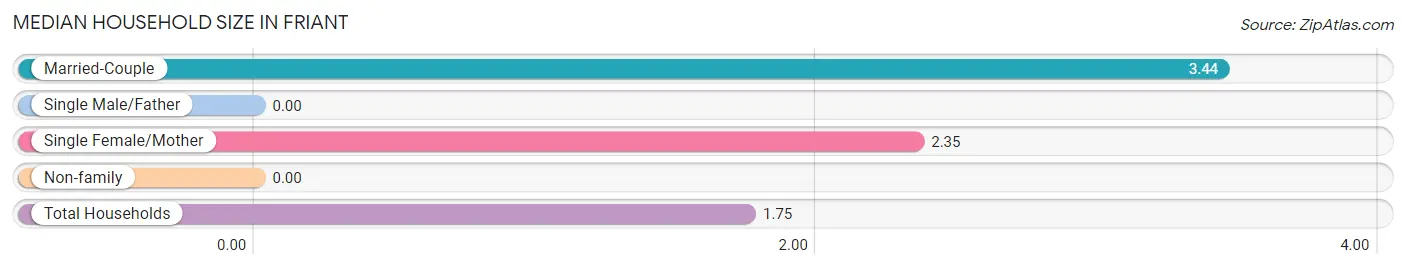
| Household Type | # Households | Household Size |
| Married-Couple | 43 (23.8%) | 3.44 |
| Single Male/Father | 0 (0.0%) | - |
| Single Female/Mother | 23 (12.7%) | 2.35 |
| Non-family | 115 (63.5%) | - |
| Total Households | 181 (100.0%) | 1.75 |
Household Size by Marriage Status in Friant
Out of a total of 181 households in Friant, 66 (36.5%) are family households, while 115 (63.5%) are nonfamily households. The most numerous type of family households are 3-person households, comprising 26, and the most common type of nonfamily households are 1-person households, comprising 115.
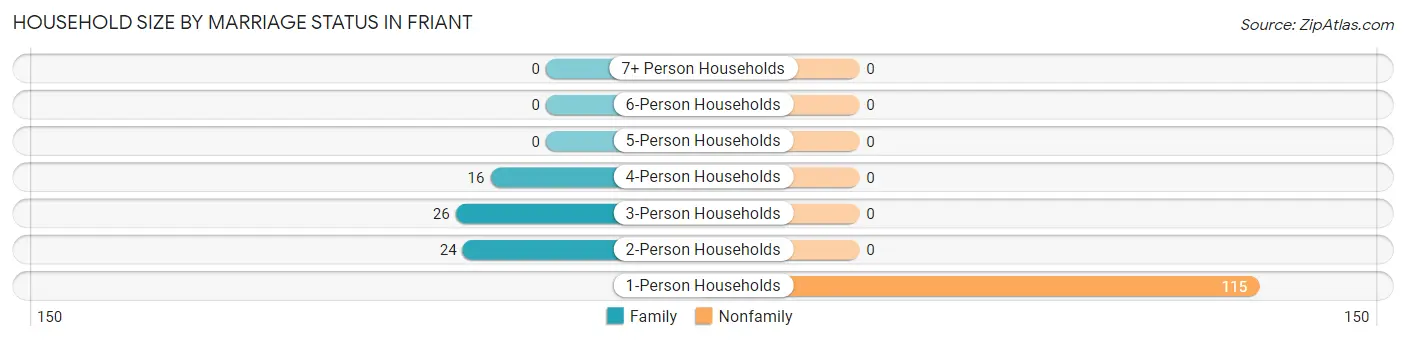
| Household Size | Family Households | Nonfamily Households |
| 1-Person Households | - | 115 (63.5%) |
| 2-Person Households | 24 (13.3%) | 0 (0.0%) |
| 3-Person Households | 26 (14.4%) | 0 (0.0%) |
| 4-Person Households | 16 (8.8%) | 0 (0.0%) |
| 5-Person Households | 0 (0.0%) | 0 (0.0%) |
| 6-Person Households | 0 (0.0%) | 0 (0.0%) |
| 7+ Person Households | 0 (0.0%) | 0 (0.0%) |
| Total | 66 (36.5%) | 115 (63.5%) |
Female Fertility in Friant
Fertility by Age in Friant
| Age Bracket | Women with Births | Births / 1,000 Women |
| 15 to 19 years | 0 (0.0%) | 0.0 |
| 20 to 34 years | 0 (0.0%) | 0.0 |
| 35 to 50 years | 0 (0.0%) | 0.0 |
| Total | 0 (0.0%) | 0.0 |
Fertility by Age by Marriage Status in Friant
| Age Bracket | Married | Unmarried |
| 15 to 19 years | 0 (0.0%) | 0 (0.0%) |
| 20 to 34 years | 0 (0.0%) | 0 (0.0%) |
| 35 to 50 years | 0 (0.0%) | 0 (0.0%) |
| Total | 0 (0.0%) | 0 (0.0%) |
Fertility by Education in Friant
| Educational Attainment | Women with Births | Births / 1,000 Women |
| Less than High School | 0 (0.0%) | 0.0 |
| High School Diploma | 0 (0.0%) | 0.0 |
| College or Associate's Degree | 0 (0.0%) | 0.0 |
| Bachelor's Degree | 0 (0.0%) | 0.0 |
| Graduate Degree | 0 (0.0%) | 0.0 |
| Total | 0 (0.0%) | 0.0 |
Fertility by Education by Marriage Status in Friant
| Educational Attainment | Married | Unmarried |
| Less than High School | 0 (0.0%) | 0 (0.0%) |
| High School Diploma | 0 (0.0%) | 0 (0.0%) |
| College or Associate's Degree | 0 (0.0%) | 0 (0.0%) |
| Bachelor's Degree | 0 (0.0%) | 0 (0.0%) |
| Graduate Degree | 0 (0.0%) | 0 (0.0%) |
| Total | 0 (0.0%) | 0 (0.0%) |
Employment Characteristics in Friant
Employment by Class of Employer in Friant
Among the 182 employed individuals in Friant, private company employees (91 | 50.0%), state government employees (34 | 18.7%), and self-employed (not incorporated) (25 | 13.7%) make up the most common classes of employment.
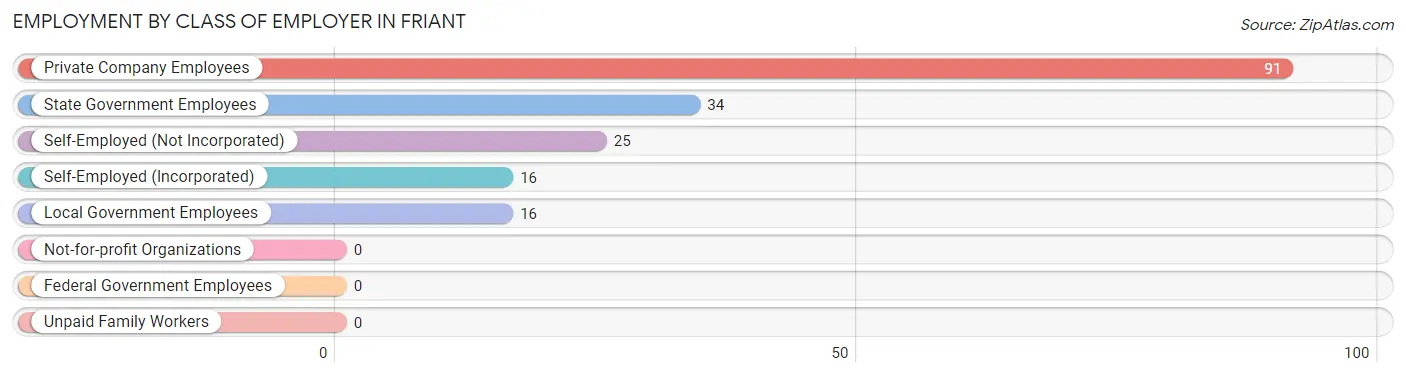
| Employer Class | # Employees | % Employees |
| Private Company Employees | 91 | 50.0% |
| Self-Employed (Incorporated) | 16 | 8.8% |
| Self-Employed (Not Incorporated) | 25 | 13.7% |
| Not-for-profit Organizations | 0 | 0.0% |
| Local Government Employees | 16 | 8.8% |
| State Government Employees | 34 | 18.7% |
| Federal Government Employees | 0 | 0.0% |
| Unpaid Family Workers | 0 | 0.0% |
| Total | 182 | 100.0% |
Employment Status by Age in Friant
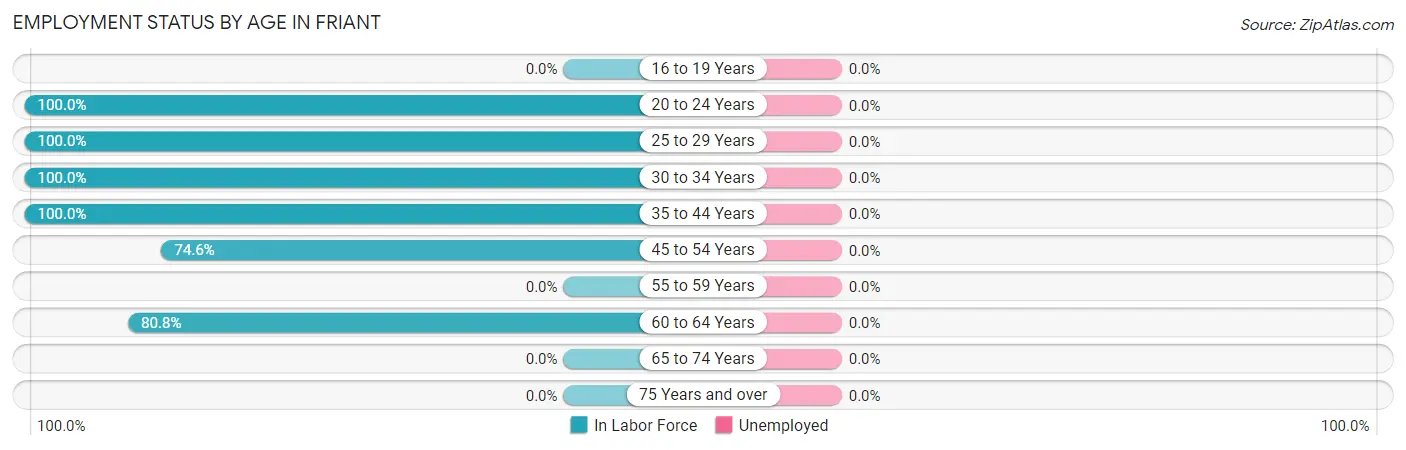
| Age Bracket | In Labor Force | Unemployed |
| 16 to 19 Years | 0 (0.0%) | 0 (0.0%) |
| 20 to 24 Years | 16 (100.0%) | 0 (0.0%) |
| 25 to 29 Years | 20 (100.0%) | 0 (0.0%) |
| 30 to 34 Years | 17 (100.0%) | 0 (0.0%) |
| 35 to 44 Years | 20 (100.0%) | 0 (0.0%) |
| 45 to 54 Years | 88 (74.6%) | 0 (0.0%) |
| 55 to 59 Years | 0 (0.0%) | 0 (0.0%) |
| 60 to 64 Years | 21 (80.8%) | 0 (0.0%) |
| 65 to 74 Years | 0 (0.0%) | 0 (0.0%) |
| 75 Years and over | 0 (0.0%) | 0 (0.0%) |
| Total | 182 (65.5%) | 0 (0.0%) |
Employment Status by Educational Attainment in Friant
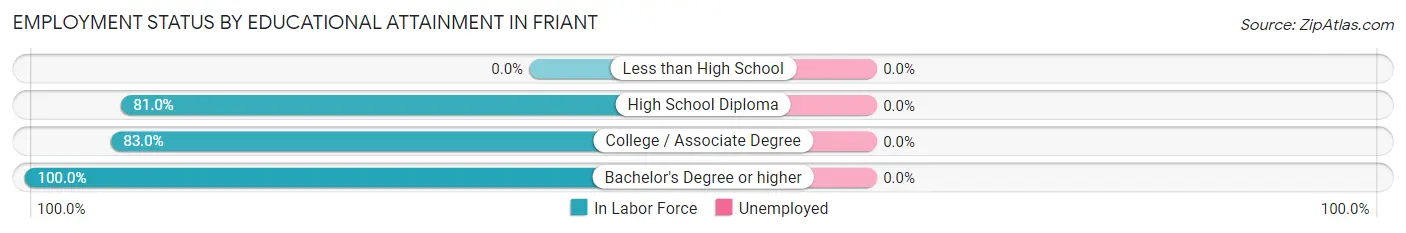
| Educational Attainment | In Labor Force | Unemployed |
| Less than High School | 0 (0.0%) | 0 (0.0%) |
| High School Diploma | 64 (81.0%) | 0 (0.0%) |
| College / Associate Degree | 73 (83.0%) | 0 (0.0%) |
| Bachelor's Degree or higher | 29 (100.0%) | 0 (0.0%) |
| Total | 166 (82.6%) | 0 (0.0%) |
Employment Occupations by Sex in Friant
Management, Business, Science and Arts Occupations
The most common Management, Business, Science and Arts occupations in Friant are Management (66 | 36.3%), Community & Social Service (29 | 15.9%), Education Instruction & Library (29 | 15.9%), Health Diagnosing & Treating (6 | 3.3%), and Health Technologists (6 | 3.3%).
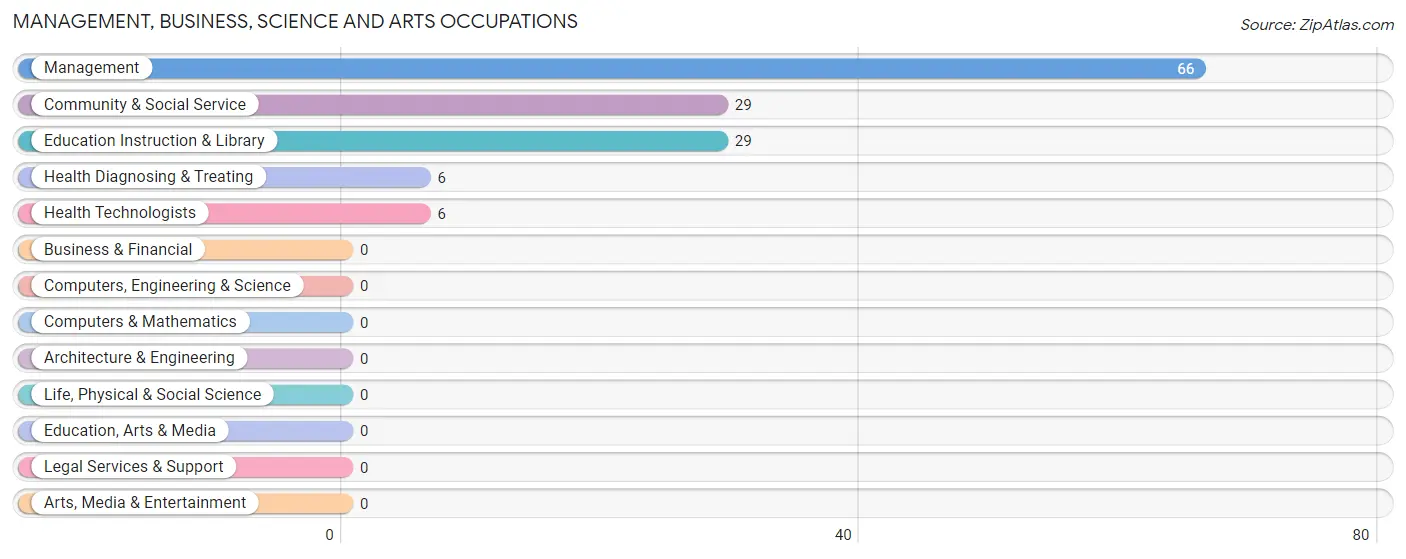
Management, Business, Science and Arts Occupations by Sex
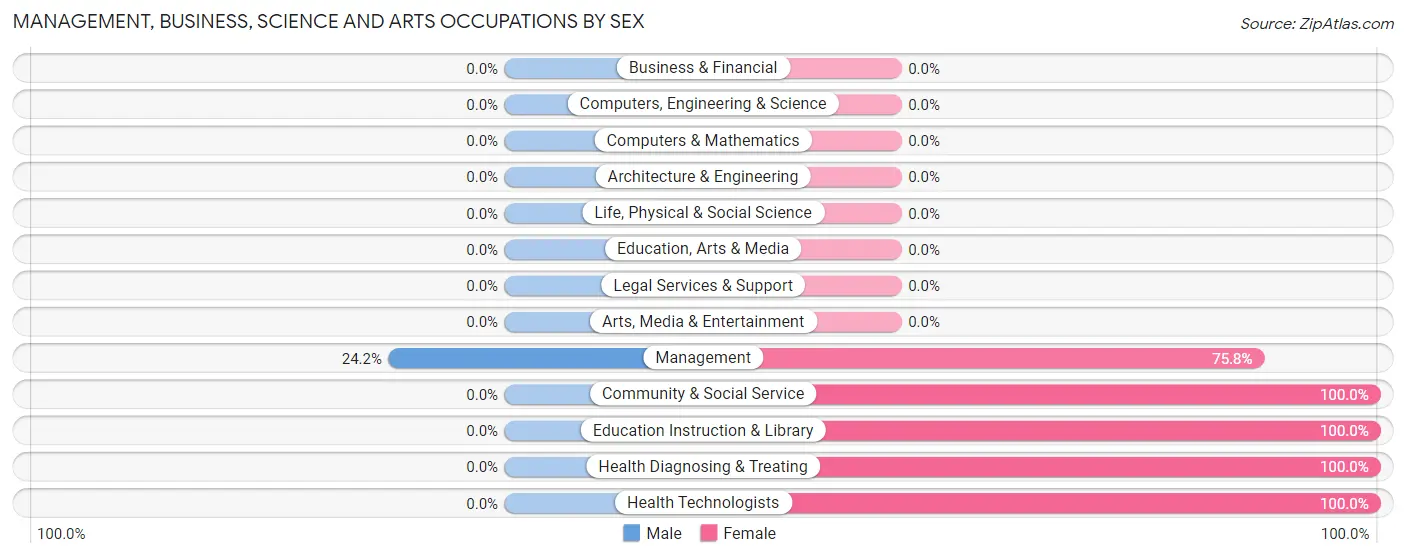
| Occupation | Male | Female |
| Management | 16 (24.2%) | 50 (75.8%) |
| Business & Financial | 0 (0.0%) | 0 (0.0%) |
| Computers, Engineering & Science | 0 (0.0%) | 0 (0.0%) |
| Computers & Mathematics | 0 (0.0%) | 0 (0.0%) |
| Architecture & Engineering | 0 (0.0%) | 0 (0.0%) |
| Life, Physical & Social Science | 0 (0.0%) | 0 (0.0%) |
| Community & Social Service | 0 (0.0%) | 29 (100.0%) |
| Education, Arts & Media | 0 (0.0%) | 0 (0.0%) |
| Legal Services & Support | 0 (0.0%) | 0 (0.0%) |
| Education Instruction & Library | 0 (0.0%) | 29 (100.0%) |
| Arts, Media & Entertainment | 0 (0.0%) | 0 (0.0%) |
| Health Diagnosing & Treating | 0 (0.0%) | 6 (100.0%) |
| Health Technologists | 0 (0.0%) | 6 (100.0%) |
| Total (Category) | 16 (15.8%) | 85 (84.2%) |
| Total (Overall) | 44 (24.2%) | 138 (75.8%) |
Services Occupations
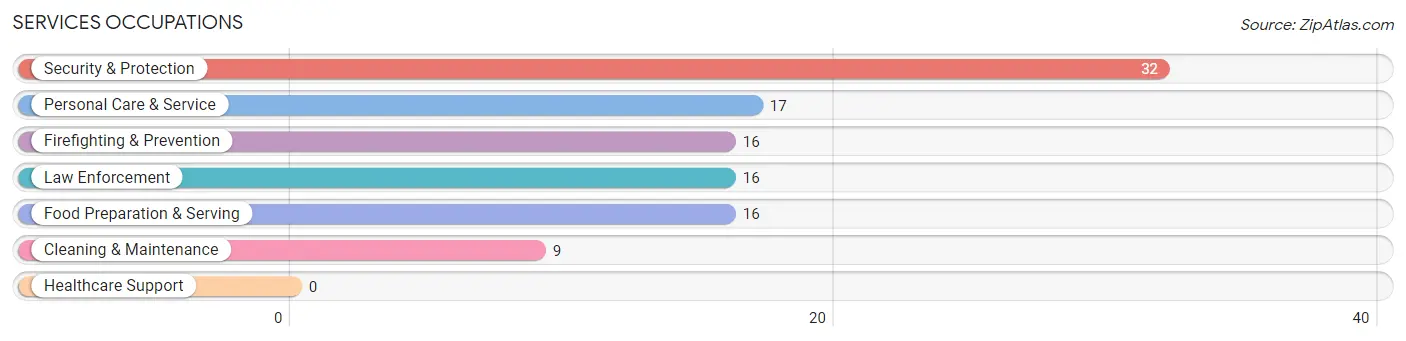
The most common Services occupations in Friant are Security & Protection (32 | 17.6%), Personal Care & Service (17 | 9.3%), Firefighting & Prevention (16 | 8.8%), Law Enforcement (16 | 8.8%), and Food Preparation & Serving (16 | 8.8%).
Services Occupations by Sex
Within the Services occupations in Friant, the most male-oriented occupations are Personal Care & Service (100.0%), and Cleaning & Maintenance (44.4%), while the most female-oriented occupations are Security & Protection (100.0%), Firefighting & Prevention (100.0%), and Law Enforcement (100.0%).
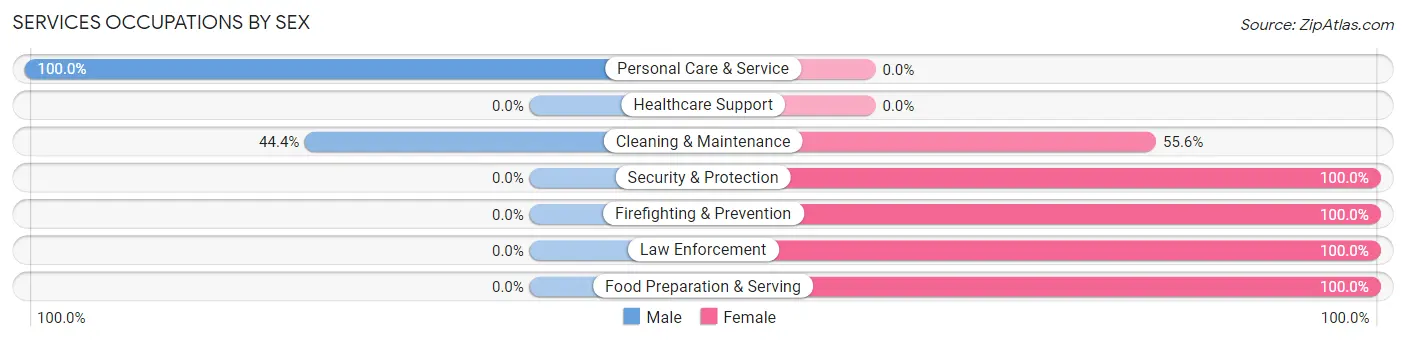
| Occupation | Male | Female |
| Healthcare Support | 0 (0.0%) | 0 (0.0%) |
| Security & Protection | 0 (0.0%) | 32 (100.0%) |
| Firefighting & Prevention | 0 (0.0%) | 16 (100.0%) |
| Law Enforcement | 0 (0.0%) | 16 (100.0%) |
| Food Preparation & Serving | 0 (0.0%) | 16 (100.0%) |
| Cleaning & Maintenance | 4 (44.4%) | 5 (55.6%) |
| Personal Care & Service | 17 (100.0%) | 0 (0.0%) |
| Total (Category) | 21 (28.4%) | 53 (71.6%) |
| Total (Overall) | 44 (24.2%) | 138 (75.8%) |
Sales and Office Occupations
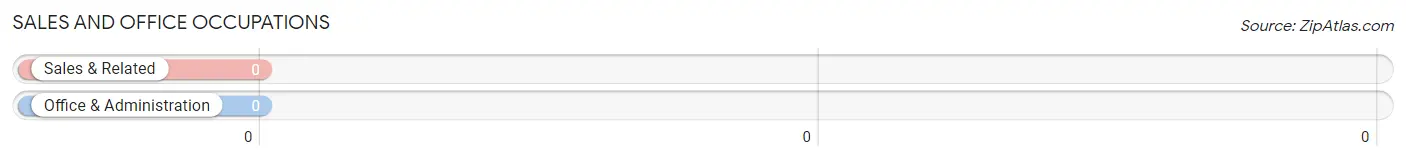
Sales and Office Occupations by Sex
| Occupation | Male | Female |
| Sales & Related | 0 (0.0%) | 0 (0.0%) |
| Office & Administration | 0 (0.0%) | 0 (0.0%) |
| Total (Category) | 0 (0.0%) | 0 (0.0%) |
| Total (Overall) | 44 (24.2%) | 138 (75.8%) |
Natural Resources, Construction and Maintenance Occupations
Natural Resources, Construction and Maintenance Occupations by Sex
| Occupation | Male | Female |
| Farming, Fishing & Forestry | 0 (0.0%) | 0 (0.0%) |
| Construction & Extraction | 0 (0.0%) | 0 (0.0%) |
| Installation, Maintenance & Repair | 0 (0.0%) | 0 (0.0%) |
| Total (Category) | 0 (0.0%) | 0 (0.0%) |
| Total (Overall) | 44 (24.2%) | 138 (75.8%) |
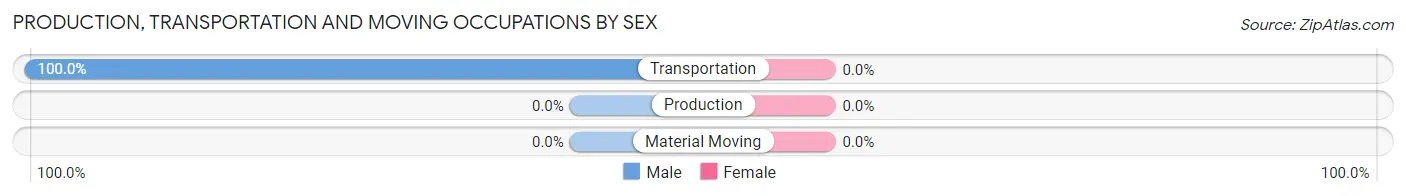
Production, Transportation and Moving Occupations
The most common Production, Transportation and Moving occupations in Friant are , and Transportation (7 | 3.8%).
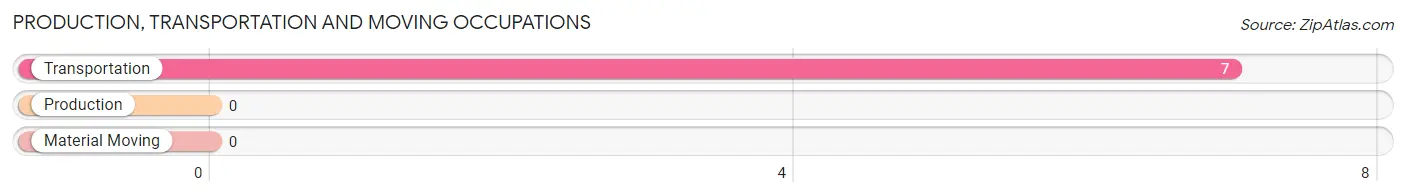
Production, Transportation and Moving Occupations by Sex
| Occupation | Male | Female |
| Production | 0 (0.0%) | 0 (0.0%) |
| Transportation | 7 (100.0%) | 0 (0.0%) |
| Material Moving | 0 (0.0%) | 0 (0.0%) |
| Total (Category) | 7 (100.0%) | 0 (0.0%) |
| Total (Overall) | 44 (24.2%) | 138 (75.8%) |
Employment Industries by Sex in Friant
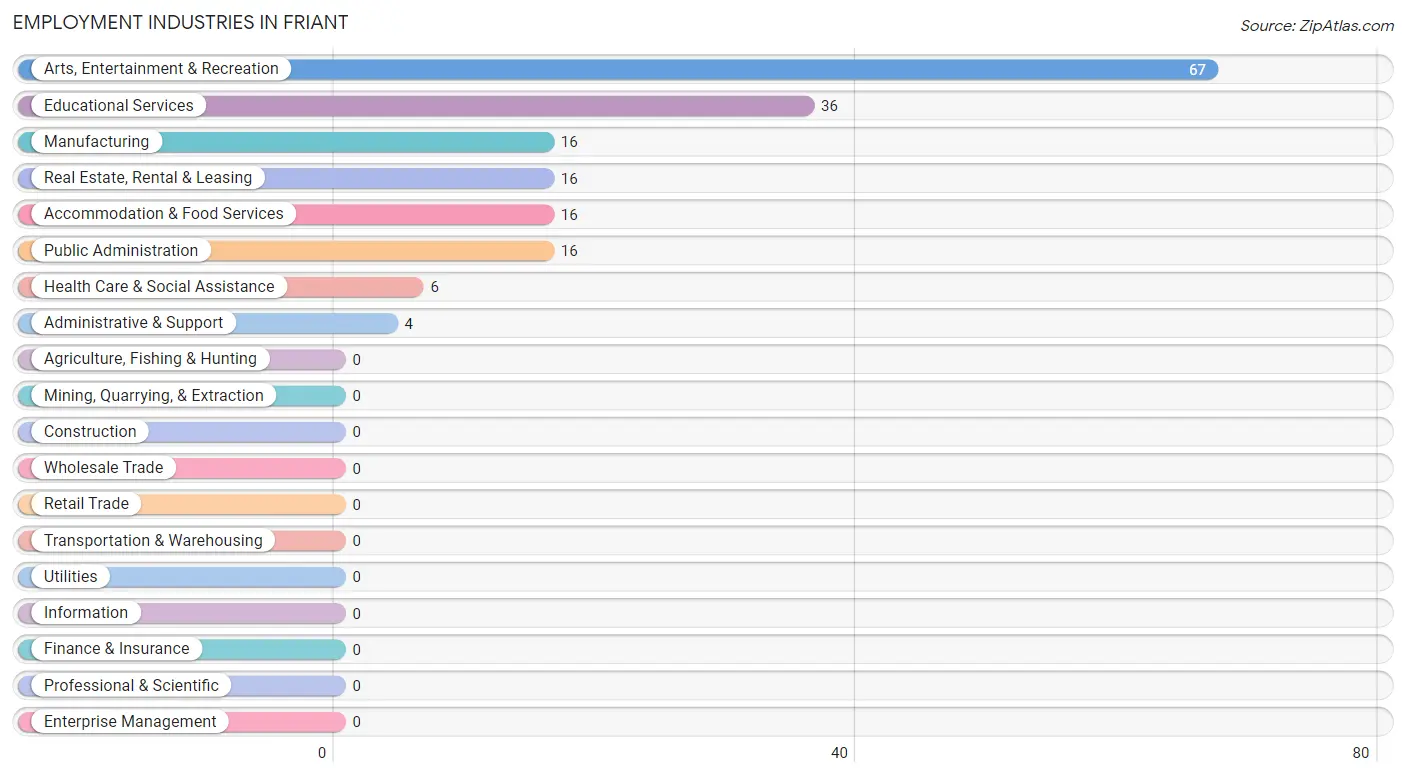
Employment Industries in Friant
The major employment industries in Friant include Arts, Entertainment & Recreation (67 | 36.8%), Educational Services (36 | 19.8%), Manufacturing (16 | 8.8%), Real Estate, Rental & Leasing (16 | 8.8%), and Accommodation & Food Services (16 | 8.8%).
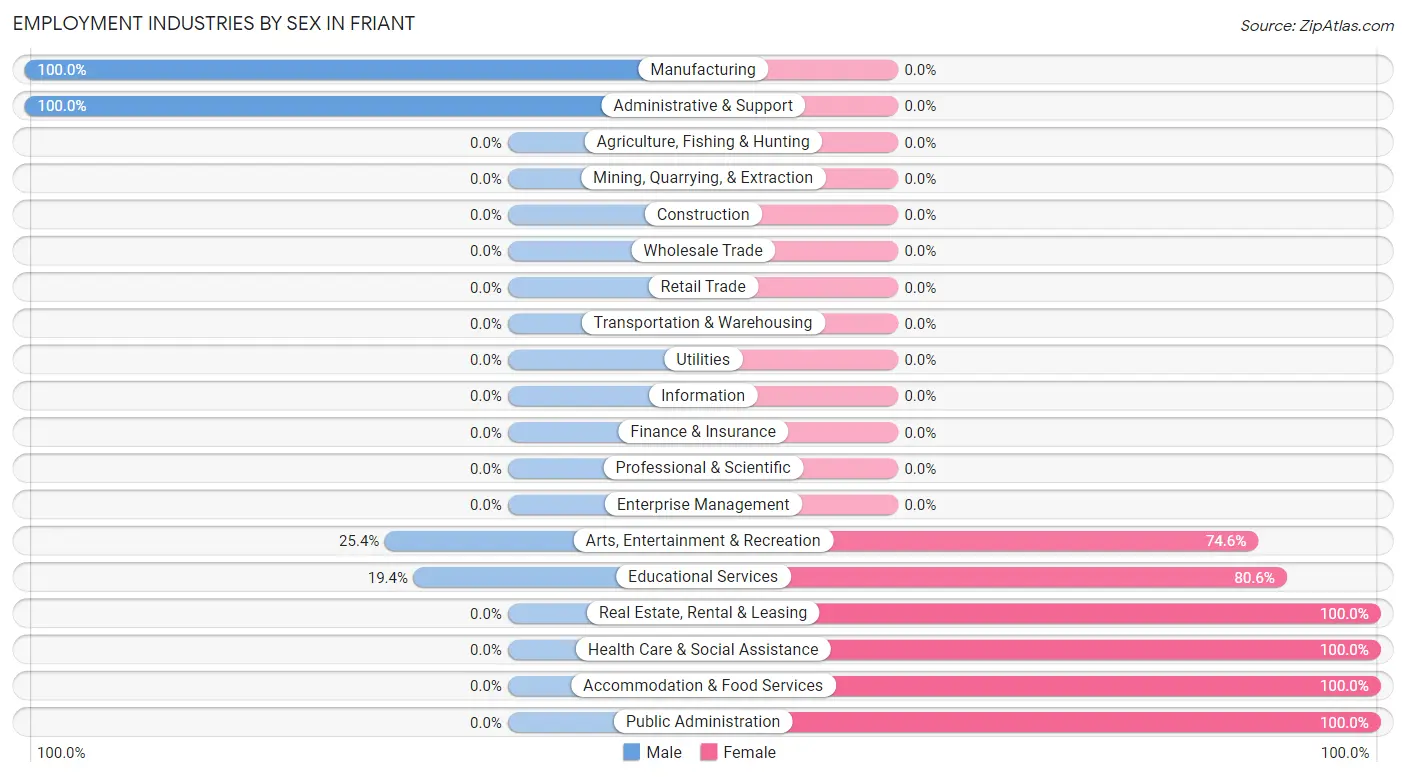
Employment Industries by Sex in Friant
The Friant industries that see more men than women are Manufacturing (100.0%), Administrative & Support (100.0%), and Arts, Entertainment & Recreation (25.4%), whereas the industries that tend to have a higher number of women are Real Estate, Rental & Leasing (100.0%), Health Care & Social Assistance (100.0%), and Accommodation & Food Services (100.0%).
| Industry | Male | Female |
| Agriculture, Fishing & Hunting | 0 (0.0%) | 0 (0.0%) |
| Mining, Quarrying, & Extraction | 0 (0.0%) | 0 (0.0%) |
| Construction | 0 (0.0%) | 0 (0.0%) |
| Manufacturing | 16 (100.0%) | 0 (0.0%) |
| Wholesale Trade | 0 (0.0%) | 0 (0.0%) |
| Retail Trade | 0 (0.0%) | 0 (0.0%) |
| Transportation & Warehousing | 0 (0.0%) | 0 (0.0%) |
| Utilities | 0 (0.0%) | 0 (0.0%) |
| Information | 0 (0.0%) | 0 (0.0%) |
| Finance & Insurance | 0 (0.0%) | 0 (0.0%) |
| Real Estate, Rental & Leasing | 0 (0.0%) | 16 (100.0%) |
| Professional & Scientific | 0 (0.0%) | 0 (0.0%) |
| Enterprise Management | 0 (0.0%) | 0 (0.0%) |
| Administrative & Support | 4 (100.0%) | 0 (0.0%) |
| Educational Services | 7 (19.4%) | 29 (80.6%) |
| Health Care & Social Assistance | 0 (0.0%) | 6 (100.0%) |
| Arts, Entertainment & Recreation | 17 (25.4%) | 50 (74.6%) |
| Accommodation & Food Services | 0 (0.0%) | 16 (100.0%) |
| Public Administration | 0 (0.0%) | 16 (100.0%) |
| Total | 44 (24.2%) | 138 (75.8%) |
Education in Friant
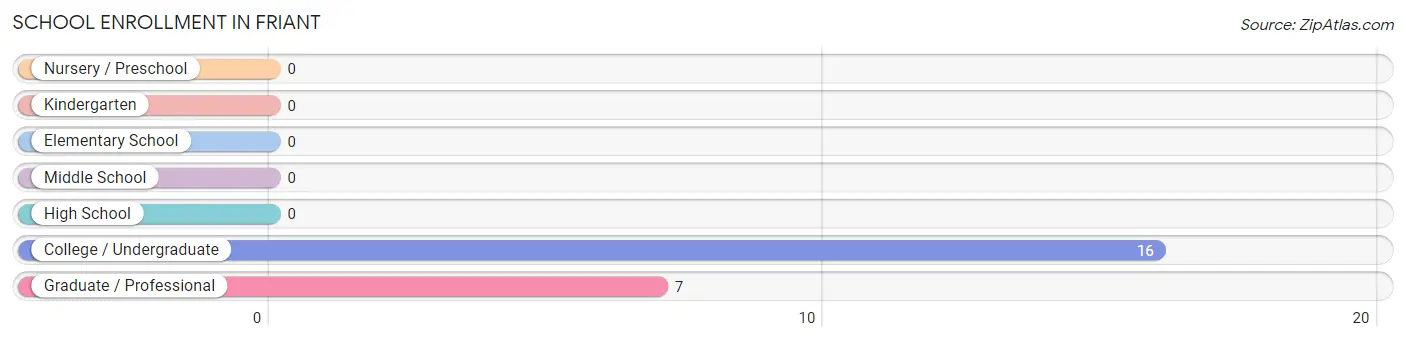
School Enrollment in Friant
The most common levels of schooling among the 23 students in Friant are college / undergraduate (16 | 69.6%), and graduate / professional (7 | 30.4%).
| School Level | # Students | % Students |
| Nursery / Preschool | 0 | 0.0% |
| Kindergarten | 0 | 0.0% |
| Elementary School | 0 | 0.0% |
| Middle School | 0 | 0.0% |
| High School | 0 | 0.0% |
| College / Undergraduate | 16 | 69.6% |
| Graduate / Professional | 7 | 30.4% |
| Total | 23 | 100.0% |
School Enrollment by Age by Funding Source in Friant
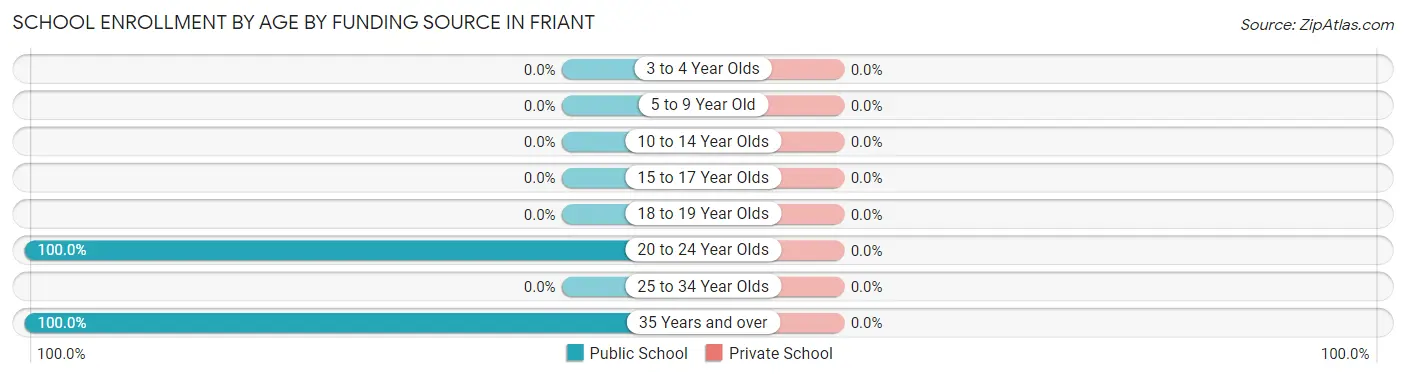
| Age Bracket | Public School | Private School |
| 3 to 4 Year Olds | 0 (0.0%) | 0 (0.0%) |
| 5 to 9 Year Old | 0 (0.0%) | 0 (0.0%) |
| 10 to 14 Year Olds | 0 (0.0%) | 0 (0.0%) |
| 15 to 17 Year Olds | 0 (0.0%) | 0 (0.0%) |
| 18 to 19 Year Olds | 0 (0.0%) | 0 (0.0%) |
| 20 to 24 Year Olds | 16 (100.0%) | 0 (0.0%) |
| 25 to 34 Year Olds | 0 (0.0%) | 0 (0.0%) |
| 35 Years and over | 7 (100.0%) | 0 (0.0%) |
| Total | 23 (100.0%) | 0 (0.0%) |
Educational Attainment by Field of Study in Friant
Business (23 | 79.3%), and social sciences (6 | 20.7%) are the most common fields of study among 29 individuals in Friant who have obtained a bachelor's degree or higher.
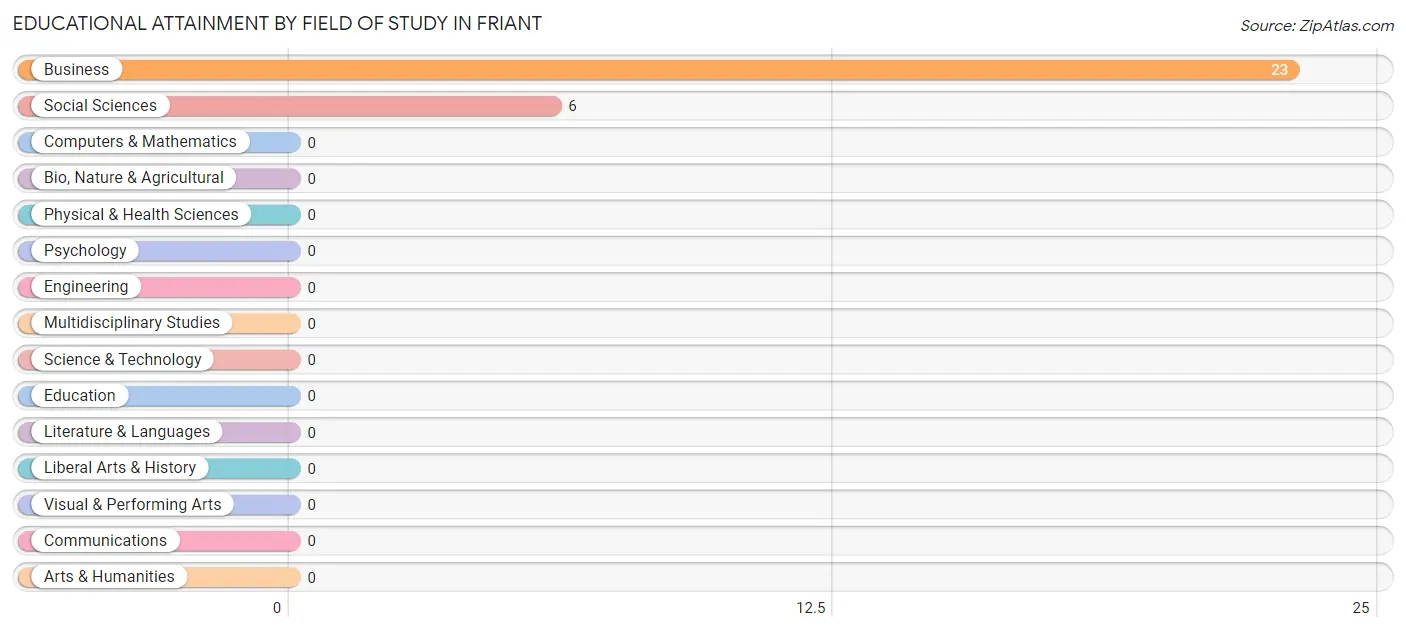
| Field of Study | # Graduates | % Graduates |
| Computers & Mathematics | 0 | 0.0% |
| Bio, Nature & Agricultural | 0 | 0.0% |
| Physical & Health Sciences | 0 | 0.0% |
| Psychology | 0 | 0.0% |
| Social Sciences | 6 | 20.7% |
| Engineering | 0 | 0.0% |
| Multidisciplinary Studies | 0 | 0.0% |
| Science & Technology | 0 | 0.0% |
| Business | 23 | 79.3% |
| Education | 0 | 0.0% |
| Literature & Languages | 0 | 0.0% |
| Liberal Arts & History | 0 | 0.0% |
| Visual & Performing Arts | 0 | 0.0% |
| Communications | 0 | 0.0% |
| Arts & Humanities | 0 | 0.0% |
| Total | 29 | 100.0% |
Transportation & Commute in Friant
Vehicle Availability by Sex in Friant
The most prevalent vehicle ownership categories in Friant are males with 2 vehicles (24, accounting for 54.5%) and females with 2 vehicles (73, making up 17.4%).
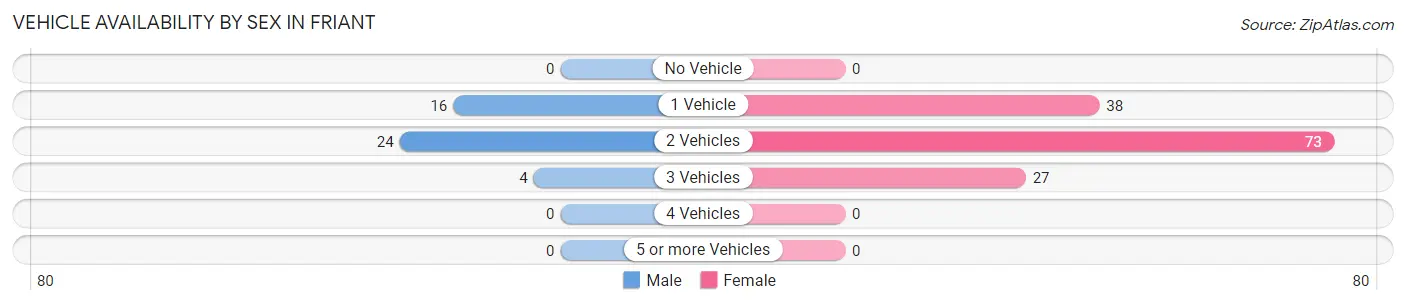
| Vehicles Available | Male | Female |
| No Vehicle | 0 (0.0%) | 0 (0.0%) |
| 1 Vehicle | 16 (36.4%) | 38 (27.5%) |
| 2 Vehicles | 24 (54.5%) | 73 (52.9%) |
| 3 Vehicles | 4 (9.1%) | 27 (19.6%) |
| 4 Vehicles | 0 (0.0%) | 0 (0.0%) |
| 5 or more Vehicles | 0 (0.0%) | 0 (0.0%) |
| Total | 44 (100.0%) | 138 (100.0%) |
Commute Time in Friant
The most frequently occuring commute durations in Friant are 10 to 14 minutes (50 commuters, 33.3%), 35 to 39 minutes (40 commuters, 26.7%), and 25 to 29 minutes (22 commuters, 14.7%).
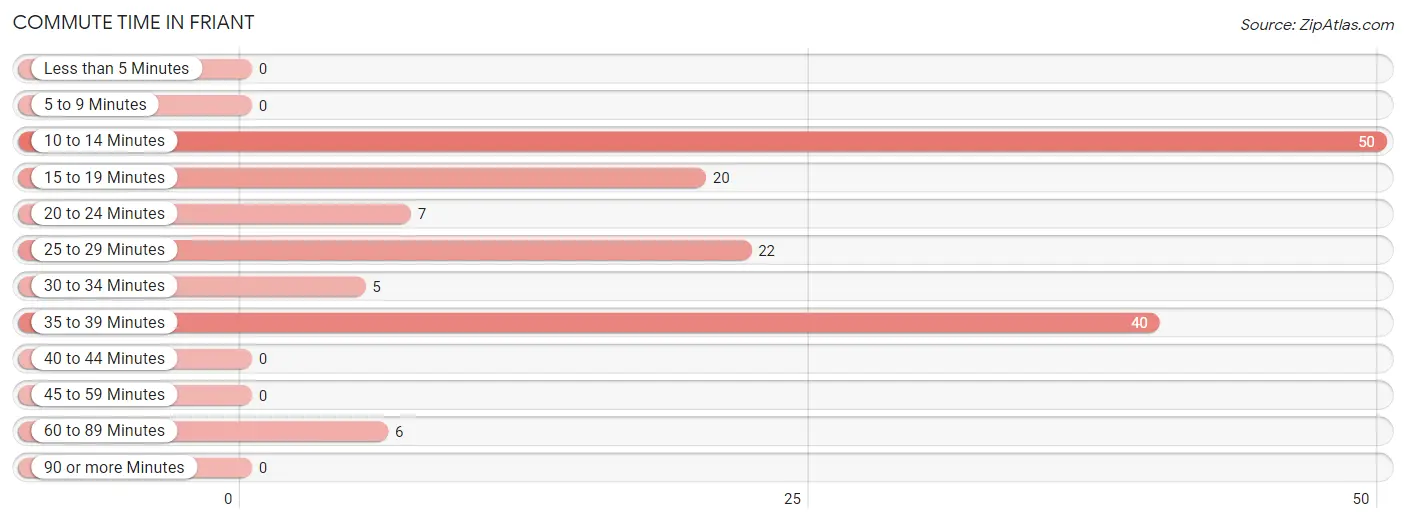
| Commute Time | # Commuters | % Commuters |
| Less than 5 Minutes | 0 | 0.0% |
| 5 to 9 Minutes | 0 | 0.0% |
| 10 to 14 Minutes | 50 | 33.3% |
| 15 to 19 Minutes | 20 | 13.3% |
| 20 to 24 Minutes | 7 | 4.7% |
| 25 to 29 Minutes | 22 | 14.7% |
| 30 to 34 Minutes | 5 | 3.3% |
| 35 to 39 Minutes | 40 | 26.7% |
| 40 to 44 Minutes | 0 | 0.0% |
| 45 to 59 Minutes | 0 | 0.0% |
| 60 to 89 Minutes | 6 | 4.0% |
| 90 or more Minutes | 0 | 0.0% |
Commute Time by Sex in Friant
The most common commute times in Friant are 35 to 39 minutes (17 commuters, 60.7%) for males and 10 to 14 minutes (50 commuters, 41.0%) for females.
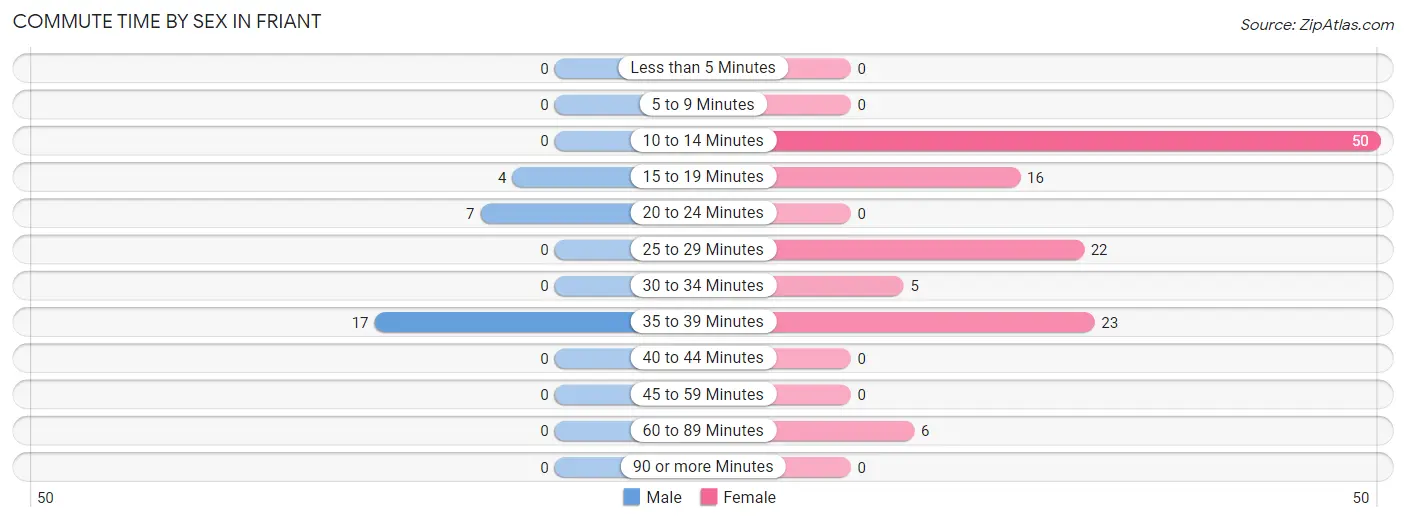
| Commute Time | Male | Female |
| Less than 5 Minutes | 0 (0.0%) | 0 (0.0%) |
| 5 to 9 Minutes | 0 (0.0%) | 0 (0.0%) |
| 10 to 14 Minutes | 0 (0.0%) | 50 (41.0%) |
| 15 to 19 Minutes | 4 (14.3%) | 16 (13.1%) |
| 20 to 24 Minutes | 7 (25.0%) | 0 (0.0%) |
| 25 to 29 Minutes | 0 (0.0%) | 22 (18.0%) |
| 30 to 34 Minutes | 0 (0.0%) | 5 (4.1%) |
| 35 to 39 Minutes | 17 (60.7%) | 23 (18.9%) |
| 40 to 44 Minutes | 0 (0.0%) | 0 (0.0%) |
| 45 to 59 Minutes | 0 (0.0%) | 0 (0.0%) |
| 60 to 89 Minutes | 0 (0.0%) | 6 (4.9%) |
| 90 or more Minutes | 0 (0.0%) | 0 (0.0%) |
Time of Departure to Work by Sex in Friant
The most frequent times of departure to work in Friant are 12:00 AM to 4:59 AM (17, 60.7%) for males and 12:00 AM to 4:59 AM (38, 31.1%) for females.
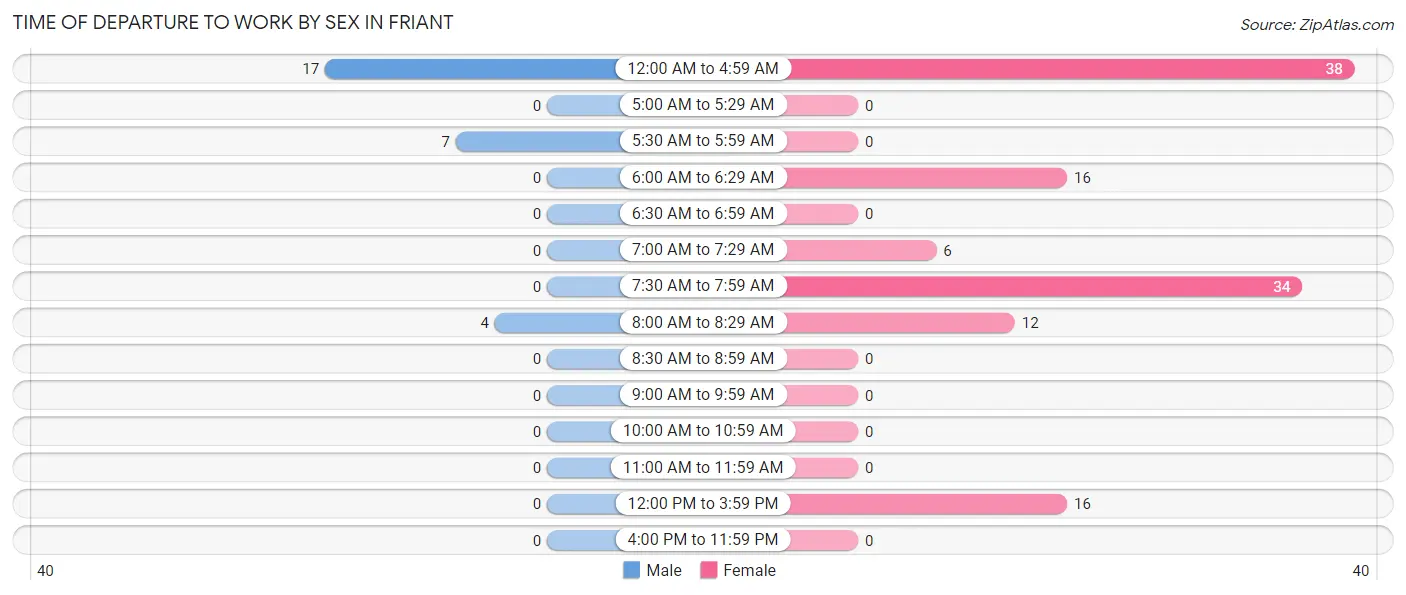
| Time of Departure | Male | Female |
| 12:00 AM to 4:59 AM | 17 (60.7%) | 38 (31.1%) |
| 5:00 AM to 5:29 AM | 0 (0.0%) | 0 (0.0%) |
| 5:30 AM to 5:59 AM | 7 (25.0%) | 0 (0.0%) |
| 6:00 AM to 6:29 AM | 0 (0.0%) | 16 (13.1%) |
| 6:30 AM to 6:59 AM | 0 (0.0%) | 0 (0.0%) |
| 7:00 AM to 7:29 AM | 0 (0.0%) | 6 (4.9%) |
| 7:30 AM to 7:59 AM | 0 (0.0%) | 34 (27.9%) |
| 8:00 AM to 8:29 AM | 4 (14.3%) | 12 (9.8%) |
| 8:30 AM to 8:59 AM | 0 (0.0%) | 0 (0.0%) |
| 9:00 AM to 9:59 AM | 0 (0.0%) | 0 (0.0%) |
| 10:00 AM to 10:59 AM | 0 (0.0%) | 0 (0.0%) |
| 11:00 AM to 11:59 AM | 0 (0.0%) | 0 (0.0%) |
| 12:00 PM to 3:59 PM | 0 (0.0%) | 16 (13.1%) |
| 4:00 PM to 11:59 PM | 0 (0.0%) | 0 (0.0%) |
| Total | 28 (100.0%) | 122 (100.0%) |
Housing Occupancy in Friant
Occupancy by Ownership in Friant
Of the total 181 dwellings in Friant, owner-occupied units account for 143 (79.0%), while renter-occupied units make up 38 (21.0%).
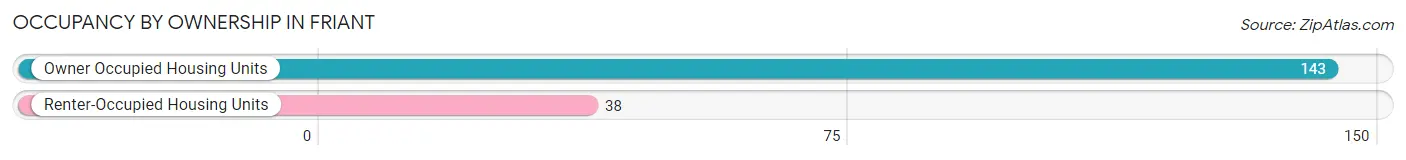
| Occupancy | # Housing Units | % Housing Units |
| Owner Occupied Housing Units | 143 | 79.0% |
| Renter-Occupied Housing Units | 38 | 21.0% |
| Total Occupied Housing Units | 181 | 100.0% |
Occupancy by Household Size in Friant
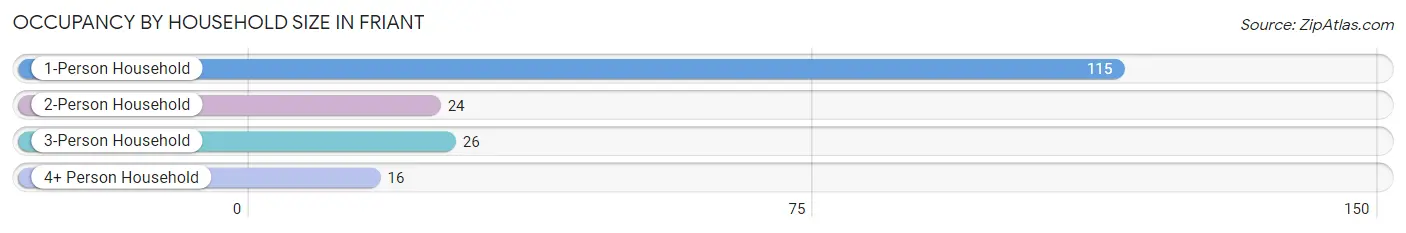
| Household Size | # Housing Units | % Housing Units |
| 1-Person Household | 115 | 63.5% |
| 2-Person Household | 24 | 13.3% |
| 3-Person Household | 26 | 14.4% |
| 4+ Person Household | 16 | 8.8% |
| Total Housing Units | 181 | 100.0% |
Occupancy by Ownership by Household Size in Friant
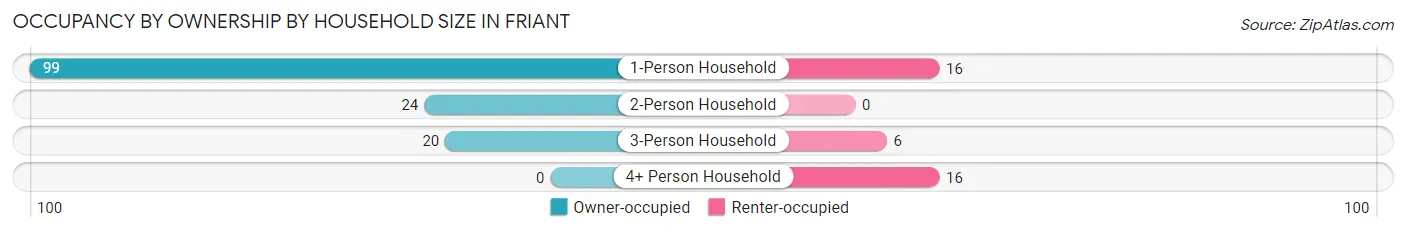
| Household Size | Owner-occupied | Renter-occupied |
| 1-Person Household | 99 (86.1%) | 16 (13.9%) |
| 2-Person Household | 24 (100.0%) | 0 (0.0%) |
| 3-Person Household | 20 (76.9%) | 6 (23.1%) |
| 4+ Person Household | 0 (0.0%) | 16 (100.0%) |
| Total Housing Units | 143 (79.0%) | 38 (21.0%) |
Occupancy by Educational Attainment in Friant
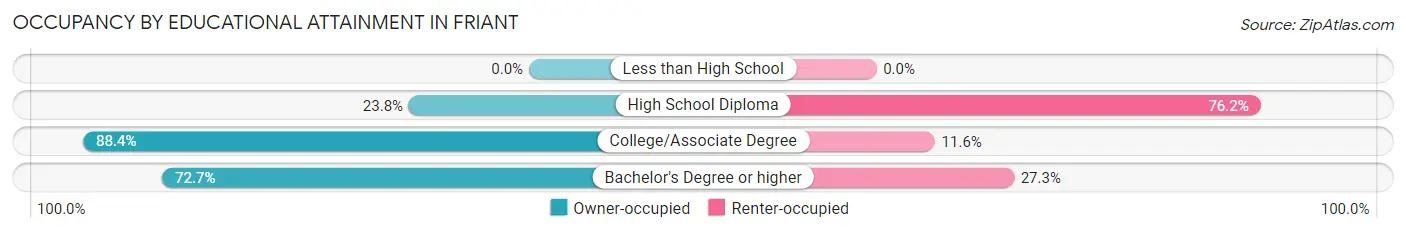
| Household Size | Owner-occupied | Renter-occupied |
| Less than High School | 0 (0.0%) | 0 (0.0%) |
| High School Diploma | 5 (23.8%) | 16 (76.2%) |
| College/Associate Degree | 122 (88.4%) | 16 (11.6%) |
| Bachelor's Degree or higher | 16 (72.7%) | 6 (27.3%) |
Occupancy by Age of Householder in Friant
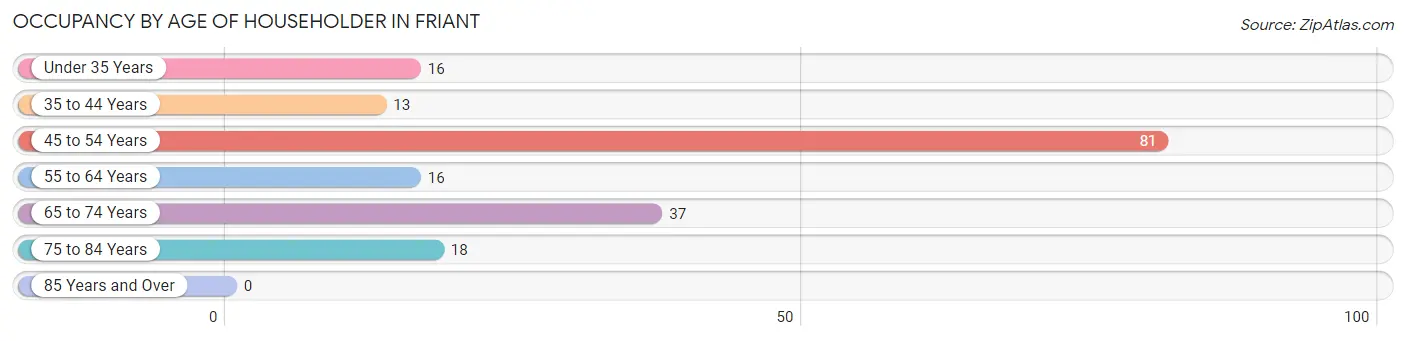
| Age Bracket | # Households | % Households |
| Under 35 Years | 16 | 8.8% |
| 35 to 44 Years | 13 | 7.2% |
| 45 to 54 Years | 81 | 44.8% |
| 55 to 64 Years | 16 | 8.8% |
| 65 to 74 Years | 37 | 20.4% |
| 75 to 84 Years | 18 | 9.9% |
| 85 Years and Over | 0 | 0.0% |
| Total | 181 | 100.0% |
Housing Finances in Friant
Median Income by Occupancy in Friant
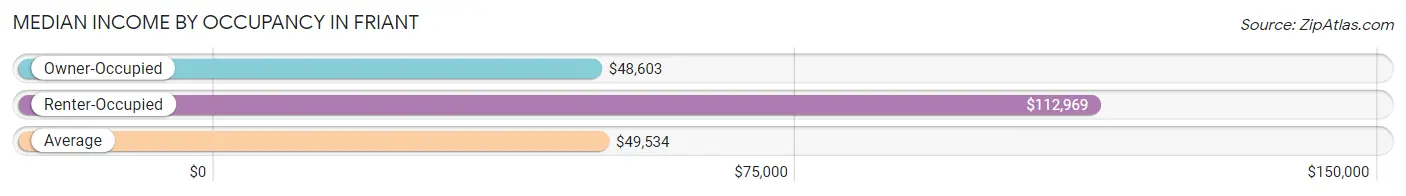
| Occupancy Type | # Households | Median Income |
| Owner-Occupied | 143 (79.0%) | $48,603 |
| Renter-Occupied | 38 (21.0%) | $112,969 |
| Average | 181 (100.0%) | $49,534 |
Occupancy by Householder Income Bracket in Friant
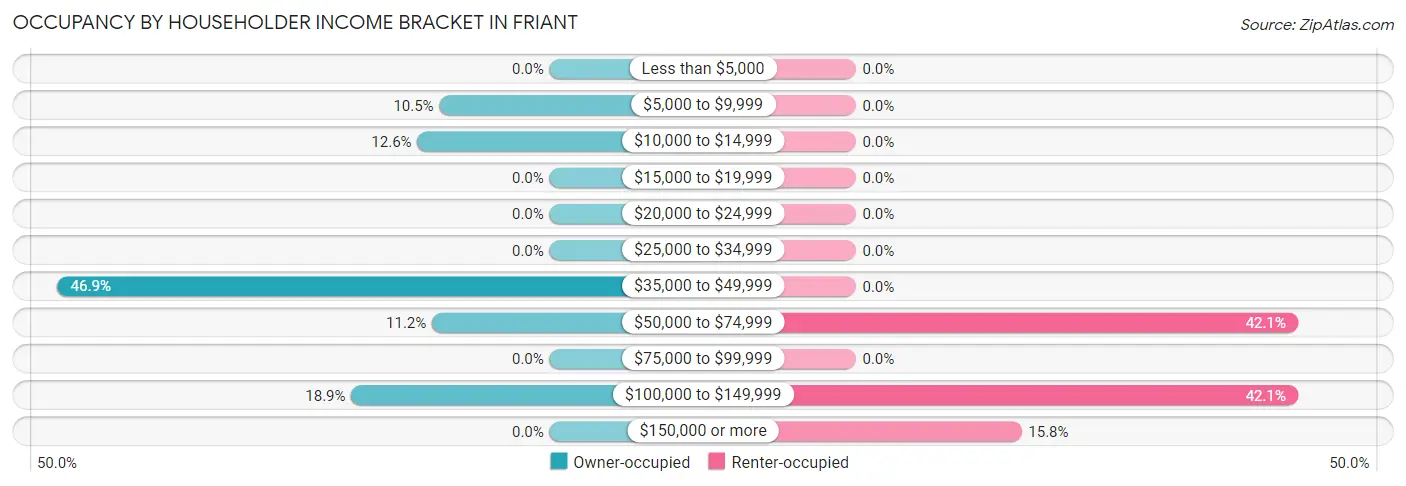
| Income Bracket | Owner-occupied | Renter-occupied |
| Less than $5,000 | 0 (0.0%) | 0 (0.0%) |
| $5,000 to $9,999 | 15 (10.5%) | 0 (0.0%) |
| $10,000 to $14,999 | 18 (12.6%) | 0 (0.0%) |
| $15,000 to $19,999 | 0 (0.0%) | 0 (0.0%) |
| $20,000 to $24,999 | 0 (0.0%) | 0 (0.0%) |
| $25,000 to $34,999 | 0 (0.0%) | 0 (0.0%) |
| $35,000 to $49,999 | 67 (46.9%) | 0 (0.0%) |
| $50,000 to $74,999 | 16 (11.2%) | 16 (42.1%) |
| $75,000 to $99,999 | 0 (0.0%) | 0 (0.0%) |
| $100,000 to $149,999 | 27 (18.9%) | 16 (42.1%) |
| $150,000 or more | 0 (0.0%) | 6 (15.8%) |
| Total | 143 (100.0%) | 38 (100.0%) |
Monthly Housing Cost Tiers in Friant
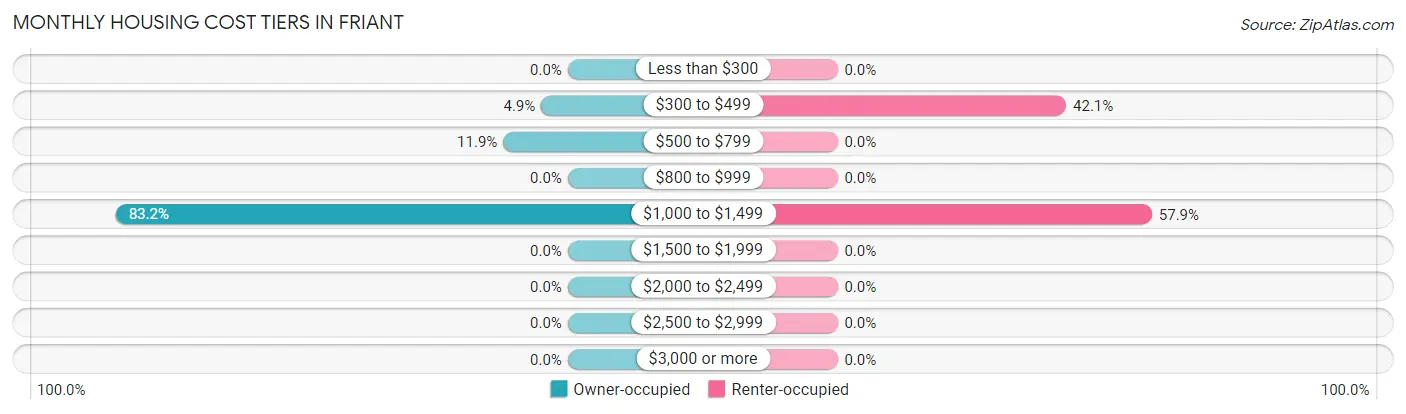
| Monthly Cost | Owner-occupied | Renter-occupied |
| Less than $300 | 0 (0.0%) | 0 (0.0%) |
| $300 to $499 | 7 (4.9%) | 16 (42.1%) |
| $500 to $799 | 17 (11.9%) | 0 (0.0%) |
| $800 to $999 | 0 (0.0%) | 0 (0.0%) |
| $1,000 to $1,499 | 119 (83.2%) | 22 (57.9%) |
| $1,500 to $1,999 | 0 (0.0%) | 0 (0.0%) |
| $2,000 to $2,499 | 0 (0.0%) | 0 (0.0%) |
| $2,500 to $2,999 | 0 (0.0%) | 0 (0.0%) |
| $3,000 or more | 0 (0.0%) | 0 (0.0%) |
| Total | 143 (100.0%) | 38 (100.0%) |
Physical Housing Characteristics in Friant
Housing Structures in Friant
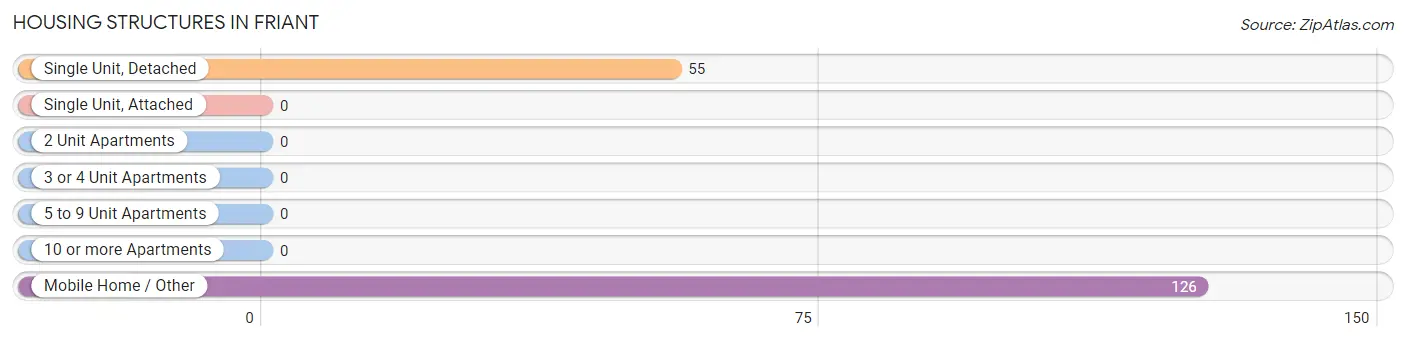
| Structure Type | # Housing Units | % Housing Units |
| Single Unit, Detached | 55 | 30.4% |
| Single Unit, Attached | 0 | 0.0% |
| 2 Unit Apartments | 0 | 0.0% |
| 3 or 4 Unit Apartments | 0 | 0.0% |
| 5 to 9 Unit Apartments | 0 | 0.0% |
| 10 or more Apartments | 0 | 0.0% |
| Mobile Home / Other | 126 | 69.6% |
| Total | 181 | 100.0% |
Housing Structures by Occupancy in Friant
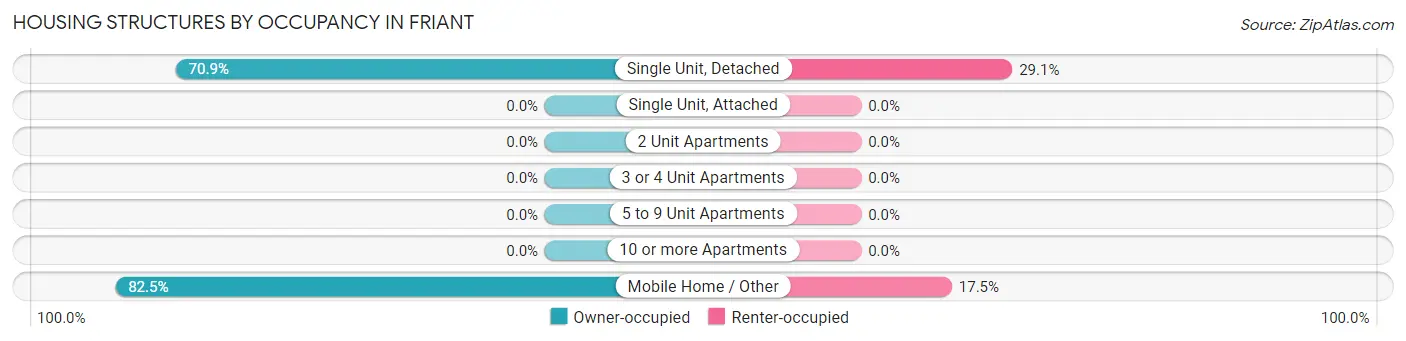
| Structure Type | Owner-occupied | Renter-occupied |
| Single Unit, Detached | 39 (70.9%) | 16 (29.1%) |
| Single Unit, Attached | 0 (0.0%) | 0 (0.0%) |
| 2 Unit Apartments | 0 (0.0%) | 0 (0.0%) |
| 3 or 4 Unit Apartments | 0 (0.0%) | 0 (0.0%) |
| 5 to 9 Unit Apartments | 0 (0.0%) | 0 (0.0%) |
| 10 or more Apartments | 0 (0.0%) | 0 (0.0%) |
| Mobile Home / Other | 104 (82.5%) | 22 (17.5%) |
| Total | 143 (79.0%) | 38 (21.0%) |
Housing Structures by Number of Rooms in Friant
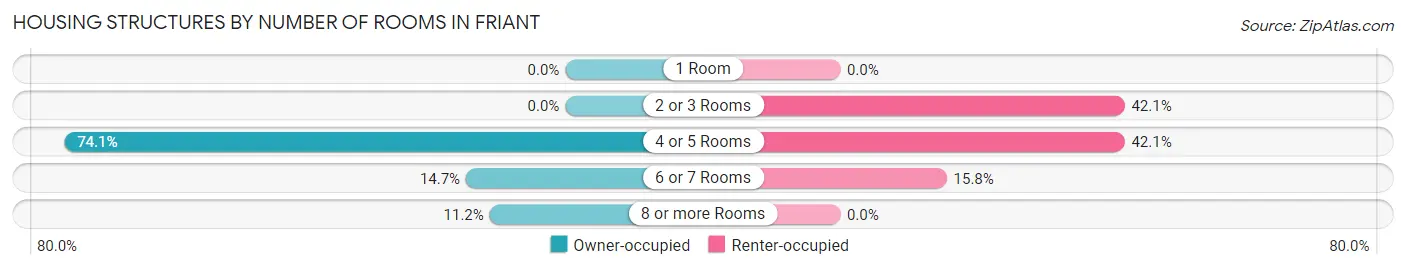
| Number of Rooms | Owner-occupied | Renter-occupied |
| 1 Room | 0 (0.0%) | 0 (0.0%) |
| 2 or 3 Rooms | 0 (0.0%) | 16 (42.1%) |
| 4 or 5 Rooms | 106 (74.1%) | 16 (42.1%) |
| 6 or 7 Rooms | 21 (14.7%) | 6 (15.8%) |
| 8 or more Rooms | 16 (11.2%) | 0 (0.0%) |
| Total | 143 (100.0%) | 38 (100.0%) |
Housing Structure by Heating Type in Friant
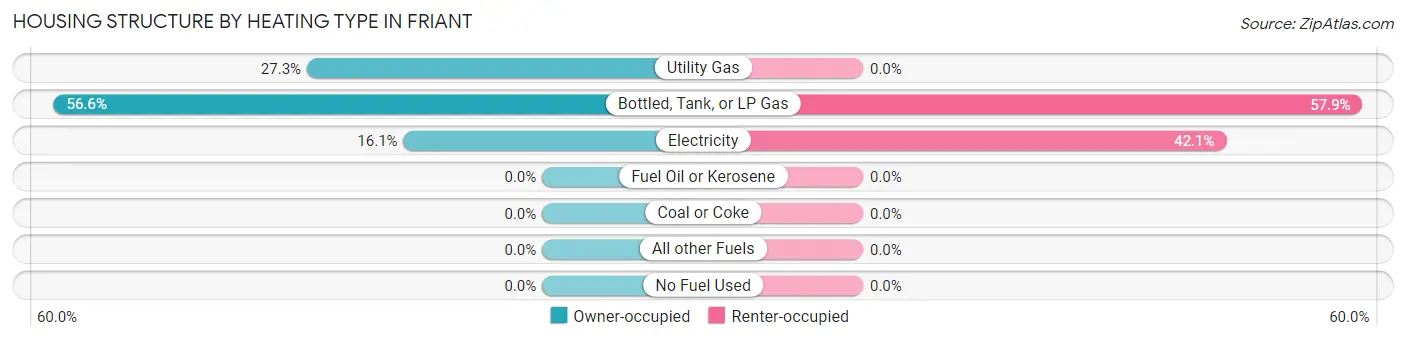
| Heating Type | Owner-occupied | Renter-occupied |
| Utility Gas | 39 (27.3%) | 0 (0.0%) |
| Bottled, Tank, or LP Gas | 81 (56.6%) | 22 (57.9%) |
| Electricity | 23 (16.1%) | 16 (42.1%) |
| Fuel Oil or Kerosene | 0 (0.0%) | 0 (0.0%) |
| Coal or Coke | 0 (0.0%) | 0 (0.0%) |
| All other Fuels | 0 (0.0%) | 0 (0.0%) |
| No Fuel Used | 0 (0.0%) | 0 (0.0%) |
| Total | 143 (100.0%) | 38 (100.0%) |
Household Vehicle Usage in Friant
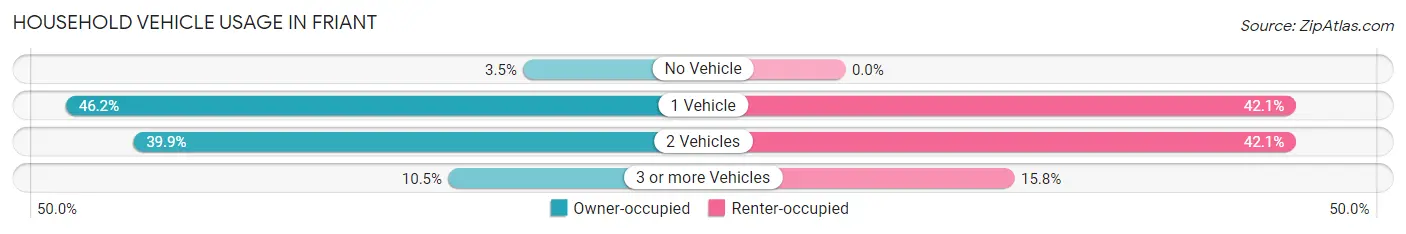
| Vehicles per Household | Owner-occupied | Renter-occupied |
| No Vehicle | 5 (3.5%) | 0 (0.0%) |
| 1 Vehicle | 66 (46.2%) | 16 (42.1%) |
| 2 Vehicles | 57 (39.9%) | 16 (42.1%) |
| 3 or more Vehicles | 15 (10.5%) | 6 (15.8%) |
| Total | 143 (100.0%) | 38 (100.0%) |
Real Estate & Mortgages in Friant
Real Estate and Mortgage Overview in Friant
| Characteristic | Without Mortgage | With Mortgage |
| Housing Units | 24 | 119 |
| Median Property Value | - | - |
| Median Household Income | - | - |
| Monthly Housing Costs | - | - |
| Real Estate Taxes | - | - |
Property Value by Mortgage Status in Friant
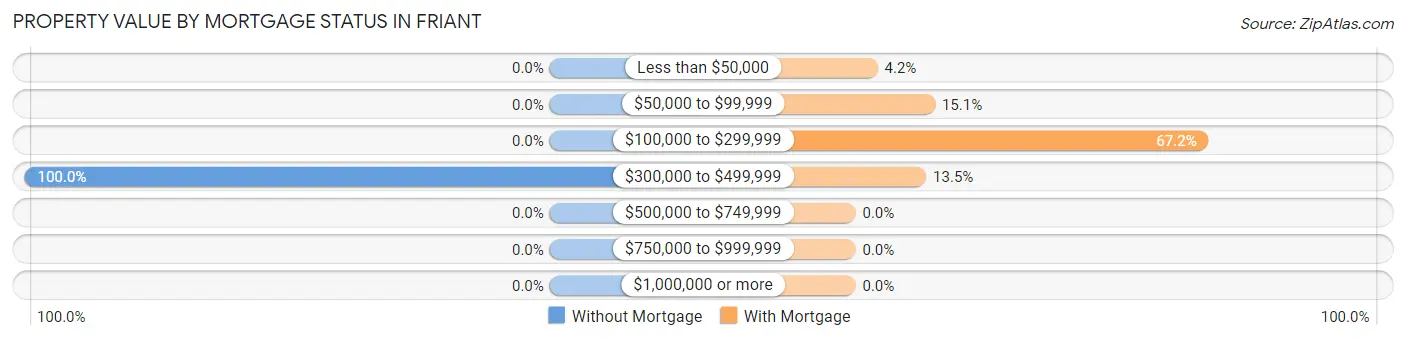
| Property Value | Without Mortgage | With Mortgage |
| Less than $50,000 | 0 (0.0%) | 5 (4.2%) |
| $50,000 to $99,999 | 0 (0.0%) | 18 (15.1%) |
| $100,000 to $299,999 | 0 (0.0%) | 80 (67.2%) |
| $300,000 to $499,999 | 24 (100.0%) | 16 (13.5%) |
| $500,000 to $749,999 | 0 (0.0%) | 0 (0.0%) |
| $750,000 to $999,999 | 0 (0.0%) | 0 (0.0%) |
| $1,000,000 or more | 0 (0.0%) | 0 (0.0%) |
| Total | 24 (100.0%) | 119 (100.0%) |
Household Income by Mortgage Status in Friant
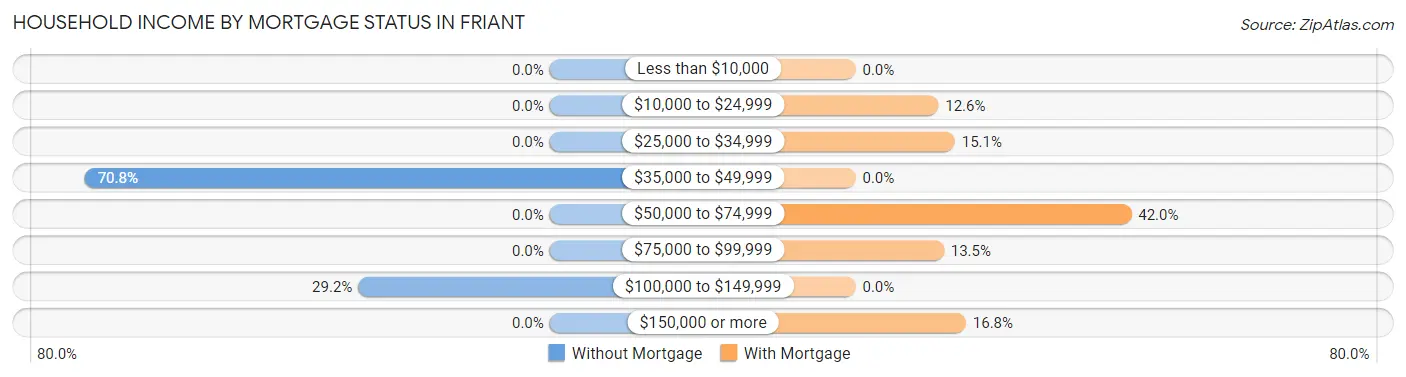
| Household Income | Without Mortgage | With Mortgage |
| Less than $10,000 | 0 (0.0%) | 0 (0.0%) |
| $10,000 to $24,999 | 0 (0.0%) | 15 (12.6%) |
| $25,000 to $34,999 | 0 (0.0%) | 18 (15.1%) |
| $35,000 to $49,999 | 17 (70.8%) | 0 (0.0%) |
| $50,000 to $74,999 | 0 (0.0%) | 50 (42.0%) |
| $75,000 to $99,999 | 0 (0.0%) | 16 (13.5%) |
| $100,000 to $149,999 | 7 (29.2%) | 0 (0.0%) |
| $150,000 or more | 0 (0.0%) | 20 (16.8%) |
| Total | 24 (100.0%) | 119 (100.0%) |
Property Value to Household Income Ratio in Friant
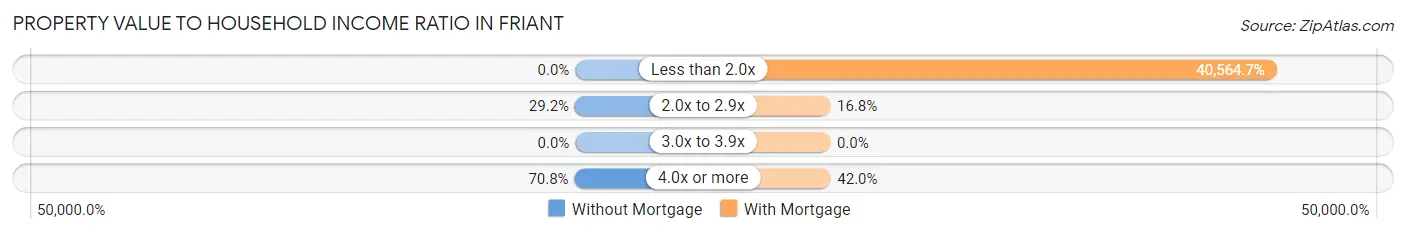
| Value-to-Income Ratio | Without Mortgage | With Mortgage |
| Less than 2.0x | 0 (0.0%) | 48,272 (40,564.7%) |
| 2.0x to 2.9x | 7 (29.2%) | 20 (16.8%) |
| 3.0x to 3.9x | 0 (0.0%) | 0 (0.0%) |
| 4.0x or more | 17 (70.8%) | 50 (42.0%) |
| Total | 24 (100.0%) | 119 (100.0%) |
Real Estate Taxes by Mortgage Status in Friant
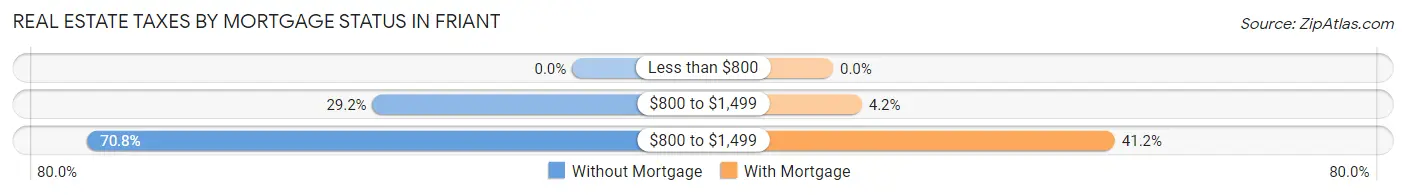
| Property Taxes | Without Mortgage | With Mortgage |
| Less than $800 | 0 (0.0%) | 0 (0.0%) |
| $800 to $1,499 | 7 (29.2%) | 5 (4.2%) |
| $800 to $1,499 | 17 (70.8%) | 49 (41.2%) |
| Total | 24 (100.0%) | 119 (100.0%) |
Health & Disability in Friant
Health Insurance Coverage by Age in Friant
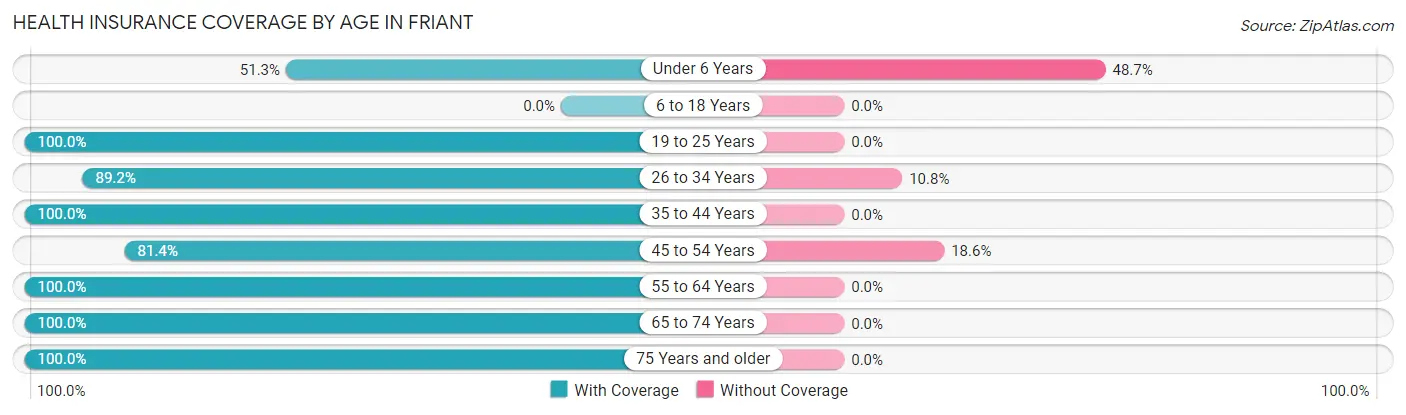
| Age Bracket | With Coverage | Without Coverage |
| Under 6 Years | 20 (51.3%) | 19 (48.7%) |
| 6 to 18 Years | 0 (0.0%) | 0 (0.0%) |
| 19 to 25 Years | 16 (100.0%) | 0 (0.0%) |
| 26 to 34 Years | 33 (89.2%) | 4 (10.8%) |
| 35 to 44 Years | 20 (100.0%) | 0 (0.0%) |
| 45 to 54 Years | 96 (81.4%) | 22 (18.6%) |
| 55 to 64 Years | 26 (100.0%) | 0 (0.0%) |
| 65 to 74 Years | 37 (100.0%) | 0 (0.0%) |
| 75 Years and older | 24 (100.0%) | 0 (0.0%) |
| Total | 272 (85.8%) | 45 (14.2%) |
Health Insurance Coverage by Citizenship Status in Friant
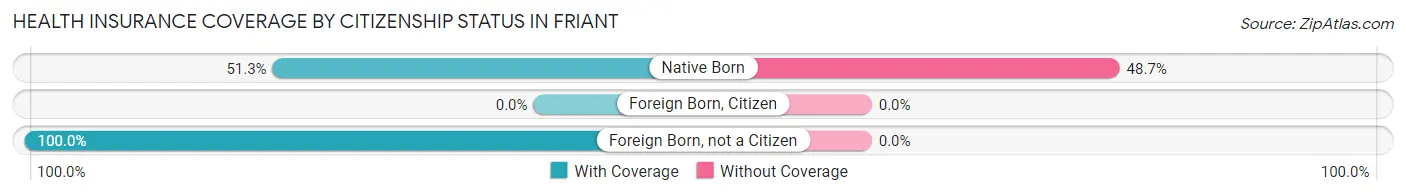
| Citizenship Status | With Coverage | Without Coverage |
| Native Born | 20 (51.3%) | 19 (48.7%) |
| Foreign Born, Citizen | 0 (0.0%) | 0 (0.0%) |
| Foreign Born, not a Citizen | 16 (100.0%) | 0 (0.0%) |
Health Insurance Coverage by Household Income in Friant
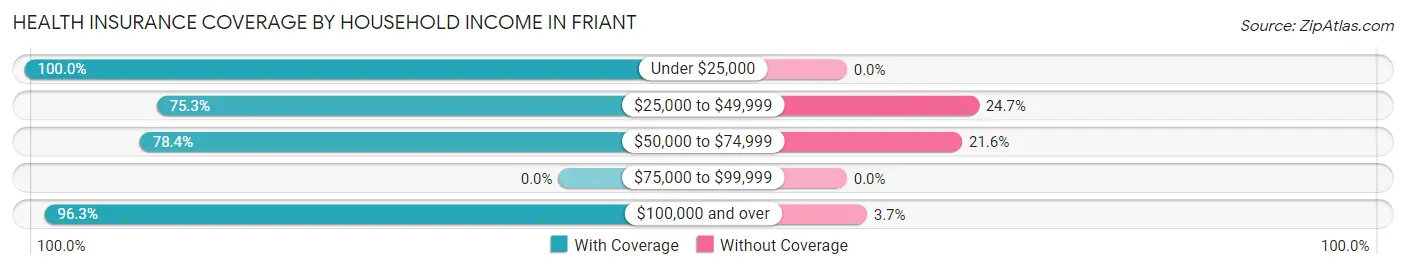
| Household Income | With Coverage | Without Coverage |
| Under $25,000 | 33 (100.0%) | 0 (0.0%) |
| $25,000 to $49,999 | 67 (75.3%) | 22 (24.7%) |
| $50,000 to $74,999 | 69 (78.4%) | 19 (21.6%) |
| $75,000 to $99,999 | 0 (0.0%) | 0 (0.0%) |
| $100,000 and over | 103 (96.3%) | 4 (3.7%) |
Public vs Private Health Insurance Coverage by Age in Friant
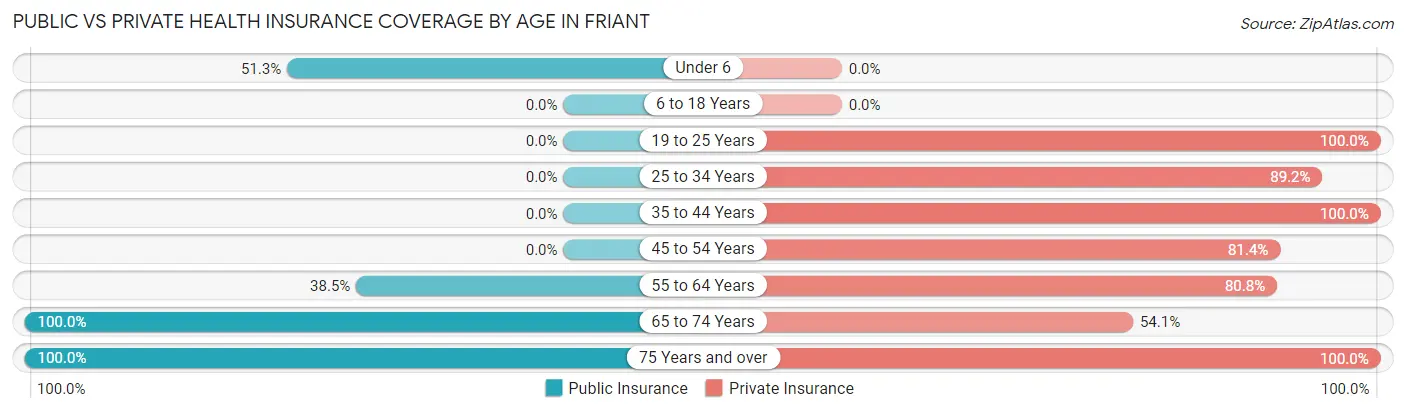
| Age Bracket | Public Insurance | Private Insurance |
| Under 6 | 20 (51.3%) | 0 (0.0%) |
| 6 to 18 Years | 0 (0.0%) | 0 (0.0%) |
| 19 to 25 Years | 0 (0.0%) | 16 (100.0%) |
| 25 to 34 Years | 0 (0.0%) | 33 (89.2%) |
| 35 to 44 Years | 0 (0.0%) | 20 (100.0%) |
| 45 to 54 Years | 0 (0.0%) | 96 (81.4%) |
| 55 to 64 Years | 10 (38.5%) | 21 (80.8%) |
| 65 to 74 Years | 37 (100.0%) | 20 (54.0%) |
| 75 Years and over | 24 (100.0%) | 24 (100.0%) |
| Total | 91 (28.7%) | 230 (72.6%) |
Disability Status by Sex by Age in Friant
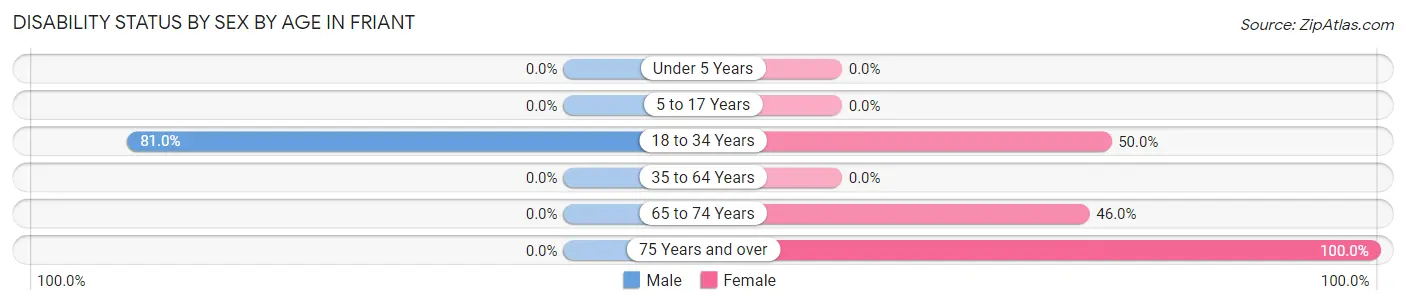
| Age Bracket | Male | Female |
| Under 5 Years | 0 (0.0%) | 0 (0.0%) |
| 5 to 17 Years | 0 (0.0%) | 0 (0.0%) |
| 18 to 34 Years | 17 (80.9%) | 16 (50.0%) |
| 35 to 64 Years | 0 (0.0%) | 0 (0.0%) |
| 65 to 74 Years | 0 (0.0%) | 17 (46.0%) |
| 75 Years and over | 0 (0.0%) | 24 (100.0%) |
Disability Class by Sex by Age in Friant
Disability Class: Hearing Difficulty
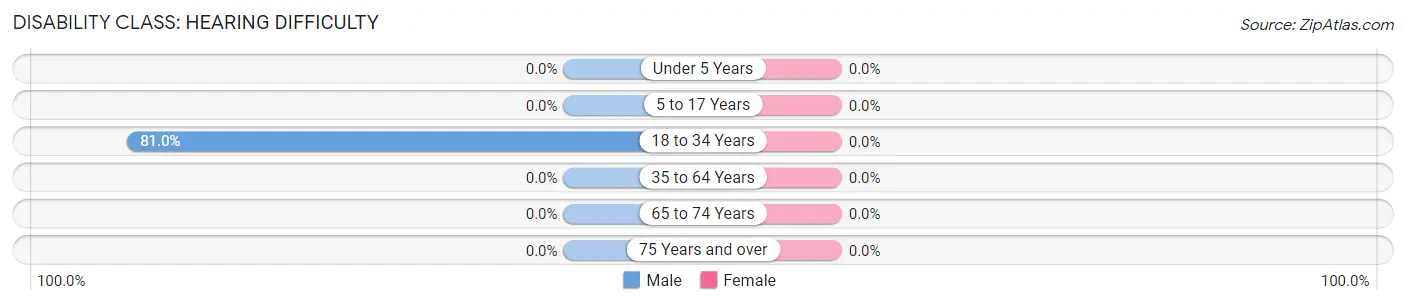
| Age Bracket | Male | Female |
| Under 5 Years | 0 (0.0%) | 0 (0.0%) |
| 5 to 17 Years | 0 (0.0%) | 0 (0.0%) |
| 18 to 34 Years | 17 (80.9%) | 0 (0.0%) |
| 35 to 64 Years | 0 (0.0%) | 0 (0.0%) |
| 65 to 74 Years | 0 (0.0%) | 0 (0.0%) |
| 75 Years and over | 0 (0.0%) | 0 (0.0%) |
Disability Class: Vision Difficulty
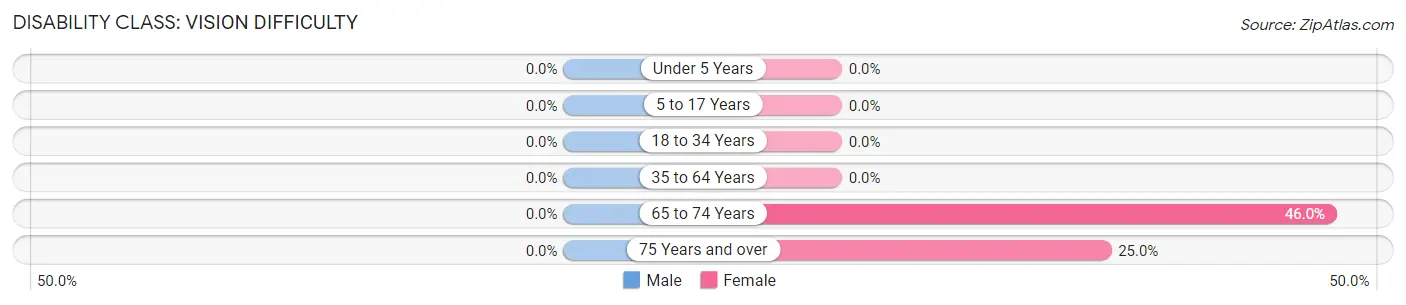
| Age Bracket | Male | Female |
| Under 5 Years | 0 (0.0%) | 0 (0.0%) |
| 5 to 17 Years | 0 (0.0%) | 0 (0.0%) |
| 18 to 34 Years | 0 (0.0%) | 0 (0.0%) |
| 35 to 64 Years | 0 (0.0%) | 0 (0.0%) |
| 65 to 74 Years | 0 (0.0%) | 17 (46.0%) |
| 75 Years and over | 0 (0.0%) | 6 (25.0%) |
Disability Class: Cognitive Difficulty
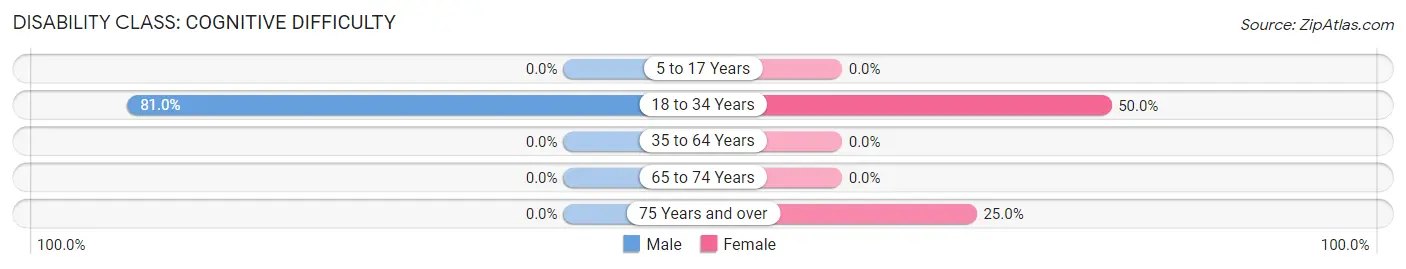
| Age Bracket | Male | Female |
| 5 to 17 Years | 0 (0.0%) | 0 (0.0%) |
| 18 to 34 Years | 17 (80.9%) | 16 (50.0%) |
| 35 to 64 Years | 0 (0.0%) | 0 (0.0%) |
| 65 to 74 Years | 0 (0.0%) | 0 (0.0%) |
| 75 Years and over | 0 (0.0%) | 6 (25.0%) |
Disability Class: Ambulatory Difficulty
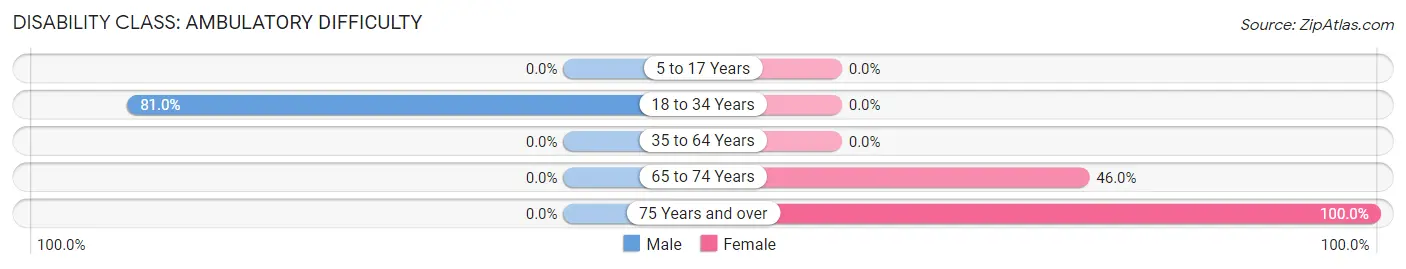
| Age Bracket | Male | Female |
| 5 to 17 Years | 0 (0.0%) | 0 (0.0%) |
| 18 to 34 Years | 17 (80.9%) | 0 (0.0%) |
| 35 to 64 Years | 0 (0.0%) | 0 (0.0%) |
| 65 to 74 Years | 0 (0.0%) | 17 (46.0%) |
| 75 Years and over | 0 (0.0%) | 24 (100.0%) |
Disability Class: Self-Care Difficulty
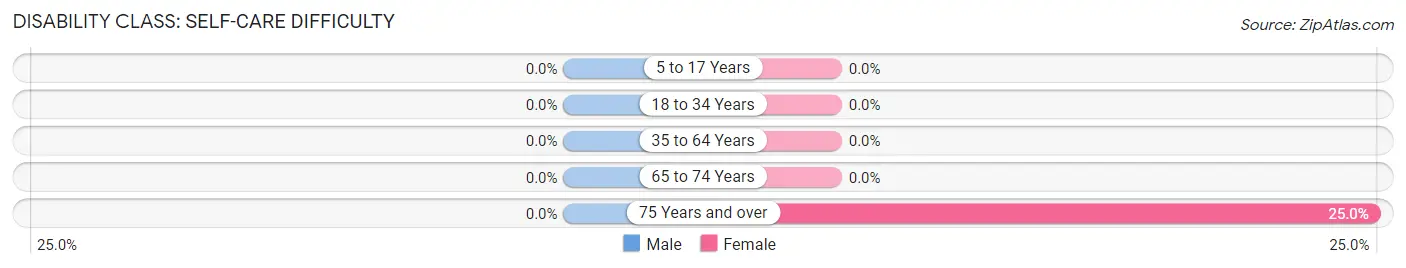
| Age Bracket | Male | Female |
| 5 to 17 Years | 0 (0.0%) | 0 (0.0%) |
| 18 to 34 Years | 0 (0.0%) | 0 (0.0%) |
| 35 to 64 Years | 0 (0.0%) | 0 (0.0%) |
| 65 to 74 Years | 0 (0.0%) | 0 (0.0%) |
| 75 Years and over | 0 (0.0%) | 6 (25.0%) |
Technology Access in Friant
Computing Device Access in Friant
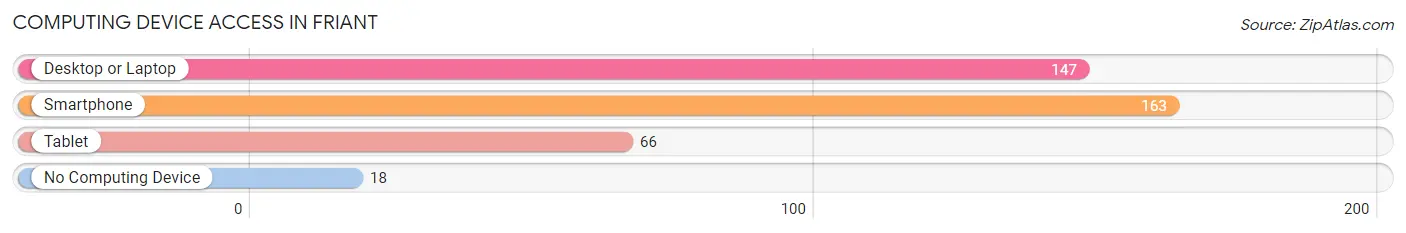
| Device Type | # Households | % Households |
| Desktop or Laptop | 147 | 81.2% |
| Smartphone | 163 | 90.1% |
| Tablet | 66 | 36.5% |
| No Computing Device | 18 | 9.9% |
| Total | 181 | 100.0% |
Internet Access in Friant
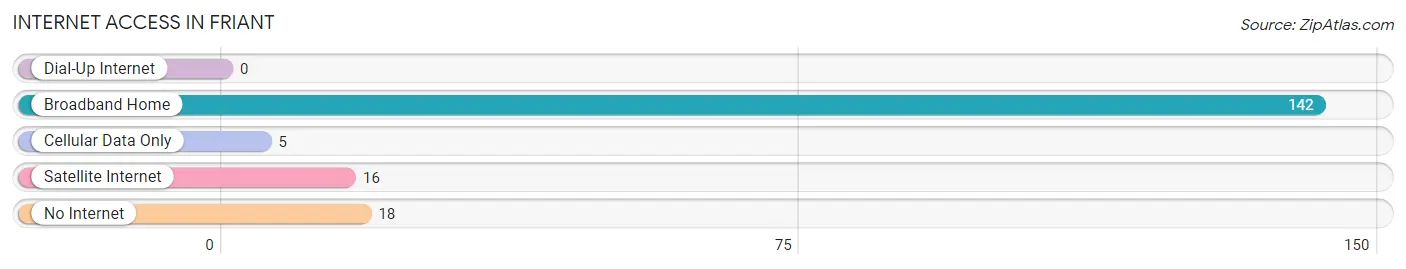
| Internet Type | # Households | % Households |
| Dial-Up Internet | 0 | 0.0% |
| Broadband Home | 142 | 78.4% |
| Cellular Data Only | 5 | 2.8% |
| Satellite Internet | 16 | 8.8% |
| No Internet | 18 | 9.9% |
| Total | 181 | 100.0% |
Friant Summary
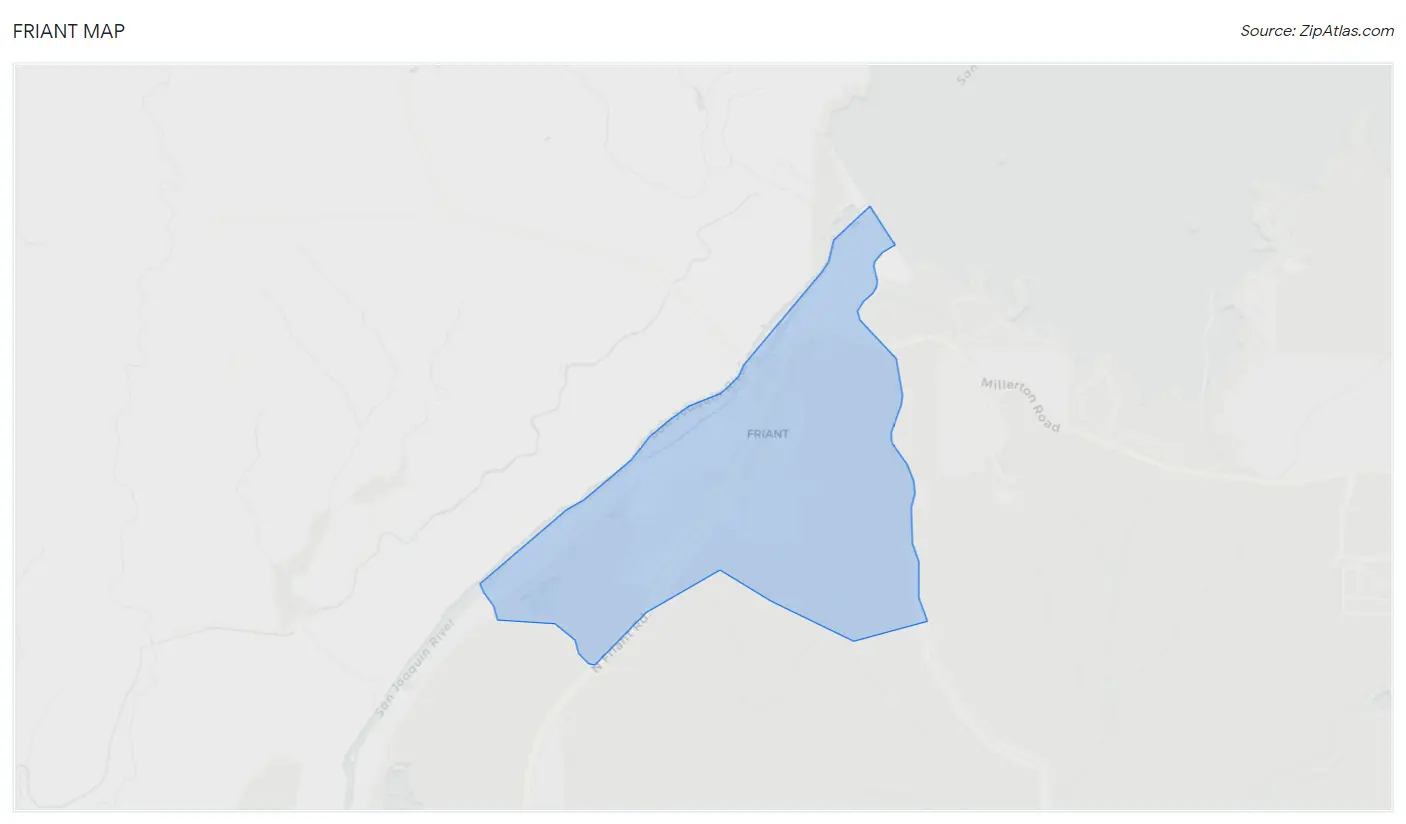
Friant is an unincorporated community located in Fresno County, California. It is situated in the San Joaquin Valley, approximately 15 miles northeast of Fresno. The population of Friant was 1,945 at the 2010 census.
History
Friant was originally inhabited by the Yokuts Indians, who lived in the area for thousands of years before the arrival of Europeans. The first Europeans to settle in the area were Spanish missionaries, who established a mission in the area in 1806. The mission was abandoned in 1833, and the area was later settled by ranchers and farmers.
The town of Friant was founded in 1872 by William Friant, a rancher from the nearby town of Clovis. Friant was a small farming community until the 1950s, when the Friant-Kern Canal was built to bring water from the nearby Kings River to the San Joaquin Valley. This allowed for the development of large-scale agriculture in the area, and Friant quickly grew into a prosperous farming community.
Geography
Friant is located in the San Joaquin Valley, approximately 15 miles northeast of Fresno. The town is situated at an elevation of approximately 300 feet above sea level. The Friant-Kern Canal runs through the town, providing irrigation water to the surrounding agricultural lands. The town is surrounded by rolling hills and farmland, and is located near the Sierra Nevada mountain range.
Economy
Friant’s economy is largely based on agriculture. The town is home to a variety of farms, including almond, pistachio, and citrus groves. The Friant-Kern Canal provides irrigation water to the surrounding agricultural lands, allowing for the production of a variety of crops. The town is also home to a number of businesses, including restaurants, gas stations, and convenience stores.
Demographics
As of the 2010 census, the population of Friant was 1,945. The racial makeup of the town was 73.3% White, 0.7% African American, 0.7% Native American, 0.7% Asian, 0.2% Pacific Islander, 22.2% from other races, and 2.2% from two or more races. Hispanic or Latino of any race were 44.2% of the population.
The median household income in Friant was $41,250, and the median family income was $45,938. The per capita income for the town was $17,845. About 17.2% of families and 20.3% of the population were below the poverty line, including 28.3% of those under age 18 and 8.2% of those age 65 or over.
Common Questions
What is Per Capita Income in Friant?
Per Capita income in Friant is $36,493.
What is the Median Household income in Friant?
Median Household Income in Friant is $49,534.
What is Income or Wage Gap in Friant?
Income or Wage Gap in Friant is 13.8%.
Women in Friant earn 86.2 cents for every dollar earned by a man.
What is Inequality or Gini Index in Friant?
Inequality or Gini Index in Friant is 0.35.
What is the Total Population of Friant?
Total Population of Friant is 317.
What is the Total Male Population of Friant?
Total Male Population of Friant is 83.
What is the Total Female Population of Friant?
Total Female Population of Friant is 234.
What is the Ratio of Males per 100 Females in Friant?
There are 35.47 Males per 100 Females in Friant.
What is the Ratio of Females per 100 Males in Friant?
There are 281.93 Females per 100 Males in Friant.
What is the Median Population Age in Friant?
Median Population Age in Friant is 50.3 Years.
What is the Average Family Size in Friant
Average Family Size in Friant is 2.8 People.
What is the Average Household Size in Friant
Average Household Size in Friant is 1.8 People.
How Large is the Labor Force in Friant?
There are 182 People in the Labor Forcein in Friant.
What is the Percentage of People in the Labor Force in Friant?
65.5% of People are in the Labor Force in Friant.