French Camp, CA Map & Demographics
French Camp Map
French Camp Overview
$17,857
PER CAPITA INCOME
$68,194
AVG FAMILY INCOME
$69,444
AVG HOUSEHOLD INCOME
10.0%
WAGE / INCOME GAP [ % ]
90.0¢/ $1
WAGE / INCOME GAP [ $ ]
0.37
INEQUALITY / GINI INDEX
3,860
TOTAL POPULATION
2,681
MALE POPULATION
1,179
FEMALE POPULATION
227.40
MALES / 100 FEMALES
43.98
FEMALES / 100 MALES
36.4
MEDIAN AGE
3.6
AVG FAMILY SIZE
3.4
AVG HOUSEHOLD SIZE
1,390
LABOR FORCE [ PEOPLE ]
41.2%
PERCENT IN LABOR FORCE
1.8%
UNEMPLOYMENT RATE
French Camp Zip Codes
French Camp Area Codes
Income in French Camp
Income Overview in French Camp
Per Capita Income in French Camp is $17,857, while median incomes of families and households are $68,194 and $69,444 respectively.
| Characteristic | Number | Measure |
| Per Capita Income | 3,860 | $17,857 |
| Median Family Income | 351 | $68,194 |
| Mean Family Income | 351 | $75,891 |
| Median Household Income | 396 | $69,444 |
| Mean Household Income | 396 | $74,953 |
| Income Deficit | 351 | $0 |
| Wage / Income Gap (%) | 3,860 | 9.97% |
| Wage / Income Gap ($) | 3,860 | 90.03¢ per $1 |
| Gini / Inequality Index | 3,860 | 0.37 |
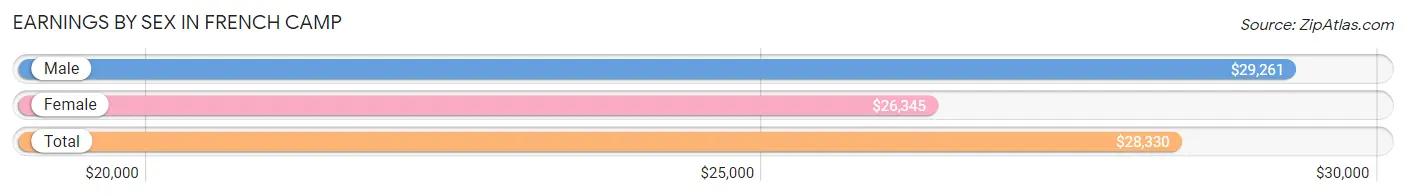
Earnings by Sex in French Camp
Average Earnings in French Camp are $28,330, $29,261 for men and $26,345 for women, a difference of 10.0%.
| Sex | Number | Average Earnings |
| Male | 1,354 (74.9%) | $29,261 |
| Female | 455 (25.2%) | $26,345 |
| Total | 1,809 (100.0%) | $28,330 |
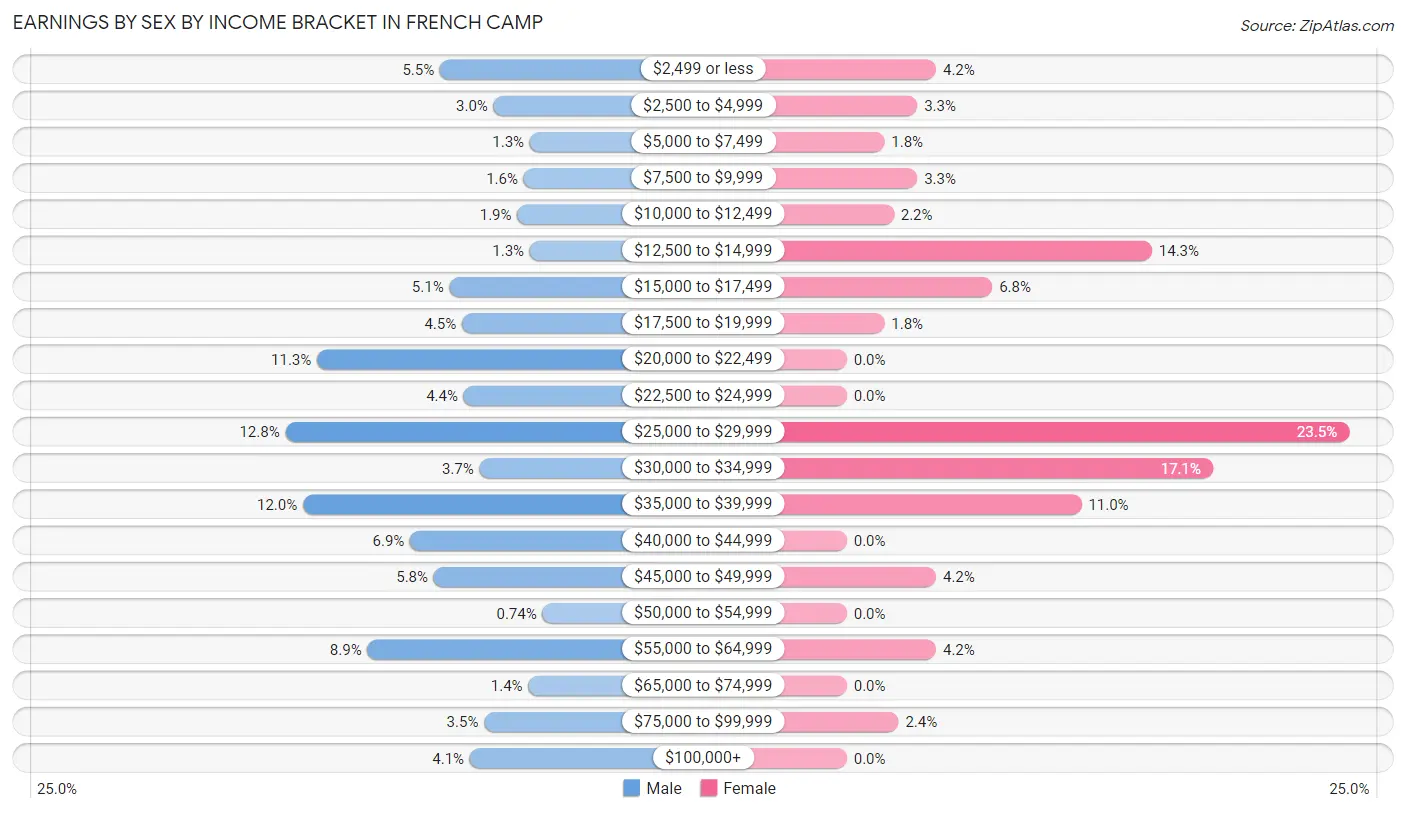
Earnings by Sex by Income Bracket in French Camp
The most common earnings brackets in French Camp are $25,000 to $29,999 for men (173 | 12.8%) and $25,000 to $29,999 for women (107 | 23.5%).
| Income | Male | Female |
| $2,499 or less | 75 (5.5%) | 19 (4.2%) |
| $2,500 to $4,999 | 41 (3.0%) | 15 (3.3%) |
| $5,000 to $7,499 | 18 (1.3%) | 8 (1.8%) |
| $7,500 to $9,999 | 22 (1.6%) | 15 (3.3%) |
| $10,000 to $12,499 | 26 (1.9%) | 10 (2.2%) |
| $12,500 to $14,999 | 18 (1.3%) | 65 (14.3%) |
| $15,000 to $17,499 | 69 (5.1%) | 31 (6.8%) |
| $17,500 to $19,999 | 61 (4.5%) | 8 (1.8%) |
| $20,000 to $22,499 | 153 (11.3%) | 0 (0.0%) |
| $22,500 to $24,999 | 60 (4.4%) | 0 (0.0%) |
| $25,000 to $29,999 | 173 (12.8%) | 107 (23.5%) |
| $30,000 to $34,999 | 50 (3.7%) | 78 (17.1%) |
| $35,000 to $39,999 | 162 (12.0%) | 50 (11.0%) |
| $40,000 to $44,999 | 94 (6.9%) | 0 (0.0%) |
| $45,000 to $49,999 | 79 (5.8%) | 19 (4.2%) |
| $50,000 to $54,999 | 10 (0.7%) | 0 (0.0%) |
| $55,000 to $64,999 | 121 (8.9%) | 19 (4.2%) |
| $65,000 to $74,999 | 19 (1.4%) | 0 (0.0%) |
| $75,000 to $99,999 | 47 (3.5%) | 11 (2.4%) |
| $100,000+ | 56 (4.1%) | 0 (0.0%) |
| Total | 1,354 (100.0%) | 455 (100.0%) |
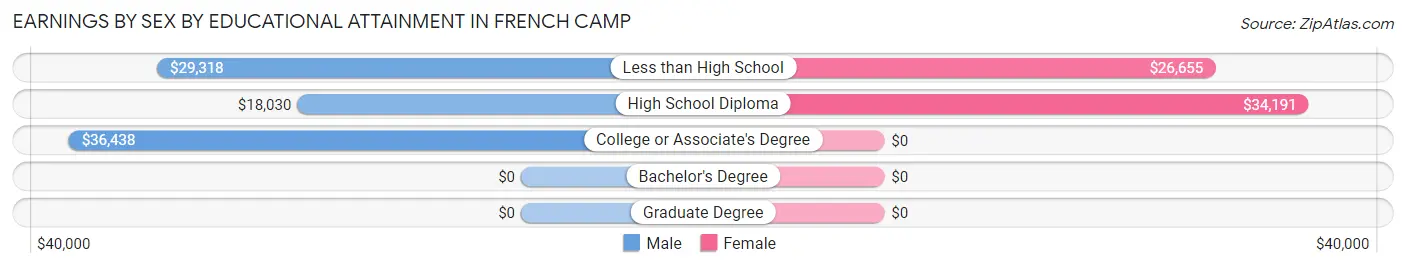
Earnings by Sex by Educational Attainment in French Camp
Average earnings in French Camp are $29,830 for men and $27,036 for women, a difference of 9.4%. Men with an educational attainment of college or associate's degree enjoy the highest average annual earnings of $36,438, while those with high school diploma education earn the least with $18,030. Women with an educational attainment of high school diploma earn the most with the average annual earnings of $34,191, while those with less than high school education have the smallest earnings of $26,655.
| Educational Attainment | Male Income | Female Income |
| Less than High School | $29,318 | $26,655 |
| High School Diploma | $18,030 | $34,191 |
| College or Associate's Degree | $36,438 | $0 |
| Bachelor's Degree | - | - |
| Graduate Degree | - | - |
| Total | $29,830 | $27,036 |
Family Income in French Camp
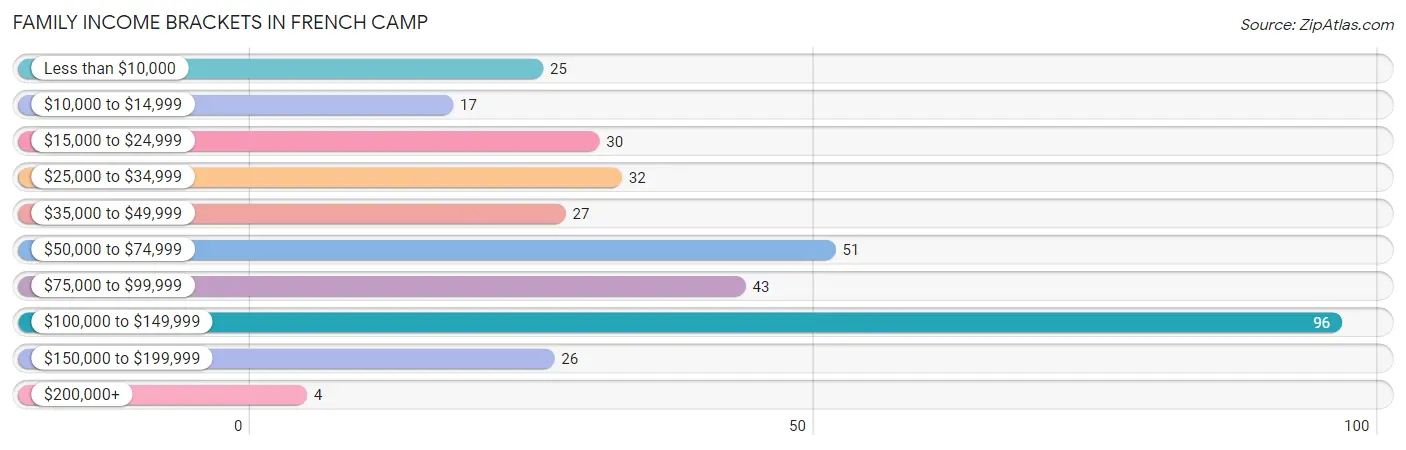
Family Income Brackets in French Camp
According to the French Camp family income data, there are 96 families falling into the $100,000 to $149,999 income range, which is the most common income bracket and makes up 27.4% of all families. Conversely, the $200,000+ income bracket is the least frequent group with only 4 families (1.1%) belonging to this category.
| Income Bracket | # Families | % Families |
| Less than $10,000 | 25 | 7.1% |
| $10,000 to $14,999 | 17 | 4.8% |
| $15,000 to $24,999 | 30 | 8.5% |
| $25,000 to $34,999 | 32 | 9.1% |
| $35,000 to $49,999 | 27 | 7.7% |
| $50,000 to $74,999 | 51 | 14.5% |
| $75,000 to $99,999 | 43 | 12.3% |
| $100,000 to $149,999 | 96 | 27.4% |
| $150,000 to $199,999 | 26 | 7.4% |
| $200,000+ | 4 | 1.1% |
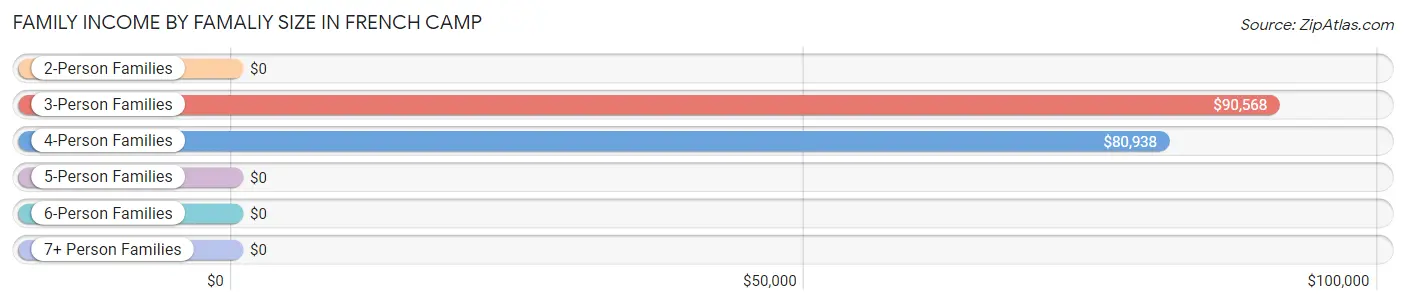
Family Income by Famaliy Size in French Camp
3-person families (21 | 6.0%) account for the highest median family income in French Camp with $90,568 per family, while 3-person families (21 | 6.0%) have the highest median income of $30,189 per family member.
| Income Bracket | # Families | Median Income |
| 2-Person Families | 170 (48.4%) | $0 |
| 3-Person Families | 21 (6.0%) | $90,568 |
| 4-Person Families | 28 (8.0%) | $80,938 |
| 5-Person Families | 45 (12.8%) | $0 |
| 6-Person Families | 71 (20.2%) | $0 |
| 7+ Person Families | 16 (4.6%) | $0 |
| Total | 351 (100.0%) | $68,194 |
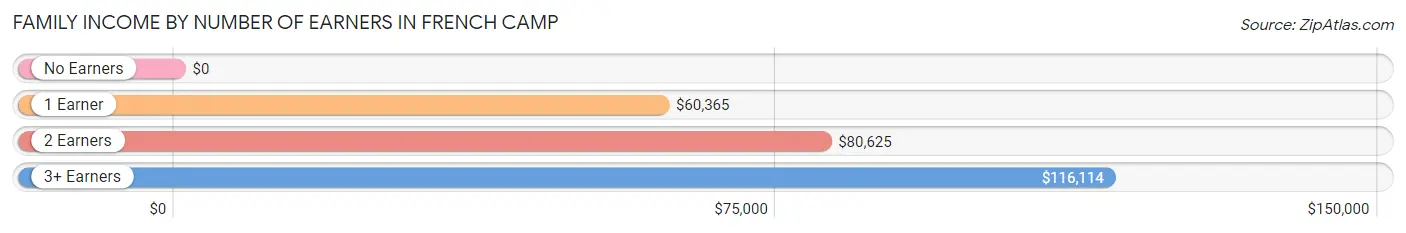
Family Income by Number of Earners in French Camp
| Number of Earners | # Families | Median Income |
| No Earners | 83 (23.6%) | $0 |
| 1 Earner | 107 (30.5%) | $60,365 |
| 2 Earners | 80 (22.8%) | $80,625 |
| 3+ Earners | 81 (23.1%) | $116,114 |
| Total | 351 (100.0%) | $68,194 |
Household Income in French Camp
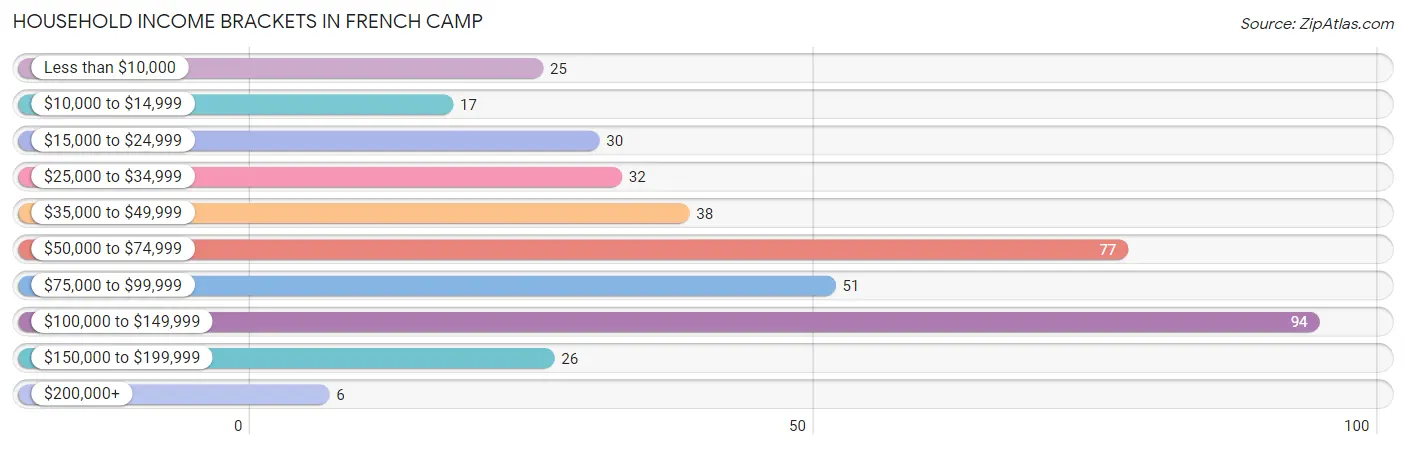
Household Income Brackets in French Camp
With 94 households falling in the category, the $100,000 to $149,999 income range is the most frequent in French Camp, accounting for 23.7% of all households. In contrast, only 6 households (1.5%) fall into the $200,000+ income bracket, making it the least populous group.
| Income Bracket | # Households | % Households |
| Less than $10,000 | 25 | 6.3% |
| $10,000 to $14,999 | 17 | 4.3% |
| $15,000 to $24,999 | 30 | 7.6% |
| $25,000 to $34,999 | 32 | 8.1% |
| $35,000 to $49,999 | 38 | 9.6% |
| $50,000 to $74,999 | 77 | 19.4% |
| $75,000 to $99,999 | 51 | 12.9% |
| $100,000 to $149,999 | 94 | 23.7% |
| $150,000 to $199,999 | 26 | 6.6% |
| $200,000+ | 6 | 1.5% |
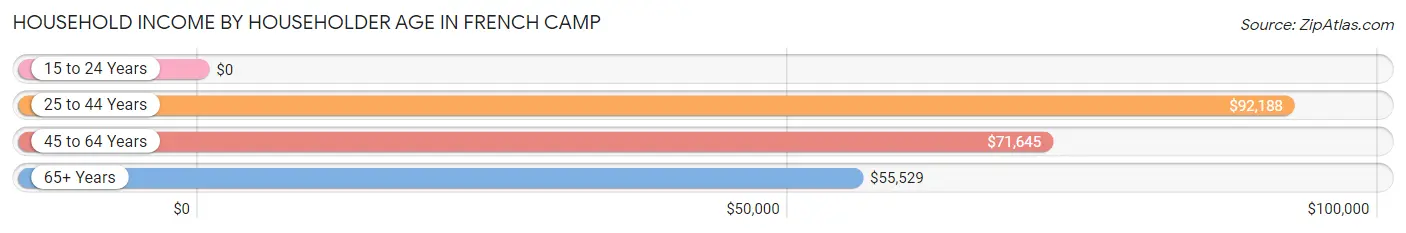
Household Income by Householder Age in French Camp
The median household income in French Camp is $69,444, with the highest median household income of $92,188 found in the 25 to 44 years age bracket for the primary householder. A total of 126 households (31.8%) fall into this category. Meanwhile, the 15 to 24 years age bracket for the primary householder has the lowest median household income of $0, with 16 households (4.0%) in this group.
| Income Bracket | # Households | Median Income |
| 15 to 24 Years | 16 (4.0%) | $0 |
| 25 to 44 Years | 126 (31.8%) | $92,188 |
| 45 to 64 Years | 137 (34.6%) | $71,645 |
| 65+ Years | 117 (29.5%) | $55,529 |
| Total | 396 (100.0%) | $69,444 |
Poverty in French Camp
Income Below Poverty by Sex and Age in French Camp
With 16.8% poverty level for males and 34.0% for females among the residents of French Camp, 18 to 24 year old males and 15 year old females are the most vulnerable to poverty, with 16 males (100.0%) and 51 females (100.0%) in their respective age groups living below the poverty level.
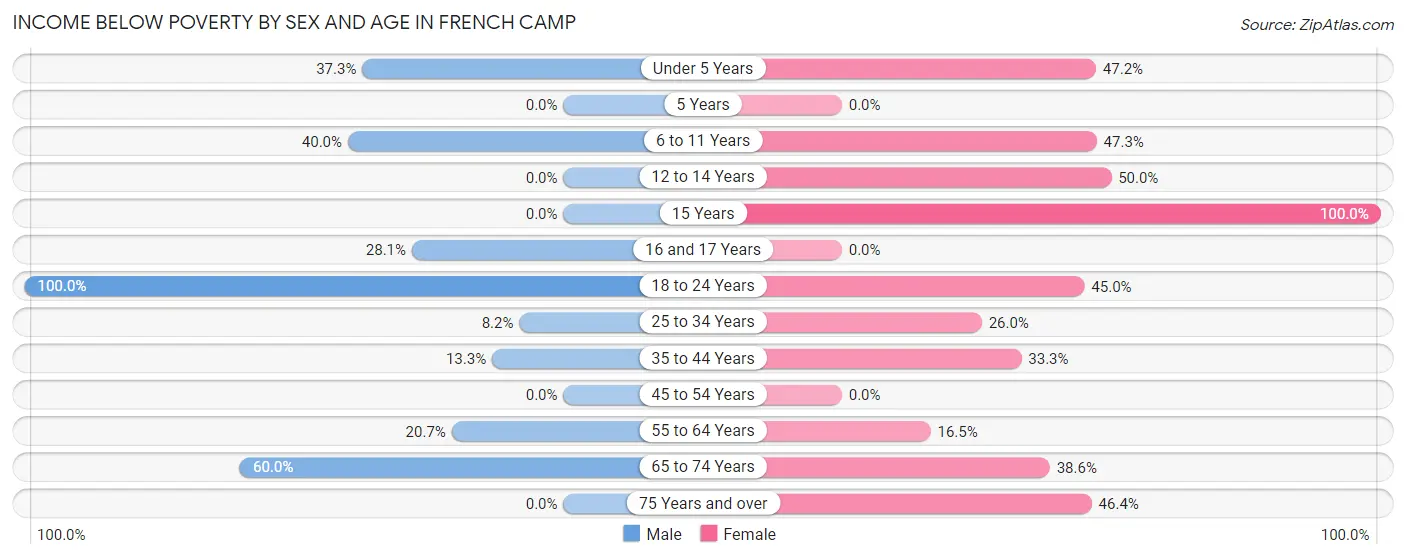
| Age Bracket | Male | Female |
| Under 5 Years | 28 (37.3%) | 25 (47.2%) |
| 5 Years | 0 (0.0%) | 0 (0.0%) |
| 6 to 11 Years | 18 (40.0%) | 44 (47.3%) |
| 12 to 14 Years | 0 (0.0%) | 10 (50.0%) |
| 15 Years | 0 (0.0%) | 51 (100.0%) |
| 16 and 17 Years | 9 (28.1%) | 0 (0.0%) |
| 18 to 24 Years | 16 (100.0%) | 68 (45.0%) |
| 25 to 34 Years | 29 (8.2%) | 47 (26.0%) |
| 35 to 44 Years | 22 (13.3%) | 42 (33.3%) |
| 45 to 54 Years | 0 (0.0%) | 0 (0.0%) |
| 55 to 64 Years | 68 (20.7%) | 28 (16.5%) |
| 65 to 74 Years | 30 (60.0%) | 22 (38.6%) |
| 75 Years and over | 0 (0.0%) | 32 (46.4%) |
| Total | 220 (16.8%) | 369 (34.0%) |
Income Above Poverty by Sex and Age in French Camp
According to the poverty statistics in French Camp, males aged 5 years and females aged 5 years are the age groups that are most secure financially, with 100.0% of males and 100.0% of females in these age groups living above the poverty line.
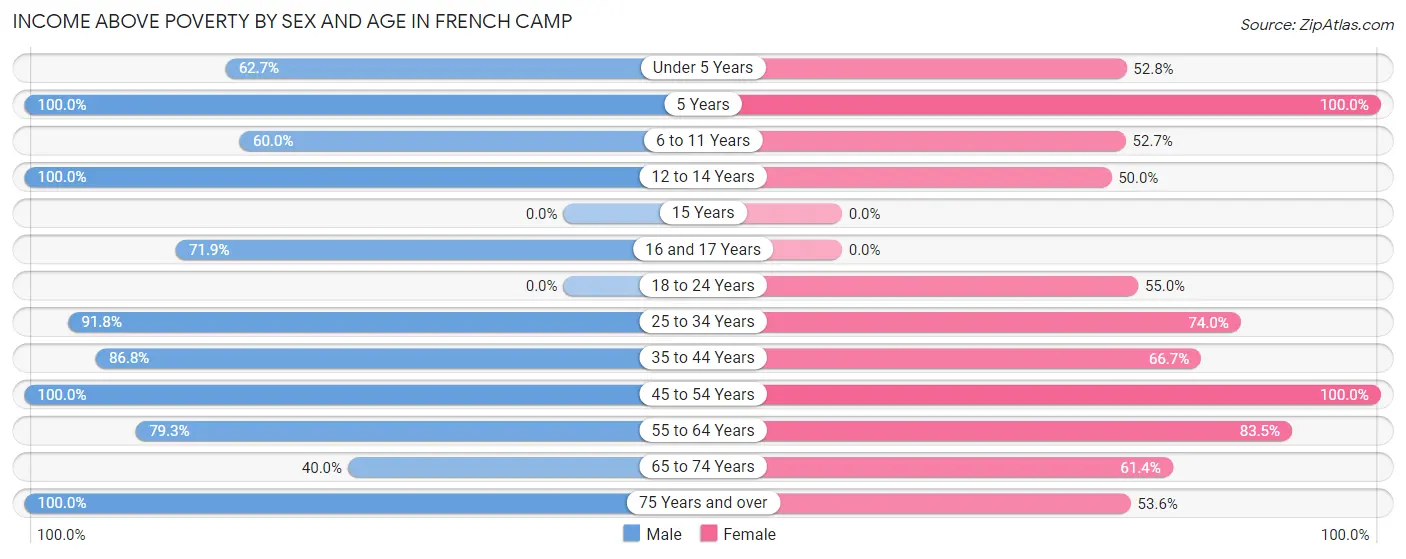
| Age Bracket | Male | Female |
| Under 5 Years | 47 (62.7%) | 28 (52.8%) |
| 5 Years | 16 (100.0%) | 20 (100.0%) |
| 6 to 11 Years | 27 (60.0%) | 49 (52.7%) |
| 12 to 14 Years | 37 (100.0%) | 10 (50.0%) |
| 15 Years | 0 (0.0%) | 0 (0.0%) |
| 16 and 17 Years | 23 (71.9%) | 0 (0.0%) |
| 18 to 24 Years | 0 (0.0%) | 83 (55.0%) |
| 25 to 34 Years | 326 (91.8%) | 134 (74.0%) |
| 35 to 44 Years | 144 (86.8%) | 84 (66.7%) |
| 45 to 54 Years | 110 (100.0%) | 95 (100.0%) |
| 55 to 64 Years | 260 (79.3%) | 142 (83.5%) |
| 65 to 74 Years | 20 (40.0%) | 35 (61.4%) |
| 75 Years and over | 81 (100.0%) | 37 (53.6%) |
| Total | 1,091 (83.2%) | 717 (66.0%) |
Income Below Poverty Among Married-Couple Families in French Camp
The poverty statistics for married-couple families in French Camp show that 20.1% or 55 of the total 274 families live below the poverty line. Families with 5 or more children have the highest poverty rate of 56.2%, comprising of 9 families. On the other hand, families with 1 or 2 children have the lowest poverty rate of 0.0%, which includes 0 families.
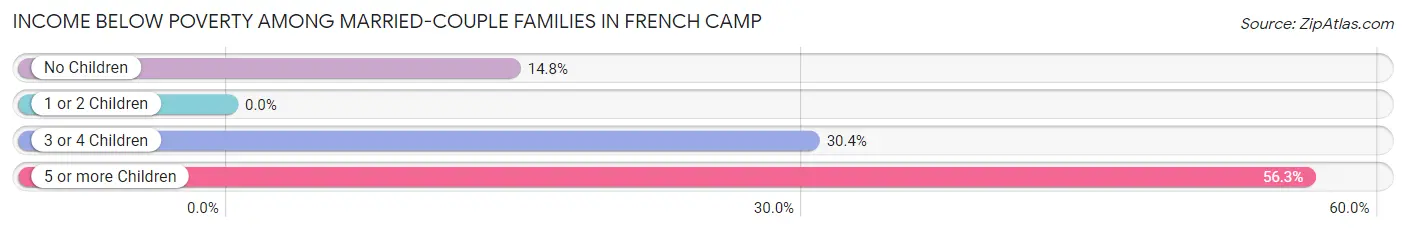
| Children | Above Poverty | Below Poverty |
| No Children | 127 (85.2%) | 22 (14.8%) |
| 1 or 2 Children | 30 (100.0%) | 0 (0.0%) |
| 3 or 4 Children | 55 (69.6%) | 24 (30.4%) |
| 5 or more Children | 7 (43.8%) | 9 (56.2%) |
| Total | 219 (79.9%) | 55 (20.1%) |
Income Below Poverty Among Single-Parent Households in French Camp
According to the poverty data in French Camp, 63.0% or 17 single-father households and 26.0% or 13 single-mother households are living below the poverty line. Among single-father households, those with no children have the highest poverty rate, with 17 households (100.0%) experiencing poverty. Likewise, among single-mother households, those with no children have the highest poverty rate, with 13 households (33.3%) falling below the poverty line.
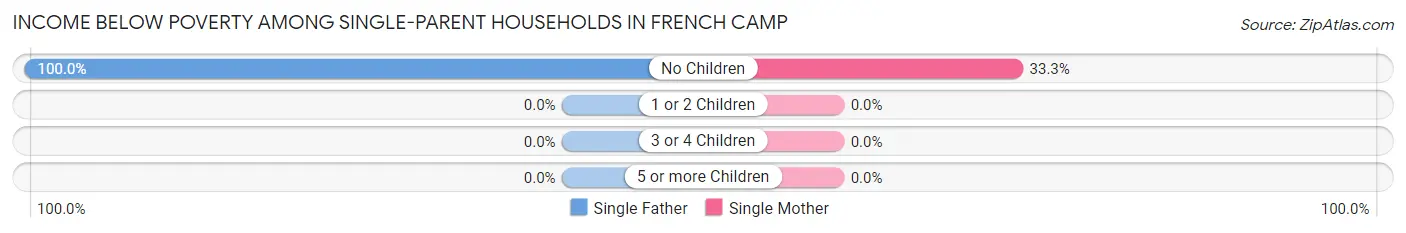
| Children | Single Father | Single Mother |
| No Children | 17 (100.0%) | 13 (33.3%) |
| 1 or 2 Children | 0 (0.0%) | 0 (0.0%) |
| 3 or 4 Children | 0 (0.0%) | 0 (0.0%) |
| 5 or more Children | 0 (0.0%) | 0 (0.0%) |
| Total | 17 (63.0%) | 13 (26.0%) |
Income Below Poverty Among Married-Couple vs Single-Parent Households in French Camp
The poverty data for French Camp shows that 55 of the married-couple family households (20.1%) and 30 of the single-parent households (39.0%) are living below the poverty level. Within the married-couple family households, those with 5 or more children have the highest poverty rate, with 9 households (56.2%) falling below the poverty line. Among the single-parent households, those with no children have the highest poverty rate, with 30 household (53.6%) living below poverty.
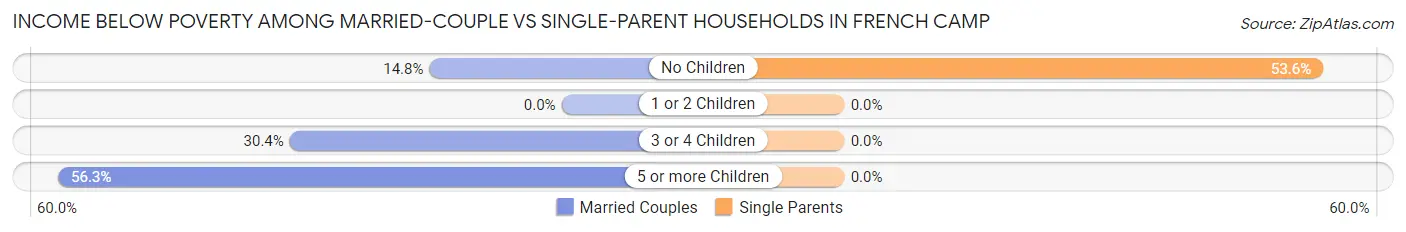
| Children | Married-Couple Families | Single-Parent Households |
| No Children | 22 (14.8%) | 30 (53.6%) |
| 1 or 2 Children | 0 (0.0%) | 0 (0.0%) |
| 3 or 4 Children | 24 (30.4%) | 0 (0.0%) |
| 5 or more Children | 9 (56.2%) | 0 (0.0%) |
| Total | 55 (20.1%) | 30 (39.0%) |
Race in French Camp
The most populous races in French Camp are Hispanic or Latino (2,355 | 61.0%), White / Caucasian (2,031 | 52.6%), and Two or more Races (1,029 | 26.7%).
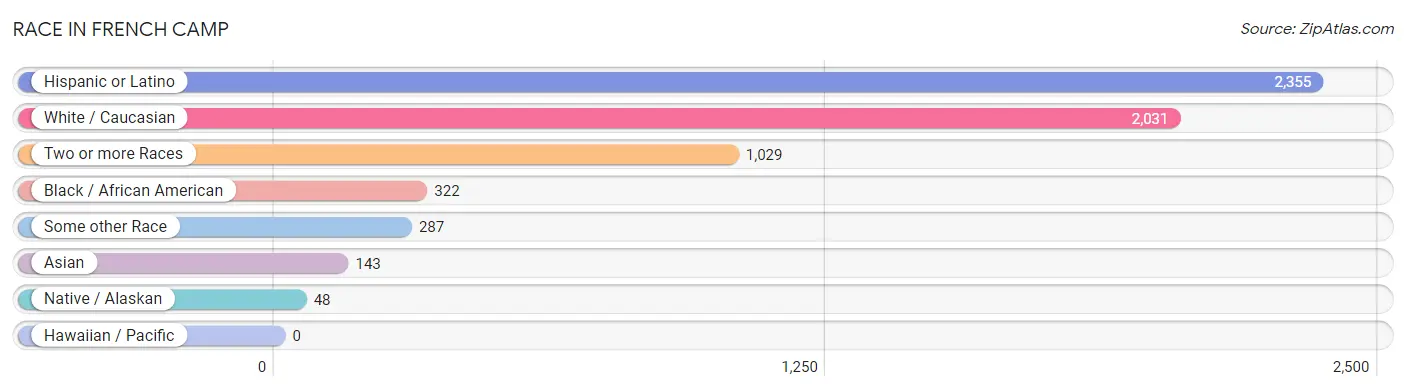
| Race | # Population | % Population |
| Asian | 143 | 3.7% |
| Black / African American | 322 | 8.3% |
| Hawaiian / Pacific | 0 | 0.0% |
| Hispanic or Latino | 2,355 | 61.0% |
| Native / Alaskan | 48 | 1.2% |
| White / Caucasian | 2,031 | 52.6% |
| Two or more Races | 1,029 | 26.7% |
| Some other Race | 287 | 7.4% |
| Total | 3,860 | 100.0% |
Ancestry in French Camp
The most populous ancestries reported in French Camp are Mexican (2,121 | 54.9%), German (280 | 7.2%), Cherokee (157 | 4.1%), Irish (128 | 3.3%), and Central American (126 | 3.3%), together accounting for 72.8% of all French Camp residents.
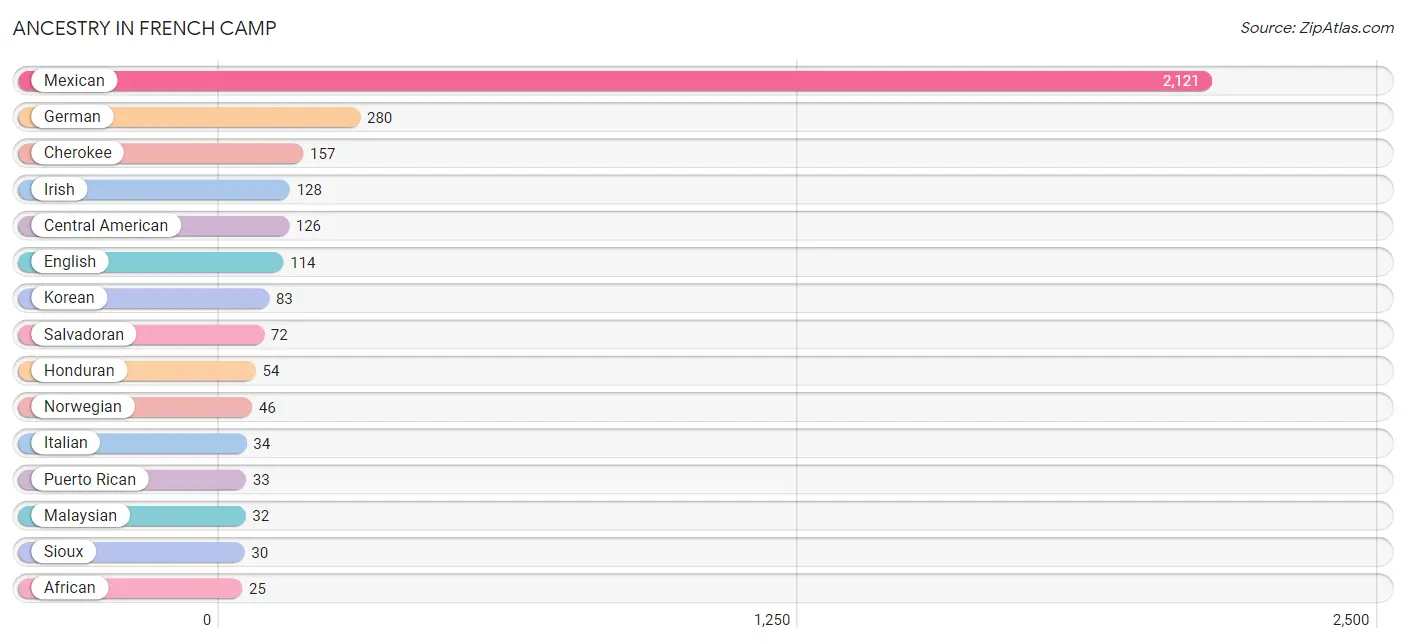
| Ancestry | # Population | % Population |
| African | 25 | 0.6% |
| Albanian | 10 | 0.3% |
| Apache | 23 | 0.6% |
| Arab | 23 | 0.6% |
| Basque | 6 | 0.2% |
| Bhutanese | 17 | 0.4% |
| Blackfeet | 23 | 0.6% |
| Cajun | 2 | 0.1% |
| Central American | 126 | 3.3% |
| Cherokee | 157 | 4.1% |
| Czechoslovakian | 5 | 0.1% |
| Ecuadorian | 2 | 0.1% |
| English | 114 | 2.9% |
| European | 19 | 0.5% |
| French | 16 | 0.4% |
| French Canadian | 2 | 0.1% |
| German | 280 | 7.2% |
| Honduran | 54 | 1.4% |
| Indian (Asian) | 23 | 0.6% |
| Irish | 128 | 3.3% |
| Italian | 34 | 0.9% |
| Japanese | 14 | 0.4% |
| Kiowa | 2 | 0.1% |
| Korean | 83 | 2.1% |
| Lebanese | 23 | 0.6% |
| Malaysian | 32 | 0.8% |
| Mexican | 2,121 | 54.9% |
| Norwegian | 46 | 1.2% |
| Portuguese | 21 | 0.5% |
| Puerto Rican | 33 | 0.9% |
| Russian | 8 | 0.2% |
| Salvadoran | 72 | 1.9% |
| Scottish | 25 | 0.6% |
| Sioux | 30 | 0.8% |
| South American | 2 | 0.1% |
| Spanish | 7 | 0.2% |
| Sri Lankan | 23 | 0.6% |
| Subsaharan African | 25 | 0.6% |
| Swedish | 12 | 0.3% |
| Thai | 23 | 0.6% |
| Yugoslavian | 7 | 0.2% | View All 41 Rows |
Immigrants in French Camp
The most numerous immigrant groups reported in French Camp came from Central America (1,442 | 37.4%), Latin America (1,442 | 37.4%), Mexico (1,328 | 34.4%), El Salvador (55 | 1.4%), and Honduras (54 | 1.4%), together accounting for 111.9% of all French Camp residents.
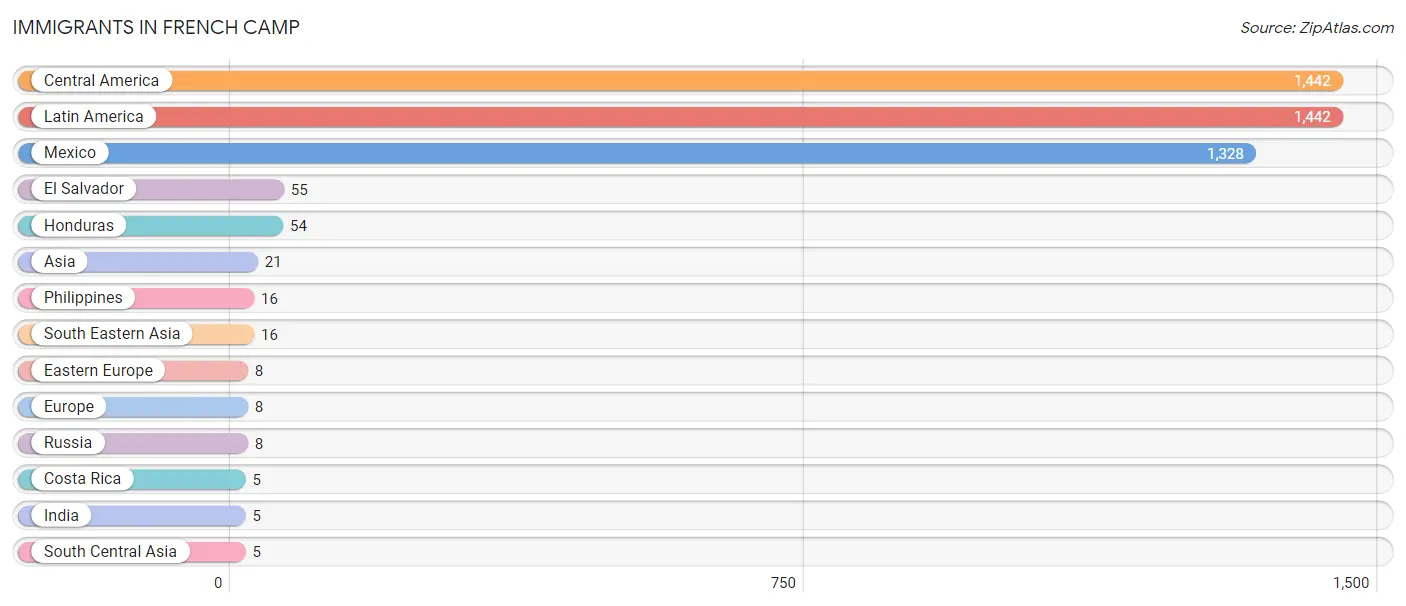
| Immigration Origin | # Population | % Population |
| Asia | 21 | 0.5% |
| Central America | 1,442 | 37.4% |
| Costa Rica | 5 | 0.1% |
| Eastern Europe | 8 | 0.2% |
| El Salvador | 55 | 1.4% |
| Europe | 8 | 0.2% |
| Honduras | 54 | 1.4% |
| India | 5 | 0.1% |
| Latin America | 1,442 | 37.4% |
| Mexico | 1,328 | 34.4% |
| Philippines | 16 | 0.4% |
| Russia | 8 | 0.2% |
| South Central Asia | 5 | 0.1% |
| South Eastern Asia | 16 | 0.4% | View All 14 Rows |
Sex and Age in French Camp
Sex and Age in French Camp
The most populous age groups in French Camp are 30 to 34 Years (406 | 15.1%) for men and 25 to 29 Years (163 | 13.8%) for women.
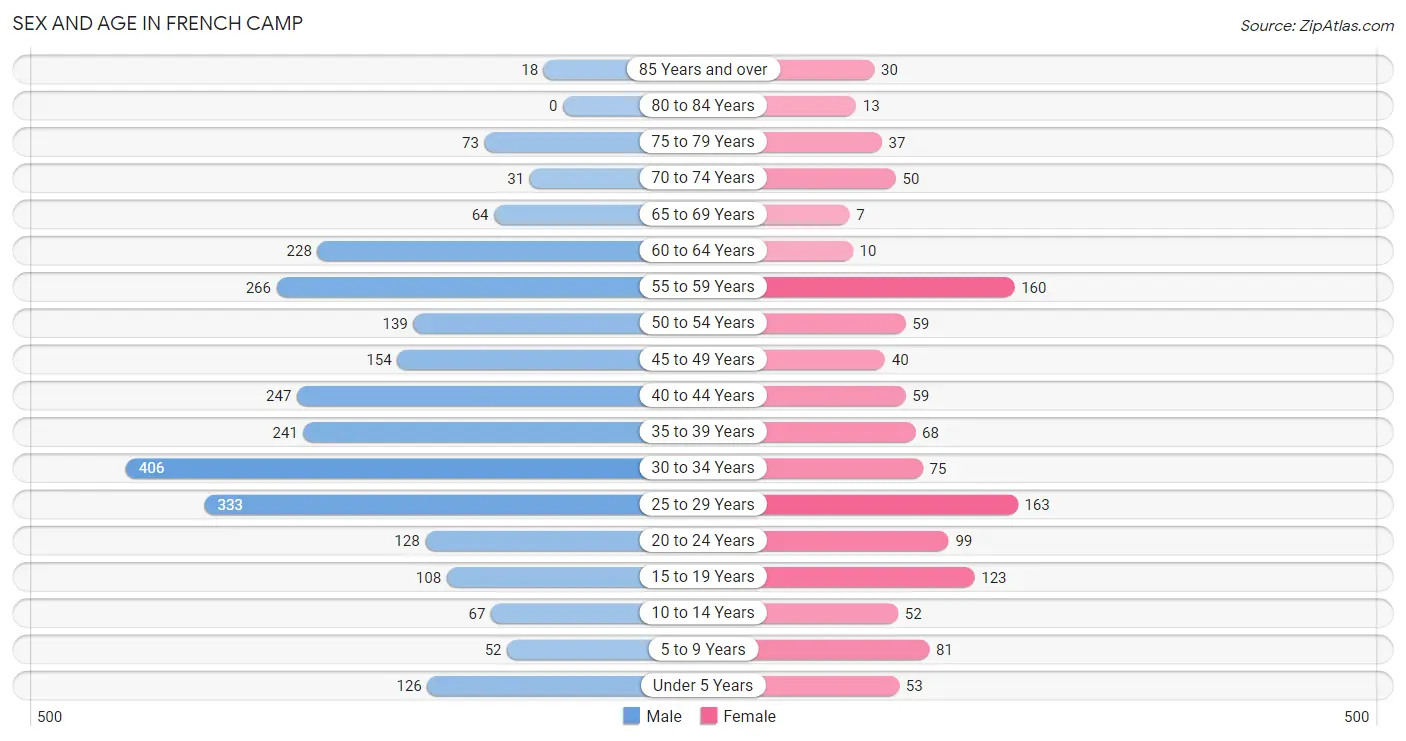
| Age Bracket | Male | Female |
| Under 5 Years | 126 (4.7%) | 53 (4.5%) |
| 5 to 9 Years | 52 (1.9%) | 81 (6.9%) |
| 10 to 14 Years | 67 (2.5%) | 52 (4.4%) |
| 15 to 19 Years | 108 (4.0%) | 123 (10.4%) |
| 20 to 24 Years | 128 (4.8%) | 99 (8.4%) |
| 25 to 29 Years | 333 (12.4%) | 163 (13.8%) |
| 30 to 34 Years | 406 (15.1%) | 75 (6.4%) |
| 35 to 39 Years | 241 (9.0%) | 68 (5.8%) |
| 40 to 44 Years | 247 (9.2%) | 59 (5.0%) |
| 45 to 49 Years | 154 (5.7%) | 40 (3.4%) |
| 50 to 54 Years | 139 (5.2%) | 59 (5.0%) |
| 55 to 59 Years | 266 (9.9%) | 160 (13.6%) |
| 60 to 64 Years | 228 (8.5%) | 10 (0.9%) |
| 65 to 69 Years | 64 (2.4%) | 7 (0.6%) |
| 70 to 74 Years | 31 (1.2%) | 50 (4.2%) |
| 75 to 79 Years | 73 (2.7%) | 37 (3.1%) |
| 80 to 84 Years | 0 (0.0%) | 13 (1.1%) |
| 85 Years and over | 18 (0.7%) | 30 (2.5%) |
| Total | 2,681 (100.0%) | 1,179 (100.0%) |
Families and Households in French Camp
Median Family Size in French Camp
The median family size in French Camp is 3.57 persons per family, with married-couple families (274 | 78.1%) accounting for the largest median family size of 3.66 persons per family. On the other hand, single male/father families (27 | 7.7%) represent the smallest median family size with 2.70 persons per family.
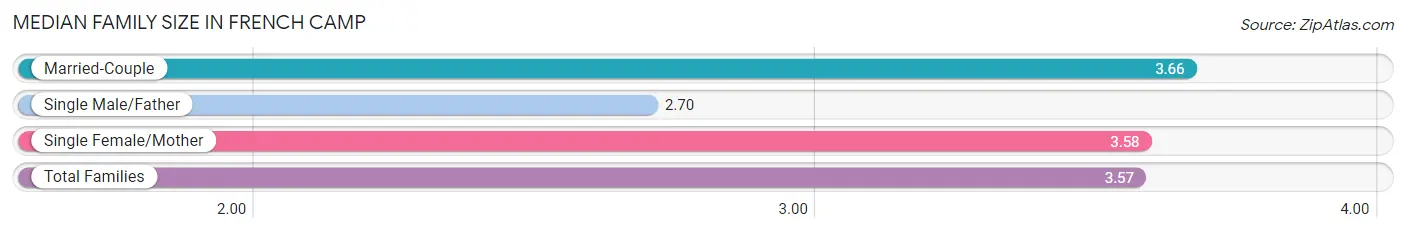
| Family Type | # Families | Family Size |
| Married-Couple | 274 (78.1%) | 3.66 |
| Single Male/Father | 27 (7.7%) | 2.70 |
| Single Female/Mother | 50 (14.2%) | 3.58 |
| Total Families | 351 (100.0%) | 3.57 |
Median Household Size in French Camp
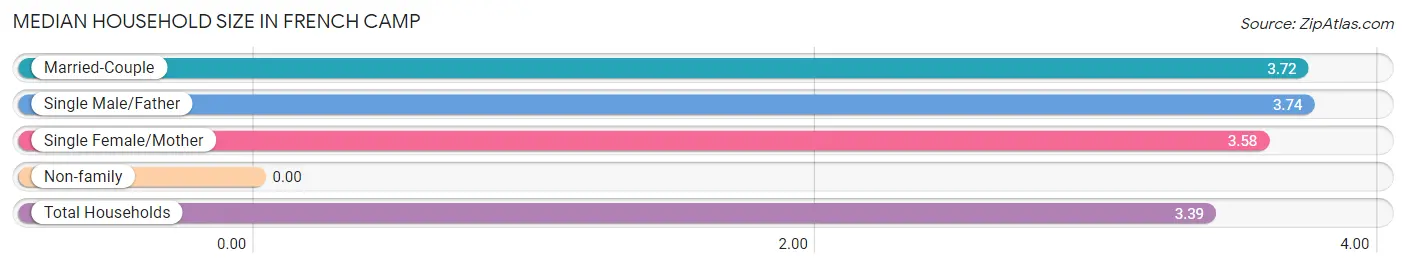
| Household Type | # Households | Household Size |
| Married-Couple | 274 (69.2%) | 3.72 |
| Single Male/Father | 27 (6.8%) | 3.74 |
| Single Female/Mother | 50 (12.6%) | 3.58 |
| Non-family | 45 (11.4%) | - |
| Total Households | 396 (100.0%) | 3.39 |
Household Size by Marriage Status in French Camp
Out of a total of 396 households in French Camp, 351 (88.6%) are family households, while 45 (11.4%) are nonfamily households. The most numerous type of family households are 2-person households, comprising 142, and the most common type of nonfamily households are 1-person households, comprising 45.
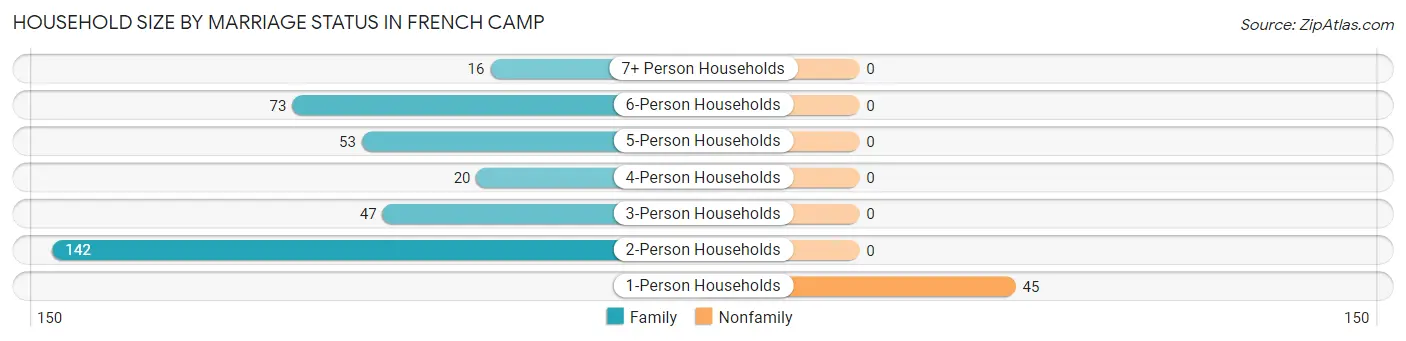
| Household Size | Family Households | Nonfamily Households |
| 1-Person Households | - | 45 (11.4%) |
| 2-Person Households | 142 (35.9%) | 0 (0.0%) |
| 3-Person Households | 47 (11.9%) | 0 (0.0%) |
| 4-Person Households | 20 (5.1%) | 0 (0.0%) |
| 5-Person Households | 53 (13.4%) | 0 (0.0%) |
| 6-Person Households | 73 (18.4%) | 0 (0.0%) |
| 7+ Person Households | 16 (4.0%) | 0 (0.0%) |
| Total | 351 (88.6%) | 45 (11.4%) |
Female Fertility in French Camp
Fertility by Age in French Camp
Average fertility rate in French Camp is 47.0 births per 1,000 women. Women in the age bracket of 20 to 34 years have the highest fertility rate with 92.0 births per 1,000 women. Women in the age bracket of 20 to 34 years acount for 100.0% of all women with births.
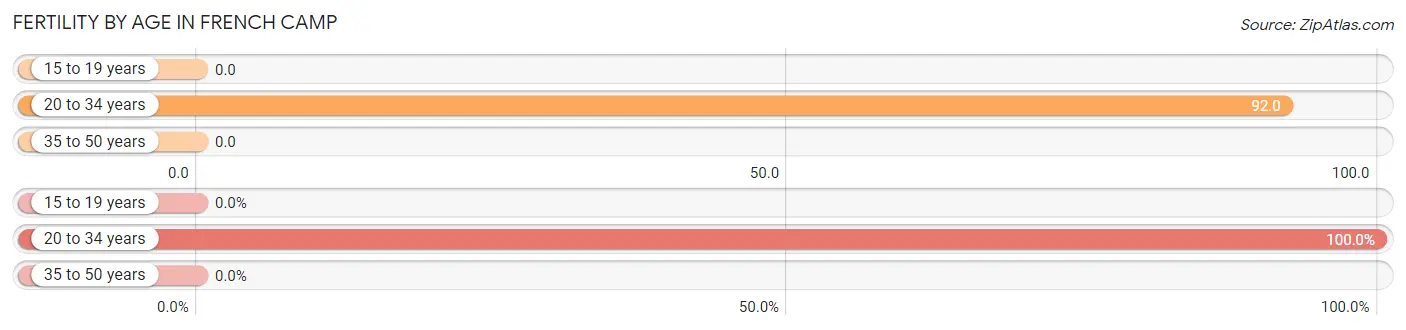
| Age Bracket | Women with Births | Births / 1,000 Women |
| 15 to 19 years | 0 (0.0%) | 0.0 |
| 20 to 34 years | 31 (100.0%) | 92.0 |
| 35 to 50 years | 0 (0.0%) | 0.0 |
| Total | 31 (100.0%) | 47.0 |
Fertility by Age by Marriage Status in French Camp
77.4% of women with births (31) in French Camp are married. The highest percentage of unmarried women with births falls into 20 to 34 years age bracket with 22.6% of them unmarried at the time of birth, while the lowest percentage of unmarried women with births belong to 20 to 34 years age bracket with 22.6% of them unmarried.
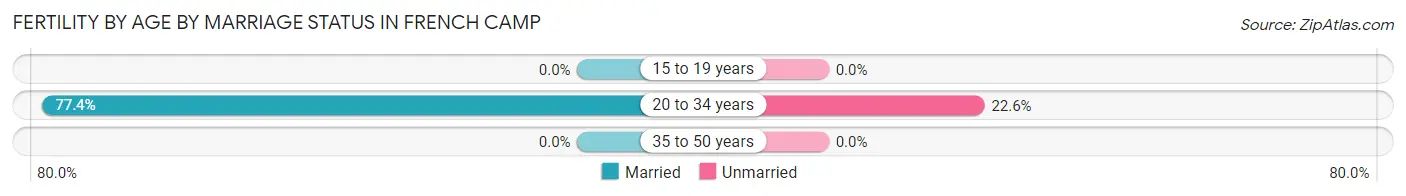
| Age Bracket | Married | Unmarried |
| 15 to 19 years | 0 (0.0%) | 0 (0.0%) |
| 20 to 34 years | 24 (77.4%) | 7 (22.6%) |
| 35 to 50 years | 0 (0.0%) | 0 (0.0%) |
| Total | 24 (77.4%) | 7 (22.6%) |
Fertility by Education in French Camp
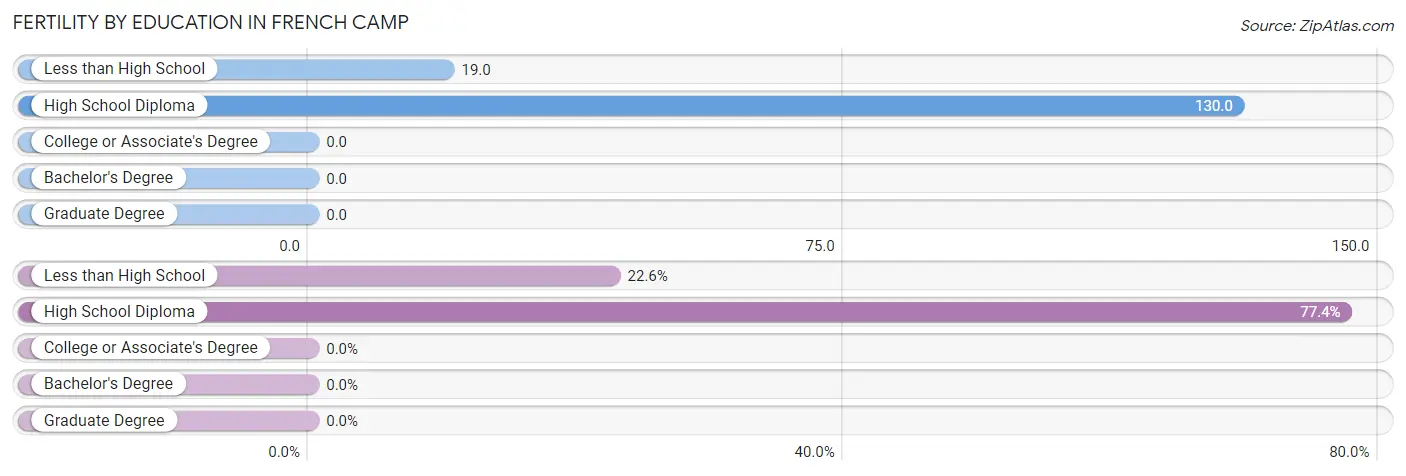
| Educational Attainment | Women with Births | Births / 1,000 Women |
| Less than High School | 7 (22.6%) | 19.0 |
| High School Diploma | 24 (77.4%) | 130.0 |
| College or Associate's Degree | 0 (0.0%) | 0.0 |
| Bachelor's Degree | 0 (0.0%) | 0.0 |
| Graduate Degree | 0 (0.0%) | 0.0 |
| Total | 31 (100.0%) | 47.0 |
Fertility by Education by Marriage Status in French Camp
22.6% of women with births in French Camp are unmarried. Women with the educational attainment of high school diploma are most likely to be married with 100.0% of them married at childbirth, while women with the educational attainment of less than high school are least likely to be married with 100.0% of them unmarried at childbirth.
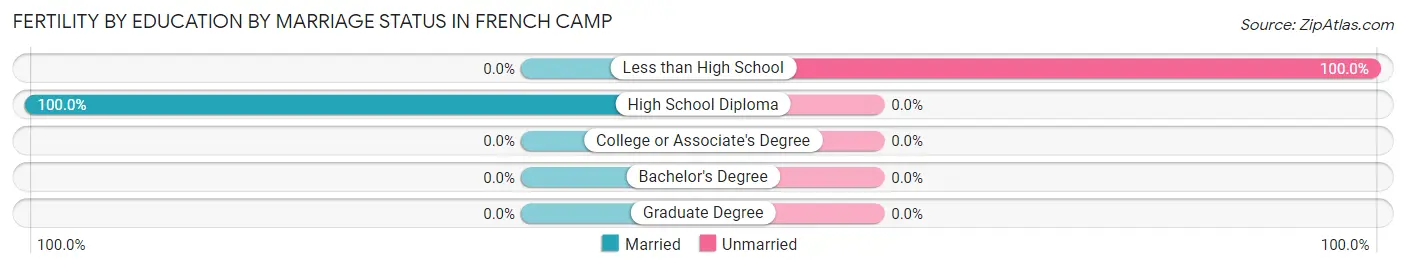
| Educational Attainment | Married | Unmarried |
| Less than High School | 0 (0.0%) | 7 (100.0%) |
| High School Diploma | 24 (100.0%) | 0 (0.0%) |
| College or Associate's Degree | 0 (0.0%) | 0 (0.0%) |
| Bachelor's Degree | 0 (0.0%) | 0 (0.0%) |
| Graduate Degree | 0 (0.0%) | 0 (0.0%) |
| Total | 24 (77.4%) | 7 (22.6%) |
Employment Characteristics in French Camp
Employment by Class of Employer in French Camp
Among the 1,341 employed individuals in French Camp, private company employees (1,214 | 90.5%), self-employed (not incorporated) (44 | 3.3%), and self-employed (incorporated) (31 | 2.3%) make up the most common classes of employment.
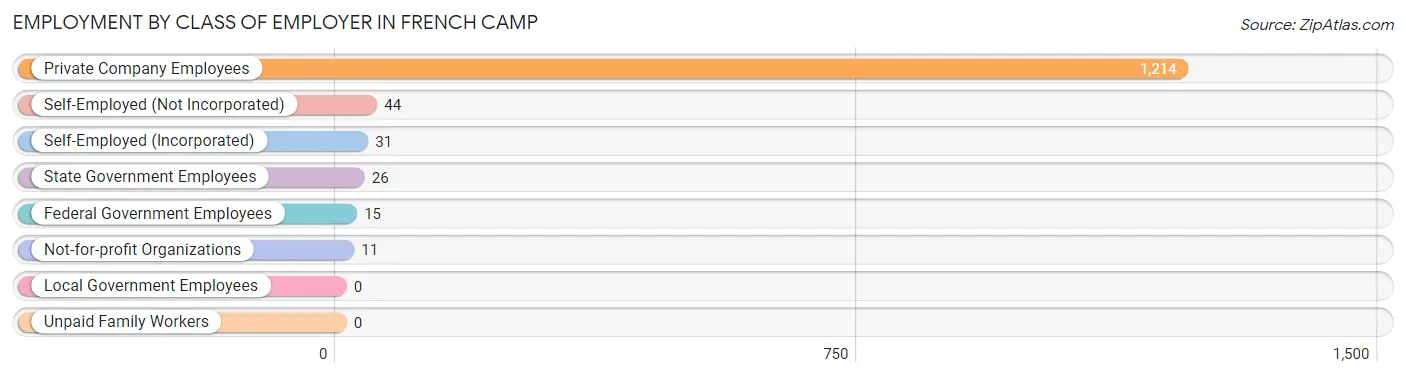
| Employer Class | # Employees | % Employees |
| Private Company Employees | 1,214 | 90.5% |
| Self-Employed (Incorporated) | 31 | 2.3% |
| Self-Employed (Not Incorporated) | 44 | 3.3% |
| Not-for-profit Organizations | 11 | 0.8% |
| Local Government Employees | 0 | 0.0% |
| State Government Employees | 26 | 1.9% |
| Federal Government Employees | 15 | 1.1% |
| Unpaid Family Workers | 0 | 0.0% |
| Total | 1,341 | 100.0% |
Employment Status by Age in French Camp
According to the labor force statistics for French Camp, out of the total population over 16 years of age (3,373), 41.2% or 1,390 individuals are in the labor force, with 1.8% or 25 of them unemployed. The age group with the highest labor force participation rate is 60 to 64 years, with 65.1% or 155 individuals in the labor force. Within the labor force, the 60 to 64 years age range has the highest percentage of unemployed individuals, with 11.0% or 17 of them being unemployed.
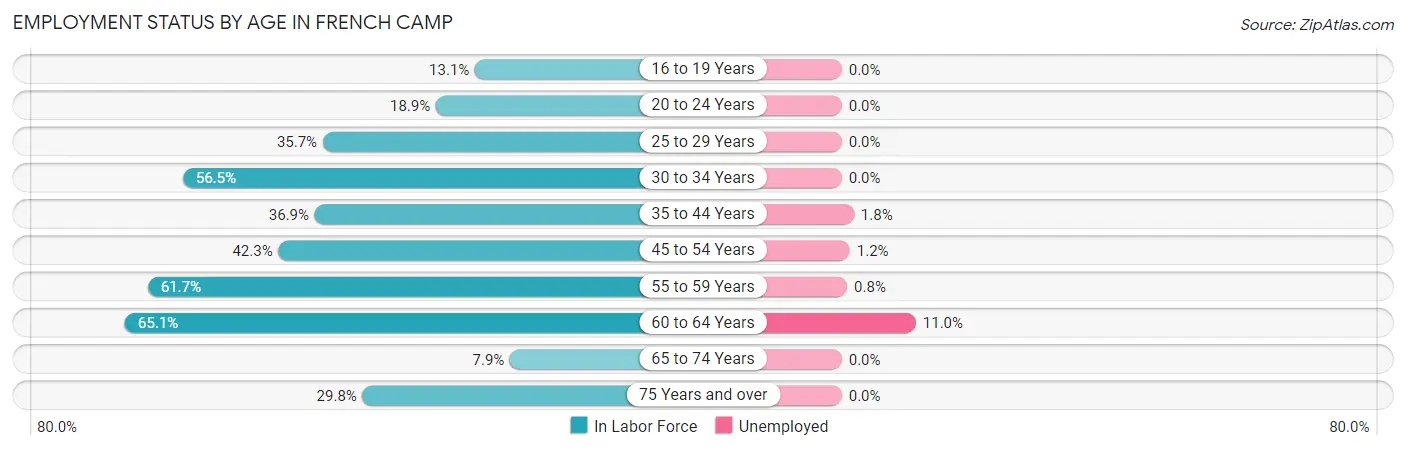
| Age Bracket | In Labor Force | Unemployed |
| 16 to 19 Years | 23 (13.1%) | 0 (0.0%) |
| 20 to 24 Years | 43 (18.9%) | 0 (0.0%) |
| 25 to 29 Years | 177 (35.7%) | 0 (0.0%) |
| 30 to 34 Years | 272 (56.5%) | 0 (0.0%) |
| 35 to 44 Years | 227 (36.9%) | 4 (1.8%) |
| 45 to 54 Years | 166 (42.3%) | 2 (1.2%) |
| 55 to 59 Years | 263 (61.7%) | 2 (0.8%) |
| 60 to 64 Years | 155 (65.1%) | 17 (11.0%) |
| 65 to 74 Years | 12 (7.9%) | 0 (0.0%) |
| 75 Years and over | 51 (29.8%) | 0 (0.0%) |
| Total | 1,390 (41.2%) | 25 (1.8%) |
Employment Status by Educational Attainment in French Camp
According to labor force statistics for French Camp, 47.6% of individuals (1,260) out of the total population between 25 and 64 years of age (2,648) are in the labor force, with 2.0% or 25 of them being unemployed. The group with the highest labor force participation rate are those with the educational attainment of less than high school, with 61.9% or 779 individuals in the labor force. Within the labor force, individuals with high school diploma education have the highest percentage of unemployment, with 7.0% or 15 of them being unemployed.
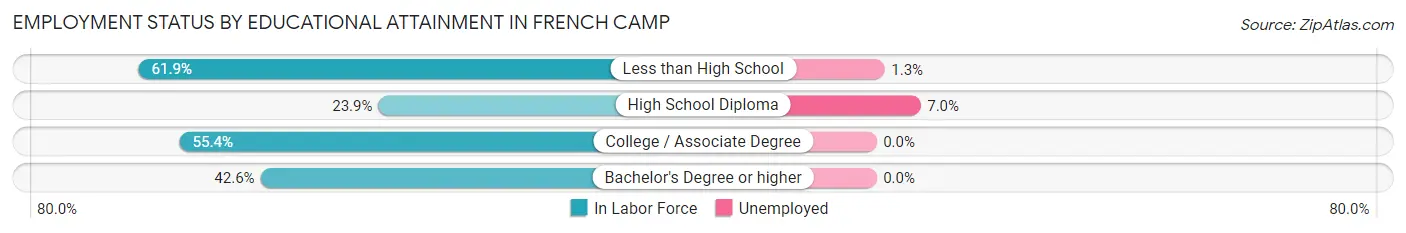
| Educational Attainment | In Labor Force | Unemployed |
| Less than High School | 779 (61.9%) | 16 (1.3%) |
| High School Diploma | 213 (23.9%) | 63 (7.0%) |
| College / Associate Degree | 245 (55.4%) | 0 (0.0%) |
| Bachelor's Degree or higher | 23 (42.6%) | 0 (0.0%) |
| Total | 1,260 (47.6%) | 53 (2.0%) |
Employment Occupations by Sex in French Camp
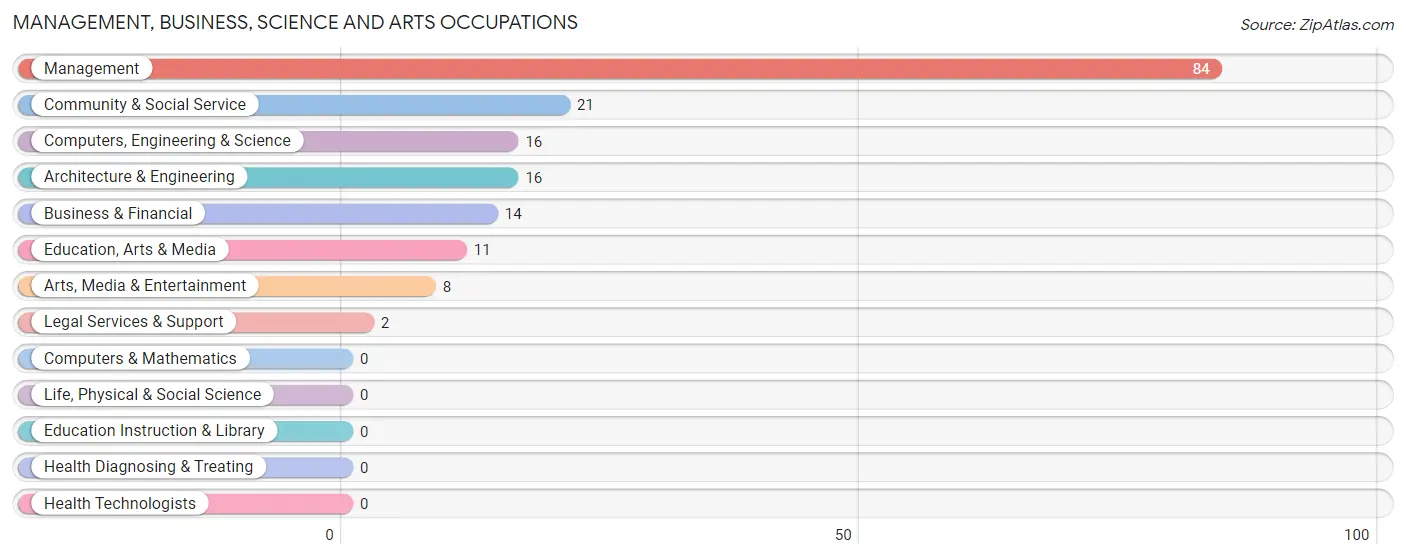
Management, Business, Science and Arts Occupations
The most common Management, Business, Science and Arts occupations in French Camp are Management (84 | 6.2%), Community & Social Service (21 | 1.5%), Computers, Engineering & Science (16 | 1.2%), Architecture & Engineering (16 | 1.2%), and Business & Financial (14 | 1.0%).
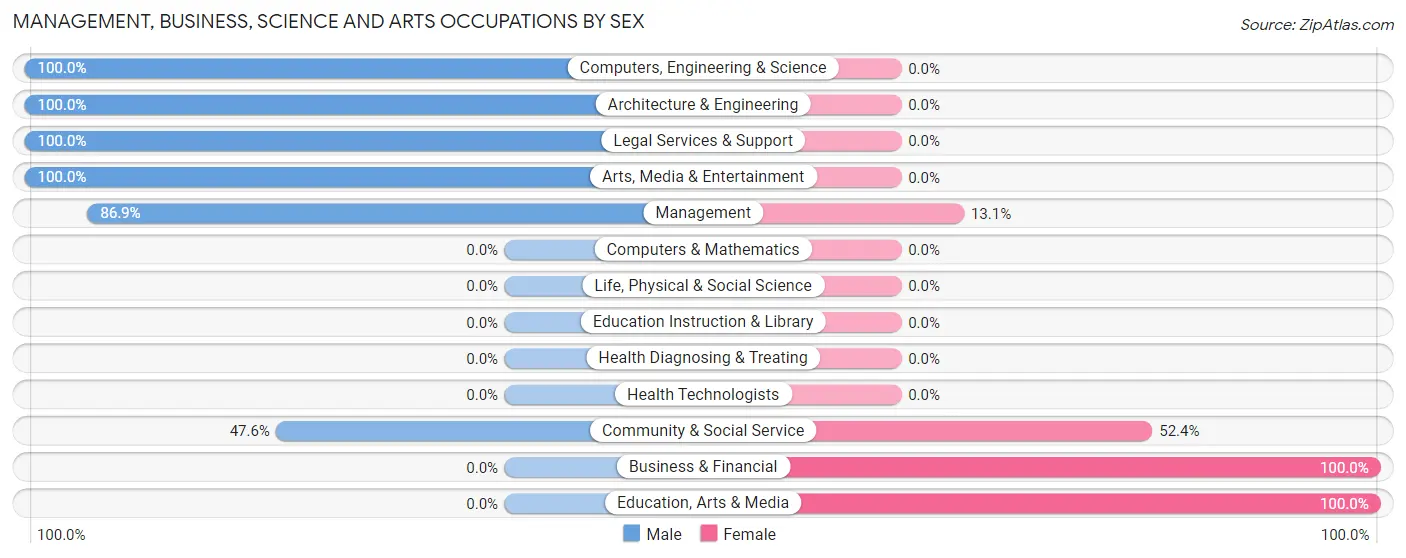
Management, Business, Science and Arts Occupations by Sex
Within the Management, Business, Science and Arts occupations in French Camp, the most male-oriented occupations are Computers, Engineering & Science (100.0%), Architecture & Engineering (100.0%), and Legal Services & Support (100.0%), while the most female-oriented occupations are Business & Financial (100.0%), Education, Arts & Media (100.0%), and Community & Social Service (52.4%).
| Occupation | Male | Female |
| Management | 73 (86.9%) | 11 (13.1%) |
| Business & Financial | 0 (0.0%) | 14 (100.0%) |
| Computers, Engineering & Science | 16 (100.0%) | 0 (0.0%) |
| Computers & Mathematics | 0 (0.0%) | 0 (0.0%) |
| Architecture & Engineering | 16 (100.0%) | 0 (0.0%) |
| Life, Physical & Social Science | 0 (0.0%) | 0 (0.0%) |
| Community & Social Service | 10 (47.6%) | 11 (52.4%) |
| Education, Arts & Media | 0 (0.0%) | 11 (100.0%) |
| Legal Services & Support | 2 (100.0%) | 0 (0.0%) |
| Education Instruction & Library | 0 (0.0%) | 0 (0.0%) |
| Arts, Media & Entertainment | 8 (100.0%) | 0 (0.0%) |
| Health Diagnosing & Treating | 0 (0.0%) | 0 (0.0%) |
| Health Technologists | 0 (0.0%) | 0 (0.0%) |
| Total (Category) | 99 (73.3%) | 36 (26.7%) |
| Total (Overall) | 924 (67.7%) | 440 (32.3%) |
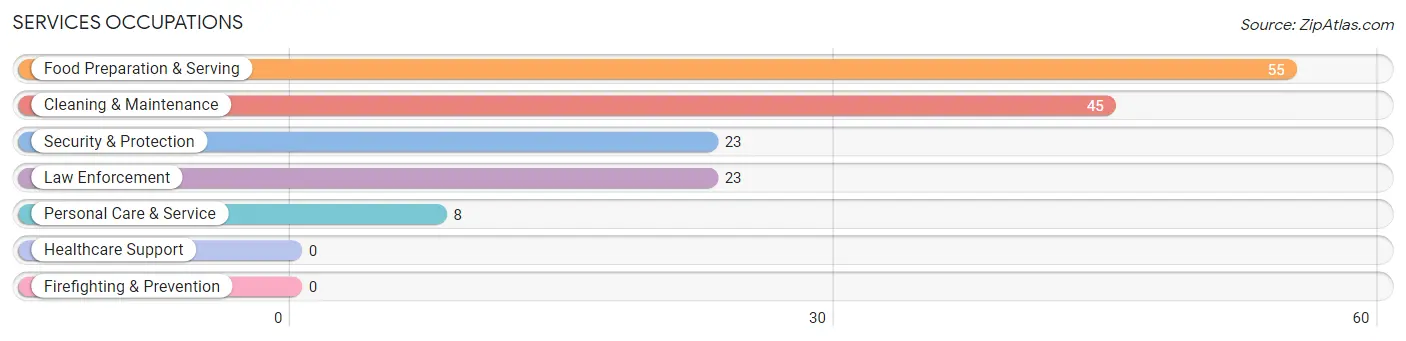
Services Occupations
The most common Services occupations in French Camp are Food Preparation & Serving (55 | 4.0%), Cleaning & Maintenance (45 | 3.3%), Security & Protection (23 | 1.7%), Law Enforcement (23 | 1.7%), and Personal Care & Service (8 | 0.6%).
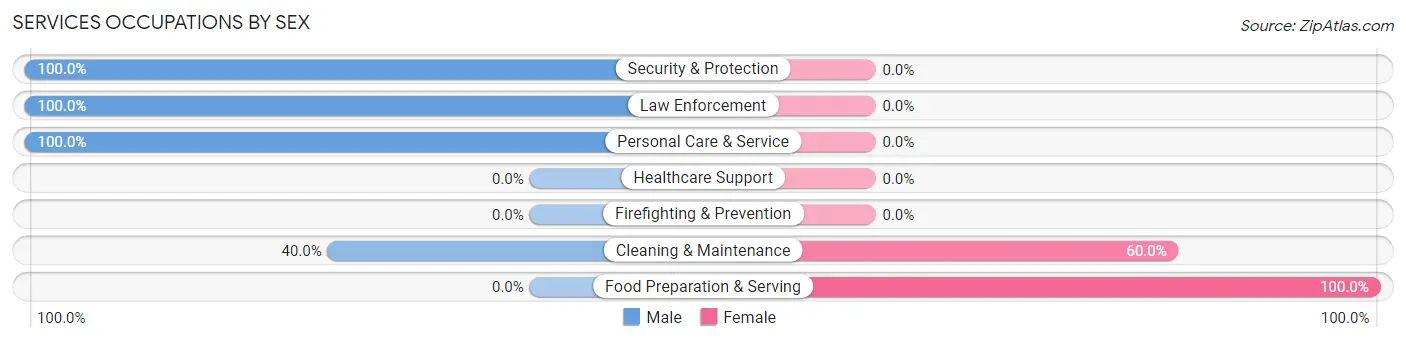
Services Occupations by Sex
Within the Services occupations in French Camp, the most male-oriented occupations are Security & Protection (100.0%), Law Enforcement (100.0%), and Personal Care & Service (100.0%), while the most female-oriented occupations are Food Preparation & Serving (100.0%), and Cleaning & Maintenance (60.0%).
| Occupation | Male | Female |
| Healthcare Support | 0 (0.0%) | 0 (0.0%) |
| Security & Protection | 23 (100.0%) | 0 (0.0%) |
| Firefighting & Prevention | 0 (0.0%) | 0 (0.0%) |
| Law Enforcement | 23 (100.0%) | 0 (0.0%) |
| Food Preparation & Serving | 0 (0.0%) | 55 (100.0%) |
| Cleaning & Maintenance | 18 (40.0%) | 27 (60.0%) |
| Personal Care & Service | 8 (100.0%) | 0 (0.0%) |
| Total (Category) | 49 (37.4%) | 82 (62.6%) |
| Total (Overall) | 924 (67.7%) | 440 (32.3%) |
Sales and Office Occupations
The most common Sales and Office occupations in French Camp are Office & Administration (81 | 5.9%), and Sales & Related (57 | 4.2%).
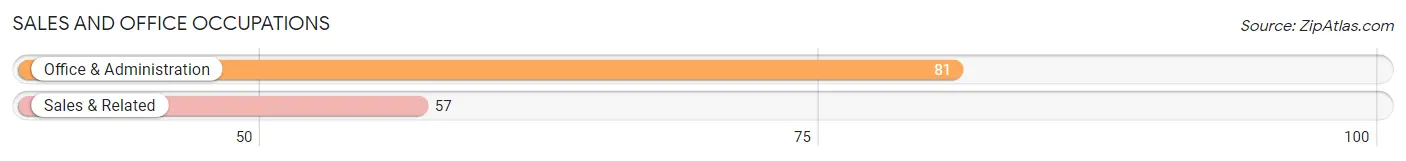
Sales and Office Occupations by Sex
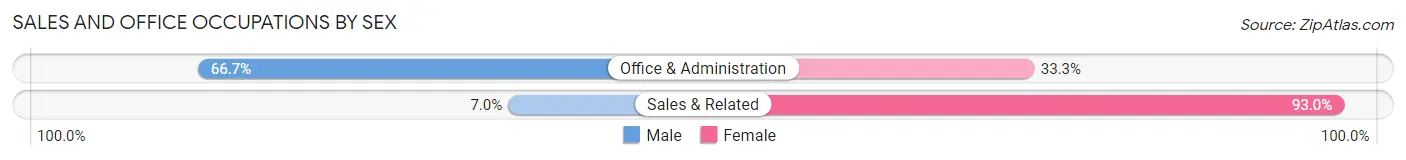
| Occupation | Male | Female |
| Sales & Related | 4 (7.0%) | 53 (93.0%) |
| Office & Administration | 54 (66.7%) | 27 (33.3%) |
| Total (Category) | 58 (42.0%) | 80 (58.0%) |
| Total (Overall) | 924 (67.7%) | 440 (32.3%) |
Natural Resources, Construction and Maintenance Occupations
The most common Natural Resources, Construction and Maintenance occupations in French Camp are Farming, Fishing & Forestry (435 | 31.9%), Installation, Maintenance & Repair (142 | 10.4%), and Construction & Extraction (55 | 4.0%).
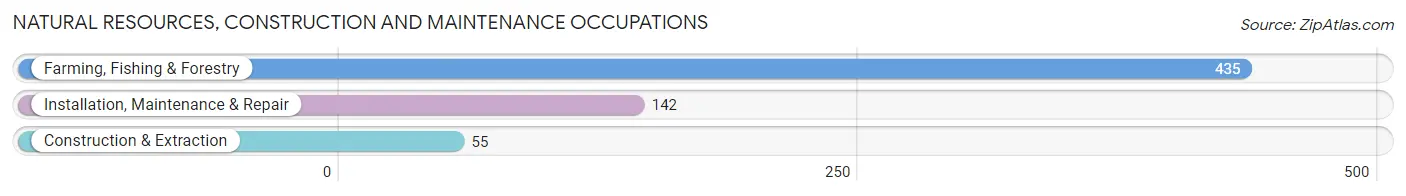
Natural Resources, Construction and Maintenance Occupations by Sex
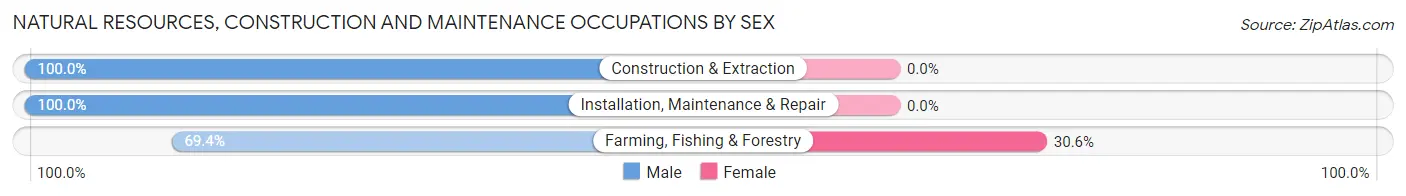
| Occupation | Male | Female |
| Farming, Fishing & Forestry | 302 (69.4%) | 133 (30.6%) |
| Construction & Extraction | 55 (100.0%) | 0 (0.0%) |
| Installation, Maintenance & Repair | 142 (100.0%) | 0 (0.0%) |
| Total (Category) | 499 (79.0%) | 133 (21.0%) |
| Total (Overall) | 924 (67.7%) | 440 (32.3%) |
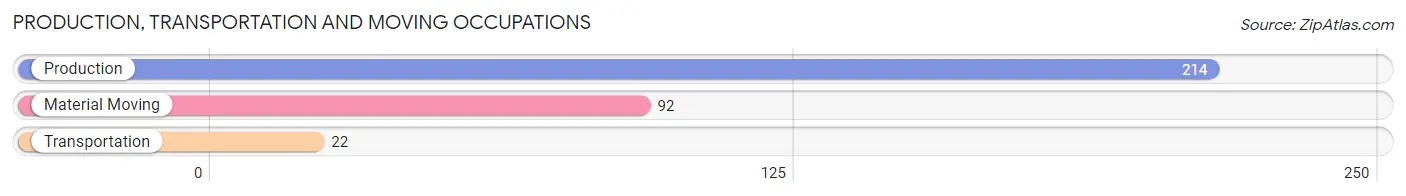
Production, Transportation and Moving Occupations
The most common Production, Transportation and Moving occupations in French Camp are Production (214 | 15.7%), Material Moving (92 | 6.7%), and Transportation (22 | 1.6%).
Production, Transportation and Moving Occupations by Sex
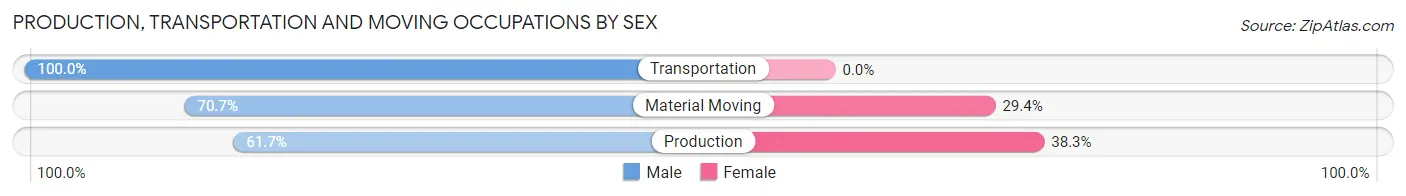
| Occupation | Male | Female |
| Production | 132 (61.7%) | 82 (38.3%) |
| Transportation | 22 (100.0%) | 0 (0.0%) |
| Material Moving | 65 (70.7%) | 27 (29.3%) |
| Total (Category) | 219 (66.8%) | 109 (33.2%) |
| Total (Overall) | 924 (67.7%) | 440 (32.3%) |
Employment Industries by Sex in French Camp
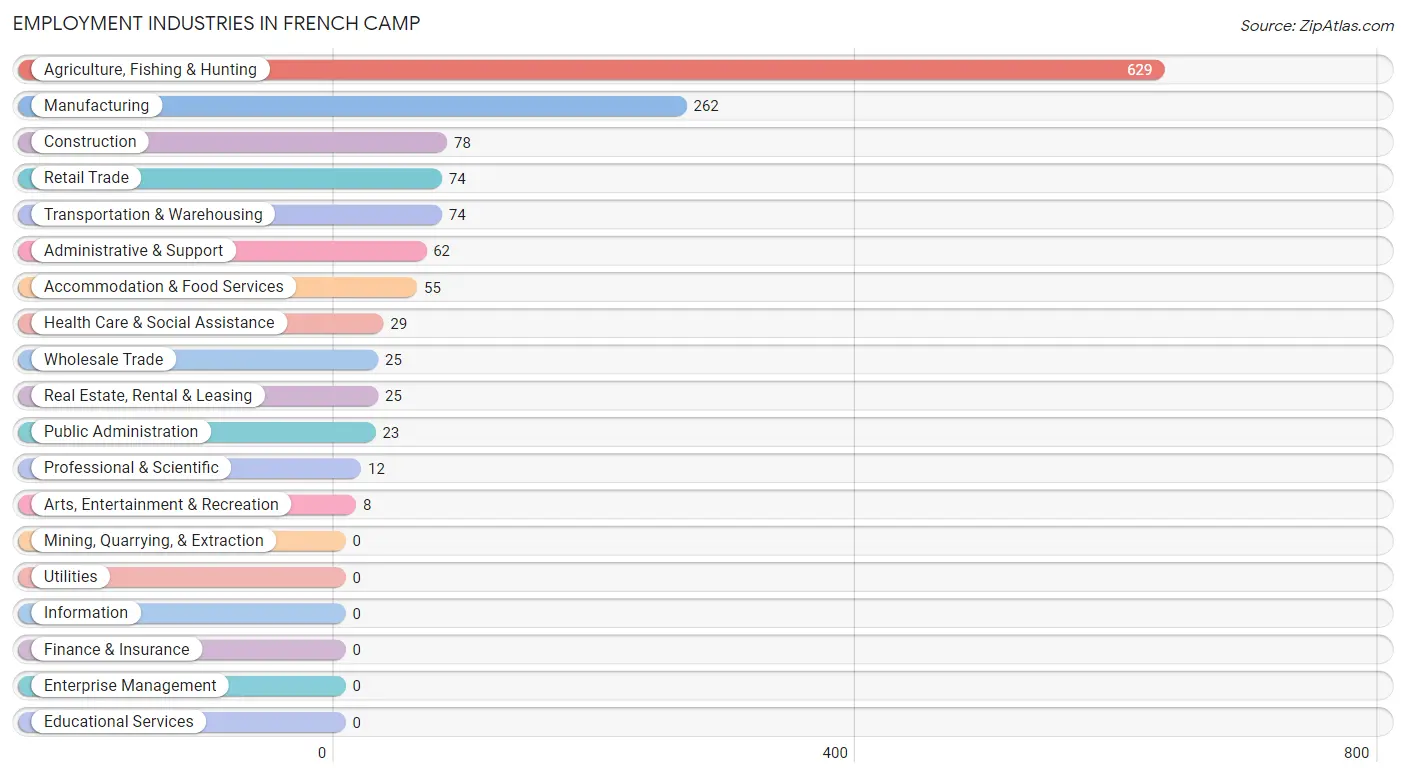
Employment Industries in French Camp
The major employment industries in French Camp include Agriculture, Fishing & Hunting (629 | 46.1%), Manufacturing (262 | 19.2%), Construction (78 | 5.7%), Retail Trade (74 | 5.4%), and Transportation & Warehousing (74 | 5.4%).
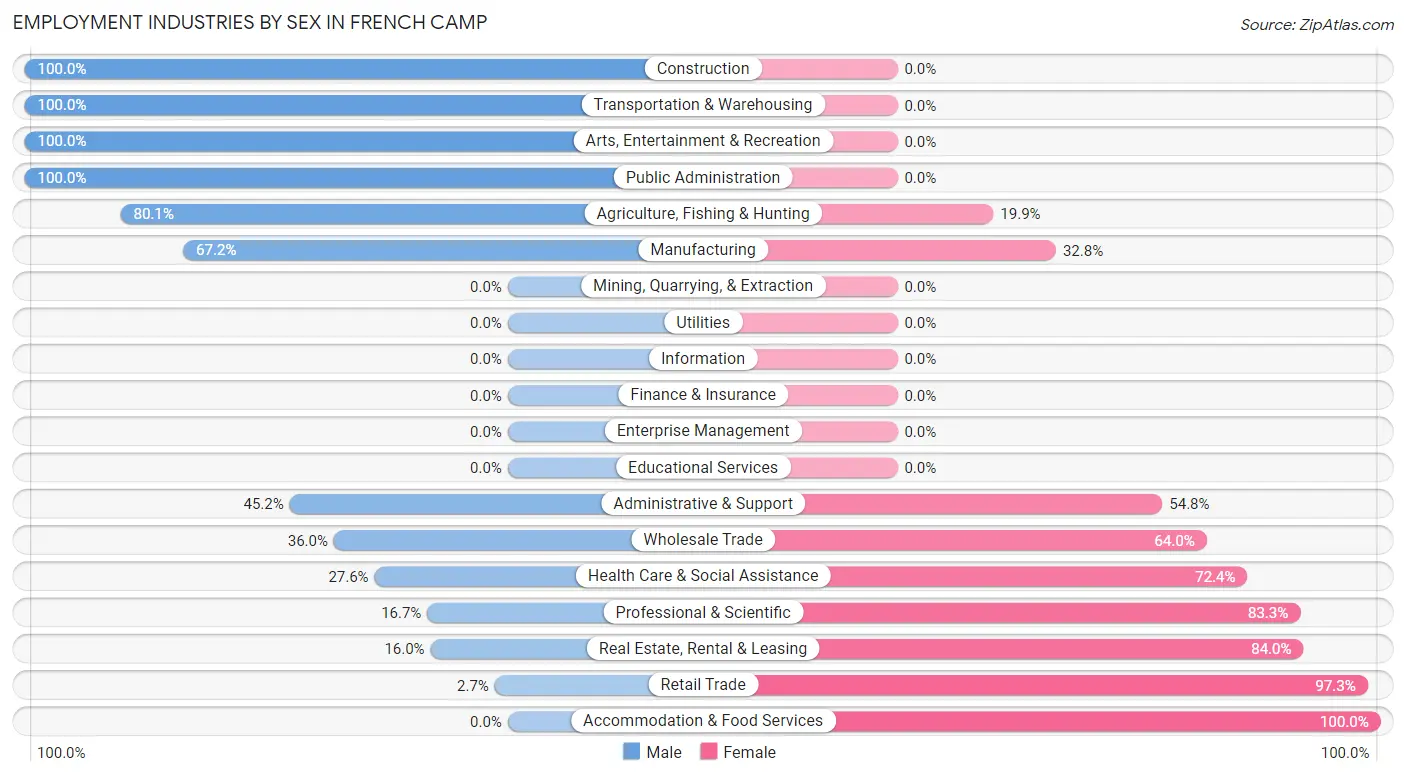
Employment Industries by Sex in French Camp
The French Camp industries that see more men than women are Construction (100.0%), Transportation & Warehousing (100.0%), and Arts, Entertainment & Recreation (100.0%), whereas the industries that tend to have a higher number of women are Accommodation & Food Services (100.0%), Retail Trade (97.3%), and Real Estate, Rental & Leasing (84.0%).
| Industry | Male | Female |
| Agriculture, Fishing & Hunting | 504 (80.1%) | 125 (19.9%) |
| Mining, Quarrying, & Extraction | 0 (0.0%) | 0 (0.0%) |
| Construction | 78 (100.0%) | 0 (0.0%) |
| Manufacturing | 176 (67.2%) | 86 (32.8%) |
| Wholesale Trade | 9 (36.0%) | 16 (64.0%) |
| Retail Trade | 2 (2.7%) | 72 (97.3%) |
| Transportation & Warehousing | 74 (100.0%) | 0 (0.0%) |
| Utilities | 0 (0.0%) | 0 (0.0%) |
| Information | 0 (0.0%) | 0 (0.0%) |
| Finance & Insurance | 0 (0.0%) | 0 (0.0%) |
| Real Estate, Rental & Leasing | 4 (16.0%) | 21 (84.0%) |
| Professional & Scientific | 2 (16.7%) | 10 (83.3%) |
| Enterprise Management | 0 (0.0%) | 0 (0.0%) |
| Administrative & Support | 28 (45.2%) | 34 (54.8%) |
| Educational Services | 0 (0.0%) | 0 (0.0%) |
| Health Care & Social Assistance | 8 (27.6%) | 21 (72.4%) |
| Arts, Entertainment & Recreation | 8 (100.0%) | 0 (0.0%) |
| Accommodation & Food Services | 0 (0.0%) | 55 (100.0%) |
| Public Administration | 23 (100.0%) | 0 (0.0%) |
| Total | 924 (67.7%) | 440 (32.3%) |
Education in French Camp
School Enrollment in French Camp
The most common levels of schooling among the 574 students in French Camp are high school (253 | 44.1%), middle school (119 | 20.7%), and elementary school (73 | 12.7%).
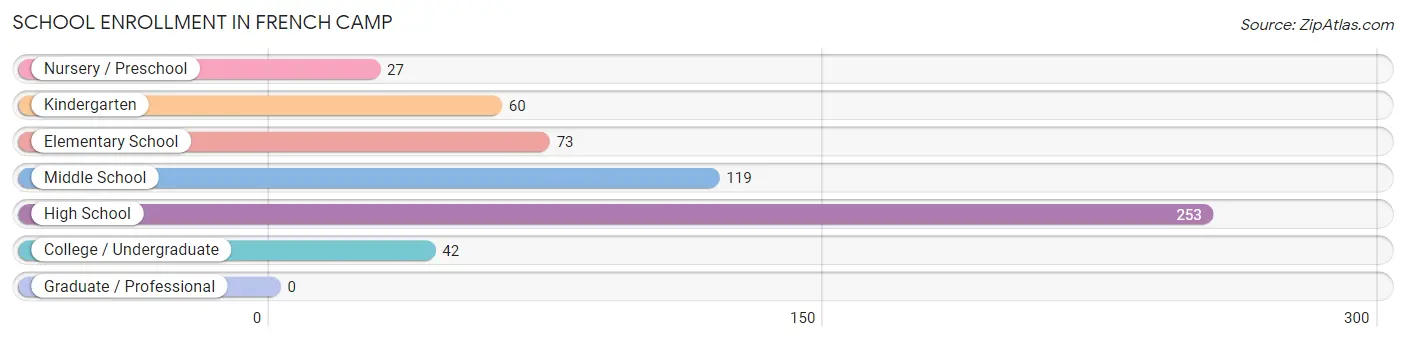
| School Level | # Students | % Students |
| Nursery / Preschool | 27 | 4.7% |
| Kindergarten | 60 | 10.4% |
| Elementary School | 73 | 12.7% |
| Middle School | 119 | 20.7% |
| High School | 253 | 44.1% |
| College / Undergraduate | 42 | 7.3% |
| Graduate / Professional | 0 | 0.0% |
| Total | 574 | 100.0% |
School Enrollment by Age by Funding Source in French Camp
Out of a total of 574 students who are enrolled in schools in French Camp, 19 (3.3%) attend a private institution, while the remaining 555 (96.7%) are enrolled in public schools. The age group of 20 to 24 year olds has the highest likelihood of being enrolled in private schools, with 6 (12.2% in the age bracket) enrolled. Conversely, the age group of 5 to 9 year old has the lowest likelihood of being enrolled in a private school, with 133 (100.0% in the age bracket) attending a public institution.
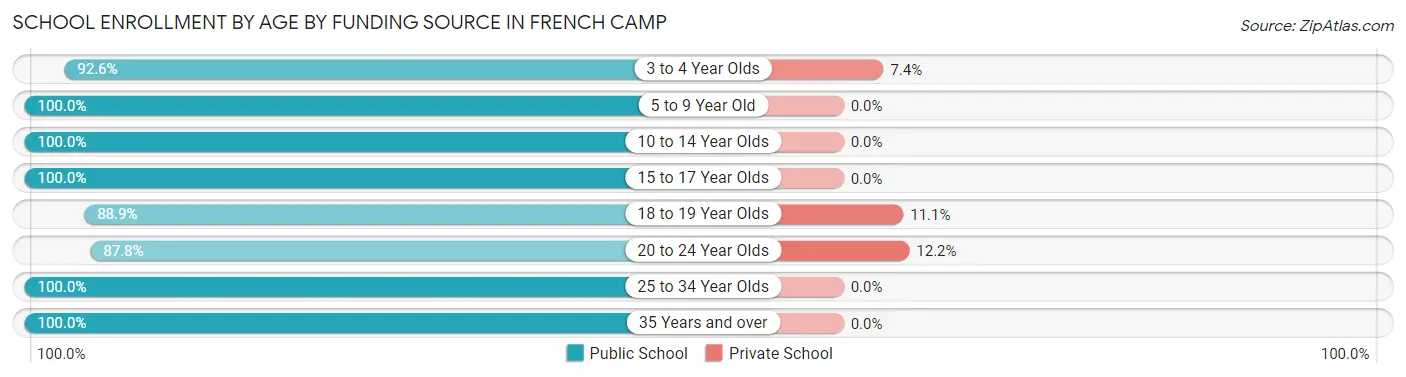
| Age Bracket | Public School | Private School |
| 3 to 4 Year Olds | 25 (92.6%) | 2 (7.4%) |
| 5 to 9 Year Old | 133 (100.0%) | 0 (0.0%) |
| 10 to 14 Year Olds | 119 (100.0%) | 0 (0.0%) |
| 15 to 17 Year Olds | 101 (100.0%) | 0 (0.0%) |
| 18 to 19 Year Olds | 88 (88.9%) | 11 (11.1%) |
| 20 to 24 Year Olds | 43 (87.8%) | 6 (12.2%) |
| 25 to 34 Year Olds | 19 (100.0%) | 0 (0.0%) |
| 35 Years and over | 27 (100.0%) | 0 (0.0%) |
| Total | 555 (96.7%) | 19 (3.3%) |
Educational Attainment by Field of Study in French Camp
Business (40 | 60.6%), education (12 | 18.2%), bio, nature & agricultural (4 | 6.1%), engineering (4 | 6.1%), and liberal arts & history (4 | 6.1%) are the most common fields of study among 66 individuals in French Camp who have obtained a bachelor's degree or higher.
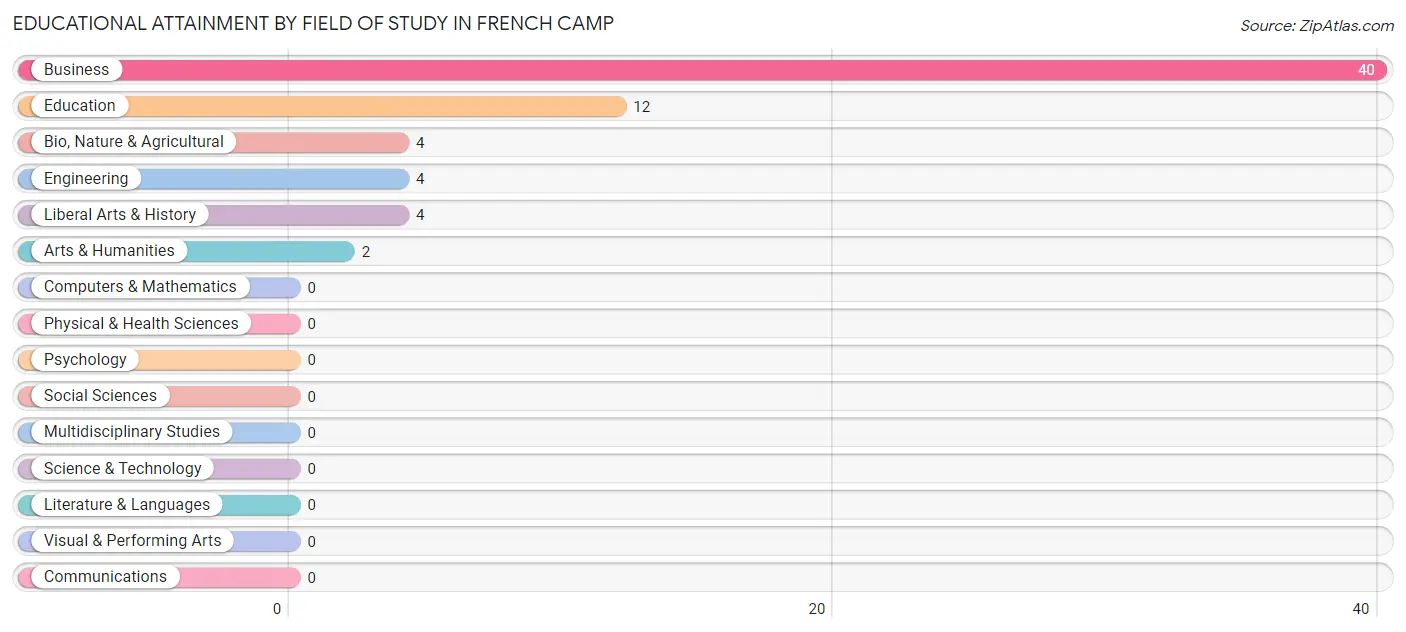
| Field of Study | # Graduates | % Graduates |
| Computers & Mathematics | 0 | 0.0% |
| Bio, Nature & Agricultural | 4 | 6.1% |
| Physical & Health Sciences | 0 | 0.0% |
| Psychology | 0 | 0.0% |
| Social Sciences | 0 | 0.0% |
| Engineering | 4 | 6.1% |
| Multidisciplinary Studies | 0 | 0.0% |
| Science & Technology | 0 | 0.0% |
| Business | 40 | 60.6% |
| Education | 12 | 18.2% |
| Literature & Languages | 0 | 0.0% |
| Liberal Arts & History | 4 | 6.1% |
| Visual & Performing Arts | 0 | 0.0% |
| Communications | 0 | 0.0% |
| Arts & Humanities | 2 | 3.0% |
| Total | 66 | 100.0% |
Transportation & Commute in French Camp
Vehicle Availability by Sex in French Camp
The most prevalent vehicle ownership categories in French Camp are males with 2 vehicles (127, accounting for 44.7%) and females with 2 vehicles (63, making up 59.4%).
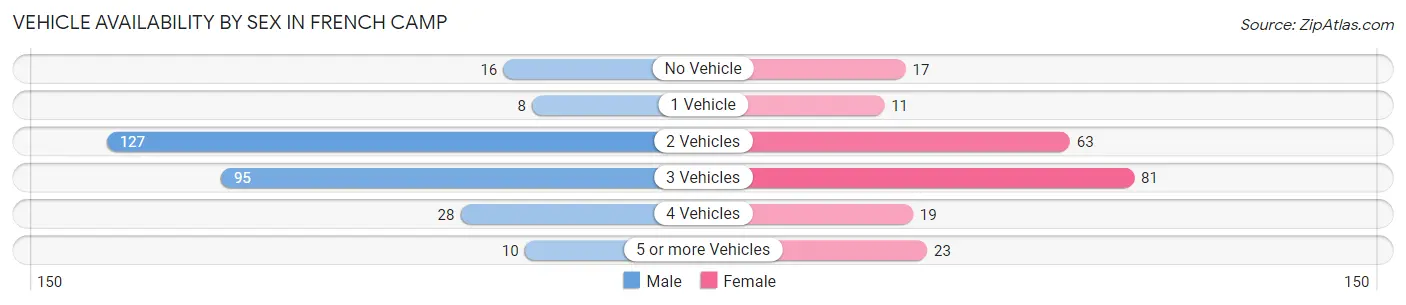
| Vehicles Available | Male | Female |
| No Vehicle | 16 (5.6%) | 17 (7.9%) |
| 1 Vehicle | 8 (2.8%) | 11 (5.1%) |
| 2 Vehicles | 127 (44.7%) | 63 (29.4%) |
| 3 Vehicles | 95 (33.5%) | 81 (37.9%) |
| 4 Vehicles | 28 (9.9%) | 19 (8.9%) |
| 5 or more Vehicles | 10 (3.5%) | 23 (10.7%) |
| Total | 284 (100.0%) | 214 (100.0%) |
Commute Time in French Camp
The most frequently occuring commute durations in French Camp are 20 to 24 minutes (361 commuters, 32.8%), 15 to 19 minutes (296 commuters, 26.9%), and 30 to 34 minutes (178 commuters, 16.2%).
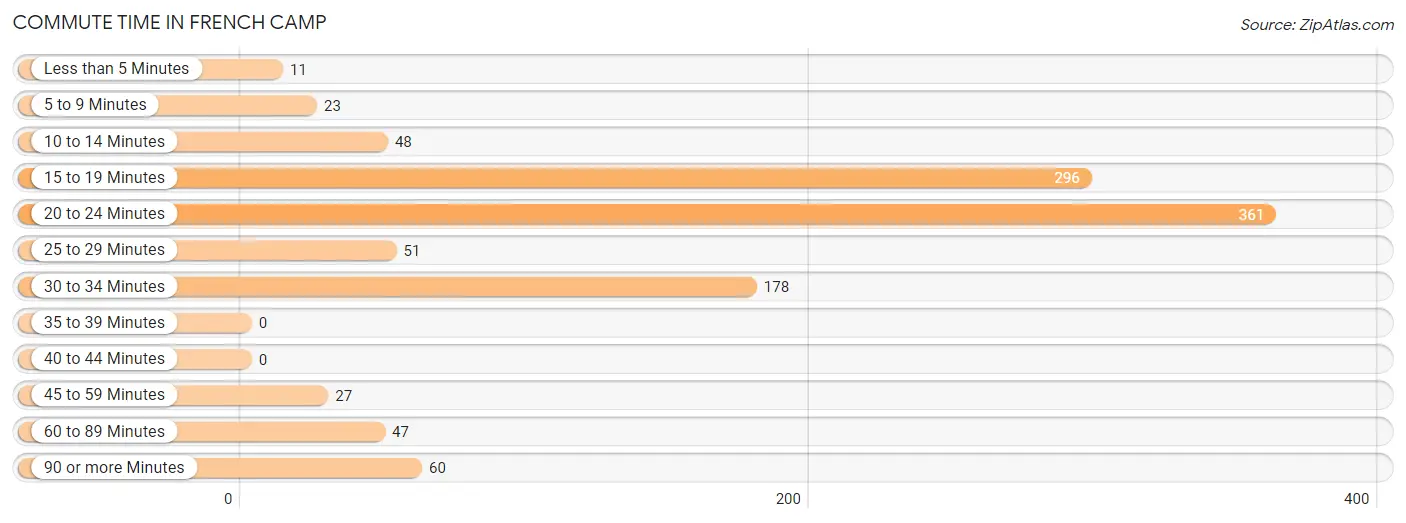
| Commute Time | # Commuters | % Commuters |
| Less than 5 Minutes | 11 | 1.0% |
| 5 to 9 Minutes | 23 | 2.1% |
| 10 to 14 Minutes | 48 | 4.4% |
| 15 to 19 Minutes | 296 | 26.9% |
| 20 to 24 Minutes | 361 | 32.8% |
| 25 to 29 Minutes | 51 | 4.6% |
| 30 to 34 Minutes | 178 | 16.2% |
| 35 to 39 Minutes | 0 | 0.0% |
| 40 to 44 Minutes | 0 | 0.0% |
| 45 to 59 Minutes | 27 | 2.5% |
| 60 to 89 Minutes | 47 | 4.3% |
| 90 or more Minutes | 60 | 5.4% |
Commute Time by Sex in French Camp
The most common commute times in French Camp are 15 to 19 minutes (265 commuters, 40.0%) for males and 20 to 24 minutes (172 commuters, 39.1%) for females.
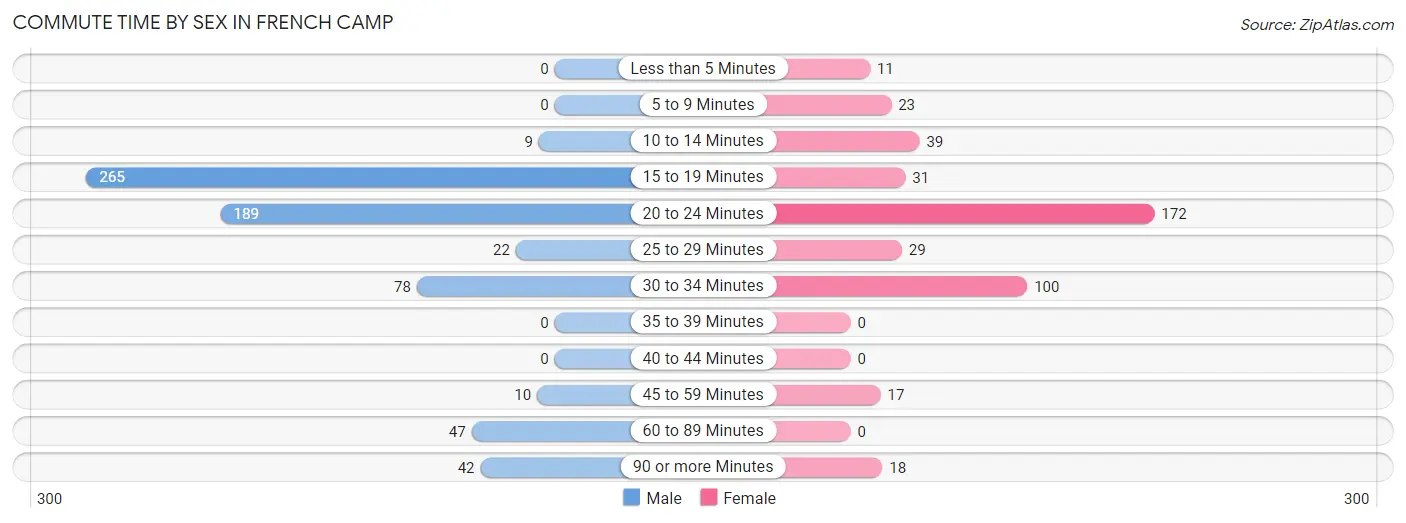
| Commute Time | Male | Female |
| Less than 5 Minutes | 0 (0.0%) | 11 (2.5%) |
| 5 to 9 Minutes | 0 (0.0%) | 23 (5.2%) |
| 10 to 14 Minutes | 9 (1.4%) | 39 (8.9%) |
| 15 to 19 Minutes | 265 (40.0%) | 31 (7.0%) |
| 20 to 24 Minutes | 189 (28.5%) | 172 (39.1%) |
| 25 to 29 Minutes | 22 (3.3%) | 29 (6.6%) |
| 30 to 34 Minutes | 78 (11.8%) | 100 (22.7%) |
| 35 to 39 Minutes | 0 (0.0%) | 0 (0.0%) |
| 40 to 44 Minutes | 0 (0.0%) | 0 (0.0%) |
| 45 to 59 Minutes | 10 (1.5%) | 17 (3.9%) |
| 60 to 89 Minutes | 47 (7.1%) | 0 (0.0%) |
| 90 or more Minutes | 42 (6.3%) | 18 (4.1%) |
Time of Departure to Work by Sex in French Camp
The most frequent times of departure to work in French Camp are 6:00 AM to 6:29 AM (206, 31.1%) for males and 5:30 AM to 5:59 AM (100, 22.7%) for females.
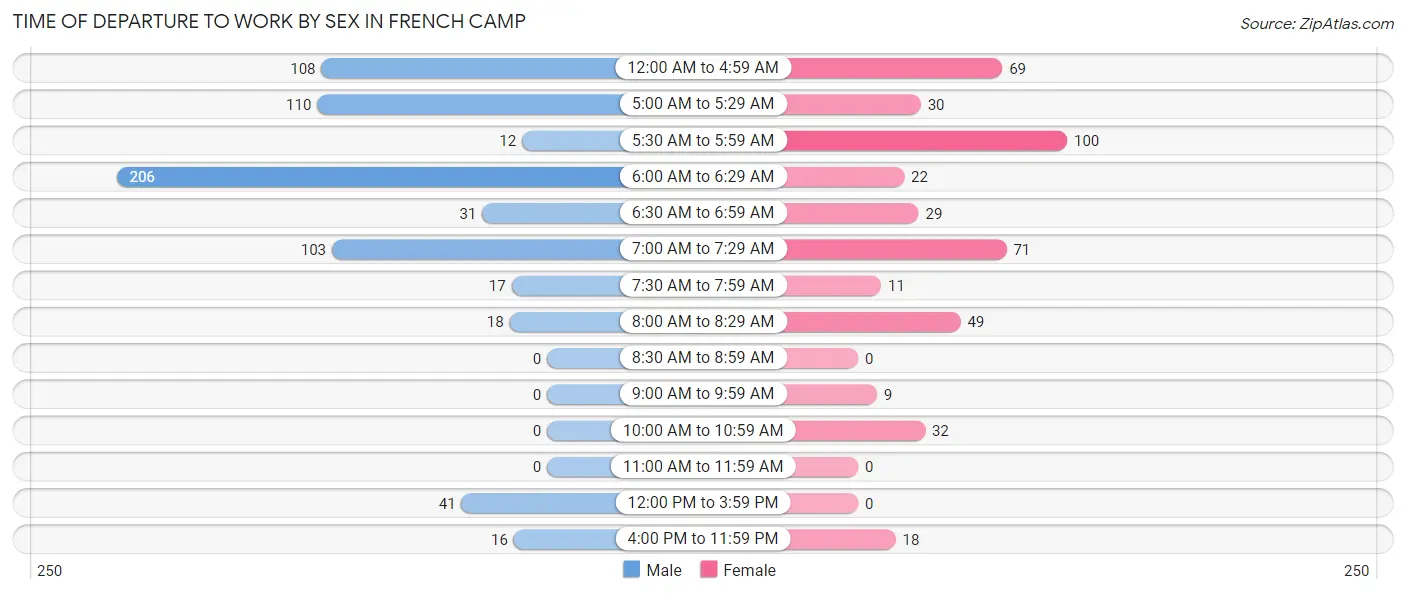
| Time of Departure | Male | Female |
| 12:00 AM to 4:59 AM | 108 (16.3%) | 69 (15.7%) |
| 5:00 AM to 5:29 AM | 110 (16.6%) | 30 (6.8%) |
| 5:30 AM to 5:59 AM | 12 (1.8%) | 100 (22.7%) |
| 6:00 AM to 6:29 AM | 206 (31.1%) | 22 (5.0%) |
| 6:30 AM to 6:59 AM | 31 (4.7%) | 29 (6.6%) |
| 7:00 AM to 7:29 AM | 103 (15.6%) | 71 (16.1%) |
| 7:30 AM to 7:59 AM | 17 (2.6%) | 11 (2.5%) |
| 8:00 AM to 8:29 AM | 18 (2.7%) | 49 (11.1%) |
| 8:30 AM to 8:59 AM | 0 (0.0%) | 0 (0.0%) |
| 9:00 AM to 9:59 AM | 0 (0.0%) | 9 (2.1%) |
| 10:00 AM to 10:59 AM | 0 (0.0%) | 32 (7.3%) |
| 11:00 AM to 11:59 AM | 0 (0.0%) | 0 (0.0%) |
| 12:00 PM to 3:59 PM | 41 (6.2%) | 0 (0.0%) |
| 4:00 PM to 11:59 PM | 16 (2.4%) | 18 (4.1%) |
| Total | 662 (100.0%) | 440 (100.0%) |
Housing Occupancy in French Camp
Occupancy by Ownership in French Camp
Of the total 396 dwellings in French Camp, owner-occupied units account for 200 (50.5%), while renter-occupied units make up 196 (49.5%).
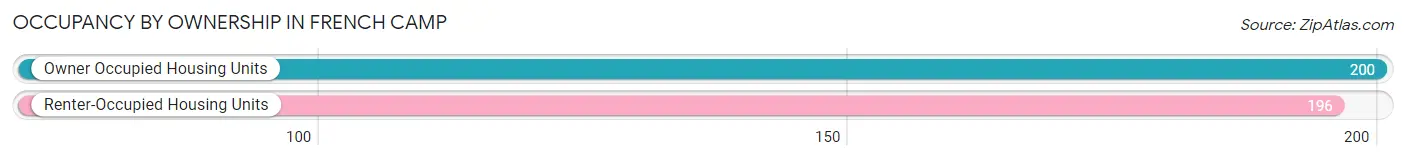
| Occupancy | # Housing Units | % Housing Units |
| Owner Occupied Housing Units | 200 | 50.5% |
| Renter-Occupied Housing Units | 196 | 49.5% |
| Total Occupied Housing Units | 396 | 100.0% |
Occupancy by Household Size in French Camp
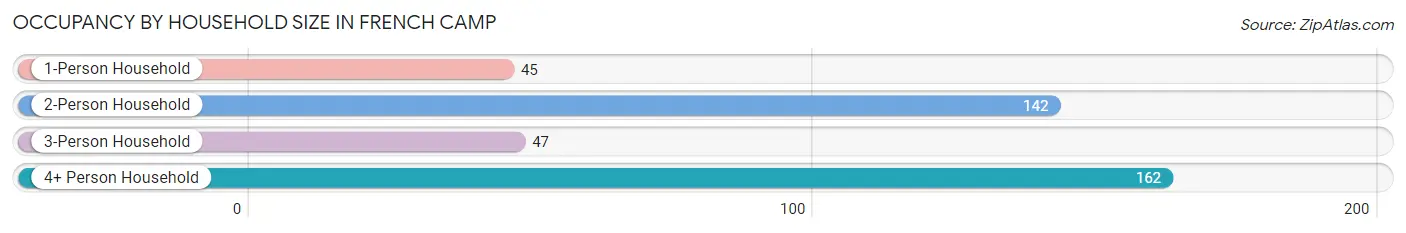
| Household Size | # Housing Units | % Housing Units |
| 1-Person Household | 45 | 11.4% |
| 2-Person Household | 142 | 35.9% |
| 3-Person Household | 47 | 11.9% |
| 4+ Person Household | 162 | 40.9% |
| Total Housing Units | 396 | 100.0% |
Occupancy by Ownership by Household Size in French Camp
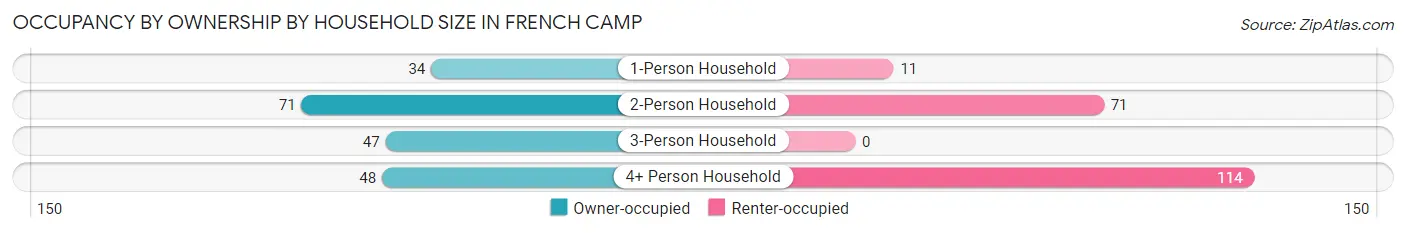
| Household Size | Owner-occupied | Renter-occupied |
| 1-Person Household | 34 (75.6%) | 11 (24.4%) |
| 2-Person Household | 71 (50.0%) | 71 (50.0%) |
| 3-Person Household | 47 (100.0%) | 0 (0.0%) |
| 4+ Person Household | 48 (29.6%) | 114 (70.4%) |
| Total Housing Units | 200 (50.5%) | 196 (49.5%) |
Occupancy by Educational Attainment in French Camp
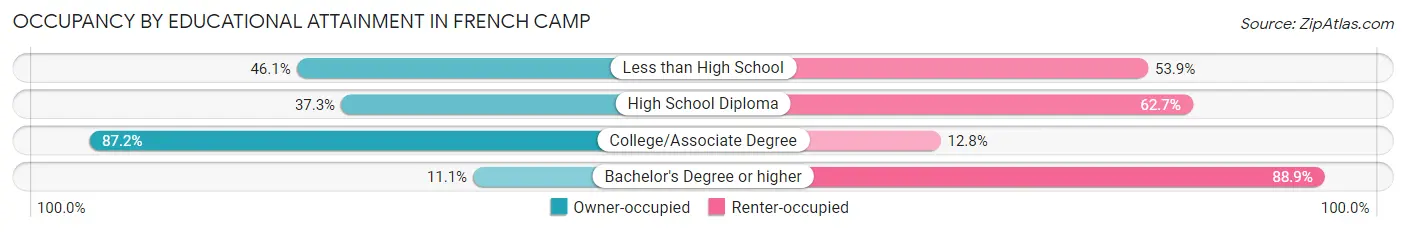
| Household Size | Owner-occupied | Renter-occupied |
| Less than High School | 53 (46.1%) | 62 (53.9%) |
| High School Diploma | 63 (37.3%) | 106 (62.7%) |
| College/Associate Degree | 82 (87.2%) | 12 (12.8%) |
| Bachelor's Degree or higher | 2 (11.1%) | 16 (88.9%) |
Occupancy by Age of Householder in French Camp
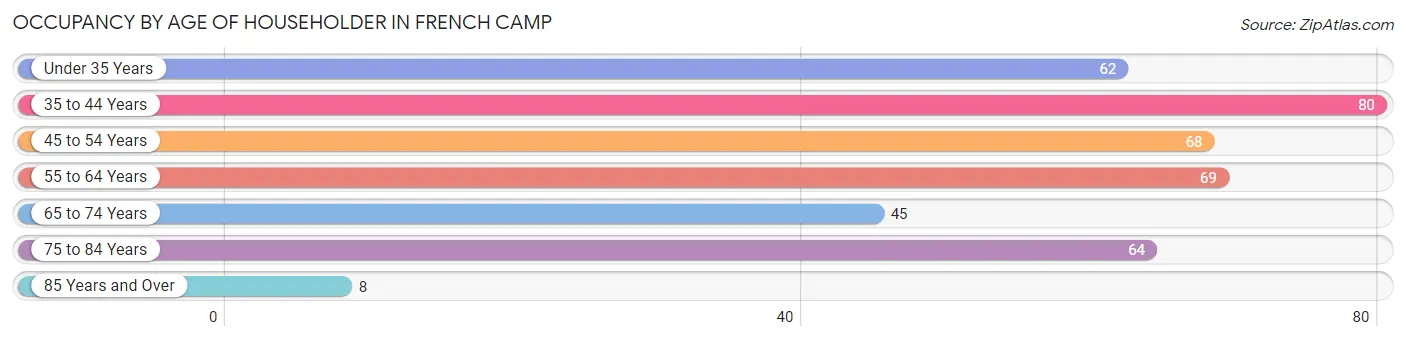
| Age Bracket | # Households | % Households |
| Under 35 Years | 62 | 15.7% |
| 35 to 44 Years | 80 | 20.2% |
| 45 to 54 Years | 68 | 17.2% |
| 55 to 64 Years | 69 | 17.4% |
| 65 to 74 Years | 45 | 11.4% |
| 75 to 84 Years | 64 | 16.2% |
| 85 Years and Over | 8 | 2.0% |
| Total | 396 | 100.0% |
Housing Finances in French Camp
Median Income by Occupancy in French Camp
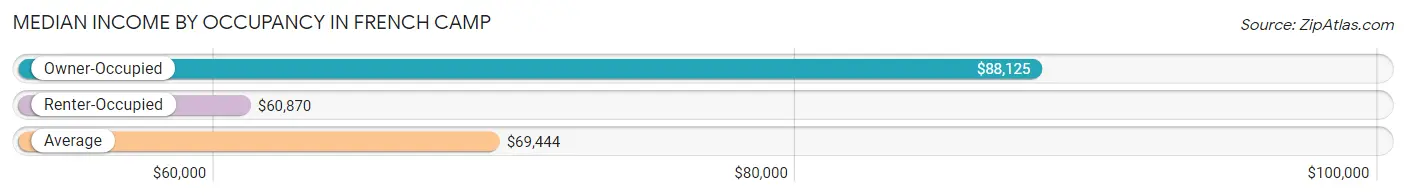
| Occupancy Type | # Households | Median Income |
| Owner-Occupied | 200 (50.5%) | $88,125 |
| Renter-Occupied | 196 (49.5%) | $60,870 |
| Average | 396 (100.0%) | $69,444 |
Occupancy by Householder Income Bracket in French Camp
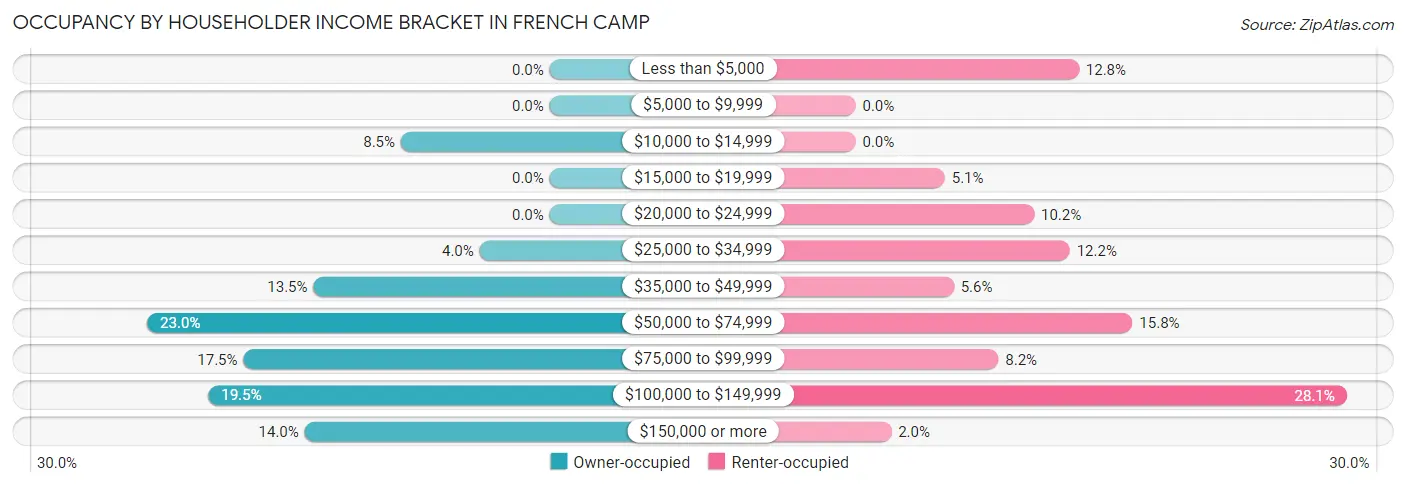
| Income Bracket | Owner-occupied | Renter-occupied |
| Less than $5,000 | 0 (0.0%) | 25 (12.8%) |
| $5,000 to $9,999 | 0 (0.0%) | 0 (0.0%) |
| $10,000 to $14,999 | 17 (8.5%) | 0 (0.0%) |
| $15,000 to $19,999 | 0 (0.0%) | 10 (5.1%) |
| $20,000 to $24,999 | 0 (0.0%) | 20 (10.2%) |
| $25,000 to $34,999 | 8 (4.0%) | 24 (12.2%) |
| $35,000 to $49,999 | 27 (13.5%) | 11 (5.6%) |
| $50,000 to $74,999 | 46 (23.0%) | 31 (15.8%) |
| $75,000 to $99,999 | 35 (17.5%) | 16 (8.2%) |
| $100,000 to $149,999 | 39 (19.5%) | 55 (28.1%) |
| $150,000 or more | 28 (14.0%) | 4 (2.0%) |
| Total | 200 (100.0%) | 196 (100.0%) |
Monthly Housing Cost Tiers in French Camp
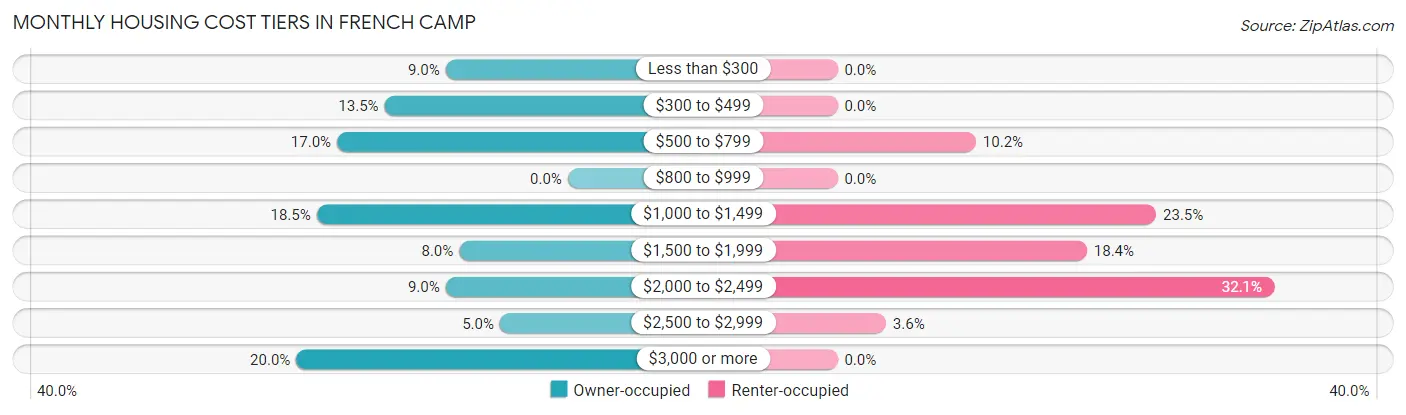
| Monthly Cost | Owner-occupied | Renter-occupied |
| Less than $300 | 18 (9.0%) | 0 (0.0%) |
| $300 to $499 | 27 (13.5%) | 0 (0.0%) |
| $500 to $799 | 34 (17.0%) | 20 (10.2%) |
| $800 to $999 | 0 (0.0%) | 0 (0.0%) |
| $1,000 to $1,499 | 37 (18.5%) | 46 (23.5%) |
| $1,500 to $1,999 | 16 (8.0%) | 36 (18.4%) |
| $2,000 to $2,499 | 18 (9.0%) | 63 (32.1%) |
| $2,500 to $2,999 | 10 (5.0%) | 7 (3.6%) |
| $3,000 or more | 40 (20.0%) | 0 (0.0%) |
| Total | 200 (100.0%) | 196 (100.0%) |
Physical Housing Characteristics in French Camp
Housing Structures in French Camp
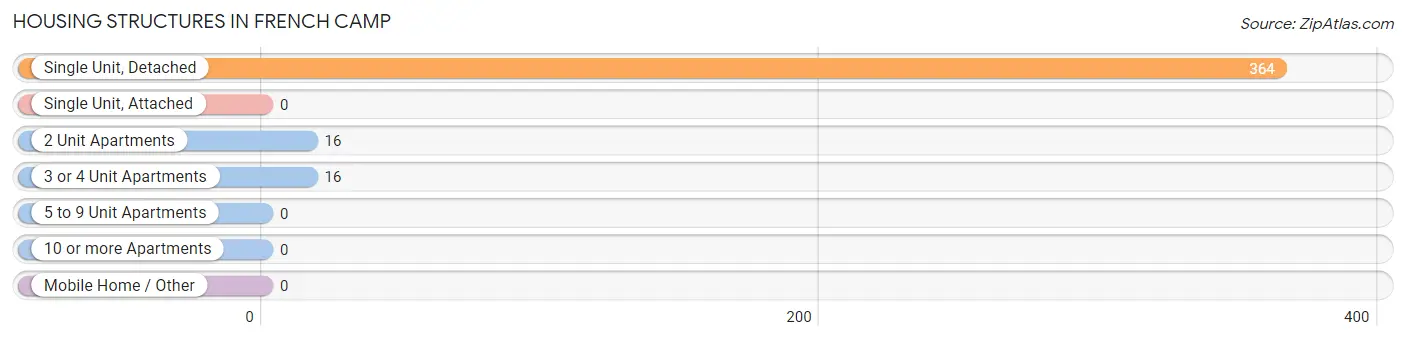
| Structure Type | # Housing Units | % Housing Units |
| Single Unit, Detached | 364 | 91.9% |
| Single Unit, Attached | 0 | 0.0% |
| 2 Unit Apartments | 16 | 4.0% |
| 3 or 4 Unit Apartments | 16 | 4.0% |
| 5 to 9 Unit Apartments | 0 | 0.0% |
| 10 or more Apartments | 0 | 0.0% |
| Mobile Home / Other | 0 | 0.0% |
| Total | 396 | 100.0% |
Housing Structures by Occupancy in French Camp
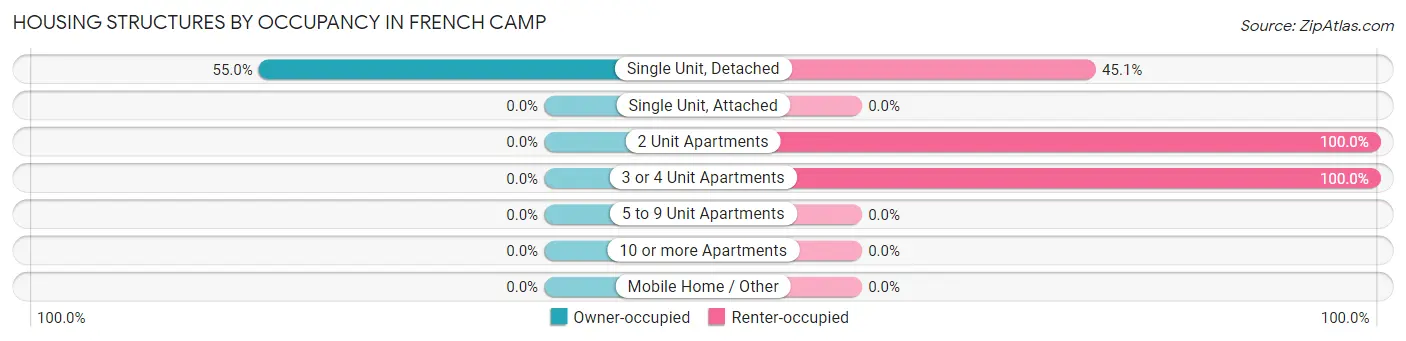
| Structure Type | Owner-occupied | Renter-occupied |
| Single Unit, Detached | 200 (54.9%) | 164 (45.1%) |
| Single Unit, Attached | 0 (0.0%) | 0 (0.0%) |
| 2 Unit Apartments | 0 (0.0%) | 16 (100.0%) |
| 3 or 4 Unit Apartments | 0 (0.0%) | 16 (100.0%) |
| 5 to 9 Unit Apartments | 0 (0.0%) | 0 (0.0%) |
| 10 or more Apartments | 0 (0.0%) | 0 (0.0%) |
| Mobile Home / Other | 0 (0.0%) | 0 (0.0%) |
| Total | 200 (50.5%) | 196 (49.5%) |
Housing Structures by Number of Rooms in French Camp
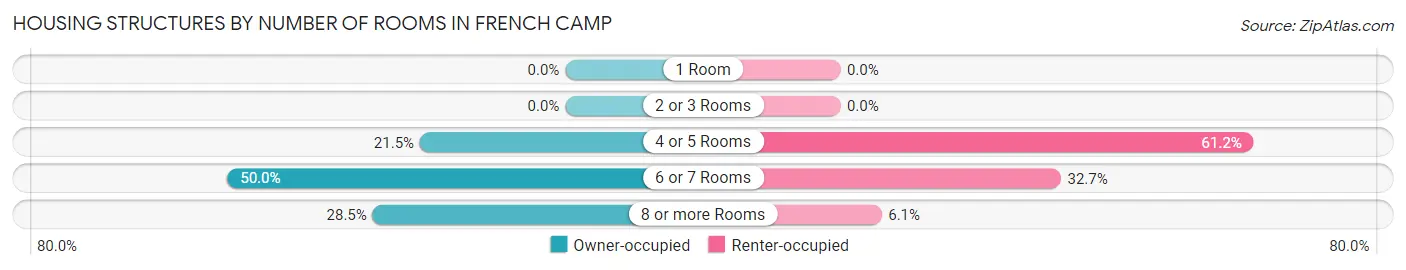
| Number of Rooms | Owner-occupied | Renter-occupied |
| 1 Room | 0 (0.0%) | 0 (0.0%) |
| 2 or 3 Rooms | 0 (0.0%) | 0 (0.0%) |
| 4 or 5 Rooms | 43 (21.5%) | 120 (61.2%) |
| 6 or 7 Rooms | 100 (50.0%) | 64 (32.7%) |
| 8 or more Rooms | 57 (28.5%) | 12 (6.1%) |
| Total | 200 (100.0%) | 196 (100.0%) |
Housing Structure by Heating Type in French Camp
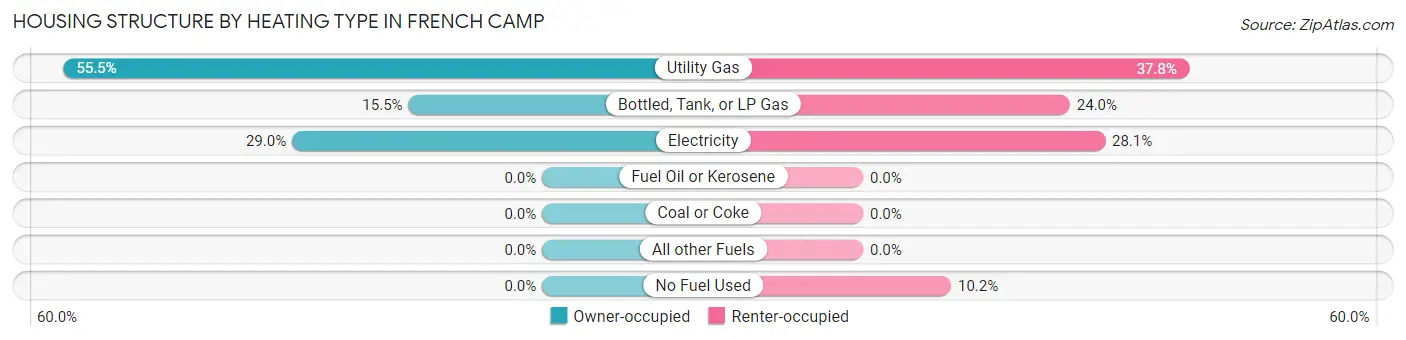
| Heating Type | Owner-occupied | Renter-occupied |
| Utility Gas | 111 (55.5%) | 74 (37.8%) |
| Bottled, Tank, or LP Gas | 31 (15.5%) | 47 (24.0%) |
| Electricity | 58 (29.0%) | 55 (28.1%) |
| Fuel Oil or Kerosene | 0 (0.0%) | 0 (0.0%) |
| Coal or Coke | 0 (0.0%) | 0 (0.0%) |
| All other Fuels | 0 (0.0%) | 0 (0.0%) |
| No Fuel Used | 0 (0.0%) | 20 (10.2%) |
| Total | 200 (100.0%) | 196 (100.0%) |
Household Vehicle Usage in French Camp
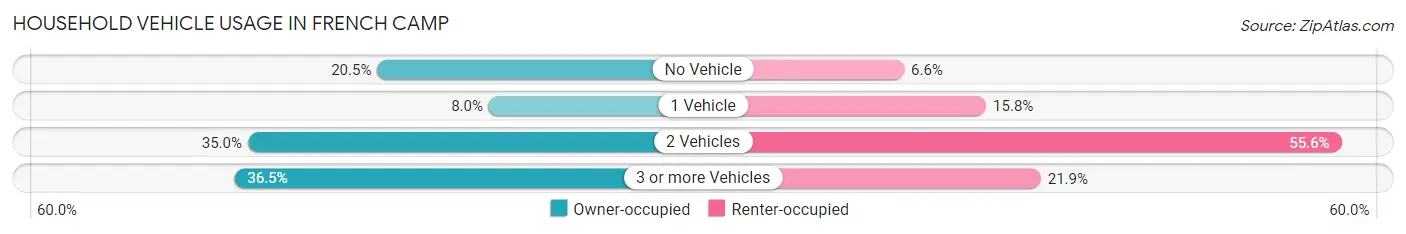
| Vehicles per Household | Owner-occupied | Renter-occupied |
| No Vehicle | 41 (20.5%) | 13 (6.6%) |
| 1 Vehicle | 16 (8.0%) | 31 (15.8%) |
| 2 Vehicles | 70 (35.0%) | 109 (55.6%) |
| 3 or more Vehicles | 73 (36.5%) | 43 (21.9%) |
| Total | 200 (100.0%) | 196 (100.0%) |
Real Estate & Mortgages in French Camp
Real Estate and Mortgage Overview in French Camp
| Characteristic | Without Mortgage | With Mortgage |
| Housing Units | 90 | 110 |
| Median Property Value | $332,000 | $500,000 |
| Median Household Income | $56,058 | $28 |
| Monthly Housing Costs | $500 | $29 |
| Real Estate Taxes | - | - |
Property Value by Mortgage Status in French Camp
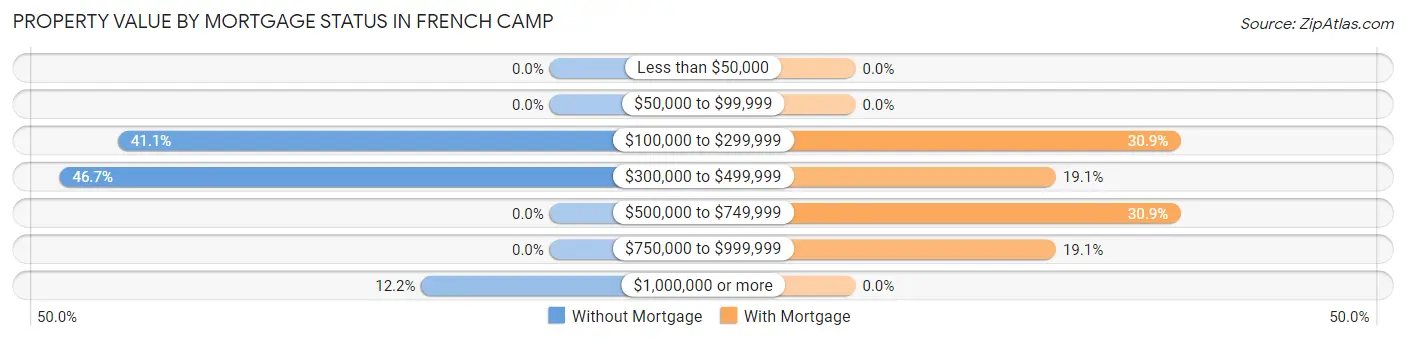
| Property Value | Without Mortgage | With Mortgage |
| Less than $50,000 | 0 (0.0%) | 0 (0.0%) |
| $50,000 to $99,999 | 0 (0.0%) | 0 (0.0%) |
| $100,000 to $299,999 | 37 (41.1%) | 34 (30.9%) |
| $300,000 to $499,999 | 42 (46.7%) | 21 (19.1%) |
| $500,000 to $749,999 | 0 (0.0%) | 34 (30.9%) |
| $750,000 to $999,999 | 0 (0.0%) | 21 (19.1%) |
| $1,000,000 or more | 11 (12.2%) | 0 (0.0%) |
| Total | 90 (100.0%) | 110 (100.0%) |
Household Income by Mortgage Status in French Camp
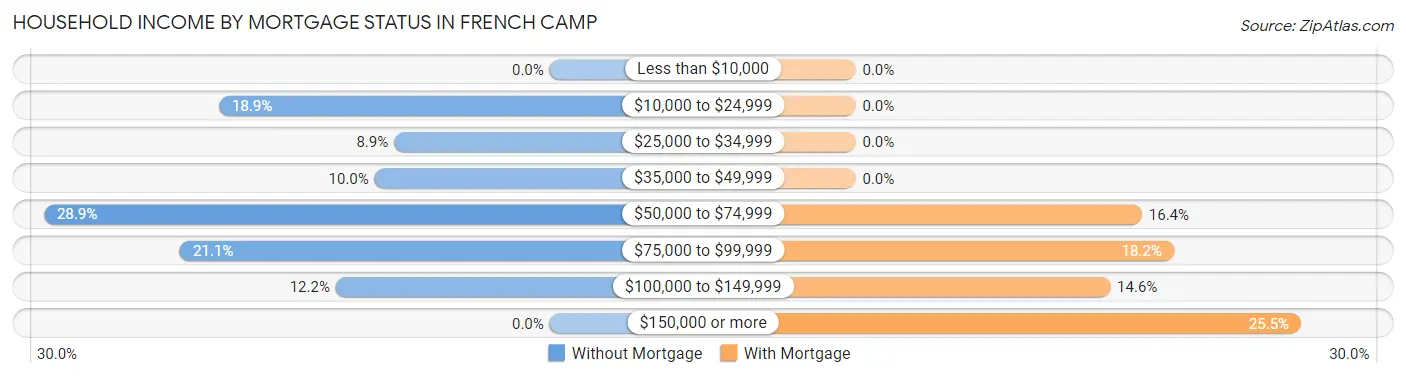
| Household Income | Without Mortgage | With Mortgage |
| Less than $10,000 | 0 (0.0%) | 0 (0.0%) |
| $10,000 to $24,999 | 17 (18.9%) | 0 (0.0%) |
| $25,000 to $34,999 | 8 (8.9%) | 0 (0.0%) |
| $35,000 to $49,999 | 9 (10.0%) | 0 (0.0%) |
| $50,000 to $74,999 | 26 (28.9%) | 18 (16.4%) |
| $75,000 to $99,999 | 19 (21.1%) | 20 (18.2%) |
| $100,000 to $149,999 | 11 (12.2%) | 16 (14.5%) |
| $150,000 or more | 0 (0.0%) | 28 (25.5%) |
| Total | 90 (100.0%) | 110 (100.0%) |
Property Value to Household Income Ratio in French Camp
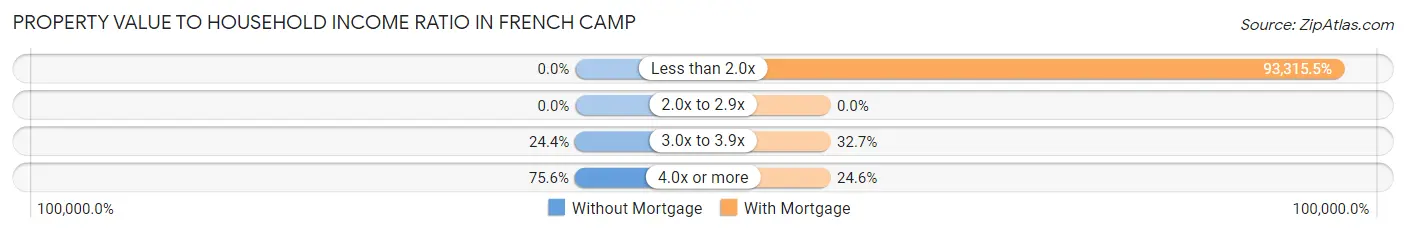
| Value-to-Income Ratio | Without Mortgage | With Mortgage |
| Less than 2.0x | 0 (0.0%) | 102,647 (93,315.4%) |
| 2.0x to 2.9x | 0 (0.0%) | 0 (0.0%) |
| 3.0x to 3.9x | 22 (24.4%) | 36 (32.7%) |
| 4.0x or more | 68 (75.6%) | 27 (24.5%) |
| Total | 90 (100.0%) | 110 (100.0%) |
Real Estate Taxes by Mortgage Status in French Camp
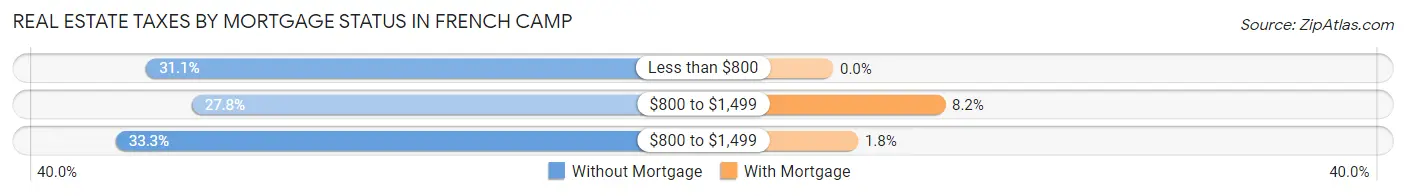
| Property Taxes | Without Mortgage | With Mortgage |
| Less than $800 | 28 (31.1%) | 0 (0.0%) |
| $800 to $1,499 | 25 (27.8%) | 9 (8.2%) |
| $800 to $1,499 | 30 (33.3%) | 2 (1.8%) |
| Total | 90 (100.0%) | 110 (100.0%) |
Health & Disability in French Camp
Health Insurance Coverage by Age in French Camp
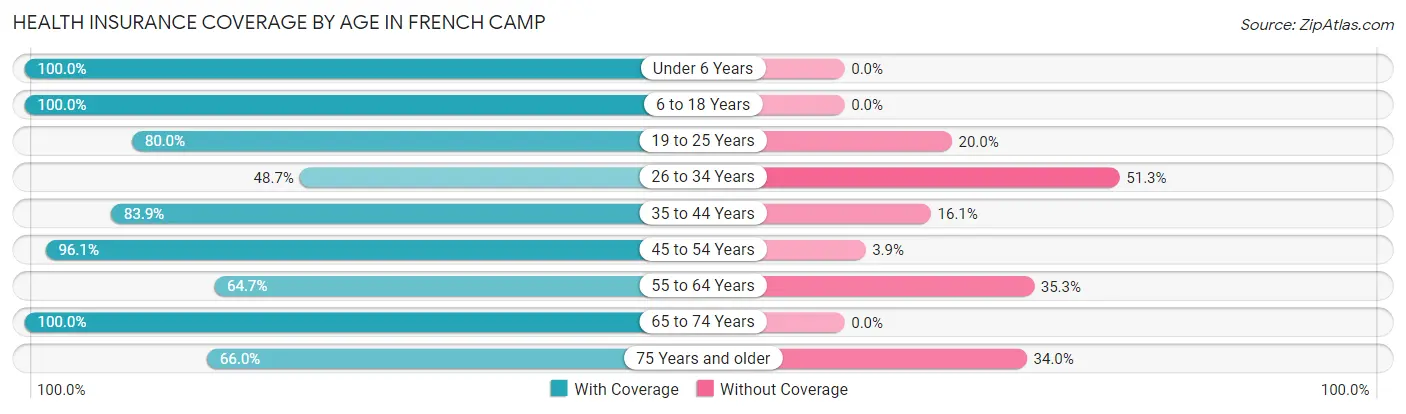
| Age Bracket | With Coverage | Without Coverage |
| Under 6 Years | 215 (100.0%) | 0 (0.0%) |
| 6 to 18 Years | 380 (100.0%) | 0 (0.0%) |
| 19 to 25 Years | 104 (80.0%) | 26 (20.0%) |
| 26 to 34 Years | 246 (48.7%) | 259 (51.3%) |
| 35 to 44 Years | 245 (83.9%) | 47 (16.1%) |
| 45 to 54 Years | 197 (96.1%) | 8 (3.9%) |
| 55 to 64 Years | 322 (64.7%) | 176 (35.3%) |
| 65 to 74 Years | 107 (100.0%) | 0 (0.0%) |
| 75 Years and older | 99 (66.0%) | 51 (34.0%) |
| Total | 1,915 (77.2%) | 567 (22.8%) |
Health Insurance Coverage by Citizenship Status in French Camp
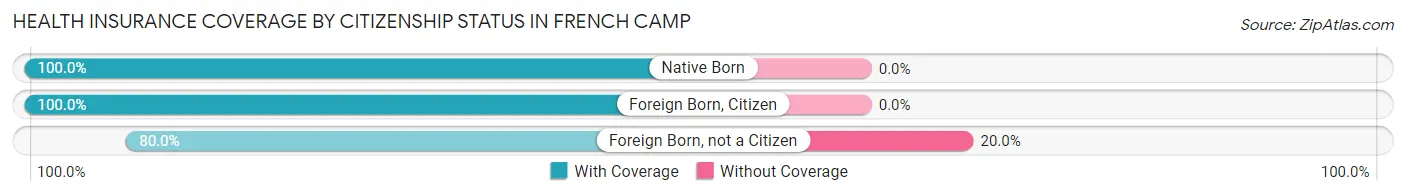
| Citizenship Status | With Coverage | Without Coverage |
| Native Born | 215 (100.0%) | 0 (0.0%) |
| Foreign Born, Citizen | 380 (100.0%) | 0 (0.0%) |
| Foreign Born, not a Citizen | 104 (80.0%) | 26 (20.0%) |
Health Insurance Coverage by Household Income in French Camp
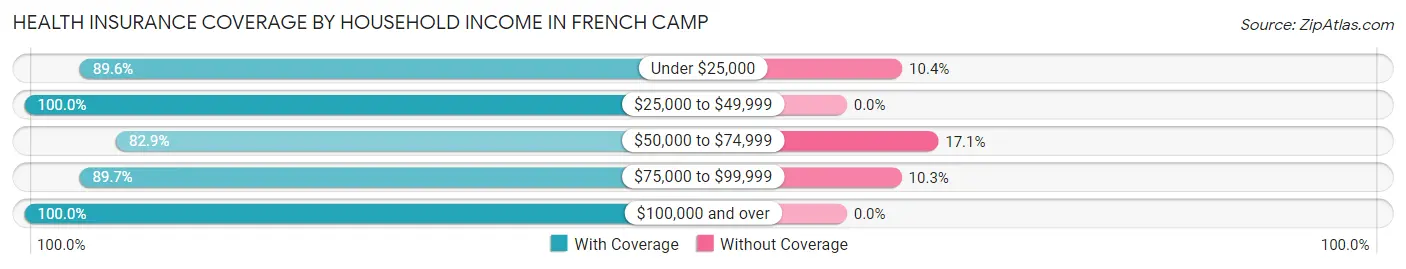
| Household Income | With Coverage | Without Coverage |
| Under $25,000 | 147 (89.6%) | 17 (10.4%) |
| $25,000 to $49,999 | 277 (100.0%) | 0 (0.0%) |
| $50,000 to $74,999 | 203 (82.9%) | 42 (17.1%) |
| $75,000 to $99,999 | 192 (89.7%) | 22 (10.3%) |
| $100,000 and over | 444 (100.0%) | 0 (0.0%) |
Public vs Private Health Insurance Coverage by Age in French Camp
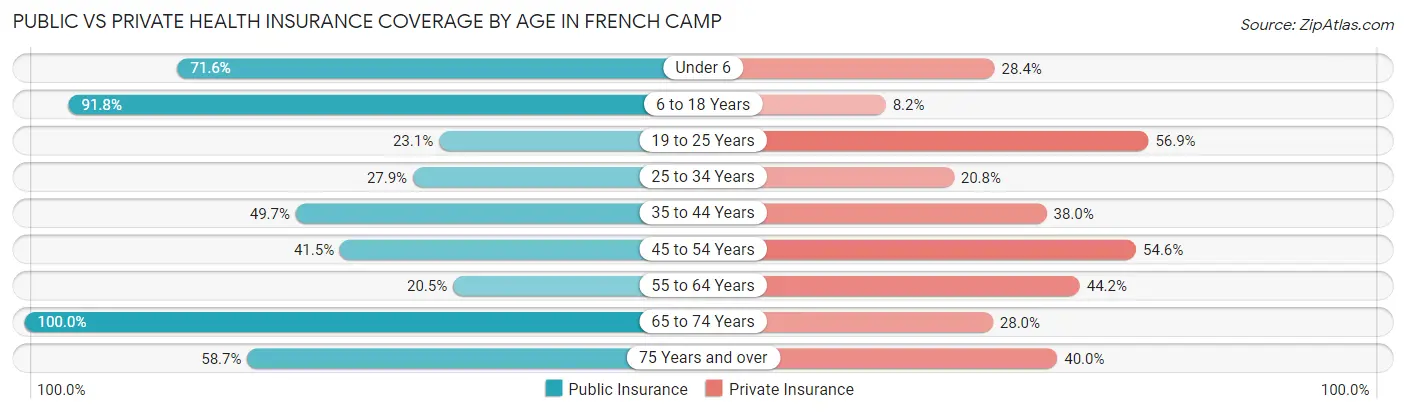
| Age Bracket | Public Insurance | Private Insurance |
| Under 6 | 154 (71.6%) | 61 (28.4%) |
| 6 to 18 Years | 349 (91.8%) | 31 (8.2%) |
| 19 to 25 Years | 30 (23.1%) | 74 (56.9%) |
| 25 to 34 Years | 141 (27.9%) | 105 (20.8%) |
| 35 to 44 Years | 145 (49.7%) | 111 (38.0%) |
| 45 to 54 Years | 85 (41.5%) | 112 (54.6%) |
| 55 to 64 Years | 102 (20.5%) | 220 (44.2%) |
| 65 to 74 Years | 107 (100.0%) | 30 (28.0%) |
| 75 Years and over | 88 (58.7%) | 60 (40.0%) |
| Total | 1,201 (48.4%) | 804 (32.4%) |
Disability Status by Sex by Age in French Camp
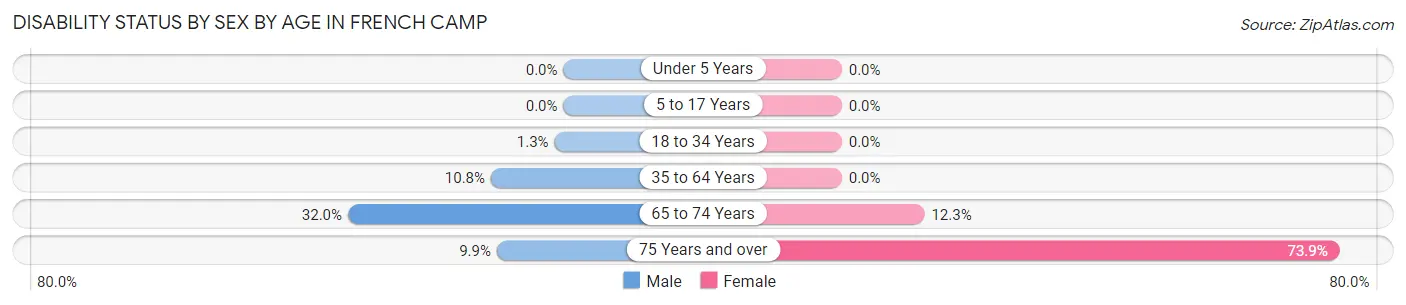
| Age Bracket | Male | Female |
| Under 5 Years | 0 (0.0%) | 0 (0.0%) |
| 5 to 17 Years | 0 (0.0%) | 0 (0.0%) |
| 18 to 34 Years | 5 (1.3%) | 0 (0.0%) |
| 35 to 64 Years | 65 (10.8%) | 0 (0.0%) |
| 65 to 74 Years | 16 (32.0%) | 7 (12.3%) |
| 75 Years and over | 8 (9.9%) | 51 (73.9%) |
Disability Class by Sex by Age in French Camp
Disability Class: Hearing Difficulty
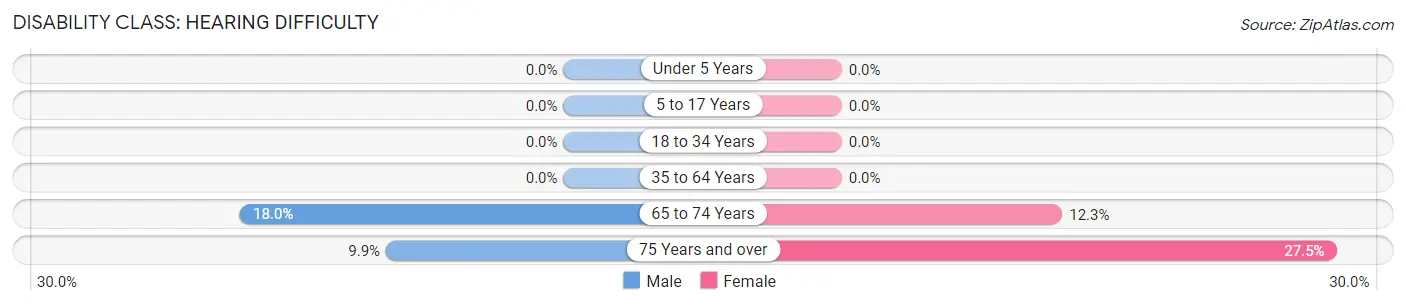
| Age Bracket | Male | Female |
| Under 5 Years | 0 (0.0%) | 0 (0.0%) |
| 5 to 17 Years | 0 (0.0%) | 0 (0.0%) |
| 18 to 34 Years | 0 (0.0%) | 0 (0.0%) |
| 35 to 64 Years | 0 (0.0%) | 0 (0.0%) |
| 65 to 74 Years | 9 (18.0%) | 7 (12.3%) |
| 75 Years and over | 8 (9.9%) | 19 (27.5%) |
Disability Class: Vision Difficulty
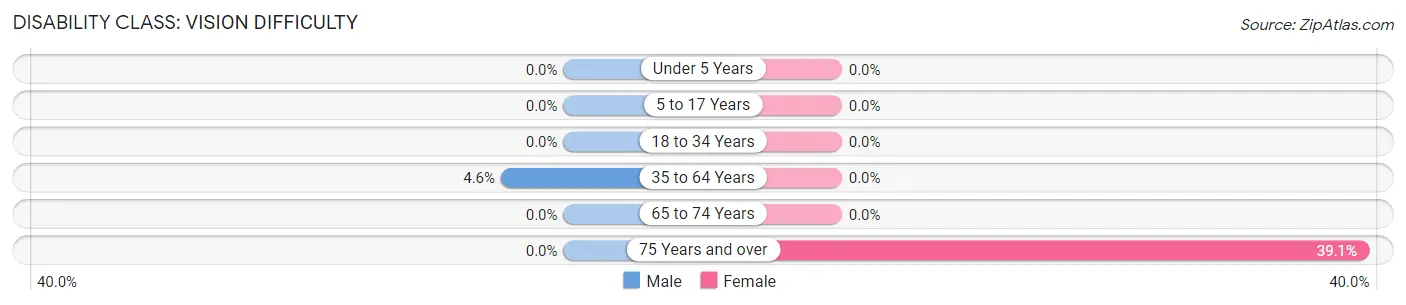
| Age Bracket | Male | Female |
| Under 5 Years | 0 (0.0%) | 0 (0.0%) |
| 5 to 17 Years | 0 (0.0%) | 0 (0.0%) |
| 18 to 34 Years | 0 (0.0%) | 0 (0.0%) |
| 35 to 64 Years | 28 (4.6%) | 0 (0.0%) |
| 65 to 74 Years | 0 (0.0%) | 0 (0.0%) |
| 75 Years and over | 0 (0.0%) | 27 (39.1%) |
Disability Class: Cognitive Difficulty
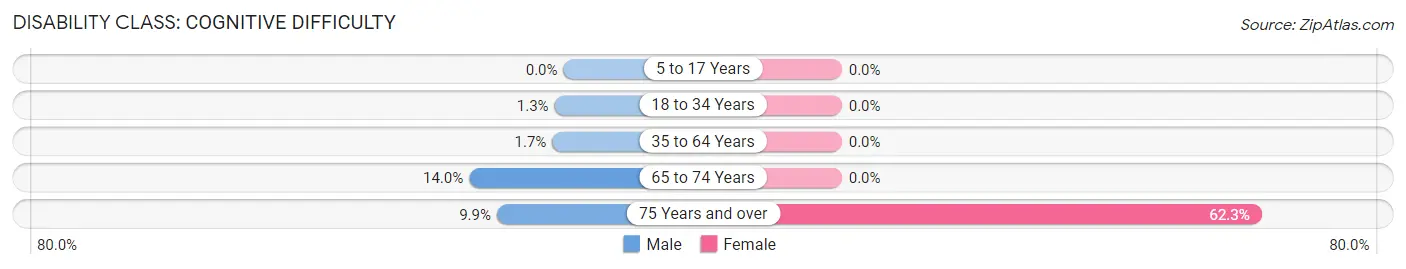
| Age Bracket | Male | Female |
| 5 to 17 Years | 0 (0.0%) | 0 (0.0%) |
| 18 to 34 Years | 5 (1.3%) | 0 (0.0%) |
| 35 to 64 Years | 10 (1.7%) | 0 (0.0%) |
| 65 to 74 Years | 7 (14.0%) | 0 (0.0%) |
| 75 Years and over | 8 (9.9%) | 43 (62.3%) |
Disability Class: Ambulatory Difficulty
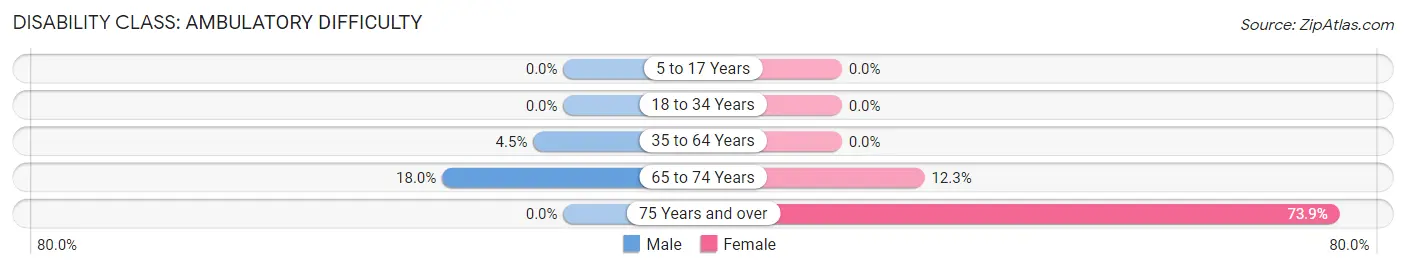
| Age Bracket | Male | Female |
| 5 to 17 Years | 0 (0.0%) | 0 (0.0%) |
| 18 to 34 Years | 0 (0.0%) | 0 (0.0%) |
| 35 to 64 Years | 27 (4.5%) | 0 (0.0%) |
| 65 to 74 Years | 9 (18.0%) | 7 (12.3%) |
| 75 Years and over | 0 (0.0%) | 51 (73.9%) |
Disability Class: Self-Care Difficulty
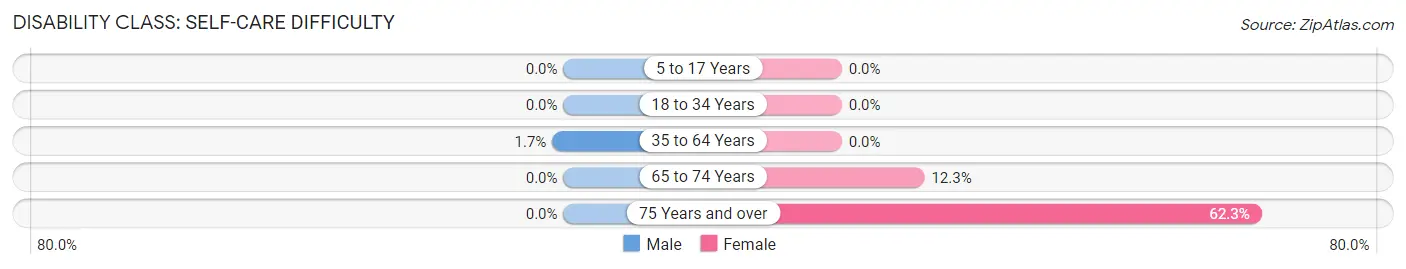
| Age Bracket | Male | Female |
| 5 to 17 Years | 0 (0.0%) | 0 (0.0%) |
| 18 to 34 Years | 0 (0.0%) | 0 (0.0%) |
| 35 to 64 Years | 10 (1.7%) | 0 (0.0%) |
| 65 to 74 Years | 0 (0.0%) | 7 (12.3%) |
| 75 Years and over | 0 (0.0%) | 43 (62.3%) |
Technology Access in French Camp
Computing Device Access in French Camp
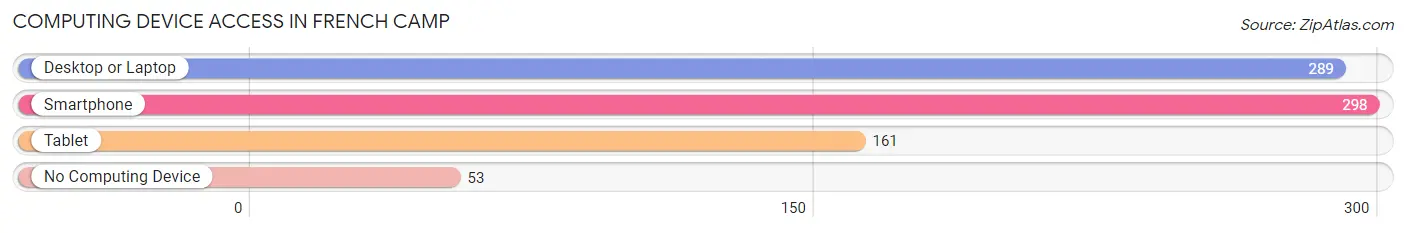
| Device Type | # Households | % Households |
| Desktop or Laptop | 289 | 73.0% |
| Smartphone | 298 | 75.2% |
| Tablet | 161 | 40.7% |
| No Computing Device | 53 | 13.4% |
| Total | 396 | 100.0% |
Internet Access in French Camp
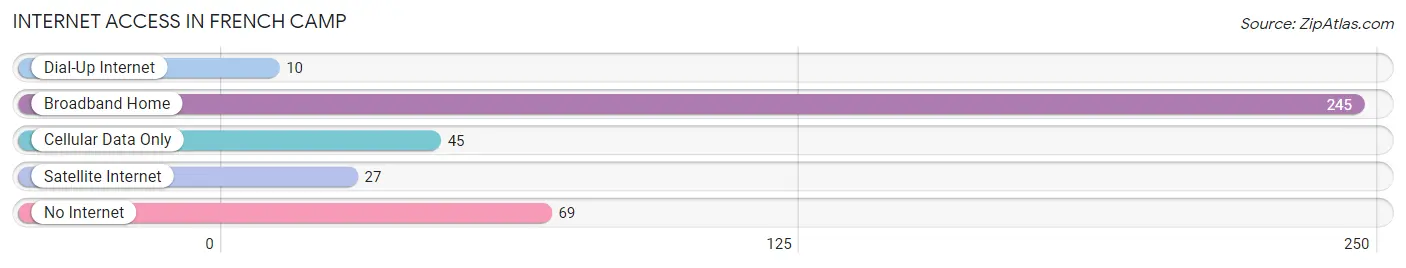
| Internet Type | # Households | % Households |
| Dial-Up Internet | 10 | 2.5% |
| Broadband Home | 245 | 61.9% |
| Cellular Data Only | 45 | 11.4% |
| Satellite Internet | 27 | 6.8% |
| No Internet | 69 | 17.4% |
| Total | 396 | 100.0% |
French Camp Summary
History
French Camp is an unincorporated community located in San Joaquin County, California. It is situated along the Stanislaus River, approximately 10 miles south of Stockton. The area was originally inhabited by the Yokut Indians, who were later displaced by Spanish settlers in the late 1700s. The area was named after a French-Canadian trapper, Jean Baptiste Charbonneau, who was the son of Sacagawea and Toussaint Charbonneau.
The area was first settled in 1844 by a group of French-Canadian immigrants, who established a trading post and a small settlement. The settlement was known as French Camp, and it quickly grew into a thriving community. The town was home to a variety of businesses, including a blacksmith, a general store, a saloon, and a hotel.
In 1848, the town was incorporated as a municipality. The town was home to a variety of industries, including a brickyard, a sawmill, and a flour mill. The town also had a post office, a school, and a church.
In the late 1800s, the town began to decline due to the depletion of the local timber resources. The town was eventually abandoned in the early 1900s. In the 1950s, the town was re-established as a residential community.
Geography
French Camp is located in San Joaquin County, California. It is situated along the Stanislaus River, approximately 10 miles south of Stockton. The town is located in the Central Valley region of California, which is known for its fertile soil and mild climate.
The town is surrounded by rolling hills and farmland. The area is home to a variety of wildlife, including deer, coyotes, and wild turkeys. The town is also home to a variety of birds, including hawks, owls, and quail.
Economy
The economy of French Camp is largely based on agriculture. The area is home to a variety of crops, including corn, wheat, and alfalfa. The town is also home to a variety of livestock, including cattle, sheep, and horses.
The town is also home to a variety of businesses, including a grocery store, a hardware store, and a gas station. The town is also home to a variety of restaurants, including Mexican, Italian, and Chinese.
Demographics
As of the 2010 census, the population of French Camp was 1,845. The population is largely composed of white (83.3%) and Hispanic (14.2%) residents. The median age of the population is 37.7 years. The median household income is $45,938.
The town is served by the Stockton Unified School District. The town is home to a variety of churches, including Catholic, Baptist, and Methodist. The town is also home to a variety of parks, including French Camp Park and Stanislaus River Park.
Common Questions
What is Per Capita Income in French Camp?
Per Capita income in French Camp is $17,857.
What is the Median Family Income in French Camp?
Median Family Income in French Camp is $68,194.
What is the Median Household income in French Camp?
Median Household Income in French Camp is $69,444.
What is Income or Wage Gap in French Camp?
Income or Wage Gap in French Camp is 10.0%.
Women in French Camp earn 90.0 cents for every dollar earned by a man.
What is Inequality or Gini Index in French Camp?
Inequality or Gini Index in French Camp is 0.37.
What is the Total Population of French Camp?
Total Population of French Camp is 3,860.
What is the Total Male Population of French Camp?
Total Male Population of French Camp is 2,681.
What is the Total Female Population of French Camp?
Total Female Population of French Camp is 1,179.
What is the Ratio of Males per 100 Females in French Camp?
There are 227.40 Males per 100 Females in French Camp.
What is the Ratio of Females per 100 Males in French Camp?
There are 43.98 Females per 100 Males in French Camp.
What is the Median Population Age in French Camp?
Median Population Age in French Camp is 36.4 Years.
What is the Average Family Size in French Camp
Average Family Size in French Camp is 3.6 People.
What is the Average Household Size in French Camp
Average Household Size in French Camp is 3.4 People.
How Large is the Labor Force in French Camp?
There are 1,390 People in the Labor Forcein in French Camp.
What is the Percentage of People in the Labor Force in French Camp?
41.2% of People are in the Labor Force in French Camp.
What is the Unemployment Rate in French Camp?
Unemployment Rate in French Camp is 1.8%.