Fort Bidwell, CA Map & Demographics
Fort Bidwell Map
Fort Bidwell Overview
$24,376
PER CAPITA INCOME
$22,617
FAMILY INCOME DEFICIT
0.46
INEQUALITY / GINI INDEX
169
TOTAL POPULATION
99
MALE POPULATION
70
FEMALE POPULATION
141.43
MALES / 100 FEMALES
70.71
FEMALES / 100 MALES
31.5
MEDIAN AGE
3.4
AVG FAMILY SIZE
2.8
AVG HOUSEHOLD SIZE
81
LABOR FORCE [ PEOPLE ]
57.9%
PERCENT IN LABOR FORCE
11.1%
UNEMPLOYMENT RATE
Fort Bidwell Zip Codes
Fort Bidwell Area Codes
Income in Fort Bidwell
Income Overview in Fort Bidwell
| Characteristic | Number | Measure |
| Per Capita Income | 169 | $24,376 |
| Median Family Income | 38 | $0 |
| Mean Family Income | 38 | $68,063 |
| Median Household Income | 60 | $0 |
| Mean Household Income | 60 | $52,383 |
| Income Deficit | 38 | $22,617 |
| Wage / Income Gap (%) | 169 | 0.00% |
| Wage / Income Gap ($) | 169 | 100.00¢ per $1 |
| Gini / Inequality Index | 169 | 0.46 |
Earnings by Sex in Fort Bidwell
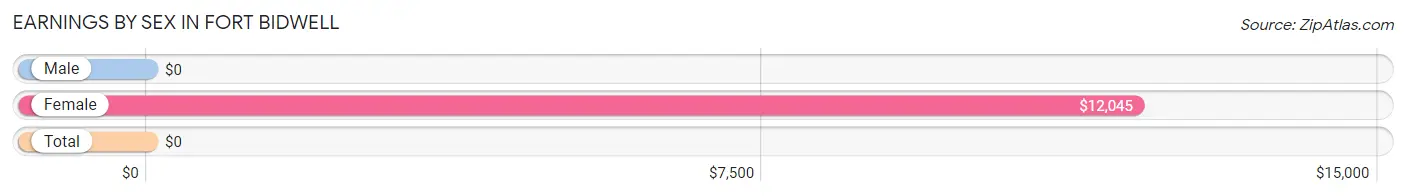
| Sex | Number | Average Earnings |
| Male | 57 (72.2%) | $0 |
| Female | 22 (27.9%) | $12,045 |
| Total | 79 (100.0%) | $0 |
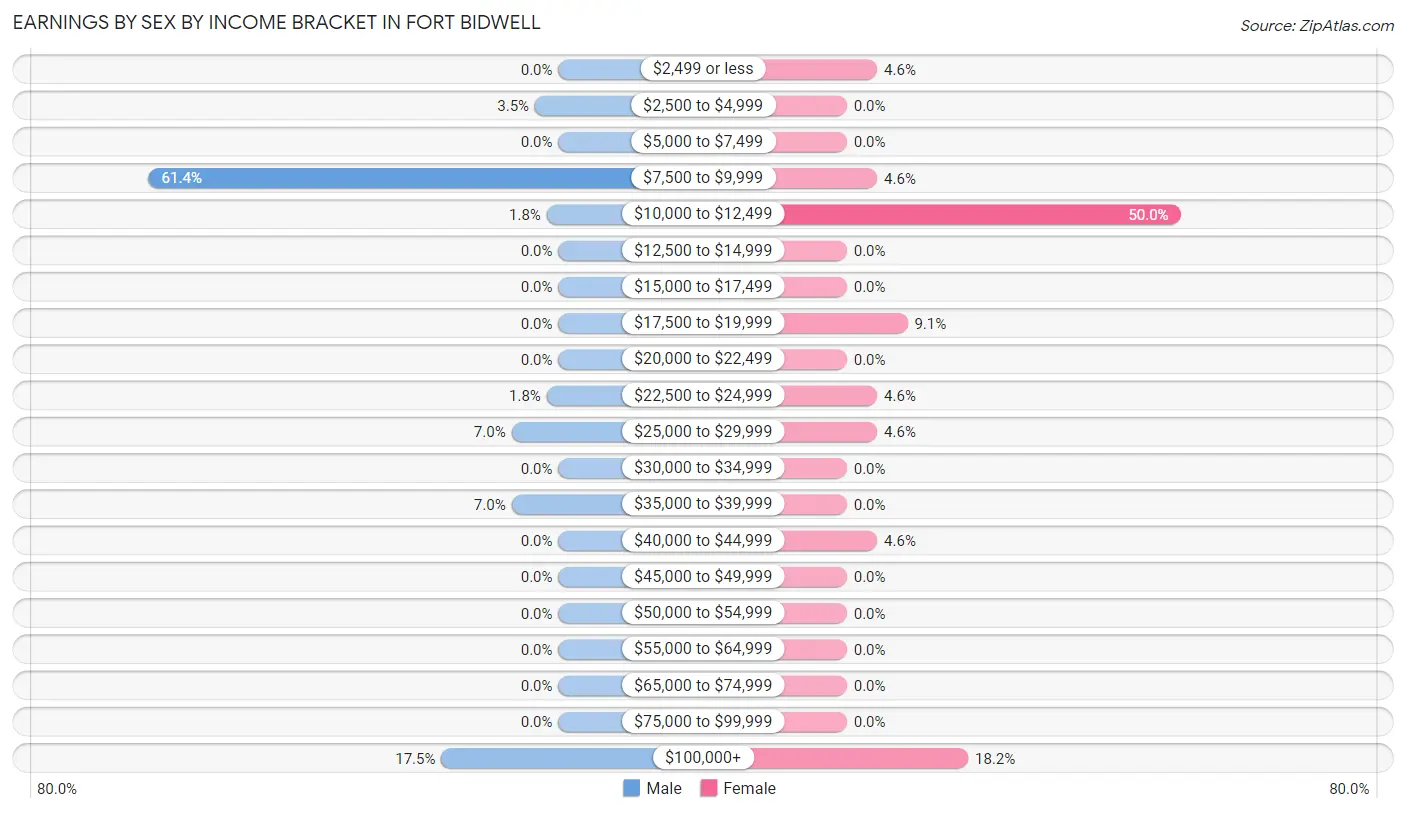
Earnings by Sex by Income Bracket in Fort Bidwell
The most common earnings brackets in Fort Bidwell are $7,500 to $9,999 for men (35 | 61.4%) and $10,000 to $12,499 for women (11 | 50.0%).
| Income | Male | Female |
| $2,499 or less | 0 (0.0%) | 1 (4.5%) |
| $2,500 to $4,999 | 2 (3.5%) | 0 (0.0%) |
| $5,000 to $7,499 | 0 (0.0%) | 0 (0.0%) |
| $7,500 to $9,999 | 35 (61.4%) | 1 (4.5%) |
| $10,000 to $12,499 | 1 (1.8%) | 11 (50.0%) |
| $12,500 to $14,999 | 0 (0.0%) | 0 (0.0%) |
| $15,000 to $17,499 | 0 (0.0%) | 0 (0.0%) |
| $17,500 to $19,999 | 0 (0.0%) | 2 (9.1%) |
| $20,000 to $22,499 | 0 (0.0%) | 0 (0.0%) |
| $22,500 to $24,999 | 1 (1.8%) | 1 (4.5%) |
| $25,000 to $29,999 | 4 (7.0%) | 1 (4.5%) |
| $30,000 to $34,999 | 0 (0.0%) | 0 (0.0%) |
| $35,000 to $39,999 | 4 (7.0%) | 0 (0.0%) |
| $40,000 to $44,999 | 0 (0.0%) | 1 (4.5%) |
| $45,000 to $49,999 | 0 (0.0%) | 0 (0.0%) |
| $50,000 to $54,999 | 0 (0.0%) | 0 (0.0%) |
| $55,000 to $64,999 | 0 (0.0%) | 0 (0.0%) |
| $65,000 to $74,999 | 0 (0.0%) | 0 (0.0%) |
| $75,000 to $99,999 | 0 (0.0%) | 0 (0.0%) |
| $100,000+ | 10 (17.5%) | 4 (18.2%) |
| Total | 57 (100.0%) | 22 (100.0%) |
Earnings by Sex by Educational Attainment in Fort Bidwell
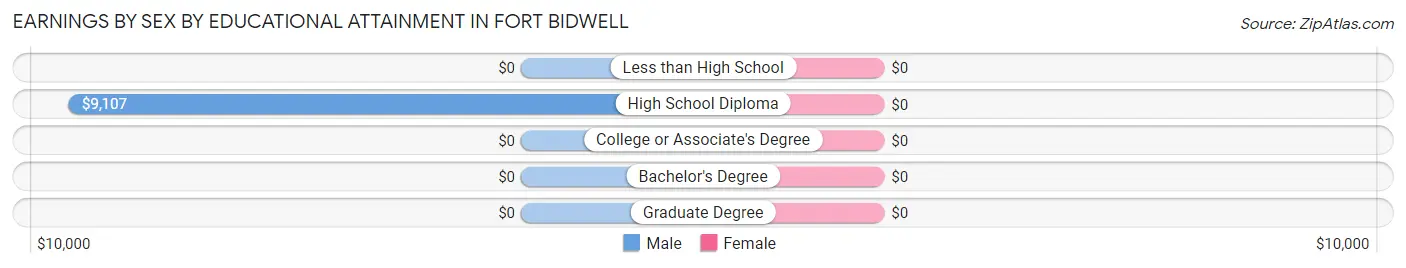
| Educational Attainment | Male Income | Female Income |
| Less than High School | - | - |
| High School Diploma | $9,107 | $0 |
| College or Associate's Degree | - | - |
| Bachelor's Degree | - | - |
| Graduate Degree | - | - |
| Total | - | - |
Family Income in Fort Bidwell
Family Income Brackets in Fort Bidwell
According to the Fort Bidwell family income data, there are 9 families falling into the $100,000 to $149,999 income range, which is the most common income bracket and makes up 23.7% of all families.
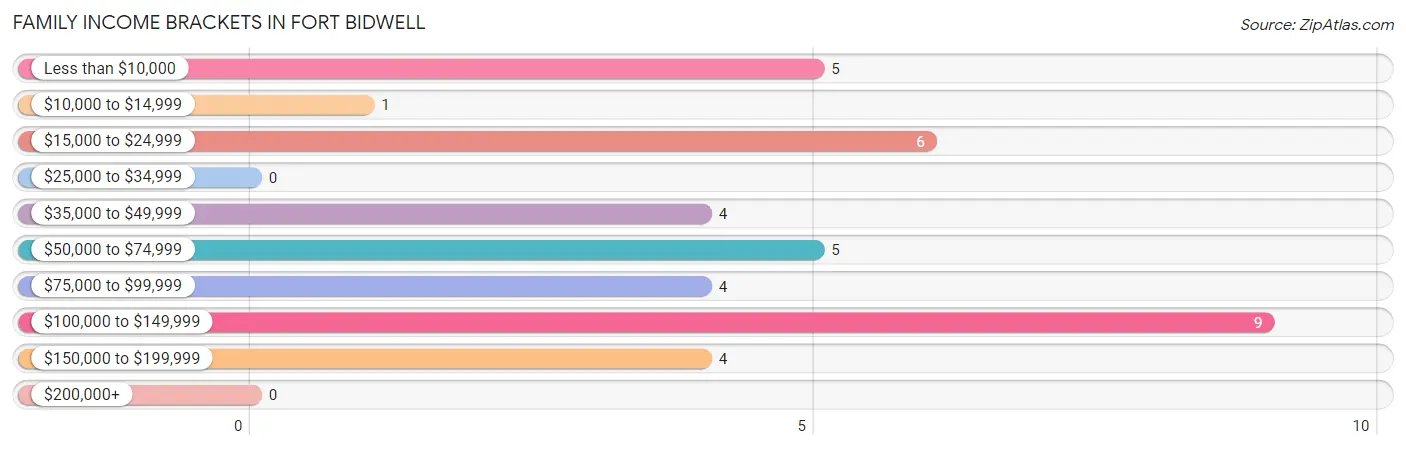
| Income Bracket | # Families | % Families |
| Less than $10,000 | 5 | 13.2% |
| $10,000 to $14,999 | 1 | 2.6% |
| $15,000 to $24,999 | 6 | 15.8% |
| $25,000 to $34,999 | 0 | 0.0% |
| $35,000 to $49,999 | 4 | 10.5% |
| $50,000 to $74,999 | 5 | 13.2% |
| $75,000 to $99,999 | 4 | 10.5% |
| $100,000 to $149,999 | 9 | 23.7% |
| $150,000 to $199,999 | 4 | 10.5% |
| $200,000+ | 0 | 0.0% |
Family Income by Famaliy Size in Fort Bidwell
| Income Bracket | # Families | Median Income |
| 2-Person Families | 28 (73.7%) | $0 |
| 3-Person Families | 0 (0.0%) | $0 |
| 4-Person Families | 8 (21.0%) | $0 |
| 5-Person Families | 2 (5.3%) | $0 |
| 6-Person Families | 0 (0.0%) | $0 |
| 7+ Person Families | 0 (0.0%) | $0 |
| Total | 38 (100.0%) | $0 |
Family Income by Number of Earners in Fort Bidwell
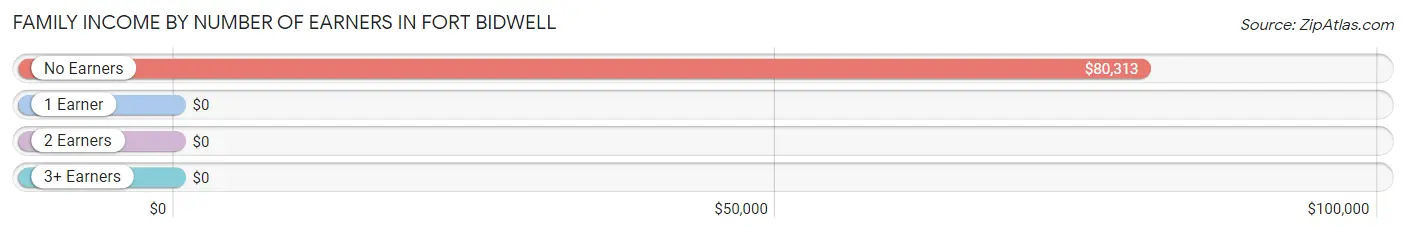
| Number of Earners | # Families | Median Income |
| No Earners | 17 (44.7%) | $80,313 |
| 1 Earner | 16 (42.1%) | $0 |
| 2 Earners | 5 (13.2%) | $0 |
| 3+ Earners | 0 (0.0%) | $0 |
| Total | 38 (100.0%) | $0 |
Household Income in Fort Bidwell
Household Income Brackets in Fort Bidwell
With 10 households falling in the category, the $35,000 to $49,999 income range is the most frequent in Fort Bidwell, accounting for 16.7% of all households.
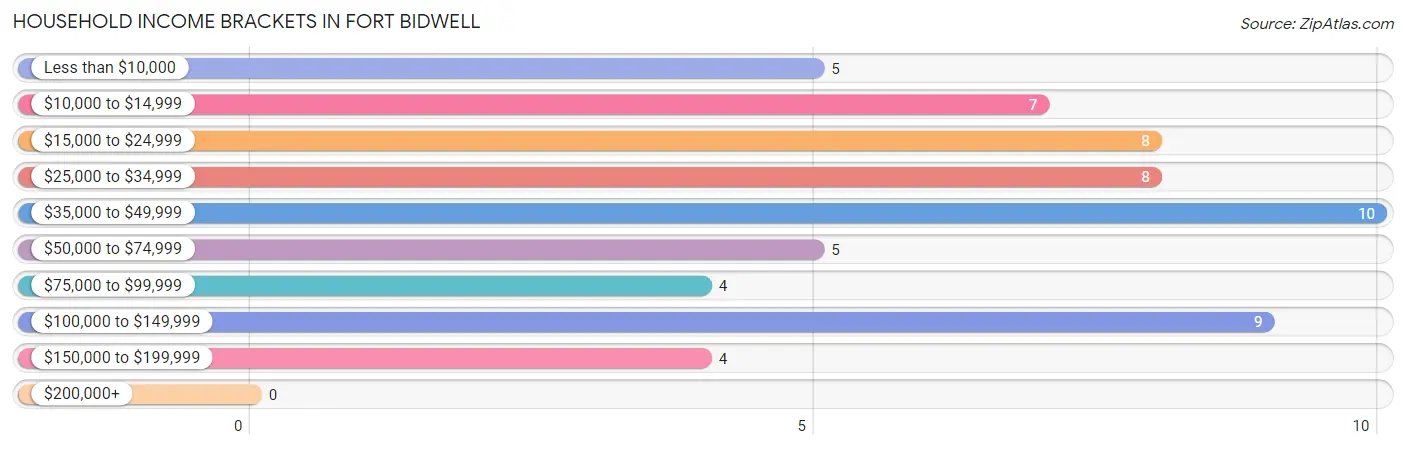
| Income Bracket | # Households | % Households |
| Less than $10,000 | 5 | 8.3% |
| $10,000 to $14,999 | 7 | 11.7% |
| $15,000 to $24,999 | 8 | 13.3% |
| $25,000 to $34,999 | 8 | 13.3% |
| $35,000 to $49,999 | 10 | 16.7% |
| $50,000 to $74,999 | 5 | 8.3% |
| $75,000 to $99,999 | 4 | 6.7% |
| $100,000 to $149,999 | 9 | 15.0% |
| $150,000 to $199,999 | 4 | 6.7% |
| $200,000+ | 0 | 0.0% |
Household Income by Householder Age in Fort Bidwell
| Income Bracket | # Households | Median Income |
| 15 to 24 Years | 0 (0.0%) | $0 |
| 25 to 44 Years | 12 (20.0%) | $0 |
| 45 to 64 Years | 17 (28.3%) | $0 |
| 65+ Years | 31 (51.7%) | $0 |
| Total | 60 (100.0%) | $0 |
Poverty in Fort Bidwell
Income Below Poverty by Sex and Age in Fort Bidwell
With 18.2% poverty level for males and 45.7% for females among the residents of Fort Bidwell, 6 to 11 year old males and under 5 year old females are the most vulnerable to poverty, with 2 males (100.0%) and 5 females (100.0%) in their respective age groups living below the poverty level.
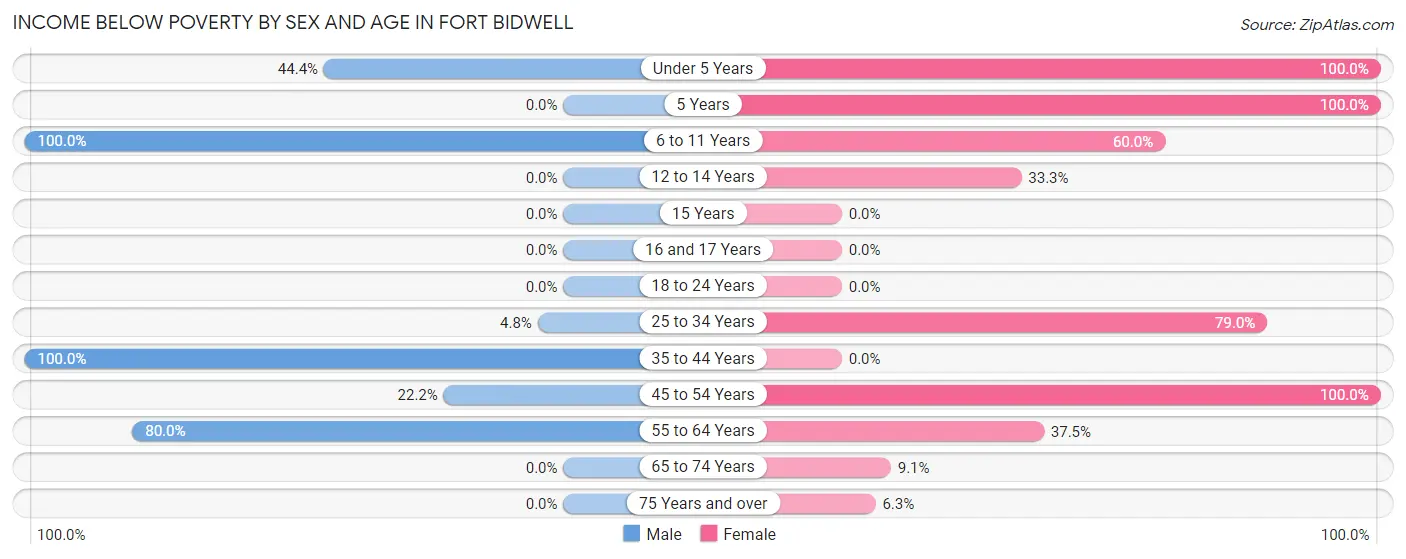
| Age Bracket | Male | Female |
| Under 5 Years | 4 (44.4%) | 5 (100.0%) |
| 5 Years | 0 (0.0%) | 2 (100.0%) |
| 6 to 11 Years | 2 (100.0%) | 3 (60.0%) |
| 12 to 14 Years | 0 (0.0%) | 1 (33.3%) |
| 15 Years | 0 (0.0%) | 0 (0.0%) |
| 16 and 17 Years | 0 (0.0%) | 0 (0.0%) |
| 18 to 24 Years | 0 (0.0%) | 0 (0.0%) |
| 25 to 34 Years | 2 (4.8%) | 15 (78.9%) |
| 35 to 44 Years | 2 (100.0%) | 0 (0.0%) |
| 45 to 54 Years | 4 (22.2%) | 1 (100.0%) |
| 55 to 64 Years | 4 (80.0%) | 3 (37.5%) |
| 65 to 74 Years | 0 (0.0%) | 1 (9.1%) |
| 75 Years and over | 0 (0.0%) | 1 (6.2%) |
| Total | 18 (18.2%) | 32 (45.7%) |
Income Above Poverty by Sex and Age in Fort Bidwell
According to the poverty statistics in Fort Bidwell, males aged 12 to 14 years and females aged 75 years and over are the age groups that are most secure financially, with 100.0% of males and 93.8% of females in these age groups living above the poverty line.
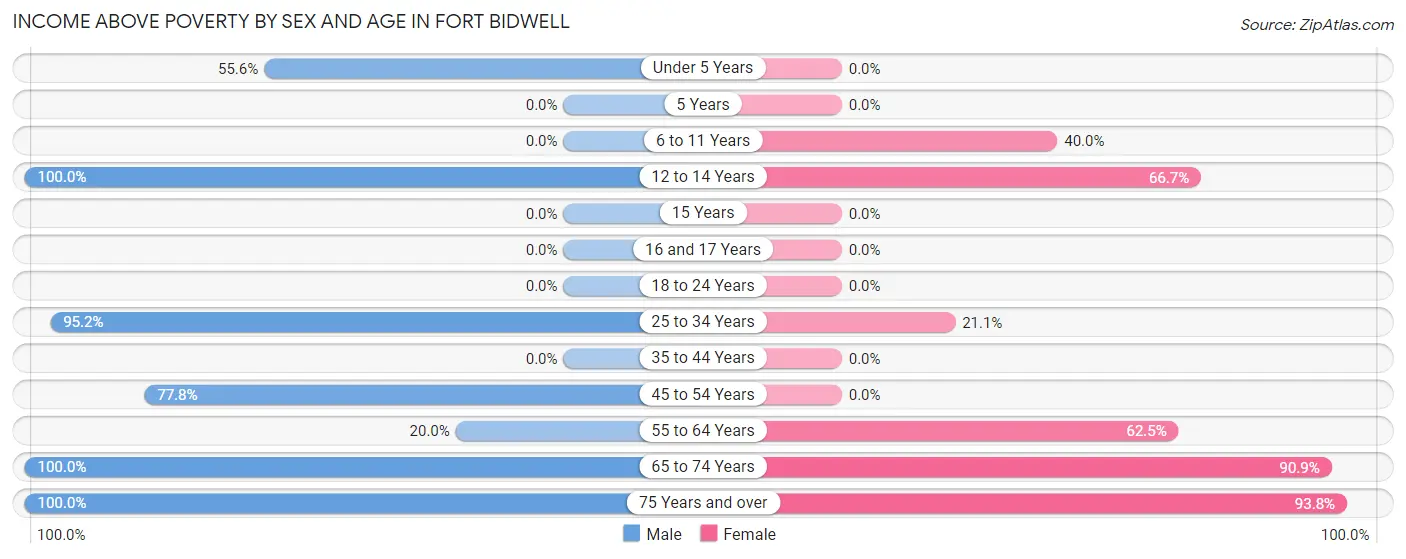
| Age Bracket | Male | Female |
| Under 5 Years | 5 (55.6%) | 0 (0.0%) |
| 5 Years | 0 (0.0%) | 0 (0.0%) |
| 6 to 11 Years | 0 (0.0%) | 2 (40.0%) |
| 12 to 14 Years | 3 (100.0%) | 2 (66.7%) |
| 15 Years | 0 (0.0%) | 0 (0.0%) |
| 16 and 17 Years | 0 (0.0%) | 0 (0.0%) |
| 18 to 24 Years | 0 (0.0%) | 0 (0.0%) |
| 25 to 34 Years | 40 (95.2%) | 4 (21.0%) |
| 35 to 44 Years | 0 (0.0%) | 0 (0.0%) |
| 45 to 54 Years | 14 (77.8%) | 0 (0.0%) |
| 55 to 64 Years | 1 (20.0%) | 5 (62.5%) |
| 65 to 74 Years | 8 (100.0%) | 10 (90.9%) |
| 75 Years and over | 10 (100.0%) | 15 (93.8%) |
| Total | 81 (81.8%) | 38 (54.3%) |
Income Below Poverty Among Married-Couple Families in Fort Bidwell
| Children | Above Poverty | Below Poverty |
| No Children | 17 (100.0%) | 0 (0.0%) |
| 1 or 2 Children | 4 (100.0%) | 0 (0.0%) |
| 3 or 4 Children | 1 (100.0%) | 0 (0.0%) |
| 5 or more Children | 0 (0.0%) | 0 (0.0%) |
| Total | 22 (100.0%) | 0 (0.0%) |
Income Below Poverty Among Single-Parent Households in Fort Bidwell
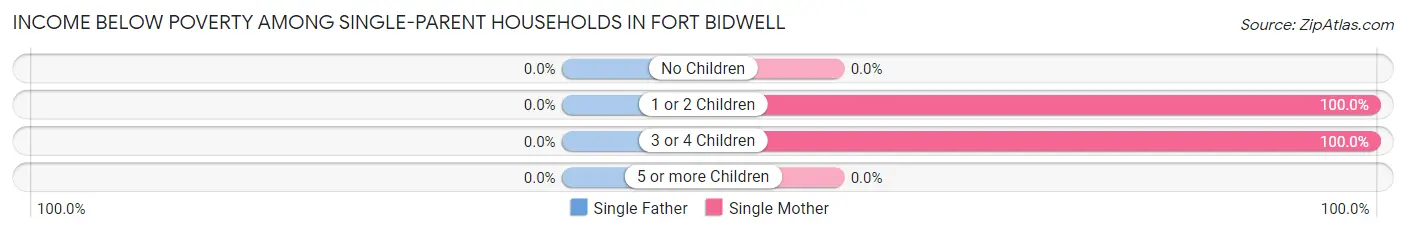
| Children | Single Father | Single Mother |
| No Children | 0 (0.0%) | 0 (0.0%) |
| 1 or 2 Children | 0 (0.0%) | 1 (100.0%) |
| 3 or 4 Children | 0 (0.0%) | 5 (100.0%) |
| 5 or more Children | 0 (0.0%) | 0 (0.0%) |
| Total | 0 (0.0%) | 6 (37.5%) |
Income Below Poverty Among Married-Couple vs Single-Parent Households in Fort Bidwell
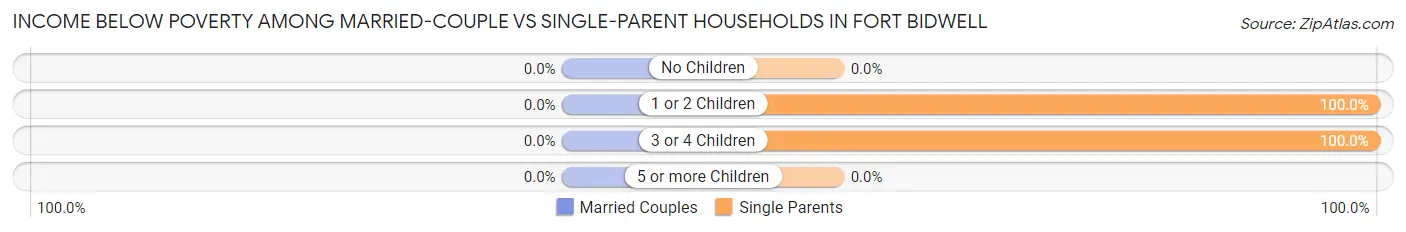
| Children | Married-Couple Families | Single-Parent Households |
| No Children | 0 (0.0%) | 0 (0.0%) |
| 1 or 2 Children | 0 (0.0%) | 1 (100.0%) |
| 3 or 4 Children | 0 (0.0%) | 5 (100.0%) |
| 5 or more Children | 0 (0.0%) | 0 (0.0%) |
| Total | 0 (0.0%) | 6 (37.5%) |
Race in Fort Bidwell
The most populous races in Fort Bidwell are Native / Alaskan (86 | 50.9%), White / Caucasian (79 | 46.8%), and Hispanic or Latino (14 | 8.3%).
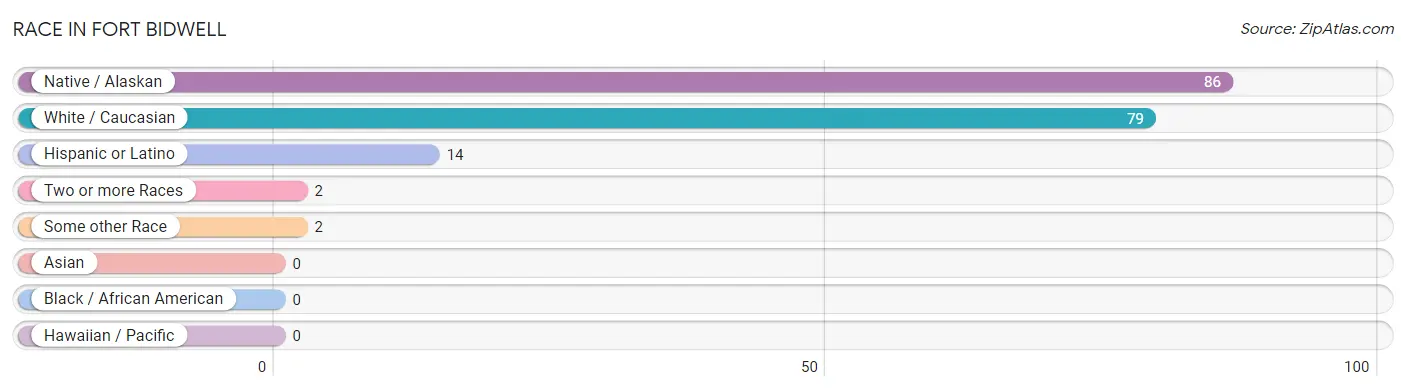
| Race | # Population | % Population |
| Asian | 0 | 0.0% |
| Black / African American | 0 | 0.0% |
| Hawaiian / Pacific | 0 | 0.0% |
| Hispanic or Latino | 14 | 8.3% |
| Native / Alaskan | 86 | 50.9% |
| White / Caucasian | 79 | 46.8% |
| Two or more Races | 2 | 1.2% |
| Some other Race | 2 | 1.2% |
| Total | 169 | 100.0% |
Ancestry in Fort Bidwell
The most populous ancestries reported in Fort Bidwell are Paiute (78 | 46.2%), Mexican (14 | 8.3%), British (13 | 7.7%), German (12 | 7.1%), and English (8 | 4.7%), together accounting for 73.9% of all Fort Bidwell residents.
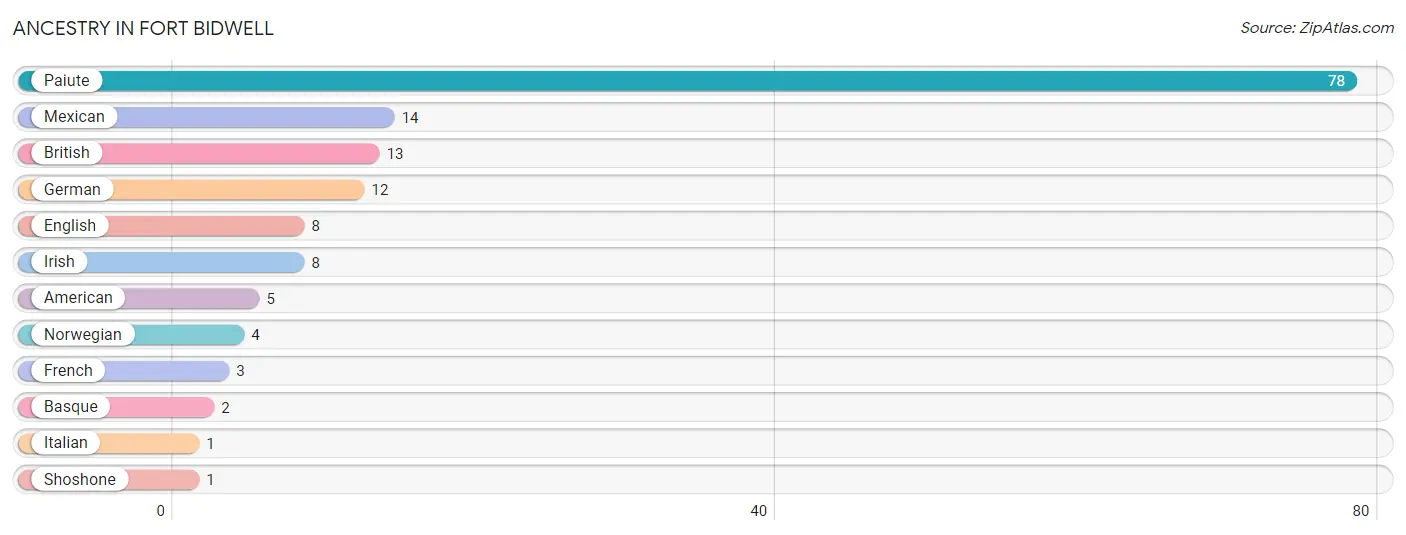
| Ancestry | # Population | % Population |
| American | 5 | 3.0% |
| Basque | 2 | 1.2% |
| British | 13 | 7.7% |
| English | 8 | 4.7% |
| French | 3 | 1.8% |
| German | 12 | 7.1% |
| Irish | 8 | 4.7% |
| Italian | 1 | 0.6% |
| Mexican | 14 | 8.3% |
| Norwegian | 4 | 2.4% |
| Paiute | 78 | 46.2% |
| Shoshone | 1 | 0.6% | View All 12 Rows |
Immigrants in Fort Bidwell

| Immigration Origin | # Population | % Population | View All 0 Rows |
Sex and Age in Fort Bidwell
Sex and Age in Fort Bidwell
The most populous age groups in Fort Bidwell are 25 to 29 Years (35 | 35.3%) for men and 25 to 29 Years (13 | 18.6%) for women.
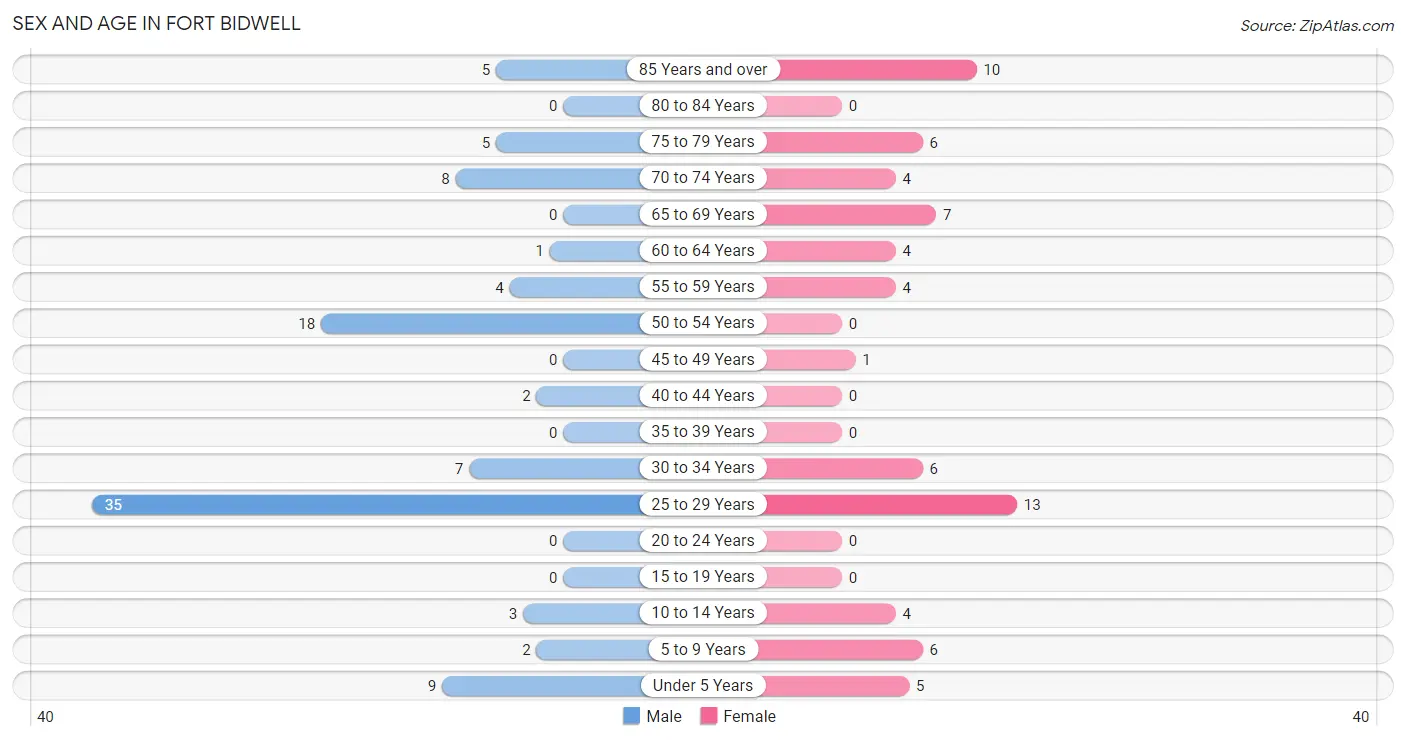
| Age Bracket | Male | Female |
| Under 5 Years | 9 (9.1%) | 5 (7.1%) |
| 5 to 9 Years | 2 (2.0%) | 6 (8.6%) |
| 10 to 14 Years | 3 (3.0%) | 4 (5.7%) |
| 15 to 19 Years | 0 (0.0%) | 0 (0.0%) |
| 20 to 24 Years | 0 (0.0%) | 0 (0.0%) |
| 25 to 29 Years | 35 (35.3%) | 13 (18.6%) |
| 30 to 34 Years | 7 (7.1%) | 6 (8.6%) |
| 35 to 39 Years | 0 (0.0%) | 0 (0.0%) |
| 40 to 44 Years | 2 (2.0%) | 0 (0.0%) |
| 45 to 49 Years | 0 (0.0%) | 1 (1.4%) |
| 50 to 54 Years | 18 (18.2%) | 0 (0.0%) |
| 55 to 59 Years | 4 (4.0%) | 4 (5.7%) |
| 60 to 64 Years | 1 (1.0%) | 4 (5.7%) |
| 65 to 69 Years | 0 (0.0%) | 7 (10.0%) |
| 70 to 74 Years | 8 (8.1%) | 4 (5.7%) |
| 75 to 79 Years | 5 (5.1%) | 6 (8.6%) |
| 80 to 84 Years | 0 (0.0%) | 0 (0.0%) |
| 85 Years and over | 5 (5.1%) | 10 (14.3%) |
| Total | 99 (100.0%) | 70 (100.0%) |
Families and Households in Fort Bidwell
Median Family Size in Fort Bidwell
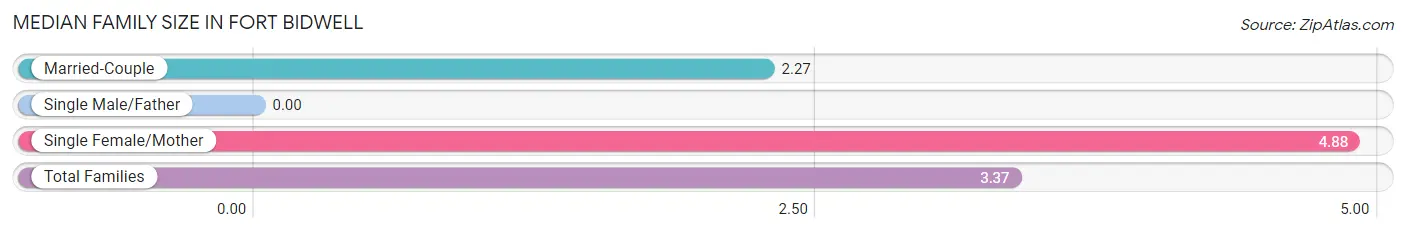
| Family Type | # Families | Family Size |
| Married-Couple | 22 (57.9%) | 2.27 |
| Single Male/Father | 0 (0.0%) | - |
| Single Female/Mother | 16 (42.1%) | 4.88 |
| Total Families | 38 (100.0%) | 3.37 |
Median Household Size in Fort Bidwell
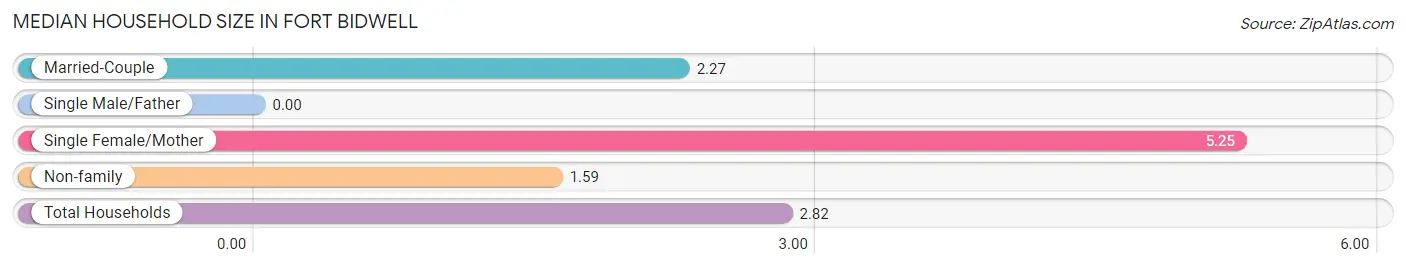
| Household Type | # Households | Household Size |
| Married-Couple | 22 (36.7%) | 2.27 |
| Single Male/Father | 0 (0.0%) | - |
| Single Female/Mother | 16 (26.7%) | 5.25 |
| Non-family | 22 (36.7%) | 1.59 |
| Total Households | 60 (100.0%) | 2.82 |
Household Size by Marriage Status in Fort Bidwell
Out of a total of 60 households in Fort Bidwell, 38 (63.3%) are family households, while 22 (36.7%) are nonfamily households. The most numerous type of family households are 2-person households, comprising 27, and the most common type of nonfamily households are 1-person households, comprising 16.
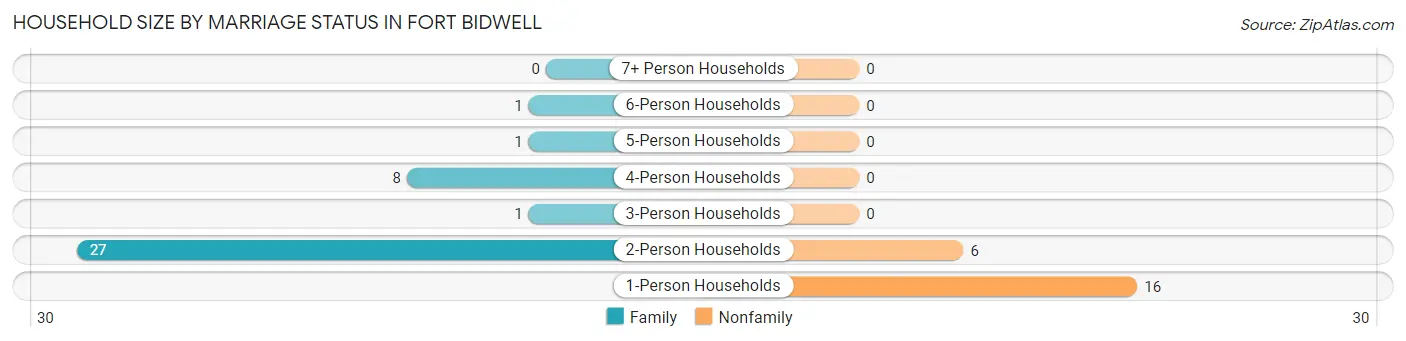
| Household Size | Family Households | Nonfamily Households |
| 1-Person Households | - | 16 (26.7%) |
| 2-Person Households | 27 (45.0%) | 6 (10.0%) |
| 3-Person Households | 1 (1.7%) | 0 (0.0%) |
| 4-Person Households | 8 (13.3%) | 0 (0.0%) |
| 5-Person Households | 1 (1.7%) | 0 (0.0%) |
| 6-Person Households | 1 (1.7%) | 0 (0.0%) |
| 7+ Person Households | 0 (0.0%) | 0 (0.0%) |
| Total | 38 (63.3%) | 22 (36.7%) |
Female Fertility in Fort Bidwell
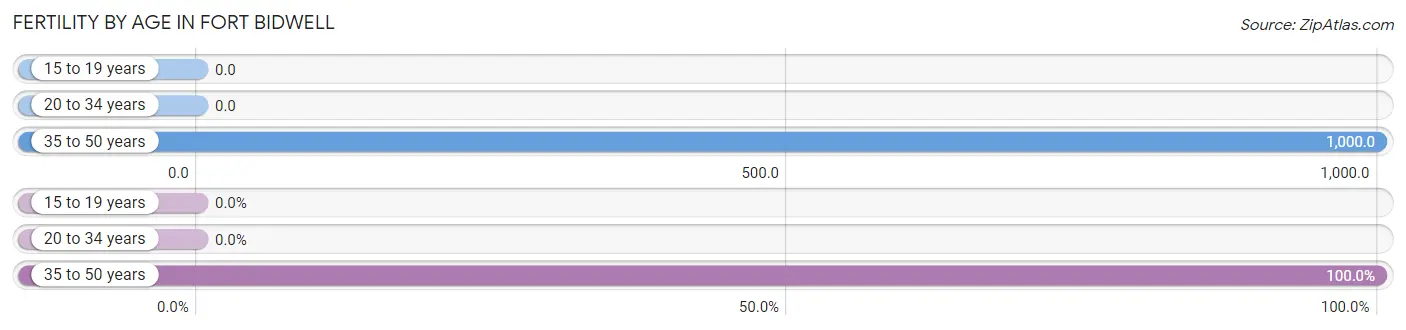
Fertility by Age in Fort Bidwell
Average fertility rate in Fort Bidwell is 50.0 births per 1,000 women. Women in the age bracket of 35 to 50 years have the highest fertility rate with 1,000.0 births per 1,000 women. Women in the age bracket of 35 to 50 years acount for 100.0% of all women with births.
| Age Bracket | Women with Births | Births / 1,000 Women |
| 15 to 19 years | 0 (0.0%) | 0.0 |
| 20 to 34 years | 0 (0.0%) | 0.0 |
| 35 to 50 years | 1 (100.0%) | 1,000.0 |
| Total | 1 (100.0%) | 50.0 |
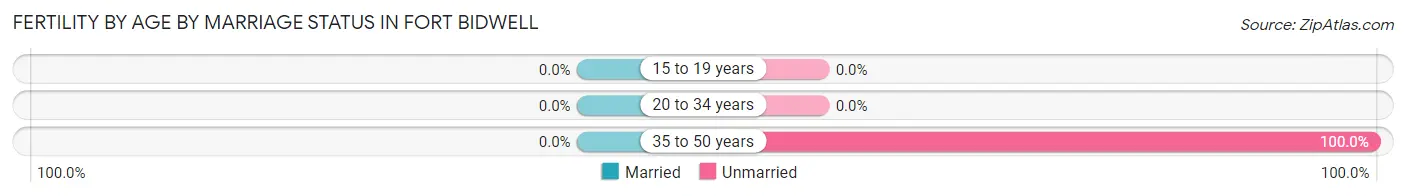
Fertility by Age by Marriage Status in Fort Bidwell
| Age Bracket | Married | Unmarried |
| 15 to 19 years | 0 (0.0%) | 0 (0.0%) |
| 20 to 34 years | 0 (0.0%) | 0 (0.0%) |
| 35 to 50 years | 0 (0.0%) | 1 (100.0%) |
| Total | 0 (0.0%) | 1 (100.0%) |
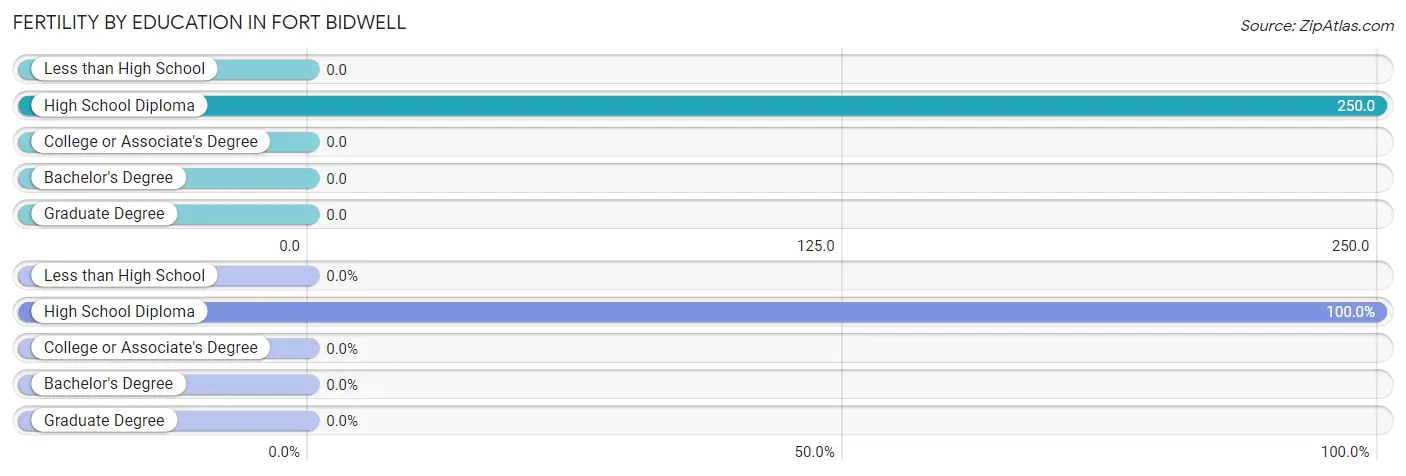
Fertility by Education in Fort Bidwell
| Educational Attainment | Women with Births | Births / 1,000 Women |
| Less than High School | 0 (0.0%) | 0.0 |
| High School Diploma | 1 (100.0%) | 250.0 |
| College or Associate's Degree | 0 (0.0%) | 0.0 |
| Bachelor's Degree | 0 (0.0%) | 0.0 |
| Graduate Degree | 0 (0.0%) | 0.0 |
| Total | 1 (100.0%) | 50.0 |
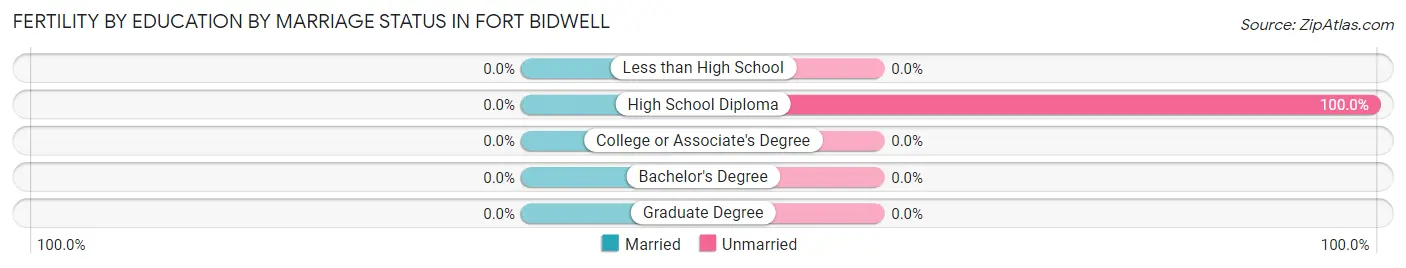
Fertility by Education by Marriage Status in Fort Bidwell
| Educational Attainment | Married | Unmarried |
| Less than High School | 0 (0.0%) | 0 (0.0%) |
| High School Diploma | 0 (0.0%) | 1 (100.0%) |
| College or Associate's Degree | 0 (0.0%) | 0 (0.0%) |
| Bachelor's Degree | 0 (0.0%) | 0 (0.0%) |
| Graduate Degree | 0 (0.0%) | 0 (0.0%) |
| Total | 0 (0.0%) | 1 (100.0%) |
Employment Characteristics in Fort Bidwell
Employment by Class of Employer in Fort Bidwell
Among the 72 employed individuals in Fort Bidwell, self-employed (not incorporated) (35 | 48.6%), private company employees (20 | 27.8%), and local government employees (12 | 16.7%) make up the most common classes of employment.
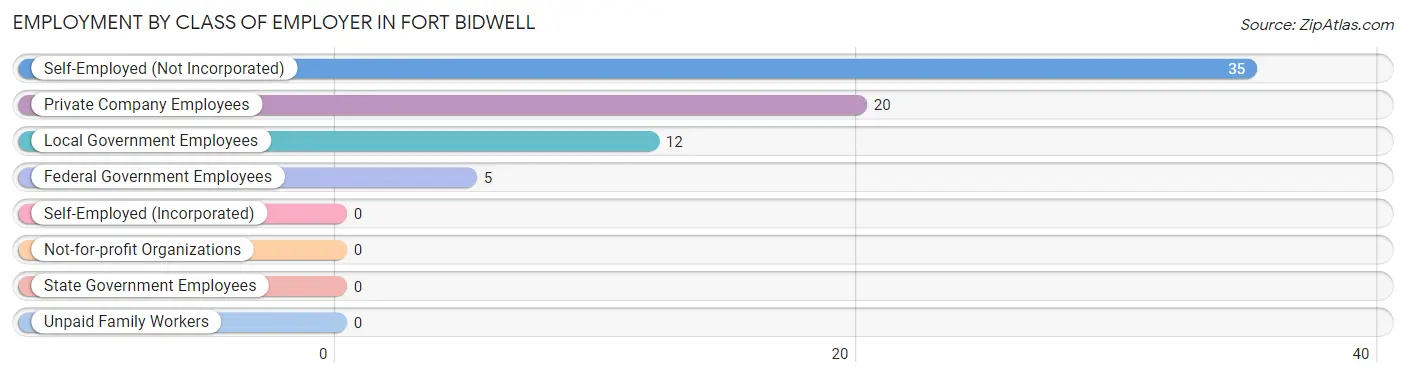
| Employer Class | # Employees | % Employees |
| Private Company Employees | 20 | 27.8% |
| Self-Employed (Incorporated) | 0 | 0.0% |
| Self-Employed (Not Incorporated) | 35 | 48.6% |
| Not-for-profit Organizations | 0 | 0.0% |
| Local Government Employees | 12 | 16.7% |
| State Government Employees | 0 | 0.0% |
| Federal Government Employees | 5 | 6.9% |
| Unpaid Family Workers | 0 | 0.0% |
| Total | 72 | 100.0% |
Employment Status by Age in Fort Bidwell
According to the labor force statistics for Fort Bidwell, out of the total population over 16 years of age (140), 57.9% or 81 individuals are in the labor force, with 11.1% or 9 of them unemployed. The age group with the highest labor force participation rate is 25 to 29 years, with 100.0% or 48 individuals in the labor force. Within the labor force, the 30 to 34 years age range has the highest percentage of unemployed individuals, with 55.6% or 5 of them being unemployed.
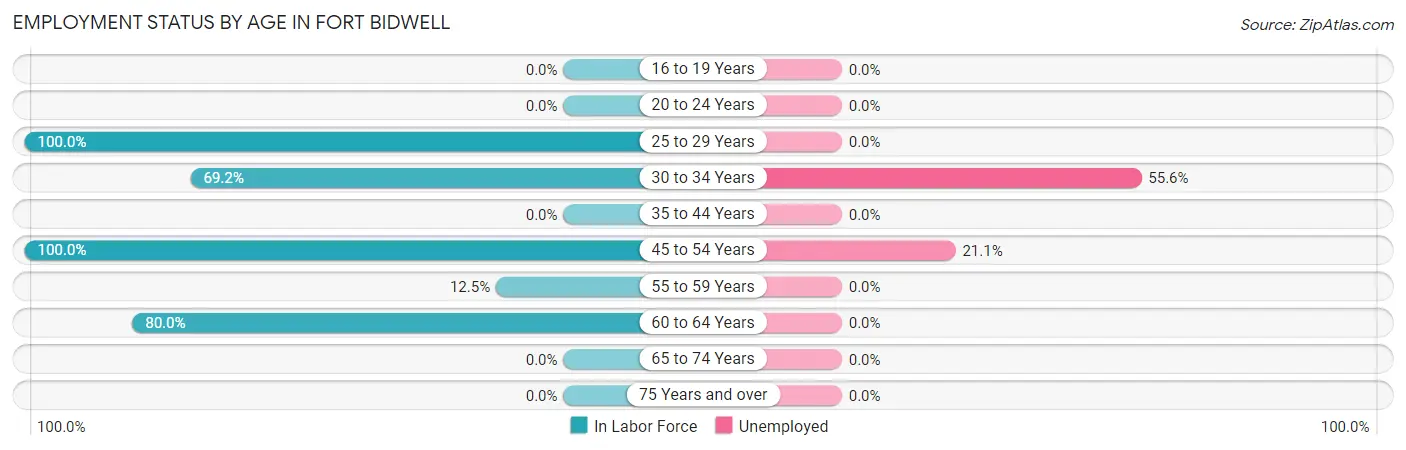
| Age Bracket | In Labor Force | Unemployed |
| 16 to 19 Years | 0 (0.0%) | 0 (0.0%) |
| 20 to 24 Years | 0 (0.0%) | 0 (0.0%) |
| 25 to 29 Years | 48 (100.0%) | 0 (0.0%) |
| 30 to 34 Years | 9 (69.2%) | 5 (55.6%) |
| 35 to 44 Years | 0 (0.0%) | 0 (0.0%) |
| 45 to 54 Years | 19 (100.0%) | 4 (21.1%) |
| 55 to 59 Years | 1 (12.5%) | 0 (0.0%) |
| 60 to 64 Years | 4 (80.0%) | 0 (0.0%) |
| 65 to 74 Years | 0 (0.0%) | 0 (0.0%) |
| 75 Years and over | 0 (0.0%) | 0 (0.0%) |
| Total | 81 (57.9%) | 9 (11.1%) |
Employment Status by Educational Attainment in Fort Bidwell
According to labor force statistics for Fort Bidwell, 85.3% of individuals (81) out of the total population between 25 and 64 years of age (95) are in the labor force, with 11.1% or 9 of them being unemployed. The group with the highest labor force participation rate are those with the educational attainment of bachelor's degree or higher, with 100.0% or 20 individuals in the labor force. Within the labor force, individuals with less than high school education have the highest percentage of unemployment, with 100.0% or 8 of them being unemployed.
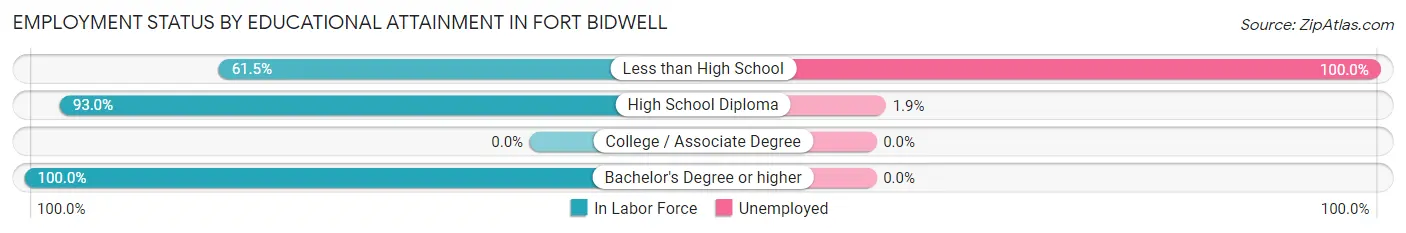
| Educational Attainment | In Labor Force | Unemployed |
| Less than High School | 8 (61.5%) | 13 (100.0%) |
| High School Diploma | 53 (93.0%) | 1 (1.9%) |
| College / Associate Degree | 0 (0.0%) | 0 (0.0%) |
| Bachelor's Degree or higher | 20 (100.0%) | 0 (0.0%) |
| Total | 81 (85.3%) | 11 (11.1%) |
Employment Occupations by Sex in Fort Bidwell
Management, Business, Science and Arts Occupations
The most common Management, Business, Science and Arts occupations in Fort Bidwell are Computers, Engineering & Science (10 | 13.9%), Computers & Mathematics (10 | 13.9%), and Management (4 | 5.6%).
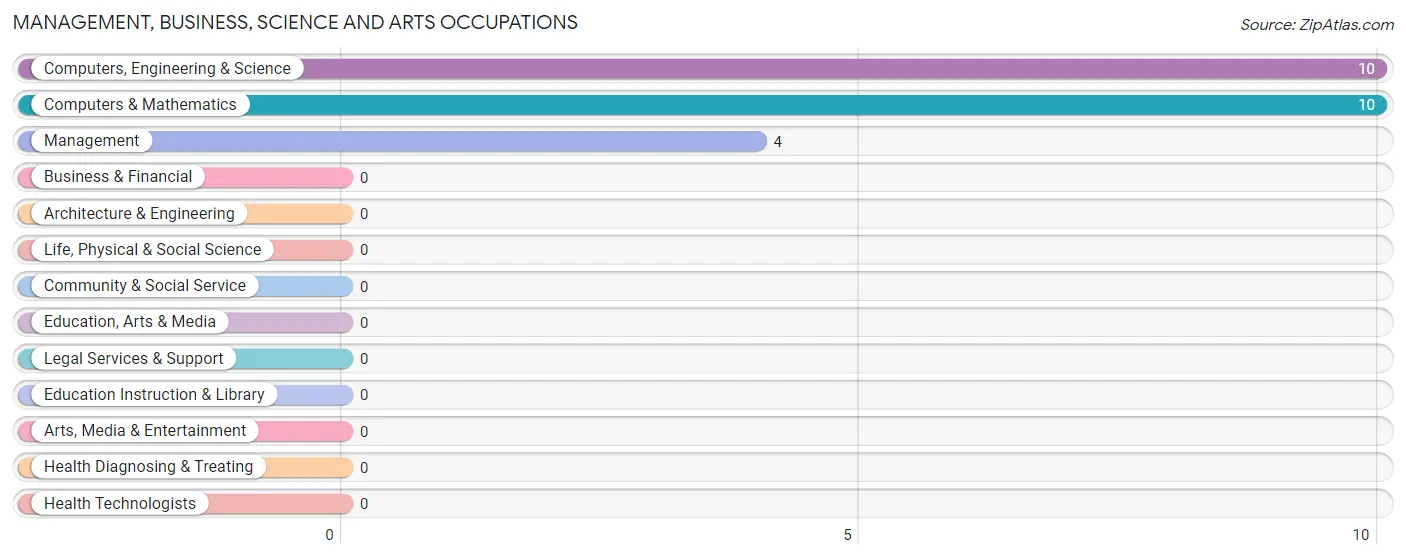
Management, Business, Science and Arts Occupations by Sex
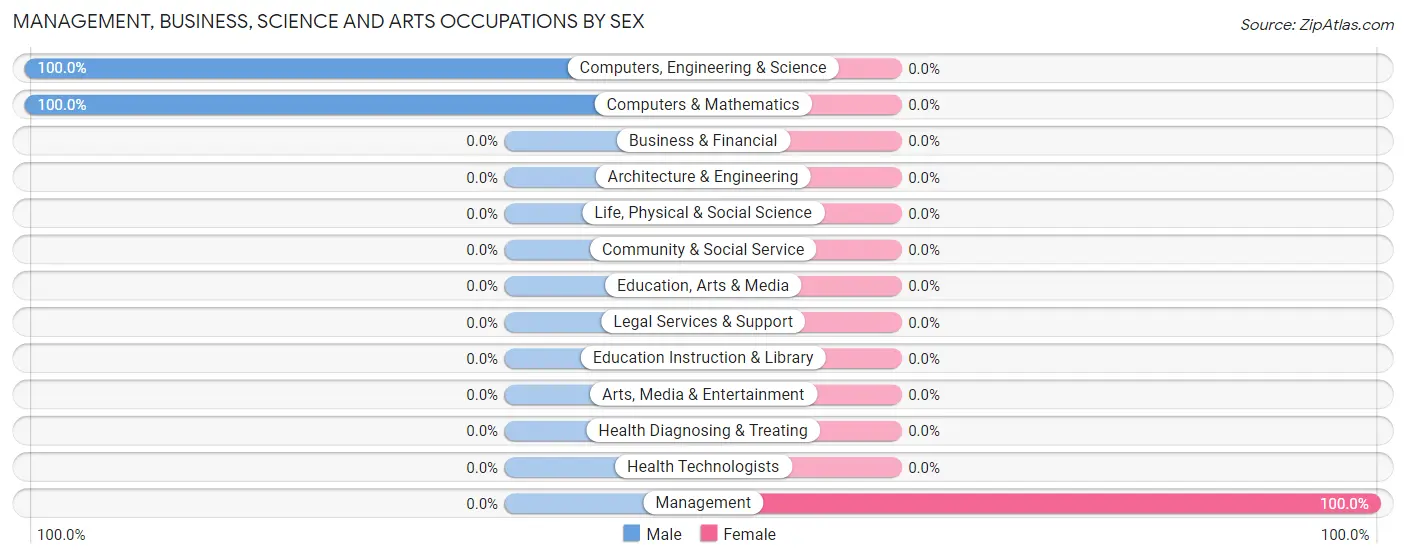
| Occupation | Male | Female |
| Management | 0 (0.0%) | 4 (100.0%) |
| Business & Financial | 0 (0.0%) | 0 (0.0%) |
| Computers, Engineering & Science | 10 (100.0%) | 0 (0.0%) |
| Computers & Mathematics | 10 (100.0%) | 0 (0.0%) |
| Architecture & Engineering | 0 (0.0%) | 0 (0.0%) |
| Life, Physical & Social Science | 0 (0.0%) | 0 (0.0%) |
| Community & Social Service | 0 (0.0%) | 0 (0.0%) |
| Education, Arts & Media | 0 (0.0%) | 0 (0.0%) |
| Legal Services & Support | 0 (0.0%) | 0 (0.0%) |
| Education Instruction & Library | 0 (0.0%) | 0 (0.0%) |
| Arts, Media & Entertainment | 0 (0.0%) | 0 (0.0%) |
| Health Diagnosing & Treating | 0 (0.0%) | 0 (0.0%) |
| Health Technologists | 0 (0.0%) | 0 (0.0%) |
| Total (Category) | 10 (71.4%) | 4 (28.6%) |
| Total (Overall) | 53 (73.6%) | 19 (26.4%) |
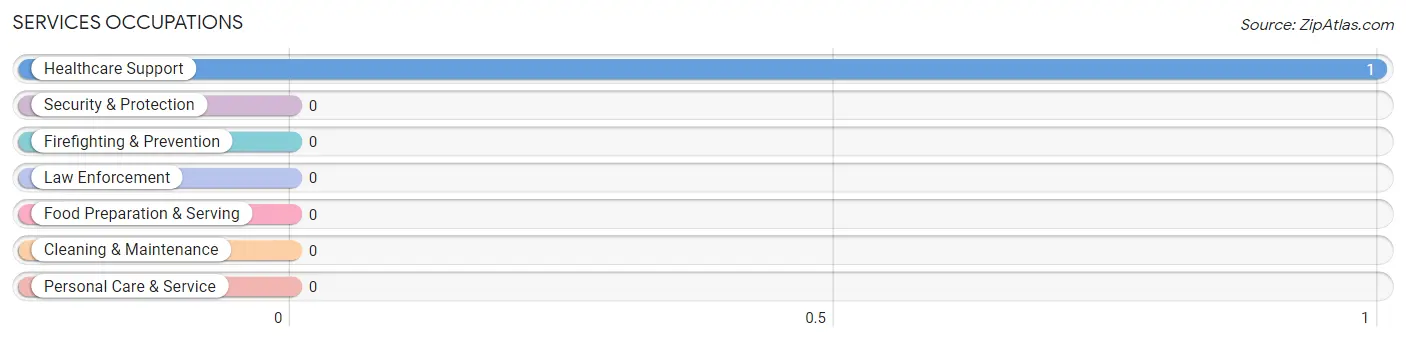
Services Occupations
The most common Services occupations in Fort Bidwell are , and Healthcare Support (1 | 1.4%).
Services Occupations by Sex
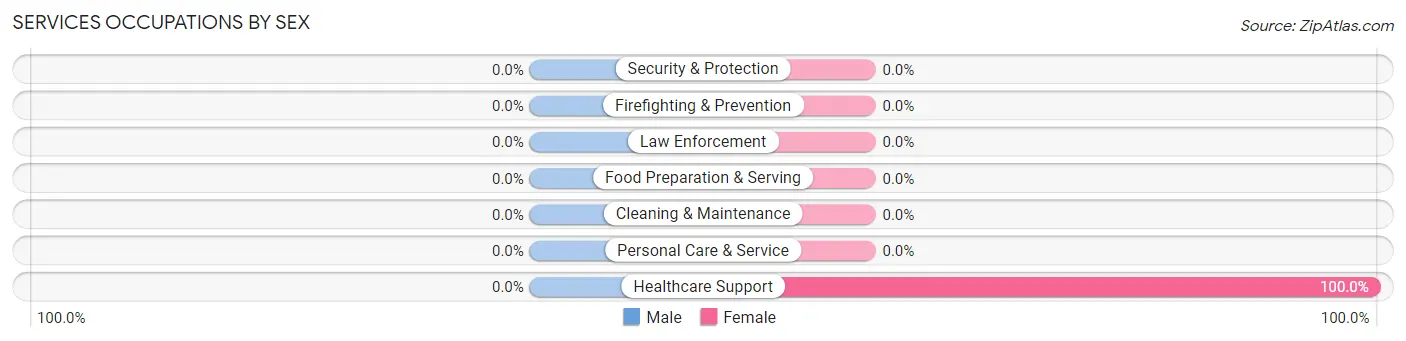
| Occupation | Male | Female |
| Healthcare Support | 0 (0.0%) | 1 (100.0%) |
| Security & Protection | 0 (0.0%) | 0 (0.0%) |
| Firefighting & Prevention | 0 (0.0%) | 0 (0.0%) |
| Law Enforcement | 0 (0.0%) | 0 (0.0%) |
| Food Preparation & Serving | 0 (0.0%) | 0 (0.0%) |
| Cleaning & Maintenance | 0 (0.0%) | 0 (0.0%) |
| Personal Care & Service | 0 (0.0%) | 0 (0.0%) |
| Total (Category) | 0 (0.0%) | 1 (100.0%) |
| Total (Overall) | 53 (73.6%) | 19 (26.4%) |
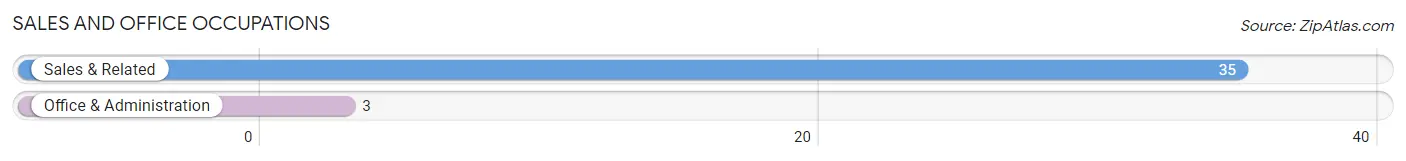
Sales and Office Occupations
The most common Sales and Office occupations in Fort Bidwell are Sales & Related (35 | 48.6%), and Office & Administration (3 | 4.2%).
Sales and Office Occupations by Sex
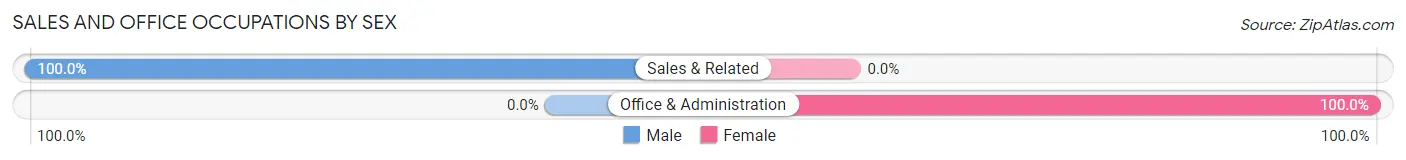
| Occupation | Male | Female |
| Sales & Related | 35 (100.0%) | 0 (0.0%) |
| Office & Administration | 0 (0.0%) | 3 (100.0%) |
| Total (Category) | 35 (92.1%) | 3 (7.9%) |
| Total (Overall) | 53 (73.6%) | 19 (26.4%) |
Natural Resources, Construction and Maintenance Occupations
The most common Natural Resources, Construction and Maintenance occupations in Fort Bidwell are , and Construction & Extraction (8 | 11.1%).
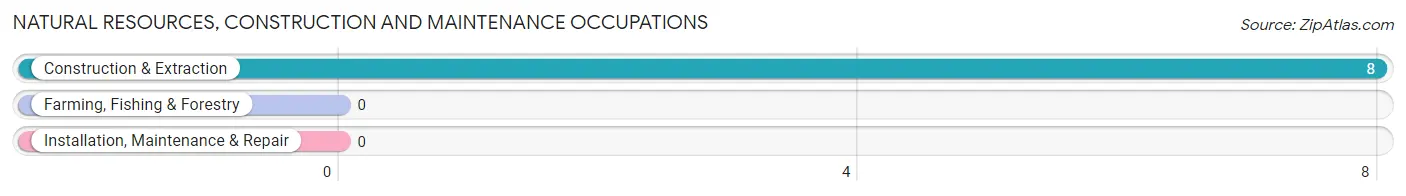
Natural Resources, Construction and Maintenance Occupations by Sex
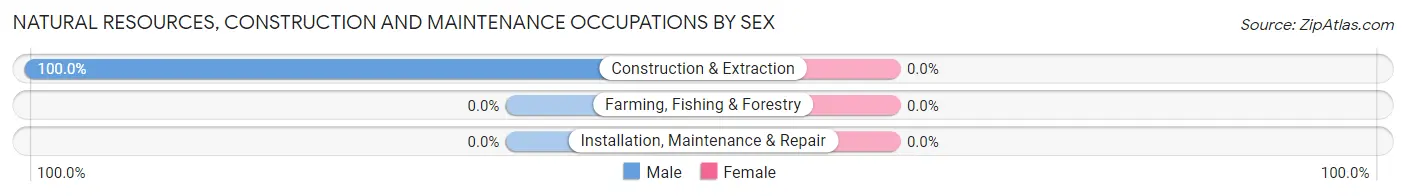
| Occupation | Male | Female |
| Farming, Fishing & Forestry | 0 (0.0%) | 0 (0.0%) |
| Construction & Extraction | 8 (100.0%) | 0 (0.0%) |
| Installation, Maintenance & Repair | 0 (0.0%) | 0 (0.0%) |
| Total (Category) | 8 (100.0%) | 0 (0.0%) |
| Total (Overall) | 53 (73.6%) | 19 (26.4%) |
Production, Transportation and Moving Occupations
The most common Production, Transportation and Moving occupations in Fort Bidwell are Production (10 | 13.9%), and Transportation (1 | 1.4%).
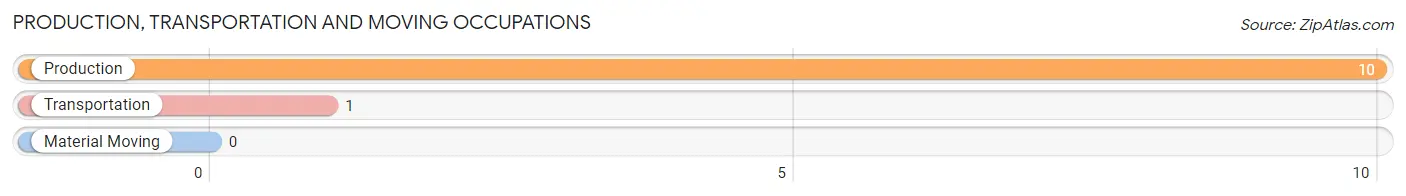
Production, Transportation and Moving Occupations by Sex
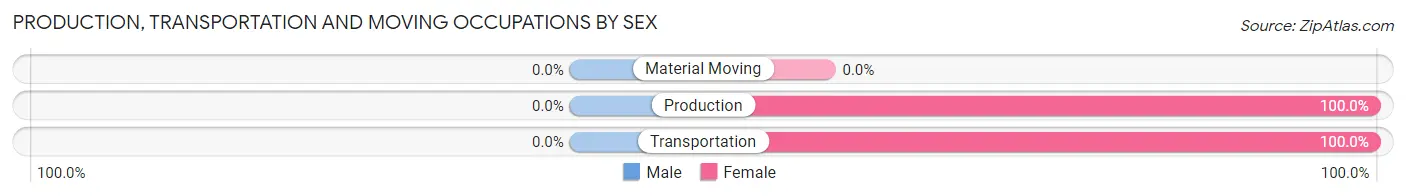
| Occupation | Male | Female |
| Production | 0 (0.0%) | 10 (100.0%) |
| Transportation | 0 (0.0%) | 1 (100.0%) |
| Material Moving | 0 (0.0%) | 0 (0.0%) |
| Total (Category) | 0 (0.0%) | 11 (100.0%) |
| Total (Overall) | 53 (73.6%) | 19 (26.4%) |
Employment Industries by Sex in Fort Bidwell
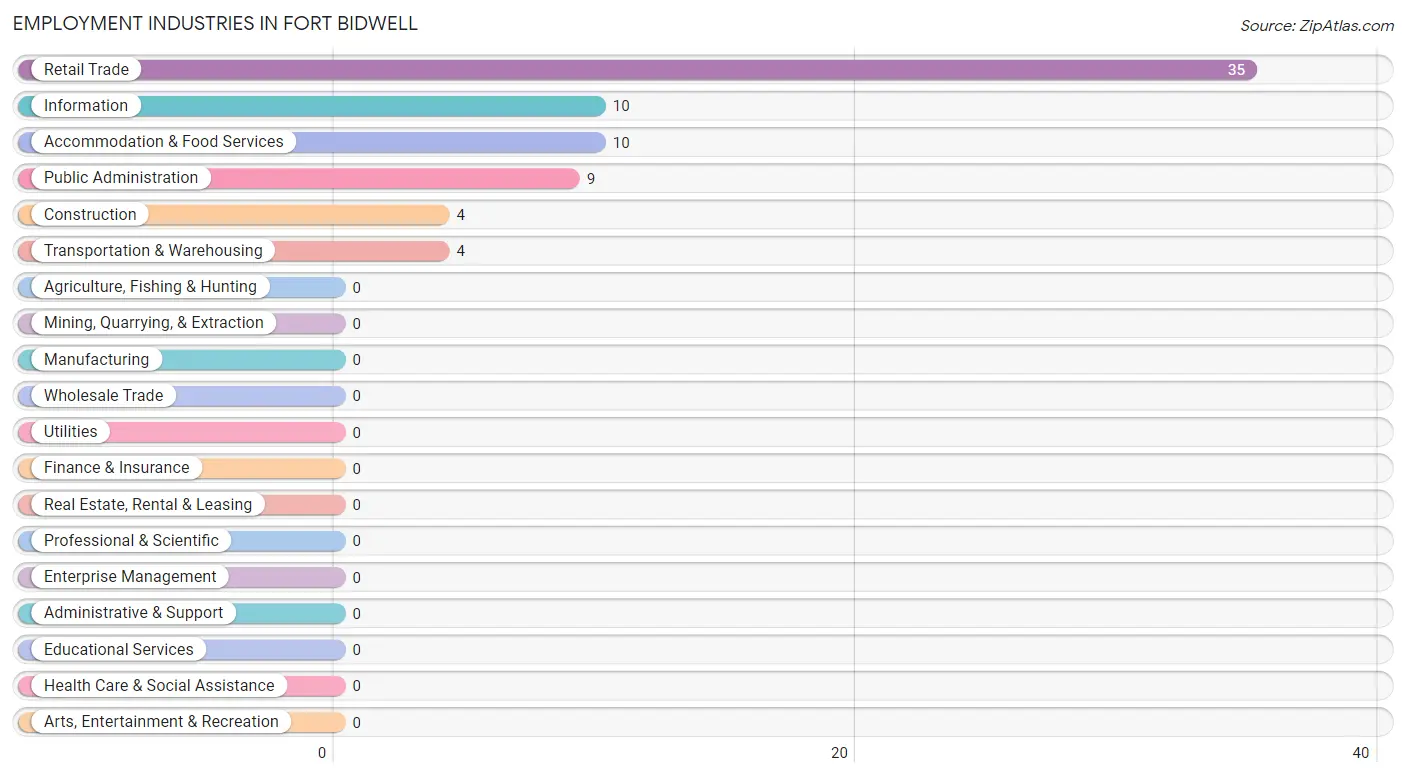
Employment Industries in Fort Bidwell
The major employment industries in Fort Bidwell include Retail Trade (35 | 48.6%), Information (10 | 13.9%), Accommodation & Food Services (10 | 13.9%), Public Administration (9 | 12.5%), and Construction (4 | 5.6%).
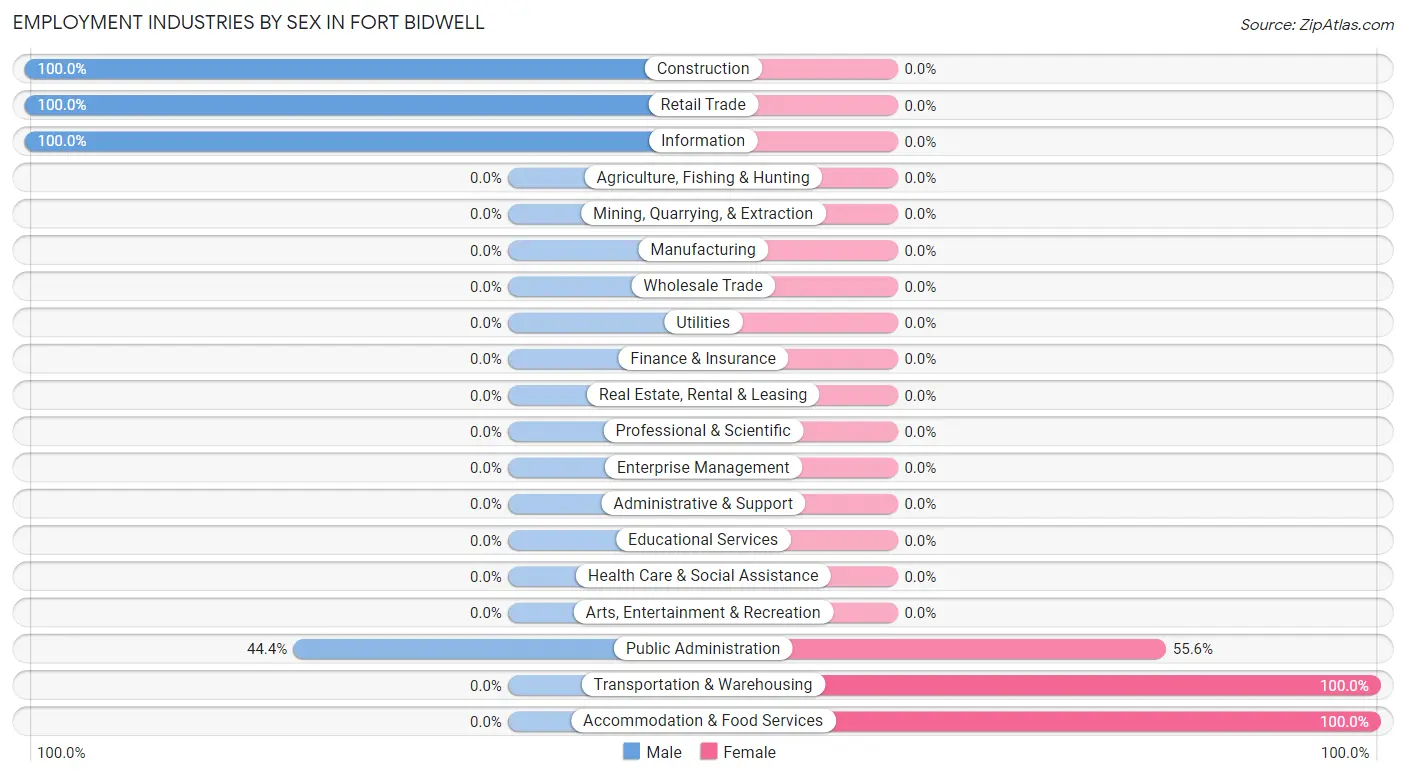
Employment Industries by Sex in Fort Bidwell
The Fort Bidwell industries that see more men than women are Construction (100.0%), Retail Trade (100.0%), and Information (100.0%), whereas the industries that tend to have a higher number of women are Transportation & Warehousing (100.0%), Accommodation & Food Services (100.0%), and Public Administration (55.6%).
| Industry | Male | Female |
| Agriculture, Fishing & Hunting | 0 (0.0%) | 0 (0.0%) |
| Mining, Quarrying, & Extraction | 0 (0.0%) | 0 (0.0%) |
| Construction | 4 (100.0%) | 0 (0.0%) |
| Manufacturing | 0 (0.0%) | 0 (0.0%) |
| Wholesale Trade | 0 (0.0%) | 0 (0.0%) |
| Retail Trade | 35 (100.0%) | 0 (0.0%) |
| Transportation & Warehousing | 0 (0.0%) | 4 (100.0%) |
| Utilities | 0 (0.0%) | 0 (0.0%) |
| Information | 10 (100.0%) | 0 (0.0%) |
| Finance & Insurance | 0 (0.0%) | 0 (0.0%) |
| Real Estate, Rental & Leasing | 0 (0.0%) | 0 (0.0%) |
| Professional & Scientific | 0 (0.0%) | 0 (0.0%) |
| Enterprise Management | 0 (0.0%) | 0 (0.0%) |
| Administrative & Support | 0 (0.0%) | 0 (0.0%) |
| Educational Services | 0 (0.0%) | 0 (0.0%) |
| Health Care & Social Assistance | 0 (0.0%) | 0 (0.0%) |
| Arts, Entertainment & Recreation | 0 (0.0%) | 0 (0.0%) |
| Accommodation & Food Services | 0 (0.0%) | 10 (100.0%) |
| Public Administration | 4 (44.4%) | 5 (55.6%) |
| Total | 53 (73.6%) | 19 (26.4%) |
Education in Fort Bidwell
School Enrollment in Fort Bidwell
The most common levels of schooling among the 18 students in Fort Bidwell are middle school (7 | 38.9%), elementary school (6 | 33.3%), and nursery / preschool (5 | 27.8%).
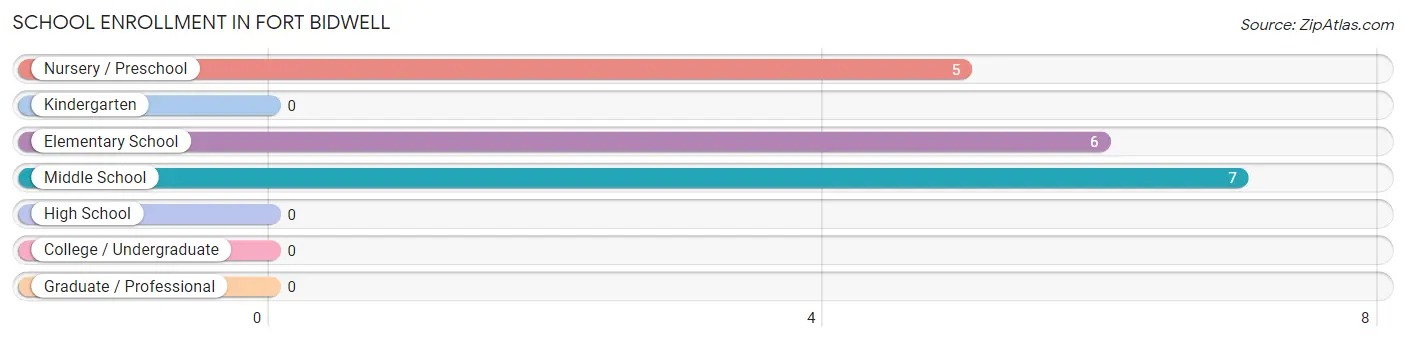
| School Level | # Students | % Students |
| Nursery / Preschool | 5 | 27.8% |
| Kindergarten | 0 | 0.0% |
| Elementary School | 6 | 33.3% |
| Middle School | 7 | 38.9% |
| High School | 0 | 0.0% |
| College / Undergraduate | 0 | 0.0% |
| Graduate / Professional | 0 | 0.0% |
| Total | 18 | 100.0% |
School Enrollment by Age by Funding Source in Fort Bidwell
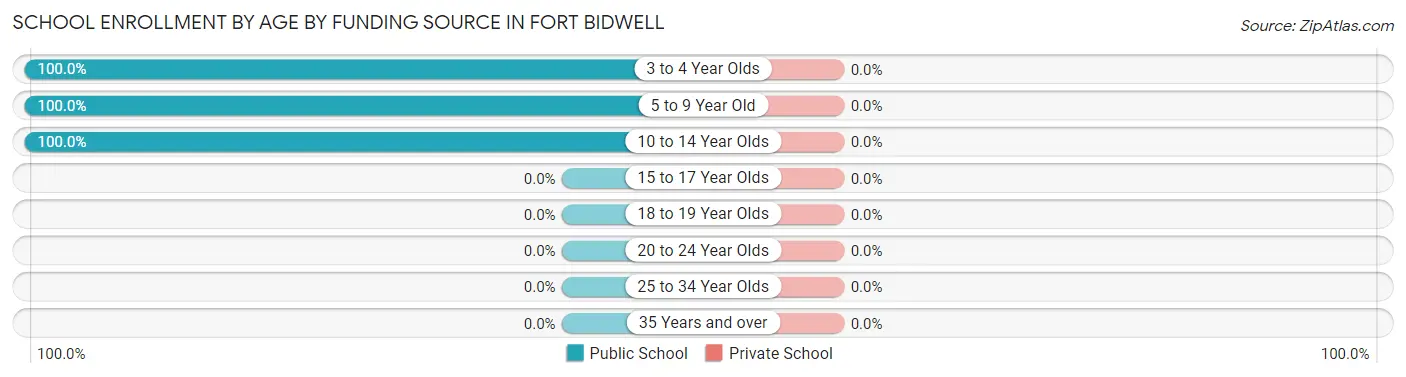
| Age Bracket | Public School | Private School |
| 3 to 4 Year Olds | 5 (100.0%) | 0 (0.0%) |
| 5 to 9 Year Old | 6 (100.0%) | 0 (0.0%) |
| 10 to 14 Year Olds | 7 (100.0%) | 0 (0.0%) |
| 15 to 17 Year Olds | 0 (0.0%) | 0 (0.0%) |
| 18 to 19 Year Olds | 0 (0.0%) | 0 (0.0%) |
| 20 to 24 Year Olds | 0 (0.0%) | 0 (0.0%) |
| 25 to 34 Year Olds | 0 (0.0%) | 0 (0.0%) |
| 35 Years and over | 0 (0.0%) | 0 (0.0%) |
| Total | 18 (100.0%) | 0 (0.0%) |
Educational Attainment by Field of Study in Fort Bidwell
Bio, nature & agricultural (10 | 28.6%), business (10 | 28.6%), social sciences (5 | 14.3%), engineering (4 | 11.4%), and literature & languages (3 | 8.6%) are the most common fields of study among 35 individuals in Fort Bidwell who have obtained a bachelor's degree or higher.
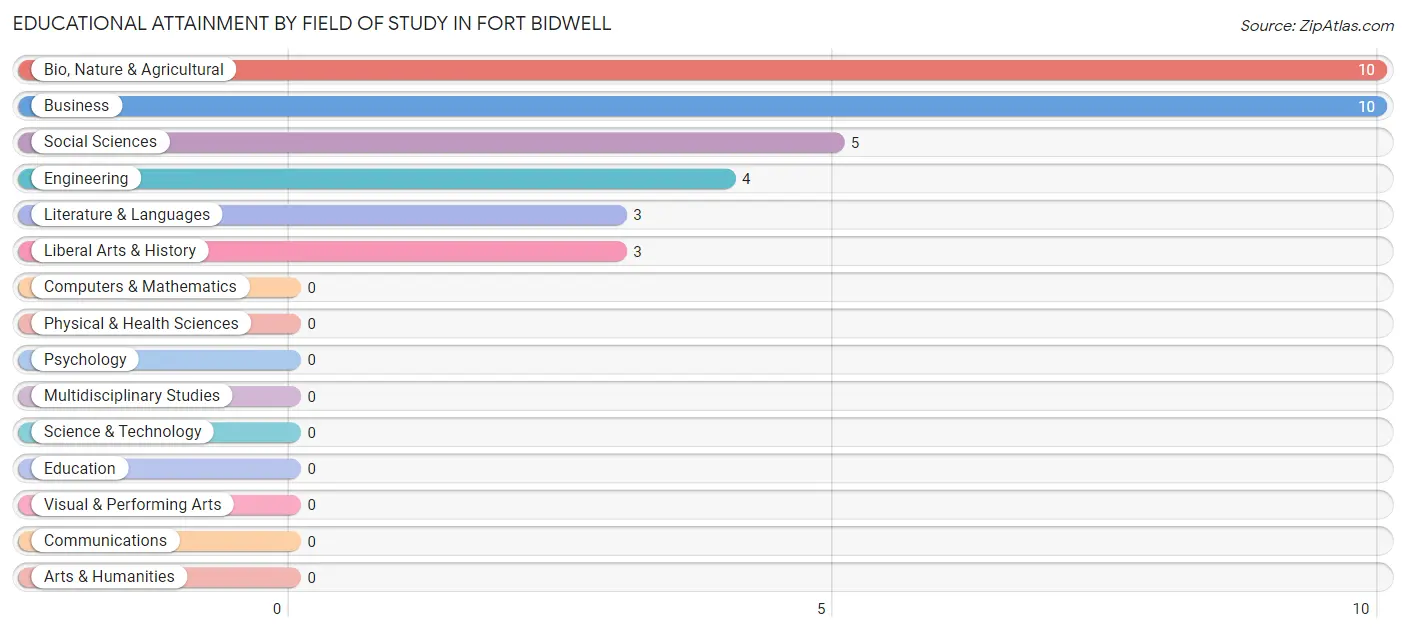
| Field of Study | # Graduates | % Graduates |
| Computers & Mathematics | 0 | 0.0% |
| Bio, Nature & Agricultural | 10 | 28.6% |
| Physical & Health Sciences | 0 | 0.0% |
| Psychology | 0 | 0.0% |
| Social Sciences | 5 | 14.3% |
| Engineering | 4 | 11.4% |
| Multidisciplinary Studies | 0 | 0.0% |
| Science & Technology | 0 | 0.0% |
| Business | 10 | 28.6% |
| Education | 0 | 0.0% |
| Literature & Languages | 3 | 8.6% |
| Liberal Arts & History | 3 | 8.6% |
| Visual & Performing Arts | 0 | 0.0% |
| Communications | 0 | 0.0% |
| Arts & Humanities | 0 | 0.0% |
| Total | 35 | 100.0% |
Transportation & Commute in Fort Bidwell
Vehicle Availability by Sex in Fort Bidwell
The most prevalent vehicle ownership categories in Fort Bidwell are males with 1 vehicle (49, accounting for 92.4%) and females with 1 vehicle (5, making up 257.9%).
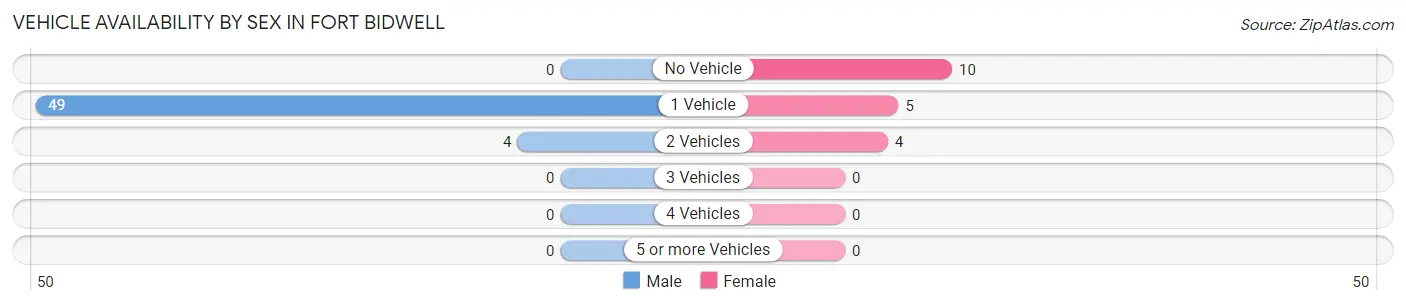
| Vehicles Available | Male | Female |
| No Vehicle | 0 (0.0%) | 10 (52.6%) |
| 1 Vehicle | 49 (92.4%) | 5 (26.3%) |
| 2 Vehicles | 4 (7.5%) | 4 (21.0%) |
| 3 Vehicles | 0 (0.0%) | 0 (0.0%) |
| 4 Vehicles | 0 (0.0%) | 0 (0.0%) |
| 5 or more Vehicles | 0 (0.0%) | 0 (0.0%) |
| Total | 53 (100.0%) | 19 (100.0%) |
Commute Time in Fort Bidwell
The most frequently occuring commute durations in Fort Bidwell are 90 or more minutes (35 commuters, 56.5%), 5 to 9 minutes (12 commuters, 19.4%), and less than 5 minutes (11 commuters, 17.7%).
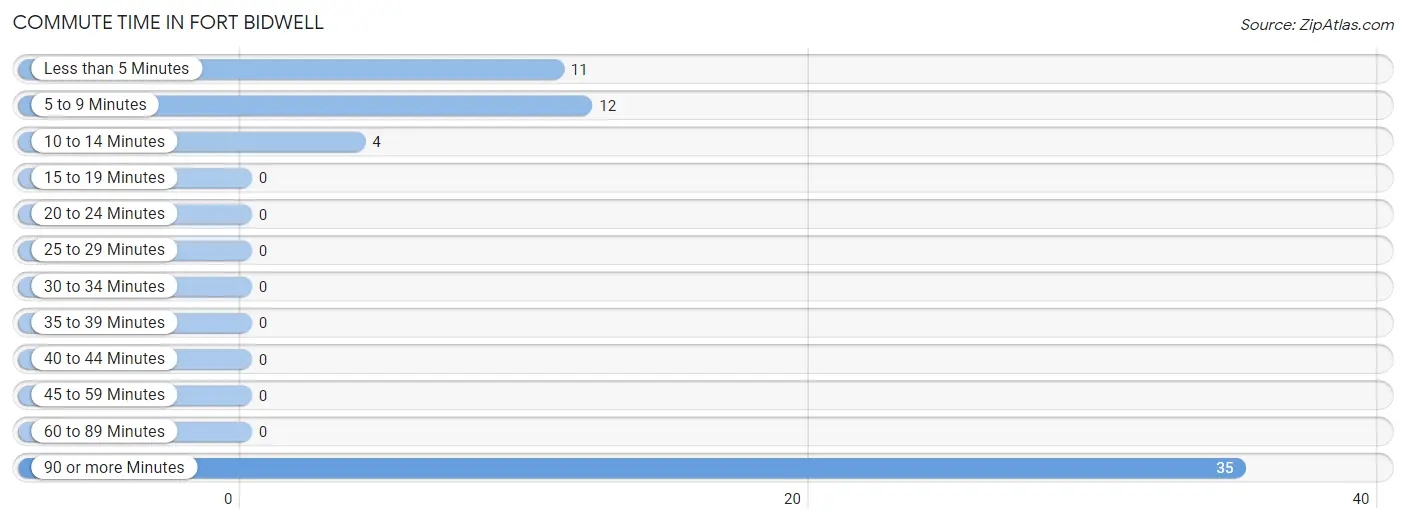
| Commute Time | # Commuters | % Commuters |
| Less than 5 Minutes | 11 | 17.7% |
| 5 to 9 Minutes | 12 | 19.4% |
| 10 to 14 Minutes | 4 | 6.5% |
| 15 to 19 Minutes | 0 | 0.0% |
| 20 to 24 Minutes | 0 | 0.0% |
| 25 to 29 Minutes | 0 | 0.0% |
| 30 to 34 Minutes | 0 | 0.0% |
| 35 to 39 Minutes | 0 | 0.0% |
| 40 to 44 Minutes | 0 | 0.0% |
| 45 to 59 Minutes | 0 | 0.0% |
| 60 to 89 Minutes | 0 | 0.0% |
| 90 or more Minutes | 35 | 56.5% |
Commute Time by Sex in Fort Bidwell
The most common commute times in Fort Bidwell are 90 or more minutes (35 commuters, 81.4%) for males and less than 5 minutes (11 commuters, 57.9%) for females.
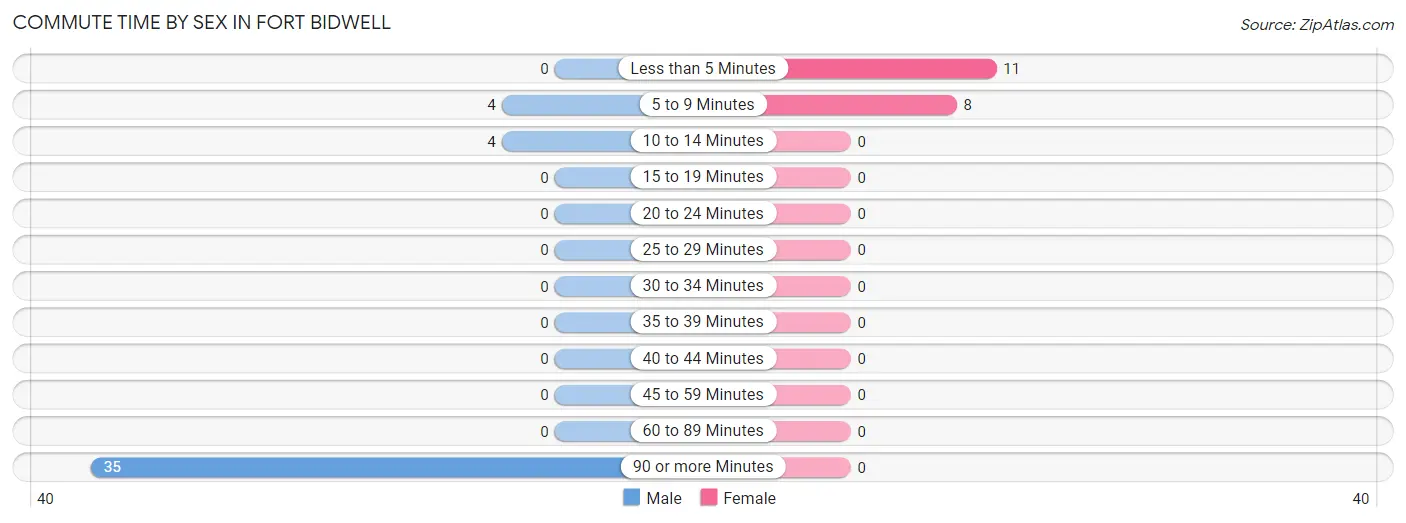
| Commute Time | Male | Female |
| Less than 5 Minutes | 0 (0.0%) | 11 (57.9%) |
| 5 to 9 Minutes | 4 (9.3%) | 8 (42.1%) |
| 10 to 14 Minutes | 4 (9.3%) | 0 (0.0%) |
| 15 to 19 Minutes | 0 (0.0%) | 0 (0.0%) |
| 20 to 24 Minutes | 0 (0.0%) | 0 (0.0%) |
| 25 to 29 Minutes | 0 (0.0%) | 0 (0.0%) |
| 30 to 34 Minutes | 0 (0.0%) | 0 (0.0%) |
| 35 to 39 Minutes | 0 (0.0%) | 0 (0.0%) |
| 40 to 44 Minutes | 0 (0.0%) | 0 (0.0%) |
| 45 to 59 Minutes | 0 (0.0%) | 0 (0.0%) |
| 60 to 89 Minutes | 0 (0.0%) | 0 (0.0%) |
| 90 or more Minutes | 35 (81.4%) | 0 (0.0%) |
Time of Departure to Work by Sex in Fort Bidwell
The most frequent times of departure to work in Fort Bidwell are 12:00 AM to 4:59 AM (35, 81.4%) for males and 10:00 AM to 10:59 AM (10, 52.6%) for females.
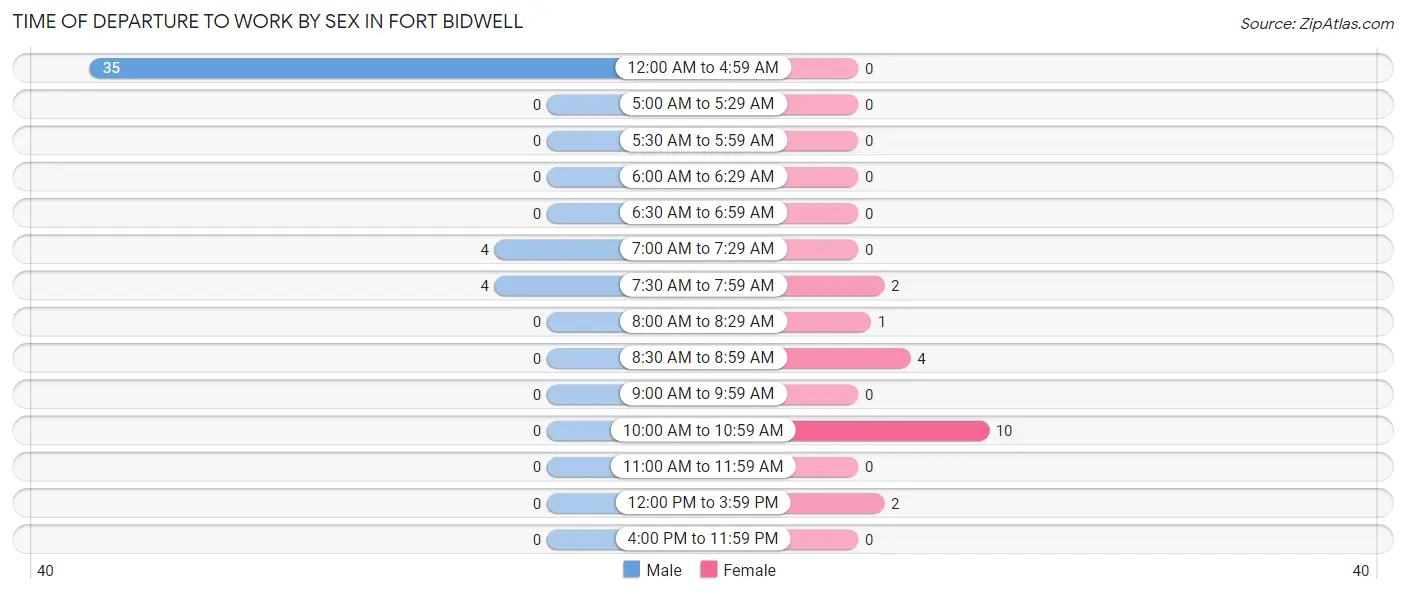
| Time of Departure | Male | Female |
| 12:00 AM to 4:59 AM | 35 (81.4%) | 0 (0.0%) |
| 5:00 AM to 5:29 AM | 0 (0.0%) | 0 (0.0%) |
| 5:30 AM to 5:59 AM | 0 (0.0%) | 0 (0.0%) |
| 6:00 AM to 6:29 AM | 0 (0.0%) | 0 (0.0%) |
| 6:30 AM to 6:59 AM | 0 (0.0%) | 0 (0.0%) |
| 7:00 AM to 7:29 AM | 4 (9.3%) | 0 (0.0%) |
| 7:30 AM to 7:59 AM | 4 (9.3%) | 2 (10.5%) |
| 8:00 AM to 8:29 AM | 0 (0.0%) | 1 (5.3%) |
| 8:30 AM to 8:59 AM | 0 (0.0%) | 4 (21.0%) |
| 9:00 AM to 9:59 AM | 0 (0.0%) | 0 (0.0%) |
| 10:00 AM to 10:59 AM | 0 (0.0%) | 10 (52.6%) |
| 11:00 AM to 11:59 AM | 0 (0.0%) | 0 (0.0%) |
| 12:00 PM to 3:59 PM | 0 (0.0%) | 2 (10.5%) |
| 4:00 PM to 11:59 PM | 0 (0.0%) | 0 (0.0%) |
| Total | 43 (100.0%) | 19 (100.0%) |
Housing Occupancy in Fort Bidwell
Occupancy by Ownership in Fort Bidwell
Of the total 60 dwellings in Fort Bidwell, owner-occupied units account for 32 (53.3%), while renter-occupied units make up 28 (46.7%).
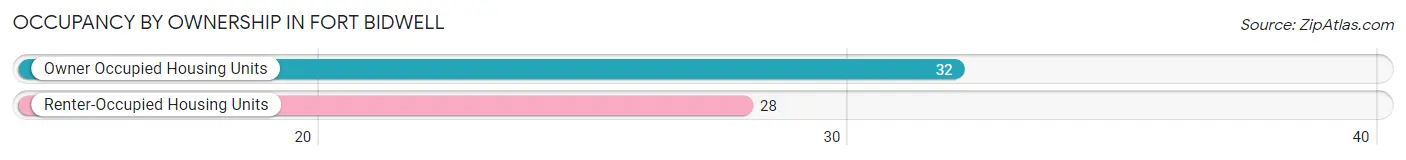
| Occupancy | # Housing Units | % Housing Units |
| Owner Occupied Housing Units | 32 | 53.3% |
| Renter-Occupied Housing Units | 28 | 46.7% |
| Total Occupied Housing Units | 60 | 100.0% |
Occupancy by Household Size in Fort Bidwell
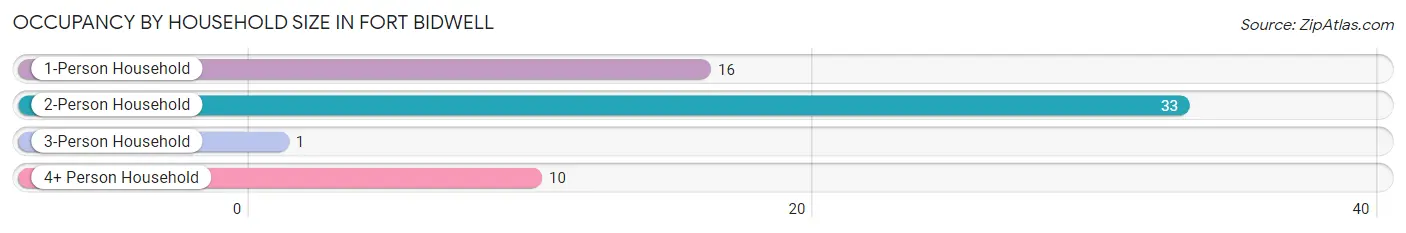
| Household Size | # Housing Units | % Housing Units |
| 1-Person Household | 16 | 26.7% |
| 2-Person Household | 33 | 55.0% |
| 3-Person Household | 1 | 1.7% |
| 4+ Person Household | 10 | 16.7% |
| Total Housing Units | 60 | 100.0% |
Occupancy by Ownership by Household Size in Fort Bidwell
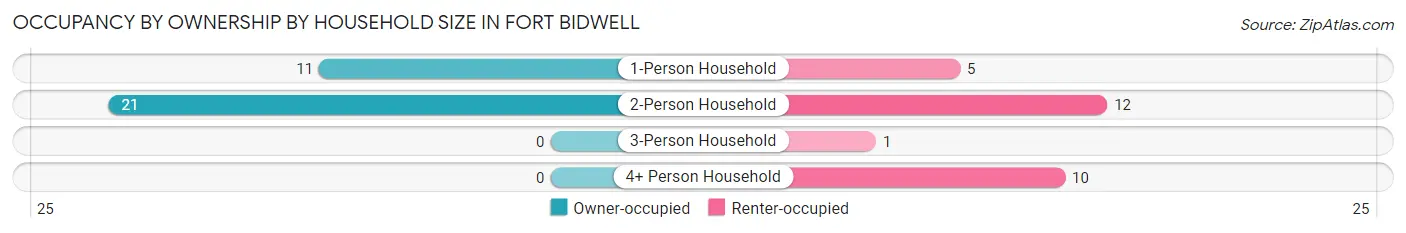
| Household Size | Owner-occupied | Renter-occupied |
| 1-Person Household | 11 (68.8%) | 5 (31.2%) |
| 2-Person Household | 21 (63.6%) | 12 (36.4%) |
| 3-Person Household | 0 (0.0%) | 1 (100.0%) |
| 4+ Person Household | 0 (0.0%) | 10 (100.0%) |
| Total Housing Units | 32 (53.3%) | 28 (46.7%) |
Occupancy by Educational Attainment in Fort Bidwell
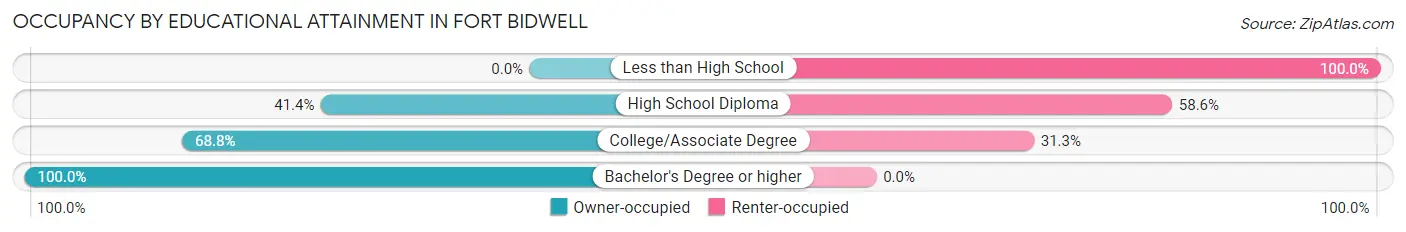
| Household Size | Owner-occupied | Renter-occupied |
| Less than High School | 0 (0.0%) | 6 (100.0%) |
| High School Diploma | 12 (41.4%) | 17 (58.6%) |
| College/Associate Degree | 11 (68.8%) | 5 (31.2%) |
| Bachelor's Degree or higher | 9 (100.0%) | 0 (0.0%) |
Occupancy by Age of Householder in Fort Bidwell
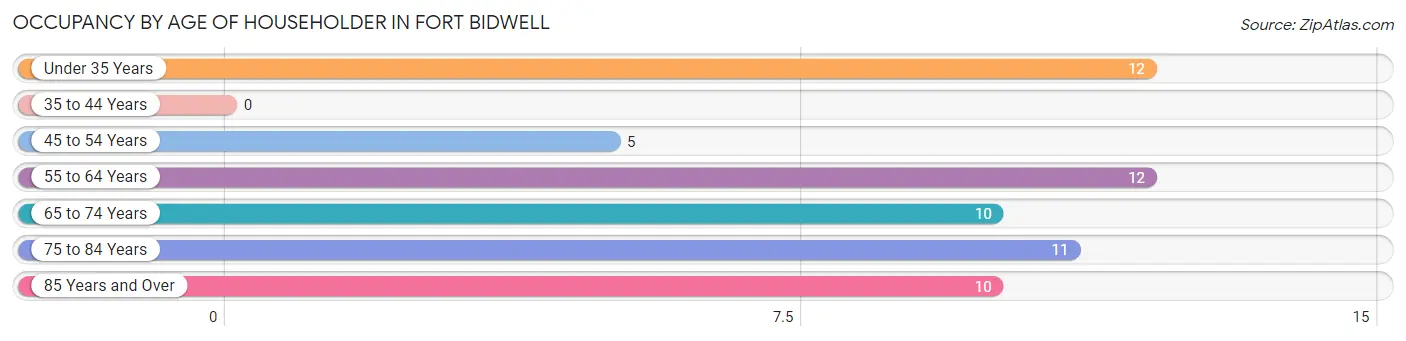
| Age Bracket | # Households | % Households |
| Under 35 Years | 12 | 20.0% |
| 35 to 44 Years | 0 | 0.0% |
| 45 to 54 Years | 5 | 8.3% |
| 55 to 64 Years | 12 | 20.0% |
| 65 to 74 Years | 10 | 16.7% |
| 75 to 84 Years | 11 | 18.3% |
| 85 Years and Over | 10 | 16.7% |
| Total | 60 | 100.0% |
Housing Finances in Fort Bidwell
Median Income by Occupancy in Fort Bidwell
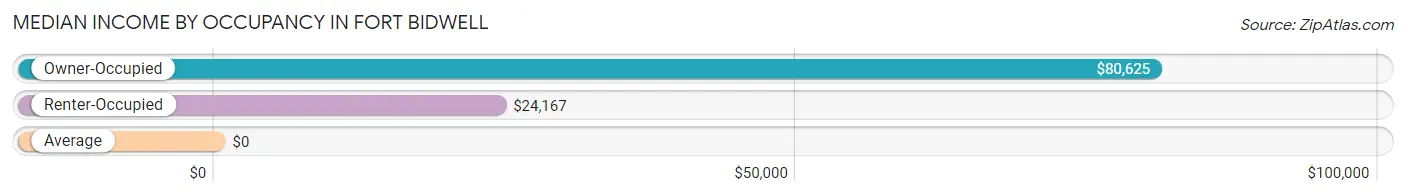
| Occupancy Type | # Households | Median Income |
| Owner-Occupied | 32 (53.3%) | $80,625 |
| Renter-Occupied | 28 (46.7%) | $24,167 |
| Average | 60 (100.0%) | $0 |
Occupancy by Householder Income Bracket in Fort Bidwell
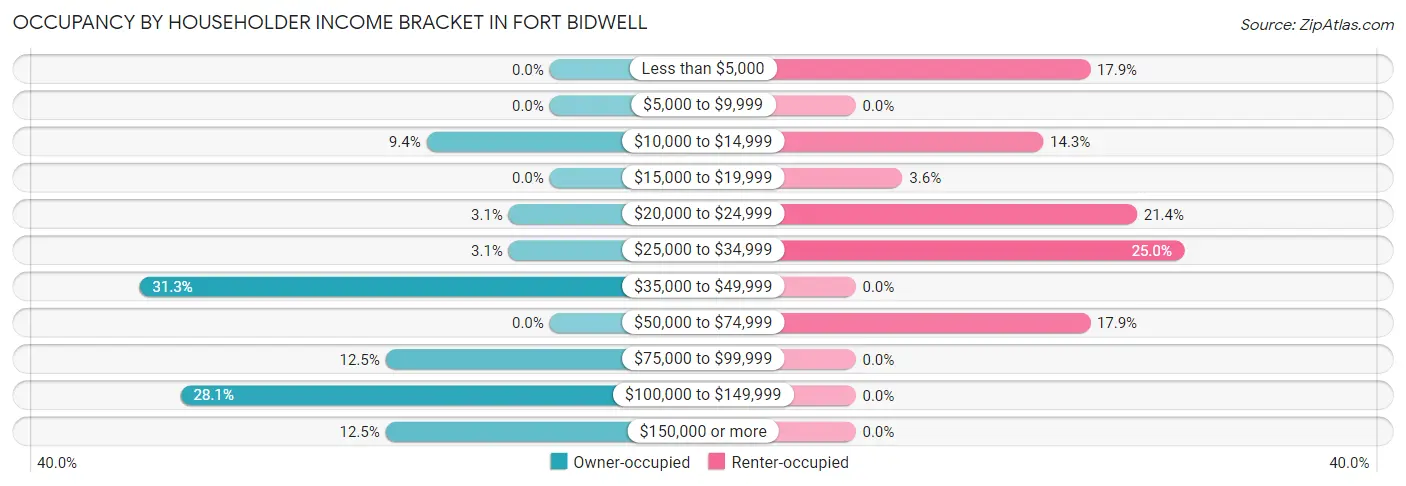
| Income Bracket | Owner-occupied | Renter-occupied |
| Less than $5,000 | 0 (0.0%) | 5 (17.9%) |
| $5,000 to $9,999 | 0 (0.0%) | 0 (0.0%) |
| $10,000 to $14,999 | 3 (9.4%) | 4 (14.3%) |
| $15,000 to $19,999 | 0 (0.0%) | 1 (3.6%) |
| $20,000 to $24,999 | 1 (3.1%) | 6 (21.4%) |
| $25,000 to $34,999 | 1 (3.1%) | 7 (25.0%) |
| $35,000 to $49,999 | 10 (31.2%) | 0 (0.0%) |
| $50,000 to $74,999 | 0 (0.0%) | 5 (17.9%) |
| $75,000 to $99,999 | 4 (12.5%) | 0 (0.0%) |
| $100,000 to $149,999 | 9 (28.1%) | 0 (0.0%) |
| $150,000 or more | 4 (12.5%) | 0 (0.0%) |
| Total | 32 (100.0%) | 28 (100.0%) |
Monthly Housing Cost Tiers in Fort Bidwell
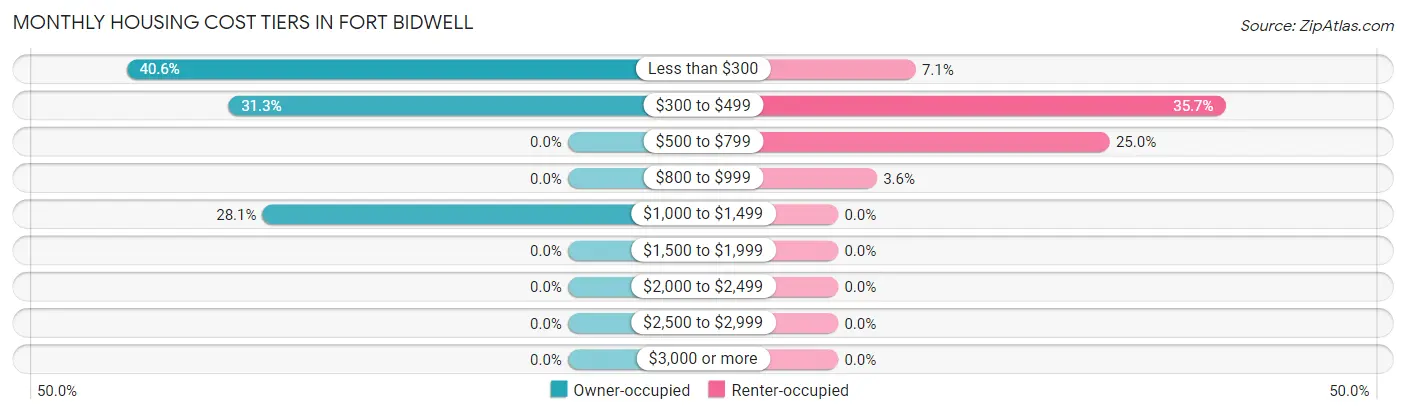
| Monthly Cost | Owner-occupied | Renter-occupied |
| Less than $300 | 13 (40.6%) | 2 (7.1%) |
| $300 to $499 | 10 (31.2%) | 10 (35.7%) |
| $500 to $799 | 0 (0.0%) | 7 (25.0%) |
| $800 to $999 | 0 (0.0%) | 1 (3.6%) |
| $1,000 to $1,499 | 9 (28.1%) | 0 (0.0%) |
| $1,500 to $1,999 | 0 (0.0%) | 0 (0.0%) |
| $2,000 to $2,499 | 0 (0.0%) | 0 (0.0%) |
| $2,500 to $2,999 | 0 (0.0%) | 0 (0.0%) |
| $3,000 or more | 0 (0.0%) | 0 (0.0%) |
| Total | 32 (100.0%) | 28 (100.0%) |
Physical Housing Characteristics in Fort Bidwell
Housing Structures in Fort Bidwell
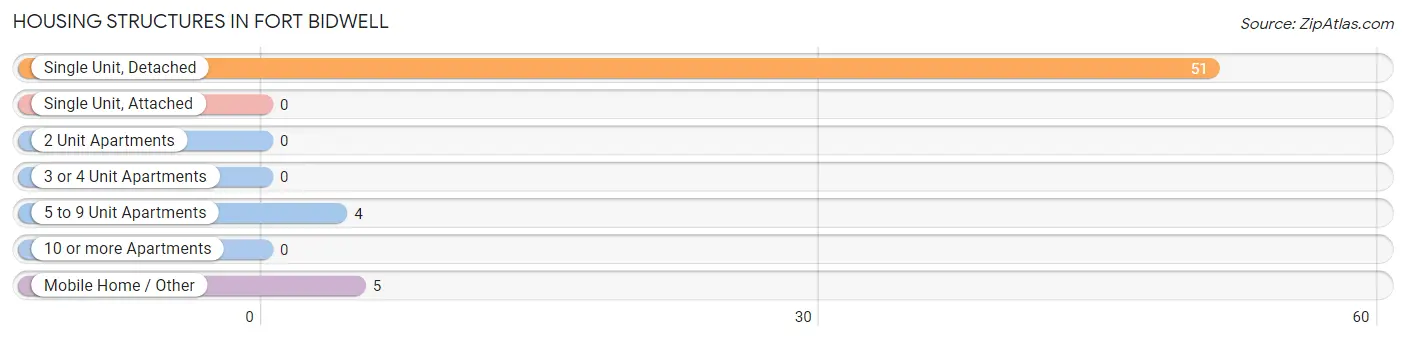
| Structure Type | # Housing Units | % Housing Units |
| Single Unit, Detached | 51 | 85.0% |
| Single Unit, Attached | 0 | 0.0% |
| 2 Unit Apartments | 0 | 0.0% |
| 3 or 4 Unit Apartments | 0 | 0.0% |
| 5 to 9 Unit Apartments | 4 | 6.7% |
| 10 or more Apartments | 0 | 0.0% |
| Mobile Home / Other | 5 | 8.3% |
| Total | 60 | 100.0% |
Housing Structures by Occupancy in Fort Bidwell
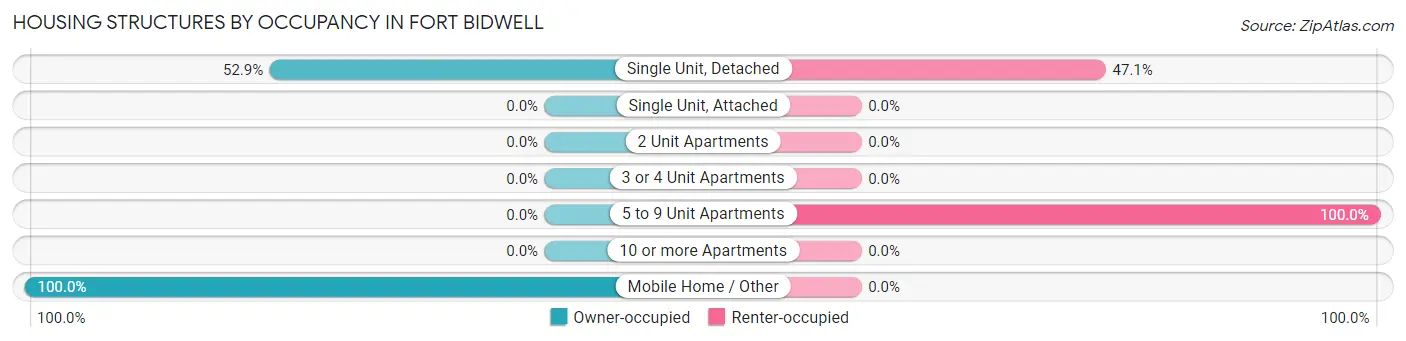
| Structure Type | Owner-occupied | Renter-occupied |
| Single Unit, Detached | 27 (52.9%) | 24 (47.1%) |
| Single Unit, Attached | 0 (0.0%) | 0 (0.0%) |
| 2 Unit Apartments | 0 (0.0%) | 0 (0.0%) |
| 3 or 4 Unit Apartments | 0 (0.0%) | 0 (0.0%) |
| 5 to 9 Unit Apartments | 0 (0.0%) | 4 (100.0%) |
| 10 or more Apartments | 0 (0.0%) | 0 (0.0%) |
| Mobile Home / Other | 5 (100.0%) | 0 (0.0%) |
| Total | 32 (53.3%) | 28 (46.7%) |
Housing Structures by Number of Rooms in Fort Bidwell
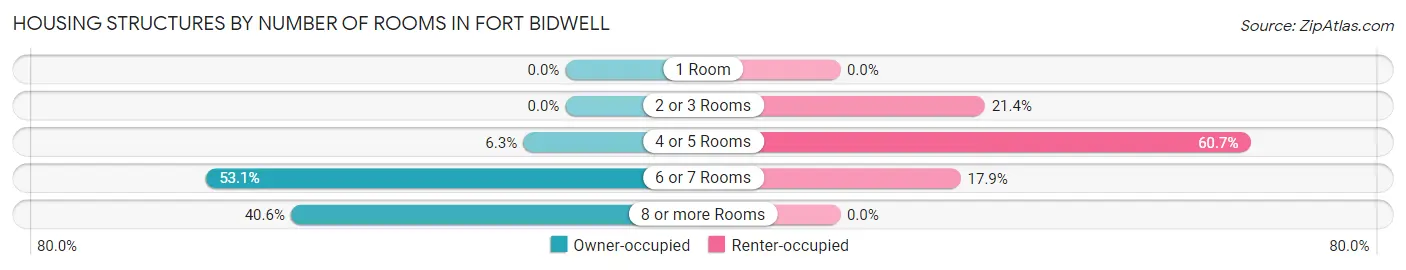
| Number of Rooms | Owner-occupied | Renter-occupied |
| 1 Room | 0 (0.0%) | 0 (0.0%) |
| 2 or 3 Rooms | 0 (0.0%) | 6 (21.4%) |
| 4 or 5 Rooms | 2 (6.2%) | 17 (60.7%) |
| 6 or 7 Rooms | 17 (53.1%) | 5 (17.9%) |
| 8 or more Rooms | 13 (40.6%) | 0 (0.0%) |
| Total | 32 (100.0%) | 28 (100.0%) |
Housing Structure by Heating Type in Fort Bidwell
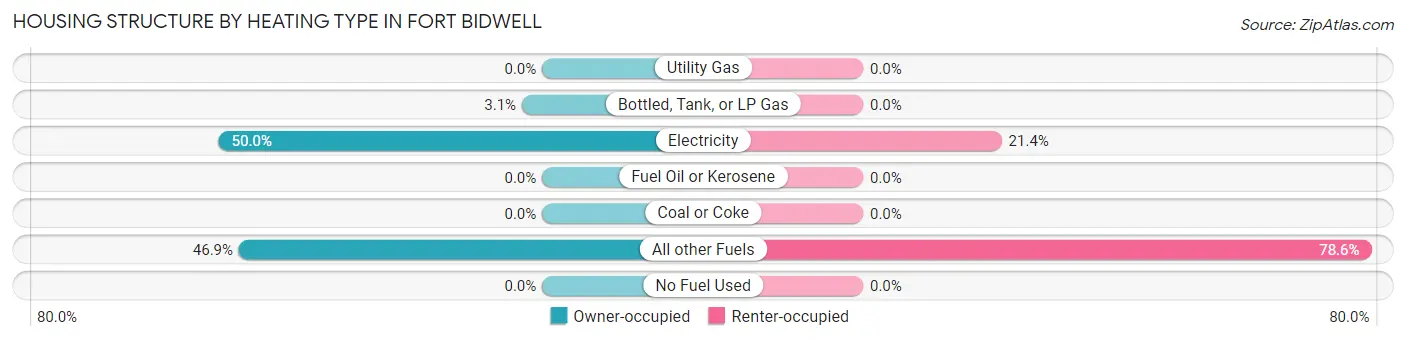
| Heating Type | Owner-occupied | Renter-occupied |
| Utility Gas | 0 (0.0%) | 0 (0.0%) |
| Bottled, Tank, or LP Gas | 1 (3.1%) | 0 (0.0%) |
| Electricity | 16 (50.0%) | 6 (21.4%) |
| Fuel Oil or Kerosene | 0 (0.0%) | 0 (0.0%) |
| Coal or Coke | 0 (0.0%) | 0 (0.0%) |
| All other Fuels | 15 (46.9%) | 22 (78.6%) |
| No Fuel Used | 0 (0.0%) | 0 (0.0%) |
| Total | 32 (100.0%) | 28 (100.0%) |
Household Vehicle Usage in Fort Bidwell
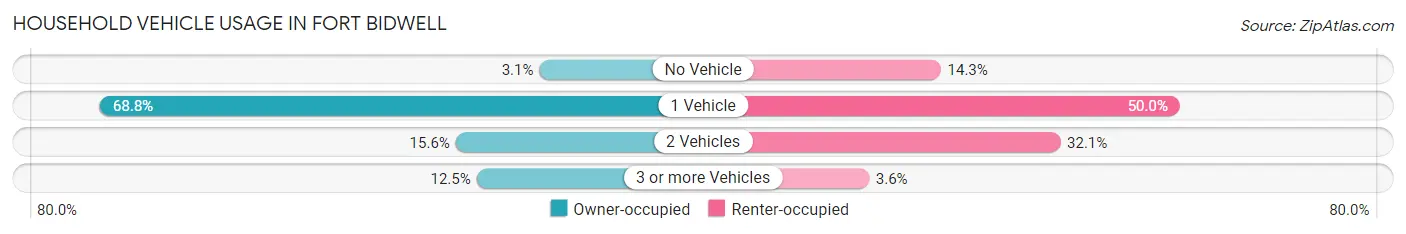
| Vehicles per Household | Owner-occupied | Renter-occupied |
| No Vehicle | 1 (3.1%) | 4 (14.3%) |
| 1 Vehicle | 22 (68.8%) | 14 (50.0%) |
| 2 Vehicles | 5 (15.6%) | 9 (32.1%) |
| 3 or more Vehicles | 4 (12.5%) | 1 (3.6%) |
| Total | 32 (100.0%) | 28 (100.0%) |
Real Estate & Mortgages in Fort Bidwell
Real Estate and Mortgage Overview in Fort Bidwell
| Characteristic | Without Mortgage | With Mortgage |
| Housing Units | 23 | 9 |
| Median Property Value | $187,500 | $0 |
| Median Household Income | $110,750 | $0 |
| Monthly Housing Costs | $285 | $0 |
| Real Estate Taxes | $1,750 | $0 |
Property Value by Mortgage Status in Fort Bidwell
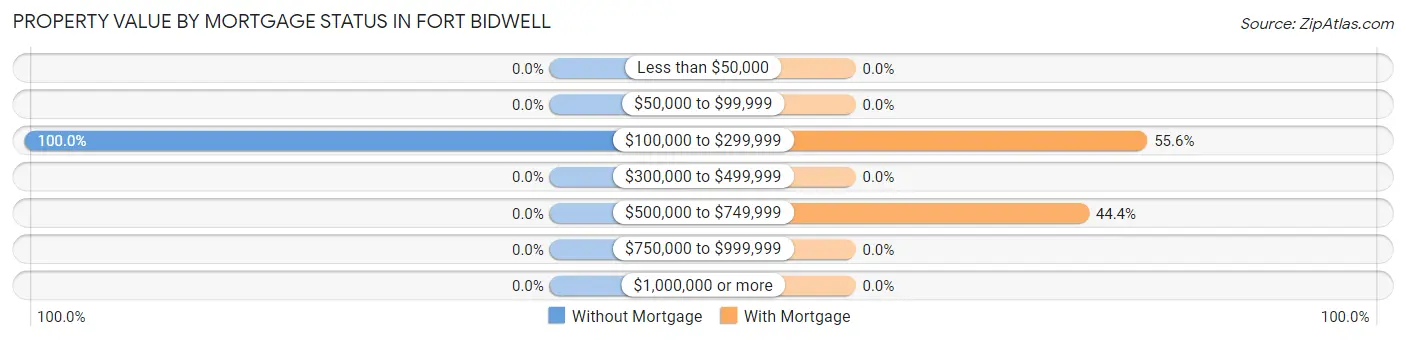
| Property Value | Without Mortgage | With Mortgage |
| Less than $50,000 | 0 (0.0%) | 0 (0.0%) |
| $50,000 to $99,999 | 0 (0.0%) | 0 (0.0%) |
| $100,000 to $299,999 | 23 (100.0%) | 5 (55.6%) |
| $300,000 to $499,999 | 0 (0.0%) | 0 (0.0%) |
| $500,000 to $749,999 | 0 (0.0%) | 4 (44.4%) |
| $750,000 to $999,999 | 0 (0.0%) | 0 (0.0%) |
| $1,000,000 or more | 0 (0.0%) | 0 (0.0%) |
| Total | 23 (100.0%) | 9 (100.0%) |
Household Income by Mortgage Status in Fort Bidwell
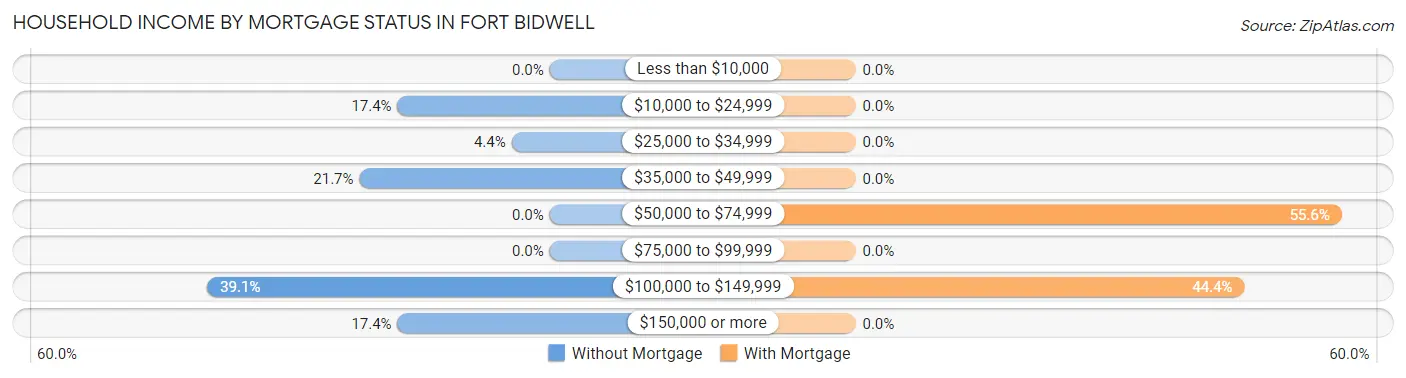
| Household Income | Without Mortgage | With Mortgage |
| Less than $10,000 | 0 (0.0%) | 0 (0.0%) |
| $10,000 to $24,999 | 4 (17.4%) | 0 (0.0%) |
| $25,000 to $34,999 | 1 (4.3%) | 0 (0.0%) |
| $35,000 to $49,999 | 5 (21.7%) | 0 (0.0%) |
| $50,000 to $74,999 | 0 (0.0%) | 5 (55.6%) |
| $75,000 to $99,999 | 0 (0.0%) | 0 (0.0%) |
| $100,000 to $149,999 | 9 (39.1%) | 4 (44.4%) |
| $150,000 or more | 4 (17.4%) | 0 (0.0%) |
| Total | 23 (100.0%) | 9 (100.0%) |
Property Value to Household Income Ratio in Fort Bidwell
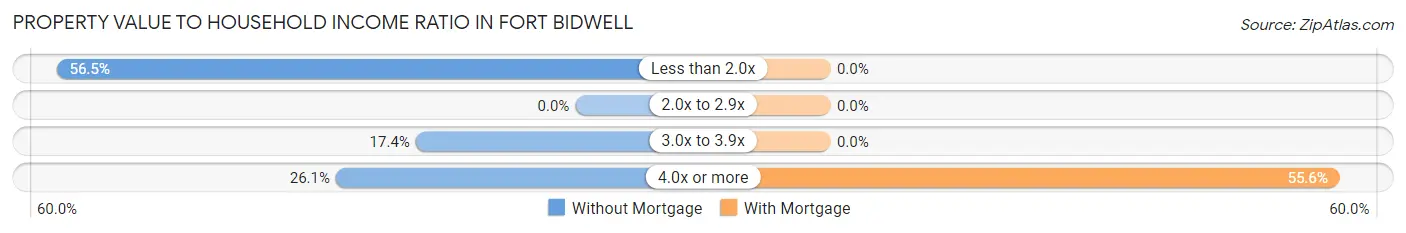
| Value-to-Income Ratio | Without Mortgage | With Mortgage |
| Less than 2.0x | 13 (56.5%) | 0 (0.0%) |
| 2.0x to 2.9x | 0 (0.0%) | 0 (0.0%) |
| 3.0x to 3.9x | 4 (17.4%) | 0 (0.0%) |
| 4.0x or more | 6 (26.1%) | 5 (55.6%) |
| Total | 23 (100.0%) | 9 (100.0%) |
Real Estate Taxes by Mortgage Status in Fort Bidwell
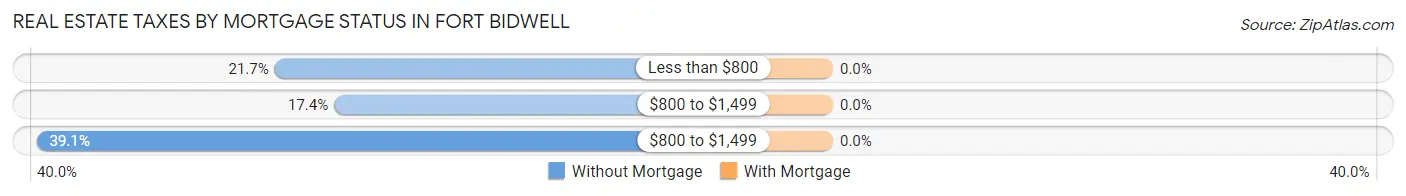
| Property Taxes | Without Mortgage | With Mortgage |
| Less than $800 | 5 (21.7%) | 0 (0.0%) |
| $800 to $1,499 | 4 (17.4%) | 0 (0.0%) |
| $800 to $1,499 | 9 (39.1%) | 0 (0.0%) |
| Total | 23 (100.0%) | 9 (100.0%) |
Health & Disability in Fort Bidwell
Health Insurance Coverage by Age in Fort Bidwell
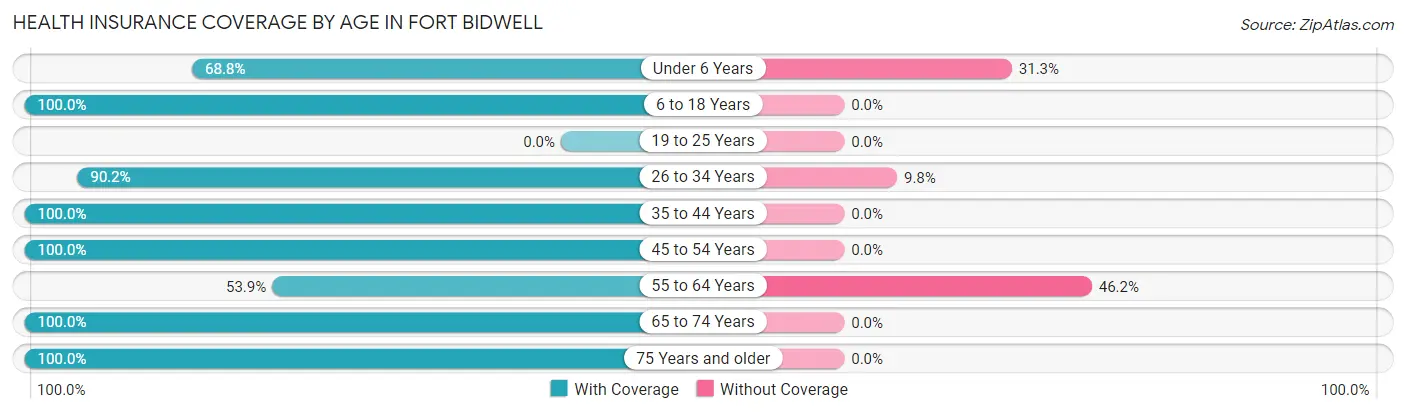
| Age Bracket | With Coverage | Without Coverage |
| Under 6 Years | 11 (68.8%) | 5 (31.2%) |
| 6 to 18 Years | 13 (100.0%) | 0 (0.0%) |
| 19 to 25 Years | 0 (0.0%) | 0 (0.0%) |
| 26 to 34 Years | 55 (90.2%) | 6 (9.8%) |
| 35 to 44 Years | 2 (100.0%) | 0 (0.0%) |
| 45 to 54 Years | 19 (100.0%) | 0 (0.0%) |
| 55 to 64 Years | 7 (53.8%) | 6 (46.2%) |
| 65 to 74 Years | 19 (100.0%) | 0 (0.0%) |
| 75 Years and older | 26 (100.0%) | 0 (0.0%) |
| Total | 152 (89.9%) | 17 (10.1%) |
Health Insurance Coverage by Citizenship Status in Fort Bidwell
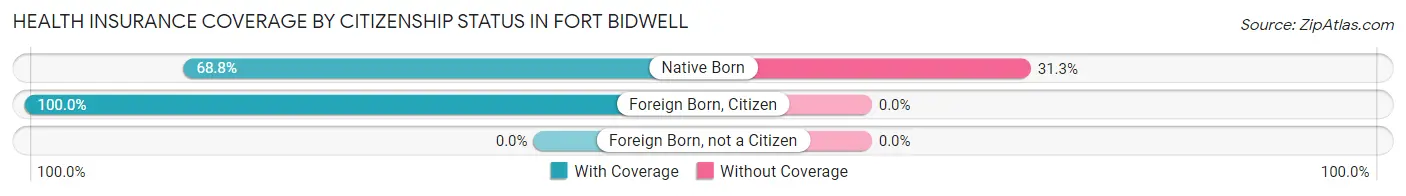
| Citizenship Status | With Coverage | Without Coverage |
| Native Born | 11 (68.8%) | 5 (31.2%) |
| Foreign Born, Citizen | 13 (100.0%) | 0 (0.0%) |
| Foreign Born, not a Citizen | 0 (0.0%) | 0 (0.0%) |
Health Insurance Coverage by Household Income in Fort Bidwell
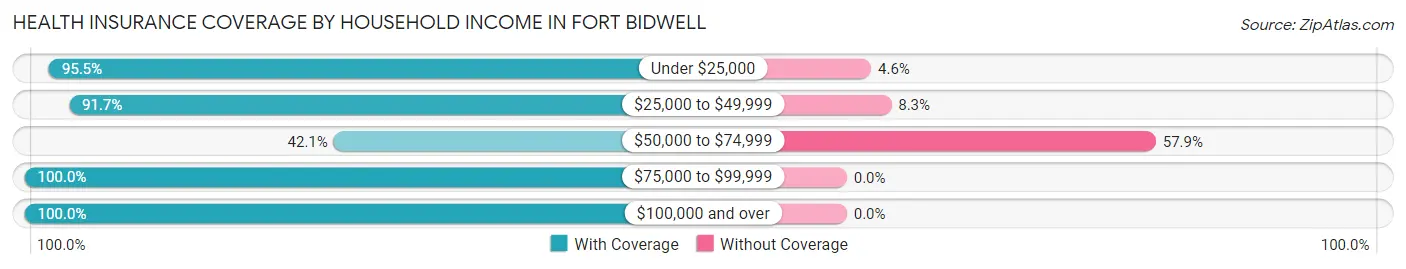
| Household Income | With Coverage | Without Coverage |
| Under $25,000 | 84 (95.5%) | 4 (4.5%) |
| $25,000 to $49,999 | 22 (91.7%) | 2 (8.3%) |
| $50,000 to $74,999 | 8 (42.1%) | 11 (57.9%) |
| $75,000 to $99,999 | 7 (100.0%) | 0 (0.0%) |
| $100,000 and over | 31 (100.0%) | 0 (0.0%) |
Public vs Private Health Insurance Coverage by Age in Fort Bidwell
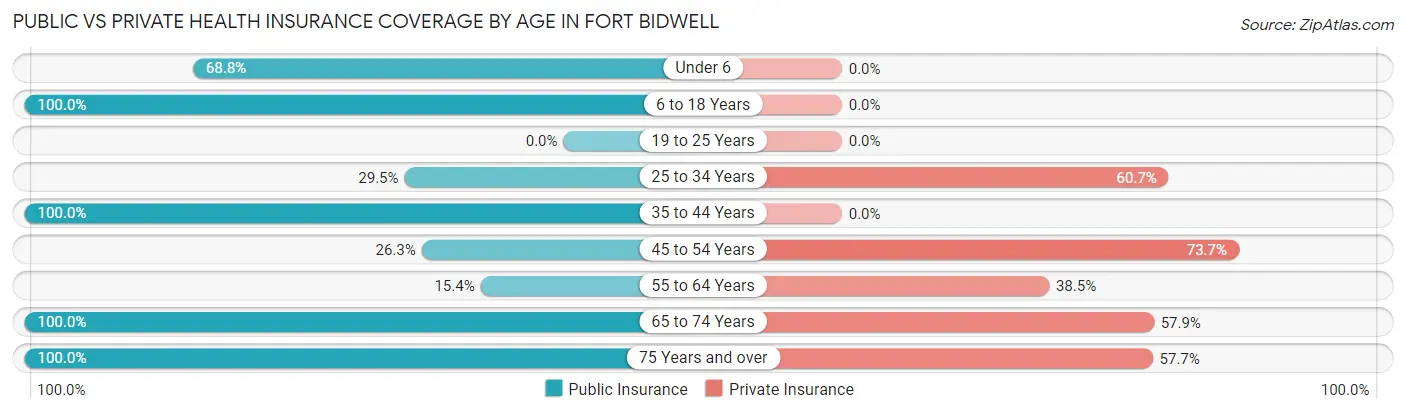
| Age Bracket | Public Insurance | Private Insurance |
| Under 6 | 11 (68.8%) | 0 (0.0%) |
| 6 to 18 Years | 13 (100.0%) | 0 (0.0%) |
| 19 to 25 Years | 0 (0.0%) | 0 (0.0%) |
| 25 to 34 Years | 18 (29.5%) | 37 (60.7%) |
| 35 to 44 Years | 2 (100.0%) | 0 (0.0%) |
| 45 to 54 Years | 5 (26.3%) | 14 (73.7%) |
| 55 to 64 Years | 2 (15.4%) | 5 (38.5%) |
| 65 to 74 Years | 19 (100.0%) | 11 (57.9%) |
| 75 Years and over | 26 (100.0%) | 15 (57.7%) |
| Total | 96 (56.8%) | 82 (48.5%) |
Disability Status by Sex by Age in Fort Bidwell
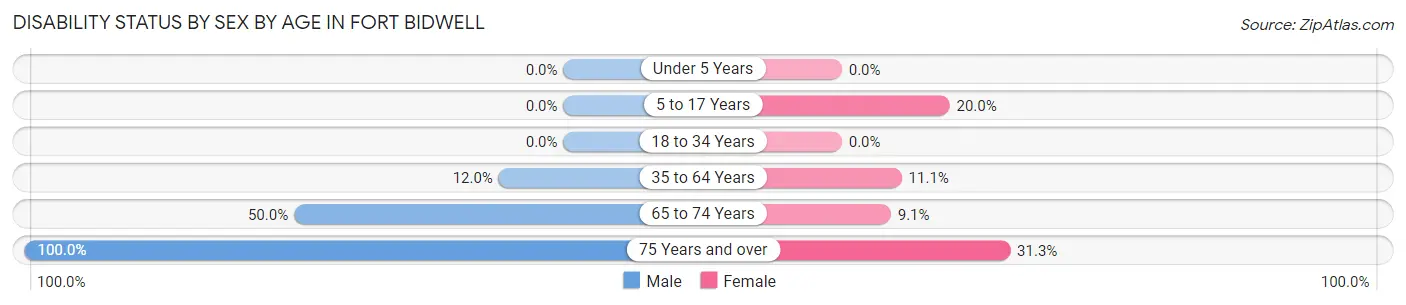
| Age Bracket | Male | Female |
| Under 5 Years | 0 (0.0%) | 0 (0.0%) |
| 5 to 17 Years | 0 (0.0%) | 2 (20.0%) |
| 18 to 34 Years | 0 (0.0%) | 0 (0.0%) |
| 35 to 64 Years | 3 (12.0%) | 1 (11.1%) |
| 65 to 74 Years | 4 (50.0%) | 1 (9.1%) |
| 75 Years and over | 10 (100.0%) | 5 (31.2%) |
Disability Class by Sex by Age in Fort Bidwell
Disability Class: Hearing Difficulty
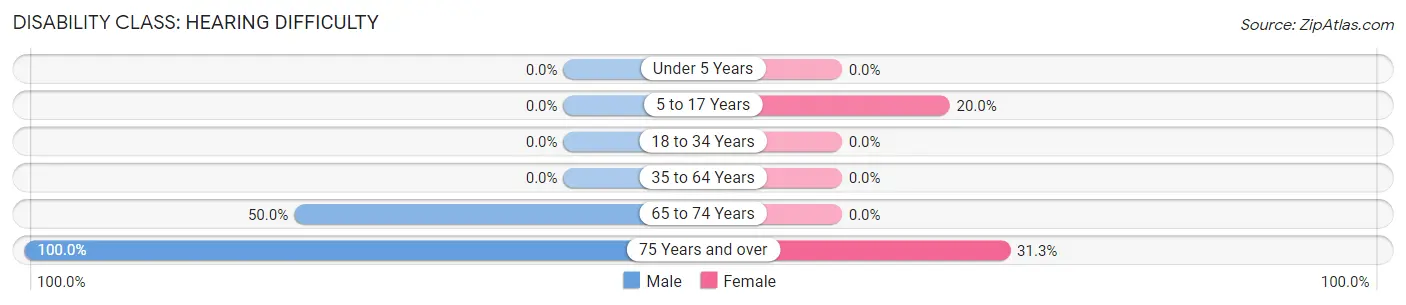
| Age Bracket | Male | Female |
| Under 5 Years | 0 (0.0%) | 0 (0.0%) |
| 5 to 17 Years | 0 (0.0%) | 2 (20.0%) |
| 18 to 34 Years | 0 (0.0%) | 0 (0.0%) |
| 35 to 64 Years | 0 (0.0%) | 0 (0.0%) |
| 65 to 74 Years | 4 (50.0%) | 0 (0.0%) |
| 75 Years and over | 10 (100.0%) | 5 (31.2%) |
Disability Class: Vision Difficulty
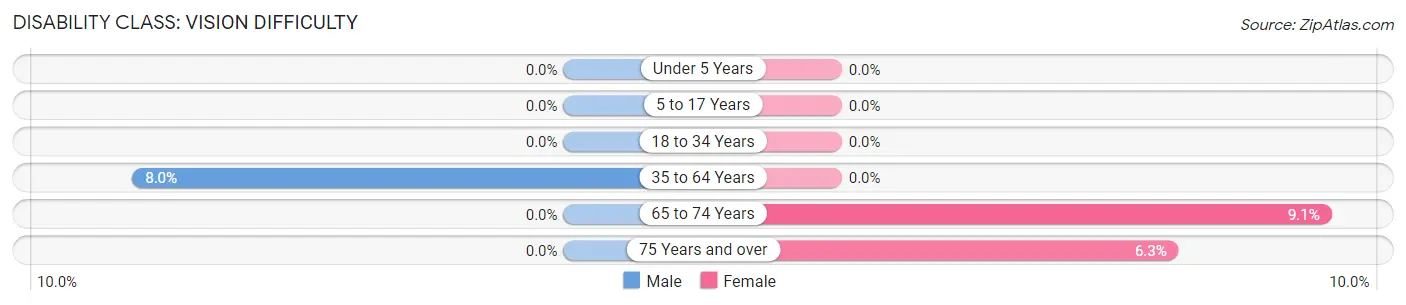
| Age Bracket | Male | Female |
| Under 5 Years | 0 (0.0%) | 0 (0.0%) |
| 5 to 17 Years | 0 (0.0%) | 0 (0.0%) |
| 18 to 34 Years | 0 (0.0%) | 0 (0.0%) |
| 35 to 64 Years | 2 (8.0%) | 0 (0.0%) |
| 65 to 74 Years | 0 (0.0%) | 1 (9.1%) |
| 75 Years and over | 0 (0.0%) | 1 (6.2%) |
Disability Class: Cognitive Difficulty
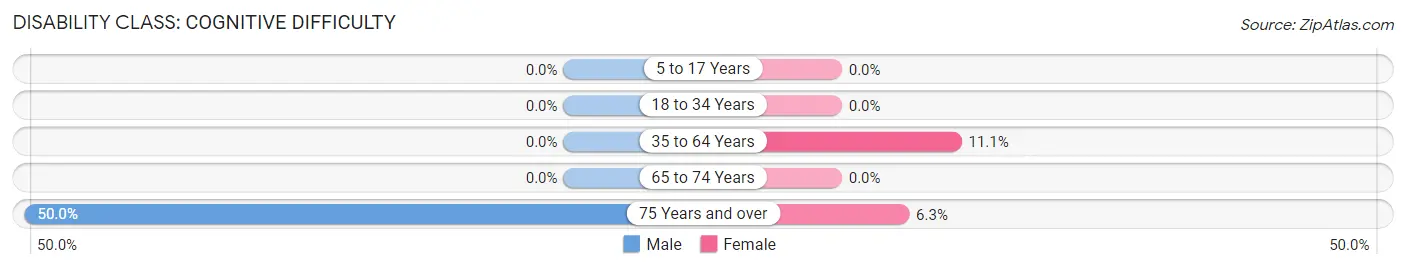
| Age Bracket | Male | Female |
| 5 to 17 Years | 0 (0.0%) | 0 (0.0%) |
| 18 to 34 Years | 0 (0.0%) | 0 (0.0%) |
| 35 to 64 Years | 0 (0.0%) | 1 (11.1%) |
| 65 to 74 Years | 0 (0.0%) | 0 (0.0%) |
| 75 Years and over | 5 (50.0%) | 1 (6.2%) |
Disability Class: Ambulatory Difficulty
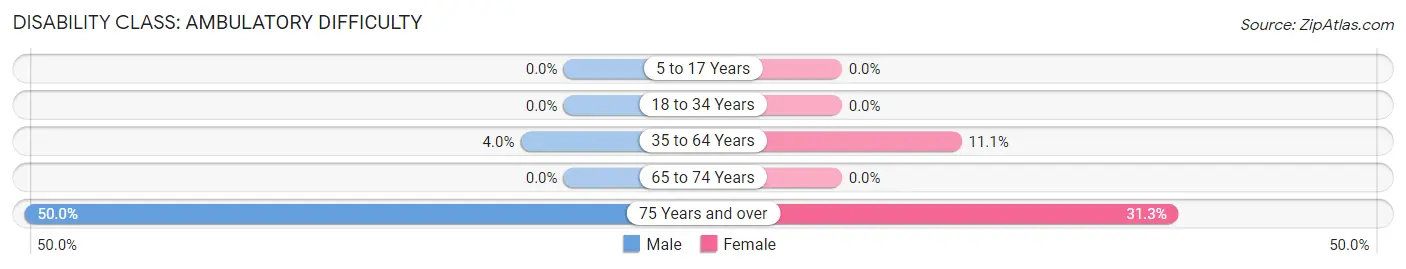
| Age Bracket | Male | Female |
| 5 to 17 Years | 0 (0.0%) | 0 (0.0%) |
| 18 to 34 Years | 0 (0.0%) | 0 (0.0%) |
| 35 to 64 Years | 1 (4.0%) | 1 (11.1%) |
| 65 to 74 Years | 0 (0.0%) | 0 (0.0%) |
| 75 Years and over | 5 (50.0%) | 5 (31.2%) |
Disability Class: Self-Care Difficulty
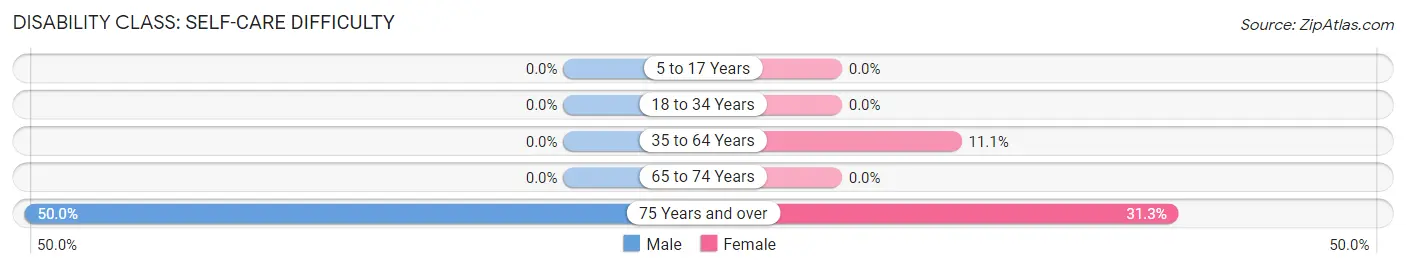
| Age Bracket | Male | Female |
| 5 to 17 Years | 0 (0.0%) | 0 (0.0%) |
| 18 to 34 Years | 0 (0.0%) | 0 (0.0%) |
| 35 to 64 Years | 0 (0.0%) | 1 (11.1%) |
| 65 to 74 Years | 0 (0.0%) | 0 (0.0%) |
| 75 Years and over | 5 (50.0%) | 5 (31.2%) |
Technology Access in Fort Bidwell
Computing Device Access in Fort Bidwell
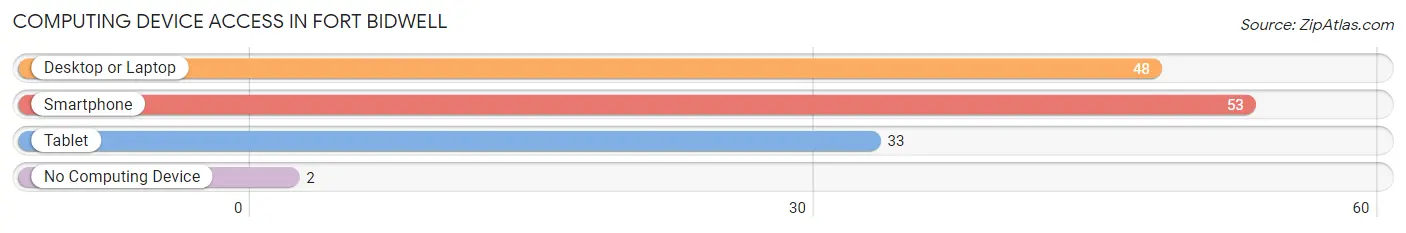
| Device Type | # Households | % Households |
| Desktop or Laptop | 48 | 80.0% |
| Smartphone | 53 | 88.3% |
| Tablet | 33 | 55.0% |
| No Computing Device | 2 | 3.3% |
| Total | 60 | 100.0% |
Internet Access in Fort Bidwell
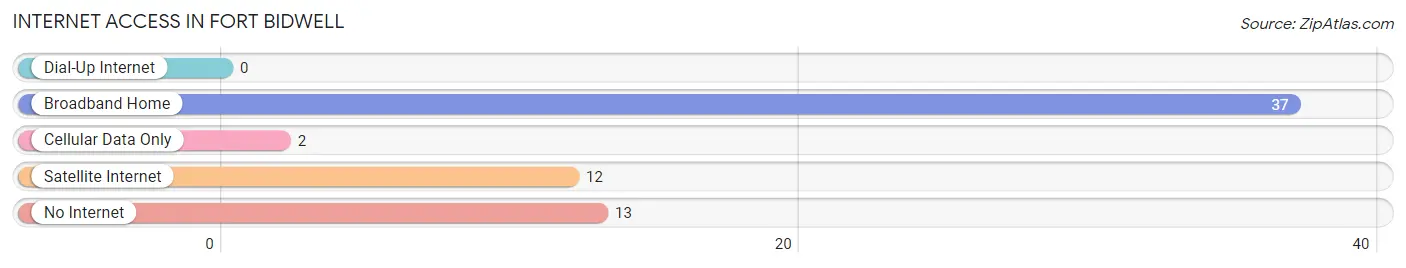
| Internet Type | # Households | % Households |
| Dial-Up Internet | 0 | 0.0% |
| Broadband Home | 37 | 61.7% |
| Cellular Data Only | 2 | 3.3% |
| Satellite Internet | 12 | 20.0% |
| No Internet | 13 | 21.7% |
| Total | 60 | 100.0% |
Fort Bidwell Summary
History
The small town of Fort Bidwell, California is located in Modoc County, in the far northeastern corner of the state. It is situated on the banks of the Pit River, near the Oregon border. The town was founded in 1864, when the U.S. Army established a military post there to protect settlers from Native American attacks. The post was named after General John Bidwell, who had led a successful campaign against the Modoc Indians in the area.
The town grew slowly over the years, and by the early 1900s, it had become a bustling center of commerce and industry. The town was home to several sawmills, a flour mill, a blacksmith shop, and a hotel. It also had a post office, a school, and a general store.
In the 1920s, Fort Bidwell began to decline. The sawmills and other businesses closed, and the population dwindled. By the 1950s, the town was nearly abandoned. In the 1960s, the town was revitalized when the U.S. Army Corps of Engineers built a dam on the Pit River, creating Lake Bidwell. The lake provided a source of recreation and tourism, and the town began to grow again.
Today, Fort Bidwell is a small, rural community with a population of about 500 people. It is a popular destination for fishing, camping, and other outdoor activities.
Geography
Fort Bidwell is located in Modoc County, in the far northeastern corner of California. It is situated on the banks of the Pit River, near the Oregon border. The town is surrounded by the Modoc National Forest, which covers over 1.6 million acres of land. The area is known for its rugged beauty, with rolling hills, pine forests, and open meadows.
The climate in Fort Bidwell is semi-arid, with hot summers and cold winters. The average annual temperature is around 50°F, and the average annual precipitation is around 10 inches.
Economy
The economy of Fort Bidwell is largely based on tourism and recreation. The town is a popular destination for fishing, camping, and other outdoor activities. The nearby Lake Bidwell provides a source of recreation and tourism, and the town also has several restaurants, stores, and other businesses.
The town is also home to a small manufacturing industry. There are several small factories that produce wood products, metal products, and other goods.
Demographics
As of the 2010 census, the population of Fort Bidwell was 498 people. The racial makeup of the town was 94.4% White, 0.2% African American, 0.8% Native American, 0.2% Asian, 0.2% Pacific Islander, and 4.0% from other races. The median household income was $30,000, and the median age was 44.
Fort Bidwell is a small, rural community with a close-knit population. The town is known for its friendly atmosphere and its strong sense of community.
Common Questions
What is Per Capita Income in Fort Bidwell?
Per Capita income in Fort Bidwell is $24,376.
What is Family Income Deficit in Fort Bidwell?
Family Income Deficit in Fort Bidwell is $22,617.
Families that are below poverty line in Fort Bidwell earn $22,617 less on average than the poverty threshold level.
What is Inequality or Gini Index in Fort Bidwell?
Inequality or Gini Index in Fort Bidwell is 0.46.
What is the Total Population of Fort Bidwell?
Total Population of Fort Bidwell is 169.
What is the Total Male Population of Fort Bidwell?
Total Male Population of Fort Bidwell is 99.
What is the Total Female Population of Fort Bidwell?
Total Female Population of Fort Bidwell is 70.
What is the Ratio of Males per 100 Females in Fort Bidwell?
There are 141.43 Males per 100 Females in Fort Bidwell.
What is the Ratio of Females per 100 Males in Fort Bidwell?
There are 70.71 Females per 100 Males in Fort Bidwell.
What is the Median Population Age in Fort Bidwell?
Median Population Age in Fort Bidwell is 31.5 Years.
What is the Average Family Size in Fort Bidwell
Average Family Size in Fort Bidwell is 3.4 People.
What is the Average Household Size in Fort Bidwell
Average Household Size in Fort Bidwell is 2.8 People.
How Large is the Labor Force in Fort Bidwell?
There are 81 People in the Labor Forcein in Fort Bidwell.
What is the Percentage of People in the Labor Force in Fort Bidwell?
57.9% of People are in the Labor Force in Fort Bidwell.
What is the Unemployment Rate in Fort Bidwell?
Unemployment Rate in Fort Bidwell is 11.1%.