Farmersville, CA Map & Demographics
Farmersville Map
Farmersville Overview
$16,635
PER CAPITA INCOME
$56,729
AVG FAMILY INCOME
$52,714
AVG HOUSEHOLD INCOME
14.6%
WAGE / INCOME GAP [ % ]
85.4¢/ $1
WAGE / INCOME GAP [ $ ]
$11,356
FAMILY INCOME DEFICIT
0.37
INEQUALITY / GINI INDEX
10,393
TOTAL POPULATION
5,234
MALE POPULATION
5,159
FEMALE POPULATION
101.45
MALES / 100 FEMALES
98.57
FEMALES / 100 MALES
29.4
MEDIAN AGE
4.2
AVG FAMILY SIZE
3.8
AVG HOUSEHOLD SIZE
4,750
LABOR FORCE [ PEOPLE ]
60.4%
PERCENT IN LABOR FORCE
9.8%
UNEMPLOYMENT RATE
Farmersville Zip Codes
Farmersville Area Codes
Income in Farmersville
Income Overview in Farmersville
Per Capita Income in Farmersville is $16,635, while median incomes of families and households are $56,729 and $52,714 respectively.
| Characteristic | Number | Measure |
| Per Capita Income | 10,393 | $16,635 |
| Median Family Income | 2,239 | $56,729 |
| Mean Family Income | 2,239 | $63,842 |
| Median Household Income | 2,732 | $52,714 |
| Mean Household Income | 2,732 | $60,492 |
| Income Deficit | 2,239 | $11,356 |
| Wage / Income Gap (%) | 10,393 | 14.65% |
| Wage / Income Gap ($) | 10,393 | 85.35¢ per $1 |
| Gini / Inequality Index | 10,393 | 0.37 |
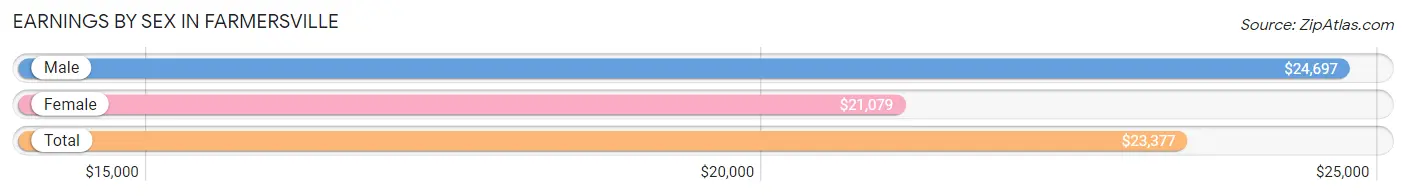
Earnings by Sex in Farmersville
Average Earnings in Farmersville are $23,377, $24,697 for men and $21,079 for women, a difference of 14.6%.
| Sex | Number | Average Earnings |
| Male | 2,553 (53.2%) | $24,697 |
| Female | 2,249 (46.8%) | $21,079 |
| Total | 4,802 (100.0%) | $23,377 |
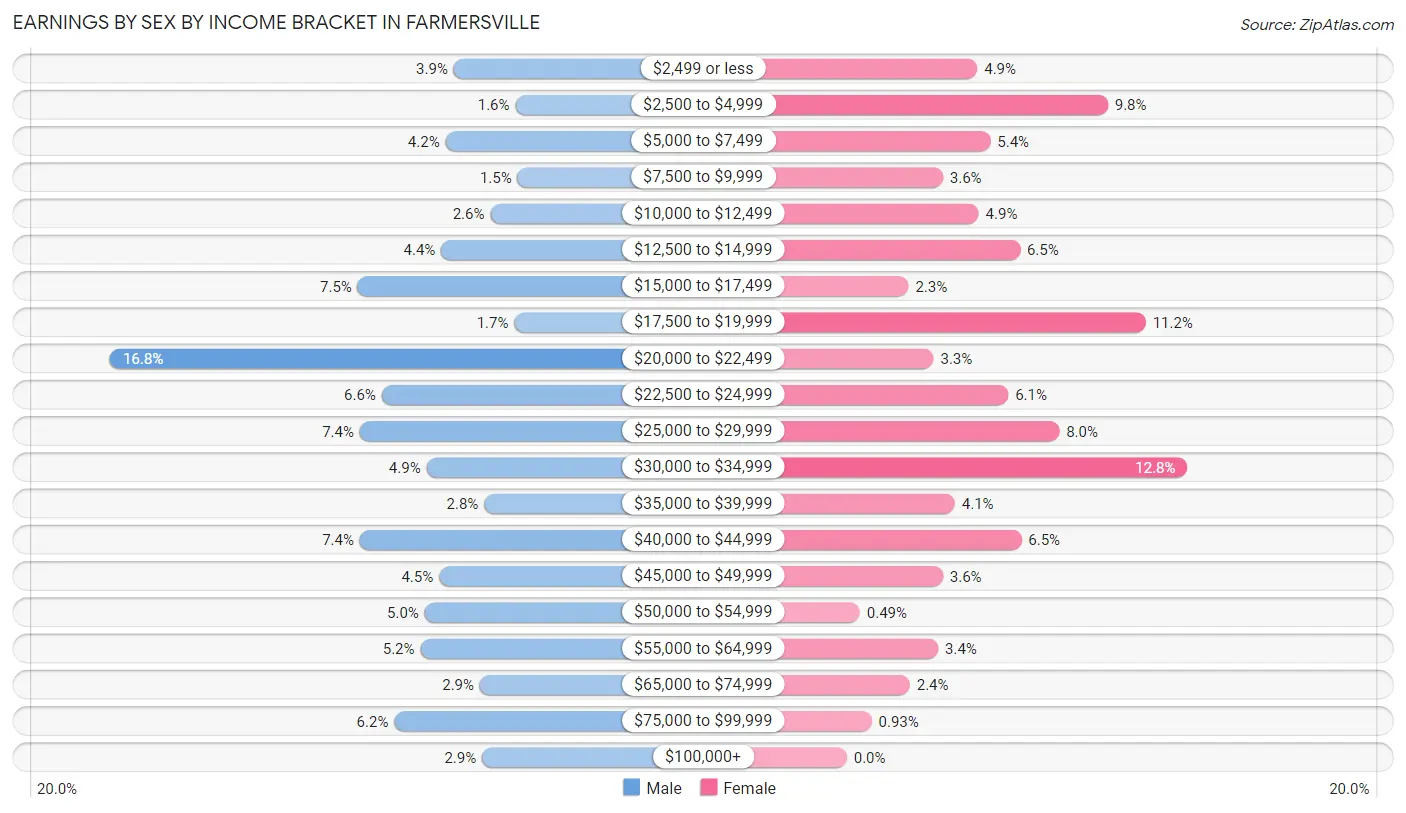
Earnings by Sex by Income Bracket in Farmersville
The most common earnings brackets in Farmersville are $20,000 to $22,499 for men (429 | 16.8%) and $30,000 to $34,999 for women (287 | 12.8%).
| Income | Male | Female |
| $2,499 or less | 100 (3.9%) | 110 (4.9%) |
| $2,500 to $4,999 | 41 (1.6%) | 220 (9.8%) |
| $5,000 to $7,499 | 108 (4.2%) | 121 (5.4%) |
| $7,500 to $9,999 | 39 (1.5%) | 81 (3.6%) |
| $10,000 to $12,499 | 65 (2.5%) | 111 (4.9%) |
| $12,500 to $14,999 | 112 (4.4%) | 146 (6.5%) |
| $15,000 to $17,499 | 192 (7.5%) | 52 (2.3%) |
| $17,500 to $19,999 | 42 (1.7%) | 252 (11.2%) |
| $20,000 to $22,499 | 429 (16.8%) | 73 (3.3%) |
| $22,500 to $24,999 | 169 (6.6%) | 136 (6.0%) |
| $25,000 to $29,999 | 190 (7.4%) | 179 (8.0%) |
| $30,000 to $34,999 | 126 (4.9%) | 287 (12.8%) |
| $35,000 to $39,999 | 71 (2.8%) | 91 (4.1%) |
| $40,000 to $44,999 | 190 (7.4%) | 147 (6.5%) |
| $45,000 to $49,999 | 114 (4.5%) | 81 (3.6%) |
| $50,000 to $54,999 | 128 (5.0%) | 11 (0.5%) |
| $55,000 to $64,999 | 132 (5.2%) | 77 (3.4%) |
| $65,000 to $74,999 | 75 (2.9%) | 53 (2.4%) |
| $75,000 to $99,999 | 157 (6.1%) | 21 (0.9%) |
| $100,000+ | 73 (2.9%) | 0 (0.0%) |
| Total | 2,553 (100.0%) | 2,249 (100.0%) |
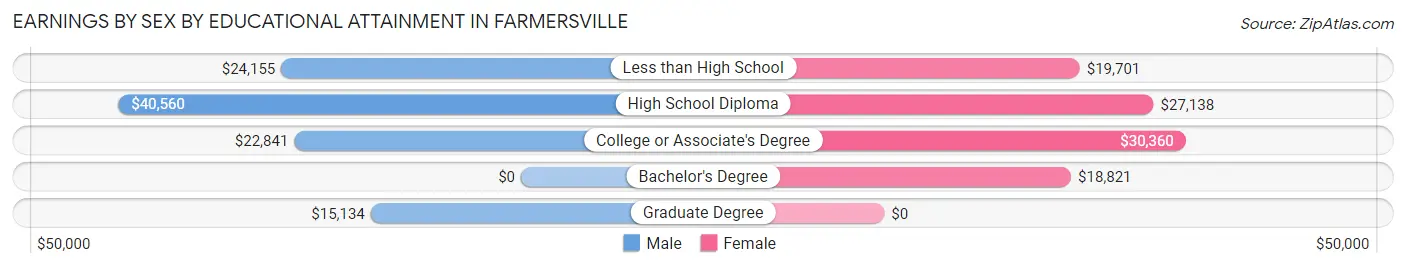
Earnings by Sex by Educational Attainment in Farmersville
Average earnings in Farmersville are $28,971 for men and $23,796 for women, a difference of 17.9%. Men with an educational attainment of high school diploma enjoy the highest average annual earnings of $40,560, while those with graduate degree education earn the least with $15,134. Women with an educational attainment of college or associate's degree earn the most with the average annual earnings of $30,360, while those with bachelor's degree education have the smallest earnings of $18,821.
| Educational Attainment | Male Income | Female Income |
| Less than High School | $24,155 | $19,701 |
| High School Diploma | $40,560 | $27,138 |
| College or Associate's Degree | $22,841 | $30,360 |
| Bachelor's Degree | - | - |
| Graduate Degree | $15,134 | $0 |
| Total | $28,971 | $23,796 |
Family Income in Farmersville
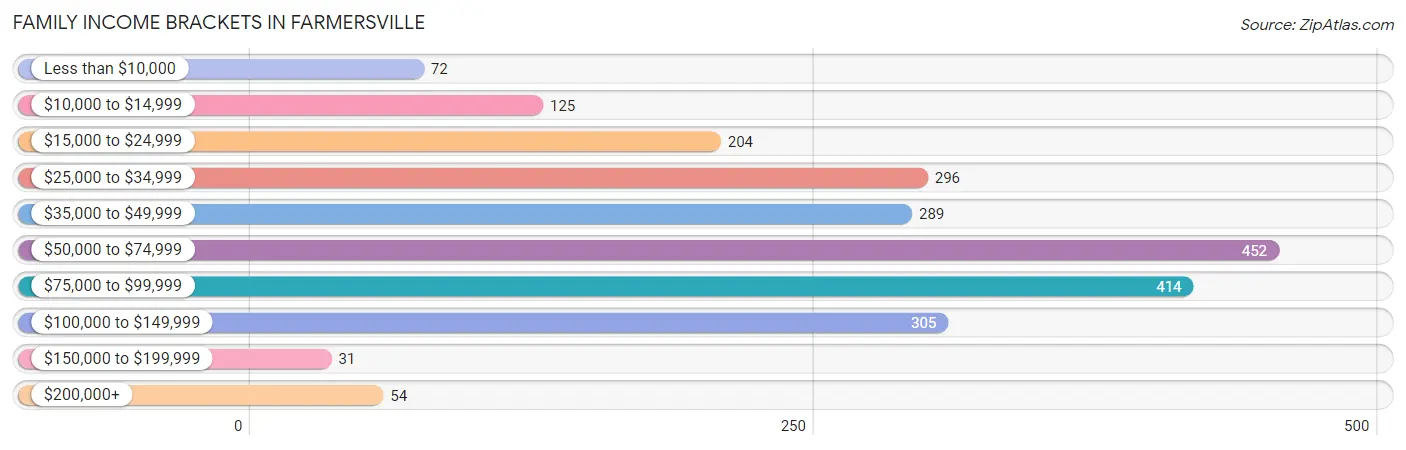
Family Income Brackets in Farmersville
According to the Farmersville family income data, there are 452 families falling into the $50,000 to $74,999 income range, which is the most common income bracket and makes up 20.2% of all families. Conversely, the $150,000 to $199,999 income bracket is the least frequent group with only 31 families (1.4%) belonging to this category.
| Income Bracket | # Families | % Families |
| Less than $10,000 | 72 | 3.2% |
| $10,000 to $14,999 | 125 | 5.6% |
| $15,000 to $24,999 | 204 | 9.1% |
| $25,000 to $34,999 | 296 | 13.2% |
| $35,000 to $49,999 | 289 | 12.9% |
| $50,000 to $74,999 | 452 | 20.2% |
| $75,000 to $99,999 | 414 | 18.5% |
| $100,000 to $149,999 | 305 | 13.6% |
| $150,000 to $199,999 | 31 | 1.4% |
| $200,000+ | 54 | 2.4% |
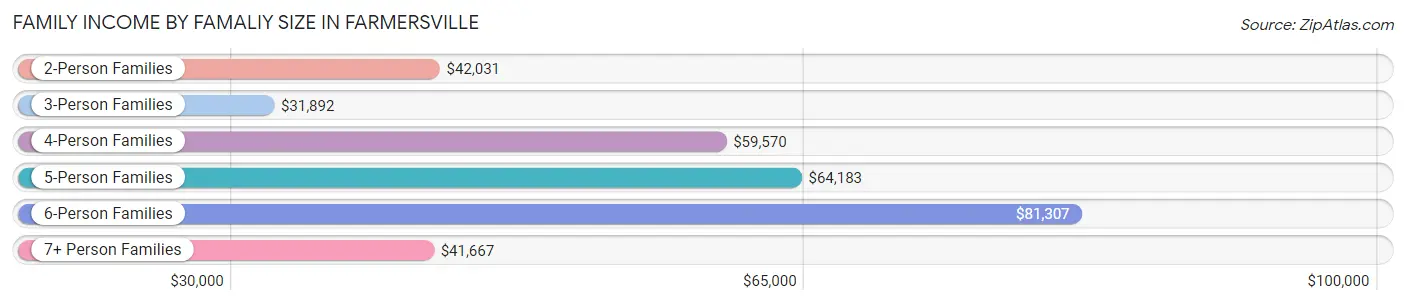
Family Income by Famaliy Size in Farmersville
6-person families (156 | 7.0%) account for the highest median family income in Farmersville with $81,307 per family, while 2-person families (477 | 21.3%) have the highest median income of $21,016 per family member.
| Income Bracket | # Families | Median Income |
| 2-Person Families | 477 (21.3%) | $42,031 |
| 3-Person Families | 400 (17.9%) | $31,892 |
| 4-Person Families | 651 (29.1%) | $59,570 |
| 5-Person Families | 479 (21.4%) | $64,183 |
| 6-Person Families | 156 (7.0%) | $81,307 |
| 7+ Person Families | 76 (3.4%) | $41,667 |
| Total | 2,239 (100.0%) | $56,729 |
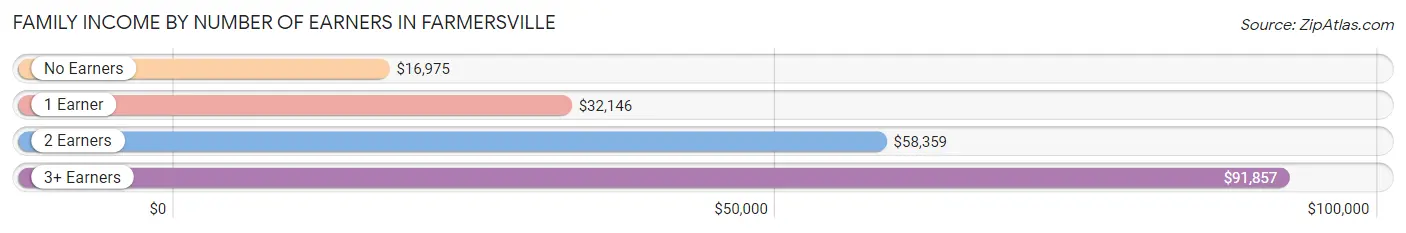
Family Income by Number of Earners in Farmersville
The median family income in Farmersville is $56,729, with families comprising 3+ earners (576) having the highest median family income of $91,857, while families with no earners (242) have the lowest median family income of $16,975, accounting for 25.7% and 10.8% of families, respectively.
| Number of Earners | # Families | Median Income |
| No Earners | 242 (10.8%) | $16,975 |
| 1 Earner | 693 (30.9%) | $32,146 |
| 2 Earners | 728 (32.5%) | $58,359 |
| 3+ Earners | 576 (25.7%) | $91,857 |
| Total | 2,239 (100.0%) | $56,729 |
Household Income in Farmersville
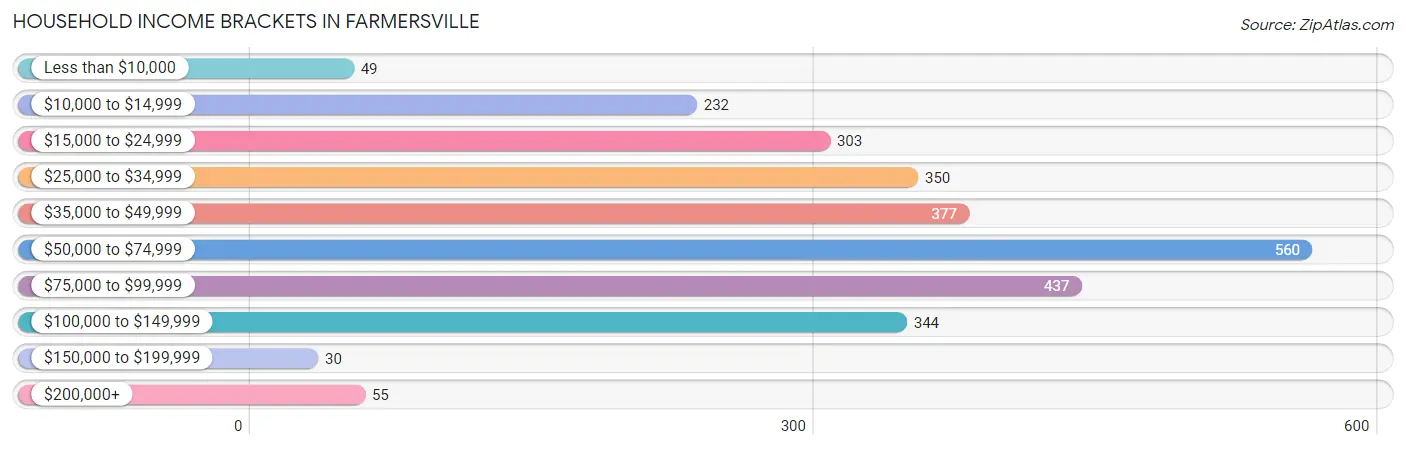
Household Income Brackets in Farmersville
With 560 households falling in the category, the $50,000 to $74,999 income range is the most frequent in Farmersville, accounting for 20.5% of all households. In contrast, only 30 households (1.1%) fall into the $150,000 to $199,999 income bracket, making it the least populous group.
| Income Bracket | # Households | % Households |
| Less than $10,000 | 49 | 1.8% |
| $10,000 to $14,999 | 232 | 8.5% |
| $15,000 to $24,999 | 303 | 11.1% |
| $25,000 to $34,999 | 350 | 12.8% |
| $35,000 to $49,999 | 377 | 13.8% |
| $50,000 to $74,999 | 560 | 20.5% |
| $75,000 to $99,999 | 437 | 16.0% |
| $100,000 to $149,999 | 344 | 12.6% |
| $150,000 to $199,999 | 30 | 1.1% |
| $200,000+ | 55 | 2.0% |
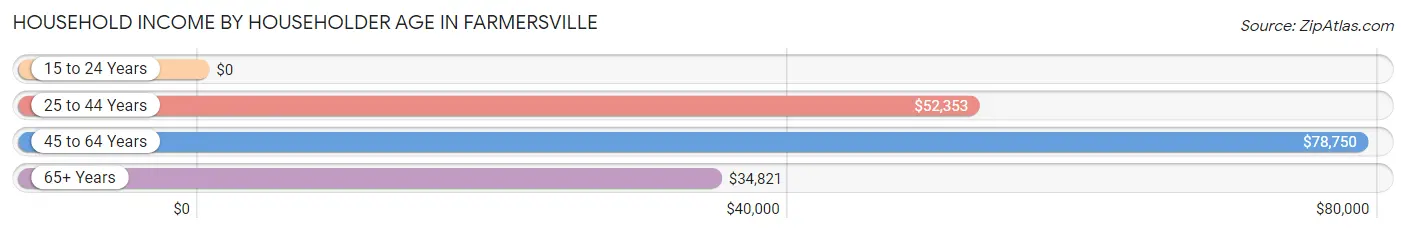
Household Income by Householder Age in Farmersville
The median household income in Farmersville is $52,714, with the highest median household income of $78,750 found in the 45 to 64 years age bracket for the primary householder. A total of 1,019 households (37.3%) fall into this category. Meanwhile, the 15 to 24 years age bracket for the primary householder has the lowest median household income of $0, with 44 households (1.6%) in this group.
| Income Bracket | # Households | Median Income |
| 15 to 24 Years | 44 (1.6%) | $0 |
| 25 to 44 Years | 1,074 (39.3%) | $52,353 |
| 45 to 64 Years | 1,019 (37.3%) | $78,750 |
| 65+ Years | 595 (21.8%) | $34,821 |
| Total | 2,732 (100.0%) | $52,714 |
Poverty in Farmersville
Income Below Poverty by Sex and Age in Farmersville
With 22.2% poverty level for males and 27.0% for females among the residents of Farmersville, under 5 year old males and 5 year old females are the most vulnerable to poverty, with 173 males (55.4%) and 87 females (100.0%) in their respective age groups living below the poverty level.
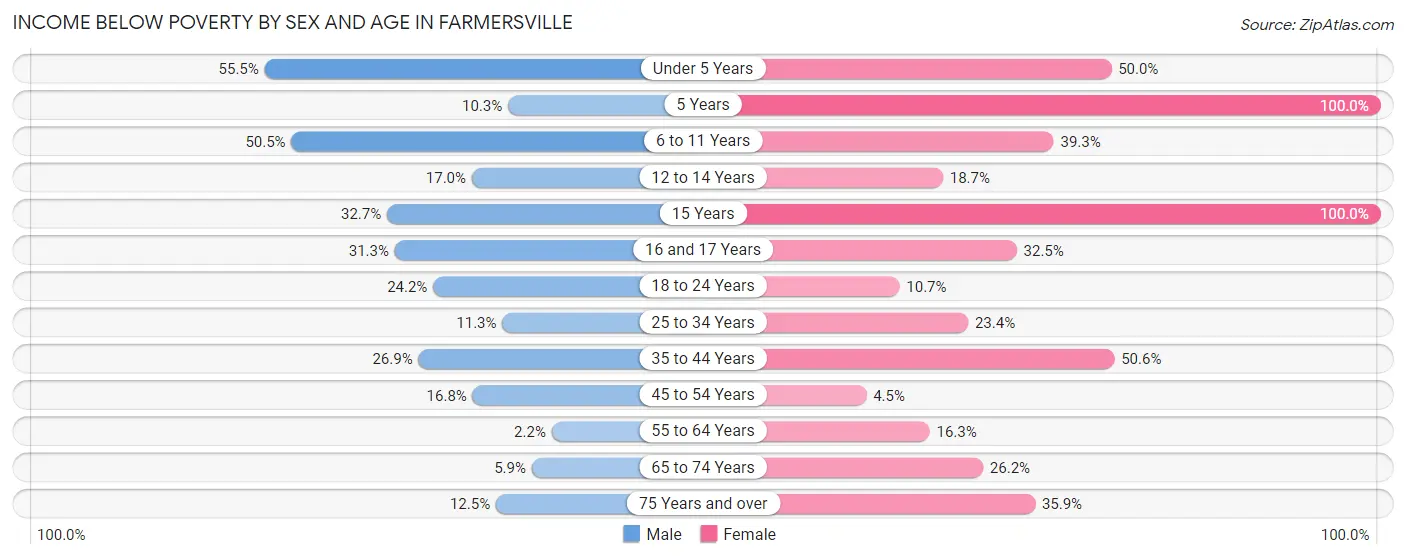
| Age Bracket | Male | Female |
| Under 5 Years | 173 (55.4%) | 109 (50.0%) |
| 5 Years | 12 (10.3%) | 87 (100.0%) |
| 6 to 11 Years | 213 (50.5%) | 215 (39.3%) |
| 12 to 14 Years | 36 (17.0%) | 83 (18.7%) |
| 15 Years | 36 (32.7%) | 25 (100.0%) |
| 16 and 17 Years | 87 (31.3%) | 61 (32.5%) |
| 18 to 24 Years | 194 (24.2%) | 71 (10.7%) |
| 25 to 34 Years | 89 (11.3%) | 170 (23.4%) |
| 35 to 44 Years | 171 (26.9%) | 268 (50.6%) |
| 45 to 54 Years | 105 (16.8%) | 25 (4.5%) |
| 55 to 64 Years | 12 (2.1%) | 102 (16.3%) |
| 65 to 74 Years | 13 (5.9%) | 55 (26.2%) |
| 75 Years and over | 18 (12.5%) | 114 (35.8%) |
| Total | 1,159 (22.2%) | 1,385 (27.0%) |
Income Above Poverty by Sex and Age in Farmersville
According to the poverty statistics in Farmersville, males aged 55 to 64 years and females aged 45 to 54 years are the age groups that are most secure financially, with 97.9% of males and 95.5% of females in these age groups living above the poverty line.
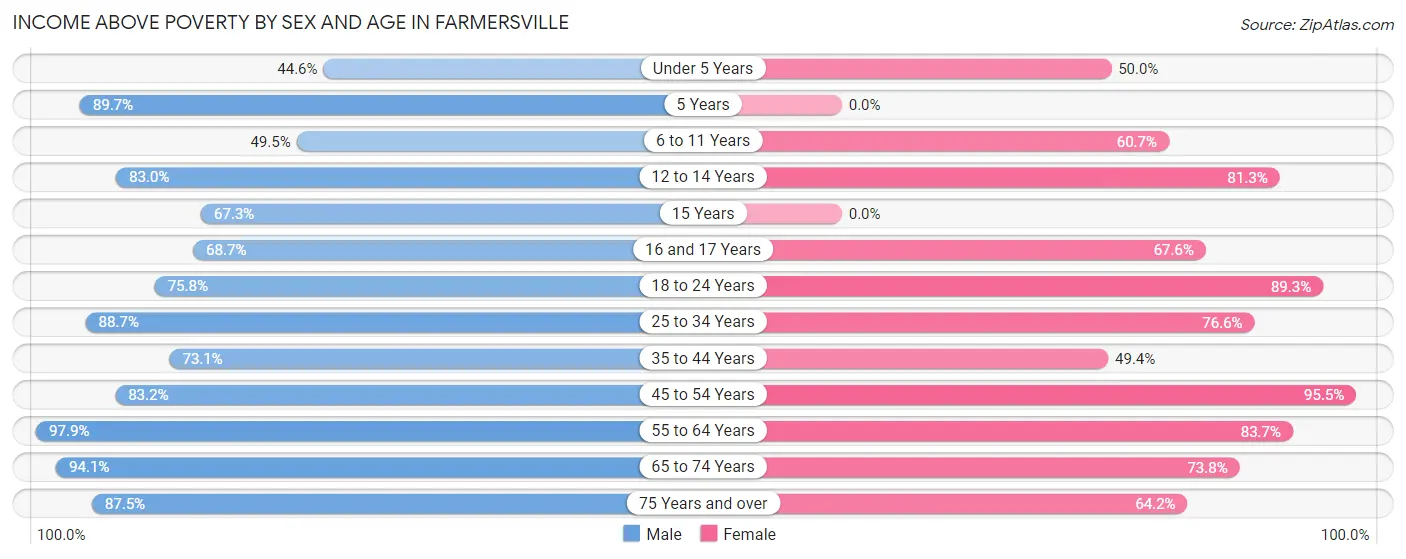
| Age Bracket | Male | Female |
| Under 5 Years | 139 (44.6%) | 109 (50.0%) |
| 5 Years | 105 (89.7%) | 0 (0.0%) |
| 6 to 11 Years | 209 (49.5%) | 332 (60.7%) |
| 12 to 14 Years | 176 (83.0%) | 360 (81.3%) |
| 15 Years | 74 (67.3%) | 0 (0.0%) |
| 16 and 17 Years | 191 (68.7%) | 127 (67.5%) |
| 18 to 24 Years | 609 (75.8%) | 593 (89.3%) |
| 25 to 34 Years | 697 (88.7%) | 556 (76.6%) |
| 35 to 44 Years | 465 (73.1%) | 262 (49.4%) |
| 45 to 54 Years | 519 (83.2%) | 527 (95.5%) |
| 55 to 64 Years | 546 (97.9%) | 524 (83.7%) |
| 65 to 74 Years | 209 (94.1%) | 155 (73.8%) |
| 75 Years and over | 126 (87.5%) | 204 (64.1%) |
| Total | 4,065 (77.8%) | 3,749 (73.0%) |
Income Below Poverty Among Married-Couple Families in Farmersville
The poverty statistics for married-couple families in Farmersville show that 15.0% or 189 of the total 1,263 families live below the poverty line. Families with 5 or more children have the highest poverty rate of 69.7%, comprising of 46 families. On the other hand, families with 1 or 2 children have the lowest poverty rate of 9.7%, which includes 64 families.
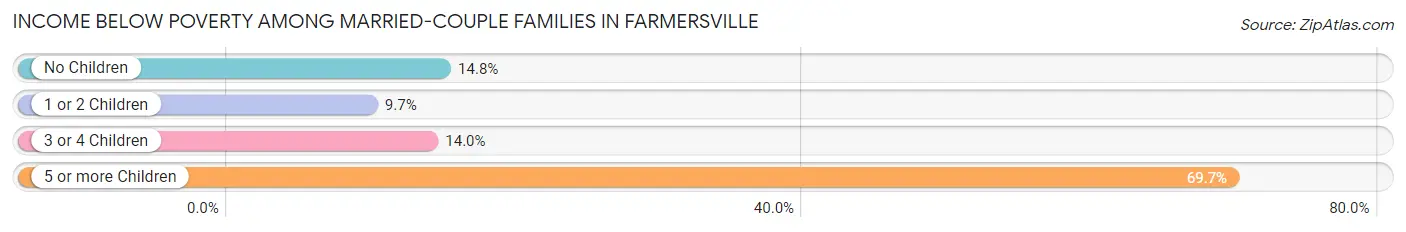
| Children | Above Poverty | Below Poverty |
| No Children | 350 (85.2%) | 61 (14.8%) |
| 1 or 2 Children | 593 (90.3%) | 64 (9.7%) |
| 3 or 4 Children | 111 (86.1%) | 18 (14.0%) |
| 5 or more Children | 20 (30.3%) | 46 (69.7%) |
| Total | 1,074 (85.0%) | 189 (15.0%) |
Income Below Poverty Among Single-Parent Households in Farmersville
According to the poverty data in Farmersville, 19.8% or 54 single-father households and 30.7% or 216 single-mother households are living below the poverty line. Among single-father households, those with 3 or 4 children have the highest poverty rate, with 20 households (42.5%) experiencing poverty. Likewise, among single-mother households, those with 3 or 4 children have the highest poverty rate, with 136 households (86.1%) falling below the poverty line.

| Children | Single Father | Single Mother |
| No Children | 10 (6.3%) | 26 (9.3%) |
| 1 or 2 Children | 24 (35.3%) | 54 (20.4%) |
| 3 or 4 Children | 20 (42.5%) | 136 (86.1%) |
| 5 or more Children | 0 (0.0%) | 0 (0.0%) |
| Total | 54 (19.8%) | 216 (30.7%) |
Income Below Poverty Among Married-Couple vs Single-Parent Households in Farmersville
The poverty data for Farmersville shows that 189 of the married-couple family households (15.0%) and 270 of the single-parent households (27.7%) are living below the poverty level. Within the married-couple family households, those with 5 or more children have the highest poverty rate, with 46 households (69.7%) falling below the poverty line. Among the single-parent households, those with 3 or 4 children have the highest poverty rate, with 156 household (76.1%) living below poverty.
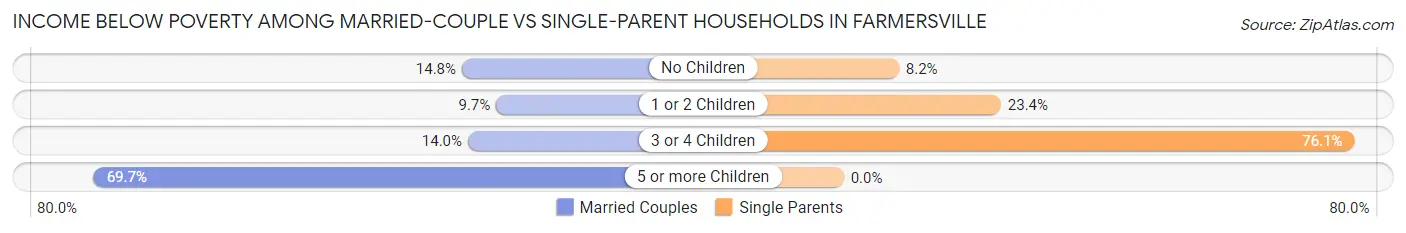
| Children | Married-Couple Families | Single-Parent Households |
| No Children | 61 (14.8%) | 36 (8.2%) |
| 1 or 2 Children | 64 (9.7%) | 78 (23.4%) |
| 3 or 4 Children | 18 (14.0%) | 156 (76.1%) |
| 5 or more Children | 46 (69.7%) | 0 (0.0%) |
| Total | 189 (15.0%) | 270 (27.7%) |
Race in Farmersville
The most populous races in Farmersville are Hispanic or Latino (9,296 | 89.4%), Some other Race (3,827 | 36.8%), and White / Caucasian (3,754 | 36.1%).
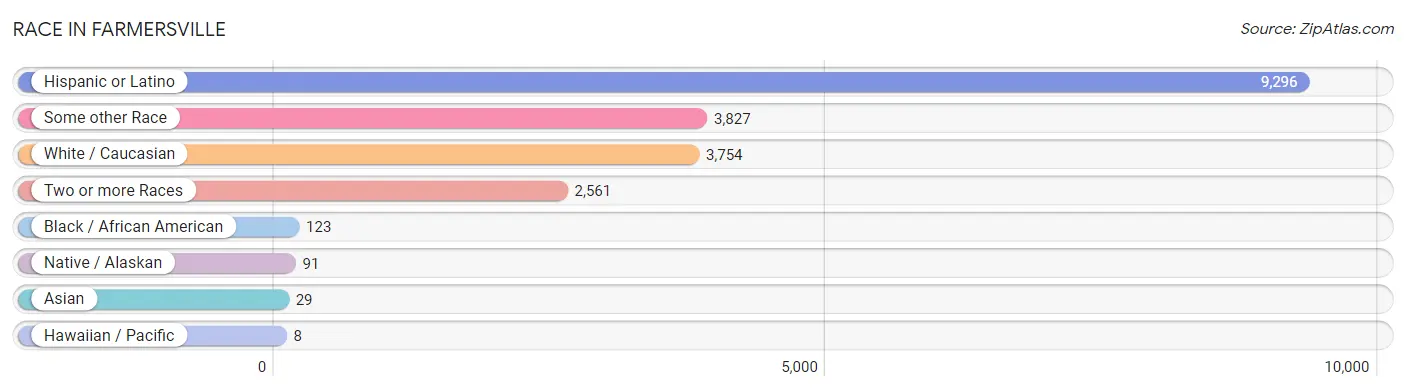
| Race | # Population | % Population |
| Asian | 29 | 0.3% |
| Black / African American | 123 | 1.2% |
| Hawaiian / Pacific | 8 | 0.1% |
| Hispanic or Latino | 9,296 | 89.4% |
| Native / Alaskan | 91 | 0.9% |
| White / Caucasian | 3,754 | 36.1% |
| Two or more Races | 2,561 | 24.6% |
| Some other Race | 3,827 | 36.8% |
| Total | 10,393 | 100.0% |
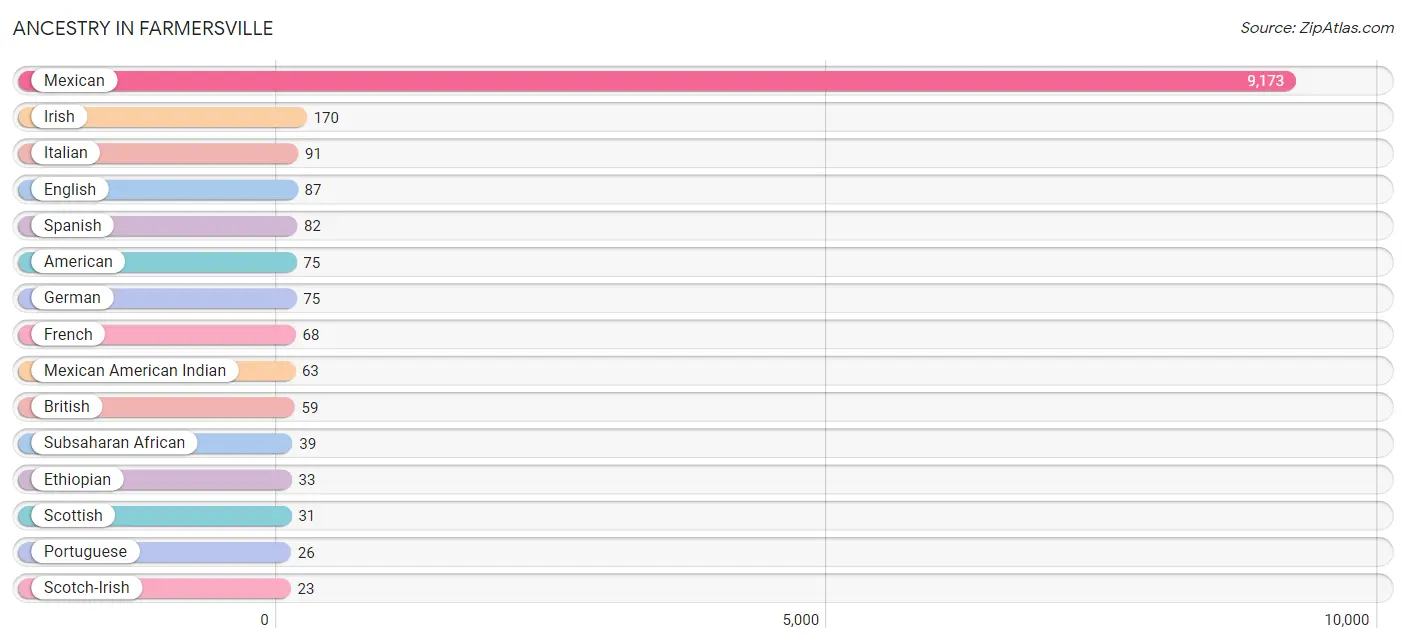
Ancestry in Farmersville
The most populous ancestries reported in Farmersville are Mexican (9,173 | 88.3%), Irish (170 | 1.6%), Italian (91 | 0.9%), English (87 | 0.8%), and Spanish (82 | 0.8%), together accounting for 92.4% of all Farmersville residents.
| Ancestry | # Population | % Population |
| American | 75 | 0.7% |
| British | 59 | 0.6% |
| Cuban | 20 | 0.2% |
| Ecuadorian | 9 | 0.1% |
| English | 87 | 0.8% |
| Ethiopian | 33 | 0.3% |
| French | 68 | 0.6% |
| German | 75 | 0.7% |
| Indian (Asian) | 7 | 0.1% |
| Irish | 170 | 1.6% |
| Italian | 91 | 0.9% |
| Korean | 22 | 0.2% |
| Mexican | 9,173 | 88.3% |
| Mexican American Indian | 63 | 0.6% |
| Native Hawaiian | 8 | 0.1% |
| Norwegian | 8 | 0.1% |
| Portuguese | 26 | 0.3% |
| Scotch-Irish | 23 | 0.2% |
| Scottish | 31 | 0.3% |
| South American | 9 | 0.1% |
| Spaniard | 12 | 0.1% |
| Spanish | 82 | 0.8% |
| Subsaharan African | 39 | 0.4% | View All 23 Rows |
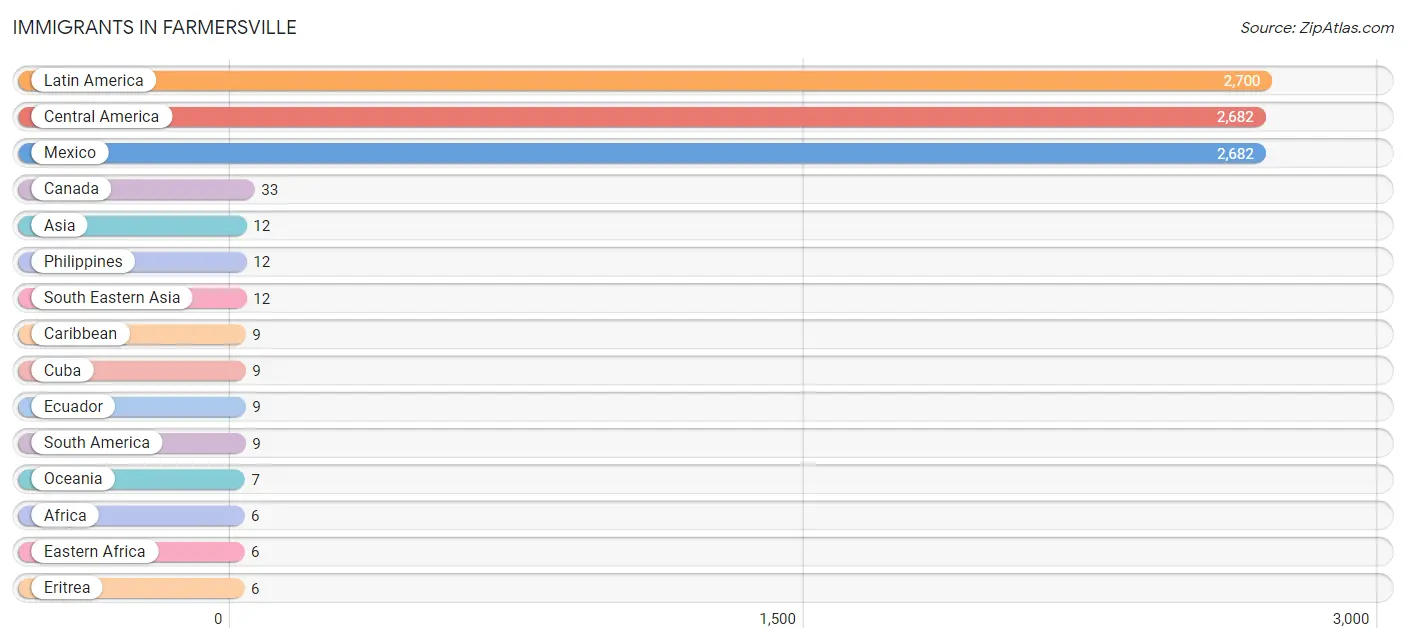
Immigrants in Farmersville
The most numerous immigrant groups reported in Farmersville came from Latin America (2,700 | 26.0%), Central America (2,682 | 25.8%), Mexico (2,682 | 25.8%), Canada (33 | 0.3%), and Asia (12 | 0.1%), together accounting for 78.0% of all Farmersville residents.
| Immigration Origin | # Population | % Population |
| Africa | 6 | 0.1% |
| Asia | 12 | 0.1% |
| Canada | 33 | 0.3% |
| Caribbean | 9 | 0.1% |
| Central America | 2,682 | 25.8% |
| Cuba | 9 | 0.1% |
| Eastern Africa | 6 | 0.1% |
| Ecuador | 9 | 0.1% |
| Eritrea | 6 | 0.1% |
| Latin America | 2,700 | 26.0% |
| Mexico | 2,682 | 25.8% |
| Oceania | 7 | 0.1% |
| Philippines | 12 | 0.1% |
| South America | 9 | 0.1% |
| South Eastern Asia | 12 | 0.1% | View All 15 Rows |
Sex and Age in Farmersville
Sex and Age in Farmersville
The most populous age groups in Farmersville are 15 to 19 Years (647 | 12.4%) for men and 10 to 14 Years (700 | 13.6%) for women.
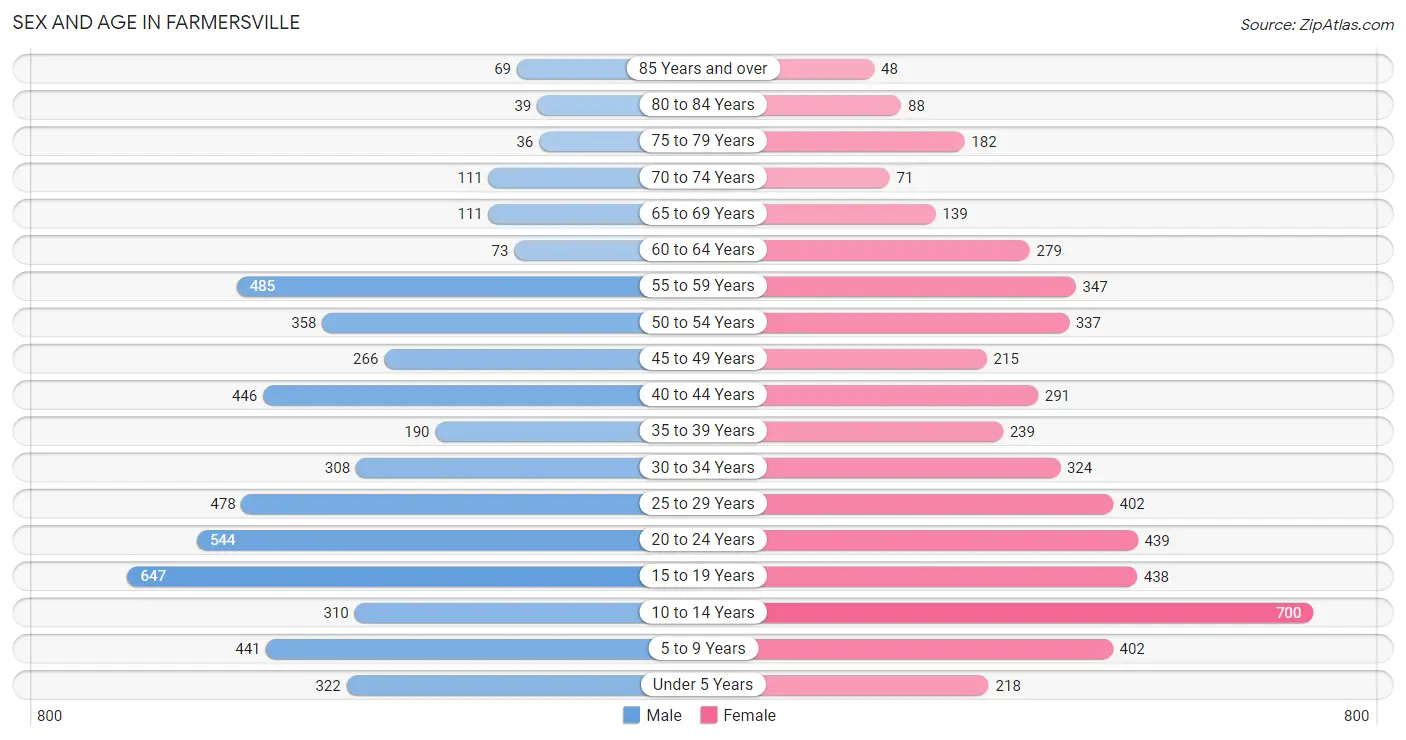
| Age Bracket | Male | Female |
| Under 5 Years | 322 (6.1%) | 218 (4.2%) |
| 5 to 9 Years | 441 (8.4%) | 402 (7.8%) |
| 10 to 14 Years | 310 (5.9%) | 700 (13.6%) |
| 15 to 19 Years | 647 (12.4%) | 438 (8.5%) |
| 20 to 24 Years | 544 (10.4%) | 439 (8.5%) |
| 25 to 29 Years | 478 (9.1%) | 402 (7.8%) |
| 30 to 34 Years | 308 (5.9%) | 324 (6.3%) |
| 35 to 39 Years | 190 (3.6%) | 239 (4.6%) |
| 40 to 44 Years | 446 (8.5%) | 291 (5.6%) |
| 45 to 49 Years | 266 (5.1%) | 215 (4.2%) |
| 50 to 54 Years | 358 (6.8%) | 337 (6.5%) |
| 55 to 59 Years | 485 (9.3%) | 347 (6.7%) |
| 60 to 64 Years | 73 (1.4%) | 279 (5.4%) |
| 65 to 69 Years | 111 (2.1%) | 139 (2.7%) |
| 70 to 74 Years | 111 (2.1%) | 71 (1.4%) |
| 75 to 79 Years | 36 (0.7%) | 182 (3.5%) |
| 80 to 84 Years | 39 (0.7%) | 88 (1.7%) |
| 85 Years and over | 69 (1.3%) | 48 (0.9%) |
| Total | 5,234 (100.0%) | 5,159 (100.0%) |
Families and Households in Farmersville
Median Family Size in Farmersville
The median family size in Farmersville is 4.19 persons per family, with married-couple families (1,263 | 56.4%) accounting for the largest median family size of 4.63 persons per family. On the other hand, single male/father families (273 | 12.2%) represent the smallest median family size with 3.61 persons per family.
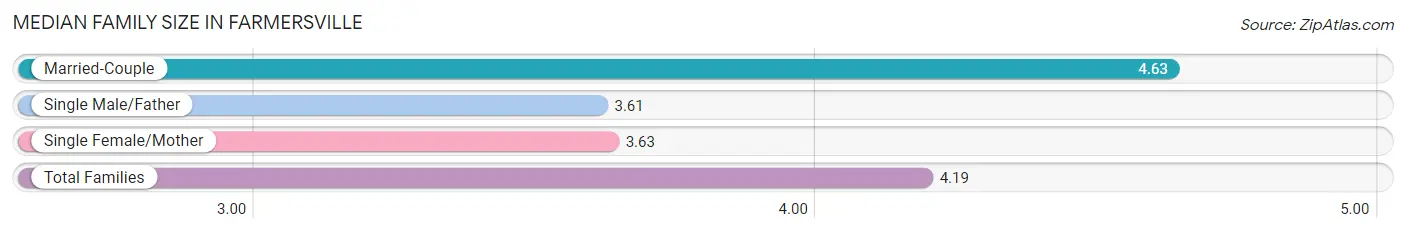
| Family Type | # Families | Family Size |
| Married-Couple | 1,263 (56.4%) | 4.63 |
| Single Male/Father | 273 (12.2%) | 3.61 |
| Single Female/Mother | 703 (31.4%) | 3.63 |
| Total Families | 2,239 (100.0%) | 4.19 |
Median Household Size in Farmersville
The median household size in Farmersville is 3.80 persons per household, with married-couple households (1,263 | 46.2%) accounting for the largest median household size of 4.64 persons per household. non-family households (493 | 18.0%) represent the smallest median household size with 1.54 persons per household.
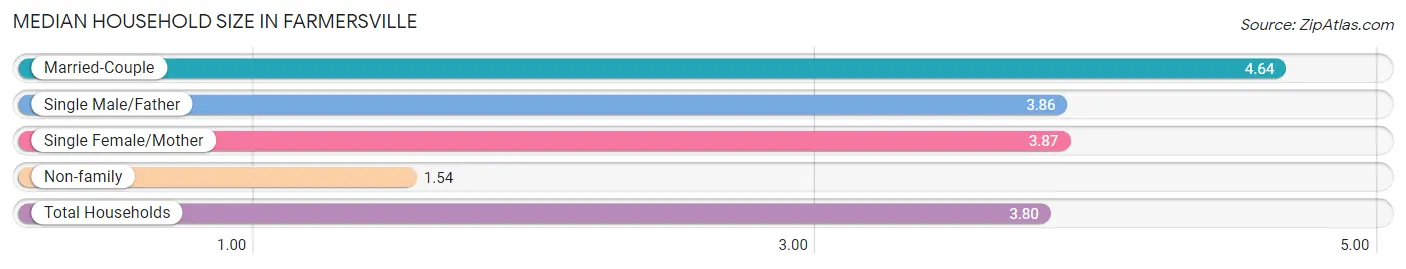
| Household Type | # Households | Household Size |
| Married-Couple | 1,263 (46.2%) | 4.64 |
| Single Male/Father | 273 (10.0%) | 3.86 |
| Single Female/Mother | 703 (25.7%) | 3.87 |
| Non-family | 493 (18.0%) | 1.54 |
| Total Households | 2,732 (100.0%) | 3.80 |
Household Size by Marriage Status in Farmersville
Out of a total of 2,732 households in Farmersville, 2,239 (82.0%) are family households, while 493 (18.0%) are nonfamily households. The most numerous type of family households are 4-person households, comprising 659, and the most common type of nonfamily households are 1-person households, comprising 359.
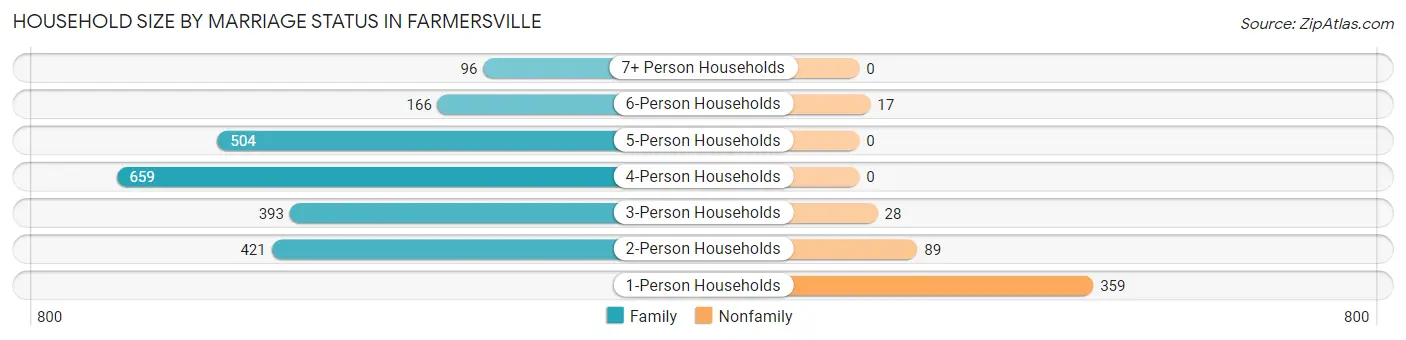
| Household Size | Family Households | Nonfamily Households |
| 1-Person Households | - | 359 (13.1%) |
| 2-Person Households | 421 (15.4%) | 89 (3.3%) |
| 3-Person Households | 393 (14.4%) | 28 (1.0%) |
| 4-Person Households | 659 (24.1%) | 0 (0.0%) |
| 5-Person Households | 504 (18.4%) | 0 (0.0%) |
| 6-Person Households | 166 (6.1%) | 17 (0.6%) |
| 7+ Person Households | 96 (3.5%) | 0 (0.0%) |
| Total | 2,239 (82.0%) | 493 (18.0%) |
Female Fertility in Farmersville
Fertility by Age in Farmersville
Average fertility rate in Farmersville is 69.0 births per 1,000 women. Women in the age bracket of 15 to 19 years have the highest fertility rate with 112.0 births per 1,000 women. Women in the age bracket of 20 to 34 years acount for 45.1% of all women with births.
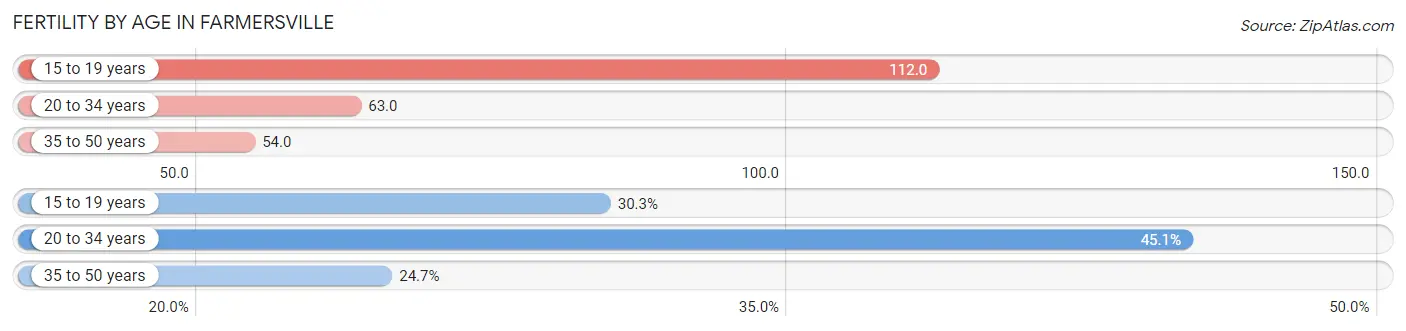
| Age Bracket | Women with Births | Births / 1,000 Women |
| 15 to 19 years | 49 (30.2%) | 112.0 |
| 20 to 34 years | 73 (45.1%) | 63.0 |
| 35 to 50 years | 40 (24.7%) | 54.0 |
| Total | 162 (100.0%) | 69.0 |
Fertility by Age by Marriage Status in Farmersville
40.7% of women with births (162) in Farmersville are married. The highest percentage of unmarried women with births falls into 15 to 19 years age bracket with 100.0% of them unmarried at the time of birth, while the lowest percentage of unmarried women with births belong to 35 to 50 years age bracket with 0.0% of them unmarried.
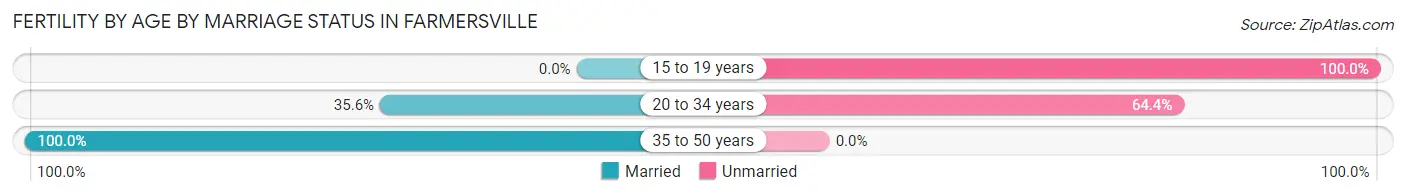
| Age Bracket | Married | Unmarried |
| 15 to 19 years | 0 (0.0%) | 49 (100.0%) |
| 20 to 34 years | 26 (35.6%) | 47 (64.4%) |
| 35 to 50 years | 40 (100.0%) | 0 (0.0%) |
| Total | 66 (40.7%) | 96 (59.3%) |
Fertility by Education in Farmersville
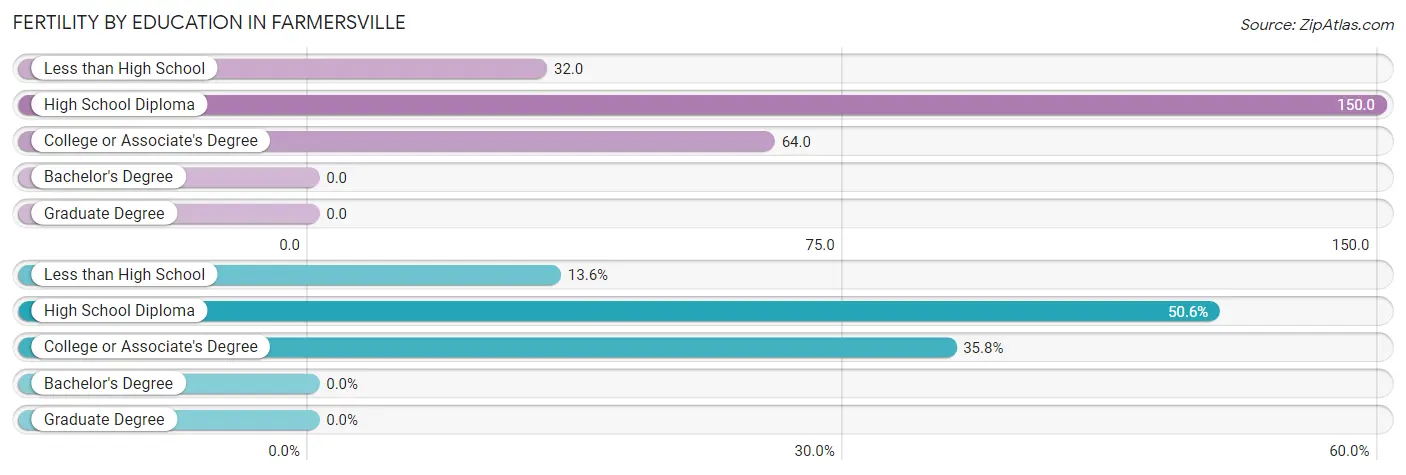
| Educational Attainment | Women with Births | Births / 1,000 Women |
| Less than High School | 22 (13.6%) | 32.0 |
| High School Diploma | 82 (50.6%) | 150.0 |
| College or Associate's Degree | 58 (35.8%) | 64.0 |
| Bachelor's Degree | 0 (0.0%) | 0.0 |
| Graduate Degree | 0 (0.0%) | 0.0 |
| Total | 162 (100.0%) | 69.0 |
Fertility by Education by Marriage Status in Farmersville
59.3% of women with births in Farmersville are unmarried. Women with the educational attainment of less than high school are most likely to be married with 100.0% of them married at childbirth, while women with the educational attainment of college or associate's degree are least likely to be married with 84.5% of them unmarried at childbirth.
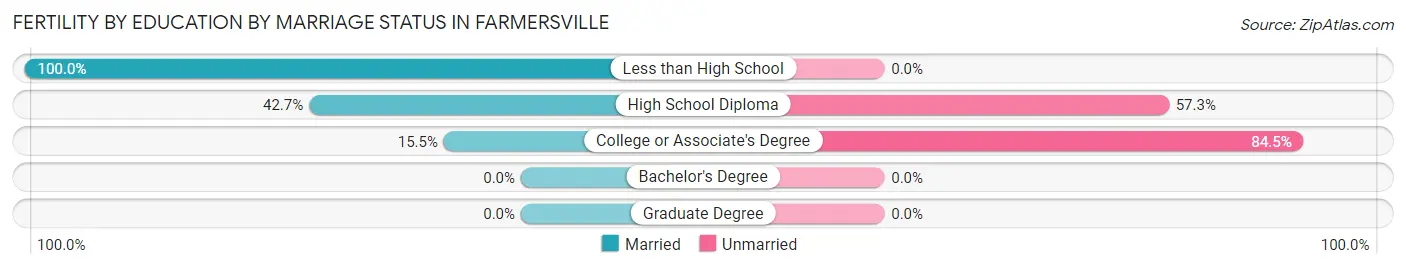
| Educational Attainment | Married | Unmarried |
| Less than High School | 22 (100.0%) | 0 (0.0%) |
| High School Diploma | 35 (42.7%) | 47 (57.3%) |
| College or Associate's Degree | 9 (15.5%) | 49 (84.5%) |
| Bachelor's Degree | 0 (0.0%) | 0 (0.0%) |
| Graduate Degree | 0 (0.0%) | 0 (0.0%) |
| Total | 66 (40.7%) | 96 (59.3%) |
Employment Characteristics in Farmersville
Employment by Class of Employer in Farmersville
Among the 4,138 employed individuals in Farmersville, private company employees (3,152 | 76.2%), local government employees (383 | 9.3%), and self-employed (not incorporated) (256 | 6.2%) make up the most common classes of employment.
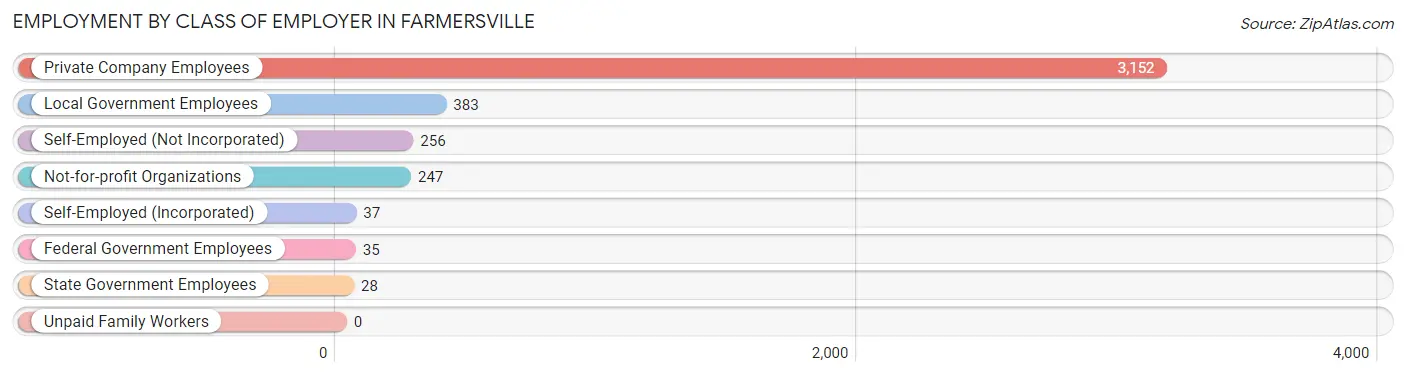
| Employer Class | # Employees | % Employees |
| Private Company Employees | 3,152 | 76.2% |
| Self-Employed (Incorporated) | 37 | 0.9% |
| Self-Employed (Not Incorporated) | 256 | 6.2% |
| Not-for-profit Organizations | 247 | 6.0% |
| Local Government Employees | 383 | 9.3% |
| State Government Employees | 28 | 0.7% |
| Federal Government Employees | 35 | 0.9% |
| Unpaid Family Workers | 0 | 0.0% |
| Total | 4,138 | 100.0% |
Employment Status by Age in Farmersville
According to the labor force statistics for Farmersville, out of the total population over 16 years of age (7,865), 60.4% or 4,750 individuals are in the labor force, with 9.8% or 466 of them unemployed. The age group with the highest labor force participation rate is 45 to 54 years, with 78.1% or 918 individuals in the labor force. Within the labor force, the 16 to 19 years age range has the highest percentage of unemployed individuals, with 45.2% or 136 of them being unemployed.
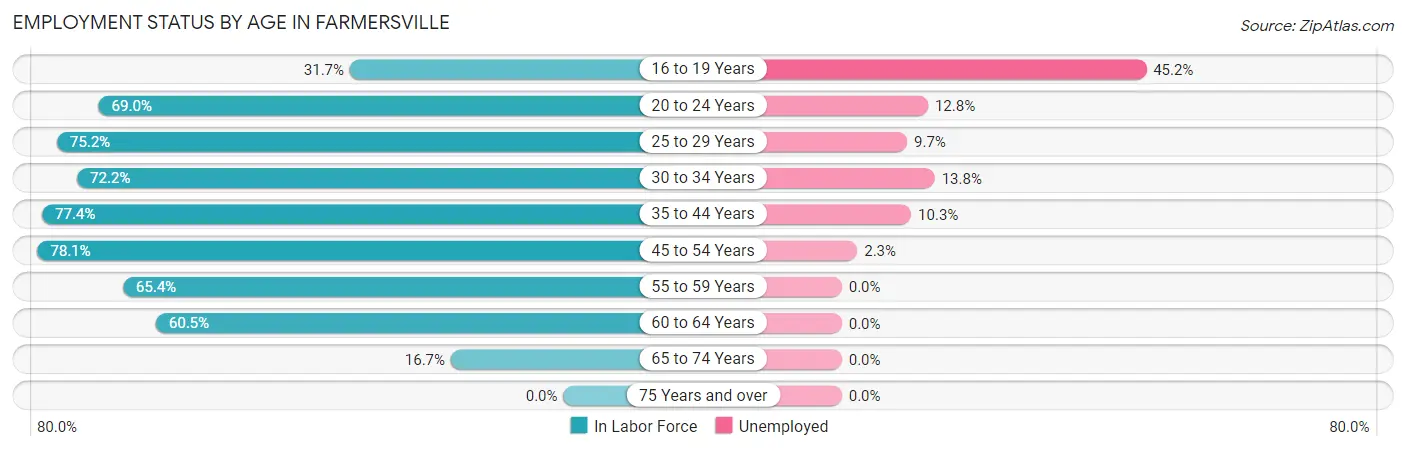
| Age Bracket | In Labor Force | Unemployed |
| 16 to 19 Years | 301 (31.7%) | 136 (45.2%) |
| 20 to 24 Years | 678 (69.0%) | 87 (12.8%) |
| 25 to 29 Years | 662 (75.2%) | 64 (9.7%) |
| 30 to 34 Years | 456 (72.2%) | 63 (13.8%) |
| 35 to 44 Years | 902 (77.4%) | 93 (10.3%) |
| 45 to 54 Years | 918 (78.1%) | 21 (2.3%) |
| 55 to 59 Years | 544 (65.4%) | 0 (0.0%) |
| 60 to 64 Years | 213 (60.5%) | 0 (0.0%) |
| 65 to 74 Years | 72 (16.7%) | 0 (0.0%) |
| 75 Years and over | 0 (0.0%) | 0 (0.0%) |
| Total | 4,750 (60.4%) | 466 (9.8%) |
Employment Status by Educational Attainment in Farmersville
According to labor force statistics for Farmersville, 73.4% of individuals (3,698) out of the total population between 25 and 64 years of age (5,038) are in the labor force, with 6.5% or 240 of them being unemployed. The group with the highest labor force participation rate are those with the educational attainment of bachelor's degree or higher, with 92.3% or 203 individuals in the labor force. Within the labor force, individuals with college / associate degree education have the highest percentage of unemployment, with 14.5% or 144 of them being unemployed.
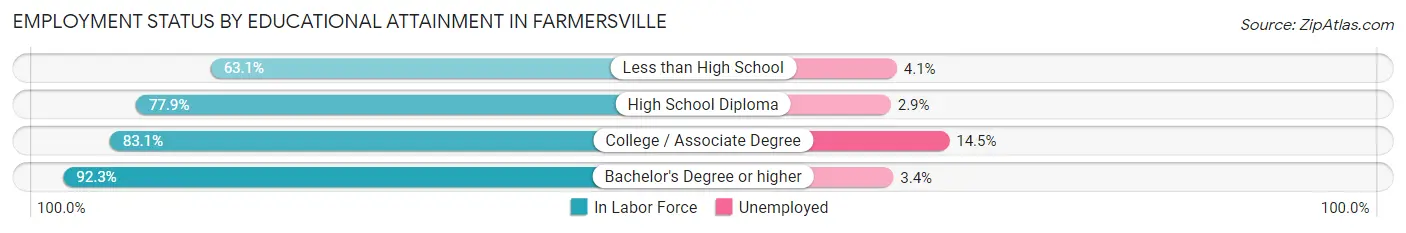
| Educational Attainment | In Labor Force | Unemployed |
| Less than High School | 1,374 (63.1%) | 89 (4.1%) |
| High School Diploma | 1,127 (77.9%) | 42 (2.9%) |
| College / Associate Degree | 991 (83.1%) | 173 (14.5%) |
| Bachelor's Degree or higher | 203 (92.3%) | 7 (3.4%) |
| Total | 3,698 (73.4%) | 327 (6.5%) |
Employment Occupations by Sex in Farmersville
Management, Business, Science and Arts Occupations
The most common Management, Business, Science and Arts occupations in Farmersville are Community & Social Service (296 | 6.9%), Management (258 | 6.0%), Education Instruction & Library (193 | 4.5%), Education, Arts & Media (103 | 2.4%), and Health Diagnosing & Treating (16 | 0.4%).
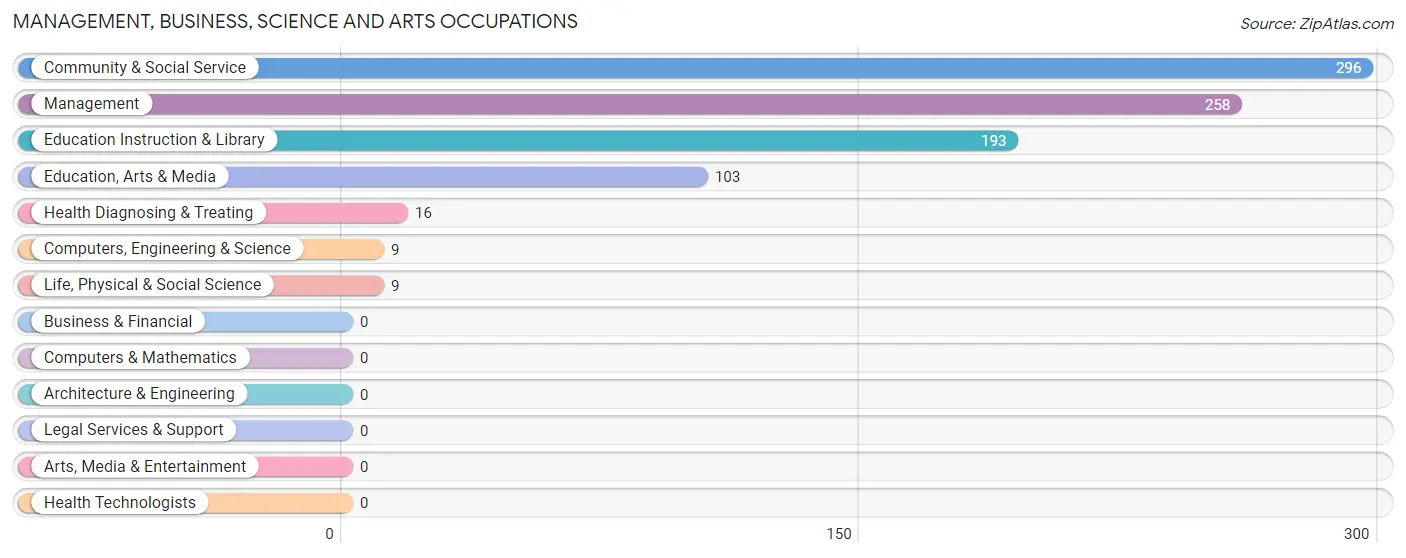
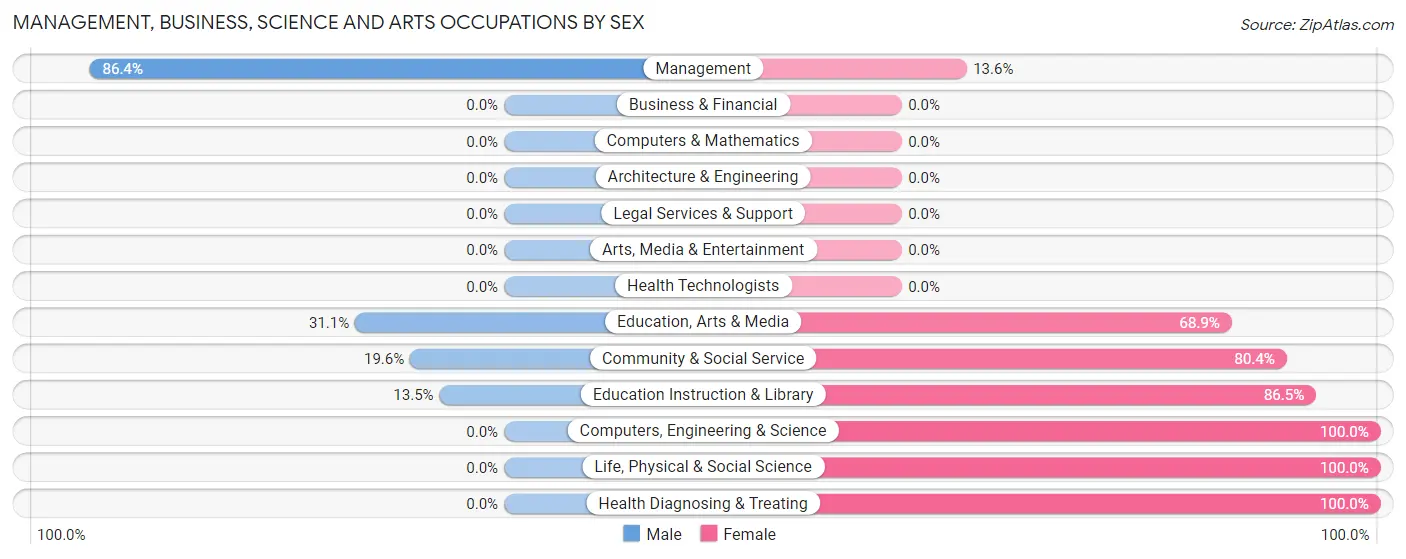
Management, Business, Science and Arts Occupations by Sex
Within the Management, Business, Science and Arts occupations in Farmersville, the most male-oriented occupations are Management (86.4%), Education, Arts & Media (31.1%), and Community & Social Service (19.6%), while the most female-oriented occupations are Computers, Engineering & Science (100.0%), Life, Physical & Social Science (100.0%), and Health Diagnosing & Treating (100.0%).
| Occupation | Male | Female |
| Management | 223 (86.4%) | 35 (13.6%) |
| Business & Financial | 0 (0.0%) | 0 (0.0%) |
| Computers, Engineering & Science | 0 (0.0%) | 9 (100.0%) |
| Computers & Mathematics | 0 (0.0%) | 0 (0.0%) |
| Architecture & Engineering | 0 (0.0%) | 0 (0.0%) |
| Life, Physical & Social Science | 0 (0.0%) | 9 (100.0%) |
| Community & Social Service | 58 (19.6%) | 238 (80.4%) |
| Education, Arts & Media | 32 (31.1%) | 71 (68.9%) |
| Legal Services & Support | 0 (0.0%) | 0 (0.0%) |
| Education Instruction & Library | 26 (13.5%) | 167 (86.5%) |
| Arts, Media & Entertainment | 0 (0.0%) | 0 (0.0%) |
| Health Diagnosing & Treating | 0 (0.0%) | 16 (100.0%) |
| Health Technologists | 0 (0.0%) | 0 (0.0%) |
| Total (Category) | 281 (48.5%) | 298 (51.5%) |
| Total (Overall) | 2,427 (56.7%) | 1,856 (43.3%) |
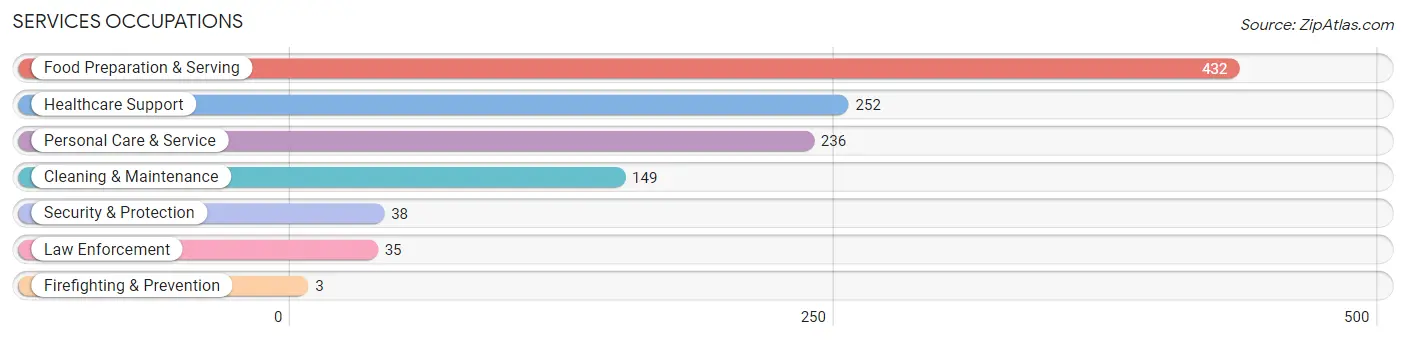
Services Occupations
The most common Services occupations in Farmersville are Food Preparation & Serving (432 | 10.1%), Healthcare Support (252 | 5.9%), Personal Care & Service (236 | 5.5%), Cleaning & Maintenance (149 | 3.5%), and Security & Protection (38 | 0.9%).
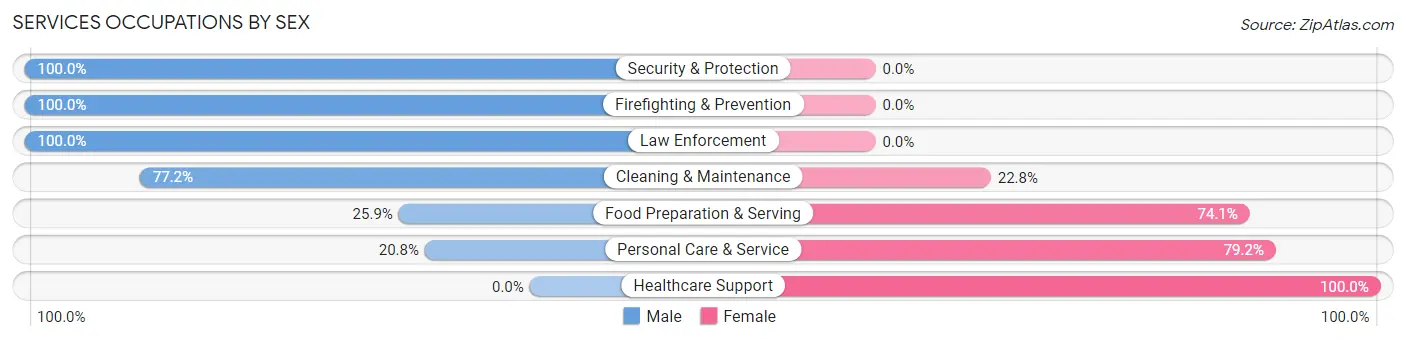
Services Occupations by Sex
Within the Services occupations in Farmersville, the most male-oriented occupations are Security & Protection (100.0%), Firefighting & Prevention (100.0%), and Law Enforcement (100.0%), while the most female-oriented occupations are Healthcare Support (100.0%), Personal Care & Service (79.2%), and Food Preparation & Serving (74.1%).
| Occupation | Male | Female |
| Healthcare Support | 0 (0.0%) | 252 (100.0%) |
| Security & Protection | 38 (100.0%) | 0 (0.0%) |
| Firefighting & Prevention | 3 (100.0%) | 0 (0.0%) |
| Law Enforcement | 35 (100.0%) | 0 (0.0%) |
| Food Preparation & Serving | 112 (25.9%) | 320 (74.1%) |
| Cleaning & Maintenance | 115 (77.2%) | 34 (22.8%) |
| Personal Care & Service | 49 (20.8%) | 187 (79.2%) |
| Total (Category) | 314 (28.4%) | 793 (71.6%) |
| Total (Overall) | 2,427 (56.7%) | 1,856 (43.3%) |
Sales and Office Occupations
The most common Sales and Office occupations in Farmersville are Sales & Related (400 | 9.3%), and Office & Administration (296 | 6.9%).

Sales and Office Occupations by Sex

| Occupation | Male | Female |
| Sales & Related | 158 (39.5%) | 242 (60.5%) |
| Office & Administration | 106 (35.8%) | 190 (64.2%) |
| Total (Category) | 264 (37.9%) | 432 (62.1%) |
| Total (Overall) | 2,427 (56.7%) | 1,856 (43.3%) |
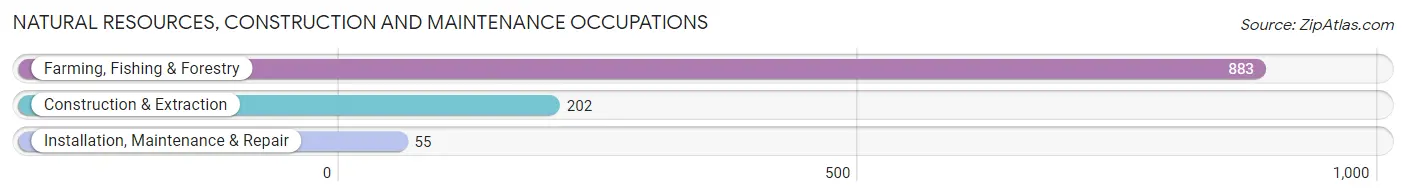
Natural Resources, Construction and Maintenance Occupations
The most common Natural Resources, Construction and Maintenance occupations in Farmersville are Farming, Fishing & Forestry (883 | 20.6%), Construction & Extraction (202 | 4.7%), and Installation, Maintenance & Repair (55 | 1.3%).
Natural Resources, Construction and Maintenance Occupations by Sex

| Occupation | Male | Female |
| Farming, Fishing & Forestry | 739 (83.7%) | 144 (16.3%) |
| Construction & Extraction | 188 (93.1%) | 14 (6.9%) |
| Installation, Maintenance & Repair | 55 (100.0%) | 0 (0.0%) |
| Total (Category) | 982 (86.1%) | 158 (13.9%) |
| Total (Overall) | 2,427 (56.7%) | 1,856 (43.3%) |
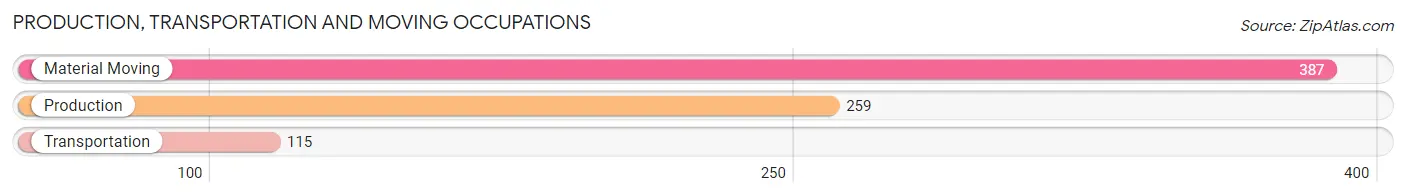
Production, Transportation and Moving Occupations
The most common Production, Transportation and Moving occupations in Farmersville are Material Moving (387 | 9.0%), Production (259 | 6.0%), and Transportation (115 | 2.7%).
Production, Transportation and Moving Occupations by Sex
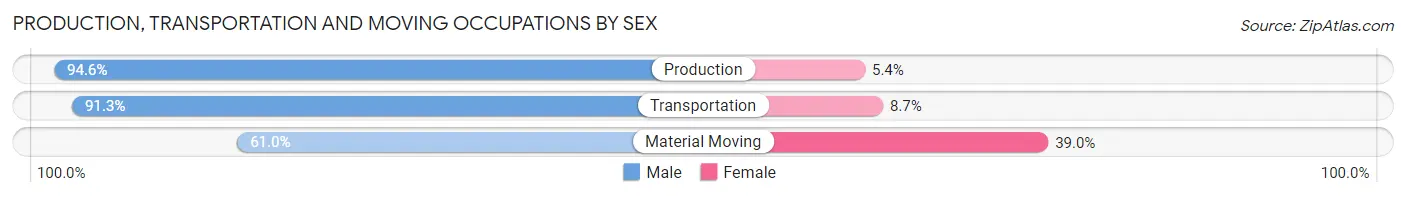
| Occupation | Male | Female |
| Production | 245 (94.6%) | 14 (5.4%) |
| Transportation | 105 (91.3%) | 10 (8.7%) |
| Material Moving | 236 (61.0%) | 151 (39.0%) |
| Total (Category) | 586 (77.0%) | 175 (23.0%) |
| Total (Overall) | 2,427 (56.7%) | 1,856 (43.3%) |
Employment Industries by Sex in Farmersville
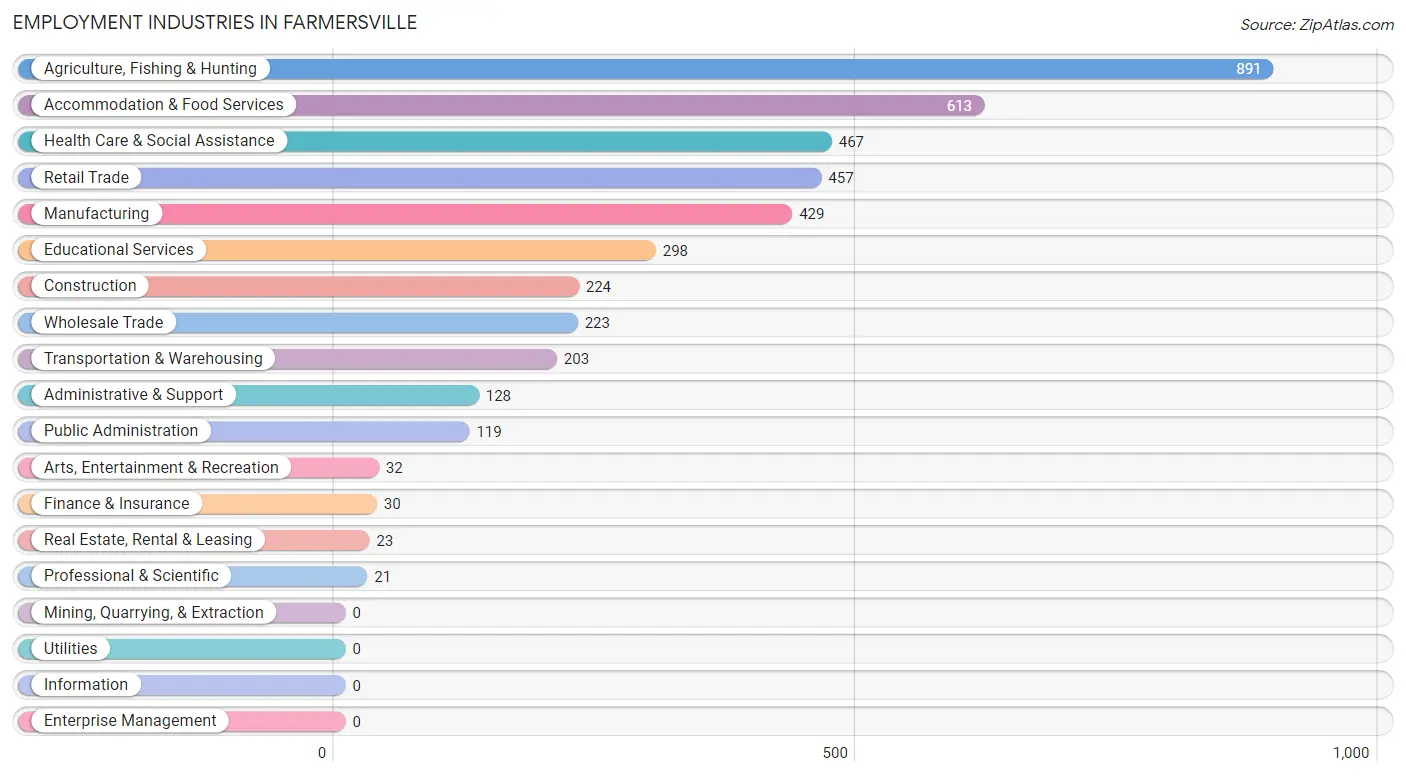
Employment Industries in Farmersville
The major employment industries in Farmersville include Agriculture, Fishing & Hunting (891 | 20.8%), Accommodation & Food Services (613 | 14.3%), Health Care & Social Assistance (467 | 10.9%), Retail Trade (457 | 10.7%), and Manufacturing (429 | 10.0%).
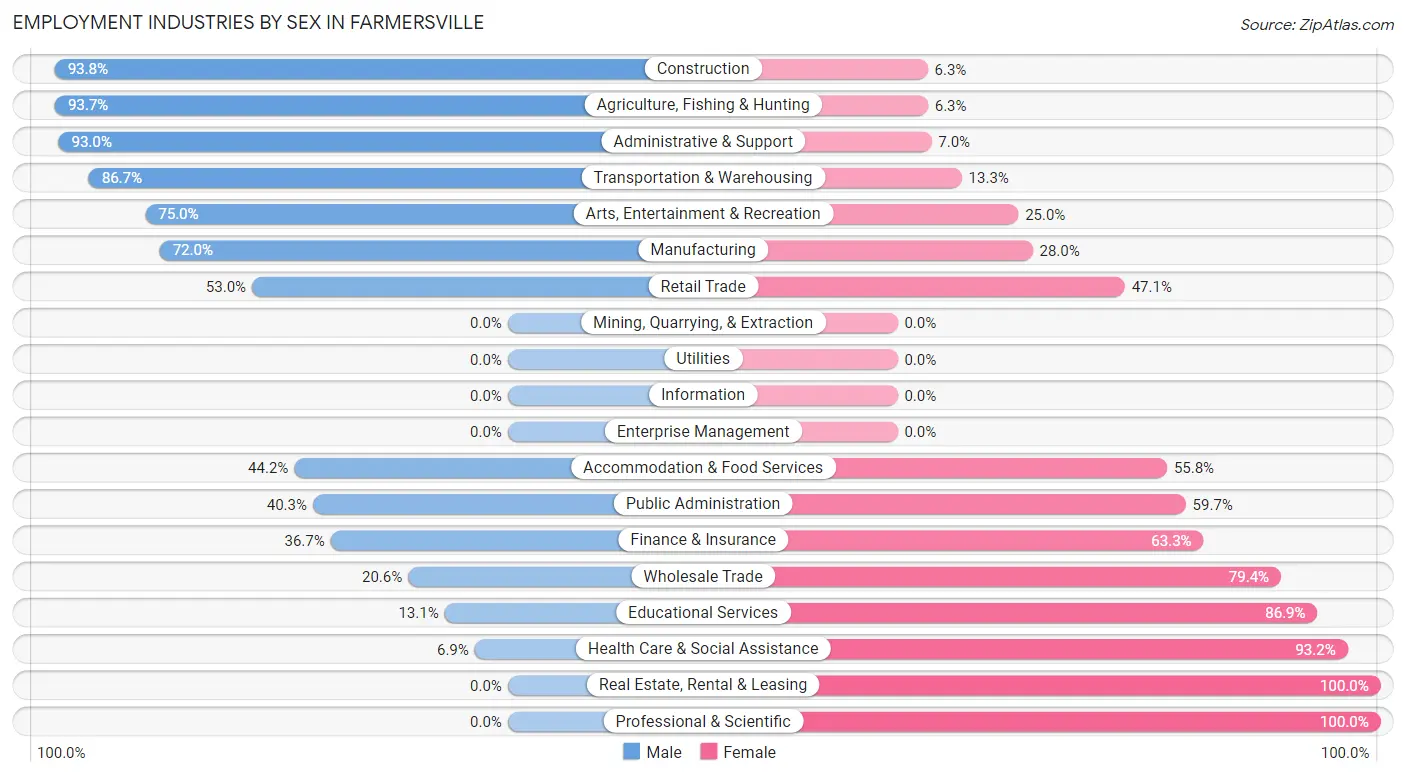
Employment Industries by Sex in Farmersville
The Farmersville industries that see more men than women are Construction (93.8%), Agriculture, Fishing & Hunting (93.7%), and Administrative & Support (93.0%), whereas the industries that tend to have a higher number of women are Real Estate, Rental & Leasing (100.0%), Professional & Scientific (100.0%), and Health Care & Social Assistance (93.1%).
| Industry | Male | Female |
| Agriculture, Fishing & Hunting | 835 (93.7%) | 56 (6.3%) |
| Mining, Quarrying, & Extraction | 0 (0.0%) | 0 (0.0%) |
| Construction | 210 (93.8%) | 14 (6.2%) |
| Manufacturing | 309 (72.0%) | 120 (28.0%) |
| Wholesale Trade | 46 (20.6%) | 177 (79.4%) |
| Retail Trade | 242 (52.9%) | 215 (47.0%) |
| Transportation & Warehousing | 176 (86.7%) | 27 (13.3%) |
| Utilities | 0 (0.0%) | 0 (0.0%) |
| Information | 0 (0.0%) | 0 (0.0%) |
| Finance & Insurance | 11 (36.7%) | 19 (63.3%) |
| Real Estate, Rental & Leasing | 0 (0.0%) | 23 (100.0%) |
| Professional & Scientific | 0 (0.0%) | 21 (100.0%) |
| Enterprise Management | 0 (0.0%) | 0 (0.0%) |
| Administrative & Support | 119 (93.0%) | 9 (7.0%) |
| Educational Services | 39 (13.1%) | 259 (86.9%) |
| Health Care & Social Assistance | 32 (6.9%) | 435 (93.1%) |
| Arts, Entertainment & Recreation | 24 (75.0%) | 8 (25.0%) |
| Accommodation & Food Services | 271 (44.2%) | 342 (55.8%) |
| Public Administration | 48 (40.3%) | 71 (59.7%) |
| Total | 2,427 (56.7%) | 1,856 (43.3%) |
Education in Farmersville
School Enrollment in Farmersville
The most common levels of schooling among the 3,434 students in Farmersville are middle school (858 | 25.0%), college / undergraduate (820 | 23.9%), and high school (758 | 22.1%).
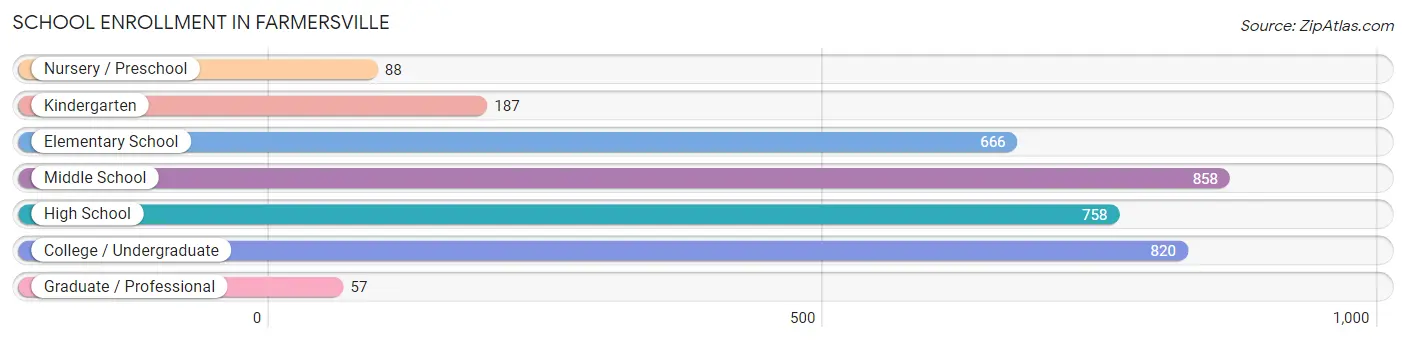
| School Level | # Students | % Students |
| Nursery / Preschool | 88 | 2.6% |
| Kindergarten | 187 | 5.4% |
| Elementary School | 666 | 19.4% |
| Middle School | 858 | 25.0% |
| High School | 758 | 22.1% |
| College / Undergraduate | 820 | 23.9% |
| Graduate / Professional | 57 | 1.7% |
| Total | 3,434 | 100.0% |
School Enrollment by Age by Funding Source in Farmersville
Out of a total of 3,434 students who are enrolled in schools in Farmersville, 203 (5.9%) attend a private institution, while the remaining 3,231 (94.1%) are enrolled in public schools. The age group of 20 to 24 year olds has the highest likelihood of being enrolled in private schools, with 77 (25.8% in the age bracket) enrolled. Conversely, the age group of 5 to 9 year old has the lowest likelihood of being enrolled in a private school, with 832 (100.0% in the age bracket) attending a public institution.
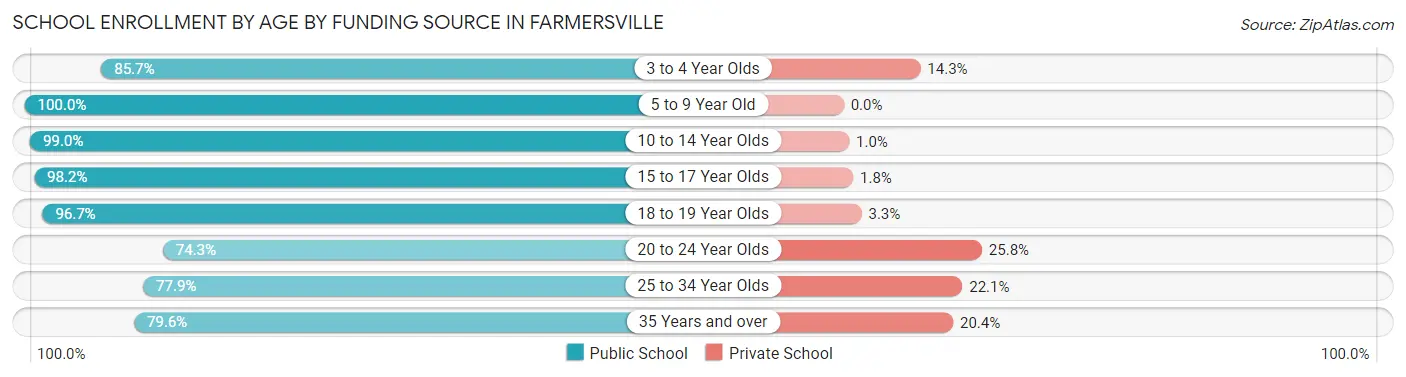
| Age Bracket | Public School | Private School |
| 3 to 4 Year Olds | 42 (85.7%) | 7 (14.3%) |
| 5 to 9 Year Old | 832 (100.0%) | 0 (0.0%) |
| 10 to 14 Year Olds | 978 (99.0%) | 10 (1.0%) |
| 15 to 17 Year Olds | 558 (98.2%) | 10 (1.8%) |
| 18 to 19 Year Olds | 290 (96.7%) | 10 (3.3%) |
| 20 to 24 Year Olds | 222 (74.3%) | 77 (25.8%) |
| 25 to 34 Year Olds | 268 (77.9%) | 76 (22.1%) |
| 35 Years and over | 43 (79.6%) | 11 (20.4%) |
| Total | 3,231 (94.1%) | 203 (5.9%) |
Educational Attainment by Field of Study in Farmersville
Social sciences (50 | 14.7%), science & technology (44 | 12.9%), physical & health sciences (39 | 11.5%), business (39 | 11.5%), and literature & languages (35 | 10.3%) are the most common fields of study among 340 individuals in Farmersville who have obtained a bachelor's degree or higher.
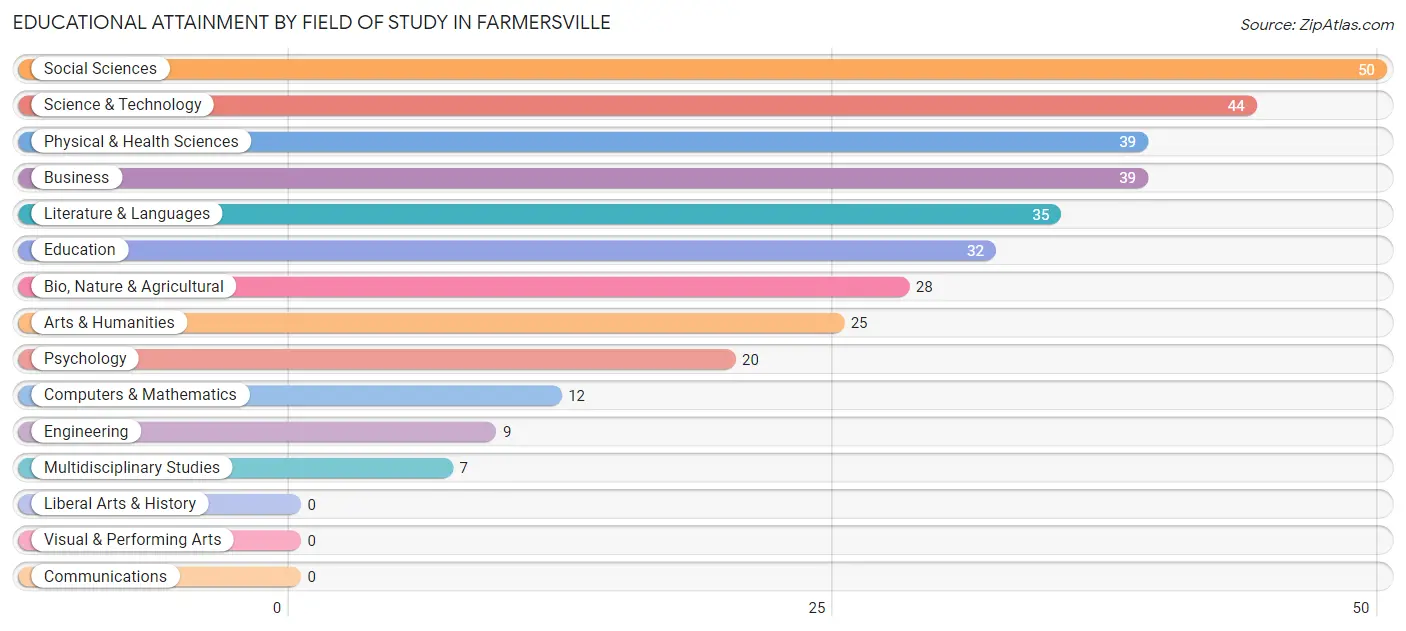
| Field of Study | # Graduates | % Graduates |
| Computers & Mathematics | 12 | 3.5% |
| Bio, Nature & Agricultural | 28 | 8.2% |
| Physical & Health Sciences | 39 | 11.5% |
| Psychology | 20 | 5.9% |
| Social Sciences | 50 | 14.7% |
| Engineering | 9 | 2.6% |
| Multidisciplinary Studies | 7 | 2.1% |
| Science & Technology | 44 | 12.9% |
| Business | 39 | 11.5% |
| Education | 32 | 9.4% |
| Literature & Languages | 35 | 10.3% |
| Liberal Arts & History | 0 | 0.0% |
| Visual & Performing Arts | 0 | 0.0% |
| Communications | 0 | 0.0% |
| Arts & Humanities | 25 | 7.3% |
| Total | 340 | 100.0% |
Transportation & Commute in Farmersville
Vehicle Availability by Sex in Farmersville
The most prevalent vehicle ownership categories in Farmersville are males with 2 vehicles (706, accounting for 29.6%) and females with 2 vehicles (475, making up 40.3%).
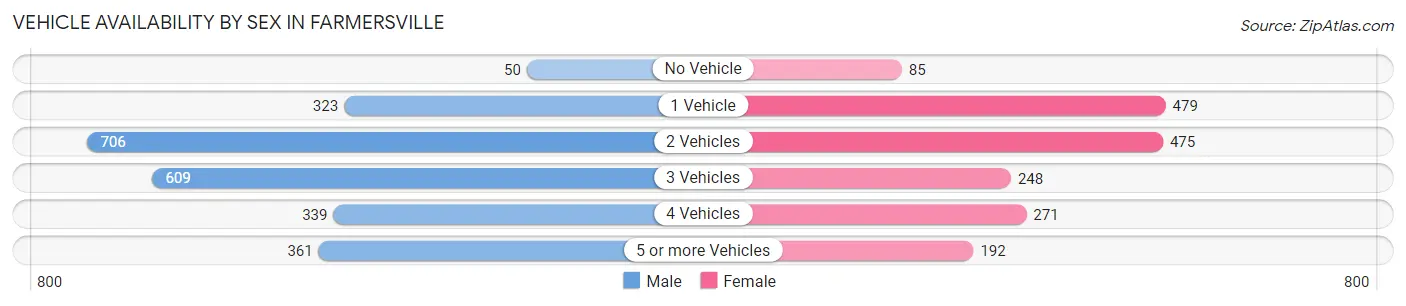
| Vehicles Available | Male | Female |
| No Vehicle | 50 (2.1%) | 85 (4.9%) |
| 1 Vehicle | 323 (13.5%) | 479 (27.4%) |
| 2 Vehicles | 706 (29.6%) | 475 (27.1%) |
| 3 Vehicles | 609 (25.5%) | 248 (14.2%) |
| 4 Vehicles | 339 (14.2%) | 271 (15.5%) |
| 5 or more Vehicles | 361 (15.1%) | 192 (11.0%) |
| Total | 2,388 (100.0%) | 1,750 (100.0%) |
Commute Time in Farmersville
The most frequently occuring commute durations in Farmersville are 20 to 24 minutes (869 commuters, 21.5%), 15 to 19 minutes (851 commuters, 21.1%), and 5 to 9 minutes (591 commuters, 14.6%).
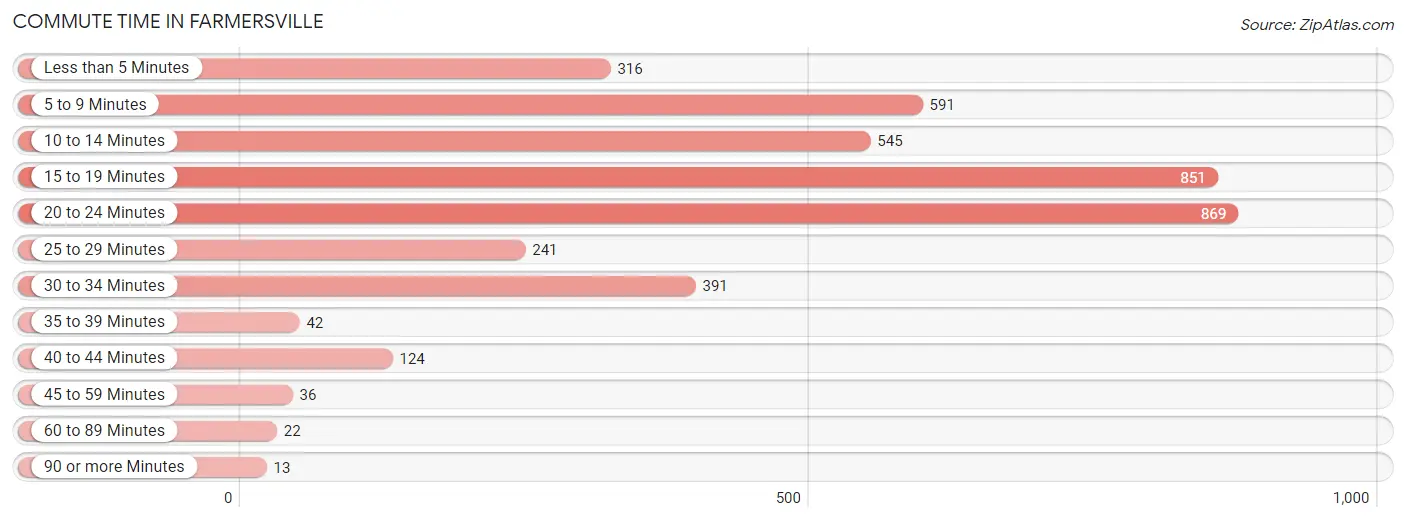
| Commute Time | # Commuters | % Commuters |
| Less than 5 Minutes | 316 | 7.8% |
| 5 to 9 Minutes | 591 | 14.6% |
| 10 to 14 Minutes | 545 | 13.5% |
| 15 to 19 Minutes | 851 | 21.1% |
| 20 to 24 Minutes | 869 | 21.5% |
| 25 to 29 Minutes | 241 | 6.0% |
| 30 to 34 Minutes | 391 | 9.7% |
| 35 to 39 Minutes | 42 | 1.0% |
| 40 to 44 Minutes | 124 | 3.1% |
| 45 to 59 Minutes | 36 | 0.9% |
| 60 to 89 Minutes | 22 | 0.5% |
| 90 or more Minutes | 13 | 0.3% |
Commute Time by Sex in Farmersville
The most common commute times in Farmersville are 20 to 24 minutes (540 commuters, 22.7%) for males and 15 to 19 minutes (412 commuters, 24.8%) for females.
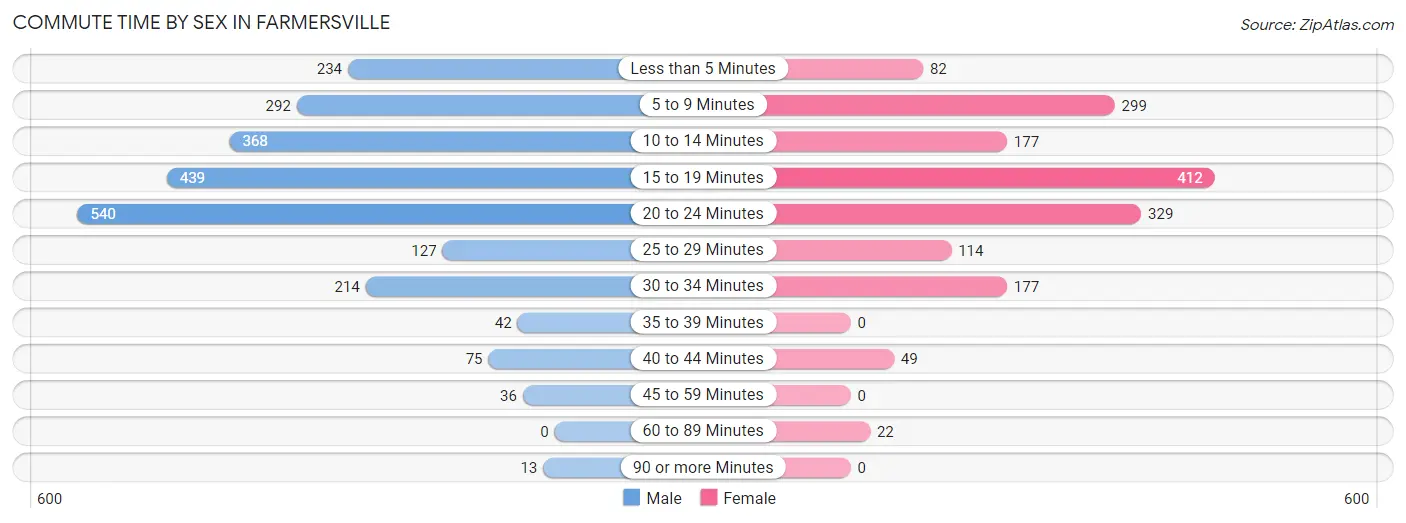
| Commute Time | Male | Female |
| Less than 5 Minutes | 234 (9.8%) | 82 (4.9%) |
| 5 to 9 Minutes | 292 (12.3%) | 299 (18.0%) |
| 10 to 14 Minutes | 368 (15.5%) | 177 (10.7%) |
| 15 to 19 Minutes | 439 (18.4%) | 412 (24.8%) |
| 20 to 24 Minutes | 540 (22.7%) | 329 (19.8%) |
| 25 to 29 Minutes | 127 (5.3%) | 114 (6.9%) |
| 30 to 34 Minutes | 214 (9.0%) | 177 (10.7%) |
| 35 to 39 Minutes | 42 (1.8%) | 0 (0.0%) |
| 40 to 44 Minutes | 75 (3.2%) | 49 (2.9%) |
| 45 to 59 Minutes | 36 (1.5%) | 0 (0.0%) |
| 60 to 89 Minutes | 0 (0.0%) | 22 (1.3%) |
| 90 or more Minutes | 13 (0.5%) | 0 (0.0%) |
Time of Departure to Work by Sex in Farmersville
The most frequent times of departure to work in Farmersville are 7:00 AM to 7:29 AM (336, 14.1%) for males and 7:30 AM to 7:59 AM (380, 22.9%) for females.
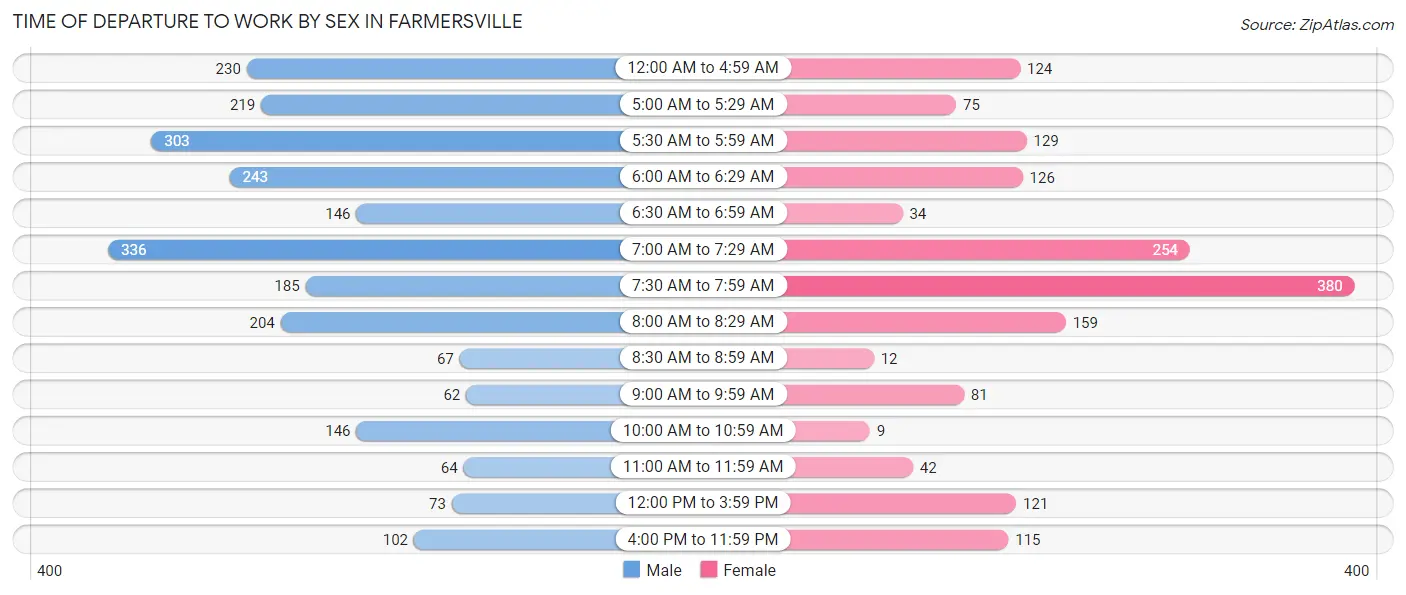
| Time of Departure | Male | Female |
| 12:00 AM to 4:59 AM | 230 (9.7%) | 124 (7.5%) |
| 5:00 AM to 5:29 AM | 219 (9.2%) | 75 (4.5%) |
| 5:30 AM to 5:59 AM | 303 (12.7%) | 129 (7.8%) |
| 6:00 AM to 6:29 AM | 243 (10.2%) | 126 (7.6%) |
| 6:30 AM to 6:59 AM | 146 (6.1%) | 34 (2.1%) |
| 7:00 AM to 7:29 AM | 336 (14.1%) | 254 (15.3%) |
| 7:30 AM to 7:59 AM | 185 (7.8%) | 380 (22.9%) |
| 8:00 AM to 8:29 AM | 204 (8.6%) | 159 (9.6%) |
| 8:30 AM to 8:59 AM | 67 (2.8%) | 12 (0.7%) |
| 9:00 AM to 9:59 AM | 62 (2.6%) | 81 (4.9%) |
| 10:00 AM to 10:59 AM | 146 (6.1%) | 9 (0.5%) |
| 11:00 AM to 11:59 AM | 64 (2.7%) | 42 (2.5%) |
| 12:00 PM to 3:59 PM | 73 (3.1%) | 121 (7.3%) |
| 4:00 PM to 11:59 PM | 102 (4.3%) | 115 (6.9%) |
| Total | 2,380 (100.0%) | 1,661 (100.0%) |
Housing Occupancy in Farmersville
Occupancy by Ownership in Farmersville
Of the total 2,732 dwellings in Farmersville, owner-occupied units account for 1,859 (68.0%), while renter-occupied units make up 873 (32.0%).
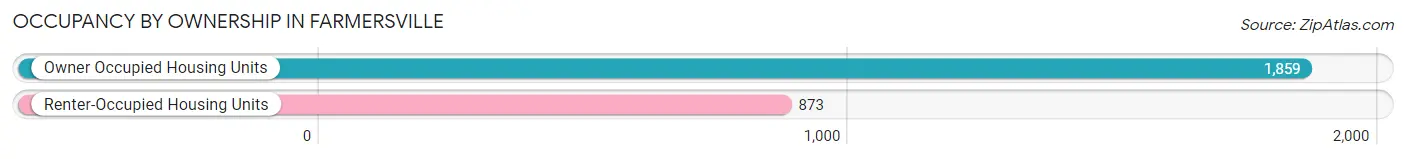
| Occupancy | # Housing Units | % Housing Units |
| Owner Occupied Housing Units | 1,859 | 68.0% |
| Renter-Occupied Housing Units | 873 | 32.0% |
| Total Occupied Housing Units | 2,732 | 100.0% |
Occupancy by Household Size in Farmersville
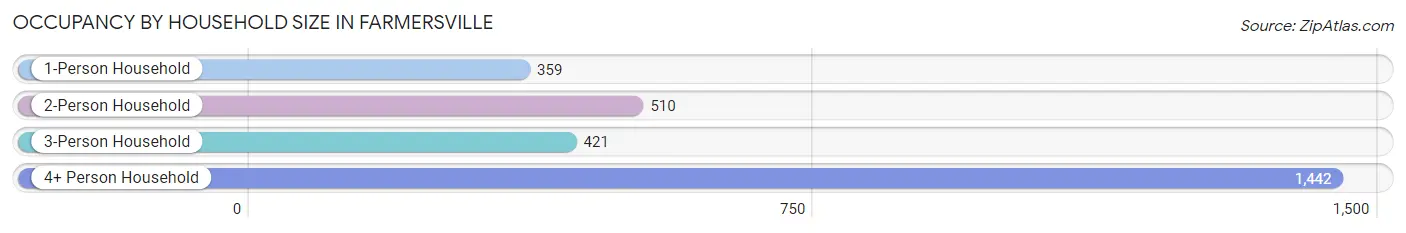
| Household Size | # Housing Units | % Housing Units |
| 1-Person Household | 359 | 13.1% |
| 2-Person Household | 510 | 18.7% |
| 3-Person Household | 421 | 15.4% |
| 4+ Person Household | 1,442 | 52.8% |
| Total Housing Units | 2,732 | 100.0% |
Occupancy by Ownership by Household Size in Farmersville
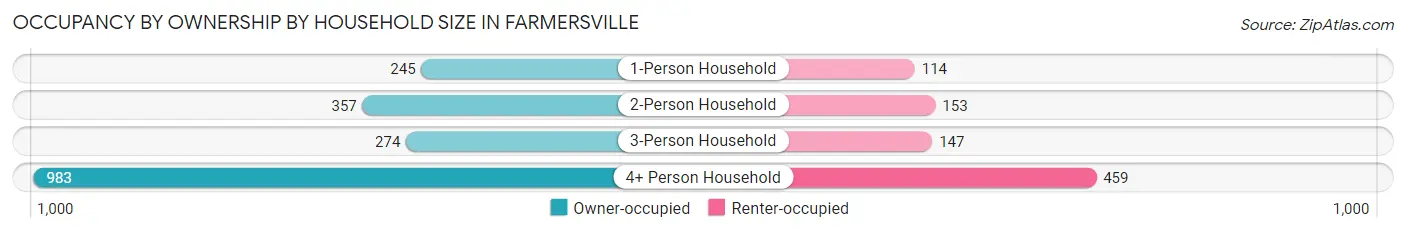
| Household Size | Owner-occupied | Renter-occupied |
| 1-Person Household | 245 (68.2%) | 114 (31.8%) |
| 2-Person Household | 357 (70.0%) | 153 (30.0%) |
| 3-Person Household | 274 (65.1%) | 147 (34.9%) |
| 4+ Person Household | 983 (68.2%) | 459 (31.8%) |
| Total Housing Units | 1,859 (68.0%) | 873 (32.0%) |
Occupancy by Educational Attainment in Farmersville
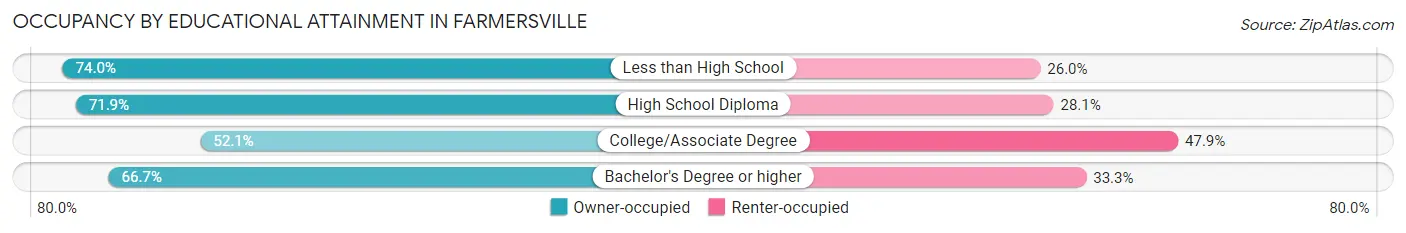
| Household Size | Owner-occupied | Renter-occupied |
| Less than High School | 869 (74.0%) | 306 (26.0%) |
| High School Diploma | 577 (71.9%) | 226 (28.1%) |
| College/Associate Degree | 321 (52.1%) | 295 (47.9%) |
| Bachelor's Degree or higher | 92 (66.7%) | 46 (33.3%) |
Occupancy by Age of Householder in Farmersville
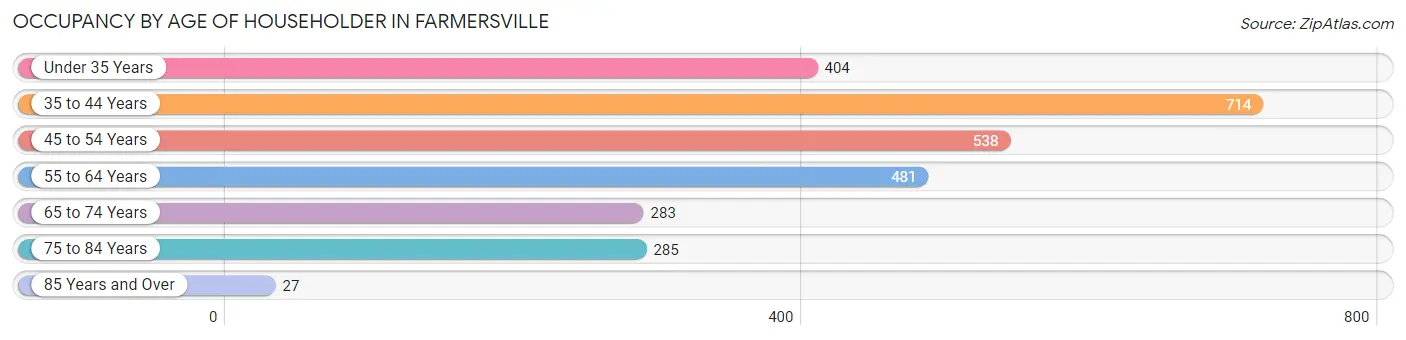
| Age Bracket | # Households | % Households |
| Under 35 Years | 404 | 14.8% |
| 35 to 44 Years | 714 | 26.1% |
| 45 to 54 Years | 538 | 19.7% |
| 55 to 64 Years | 481 | 17.6% |
| 65 to 74 Years | 283 | 10.4% |
| 75 to 84 Years | 285 | 10.4% |
| 85 Years and Over | 27 | 1.0% |
| Total | 2,732 | 100.0% |
Housing Finances in Farmersville
Median Income by Occupancy in Farmersville
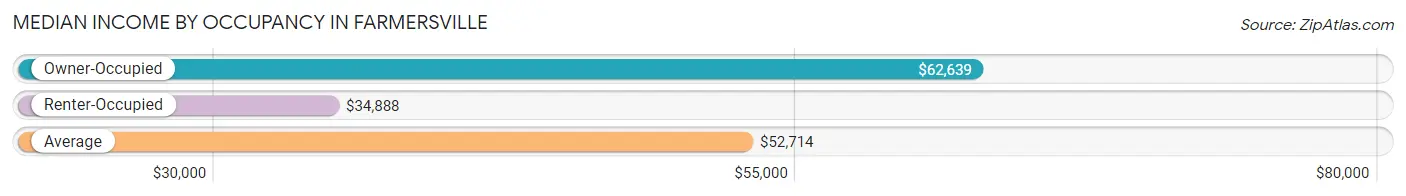
| Occupancy Type | # Households | Median Income |
| Owner-Occupied | 1,859 (68.0%) | $62,639 |
| Renter-Occupied | 873 (32.0%) | $34,888 |
| Average | 2,732 (100.0%) | $52,714 |
Occupancy by Householder Income Bracket in Farmersville
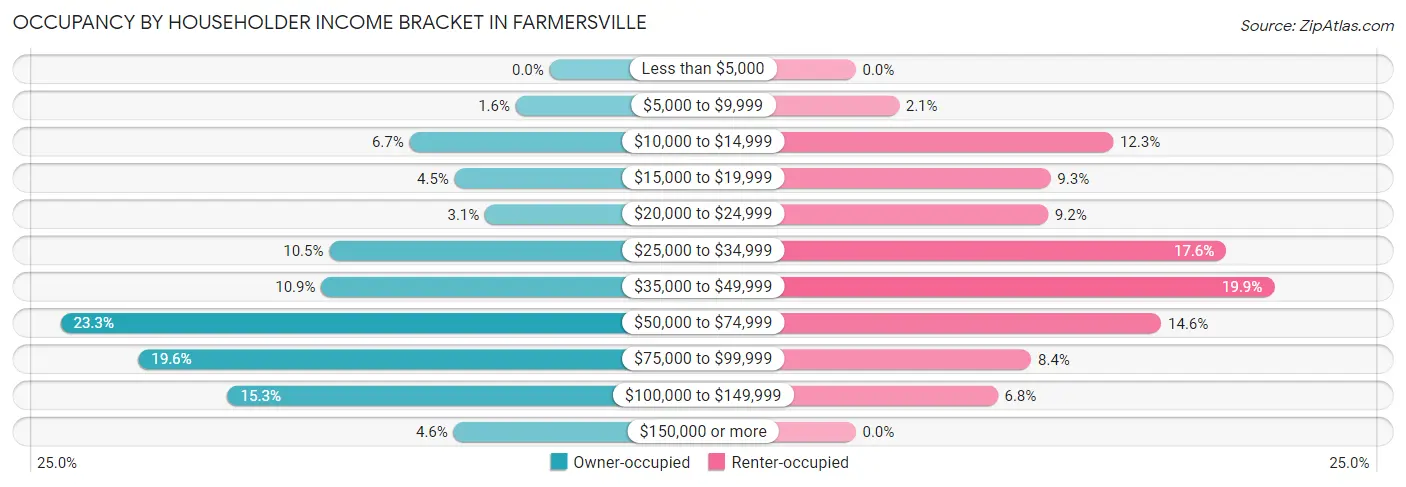
| Income Bracket | Owner-occupied | Renter-occupied |
| Less than $5,000 | 0 (0.0%) | 0 (0.0%) |
| $5,000 to $9,999 | 30 (1.6%) | 18 (2.1%) |
| $10,000 to $14,999 | 124 (6.7%) | 107 (12.3%) |
| $15,000 to $19,999 | 84 (4.5%) | 81 (9.3%) |
| $20,000 to $24,999 | 57 (3.1%) | 80 (9.2%) |
| $25,000 to $34,999 | 195 (10.5%) | 154 (17.6%) |
| $35,000 to $49,999 | 202 (10.9%) | 174 (19.9%) |
| $50,000 to $74,999 | 433 (23.3%) | 127 (14.5%) |
| $75,000 to $99,999 | 364 (19.6%) | 73 (8.4%) |
| $100,000 to $149,999 | 285 (15.3%) | 59 (6.8%) |
| $150,000 or more | 85 (4.6%) | 0 (0.0%) |
| Total | 1,859 (100.0%) | 873 (100.0%) |
Monthly Housing Cost Tiers in Farmersville
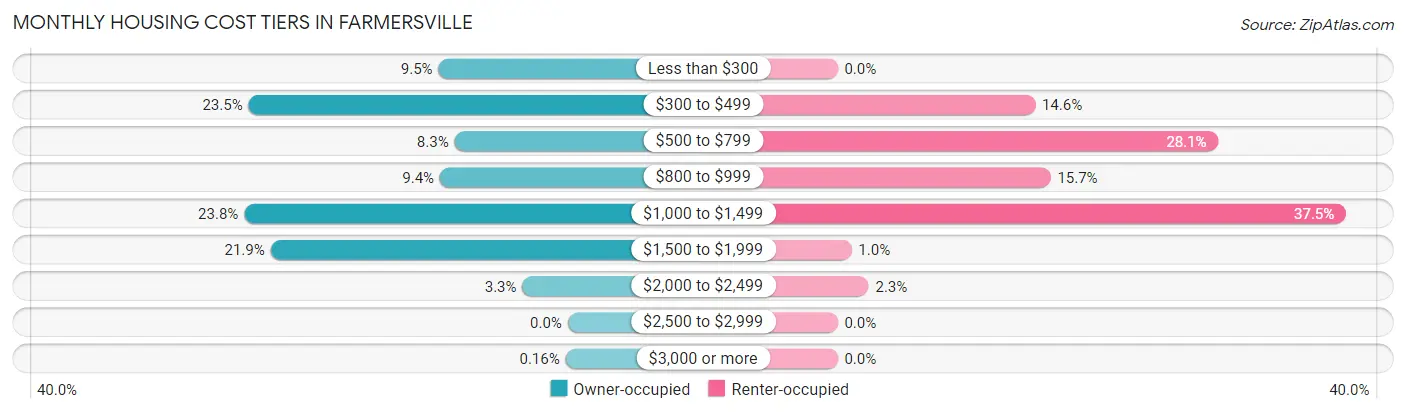
| Monthly Cost | Owner-occupied | Renter-occupied |
| Less than $300 | 177 (9.5%) | 0 (0.0%) |
| $300 to $499 | 437 (23.5%) | 127 (14.5%) |
| $500 to $799 | 155 (8.3%) | 245 (28.1%) |
| $800 to $999 | 175 (9.4%) | 137 (15.7%) |
| $1,000 to $1,499 | 443 (23.8%) | 327 (37.5%) |
| $1,500 to $1,999 | 407 (21.9%) | 9 (1.0%) |
| $2,000 to $2,499 | 62 (3.3%) | 20 (2.3%) |
| $2,500 to $2,999 | 0 (0.0%) | 0 (0.0%) |
| $3,000 or more | 3 (0.2%) | 0 (0.0%) |
| Total | 1,859 (100.0%) | 873 (100.0%) |
Physical Housing Characteristics in Farmersville
Housing Structures in Farmersville
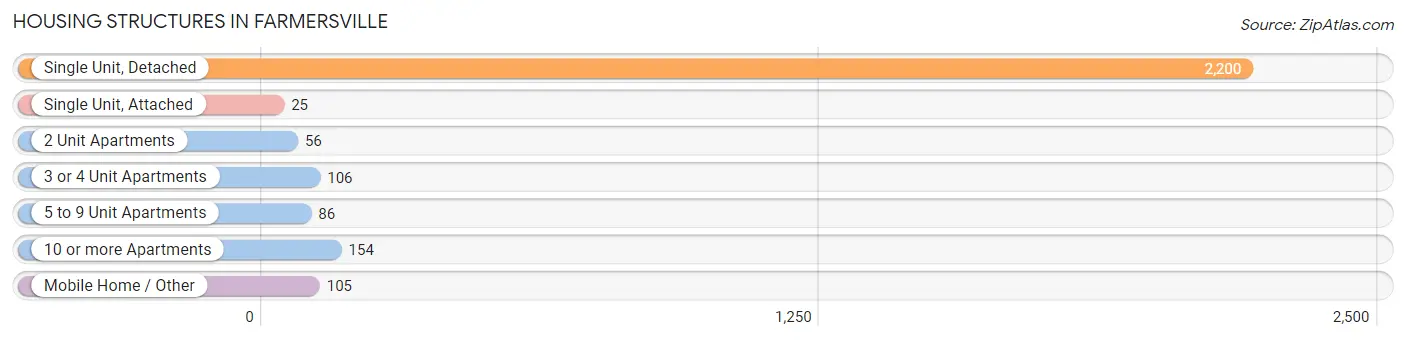
| Structure Type | # Housing Units | % Housing Units |
| Single Unit, Detached | 2,200 | 80.5% |
| Single Unit, Attached | 25 | 0.9% |
| 2 Unit Apartments | 56 | 2.1% |
| 3 or 4 Unit Apartments | 106 | 3.9% |
| 5 to 9 Unit Apartments | 86 | 3.2% |
| 10 or more Apartments | 154 | 5.6% |
| Mobile Home / Other | 105 | 3.8% |
| Total | 2,732 | 100.0% |
Housing Structures by Occupancy in Farmersville
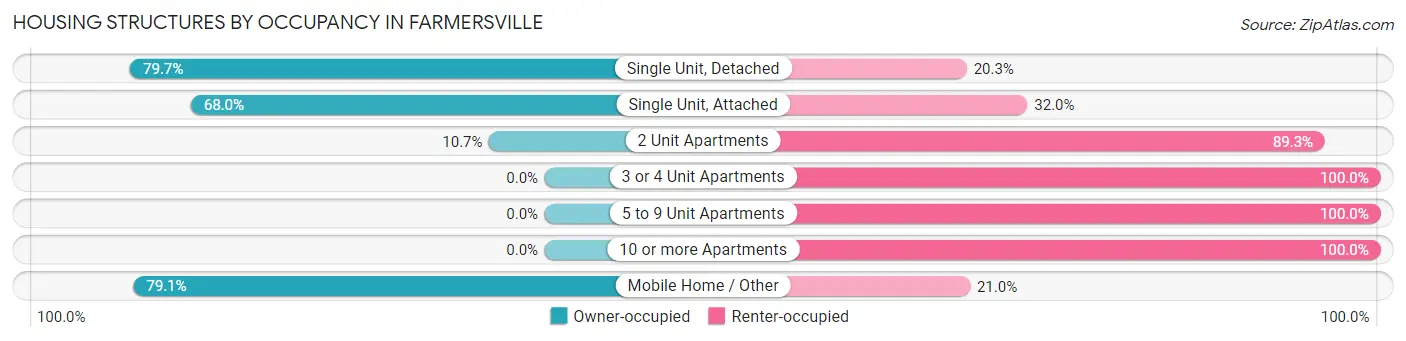
| Structure Type | Owner-occupied | Renter-occupied |
| Single Unit, Detached | 1,753 (79.7%) | 447 (20.3%) |
| Single Unit, Attached | 17 (68.0%) | 8 (32.0%) |
| 2 Unit Apartments | 6 (10.7%) | 50 (89.3%) |
| 3 or 4 Unit Apartments | 0 (0.0%) | 106 (100.0%) |
| 5 to 9 Unit Apartments | 0 (0.0%) | 86 (100.0%) |
| 10 or more Apartments | 0 (0.0%) | 154 (100.0%) |
| Mobile Home / Other | 83 (79.0%) | 22 (20.9%) |
| Total | 1,859 (68.0%) | 873 (32.0%) |
Housing Structures by Number of Rooms in Farmersville
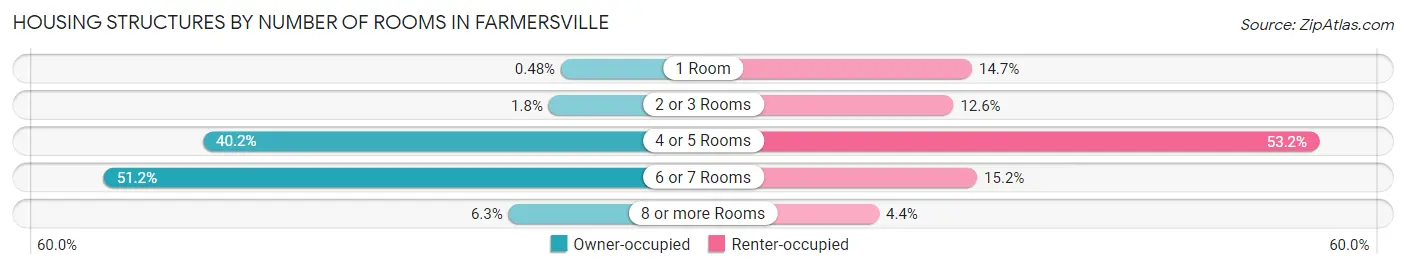
| Number of Rooms | Owner-occupied | Renter-occupied |
| 1 Room | 9 (0.5%) | 128 (14.7%) |
| 2 or 3 Rooms | 34 (1.8%) | 110 (12.6%) |
| 4 or 5 Rooms | 747 (40.2%) | 464 (53.1%) |
| 6 or 7 Rooms | 952 (51.2%) | 133 (15.2%) |
| 8 or more Rooms | 117 (6.3%) | 38 (4.3%) |
| Total | 1,859 (100.0%) | 873 (100.0%) |
Housing Structure by Heating Type in Farmersville
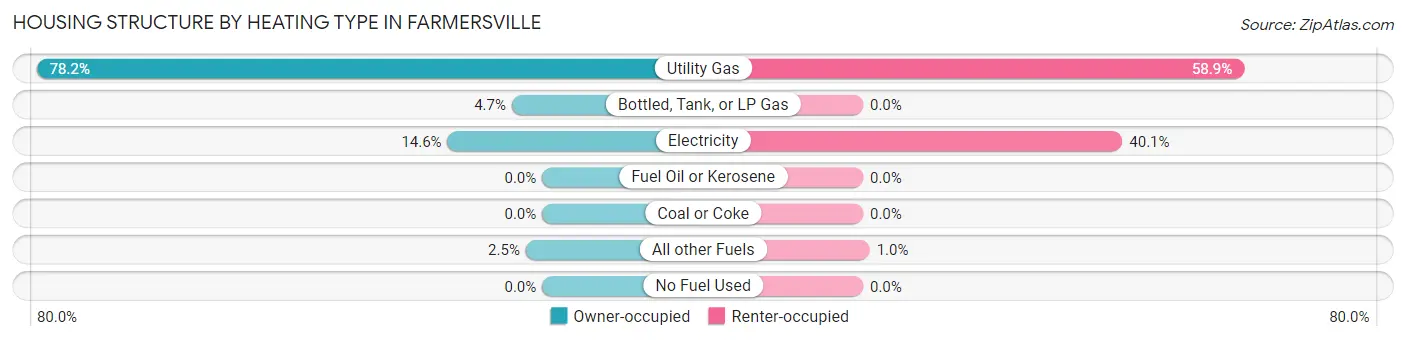
| Heating Type | Owner-occupied | Renter-occupied |
| Utility Gas | 1,453 (78.2%) | 514 (58.9%) |
| Bottled, Tank, or LP Gas | 87 (4.7%) | 0 (0.0%) |
| Electricity | 272 (14.6%) | 350 (40.1%) |
| Fuel Oil or Kerosene | 0 (0.0%) | 0 (0.0%) |
| Coal or Coke | 0 (0.0%) | 0 (0.0%) |
| All other Fuels | 47 (2.5%) | 9 (1.0%) |
| No Fuel Used | 0 (0.0%) | 0 (0.0%) |
| Total | 1,859 (100.0%) | 873 (100.0%) |
Household Vehicle Usage in Farmersville
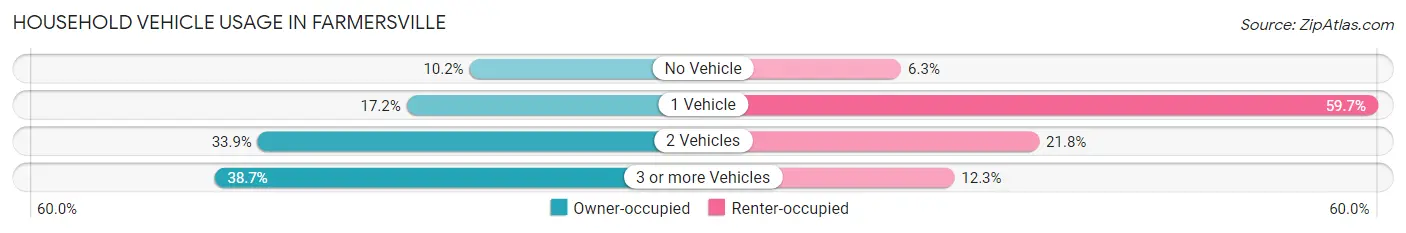
| Vehicles per Household | Owner-occupied | Renter-occupied |
| No Vehicle | 189 (10.2%) | 55 (6.3%) |
| 1 Vehicle | 320 (17.2%) | 521 (59.7%) |
| 2 Vehicles | 630 (33.9%) | 190 (21.8%) |
| 3 or more Vehicles | 720 (38.7%) | 107 (12.3%) |
| Total | 1,859 (100.0%) | 873 (100.0%) |
Real Estate & Mortgages in Farmersville
Real Estate and Mortgage Overview in Farmersville
| Characteristic | Without Mortgage | With Mortgage |
| Housing Units | 674 | 1,185 |
| Median Property Value | $206,900 | $247,900 |
| Median Household Income | $65,313 | $56 |
| Monthly Housing Costs | $389 | $3 |
| Real Estate Taxes | $1,188 | $48 |
Property Value by Mortgage Status in Farmersville
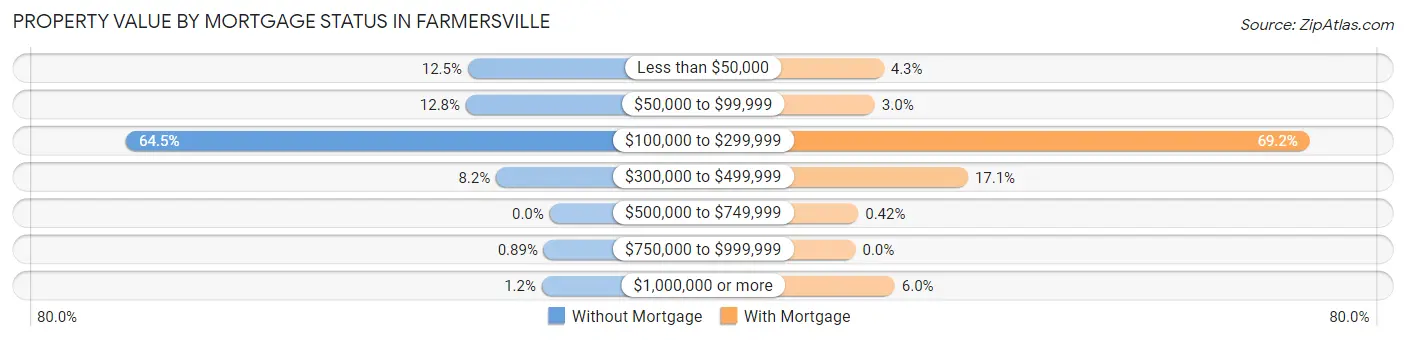
| Property Value | Without Mortgage | With Mortgage |
| Less than $50,000 | 84 (12.5%) | 51 (4.3%) |
| $50,000 to $99,999 | 86 (12.8%) | 35 (2.9%) |
| $100,000 to $299,999 | 435 (64.5%) | 820 (69.2%) |
| $300,000 to $499,999 | 55 (8.2%) | 203 (17.1%) |
| $500,000 to $749,999 | 0 (0.0%) | 5 (0.4%) |
| $750,000 to $999,999 | 6 (0.9%) | 0 (0.0%) |
| $1,000,000 or more | 8 (1.2%) | 71 (6.0%) |
| Total | 674 (100.0%) | 1,185 (100.0%) |
Household Income by Mortgage Status in Farmersville
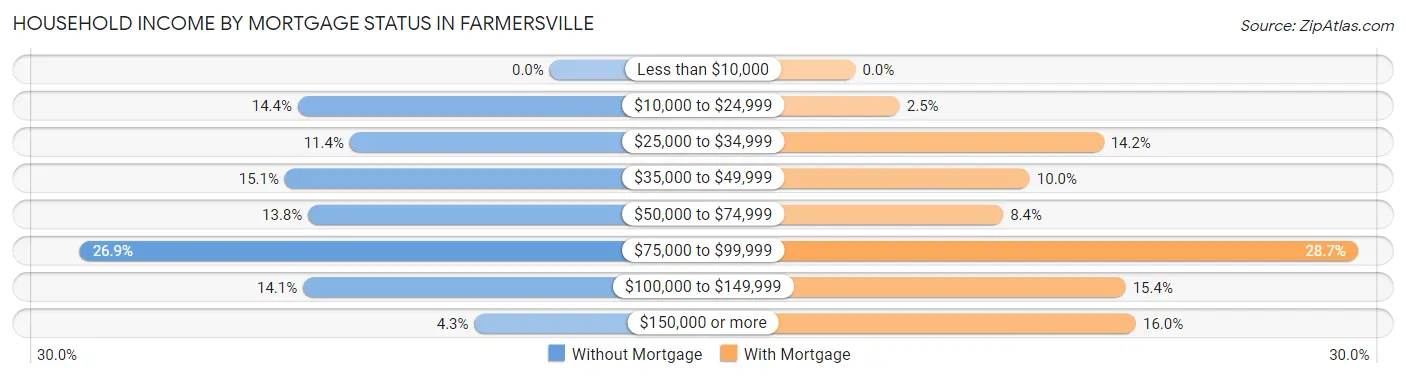
| Household Income | Without Mortgage | With Mortgage |
| Less than $10,000 | 0 (0.0%) | 0 (0.0%) |
| $10,000 to $24,999 | 97 (14.4%) | 30 (2.5%) |
| $25,000 to $34,999 | 77 (11.4%) | 168 (14.2%) |
| $35,000 to $49,999 | 102 (15.1%) | 118 (10.0%) |
| $50,000 to $74,999 | 93 (13.8%) | 100 (8.4%) |
| $75,000 to $99,999 | 181 (26.9%) | 340 (28.7%) |
| $100,000 to $149,999 | 95 (14.1%) | 183 (15.4%) |
| $150,000 or more | 29 (4.3%) | 190 (16.0%) |
| Total | 674 (100.0%) | 1,185 (100.0%) |
Property Value to Household Income Ratio in Farmersville
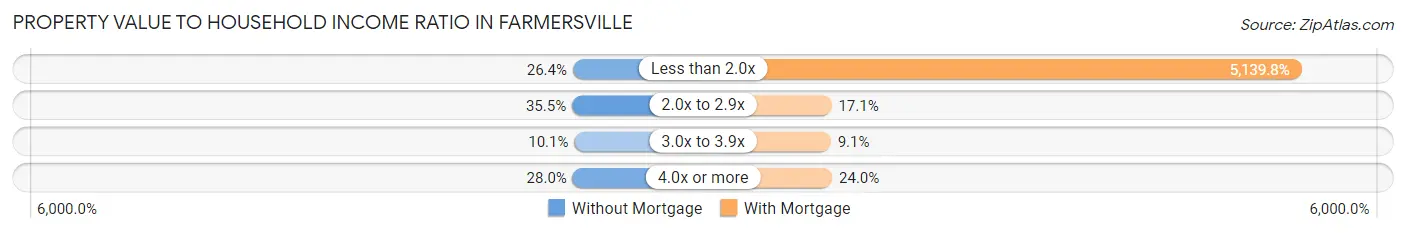
| Value-to-Income Ratio | Without Mortgage | With Mortgage |
| Less than 2.0x | 178 (26.4%) | 60,906 (5,139.8%) |
| 2.0x to 2.9x | 239 (35.5%) | 203 (17.1%) |
| 3.0x to 3.9x | 68 (10.1%) | 108 (9.1%) |
| 4.0x or more | 189 (28.0%) | 284 (24.0%) |
| Total | 674 (100.0%) | 1,185 (100.0%) |
Real Estate Taxes by Mortgage Status in Farmersville
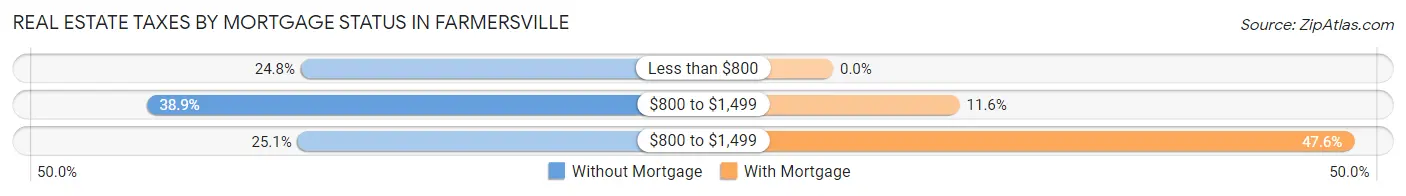
| Property Taxes | Without Mortgage | With Mortgage |
| Less than $800 | 167 (24.8%) | 0 (0.0%) |
| $800 to $1,499 | 262 (38.9%) | 137 (11.6%) |
| $800 to $1,499 | 169 (25.1%) | 564 (47.6%) |
| Total | 674 (100.0%) | 1,185 (100.0%) |
Health & Disability in Farmersville
Health Insurance Coverage by Age in Farmersville
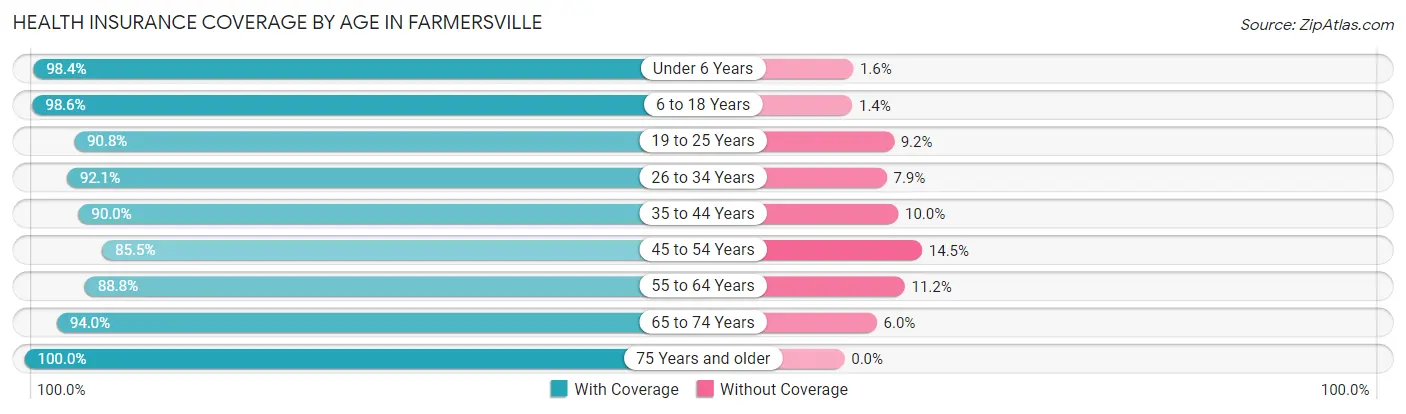
| Age Bracket | With Coverage | Without Coverage |
| Under 6 Years | 732 (98.4%) | 12 (1.6%) |
| 6 to 18 Years | 2,466 (98.6%) | 36 (1.4%) |
| 19 to 25 Years | 1,232 (90.8%) | 125 (9.2%) |
| 26 to 34 Years | 1,262 (92.1%) | 108 (7.9%) |
| 35 to 44 Years | 1,049 (90.0%) | 117 (10.0%) |
| 45 to 54 Years | 1,006 (85.5%) | 170 (14.5%) |
| 55 to 64 Years | 1,051 (88.8%) | 133 (11.2%) |
| 65 to 74 Years | 406 (94.0%) | 26 (6.0%) |
| 75 Years and older | 462 (100.0%) | 0 (0.0%) |
| Total | 9,666 (93.0%) | 727 (7.0%) |
Health Insurance Coverage by Citizenship Status in Farmersville

| Citizenship Status | With Coverage | Without Coverage |
| Native Born | 732 (98.4%) | 12 (1.6%) |
| Foreign Born, Citizen | 2,466 (98.6%) | 36 (1.4%) |
| Foreign Born, not a Citizen | 1,232 (90.8%) | 125 (9.2%) |
Health Insurance Coverage by Household Income in Farmersville
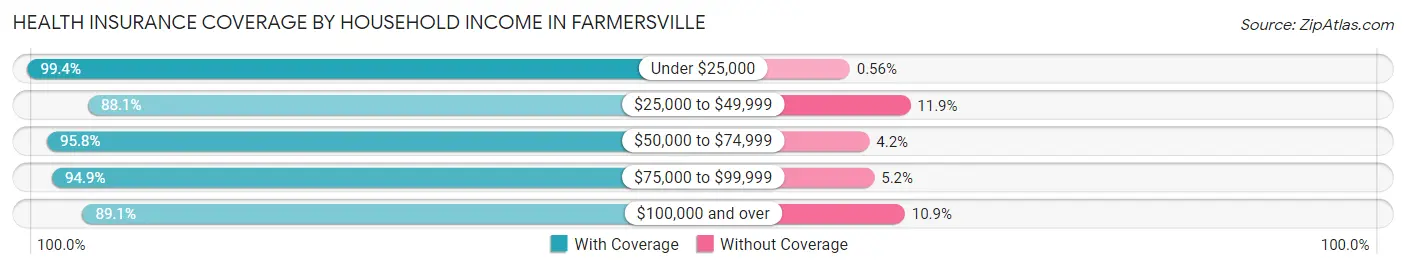
| Household Income | With Coverage | Without Coverage |
| Under $25,000 | 1,609 (99.4%) | 9 (0.6%) |
| $25,000 to $49,999 | 2,292 (88.1%) | 310 (11.9%) |
| $50,000 to $74,999 | 2,014 (95.8%) | 89 (4.2%) |
| $75,000 to $99,999 | 2,046 (94.9%) | 111 (5.1%) |
| $100,000 and over | 1,705 (89.1%) | 208 (10.9%) |
Public vs Private Health Insurance Coverage by Age in Farmersville
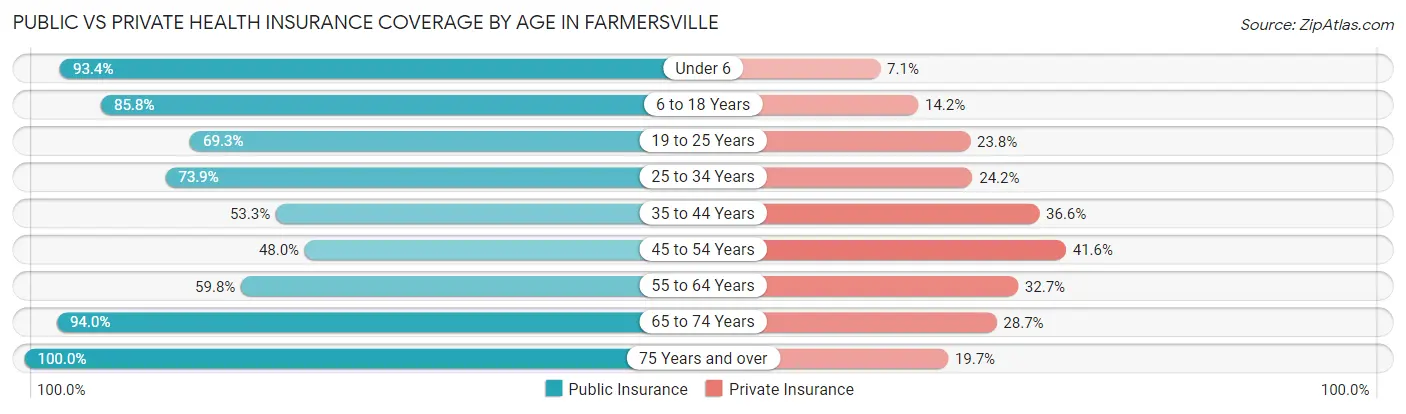
| Age Bracket | Public Insurance | Private Insurance |
| Under 6 | 695 (93.4%) | 53 (7.1%) |
| 6 to 18 Years | 2,147 (85.8%) | 354 (14.1%) |
| 19 to 25 Years | 940 (69.3%) | 323 (23.8%) |
| 25 to 34 Years | 1,012 (73.9%) | 332 (24.2%) |
| 35 to 44 Years | 622 (53.3%) | 427 (36.6%) |
| 45 to 54 Years | 564 (48.0%) | 489 (41.6%) |
| 55 to 64 Years | 708 (59.8%) | 387 (32.7%) |
| 65 to 74 Years | 406 (94.0%) | 124 (28.7%) |
| 75 Years and over | 462 (100.0%) | 91 (19.7%) |
| Total | 7,556 (72.7%) | 2,580 (24.8%) |
Disability Status by Sex by Age in Farmersville
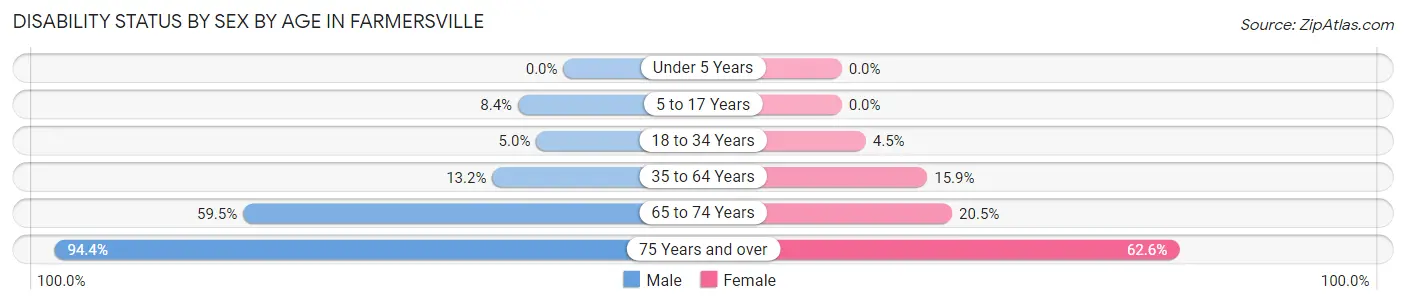
| Age Bracket | Male | Female |
| Under 5 Years | 0 (0.0%) | 0 (0.0%) |
| 5 to 17 Years | 96 (8.4%) | 0 (0.0%) |
| 18 to 34 Years | 80 (5.0%) | 62 (4.5%) |
| 35 to 64 Years | 240 (13.2%) | 271 (15.9%) |
| 65 to 74 Years | 132 (59.5%) | 43 (20.5%) |
| 75 Years and over | 136 (94.4%) | 199 (62.6%) |
Disability Class by Sex by Age in Farmersville
Disability Class: Hearing Difficulty
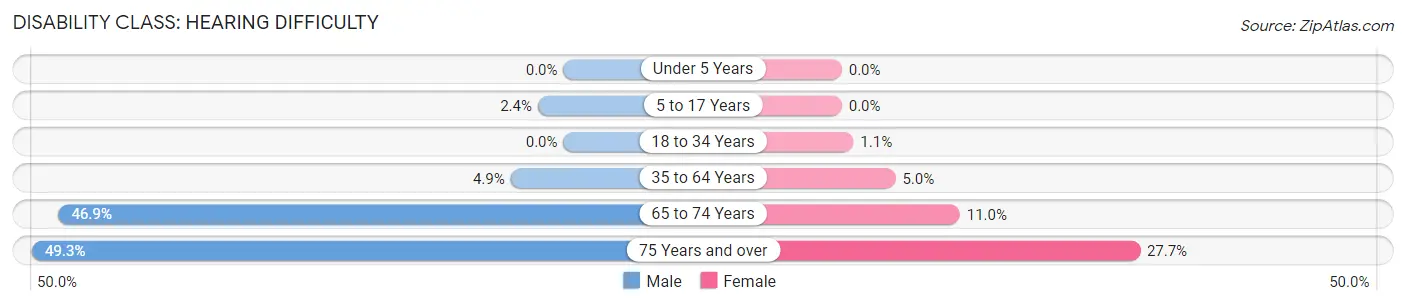
| Age Bracket | Male | Female |
| Under 5 Years | 0 (0.0%) | 0 (0.0%) |
| 5 to 17 Years | 27 (2.4%) | 0 (0.0%) |
| 18 to 34 Years | 0 (0.0%) | 15 (1.1%) |
| 35 to 64 Years | 89 (4.9%) | 85 (5.0%) |
| 65 to 74 Years | 104 (46.9%) | 23 (11.0%) |
| 75 Years and over | 71 (49.3%) | 88 (27.7%) |
Disability Class: Vision Difficulty
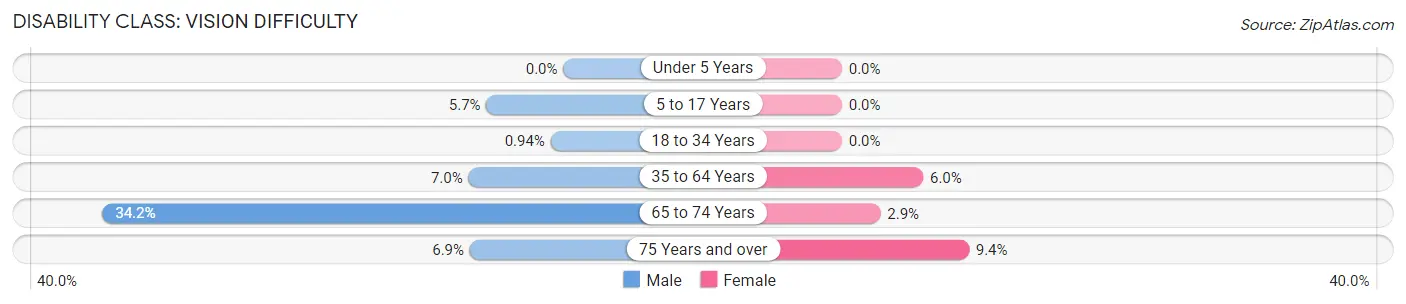
| Age Bracket | Male | Female |
| Under 5 Years | 0 (0.0%) | 0 (0.0%) |
| 5 to 17 Years | 65 (5.7%) | 0 (0.0%) |
| 18 to 34 Years | 15 (0.9%) | 0 (0.0%) |
| 35 to 64 Years | 128 (7.0%) | 103 (6.0%) |
| 65 to 74 Years | 76 (34.2%) | 6 (2.9%) |
| 75 Years and over | 10 (6.9%) | 30 (9.4%) |
Disability Class: Cognitive Difficulty
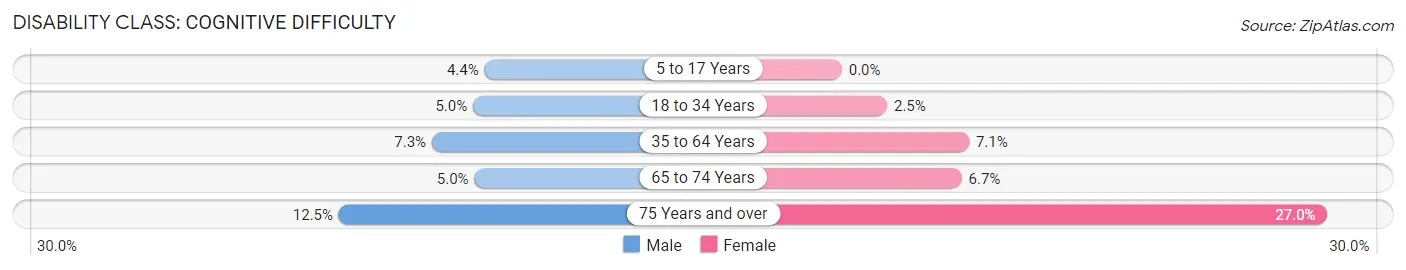
| Age Bracket | Male | Female |
| 5 to 17 Years | 50 (4.4%) | 0 (0.0%) |
| 18 to 34 Years | 80 (5.0%) | 35 (2.5%) |
| 35 to 64 Years | 133 (7.3%) | 121 (7.1%) |
| 65 to 74 Years | 11 (5.0%) | 14 (6.7%) |
| 75 Years and over | 18 (12.5%) | 86 (27.0%) |
Disability Class: Ambulatory Difficulty
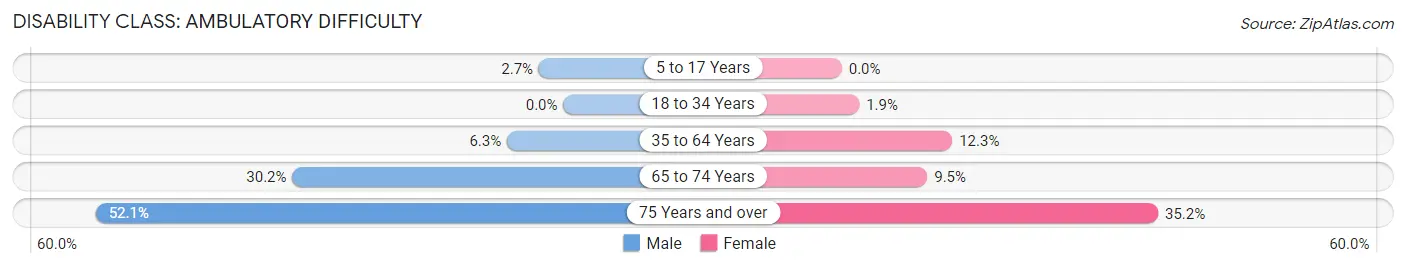
| Age Bracket | Male | Female |
| 5 to 17 Years | 31 (2.7%) | 0 (0.0%) |
| 18 to 34 Years | 0 (0.0%) | 27 (1.9%) |
| 35 to 64 Years | 114 (6.3%) | 210 (12.3%) |
| 65 to 74 Years | 67 (30.2%) | 20 (9.5%) |
| 75 Years and over | 75 (52.1%) | 112 (35.2%) |
Disability Class: Self-Care Difficulty
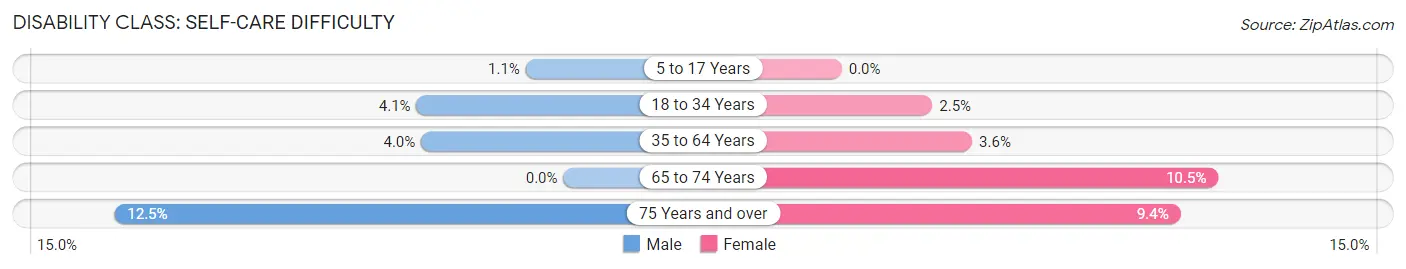
| Age Bracket | Male | Female |
| 5 to 17 Years | 12 (1.1%) | 0 (0.0%) |
| 18 to 34 Years | 65 (4.1%) | 35 (2.5%) |
| 35 to 64 Years | 72 (4.0%) | 62 (3.6%) |
| 65 to 74 Years | 0 (0.0%) | 22 (10.5%) |
| 75 Years and over | 18 (12.5%) | 30 (9.4%) |
Technology Access in Farmersville
Computing Device Access in Farmersville
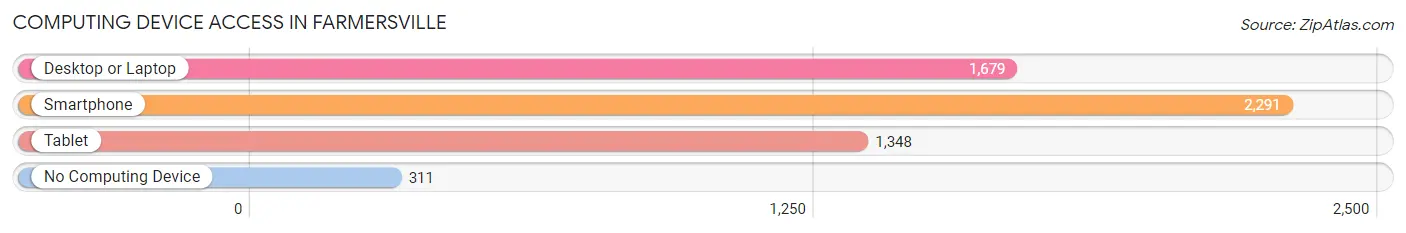
| Device Type | # Households | % Households |
| Desktop or Laptop | 1,679 | 61.5% |
| Smartphone | 2,291 | 83.9% |
| Tablet | 1,348 | 49.3% |
| No Computing Device | 311 | 11.4% |
| Total | 2,732 | 100.0% |
Internet Access in Farmersville
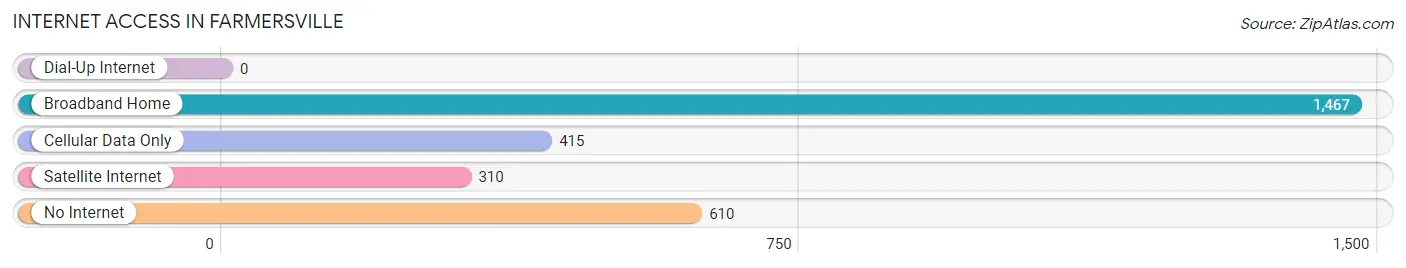
| Internet Type | # Households | % Households |
| Dial-Up Internet | 0 | 0.0% |
| Broadband Home | 1,467 | 53.7% |
| Cellular Data Only | 415 | 15.2% |
| Satellite Internet | 310 | 11.4% |
| No Internet | 610 | 22.3% |
| Total | 2,732 | 100.0% |
Farmersville Summary
Farmersville is a small town located in Tulare County, California, United States. It is situated in the San Joaquin Valley, approximately 35 miles southeast of Fresno. The population was 10,588 at the 2010 census, up from 8,737 at the 2000 census.
History
The area that is now Farmersville was originally inhabited by the Yokuts Indians. The first European settlers arrived in the area in the late 1800s. The town was founded in 1873 by two brothers, John and William Farmer, who purchased land in the area and began farming. The town was named after them.
In the early 1900s, the town began to grow as more people moved to the area to work in the agricultural industry. The town was incorporated in 1914.
Geography
Farmersville is located at 36°22′17″N 119°14′17″W (36.371445, -119.238018). According to the United States Census Bureau, the town has a total area of 1.3 square miles (3.4 km2), all of it land.
Economy
The economy of Farmersville is largely based on agriculture. The town is home to a variety of farms, including dairy, poultry, and vegetable farms. The town is also home to several food processing plants.
Demographics
As of the census of 2000, there were 8,737 people, 2,717 households, and 2,092 families residing in the town. The population density was 6,717.3 people per square mile (2,597.2/km2). There were 2,890 housing units at an average density of 2,213.2 per square mile (854.3/km2). The racial makeup of the town was 57.2% White, 0.7% African American, 1.2% Native American, 0.4% Asian, 0.1% Pacific Islander, 37.2% from other races, and 3.2% from two or more races. Hispanic or Latino of any race were 64.2% of the population.
There were 2,717 households, out of which 41.2% had children under the age of 18 living with them, 54.2% were married couples living together, 14.2% had a female householder with no husband present, and 24.2% were non-families. 19.7% of all households were made up of individuals, and 8.2% had someone living alone who was 65 years of age or older. The average household size was 3.20 and the average family size was 3.68.
In the town, the population was spread out, with 33.2% under the age of 18, 11.2% from 18 to 24, 27.2% from 25 to 44, 17.7% from 45 to 64, and 10.7% who were 65 years of age or older. The median age was 29 years. For every 100 females, there were 97.2 males. For every 100 females age 18 and over, there were 93.2 males.
The median income for a household in the town was $25,938, and the median income for a family was $27,917. Males had a median income of $25,938 versus $19,917 for females. The per capita income for the town was $10,945. About 24.2% of families and 28.2% of the population were below the poverty line, including 36.2% of those under age 18 and 16.2% of those age 65 or over.
Common Questions
What is Per Capita Income in Farmersville?
Per Capita income in Farmersville is $16,635.
What is the Median Family Income in Farmersville?
Median Family Income in Farmersville is $56,729.
What is the Median Household income in Farmersville?
Median Household Income in Farmersville is $52,714.
What is Income or Wage Gap in Farmersville?
Income or Wage Gap in Farmersville is 14.6%.
Women in Farmersville earn 85.4 cents for every dollar earned by a man.
What is Family Income Deficit in Farmersville?
Family Income Deficit in Farmersville is $11,356.
Families that are below poverty line in Farmersville earn $11,356 less on average than the poverty threshold level.
What is Inequality or Gini Index in Farmersville?
Inequality or Gini Index in Farmersville is 0.37.
What is the Total Population of Farmersville?
Total Population of Farmersville is 10,393.
What is the Total Male Population of Farmersville?
Total Male Population of Farmersville is 5,234.
What is the Total Female Population of Farmersville?
Total Female Population of Farmersville is 5,159.
What is the Ratio of Males per 100 Females in Farmersville?
There are 101.45 Males per 100 Females in Farmersville.
What is the Ratio of Females per 100 Males in Farmersville?
There are 98.57 Females per 100 Males in Farmersville.
What is the Median Population Age in Farmersville?
Median Population Age in Farmersville is 29.4 Years.
What is the Average Family Size in Farmersville
Average Family Size in Farmersville is 4.2 People.
What is the Average Household Size in Farmersville
Average Household Size in Farmersville is 3.8 People.
How Large is the Labor Force in Farmersville?
There are 4,750 People in the Labor Forcein in Farmersville.
What is the Percentage of People in the Labor Force in Farmersville?
60.4% of People are in the Labor Force in Farmersville.
What is the Unemployment Rate in Farmersville?
Unemployment Rate in Farmersville is 9.8%.