Fairfax, CA Map & Demographics
Fairfax Map
Fairfax Overview
$66,389
PER CAPITA INCOME
$163,201
AVG FAMILY INCOME
$126,034
AVG HOUSEHOLD INCOME
45.5%
WAGE / INCOME GAP [ % ]
54.5¢/ $1
WAGE / INCOME GAP [ $ ]
0.47
INEQUALITY / GINI INDEX
7,567
TOTAL POPULATION
3,598
MALE POPULATION
3,969
FEMALE POPULATION
90.65
MALES / 100 FEMALES
110.31
FEMALES / 100 MALES
47.6
MEDIAN AGE
2.8
AVG FAMILY SIZE
2.3
AVG HOUSEHOLD SIZE
4,575
LABOR FORCE [ PEOPLE ]
71.0%
PERCENT IN LABOR FORCE
10.8%
UNEMPLOYMENT RATE
Fairfax Zip Codes
Fairfax Area Codes
Income in Fairfax
Income Overview in Fairfax
Per Capita Income in Fairfax is $66,389, while median incomes of families and households are $163,201 and $126,034 respectively.
| Characteristic | Number | Measure |
| Per Capita Income | 7,567 | $66,389 |
| Median Family Income | 1,915 | $163,201 |
| Mean Family Income | 1,915 | $195,910 |
| Median Household Income | 3,259 | $126,034 |
| Mean Household Income | 3,259 | $153,699 |
| Income Deficit | 1,915 | $0 |
| Wage / Income Gap (%) | 7,567 | 45.48% |
| Wage / Income Gap ($) | 7,567 | 54.52¢ per $1 |
| Gini / Inequality Index | 7,567 | 0.47 |
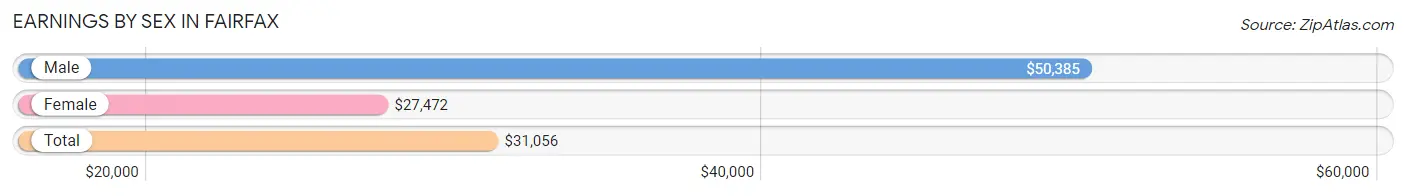
Earnings by Sex in Fairfax
Average Earnings in Fairfax are $31,056, $50,385 for men and $27,472 for women, a difference of 45.5%.
| Sex | Number | Average Earnings |
| Male | 2,297 (48.7%) | $50,385 |
| Female | 2,421 (51.3%) | $27,472 |
| Total | 4,718 (100.0%) | $31,056 |
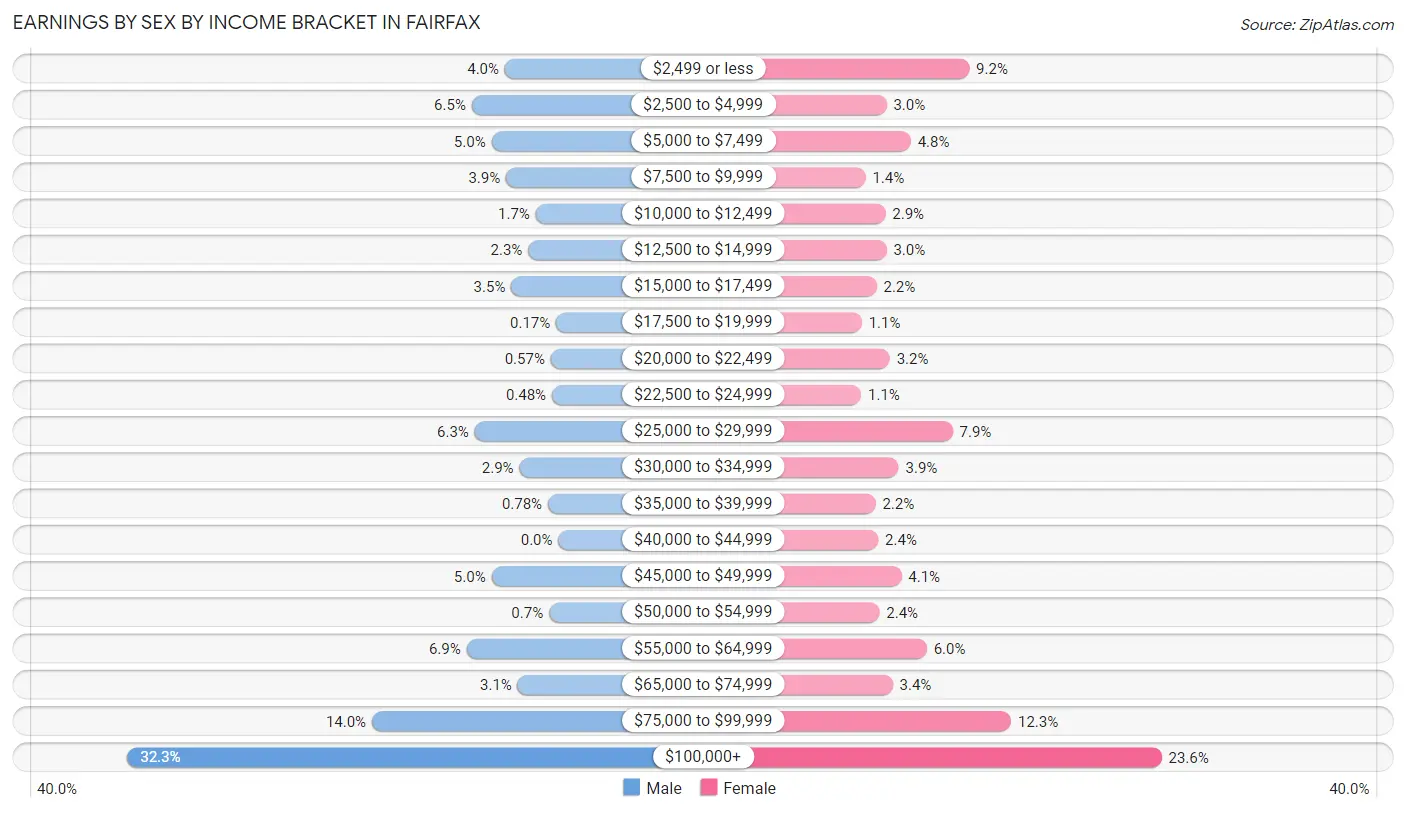
Earnings by Sex by Income Bracket in Fairfax
The most common earnings brackets in Fairfax are $100,000+ for men (742 | 32.3%) and $100,000+ for women (571 | 23.6%).
| Income | Male | Female |
| $2,499 or less | 92 (4.0%) | 222 (9.2%) |
| $2,500 to $4,999 | 149 (6.5%) | 72 (3.0%) |
| $5,000 to $7,499 | 115 (5.0%) | 116 (4.8%) |
| $7,500 to $9,999 | 90 (3.9%) | 34 (1.4%) |
| $10,000 to $12,499 | 39 (1.7%) | 70 (2.9%) |
| $12,500 to $14,999 | 52 (2.3%) | 72 (3.0%) |
| $15,000 to $17,499 | 81 (3.5%) | 54 (2.2%) |
| $17,500 to $19,999 | 4 (0.2%) | 27 (1.1%) |
| $20,000 to $22,499 | 13 (0.6%) | 78 (3.2%) |
| $22,500 to $24,999 | 11 (0.5%) | 26 (1.1%) |
| $25,000 to $29,999 | 144 (6.3%) | 192 (7.9%) |
| $30,000 to $34,999 | 67 (2.9%) | 94 (3.9%) |
| $35,000 to $39,999 | 18 (0.8%) | 52 (2.1%) |
| $40,000 to $44,999 | 0 (0.0%) | 57 (2.4%) |
| $45,000 to $49,999 | 115 (5.0%) | 99 (4.1%) |
| $50,000 to $54,999 | 16 (0.7%) | 59 (2.4%) |
| $55,000 to $64,999 | 158 (6.9%) | 145 (6.0%) |
| $65,000 to $74,999 | 70 (3.0%) | 83 (3.4%) |
| $75,000 to $99,999 | 321 (14.0%) | 298 (12.3%) |
| $100,000+ | 742 (32.3%) | 571 (23.6%) |
| Total | 2,297 (100.0%) | 2,421 (100.0%) |
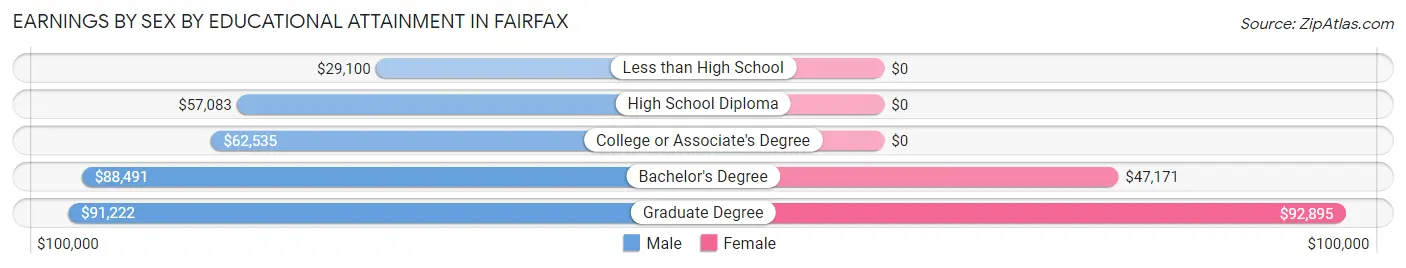
Earnings by Sex by Educational Attainment in Fairfax
Average earnings in Fairfax are $79,426 for men and $52,939 for women, a difference of 33.4%. Men with an educational attainment of graduate degree enjoy the highest average annual earnings of $91,222, while those with less than high school education earn the least with $29,100. Women with an educational attainment of graduate degree earn the most with the average annual earnings of $92,895, while those with bachelor's degree education have the smallest earnings of $47,171.
| Educational Attainment | Male Income | Female Income |
| Less than High School | $29,100 | $0 |
| High School Diploma | $57,083 | $0 |
| College or Associate's Degree | $62,535 | $0 |
| Bachelor's Degree | $88,491 | $47,171 |
| Graduate Degree | $91,222 | $92,895 |
| Total | $79,426 | $52,939 |
Family Income in Fairfax
Family Income Brackets in Fairfax
According to the Fairfax family income data, there are 710 families falling into the $200,000+ income range, which is the most common income bracket and makes up 37.1% of all families. Conversely, the $15,000 to $24,999 income bracket is the least frequent group with only 11 families (0.6%) belonging to this category.
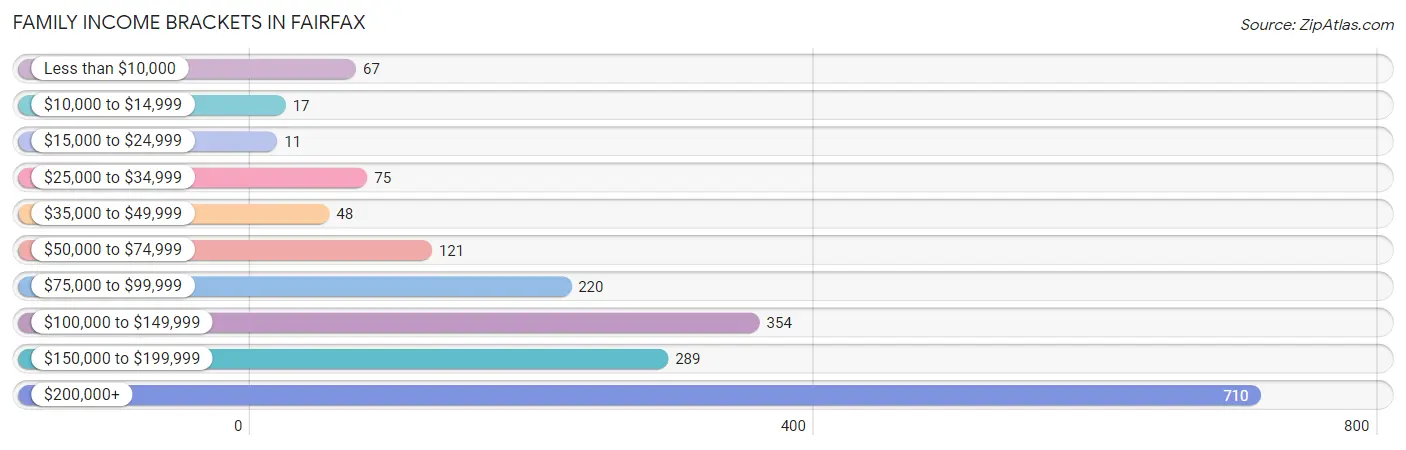
| Income Bracket | # Families | % Families |
| Less than $10,000 | 67 | 3.5% |
| $10,000 to $14,999 | 17 | 0.9% |
| $15,000 to $24,999 | 11 | 0.6% |
| $25,000 to $34,999 | 75 | 3.9% |
| $35,000 to $49,999 | 48 | 2.5% |
| $50,000 to $74,999 | 121 | 6.3% |
| $75,000 to $99,999 | 220 | 11.5% |
| $100,000 to $149,999 | 354 | 18.5% |
| $150,000 to $199,999 | 289 | 15.1% |
| $200,000+ | 710 | 37.1% |
Family Income by Famaliy Size in Fairfax
4-person families (377 | 19.7%) account for the highest median family income in Fairfax with $250,001 per family, while 2-person families (1,048 | 54.7%) have the highest median income of $63,356 per family member.
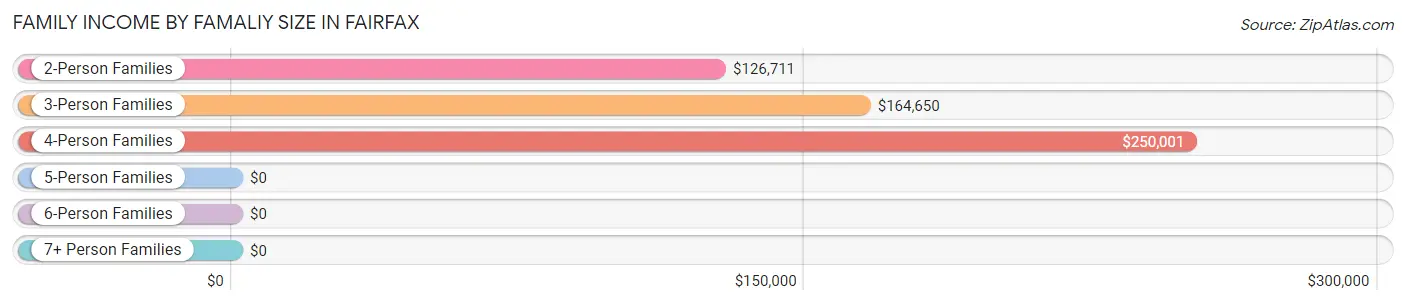
| Income Bracket | # Families | Median Income |
| 2-Person Families | 1,048 (54.7%) | $126,711 |
| 3-Person Families | 459 (24.0%) | $164,650 |
| 4-Person Families | 377 (19.7%) | $250,001 |
| 5-Person Families | 22 (1.1%) | $0 |
| 6-Person Families | 9 (0.5%) | $0 |
| 7+ Person Families | 0 (0.0%) | $0 |
| Total | 1,915 (100.0%) | $163,201 |
Family Income by Number of Earners in Fairfax
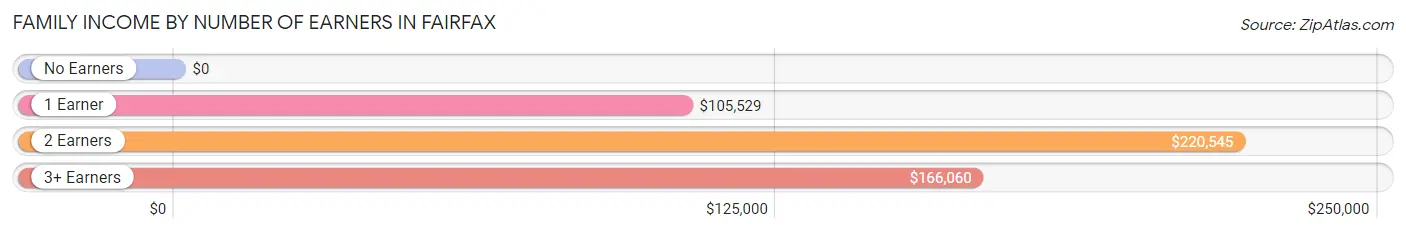
| Number of Earners | # Families | Median Income |
| No Earners | 176 (9.2%) | $0 |
| 1 Earner | 615 (32.1%) | $105,529 |
| 2 Earners | 927 (48.4%) | $220,545 |
| 3+ Earners | 197 (10.3%) | $166,060 |
| Total | 1,915 (100.0%) | $163,201 |
Household Income in Fairfax
Household Income Brackets in Fairfax
With 886 households falling in the category, the $200,000+ income range is the most frequent in Fairfax, accounting for 27.2% of all households. In contrast, only 49 households (1.5%) fall into the $10,000 to $14,999 income bracket, making it the least populous group.
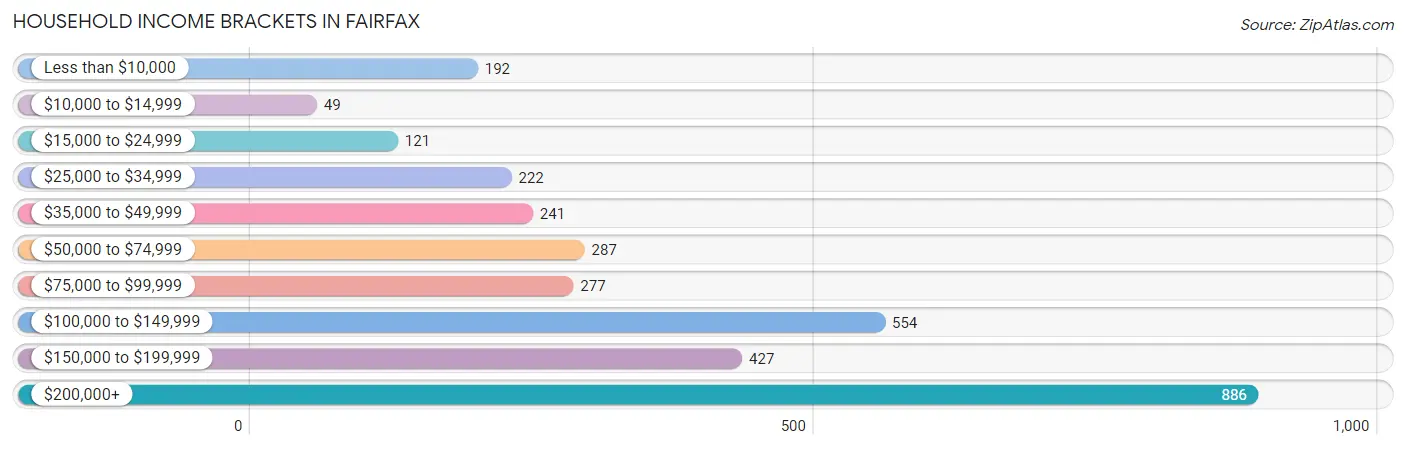
| Income Bracket | # Households | % Households |
| Less than $10,000 | 192 | 5.9% |
| $10,000 to $14,999 | 49 | 1.5% |
| $15,000 to $24,999 | 121 | 3.7% |
| $25,000 to $34,999 | 222 | 6.8% |
| $35,000 to $49,999 | 241 | 7.4% |
| $50,000 to $74,999 | 287 | 8.8% |
| $75,000 to $99,999 | 277 | 8.5% |
| $100,000 to $149,999 | 554 | 17.0% |
| $150,000 to $199,999 | 427 | 13.1% |
| $200,000+ | 886 | 27.2% |
Household Income by Householder Age in Fairfax
The median household income in Fairfax is $126,034, with the highest median household income of $164,550 found in the 45 to 64 years age bracket for the primary householder. A total of 1,517 households (46.6%) fall into this category. Meanwhile, the 15 to 24 years age bracket for the primary householder has the lowest median household income of $0, with 74 households (2.3%) in this group.
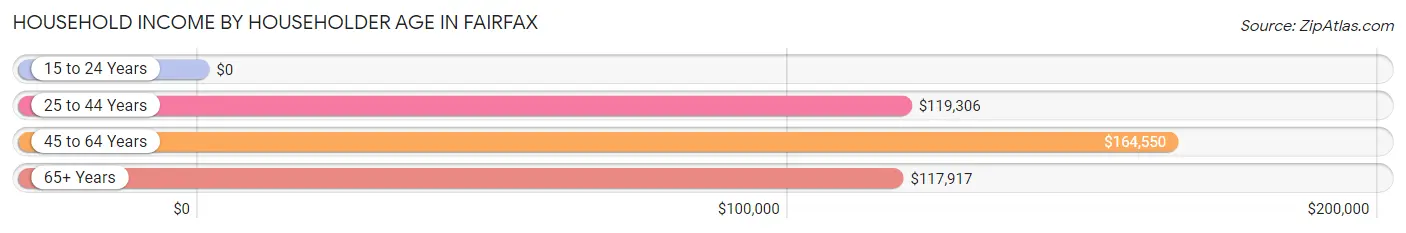
| Income Bracket | # Households | Median Income |
| 15 to 24 Years | 74 (2.3%) | $0 |
| 25 to 44 Years | 688 (21.1%) | $119,306 |
| 45 to 64 Years | 1,517 (46.6%) | $164,550 |
| 65+ Years | 980 (30.1%) | $117,917 |
| Total | 3,259 (100.0%) | $126,034 |
Poverty in Fairfax
Income Below Poverty by Sex and Age in Fairfax
With 10.2% poverty level for males and 9.6% for females among the residents of Fairfax, 5 year old males and under 5 year old females are the most vulnerable to poverty, with 2 males (100.0%) and 61 females (32.3%) in their respective age groups living below the poverty level.
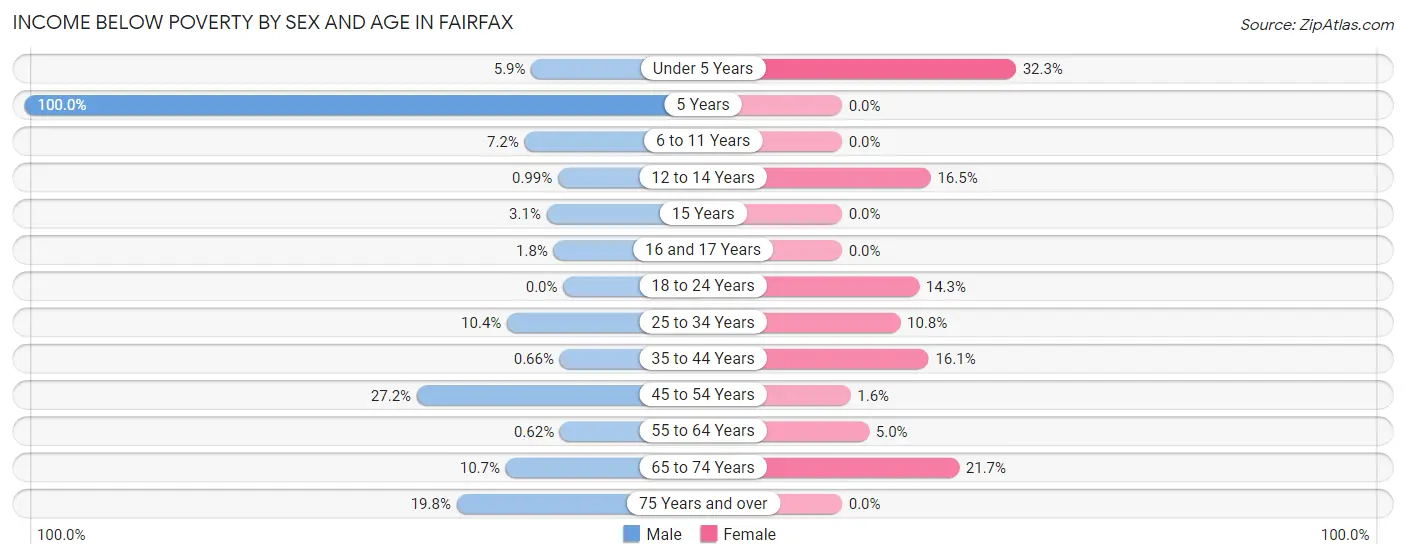
| Age Bracket | Male | Female |
| Under 5 Years | 12 (5.9%) | 61 (32.3%) |
| 5 Years | 2 (100.0%) | 0 (0.0%) |
| 6 to 11 Years | 10 (7.2%) | 0 (0.0%) |
| 12 to 14 Years | 1 (1.0%) | 13 (16.5%) |
| 15 Years | 2 (3.1%) | 0 (0.0%) |
| 16 and 17 Years | 1 (1.8%) | 0 (0.0%) |
| 18 to 24 Years | 0 (0.0%) | 37 (14.3%) |
| 25 to 34 Years | 29 (10.4%) | 46 (10.8%) |
| 35 to 44 Years | 3 (0.7%) | 61 (16.1%) |
| 45 to 54 Years | 181 (27.2%) | 12 (1.6%) |
| 55 to 64 Years | 3 (0.6%) | 33 (5.0%) |
| 65 to 74 Years | 44 (10.7%) | 118 (21.7%) |
| 75 Years and over | 77 (19.8%) | 0 (0.0%) |
| Total | 365 (10.2%) | 381 (9.6%) |
Income Above Poverty by Sex and Age in Fairfax
According to the poverty statistics in Fairfax, males aged 18 to 24 years and females aged 5 years are the age groups that are most secure financially, with 100.0% of males and 100.0% of females in these age groups living above the poverty line.
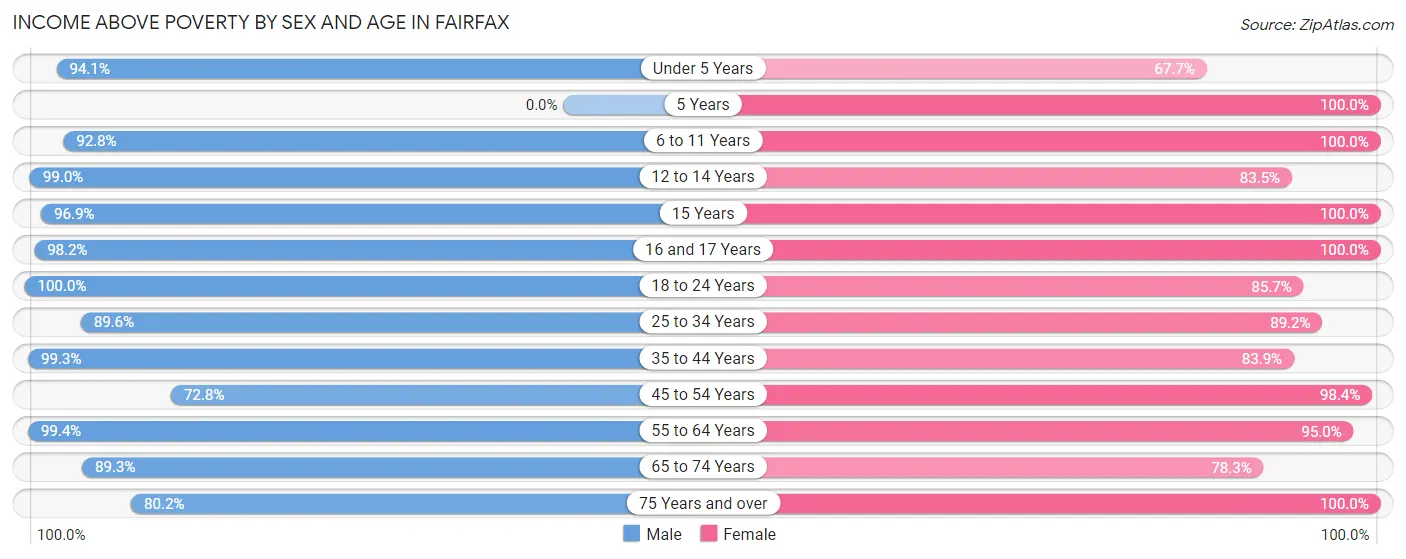
| Age Bracket | Male | Female |
| Under 5 Years | 190 (94.1%) | 128 (67.7%) |
| 5 Years | 0 (0.0%) | 28 (100.0%) |
| 6 to 11 Years | 129 (92.8%) | 183 (100.0%) |
| 12 to 14 Years | 100 (99.0%) | 66 (83.5%) |
| 15 Years | 63 (96.9%) | 124 (100.0%) |
| 16 and 17 Years | 55 (98.2%) | 95 (100.0%) |
| 18 to 24 Years | 321 (100.0%) | 222 (85.7%) |
| 25 to 34 Years | 249 (89.6%) | 379 (89.2%) |
| 35 to 44 Years | 453 (99.3%) | 318 (83.9%) |
| 45 to 54 Years | 485 (72.8%) | 741 (98.4%) |
| 55 to 64 Years | 480 (99.4%) | 624 (95.0%) |
| 65 to 74 Years | 368 (89.3%) | 425 (78.3%) |
| 75 Years and over | 312 (80.2%) | 255 (100.0%) |
| Total | 3,205 (89.8%) | 3,588 (90.4%) |
Income Below Poverty Among Married-Couple Families in Fairfax
The poverty statistics for married-couple families in Fairfax show that 0.5% or 8 of the total 1,459 families live below the poverty line. Families with 1 or 2 children have the highest poverty rate of 1.6%, comprising of 8 families. On the other hand, families with no children have the lowest poverty rate of 0.0%, which includes 0 families.
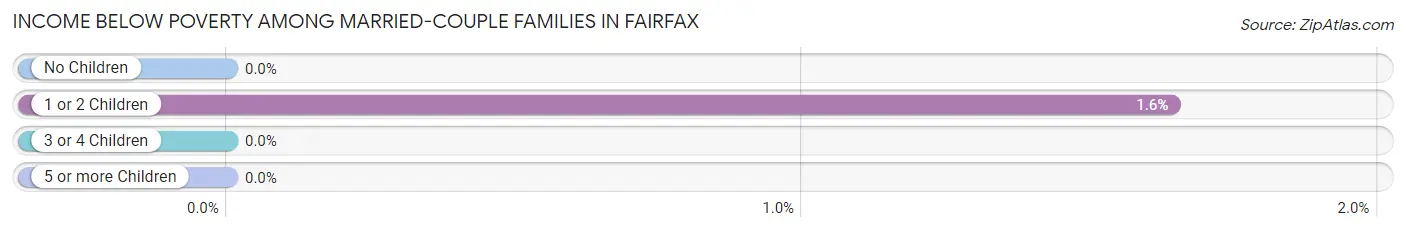
| Children | Above Poverty | Below Poverty |
| No Children | 960 (100.0%) | 0 (0.0%) |
| 1 or 2 Children | 481 (98.4%) | 8 (1.6%) |
| 3 or 4 Children | 10 (100.0%) | 0 (0.0%) |
| 5 or more Children | 0 (0.0%) | 0 (0.0%) |
| Total | 1,451 (99.5%) | 8 (0.5%) |
Income Below Poverty Among Single-Parent Households in Fairfax
According to the poverty data in Fairfax, 13.6% or 18 single-father households and 22.2% or 72 single-mother households are living below the poverty line. Among single-father households, those with no children have the highest poverty rate, with 18 households (26.5%) experiencing poverty. Likewise, among single-mother households, those with 5 or more children have the highest poverty rate, with 1 households (100.0%) falling below the poverty line.
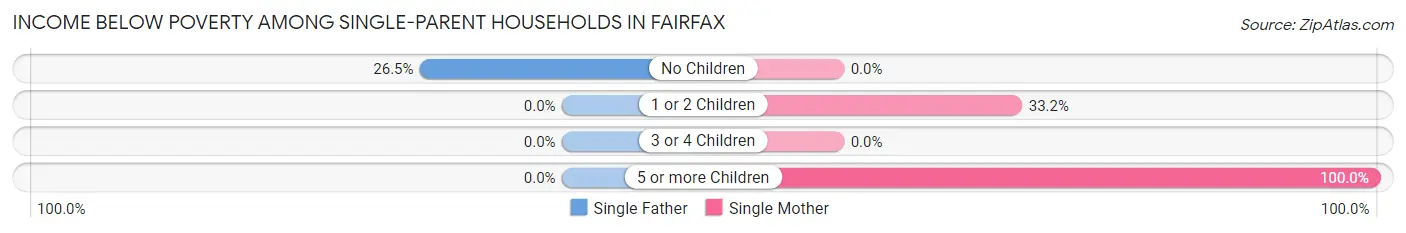
| Children | Single Father | Single Mother |
| No Children | 18 (26.5%) | 0 (0.0%) |
| 1 or 2 Children | 0 (0.0%) | 71 (33.2%) |
| 3 or 4 Children | 0 (0.0%) | 0 (0.0%) |
| 5 or more Children | 0 (0.0%) | 1 (100.0%) |
| Total | 18 (13.6%) | 72 (22.2%) |
Income Below Poverty Among Married-Couple vs Single-Parent Households in Fairfax
The poverty data for Fairfax shows that 8 of the married-couple family households (0.5%) and 90 of the single-parent households (19.7%) are living below the poverty level. Within the married-couple family households, those with 1 or 2 children have the highest poverty rate, with 8 households (1.6%) falling below the poverty line. Among the single-parent households, those with 5 or more children have the highest poverty rate, with 1 household (100.0%) living below poverty.
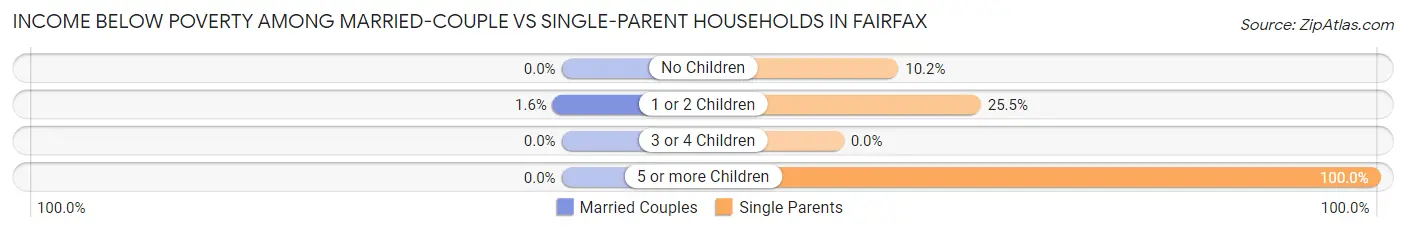
| Children | Married-Couple Families | Single-Parent Households |
| No Children | 0 (0.0%) | 18 (10.2%) |
| 1 or 2 Children | 8 (1.6%) | 71 (25.5%) |
| 3 or 4 Children | 0 (0.0%) | 0 (0.0%) |
| 5 or more Children | 0 (0.0%) | 1 (100.0%) |
| Total | 8 (0.5%) | 90 (19.7%) |
Race in Fairfax
The most populous races in Fairfax are White / Caucasian (6,418 | 84.8%), Hispanic or Latino (560 | 7.4%), and Two or more Races (476 | 6.3%).
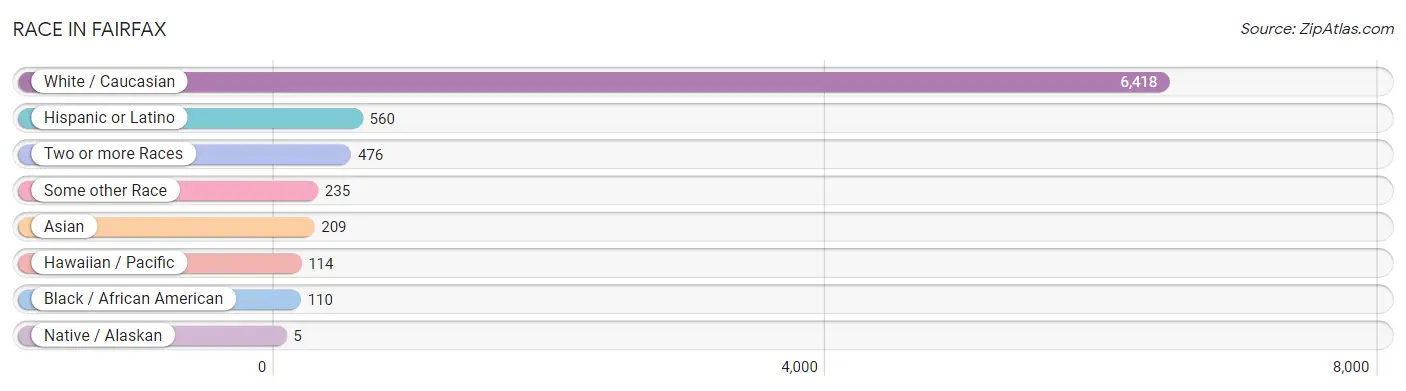
| Race | # Population | % Population |
| Asian | 209 | 2.8% |
| Black / African American | 110 | 1.5% |
| Hawaiian / Pacific | 114 | 1.5% |
| Hispanic or Latino | 560 | 7.4% |
| Native / Alaskan | 5 | 0.1% |
| White / Caucasian | 6,418 | 84.8% |
| Two or more Races | 476 | 6.3% |
| Some other Race | 235 | 3.1% |
| Total | 7,567 | 100.0% |
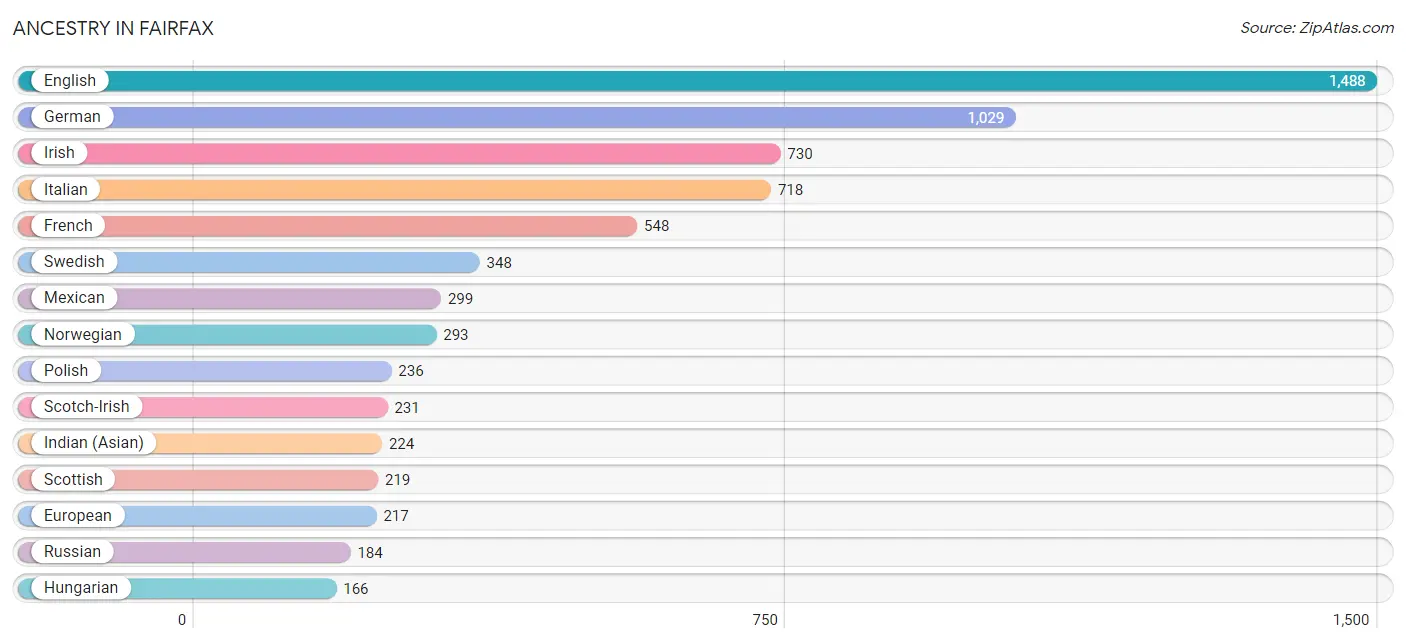
Ancestry in Fairfax
The most populous ancestries reported in Fairfax are English (1,488 | 19.7%), German (1,029 | 13.6%), Irish (730 | 9.7%), Italian (718 | 9.5%), and French (548 | 7.2%), together accounting for 59.6% of all Fairfax residents.
| Ancestry | # Population | % Population |
| American | 127 | 1.7% |
| Argentinean | 21 | 0.3% |
| Austrian | 54 | 0.7% |
| Basque | 13 | 0.2% |
| Bermudan | 35 | 0.5% |
| Bhutanese | 38 | 0.5% |
| British | 43 | 0.6% |
| Central American | 88 | 1.2% |
| Czech | 59 | 0.8% |
| Czechoslovakian | 22 | 0.3% |
| Danish | 60 | 0.8% |
| Dutch | 17 | 0.2% |
| Eastern European | 67 | 0.9% |
| English | 1,488 | 19.7% |
| European | 217 | 2.9% |
| Filipino | 30 | 0.4% |
| Finnish | 16 | 0.2% |
| French | 548 | 7.2% |
| German | 1,029 | 13.6% |
| Greek | 59 | 0.8% |
| Guatemalan | 20 | 0.3% |
| Hungarian | 166 | 2.2% |
| Indian (Asian) | 224 | 3.0% |
| Iranian | 7 | 0.1% |
| Irish | 730 | 9.7% |
| Italian | 718 | 9.5% |
| Japanese | 31 | 0.4% |
| Korean | 11 | 0.2% |
| Mexican | 299 | 4.0% |
| Native Hawaiian | 67 | 0.9% |
| Nicaraguan | 54 | 0.7% |
| Northern European | 13 | 0.2% |
| Norwegian | 293 | 3.9% |
| Pakistani | 56 | 0.7% |
| Peruvian | 47 | 0.6% |
| Polish | 236 | 3.1% |
| Portuguese | 11 | 0.2% |
| Puerto Rican | 2 | 0.0% |
| Romanian | 76 | 1.0% |
| Russian | 184 | 2.4% |
| Salvadoran | 14 | 0.2% |
| Scandinavian | 65 | 0.9% |
| Scotch-Irish | 231 | 3.0% |
| Scottish | 219 | 2.9% |
| Sioux | 5 | 0.1% |
| Slavic | 14 | 0.2% |
| South African | 38 | 0.5% |
| South American | 68 | 0.9% |
| Spaniard | 6 | 0.1% |
| Spanish | 97 | 1.3% |
| Subsaharan African | 38 | 0.5% |
| Swedish | 348 | 4.6% |
| Swiss | 87 | 1.1% |
| Thai | 12 | 0.2% |
| Ukrainian | 82 | 1.1% |
| Welsh | 96 | 1.3% | View All 56 Rows |
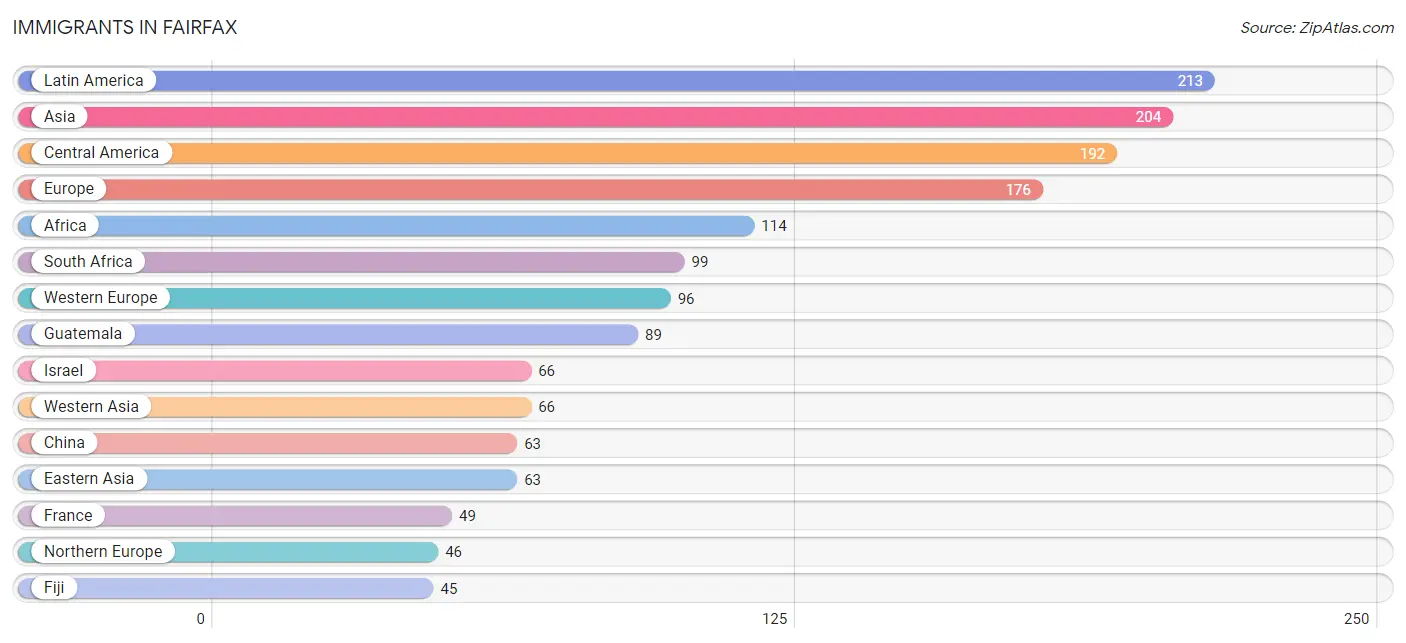
Immigrants in Fairfax
The most numerous immigrant groups reported in Fairfax came from Latin America (213 | 2.8%), Asia (204 | 2.7%), Central America (192 | 2.5%), Europe (176 | 2.3%), and Africa (114 | 1.5%), together accounting for 11.9% of all Fairfax residents.
| Immigration Origin | # Population | % Population |
| Africa | 114 | 1.5% |
| Argentina | 21 | 0.3% |
| Asia | 204 | 2.7% |
| Belarus | 10 | 0.1% |
| Cambodia | 12 | 0.2% |
| Canada | 33 | 0.4% |
| Central America | 192 | 2.5% |
| China | 63 | 0.8% |
| Eastern Africa | 15 | 0.2% |
| Eastern Asia | 63 | 0.8% |
| Eastern Europe | 10 | 0.1% |
| El Salvador | 22 | 0.3% |
| England | 29 | 0.4% |
| Europe | 176 | 2.3% |
| Fiji | 45 | 0.6% |
| France | 49 | 0.6% |
| Germany | 35 | 0.5% |
| Guatemala | 89 | 1.2% |
| Hong Kong | 43 | 0.6% |
| India | 12 | 0.2% |
| Israel | 66 | 0.9% |
| Italy | 24 | 0.3% |
| Latin America | 213 | 2.8% |
| Mexico | 43 | 0.6% |
| Nicaragua | 38 | 0.5% |
| Northern Europe | 46 | 0.6% |
| Oceania | 45 | 0.6% |
| South Africa | 99 | 1.3% |
| South America | 21 | 0.3% |
| South Central Asia | 38 | 0.5% |
| South Eastern Asia | 37 | 0.5% |
| Southern Europe | 24 | 0.3% |
| Sri Lanka | 26 | 0.3% |
| Sweden | 8 | 0.1% |
| Switzerland | 12 | 0.2% |
| Thailand | 25 | 0.3% |
| Western Asia | 66 | 0.9% |
| Western Europe | 96 | 1.3% | View All 38 Rows |
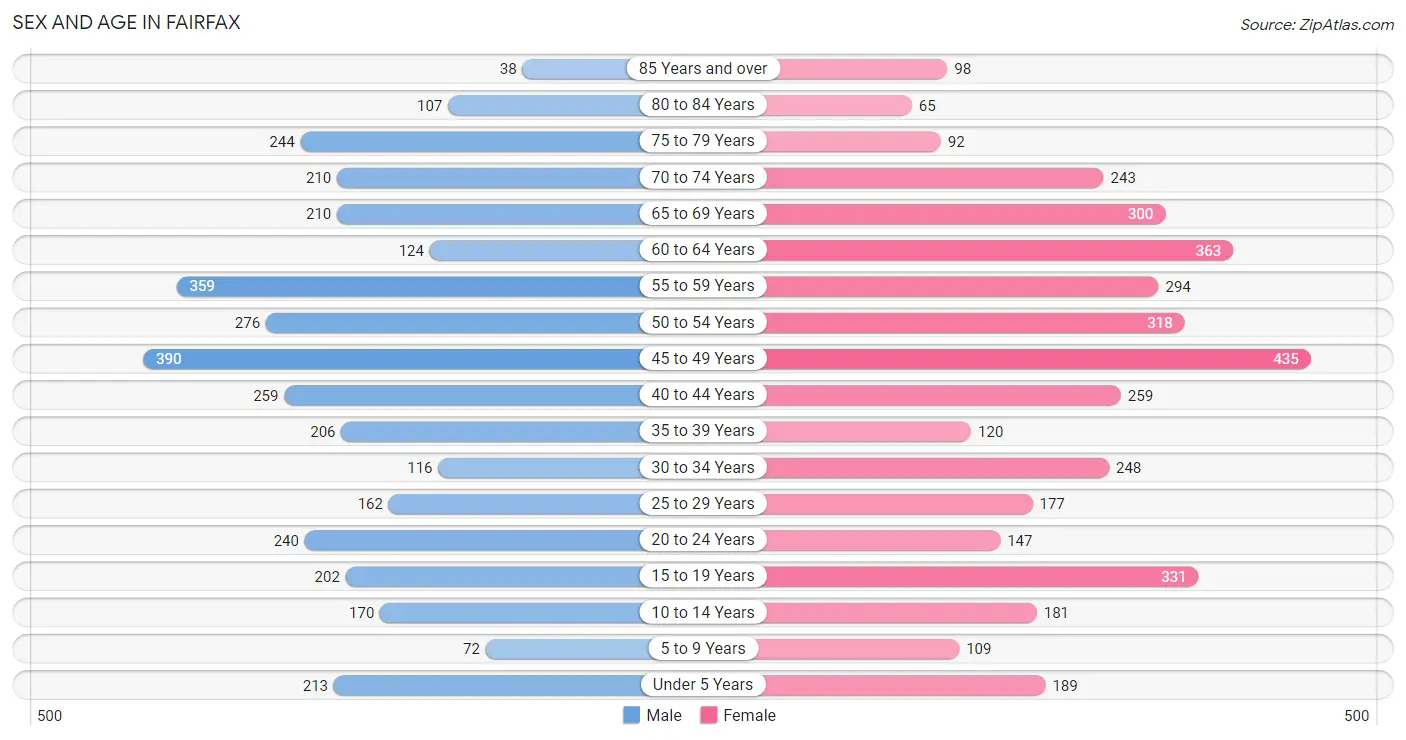
Sex and Age in Fairfax
Sex and Age in Fairfax
The most populous age groups in Fairfax are 45 to 49 Years (390 | 10.8%) for men and 45 to 49 Years (435 | 11.0%) for women.
| Age Bracket | Male | Female |
| Under 5 Years | 213 (5.9%) | 189 (4.8%) |
| 5 to 9 Years | 72 (2.0%) | 109 (2.8%) |
| 10 to 14 Years | 170 (4.7%) | 181 (4.6%) |
| 15 to 19 Years | 202 (5.6%) | 331 (8.3%) |
| 20 to 24 Years | 240 (6.7%) | 147 (3.7%) |
| 25 to 29 Years | 162 (4.5%) | 177 (4.5%) |
| 30 to 34 Years | 116 (3.2%) | 248 (6.2%) |
| 35 to 39 Years | 206 (5.7%) | 120 (3.0%) |
| 40 to 44 Years | 259 (7.2%) | 259 (6.5%) |
| 45 to 49 Years | 390 (10.8%) | 435 (11.0%) |
| 50 to 54 Years | 276 (7.7%) | 318 (8.0%) |
| 55 to 59 Years | 359 (10.0%) | 294 (7.4%) |
| 60 to 64 Years | 124 (3.5%) | 363 (9.1%) |
| 65 to 69 Years | 210 (5.8%) | 300 (7.6%) |
| 70 to 74 Years | 210 (5.8%) | 243 (6.1%) |
| 75 to 79 Years | 244 (6.8%) | 92 (2.3%) |
| 80 to 84 Years | 107 (3.0%) | 65 (1.6%) |
| 85 Years and over | 38 (1.1%) | 98 (2.5%) |
| Total | 3,598 (100.0%) | 3,969 (100.0%) |
Families and Households in Fairfax
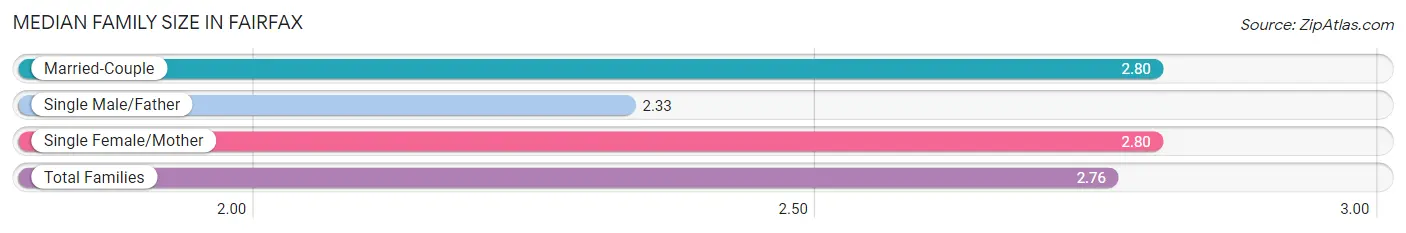
Median Family Size in Fairfax
The median family size in Fairfax is 2.76 persons per family, with married-couple families (1,459 | 76.2%) accounting for the largest median family size of 2.8 persons per family. On the other hand, single male/father families (132 | 6.9%) represent the smallest median family size with 2.33 persons per family.
| Family Type | # Families | Family Size |
| Married-Couple | 1,459 (76.2%) | 2.80 |
| Single Male/Father | 132 (6.9%) | 2.33 |
| Single Female/Mother | 324 (16.9%) | 2.80 |
| Total Families | 1,915 (100.0%) | 2.76 |
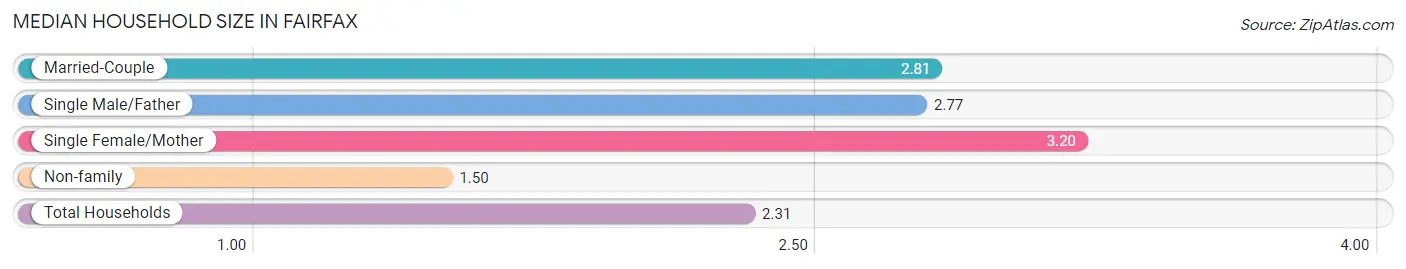
Median Household Size in Fairfax
The median household size in Fairfax is 2.31 persons per household, with single female/mother households (324 | 9.9%) accounting for the largest median household size of 3.2 persons per household. non-family households (1,344 | 41.2%) represent the smallest median household size with 1.50 persons per household.
| Household Type | # Households | Household Size |
| Married-Couple | 1,459 (44.8%) | 2.81 |
| Single Male/Father | 132 (4.1%) | 2.77 |
| Single Female/Mother | 324 (9.9%) | 3.20 |
| Non-family | 1,344 (41.2%) | 1.50 |
| Total Households | 3,259 (100.0%) | 2.31 |
Household Size by Marriage Status in Fairfax
Out of a total of 3,259 households in Fairfax, 1,915 (58.8%) are family households, while 1,344 (41.2%) are nonfamily households. The most numerous type of family households are 2-person households, comprising 971, and the most common type of nonfamily households are 1-person households, comprising 860.
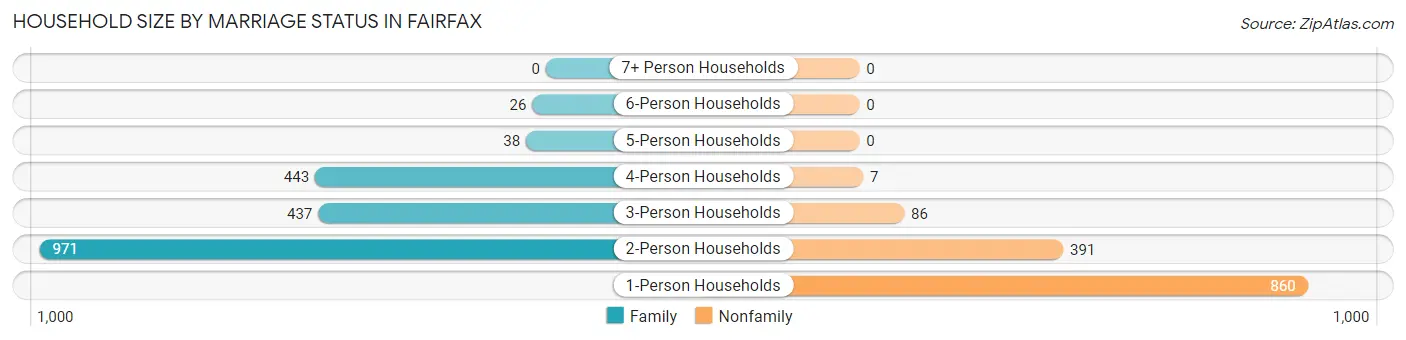
| Household Size | Family Households | Nonfamily Households |
| 1-Person Households | - | 860 (26.4%) |
| 2-Person Households | 971 (29.8%) | 391 (12.0%) |
| 3-Person Households | 437 (13.4%) | 86 (2.6%) |
| 4-Person Households | 443 (13.6%) | 7 (0.2%) |
| 5-Person Households | 38 (1.2%) | 0 (0.0%) |
| 6-Person Households | 26 (0.8%) | 0 (0.0%) |
| 7+ Person Households | 0 (0.0%) | 0 (0.0%) |
| Total | 1,915 (58.8%) | 1,344 (41.2%) |
Female Fertility in Fairfax
Fertility by Age in Fairfax
Average fertility rate in Fairfax is 114.0 births per 1,000 women. Women in the age bracket of 35 to 50 years have the highest fertility rate with 184.0 births per 1,000 women. Women in the age bracket of 35 to 50 years acount for 79.8% of all women with births.
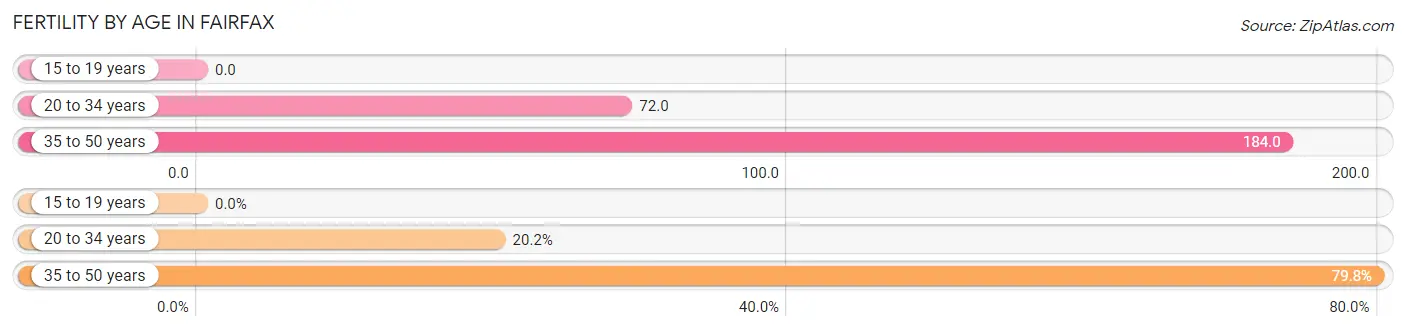
| Age Bracket | Women with Births | Births / 1,000 Women |
| 15 to 19 years | 0 (0.0%) | 0.0 |
| 20 to 34 years | 41 (20.2%) | 72.0 |
| 35 to 50 years | 162 (79.8%) | 184.0 |
| Total | 203 (100.0%) | 114.0 |
Fertility by Age by Marriage Status in Fairfax
64.0% of women with births (203) in Fairfax are married. The highest percentage of unmarried women with births falls into 35 to 50 years age bracket with 39.5% of them unmarried at the time of birth, while the lowest percentage of unmarried women with births belong to 20 to 34 years age bracket with 22.0% of them unmarried.
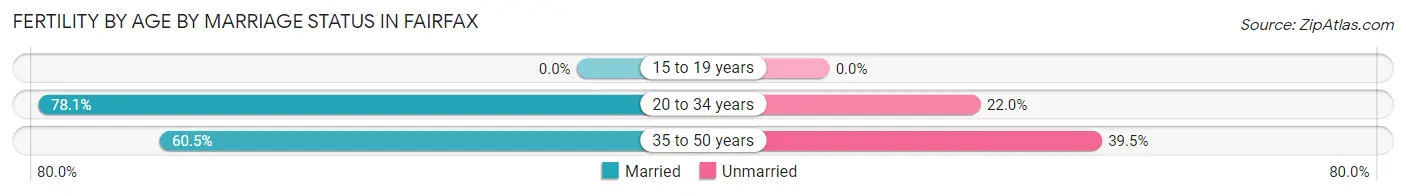
| Age Bracket | Married | Unmarried |
| 15 to 19 years | 0 (0.0%) | 0 (0.0%) |
| 20 to 34 years | 32 (78.0%) | 9 (22.0%) |
| 35 to 50 years | 98 (60.5%) | 64 (39.5%) |
| Total | 130 (64.0%) | 73 (36.0%) |
Fertility by Education in Fairfax
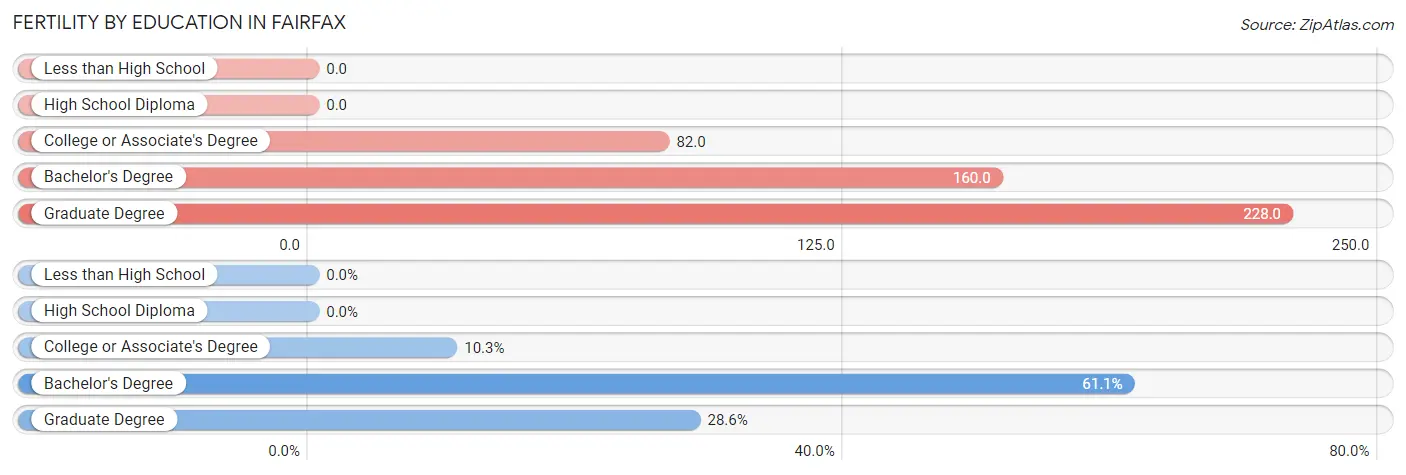
| Educational Attainment | Women with Births | Births / 1,000 Women |
| Less than High School | 0 (0.0%) | 0.0 |
| High School Diploma | 0 (0.0%) | 0.0 |
| College or Associate's Degree | 21 (10.3%) | 82.0 |
| Bachelor's Degree | 124 (61.1%) | 160.0 |
| Graduate Degree | 58 (28.6%) | 228.0 |
| Total | 203 (100.0%) | 114.0 |
Fertility by Education by Marriage Status in Fairfax
36.0% of women with births in Fairfax are unmarried. Women with the educational attainment of graduate degree are most likely to be married with 100.0% of them married at childbirth, while women with the educational attainment of college or associate's degree are least likely to be married with 100.0% of them unmarried at childbirth.
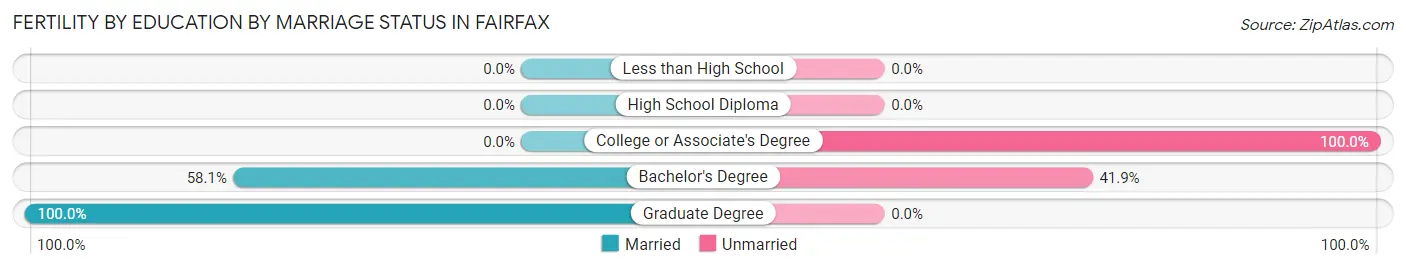
| Educational Attainment | Married | Unmarried |
| Less than High School | 0 (0.0%) | 0 (0.0%) |
| High School Diploma | 0 (0.0%) | 0 (0.0%) |
| College or Associate's Degree | 0 (0.0%) | 21 (100.0%) |
| Bachelor's Degree | 72 (58.1%) | 52 (41.9%) |
| Graduate Degree | 58 (100.0%) | 0 (0.0%) |
| Total | 130 (64.0%) | 73 (36.0%) |
Employment Characteristics in Fairfax
Employment by Class of Employer in Fairfax
Among the 3,938 employed individuals in Fairfax, private company employees (2,192 | 55.7%), self-employed (not incorporated) (707 | 17.9%), and not-for-profit organizations (465 | 11.8%) make up the most common classes of employment.
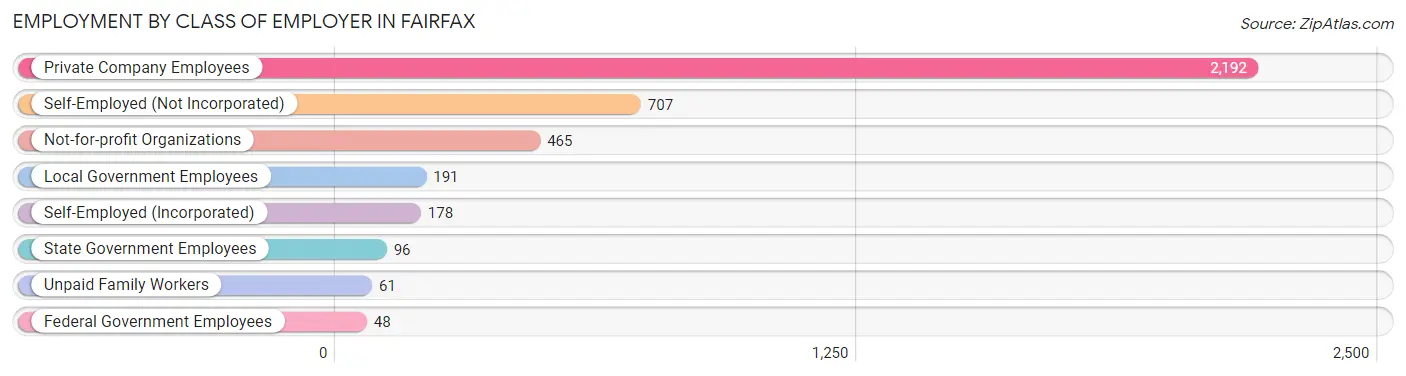
| Employer Class | # Employees | % Employees |
| Private Company Employees | 2,192 | 55.7% |
| Self-Employed (Incorporated) | 178 | 4.5% |
| Self-Employed (Not Incorporated) | 707 | 17.9% |
| Not-for-profit Organizations | 465 | 11.8% |
| Local Government Employees | 191 | 4.9% |
| State Government Employees | 96 | 2.4% |
| Federal Government Employees | 48 | 1.2% |
| Unpaid Family Workers | 61 | 1.5% |
| Total | 3,938 | 100.0% |
Employment Status by Age in Fairfax
According to the labor force statistics for Fairfax, out of the total population over 16 years of age (6,444), 71.0% or 4,575 individuals are in the labor force, with 10.8% or 494 of them unemployed. The age group with the highest labor force participation rate is 45 to 54 years, with 91.1% or 1,293 individuals in the labor force. Within the labor force, the 65 to 74 years age range has the highest percentage of unemployed individuals, with 28.9% or 116 of them being unemployed.
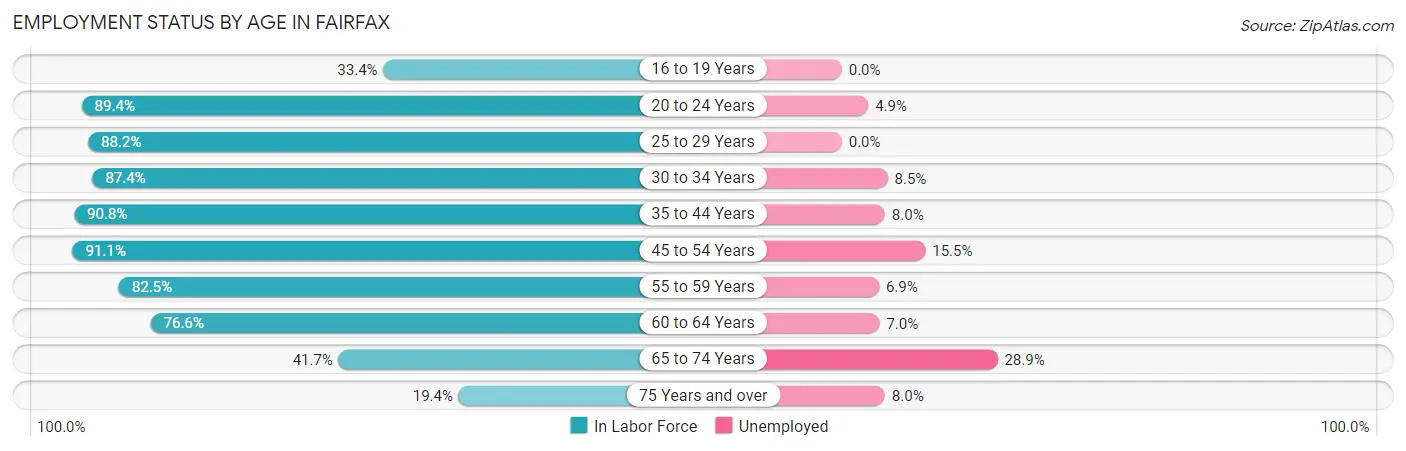
| Age Bracket | In Labor Force | Unemployed |
| 16 to 19 Years | 115 (33.4%) | 0 (0.0%) |
| 20 to 24 Years | 346 (89.4%) | 17 (4.9%) |
| 25 to 29 Years | 299 (88.2%) | 0 (0.0%) |
| 30 to 34 Years | 318 (87.4%) | 27 (8.5%) |
| 35 to 44 Years | 766 (90.8%) | 61 (8.0%) |
| 45 to 54 Years | 1,293 (91.1%) | 200 (15.5%) |
| 55 to 59 Years | 539 (82.5%) | 37 (6.9%) |
| 60 to 64 Years | 373 (76.6%) | 26 (7.0%) |
| 65 to 74 Years | 402 (41.7%) | 116 (28.9%) |
| 75 Years and over | 125 (19.4%) | 10 (8.0%) |
| Total | 4,575 (71.0%) | 494 (10.8%) |
Employment Status by Educational Attainment in Fairfax
According to labor force statistics for Fairfax, 87.4% of individuals (3,589) out of the total population between 25 and 64 years of age (4,106) are in the labor force, with 9.8% or 352 of them being unemployed. The group with the highest labor force participation rate are those with the educational attainment of college / associate degree, with 96.1% or 904 individuals in the labor force. Within the labor force, individuals with college / associate degree education have the highest percentage of unemployment, with 17.5% or 158 of them being unemployed.
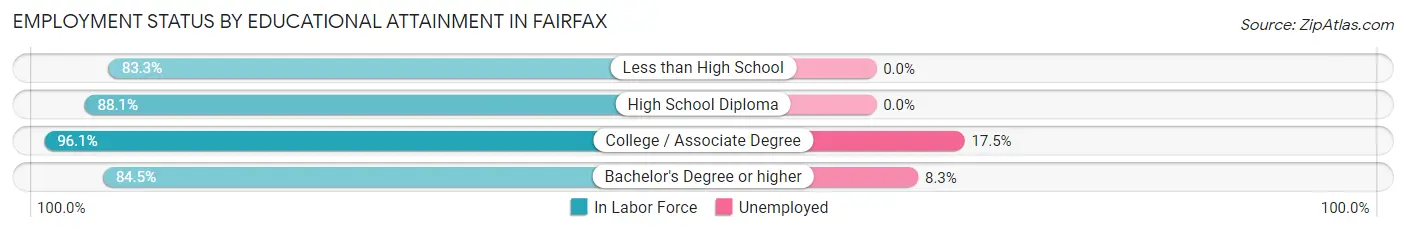
| Educational Attainment | In Labor Force | Unemployed |
| Less than High School | 90 (83.3%) | 0 (0.0%) |
| High School Diploma | 274 (88.1%) | 0 (0.0%) |
| College / Associate Degree | 904 (96.1%) | 165 (17.5%) |
| Bachelor's Degree or higher | 2,320 (84.5%) | 228 (8.3%) |
| Total | 3,589 (87.4%) | 402 (9.8%) |
Employment Occupations by Sex in Fairfax
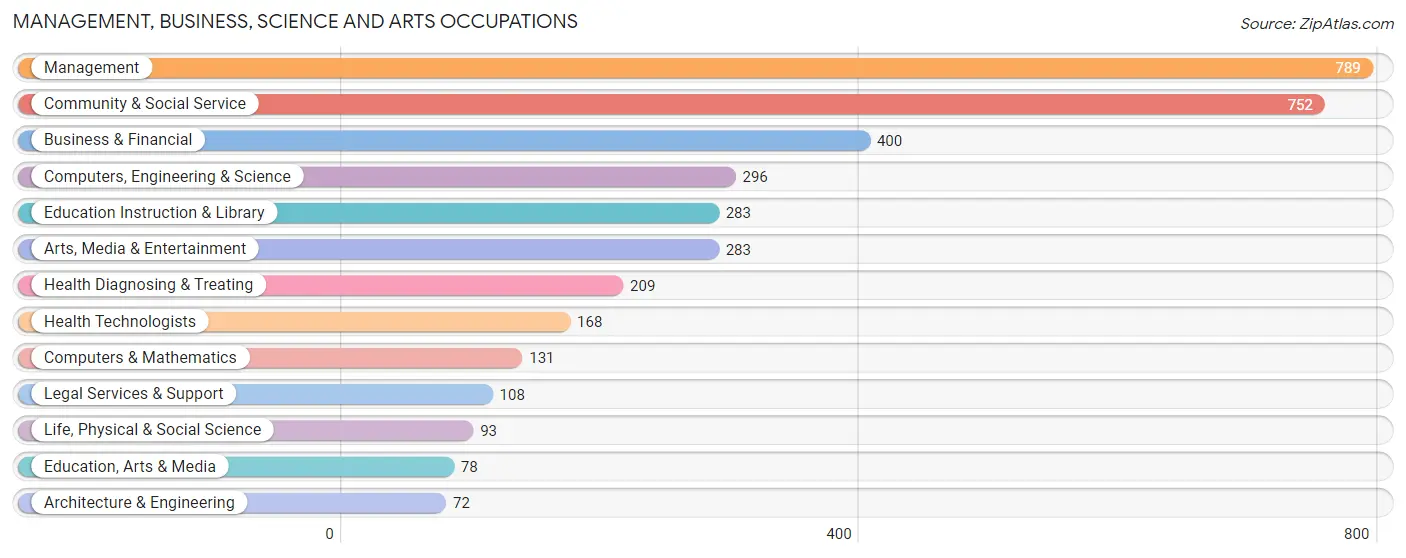
Management, Business, Science and Arts Occupations
The most common Management, Business, Science and Arts occupations in Fairfax are Management (789 | 19.3%), Community & Social Service (752 | 18.4%), Business & Financial (400 | 9.8%), Computers, Engineering & Science (296 | 7.2%), and Education Instruction & Library (283 | 6.9%).
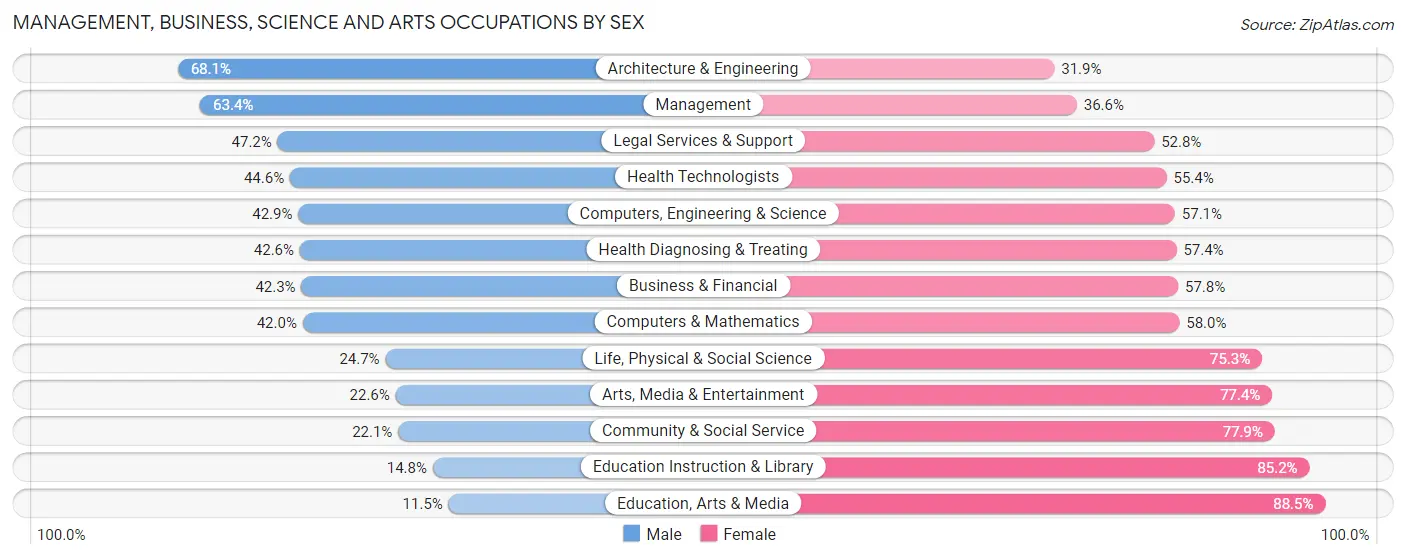
Management, Business, Science and Arts Occupations by Sex
Within the Management, Business, Science and Arts occupations in Fairfax, the most male-oriented occupations are Architecture & Engineering (68.1%), Management (63.4%), and Legal Services & Support (47.2%), while the most female-oriented occupations are Education, Arts & Media (88.5%), Education Instruction & Library (85.2%), and Community & Social Service (77.9%).
| Occupation | Male | Female |
| Management | 500 (63.4%) | 289 (36.6%) |
| Business & Financial | 169 (42.2%) | 231 (57.8%) |
| Computers, Engineering & Science | 127 (42.9%) | 169 (57.1%) |
| Computers & Mathematics | 55 (42.0%) | 76 (58.0%) |
| Architecture & Engineering | 49 (68.1%) | 23 (31.9%) |
| Life, Physical & Social Science | 23 (24.7%) | 70 (75.3%) |
| Community & Social Service | 166 (22.1%) | 586 (77.9%) |
| Education, Arts & Media | 9 (11.5%) | 69 (88.5%) |
| Legal Services & Support | 51 (47.2%) | 57 (52.8%) |
| Education Instruction & Library | 42 (14.8%) | 241 (85.2%) |
| Arts, Media & Entertainment | 64 (22.6%) | 219 (77.4%) |
| Health Diagnosing & Treating | 89 (42.6%) | 120 (57.4%) |
| Health Technologists | 75 (44.6%) | 93 (55.4%) |
| Total (Category) | 1,051 (43.0%) | 1,395 (57.0%) |
| Total (Overall) | 2,055 (50.4%) | 2,026 (49.6%) |
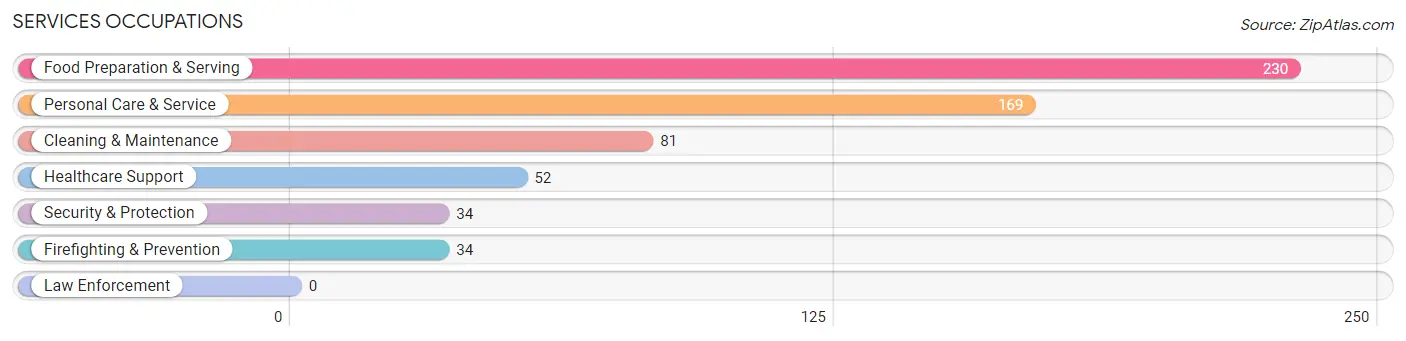
Services Occupations
The most common Services occupations in Fairfax are Food Preparation & Serving (230 | 5.6%), Personal Care & Service (169 | 4.1%), Cleaning & Maintenance (81 | 2.0%), Healthcare Support (52 | 1.3%), and Security & Protection (34 | 0.8%).
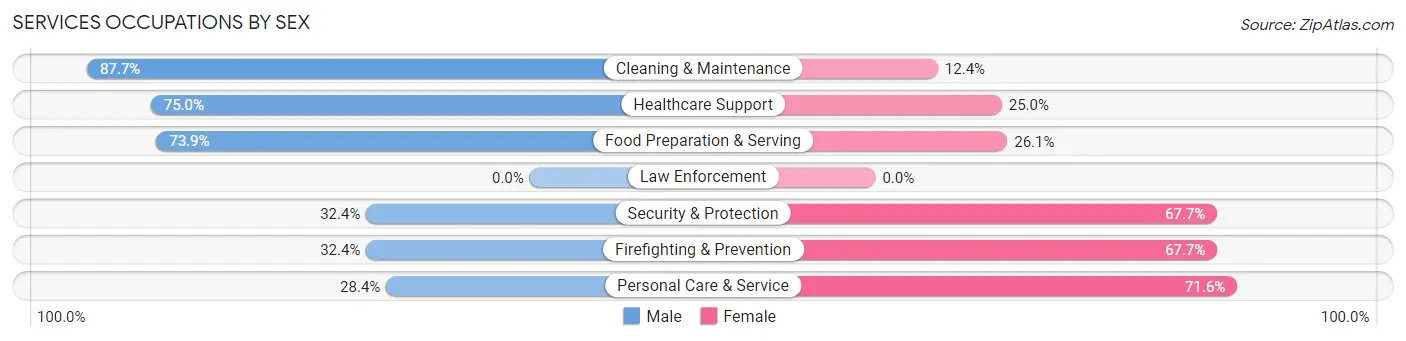
Services Occupations by Sex
Within the Services occupations in Fairfax, the most male-oriented occupations are Cleaning & Maintenance (87.6%), Healthcare Support (75.0%), and Food Preparation & Serving (73.9%), while the most female-oriented occupations are Personal Care & Service (71.6%), Security & Protection (67.6%), and Firefighting & Prevention (67.6%).
| Occupation | Male | Female |
| Healthcare Support | 39 (75.0%) | 13 (25.0%) |
| Security & Protection | 11 (32.4%) | 23 (67.6%) |
| Firefighting & Prevention | 11 (32.4%) | 23 (67.6%) |
| Law Enforcement | 0 (0.0%) | 0 (0.0%) |
| Food Preparation & Serving | 170 (73.9%) | 60 (26.1%) |
| Cleaning & Maintenance | 71 (87.6%) | 10 (12.3%) |
| Personal Care & Service | 48 (28.4%) | 121 (71.6%) |
| Total (Category) | 339 (59.9%) | 227 (40.1%) |
| Total (Overall) | 2,055 (50.4%) | 2,026 (49.6%) |
Sales and Office Occupations
The most common Sales and Office occupations in Fairfax are Sales & Related (329 | 8.1%), and Office & Administration (259 | 6.4%).
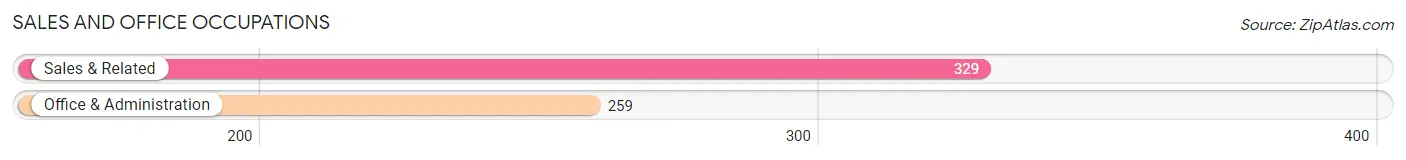
Sales and Office Occupations by Sex
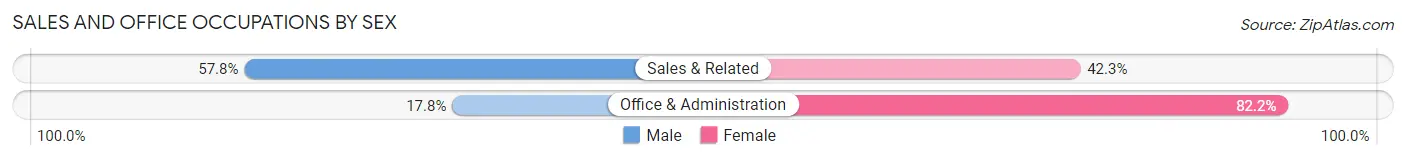
| Occupation | Male | Female |
| Sales & Related | 190 (57.8%) | 139 (42.2%) |
| Office & Administration | 46 (17.8%) | 213 (82.2%) |
| Total (Category) | 236 (40.1%) | 352 (59.9%) |
| Total (Overall) | 2,055 (50.4%) | 2,026 (49.6%) |
Natural Resources, Construction and Maintenance Occupations
The most common Natural Resources, Construction and Maintenance occupations in Fairfax are Construction & Extraction (168 | 4.1%), Installation, Maintenance & Repair (116 | 2.8%), and Farming, Fishing & Forestry (8 | 0.2%).
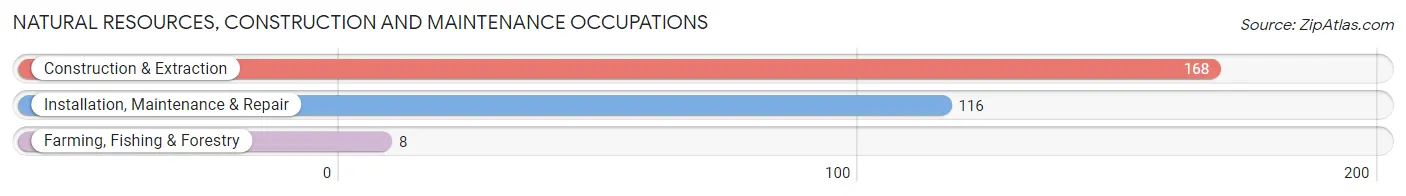
Natural Resources, Construction and Maintenance Occupations by Sex
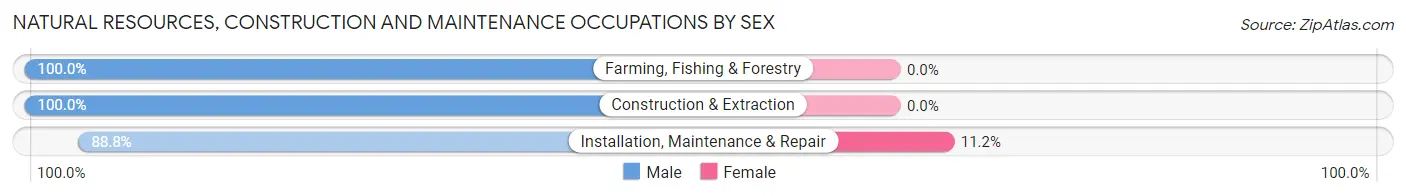
| Occupation | Male | Female |
| Farming, Fishing & Forestry | 8 (100.0%) | 0 (0.0%) |
| Construction & Extraction | 168 (100.0%) | 0 (0.0%) |
| Installation, Maintenance & Repair | 103 (88.8%) | 13 (11.2%) |
| Total (Category) | 279 (95.6%) | 13 (4.4%) |
| Total (Overall) | 2,055 (50.4%) | 2,026 (49.6%) |
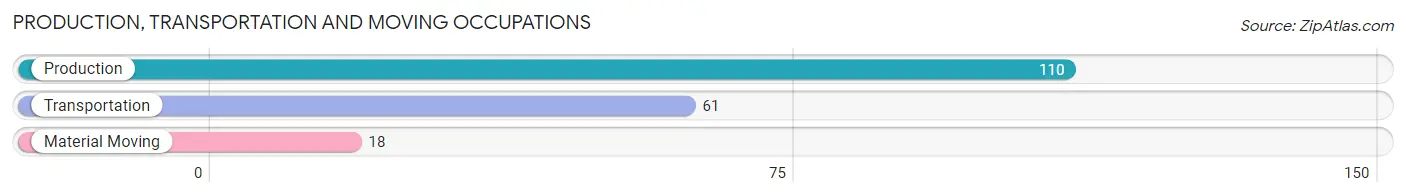
Production, Transportation and Moving Occupations
The most common Production, Transportation and Moving occupations in Fairfax are Production (110 | 2.7%), Transportation (61 | 1.5%), and Material Moving (18 | 0.4%).
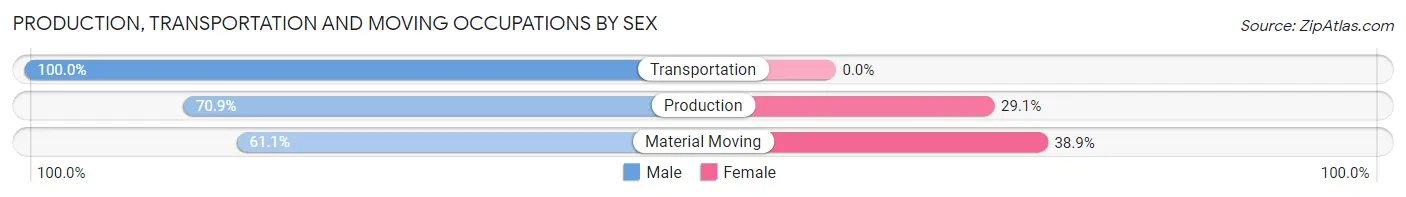
Production, Transportation and Moving Occupations by Sex
| Occupation | Male | Female |
| Production | 78 (70.9%) | 32 (29.1%) |
| Transportation | 61 (100.0%) | 0 (0.0%) |
| Material Moving | 11 (61.1%) | 7 (38.9%) |
| Total (Category) | 150 (79.4%) | 39 (20.6%) |
| Total (Overall) | 2,055 (50.4%) | 2,026 (49.6%) |
Employment Industries by Sex in Fairfax
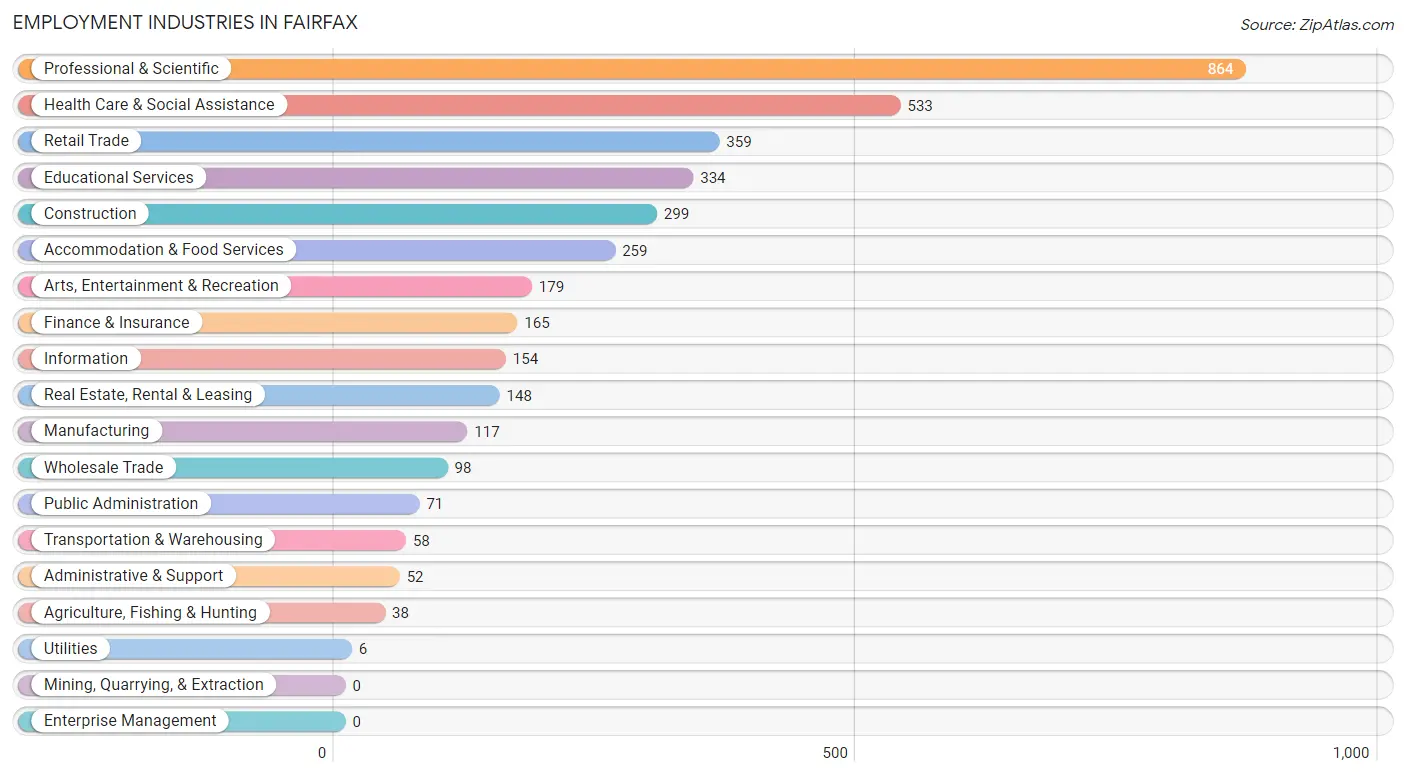
Employment Industries in Fairfax
The major employment industries in Fairfax include Professional & Scientific (864 | 21.2%), Health Care & Social Assistance (533 | 13.1%), Retail Trade (359 | 8.8%), Educational Services (334 | 8.2%), and Construction (299 | 7.3%).
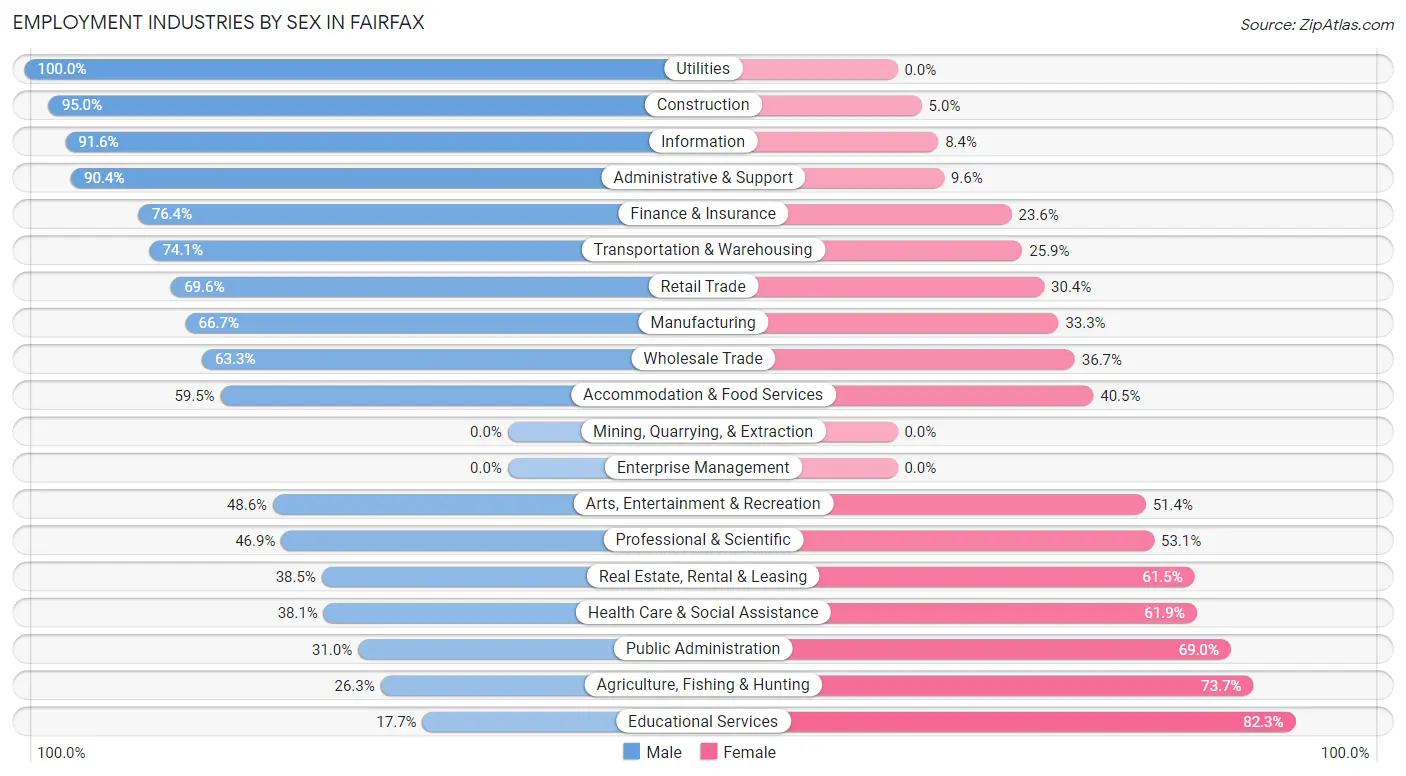
Employment Industries by Sex in Fairfax
The Fairfax industries that see more men than women are Utilities (100.0%), Construction (95.0%), and Information (91.6%), whereas the industries that tend to have a higher number of women are Educational Services (82.3%), Agriculture, Fishing & Hunting (73.7%), and Public Administration (69.0%).
| Industry | Male | Female |
| Agriculture, Fishing & Hunting | 10 (26.3%) | 28 (73.7%) |
| Mining, Quarrying, & Extraction | 0 (0.0%) | 0 (0.0%) |
| Construction | 284 (95.0%) | 15 (5.0%) |
| Manufacturing | 78 (66.7%) | 39 (33.3%) |
| Wholesale Trade | 62 (63.3%) | 36 (36.7%) |
| Retail Trade | 250 (69.6%) | 109 (30.4%) |
| Transportation & Warehousing | 43 (74.1%) | 15 (25.9%) |
| Utilities | 6 (100.0%) | 0 (0.0%) |
| Information | 141 (91.6%) | 13 (8.4%) |
| Finance & Insurance | 126 (76.4%) | 39 (23.6%) |
| Real Estate, Rental & Leasing | 57 (38.5%) | 91 (61.5%) |
| Professional & Scientific | 405 (46.9%) | 459 (53.1%) |
| Enterprise Management | 0 (0.0%) | 0 (0.0%) |
| Administrative & Support | 47 (90.4%) | 5 (9.6%) |
| Educational Services | 59 (17.7%) | 275 (82.3%) |
| Health Care & Social Assistance | 203 (38.1%) | 330 (61.9%) |
| Arts, Entertainment & Recreation | 87 (48.6%) | 92 (51.4%) |
| Accommodation & Food Services | 154 (59.5%) | 105 (40.5%) |
| Public Administration | 22 (31.0%) | 49 (69.0%) |
| Total | 2,055 (50.4%) | 2,026 (49.6%) |
Education in Fairfax
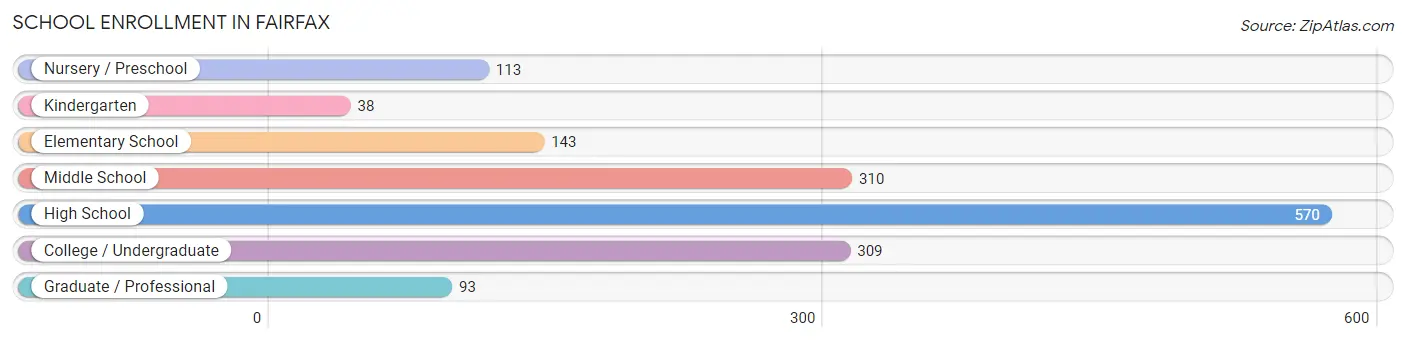
School Enrollment in Fairfax
The most common levels of schooling among the 1,576 students in Fairfax are high school (570 | 36.2%), middle school (310 | 19.7%), and college / undergraduate (309 | 19.6%).
| School Level | # Students | % Students |
| Nursery / Preschool | 113 | 7.2% |
| Kindergarten | 38 | 2.4% |
| Elementary School | 143 | 9.1% |
| Middle School | 310 | 19.7% |
| High School | 570 | 36.2% |
| College / Undergraduate | 309 | 19.6% |
| Graduate / Professional | 93 | 5.9% |
| Total | 1,576 | 100.0% |
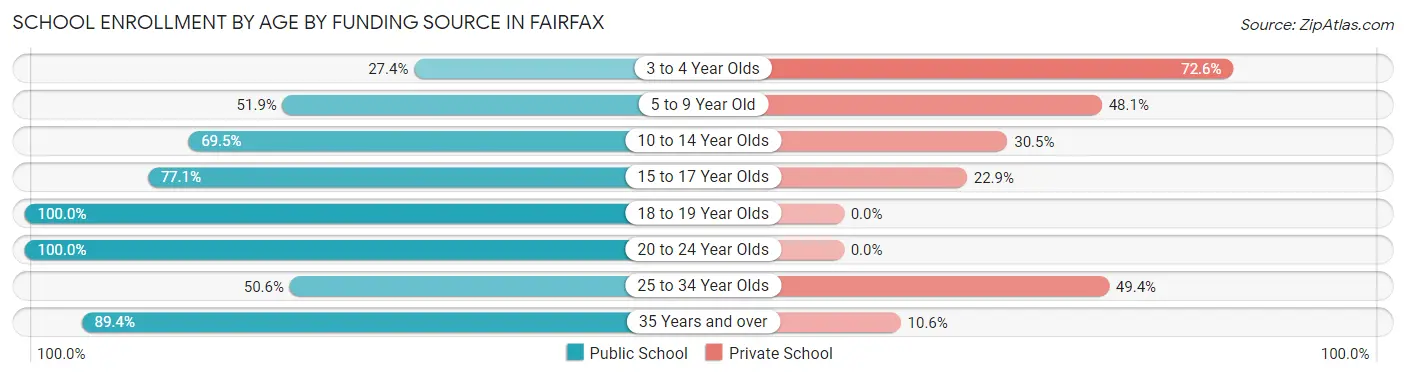
School Enrollment by Age by Funding Source in Fairfax
Out of a total of 1,576 students who are enrolled in schools in Fairfax, 410 (26.0%) attend a private institution, while the remaining 1,166 (74.0%) are enrolled in public schools. The age group of 3 to 4 year olds has the highest likelihood of being enrolled in private schools, with 82 (72.6% in the age bracket) enrolled. Conversely, the age group of 18 to 19 year olds has the lowest likelihood of being enrolled in a private school, with 189 (100.0% in the age bracket) attending a public institution.
| Age Bracket | Public School | Private School |
| 3 to 4 Year Olds | 31 (27.4%) | 82 (72.6%) |
| 5 to 9 Year Old | 94 (51.9%) | 87 (48.1%) |
| 10 to 14 Year Olds | 244 (69.5%) | 107 (30.5%) |
| 15 to 17 Year Olds | 262 (77.1%) | 78 (22.9%) |
| 18 to 19 Year Olds | 189 (100.0%) | 0 (0.0%) |
| 20 to 24 Year Olds | 187 (100.0%) | 0 (0.0%) |
| 25 to 34 Year Olds | 42 (50.6%) | 41 (49.4%) |
| 35 Years and over | 118 (89.4%) | 14 (10.6%) |
| Total | 1,166 (74.0%) | 410 (26.0%) |
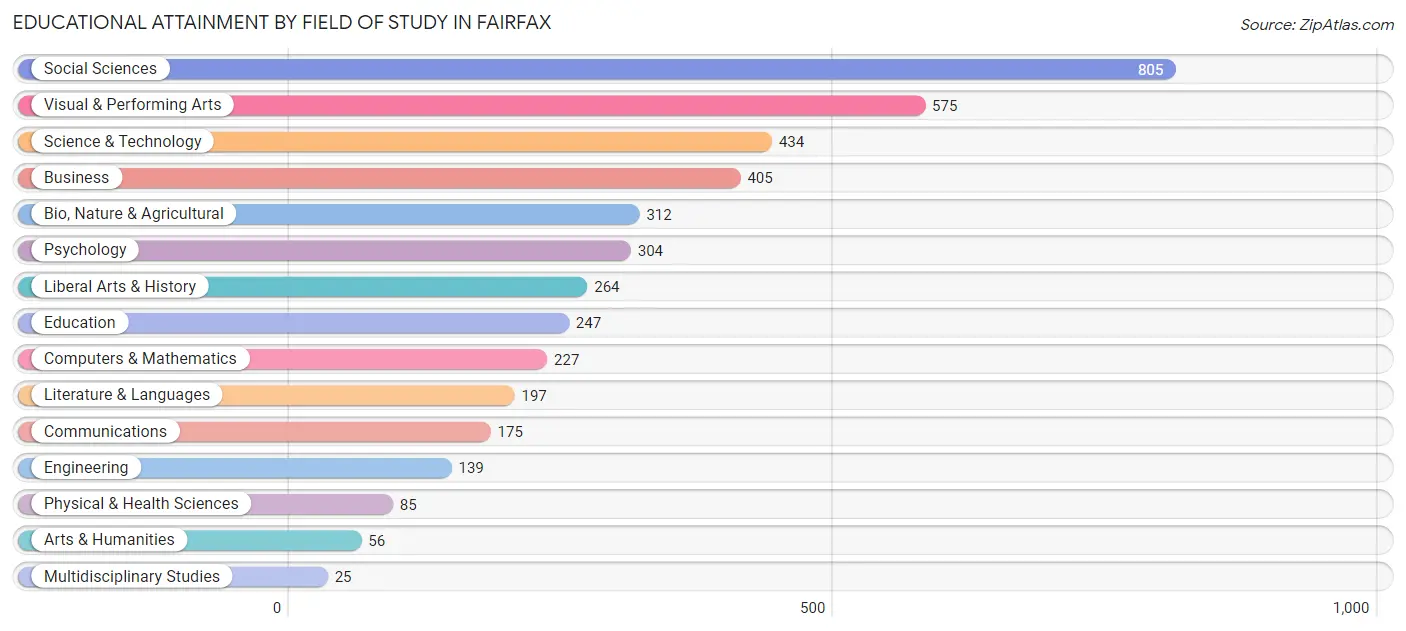
Educational Attainment by Field of Study in Fairfax
Social sciences (805 | 18.9%), visual & performing arts (575 | 13.5%), science & technology (434 | 10.2%), business (405 | 9.5%), and bio, nature & agricultural (312 | 7.3%) are the most common fields of study among 4,250 individuals in Fairfax who have obtained a bachelor's degree or higher.
| Field of Study | # Graduates | % Graduates |
| Computers & Mathematics | 227 | 5.3% |
| Bio, Nature & Agricultural | 312 | 7.3% |
| Physical & Health Sciences | 85 | 2.0% |
| Psychology | 304 | 7.1% |
| Social Sciences | 805 | 18.9% |
| Engineering | 139 | 3.3% |
| Multidisciplinary Studies | 25 | 0.6% |
| Science & Technology | 434 | 10.2% |
| Business | 405 | 9.5% |
| Education | 247 | 5.8% |
| Literature & Languages | 197 | 4.6% |
| Liberal Arts & History | 264 | 6.2% |
| Visual & Performing Arts | 575 | 13.5% |
| Communications | 175 | 4.1% |
| Arts & Humanities | 56 | 1.3% |
| Total | 4,250 | 100.0% |
Transportation & Commute in Fairfax
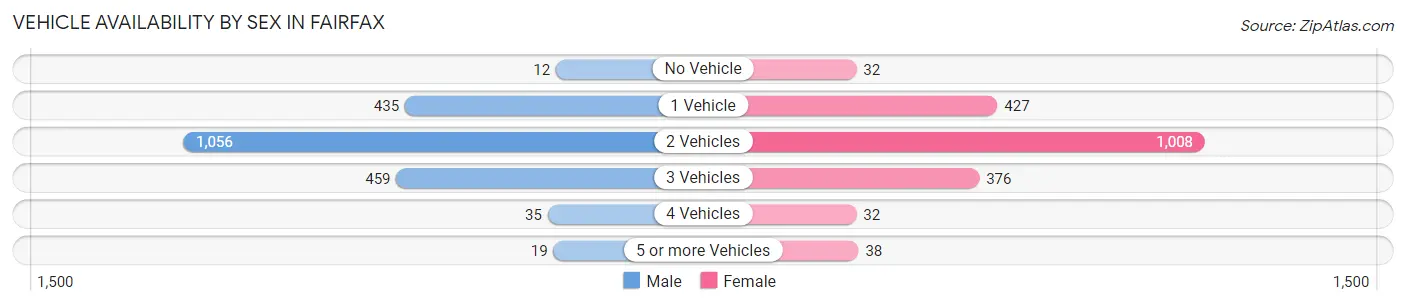
Vehicle Availability by Sex in Fairfax
The most prevalent vehicle ownership categories in Fairfax are males with 2 vehicles (1,056, accounting for 52.4%) and females with 2 vehicles (1,008, making up 55.2%).
| Vehicles Available | Male | Female |
| No Vehicle | 12 (0.6%) | 32 (1.7%) |
| 1 Vehicle | 435 (21.6%) | 427 (22.3%) |
| 2 Vehicles | 1,056 (52.4%) | 1,008 (52.7%) |
| 3 Vehicles | 459 (22.8%) | 376 (19.7%) |
| 4 Vehicles | 35 (1.7%) | 32 (1.7%) |
| 5 or more Vehicles | 19 (0.9%) | 38 (2.0%) |
| Total | 2,016 (100.0%) | 1,913 (100.0%) |
Commute Time in Fairfax
The most frequently occuring commute durations in Fairfax are 60 to 89 minutes (426 commuters, 16.2%), 20 to 24 minutes (324 commuters, 12.3%), and 30 to 34 minutes (290 commuters, 11.0%).
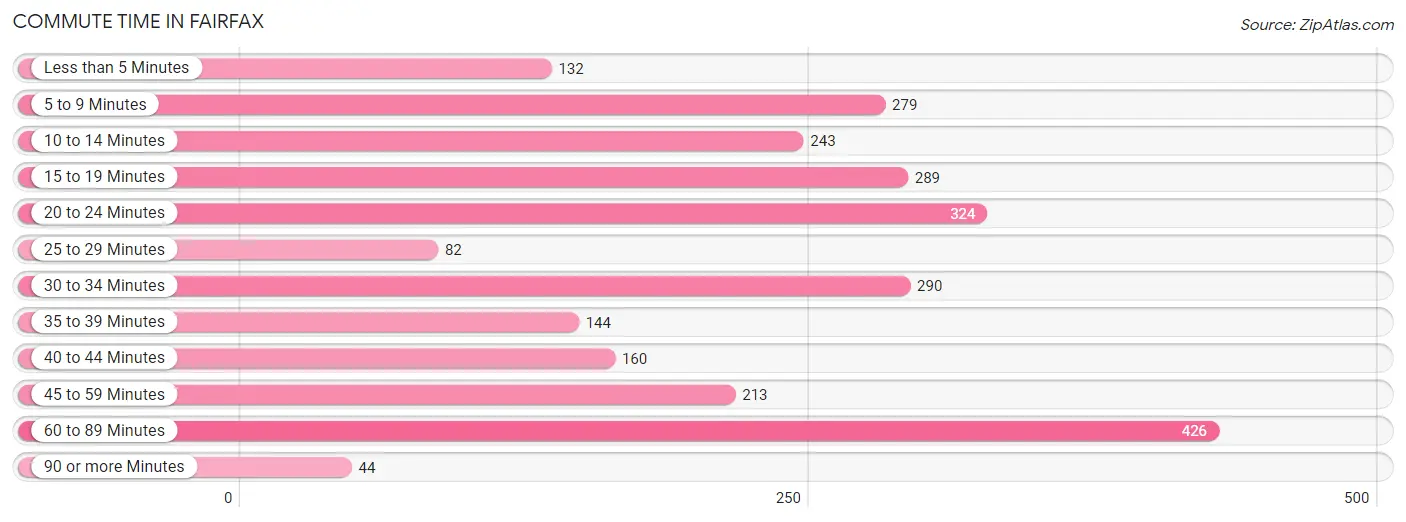
| Commute Time | # Commuters | % Commuters |
| Less than 5 Minutes | 132 | 5.0% |
| 5 to 9 Minutes | 279 | 10.6% |
| 10 to 14 Minutes | 243 | 9.2% |
| 15 to 19 Minutes | 289 | 11.0% |
| 20 to 24 Minutes | 324 | 12.3% |
| 25 to 29 Minutes | 82 | 3.1% |
| 30 to 34 Minutes | 290 | 11.0% |
| 35 to 39 Minutes | 144 | 5.5% |
| 40 to 44 Minutes | 160 | 6.1% |
| 45 to 59 Minutes | 213 | 8.1% |
| 60 to 89 Minutes | 426 | 16.2% |
| 90 or more Minutes | 44 | 1.7% |
Commute Time by Sex in Fairfax
The most common commute times in Fairfax are 60 to 89 minutes (350 commuters, 25.6%) for males and 15 to 19 minutes (263 commuters, 20.9%) for females.
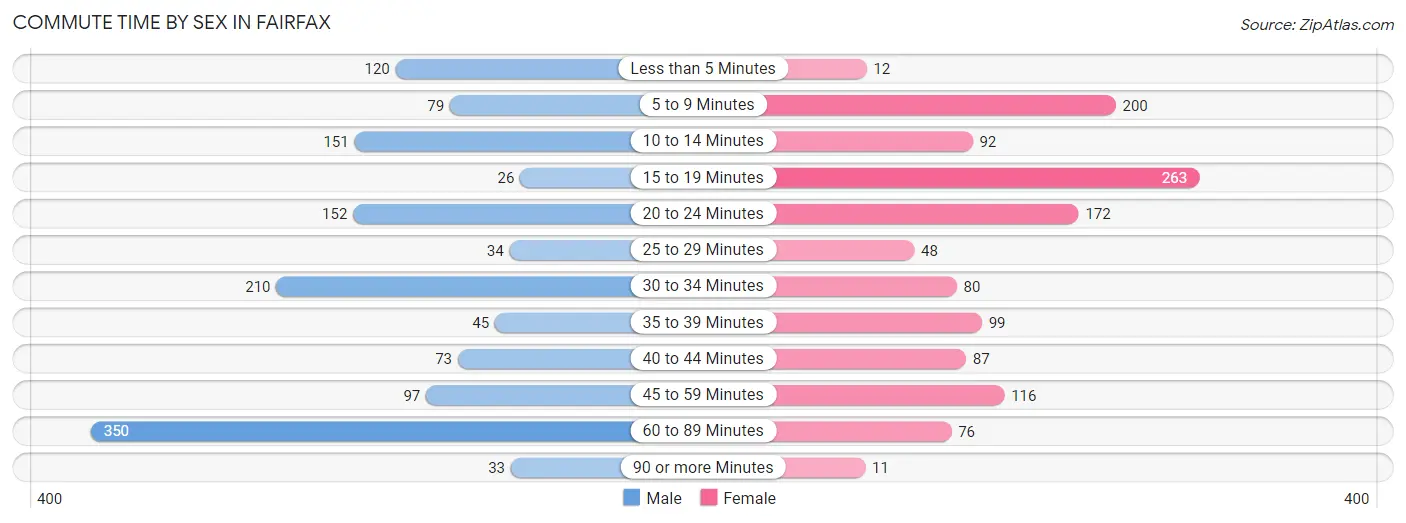
| Commute Time | Male | Female |
| Less than 5 Minutes | 120 (8.8%) | 12 (1.0%) |
| 5 to 9 Minutes | 79 (5.8%) | 200 (15.9%) |
| 10 to 14 Minutes | 151 (11.0%) | 92 (7.3%) |
| 15 to 19 Minutes | 26 (1.9%) | 263 (20.9%) |
| 20 to 24 Minutes | 152 (11.1%) | 172 (13.7%) |
| 25 to 29 Minutes | 34 (2.5%) | 48 (3.8%) |
| 30 to 34 Minutes | 210 (15.3%) | 80 (6.4%) |
| 35 to 39 Minutes | 45 (3.3%) | 99 (7.9%) |
| 40 to 44 Minutes | 73 (5.3%) | 87 (6.9%) |
| 45 to 59 Minutes | 97 (7.1%) | 116 (9.2%) |
| 60 to 89 Minutes | 350 (25.6%) | 76 (6.0%) |
| 90 or more Minutes | 33 (2.4%) | 11 (0.9%) |
Time of Departure to Work by Sex in Fairfax
The most frequent times of departure to work in Fairfax are 8:00 AM to 8:29 AM (200, 14.6%) for males and 8:00 AM to 8:29 AM (271, 21.6%) for females.
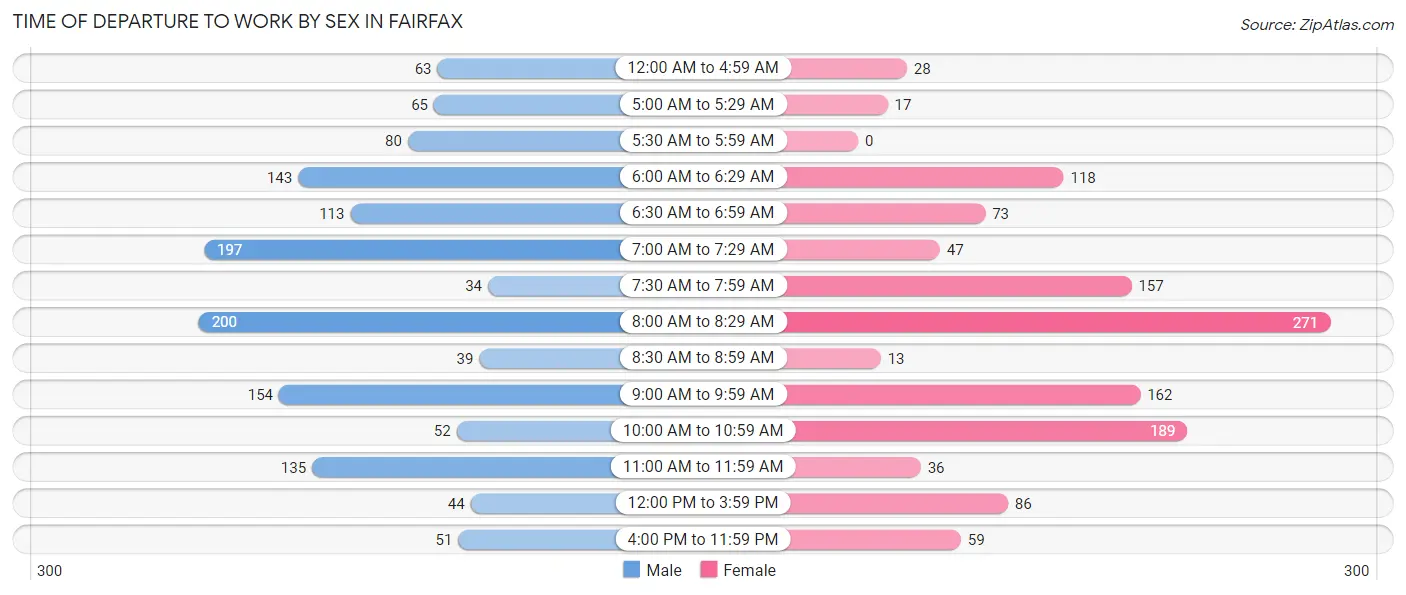
| Time of Departure | Male | Female |
| 12:00 AM to 4:59 AM | 63 (4.6%) | 28 (2.2%) |
| 5:00 AM to 5:29 AM | 65 (4.7%) | 17 (1.3%) |
| 5:30 AM to 5:59 AM | 80 (5.8%) | 0 (0.0%) |
| 6:00 AM to 6:29 AM | 143 (10.4%) | 118 (9.4%) |
| 6:30 AM to 6:59 AM | 113 (8.3%) | 73 (5.8%) |
| 7:00 AM to 7:29 AM | 197 (14.4%) | 47 (3.7%) |
| 7:30 AM to 7:59 AM | 34 (2.5%) | 157 (12.5%) |
| 8:00 AM to 8:29 AM | 200 (14.6%) | 271 (21.6%) |
| 8:30 AM to 8:59 AM | 39 (2.9%) | 13 (1.0%) |
| 9:00 AM to 9:59 AM | 154 (11.2%) | 162 (12.9%) |
| 10:00 AM to 10:59 AM | 52 (3.8%) | 189 (15.0%) |
| 11:00 AM to 11:59 AM | 135 (9.9%) | 36 (2.9%) |
| 12:00 PM to 3:59 PM | 44 (3.2%) | 86 (6.9%) |
| 4:00 PM to 11:59 PM | 51 (3.7%) | 59 (4.7%) |
| Total | 1,370 (100.0%) | 1,256 (100.0%) |
Housing Occupancy in Fairfax
Occupancy by Ownership in Fairfax
Of the total 486 dwellings in Fairfax, owner-occupied units account for 335 (68.9%), while renter-occupied units make up 151 (31.1%).
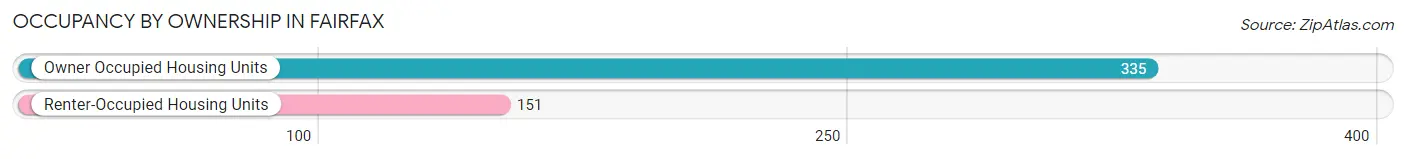
| Occupancy | # Housing Units | % Housing Units |
| Owner Occupied Housing Units | 335 | 68.9% |
| Renter-Occupied Housing Units | 151 | 31.1% |
| Total Occupied Housing Units | 486 | 100.0% |
Occupancy by Household Size in Fairfax
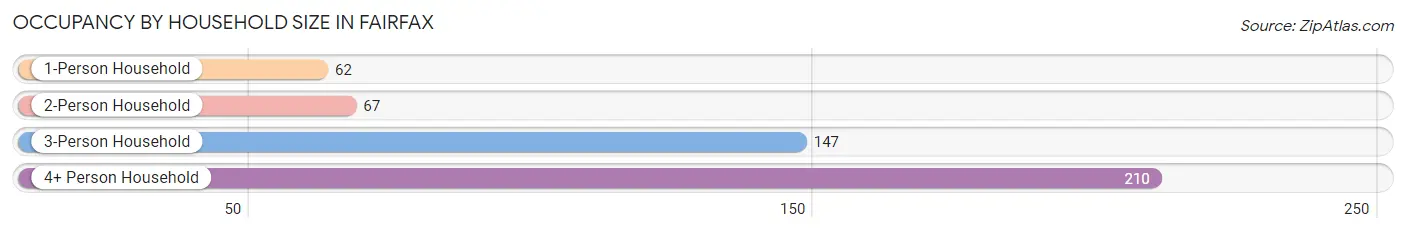
| Household Size | # Housing Units | % Housing Units |
| 1-Person Household | 62 | 12.8% |
| 2-Person Household | 67 | 13.8% |
| 3-Person Household | 147 | 30.2% |
| 4+ Person Household | 210 | 43.2% |
| Total Housing Units | 486 | 100.0% |
Occupancy by Ownership by Household Size in Fairfax
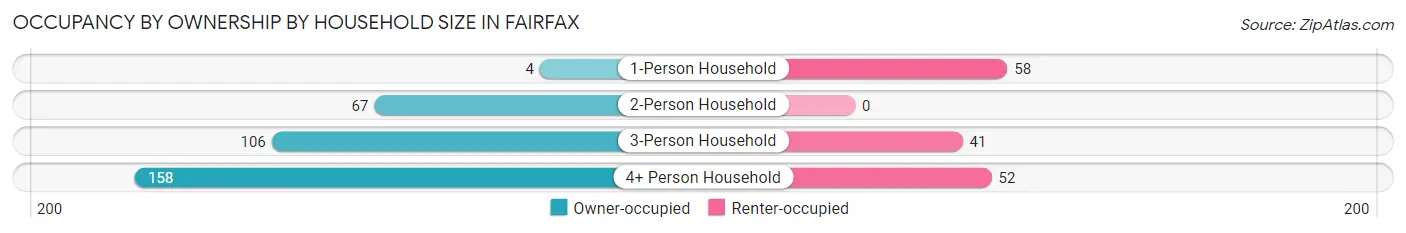
| Household Size | Owner-occupied | Renter-occupied |
| 1-Person Household | 4 (6.5%) | 58 (93.5%) |
| 2-Person Household | 67 (100.0%) | 0 (0.0%) |
| 3-Person Household | 106 (72.1%) | 41 (27.9%) |
| 4+ Person Household | 158 (75.2%) | 52 (24.8%) |
| Total Housing Units | 335 (68.9%) | 151 (31.1%) |
Occupancy by Educational Attainment in Fairfax
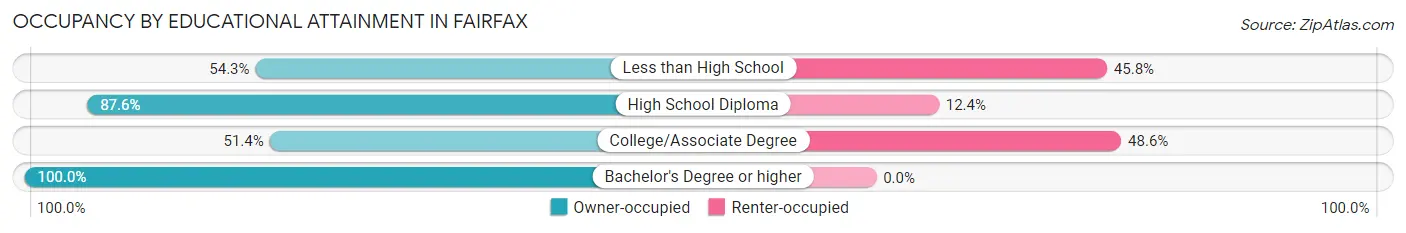
| Household Size | Owner-occupied | Renter-occupied |
| Less than High School | 115 (54.2%) | 97 (45.8%) |
| High School Diploma | 141 (87.6%) | 20 (12.4%) |
| College/Associate Degree | 36 (51.4%) | 34 (48.6%) |
| Bachelor's Degree or higher | 43 (100.0%) | 0 (0.0%) |
Occupancy by Age of Householder in Fairfax
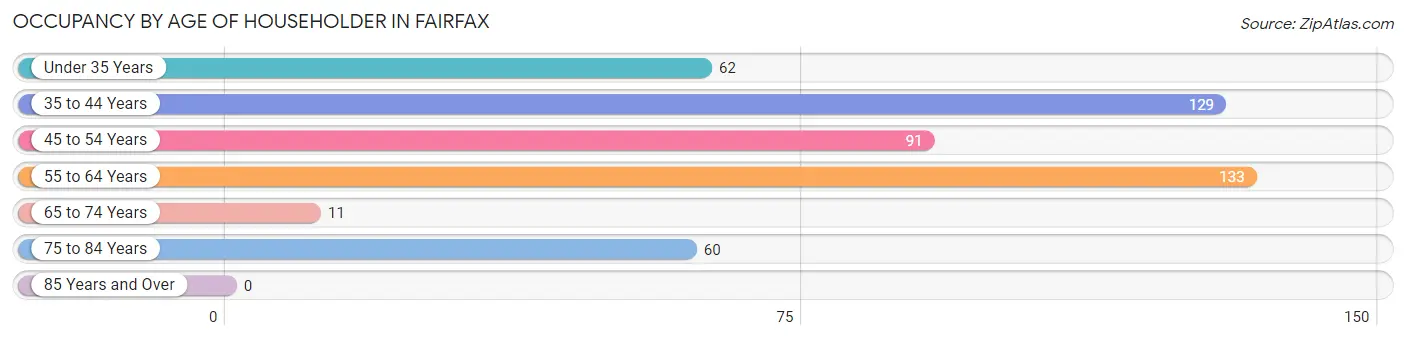
| Age Bracket | # Households | % Households |
| Under 35 Years | 62 | 12.8% |
| 35 to 44 Years | 129 | 26.5% |
| 45 to 54 Years | 91 | 18.7% |
| 55 to 64 Years | 133 | 27.4% |
| 65 to 74 Years | 11 | 2.3% |
| 75 to 84 Years | 60 | 12.3% |
| 85 Years and Over | 0 | 0.0% |
| Total | 486 | 100.0% |
Housing Finances in Fairfax
Median Income by Occupancy in Fairfax
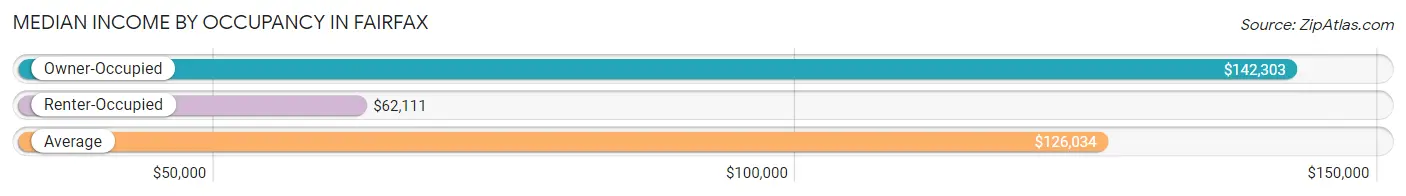
| Occupancy Type | # Households | Median Income |
| Owner-Occupied | 2,074 (63.6%) | $142,303 |
| Renter-Occupied | 1,185 (36.4%) | $62,111 |
| Average | 3,259 (100.0%) | $126,034 |
Occupancy by Householder Income Bracket in Fairfax
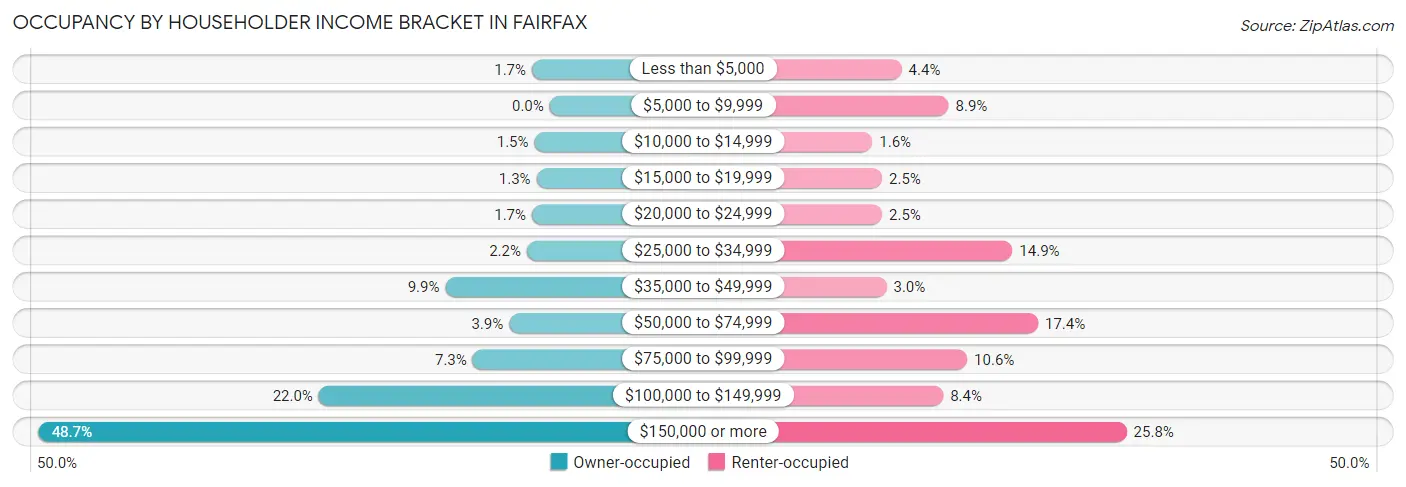
| Income Bracket | Owner-occupied | Renter-occupied |
| Less than $5,000 | 35 (1.7%) | 52 (4.4%) |
| $5,000 to $9,999 | 0 (0.0%) | 105 (8.9%) |
| $10,000 to $14,999 | 30 (1.5%) | 19 (1.6%) |
| $15,000 to $19,999 | 26 (1.3%) | 30 (2.5%) |
| $20,000 to $24,999 | 35 (1.7%) | 30 (2.5%) |
| $25,000 to $34,999 | 45 (2.2%) | 177 (14.9%) |
| $35,000 to $49,999 | 206 (9.9%) | 35 (2.9%) |
| $50,000 to $74,999 | 80 (3.9%) | 206 (17.4%) |
| $75,000 to $99,999 | 152 (7.3%) | 126 (10.6%) |
| $100,000 to $149,999 | 456 (22.0%) | 99 (8.4%) |
| $150,000 or more | 1,009 (48.6%) | 306 (25.8%) |
| Total | 2,074 (100.0%) | 1,185 (100.0%) |
Monthly Housing Cost Tiers in Fairfax
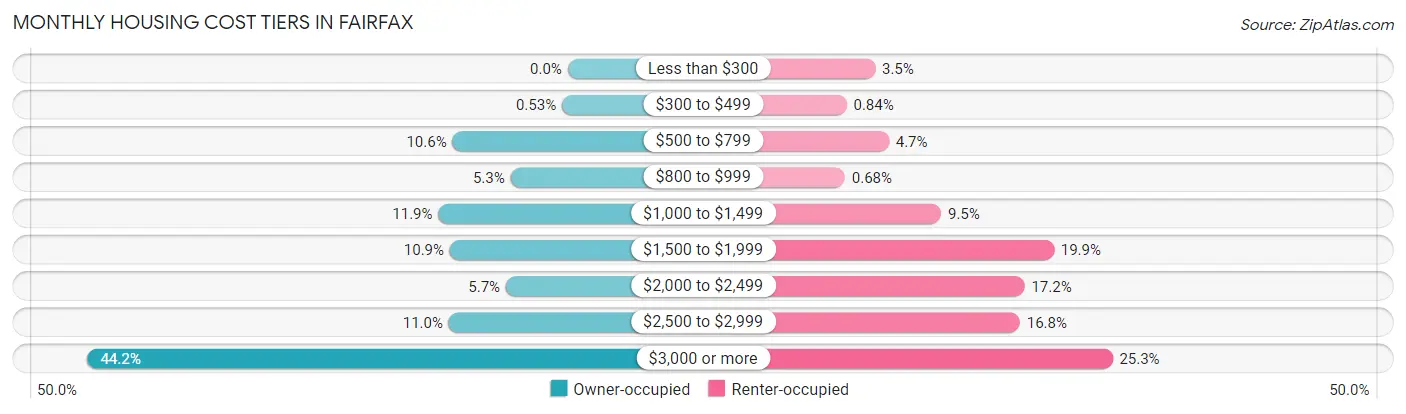
| Monthly Cost | Owner-occupied | Renter-occupied |
| Less than $300 | 0 (0.0%) | 41 (3.5%) |
| $300 to $499 | 11 (0.5%) | 10 (0.8%) |
| $500 to $799 | 220 (10.6%) | 56 (4.7%) |
| $800 to $999 | 109 (5.3%) | 8 (0.7%) |
| $1,000 to $1,499 | 247 (11.9%) | 113 (9.5%) |
| $1,500 to $1,999 | 225 (10.8%) | 236 (19.9%) |
| $2,000 to $2,499 | 118 (5.7%) | 204 (17.2%) |
| $2,500 to $2,999 | 227 (11.0%) | 199 (16.8%) |
| $3,000 or more | 917 (44.2%) | 300 (25.3%) |
| Total | 2,074 (100.0%) | 1,185 (100.0%) |
Physical Housing Characteristics in Fairfax
Housing Structures in Fairfax
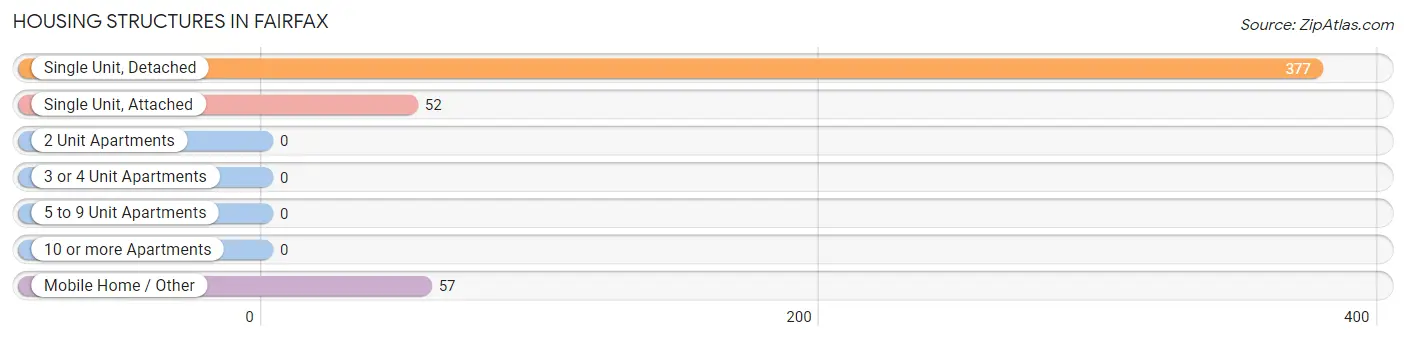
| Structure Type | # Housing Units | % Housing Units |
| Single Unit, Detached | 377 | 77.6% |
| Single Unit, Attached | 52 | 10.7% |
| 2 Unit Apartments | 0 | 0.0% |
| 3 or 4 Unit Apartments | 0 | 0.0% |
| 5 to 9 Unit Apartments | 0 | 0.0% |
| 10 or more Apartments | 0 | 0.0% |
| Mobile Home / Other | 57 | 11.7% |
| Total | 486 | 100.0% |
Housing Structures by Occupancy in Fairfax
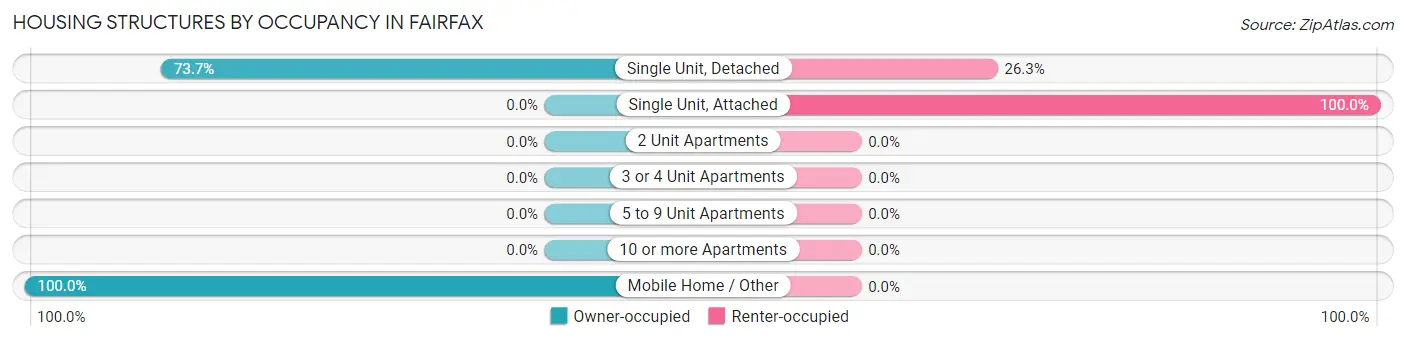
| Structure Type | Owner-occupied | Renter-occupied |
| Single Unit, Detached | 278 (73.7%) | 99 (26.3%) |
| Single Unit, Attached | 0 (0.0%) | 52 (100.0%) |
| 2 Unit Apartments | 0 (0.0%) | 0 (0.0%) |
| 3 or 4 Unit Apartments | 0 (0.0%) | 0 (0.0%) |
| 5 to 9 Unit Apartments | 0 (0.0%) | 0 (0.0%) |
| 10 or more Apartments | 0 (0.0%) | 0 (0.0%) |
| Mobile Home / Other | 57 (100.0%) | 0 (0.0%) |
| Total | 335 (68.9%) | 151 (31.1%) |
Housing Structures by Number of Rooms in Fairfax
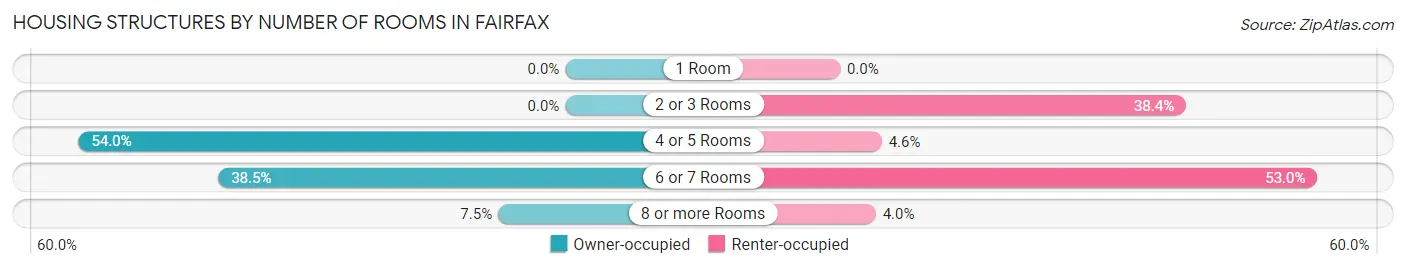
| Number of Rooms | Owner-occupied | Renter-occupied |
| 1 Room | 0 (0.0%) | 0 (0.0%) |
| 2 or 3 Rooms | 0 (0.0%) | 58 (38.4%) |
| 4 or 5 Rooms | 181 (54.0%) | 7 (4.6%) |
| 6 or 7 Rooms | 129 (38.5%) | 80 (53.0%) |
| 8 or more Rooms | 25 (7.5%) | 6 (4.0%) |
| Total | 335 (100.0%) | 151 (100.0%) |
Housing Structure by Heating Type in Fairfax
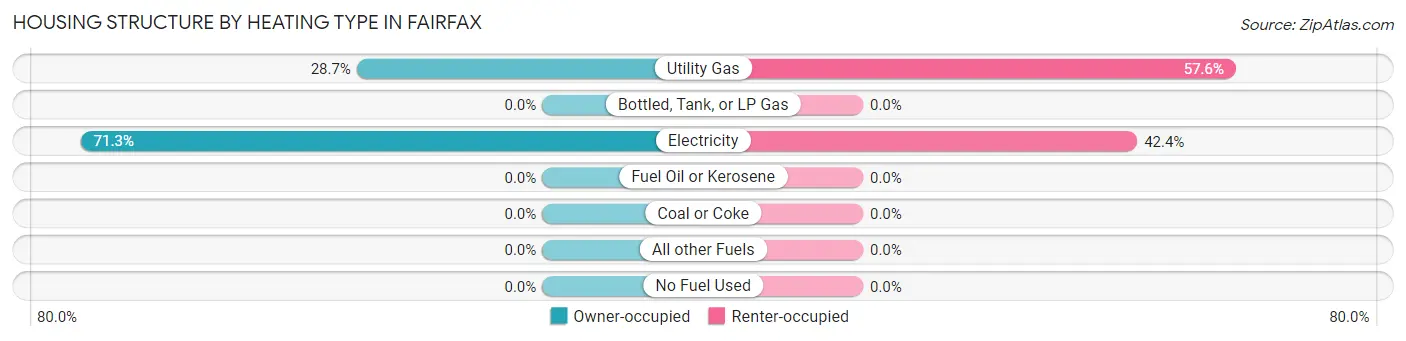
| Heating Type | Owner-occupied | Renter-occupied |
| Utility Gas | 96 (28.7%) | 87 (57.6%) |
| Bottled, Tank, or LP Gas | 0 (0.0%) | 0 (0.0%) |
| Electricity | 239 (71.3%) | 64 (42.4%) |
| Fuel Oil or Kerosene | 0 (0.0%) | 0 (0.0%) |
| Coal or Coke | 0 (0.0%) | 0 (0.0%) |
| All other Fuels | 0 (0.0%) | 0 (0.0%) |
| No Fuel Used | 0 (0.0%) | 0 (0.0%) |
| Total | 335 (100.0%) | 151 (100.0%) |
Household Vehicle Usage in Fairfax
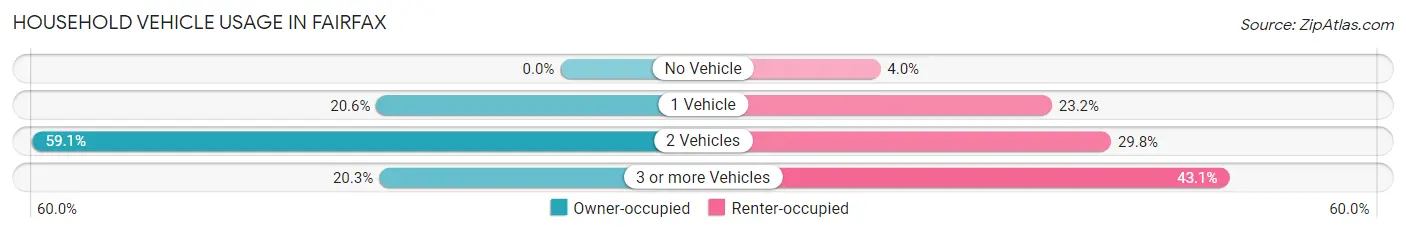
| Vehicles per Household | Owner-occupied | Renter-occupied |
| No Vehicle | 0 (0.0%) | 6 (4.0%) |
| 1 Vehicle | 69 (20.6%) | 35 (23.2%) |
| 2 Vehicles | 198 (59.1%) | 45 (29.8%) |
| 3 or more Vehicles | 68 (20.3%) | 65 (43.0%) |
| Total | 335 (100.0%) | 151 (100.0%) |
Real Estate & Mortgages in Fairfax
Real Estate and Mortgage Overview in Fairfax
| Characteristic | Without Mortgage | With Mortgage |
| Housing Units | 807 | 1,267 |
| Median Property Value | $954,300 | $1,063,600 |
| Median Household Income | $104,583 | $802 |
| Monthly Housing Costs | $1,084 | $864 |
| Real Estate Taxes | $8,497 | $0 |
Property Value by Mortgage Status in Fairfax
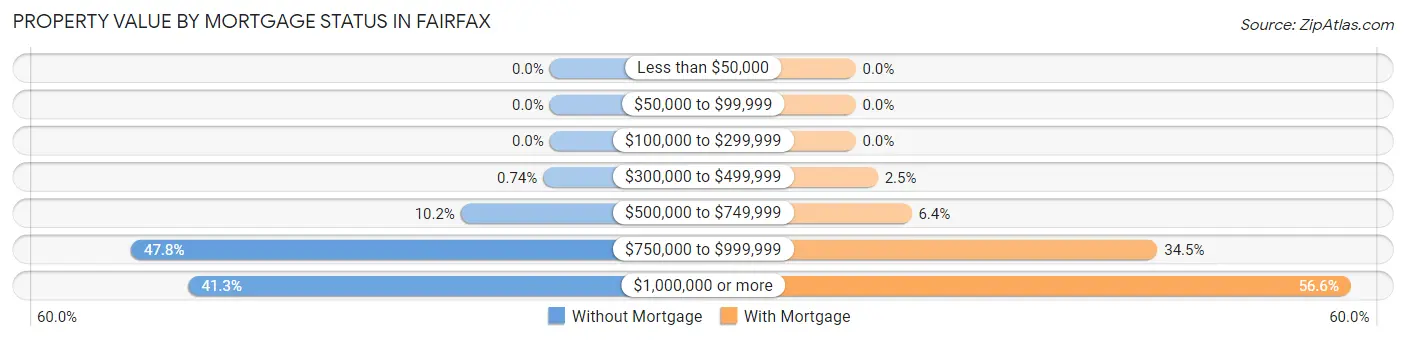
| Property Value | Without Mortgage | With Mortgage |
| Less than $50,000 | 0 (0.0%) | 0 (0.0%) |
| $50,000 to $99,999 | 0 (0.0%) | 0 (0.0%) |
| $100,000 to $299,999 | 0 (0.0%) | 0 (0.0%) |
| $300,000 to $499,999 | 6 (0.7%) | 32 (2.5%) |
| $500,000 to $749,999 | 82 (10.2%) | 81 (6.4%) |
| $750,000 to $999,999 | 386 (47.8%) | 437 (34.5%) |
| $1,000,000 or more | 333 (41.3%) | 717 (56.6%) |
| Total | 807 (100.0%) | 1,267 (100.0%) |
Household Income by Mortgage Status in Fairfax
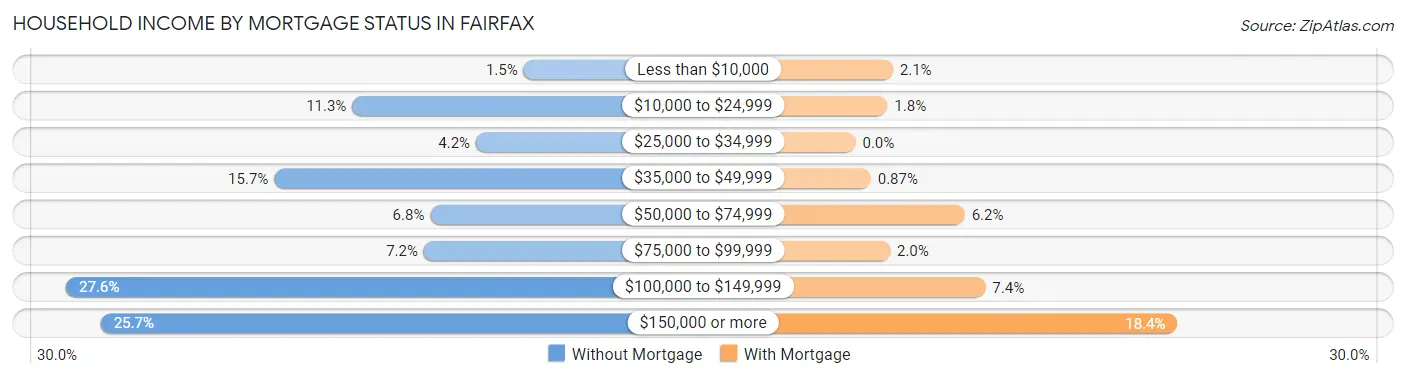
| Household Income | Without Mortgage | With Mortgage |
| Less than $10,000 | 12 (1.5%) | 27 (2.1%) |
| $10,000 to $24,999 | 91 (11.3%) | 23 (1.8%) |
| $25,000 to $34,999 | 34 (4.2%) | 0 (0.0%) |
| $35,000 to $49,999 | 127 (15.7%) | 11 (0.9%) |
| $50,000 to $74,999 | 55 (6.8%) | 79 (6.2%) |
| $75,000 to $99,999 | 58 (7.2%) | 25 (2.0%) |
| $100,000 to $149,999 | 223 (27.6%) | 94 (7.4%) |
| $150,000 or more | 207 (25.7%) | 233 (18.4%) |
| Total | 807 (100.0%) | 1,267 (100.0%) |
Property Value to Household Income Ratio in Fairfax
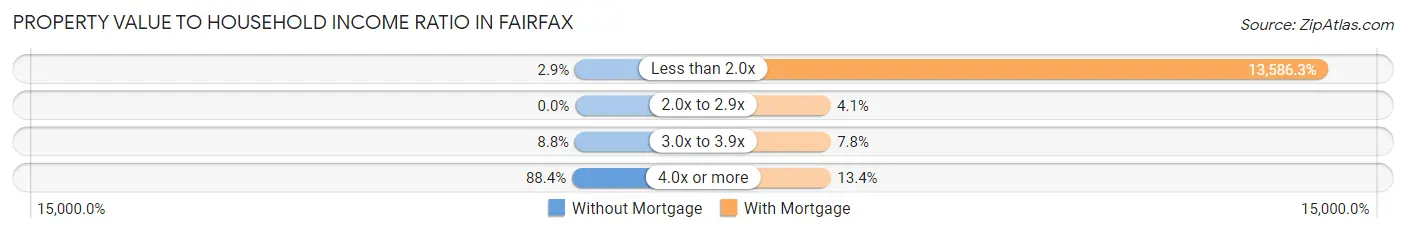
| Value-to-Income Ratio | Without Mortgage | With Mortgage |
| Less than 2.0x | 23 (2.9%) | 172,138 (13,586.3%) |
| 2.0x to 2.9x | 0 (0.0%) | 52 (4.1%) |
| 3.0x to 3.9x | 71 (8.8%) | 99 (7.8%) |
| 4.0x or more | 713 (88.3%) | 170 (13.4%) |
| Total | 807 (100.0%) | 1,267 (100.0%) |
Real Estate Taxes by Mortgage Status in Fairfax
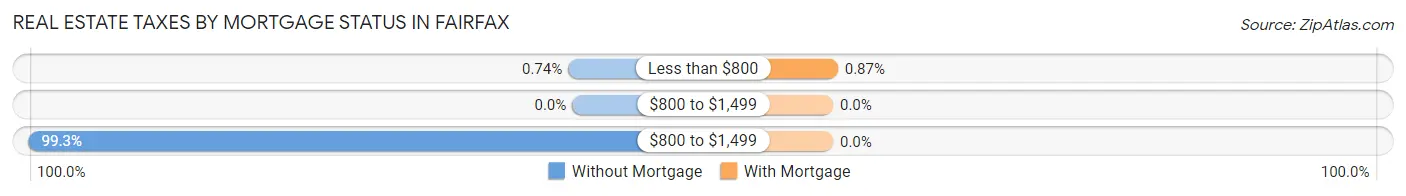
| Property Taxes | Without Mortgage | With Mortgage |
| Less than $800 | 6 (0.7%) | 11 (0.9%) |
| $800 to $1,499 | 0 (0.0%) | 0 (0.0%) |
| $800 to $1,499 | 801 (99.3%) | 0 (0.0%) |
| Total | 807 (100.0%) | 1,267 (100.0%) |
Health & Disability in Fairfax
Health Insurance Coverage by Age in Fairfax
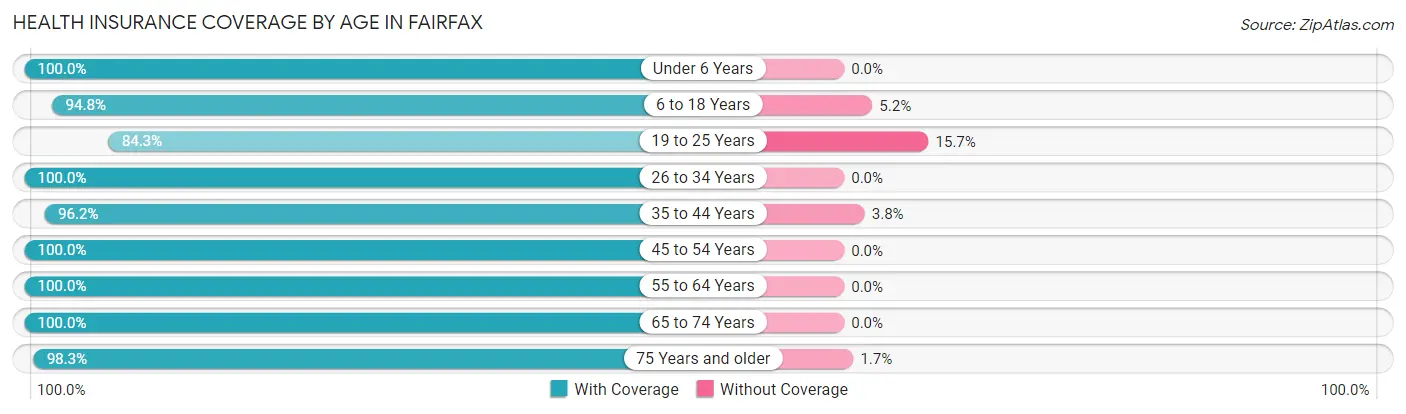
| Age Bracket | With Coverage | Without Coverage |
| Under 6 Years | 432 (100.0%) | 0 (0.0%) |
| 6 to 18 Years | 977 (94.8%) | 54 (5.2%) |
| 19 to 25 Years | 461 (84.3%) | 86 (15.7%) |
| 26 to 34 Years | 547 (100.0%) | 0 (0.0%) |
| 35 to 44 Years | 803 (96.2%) | 32 (3.8%) |
| 45 to 54 Years | 1,419 (100.0%) | 0 (0.0%) |
| 55 to 64 Years | 1,140 (100.0%) | 0 (0.0%) |
| 65 to 74 Years | 955 (100.0%) | 0 (0.0%) |
| 75 Years and older | 633 (98.3%) | 11 (1.7%) |
| Total | 7,367 (97.6%) | 183 (2.4%) |
Health Insurance Coverage by Citizenship Status in Fairfax
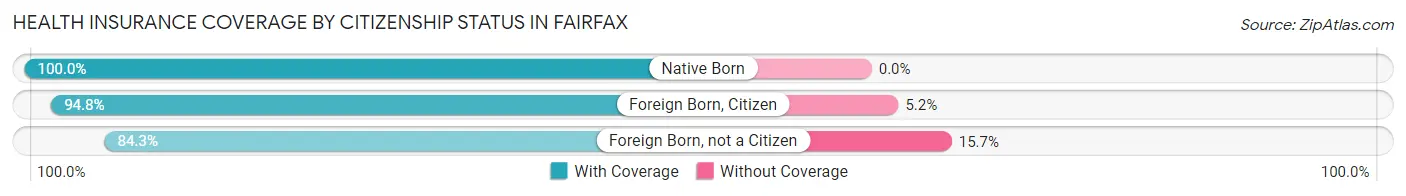
| Citizenship Status | With Coverage | Without Coverage |
| Native Born | 432 (100.0%) | 0 (0.0%) |
| Foreign Born, Citizen | 977 (94.8%) | 54 (5.2%) |
| Foreign Born, not a Citizen | 461 (84.3%) | 86 (15.7%) |
Health Insurance Coverage by Household Income in Fairfax
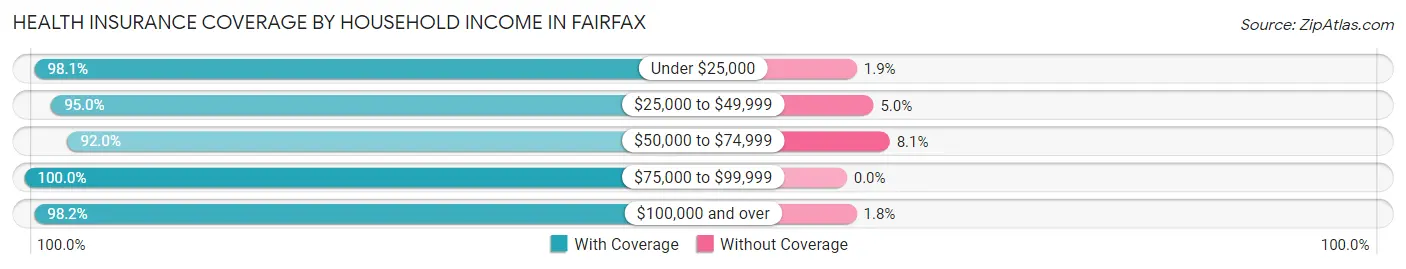
| Household Income | With Coverage | Without Coverage |
| Under $25,000 | 571 (98.1%) | 11 (1.9%) |
| $25,000 to $49,999 | 627 (95.0%) | 33 (5.0%) |
| $50,000 to $74,999 | 514 (91.9%) | 45 (8.1%) |
| $75,000 to $99,999 | 595 (100.0%) | 0 (0.0%) |
| $100,000 and over | 5,032 (98.2%) | 94 (1.8%) |
Public vs Private Health Insurance Coverage by Age in Fairfax
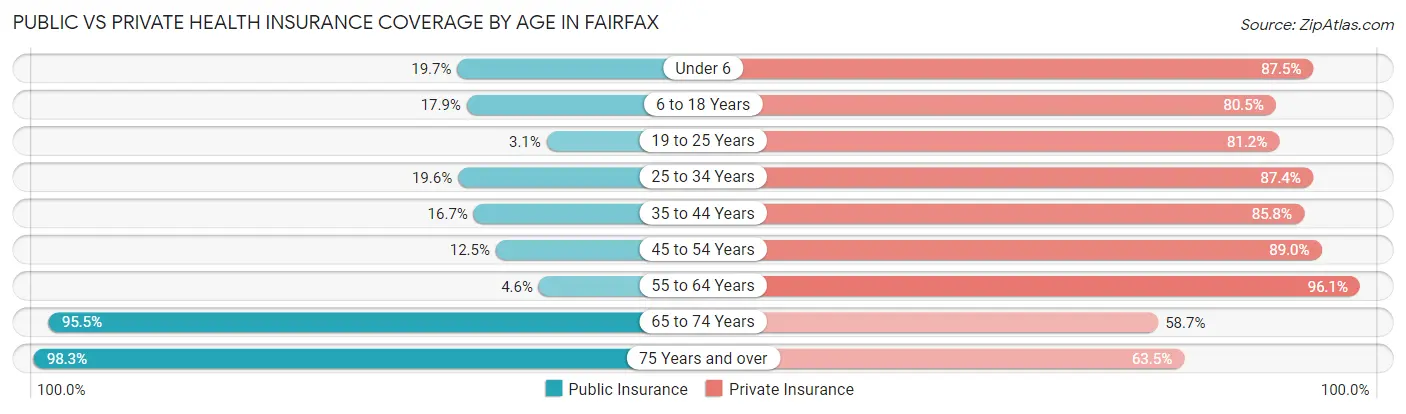
| Age Bracket | Public Insurance | Private Insurance |
| Under 6 | 85 (19.7%) | 378 (87.5%) |
| 6 to 18 Years | 185 (17.9%) | 830 (80.5%) |
| 19 to 25 Years | 17 (3.1%) | 444 (81.2%) |
| 25 to 34 Years | 107 (19.6%) | 478 (87.4%) |
| 35 to 44 Years | 139 (16.7%) | 716 (85.8%) |
| 45 to 54 Years | 178 (12.5%) | 1,263 (89.0%) |
| 55 to 64 Years | 52 (4.6%) | 1,096 (96.1%) |
| 65 to 74 Years | 912 (95.5%) | 561 (58.7%) |
| 75 Years and over | 633 (98.3%) | 409 (63.5%) |
| Total | 2,308 (30.6%) | 6,175 (81.8%) |
Disability Status by Sex by Age in Fairfax
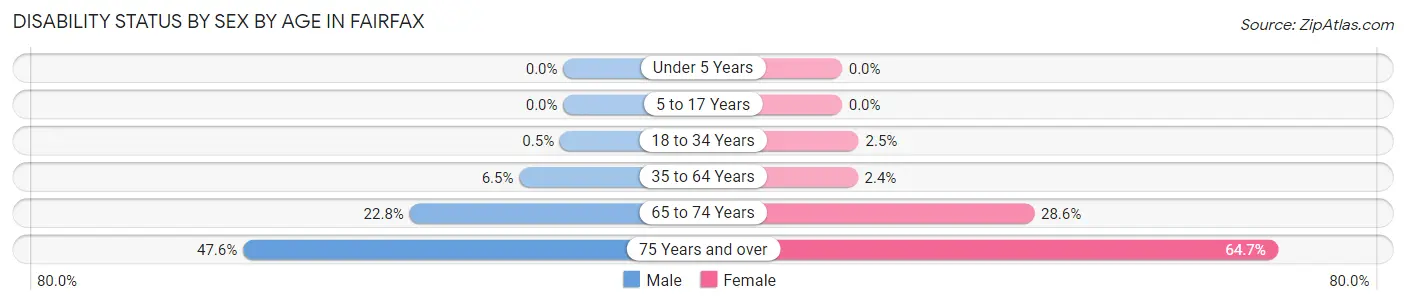
| Age Bracket | Male | Female |
| Under 5 Years | 0 (0.0%) | 0 (0.0%) |
| 5 to 17 Years | 0 (0.0%) | 0 (0.0%) |
| 18 to 34 Years | 3 (0.5%) | 17 (2.5%) |
| 35 to 64 Years | 105 (6.5%) | 42 (2.4%) |
| 65 to 74 Years | 94 (22.8%) | 155 (28.5%) |
| 75 Years and over | 185 (47.6%) | 165 (64.7%) |
Disability Class by Sex by Age in Fairfax
Disability Class: Hearing Difficulty
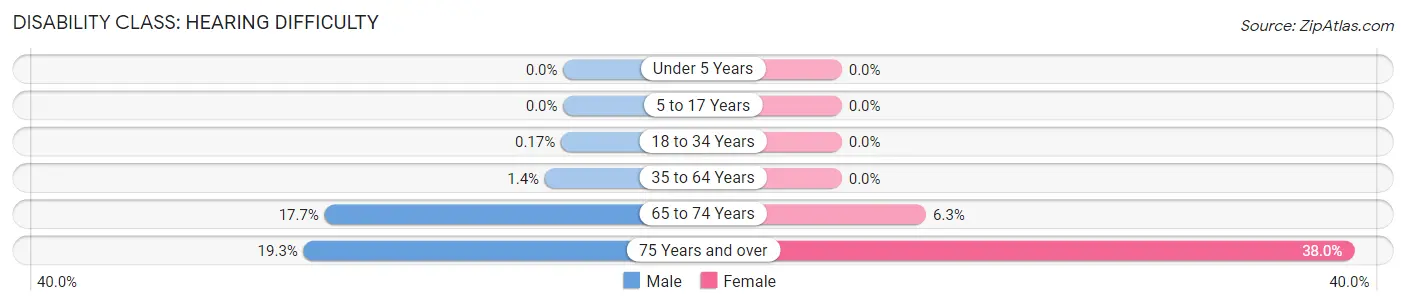
| Age Bracket | Male | Female |
| Under 5 Years | 0 (0.0%) | 0 (0.0%) |
| 5 to 17 Years | 0 (0.0%) | 0 (0.0%) |
| 18 to 34 Years | 1 (0.2%) | 0 (0.0%) |
| 35 to 64 Years | 22 (1.4%) | 0 (0.0%) |
| 65 to 74 Years | 73 (17.7%) | 34 (6.3%) |
| 75 Years and over | 75 (19.3%) | 97 (38.0%) |
Disability Class: Vision Difficulty
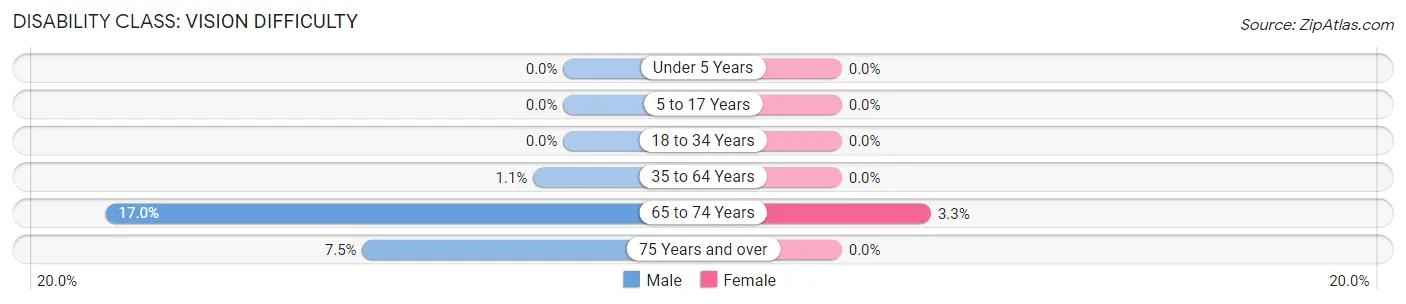
| Age Bracket | Male | Female |
| Under 5 Years | 0 (0.0%) | 0 (0.0%) |
| 5 to 17 Years | 0 (0.0%) | 0 (0.0%) |
| 18 to 34 Years | 0 (0.0%) | 0 (0.0%) |
| 35 to 64 Years | 18 (1.1%) | 0 (0.0%) |
| 65 to 74 Years | 70 (17.0%) | 18 (3.3%) |
| 75 Years and over | 29 (7.5%) | 0 (0.0%) |
Disability Class: Cognitive Difficulty
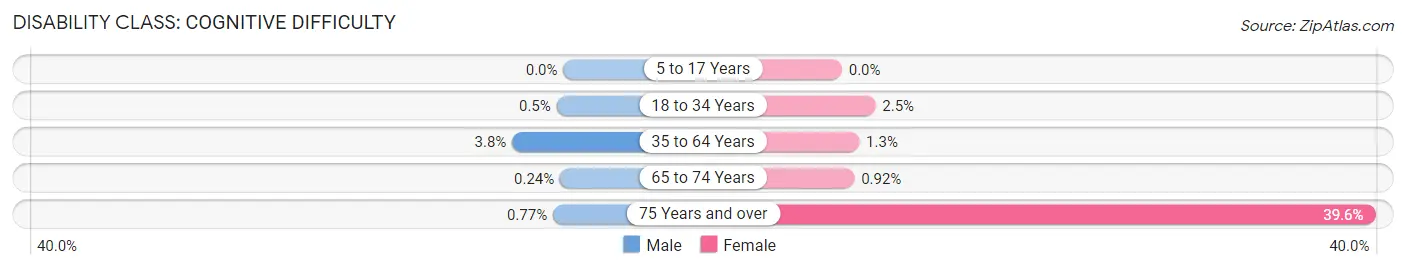
| Age Bracket | Male | Female |
| 5 to 17 Years | 0 (0.0%) | 0 (0.0%) |
| 18 to 34 Years | 3 (0.5%) | 17 (2.5%) |
| 35 to 64 Years | 61 (3.8%) | 23 (1.3%) |
| 65 to 74 Years | 1 (0.2%) | 5 (0.9%) |
| 75 Years and over | 3 (0.8%) | 101 (39.6%) |
Disability Class: Ambulatory Difficulty
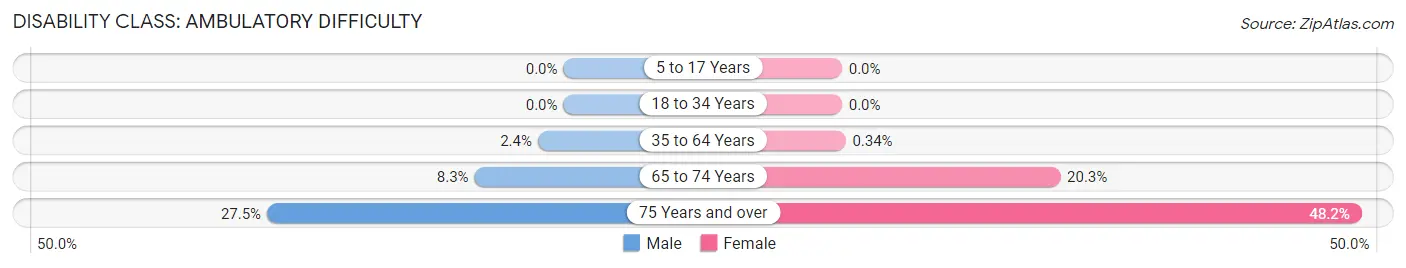
| Age Bracket | Male | Female |
| 5 to 17 Years | 0 (0.0%) | 0 (0.0%) |
| 18 to 34 Years | 0 (0.0%) | 0 (0.0%) |
| 35 to 64 Years | 38 (2.4%) | 6 (0.3%) |
| 65 to 74 Years | 34 (8.3%) | 110 (20.3%) |
| 75 Years and over | 107 (27.5%) | 123 (48.2%) |
Disability Class: Self-Care Difficulty
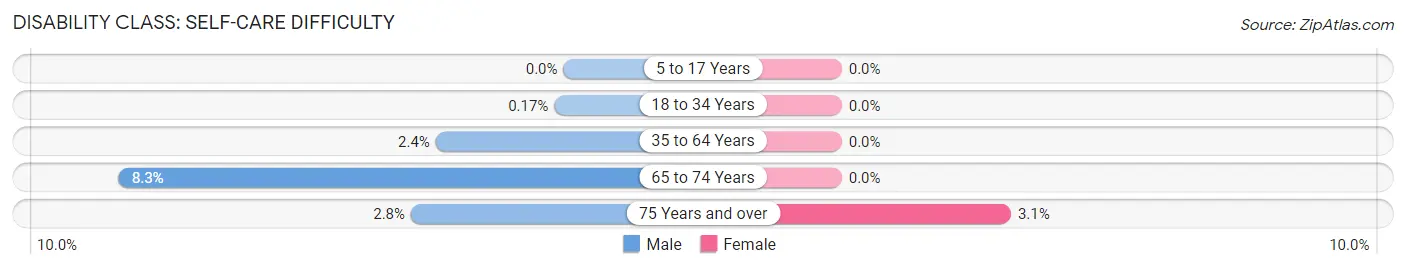
| Age Bracket | Male | Female |
| 5 to 17 Years | 0 (0.0%) | 0 (0.0%) |
| 18 to 34 Years | 1 (0.2%) | 0 (0.0%) |
| 35 to 64 Years | 38 (2.4%) | 0 (0.0%) |
| 65 to 74 Years | 34 (8.3%) | 0 (0.0%) |
| 75 Years and over | 11 (2.8%) | 8 (3.1%) |
Technology Access in Fairfax
Computing Device Access in Fairfax
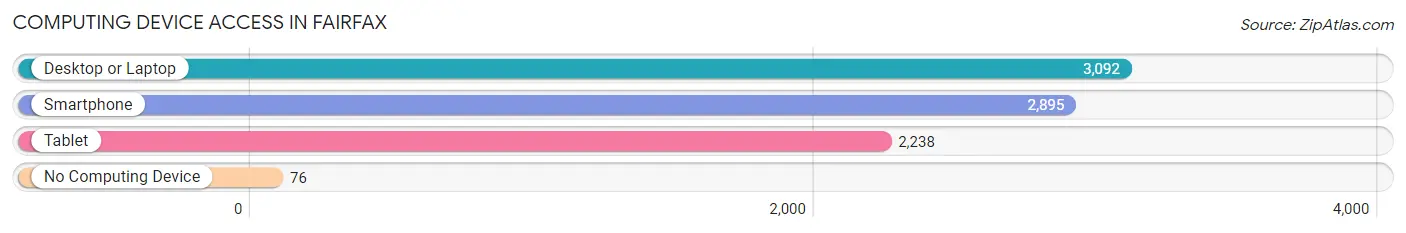
| Device Type | # Households | % Households |
| Desktop or Laptop | 3,092 | 94.9% |
| Smartphone | 2,895 | 88.8% |
| Tablet | 2,238 | 68.7% |
| No Computing Device | 76 | 2.3% |
| Total | 3,259 | 100.0% |
Internet Access in Fairfax
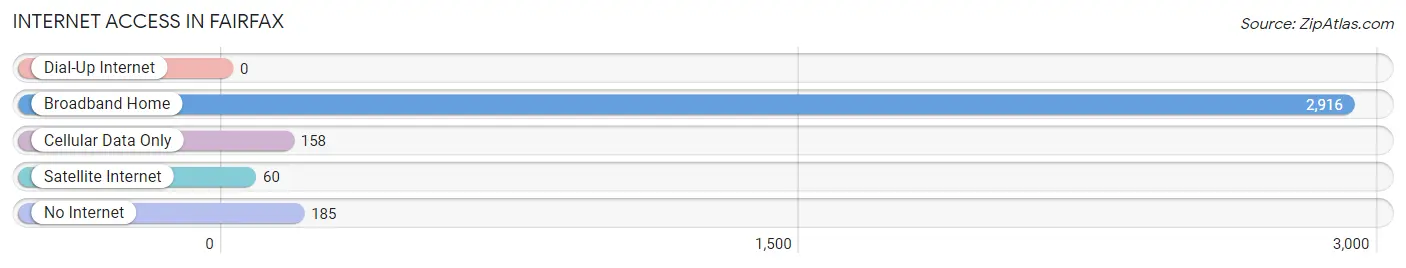
| Internet Type | # Households | % Households |
| Dial-Up Internet | 0 | 0.0% |
| Broadband Home | 2,916 | 89.5% |
| Cellular Data Only | 158 | 4.9% |
| Satellite Internet | 60 | 1.8% |
| No Internet | 185 | 5.7% |
| Total | 3,259 | 100.0% |
Fairfax Summary
Fairfax is a small town located in Marin County, California, United States. It is situated in the San Francisco Bay Area, about 10 miles (16 km) north of San Francisco. The population was 7,441 at the 2010 census.
History
The area that is now Fairfax was originally inhabited by the Coast Miwok Native American tribe. The first European settlers arrived in the area in the late 19th century, and the town was officially founded in 1892. The town was named after a local landowner, Charles Fairfax.
In the early 20th century, Fairfax was a popular destination for tourists, and it was known for its natural beauty and outdoor activities. The town was also home to a number of artists and writers, including Jack London, who wrote his novel The Valley of the Moon while living in Fairfax.
Geography
Fairfax is located in Marin County, California, in the San Francisco Bay Area. It is situated in the San Geronimo Valley, about 10 miles (16 km) north of San Francisco. The town is surrounded by rolling hills and is located near the San Geronimo Creek.
The climate in Fairfax is mild, with temperatures ranging from the mid-50s to the mid-70s Fahrenheit (10-25 Celsius). The town receives an average of 25 inches (63 cm) of rain per year.
Economy
The economy of Fairfax is largely based on tourism and retail. The town is home to a number of restaurants, cafes, and shops, as well as a number of art galleries and studios. The town is also home to a number of small businesses, including a winery, a brewery, and a distillery.
Demographics
As of the 2010 census, the population of Fairfax was 7,441. The racial makeup of the town was 87.3% White, 1.3% African American, 0.4% Native American, 5.2% Asian, 0.2% Pacific Islander, 2.2% from other races, and 3.6% from two or more races. Hispanic or Latino of any race were 8.2% of the population.
The median income for a household in Fairfax was $76,837, and the median income for a family was $90,945. The per capita income for the town was $41,945. About 4.3% of families and 6.2% of the population were below the poverty line, including 8.2% of those under age 18 and 3.2% of those age 65 or over.
Common Questions
What is Per Capita Income in Fairfax?
Per Capita income in Fairfax is $66,389.
What is the Median Family Income in Fairfax?
Median Family Income in Fairfax is $163,201.
What is the Median Household income in Fairfax?
Median Household Income in Fairfax is $126,034.
What is Income or Wage Gap in Fairfax?
Income or Wage Gap in Fairfax is 45.5%.
Women in Fairfax earn 54.5 cents for every dollar earned by a man.
What is Inequality or Gini Index in Fairfax?
Inequality or Gini Index in Fairfax is 0.47.
What is the Total Population of Fairfax?
Total Population of Fairfax is 7,567.
What is the Total Male Population of Fairfax?
Total Male Population of Fairfax is 3,598.
What is the Total Female Population of Fairfax?
Total Female Population of Fairfax is 3,969.
What is the Ratio of Males per 100 Females in Fairfax?
There are 90.65 Males per 100 Females in Fairfax.
What is the Ratio of Females per 100 Males in Fairfax?
There are 110.31 Females per 100 Males in Fairfax.
What is the Median Population Age in Fairfax?
Median Population Age in Fairfax is 47.6 Years.
What is the Average Family Size in Fairfax
Average Family Size in Fairfax is 2.8 People.
What is the Average Household Size in Fairfax
Average Household Size in Fairfax is 2.3 People.
How Large is the Labor Force in Fairfax?
There are 4,575 People in the Labor Forcein in Fairfax.
What is the Percentage of People in the Labor Force in Fairfax?
71.0% of People are in the Labor Force in Fairfax.
What is the Unemployment Rate in Fairfax?
Unemployment Rate in Fairfax is 10.8%.